UNITED STATES
SECURITIES AND EXCHANGE COMMISSION
Washington, D.C. 20549
FORM N-CSR
CERTIFIED SHAREHOLDER REPORT OF REGISTERED
MANAGEMENT INVESTMENT COMPANIES
Investment Company Act file number | 811-22696 |
|
Victory Portfolios II |
(Exact name of registrant as specified in charter) |
|
4900 Tiedeman Road, 4th Floor, Brooklyn, Ohio | | 44144 |
(Address of principal executive offices) | | (Zip code) |
|
Citi Fund Services Ohio, Inc., 4400 Easton Commons, Suite 200, Columbus, OH 43219 |
(Name and address of agent for service) |
|
Registrant’s telephone number, including area code: | 800-539-3863 | |
|
Date of fiscal year end: | June 30 | |
|
Date of reporting period: | December 31, 2018 | |
| | | | | | | | |
Item 1. Reports to Stockholders.

December 31, 2018
Semi Annual Report
Victory US 500 Enhanced Volatility Wtd Index Fund
Victory Market Neutral Income Fund
Beginning on January 1, 2021, as permitted by regulations adopted by the Securities and Exchange Commission, paper copies of the Victory Funds' shareholder reports will no longer be sent by mail, unless you specifically request paper copies of the reports from the Victory Funds or from your financial intermediary, such as a broker-dealer or bank. Instead, the reports will be made available on www.VictoryFunds.com, and you will be notified by mail each time a report is posted and provided with a website link to access the report. If you already elected to receive shareholder reports electronically, you will not be affected by this change, and you need not take any action.
You may elect to receive shareholder reports and other communications from the Victory Funds or your financial intermediary electronically sooner than January 1, 2021 by notifying your financial intermediary directly or, if you are a direct investor, by calling 800-539-3863 or by sending an e-mail request to TA.Processing@FISGlobal.com.
You may elect to receive all future reports in paper free of charge. If you invest through a financial intermediary, you can contact your financial intermediary to request that you continue to receive paper copies of your reports. If you invest directly with the Victory Funds, you can call 800-539-3863 or send an e-mail request to TA.Processing@FISGlobal.com. Your election to receive reports in paper will apply to all Victory Funds you hold directly or through your financial intermediary.
www.vcm.com
News, Information And Education 24 Hours A Day, 7 Days A Week
The Victory CEMP site gives fund shareholders, prospective shareholders, and investment professionals a convenient way to access fund information, get guidance, and track fund performance anywhere they can access the Internet. The site includes:
• Detailed performance records
• Daily share prices
• The latest fund news
• Investment resources to help you become a better investor
• A section dedicated to investment professionals
Whether you're a potential investor searching for the fund that matches your investment philosophy, a seasoned investor interested in planning tools, or an investment professional, www.vcm.com has what you seek. Visit us anytime. We're always open.
Table of Contents
Financial Statements | |
Victory US 500 Enhanced Volatility Wtd
Index Fund | |
Investment Objectives & Portfolio Holdings | | | 2 | | |
Schedule of Investments | | | 3-14 | | |
Statements of Assets and Liabilities | | | 32 | | |
Statements of Operations | | | 33 | | |
Statements of Changes in Net Assets | | | 34-35 | | |
Financial Highlights | | | 36-38 | | |
Victory Market Neutral Income Fund | |
Investment Objectives & Portfolio Holdings | | | 2 | | |
Schedule of Investments | | | 15-31 | | |
Statements of Assets and Liabilities | | | 32 | | |
Statements of Operations | | | 33 | | |
Statements of Changes in Net Assets | | | 34-35 | | |
Financial Highlights | | | 39-41 | | |
Notes to Financial Statements | | | 42 | | |
Supplemental Information | | | 55 | | |
Trustee and Officer Information | | | 55 | | |
Proxy Voting and Form N-Q Information | | | 59 | | |
Expense Examples | | | 59 | | |
Advisory Contract Approval | | | 61 | | |
Privacy Policy (inside back cover) | | | |
The Victory Funds are distributed by Victory Capital Advisers, Inc. Victory Capital Management Inc. is the investment adviser to the Funds and receives fees from the Funds for performing services for the Funds.
This report is not authorized for distribution to prospective investors unless preceded or accompanied by a current prospectus of the Victory Funds.
For additional information about any Victory Fund, including fees, expenses, and risks, view our prospectus online at www.vcm.com or call 800-539-3863. Read it carefully before you invest or send money.
The information in this semi annual report is based on data obtained from recognized services and sources and is believed to be reliable. Any opinions, projections, or recommendations in this report are subject to change without notice and are not intended as individual investment advice. Past investment performance of the Funds, markets or securities mentioned herein should not be considered to be indicative of future results.
• NOT FDIC INSURED • NO BANK GUARANTEE
• MAY LOSE VALUE

Call Victory CEMP at:
800-539-FUND (800-539-3863)
Visit our website at:
www.vcm.com
1
Victory Portfolios II | | December 31, 2018 | |
(Unaudited)
Investment Objectives & Portfolio Holdings:
(As a Percentage of Total Investments)
Victory US 500 Enhanced Volatility Wtd
Index Fund
Track performance of the Nasdaq Victory
U.S. Large Cap 500 Long/Cash Volatility
Weighted Index before expenses. | | Victory Market Neutral Income Fund
Seeks to achieve high current income. | |

| | 
| |
2
Victory Portfolios II
Victory US 500 Enhanced Volatility Wtd Index Fund | | Schedule of Portfolio Investments
December 31, 2018 | |
(Unaudited)
Security Description | | Shares | | Value | |
Common Stocks (99.2%) | |
Communication Services (3.1%): | |
AT&T, Inc. | | | 8,159 | | | $ | 232,858 | | |
Cable One, Inc. | | | 297 | | | | 243,570 | | |
Cargurus, Inc. (a) | | | 2,280 | | | | 76,904 | | |
CBS Corp., Class B | | | 3,803 | | | | 166,267 | | |
CenturyLink, Inc. | | | 7,881 | | | | 119,397 | | |
Charter Communications, Inc., Class A (a) | | | 545 | | | | 155,309 | | |
Comcast Corp., Class A | | | 5,760 | | | | 196,128 | | |
DISH Network Corp. (a) | | | 3,864 | | | | 96,484 | | |
Facebook, Inc., Class A (a) | | | 804 | | | | 105,396 | | |
InterActive Corp. (a) | | | 712 | | | | 130,325 | | |
Netflix, Inc. (a) | | | 388 | | | | 103,852 | | |
Omnicom Group, Inc. | | | 3,825 | | | | 280,143 | | |
The Walt Disney Co. | | | 3,016 | | | | 330,705 | | |
T-Mobile US, Inc. (a) | | | 3,463 | | | | 220,281 | | |
Verizon Communications, Inc. | | | 5,517 | | | | 310,165 | | |
Viacom, Inc., Class B | | | 7,071 | | | | 181,725 | | |
World Wrestling Entertainment, Inc. | | | 1,688 | | | | 126,127 | | |
Zayo Group Holdings, Inc. (a) | | | 7,340 | | | | 167,646 | | |
| | | | 3,243,282 | | |
Consumer Discretionary (12.8%): | |
Advance Auto Parts, Inc. | | | 1,221 | | | | 192,259 | | |
Amazon.com, Inc. (a) | | | 110 | | | | 165,217 | | |
American Eagle Outfitters, Inc. | | | 5,751 | | | | 111,167 | | |
Aramark | | | 6,061 | | | | 175,587 | | |
AutoZone, Inc. (a) | | | 308 | | | | 258,209 | | |
Best Buy Co., Inc. | | | 2,412 | | | | 127,740 | | |
Bright Horizons Family Solutions, Inc. (a) | | | 2,611 | | | | 290,996 | | |
Burlington Stores, Inc. (a) | | | 1,306 | | | | 212,447 | | |
CarMax, Inc. (a) (b) | | | 2,509 | | | | 157,390 | | |
Carter's, Inc. | | | 2,219 | | | | 181,115 | | |
Chipotle Mexican Grill, Inc. (a) | | | 255 | | | | 110,106 | | |
D.R. Horton, Inc. | | | 4,055 | | | | 140,546 | | |
Darden Restaurants, Inc. | | | 1,659 | | | | 165,668 | | |
Dollar General Corp. | | | 2,163 | | | | 233,777 | | |
Dollar Tree, Inc. (a) | | | 1,714 | | | | 154,808 | | |
Domino's Pizza, Inc. | | | 791 | | | | 196,160 | | |
Dunkin' Brands Group, Inc. | | | 4,798 | | | | 307,648 | | |
Etsy, Inc. (a) | | | 2,281 | | | | 108,507 | | |
Five Below, Inc. (a) | | | 1,152 | | | | 117,873 | | |
Ford Motor Co. | | | 26,973 | | | | 206,344 | | |
Garmin Ltd. | | | 4,743 | | | | 300,328 | | |
Gentex Corp. | | | 9,866 | | | | 199,392 | | |
Genuine Parts Co. | | | 3,248 | | | | 311,872 | | |
Grand Canyon Education, Inc. (a) | | | 2,333 | | | | 224,295 | | |
GrubHub, Inc. (a) (b) | | | 809 | | | | 62,139 | | |
Harley-Davidson, Inc. | | | 5,104 | | | | 174,148 | | |
Hilton Worldwide Holdings, Inc. | | | 3,775 | | | | 271,045 | | |
See notes to financial statements.
3
Victory Portfolios II
Victory US 500 Enhanced Volatility Wtd Index Fund | | Schedule of Portfolio Investments — continued
December 31, 2018 | |
(Unaudited)
Security Description | | Shares | | Value | |
Hyatt Hotels Corp., Class A | | | 3,810 | | | $ | 257,556 | | |
Kohl's Corp. | | | 2,004 | | | | 132,945 | | |
L Brands, Inc. | | | 4,908 | | | | 125,988 | | |
Las Vegas Sands Corp. | | | 3,423 | | | | 178,167 | | |
Lear Corp. | | | 1,454 | | | | 178,638 | | |
Leggett & Platt, Inc. | | | 5,833 | | | | 209,055 | | |
Lennar Corp., Class A | | | 3,532 | | | | 138,278 | | |
LKQ Corp. (a) (b) | | | 4,798 | | | | 113,857 | | |
Lowe's Co., Inc. | | | 1,857 | | | | 171,513 | | |
Macy's, Inc. | | | 3,525 | | | | 104,975 | | |
Marriott International, Inc., Class A | | | 2,057 | | | | 223,308 | | |
McDonald's Corp. | | | 1,698 | | | | 301,514 | | |
MGM Resorts International | | | 5,650 | | | | 137,069 | | |
Mohawk Industries, Inc. (a) | | | 879 | | | | 102,808 | | |
Newell Brands, Inc. (b) | | | 6,914 | | | | 128,531 | | |
Nordstrom, Inc. (b) | | | 2,365 | | | | 110,233 | | |
Norwegian Cruise Line Holdings Ltd. (a) | | | 4,187 | | | | 177,487 | | |
NVR, Inc. (a) | | | 68 | | | | 165,715 | | |
Ollie's Bargain Outlet Holdings, Inc. (a) | | | 2,299 | | | | 152,906 | | |
O'Reilly Automotive, Inc. (a) | | | 581 | | | | 200,056 | | |
Penske Automotive Group, Inc. | | | 4,292 | | | | 173,053 | | |
Polaris Industries, Inc. | | | 1,666 | | | | 127,749 | | |
Pool Corp. (b) | | | 1,895 | | | | 281,692 | | |
PulteGroup, Inc. | | | 7,064 | | | | 183,593 | | |
PVH Corp. | | | 1,525 | | | | 141,749 | | |
Qurate Retail, Inc. (a) | | | 8,974 | | | | 175,173 | | |
Ross Stores, Inc. | | | 2,429 | | | | 202,093 | | |
Royal Caribbean Cruises Ltd. (b) | | | 1,751 | | | | 171,230 | | |
Service Corp. International | | | 7,269 | | | | 292,649 | | |
Servicemaster Global Holdings, Inc. (a) | | | 6,755 | | | | 248,179 | | |
Stamps.com, Inc. (a) | | | 603 | | | | 93,851 | | |
Starbucks Corp. | | | 4,673 | | | | 300,941 | | |
Target Corp. | | | 2,730 | | | | 180,426 | | |
Texas Roadhouse, Inc. | | | 3,693 | | | | 220,472 | | |
The Gap, Inc. | | | 4,588 | | | | 118,187 | | |
The Home Depot, Inc. | | | 1,639 | | | | 281,612 | | |
The TJX Co., Inc. | | | 5,926 | | | | 265,128 | | |
Thor Industries, Inc. | | | 1,516 | | | | 78,832 | | |
Tiffany & Co. | | | 1,183 | | | | 95,243 | | |
Toll Brothers, Inc. | | | 4,436 | | | | 146,077 | | |
Tractor Supply Co. | | | 2,304 | | | | 192,246 | | |
Ulta Salon, Cosmetics & Fragrance, Inc. (a) | | | 736 | | | | 180,202 | | |
Urban Outfitters, Inc. (a) | | | 3,722 | | | | 123,570 | | |
Weight Watchers International, Inc. (a) | | | 1,696 | | | | 65,381 | | |
Williams-Sonoma, Inc. | | | 2,130 | | | | 107,459 | | |
Yum! Brands, Inc. | | | 3,585 | | | | 329,534 | | |
| | | | 13,243,703 | | |
See notes to financial statements.
4
Victory Portfolios II
Victory US 500 Enhanced Volatility Wtd Index Fund | | Schedule of Portfolio Investments — continued
December 31, 2018 | |
(Unaudited)
Security Description | | Shares | | Value | |
Consumer Staples (7.4%): | |
Altria Group, Inc. | | | 4,200 | | | $ | 207,438 | | |
Archer-Daniels-Midland Co. | | | 7,315 | | | | 299,696 | | |
Brown-Forman Corp., Class B | | | 4,450 | | | | 211,731 | | |
Church & Dwight Co., Inc. | | | 4,739 | | | | 311,637 | | |
Colgate-Palmolive Co. | | | 5,176 | | | | 308,076 | | |
Conagra Brands, Inc. | | | 7,285 | | | | 155,608 | | |
Constellation Brands, Inc., Class A | | | 1,291 | | | | 207,619 | | |
Costco Wholesale Corp. | | | 1,500 | | | | 305,564 | | |
General Mills, Inc. | | | 4,974 | | | | 193,688 | | |
Hormel Foods Corp. (b) | | | 7,453 | | | | 318,094 | | |
Ingredion, Inc. | | | 2,243 | | | | 205,010 | | |
Kellogg Co. | | | 3,632 | | | | 207,060 | | |
Kimberly-Clark Corp. | | | 2,215 | | | | 252,377 | | |
Lamb Weston Holdings, Inc. | | | 4,245 | | | | 312,262 | | |
McCormick & Co., Inc. | | | 2,223 | | | | 309,531 | | |
Molson Coors Brewing Co., Class B | | | 2,713 | | | | 152,362 | | |
Mondelez International, Inc., Class A | | | 6,943 | | | | 277,928 | | |
Monster Beverage Corp. (a) | | | 2,878 | | | | 141,655 | | |
National Beverage Corp. (b) | | | 1,507 | | | | 108,157 | | |
Nu Skin Enterprises, Inc., Class A | | | 2,537 | | | | 155,594 | | |
Philip Morris International, Inc. | | | 2,423 | | | | 161,759 | | |
Pilgrim's Pride Corp. (a) | | | 9,691 | | | | 150,307 | | |
Post Holdings, Inc. (a) | | | 2,363 | | | | 210,614 | | |
Sysco Corp. | | | 3,830 | | | | 239,988 | | |
The Clorox Co. | | | 1,631 | | | | 251,402 | | |
The Estee Lauder Cos., Inc., Class A | | | 1,703 | | | | 221,561 | | |
The Hershey Co. | | | 2,723 | | | | 291,851 | | |
The J.M. Smucker Co. | | | 2,138 | | | | 199,882 | | |
The Kraft Heinz Co. | | | 3,924 | | | | 168,889 | | |
The Kroger Co. | | | 5,378 | | | | 147,895 | | |
The Procter & Gamble Co. | | | 4,451 | | | | 409,136 | | |
Tyson Foods, Inc., Class A | | | 3,795 | | | | 202,653 | | |
US Foods Holding Corp. (a) | | | 5,612 | | | | 177,564 | | |
Walgreens Boots Alliance, Inc. | | | 3,024 | | | | 206,630 | | |
| | | | 7,681,218 | | |
Energy (2.9%): | |
Apache Corp. (b) | | | 3,682 | | | | 96,653 | | |
Centennial Resource Development, Inc. (a) (b) | | | 7,075 | | | | 77,967 | | |
Chevron Corp. | | | 2,303 | | | | 250,543 | | |
Cimarex Energy Co. | | | 1,982 | | | | 122,190 | | |
ConocoPhillips | | | 2,908 | | | | 181,314 | | |
Continental Resources, Inc. (a) | | | 2,610 | | | | 104,896 | | |
Core Laboratories N.V. | | | 1,608 | | | | 95,933 | | |
Diamondback Energy, Inc. | | | 1,192 | | | | 110,498 | | |
EOG Resources, Inc. | | | 1,911 | | | | 166,658 | | |
Exxon Mobil Corp. | | | 3,642 | | | | 248,348 | | |
HollyFrontier Corp. | | | 2,285 | | | | 116,809 | | |
Marathon Petroleum Corp. | | | 2,300 | | | | 135,723 | | |
Newfield Exploration Co. (a) | | | 5,395 | | | | 79,091 | | |
See notes to financial statements.
5
Victory Portfolios II
Victory US 500 Enhanced Volatility Wtd Index Fund | | Schedule of Portfolio Investments — continued
December 31, 2018 | |
(Unaudited)
Security Description | | Shares | | Value | |
Occidental Petroleum Corp. | | | 3,168 | | | $ | 194,452 | | |
ONEOK, Inc. | | | 4,745 | | | | 255,993 | | |
PBF Energy, Inc. | | | 3,427 | | | | 111,960 | | |
Peabody Energy Corp. | | | 4,933 | | | | 150,358 | | |
Phillips 66 | | | 2,349 | | | | 202,366 | | |
The Williams Cos., Inc. | | | 8,641 | | | | 190,534 | | |
Valero Energy Corp. | | | 1,971 | | | | 147,766 | | |
| | | | 3,040,052 | | |
Financials (20.6%): | |
Affiliated Managers Group, Inc. | | | 1,611 | | | | 156,976 | | |
Aflac, Inc. | | | 8,477 | | | | 386,213 | | |
Ally Financial, Inc. | | | 9,917 | | | | 224,719 | | |
American Financial Group, Inc. | | | 3,299 | | | | 298,658 | | |
Ameriprise Financial, Inc. | | | 1,625 | | | | 169,601 | | |
Arthur J. Gallagher & Co. | | | 5,094 | | | | 375,428 | | |
Associated Banc-Corp. | | | 9,048 | | | | 179,060 | | |
Athene Holding Ltd., Class A (a) | | | 4,928 | | | | 196,282 | | |
Bank of America Corp. | | | 7,895 | | | | 194,533 | | |
Bank Ozk | | | 5,449 | | | | 124,401 | | |
BB&T Corp. | | | 5,136 | | | | 222,492 | | |
BlackRock, Inc., Class A | | | 511 | | | | 200,731 | | |
BOK Financial Corp. | | | 2,774 | | | | 203,417 | | |
Brown & Brown, Inc. | | | 12,543 | | | | 345,685 | | |
CBOE Holdings, Inc. | | | 2,446 | | | | 239,292 | | |
Citizens Financial Group, Inc. | | | 5,838 | | | | 173,564 | | |
CME Group, Inc. | | | 1,692 | | | | 318,298 | | |
CNA Financial Corp. | | | 6,627 | | | | 292,582 | | |
Comerica, Inc. | | | 2,636 | | | | 181,067 | | |
Commerce Bank, Inc. (b) | | | 4,517 | | | | 254,623 | | |
Credit Acceptance Corp. (a) | | | 447 | | | | 170,647 | | |
Cullen/Frost Bankers, Inc. (b) | | | 2,404 | | | | 211,408 | | |
Discover Financial Services | | | 3,378 | | | | 199,234 | | |
E*TRADE Financial Corp. | | | 3,790 | | | | 166,305 | | |
East West Bancorp, Inc. | | | 3,921 | | | | 170,681 | | |
Eaton Vance Corp. | | | 5,716 | | | | 201,089 | | |
Erie Indemnity Co., Class A | | | 2,658 | | | | 354,338 | | |
FactSet Research Systems, Inc. (b) | | | 1,265 | | | | 253,164 | | |
Fifth Third BanCorp | | | 7,157 | | | | 168,404 | | |
First American Financial Corp. | | | 5,341 | | | | 238,422 | | |
First Citizens BancShares, Inc., Class A | | | 525 | | | | 197,951 | | |
First Republic Bank | | | 3,053 | | | | 265,306 | | |
FNF Group | | | 7,227 | | | | 227,217 | | |
Green Dot Corp. (a) | | | 1,990 | | | | 158,245 | | |
Hanover Insurance Group, Inc. | | | 2,500 | | | | 291,925 | | |
Huntington Bancshares, Inc. | | | 16,765 | | | | 199,839 | | |
IBERIABANK Corp. | | | 3,145 | | | | 202,161 | | |
Intercontinental Exchange, Inc. | | | 4,105 | | | | 309,230 | | |
Invesco Ltd. | | | 8,888 | | | | 148,785 | | |
JPMorgan Chase & Co. | | | 2,347 | | | | 229,114 | | |
Kemper Corp. | | | 2,342 | | | | 155,462 | | |
See notes to financial statements.
6
Victory Portfolios II
Victory US 500 Enhanced Volatility Wtd Index Fund | | Schedule of Portfolio Investments — continued
December 31, 2018 | |
(Unaudited)
Security Description | | Shares | | Value | |
KeyCorp | | | 11,020 | | | $ | 162,876 | | |
Lincoln National Corp. | | | 3,538 | | | | 181,535 | | |
Loews Corp. | | | 7,027 | | | | 319,869 | | |
LPL Financial Holdings, Inc. | | | 3,174 | | | | 193,868 | | |
M&T Bank Corp. | | | 1,658 | | | | 237,310 | | |
MarketAxess Holdings, Inc. | | | 1,538 | | | | 324,994 | | |
Marsh & McLennan Co., Inc. | | | 4,546 | | | | 362,544 | | |
MGIC Investment Corp. (a) | | | 11,175 | | | | 116,891 | | |
Moody's Corp. | | | 1,718 | | | | 240,589 | | |
Morgan Stanley | | | 4,595 | | | | 182,192 | | |
Morningstar, Inc. | | | 2,255 | | | | 247,689 | | |
MSCI, Inc. | | | 1,680 | | | | 247,682 | | |
Nasdaq, Inc. | | | 3,461 | | | | 282,314 | | |
New York Community Bancorp, Inc. | | | 21,813 | | | | 205,260 | | |
Northern Trust Corp. | | | 2,408 | | | | 201,285 | | |
Old Republic International Corp. | | | 15,739 | | | | 323,751 | | |
Onemain Holdings, Inc. (a) | | | 5,976 | | | | 145,157 | | |
PacWest Bancorp | | | 5,658 | | | | 188,298 | | |
People's United Financial, Inc. | | | 18,512 | | | | 267,127 | | |
Pinnacle Financial Partners, Inc. (b) | | | 3,850 | | | | 177,485 | | |
Primerica, Inc. | | | 2,133 | | | | 208,415 | | |
Principal Financial Group, Inc. | | | 4,440 | | | | 196,115 | | |
Prosperity Bancshares, Inc. | | | 3,596 | | | | 224,031 | | |
Prudential Financial, Inc. | | | 2,476 | | | | 201,918 | | |
Raymond James Financial, Inc. | | | 2,448 | | | | 182,156 | | |
Regions Financial Corp. | | | 12,149 | | | | 162,554 | | |
Reinsurance Group of America, Inc. | | | 2,006 | | | | 281,301 | | |
S&P Global, Inc. | | | 1,667 | | | | 283,290 | | |
Santander Consumer USA Holdings, Inc. | | | 7,881 | | | | 138,627 | | |
SEI Investments Co. | | | 3,958 | | | | 182,860 | | |
Signature Bank | | | 1,948 | | | | 200,274 | | |
SLM Corp. (a) | | | 22,173 | | | | 184,258 | | |
State Street Corp. | | | 2,508 | | | | 158,180 | | |
SunTrust Banks, Inc. | | | 3,607 | | | | 181,937 | | |
SVB Financial Group (a) | | | 468 | | | | 88,883 | | |
Synchrony Financial | | | 6,368 | | | | 149,393 | | |
Synovus Financial Corp. | | | 4,958 | | | | 158,606 | | |
T. Rowe Price Group, Inc. | | | 2,174 | | | | 200,704 | | |
TD Ameritrade Holding Corp. | | | 3,592 | | | | 175,864 | | |
Texas Capital Bancshares, Inc. (a) | | | 2,568 | | | | 131,199 | | |
The Allstate Corp. | | | 3,621 | | | | 299,203 | | |
The Bank of New York Mellon Corp. | | | 4,730 | | | | 222,641 | | |
The Charles Schwab Corp. | | | 4,235 | | | | 175,880 | | |
The PNC Financial Services Group, Inc. | | | 1,869 | | | | 218,505 | | |
The Progressive Corp. | | | 4,988 | | | | 300,926 | | |
The Travelers Co., Inc. | | | 2,488 | | | | 297,938 | | |
Torchmark Corp. | | | 3,628 | | | | 270,395 | | |
U.S. Bancorp | | | 5,932 | | | | 271,091 | | |
Umpqua Holdings Corp. | | | 11,445 | | | | 181,976 | | |
Unum Group | | | 4,387 | | | | 128,890 | | |
See notes to financial statements.
7
Victory Portfolios II
Victory US 500 Enhanced Volatility Wtd Index Fund | | Schedule of Portfolio Investments — continued
December 31, 2018 | |
(Unaudited)
Security Description | | Shares | | Value | |
W.R. Berkley Corp. | | | 4,995 | | | $ | 369,180 | | |
Webster Financial Corp. | | | 3,622 | | | | 178,528 | | |
Wells Fargo & Co. | | | 4,618 | | | | 212,797 | | |
Western Alliance BanCorp (a) | | | 4,561 | | | | 180,114 | | |
Wintrust Financial Corp. | | | 2,848 | | | | 189,364 | | |
Zions BanCorp | | | 4,710 | | | | 191,885 | | |
| | | | 21,245,143 | | |
Health Care (9.0%): | |
AbbVie, Inc. | | | 1,793 | | | | 165,297 | | |
ABIOMED, Inc. (a) | | | 374 | | | | 121,565 | | |
Align Technology, Inc. (a) | | | 403 | | | | 84,400 | | |
Anthem, Inc. | | | 1,036 | | | | 272,085 | | |
athenahealth, Inc. (a) | | | 1,015 | | | | 133,909 | | |
BIO-RAD Laboratories, Inc., Class A (a) | | | 725 | | | | 168,360 | | |
Bio-Techne Corp. | | | 1,264 | | | | 182,926 | | |
Centene Corp. (a) | | | 1,767 | | | | 203,735 | | |
Cerner Corp. (a) | | | 3,546 | | | | 185,953 | | |
Chemed Corp. | | | 969 | | | | 274,498 | | |
Cigna Corp. | | | 1,211 | | | | 229,993 | | |
Danaher Corp. | | | 3,039 | | | | 313,382 | | |
Encompass Health Corp. | | | 3,137 | | | | 193,553 | | |
Exelixis, Inc. (a) | | | 5,932 | | | | 116,682 | | |
Globus Medical, Inc., Class A (a) | | | 4,244 | | | | 183,680 | | |
HCA Holdings, Inc. | | | 1,917 | | | | 238,571 | | |
HealthEquity, Inc. (a) (b) | | | 1,725 | | | | 102,896 | | |
Henry Schein, Inc. (a) | | | 2,821 | | | | 221,505 | | |
Hill-Rom Holdings, Inc. | | | 2,957 | | | | 261,842 | | |
Humana, Inc. | | | 1,007 | | | | 288,484 | | |
ICU Medical, Inc. (a) | | | 672 | | | | 154,311 | | |
IDEXX Laboratories, Inc. (a) | | | 816 | | | | 151,792 | | |
Illumina, Inc. (a) | | | 507 | | | | 152,065 | | |
Integra LifeSciences Holdings Corp. (a) (b) | | | 3,999 | | | | 180,355 | | |
IQVIA Holdings, Inc. (a) | | | 1,988 | | | | 230,946 | | |
Jazz Pharmaceuticals PLC (a) | | | 1,437 | | | | 178,131 | | |
Laboratory Corp. of America Holdings (a) | | | 1,821 | | | | 230,102 | | |
Masimo Corp. (a) | | | 1,842 | | | | 197,776 | | |
Medidata Solutions, Inc. (a) (b) | | | 1,951 | | | | 131,536 | | |
Mednax, Inc. (a) | | | 4,402 | | | | 145,266 | | |
Mettler-Toledo International, Inc. (a) | | | 425 | | | | 240,372 | | |
Mylan NV (a) | | | 4,821 | | | | 132,095 | | |
Neogen Corp. (a) | | | 2,723 | | | | 155,211 | | |
Penumbra, Inc. (a) (b) | | | 978 | | | | 119,512 | | |
Perrigo Co. PLC | | | 2,622 | | | | 101,603 | | |
Pfizer, Inc. | | | 9,035 | | | | 394,378 | | |
Quest Diagnostics, Inc. | | | 2,470 | | | | 205,677 | | |
Regeneron Pharmaceuticals, Inc. (a) | | | 484 | | | | 180,775 | | |
ResMed, Inc. | | | 2,777 | | | | 316,216 | | |
Thermo Fisher Scientific, Inc. | | | 1,219 | | | | 272,799 | | |
United Therapeutics Corp. (a) (b) | | | 1,396 | | | | 152,024 | | |
UnitedHealth Group, Inc. | | | 1,121 | | | | 279,264 | | |
See notes to financial statements.
8
Victory Portfolios II
Victory US 500 Enhanced Volatility Wtd Index Fund | | Schedule of Portfolio Investments — continued
December 31, 2018 | |
(Unaudited)
Security Description | | Shares | | Value | |
Universal Health Services, Inc., Class B | | | 1,995 | | | $ | 232,537 | | |
Veeva Systems, Inc. (a) | | | 1,622 | | | | 144,877 | | |
WellCare Health Plans, Inc. (a) | | | 779 | | | | 183,914 | | |
Zimmer Biomet Holdings, Inc. | | | 2,062 | | | | 213,871 | | |
Zoetis, Inc. | | | 2,886 | | | | 246,868 | | |
| | | | 9,267,589 | | |
Industrials (18.9%): | |
3M Co. | | | 1,230 | | | | 234,364 | | |
A.O. Smith Corp. | | | 4,386 | | | | 187,282 | | |
Acuity Brands, Inc. | | | 1,064 | | | | 122,307 | | |
AGCO Corp. | | | 3,477 | | | | 193,565 | | |
Air Lease Corp. | | | 6,122 | | | | 184,946 | | |
Alaska Air Group, Inc. | | | 2,492 | | | | 151,638 | | |
Allegion PLC | | | 3,226 | | | | 257,145 | | |
Allison Transmission Holdings, Inc. | | | 3,992 | | | | 175,289 | | |
AMERCO, Inc. | | | 602 | | | | 197,522 | | |
American Airlines Group, Inc. | | | 4,157 | | | | 133,481 | | |
AMETEK, Inc. | | | 3,811 | | | | 258,004 | | |
ASGN, Inc. (a) | | | 2,296 | | | | 125,132 | | |
C.H. Robinson Worldwide, Inc. | | | 2,477 | | | | 208,291 | | |
Carlisle Cos., Inc. | | | 1,889 | | | | 189,882 | | |
Cintas Corp. | | | 1,402 | | | | 235,522 | | |
Copart, Inc. (a) | | | 4,191 | | | | 200,246 | | |
Costar Group, Inc. (a) | | | 597 | | | | 201,392 | | |
CSX Corp. | | | 3,242 | | | | 201,425 | | |
Curtiss-Wright Corp. | | | 1,724 | | | | 176,055 | | |
Delta Air Lines, Inc. | | | 4,093 | | | | 204,242 | | |
Dover Corp. | | | 2,834 | | | | 201,072 | | |
Eaton Corp. PLC, ADR | | | 3,296 | | | | 226,303 | | |
EMCOR Group, Inc. | | | 3,104 | | | | 185,278 | | |
Emerson Electric Co. | | | 3,277 | | | | 195,801 | | |
Equifax, Inc. | | | 1,896 | | | | 176,574 | | |
Expeditors International of Washington, Inc. | | | 3,232 | | | | 220,067 | | |
Fastenal Co. | | | 3,522 | | | | 184,165 | | |
FedEx Corp. | | | 1,012 | | | | 163,266 | | |
Fortive Corp. | | | 3,062 | | | | 207,175 | | |
Fortune Brands Home & Security, Inc. | | | 4,522 | | | | 171,791 | | |
Gardner Denver Holdings, Inc. (a) | | | 6,217 | | | | 127,138 | | |
General Dynamics Corp. | | | 1,513 | | | | 237,859 | | |
Genesee & Wyoming, Inc., Class A (a) | | | 3,033 | | | | 224,503 | | |
Graco, Inc. | | | 6,184 | | | | 258,799 | | |
Harris Corp. | | | 1,505 | | | | 202,648 | | |
HEICO Corp. | | | 2,422 | | | | 187,657 | | |
Hexcel Corp. | | | 4,541 | | | | 260,380 | | |
Hubbell, Inc. | | | 1,908 | | | | 189,541 | | |
Huntington Ingalls Industries, Inc. | | | 876 | | | | 166,712 | | |
IDEX Corp. | | | 1,786 | | | | 225,499 | | |
Ingersoll-Rand PLC | | | 2,417 | | | | 220,503 | | |
Insperity, Inc. | | | 1,412 | | | | 131,824 | | |
J.B. Hunt Transport Services, Inc. | | | 2,134 | | | | 198,547 | | |
See notes to financial statements.
9
Victory Portfolios II
Victory US 500 Enhanced Volatility Wtd Index Fund | | Schedule of Portfolio Investments — continued
December 31, 2018 | |
(Unaudited)
Security Description | | Shares | | Value | |
Jacobs Engineering Group, Inc. | | | 2,885 | | | $ | 168,657 | | |
Johnson Controls International PLC | | | 6,035 | | | | 178,938 | | |
Kansas City Southern | | | 2,182 | | | | 208,272 | | |
KAR Auction Services, Inc. | | | 5,370 | | | | 256,256 | | |
Kirby Corp. (a) | | | 2,516 | | | | 169,478 | | |
Knight-Swift Transportation Holdings, Inc. | | | 5,003 | | | | 125,425 | | |
L3 Technologies, Inc. | | | 1,339 | | | | 232,531 | | |
Landstar System, Inc. | | | 2,097 | | | | 200,620 | | |
Lennox International, Inc. | | | 1,109 | | | | 242,716 | | |
Lincoln Electric Holdings, Inc. | | | 2,742 | | | | 216,207 | | |
ManpowerGroup, Inc. | | | 1,932 | | | | 125,194 | | |
Masco Corp. | | | 6,339 | | | | 185,352 | | |
MSC Industrial Direct Co., Inc., Class A | | | 3,126 | | | | 240,452 | | |
Nordson Corp. | | | 1,790 | | | | 213,637 | | |
Norfolk Southern Corp. | | | 1,306 | | | | 195,299 | | |
Northrop Grumman Corp. | | | 796 | | | | 194,940 | | |
Old Dominion Freight Line, Inc. | | | 1,301 | | | | 160,660 | | |
Oshkosh Corp. | | | 2,821 | | | | 172,956 | | |
PACCAR, Inc. | | | 3,368 | | | | 192,448 | | |
Parker-Hannifin Corp. | | | 1,278 | | | | 190,601 | | |
Quanta Services, Inc. | | | 7,803 | | | | 234,870 | | |
Raytheon Co. | | | 1,396 | | | | 214,077 | | |
Republic Services, Inc., Class A | | | 5,059 | | | | 364,704 | | |
Robert Half International, Inc. | | | 3,086 | | | | 176,519 | | |
Rollins, Inc. | | | 7,860 | | | | 283,746 | | |
Roper Technologies, Inc. | | | 928 | | | | 247,331 | | |
Schneider National, Inc. | | | 7,271 | | | | 135,750 | | |
Sensata Technologies Holding PLC, ADR (a) | | | 4,626 | | | | 207,430 | | |
Snap-on, Inc. (b) | | | 1,277 | | | | 185,535 | | |
Southwest Airlines Co. | | | 3,584 | | | | 166,584 | | |
Spirit Aerosystems Holdings, Inc., Class A | | | 2,717 | | | | 195,869 | | |
Stanley Black & Decker, Inc. | | | 1,582 | | | | 189,429 | | |
Stericycle, Inc. (a) | | | 3,357 | | | | 123,168 | | |
Teledyne Technologies, Inc. (a) | | | 1,087 | | | | 225,085 | | |
The Boeing Co. | | | 611 | | | | 197,048 | | |
The Middleby Corp. (a) (b) | | | 1,257 | | | | 129,132 | | |
Toro Co. | | | 4,327 | | | | 241,792 | | |
TransDigm Group, Inc. (a) | | | 871 | | | | 296,191 | | |
TransUnion | | | 3,461 | | | | 196,585 | | |
Trex Co., Inc. (a) | | | 1,540 | | | | 91,414 | | |
Trinity Industries, Inc. | | | 10,279 | | | | 211,645 | | |
Union Pacific Corp. | | | 1,831 | | | | 253,100 | | |
United Continental Holdings, Inc. (a) | | | 2,337 | | | | 195,677 | | |
United Parcel Service, Inc., Class B | | | 2,181 | | | | 212,713 | | |
United Rentals, Inc. (a) | | | 1,085 | | | | 111,245 | | |
United Technologies Corp. | | | 2,487 | | | | 264,815 | | |
Verisk Analytics, Inc., Class A (a) | | | 2,767 | | | | 301,714 | | |
W.W. Grainger, Inc. | | | 545 | | | | 153,886 | | |
WABCO Holdings, Inc. (a) (b) | | | 2,062 | | | | 221,335 | | |
Wabtec Corp. (b) | | | 2,613 | | | | 183,563 | | |
See notes to financial statements.
10
Victory Portfolios II
Victory US 500 Enhanced Volatility Wtd Index Fund | | Schedule of Portfolio Investments — continued
December 31, 2018 | |
(Unaudited)
Security Description | | Shares | | Value | |
Waste Management, Inc. | | | 3,657 | | | $ | 325,436 | | |
Watsco, Inc. | | | 1,299 | | | | 180,743 | | |
Woodward, Inc. | | | 3,530 | | | | 262,243 | | |
XPO Logistics, Inc. (a) | | | 1,670 | | | | 95,257 | | |
Xylem, Inc. | | | 2,905 | | | | 193,822 | | |
| | | | 19,540,924 | | |
Information Technology (11.1%): | |
Accenture PLC, Class A | | | 1,466 | | | | 206,721 | | |
Adobe Systems, Inc. (a) | | | 795 | | | | 179,861 | | |
Advanced Micro Devices, Inc. (a) | | | 4,535 | | | | 83,716 | | |
Akamai Technologies, Inc. (a) | | | 2,719 | | | | 166,077 | | |
Alliance Data Systems Corp. | | | 937 | | | | 140,625 | | |
Analog Devices, Inc. | | | 2,500 | | | | 214,574 | | |
ANSYS, Inc. (a) | | | 1,505 | | | | 215,125 | | |
Apple, Inc. | | | 1,116 | | | | 176,038 | | |
Applied Materials, Inc. | | | 3,539 | | | | 115,867 | | |
Arrow Electronics, Inc. (a) | | | 3,274 | | | | 225,742 | | |
Aspen Technology, Inc. (a) | | | 2,156 | | | | 177,180 | | |
Automatic Data Processing, Inc. | | | 2,071 | | | | 271,550 | | |
Black Knight, Inc. (a) | | | 6,946 | | | | 312,987 | | |
Blackbaud, Inc. | | | 1,839 | | | | 115,673 | | |
Booz Allen Hamilton Holdings Corp. | | | 6,119 | | | | 275,783 | | |
Broadcom, Inc. | | | 766 | | | | 194,778 | | |
Broadridge Financial Solutions, Inc. | | | 1,731 | | | | 166,609 | | |
CACI International, Inc., Class A (a) | | | 1,233 | | | | 177,589 | | |
CDK Global, Inc. | | | 5,637 | | | | 269,900 | | |
CDW Corp. of Delaware | | | 3,059 | | | | 247,932 | | |
Coherent, Inc. (a) | | | 683 | | | | 72,200 | | |
CommScope Holding Co., Inc. (a) | | | 4,017 | | | | 65,839 | | |
DXC Technology Co. | | | 2,824 | | | | 150,152 | | |
F5 Networks, Inc. (a) | | | 1,444 | | | | 233,971 | | |
Fair Isaac Corp. (a) | | | 1,154 | | | | 215,798 | | |
Fidelity National Information Services, Inc. | | | 3,231 | | | | 331,338 | | |
First Data Corp., Class A (a) | | | 6,440 | | | | 108,900 | | |
Fiserv, Inc. (a) | | | 4,698 | | | | 345,255 | | |
FleetCor Technologies, Inc. (a) | | | 1,220 | | | | 226,578 | | |
Genpact Ltd. | | | 9,742 | | | | 262,937 | | |
Global Payments, Inc. | | | 2,124 | | | | 219,048 | | |
Hewlett Packard Enterprises Co. | | | 12,516 | | | | 165,336 | | |
HP, Inc. | | | 10,109 | | | | 206,830 | | |
IPG Photonics Corp. (a) (b) | | | 620 | | | | 70,240 | | |
Jabil Circuit, Inc. | | | 7,274 | | | | 180,322 | | |
Jack Henry & Associates, Inc. | | | 1,936 | | | | 244,943 | | |
Leidos Holdings, Inc. | | | 3,905 | | | | 205,872 | | |
LogMeIn, Inc. | | | 1,464 | | | | 119,418 | | |
Marvell Technology Group Ltd., ADR | | | 8,077 | | | | 130,767 | | |
Mastercard, Inc., Class A | | | 1,232 | | | | 232,417 | | |
Micron Technology, Inc. (a) | | | 2,292 | | | | 72,725 | | |
MKS Instruments, Inc. | | | 1,529 | | | | 98,789 | | |
Monolithic Power Systems, Inc. | | | 1,401 | | | | 162,866 | | |
See notes to financial statements.
11
Victory Portfolios II
Victory US 500 Enhanced Volatility Wtd Index Fund | | Schedule of Portfolio Investments — continued
December 31, 2018 | |
(Unaudited)
Security Description | | Shares | | Value | |
Nvidia Corp. | | | 588 | | | $ | 78,498 | | |
ON Semiconductor Corp. (a) | | | 8,029 | | | | 132,559 | | |
Paychex, Inc. | | | 4,618 | | | | 300,863 | | |
Paycom Software, Inc. (a) (b) | | | 821 | | | | 100,531 | | |
PayPal Holdings, Inc. (a) | | | 2,340 | | | | 196,771 | | |
PTC, Inc. (a) | | | 2,360 | | | | 195,644 | | |
Sabre Corp. | | | 7,783 | | | | 168,424 | | |
Salesforce.com, Inc. (a) | | | 1,528 | | | | 209,290 | | |
Seagate Technology PLC | | | 3,140 | | | | 121,173 | | |
Skyworks Solutions, Inc. | | | 2,286 | | | | 153,208 | | |
Texas Instruments, Inc. | | | 2,005 | | | | 189,473 | | |
The Trade Desk, Inc., Class A (a) (b) | | | 448 | | | | 51,995 | | |
Total System Services, Inc. | | | 3,010 | | | | 244,683 | | |
Tyler Technologies, Inc. (a) | | | 1,251 | | | | 232,461 | | |
Universal Display Corp. (b) | | | 897 | | | | 83,932 | | |
VeriSign, Inc. (a) | | | 1,859 | | | | 275,671 | | |
Visa, Inc., Class A | | | 2,057 | | | | 271,401 | | |
WEX, Inc. (a) | | | 1,354 | | | | 189,641 | | |
Xilinx, Inc. | | | 2,506 | | | | 213,436 | | |
| | | | 11,466,522 | | |
Materials (5.6%): | |
Air Products & Chemicals, Inc. | | | 1,979 | | | | 316,740 | | |
AptarGroup, Inc. | | | 3,085 | | | | 290,206 | | |
Ball Corp. | | | 7,695 | | | | 353,817 | | |
Berry Global Group, Inc. (a) | | | 5,761 | | | | 273,820 | | |
Celanese Corp., Series A | | | 2,115 | | | | 190,287 | | |
Eastman Chemical Co. | | | 2,794 | | | | 204,269 | | |
Ecolab, Inc. | | | 2,372 | | | | 349,515 | | |
FMC Corp. | | | 2,690 | | | | 198,952 | | |
Freeport-McMoRan, Inc. | | | 9,326 | | | | 96,151 | | |
Huntsman Corp. | | | 6,315 | | | | 121,816 | | |
International Paper Co. | | | 4,619 | | | | 186,423 | | |
Lyondellbasell Industries NV, Class A | | | 2,052 | | | | 170,644 | | |
Martin Marietta Materials, Inc. | | | 1,240 | | | | 213,119 | | |
NewMarket Corp. | | | 660 | | | | 271,979 | | |
Nucor Corp. | | | 3,383 | | | | 175,273 | | |
Olin Corp. | | | 6,748 | | | | 135,702 | | |
Packaging Corp. of America | | | 2,240 | | | | 186,950 | | |
PPG Industries, Inc. | | | 2,478 | | | | 253,326 | | |
Reliance Steel & Aluminum Co. | | | 2,443 | | | | 173,868 | | |
RPM International, Inc. | | | 3,611 | | | | 212,255 | | |
Sonoco Products Co. | | | 6,048 | | | | 321,330 | | |
Steel Dynamics, Inc. | | | 4,051 | | | | 121,692 | | |
The Chemours Co. | | | 4,161 | | | | 117,423 | | |
The Sherwin-Williams Co. | | | 591 | | | | 232,535 | | |
U.S. Steel Corp. | | | 3,923 | | | | 71,556 | | |
Vulcan Materials Co. | | | 2,120 | | | | 209,456 | | |
See notes to financial statements.
12
Victory Portfolios II
Victory US 500 Enhanced Volatility Wtd Index Fund | | Schedule of Portfolio Investments — continued
December 31, 2018 | |
(Unaudited)
Security Description | | Shares | | Value | |
Westlake Chemical Corp. | | | 2,025 | | | $ | 133,994 | | |
WestRock Co. | | | 4,787 | | | | 180,757 | | |
| | | | 5,763,855 | | |
Real Estate (0.4%): | |
CBRE Group, Inc., Class A (a) | | | 6,239 | | | | 249,810 | | |
Jones Lang LaSalle, Inc. | | | 1,557 | | | | 197,116 | | |
| | | | 446,926 | | |
Utilities (7.4%): | |
Alliant Energy Corp. | | | 8,522 | | | | 360,055 | | |
American Electric Power Co., Inc. | | | 5,027 | | | | 375,718 | | |
Aqua America, Inc. | | | 8,884 | | | | 303,744 | | |
Atmos Energy Corp. | | | 4,289 | | | | 397,676 | | |
Consolidated Edison, Inc. | | | 4,674 | | | | 357,374 | | |
Dominion Resources, Inc. | | | 4,706 | | | | 336,291 | | |
DTE Energy Co. | | | 3,485 | | | | 384,396 | | |
Duke Energy Corp. | | | 4,605 | | | | 397,412 | | |
Eversource Energy | | | 6,037 | | | | 392,646 | | |
Exelon Corp. | | | 9,148 | | | | 412,575 | | |
IDACORP, Inc. | | | 3,457 | | | | 321,708 | | |
MDU Resources Group, Inc. | | | 12,462 | | | | 297,094 | | |
National Fuel Gas Co. (b) | | | 6,411 | | | | 328,115 | | |
NextEra Energy, Inc. | | | 2,394 | | | | 416,124 | | |
OGE Energy Corp. | | | 9,880 | | | | 387,197 | | |
Pinnacle West Capital Corp. | | | 4,663 | | | | 397,288 | | |
PPL Corp. | | | 9,791 | | | | 277,379 | | |
Public Service Enterprise Group, Inc. | | | 6,861 | | | | 357,115 | | |
UGI Corp. | | | 7,673 | | | | 409,355 | | |
WEC Energy Group, Inc. | | | 5,543 | | | | 383,908 | | |
Xcel Energy, Inc. | | | 7,329 | | | | 361,100 | | |
| | | | 7,654,270 | | |
Total Common Stocks (Cost $91,484,282) | | | 102,593,484 | | |
Collateral for Securities Loaned^ (3.4%) | |
BlackRock Liquidity Funds TempFund Portfolio, Institutional Class, 2.49% (c) | | | 666,821 | | | | 666,820 | | |
Fidelity Investments Money Market Government Portfolio, Class I, 2.28% (c) | | | 963,524 | | | | 963,524 | | |
Fidelity Investments Prime Money Market Portfolio, Class I, 2.46% (c) | | | 29,754 | | | | 29,754 | | |
Goldman Sachs Financial Square Prime Obligations Fund,
Institutional Class, 2.55% (c) | | | 370,460 | | | | 370,460 | | |
JPMorgan Prime Money Market Fund, Capital Class, 2.49% (c) | | | 592,699 | | | | 592,699 | | |
Morgan Stanley Institutional Liquidity Prime Portfolio,
Institutional Class, 2.58% (c) | | | 889,104 | | | | 889,104 | | |
Total Collateral for Securities Loaned (Cost $3,512,361) | | | 3,512,361 | | |
Total Investments (Cost $94,996,643) — 102.6% | | | 106,105,845 | | |
Liabilities in excess of other assets — (2.6)% | | | (2,718,751 | ) | |
NET ASSETS — 100.00% | | $ | 103,387,094 | | |
See notes to financial statements.
13
Victory Portfolios II
Victory US 500 Enhanced Volatility Wtd Index Fund | | Schedule of Portfolio Investments — continued
December 31, 2018 | |
(Unaudited)
^ Purchased with cash collateral from securities on loan.
(a) Non-income producing security.
(b) All or a portion of this security is on loan.
(c) Rate disclosed is the daily yield on December 31, 2018.
ADR — American Depositary Receipt
PLC — Public Limited Company
Futures Contracts Purchased
| | | Number of
Contracts | | Expiration
Date | | Notional
Amount | | Value | | Unrealized
Appreciation
(Depreciation) | |
E-Mini S&P 500 Futures | | | 9 | | | 3/15/19 | | $ | 1,132,674 | | | $ | 1,127,340 | | | $ | (5,334 | ) | |
| | | | | Total unrealized appreciation | | | | | | $ | — | | |
| | | | | Total unrealized depreciation | | | | | | | (5,334 | ) | |
| | | | | Total net unrealized appreciation(depreciation) | | | | | | $ | (5,334 | ) | |
See notes to financial statements.
14
Victory Portfolios II
Victory Market Neutral Income Fund | | Schedule of Portfolio Investments
December 31, 2018 | |
(Unaudited)
Security Description | | Shares | | Fair
Value(a) | |
Common Stocks (76.7%) | |
Australia (1.9%): | |
Communication Services (0.1%): | |
Telstra Corp. Ltd. | | | 34,561 | | | $ | 69,344 | | |
Consumer Staples (0.2%): | |
Wesfarmers Ltd. | | | 4,903 | | | | 111,366 | | |
Financials (0.9%): | |
Australia & New Zealand Banking Group Ltd. | | | 6,251 | | | | 107,986 | | |
Commonwealth Bank of Australia | | | 2,384 | | | | 121,577 | | |
National Australia Bank Ltd. | | | 7,410 | | | | 125,716 | | |
Westpac Banking Corp. | | | 6,105 | | | | 107,852 | | |
| | | | 463,131 | | |
Materials (0.5%): | |
BHP Group PLC | | | 3,223 | | | | 68,095 | | |
RIO Tinto Ltd. | | | 1,767 | | | | 97,776 | | |
South32 Ltd. | | | 24,169 | | | | 57,481 | | |
| | | | 223,352 | | |
Utilities (0.2%): | |
AGL Energy Ltd. (b) | | | 6,269 | | | | 91,020 | | |
| | | | 958,213 | | |
Bermuda (0.4%): | |
Financials (0.4%): | |
Invesco Ltd. | | | 3,494 | | | | 58,489 | | |
James River Group Holdings Ltd. | | | 3,514 | | | | 128,402 | | |
| | | | 186,891 | | |
Brazil (1.9%): | |
Consumer Discretionary (0.1%): | |
Kroton Educacional S.A. | | | 20,700 | | | | 47,295 | | |
Financials (0.5%): | |
Banco do Brasil SA | | | 9,700 | | | | 116,136 | | |
BB Seguridade Participacoes SA | | | 18,100 | | | | 128,875 | | |
| | | | 245,011 | | |
Health Care (0.3%): | |
Fleury SA | | | 13,600 | | | | 69,220 | | |
Hypermarcas S.A. | | | 14,100 | | | | 109,812 | | |
| | | | 179,032 | | |
Industrials (0.2%): | |
CCR SA | | | 35,900 | | | | 103,554 | | |
Information Technology (0.1%): | |
Cielo SA | | | 19,700 | | | | 45,158 | | |
See notes to financial statements.
15
Victory Portfolios II
Victory Market Neutral Income Fund | | Schedule of Portfolio Investments — continued
December 31, 2018 | |
(Unaudited)
Security Description | | Shares | | Fair
Value(a) | |
Utilities (0.7%): | |
Cia de Saneamento Basico do Estado de Sao Paulo | | | 14,100 | | | $ | 114,433 | | |
EDP — Energias do Brasil SA | | | 22,300 | | | | 84,744 | | |
Engie Brasil Energia SA | | | 17,303 | | | | 147,190 | | |
| | | | 346,367 | | |
| | | | 966,417 | | |
Canada (2.3%): | |
Communication Services (0.8%): | |
BCE, Inc. | | | 5,014 | | | | 198,099 | | |
TELUS Corp. (b) | | | 6,048 | | | | 200,492 | | |
| | | | 398,591 | | |
Energy (0.5%): | |
Enbridge, Inc. | | | 2,288 | | | | 71,087 | | |
Pembina Pipeline Corp. (b) | | | 3,261 | | | | 96,779 | | |
TransCanada Corp. | | | 2,486 | | | | 88,786 | | |
| | | | 256,652 | | |
Financials (0.3%): | |
Power Financial Corp. | | | 7,709 | | | | 145,878 | | |
Utilities (0.7%): | |
Fortis, Inc. | | | 5,813 | | | | 193,809 | | |
Hydro One Ltd. (c) | | | 11,918 | | | | 176,806 | | |
| | | | 370,615 | | |
| | | | 1,171,736 | | |
Chile (0.6%): | |
Utilities (0.6%): | |
Aguas Andinas SA | | | 359,289 | | | | 197,826 | | |
Colbun SA | | | 590,023 | | | | 119,163 | | |
| | | | 316,989 | | |
China (3.0%): | |
Consumer Discretionary (0.2%): | |
Chongqing Changan Automobile Co. Ltd. | | | 112,700 | | | | 50,367 | | |
Guangzhou Automobile Group Co. Ltd. (b) | | | 62,000 | | | | 61,816 | | |
| | | | 112,183 | | |
Energy (0.4%): | |
China Petroleum & Chemical Corp., Class H | | | 96,000 | | | | 68,434 | | |
China Shenhua Energy Co. Ltd. | | | 35,000 | | | | 76,338 | | |
Yanzhou Coal Mining Co. Ltd. | | | 44,000 | | | | 35,538 | | |
| | | | 180,310 | | |
Financials (1.8%): | |
Agricultural Bank of China Ltd. | | | 225,000 | | | | 98,555 | | |
Bank of China Ltd. | | | 341,000 | | | | 147,015 | | |
Bank of Communications Co. Ltd., Class H | | | 197,000 | | | | 153,834 | | |
China Cinda Asset Management Co. | | | 406,000 | | | | 98,410 | | |
China CITIC Bank Corp. Ltd. | | | 171,000 | | | | 103,750 | | |
See notes to financial statements.
16
Victory Portfolios II
Victory Market Neutral Income Fund | | Schedule of Portfolio Investments — continued
December 31, 2018 | |
(Unaudited)
Security Description | | Shares | | Fair
Value(a) | |
China Everbright Bank Co. Ltd. | | | 299,000 | | | $ | 129,577 | | |
China Huarong Asset Management Co. Ltd., Class H (c) | | | 364,000 | | | | 66,447 | | |
Chongqing Rural Commercial Bank Co. Ltd. | | | 177,000 | | | | 94,862 | | |
| | | | 892,450 | | |
Industrials (0.3%): | |
Jiangsu Expressway Co. Ltd. | | | 72,000 | | | | 100,505 | | |
Weichai Power Co. Ltd. | | | 50,000 | | | | 57,247 | | |
| | | | 157,752 | | |
Materials (0.1%): | |
Sinopec Shanghai Petrochemical Co. Ltd. | | | 164,000 | | | | 71,794 | | |
Real Estate (0.2%): | |
Cifi Holdings Group Co. Ltd. | | | 100,000 | | | | 53,010 | | |
Guangzhou R&f Properties Co. Ltd., Class H | | | 34,000 | | | | 51,453 | | |
| | | | 104,463 | | |
| | | | 1,518,952 | | |
Czech Republic (0.4%): | |
Financials (0.4%): | |
Komercni Banka AS | | | 5,258 | | | | 198,638 | | |
Denmark (0.1%): | |
Financials (0.1%): | |
Danske Bank A/S | | | 3,063 | | | | 60,820 | | |
Egypt (0.3%): | |
Consumer Staples (0.2%): | |
Eastern Tobacco | | | 77,925 | | | | 70,872 | | |
Industrials (0.1%): | |
Elsewedy Electric Co. | | | 66,323 | | | | 66,720 | | |
| | | | 137,592 | | |
Finland (0.6%): | |
Financials (0.4%): | |
Nordea Bank AB | | | 9,052 | | | | 76,243 | | |
Sampo Oyj, Class A | | | 2,642 | | | | 117,077 | | |
| | | | 193,320 | | |
Utilities (0.2%): | |
Fortum Oyj | | | 3,902 | | | | 85,400 | | |
| | | | 278,720 | | |
France (2.4%): | |
Communication Services (0.2%): | |
Orange SA | | | 7,999 | | | | 129,612 | | |
Consumer Discretionary (0.1%): | |
Renault SA | | | 981 | | | | 61,101 | | |
Energy (0.2%): | |
Total SA | | | 1,812 | | | | 95,561 | | |
See notes to financial statements.
17
Victory Portfolios II
Victory Market Neutral Income Fund | | Schedule of Portfolio Investments — continued
December 31, 2018 | |
(Unaudited)
Security Description | | Shares | | Fair
Value(a) | |
Financials (0.8%): | |
AXA SA | | | 3,742 | | | $ | 80,748 | | |
BNP Paribas SA | | | 1,847 | | | | 83,401 | | |
Credit Agricole SA | | | 9,087 | | | | 97,785 | | |
Natixis SA | | | 12,860 | | | | 60,646 | | |
Societe Generale SA | | | 2,828 | | | | 89,648 | | |
| | | | 412,228 | | |
Health Care (0.3%): | |
Sanofi | | | 1,560 | | | | 135,311 | | |
Industrials (0.2%): | |
Bouygues | | | 2,540 | | | | 91,196 | | |
Utilities (0.6%): | |
GDF Suez | | | 7,278 | | | | 104,556 | | |
Suez Environnement Co. | | | 5,663 | | | | 74,926 | | |
Veolia Environnement SA | | | 5,331 | | | | 109,160 | | |
| | | | 288,642 | | |
| | | | 1,213,651 | | |
Germany (0.8%): | |
Communication Services (0.3%): | |
Deutsche Telekom AG, Registered Shares | | | 7,728 | | | | 131,333 | | |
Consumer Discretionary (0.3%): | |
Bayerische Motoren Werke AG | | | 1,071 | | | | 86,852 | | |
Daimler AG, Registered Shares | | | 1,406 | | | | 74,107 | | |
| | | | 160,959 | | |
Materials (0.2%): | |
BASF SE | | | 1,148 | | | | 79,951 | | |
| | | | 372,243 | | |
Hong Kong (1.2%): | |
Consumer Staples (0.1%): | |
WH Group Ltd. (c) | | | 67,500 | | | | 51,847 | | |
Industrials (0.2%): | |
China Merchants Holdings International (b) | | | 62,000 | | | | 111,484 | | |
Real Estate (0.1%): | |
Agile Group Holdings Ltd. | | | 36,000 | | | | 42,472 | | |
Utilities (0.8%): | |
China Resources Power Holdings Co. Ltd. | | | 56,000 | | | | 107,719 | | |
CK Infrastructure Holdings Ltd. | | | 21,000 | | | | 158,932 | | |
Power Assets Holdings Ltd. (b) | | | 18,000 | | | | 125,061 | | |
| | | | 391,712 | | |
| | | | 597,515 | | |
India (0.2%): | |
Communication Services (0.2%): | |
Bharti Infratel Ltd. | | | 29,886 | | | | 110,862 | | |
See notes to financial statements.
18
Victory Portfolios II
Victory Market Neutral Income Fund | | Schedule of Portfolio Investments — continued
December 31, 2018 | |
(Unaudited)
Security Description | | Shares | | Fair
Value(a) | |
Indonesia (0.6%): | |
Communication Services (0.2%): | |
PT Telekomunikasi Indonesia Persero TBK | | | 349,100 | | | $ | 91,298 | | |
Energy (0.3%): | |
PT Adaro Energy TBK | | | 459,200 | | | | 38,862 | | |
PT Indo Tambangraya Megah TBK | | | 28,100 | | | | 39,643 | | |
Tambang Batubara Bukit Asam TBK PT | | | 238,600 | | | | 71,504 | | |
| | | | 150,009 | | |
Materials (0.1%): | |
PT Indocement Tunggal Prakarsa TBK | | | 43,800 | | | | 56,271 | | |
| | | | 297,578 | | |
Ireland (0.4%): | |
Communication Services (0.1%): | |
WPP PLC | | | 3,951 | | | | 42,992 | | |
Industrials (0.2%): | |
Eaton Corp. PLC, ADR | | | 1,296 | | | | 88,984 | | |
Information Technology (0.1%): | |
Seagate Technology PLC | | | 1,236 | | | | 47,697 | | |
| | | | 179,673 | | |
Italy (1.3%): | |
Energy (0.4%): | |
Eni SpA | | | 5,665 | | | | 89,479 | | |
Snam SpA | | | 23,922 | | | | 104,725 | | |
| | | | 194,204 | | |
Financials (0.3%): | |
Assicurazioni Generali SpA | | | 6,544 | | | | 109,361 | | |
Intesa Sanpaolo SpA | | | 29,240 | | | | 65,098 | | |
| | | | 174,459 | | |
Industrials (0.1%): | |
Atlantia SpA | | | 2,384 | | | | 49,330 | | |
Utilities (0.5%): | |
Enel SpA | | | 20,669 | | | | 119,807 | | |
Terna Rete Elettrica Nazionale SpA | | | 18,824 | | | | 106,890 | | |
| | | | 226,697 | | |
| | | | 644,690 | | |
Japan (1.2%): | |
Consumer Discretionary (0.8%): | |
Bridgestone Corp. | | | 2,900 | | | | 111,276 | | |
Fuji Heavy Industries Ltd. | | | 3,800 | | | | 81,192 | | |
Nissan Motor Co. Ltd. | | | 13,900 | | | | 111,206 | | |
Sekisui House Ltd. | | | 6,500 | | | | 95,466 | | |
| | | | 399,140 | | |
See notes to financial statements.
19
Victory Portfolios II
Victory Market Neutral Income Fund | | Schedule of Portfolio Investments — continued
December 31, 2018 | |
(Unaudited)
Security Description | | Shares | | Fair
Value(a) | |
Consumer Staples (0.2%): | |
Japan Tobacco, Inc. | | | 3,700 | | | $ | 87,928 | | |
Information Technology (0.2%): | |
Canon, Inc. | | | 4,400 | | | | 121,086 | | |
| | | | 608,154 | | |
Korea, Republic Of (0.5%): | |
Consumer Staples (0.2%): | |
KT&G Corp. | | | 1,170 | | | | 106,534 | | |
Energy (0.3%): | |
SK Innovation Co. Ltd. | | | 434 | | | | 69,670 | | |
S-Oil Corp. | | | 699 | | | | 60,976 | | |
| | | | 130,646 | | |
| | | | 237,180 | | |
Macau (0.1%): | |
Consumer Discretionary (0.1%): | |
Sands China Ltd. | | | 14,400 | | | | 62,802 | | |
Malaysia (1.5%): | |
Communication Services (0.4%): | |
Astro Malaysia Holdings BHD | | | 116,200 | | | | 36,615 | | |
DiGi.Com Berhad | | | 91,100 | | | | 99,052 | | |
Telekom Malaysia Berhad | | | 80,500 | | | | 51,941 | | |
| | | | 187,608 | | |
Consumer Staples (0.1%): | |
British American Tobacco Malaysia BHD | | | 6,700 | | | | 58,465 | | |
Financials (0.5%): | |
CIMB Group Holdings Berhad | | | 73,000 | | | | 100,859 | | |
Malayan Banking Berhad | | | 62,800 | | | | 144,349 | | |
| | | | 245,208 | | |
Industrials (0.4%): | |
MISC BHD | | | 63,200 | | | | 102,458 | | |
Sime Darby BHD | | | 170,200 | | | | 98,898 | | |
| | | | 201,356 | | |
Utilities (0.1%): | |
YTL Power International BHD | | | 285,300 | | | | 57,331 | | |
| | | | 749,968 | | |
Mexico (0.3%): | |
Consumer Staples (0.2%): | |
Kimberly-Clark de Mexico SAB de CV, Series A | | | 62,447 | | | | 99,068 | | |
Materials (0.1%): | |
Grupo Mexico SAB de CV, Series B | | | 30,329 | | | | 62,425 | | |
| | | | 161,493 | | |
See notes to financial statements.
20
Victory Portfolios II
Victory Market Neutral Income Fund | | Schedule of Portfolio Investments — continued
December 31, 2018 | |
(Unaudited)
Security Description | | Shares | | Fair
Value(a) | |
Netherlands (0.9%): | |
Communication Services (0.3%): | |
Koninklijke KPN NV | | | 41,214 | | | $ | 120,370 | | |
Financials (0.3%): | |
ABN AMRO Group NV (c) | | | 3,351 | | | | 78,844 | | |
ING Groep NV | | | 7,941 | | | | 85,407 | | |
| | | | 164,251 | | |
Industrials (0.2%): | |
Randstad Holding NV | | | 1,605 | | | | 73,579 | | |
Materials (0.1%): | |
Lyondellbasell Industries NV, Class A | | | 807 | | | | 67,110 | | |
| | | | 425,310 | | |
Norway (0.4%): | |
Communication Services (0.2%): | |
Telenor ASA | | | 5,495 | | | | 106,787 | | |
Consumer Staples (0.2%): | |
Marine Harvest ASA | | | 4,415 | | | | 93,121 | | |
| | | | 199,908 | | |
Philippines (0.2%): | |
Communication Services (0.2%): | |
Globe Telecom, Inc. | | | 1,905 | | | | 68,680 | | |
Poland (0.2%): | |
Financials (0.2%): | |
Bank Pekao SA | | | 3,455 | | | | 100,794 | | |
Portugal (0.1%): | |
Consumer Staples (0.1%): | |
Jeronimo Martins SGPS SA | | | 5,177 | | | | 61,342 | | |
Russian Federation (1.9%): | |
Communication Services (0.5%): | |
Mobile TeleSystems PJSC | | | 34,060 | | | | 116,709 | | |
Rostelecom PJSC | | | 143,550 | | | | 151,028 | | |
| | | | 267,737 | | |
Consumer Staples (0.3%): | |
Magnit PJSC, GDR | | | 4,982 | | | | 63,421 | | |
X5 Retail Group NV, Registered Shares, GDR | | | 3,019 | | | | 74,902 | | |
| | | | 138,323 | | |
Energy (0.3%): | |
Tatneft PAO | | | 11,330 | | | | 119,670 | | |
Materials (0.6%): | |
ALROSA AO | | | 65,710 | | | | 92,819 | | |
Evraz PLC | | | 6,650 | | | | 40,715 | | |
See notes to financial statements.
21
Victory Portfolios II
Victory Market Neutral Income Fund | | Schedule of Portfolio Investments — continued
December 31, 2018 | |
(Unaudited)
Security Description | | Shares | | Fair
Value(a) | |
MMC Norilsk Nickel PJSC | | | 501 | | | $ | 94,168 | | |
Severstal PJSC | | | 6,660 | | | | 90,299 | | |
| | | | 318,001 | | |
Utilities (0.2%): | |
Federal Grid Co. Unified Energy System PJSC | | | 47,860,000 | | | | 102,048 | | |
| | | | 945,779 | | |
Singapore (0.2%): | |
Communication Services (0.2%): | |
Singapore Telecommunications Ltd. | | | 46,900 | | | | 100,966 | | |
South Africa (1.8%): | |
Communication Services (0.5%): | |
Telkom SA SOC Ltd. | | | 30,876 | | | | 136,309 | | |
Vodacom Group Ltd. | | | 10,265 | | | | 94,650 | | |
| | | | 230,959 | | |
Consumer Discretionary (0.3%): | |
The Foschini Group Ltd. | | | 6,790 | | | | 78,611 | | |
Truworths International Ltd. | | | 14,060 | | | | 86,198 | | |
| | | | 164,809 | | |
Financials (0.8%): | |
Absa Group Ltd. | | | 8,521 | | | | 95,880 | | |
Investec Ltd. | | | 17,931 | | | | 98,207 | | |
Nedbank Group Ltd. | | | 5,412 | | | | 103,482 | | |
Standard Bank Group Ltd. | | | 7,359 | | | | 91,664 | | |
| | | | 389,233 | | |
Materials (0.2%): | |
African Rainbow Minerals Ltd. | | | 6,700 | | | | 66,433 | | |
Assore Ltd. | | | 2,730 | | | | 55,325 | | |
| | | | 121,758 | | |
| | | | 906,759 | | |
Spain (1.2%): | |
Communication Services (0.2%): | |
Telefonica SA | | | 15,738 | | | | 132,455 | | |
Energy (0.2%): | |
Repsol SA | | | 5,404 | | | | 86,869 | | |
Utilities (0.8%): | |
Endesa SA | | | 5,829 | | | | 134,402 | | |
Iberdrola SA | | | 16,397 | | | | 131,648 | | |
Red Electrica Corp. SA | | | 5,854 | | | | 130,528 | | |
| | | | 396,578 | | |
| | | | 615,902 | | |
See notes to financial statements.
22
Victory Portfolios II
Victory Market Neutral Income Fund | | Schedule of Portfolio Investments — continued
December 31, 2018 | |
(Unaudited)
Security Description | | Shares | | Fair
Value(a) | |
Sweden (0.9%): | |
Communication Services (0.2%): | |
TeliaSonera AB | | | 21,608 | | | $ | 102,843 | | |
Consumer Discretionary (0.2%): | |
Hennes & Mauritz AB, B Shares (b) | | | 4,968 | | | | 70,689 | | |
Financials (0.4%): | |
Skandinaviska Enskilda Banken AB, Class A | | | 9,284 | | | | 90,298 | | |
Swedbank AB, A Shares | | | 4,939 | | | | 110,453 | | |
| | | | 200,751 | | |
Industrials (0.1%): | |
Atlas Copco AB, A Shares | | | 2,797 | | | | 66,768 | | |
| | | | 441,051 | | |
Switzerland (0.9%): | |
Communication Services (0.3%): | |
Swisscom AG | | | 271 | | | | 129,584 | | |
Consumer Discretionary (0.2%): | |
Garmin Ltd. | | | 1,865 | | | | 118,092 | | |
Financials (0.3%): | |
Zurich Insurance Group AG | | | 424 | | | | 126,441 | | |
Industrials (0.1%): | |
Adecco SA, Registered Shares | | | 1,511 | | | | 71,050 | | |
| | | | 445,167 | | |
Taiwan (3.6%): | |
Consumer Discretionary (0.4%): | |
Pou Chen Corp. | | | 123,000 | | | | 130,298 | | |
Ruentex Industries Ltd. | | | 34,200 | | | | 87,459 | | |
| | | | 217,757 | | |
Consumer Staples (0.4%): | |
President Chain Store Corp. | | | 9,000 | | | | 90,678 | | |
Uni-President Enterprises Corp. | | | 47,000 | | | | 106,630 | | |
| | | | 197,308 | | |
Financials (0.4%): | |
Mega Financial Holding Co. Ltd. | | | 231,000 | | | | 195,022 | | |
Information Technology (1.9%): | |
Asustek Computer, Inc. | | | 17,000 | | | | 111,419 | | |
AU Optronics Corp. | | | 241,000 | | | | 95,765 | | |
Compal Electronics, Inc. | | | 300,000 | | | | 170,148 | | |
Inventec Corp. | | | 188,000 | | | | 134,523 | | |
Pegatron Corp. | | | 60,000 | | | | 100,451 | | |
Quanta Computer, Inc. | | | 81,000 | | | | 138,638 | | |
Winbond Electronics Corp. | | | 134,000 | | | | 59,047 | | |
WPG Holdings Ltd. | | | 109,000 | | | | 130,793 | | |
| | | | 940,784 | | |
See notes to financial statements.
23
Victory Portfolios II
Victory Market Neutral Income Fund | | Schedule of Portfolio Investments — continued
December 31, 2018 | |
(Unaudited)
Security Description | | Shares | | Fair
Value(a) | |
Materials (0.5%): | |
Formosa Chemicals & Fibre | | | 33,000 | | | $ | 112,898 | | |
Nan Ya Plastics Corp. | | | 59,000 | | | | 145,106 | | |
| | | | 258,004 | | |
| | | | 1,808,875 | | |
Thailand (1.7%): | |
Communication Services (0.3%): | |
Intouch Holdings Public Co. Ltd. | | | 113,700 | | | | 166,759 | | |
Energy (0.4%): | |
Esso Thailand PCL | | | 133,000 | | | | 41,657 | | |
IRPC Public Co. Ltd. | | | 489,400 | | | | 86,456 | | |
Thai Oil PCL | | | 32,200 | | | | 65,447 | | |
| | | | 193,560 | | |
Materials (0.4%): | |
PTT Global Chemical Public Co. Ltd. | | | 35,100 | | | | 76,913 | | |
The Siam Cement Public Co. Ltd. | | | 11,000 | | | | 147,372 | | |
| | | | 224,285 | | |
Utilities (0.6%): | |
Ratchaburi Electricity Generating Holdings Public Co. Ltd. | | | 180,400 | | | | 281,339 | | |
| | | | 865,943 | | |
Turkey (0.6%): | |
Communication Services (0.2%): | |
Turkcell Iletisim Hizmetleri AS | | | 45,875 | | | | 105,396 | | |
Consumer Discretionary (0.1%): | |
Tofas Turk Otomobil Fabrikasi AS | | | 23,930 | | | | 76,530 | | |
Energy (0.2%): | |
Tupras Turkiye Petrol Rafinerileri AS | | | 3,860 | | | | 85,194 | | |
Materials (0.1%): | |
Eregli Demir ve Celik Fabrikalari TAS | | | 36,983 | | | | 50,376 | | |
| | | | 317,496 | | |
United Kingdom (2.9%): | |
Communication Services (0.3%): | |
BT Group PLC | | | 29,418 | | | | 89,435 | | |
Vodafone Group PLC | | | 46,971 | | | | 91,311 | | |
| | | | 180,746 | | |
Consumer Discretionary (0.3%): | |
Next PLC | | | 1,158 | | | | 58,953 | | |
Persimmon PLC | | | 3,622 | | | | 89,181 | | |
| | | | 148,134 | | |
Consumer Staples (0.3%): | |
British American Tobacco PLC | | | 1,715 | | | | 54,561 | | |
Imperial Tobacco Group PLC | | | 2,673 | | | | 81,118 | | |
| | | | 135,679 | | |
See notes to financial statements.
24
Victory Portfolios II
Victory Market Neutral Income Fund | | Schedule of Portfolio Investments — continued
December 31, 2018 | |
(Unaudited)
Security Description | | Shares | | Fair
Value(a) | |
Energy (0.3%): | |
| BP PLC | | | 12,889 | | | $ | 81,468 | | |
Royal Dutch Shell PLC, Class A | | | 3,093 | | | | 91,022 | | |
| | | | 172,490 | | |
Financials (0.6%): | |
Aviva PLC | | | 20,008 | | | | 95,744 | | |
Legal & General Group PLC | | | 37,116 | | | | 109,341 | | |
Standard Life Aberdeen PLC | | | 24,932 | | | | 81,623 | | |
| | | | 286,708 | | |
Materials (0.5%): | |
Anglo American PLC | | | 2,745 | | | | 61,370 | | |
Antofagasta PLC | | | 6,346 | | | | 63,460 | | |
Mondi PLC | | | 2,886 | | | | 60,100 | | |
Rio Tinto PLC | | | 1,559 | | | | 74,653 | | |
| | | | 259,583 | | |
Utilities (0.6%): | |
Centrica PLC | | | 51,625 | | | | 89,038 | | |
National Grid PLC | | | 10,157 | | | | 99,354 | | |
SSE PLC | | | 7,259 | | | | 100,228 | | |
| | | | 288,620 | | |
| | | | 1,471,960 | | |
United States (37.2%): | |
Communication Services (1.6%): | |
AT&T, Inc. | | | 3,208 | | | | 91,556 | | |
CenturyLink, Inc. | | | 3,099 | | | | 46,950 | | |
Emerald Expositions Events, Inc. | | | 6,055 | | | | 74,719 | | |
Marcus Corp. | | | 2,879 | | | | 113,721 | | |
Omnicom Group, Inc. | | | 1,504 | | | | 110,153 | | |
Sinclair Broadcast Group, Inc., Class A | | | 2,902 | | | | 76,439 | | |
TEGNA, Inc. | | | 7,783 | | | | 84,601 | | |
Verizon Communications, Inc. | | | 2,170 | | | | 121,997 | | |
Viacom, Inc., Class B | | | 2,780 | | | | 71,446 | | |
| | | | 791,582 | | |
Consumer Discretionary (5.0%): | |
Acushnet Holdings Corp. | | | 4,346 | | | | 91,570 | | |
Bed Bath & Beyond, Inc. (b) | | | 4,090 | | | | 46,299 | | |
Big Lots, Inc. | | | 2,117 | | | | 61,224 | | |
Bloomin' Brands, Inc. | | | 6,035 | | | | 107,966 | | |
Bluegreen Vacations Corp. | | | 3,940 | | | | 50,944 | | |
Brinker International, Inc. (b) | | | 2,218 | | | | 97,548 | | |
Chico's FAS, Inc. | | | 7,064 | | | | 39,700 | | |
Ethan Allen Interiors, Inc. | | | 5,632 | | | | 99,067 | | |
Ford Motor Co. | | | 10,607 | | | | 81,143 | | |
Genuine Parts Co. | | | 1,276 | | | | 122,521 | | |
Group 1 Automotive, Inc. | | | 1,043 | | | | 54,987 | | |
Harley-Davidson, Inc. | | | 2,007 | | | | 68,479 | | |
See notes to financial statements.
25
Victory Portfolios II
Victory Market Neutral Income Fund | | Schedule of Portfolio Investments — continued
December 31, 2018 | |
(Unaudited)
Security Description | | Shares | | Fair
Value(a) | |
Haverty Furniture Cos., Inc. | | | 4,570 | | | $ | 85,825 | | |
Jack in the Box, Inc. | | | 1,328 | | | | 103,093 | | |
Kohl's Corp. | | | 788 | | | | 52,276 | | |
L Brands, Inc. | | | 1,930 | | | | 49,543 | | |
Las Vegas Sands Corp. | | | 1,346 | | | | 70,059 | | |
La-Z-Boy, Inc. | | | 2,629 | | | | 72,850 | | |
LCI Industries (b) | | | 840 | | | | 56,112 | | |
Leggett & Platt, Inc. | | | 2,294 | | | | 82,217 | | |
Macy's, Inc. | | | 1,386 | | | | 41,275 | | |
McDonald's Corp. | | | 668 | | | | 118,617 | | |
MDC Holdings, Inc. | | | 3,194 | | | | 89,783 | | |
Newell Brands, Inc. (b) | | | 2,718 | | | | 50,528 | | |
Nutrisystem, Inc. | | | 1,806 | | | | 79,247 | | |
Papa John's International, Inc. (b) | | | 1,639 | | | | 65,249 | | |
Penske Automotive Group, Inc. | | | 1,688 | | | | 68,060 | | |
PetMed Express, Inc. (b) | | | 1,953 | | | | 45,427 | | |
Ruth's Hospitality Group, Inc. | | | 3,008 | | | | 68,372 | | |
Sturm Ruger & Co. | | | 1,639 | | | | 87,227 | | |
Target Corp. | | | 1,073 | | | | 70,914 | | |
Tenneco, Inc. | | | 2,251 | | | | 61,655 | | |
The Buckle, Inc. (b) | | | 2,898 | | | | 56,047 | | |
The Cheesecake Factory, Inc. (b) | | | 1,926 | | | | 83,800 | | |
The Gap, Inc. | | | 1,803 | | | | 46,445 | | |
| | | | 2,526,069 | | |
Consumer Staples (3.5%): | |
Altria Group, Inc. | | | 1,652 | | | | 81,592 | | |
Archer-Daniels-Midland Co. | | | 2,876 | | | | 117,830 | | |
B&G Foods, Inc. (b) | | | 2,332 | | | | 67,418 | | |
Colgate-Palmolive Co. | | | 2,034 | | | | 121,064 | | |
General Mills, Inc. | | | 1,956 | | | | 76,167 | | |
Ingles Markets, Inc., Class A | | | 2,269 | | | | 61,762 | | |
Ingredion, Inc. | | | 883 | | | | 80,706 | | |
John B. Sanfilippo & Son, Inc. (b) | | | 1,470 | | | | 81,820 | | |
Kellogg Co. | | | 1,427 | | | | 81,353 | | |
Kimberly-Clark Corp. | | | 871 | | | | 99,242 | | |
Molson Coors Brewing Co., Class B | | | 1,067 | | | | 59,923 | | |
Philip Morris International, Inc. | | | 953 | | | | 63,622 | | |
The Clorox Co. | | | 641 | | | | 98,804 | | |
The Hershey Co. | | | 1,071 | | | | 114,790 | | |
The J.M. Smucker Co. | | | 840 | | | | 78,531 | | |
The Kraft Heinz Co. | | | 1,543 | | | | 66,411 | | |
The Procter & Gamble Co. | | | 1,751 | | | | 160,952 | | |
Universal Corp. | | | 986 | | | | 53,392 | | |
Vector Group Ltd. | | | 10,359 | | | | 100,793 | | |
Walgreens Boots Alliance, Inc. | | | 1,189 | | | | 81,244 | | |
| | | | 1,747,416 | | |
Energy (1.5%): | |
Arch Coal, Inc. | | | 905 | | | | 75,106 | | |
Chevron Corp. | | | 906 | | | | 98,564 | | |
See notes to financial statements.
26
Victory Portfolios II
Victory Market Neutral Income Fund | | Schedule of Portfolio Investments — continued
December 31, 2018 | |
(Unaudited)
Security Description | | Shares | | Fair
Value(a) | |
Evolution Petroleum Corp. | | | 9,435 | | | $ | 64,347 | | |
Exxon Mobil Corp. | | | 1,431 | | | | 97,580 | | |
Occidental Petroleum Corp. | | | 1,246 | | | | 76,479 | | |
ONEOK, Inc. | | | 1,865 | | | | 100,617 | | |
Phillips 66 | | | 923 | | | | 79,516 | | |
RPC, Inc. (b) | | | 5,100 | | | | 50,337 | | |
The Williams Cos., Inc. | | | 3,397 | | | | 74,904 | | |
Valero Energy Corp. | | | 775 | | | | 58,102 | | |
| | | | 775,552 | | |
Financials (7.7%): | |
American Financial Group, Inc. | | | 1,277 | | | | 115,607 | | |
Ameriprise Financial, Inc. | | | 640 | | | | 66,797 | | |
BB&T Corp. | | | 2,019 | | | | 87,463 | | |
Capitol Federal Financial, Inc. | | | 17,979 | | | | 229,592 | | |
CNA Financial Corp. | | | 2,605 | | | | 115,011 | | |
Cohen & Steers, Inc. (b) | | | 3,693 | | | | 126,744 | | |
Erie Indemnity Co., Class A | | | 1,046 | | | | 139,442 | | |
Federated Investors, Inc., Class B | | | 4,303 | | | | 114,245 | | |
First American Financial Corp. | | | 2,101 | | | | 93,789 | | |
First Busey Corp. | | | 5,344 | | | | 131,142 | | |
FNF Group | | | 2,843 | | | | 89,384 | | |
Hope Bancorp, Inc. | | | 7,774 | | | | 92,200 | | |
Horace Mann Educators Corp. | | | 3,292 | | | | 123,285 | | |
Huntington Bancshares, Inc. | | | 6,593 | | | | 78,589 | | |
KeyCorp | | | 4,334 | | | | 64,057 | | |
Legg Mason, Inc. | | | 3,795 | | | | 96,810 | | |
New York Community Bancorp, Inc. | | | 8,579 | | | | 80,728 | | |
Northwest Bancshares, Inc. | | | 11,391 | | | | 192,964 | | |
Old Republic International Corp. | | | 6,187 | | | | 127,267 | | |
PacWest Bancorp | | | 2,224 | | | | 74,015 | | |
Park National Corp. (b) | | | 1,441 | | | | 122,413 | | |
People's United Financial, Inc. | | | 7,280 | | | | 105,050 | | |
Principal Financial Group, Inc. | | | 1,746 | | | | 77,121 | | |
ProAssurance Corp. | | | 2,204 | | | | 89,394 | | |
Provident Financial Services, Inc. | | | 6,942 | | | | 167,510 | | |
Prudential Financial, Inc. | | | 973 | | | | 79,348 | | |
Safety Insurance Group, Inc. | | | 1,862 | | | | 152,330 | | |
Sandy Spring BanCorp | | | 4,322 | | | | 135,451 | | |
Southside Bancshares, Inc. | | | 4,597 | | | | 145,955 | | |
Trustmark Corp. (b) | | | 4,526 | | | | 128,674 | | |
Umpqua Holdings Corp. | | | 4,500 | | | | 71,550 | | |
Unum Group | | | 1,725 | | | | 50,680 | | |
Waddell & Reed Financial, Inc., Class A (b) | | | 4,727 | | | | 85,464 | | |
Wells Fargo & Co. | | | 1,816 | | | | 83,681 | | |
Westamerica BanCorp | | | 2,312 | | | | 128,732 | | |
| | | | 3,862,484 | | |
Health Care (0.8%): | |
AbbVie, Inc. | | | 705 | | | | 64,994 | | |
Meridian Bioscience, Inc. | | | 9,371 | | | | 162,680 | | |
See notes to financial statements.
27
Victory Portfolios II
Victory Market Neutral Income Fund | | Schedule of Portfolio Investments — continued
December 31, 2018 | |
(Unaudited)
Security Description | | Shares | | Fair
Value(a) | |
Pfizer, Inc. | | | 3,552 | | | $ | 155,045 | | |
| | | | 382,719 | | |
Industrials (5.6%): | |
3M Co. | | | 484 | | | | 92,221 | | |
Acco Brands Corp. | | | 9,775 | | | | 66,275 | | |
Aircastle Ltd. | | | 6,111 | | | | 105,354 | | |
Allegiant Travel Co. | | | 583 | | | | 58,428 | | |
Altra Industrial Motion Corp. | | | 3,217 | | | | 80,908 | | |
Applied Industrial Technologies, Inc. | | | 1,562 | | | | 84,254 | | |
Brady Corp., Class A | | | 3,686 | | | | 160,194 | | |
Deluxe Corp. | | | 2,637 | | | | 101,366 | | |
Emerson Electric Co. | | | 1,289 | | | | 77,018 | | |
Fastenal Co. | | | 1,385 | | | | 72,422 | | |
Gorman-Rupp Co. | | | 4,122 | | | | 133,594 | | |
H&E Equipment Services, Inc. | | | 1,988 | | | | 40,595 | | |
Herman Miller, Inc. | | | 2,453 | | | | 74,203 | | |
HNI Corp. | | | 2,352 | | | | 83,331 | | |
Hubbell, Inc. | | | 750 | | | | 74,505 | | |
Johnson Controls International PLC | | | 2,373 | | | | 70,359 | | |
KBR, Inc. | | | 5,199 | | | | 78,921 | | |
Kimball International, Inc., Class B | | | 8,917 | | | | 126,532 | | |
Knoll, Inc. | | | 5,467 | | | | 90,096 | | |
Matson, Inc. | | | 3,463 | | | | 110,885 | | |
Matthews International Corp., Class A (b) | | | 2,596 | | | | 105,450 | | |
McGrath RentCorp | | | 2,366 | | | | 121,802 | | |
Mobile Mini, Inc. | | | 2,191 | | | | 69,564 | | |
MSC Industrial Direct Co., Inc., Class A | | | 1,228 | | | | 94,458 | | |
Mueller Water Products, Inc., Class A | | | 9,357 | | | | 85,149 | | |
National Presto Industries, Inc. | | | 894 | | | | 104,526 | | |
Pitney Bowes, Inc. | | | 12,691 | | | | 75,004 | | |
Steelcase, Inc., Class A | | | 7,301 | | | | 108,274 | | |
The Greenbrier Cos., Inc. (b) | | | 1,708 | | | | 67,534 | | |
United Parcel Service, Inc., Class B | | | 857 | | | | 83,583 | | |
Wabash National Corp. | | | 5,613 | | | | 73,418 | | |
Watsco, Inc. | | | 510 | | | | 70,961 | | |
| | | | 2,841,184 | | |
Information Technology (2.0%): | |
Broadcom, Inc. | | | 301 | | | | 76,538 | | |
Cass Information Systems, Inc. | | | 2,229 | | | | 117,959 | | |
CSG Systems International, Inc. | | | 3,743 | | | | 118,915 | | |
InterDigital, Inc. | | | 2,121 | | | | 140,898 | | |
ManTech International Corp., Class A | | | 1,731 | | | | 90,523 | | |
MTS Systems Corp. | | | 2,343 | | | | 94,025 | | |
NIC, Inc. | | | 7,339 | | | | 91,591 | | |
Paychex, Inc. | | | 1,816 | | | | 118,312 | | |
Progress Software Corp. | | | 1,815 | | | | 64,414 | | |
The Hackett Group, Inc. (b) | | | 6,680 | | | | 106,947 | | |
| | | | 1,020,122 | | |
See notes to financial statements.
28
Victory Portfolios II
Victory Market Neutral Income Fund | | Schedule of Portfolio Investments — continued
December 31, 2018 | |
(Unaudited)
Security Description | | Shares | | Fair
Value(a) | |
Materials (1.8%): | |
Air Products & Chemicals, Inc. | | | 779 | | | $ | 124,679 | | |
Greif, Inc., Class A | | | 1,781 | | | | 66,093 | | |
International Paper Co. | | | 1,816 | | | | 73,294 | | |
Myers Industries, Inc. | | | 3,274 | | | | 49,470 | | |
Nucor Corp. | | | 1,331 | | | | 68,959 | | |
Olin Corp. | | | 2,652 | | | | 53,332 | | |
Packaging Corp. of America | | | 882 | | | | 73,612 | | |
Rayonier Advanced Materials, Inc. | | | 3,713 | | | | 39,543 | | |
Schnitzer Steel Industries, Inc. | | | 2,851 | | | | 61,439 | | |
Sonoco Products Co. | | | 2,377 | | | | 126,290 | | |
WestRock Co. | | | 1,881 | | | | 71,026 | | |
Worthington Industries, Inc. | | | 2,206 | | | | 76,857 | | |
| | | | 884,594 | | |
Real Estate (0.4%): | |
Four Corners Property Trust, Inc. | | | 7,316 | | | | 191,679 | | |
Utilities (7.3%): | |
Alliant Energy Corp. | | | 3,351 | | | | 141,580 | | |
American Electric Power Co., Inc. | | | 1,976 | | | | 147,686 | | |
American States Water Co. | | | 2,418 | | | | 162,103 | | |
Chesapeake Utilities Corp. | | | 1,781 | | | | 144,795 | | |
Consolidated Edison, Inc. | | | 1,839 | | | | 140,610 | | |
Dominion Resources, Inc. | | | 1,850 | | | | 132,201 | | |
DTE Energy Co. | | | 1,370 | | | | 151,111 | | |
Duke Energy Corp. | | | 1,810 | | | | 156,203 | | |
Eversource Energy | | | 2,374 | | | | 154,405 | | |
Exelon Corp. | | | 3,598 | | | | 162,270 | | |
IDACORP, Inc. | | | 1,359 | | | | 126,468 | | |
MDU Resources Group, Inc. | | | 4,898 | | | | 116,768 | | |
MGE Energy, Inc. | | | 2,734 | | | | 163,931 | | |
Middlesex Water Co. | | | 2,560 | | | | 136,576 | | |
National Fuel Gas Co. (b) | | | 2,521 | | | | 129,025 | | |
NextEra Energy, Inc. | | | 941 | | | | 163,565 | | |
OGE Energy Corp. | | | 3,884 | | | | 152,214 | | |
Otter Tail Corp. | | | 3,707 | | | | 184,015 | | |
Pinnacle West Capital Corp. | | | 1,833 | | | | 156,172 | | |
PPL Corp. | | | 3,850 | | | | 109,070 | | |
Public Service Enterprise Group, Inc. | | | 2,698 | | | | 140,431 | | |
SJW Corp. | | | 1,763 | | | | 98,058 | | |
Unitil Corp. | | | 3,605 | | | | 182,557 | | |
WEC Energy Group, Inc. | | | 2,179 | | | | 150,918 | | |
Xcel Energy, Inc. | | | 2,882 | | | | 141,997 | | |
| | | | 3,644,729 | | |
| | | | 18,668,130 | | |
Total Common Stocks (Cost $41,426,355) | | | 38,474,839 | | |
See notes to financial statements.
29
Victory Portfolios II
Victory Market Neutral Income Fund | | Schedule of Portfolio Investments — continued
December 31, 2018 | |
(Unaudited)
Security Description | | Shares | | Fair
Value(a) | |
Rights (0.0%) (d) | |
Spain (0.0%): (d) | |
Energy (0.0%): (d) | |
Repsol SA Expires 01/10/19 @ $0.41 (e) | | | 4,643 | | | $ | 2,127 | | |
United States (0.0%): (d) | |
Materials (0.0%): (d) | |
Schulman, Inc. (e) (f) (g) | | | 1,513 | | | | 3,026 | | |
Total Rights (Cost $5,203) | | | 5,153 | | |
Collateral for Securities Loaned^ (2.6%) | |
United States (2.6%): | |
BlackRock Liquidity Funds TempFund Portfolio, Institutional Class, 2.49% (h) | | | 250,287 | | | | 250,287 | | |
Fidelity Investments Money Market Government Portfolio, Class I, 2.28% (h) | | | 361,652 | | | | 361,652 | | |
Fidelity Investments Prime Money Market Portfolio, Class I, 2.46% (h) | | | 11,168 | | | | 11,168 | | |
Goldman Sachs Financial Square Prime Obligations Fund, Institutional
Class, 2.55% (h) | | | 139,050 | | | | 139,050 | | |
JPMorgan Prime Money Market Fund, Capital Class, 2.49% (h) | | | 222,466 | | | | 222,466 | | |
Morgan Stanley Institutional Liquidity Prime Portfolio, Institutional
Class, 2.58% (h) | | | 333,719 | | | | 333,719 | | |
Total Collateral for Securities Loaned (Cost $1,318,342) | | | 1,318,342 | | |
Total Investments (Cost $42,749,900) — 79.3% | | | 39,798,334 | | |
Other assets in excess of liabilities — 20.7% | | | 10,400,275 | | |
NET ASSETS — 100.00% | | $ | 50,198,609 | | |
^ Purchased with cash collateral from securities on loan.
(a) All securities, except those traded on exchanges in the United States (including ADRs), Canada, Mexico were fair valued at December 31, 2018. See Note 2 for further information.
(b) All or a portion of this security is on loan.
(c) Rule 144A security or other security that is restricted as to resale to institutional investors. The Fund's Adviser has deemed this security to be liquid based upon procedures approved by the Board of Trustees. As of December 31, 2018, the fair value of these securities was $373,944 and amounted to 0.7% of net assets.
(d) Amount represents less than 0.05% of net assets.
(e) Non-income producing security.
(f) Security was fair valued based upon procedures approved by the Board of Trustees and represents 0.0% of the Fund's net assets as of December 31, 2018. This security is classified as Level 3 within the fair value hierarchy. (See Note 2)
(g) The Fund's Adviser has deemed this security to be illiquid based upon procedures approved by the Board of Trustees. As of December 31, 2018, illiquid securities were 0.0% of the Fund's net assets.
(h) Rate disclosed is the daily yield on December 31, 2018.
ADR — American Depositary Receipt
GDR — Global Depository Receipt
PCL — Public Company Limited
PLC — Public Limited Company
See notes to financial statements.
30
Victory Portfolios II
Victory Market Neutral Income Fund | | Schedule of Portfolio Investments — continued
December 31, 2018 | |
(Unaudited)
Written Options
Exchange-traded options
Description | | Put/
Call | | Strike
Price | | Expiration
Date | | Contracts | | Fair Value | |
S&P E-Mini Option | | Put | | USD | 2,470.00 | | | 1/18/19 | | | 46 | | | $ | (94,760 | ) | |
Total (Premiums Received $117,143) | | | | | | | | | | $ | (94,760 | ) | |
Futures Contracts Purchased
| | | Number of
Contracts | | Expiration
Date | | Notional
Amount | | Value | | Unrealized
Appreciation
(Depreciation) | |
CBOE Volatility Index (VIX)
Futures | | | 60 | | | 1/16/19 | | $ | 1,257,933 | | | $ | 1,450,500 | | | $ | 192,567 | | |
NASDAQ 100 E-Mini Futures | | | 92 | | | 3/15/19 | | | 12,295,386 | | | | 11,653,180 | | | | (642,206 | ) | |
| | | | | | | | | | | $ | (449,639 | ) | |
Futures Contracts Sold
| | | Number of
Contracts | | Expiration
Date | | Notional
Amount | | Value | | Unrealized
Appreciation
(Depreciation) | |
E-Mini S&P 500 Futures | | | 170 | | | 3/15/19 | | $ | 22,199,102 | | | $ | 21,294,200 | | | $ | 904,902 | | |
Mini MSCI EAFE Index Futures | | | 113 | | | 3/15/19 | | | 9,845,685 | | | | 9,695,400 | | | | 150,285 | | |
Mini MSCI Emerging Markets
Index Futures | | | 199 | | | 3/15/19 | | | 9,686,498 | | | | 9,619,660 | | | | 66,838 | | |
Russell 2000 Mini Index Futures | | | 149 | | | 3/15/19 | | | 10,448,972 | | | | 10,050,050 | | | | 398,922 | | |
| | | | | | | | | | | $ | 1,520,947 | | |
| | | | | Total unrealized appreciation | | | | | | $ | 1,713,514 | | |
| | | | | Total unrealized depreciation | | | | | | | (642,206 | ) | |
| | | | | Total net unrealized appreciation(depreciation) | | | | | | $ | 1,071,308 | | |
See notes to financial statements.
31
Victory Portfolios II | | Statements of Assets and Liabilities
December 31, 2018 | |
(Unaudited)
| | | Victory
US 500
Enhanced
Volatility Wtd
Index Fund | | Victory
Market Neutral
Income Fund | |
ASSETS: | |
Investments, at value (Cost $94,996,643 and $42,749,900) | | $ | 106,105,845 | (a) | | $ | 39,798,334 | (b) | |
Foreign currency, at value (Cost $— and $26,809) | | | — | | | | 26,809 | | |
Cash and cash equivalents | | | — | | | | 2,933,342 | | |
Deposits with brokers for futures contracts | | | 95,956 | | | | 4,828,201 | | |
Interest and dividends receivable | | | 129,619 | | | | 95,248 | | |
Receivable for capital shares issued | | | 6,680 | | | | 4,371,412 | | |
Receivable for investments sold | | | 1,068,605 | | | | — | | |
Variation margin receivable on open futures contracts | | | 8,640 | | | | — | | |
Reclaims receivable | | | — | | | | 28,419 | | |
Receivable from Adviser | | | 47,566 | | | | 13,695 | | |
Prepaid expenses | | | 11,975 | | | | 2,963 | | |
Total Assets | | | 107,474,886 | | | | 52,098,423 | | |
LIABILITIES: | |
Payables: | |
Written options, at value (Premiums Received $— and $117,143) | | | — | | | | 94,760 | | |
Collateral received on loaned securities | | | 3,512,361 | | | | 1,318,342 | | |
Custodian | | | 39,721 | | | | — | | |
Investments purchased | | | — | | | | 229,988 | | |
Capital shares redeemed | | | 389,048 | | | | — | | |
Variation margin on open futures contracts | | | — | | | | 188,640 | | |
Accrued foreign capital gains tax | | | — | | | | 286 | | |
Accrued expenses and other payables: | |
Investment advisory fees | | | 65,605 | | | | 21,898 | | |
Administration fees | | | 5,749 | | | | 2,240 | | |
Custodian fees | | | 2,223 | | | | 18,742 | | |
Transfer agent fees | | | 20,504 | | | | 3,158 | | |
Chief Compliance Officer fees | | | 129 | | | | 51 | | |
Trustees' fees | | | 27 | | | | 76 | | |
| 12b-1 fees | | | 19,250 | | | | 2,777 | | |
Other accrued expenses | | | 33,175 | | | | 18,856 | | |
Total Liabilities | | | 4,087,792 | | | | 1,899,814 | | |
NET ASSETS: | |
Capital | | | 93,007,687 | | | | 52,270,392 | | |
Total distributable earnings/(loss) | | | 10,379,407 | | | | (2,071,783 | ) | |
Net Assets | | $ | 103,387,094 | | | $ | 50,198,609 | | |
Net Assets | |
Class A Shares | | $ | 38,427,497 | | | $ | 27,805,122 | | |
Class C Shares | | | 34,307,300 | | | | 409,980 | | |
Class I Shares | | | 30,652,297 | | | | 21,983,507 | | |
Total | | $ | 103,387,094 | | | $ | 50,198,609 | | |
Shares (unlimited number of shares authorized with no par value): | |
Class A Shares | | | 2,991,771 | | | | 2,893,812 | | |
Class C Shares | | | 2,738,622 | | | | 43,012 | | |
Class I Shares | | | 2,386,152 | | | | 2,277,967 | | |
Total | | | 8,116,545 | | | | 5,214,791 | | |
Net asset value, offering (except Class A Shares) and redemption
price per share: | |
Class A Shares | | $ | 12.84 | | | $ | 9.61 | | |
Class C Shares (c) | | | 12.53 | | | | 9.53 | | |
Class I Shares | | | 12.85 | | | | 9.65 | | |
Maximum Sales Charge — Class A Shares | | | 5.75 | % | | | 5.75 | % | |
Maximum offering price
(100%/(100%-maximum sales charge) of net asset value
adjusted to the nearest cent) per share — Class A Shares | | $ | 13.62 | | | $ | 10.20 | | |
(a) Includes $3,462,829 of securities on loan.
(b) Includes $1,539,366 of securities on loan.
(c) Redemption price per share varies by the length of time shares are held.
See notes to financial statements.
32
Victory Portfolios II | | Statements of Operations
For the Six Months Ended December 31, 2018 | |
(Unaudited)
| | | Victory
US 500
Enhanced
Volatility Wtd
Index Fund | | Victory
Market Neutral
Income Fund | |
Investment Income: | |
Dividends | | $ | 1,105,255 | | | $ | 830,369 | | |
Interest | | | 1,579 | | | | 57,100 | | |
Securities lending (net of fees) | | | 7,570 | | | | 7,059 | | |
Foreign tax withholding | | | (66 | ) | | | (69,183 | ) | |
Total Income | | | 1,114,338 | | | | 825,345 | | |
Expenses: | |
Investment advisory fees | | | 442,175 | | | | 132,226 | | |
Administration fees | | | 38,432 | | | | 13,414 | | |
12b-1 fees — Class A Shares | | | 58,884 | | | | 2,832 | | |
12b-1 fees — Class C Shares | | | 204,930 | | | | 1,851 | | |
Custodian fees | | | 3,059 | | | | 31,425 | | |
Transfer agent fees — Class A Shares | | | 21,054 | | | | 685 | | |
Transfer agent fees — Class C Shares | | | 22,300 | | | | 251 | | |
Transfer agent fees — Class I Shares | | | 14,941 | | | | 4,612 | | |
Trustees' fees | | | 5,300 | | | | 1,875 | | |
Chief Compliance Officer fees | | | 531 | | | | 184 | | |
Legal and audit fees | | | 13,294 | | | | 9,773 | | |
State registration and filing fees | | | 28,296 | | | | 22,543 | | |
Interest expense on interfund lending | | | 31 | | | | — | | |
Other expenses | | | 27,365 | | | | 13,498 | | |
Total Expenses | | | 880,592 | | | | 235,169 | | |
Expenses waived/reimbursed by Adviser | | | (147,637 | ) | | | (102,496 | ) | |
Net Expenses | | | 732,955 | | | | 132,673 | | |
Net Investment Income (Loss) | | | 381,383 | | | | 692,672 | | |
Realized/Unrealized Gains (Losses) from Investment Transactions: | |
Net realized gains (losses) from investment transactions and
foreign currency translations | | | 4,534,038 | | | | 1,004,093 | | |
Net realized gains (losses) from futures transactions | | | (102,448 | ) | | | 2,340,625 | | |
Net realized gains (losses) from written options | | | — | | | | 878,232 | | |
Net change in unrealized appreciation/depreciation on investments
and foreign currency translations | | | (17,536,503 | ) | | | (4,427,493 | ) | |
Net change in unrealized appreciation/depreciation on futures
transactions | | | 4,615 | | | | (111,515 | ) | |
Net change in unrealized appreciation/depreciation on written options | | | — | | | | 225,192 | | |
Net change in accrued foreign taxes on unrealized gains | | | — | | | | 3,910 | | |
Net realized/unrealized gains (losses) on investments | | | (13,100,298 | ) | | | (86,956 | ) | |
Change in net assets resulting from operations | | $ | (12,718,915 | ) | | $ | 605,716 | | |
See notes to financial statements.
33
Victory Portfolios II | | Statements of Changes in Net Assets | |
| | | Victory US 500
Enhanced Volatility Wtd
Index Fund | | Victory Market Neutral
Income Fund | |
| | | Six Months
Ended
December 31,
2018 | | Year
Ended
June 30,
2018 | | Six Months
Ended
December 31,
2018 | | Year
Ended
June 30,
2018 | |
| | | (Unaudited) | | | | (Unaudited) | | | |
From Investment Activities: | |
Operations: | |
Net investment income (loss) | | $ | 381,383 | | | $ | 520,905 | | | $ | 692,672 | | | $ | 1,367,130 | | |
Net realized gains (losses) from
investment transactions | | | 4,431,590 | | | | 16,530,506 | | | | 4,222,950 | | | | 1,997,614 | | |
Net change in unrealized
appreciation/depreciation
on investments | | | (17,531,888 | ) | | | (1,974,167 | ) | | | (4,309,906 | ) | | | (579,923 | ) | |
Change in net assets resulting
from operations | | | (12,718,915 | ) | | | 15,077,244 | | | | 605,716 | | | | 2,784,821 | | |
Distributions to Shareholders: (a) | |
Class A Shares | | | (5,296,808 | ) | | | (3,474,874 | ) | | | (357,543 | ) | | | (729,949 | ) | |
Class C Shares | | | (4,582,682 | ) | | | (5,093,813 | ) | | | (4,542 | ) | | | (9,927 | ) | |
Class I Shares | | | (4,236,494 | ) | | | (3,082,938 | ) | | | (340,817 | ) | | | (837,655 | ) | |
Change in net assets resulting from
distributions to shareholders | | | (14,115,984 | ) | | | (11,651,625 | ) | | | (702,902 | ) | | | (1,577,531 | ) | |
Change in net assets resulting from
capital transactions | | | 740,681 | | | | (1,036,505 | ) | | | 6,654,305 | | | | (14,222,605 | ) | |
Change in net assets | | | (26,094,218 | ) | | | 2,389,114 | | | | 6,557,119 | | | | (13,015,315 | ) | |
Net Assets: | |
Beginning of period | | | 129,481,312 | | | | 127,092,198 | | | | 43,641,490 | | | | 56,656,805 | | |
End of period | | $ | 103,387,094 | | | $ | 129,481,312 | | | $ | 50,198,609 | | | $ | 43,641,490 | | |
(a) Current and prior year distributions to shareholders have been reclassified and conform to amended GAAP presentation under Regulation S-X (See Item 10 in the Notes to Financial Statements).
(continues on next page)
See notes to financial statements.
34
Victory Portfolios II | | Statements of Changes in Net Assets | |
(continued)
| | | Victory US 500
Enhanced Volatility Wtd
Index Fund | | Victory Market Neutral
Income Fund | |
| | | Six Months
Ended
December 31,
2018 | | Year
Ended
June 30,
2018 | | Six Months
Ended
December 31,
2018 | | Year
Ended
June 30,
2018 | |
| | | (Unaudited) | | | | (Unaudited) | | | |
Capital Transactions: | |
Class A Shares | |
Proceeds from shares issued | | $ | 2,627,587 | | | $ | 26,139,052 | | | $ | 10,848,579 | | | $ | 2,828,020 | | |
Distributions reinvested | | | 5,231,073 | | | | 3,421,278 | | | | 356,077 | | | | 727,653 | | |
Cost of shares redeemed | | | (11,140,428 | ) | | | (15,975,579 | ) | | | (7,219,853 | ) | | | (5,260,176 | ) | |
Total Class A Shares | | $ | (3,281,768 | ) | | $ | 13,584,751 | | | $ | 3,984,803 | | | $ | (1,704,503 | ) | |
Class C Shares | |
Proceeds from shares issued | | $ | 3,452,633 | | | $ | 13,301,468 | | | $ | 127,951 | | | $ | 151,102 | | |
Distributions reinvested | | | 4,552,125 | | | | 5,056,077 | | | | 4,542 | | | | 9,927 | | |
Cost of shares redeemed | | | (6,182,115 | ) | | | (35,709,156 | ) | | | (32,723 | ) | | | (377,788 | ) | |
Total Class C Shares | | $ | 1,822,643 | | | $ | (17,351,611 | ) | | $ | 99,770 | | | $ | (216,759 | ) | |
Class I Shares | |
Proceeds from shares issued | | $ | 4,905,202 | | | $ | 11,264,963 | | | $ | 10,321,125 | | | $ | 10,892,602 | | |
Distributions reinvested | | | 4,030,409 | | | | 2,880,716 | | | | 335,293 | | | | 831,102 | | |
Cost of shares redeemed | | | (6,735,805 | ) | | | (11,415,324 | ) | | | (8,086,686 | ) | | | (24,025,047 | ) | |
Total Class I Shares | | $ | 2,199,806 | | | $ | 2,730,355 | | | $ | 2,569,732 | | | $ | (12,301,343 | ) | |
Change in net assets resulting from
capital transactions | | $ | 740,681 | | | $ | (1,036,505 | ) | | $ | 6,654,305 | | | $ | (14,222,605 | ) | |
Share Transactions: | |
Class A Shares | |
Issued | | | 167,606 | | | | 1,598,096 | | | | 1,121,274 | | | | 295,657 | | |
Reinvested | | | 405,953 | | | | 208,990 | | | | 37,007 | | | | 76,073 | | |
Redeemed | | | (714,037 | ) | | | (963,489 | ) | | | (745,572 | ) | | | (549,478 | ) | |
Total Class A Shares | | | (140,478 | ) | | | 843,597 | | | | 412,709 | | | | (177,748 | ) | |
Class C Shares | |
Issued | | | 215,651 | | | | 814,121 | | | | 13,344 | | | | 15,890 | | |
Reinvested | | | 363,588 | | | | 315,413 | | | | 475 | | | | 1,047 | | |
Redeemed | | | (402,487 | ) | | | (2,219,795 | ) | | | (3,412 | ) | | | (39,902 | ) | |
Total Class C Shares | | | 176,752 | | | | (1,090,261 | ) | | | 10,407 | | | | (22,965 | ) | |
Class I Shares | |
Issued | | | 305,073 | | | | 680,103 | | | | 1,060,028 | | | | 1,131,635 | | |
Reinvested | | | 312,177 | | | | 175,785 | | | | 34,708 | | | | 86,613 | | |
Redeemed | | | (437,385 | ) | | | (690,384 | ) | | | (835,766 | ) | | | (2,499,198 | ) | |
Total Class I Shares | | | 179,865 | | | | 165,504 | | | | 258,970 | | | | (1,280,950 | ) | |
Change in Shares | | | 216,139 | | | | (81,160 | ) | | | 682,086 | | | | (1,481,663 | ) | |
See notes to financial statements.
35
Victory Portfolios II | | Financial Highlights | |
For a Share Outstanding Throughout Each Period
| | | Victory US 500 Enhanced Volatility Wtd Index Fund | |
| | | Class A Shares | |
| | | Six
Months
Ended
December 31,
2018 | | Year
Ended
June 30,
2018 | | Year
Ended
June 30,
2017 | | Year
Ended
June 30,
2016 | | Year
Ended
June 30,
2015 | | Year
Ended
June 30,
2014 | |
| | | (Unaudited) | | | | | | | | | | | |
Net Asset Value, Beginning of Period | | $ | 16.50 | | | $ | 16.04 | | | $ | 13.80 | | | $ | 14.15 | | | $ | 14.16 | | | $ | 11.71 | | |
Investment Activities: | |
Net investment income (loss) (a) | | | 0.06 | | | | 0.11 | | | | 0.11 | | | | 0.13 | | | | 0.05 | | | | 0.03 | | |
Net realized and unrealized
gains (losses) on investments | | | (1.79 | ) | | | 1.91 | | | | 2.48 | | | | 0.16 | | | | 0.74 | | | | 2.58 | | |
Total from Investment
Activities | | | (1.73 | ) | | | 2.02 | | | | 2.59 | | | | 0.29 | | | | 0.79 | | | | 2.61 | | |
Distributions to Shareholders: | |
Net investment income | | | (0.04 | ) | | | (0.10 | ) | | | (0.11 | ) | | | (0.12 | ) | | | (0.04 | ) | | | (0.13 | ) | |
Net realized gains
from investments | | | (1.89 | ) | | | (1.46 | ) | | | (0.24 | ) | | | (0.52 | ) | | | (0.76 | ) | | | (0.03 | ) | |
Total Distributions to
Shareholders | | | (1.93 | ) | | | (1.56 | ) | | | (0.35 | ) | | | (0.64 | ) | | | (0.80 | ) | | | (0.16 | ) | |
Net Asset Value, End of Period | | $ | 12.84 | | | $ | 16.50 | | | $ | 16.04 | | | $ | 13.80 | | | $ | 14.15 | | | $ | 14.16 | | |
Total Return (excludes sales
charge) (b) | | | (10.53 | )% | | | 12.79 | % | | | 18.89 | % | | | 2.17 | % | | | 5.89 | % | | | 22.39 | % | |
Ratios/Supplemental Data: | |
Net Assets at end of period (000) | | $ | 38,427 | | | $ | 51,671 | | | $ | 36,721 | | | $ | 62,700 | | | $ | 75,399 | | | $ | 77,212 | | |
Ratio of net expenses to average
net assets (c) | | | 0.99 | % | | | 0.99 | % | | | 0.99 | % | | | 0.99 | % | | | 1.50 | % | | | 1.60 | % | |
Ratio of net investment income (loss)
to average net assets (c) | | | 0.77 | % | | | 0.67 | % | | | 0.75 | % | | | 0.92 | % | | | 0.35 | % | | | 0.25 | % | |
Ratio of gross expenses to average
net assets (c) (d) | | | 1.20 | % | | | 1.19 | % | | | 1.35 | % | | | 1.28 | % | | | 1.67 | % | | | 1.68 | % | |
Portfolio turnover (b) (e) | | | 19 | % | | | 45 | % | | | 38 | % | | | 46 | % | | | 48 | % | | | 29 | % | |
(a) Per share net investment income (loss) has been calculated using the average daily shares method.
(b) Not annualized for periods less than one year.
(c) Annualized for periods less than one year.
(d) During the period, certain fees were reduced and/or reimbursed. If such fee reductions and/or reimbursements had not occurred, the ratios would have been as indicated.
(e) Portfolio turnover is calculated on the basis of the Fund as a whole without distinguishing between the classes of shares issued.
See notes to financial statements.
36
Victory Portfolios II | | Financial Highlights — continued | |
For a Share Outstanding Throughout Each Period
| | | Victory US 500 Enhanced Volatility Wtd Index Fund | |
| | | Class C Shares | |
| | | Six
Months
Ended
December 31,
2018 | | Year
Ended
June 30,
2018 | | Year
Ended
June 30,
2017 | | Year
Ended
June 30,
2016 | | Year
Ended
June 30,
2015 | | Year
Ended
June 30,
2014 | |
| | | (Unaudited) | | | | | | | | | | | |
Net Asset Value, Beginning of Period | | $ | 16.16 | | | $ | 15.78 | | | $ | 13.59 | | | $ | 13.95 | | | $ | 14.05 | | | $ | 11.67 | | |
Investment Activities: | |
Net investment income (loss) (a) | | | — | (b) | | | (0.02 | ) | | | — | (b) | | | 0.02 | | | | (0.05 | ) | | | (0.07 | ) | |
Net realized and unrealized
gains (losses) on investments | | | (1.74 | ) | | | 1.86 | | | | 2.44 | | | | 0.17 | | | | 0.71 | | | | 2.57 | | |
Total from Investment
Activities | | | (1.74 | ) | | | 1.84 | | | | 2.44 | | | | 0.19 | | | | 0.66 | | | | 2.50 | | |
Distributions to Shareholders: | |
Net investment income | | | — | | | | — | (b) | | | (0.01 | ) | | | (0.03 | ) | | | — | | | | (0.09 | ) | |
Net realized gains
from investments | | | (1.89 | ) | | | (1.46 | ) | | | (0.24 | ) | | | (0.52 | ) | | | (0.76 | ) | | | (0.03 | ) | |
Total Distributions to
Shareholders | | | (1.89 | ) | | | (1.46 | ) | | | (0.25 | ) | | | (0.55 | ) | | | (0.76 | ) | | | (0.12 | ) | |
Net Asset Value, End of Period | | $ | 12.53 | | | $ | 16.16 | | | $ | 15.78 | | | $ | 13.59 | | | $ | 13.95 | | | $ | 14.05 | | |
Total Return (excludes contingent
deferred sales charge) (c) | | | (10.77 | )% | | | 11.78 | % | | | 18.09 | % | | | 1.42 | % | | | 5.01 | % | | | 21.52 | % | |
Ratios/Supplemental Data: | |
Net Assets at end of period (000) | | $ | 34,307 | | | $ | 41,410 | | | $ | 57,620 | | | $ | 58,249 | | | $ | 56,826 | | | $ | 33,464 | | |
Ratio of net expenses to average
net assets (d) | | | 1.74 | % | | | 1.74 | % | | | 1.74 | % | | | 1.74 | % | | | 2.25 | % | | | 2.35 | % | |
Ratio of net investment income (loss)
to average net assets (d) | | | 0.03 | % | | | (0.11 | )% | | | 0.01 | % | | | 0.16 | % | | | (0.37 | )% | | | (0.50 | )% | |
Ratio of gross expenses to average
net assets (d) (e) | | | 2.00 | % | | | 1.97 | % | | | 2.12 | % | | | 2.11 | % | | | 2.42 | % | | | 3.43 | % | |
Portfolio turnover (c) (f) | | | 19 | % | | | 45 | % | | | 38 | % | | | 46 | % | | | 48 | % | | | 29 | % | |
(a) Per share net investment income (loss) has been calculated using the average daily shares method.
(b) Amount is less than $0.005 per share.
(c) Not annualized for periods less than one year.
(d) Annualized for periods less than one year.
(e) During the period, certain fees were reduced and/or reimbursed. If such fee reductions and/or reimbursements had not occurred, the ratios would have been as indicated.
(f) Portfolio turnover is calculated on the basis of the Fund as a whole without distinguishing between the classes of shares issued.
See notes to financial statements.
37
Victory Portfolios II | | Financial Highlights — continued | |
For a Share Outstanding Throughout Each Period
| | | Victory US 500 Enhanced Volatility Wtd Index Fund | |
| | | Class I Shares | |
| | | Six
Months
Ended
December 31,
2018 | | Year
Ended
June 30,
2018 | | Year
Ended
June 30,
2017 | | Year
Ended
June 30,
2016 | | Year
Ended
June 30,
2015 | | Year
Ended
June 30,
2014 | |
| | | (Unaudited) | | | | | | | | | | | |
Net Asset Value, Beginning of Period | | $ | 16.50 | | | $ | 16.05 | | | $ | 13.80 | | | $ | 14.15 | | | $ | 14.16 | | | $ | 11.71 | | |
Investment Activities: | |
Net investment income (loss) (a) | | | 0.09 | | | | 0.15 | | | | 0.15 | | | | 0.16 | | | | 0.08 | | | | 0.07 | | |
Net realized and unrealized
gains (losses) on investments | | | (1.79 | ) | | | 1.90 | | | | 2.48 | | | | 0.16 | | | | 0.74 | | | | 2.57 | | |
Total from Investment
Activities | | | (1.70 | ) | | | 2.05 | | | | 2.63 | | | | 0.32 | | | | 0.82 | | | | 2.64 | | |
Distributions to Shareholders: | |
Net investment income | | | (0.06 | ) | | | (0.14 | ) | | | (0.14 | ) | | | (0.15 | ) | | | (0.07 | ) | | | (0.16 | ) | |
Net realized gains
from investments | | | (1.89 | ) | | | (1.46 | ) | | | (0.24 | ) | | | (0.52 | ) | | | (0.76 | ) | | | (0.03 | ) | |
Total Distributions to
Shareholders | | | (1.95 | ) | | | (1.60 | ) | | | (0.38 | ) | | | (0.67 | ) | | | (0.83 | ) | | | (0.19 | ) | |
Net Asset Value, End of Period | | $ | 12.85 | | | $ | 16.50 | | | $ | 16.05 | | | $ | 13.80 | | | $ | 14.15 | | | $ | 14.16 | | |
Total Return (b) | | | (10.34 | )% | | | 12.97 | % | | | 19.24 | % | | | 2.42 | % | | | 6.16 | % | | | 22.66 | % | |
Ratios/Supplemental Data: | |
Net Assets at end of period (000) | | $ | 30,652 | | | $ | 36,400 | | | $ | 32,751 | | | $ | 44,170 | | | $ | 63,213 | | | $ | 92,699 | | |
Ratio of net expenses to average
net assets (c) | | | 0.74 | % | | | 0.74 | % | | | 0.74 | % | | | 0.74 | % | | | 1.25 | % | | | 1.35 | % | |
Ratio of net investment income (loss)
to average net assets (c) | | | 1.03 | % | | | 0.91 | % | | | 1.00 | % | | | 1.14 | % | | | 0.60 | % | | | 0.50 | % | |
Ratio of gross expenses to average
net assets (c) (d) | | | 0.97 | % | | | 0.95 | % | | | 1.13 | % | | | 1.11 | % | | | 1.42 | % | | | 1.43 | % | |
Portfolio turnover (b) (e) | | | 19 | % | | | 45 | % | | | 38 | % | | | 46 | % | | | 48 | % | | | 29 | % | |
(a) Per share net investment income (loss) has been calculated using the average daily shares method.
(b) Not annualized for periods less than one year.
(c) Annualized for periods less than one year.
(d) During the period, certain fees were reduced and/or reimbursed. If such fee reductions and/or reimbursements had not occurred, the ratios would have been as indicated.
(e) Portfolio turnover is calculated on the basis of the Fund as a whole without distinguishing between the classes of shares issued.
See notes to financial statements.
38
Victory Portfolios II | | Financial Highlights | |
For a Share Outstanding Throughout Each Period
| | | Victory Market Neutral Income Fund | |
| | | Class A Shares | |
| | | Six
Months
Ended
December 31,
2018 | | Year
Ended
June 30,
2018 | | Year
Ended
June 30,
2017 | | Year
Ended
June 30,
2016 | | Year
Ended
June 30,
2015 | | Year
Ended
June 30,
2014 | |
| | | (Unaudited) | | | | | | | | | | | |
Net Asset Value, Beginning of Period | | $ | 9.61 | | | $ | 9.40 | | | $ | 9.21 | | | $ | 9.41 | | | $ | 9.84 | | | $ | 9.78 | | |
Investment Activities: | |
Net investment income (loss) (a) | | | 0.15 | | | | 0.24 | | | | 0.24 | | | | 0.26 | | | | 0.22 | | | | 0.11 | | |
Net realized and unrealized
gains (losses) on investments | | | (0.01 | ) | | | 0.26 | | | | 0.20 | (b) | | | (0.02 | ) | | | (0.38 | ) | | | — | (c) | |
Total from Investment
Activities | | | 0.14 | | | | 0.50 | | | | 0.44 | | | | 0.24 | | | | (0.16 | ) | | | 0.11 | | |
Distributions to Shareholders: | |
Net investment income | | | (0.12 | ) | | | (0.29 | ) | | | (0.25 | ) | | | (0.21 | ) | | | (0.21 | ) | | | (0.05 | ) | |
Net realized gains
from investments | | | (0.02 | ) | | | — | | | | — | | | | (0.23 | ) | | | (0.06 | ) | | | — | | |
Total Distributions to
Shareholders | | | (0.14 | ) | | | (0.29 | ) | | | (0.25 | ) | | | (0.44 | ) | | | (0.27 | ) | | | (0.05 | ) | |
Net Asset Value, End of Period | | $ | 9.61 | | | $ | 9.61 | | | $ | 9.40 | | | $ | 9.21 | | | $ | 9.41 | | | $ | 9.84 | | |
Total Return (excludes sales
charge) (d) | | | 1.51 | % | | | 5.37 | % | | | 4.77 | % | | | 2.54 | % | | | (1.62 | )% | | | 1.15 | % | |
Ratios/Supplemental Data: | |
Net Assets at end of period (000) | | $ | 27,805 | | | $ | 23,847 | | | $ | 24,998 | | | $ | 29,649 | | | $ | 31,313 | | | $ | 28,924 | | |
Ratio of net expenses to average
net assets (e) | | | 0.75 | % | | | 0.89 | % | | | 0.90 | % | | | 0.90 | % | | | 1.13 | % | | | 1.15 | % | |
Ratio of net investment income (loss)
to average net assets (e) | | | 2.99 | % | | | 2.55 | % | | | 2.59 | % | | | 2.72 | % | | | 2.23 | % | | | 1.09 | % | |
Ratio of gross expenses to average
net assets (e) (f) | | | 1.02 | % | | | 1.18 | % | | | 1.25 | % | | | 1.06 | % | | | 1.27 | % | | | 1.25 | % | |
Portfolio turnover (d) (g) (f) | | | 51 | % | | | 69 | % | | | 63 | % | | | 92 | % | | | 135 | % | | | 190 | % | |
(a) Per share net investment income (loss) has been calculated using the average daily shares method.
(b) The amount of net realized and unrealized gains (losses) on investments per share for the year ended June 30, 2017 does not accord with the amounts in the Statement of Operations due to timing of purchases and sales of Fund Shares in relation to fluctuating market values.
(c) Amount is less than $0.005 per share.
(d) Not annualized for periods less than one year.
(e) Annualized for periods less than one year.
(f) During the period, certain fees were reduced and/or reimbursed. If such fee reductions and/or reimbursements had not occurred, the ratios would have been gas indicated.
(g) Portfolio turnover is calculated on the basis of the Fund as a whole without distinguishing between the classes of shares issued.
See notes to financial statements.
39
Victory Portfolios II | | Financial Highlights — continued | |
For a Share Outstanding Throughout Each Period
| | | Victory Market Neutral Income Fund | |
| | | Class C Shares | |
| | | Six
Months
Ended
December 31,
2018 | | Year
Ended
June 30,
2018 | | Year
Ended
June 30,
2017 | | Year
Ended
June 30,
2016 | | Year
Ended
June 30,
2015 | | Year
Ended
June 30,
2014 | |
| | | (Unaudited) | | | | | | | | | | | |
Net Asset Value, Beginning of Period | | $ | 9.54 | | | $ | 9.33 | | | $ | 9.15 | | | $ | 9.36 | | | $ | 9.74 | | | $ | 9.74 | | |
Investment Activities: | |
Net investment income (loss) (a) | | | 0.11 | | | | 0.17 | | | | 0.17 | | | | 0.19 | | | | 0.14 | | | | 0.01 | | |
Net realized and unrealized
gains (losses) on investments | | | (0.01 | ) | | | 0.26 | | | | 0.20 | (b) | | | (0.02 | ) | | | (0.38 | ) | | | 0.02 | | |
Total from Investment
Activities | | | 0.10 | | | | 0.43 | | | | 0.37 | | | | 0.17 | | | | (0.24 | ) | | | 0.03 | | |
Distributions to Shareholders: | |
Net investment income | | | (0.09 | ) | | | (0.22 | ) | | | (0.19 | ) | | | (0.15 | ) | | | (0.08 | ) | | | (0.03 | ) | |
Net realized gains
from investments | | | (0.02 | ) | | | — | | | | — | | | | (0.23 | ) | | | (0.06 | ) | | | — | | |
Total Distributions to
Shareholders | | | (0.11 | ) | | | (0.22 | ) | | | (0.19 | ) | | | (0.38 | ) | | | (0.14 | ) | | | (0.03 | ) | |
Net Asset Value, End of Period | | $ | 9.53 | | | $ | 9.54 | | | $ | 9.33 | | | $ | 9.15 | | | $ | 9.36 | | | $ | 9.74 | | |
Total Return (excludes contingent
deferred sales charge) (c) | | | 1.06 | % | | | 4.64 | % | | | 4.02 | % | | | 1.75 | % | | | (2.42 | )% | | | 0.34 | % | |
Ratios/Supplemental Data: | |
Net Assets at end of period (000) | | $ | 410 | | | $ | 311 | | | $ | 519 | | | $ | 518 | | | $ | 385 | | | $ | 267 | | |
Ratio of net expenses to average
net assets (d) | | | 1.50 | % | | | 1.64 | % | | | 1.65 | % | | | 1.65 | % | | | 2.02 | % | | | 2.00 | % | |
Ratio of net investment income (loss)
to average net assets (d) | | | 2.21 | % | | | 1.79 | % | | | 1.88 | % | | | 2.00 | % | | | 1.88 | % | | | 1.90 | % | |
Ratio of gross expenses to average
net assets (d) (e) | | | 2.56 | % | | | 2.51 | % | | | 3.00 | % | | | 2.48 | % | | | 1.29 | % | | | (0.04 | )% | |
Portfolio turnover (c) (f) | | | 51 | % | | | 69 | % | | | 63 | % | | | 92 | % | | | 135 | % | | | 190 | % | |
(a) Per share net investment income (loss) has been calculated using the average daily shares method.
(b) The amount of net realized and unrealized gains (losses) on investments per share for the year ended June 30, 2017 does not accord with the amounts in the Statement of Operations due to timing of purchases and sales of Fund Shares in relation to fluctuating market values.
(c) Not annualized for periods less than one year.
(d) Annualized for periods less than one year.
(e) During the period, certain fees were reduced and/or reimbursed. If such fee reductions and/or reimbursements had not occurred, the ratios would have been as indicated.
(f) Portfolio turnover is calculated on the basis of the Fund as a whole without distinguishing between the classes of shares issued.
See notes to financial statements.
40
Victory Portfolios II | | Financial Highlights — continued | |
For a Share Outstanding Throughout Each Period
| | | Victory Market Neutral Income Fund | |
| | | Class I Shares | |
| | | Six
Months
Ended
December 31,
2018 | | Year
Ended
June 30,
2018 | | Year
Ended
June 30,
2017 | | Year
Ended
June 30,
2016 | | Year
Ended
June 30,
2015 | | Year
Ended
June 30,
2014 | |
| | | (Unaudited) | | | | | | | | | | | |
Net Asset Value, Beginning of Period | | $ | 9.65 | | | $ | 9.44 | | | $ | 9.24 | | | $ | 9.44 | | | $ | 9.89 | | | $ | 9.81 | | |
Investment Activities: | |
Net investment income (loss) (a) | | | 0.16 | | | | 0.26 | | | | 0.27 | | | | 0.30 | | | | 0.23 | | | | 0.10 | | |
Net realized and unrealized
gains (losses) on investments | | | — | (b) | | | 0.26 | | | | 0.20 | | | | (0.04 | ) | | | (0.37 | ) | | | 0.04 | | |
Total from Investment
Activities | | | 0.16 | | | | 0.52 | | | | 0.47 | | | | 0.26 | | | | (0.14 | ) | | | 0.14 | | |
Distributions to Shareholders: | |
Net investment income | | | (0.14 | ) | | | (0.31 | ) | | | (0.27 | ) | | | (0.23 | ) | | | (0.25 | ) | | | (0.06 | ) | |
Net realized gains
from investments | | | (0.02 | ) | | | — | | | | — | | | | (0.23 | ) | | | (0.06 | ) | | | — | | |
Total Distributions to
Shareholders | | | (0.16 | ) | | | (0.31 | ) | | | (0.27 | ) | | | (0.46 | ) | | | (0.31 | ) | | | (0.06 | ) | |
Net Asset Value, End of Period | | $ | 9.65 | | | $ | 9.65 | | | $ | 9.44 | | | $ | 9.24 | | | $ | 9.44 | | | $ | 9.89 | | |
Total Return (c) | | | 1.65 | % | | | 5.62 | % | | | 5.11 | % | | | 2.77 | % | | | (1.41 | )% | | | 1.44 | % | |
Ratios/Supplemental Data: | |
Net Assets at end of period (000) | | $ | 21,984 | | | $ | 19,483 | | | $ | 31,140 | | | $ | 43,866 | | | $ | 25,310 | | | $ | 33,773 | | |
Ratio of net expenses to average
net assets (d) | | | 0.40 | % | | | 0.64 | % | | | 0.65 | % | | | 0.65 | % | | | 1.02 | % | | | 1.00 | % | |
Ratio of net investment income (loss)
to average net assets (d) | | | 3.35 | % | | | 2.72 | % | | | 2.83 | % | | | 3.16 | % | | | 0.88 | % | | | 0.90 | % | |
Ratio of gross expenses to average
net assets (d) (e) | | | 1.09 | % | | | 1.09 | % | | | 1.13 | % | | | 1.05 | % | | | 2.25 | % | | | 0.87 | % | |
Portfolio turnover (c) (f) | | | 51 | % | | | 69 | % | | | 63 | % | | | 92 | % | | | 135 | % | | | 190 | % | |
(a) Per share net investment income (loss) has been calculated using the average daily shares method.
(b) Amount is less than $0.005 per share.
(c) Not annualized for periods less than one year.
(d) Annualized for periods less than one year.
(e) During the period, certain fees were reduced and/or reimbursed. If such fee reductions and/or reimbursements had not occurred, the ratios would have been as indicated.
(f) Portfolio turnover is calculated on the basis of the Fund as a whole without distinguishing between the classes of shares issued.
See notes to financial statements.
41
Victory Portfolios II | | Notes to Financial Statements
December 31, 2018 | |
(Unaudited)
1. Organization:
Victory Portfolios II (the "Trust") was organized on April 11, 2012 as a Delaware statutory trust. The Trust is registered under the Investment Company Act of 1940, as amended (the "1940 Act"), as an open-end investment company. The Trust is comprised of 20 funds, 18 of which are exchange-traded funds ("ETFs"), and is authorized to issue an unlimited number of shares, which are units of beneficial interest with no par value. Each Fund is classified as diversified under the 1940 Act.
The accompanying financial statements are those of the following two Funds (collectively, the "Funds" and individually, a "Fund").
Funds (Legal Name) | | Funds (Short Name) | | Investment Share
Classes Offered | |
Victory US 500 Enhanced
Volatility Wtd Index Fund | | US 500 Enhanced Volatility
Wtd Index Fund | | Classes A, C and I
| |
Victory Market Neutral Income
Fund | | Market Neutral Income
Fund | | Classes A, C and I
| |
Each class of shares of a Fund has substantially identical rights and privileges except with respect to sales charges, fees paid under distribution plans, expenses allocable exclusively to each class of shares, voting rights on matters solely affecting a single class of shares, and the exchange privilege of each class of shares.
Under the Trust's organizational documents, its officers and trustees are indemnified against certain liabilities arising out of the performance of their duties to the Funds. In addition, in the normal course of business, the Funds enter into contracts with their vendors and others that provide for general indemnifications. The Funds' maximum exposure under these arrangements is unknown, as this would involve future claims that may be made against the Funds. However, based on experience, the Funds expect that risk of loss to be remote.
2. Significant Accounting Policies:
The following is a summary of significant accounting policies followed by the Trust in the preparation of its financial statements. The policies are in conformity with accounting principles generally accepted in the United States of America ("GAAP"). The preparation of financial statements in accordance with GAAP requires management to make estimates and assumptions that affect the reported amounts of assets and liabilities and disclosure of contingent assets and liabilities at the date of the financial statements and the reported amounts of income and expenses for the period. Actual results could differ from those estimates. The Funds follow the specialized accounting and reporting requirements under GAAP that are applicable to investment companies.
Investment Valuation:
The Funds record investments at fair value. Fair value is defined as the price that would be received to sell an asset or paid to transfer a liability in an orderly transaction between market participants at the measurement date.
The valuation techniques described below maximize the use of observable inputs and minimize the use of unobservable inputs in determining fair value. The inputs used for valuing the Funds' investments are summarized in the three broad levels listed below:
• Level 1 — quoted prices in active markets for identical securities
• Level 2 — other significant observable inputs (including quoted prices for similar securities or interest rates applicable to those securities, etc.)
• Level 3 — significant unobservable inputs (including the Funds' own assumptions in determining the fair value of investments)
Changes in valuation techniques may result in transfers in or out of an assigned level within the disclosure hierarchy. The inputs or methodologies used for valuation techniques are not necessarily an indication of the risk associated with entering into those investments.
42
Victory Portfolios II | | Notes to Financial Statements — continued
December 31, 2018 | |
(Unaudited)
Portfolio securities listed or traded on securities exchanges, including American Depositary Receipts ("ADRs") and Rights, are valued at the closing price on the exchange or system where the security is principally traded, if available, or at the Nasdaq Official Closing Price. If there have been no sales for that day on the exchange or system, then a security is valued at the last available bid quotation on the exchange or system where the security is principally traded. In each of these situations, valuations are typically categorized as Level 1 in the fair value hierarchy.
Investments in open-end investment companies are valued at net asset value. These valuations are typically categorized as Level 1 in the fair value hierarchy.
Futures contracts are valued at the settlement price established each day by the board of trade or an exchange on which they are traded. These valuations are typically categorized as Level 1 in the fair value hierarchy.
Options are generally valued at the last quoted sales price or, in the absence of a sale, at the mean between the current bid and ask prices. These valuations are typically categorized as Level 1 in the fair value hierarchy.
Investments for which there are no such quotations, or for which quotations do not appear reliable, are valued at fair value in accordance with procedures established by and under the general supervision and responsibility of the Trust's Board of Trustees ("Board"). These valuations are typically categorized as Level 2 or Level 3 in the fair value hierarchy, based on the observability of inputs used to determine the fair value.
In accordance with procedures adopted by the Board, fair value pricing may be used if events materially affecting the value of foreign securities occur between the time the exchange on which they are traded closes and the time the Funds' net asset values are calculated. The Victory Market Neutral Income Fund uses a systematic valuation model, provided daily by an independent third party to fair value their international equity securities. These valuations are considered as Level 2 in the fair value hierarchy.
A summary of the valuations as of December 31, 2018, based upon the three levels defined above, is included in the table below while the breakdown, by category, of investments is disclosed in the Schedules of Portfolio Investments:
| | | LEVEL 1 —
Quoted Prices | | LEVEL 2 —
Other Significant
Observable Inputs | | Total | |
| | | Investments
in
Securities | | Other
Financial
Investments^ | | Investments
in
Securities | | Other
Financial
Investments^ | | Investments
in
Securities | | Other
Financial
Investments^ | |
Victory US 500 Enhanced Volatility Wtd Index Fund | |
Common Stocks | | $ | 102,593,484 | | | $ | — | | | $ | — | | | $ | — | | | $ | 102,593,484 | | | $ | — | | |
Collateral for Securities
Loaned | | | 3,512,361 | | | | — | | | | — | | | | — | | | | 3,512,361 | | | | — | | |
Futures Contracts | | | — | | | | (5,334 | ) | | | — | | | | — | | | | — | | | | (5,334 | ) | |
Total | | | 106,105,845 | | | | (5,334 | ) | | | — | | | | — | | | | 106,105,845 | | | | (5,334 | ) | |
Victory Market Neutral Income Fund | |
Common Stocks | | | 20,573,554 | (a) | | | — | | | | 17,901,285 | | | | — | | | | 38,474,839 | | | | — | | |
Rights | | | 2,127 | | | | — | | | | 3,026 | | | | — | | | | 5,153 | | | | — | | |
43
Victory Portfolios II | | Notes to Financial Statements — continued
December 31, 2018 | |
(Unaudited)
| | | LEVEL 1 —
Quoted Prices | | LEVEL 2 —
Other Significant
Observable Inputs | | Total | |
| | | Investments
in
Securities | | Other
Financial
Investments^ | | Investments
in
Securities | | Other
Financial
Investments^ | | Investments
in
Securities | | Other
Financial
Investments^ | |
Collateral for Securities
Loaned | | $ | 1,318,342 | | | $ | — | | | $ | — | | | $ | — | | | $ | 1,318,342 | | | $ | — | | |
Option | | | — | | | | (94,760 | ) | | | — | | | | — | | | | — | | | | (94,760 | ) | |
Futures Contracts | | | — | | | | 1,071,308 | | | | — | | | | — | | | | — | | | | 1,071,308 | | |
Total | | | 21,894,023 | | | | 976,548 | | | | 17,904,311 | | | | — | | | | 39,798,334 | | | | 976,548 | | |
^ Other Financial instruments include any derivative instruments not reflected in the Schedules of Portfolio Investments as Investment Securities, such as futures contracts and written options. These instruments are generally recorded in the financial statements at the unrealized gain or loss on the investment.
(a) Consists of all securities traded on U.S. securities exchanges (including ADRs) and all securities listed under Canada and Mexico.
For the six months ended December 31, 2018, there were no Level 3 investments for which significant unobservable inputs were used to determine fair value.
Investment Companies:
Open-End Funds:
The Funds may invest in portfolios of open-end investment companies. These investment companies value securities in their portfolios for which market quotations are readily available at their market values (generally the last reported sale price) and all other securities and assets at their fair value by the methods established by the board of directors of the underlying funds.
Derivative Instruments:
Foreign Exchange Currency Contracts:
The Funds may enter into foreign exchange currency contracts to convert U.S. dollars to and from various foreign currencies. A foreign exchange currency contract is an obligation by a Fund to purchase or sell a specific currency at a future date at a price (in U.S. dollars) set at the time of the contract. The Funds do not engage in "cross-currency" foreign exchange contracts (i.e., contracts to purchase or sell one foreign currency in exchange for another foreign currency). The Funds' foreign exchange currency contracts might be considered spot contracts (typically a contract of one week or less) or forward contracts (typically a contract term over one week). A spot contract is entered into for purposes of hedging against foreign currency fluctuations relating to a specific portfolio transaction, such as the delay between a security transaction trade date and settlement date. Forward contracts are entered into for purposes of hedging portfolio holdings or concentrations of such holdings. Each foreign exchange currency contract is adjusted daily by the prevailing spot or forward rate of the underlying currency, and any appreciation or depreciation is recorded for financial statement purposes as unrealized until the contract settlement date, at which time the Fund records realized gains or losses equal to the difference between the value of a contract at the time it was opened and the value at the time it was closed. A Fund could be exposed to risk if a counterparty is unable to meet the terms of a foreign exchange currency contract or if the value of the foreign currency changes unfavorably. In addition, the use of foreign exchange currency contracts does not eliminate fluctuations in the underlying prices of the securities. As of December 31, 2018, the Funds had no open forward foreign exchange currency contracts.
44
Victory Portfolios II | | Notes to Financial Statements — continued
December 31, 2018 | |
(Unaudited)
Futures Contracts:
The Funds may enter into contracts for the future delivery of securities or foreign currencies and futures contracts based on a specific security, class of securities, foreign currency or an index, and purchase or sell options on any such futures contracts. A futures contract on a securities index is an agreement obligating either party to pay, and entitling the other party to receive, while the contract is outstanding, cash payments based on the level of a specified securities index. No physical delivery of the underlying asset is made. A Fund may enter into futures contracts in an effort to hedge against market risks. The acquisition of put and call options on futures contracts will give the Fund the right (but not the obligation), for a specified price, to sell or to purchase the underlying futures contract, upon exercise of the option, at any time during the option period. Futures transactions involve brokerage costs and require the Fund to segregate assets to cover contracts that would require it to purchase securities or currencies. A good faith margin deposit, known as initial margin, of cash or government securities with a broker or custodian is required to initiate and maintain open positions in futures contracts. Subsequent payments, known as variation margin, are made or received by the Fund based on the change in the market value of the position and are recorded as unrealized appreciation or depreciation until the contract is closed out, at which time the gain or loss is realized. A Fund may lose the expected benefit of futures transactions if interest rates, exchange rates or securities prices change in an unanticipated manner. Such unanticipated changes may also result in lower overall performance than if the Fund had not entered into any futures transactions. In addition, the value of a Fund's futures positions may not prove to be perfectly or even highly correlated with the value of its portfolio securities or foreign currencies, limiting a Fund's ability to hedge effectively against interest rate, exchange rate and/or market risk and giving rise to additional risks. There is no assurance of liquidity in the secondary market for purposes of closing out futures positions. The collateral held by the Funds is presented on the Statements of Assets and Liabilities under Deposit with broker for futures contracts and written options.
Options Transactions:
The Funds may purchase or sell options to aid in hedging against equity price risk incurred in the normal course of pursuing its investment objective. When a Fund writes a call option, an amount equal to the premium received is included as a liability. The amount of the liability is subsequently marked-to-market to reflect the current market value of the option. If an option expires on its stipulated expiration date or if the Fund enters into a closing purchase transaction, a gain or loss is realized. If a written call option is exercised, a gain or loss is realized for the sale of the underlying security and the proceeds from the sale are increased by the premium originally received. As a writer of an option, the Fund has no control over whether the option will be exercised and, as a result, retains the market risk of an unfavorable change in the price of the security underlying the written option.
The Funds may purchase put and call options. Put options are purchased to hedge against a decline in the value of securities held in the Fund's portfolio. If such a decline occurs, the put options will permit the Fund to sell the securities underlying such options at the exercise price, or to close out the options at a profit. The premium paid for a put or call option plus any transaction costs will reduce the benefit, if any, realized by the Fund upon exercise of the option, and, unless the price of the underlying security rises or declines sufficiently, the option may expire worthless to the Fund. In addition, in the event that the price of the security in connection with which an option was purchased moves in a direction favorable to the Fund, the benefits realized by the Fund as a result of such favorable movement will be reduced by the amount of the premium paid for the option and related transaction costs. Written and purchased options are non-income producing securities. With purchased options, there is minimal counterparty risk to the Fund since these options are exchange-traded. The collateral held by the Funds is presented on the Statements of Assets and Liabilities under Deposits with brokers for futures contracts and written options.
Offsetting of Financial Assets and Derivatives Assets:
The Funds are subject to various Master Netting Arrangements, which govern the terms of certain transactions with select counterparties. The Master Netting Arrangements allow the Funds to close
45
Victory Portfolios II | | Notes to Financial Statements — continued
December 31, 2018 | |
(Unaudited)
out and net total exposure to a counterparty in the event of a default with respect to all the transactions governed under a single agreement with a counterparty. The Master Netting Arrangements also specify collateral posting arrangements at pre-arranged exposure levels. Under the Master Netting Arrangements, collateral is routinely transferred if the total net exposure to certain transactions (net of existing collateral already in place) governed under the relevant Master Netting Arrangement with a counterparty in a given account exceeds a specified threshold depending on the counterparty and the type of Master Netting Arrangement.
The table below, as of December 31, 2018, discloses both gross information and net information about instruments and transactions eligible for offset in the Statements of Assets and Liabilities and instruments and transactions that are subject to an agreement similar to a master netting agreement as well as amounts related to collateral held at clearing brokers and counterparties.
Assets | | Gross Amounts
of Recognized
Assets | | Gross Amounts
Available for
Offset | | Net Amounts
Presented in the
Statements of
Assets and
Liabilities | | Cash
Collateral
Received | | Net
Amount | |
US 500 Enhanced Volatility Wtd Index Fund | |
Futures | |
Goldman Sachs & Co. | | $ | 8,640 | | | $ | — | | | $ | 8,640 | | | $ | — | | | $ | 8,640 | | |
Market Neutral Income Fund | |
Futures | |
Goldman Sachs & Co. | | | 108,425 | | | | (108,425 | ) | | | — | | | | — | | | | — | | |
Liabilities | | Gross Amounts
of Recognized
Liabilities | | Gross Amounts
Available for
Offset | | Net Amounts
Presented in the
Statements of
Assets and
Liabilities | | Cash
Collateral
Pledged | | Net
Amount | |
Market Neutral Income Fund | |
Futures | |
Goldman Sachs & Co. | | $ | 297,065 | | | $ | (108,425 | ) | | $ | 188,640 | | | $ | (188,640 | ) | | $ | — | | |
Summary of Derivative Instruments:
The following table summarizes the fair values of derivative instruments on the Statements of Assets and Liabilities, categorized by risk exposure, as of December 31, 2018:
| | | Asset Location | | Liability Location | |
Risk Exposure | | Variation Margin
Receivable on Open
Futures Contracts* | | Variation Margin
Payable on Open
Futures Contracts* | |
Futures Contracts | |
Equity Risk | |
US 500 Enhanced Volatility Wtd Index Fund | | $ | — | | | $ | 5,334 | | |
Market Neutral Income Fund | | | 1,713,514 | | | | 642,206 | | |
| | | Liability Location | |
| | | Written Options, at Value | |
Written Options | |
Equity Risk | |
Market Neutral Income Fund | | $ | 94,760 | | |
* Includes cumulative appreciation (depreciation) of futures contracts as reported on the Schedules of Portfolio Investments. Only current day's variation margin is reported within the Statements of Assets and Liabilities.
46
Victory Portfolios II | | Notes to Financial Statements — continued
December 31, 2018 | |
(Unaudited)
The following table presents the effect of derivative instruments on the Statements of Operations, categorized by risk exposure, for the six months ended December 31, 2018:
| | | Net Realized Gains
(Losses) on
Derivatives
Recognized as a
Result from
Operations | | Net Change in
Unrealized
Appreciation/Depreciation
on Derivatives Recognized
as a Result of Operations | |
Risk Exposure | | Net Realized
Gains (Losses) from
Futures Contracts | | Net Change in
Unrealized
Appreciation (Depreciation)
from Futures Contracts | |
Futures Contracts | |
Equity Risk | |
US 500 Enhanced Volatility Wtd Index Fund | | $ | (102,448 | ) | | $ | 4,615 | | |
Market Neutral Income Fund | | | 2,340,625 | | | | (111,515 | ) | |
| | | Net Realized
Gains (Losses) from
Written Options | | Net Change in
Unrealized
Appreciation (Depreciation)
from Written Options | |
Written Options | |
Equity Risk | |
Market Neutral Income Fund | | $ | 878,232 | | | $ | 225,192 | | |
All open derivative positions at period end are reflected in each respective Fund's Schedule of Portfolio Investments. The underlying face value of open derivative positions relative to each Fund's net assets at period end is generally representative of the notional amount of open positions to net assets throughout the period.
Investment Transactions and Related Income:
Changes in holdings of investments are accounted for no later than one business day following the trade date. For financial reporting purposes, however, investment transactions are accounted for on trade date on the last business day of the reporting period. Interest income is recognized on an accrual basis and includes, where applicable, the amortization of premiums or accretion of discounts. Dividend income is recorded on the ex-dividend date. Gains or losses realized on sales of securities are determined by comparing the identified cost of the security lot sold with the net sales proceeds.
Withholding taxes on interest, dividends and gains as a result of certain investments in ADRs by the Funds have been provided for in accordance with each investment's applicable country's tax rules and rates.
Securities Lending:
The Trust has entered into a Master Securities Lending Agreement ("MSLA") with Citibank, N.A. ("Citibank" or the "Agent"). Under the terms of the MSLA, the Funds may lend securities to certain broker-dealers and banks in exchange for collateral in the amount of at least 102% of the value of U.S. securities loaned or at least 105% of the value of non-U.S. securities loaned, marked-to-market daily. Any collateral shortfalls associated with increases in the valuation of the securities loaned are adjusted the next business day. The collateral can be received in the form of cash collateral and/or non-cash collateral. Non-cash collateral can include U.S. Government Securities, letters of credit and certificates of deposit. The cash collateral is invested in short-term instruments or cash equivalents as noted in the Funds' Schedules of Portfolio Investments. The Trust does not have effective control of the non-cash collateral and therefore it is not disclosed in the Funds' Schedules of Portfolio Investments. The Funds continue to benefit from interest or dividends on the securities loaned and may also earn a return from the collateral. The Funds pay various fees in connection with the investment of cash collateral. The Funds pay the Agent fees based on the investment income received from securities lending activities.
47
Victory Portfolios II | | Notes to Financial Statements — continued
December 31, 2018 | |
(Unaudited)
Securities lending income is disclosed on the Statements of Operations. Although risk is mitigated by the collateral, the Funds could experience a delay in recovering their securities and possible loss of income or value if the borrower fails to return them.
Securities lending transactions are entered into by a Fund under the MSLA, which permits the Fund, under certain circumstances such as an event of default, to offset amounts payable by the Fund to the same counterparty against amounts receivable from the counterparty to create a net payment due to or from the Fund.
The following table is a summary of the Funds' securities lending transactions which are subject to offset under the MSLA as of December 31, 2018. These transactions are accounted for as secured borrowings with an overnight and continuous contractual maturity for cash collateral, and greater than overnight and continuous contractual maturity for non-cash collateral.
| | | Gross
Amount of
Recognized
Assets
(Value of | | Value of
Cash | | Value of Non-cash Collateral
Received by Maturity | | | |
Fund | | Securities
on Loan) | | Collateral
Received | | <30 Days | | Between 30
& 90 Days | | >90 Days | | Net Amount | |
US 500 Enhanced Volatility
Wtd Index Fund | | $ | 3,462,829 | | | $ | 3,512,361 | | | $ | — | | | $ | — | | | $ | — | | | $ | 49,532 | | |
Market Neutral Income
Fund | | | 1,539,366 | | | | 1,318,342 | | | | — | | | | — | | | | 281,051 | | | | 60,027 | | |
Foreign Currency Translations:
The accounting records of the Funds are maintained in U.S. dollars. Investment securities and other assets and liabilities of a Fund denominated in a foreign currency are translated into U.S. dollars at current exchange rates. Purchases and sales of securities, income receipts and expense payments are translated into U.S. dollars at the exchange rates on the date of the transactions. The Funds do not isolate the portion of the results of operations resulting from changes in foreign exchange rates on investments from fluctuations arising from changes in market prices of securities held. Such fluctuations are disclosed as net change in unrealized appreciation/depreciation on investments and foreign currency translations on the Statements of Operations. Any realized gains or losses from these fluctuations are disclosed as net realized gains or losses from investment transactions and foreign currency translations on the Statements of Operations.
Foreign Taxes:
The Funds may be subject to foreign taxes related to foreign income received (a portion of which may be reclaimable), capital gains on the sale of securities, and certain foreign currency transactions. All foreign taxes are recorded in accordance with the applicable regulations and rates that exist in the foreign jurisdictions in which the Funds invest.
Dividends to Shareholders:
Dividends from net investment income, if any, are declared and paid quarterly for each Fund. Distributable net realized gains, if any, are declared and distributed at least annually from each Fund.
The amounts of dividends from net investment income and distributions from net realized gains are determined in accordance with federal income tax regulations, which may differ from GAAP. To the extent these "book/tax" differences are permanent in nature (e.g., net operating loss, distribution reclassification, and deemed distribution due to shareholder redemptions), such amounts are reclassified within the components of net assets based on their federal tax-basis treatment; temporary differences (e.g., wash sales) do not require reclassification. To the extent dividends and distributions exceed net investment income and net realized gains for tax purposes, they are reported as distributions
48
Victory Portfolios II | | Notes to Financial Statements — continued
December 31, 2018 | |
(Unaudited)
of capital. Net investment losses incurred by a Fund may be reclassified as an offset to capital on the accompanying Statements of Assets and Liabilities.
Federal Income Taxes:
It is the policy of each Fund to continue to qualify as a regulated investment company by complying with the provisions available to certain investment companies, as defined in applicable sections of the Internal Revenue Code, and to make distributions of net investment income and net realized gains sufficient to relieve it from all, or substantially all, federal income taxes. Accordingly, no provision for federal income taxes is required in the financial statements. The Funds have a tax year end of June 30.
Management of the Funds has reviewed tax positions taken in tax years that remain subject to examination by all major tax jurisdictions, including federal (i.e., the last four tax year ends and the interim tax period since then). Management believes that there is no tax liability resulting from unrecognized tax benefits related to uncertain tax positions taken.
Allocations:
Expenses directly attributable to a Fund are charged to the Fund, while expenses which are attributable to more than one fund in the Trust, or jointly with an affiliated trust, are allocated among the respective funds in the Trust and/or affiliated trust based upon net assets or another appropriate basis.
Income, expenses (other than class-specific expenses such as transfer agent fees, state registration fees, printing and 12b-1 fees), and realized and unrealized gains or losses on investments are allocated to each class of shares based on its relative net assets on the date income is earned or expenses and realized and unrealized gains and losses are incurred.
Affiliated Securities Transactions:
Pursuant to Rule 17a-7 under the 1940 Act, the Funds may engage in securities transactions with affiliated investment companies and advisory accounts managed by the Adviser and any applicable sub-adviser. Any such purchase or sale transaction must be effected without brokerage commission or other remuneration, except for customary transfer fees. The transaction must be effected at the current market price, which is either the security's last sale price on an exchange or, if there are no transactions in the security that day, at the average of the highest bid and lowest asked price. For the year ended December 31, 2018, the Funds did not engage in any Rule 17a-7 transactions under the 1940 Act.
3. Purchases and Sales of Securities:
Purchases and sales of securities (excluding securities maturing less than one year from acquisition) for the six months ended December 31, 2018 were as follows:
Fund | | Purchases | | Sales | |
US 500 Enhanced Volatility Wtd Index Fund | | $ | 23,014,425 | | | $ | 36,306,339 | | |
Market Neutral Income Fund | | | 24,541,893 | | | | 18,635,892 | | |
For the six months ended December 31, 2018, there were no purchases or sales of U.S. Government Securities.
4. Fees and Transactions with Affiliates and Related Parties:
Investment advisory services are provided to the Funds by Victory Capital Management Inc. ("VCM" or the "Adviser"), a New York corporation registered as an investment adviser with the Securities and Exchange Commission ("SEC"). The Adviser is a wholly-owned indirect subsidiary of Victory Capital Holdings, Inc., a publicly traded Delaware corporation and a wholly-owned direct subsidiary of Victory Capital Operating, LLC.
49
Victory Portfolios II | | Notes to Financial Statements — continued
December 31, 2018 | |
(Unaudited)
Under the terms of the Investment Advisory Agreements, the Adviser is entitled to receive fees based on a percentage of the average daily net assets of each Fund. The rates at which the Adviser is paid by each Fund are included in the table below. The Adviser may use its resources to assist with the Funds' distribution and marketing expenses.
| | | Adviser Fee
Rate | |
US 500 Enhanced Volatility Wtd Index Fund | | | 0.70 | % | |
Market Neutral Income Fund | | | 0.60 | % | |
VCM also serves as the Funds' administrator and fund accountant. Under an Administration and Fund Accounting Agreement, VCM is paid for its services an annual fee at a rate of 0.08% of the first $15 billion in average daily net assets of the Trust, Victory Variable Insurance Funds and Victory Portfolios (collectively, the "Trusts"), 0.05% of the average daily net assets above $15 billion to $30 billion of the Trusts and 0.04% of the average daily net assets over $30 billion of the Trusts.
Citi Fund Services Ohio, Inc. ("Citi"), an affiliate of Citibank, N.A., acts as sub-administrator and sub-fund accountant to the Funds pursuant to a Sub-Administration and Sub-Fund Accounting Services Agreement between VCM and Citi. VCM pays Citi a fee for providing these services. The Trust reimburses VCM and Citi for all of their reasonable out-of-pocket expenses incurred in providing these services.
FIS Investor Services, LLC ("FIS") serves as the Funds' transfer agent. Under the Transfer Agent Agreement, the Trust pays FIS a fee for its services and reimburses FIS for all of their reasonable out-of-pocket expenses incurred in providing these services.
The Chief Compliance Officer ("CCO") is an employee of the Adviser, which pays the compensation of the CCO and his support staff. The Trust has entered into an Agreement to provide compliance services with the Adviser, pursuant to which the Adviser furnishes its compliance personnel, including the services of the CCO, and other resources reasonably necessary to provide the Trust with compliance oversight services related to the design, administration and oversight of a compliance program for the Trust in accordance with Rule 38a-1 under the 1940 Act. Funds in the Trust, Victory Variable Insurance Funds, Victory Institutional Funds and Victory Portfolios (collectively, the "Victory Funds Complex"), in the aggregate, compensate the Adviser for these services.
The Victory Funds Complex pays an annual retainer to each Independent Trustee, plus an additional annual retainer to the Chairman of the Board. The aggregate amount of the fees and expenses of the Independent Trustees are allocated amongst all the funds in the Victory Funds Complex and are presented in the Statements of Operations.
Shearman & Sterling LLP provides legal services to the Trust.
Victory Capital Advisers, Inc. (the "Distributor"), an affiliate of the Adviser, serves as distributor for the continuous offering of the shares of the Funds pursuant to a Distribution Agreement between the Distributor and the Trust.
Pursuant to the Distribution and Service Plans adopted in accordance with Rule 12b-1 under the 1940 Act, the Distributor may receive a monthly distribution and service fee, at an annual rate of up to 0.25% and 1.00% of the average daily net assets for Class A and Class C Shares of each of the respective Funds. The distribution and service fees paid to the Distributor may be used by the Distributor to pay for activities primarily intended to result in the sale of Class A or Class C Shares of the Funds.
In addition, the Distributor is entitled to receive commissions on sales of Class A Shares of the Funds. For the six months ended December 31, 2018, the Distributor received approximately $2,130 from commissions earned on sales of Class A Shares. A $15 redemption fee may be charged for redemptions made by wire. The redemption fee is paid directly to and retained by the Funds, and is designed to deter excessive short-term trading and to offset brokerage commissions, market impact and other costs that may be associated with short-term money movement in and out of the Funds.
50
Victory Portfolios II | | Notes to Financial Statements — continued
December 31, 2018 | |
(Unaudited)
The Adviser has entered into expense limitation agreements with certain Funds. Under the terms of the agreements, the Adviser has agreed to waive fees or reimburse certain expenses to the extent that ordinary operating expenses incurred by certain classes of a Fund in any fiscal year exceed the expense limit for such classes of the Fund. Such excess amount will be the liability of the Adviser. Interest, taxes, brokerage commissions, other expenditures which are capitalized in accordance with GAAP, and other extraordinary expenses not incurred in the ordinary course of a Fund's business are excluded from the expense limits. As of December 31, 2018, the expense limits (excluding voluntary waivers) are as follows:
| | | In effect July 1, 2018 until October 31, 2019 | |
| | | Class A Shares | | Class C Shares | | Class I Shares | |
US 500 Enhanced Volatility Wtd Index Fund | | | 0.99 | % | | | 1.74 | % | | | 0.74 | % | |
Market Neutral Income Fund | | | 0.75 | % | | | 1.50 | % | | | 0.40 | % | |
The Funds have agreed to repay fees and expenses that were waived or reimbursed by the Adviser for a period up to three fiscal years after such waiver or reimbursement was made to the extent such payments or repayments would not cause the expenses of a class to exceed the original expense limitation in place at the time of the waiver or reimbursement or any expense limitation agreement in place at the time of repayment. Amounts repaid to the Adviser during the six months ended, if any, are reflected on the Statements of Operations as "Recoupment of prior expenses waived/reimbursed by Adviser".
As of December 31, 2018, the following amounts are available to be repaid to the Adviser.
Fund | | Expires
6/30/19 | | Expires
6/30/20 | | Expires
6/30/21 | | Expires
6/30/22 | | Total | |
US 500 Enhanced Volatility
Wtd Index Fund | | $ | 619,681 | | | $ | 534,407 | | | $ | 283,259 | | | $ | 147,637 | | | $ | 1,584,984 | | |
Market Neutral Income Fund | | | 201,142 | | | | 256,668 | | | | 197,955 | | | | 102,496 | | | | 758,261 | | |
The Adviser may voluntarily waive or reimburse additional fees to assist the Funds in maintaining competitive expense ratios. Voluntary waivers and reimbursements applicable to the Funds are not available to be recouped at a future time. There were no voluntary waivers or reimbursements for the six months ended December 31, 2018.
Certain officers and/or interested trustees of the Funds are also officers and/or employees of the Adviser, Administrator, Fund Accountant, Sub-Administrator, Sub-Fund Accountant, and Legal.
5. Risks:
Each Fund may be subject to other risks in addition to these identified risks.
An investment in the Funds' shares represents an indirect investment in the securities owned by the Funds, some of which will be traded on a national securities exchange or in the over-the-counter markets. The value of the securities in which the Funds invest, like other market investments, may move up or down, sometimes rapidly and unpredictably. The value of the securities in which the Funds invest may affect the value of the Funds' shares. An investment in the Funds' shares at any point in time may be worth less than the original investment, even after taking into account the reinvestment of the Funds' distributions.
The Market Neutral Income Fund invests in securities of foreign issuers in various countries. Investing on an international basis involves certain risks not involved in domestic investments including the risk of nationalization or expropriation of assets, imposition of currency exchange controls or restrictions on the repatriation of foreign currency, confiscatory taxation, political or financial instability and diplomatic developments, which could affect the value of a Fund's investments in certain foreign countries. Governments of many countries have exercised and continue to exercise substantial influence over many aspects of the private sector through the ownership or control of many companies, including some of the largest in these countries. As a result, government actions in the future could have a significant effect on economic conditions which may adversely affect prices of certain portfolio securities. There is also generally less government supervision and regulation of stock exchanges, brokers and listed companies than in the U.S. Dividends or interest on, or proceeds from the sale of, foreign securities
51
Victory Portfolios II | | Notes to Financial Statements — continued
December 31, 2018 | |
(Unaudited)
may be subject to foreign withholding taxes, and special U.S. tax considerations may apply. Moreover, foreign economies may differ favorably or unfavorably from the U.S. economy in such respects as growth of gross national product, rate of inflation, capital reinvestment, resource self-sufficiency and balance of payments position. The Schedule of Portfolio Investments includes information on each Fund's holdings, including industry and/or geographic composition, as relevant.
The Funds will be subject to credit risk with respect to the amount each expects to receive from counterparties for financial instruments entered into by the Funds. The Funds may be negatively impacted if a counterparty becomes bankrupt or otherwise fails to perform its obligations due to financial difficulties. The Funds may experience significant delays in obtaining any recovery in bankruptcy or other reorganization proceeding and the Funds may obtain only limited recovery or may obtain no recovery in such circumstances. The Funds typically enter into transactions with counterparties whose credit ratings are investment grade, as determined by a nationally recognized statistical rating organization or, if unrated, judged by the Adviser to be of comparable quality.
6. Borrowing and Interfund Lending:
Line of Credit:
The Victory Funds Complex participates in a short-term, demand note "Line of Credit" agreement with Citibank. Under the agreement with Citibank, the Victory Funds Complex may borrow up to $250 million, of which $100 million is committed and $150 million is uncommitted. $40 million of the Line of Credit is reserved for use by the Victory Floating Rate Fund, another series of the Victory Funds Complex, with that Fund paying the related commitment fees for that amount. The purpose of the agreement is to meet temporary or emergency cash needs, including redemption requests that might otherwise require the untimely disposition of securities. The current agreement was amended on July 27, 2018 with a new termination date of July 26, 2019. Citibank receives an annual commitment fee of 0.15% on $100 million for providing the Line of Credit. For the six months ended December 31, 2018, Citibank earned approximately $76,000 in commitment fees from the Victory Funds Complex. Each fund in the Victory Funds Complex pays a pro-rata portion of the commitment fees plus any interest on amounts borrowed. Interest accrued by each Fund during the period is presented on the Statements of Operations under Interest expense on line of credit.
The Funds did not utilize or participate in the Line of Credit during the six months ended December 31, 2018.
Interfund Lending:
The Trust and Adviser rely on an exemptive order granted by the SEC in March 2017 (the "Order"), permitting the establishment and operation of an Interfund Lending Facility (the "Facility"). The Facility allows each Fund to directly borrow money to or from any other Victory Fund relying upon the Order at rates beneficial to both the borrowing and lending funds. Advances under the Facility are allowed for temporary or emergency purposes, including the meeting of redemption requests that otherwise might require the untimely disposition of securities, and are subject to each Fund's borrowing restrictions. The interfund loan rate is determined, as specified in the Order, by averaging the current repurchase agreement rate and the current bank loan rate. Interest accrued by each Fund during the period is presented on the Statements of Operations under Interest expense on interfund lending.
The average borrowing for the days outstanding and average interest rate for each Fund during the six months ended December 31, 2018 were as follows:
Fund | | Borrower or
Lender | | Amount
Outstanding at
December 31, 2018 | | Average
Borrowing* | | Days
Borrowing
Outstanding | | Average
Interest
Rate* | | Maximum
Borrowing
During the
Period | |
US 500 Enhanced Volatility
Wtd Index Fund | | Borrower | | $ | — | | | $ | 191,500 | | | | 2 | | | | 2.95 | % | | $ | 254,000 | | |
* For the six months ended December 31, 2018, based on the number of days borrowings were outstanding.
52
Victory Portfolios II | | Notes to Financial Statements — continued
December 31, 2018 | |
(Unaudited)
7. Federal Income Tax Information:
The tax character of distributions paid and the tax basis of current components of accumulated earnings (deficit) will be determined at the end of the current tax year ending June 30, 2019.
The tax character of distributions paid during the most recent tax year ended June 30, 2018, were as follows (total distributions paid may differ from the Statements of Changes in Net Assets because, for tax purposes, dividends are recognized when actually paid):
| | | Year Ended June 30, 2018 | |
| | | Distributions paid from | | | | | |
| | | Ordinary
Income | | Net
Long-Term
Capital Gains | | Total
Taxable
Distributions | | Total
Distributions
Paid | |
US 500 Enhanced Volatility Wtd Index Fund | | $ | 2,489,677 | | | $ | 9,161,948 | | | $ | 11,651,625 | | | $ | 11,651,625 | | |
Market Neutral Income Fund | | | 1,577,531 | | | | — | | | | 1,577,531 | | | | 1,577,531 | | |
As of the most recent tax year ended June 30, 2018, the components of accumulated earnings/(deficit) on a tax basis were as follows:
| | | Undistributed
Ordinary
Income | | Undistributed
Long-Term
Capital Gains | | Accumulated
Earnings | | Accumulated
Capital and
Other
Losses | | Qualified
Late-Year
Losses* | | Unrealized
Appreciation
(Depreciation)** | | Total
Accumulated
Earnings
(Deficit) | |
US 500 Enhanced
Volatility Wtd
Index Fund | | $ | 843,699 | | | $ | 8,193,780 | | | $ | 9,037,479 | | | $ | — | | | $ | — | | | $ | 28,176,828 | | | $ | 37,214,307 | | |
Market Neutral
Income Fund | | | — | | | | — | | | | — | | | | (3,218,501 | ) | | | (14,933 | ) | | | 1,258,836 | | | | (1,974,598 | ) | |
* Qualified late-year losses are comprised of post-October capital losses incurred after October 31, 2017, and certain late-year ordinary losses. Late-year ordinary losses represent ordinary losses incurred after December 31, 2017 and specified losses incurred after October 31, 2017. These losses are deemed to arise on the first day of the Fund's next taxable year.
** The difference between the book-basis and tax-basis of unrealized appreciation/(depreciation) is attributable primarily to tax deferral of losses on wash sales.
As of the most recent tax year ended June 30, 2018, the following Funds had net capital loss carryforwards ("CLCFs") as summarized in the tables below. CLCFs subject to expiration are applied as short-term capital loss regardless of whether the originating capital loss was short-term or long-term. CLCFs that are not subject to expiration are applied as either short-term or long-term depending on the originating capital loss and must be utilized before those that are subject to expiration.
CLCFs subject to expiration:
| | | Short-Term
Amount | | Long-Term
Amount | | Total | |
Market Neutral Income Fund | | $ | — | | | $ | 3,218,501 | | | $ | 3,218,501 | | |
At December 31, 2018, the cost basis for federal income tax purposes, gross unrealized appreciation, gross unrealized depreciation and net unrealized appreciation (depreciation) for investments were as follows:
| | Cost of
Investments
for Federal
Tax Purposes | | Gross
Unrealized
Appreciation | | Gross
Unrealized
Depreciation | | Net
Unrealized
Appreciation
(Depreciation) | |
US 500 Enhanced Volatility Wtd
Index Fund | | $ | 95,356,050 | | | $ | 20,276,649 | | | $ | (9,532,188 | ) | | $ | 10,744,461 | | |
Market Neutral Income Fund | | | 42,895,892 | | | | 2,625,267 | | | | (4,651,517 | ) | | | (2,026,250 | ) | |
53
Victory Portfolios II | | Notes to Financial Statements — continued
December 31, 2018 | |
(Unaudited)
8. Fund Ownership:
Ownership of more than 25% of the voting securities of a fund creates presumptions of control of the fund, under section 2(a)(9) of the 1940 Act. As of December 31, 2018, the shareholders listed below held more than 25% of the shares outstanding of the Funds and may be deemed to control those Funds.
Shareholder | | Fund | | Percent | |
LPL Financial Corp. | | US 500 Enhanced Volatility Wtd Index Fund | | | 33.9 | % | |
Charles Schwab & Co., Inc. | | Market Neutral Income Fund | | | 70.8 | % | |
9. Recent Accounting Pronouncements:
In October 2016, the SEC released its Final Rules on Investment Company Reporting Modernization (the "Rules"). The Rules introduced a new regulatory reporting form for investment companies — Form N-PORT. The Funds' compliance date for Form N-PORT was June 1, 2018, and the Funds will make their initial filing with the SEC on Form N-PORT for the period ending March 31, 2019. Effective with the period ended June 30, 2018, the Funds were required to maintain, and make available to the SEC upon request, the information required to be included in Form N-PORT. Form N-PORT will replace Form N-Q filings effective with the requirement to file the Form N-PORT with the SEC for the period ending March 31, 2019. The Funds' adoption of this amendment has no effect on the Funds' net assets or results of operations.
In August 2018, the FASB issued ASU No. 2018-13, "Fair Value Measurements" ("ASU 2018-13"). This update makes certain removals from, changes to and additions to existing disclosure requirements for fair value measurements. ASU 2018-13 does not change fair value measurements already required or permitted by existing standards. ASU 2018-13 is effective for financial statements issued for fiscal years beginning after December 15, 2019, and interim periods within those fiscal years. As permitted, the Funds have early adopted ASU 2018-13 with the financial statements prepared as of December 31, 2018.
In August 2018, the SEC adopted amendments to certain financial statement disclosure requirements to conform them to GAAP for investment companies. These amendments made certain disclosure requirements effective under Regulation S-X. The Funds' adoption of these amendments, effective with the financial statements prepared as of December 31, 2018 had no effect on the Funds' net assets or results of operations. As a result of adopting these amendments, the distributions to shareholders in the June 30, 2018 Statements of Changes in Net Assets presented herein have been reclassified to conform to the current year presentation, which includes all distributions to each class of shareholders, other than tax basis return of capital distributions, in one line item per share class. Distributions to shareholders for the year ended June 30, 2018 from net investment income and net realized gains in the Fund were as follows:
| | | US 500 Enhanced Volatility
WTD Index Fund | | Market Neutral Income fund | |
Distributions to Shareholders: | |
From net investment income: | | | | | |
Class A Shares | | $ | (261,664 | ) | | $ | (729,949 | ) | |
Class C Shares | | | (5,831 | ) | | | (9,927 | ) | |
Class I Shares | | | (301,423 | ) | | | (837,655 | ) | |
From net realized gains: | | | | | |
Class A Shares | | | (3,213,210 | ) | | | — | | |
Class C Shares | | | (5,087,982 | ) | | | — | | |
Class I Shares | | | (2,781,515 | ) | | | — | | |
10. Subsequent Events:
The Funds have evaluated the need for additional disclosures or adjustments resulting from subsequent events through the date these financial statements were issued. Based on this evaluation, there were no subsequent events to report that would have a material impact on the Funds' financial statements.
54
Victory Portfolios II | | Supplemental Information
December 31, 2018 | |
(Unaudited)
Trustee and Officer Information
Board of Trustees:
Overall responsibility for management of the Trust rests with the Board. The Trust is managed by the Board in accordance with the laws of the State of Delaware. There are currently ten Trustees, nine of whom are not "interested persons" of the Trust within the meaning of that term under the 1940 Act ("Independent Trustees") and one of whom is an "interested person" of the Trust within the meaning of that term under the 1940 Act ("Interested Trustee"). The Trustees, in turn, elect the officers of the Trust to actively supervise its day-to-day operations. The following tables list the Trustees, their ages, position with the Trust, commencement of service, principal occupations during the past five years and any directorships of other investment companies or companies whose securities are registered under the Securities Exchange Act of 1934, as amended, or who file reports under that Act. Each Trustee oversees 20 portfolios in the Trust, nine portfolios in Victory Variable Insurance Funds, one portfolio in Victory Institutional Funds and 42 portfolios in Victory Portfolios, each a registered investment company that, together with the Trust, comprise the Victory Funds Complex. Each Trustee's address is c/o Victory Portfolios II, 4900 Tiedeman Road, 4th Floor, Brooklyn, Ohio 44144. Each Trustee has an indefinite term.
Name and Age | | Position
Held with
the Trust | | Date
Commenced
Service | | Principal Occupation
During Past 5 Years | | Other
Directorships
Held During
Past 5 Years | |
Independent Trustees. | |
David Brooks Adcock, 67 | | Trustee | | May 2015 | | Consultant (since 2006). | | Chair and Trustee, Turner Funds (December 2016-December 2017). | |
Nigel D. T. Andrews, 71 | | Vice Chair and Trustee | | May 2015 | | Retired. | | Director, TCG BDC II, Inc. (since 2017); Director, TCG BDC I, Inc. (formerly Carlyle GMS Finance, Inc.) (since 2012); Director, Old Mutual US Asset Management (2002-2014). | |
E. Lee Beard, 67* | | Trustee | | May 2015 | | Retired (since 2015); Consultant, The Henlee Group, LLC (consulting) (2005-2015). | | None. | |
55
Victory Portfolios II | | Supplemental Information — continued
December 31, 2018 | |
(Unaudited)
Name and Age | | Position
Held with
the Trust | | Date
Commenced
Service | | Principal Occupation
During Past 5 Years | | Other
Directorships
Held During
Past 5 Years | |
Dennis M. Bushe, 75 | | Trustee | | July 2016 | | Retired. | | Trustee, RS Investment Trust and RS Variable Products Trust (November 2011-July 2016). | |
Sally M. Dungan, 64 | | Trustee | | May 2015 | | Chief Investment Officer, Tufts University (since 2002). | | None. | |
John L. Kelly, 65 | | Trustee | | May 2015 | | Partner, McCarvill Capital Partners (September 2016-September 2017); Advisor (January 2016-April 2016) and Managing Partner (August 2014-January 2016), Endgate Commodities LLC; Chief Operating Officer, Liquidnet Holdings, Inc. (2011-2014). | | Director, Caledonia Mining Corporation (since May 2012). | |
David L. Meyer, 61* | | Trustee | | May 2015 | | Retired. | | None. | |
Gloria S. Nelund, 57 | | Trustee | | July 2016 | | Chair, CEO and Co-Founder of TriLinc Global, LLC, an investment firm. | | TriLinc Global Impact Fund, LLC (since 2012); Trustee, RS Investment Trust and RS Variable Products Trust (November 2007-July 2016). | |
Leigh A. Wilson, 74 | | Chair and Trustee | | May 2015 | | Private Investor. | | Chair (since 2013), Caledonia Mining Corporation. | |
56
Victory Portfolios II | | Supplemental Information — continued
December 31, 2018 | |
(Unaudited)
Name and Age | | Position
Held with
the Trust | | Date
Commenced
Service | | Principal Occupation
During Past 5 Years | | Other
Directorships
Held During
Past 5 Years | |
Interested Trustee. | |
David C. Brown, 46** | | Trustee | | May 2015 | | Chairman and Chief Executive Officer (since 2013), Co-Chief Executive Officer (2011-2013), the Adviser; Chairman and Chief Executive Officer, Victory Capital Holdings, Inc. (since 2013). | | None. | |
* The Board has designated Mr. Meyer and Ms. Beard as its Audit Committee Financial Experts.
** Mr. Brown is an "Interested Person" by reason of his relationship with the Adviser.
The Statement of Additional Information includes additional information about the Trustees of the Trust and is available, without charge, by calling 800-539-3863.
57
Victory Portfolios II | | Supplemental Information — continued
December 31, 2018 | |
(Unaudited)
Officers:
The officers of the Trust, their ages, commencement of service and their principal occupations during the past five years, are detailed in the following table. Each officer serves until the earlier of his or her resignation, removal, retirement, death, or the election of a successor. The mailing address of each officer of the Trust is 4900 Tiedeman Road, 4th Floor, Brooklyn, Ohio 44144. The officers of the Trust receive no compensation directly from the Trust for performing the duties of their offices.
Name and Age | | Position with
the Trust | | Date
Commenced
Service | | Principal Occupation During Past 5 Years | |
Christopher K. Dyer, 57 | | President | | May 2015 | | Director of Mutual Fund Administration, the Adviser. | |
Scott A. Stahorsky, 49 | | Vice President | | May 2015 | | Manager, Fund Administration, the Adviser (since 2015); Senior Analyst, Fund Administration, the Adviser (prior to 2015). | |
Erin G. Wagner, 45 | | Secretary | | May 2015 | | Associate General Counsel, the Adviser (since 2013). | |
Allan Shaer, 53 | | Treasurer | | December 2017 | | Senior Vice President, Financial Administration, Citi Fund Services Ohio, Inc. (since 2016); Vice President, Mutual Fund Administration, JP Morgan Chase (2011-2016). | |
Christopher A. Ponte, 34* | | Assistant Treasurer | | May 2015 | | Manager, Fund Administration, the Adviser (since 2017); Senior Analyst, Fund Administration, the Adviser (prior to 2017); Chief Financial Officer, Victory Capital Advisers, Inc. (since 2018). | |
Colin Kinney, 45 | | Chief Compliance Officer | | July 2017 | | Chief Compliance Officer (since 2013) and Chief Risk Officer (2009-2017), the Adviser. | |
Chuck Booth, 58 | | Anti-Money Laundering Compliance Officer and Identity Theft Officer | | May 2015 | | Director, Regulatory Administration and CCO Support Services, Citi Fund Services Ohio, Inc. | |
Jay G. Baris, 65 | | Assistant Secretary | | May 2015 | | Partner, Shearman & Sterling LLP (since 2018); Partner, Morrison & Foerster LLP (2011-2017). | |
* On December 5, 2017, Mr. Ponte resigned as Treasurer and accepted the position of Assistant Treasurer of the Trust.
58
Victory Portfolios II | | Supplemental Information — continued
December 31, 2018 | |
(Unaudited)
Proxy Voting and Form N-Q Information
Proxy Voting:
Information regarding the policies and procedures that each Fund uses to determine how to vote proxies relating to portfolio securities is available without charge, upon request, by calling 800-539-3863. The information is also included in the Funds' Statement of Additional Information, which is available on the SEC's website at www.sec.gov.
Information relating to how the Funds voted proxies relating to portfolio securities held during the most recent twelve months ended June 30 is available on the SEC's website at www.sec.gov.
Availability of Schedules of Portfolio Investments:
The Trust expects to file a complete list of Schedules of Portfolio Investments with the SEC for the first and third quarter of each fiscal year on Form N-PORT beginning March 1, 2019. Prior to that date, the Trust has filed a complete list of Schedules of Portfolio Investments with the SEC for the first and third quarters of each fiscal year on Form N-Q. Forms N-PORT and Forms N-Q are available on the SEC's website at www.sec.gov.
Expense Examples
As a shareholder of the Funds, you may incur two types of costs: (1) transaction costs, including sales charges (loads) on purchases; and (2) ongoing costs, including management fees, distribution and service (12b-1) fees, and other Fund expenses. These examples are intended to help you understand your ongoing costs (in dollars) of investing in the Funds and to compare these costs with the ongoing costs of investing in other mutual funds.
These examples are based on an investment of $1,000 invested at the beginning of the period and held for the entire period from July 1, 2018 through December 31, 2018.
The Actual Expense figures in the table below provide information about actual account values and actual expenses. You may use the information below, together with the amount you invested, to estimate the expenses that you paid over the period. Simply divide your account value by $1,000 (for example, an $8,600 account value divided by $1,000 = 8.6), then multiply the result by the number in the table under the heading entitled "Actual Expenses Paid During Period" to estimate the expenses you paid on your account during this period.
The Hypothetical Expense figures in the table below provide information about hypothetical account values and hypothetical expenses based on each Fund's actual expense ratio and an assumed rate of return of 5% per year before expenses, which is not the Fund's actual return. The hypothetical account values and expenses may not be used to estimate the actual ending account balance or expenses you paid for the period. You may use this information to compare this 5% hypothetical example with the 5% hypothetical examples that appear in shareholder reports of other funds.
Please note the expenses shown in the table are meant to highlight your ongoing costs only and do not reflect any transactional costs. Therefore, the table is useful in comparing ongoing costs only, and will not help you determine the relative total costs of owning different funds. In addition, if these transactional costs were included, your costs would have been higher.
| | | Beginning
Account
Value
7/1/18 | | Actual
Ending
Account
Value
12/31/18 | | Hypothetical
Ending
Account
Value
12/31/18 | | Actual
Expenses
Paid
During
Period
7/1/18-
12/31/18* | | Hypothetical
Expenses
Paid
During
Period
7/1/18-
12/31/18* | | Annualized
Expense
Ratio
During
Period
7/1/18-
12/31/18 | |
US 500 Enhanced Volatility Wtd
Index Fund | |
Class A Shares | | $ | 1,000.00 | | | $ | 894.70 | | | $ | 1,020.21 | | | $ | 4.73 | | | $ | 5.04 | | | | 0.99 | % | |
Class C Shares | | | 1,000.00 | | | | 892.30 | | | | 1,016.43 | | | | 8.30 | | | | 8.84 | | | | 1.74 | % | |
Class I Shares | | | 1,000.00 | | | | 896.60 | | | | 1,021.48 | | | | 3.54 | | | | 3.77 | | | | 0.74 | % | |
59
Victory Portfolios II | | Supplemental Information — continued
December 31, 2018 | |
(Unaudited)
| | | Beginning
Account
Value
7/1/18 | | Actual
Ending
Account
Value
12/31/18 | | Hypothetical
Ending
Account
Value
12/31/18 | | Actual
Expenses
Paid
During
Period
7/1/18-
12/31/18* | | Hypothetical
Expenses
Paid
During
Period
7/1/18-
12/31/18* | | Annualized
Expense
Ratio
During
Period
7/1/18-
12/31/18 | |
Market Neutral Income Fund | |
Class A Shares | | $ | 1,000.00 | | | $ | 1,015.10 | | | $ | 1,021.42 | | | $ | 3.81 | | | $ | 3.82 | | | | 0.75 | % | |
Class C Shares | | | 1,000.00 | | | | 1,010.60 | | | | 1,017.64 | | | | 7.60 | | | | 7.63 | | | | 1.50 | % | |
Class I Shares | | | 1,000.00 | | | | 1,016.50 | | | | 1,023.19 | | | | 2.03 | | | | 2.04 | | | | 0.40 | % | |
* Expenses are equal to the average account value multiplied by the Fund's annualized expense ratio multiplied by 184/365 (the number of days in the most recent fiscal half-year divided by the number of days in the fiscal year).
60
Victory Portfolios II | | Supplemental Information — continued
December 31, 2018 | |
(Unaudited)
Considerations of the Board in Continuing the Investment Advisory Agreement (the "Agreement")
The Board approved the Agreement on behalf of each of the Funds at a meeting, which was called for that purpose, on December 5, 2018. The Board also considered information relating to the Funds and the Agreement provided throughout the year and, more specifically, at a meeting on October 23, 2018. In considering whether to approve the Agreement, the Board requested, and the Adviser provided, information that the Board believed to be reasonably necessary to reach its conclusions. The Board, including the Independent Trustees, evaluated this information along with other information obtained throughout the year and was advised by legal counsel to the Funds and by independent legal counsel to the Independent Trustees. In addition, in 2017 the Independent Trustees, through their counsel, retained an independent consultant to assist with a review of the overall process for conducting the annual review of these advisory arrangements. The Board considered each Fund's advisory fee, expense ratio and investment performance as significant factors in determining whether the Agreement should be continued. In considering whether the compensation paid to the Adviser was fair and reasonable, the Board also evaluated, among other things, the following factors:
• The requirements of the Funds for the services provided by the Adviser;
• The nature, quality and extent of the services provided and expected to be provided;
• The performance of the Funds as compared to comparable funds;
• The fees payable for the services and whether the fee arrangements provided for economies of scale that would benefit Fund shareholders as the Funds grow;
• Whether the fee would be sufficient to enable the Adviser to attract and retain experienced personnel and continue to provide quality services to the Funds;
• Fees paid by other clients of the Adviser whose accounts are managed in a similar investment style and any differences in the services provided to the other clients compared to those provided to the Funds;
• Total expenses of each Fund, taking into consideration any distribution or shareholder servicing fees;
* Management's commitment to operating the Funds at competitive expense levels;
• The profitability of the Adviser (as reflected by comparing fees earned against an estimate of the Adviser's costs) with respect to the Adviser's relationship with the Funds;
• Research and other service benefits received by the Adviser obtained through payment of client commissions for securities transactions;
• Other benefits received by the Adviser, and its affiliates, including revenues paid to the Adviser, or its affiliates, by the Funds for administration and fund accounting services, and distribution;
• The capabilities and financial condition of the Adviser;
• Current economic and industry trends; and
• The historical relationship between each Fund and the Adviser.
The Board reviewed each Fund's current management fee, comprised of the advisory fee plus the administrative services fee paid to the Adviser, in the context of the Adviser's profitability of each Fund individually. In addition, the Board compared each Fund's gross management fee and total operating expense ratio on a net and gross basis, taking into consideration any distribution or shareholder servicing fees, with the median gross management fee and median expense ratio of a universe of comparable mutual funds compiled by FUSE Research Network, LLC ("FUSE") and a peer group of funds with similar investment strategies selected by FUSE from the universe. The Board reviewed the factors and methodology used by FUSE in the selection of each Fund's peer group, including FUSE's selection of a broad universe of funds using the standard Retail Morningstar Categories, the more specific universe of comparable funds, and peer groups of funds with comparable investment strategies and asset levels, among other factors. The Board also reviewed any changes to FUSE's methodology as compared to the prior year, including as a result of input from the Adviser, if any. The Board noted that none of the advisory fee arrangements for the Funds included breakpoints, which are generally viewed as a method by which the investment adviser shares any economies of scale with a fund as a fund grows. The Board also considered the Adviser's commitment to limit expenses as discussed in more detail below.
61
Victory Portfolios II | | Supplemental Information — continued
December 31, 2018 | |
(Unaudited)
The Board found that the gross annual management fee paid by each Fund was within the range of management fees paid by each Fund's respective peer group. The Board also found that each Fund's Class A net annual expense ratio, taking into account any shareholder servicing or distribution fees, was reasonable as compared with each Fund's respective peer group. The Board considered the Adviser's contractual agreement with each Fund to waive its fees and reimburse expenses of certain classes for a specified period of time, as described in the Fund's prospectus.
The Board reviewed each Fund's performance over one- and three-year periods against the performance of the Fund's selected peer group and benchmark index. The Board recognized that the performance of the Funds and the peer group funds are net of expenses, while the performance of the benchmark index is gross returns. The Board considered the additional resources that the Adviser has committed to enhance portfolio analysis, compliance and trading systems.
The Board reviewed various other specific factors with respect to each Fund, as described below. In their deliberations, the Trustees did not rank the importance of any particular information or factor considered and each Trustee may have attributed different weights to various factors.
US 500 Enhanced Volatility Wtd Index Fund
Noting that the Fund commenced operations in 2012, the Board compared the Fund's Class A performance for the one- and three-year periods ended June 30, 2018, to that of the median performance of the peer group for the same periods and the benchmark index for the one-year period (benchmark index data was not available for the three-year period). The Board noted that the Fund's investment objective is to track its benchmark index before fees and expenses. The Board recognized that the performance of the Fund is net of expenses, while the performance of the benchmark index is gross returns and as a result, the Fund generally will underperform its benchmarks due to fees and expenses. The Board also considered the Fund's tracking error as a factor in evaluating performance. The Board considered the fact that the Fund underperformed the benchmark index for each of the periods reviewed, outperformed the peer group for the three- and five-year periods, and matched the peer group for the one-year period.
Having considered, among other things: (1) the Fund's management fee compared to comparable mutual funds; (2) the Fund's total expense ratio compared to comparable mutual funds; (3) that the Adviser's willingness to limit the expenses of certain classes for a period of time would provide stability to the Fund's expenses for those share classes during that period; and (4) the Fund's performance during the periods reviewed, the Board concluded that the Agreement continued to be in the best interests of the Fund's shareholders.
Market Neutral Income Fund
Noting that the Fund commenced operations in 2012, the Board compared the Fund's Class A performance for the one-, three- and five-year periods ended June 30, 2018, to that of the median performance of the peer group and benchmark index for the same periods and considered the fact that the Fund outperformed the benchmark index for all of the periods reviewed, outperformed the peer group for the one- and three-year periods, and underperformed the peer group for the five-year period.
Having considered, among other things: (1) the Fund's management fee compared to comparable mutual funds; (2) the Fund's total expense ratio compared to comparable mutual funds; (3) that the Adviser's willingness to limit the expenses of certain classes for a period of time would provide stability to the Fund's expenses for those share classes during that period; and (4) the Fund's performance during the periods reviewed, the Board concluded that the Agreement continued to be in the best interests of the Fund's shareholders.
62
Victory Portfolios II | | Supplemental Information — continued
December 31, 2018 | |
(Unaudited)
Conclusion
Based on its review of the information requested and provided, and following extended discussions, the Board determined that the Agreement, on behalf of the Funds discussed above, was consistent with the best interests of each Fund and its shareholders, and the Board unanimously approved the Agreement, on behalf of each Fund, for an additional annual period on the basis of the foregoing review and discussions and the following considerations, among others:
• The fairness and reasonableness of the investment advisory fee payable to the Adviser under the Agreement in light of the investment advisory services provided, the costs of these services, the profitability of the Adviser's relationship with the Fund and the comparability of the fee paid to the fees paid by other investment companies;
• The nature, quality and extent of the investment advisory services provided by the Adviser;
• The Adviser's entrepreneurial commitment to the management of the Funds and the creation of a broad-based family of funds, which could entail a substantial commitment of the Adviser's resources to the successful operation of the Funds;
• The Adviser's representations regarding its staffing and capabilities to manage the Funds, including the retention of personnel with relevant portfolio management experience;
• The Adviser's efforts to enhance investment results by, among other things, developing quality portfolio management teams; and
• The overall high quality of the personnel, operations, financial condition, investment management capabilities, methodologies and performance of the Adviser.
63
Privacy Policy
Protecting the Privacy of Information
The Trust respects your right to privacy. We also know that you expect us to conduct and process your business in an accurate and efficient manner. To do so, we must collect and maintain certain personal information about you. This is the information we collect from you on applications or other forms, and from the transactions you make with us or third parties. It may include your name, address, social security number, account transactions and balances, and information about investment goals and risk tolerance.
We do not disclose any information about you or about former customers to anyone except as permitted or required by law. Specifically, we may disclose the information we collect to companies that perform services on our behalf, such as the transfer agent that processes shareholder accounts and printers and mailers that assist us in the distribution of investor materials. We may also disclose this information to companies that perform marketing services on our behalf. This allows us to continue to offer you Victory investment products and services that meet your investing needs, and to effect transactions that you request or authorize. These companies will use this information only in connection with the services for which we hired them. They are not permitted to use or share this information for any other purpose.
To protect your personal information internally, we permit access only by authorized employees and maintain physical, electronic and procedural safeguards to guard your personal information.*
* You may have received communications regarding information about privacy policies from other financial institutions which gave you the opportunity to "opt-out" of certain information sharing with companies which are not affiliated with that financial institution. The Trust does not share information with other companies for purposes of marketing solicitations for products other than the Trust. Therefore, the Trust does not provide opt-out options to their shareholders.
Victory Funds
P.O. Box 182593
Columbus, Ohio 43218-2593

Visit our website at: | | Call Victory at: | |
www.vcm.com | | 800-539-FUND (800-539-3863) | |

December 31, 2018
Semi Annual Report
VictoryShares US 500 Volatility Wtd ETF
VictoryShares US Small Cap Volatility Wtd ETF
VictoryShares International Volatility Wtd ETF
VictoryShares Emerging Market Volatility Wtd ETF
VictoryShares US Large Cap High Div Volatility Wtd ETF
VictoryShares US Small Cap High Div Volatility Wtd ETF
VictoryShares International High Div Volatility Wtd ETF
VictoryShares Emerging Market High Div Volatility Wtd ETF
VictoryShares Dividend Accelerator ETF
VictoryShares US Multi-Factor Minimum Volatility ETF
VictoryShares US 500 Enhanced Volatility Wtd ETF
VictoryShares US EQ Income Enhanced Volatility Wtd ETF
VictoryShares US Discovery Enhanced Volatility Wtd ETF
VictoryShares Developed Enhanced Volatility Wtd ETF
Beginning on January 1, 2021, as permitted by regulations adopted by the Securities and Exchange Commission, paper copies of the Victory Funds' shareholder reports will no longer be sent by mail, unless you specifically request paper copies of the reports from the Victory Funds or from your financial intermediary, such as a broker-dealer or bank. Instead, the reports will be made available on www.VictoryFunds.com, and you will be notified by mail each time a report is posted and provided with a website link to access the report. If you already elected to receive shareholder reports electronically, you will not be affected by this change, and you need not take any action.
You may elect to receive shareholder reports and other communications from the Victory Funds or your financial intermediary electronically sooner than January 1, 2021 by notifying your financial intermediary directly or, if you are a direct investor, by calling 800-539-3863 or by sending an e-mail request to TA.Processing@FISGlobal.com.
You may elect to receive all future reports in paper free of charge. If you invest through a financial intermediary, you can contact your financial intermediary to request that you continue to receive paper copies of your reports. If you invest directly with the Victory Funds, you can call 800-539-3863 or send an e-mail request to TA.Processing@FISGlobal.com. Your election to receive reports in paper will apply to all Victory Funds you hold directly or through your financial intermediary.
www.vcm.com
News, Information And Education 24 Hours A Day, 7 Days A Week
The Victory Funds site gives fund shareholders, prospective shareholders, and investment professionals a convenient way to access fund information, get guidance, and track fund performance anywhere they can access the Internet. The site includes:
• Detailed performance records
• Daily share prices
• The latest fund news
• Investment resources to help you become a better investor
• A section dedicated to investment professionals
Whether you're a potential investor searching for the fund that matches your investment philosophy, a seasoned investor interested in planning tools, or an investment professional, www.vcm.com has what you seek. Visit us anytime. We're always open.
Table of Contents
Financial Statements | |
VictoryShares US 500 Volatility Wtd ETF | |
Investment Objectives and Portfolio Holdings | | | 5 | | |
Schedule of Investments | | | 9-20 | | |
Statements of Assets and Liabilities | | | 141 | | |
Statements of Operations | | | 146 | | |
Statements of Changes in Net Assets | | | 151 | | |
Financial Highlights | | | 156 | | |
VictoryShares US Small Cap Volatility Wtd ETF | |
Investment Objectives and Portfolio Holdings | | | 5 | | |
Schedule of Investments | | | 21-29 | | |
Statements of Assets and Liabilities | | | 141 | | |
Statements of Operations | | | 146 | | |
Statements of Changes in Net Assets | | | 151 | | |
Financial Highlights | | | 157 | | |
VictoryShares International Volatility Wtd ETF | |
Investment Objectives and Portfolio Holdings | | | 5 | | |
Schedule of Investments | | | 30-49 | | |
Statements of Assets and Liabilities | | | 141 | | |
Statements of Operations | | | 146 | | |
Statements of Changes in Net Assets | | | 151 | | |
Financial Highlights | | | 158 | | |
VictoryShares Emerging Market Volatility Wtd ETF | |
Investment Objectives and Portfolio Holdings | | | 5 | | |
Schedule of Investments | | | 50-68 | | |
Statements of Assets and Liabilities | | | 142 | | |
Statements of Operations | | | 147 | | |
Statements of Changes in Net Assets | | | 152 | | |
Financial Highlights | | | 159 | | |
VictoryShares US Large Cap High Div Volatility
Wtd ETF | |
Investment Objectives and Portfolio Holdings | | | 6 | | |
Schedule of Investments | | | 69-72 | | |
Statements of Assets and Liabilities | | | 142 | | |
Statements of Operations | | | 147 | | |
Statements of Changes in Net Assets | | | 152 | | |
Financial Highlights | | | 160 | | |
VictoryShares US Small Cap High Div Volatility
Wtd ETF | |
Investment Objectives and Portfolio Holdings | | | 6 | | |
Schedule of Investments | | | 73-76 | | |
Statements of Assets and Liabilities | | | 142 | | |
Statements of Operations | | | 147 | | |
Statements of Changes in Net Assets | | | 152 | | |
Financial Highlights | | | 161 | | |
1
Table of Contents (continued)
VictoryShares International High Div Volatility
Wtd ETF | |
Investment Objectives and Portfolio Holdings | | | 6 | | |
Schedule of Investments | | | 77-83 | | |
Statements of Assets and Liabilities | | | 143 | | |
Statements of Operations | | | 148 | | |
Statements of Changes in Net Assets | | | 153 | | |
Financial Highlights | | | 162 | | |
VictoryShares Emerging Market High Div Volatility
Wtd ETF | |
Investment Objectives and Portfolio Holdings | | | 6 | | |
Schedule of Investments | | | 84-89 | | |
Statements of Assets and Liabilities | | | 143 | | |
Statements of Operations | | | 148 | | |
Statements of Changes in Net Assets | | | 153 | | |
Financial Highlights | | | 163 | | |
VictoryShares Dividend Accelerator ETF | |
Investment Objectives and Portfolio Holdings | | | 7 | | |
Schedule of Investments | | | 90-92 | | |
Statements of Assets and Liabilities | | | 143 | | |
Statements of Operations | | | 148 | | |
Statements of Changes in Net Assets | | | 153 | | |
Financial Highlights | | | 164 | | |
VictoryShares US Multi-Factor Minimum
Volatility ETF | |
Investment Objectives and Portfolio Holdings | | | 7 | | |
Schedule of Investments | | | 93-95 | | |
Statements of Assets and Liabilities | | | 144 | | |
Statements of Operations | | | 149 | | |
Statements of Changes in Net Assets | | | 154 | | |
Financial Highlights | | | 165 | | |
VictoryShares US 500 Enhanced Volatility Wtd ETF | |
Investment Objectives and Portfolio Holdings | | | 7 | | |
Schedule of Investments | | | 96-107 | | |
Statements of Assets and Liabilities | | | 144 | | |
Statements of Operations | | | 149 | | |
Statements of Changes in Net Assets | | | 154 | | |
Financial Highlights | | | 166 | | |
VictoryShares US EQ Income Enhanced Volatility
Wtd ETF | |
Investment Objectives and Portfolio Holdings | | | 7 | | |
Schedule of Investments | | | 108-111 | | |
Statements of Assets and Liabilities | | | 144 | | |
Statements of Operations | | | 149 | | |
Statements of Changes in Net Assets | | | 154 | | |
Financial Highlights | | | 167 | | |
VictoryShares US Discovery Enhanced Volatility
Wtd ETF | |
Investment Objectives and Portfolio Holdings | | | 8 | | |
Schedule of Investments | | | 112-120 | | |
Statements of Assets and Liabilities | | | 145 | | |
Statements of Operations | | | 150 | | |
Statements of Changes in Net Assets | | | 155 | | |
Financial Highlights | | | 168 | | |
2
Table of Contents (continued)
VictoryShares Developed Enhanced Volatility
Wtd ETF | |
Investment Objectives and Portfolio Holdings | | | 8 | | |
Schedule of Investments | | | 121-140 | | |
Statements of Assets and Liabilities | | | 145 | | |
Statements of Operations | | | 150 | | |
Statements of Changes in Net Assets | | | 155 | | |
Financial Highlights | | | 169 | | |
Notes to Financial Statements | | | 170 | | |
Supplemental Information | | | 190 | | |
Trustee and Officer Information | | | 190 | | |
Proxy Voting and Form N-Q Information | | | 193 | | |
Expense Examples | | | 193 | | |
Advisory Contract Approval | | | 195 | | |
Privacy Policy (inside back cover) | | | |
The VictoryShares are distributed by Foreside Fund Services, LLC. Victory Capital Management Inc. is the investment adviser to the Funds and receives fees from the Funds for performing services for the Funds.
This report is not authorized for distribution to prospective investors unless preceded or accompanied by a current prospectus of the VictoryShares.
For additional information about any VictoryShares, including fees, expenses, and risks, view our prospectus online at www.vcm.com or call 866-376-7890. Read it carefully before you invest or send money.
The information in this semi annual report is based on data obtained from recognized services and sources and is believed to be reliable. Any opinions, projections, or recommendations in this report are subject to change without notice and are not intended as individual investment advice. Past investment performance of the ETFs, markets or securities mentioned herein should not be considered to be indicative of future results.
• NOT FDIC INSURED • NO BANK GUARANTEE • MAY LOSE VALUE

Call Victory at:
866-376-7890
Visit our website at:
www.vcm.com
3
This page is intentionally left blank.
4
| Victory Portfolios II | | December 31, 2018 | |
(Unaudited)
Investment Objectives & Portfolio Holdings:
(As a Percentage of Total Investments)
VictoryShares US 500 Volatility Wtd ETF
Track performance of the Nasdaq Victory US Large
Cap 500 Volatility Weighted Index before expenses. | |
Portfolio Holdings
As a Percentage of Total Investments
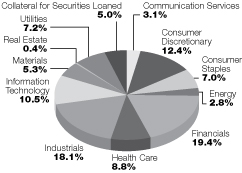
VictoryShares US Small Cap Volatility
Wtd ETF
Track performance of the Nasdaq Victory US Small
Cap 500 Volatility Weighted Index before expenses. | |
Portfolio Holdings
As a Percentage of Total Investments
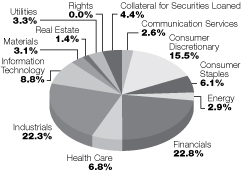
VictoryShares International Volatility
Wtd ETF
Track performance of the Nasdaq Victory
International 500 Volatility Weighted Index
before expenses. | |
Portfolio Holdings
As a Percentage of Total Investments
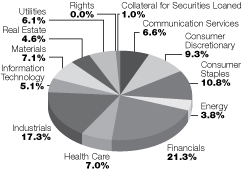
VictoryShares Emerging Market Volatility
Wtd ETF
Track performance of the Nasdaq Victory
Emerging Market 500 Volatility Weighted Index
before expenses. | |
Portfolio Holdings
As a Percentage of Total Investments

5
| Victory Portfolios II | | December 31, 2018 | |
(Unaudited)
VictoryShares US Large Cap High Div
Volatility Wtd ETF
Track performance of the Nasdaq Victory
US Large Cap High Dividend 100 Volatility
Weighted Index before expenses. | |
Portfolio Holdings
As a Percentage of Total Investments

VictoryShares US Small Cap High Div
Volatility Wtd ETF
Track performance of the Nasdaq Victory
US Small Cap High Dividend 100 Volatility
Weighted Index before expenses. | |
Portfolio Holdings
As a Percentage of Total Investments

VictoryShares International High Div
Volatility Wtd ETF
Track performance of the Nasdaq Victory
International High Dividend 100 Volatility
Weighted Index before expenses. | |
Portfolio Holdings
As a Percentage of Total Investments
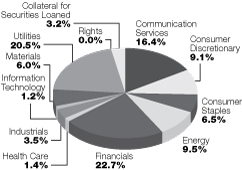
VictoryShares Emerging Market High Div
Volatility Wtd ETF
Track performance of the Nasdaq Victory
Emerging Market High Dividend 100 Volatility
Weighted Index before expenses. | |
Portfolio Holdings
As a Percentage of Total Investments
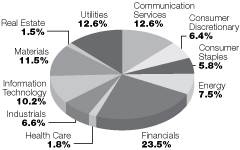
6
| Victory Portfolios II | | December 31, 2018 | |
(Unaudited)
VictoryShares Dividend Accelerator ETF
Track performance of the Nasdaq Victory
Dividend Accelerator Index
before expenses. | |
Portfolio Holdings
As a Percentage of Total Investments
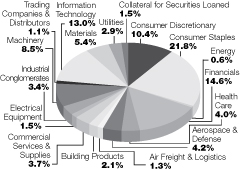
VictoryShares US Multi-Factor Minimum
Volatility ETF
Track performance of the Nasdaq Victory
US Multi-Factor Minimum Volatility Index
before expenses. | |
Portfolio Holdings
As a Percentage of Total Investments
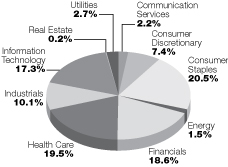
VictoryShares US 500 Enhanced
Volatility Wtd ETF
Track performance of the Nasdaq Victory
US Large Cap 500 Long/Cash Volatility Index
before expenses. | |
Portfolio Holdings
As a Percentage of Total Investments

VictoryShares US EQ Income Enhanced
Volatility Wtd ETF
Track performance of the Nasdaq Victory
US Large Cap 100 Long/Cash Volatility
Weighted Index before expenses. | |
Portfolio Holdings
As a Percentage of Total Investments
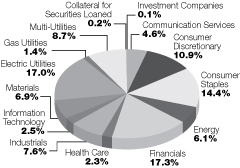
7
| Victory Portfolios II | | December 31, 2018 | |
(Unaudited)
VictoryShares US Discovery Enhanced
Volatility Wtd ETF
Track performance of the Nasdaq Victory
US Small Cap 500 Long/Cash Volatility
Weighted Index before expenses. | |
Portfolio Holdings
As a Percentage of Total Investments
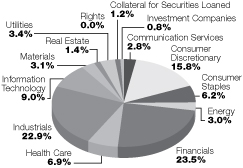
VictoryShares Developed Enhanced
Volatility Wtd ETF
Track performance of the Nasdaq Victory
International 500 Long/Cash Volatility
Weighted Index before expenses. | |
Portfolio Holdings
As a Percentage of Total Investments
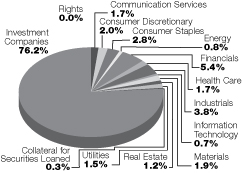
8
Victory Portfolios II
VictoryShares US 500 Volatility Wtd ETF | | Schedule of Portfolio Investments
December 31, 2018 | |
(Unaudited)
Security Description | | Shares | | Value | |
Common Stocks (99.8%) | |
Communication Services (3.1%): | |
AT&T, Inc. | | | 46,618 | | | $ | 1,330,478 | | |
Cable One, Inc. | | | 1,692 | | | | 1,387,609 | | |
Cargurus, Inc. (a) (b) | | | 13,025 | | | | 439,333 | | |
CBS Corp., Class B | | | 21,730 | | | | 950,036 | | |
CenturyLink, Inc. | | | 45,029 | | | | 682,189 | | |
Charter Communications, Inc., Class A (a) | | | 3,115 | | | | 887,682 | | |
Comcast Corp., Class A | | | 32,905 | | | | 1,120,415 | | |
DISH Network Corp. (a) | | | 22,077 | | | | 551,263 | | |
Facebook, Inc., Class A (a) | | | 4,592 | | | | 601,965 | | |
InterActive Corp. (a) | | | 4,066 | | | | 744,241 | | |
Netflix, Inc. (a) | | | 2,216 | | | | 593,135 | | |
Omnicom Group, Inc. | | | 21,857 | | | | 1,600,806 | | |
The Walt Disney Co. | | | 17,237 | | | | 1,890,036 | | |
T-Mobile US, Inc. (a) | | | 19,783 | | | | 1,258,397 | | |
Verizon Communications, Inc. | | | 31,518 | | | | 1,771,942 | | |
Viacom, Inc., Class B | | | 40,403 | | | | 1,038,357 | | |
World Wrestling Entertainment, Inc. (b) | | | 9,641 | | | | 720,376 | | |
Zayo Group Holdings, Inc. (a) | | | 41,938 | | | | 957,864 | | |
| | | | 18,526,124 | | |
Consumer Discretionary (12.8%): | |
Advance Auto Parts, Inc. | | | 6,975 | | | | 1,098,284 | | |
Amazon.com, Inc. (a) | | | 624 | | | | 937,229 | | |
American Eagle Outfitters, Inc. | | | 32,856 | | | | 635,106 | | |
Aramark | | | 34,629 | | | | 1,003,202 | | |
AutoZone, Inc. (a) | | | 1,764 | | | | 1,478,832 | | |
Best Buy Co., Inc. | | | 13,783 | | | | 729,948 | | |
Bright Horizons Family Solutions, Inc. (a) | | | 14,919 | | | | 1,662,723 | | |
Burlington Stores, Inc. (a) | | | 7,460 | | | | 1,213,518 | | |
CarMax, Inc. (a) (b) | | | 14,339 | | | | 899,485 | | |
Carter's, Inc. | | | 12,681 | | | | 1,035,023 | | |
Chipotle Mexican Grill, Inc. (a) | | | 1,456 | | | | 628,686 | | |
D.R. Horton, Inc. | | | 23,167 | | | | 802,968 | | |
Darden Restaurants, Inc. | | | 9,481 | | | | 946,773 | | |
Dollar General Corp. | | | 12,353 | | | | 1,335,113 | | |
Dollar Tree, Inc. (a) | | | 9,795 | | | | 884,684 | | |
Domino's Pizza, Inc. | | | 4,517 | | | | 1,120,171 | | |
Dunkin' Brands Group, Inc. (b) | | | 27,417 | | | | 1,757,978 | | |
Etsy, Inc. (a) | | | 13,036 | | | | 620,123 | | |
Five Below, Inc. (a) | | | 6,583 | | | | 673,573 | | |
Ford Motor Co. | | | 154,111 | | | | 1,178,949 | | |
Garmin Ltd. | | | 27,105 | | | | 1,716,289 | | |
Gentex Corp. | | | 56,365 | | | | 1,139,137 | | |
Genuine Parts Co. | | | 18,563 | | | | 1,782,419 | | |
Grand Canyon Education, Inc. (a) (b) | | | 13,331 | | | | 1,281,642 | | |
GrubHub, Inc. (a) (b) | | | 4,620 | | | | 354,862 | | |
Harley-Davidson, Inc. (b) | | | 29,159 | | | | 994,905 | | |
Hilton Worldwide Holdings, Inc. | | | 21,570 | | | | 1,548,726 | | |
See notes to financial statements.
9
Victory Portfolios II
VictoryShares US 500 Volatility Wtd ETF | | Schedule of Portfolio Investments — continued
December 31, 2018 | |
(Unaudited)
Security Description | | Shares | | Value | |
Hyatt Hotels Corp., Class A | | | 21,770 | | | $ | 1,471,652 | | |
Kohl's Corp. | | | 11,450 | | | | 759,593 | | |
L Brands, Inc. | | | 28,042 | | | | 719,838 | | |
Las Vegas Sands Corp. | | | 19,552 | | | | 1,017,682 | | |
Lear Corp. | | | 8,306 | | | | 1,020,475 | | |
Leggett & Platt, Inc. (b) | | | 33,327 | | | | 1,194,440 | | |
Lennar Corp., Class A | | | 20,181 | | | | 790,086 | | |
LKQ Corp. (a) (b) | | | 27,417 | | | | 650,605 | | |
Lowe's Co., Inc. | | | 10,612 | | | | 980,124 | | |
Macy's, Inc. | | | 20,146 | | | | 599,948 | | |
Marriott International, Inc., Class A | | | 11,750 | | | | 1,275,580 | | |
McDonald's Corp. | | | 9,700 | | | | 1,722,429 | | |
MGM Resorts International | | | 32,280 | | | | 783,113 | | |
Mohawk Industries, Inc. (a) | | | 5,026 | | | | 587,841 | | |
Newell Brands, Inc. (b) | | | 39,503 | | | | 734,361 | | |
Nordstrom, Inc. | | | 13,513 | | | | 629,841 | | |
Norwegian Cruise Line Holdings Ltd. (a) | | | 23,923 | | | | 1,014,096 | | |
NVR, Inc. (a) | | | 387 | | | | 943,115 | | |
Ollie's Bargain Outlet Holdings, Inc. (a) | | | 13,136 | | | | 873,675 | | |
O'Reilly Automotive, Inc. (a) | | | 3,317 | | | | 1,142,143 | | |
Penske Automotive Group, Inc. | | | 24,524 | | | | 988,808 | | |
Polaris Industries, Inc. (b) | | | 9,520 | | | | 729,994 | | |
Pool Corp. | | | 10,832 | | | | 1,610,177 | | |
PulteGroup, Inc. | | | 40,360 | | | | 1,048,956 | | |
PVH Corp. | | | 8,718 | | | | 810,338 | | |
Qurate Retail, Inc. (a) | | | 51,269 | | | | 1,000,771 | | |
Ross Stores, Inc. | | | 13,880 | | | | 1,154,816 | | |
Royal Caribbean Cruises Ltd. | | | 10,011 | | | | 978,976 | | |
Service Corp. International | | | 41,536 | | | | 1,672,240 | | |
Servicemaster Global Holdings, Inc. (a) | | | 38,595 | | | | 1,417,980 | | |
Stamps.com, Inc. (a) (b) | | | 3,444 | | | | 536,024 | | |
Starbucks Corp. | | | 26,696 | | | | 1,719,222 | | |
Target Corp. | | | 15,598 | | | | 1,030,872 | | |
Texas Roadhouse, Inc. (b) | | | 21,101 | | | | 1,259,730 | | |
The Gap, Inc. | | | 26,209 | | | | 675,144 | | |
The Home Depot, Inc. | | | 9,365 | | | | 1,609,093 | | |
The TJX Co., Inc. | | | 33,860 | | | | 1,514,896 | | |
Thor Industries, Inc. | | | 8,656 | | | | 450,112 | | |
Tiffany & Co. | | | 6,758 | | | | 544,087 | | |
Toll Brothers, Inc. | | | 25,346 | | | | 834,644 | | |
Tractor Supply Co. | | | 13,163 | | | | 1,098,321 | | |
Ulta Salon, Cosmetics & Fragrance, Inc. (a) | | | 4,208 | | | | 1,030,287 | | |
Urban Outfitters, Inc. (a) | | | 21,265 | | | | 705,998 | | |
Weight Watchers International, Inc. (a) | | | 9,686 | | | | 373,395 | | |
Williams-Sonoma, Inc. (b) | | | 12,171 | | | | 614,027 | | |
Yum! Brands, Inc. | | | 20,484 | | | | 1,882,888 | | |
| | | | 75,662,781 | | |
Consumer Staples (7.5%): | |
Altria Group, Inc. | | | 23,998 | | | | 1,185,261 | | |
Archer-Daniels-Midland Co. | | | 41,798 | | | | 1,712,464 | | |
See notes to financial statements.
10
Victory Portfolios II
VictoryShares US 500 Volatility Wtd ETF | | Schedule of Portfolio Investments — continued
December 31, 2018 | |
(Unaudited)
Security Description | | Shares | | Value | |
Brown-Forman Corp., Class B | | | 25,423 | | | $ | 1,209,627 | | |
Church & Dwight Co., Inc. | | | 27,078 | | | | 1,780,649 | | |
Colgate-Palmolive Co. | | | 29,572 | | | | 1,760,125 | | |
Conagra Brands, Inc. | | | 41,622 | | | | 889,046 | | |
Constellation Brands, Inc., Class A | | | 7,381 | | | | 1,187,012 | | |
Costco Wholesale Corp. | | | 8,570 | | | | 1,745,796 | | |
General Mills, Inc. | | | 28,424 | | | | 1,106,831 | | |
Hormel Foods Corp. (b) | | | 42,586 | | | | 1,817,571 | | |
Ingredion, Inc. | | | 12,816 | | | | 1,171,382 | | |
Kellogg Co. | | | 20,751 | | | | 1,183,015 | | |
Kimberly-Clark Corp. | | | 12,653 | | | | 1,441,683 | | |
Lamb Weston Holdings, Inc. | | | 24,257 | | | | 1,784,345 | | |
McCormick & Co., Inc. (b) | | | 12,703 | | | | 1,768,766 | | |
Molson Coors Brewing Co., Class B | | | 15,499 | | | | 870,424 | | |
Mondelez International, Inc., Class A | | | 39,670 | | | | 1,587,990 | | |
Monster Beverage Corp. (a) | | | 16,448 | | | | 809,571 | | |
National Beverage Corp. (b) | | | 8,333 | | | | 598,059 | | |
Nu Skin Enterprises, Inc., Class A | | | 14,493 | | | | 888,856 | | |
Philip Morris International, Inc. | | | 13,843 | | | | 924,159 | | |
Pilgrim's Pride Corp. (a) | | | 55,376 | | | | 858,882 | | |
Post Holdings, Inc. (a) | | | 13,503 | | | | 1,203,522 | | |
Sysco Corp. | | | 21,881 | | | | 1,371,063 | | |
The Clorox Co. (b) | | | 9,318 | | | | 1,436,277 | | |
The Estee Lauder Cos., Inc., Class A | | | 9,731 | | | | 1,266,003 | | |
The Hershey Co. | | | 15,558 | | | | 1,667,506 | | |
The J.M. Smucker Co. | | | 12,219 | | | | 1,142,354 | | |
The Kraft Heinz Co. | | | 22,422 | | | | 965,043 | | |
The Kroger Co. | | | 30,726 | | | | 844,965 | | |
The Procter & Gamble Co. | | | 25,426 | | | | 2,337,158 | | |
Tyson Foods, Inc., Class A | | | 21,678 | | | | 1,157,605 | | |
US Foods Holding Corp. (a) | | | 32,063 | | | | 1,014,473 | | |
Walgreens Boots Alliance, Inc. | | | 17,282 | | | | 1,180,879 | | |
| | | | 43,868,362 | | |
Energy (3.0%): | |
Apache Corp. | | | 21,037 | | | | 552,221 | | |
Centennial Resource Development, Inc. (a) (b) | | | 40,429 | | | | 445,528 | | |
Chevron Corp. | | | 13,156 | | | | 1,431,241 | | |
Cimarex Energy Co. | | | 11,320 | | | | 697,878 | | |
ConocoPhillips | | | 16,613 | | | | 1,035,821 | | |
Continental Resources, Inc. (a) (b) | | | 14,912 | | | | 599,313 | | |
Core Laboratories N.V. (b) | | | 9,182 | | | | 547,798 | | |
Diamondback Energy, Inc. | | | 6,812 | | | | 631,472 | | |
EOG Resources, Inc. | | | 10,922 | | | | 952,508 | | |
Exxon Mobil Corp. | | | 20,806 | | | | 1,418,761 | | |
HollyFrontier Corp. | | | 13,056 | | | | 667,423 | | |
Marathon Petroleum Corp. | | | 13,140 | | | | 775,391 | | |
Newfield Exploration Co. (a) | | | 30,826 | | | | 451,909 | | |
Occidental Petroleum Corp. | | | 18,102 | | | | 1,111,101 | | |
ONEOK, Inc. (b) | | | 27,111 | | | | 1,462,638 | | |
PBF Energy, Inc. | | | 19,578 | | | | 639,613 | | |
See notes to financial statements.
11
Victory Portfolios II
VictoryShares US 500 Volatility Wtd ETF | | Schedule of Portfolio Investments — continued
December 31, 2018 | |
(Unaudited)
Security Description | | Shares | | Value | |
Peabody Energy Corp. | | | 28,189 | | | $ | 859,201 | | |
Phillips 66 | | | 13,420 | | | | 1,156,133 | | |
The Williams Cos., Inc. | | | 49,372 | | | | 1,088,653 | | |
Valero Energy Corp. | | | 11,257 | | | | 843,937 | | |
| | | | 17,368,540 | | |
Financials (20.9%): | |
Affiliated Managers Group, Inc. | | | 9,208 | | | | 897,228 | | |
Aflac, Inc. | | | 48,439 | | | | 2,206,882 | | |
Ally Financial, Inc. | | | 56,662 | | | | 1,283,961 | | |
American Financial Group, Inc. | | | 18,576 | | | | 1,681,685 | | |
Ameriprise Financial, Inc. | | | 9,289 | | | | 969,493 | | |
Arthur J. Gallagher & Co. | | | 29,103 | | | | 2,144,892 | | |
Associated Banc-Corp. | | | 51,696 | | | | 1,023,064 | | |
Athene Holding Ltd., Class A (a) | | | 28,159 | | | | 1,121,573 | | |
Bank of America Corp. | | | 45,105 | | | | 1,111,387 | | |
Bank Ozk (b) | | | 31,134 | | | | 710,789 | | |
BB&T Corp. | | | 29,342 | | | | 1,271,095 | | |
BlackRock, Inc., Class A | | | 2,922 | | | | 1,147,820 | | |
BOK Financial Corp. | | | 15,848 | | | | 1,162,134 | | |
Brown & Brown, Inc. | | | 71,670 | | | | 1,975,225 | | |
CBOE Holdings, Inc. | | | 13,972 | | | | 1,366,881 | | |
Citizens Financial Group, Inc. | | | 33,355 | | | | 991,644 | | |
CME Group, Inc. | | | 9,577 | | | | 1,801,625 | | |
CNA Financial Corp. | | | 37,863 | | | | 1,671,651 | | |
Comerica, Inc. | | | 15,064 | | | | 1,034,746 | | |
Commerce Bank, Inc. (b) | | | 25,804 | | | | 1,454,571 | | |
Credit Acceptance Corp. (a) | | | 2,559 | | | | 976,924 | | |
Cullen/Frost Bankers, Inc. (b) | | | 13,739 | | | | 1,208,208 | | |
Discover Financial Services | | | 19,300 | | | | 1,138,314 | | |
E*TRADE Financial Corp. | | | 21,655 | | | | 950,221 | | |
East West Bancorp, Inc. | | | 22,401 | | | | 975,116 | | |
Eaton Vance Corp. | | | 32,660 | | | | 1,148,979 | | |
Erie Indemnity Co., Class A | | | 15,187 | | | | 2,024,579 | | |
FactSet Research Systems, Inc. (b) | | | 7,229 | | | | 1,446,740 | | |
Fifth Third BanCorp | | | 40,891 | | | | 962,165 | | |
First American Financial Corp. | | | 30,513 | | | | 1,362,100 | | |
First Citizens BancShares, Inc., Class A | | | 2,995 | | | | 1,129,265 | | |
First Republic Bank (b) | | | 17,438 | | | | 1,515,362 | | |
FNF Group | | | 41,296 | | | | 1,298,346 | | |
Green Dot Corp. (a) | | | 11,374 | | | | 904,460 | | |
Hanover Insurance Group, Inc. | | | 14,286 | | | | 1,668,176 | | |
Huntington Bancshares, Inc. | | | 95,786 | | | | 1,141,769 | | |
IBERIABANK Corp. (b) | | | 17,969 | | | | 1,155,047 | | |
Intercontinental Exchange, Inc. | | | 23,452 | | | | 1,766,639 | | |
Invesco Ltd. | | | 50,783 | | | | 850,107 | | |
JPMorgan Chase & Co. | | | 13,406 | | | | 1,308,694 | | |
Kemper Corp. | | | 13,379 | | | | 888,098 | | |
KeyCorp | | | 62,963 | | | | 930,593 | | |
Lincoln National Corp. (b) | | | 20,214 | | | | 1,037,180 | | |
Loews Corp. | | | 40,151 | | | | 1,827,674 | | |
See notes to financial statements.
12
Victory Portfolios II
VictoryShares US 500 Volatility Wtd ETF | | Schedule of Portfolio Investments — continued
December 31, 2018 | |
(Unaudited)
Security Description | | Shares | | Value | |
LPL Financial Holdings, Inc. | | | 18,135 | | | $ | 1,107,686 | | |
M&T Bank Corp. | | | 9,479 | | | | 1,356,729 | | |
MarketAxess Holdings, Inc. | | | 8,788 | | | | 1,856,991 | | |
Marsh & McLennan Co., Inc. | | | 25,969 | | | | 2,071,028 | | |
MGIC Investment Corp. (a) | | | 63,849 | | | | 667,861 | | |
Moody's Corp. | | | 9,818 | | | | 1,374,913 | | |
Morgan Stanley | | | 26,248 | | | | 1,040,733 | | |
Morningstar, Inc. | | | 12,884 | | | | 1,415,179 | | |
MSCI, Inc. | | | 9,600 | | | | 1,415,328 | | |
Nasdaq, Inc. | | | 19,772 | | | | 1,612,802 | | |
New York Community Bancorp, Inc. (b) | | | 124,634 | | | | 1,172,805 | | |
Northern Trust Corp. | | | 13,763 | | | | 1,150,449 | | |
Old Republic International Corp. | | | 89,924 | | | | 1,849,737 | | |
Onemain Holdings, Inc. (a) | | | 34,146 | | | | 829,406 | | |
PacWest Bancorp | | | 32,325 | | | | 1,075,776 | | |
People's United Financial, Inc. (b) | | | 105,774 | | | | 1,526,319 | | |
Pinnacle Financial Partners, Inc. (b) | | | 21,997 | | | | 1,014,062 | | |
Primerica, Inc. | | | 12,188 | | | | 1,190,889 | | |
Principal Financial Group, Inc. | | | 25,367 | | | | 1,120,460 | | |
Prosperity Bancshares, Inc. (b) | | | 20,547 | | | | 1,280,078 | | |
Prudential Financial, Inc. | | | 14,144 | | | | 1,153,443 | | |
Raymond James Financial, Inc. | | | 13,982 | | | | 1,040,401 | | |
Regions Financial Corp. | | | 69,413 | | | | 928,746 | | |
Reinsurance Group of America, Inc. | | | 11,461 | | | | 1,607,176 | | |
S&P Global, Inc. | | | 9,528 | | | | 1,619,188 | | |
Santander Consumer USA Holdings, Inc. | | | 45,031 | | | | 792,095 | | |
SEI Investments Co. | | | 22,613 | | | | 1,044,721 | | |
Signature Bank | | | 11,131 | | | | 1,144,378 | | |
SLM Corp. (a) | | | 126,686 | | | | 1,052,761 | | |
State Street Corp. | | | 14,331 | | | | 903,856 | | |
SunTrust Banks, Inc. | | | 20,604 | | | | 1,039,266 | | |
SVB Financial Group (a) | | | 2,675 | | | | 508,036 | | |
Synchrony Financial | | | 36,378 | | | | 853,428 | | |
Synovus Financial Corp. | | | 28,326 | | | | 906,149 | | |
T. Rowe Price Group, Inc. | | | 12,422 | | | | 1,146,799 | | |
TD Ameritrade Holding Corp. | | | 20,525 | | | | 1,004,904 | | |
Texas Capital Bancshares, Inc. (a) | | | 14,673 | | | | 749,644 | | |
The Allstate Corp. | | | 20,690 | | | | 1,709,615 | | |
The Bank of New York Mellon Corp. | | | 27,022 | | | | 1,271,926 | | |
The Charles Schwab Corp. | | | 24,200 | | | | 1,005,026 | | |
The PNC Financial Services Group, Inc. | | | 10,677 | | | | 1,248,248 | | |
The Progressive Corp. | | | 28,503 | | | | 1,719,586 | | |
The Travelers Co., Inc. | | | 14,211 | | | | 1,701,767 | | |
Torchmark Corp. | | | 20,731 | | | | 1,545,081 | | |
U.S. Bancorp | | | 33,893 | | | | 1,548,909 | | |
Umpqua Holdings Corp. | | | 65,392 | | | | 1,039,733 | | |
Unum Group | | | 25,066 | | | | 736,439 | | |
W.R. Berkley Corp. | | | 28,357 | | | | 2,095,866 | | |
Webster Financial Corp. | | | 20,699 | | | | 1,020,254 | | |
Wells Fargo & Co. | | | 26,385 | | | | 1,215,821 | | |
See notes to financial statements.
13
Victory Portfolios II
VictoryShares US 500 Volatility Wtd ETF | | Schedule of Portfolio Investments — continued
December 31, 2018 | |
(Unaudited)
Security Description | | Shares | | Value | |
Western Alliance BanCorp (a) | | | 26,060 | | | $ | 1,029,109 | | |
Wintrust Financial Corp. | | | 16,275 | | | | 1,082,125 | | |
Zions BanCorp | | | 26,911 | | | | 1,096,354 | | |
| | | | 121,333,183 | | |
Health Care (9.0%): | |
AbbVie, Inc. | | | 10,240 | | | | 944,026 | | |
ABIOMED, Inc. (a) | | | 2,138 | | | | 694,936 | | |
Align Technology, Inc. (a) | | | 2,307 | | | | 483,155 | | |
Anthem, Inc. | | | 5,916 | | | | 1,553,719 | | |
athenahealth, Inc. (a) | | | 5,802 | | | | 765,458 | | |
BIO-RAD Laboratories, Inc., Class A (a) | | | 4,146 | | | | 962,784 | | |
Bio-Techne Corp. | | | 7,221 | | | | 1,045,023 | | |
Centene Corp. (a) | | | 10,095 | | | | 1,163,954 | | |
Cerner Corp. (a) | | | 20,258 | | | | 1,062,329 | | |
Chemed Corp. | | | 5,537 | | | | 1,568,521 | | |
Cigna Corp. | | | 6,921 | | | | 1,314,436 | | |
Danaher Corp. | | | 17,362 | | | | 1,790,369 | | |
Encompass Health Corp. (b) | | | 17,921 | | | | 1,105,726 | | |
Exelixis, Inc. (a) | | | 33,892 | | | | 666,656 | | |
Globus Medical, Inc., Class A (a) | | | 24,249 | | | | 1,049,497 | | |
HCA Holdings, Inc. | | | 10,953 | | | | 1,363,101 | | |
HealthEquity, Inc. (a) (b) | | | 9,858 | | | | 588,030 | | |
Henry Schein, Inc. (a) | | | 16,116 | | | | 1,265,428 | | |
Hill-Rom Holdings, Inc. | | | 16,889 | | | | 1,495,521 | | |
Humana, Inc. | | | 5,758 | | | | 1,649,552 | | |
ICU Medical, Inc. (a) | | | 3,836 | | | | 880,861 | | |
IDEXX Laboratories, Inc. (a) | | | 4,656 | | | | 866,109 | | |
Illumina, Inc. (a) | | | 2,900 | | | | 869,797 | | |
Integra LifeSciences Holdings Corp. (a) (b) | | | 22,852 | | | | 1,030,625 | | |
IQVIA Holdings, Inc. (a) | | | 11,363 | | | | 1,320,040 | | |
Jazz Pharmaceuticals PLC (a) | | | 8,211 | | | | 1,017,836 | | |
Laboratory Corp. of America Holdings (a) | | | 10,405 | | | | 1,314,776 | | |
Masimo Corp. (a) | | | 10,519 | | | | 1,129,425 | | |
Medidata Solutions, Inc. (a) (b) | | | 11,148 | | | | 751,598 | | |
Mednax, Inc. (a) | | | 25,149 | | | | 829,917 | | |
Mettler-Toledo International, Inc. (a) | | | 2,427 | | | | 1,372,663 | | |
Mylan NV (a) | | | 27,542 | | | | 754,651 | | |
Neogen Corp. (a) | | | 15,554 | | | | 886,578 | | |
Penumbra, Inc. (a) (b) | | | 5,588 | | | | 682,854 | | |
Perrigo Co. PLC | | | 14,982 | | | | 580,553 | | |
Pfizer, Inc. | | | 51,625 | | | | 2,253,430 | | |
Quest Diagnostics, Inc. | | | 14,112 | | | | 1,175,106 | | |
Regeneron Pharmaceuticals, Inc. (a) | | | 2,764 | | | | 1,032,354 | | |
ResMed, Inc. | | | 15,864 | | | | 1,806,433 | | |
Thermo Fisher Scientific, Inc. | | | 6,964 | | | | 1,558,473 | | |
United Therapeutics Corp. (a) | | | 7,977 | | | | 868,695 | | |
UnitedHealth Group, Inc. | | | 6,407 | | | | 1,596,112 | | |
Universal Health Services, Inc., Class B | | | 11,399 | | | | 1,328,667 | | |
Veeva Systems, Inc. (a) | | | 9,268 | | | | 827,818 | | |
WellCare Health Plans, Inc. (a) | | | 4,454 | | | | 1,051,545 | | |
See notes to financial statements.
14
Victory Portfolios II
VictoryShares US 500 Volatility Wtd ETF | | Schedule of Portfolio Investments — continued
December 31, 2018 | |
(Unaudited)
Security Description | | Shares | | Value | |
Zimmer Biomet Holdings, Inc. | | | 11,778 | | | $ | 1,221,614 | | |
Zoetis, Inc. | | | 16,489 | | | | 1,410,469 | | |
| | | | 52,951,220 | | |
Industrials (19.0%): | |
3M Co. | | | 7,027 | | | | 1,338,925 | | |
A.O. Smith Corp. | | | 25,063 | | | | 1,070,190 | | |
Acuity Brands, Inc. (b) | | | 6,083 | | | | 699,241 | | |
AGCO Corp. | | | 19,864 | | | | 1,105,829 | | |
Air Lease Corp. | | | 34,979 | | | | 1,056,716 | | |
Alaska Air Group, Inc. | | | 14,235 | | | | 866,200 | | |
Allegion PLC | | | 18,429 | | | | 1,468,975 | | |
Allison Transmission Holdings, Inc. | | | 22,810 | | | | 1,001,587 | | |
AMERCO, Inc. | | | 3,437 | | | | 1,127,714 | | |
American Airlines Group, Inc. | | | 23,752 | | | | 762,677 | | |
AMETEK, Inc. | | | 21,779 | | | | 1,474,438 | | |
ASGN, Inc. (a) | | | 13,115 | | | | 714,768 | | |
C.H. Robinson Worldwide, Inc. | | | 14,155 | | | | 1,190,294 | | |
Carlisle Cos., Inc. | | | 10,790 | | | | 1,084,611 | | |
Cintas Corp. | | | 8,010 | | | | 1,345,600 | | |
Copart, Inc. (a) | | | 23,948 | | | | 1,144,235 | | |
Costar Group, Inc. (a) | | | 3,412 | | | | 1,151,004 | | |
CSX Corp. | | | 18,517 | | | | 1,150,461 | | |
Curtiss-Wright Corp. | | | 9,851 | | | | 1,005,984 | | |
Delta Air Lines, Inc. | | | 23,388 | | | | 1,167,060 | | |
Dover Corp. | | | 16,193 | | | | 1,148,893 | | |
Eaton Corp. PLC, ADR | | | 18,835 | | | | 1,293,211 | | |
EMCOR Group, Inc. | | | 17,731 | | | | 1,058,363 | | |
Emerson Electric Co. | | | 18,721 | | | | 1,118,580 | | |
Equifax, Inc. | | | 10,839 | | | | 1,009,436 | | |
Expeditors International of Washington, Inc. | | | 18,463 | | | | 1,257,145 | | |
Fastenal Co. | | | 20,117 | | | | 1,051,918 | | |
FedEx Corp. | | | 5,787 | | | | 933,617 | | |
Fortive Corp. | | | 17,496 | | | | 1,183,779 | | |
Fortune Brands Home & Security, Inc. | | | 25,837 | | | | 981,548 | | |
Gardner Denver Holdings, Inc. (a) | | | 35,522 | | | | 726,425 | | |
General Dynamics Corp. | | | 8,644 | | | | 1,358,923 | | |
Genesee & Wyoming, Inc., Class A (a) (b) | | | 17,329 | | | | 1,282,693 | | |
Graco, Inc. | | | 35,336 | | | | 1,478,811 | | |
Harris Corp. | | | 8,598 | | | | 1,157,721 | | |
HEICO Corp. | | | 13,837 | | | | 1,072,091 | | |
Hexcel Corp. | | | 25,944 | | | | 1,487,629 | | |
Hubbell, Inc. | | | 10,904 | | | | 1,083,203 | | |
Huntington Ingalls Industries, Inc. | | | 5,006 | | | | 952,692 | | |
IDEX Corp. | | | 10,202 | | | | 1,288,105 | | |
Ingersoll-Rand PLC | | | 13,812 | | | | 1,260,069 | | |
Insperity, Inc. | | | 8,067 | | | | 753,135 | | |
J.B. Hunt Transport Services, Inc. | | | 12,196 | | | | 1,134,716 | | |
Jacobs Engineering Group, Inc. | | | 16,484 | | | | 963,655 | | |
Johnson Controls International PLC | | | 34,477 | | | | 1,022,243 | | |
Kansas City Southern | | | 12,469 | | | | 1,190,166 | | |
See notes to financial statements.
15
Victory Portfolios II
VictoryShares US 500 Volatility Wtd ETF | | Schedule of Portfolio Investments — continued
December 31, 2018 | |
(Unaudited)
Security Description | | Shares | | Value | |
KAR Auction Services, Inc. | | | 30,683 | | | $ | 1,464,193 | | |
Kirby Corp. (a) | | | 14,378 | | | | 968,502 | | |
Knight-Swift Transportation Holdings, Inc. | | | 28,584 | | | | 716,601 | | |
L3 Technologies, Inc. | | | 7,651 | | | | 1,328,673 | | |
Landstar System, Inc. | | | 11,980 | | | | 1,146,127 | | |
Lennox International, Inc. | | | 6,336 | | | | 1,386,697 | | |
Lincoln Electric Holdings, Inc. | | | 15,668 | | | | 1,235,422 | | |
ManpowerGroup, Inc. | | | 11,034 | | | | 715,003 | | |
Masco Corp. | | | 36,222 | | | | 1,059,131 | | |
MSC Industrial Direct Co., Inc., Class A | | | 17,861 | | | | 1,373,868 | | |
Nordson Corp. | | | 10,225 | | | | 1,220,354 | | |
Norfolk Southern Corp. | | | 7,464 | | | | 1,116,167 | | |
Northrop Grumman Corp. | | | 4,546 | | | | 1,113,315 | | |
Old Dominion Freight Line, Inc. | | | 7,433 | | | | 917,901 | | |
Oshkosh Corp. | | | 16,116 | | | | 988,072 | | |
PACCAR, Inc. | | | 18,592 | | | | 1,062,347 | | |
Parker-Hannifin Corp. | | | 7,297 | | | | 1,088,275 | | |
Quanta Services, Inc. | | | 44,584 | | | | 1,341,978 | | |
Raytheon Co. | | | 7,976 | | | | 1,223,120 | | |
Republic Services, Inc., Class A | | | 28,903 | | | | 2,083,617 | | |
Robert Half International, Inc. | | | 17,628 | | | | 1,008,322 | | |
Rollins, Inc. (b) | | | 44,809 | | | | 1,617,605 | | |
Roper Technologies, Inc. | | | 5,300 | | | | 1,412,555 | | |
Schneider National, Inc. | | | 41,546 | | | | 775,664 | | |
Sensata Technologies Holding PLC, ADR (a) | | | 26,428 | | | | 1,185,032 | | |
Snap-on, Inc. (b) | | | 7,292 | | | | 1,059,455 | | |
Southwest Airlines Co. | | | 20,477 | | | | 951,771 | | |
Spirit Aerosystems Holdings, Inc., Class A | | | 15,521 | | | | 1,118,909 | | |
Stanley Black & Decker, Inc. | | | 9,039 | | | | 1,082,330 | | |
Stericycle, Inc. (a) | | | 19,184 | | | | 703,861 | | |
Teledyne Technologies, Inc. (a) | | | 6,209 | | | | 1,285,698 | | |
The Boeing Co. | | | 3,493 | | | | 1,126,493 | | |
The Middleby Corp. (a) (b) | | | 7,180 | | | | 737,601 | | |
Toro Co. | | | 24,726 | | | | 1,381,688 | | |
TransDigm Group, Inc. (a) | | | 4,979 | | | | 1,693,158 | | |
TransUnion | | | 19,772 | | | | 1,123,050 | | |
Trex Co., Inc. (a) | | | 8,798 | | | | 522,249 | | |
Trinity Industries, Inc. (b) | | | 58,668 | | | | 1,207,974 | | |
Union Pacific Corp. | | | 10,460 | | | | 1,445,885 | | |
United Continental Holdings, Inc. (a) | | | 13,353 | | | | 1,118,047 | | |
United Parcel Service, Inc., Class B | | | 12,462 | | | | 1,215,419 | | |
United Rentals, Inc. (a) | | | 6,197 | | | | 635,378 | | |
United Technologies Corp. | | | 14,209 | | | | 1,512,973 | | |
Verisk Analytics, Inc., Class A (a) | | | 15,807 | | | | 1,723,594 | | |
W.W. Grainger, Inc. | | | 3,117 | | | | 880,116 | | |
WABCO Holdings, Inc. (a) (b) | | | 11,782 | | | | 1,264,680 | | |
Wabtec Corp. (b) | | | 14,931 | | | | 1,048,903 | | |
Waste Management, Inc. | | | 20,894 | | | | 1,859,357 | | |
Watsco, Inc. | | | 7,422 | | | | 1,032,697 | | |
Woodward, Inc. | | | 20,171 | | | | 1,498,503 | | |
See notes to financial statements.
16
Victory Portfolios II
VictoryShares US 500 Volatility Wtd ETF | | Schedule of Portfolio Investments — continued
December 31, 2018 | |
(Unaudited)
Security Description | | Shares | | Value | |
XPO Logistics, Inc. (a) | | | 9,542 | | | $ | 544,276 | | |
Xylem, Inc. | | | 16,598 | | | | 1,107,419 | | |
| | | | 111,605,301 | | |
Information Technology (11.0%): | |
Accenture PLC, Class A | | | 8,373 | | | | 1,180,677 | | |
Adobe Systems, Inc. (a) | | | 4,541 | | | | 1,027,356 | | |
Advanced Micro Devices, Inc. (a) | | | 25,911 | | | | 478,317 | | |
Akamai Technologies, Inc. (a) | | | 15,534 | | | | 948,817 | | |
Alliance Data Systems Corp. | | | 5,355 | | | | 803,678 | | |
Analog Devices, Inc. | | | 14,286 | | | | 1,226,167 | | |
ANSYS, Inc. (a) | | | 8,598 | | | | 1,228,998 | | |
Apple, Inc. | | | 6,375 | | | | 1,005,593 | | |
Applied Materials, Inc. | | | 20,224 | | | | 662,134 | | |
Arrow Electronics, Inc. (a) | | | 18,706 | | | | 1,289,779 | | |
Aspen Technology, Inc. (a) | | | 12,318 | | | | 1,012,293 | | |
Automatic Data Processing, Inc. | | | 11,828 | | | | 1,550,887 | | |
Black Knight, Inc. (a) | | | 39,685 | | | | 1,788,206 | | |
Blackbaud, Inc. | | | 10,503 | | | | 660,639 | | |
Booz Allen Hamilton Holdings Corp. | | | 34,962 | | | | 1,575,737 | | |
Broadcom, Inc. | | | 4,373 | | | | 1,111,966 | | |
Broadridge Financial Solutions, Inc. | | | 9,890 | | | | 951,913 | | |
CACI International, Inc., Class A (a) | | | 7,040 | | | | 1,013,971 | | |
CDK Global, Inc. | | | 32,208 | | | | 1,542,120 | | |
CDW Corp. of Delaware | | | 17,482 | | | | 1,416,916 | | |
Coherent, Inc. (a) (b) | | | 3,904 | | | | 412,692 | | |
CommScope Holding Co., Inc. (a) | | | 22,950 | | | | 376,151 | | |
DXC Technology Co. | | | 16,139 | | | | 858,111 | | |
F5 Networks, Inc. (a) | | | 8,251 | | | | 1,336,909 | | |
Fair Isaac Corp. (a) | | | 6,593 | | | | 1,232,891 | | |
Fidelity National Information Services, Inc. | | | 18,460 | | | | 1,893,073 | | |
First Data Corp., Class A (a) | | | 36,795 | | | | 622,203 | | |
Fiserv, Inc. (a) (b) | | | 26,843 | | | | 1,972,693 | | |
FleetCor Technologies, Inc. (a) | | | 6,971 | | | | 1,294,654 | | |
Genpact Ltd. | | | 55,665 | | | | 1,502,398 | | |
Global Payments, Inc. | | | 12,132 | | | | 1,251,173 | | |
Hewlett Packard Enterprises Co. | | | 71,510 | | | | 944,647 | | |
HP, Inc. | | | 57,763 | | | | 1,181,831 | | |
IPG Photonics Corp. (a) (b) | | | 3,541 | | | | 401,160 | | |
Jabil Circuit, Inc. | | | 41,562 | | | | 1,030,322 | | |
Jack Henry & Associates, Inc. | | | 11,056 | | | | 1,398,805 | | |
Leidos Holdings, Inc. | | | 22,312 | | | | 1,176,289 | | |
LogMeIn, Inc. | | | 8,362 | | | | 682,088 | | |
Marvell Technology Group Ltd., ADR | | | 46,146 | | | | 747,104 | | |
Mastercard, Inc., Class A | | | 7,036 | | | | 1,327,341 | | |
Micron Technology, Inc. (a) | | | 13,095 | | | | 415,504 | | |
MKS Instruments, Inc. | | | 8,737 | | | | 564,498 | | |
Monolithic Power Systems, Inc. | | | 8,006 | | | | 930,698 | | |
Nvidia Corp. | | | 3,360 | | | | 448,560 | | |
ON Semiconductor Corp. (a) | | | 45,872 | | | | 757,347 | | |
Paychex, Inc. | | | 26,388 | | | | 1,719,178 | | |
See notes to financial statements.
17
Victory Portfolios II
VictoryShares US 500 Volatility Wtd ETF | | Schedule of Portfolio Investments — continued
December 31, 2018 | |
(Unaudited)
Security Description | | Shares | | Value | |
Paycom Software, Inc. (a) (b) | | | 4,693 | | | $ | 574,658 | | |
PayPal Holdings, Inc. (a) | | | 13,367 | | | | 1,124,031 | | |
PTC, Inc. (a) | | | 13,486 | | | | 1,117,989 | | |
Sabre Corp. | | | 44,468 | | | | 962,288 | | |
Salesforce.com, Inc. (a) | | | 8,731 | | | | 1,195,885 | | |
Seagate Technology PLC | | | 17,940 | | | | 692,305 | | |
Skyworks Solutions, Inc. | | | 13,059 | | | | 875,214 | | |
Texas Instruments, Inc. | | | 11,455 | | | | 1,082,498 | | |
The Trade Desk, Inc., Class A (a) (b) | | | 2,566 | | | | 297,810 | | |
Total System Services, Inc. | | | 17,197 | | | | 1,397,944 | | |
Tyler Technologies, Inc. (a) | | | 7,149 | | | | 1,328,427 | | |
Universal Display Corp. (b) | | | 5,125 | | | | 479,546 | | |
VeriSign, Inc. (a) | | | 10,623 | | | | 1,575,285 | | |
Visa, Inc., Class A | | | 11,755 | | | | 1,550,955 | | |
WEX, Inc. (a) | | | 7,737 | | | | 1,083,644 | | |
Xilinx, Inc. | | | 14,320 | | | | 1,219,634 | | |
| | | | 65,512,597 | | |
Materials (5.6%): | |
Air Products & Chemicals, Inc. | | | 11,305 | | | | 1,809,365 | | |
AptarGroup, Inc. | | | 17,625 | | | | 1,657,984 | | |
Ball Corp. | | | 43,969 | | | | 2,021,694 | | |
Berry Global Group, Inc. (a) | | | 32,912 | | | | 1,564,307 | | |
Celanese Corp., Series A | | | 12,082 | | | | 1,087,018 | | |
Eastman Chemical Co. | | | 15,965 | | | | 1,167,201 | | |
Ecolab, Inc. | | | 13,553 | | | | 1,997,035 | | |
FMC Corp. | | | 15,375 | | | | 1,137,135 | | |
Freeport-McMoRan, Inc. | | | 53,287 | | | | 549,389 | | |
Huntsman Corp. | | | 36,079 | | | | 695,964 | | |
International Paper Co. | | | 26,392 | | | | 1,065,181 | | |
Lyondellbasell Industries NV, Class A | | | 11,724 | | | | 974,968 | | |
Martin Marietta Materials, Inc. (b) | | | 7,086 | | | | 1,217,871 | | |
NewMarket Corp. | | | 3,768 | | | | 1,552,755 | | |
Nucor Corp. | | | 19,330 | | | | 1,001,488 | | |
Olin Corp. | | | 38,556 | | | | 775,361 | | |
Packaging Corp. of America | | | 12,799 | | | | 1,068,205 | | |
PPG Industries, Inc. | | | 14,156 | | | | 1,447,168 | | |
Reliance Steel & Aluminum Co. | | | 13,954 | | | | 993,106 | | |
RPM International, Inc. | | | 20,630 | | | | 1,212,631 | | |
Sonoco Products Co. | | | 34,558 | | | | 1,836,067 | | |
Steel Dynamics, Inc. | | | 23,148 | | | | 695,366 | | |
The Chemours Co. | | | 23,772 | | | | 670,846 | | |
The Sherwin-Williams Co. | | | 3,380 | | | | 1,329,895 | | |
U.S. Steel Corp. | | | 22,414 | | | | 408,831 | | |
Vulcan Materials Co. | | | 12,111 | | | | 1,196,567 | | |
Westlake Chemical Corp. | | | 11,566 | | | | 765,322 | | |
WestRock Co. | | | 27,355 | | | | 1,032,925 | | |
| | | | 32,931,645 | | |
See notes to financial statements.
18
Victory Portfolios II
VictoryShares US 500 Volatility Wtd ETF | | Schedule of Portfolio Investments — continued
December 31, 2018 | |
(Unaudited)
Security Description | | Shares | | Value | |
Real Estate (0.4%): | |
CBRE Group, Inc., Class A (a) | | | 35,649 | | | $ | 1,427,386 | | |
Jones Lang LaSalle, Inc. | | | 8,891 | | | | 1,125,601 | | |
| | | | 2,552,987 | | |
Utilities (7.5%): | |
Alliant Energy Corp. | | | 48,693 | | | | 2,057,279 | | |
American Electric Power Co., Inc. | | | 28,725 | | | | 2,146,907 | | |
Aqua America, Inc. (b) | | | 50,754 | | | | 1,735,279 | | |
Atmos Energy Corp. | | | 24,508 | | | | 2,272,382 | | |
Consolidated Edison, Inc. | | | 26,705 | | | | 2,041,864 | | |
Dominion Resources, Inc. | | | 26,890 | | | | 1,921,559 | | |
DTE Energy Co. | | | 19,917 | | | | 2,196,845 | | |
Duke Energy Corp. | | | 26,315 | | | | 2,270,985 | | |
Eversource Energy | | | 34,491 | | | | 2,243,295 | | |
Exelon Corp. | | | 52,267 | | | | 2,357,242 | | |
IDACORP, Inc. (b) | | | 19,753 | | | | 1,838,214 | | |
MDU Resources Group, Inc. | | | 71,203 | | | | 1,697,480 | | |
National Fuel Gas Co. (b) | | | 36,626 | | | | 1,874,519 | | |
NextEra Energy, Inc. | | | 13,673 | | | | 2,376,640 | | |
OGE Energy Corp. (b) | | | 56,453 | | | | 2,212,393 | | |
Pinnacle West Capital Corp. | | | 26,642 | | | | 2,269,898 | | |
PPL Corp. | | | 55,943 | | | | 1,584,865 | | |
Public Service Enterprise Group, Inc. | | | 39,203 | | | | 2,040,516 | | |
UGI Corp. | | | 43,835 | | | | 2,338,597 | | |
WEC Energy Group, Inc. | | | 31,675 | | | | 2,193,811 | | |
Xcel Energy, Inc. | | | 41,876 | | | | 2,063,231 | | |
| | | | 43,733,801 | | |
Total Common Stocks (Cost $641,332,520) | | | 586,046,541 | | |
Collateral for Securities Loaned^ (5.3%) | |
BlackRock Liquidity Funds TempFund Portfolio, Institutional Class, 2.49% (c) | | | 5,879,599 | | | | 5,879,599 | | |
Fidelity Investments Money Market Government Portfolio, Class I, 2.28% (c) | | | 8,495,738 | | | | 8,495,738 | | |
Fidelity Investments Prime Money Market Portfolio, Class I, 2.46% (c) | | | 262,350 | | | | 262,350 | | |
Goldman Sachs Financial Square Prime Obligations Fund, Institutional Class,
2.55% (c) | | | 3,266,480 | | | | 3,266,480 | | |
JPMorgan Prime Money Market Fund, Capital Class, 2.49% (c) | | | 5,226,042 | | | | 5,226,042 | | |
Morgan Stanley Institutional Liquidity Prime Portfolio, Institutional Class,
2.58% (c) | | | 7,839,552 | | | | 7,839,552 | | |
Total Collateral for Securities Loaned (Cost $30,969,761) | | | 30,969,761 | | |
Total Investments (Cost $672,302,281) — 105.1% | | | 617,016,302 | | |
Liabilities in excess of other assets — (5.1)% | | | (30,109,001 | ) | |
NET ASSETS — 100.00% | | $ | 586,907,301 | | |
^ Purchased with cash collateral from securities on loan.
(a) Non-income producing security.
(b) All or a portion of this security is on loan.
(c) Rate disclosed is the daily yield on December 31, 2018.
See notes to financial statements.
19
Victory Portfolios II
VictoryShares US 500 Volatility Wtd ETF | | Schedule of Portfolio Investments — continued
December 31, 2018 | |
(Unaudited)
ADR — American Depositary Receipt
PLC — Public Limited Company
Futures Contracts Purchased
| | | Number
of
Contracts | | Expiration
Date | | Notional
Amount | | Value | | Unrealized
Appreciation
(Depreciation) | |
E-Mini S&P 500 Futures | | | 3 | | | 3/15/19 | | $ | 370,975 | | | $ | 375,780 | | | $ | 4,805 | | |
| | | Total unrealized appreciation | | | | | | | | $ | 4,805 | | |
| | | Total unrealized depreciation | | | | | | | | | — | | |
| | | Total net unrealized appreciation(depreciation) | | | | | | | | $ | 4,805 | | |
See notes to financial statements.
20
Victory Portfolios II
VictoryShares US Small Cap Volatility Wtd ETF | | Schedule of Portfolio Investments
December 31, 2018 | |
(Unaudited)
Security Description | | Shares | | Value | |
Common Stocks (99.1%) | |
Communication Services (2.8%): | |
Cars.com, Inc. (a) | | | 3,323 | | | $ | 71,444 | | |
Emerald Expositions Events, Inc. | | | 6,239 | | | | 76,989 | | |
Gray Television, Inc. (a) | | | 3,935 | | | | 58,002 | | |
Loral Space & Communications, Inc. (a) | | | 3,443 | | | | 128,251 | | |
Marcus Corp. | | | 2,967 | | | | 117,197 | | |
MSG Networks, Inc., Class A (a) | | | 3,896 | | | | 91,790 | | |
QuinStreet, Inc. (a) | | | 3,482 | | | | 56,513 | | |
Shenandoah Telecommunications Co. | | | 2,511 | | | | 111,112 | | |
Sinclair Broadcast Group, Inc., Class A | | | 2,988 | | | | 78,704 | | |
Techtarget, Inc. (a) | | | 2,965 | | | | 36,203 | | |
TEGNA, Inc. | | | 8,022 | | | | 87,199 | | |
| | | | 913,404 | | |
Consumer Discretionary (16.0%): | |
Acushnet Holdings Corp. | | | 4,477 | | | | 94,331 | | |
American Axle & Manufacturing Holdings, Inc. (a) | | | 5,060 | | | | 56,166 | | |
American Outdoor Brands Corp. (a) | | | 3,273 | | | | 42,091 | | |
American Public Education, Inc. (a) | | | 1,506 | | | | 42,861 | | |
America's Car-Mart, Inc./TX (a) | | | 893 | | | | 64,698 | | |
Asbury Automotive Group, Inc. (a) | | | 1,609 | | | | 107,255 | | |
Bed Bath & Beyond, Inc. | | | 4,215 | | | | 47,714 | | |
Big Lots, Inc. | | | 2,179 | | | | 63,017 | | |
BJ's Restaurants, Inc. | | | 1,186 | | | | 59,976 | | |
Bloomin' Brands, Inc. | | | 6,217 | | | | 111,222 | | |
Bluegreen Vacations Corp. (b) | | | 4,061 | | | | 52,509 | | |
Bojangles', Inc. (a) | | | 7,107 | | | | 114,281 | | |
Boot Barn Holdings, Inc. (a) | | | 2,312 | | | | 39,373 | | |
Brinker International, Inc. | | | 2,285 | | | | 100,494 | | |
Caleres, Inc. | | | 2,448 | | | | 68,128 | | |
Carriage Services, Inc. | | | 7,630 | | | | 118,265 | | |
Cavco Industries, Inc. (a) | | | 371 | | | | 48,371 | | |
Century Communities, Inc. (a) | | | 3,143 | | | | 54,248 | | |
Chico's FAS, Inc. | | | 7,281 | | | | 40,919 | | |
Chuy's Holdings, Inc. (a) | | | 3,088 | | | | 54,781 | | |
Citi Trends, Inc. | | | 2,510 | | | | 51,179 | | |
Conn's, Inc. (a) | | | 1,236 | | | | 23,311 | | |
Cooper-Standard Holding (a) | | | 921 | | | | 57,213 | | |
Dave & Buster's Entertainment, Inc. | | | 1,467 | | | | 65,370 | | |
Denny's Corp. (a) | | | 7,242 | | | | 117,393 | | |
Dorman Products, Inc. (a) | | | 1,669 | | | | 150,243 | | |
Ethan Allen Interiors, Inc. | | | 5,802 | | | | 102,057 | | |
Express, Inc. (a) | | | 6,028 | | | | 30,803 | | |
Fox Factory Holding Corp. (a) | | | 1,113 | | | | 65,522 | | |
Funko, Inc. (a) | | | 2,439 | | | | 32,073 | | |
Group 1 Automotive, Inc. | | | 1,076 | | | | 56,727 | | |
Haverty Furniture Cos., Inc. | | | 4,931 | | | | 92,604 | | |
Hooker Furniture Corp. | | | 1,979 | | | | 52,127 | | |
Installed Building Products, Inc. (a) | | | 1,628 | | | | 54,847 | | |
See notes to financial statements.
21
Victory Portfolios II
VictoryShares US Small Cap Volatility Wtd ETF | | Schedule of Portfolio Investments — continued
December 31, 2018 | |
(Unaudited)
Security Description | | Shares | | Value | |
International Speedway Corp., Class A | | | 3,957 | | | $ | 173,554 | | |
J. Jill, Inc. (a) | | | 6,575 | | | | 35,045 | | |
Jack in the Box, Inc. | | | 1,367 | | | | 106,120 | | |
Johnson Outdoors, Inc., A | | | 700 | | | | 41,118 | | |
La-Z-Boy, Inc. | | | 2,709 | | | | 75,066 | | |
LCI Industries | | | 865 | | | | 57,782 | | |
LGI Homes, Inc. (a) (b) | | | 1,251 | | | | 56,570 | | |
Lithia Motors, Inc. | | | 1,350 | | | | 103,046 | | |
M/I Homes, Inc. (a) | | | 4,199 | | | | 88,263 | | |
MarineMax, Inc. (a) | | | 2,528 | | | | 46,288 | | |
Mastercraft Boat Holdings, Inc. (a) | | | 3,572 | | | | 66,796 | | |
MDC Holdings, Inc. | | | 3,290 | | | | 92,482 | | |
Meritage Homes Corp. (a) | | | 2,268 | | | | 83,281 | | |
Michaels Cos., Inc. (a) | | | 4,388 | | | | 59,414 | | |
Monarch Casino & Resort, Inc. (a) | | | 3,102 | | | | 118,310 | | |
Monro Muffler Brake, Inc. (b) | | | 1,236 | | | | 84,975 | | |
Murphy USA, Inc. (a) | | | 1,351 | | | | 103,540 | | |
Nautilus, Inc. (a) | | | 5,683 | | | | 61,945 | | |
Nutrisystem, Inc. | | | 1,860 | | | | 81,617 | | |
Oxford Industries, Inc. | | | 1,345 | | | | 95,549 | | |
Papa John's International, Inc. (b) | | | 1,688 | | | | 67,199 | | |
PetMed Express, Inc. | | | 2,013 | | | | 46,822 | | |
Ruth's Hospitality Group, Inc. | | | 3,099 | | | | 70,440 | | |
Sally Beauty Holdings, Inc. (a) | | | 5,479 | | | | 93,417 | | |
Sleep Number Corp. (a) | | | 2,592 | | | | 82,244 | | |
Stoneridge, Inc. (a) | | | 2,398 | | | | 59,111 | | |
Sturm Ruger & Co. | | | 1,688 | | | | 89,835 | | |
Taylor Morrison Home Corp., Class A (a) | | | 5,255 | | | | 83,555 | | |
Tenneco, Inc. | | | 2,319 | | | | 63,517 | | |
The Buckle, Inc. (b) | | | 2,985 | | | | 57,730 | | |
The Cheesecake Factory, Inc. (b) | | | 1,984 | | | | 86,324 | | |
Tilly's, Inc. | | | 2,596 | | | | 28,193 | | |
Topbuild Corp. (a) | | | 1,420 | | | | 63,900 | | |
TRI Pointe Group, Inc. (a) | | | 6,419 | | | | 70,160 | | |
Unifi, Inc. (a) | | | 3,729 | | | | 85,170 | | |
William Lyon Homes, Class A (a) | | | 4,903 | | | | 52,413 | | |
Wingstop, Inc. | | | 1,217 | | | | 78,119 | | |
Winnebago Industries, Inc. | | | 1,757 | | | | 42,537 | | |
Zagg, Inc. (a) | | | 3,146 | | | | 30,768 | | |
| | | | 5,214,384 | | |
Consumer Staples (6.3%): | |
B&G Foods, Inc. (b) | | | 2,401 | | | | 69,413 | | |
Calavo Growers, Inc. (b) | | | 1,066 | | | | 77,775 | | |
Central Garden & Pet Co., Class A (a) | | | 3,444 | | | | 107,625 | | |
Chefs' Warehouse, Inc. (a) | | | 3,039 | | | | 97,187 | | |
Craft Brew Alliance, Inc. (a) | | | 6,406 | | | | 91,670 | | |
Elf Beauty, Inc. (a) | | | 3,689 | | | | 31,947 | | |
Hostess Brands, Inc. (a) | | | 6,503 | | | | 71,143 | | |
Ingles Markets, Inc., Class A | | | 2,337 | | | | 63,613 | | |
Inter Parfums, Inc. (b) | | | 1,757 | | | | 115,206 | | |
See notes to financial statements.
22
Victory Portfolios II
VictoryShares US Small Cap Volatility Wtd ETF | | Schedule of Portfolio Investments — continued
December 31, 2018 | |
(Unaudited)
Security Description | | Shares | | Value | |
J&J Snack Foods Corp. | | | 1,093 | | | $ | 158,037 | | |
John B. Sanfilippo & Son, Inc. | | | 1,513 | | | | 84,214 | | |
Medifast, Inc. | | | 195 | | | | 24,379 | | |
MGP Ingredients, Inc. (b) | | | 953 | | | | 54,369 | | |
Natural Grocers By Vitamin Cottage, Inc. (a) | | | 2,164 | | | | 33,174 | | |
PriceSmart, Inc. | | | 1,497 | | | | 88,473 | | |
Primo Water Corp. (a) | | | 5,026 | | | | 70,414 | | |
Sanderson Farms, Inc. | | | 949 | | | | 94,226 | | |
The Simply Good Foods Co. (a) | | | 6,185 | | | | 116,897 | | |
Tootsie Roll Industries, Inc. (b) | | | 5,728 | | | | 191,314 | | |
Turning Point Brands, Inc. | | | 2,305 | | | | 62,742 | | |
United Natural Foods, Inc. (a) | | | 2,271 | | | | 24,050 | | |
Universal Corp. | | | 1,015 | | | | 54,962 | | |
Vector Group Ltd. | | | 10,674 | | | | 103,858 | | |
WD-40 Co. | | | 926 | | | | 169,699 | | |
| | | | 2,056,387 | | |
Energy (3.0%): | |
Arch Coal, Inc. | | | 932 | | | | 77,347 | | |
C&j Energy Services, Inc. (a) | | | 3,490 | | | | 47,115 | | |
Callon Petroleum Co. (a) | | | 6,310 | | | | 40,952 | | |
Denbury Resources, Inc. (a) | | | 8,834 | | | | 15,106 | | |
Earthstone Energy, Inc., Class A (a) | | | 7,984 | | | | 36,088 | | |
Evolution Petroleum Corp. | | | 9,723 | | | | 66,311 | | |
Exterran Corp. (a) | | | 3,745 | | | | 66,287 | | |
Gulfport Energy Corp. (a) | | | 5,402 | | | | 35,383 | | |
Laredo Petroleum, Inc. (a) | | | 7,395 | | | | 26,770 | | |
Newpark Resources, Inc. (a) | | | 7,336 | | | | 50,398 | | |
Par Pacific Holdings, Inc. (a) | | | 4,407 | | | | 62,491 | | |
Propetro Holding Corp. (a) | | | 4,225 | | | | 52,052 | | |
Rex American Resources Corp. (a) | | | 1,299 | | | | 88,474 | | |
RPC, Inc. (b) | | | 5,282 | | | | 52,133 | | |
SEACOR Smit, Inc. (a) | | | 2,371 | | | | 87,728 | | |
Smart Sand, Inc. (a) (b) | | | 9,813 | | | | 21,785 | | |
Solaris Oilfield Infrastructure, Inc., Class A | | | 3,678 | | | | 44,467 | | |
SRC Energy, Inc. (a) | | | 8,170 | | | | 38,399 | | |
U.S. Silica Holdings, Inc. (b) | | | 3,868 | | | | 39,376 | | |
Unit Corp. (a) | | | 2,091 | | | | 29,859 | | |
| | | | 978,521 | | |
Financials (23.8%): | |
1st Source Corp. | | | 2,886 | | | | 116,421 | | |
Ameris Bancorp | | | 2,790 | | | | 88,359 | | |
AMERISAFE, Inc. | | | 2,334 | | | | 132,314 | | |
Axos Financial, Inc. (a) (b) | | | 2,657 | | | | 66,903 | | |
BancFirst Corp. | | | 2,287 | | | | 114,121 | | |
Brookline BanCorp, Inc. | | | 9,669 | | | | 133,626 | | |
Capitol Federal Financial, Inc. | | | 18,523 | | | | 236,539 | | |
Centerstate Banks, Inc. | | | 4,917 | | | | 103,454 | | |
City Holding Co. | | | 2,004 | | | | 135,450 | | |
Cohen & Steers, Inc. | | | 3,805 | | | | 130,587 | | |
See notes to financial statements.
23
Victory Portfolios II
VictoryShares US Small Cap Volatility Wtd ETF | | Schedule of Portfolio Investments — continued
December 31, 2018 | |
(Unaudited)
Security Description | | Shares | | Value | |
Eagle Bancorp, Inc. (a) | | | 2,669 | | | $ | 130,007 | | |
Employers Holdings, Inc. | | | 3,388 | | | | 142,194 | | |
Enterprise Financial Services Corp. | | | 3,424 | | | | 128,845 | | |
FB Financial Corp. | | | 3,564 | | | | 124,811 | | |
FBL Financial Group, Inc., Class A | | | 1,608 | | | | 105,565 | | |
Federated Investors, Inc., Class B | | | 4,433 | | | | 117,696 | | |
First BanCorp | | | 3,686 | | | | 120,385 | | |
First Busey Corp. | | | 5,506 | | | | 135,117 | | |
First Commonwealth Financial Corp. | | | 9,289 | | | | 112,211 | | |
First Interstate BancSystem, Inc., Class A | | | 3,870 | | | | 141,487 | | |
First Merchants Corp. | | | 3,077 | | | | 105,449 | | |
First Midwest Bancorp, Inc. | | | 5,788 | | | | 114,660 | | |
Great Western BanCorp, Inc. | | | 3,397 | | | | 106,156 | | |
Heartland Financial USA, Inc. | | | 2,980 | | | | 130,971 | | |
Heritage Financial Corp. | | | 3,742 | | | | 111,212 | | |
Hilltop Holdings, Inc. | | | 6,178 | | | | 110,154 | | |
Hope Bancorp, Inc. | | | 8,010 | | | | 94,999 | | |
Horace Mann Educators Corp. | | | 3,391 | | | | 126,993 | | |
Independent Bank Corp. | | | 1,529 | | | | 107,504 | | |
Independent Bank Group, Inc. | | | 2,002 | | | | 91,632 | | |
James River Group Holdings Ltd. | | | 3,621 | | | | 132,311 | | |
Kearny Financial Corp. | | | 11,045 | | | | 141,597 | | |
Kinsale Capital Group, Inc. | | | 2,159 | | | | 119,954 | | |
Lakeland Financial Corp. | | | 3,640 | | | | 146,182 | | |
LegacyTexas Financial Group, Inc. | | | 2,542 | | | | 81,573 | | |
Legg Mason, Inc. | | | 3,909 | | | | 99,719 | | |
NBT Bancorp, Inc. | | | 4,178 | | | | 144,517 | | |
Nelnet, Inc., Class A | | | 2,455 | | | | 128,494 | | |
Northwest Bancshares, Inc. | | | 11,735 | | | | 198,791 | | |
Oceanfirst Financial Corp. | | | 6,581 | | | | 148,138 | | |
Pacific Premier Bancorp, Inc. (a) | | | 3,466 | | | | 88,452 | | |
Park National Corp. | | | 1,483 | | | | 125,981 | | |
PRA Group, Inc. (a) | | | 2,772 | | | | 67,554 | | |
ProAssurance Corp. | | | 2,271 | | | | 92,112 | | |
Provident Financial Services, Inc. | | | 7,153 | | | | 172,602 | | |
Renasant Corp. | | | 3,630 | | | | 109,553 | | |
S&T Bancorp, Inc. | | | 3,399 | | | | 128,618 | | |
Safety Insurance Group, Inc. | | | 1,919 | | | | 156,994 | | |
Sandy Spring BanCorp | | | 4,453 | | | | 139,557 | | |
Seacoast Banking Corp. of Florida (a) | | | 3,894 | | | | 101,322 | | |
ServisFirst Bancshares, Inc. | | | 3,282 | | | | 104,597 | | |
Simmons First National Corp., Class A | | | 4,481 | | | | 108,127 | | |
Southside Bancshares, Inc. | | | 4,735 | | | | 150,336 | | |
Tompkins Financial Corp. | | | 1,764 | | | | 132,318 | | |
Towne Bank | | | 5,697 | | | | 136,443 | | |
Trustmark Corp. (b) | | | 4,662 | | | | 132,541 | | |
Union Bankshares Corp. | | | 3,658 | | | | 103,265 | | |
Universal Insurance Holdings, Inc. | | | 2,629 | | | | 99,692 | | |
Waddell & Reed Financial, Inc., Class A (b) | | | 4,870 | | | | 88,050 | | |
Walker & Dunlop, Inc. | | | 2,205 | | | | 95,366 | | |
See notes to financial statements.
24
Victory Portfolios II
VictoryShares US Small Cap Volatility Wtd ETF | | Schedule of Portfolio Investments — continued
December 31, 2018 | |
(Unaudited)
Security Description | | Shares | | Value | |
Washington Federal, Inc. | | | 5,056 | | | $ | 135,046 | | |
WesBanco, Inc. | | | 3,324 | | | | 121,958 | | |
Westamerica BanCorp | | | 2,382 | | | | 132,630 | | |
WisdomTree Investments, Inc. | | | 11,653 | | | | 77,492 | | |
| | | | 7,757,704 | | |
Health Care (7.1%): | |
Addus HomeCare Corp. (a) | | | 1,530 | | | | 103,856 | | |
AMN Healthcare Services, Inc. (a) | | | 1,291 | | | | 73,148 | | |
Atrion Corp. | | | 175 | | | | 129,689 | | |
Cambrex Corp. (a) (b) | | | 1,609 | | | | 60,756 | | |
CONMED Corp. | | | 1,979 | | | | 127,052 | | |
Corcept Therapeutics, Inc. (a) (b) | | | 4,332 | | | | 57,876 | | |
CorVel Corp. (a) | | | 1,872 | | | | 115,540 | | |
Eagle Pharmaceuticals, Inc. (a) | | | 1,087 | | | | 43,795 | | |
Enanta Pharmaceuticals, Inc. (a) | | | 670 | | | | 47,456 | | |
Innoviva, Inc. (a) | | | 7,525 | | | | 131,311 | | |
Integer Holdings Corp. (a) | | | 1,336 | | | | 101,883 | | |
Lantheus Holdings, Inc. (a) | | | 3,696 | | | | 57,842 | | |
Lemaitre Vascular, Inc. | | | 2,239 | | | | 52,930 | | |
Magellan Health, Inc. (a) | | | 874 | | | | 49,722 | | |
Medpace Holdings, Inc. (a) | | | 1,012 | | | | 53,565 | | |
Meridian Bioscience, Inc. | | | 9,655 | | | | 167,612 | | |
Omnicell, Inc. (a) | | | 1,607 | | | | 98,413 | | |
Orthofix Medical, Inc. (a) | | | 1,672 | | | | 87,763 | | |
Phibro Animal Health Corp., Class A | | | 2,420 | | | | 77,827 | | |
Repligen Corp. (a) | | | 2,446 | | | | 129,002 | | |
Select Medical Holdings Corp. (a) | | | 5,849 | | | | 89,782 | | |
Supernus Pharmaceuticals, Inc. (a) | | | 1,696 | | | | 56,341 | | |
The Ensign Group, Inc. | | | 2,841 | | | | 110,202 | | |
Tivity Health, Inc. (a) | | | 3,850 | | | | 95,519 | | |
US Physical Therapy, Inc. | | | 1,009 | | | | 103,271 | | |
Varex Imaging Corp. (a) | | | 2,299 | | | | 54,440 | | |
| | | | 2,276,593 | | |
Industrials (23.1%): | |
AAON, Inc. (b) | | | 2,874 | | | | 100,762 | | |
Acco Brands Corp. | | | 10,073 | | | | 68,295 | | |
Advanced Disposal Services, Inc. (a) | | | 7,441 | | | | 178,137 | | |
Aircastle Ltd. | | | 6,296 | | | | 108,543 | | |
Alamo Group, Inc. | | | 1,264 | | | | 97,732 | | |
Albany International Corp., Class A | | | 1,316 | | | | 82,158 | | |
Allegiant Travel Co. | | | 602 | | | | 60,333 | | |
Altra Industrial Motion Corp. | | | 3,316 | | | | 83,397 | | |
American Woodmark Corp. (a) | | | 814 | | | | 45,324 | | |
Apogee Enterprises, Inc. | | | 2,043 | | | | 60,984 | | |
Applied Industrial Technologies, Inc. | | | 1,611 | | | | 86,897 | | |
ArcBest Corp. | | | 1,192 | | | | 40,838 | | |
Atkore International Group, Inc. (a) | | | 3,311 | | | | 65,690 | | |
BMC Stock Holdings, Inc. (a) | | | 4,246 | | | | 65,728 | | |
Brady Corp., Class A | | | 3,798 | | | | 165,060 | | |
See notes to financial statements.
25
Victory Portfolios II
VictoryShares US Small Cap Volatility Wtd ETF | | Schedule of Portfolio Investments — continued
December 31, 2018 | |
(Unaudited)
Security Description | | Shares | | Value | |
CBIZ, Inc. (a) | | | 7,486 | | | $ | 147,474 | | |
Chart Industries, Inc. (a) | | | 1,164 | | | | 75,695 | | |
Comfort Systems USA, Inc. | | | 2,130 | | | | 93,038 | | |
Continental Building Products, Inc. (a) | | | 3,418 | | | | 86,988 | | |
Deluxe Corp. | | | 2,717 | | | | 104,441 | | |
DXP Enterprise, Inc. (a) | | | 1,493 | | | | 41,565 | | |
Dycom Industries, Inc. (a) | | | 714 | | | | 38,585 | | |
Echo Global Logistics, Inc. (a) | | | 3,131 | | | | 63,653 | | |
Encore Wire Corp. | | | 2,367 | | | | 118,776 | | |
EnPro Industries, Inc. | | | 1,508 | | | | 90,631 | | |
ESCO Technologies, Inc. | | | 2,260 | | | | 149,046 | | |
Federal Signal Corp. | | | 3,485 | | | | 69,352 | | |
Forward Air Corp. | | | 2,075 | | | | 113,814 | | |
Franklin Electric Co., Inc. | | | 2,331 | | | | 99,953 | | |
FTI Consulting, Inc. (a) | | | 1,397 | | | | 93,096 | | |
Gibraltar Industries, Inc. (a) | | | 2,170 | | | | 77,230 | | |
Global Brass & Copper Holdings, Inc. | | | 2,470 | | | | 62,121 | | |
GMS, Inc. (a) (b) | | | 3,191 | | | | 47,418 | | |
Gorman-Rupp Co. | | | 4,247 | | | | 137,644 | | |
H&E Equipment Services, Inc. | | | 2,048 | | | | 41,820 | | |
Hawaiian Holdings, Inc. | | | 2,132 | | | | 56,306 | | |
Heartland Express, Inc. | | | 5,592 | | | | 102,334 | | |
Herman Miller, Inc. | | | 2,527 | | | | 76,442 | | |
HNI Corp. | | | 2,423 | | | | 85,847 | | |
Hub Group, Inc., Class A (a) | | | 1,928 | | | | 71,471 | | |
ICF International, Inc. | | | 1,697 | | | | 109,932 | | |
Insteel Industries, Inc. | | | 2,192 | | | | 53,222 | | |
Interface, Inc. | | | 5,301 | | | | 75,539 | | |
Kadant, Inc. | | | 1,478 | | | | 120,398 | | |
Kaman Corp., Class A | | | 2,197 | | | | 123,231 | | |
KBR, Inc. | | | 5,354 | | | | 81,274 | | |
Kforce, Inc. | | | 2,313 | | | | 71,518 | | |
Kimball International, Inc., Class B | | | 9,186 | | | | 130,349 | | |
Knoll, Inc. | | | 5,633 | | | | 92,832 | | |
Lindsay Corp. | | | 1,384 | | | | 133,210 | | |
Lydall, Inc. (a) | | | 2,655 | | | | 53,923 | | |
Marten Transport Ltd. | | | 4,355 | | | | 70,507 | | |
Matson, Inc. | | | 3,566 | | | | 114,183 | | |
Matthews International Corp., Class A (b) | | | 2,675 | | | | 108,659 | | |
McGrath RentCorp | | | 2,437 | | | | 125,457 | | |
Mercury Systems, Inc. (a) (b) | | | 1,209 | | | | 57,174 | | |
Milacron Holdings Corp. (a) | | | 5,686 | | | | 67,607 | | |
Mobile Mini, Inc. | | | 2,257 | | | | 71,660 | | |
Moog, Inc., Class A | | | 1,431 | | | | 110,874 | | |
Mueller Industries, Inc. | | | 3,983 | | | | 93,043 | | |
Mueller Water Products, Inc., Class A | | | 9,643 | | | | 87,751 | | |
Multi-Color Corp. (b) | | | 1,696 | | | | 59,513 | | |
National Presto Industries, Inc. (b) | | | 922 | | | | 107,800 | | |
Navigant Consulting, Inc. | | | 4,262 | | | | 102,501 | | |
NV5 Global, Inc. (a) | | | 760 | | | | 46,018 | | |
See notes to financial statements.
26
Victory Portfolios II
VictoryShares US Small Cap Volatility Wtd ETF | | Schedule of Portfolio Investments — continued
December 31, 2018 | |
(Unaudited)
Security Description | | Shares | | Value | |
Patrick Industries, Inc. (a) | | | 1,163 | | | $ | 34,436 | | |
PGT, Inc. (a) | | | 4,049 | | | | 64,177 | | |
Pitney Bowes, Inc. | | | 13,077 | | | | 77,285 | | |
Primoris Services Corp. (b) | | | 5,126 | | | | 98,060 | | |
Raven Industries, Inc. | | | 1,609 | | | | 58,230 | | |
REV Group, Inc. | | | 3,976 | | | | 29,860 | | |
Rush Enterprises, Inc., Class A | | | 2,575 | | | | 88,786 | | |
Saia, Inc. (a) | | | 1,257 | | | | 70,166 | | |
SP Plus Corp. (a) | | | 3,950 | | | | 116,683 | | |
SPX Corp. (a) | | | 4,060 | | | | 113,721 | | |
SPX Flow, Inc. (a) | | | 1,929 | | | | 58,680 | | |
Steelcase, Inc., Class A | | | 7,520 | | | | 111,522 | | |
Sun Hydraulics Corp. | | | 2,115 | | | | 70,197 | | |
Sunrun, Inc. (a) | | | 4,132 | | | | 44,997 | | |
Systemax, Inc. | | | 2,618 | | | | 62,544 | | |
The Greenbrier Cos., Inc. | | | 1,759 | | | | 69,551 | | |
Thermon Group Holdings, Inc. (a) | | | 4,413 | | | | 89,496 | | |
TrueBlue, Inc. (a) | | | 3,434 | | | | 76,407 | | |
Universal Forest Products, Inc. | | | 3,615 | | | | 93,845 | | |
US Ecology, Inc. | | | 1,568 | | | | 98,753 | | |
Vectrus, Inc. (a) | | | 1,410 | | | | 30,428 | | |
Wabash National Corp. | | | 5,783 | | | | 75,642 | | |
Werner Enterprises, Inc. (b) | | | 2,796 | | | | 82,594 | | |
WESCO International, Inc. (a) | | | 2,020 | | | | 96,960 | | |
| | | | 7,535,813 | | |
Information Technology (9.0%): | |
Alarm.com Holdings, Inc. (a) | | | 1,561 | | | | 80,969 | | |
Alpha & Omega Semiconductor Ltd. (a) | | | 6,292 | | | | 64,115 | | |
Amkor Technology, Inc. (a) | | | 10,230 | | | | 67,109 | | |
Anixter International, Inc. (a) | | | 948 | | | | 51,486 | | |
AppFolio, Inc. (a) | | | 925 | | | | 54,779 | | |
Applied Optoelectronics, Inc. (a) | | | 1,168 | | | | 18,022 | | |
Axcelis Technologies, Inc. (a) | | | 3,884 | | | | 69,135 | | |
AXT, Inc. (a) | | | 7,019 | | | | 30,533 | | |
Badger Meter, Inc. | | | 2,016 | | | | 99,207 | | |
Brooks Automation, Inc. | | | 1,390 | | | | 36,390 | | |
Casa Systems, Inc. (a) | | | 3,071 | | | | 40,322 | | |
Cass Information Systems, Inc. | | | 2,298 | | | | 121,610 | | |
Cohu, Inc. | | | 3,369 | | | | 54,140 | | |
Control4 Corp. (a) | | | 2,035 | | | | 35,816 | | |
CSG Systems International, Inc. (b) | | | 3,858 | | | | 122,569 | | |
Ebix, Inc. | | | 1,379 | | | | 58,690 | | |
Electro Scientific, Inc. (a) | | | 2,788 | | | | 83,528 | | |
ePlus, Inc. (a) | | | 1,398 | | | | 99,497 | | |
Evertec, Inc. | | | 5,964 | | | | 171,167 | | |
Fabrinet (a) | | | 1,871 | | | | 96,001 | | |
FormFactor, Inc. (a) | | | 4,290 | | | | 60,446 | | |
Ichor Holdings Ltd. (a) | | | 2,010 | | | | 32,763 | | |
Insight Enterprises, Inc. (a) | | | 1,787 | | | | 72,820 | | |
InterDigital, Inc. | | | 2,185 | | | | 145,150 | | |
See notes to financial statements.
27
Victory Portfolios II
VictoryShares US Small Cap Volatility Wtd ETF | | Schedule of Portfolio Investments — continued
December 31, 2018 | |
(Unaudited)
Security Description | | Shares | | Value | |
KEMET Corp. | | | 2,812 | | | $ | 49,322 | | |
ManTech International Corp., Class A | | | 1,784 | | | | 93,294 | | |
MTS Systems Corp. | | | 2,414 | | | | 96,874 | | |
Nanometrics, Inc. (a) | | | 1,287 | | | | 35,174 | | |
NIC, Inc. | | | 7,561 | | | | 94,361 | | |
PC Connection, Inc. | | | 3,044 | | | | 90,498 | | |
Perficient, Inc. (a) | | | 4,815 | | | | 107,182 | | |
Photronics, Inc. (a) | | | 7,315 | | | | 70,809 | | |
Presidio, Inc. (b) | | | 6,050 | | | | 78,953 | | |
Progress Software Corp. | | | 1,870 | | | | 66,366 | | |
Rogers Corp. (a) | | | 645 | | | | 63,894 | | |
ScanSource, Inc. (a) | | | 2,338 | | | | 80,380 | | |
Tech Data Corp. (a) | | | 1,001 | | | | 81,892 | | |
The Hackett Group, Inc. | | | 6,883 | | | | 110,197 | | |
TTM Technologies, Inc. (a) (b) | | | 4,629 | | | | 45,040 | | |
Ultra Clean Holdings, Inc. (a) | | | 3,846 | | | | 32,576 | | |
| | | | 2,963,076 | | |
Materials (3.1%): | |
Advansix, Inc. (a) | | | 2,311 | | | | 56,250 | | |
American Vanguard Corp. | | | 3,720 | | | | 56,507 | | |
Boise Cascade Co. | | | 2,823 | | | | 67,329 | | |
Carpenter Technology Corp. | | | 1,635 | | | | 58,222 | | |
Chase Corp. | | | 900 | | | | 90,045 | | |
Clearwater Paper Corp. (a) | | | 1,684 | | | | 41,039 | | |
Greif, Inc., Class A | | | 1,835 | | | | 68,097 | | |
Minerals Technologies, Inc. | | | 2,105 | | | | 108,070 | | |
Myers Industries, Inc. | | | 3,372 | | | | 50,951 | | |
Olympic Steel, Inc. | | | 3,379 | | | | 48,218 | | |
Rayonier Advanced Materials, Inc. | | | 3,828 | | | | 40,768 | | |
Schnitzer Steel Industries, Inc. | | | 2,937 | | | | 63,292 | | |
Stepan Co. | | | 1,154 | | | | 85,396 | | |
SunCoke Energy, Inc. (a) | | | 7,939 | | | | 67,879 | | |
Warrior Met Coal, Inc. | | | 2,231 | | | | 53,789 | | |
Worthington Industries, Inc. | | | 2,273 | | | | 79,192 | | |
| | | | 1,035,044 | | |
Real Estate (1.4%): | |
Four Corners Property Trust, Inc. | | | 7,538 | | | | 197,496 | | |
HFF, Inc., Class A | | | 1,595 | | | | 52,890 | | |
Marcus & Millichap, Inc. (a) | | | 3,957 | | | | 135,844 | | |
The RMR Group, Inc. | | | 1,237 | | | | 65,660 | | |
| | | | 451,890 | | |
Utilities (3.5%): | |
American States Water Co. | | | 2,490 | | | | 166,929 | | |
Chesapeake Utilities Corp. | | | 1,833 | | | | 149,023 | | |
MGE Energy, Inc. | | | 2,816 | | | | 168,847 | | |
Middlesex Water Co. | | | 2,637 | | | | 140,684 | | |
Otter Tail Corp. | | | 3,818 | | | | 189,526 | | |
See notes to financial statements.
28
Victory Portfolios II
VictoryShares US Small Cap Volatility Wtd ETF | | Schedule of Portfolio Investments — continued
December 31, 2018 | |
(Unaudited)
Security Description | | Shares | | Value | |
SJW Corp. | | | 1,816 | | | $ | 101,006 | | |
Unitil Corp. | | | 3,715 | | | | 188,128 | | |
| | | | 1,104,143 | | |
Total Common Stocks (Cost $38,680,855) | | | 32,286,959 | | |
Rights (0.0%) (c) | |
Materials (0.0%): (c) | |
Schulman, Inc. (a) (d) (e) | | | 1,471 | | | | 2,942 | | |
Total Rights (Cost $2,942) | | | 2,942 | | |
Collateral for Securities Loaned^ (4.6%) | |
BlackRock Liquidity Funds TempFund Portfolio, Institutional Class, 2.49% (f) | | | 282,231 | | | | 282,231 | | |
Fidelity Investments Money Market Government Portfolio, Class I, 2.28% (f) | | | 407,809 | | | | 407,809 | | |
Fidelity Investments Prime Money Market Portfolio, Class I, 2.46% (f) | | | 12,593 | | | | 12,593 | | |
Goldman Sachs Financial Square Prime Obligations Fund, Institutional Class,
2.55% (f) | | | 156,796 | | | | 156,796 | | |
JPMorgan Prime Money Market Fund, Capital Class, 2.49% (f) | | | 250,859 | | | | 250,859 | | |
Morgan Stanley Institutional Liquidity Prime Portfolio, Institutional Class,
2.58% (f) | | | 376,312 | | | | 376,312 | | |
Total Collateral for Securities Loaned (Cost $1,486,600) | | | 1,486,600 | | |
Total Investments (Cost $40,170,397) — 103.7% | | | 33,776,501 | | |
Liabilities in excess of other assets — (3.7)% | | | (1,205,282 | ) | |
NET ASSETS — 100.00% | | $ | 32,571,219 | | |
^ Purchased with cash collateral from securities on loan.
(a) Non-income producing security.
(b) All or a portion of this security is on loan.
(c) Amount represents less than 0.05% of net assets.
(d) The Fund's Adviser has deemed this security to be illiquid based upon procedures approved by the Board of Trustees. As of December 31, 2018, illiquid securities were 0.0% of the Fund's net assets.
(e) Security was fair valued based upon procedures approved by the Board of Trustees and represents 0.0% of the Fund's net assets as of December 31, 2018. This security is classified as Level 3 within the fair value hierarchy. (See Note 2)
(f) Rate disclosed is the daily yield on December 31, 2018.
Futures Contracts Purchased
| | | Number
of
Contracts | | Expiration
Date | | Notional
Amount | | Value | | Unrealized
Appreciation
(Depreciation) | |
Russell 2000 Mini Index Futures | | | 4 | | | 3/15/19 | | $ | 281,991 | | | $ | 269,800 | | | $ | (12,191 | ) | |
| | | Total unrealized appreciation | | | | | | | | $ | — | | |
| | | Total unrealized depreciation | | | | | | | | | (12,191 | ) | |
| | | Total net unrealized appreciation(depreciation) | | | | | | | | $ | (12,191 | ) | |
See notes to financial statements.
29
Victory Portfolios II
VictoryShares International Volatility Wtd ETF | | Schedule of Portfolio Investments
December 31, 2018 | |
(Unaudited)
Security Description | | Shares | | Value | |
Common Stocks (99.7%) | |
Australia (5.4%): | |
Communication Services (0.2%): | |
Telstra Corp. Ltd. | | | 19,682 | | | $ | 39,501 | | |
Consumer Discretionary (0.1%): | |
Aristocrat Leisure Ltd. | | | 2,006 | | | | 30,852 | | |
Consumer Staples (0.8%): | |
Treasury Wine Estates Ltd. | | | 3,030 | | | | 31,579 | | |
Wesfarmers Ltd. | | | 2,914 | | | | 66,117 | | |
Woolworths Ltd. | | | 4,777 | | | | 98,968 | | |
| | | | 196,664 | | |
Energy (0.5%): | |
Oil Search Ltd. | | | 9,384 | | | | 47,315 | | |
Santos Ltd. | | | 6,932 | | | | 26,751 | | |
Woodside Petroleum Ltd. | | | 2,430 | | | | 53,595 | | |
| | | | 127,661 | | |
Financials (2.0%): | |
Asx Ltd. | | | 1,690 | | | | 71,334 | | |
Australia & New Zealand Banking Group Ltd. | | | 3,674 | | | | 63,284 | | |
Commonwealth Bank of Australia | | | 1,402 | | | | 71,470 | | |
Insurance Australia Group Ltd. | | | 11,249 | | | | 55,451 | | |
Macquarie Group Ltd. | | | 753 | | | | 57,613 | | |
National Australia Bank Ltd. | | | 4,349 | | | | 73,716 | | |
Suncorp Group Ltd. | | | 7,553 | | | | 67,177 | | |
Westpac Banking Corp. | | | 3,586 | | | | 63,232 | | |
| | | | 523,277 | | |
Health Care (0.4%): | |
Cochlear Ltd. | | | 363 | | | | 44,369 | | |
CSL Ltd. | | | 380 | | | | 49,548 | | |
| | | | 93,917 | | |
Industrials (0.3%): | |
Brambles Ltd. | | | 7,968 | | | | 56,952 | | |
Cimic Group Ltd. | | | 1,075 | | | | 32,862 | | |
| | | | 89,814 | | |
Materials (0.9%): | |
BHP Billiton Ltd. | | | 2,310 | | | | 55,682 | | |
BHP Group PLC | | | 1,878 | | | | 39,528 | | |
Newcrest Mining Ltd. | | | 3,809 | | �� | | 58,474 | | |
RIO Tinto Ltd. | | | 941 | | | | 51,999 | | |
South32 Ltd. | | | 14,059 | | | | 33,166 | | |
| | | | 238,849 | | |
Utilities (0.2%): | |
AGL Energy Ltd. (a) | | | 3,685 | | | | 53,457 | | |
| | | | 1,393,992 | | |
See notes to financial statements.
30
Victory Portfolios II
VictoryShares International Volatility Wtd ETF | | Schedule of Portfolio Investments — continued
December 31, 2018 | |
(Unaudited)
Security Description | | Shares | | Value | |
Austria (0.5%): | |
Energy (0.1%): | |
OMV AG | | | 580 | | | $ | 25,415 | | |
Financials (0.2%): | |
Erste Group Bank AG | | | 1,561 | | | | 51,949 | | |
Utilities (0.2%): | |
Verbund AG, Class A (a) | | | 1,450 | | | | 61,860 | | |
| | | | 139,224 | | |
Belgium (1.8%): | |
Consumer Staples (0.5%): | |
Anheuser-Busch InBev SA/NV | | | 671 | | | | 44,354 | | |
Colruyt SA | | | 1,171 | | | | 83,494 | | |
| | | | 127,848 | | |
Financials (0.8%): | |
Ageas | | | 1,397 | | | | 62,895 | | |
Groupe Bruxelles Lambert SA | | | 830 | | | | 72,340 | | |
KBC Groep NV | | | 905 | | | | 58,764 | | |
| | | | 193,999 | | |
Health Care (0.2%): | |
UCB SA | | | 708 | | | | 57,830 | | |
Materials (0.3%): | |
Solvay SA | | | 465 | | | | 46,515 | | |
Umicore SA | | | 782 | | | | 31,230 | | |
| | | | 77,745 | | |
| | | | 457,422 | | |
Bermuda (0.6%): | |
Industrials (0.3%): | |
Jardine Matheson Holdings Ltd. | | | 1,300 | | | | 90,454 | | |
Real Estate (0.3%): | |
Hongkong Land Holdings Ltd. | | | 11,900 | | | | 74,970 | | |
| | | | 165,424 | | |
Canada (10.6%): | |
Communication Services (1.2%): | |
BCE, Inc. | | | 2,942 | | | | 116,236 | | |
Rogers Communications, Inc. | | | 1,573 | | | | 80,621 | | |
TELUS Corp. | | | 3,546 | | | | 117,550 | | |
| | | | 314,407 | | |
Consumer Discretionary (0.5%): | |
Dollarama, Inc. | | | 1,496 | | | | 35,586 | | |
Magna International, Inc. | | | 782 | | | | 35,502 | | |
Restaurant Brands International, Inc. | | | 1,102 | | | | 57,579 | | |
| | | | 128,667 | | |
See notes to financial statements.
31
Victory Portfolios II
VictoryShares International Volatility Wtd ETF | | Schedule of Portfolio Investments — continued
December 31, 2018 | |
(Unaudited)
Security Description | | Shares | | Value | |
Consumer Staples (1.1%): | |
Alimentation Couche-Tard, Inc., Class B | | | 1,067 | | | $ | 53,084 | | |
George Weston Ltd. | | | 1,098 | | | | 72,436 | | |
Loblaw Cos. Ltd. | | | 2,058 | | | | 92,135 | | |
Saputo, Inc. | | | 2,060 | | | | 59,144 | | |
| | | | 276,799 | | |
Energy (1.0%): | |
Canadian Natural Resources Ltd. | | | 1,359 | | | | 32,795 | | |
Enbridge, Inc. | | | 1,347 | | | | 41,851 | | |
Husky Energy, Inc. | | | 2,686 | | | | 27,765 | | |
Pembina Pipeline Corp. (a) | | | 1,921 | | | | 57,011 | | |
Suncor Energy, Inc. | | | 1,375 | | | | 38,409 | | |
TransCanada Corp. | | | 1,465 | | | | 52,322 | | |
| | | | 250,153 | | |
Financials (4.5%): | |
Bank of Montreal | | | 1,787 | | | | 116,764 | | |
Brookfield Asset Management, Inc. | | | 1,637 | | | | 62,745 | | |
Canadian Imperial Bank of Commerce | | | 1,463 | | | | 108,980 | | |
Fairfax Financial Holdings Ltd. | | | 108 | | | | 47,550 | | |
Great-West Lifeco, Inc. | | | 4,918 | | | | 101,530 | | |
Intact Financial Corp. | | | 1,008 | | | | 73,248 | | |
National Bank of Canada | | | 2,357 | | | | 96,784 | | |
Power Corp. of Canada | | | 4,481 | | | | 80,527 | | |
Power Financial Corp. | | | 4,527 | | | | 85,665 | | |
Royal Bank of Canada | | | 1,499 | | | | 102,613 | | |
Sun Life Financial, Inc. | | | 2,330 | | | | 77,308 | | |
The Bank of Nova Scotia | | | 1,904 | | | | 94,921 | | |
The Toronto-Dominion Bank | | | 2,195 | | | | 109,123 | | |
| | | | 1,157,758 | | |
Industrials (0.5%): | |
Canadian National Railway Co. | | | 822 | | | | 60,888 | | |
Canadian Pacific Railway Ltd. | | | 339 | | | | 60,161 | | |
| | | | 121,049 | | |
Information Technology (0.7%): | |
CGI Group, Inc. (b) | | | 1,395 | | | | 85,335 | | |
Constellation Software, Inc. | | | 63 | | | | 40,332 | | |
Open Text Corp. | | | 1,597 | | | | 52,064 | | |
| | | | 177,731 | | |
Materials (0.3%): | |
Franco-Nevada Corp. | | | 683 | | | | 47,900 | | |
Teck Resources Ltd., Class B | | | 1,586 | | | | 34,148 | | |
| | | | 82,048 | | |
See notes to financial statements.
32
Victory Portfolios II
VictoryShares International Volatility Wtd ETF | | Schedule of Portfolio Investments — continued
December 31, 2018 | |
(Unaudited)
Security Description | | Shares | | Value | |
Utilities (0.8%): | |
Fortis, Inc. | | | 3,409 | | | $ | 113,658 | | |
Hydro One Ltd. (c) | | | 6,999 | | | | 103,832 | | |
| | | | 217,490 | | |
| | | | 2,726,102 | | |
Denmark (1.7%): | |
Financials (0.2%): | |
Danske Bank A/S | | | 1,802 | | | | 35,652 | | |
Health Care (0.7%): | |
Ambu A/S (a) | | | 621 | | | | 14,927 | | |
Coloplast A/S | | | 584 | | | | 54,230 | | |
H. Lundbeck A/S | | | 646 | | | | 28,298 | | |
Novo Nordisk A/S, Class B | | | 1,129 | | | | 51,622 | | |
William Demant Holding A/S (a) (b) | | | 927 | | | | 26,308 | | |
| | | | 175,385 | | |
Industrials (0.4%): | |
DSV A/S | | | 589 | | | | 38,801 | | |
Rockwool International A/S, Class B | | | 86 | | | | 22,440 | | |
Vestas Wind Systems A/S | | | 656 | | | | 49,548 | | |
| | | | 110,789 | | |
Materials (0.4%): | |
Christian Hansen Holding A/S | | | 545 | | | | 48,233 | | |
Novozymes A/S, B Shares | | | 1,232 | | | | 55,008 | | |
| | | | 103,241 | | |
| | | | 425,067 | | |
Finland (1.3%): | |
Energy (0.1%): | |
Neste Oyj | | | 390 | | | | 30,095 | | |
Financials (0.5%): | |
Nordea Bank AB | | | 5,342 | | | | 44,977 | | |
Sampo Oyj, Class A | | | 1,547 | | | | 68,071 | | |
| | | | 113,048 | | |
Industrials (0.3%): | |
Kone Oyj, Class B | | | 1,048 | | | | 49,992 | | |
Wartsila Oyj ABP, Class B | | | 2,296 | | | | 36,548 | | |
| | | | 86,540 | | |
Materials (0.2%): | |
Stora ENSO Oyj, R Shares | | | 2,118 | | | | 24,470 | | |
UPM-Kymmene Oyj | | | 1,352 | | | | 34,307 | | |
| | | | 58,777 | | |
Utilities (0.2%): | |
Fortum Oyj | | | 2,270 | | | | 49,669 | | |
| | | | 338,129 | | |
See notes to financial statements.
33
Victory Portfolios II
VictoryShares International Volatility Wtd ETF | | Schedule of Portfolio Investments — continued
December 31, 2018 | |
(Unaudited)
Security Description | | Shares | | Value | |
France (10.9%): | |
Communication Services (0.7%): | |
Orange SA | | | 4,696 | | | $ | 76,150 | | |
Publicis Groupe SA | | | 741 | | | | 42,512 | | |
Vivendi Universal SA | | | 2,124 | | | | 51,779 | | |
| | | | 170,441 | | |
Consumer Discretionary (1.7%): | |
Accor SA | | | 1,324 | | | | 56,287 | | |
Cie Generale des Etablissements Michelin | | | 471 | | | | 46,781 | | |
Hermes International | | | 109 | | | | 60,537 | | |
Kering | | | 82 | | | | 38,665 | | |
LVMH Moet Hennessy Louis Vuitton SA | | | 156 | | | | 46,144 | | |
Psa Peugeot Citroen | | | 1,460 | | | | 31,185 | | |
Renault SA | | | 577 | | | | 36,058 | | |
Seb SA | | | 303 | | | | 39,154 | | |
Sodexo SA | | | 399 | | | | 40,910 | | |
Valeo SA | | | 1,089 | | | | 31,825 | | |
| | | | 427,546 | | |
Consumer Staples (0.9%): | |
Danone SA | | | 990 | | | | 69,761 | | |
L'Oreal SA | | | 307 | | | | 70,761 | | |
Pernod Ricard SA | | | 619 | | | | 101,617 | | |
| | | | 242,139 | | |
Energy (0.2%): | |
Total SA | | | 1,067 | | | | 56,448 | | |
Financials (1.2%): | |
AXA SA | | | 2,200 | | | | 47,528 | | |
BNP Paribas SA | | | 1,085 | | | | 49,066 | | |
CNP Assurances | | | 3,215 | | | | 68,211 | | |
Credit Agricole SA | | | 5,322 | | | | 57,493 | | |
Natixis SA | | | 7,536 | | | | 35,560 | | |
Societe Generale SA | | | 1,659 | | | | 52,873 | | |
| | | | 310,731 | | |
Health Care (1.1%): | |
BioMerieux | | | 573 | | | | 37,744 | | |
Essilor International SA | | | 590 | | | | 74,653 | | |
Ipsen SA | | | 382 | | | | 49,385 | | |
Sanofi | | | 919 | | | | 79,655 | | |
Sartorius Stedim Biotech | | | 426 | | | | 42,629 | | |
| | | | 284,066 | | |
Industrials (3.3%): | |
Aeroports de Paris | | | 274 | | | | 51,949 | | |
Airbus Group SE | | | 438 | | | | 42,129 | | |
Alstom SA | | | 1,980 | | | | 80,002 | | |
Bollore SA | | | 12,139 | | | | 48,672 | | |
Bouygues | | | 1,483 | | | | 53,244 | | |
See notes to financial statements.
34
Victory Portfolios II
VictoryShares International Volatility Wtd ETF | | Schedule of Portfolio Investments — continued
December 31, 2018 | |
(Unaudited)
Security Description | | Shares | | Value | |
Bureau Veritas SA | | | 2,967 | | | $ | 60,485 | | |
Compagnie de Saint-Gobain | | | 1,513 | | | | 50,551 | | |
Edenred | | | 1,250 | | | | 45,981 | | |
Eiffage SA | | | 842 | | | | 70,377 | | |
Legrand SA | | | 1,144 | | | | 64,611 | | |
Safran SA | | | 459 | | | | 55,422 | | |
Schneider Electric SA | | | 729 | | | | 49,874 | | |
Teleperformance | | | 262 | | | | 41,900 | | |
Thales SA | | | 517 | | | | 60,412 | | |
Vinci SA | | | 796 | | | | 65,675 | | |
| | | | 841,284 | | |
Information Technology (0.5%): | |
Atos SE | | | 362 | | | | 29,643 | | |
Cap Gemini SA | | | 497 | | | | 49,420 | | |
Dassault Systemes SA | | | 383 | | | | 45,500 | | |
| | | | 124,563 | | |
Materials (0.4%): | |
Air Liquide SA | | | 580 | | | | 72,059 | | |
Arkema SA | | | 502 | | | | 43,109 | | |
| | | | 115,168 | | |
Utilities (0.9%): | |
Electricite de France SA | | | 3,306 | | | | 52,265 | | |
Gdf Suez | | | 4,241 | | | | 60,853 | | |
Suez Environnement Co. | | | 3,302 | | | | 43,615 | | |
Veolia Environnement SA | | | 3,133 | | | | 64,443 | | |
| | | | 221,176 | | |
| | | | 2,793,562 | | |
Germany (4.9%): | |
Communication Services (0.5%): | |
Deutsche Telekom AG, Registered Shares | | | 4,538 | | | | 77,045 | | |
United Internet AG, Registered Shares | | | 851 | | | | 37,241 | | |
| | | | 114,286 | | |
Consumer Discretionary (0.5%): | |
Bayerische Motoren Werke AG | | | 636 | | | | 51,512 | | |
Continental AG | | | 230 | | | | 31,816 | | |
Daimler AG, Registered Shares | | | 832 | | | | 43,758 | | |
| | | | 127,086 | | |
Consumer Staples (0.3%): | |
Beiersdorf AG | | | 620 | | | | 64,748 | | |
Financials (0.6%): | |
Commerzbank AG (b) | | | 4,004 | | | | 26,526 | | |
Deutsche Boerse AG | | | 485 | | | | 58,311 | | |
Hannover Rueck SE | | | 528 | | | | 71,194 | | |
| | | | 156,031 | | |
See notes to financial statements.
35
Victory Portfolios II
VictoryShares International Volatility Wtd ETF | | Schedule of Portfolio Investments — continued
December 31, 2018 | |
(Unaudited)
Security Description | | Shares | | Value | |
Health Care (0.6%): | |
Bayer AG | | | 485 | | | $ | 33,648 | | |
Fresenius Medical Care AG & Co. KGaA | | | 546 | | | | 35,428 | | |
Fresenius SE & Co. KGaA | | | 658 | | | | 31,946 | | |
Merck KGaA | | | 507 | | | | 52,262 | | |
| | | | 153,284 | | |
Industrials (1.0%): | |
Brenntag AG | | | 1,100 | | | | 47,508 | | |
Deutsche Post AG | | | 1,370 | | | | 37,526 | | |
Hochtief AG | | | 349 | | | | 47,058 | | |
MTU Aero Engines Holding AG | | | 181 | | | | 32,845 | | |
Rational AG | | | 67 | | | | 38,070 | | |
Siemens AG | | | 476 | | | | 53,101 | | |
| | | | 256,108 | | |
Information Technology (0.4%): | |
Infineon Technologies AG | | | 1,717 | | | | 34,157 | | |
SAP SE | | | 532 | | | | 52,980 | | |
Wirecard AG | | | 158 | | | | 24,037 | | |
| | | | 111,174 | | |
Materials (0.5%): | |
BASF SE | | | 681 | | | | 47,121 | | |
Evonik Industries AG | | | 1,683 | | | | 42,031 | | |
Symrise AG | | | 608 | | | | 44,926 | | |
| | | | 134,078 | | |
Real Estate (0.5%): | |
Deutsche Wohnen AG | | | 1,706 | | | | 78,175 | | |
Vonovia SE | | | 1,361 | | | | 61,727 | | |
| | | | 139,902 | | |
| | | | 1,256,697 | | |
Hong Kong (5.3%): | |
Consumer Discretionary (0.2%): | |
Galaxy Entertainment Group Ltd. | | | 4,000 | | | | 25,441 | | |
Techtronic Industries Co. Ltd. | | | 4,000 | | | | 21,251 | | |
| | | | 46,692 | | |
Consumer Staples (0.2%): | |
Sun Art Retail Group Ltd. | | | 28,000 | | | | 28,536 | | |
WH Group Ltd. (c) | | | 40,000 | | | | 30,805 | | |
| | | | 59,341 | | |
Financials (0.8%): | |
AIA Group Ltd. | | | 4,800 | | | | 39,847 | | |
Hang Seng Bank | | | 2,200 | | | | 49,395 | | |
Hong Kong Exchanges and Clearing Ltd. | | | 2,000 | | | | 57,880 | | |
The Bank of East Asia Ltd. | | | 15,400 | | | | 48,973 | | |
| | | | 196,095 | | |
See notes to financial statements.
36
Victory Portfolios II
VictoryShares International Volatility Wtd ETF | | Schedule of Portfolio Investments — continued
December 31, 2018 | |
(Unaudited)
Security Description | | Shares | | Value | |
Health Care (0.1%): | |
Sino Biopharmaceutical Ltd. | | | 19,000 | | | $ | 12,521 | | |
Industrials (0.5%): | |
CK Hutchison Holdings Ltd. | | | 6,500 | | | | 62,426 | | |
MTR Corp. Ltd. | | | 12,000 | | | | 63,142 | | |
| | | | 125,568 | | |
Real Estate (2.2%): | |
CK Asset Holdings Ltd. | | | 10,313 | | | | 75,471 | | |
Henderson Land Development Co. Ltd. | | | 15,128 | | | | 75,350 | | |
New World Development Co. Ltd. | | | 46,000 | | | | 60,863 | | |
Shimao Property Holdings Ltd. | | | 8,500 | | | | 22,688 | | |
Sino Land Co. Ltd. | | | 28,000 | | | | 47,990 | | |
Sun Hung KAI Properties Ltd. | | | 7,000 | | | | 99,770 | | |
Swire Pacific Ltd., Class A | | | 6,000 | | | | 63,372 | | |
Wharf Real Estate Investment | | | 9,000 | | | | 53,851 | | |
Wheelock & Co. Ltd. | | | 12,000 | | | | 68,582 | | |
| | | | 567,937 | | |
Utilities (1.3%): | |
China Gas Holdings Ltd. (a) | | | 7,000 | | | | 24,943 | | |
CK Infrastructure Holdings Ltd. | | | 11,500 | | | | 87,094 | | |
CLP Holdings Ltd. | | | 6,500 | | | | 73,467 | | |
Hong Kong & China Gas Co. Ltd. | | | 45,394 | | | | 93,919 | | |
Power Assets Holdings Ltd. (a) | | | 9,500 | | | | 66,124 | | |
| | | | 345,547 | | |
| | | | 1,353,701 | | |
Ireland (1.3%): | |
Communication Services (0.1%): | |
WPP PLC | | | 2,322 | | | | 25,052 | | |
Consumer Staples (0.2%): | |
Kerry Group PLC | | | 545 | | | | 54,006 | | |
Financials (0.1%): | |
Bank of Ireland Group PLC | | | 6,153 | | | | 34,258 | | |
Industrials (0.6%): | |
Experian PLC | | | 2,908 | | | | 70,599 | | |
Kingspan Group PLC | | | 1,212 | | | | 51,901 | | |
Ryanair Holdings PLC, ADR (b) | | | 440 | | | | 31,389 | | |
| | | | 153,889 | | |
Materials (0.3%): | |
CRH PLC | | | 1,778 | | | | 47,052 | | |
Smurfit Kappa Group PLC | | | 596 | | | | 15,881 | | |
| | | | 62,933 | | |
| | | | 330,138 | | |
See notes to financial statements.
37
Victory Portfolios II
VictoryShares International Volatility Wtd ETF | | Schedule of Portfolio Investments — continued
December 31, 2018 | |
(Unaudited)
Security Description | | Shares | | Value | |
Israel (0.4%): | |
Financials (0.4%): | |
Bank Hapoalim BM | | | 8,637 | | | $ | 54,690 | | |
Bank Leumi Le-Israel B.M. | | | 9,719 | | | | 58,808 | | |
| | | | 113,498 | | |
Italy (2.1%): | |
Communication Services (0.1%): | |
Telecom Italia SpA (b) | | | 63,656 | | | | 35,244 | | |
Consumer Discretionary (0.1%): | |
Moncler SpA | | | 699 | | | | 23,166 | | |
Consumer Staples (0.3%): | |
Davide Campari - Milano SpA | | | 7,475 | | | | 63,240 | | |
Energy (0.5%): | |
Eni SpA | | | 3,390 | | | | 53,392 | | |
Snam SpA | | | 14,101 | | | | 61,692 | | |
| | | | 115,084 | | |
Financials (0.5%): | |
Assicurazioni Generali SpA | | | 3,908 | | | | 65,364 | | |
Intesa Sanpaolo SpA | | | 17,104 | | | | 38,009 | | |
UniCredit SpA | | | 2,765 | | | | 31,340 | | |
| | | | 134,713 | | |
Industrials (0.1%): | |
Atlantia SpA | | | 1,464 | | | | 30,306 | | |
Utilities (0.5%): | |
Enel SpA | | | 12,097 | | | | 69,901 | | |
Terna Rete Elettrica Nazionale SpA | | | 11,112 | | | | 63,051 | | |
| | | | 132,952 | | |
| | | | 534,705 | | |
Japan (20.0%): | |
Communication Services (1.0%): | |
KDDI Corp. | | | 2,300 | | | | 55,071 | | |
Nintendo Co. Ltd. | | | 100 | | | | 26,722 | | |
Nippon Telegraph & Telephone Corp. | | | 1,500 | | | | 61,347 | | |
NTT DOCOMO, Inc. | | | 3,000 | | | | 67,684 | | |
SoftBank Group Corp. | | | 300 | | | | 19,997 | | |
Yahoo Japan Corp. | | | 9,700 | | | | 24,252 | | |
| | | | 255,073 | | |
Consumer Discretionary (3.5%): | |
Aisin Seiki Co. Ltd. | | | 700 | | | | 24,400 | | |
Bridgestone Corp. | | | 1,600 | | | | 61,845 | | |
Denso Corp. | | | 900 | | | | 40,183 | | |
Fuji Heavy Industries Ltd. | | | 2,100 | | | | 45,223 | | |
Honda Motor Co. Ltd. | | | 1,700 | | | | 44,900 | | |
Isuzu Motors Ltd. | | | 3,200 | | | | 45,216 | | |
See notes to financial statements.
38
Victory Portfolios II
VictoryShares International Volatility Wtd ETF | | Schedule of Portfolio Investments — continued
December 31, 2018 | |
(Unaudited)
Security Description | | Shares | | Value | |
Koito Manufacturing Co. Ltd. | | | 500 | | | $ | 25,915 | | |
Mitsubishi Motors Corp. | | | 5,200 | | | | 28,565 | | |
Nissan Motor Co. Ltd. | | | 8,000 | | | | 64,261 | | |
Nitori Holdings Co. Ltd. | | | 200 | | | | 25,057 | | |
Oriental Land Co. Ltd. | | | 800 | | | | 80,701 | | |
Panasonic Corp. | | | 4,000 | | | | 36,157 | | |
Rakuten, Inc. (a) | | | 5,000 | | | | 33,580 | | |
Sekisui House Ltd. | | | 4,100 | | | | 60,570 | | |
Sharp Corp./Japan | | | 1,200 | | | | 12,067 | | |
Shimano, Inc. | | | 600 | | | | 84,971 | | |
Sumitomo Electric Industries Ltd. | | | 3,300 | | | | 44,024 | | |
Suzuki Motor Corp. | | | 700 | | | | 35,559 | | |
Toyota Industries Corp. | | | 600 | | | | 27,867 | | |
Toyota Motor Corp. | | | 1,100 | | | | 64,300 | | |
Zozo, Inc. | | | 600 | | | | 11,005 | | |
| | | | 896,366 | | |
Consumer Staples (1.6%): | |
Asahi Group Holdings Ltd. | | | 900 | | | | 35,059 | | |
Japan Tobacco, Inc. (a) | | | 2,100 | | | | 50,138 | | |
Kao Corp. | | | 900 | | | | 66,964 | | |
Kikkoman Corp. | | | 1,100 | | | | 59,321 | | |
Kose Corp. | | | 100 | | | | 15,750 | | |
MEIJI Holdings Co. Ltd. | | | 500 | | | | 40,880 | | |
Seven & i Holdings Co. Ltd. | | | 1,800 | | | | 78,560 | | |
Uni-Charm Corp. | | | 1,500 | | | | 48,713 | | |
Yakult Honsha Co. Ltd. | | | 400 | | | | 28,178 | | |
| | | | 423,563 | | |
Energy (0.2%): | |
Idemitsu Kosan Co. Ltd. | | | 400 | | | | 13,176 | | |
JXTG Holdings, Inc. | | | 5,300 | | | | 27,891 | | |
| | | | 41,067 | | |
Financials (2.7%): | |
Daiwa Securities Group, Inc. | | | 12,800 | | | | 65,010 | | |
Japan Post Bank Co. Ltd. | | | 6,300 | | | | 69,559 | | |
Japan Post Holdings Co. Ltd. | | | 7,900 | | | | 91,190 | | |
Mitsubishi UFJ Financial Group, Inc. | | | 9,300 | | | | 45,647 | | |
Mizuho Financial Group, Inc. | | | 54,300 | | | | 84,381 | | |
Nomura Holdings, Inc. | | | 15,500 | | | | 59,516 | | |
ORIX Corp. | | | 3,500 | | | | 51,275 | | |
Resona Holdings, Inc. | | | 8,500 | | | | 41,007 | | |
Sumitomo Mitsui Financial Group, Inc. | | | 1,700 | | | | 56,543 | | |
Sumitomo Mitsui Trust Holdings, Inc. | | | 1,600 | | | | 58,721 | | |
T&D Holdings, Inc. | | | 3,100 | | | | 36,179 | | |
The Dai-ichi Life Insurance Co. Ltd. | | | 2,400 | | | | 37,624 | | |
| | | | 696,652 | | |
See notes to financial statements.
39
Victory Portfolios II
VictoryShares International Volatility Wtd ETF | | Schedule of Portfolio Investments — continued
December 31, 2018 | |
(Unaudited)
Security Description | | Shares | | Value | |
Health Care (1.4%): | |
Astellas Pharma, Inc. | | | 3,600 | | | $ | 46,039 | | |
Chugai Pharmaceutical Co. Ltd. | | | 1,000 | | | | 58,217 | | |
Eisai Co. Ltd. | | | 200 | | | | 15,516 | | |
Hoya Corp. | | | 700 | | | | 42,253 | | |
M3, Inc. | | | 1,500 | | | | 20,175 | | |
ONO Pharmaceutical Co. Ltd. | | | 1,500 | | | | 30,728 | | |
Otsuka Holdings Co. Ltd. | | | 900 | | | | 36,899 | | |
Shionogi & Co. Ltd. | | | 1,200 | | | | 68,667 | | |
Sysmex Corp. | | | 300 | | | | 14,443 | | |
Taisho Pharmaceutical Holdings | | | 300 | | | | 30,194 | | |
| | | | 363,131 | | |
Industrials (4.5%): | |
Central Japan Railway Co. | | | 200 | | | | 42,276 | | |
Daikin Industries Ltd. | | | 300 | | | | 32,015 | | |
East Japan Railway Co. | | | 1,000 | | | | 88,612 | | |
FANUC Corp. | | | 200 | | | | 30,422 | | |
ITOCHU Corp. | | | 3,300 | | | | 56,220 | | |
Japan Airlines Co. Ltd. | | | 1,800 | | | | 63,909 | | |
Komatsu Ltd. | | | 1,600 | | | | 34,536 | | |
Kubota Corp. | | | 3,100 | | | | 44,171 | | |
Makita Corp. | | | 800 | | | | 28,506 | | |
Marubeni Corp. | | | 6,800 | | | | 47,927 | | |
Mitsubishi Corp. | | | 2,000 | | | | 55,115 | | |
Mitsubishi Electric Corp. | | | 3,400 | | | | 37,742 | | |
Mitsubishi Heavy Industries Ltd. | | | 1,800 | | | | 64,977 | | |
Mitsui & Co. Ltd. | | | 3,600 | | | | 55,532 | | |
Nidec Corp. | | | 700 | | | | 79,683 | | |
Recruit Holdings Co. Ltd. | | | 1,000 | | | | 24,295 | | |
Secom Co. Ltd. | | | 1,100 | | | | 91,481 | | |
SMC Corp. | | | 100 | | | | 30,331 | | |
Sumitomo Corp. | | | 3,600 | | | | 51,295 | | |
Taisei Corp. | | | 700 | | | | 30,053 | | |
Tokyu Corp. | | | 3,700 | | | | 60,603 | | |
Toyota Tsusho Corp. | | | 1,100 | | | | 32,571 | | |
West Japan Railway Co. | | | 1,100 | | | | 77,900 | | |
| | | | 1,160,172 | | |
Information Technology (2.3%): | |
Canon, Inc. | | | 2,400 | | | | 65,721 | | |
FUJIFILM Holdings Corp. | | | 1,500 | | | | 58,445 | | |
Fujitsu Ltd. | | | 700 | | | | 43,735 | | |
Hitachi Ltd. | | | 1,400 | | | | 37,501 | | |
Keyence Corp. | | | 400 | | | | 203,230 | | |
Murata Manufacturing Co. Ltd. | | | 200 | | | | 27,293 | | |
Nomura Research Institute Ltd. | | | 826 | | | | 30,714 | | |
NTT Data Corp. | | | 3,300 | | | | 36,285 | | |
Oracle Corp. Japan | | | 300 | | | | 19,162 | | |
See notes to financial statements.
40
Victory Portfolios II
VictoryShares International Volatility Wtd ETF | | Schedule of Portfolio Investments — continued
December 31, 2018 | |
(Unaudited)
Security Description | | Shares | | Value | |
ROHM Co. Ltd. | | | 300 | | | $ | 19,272 | | |
TDK Corp. | | | 200 | | | | 14,089 | | |
Tokyo Electron Ltd. | | | 200 | | | | 22,840 | | |
| | | | 578,287 | | |
Materials (1.1%): | |
Asahi Kasei Corp. | | | 3,200 | | | | 32,996 | | |
JFE Holdings, Inc. | | | 1,900 | | | | 30,462 | | |
Mitsubishi Chem Holdings | | | 5,500 | | | | 41,786 | | |
Nippon Paint Co. Ltd. (a) | | | 600 | | | | 20,586 | | |
Nippon Steel & Sumitomo Metal | | | 2,500 | | | | 43,172 | | |
Nitto Denko Corp. | | | 500 | | | | 25,290 | | |
Shin-Etsu Chemical Co. Ltd. | | | 500 | | | | 38,945 | | |
Toray Industries, Inc. | | | 8,200 | | | | 57,764 | | |
| | | | 291,001 | | |
Real Estate (1.3%): | |
Daito Trust Construction Co. Ltd. | | | 200 | | | | 27,402 | | |
Daiwa House Industry Co. Ltd. | | | 1,700 | | | | 54,262 | | |
Mitsubishi Estate Co. Ltd. | | | 3,100 | | | | 48,923 | | |
Mitsui Fudosan Co. Ltd. | | | 2,000 | | | | 44,621 | | |
Sumitomo Realty & Development | | | 4,300 | | | | 157,969 | | |
| | | | 333,177 | | |
Utilities (0.4%): | |
Kansai Electric Power Co. | | | 3,100 | | | | 46,674 | | |
Tokyo Gas Co. Ltd. | | | 2,300 | | | | 58,460 | | |
| | | | 105,134 | | |
| | | | 5,143,623 | | |
Korea, Republic Of (3.6%): | |
Communication Services (0.4%): | |
NAVER Corp. | | | 368 | | | | 40,240 | | |
SK Telecom Co. Ltd. | | | 250 | | | | 60,388 | | |
| | | | 100,628 | | |
Consumer Discretionary (0.3%): | |
Hyundai Motor Co. | | | 425 | | | | 45,140 | | |
LG Electronics, Inc. | | | 496 | | | | 27,696 | | |
| | | | 72,836 | | |
Consumer Staples (0.5%): | |
Amorepacific Corp. | | | 153 | | | | 28,729 | | |
KT&G Corp. | | | 690 | | | | 62,772 | | |
LG Household & Health Care Ltd. | | | 31 | | | | 30,592 | | |
| | | | 122,093 | | |
Energy (0.3%): | |
SK Innovation Co. Ltd. | | | 255 | | | | 41,026 | | |
S-Oil Corp. | | | 410 | | | | 35,903 | | |
| | | | 76,929 | | |
See notes to financial statements.
41
Victory Portfolios II
VictoryShares International Volatility Wtd ETF | | Schedule of Portfolio Investments — continued
December 31, 2018 | |
(Unaudited)
Security Description | | Shares | | Value | |
Financials (0.7%): | |
Hana Financial Group, Inc. | | | 1,011 | | | $ | 32,848 | | |
KB Financial Group, Inc. | | | 1,025 | | | | 42,720 | | |
Shinhan Financial Group Co. Ltd. | | | 1,511 | | | | 53,631 | | |
Woori Bank | | | 3,053 | | | | 42,688 | | |
| | | | 171,887 | | |
Health Care (0.1%): | |
Celltrion, Inc. (b) | | | 101 | | | | 20,054 | | |
Industrials (0.5%): | |
LG Corp. | | | 813 | | | | 50,936 | | |
Samsung C&T Corp. | | | 455 | | | | 43,025 | | |
SK Holdings Co. Ltd. | | | 221 | | | | 51,501 | | |
| | | | 145,462 | | |
Information Technology (0.5%): | |
Samsung Electro-Mechanics Co. Ltd. | | | 196 | | | | 18,182 | | |
Samsung Electronics Co. Ltd. | | | 1,065 | | | | 36,941 | | |
Samsung SDI Co. Ltd. | | | 145 | | | | 28,462 | | |
Samsung SDS Co. Ltd. | | | 144 | | | | 26,330 | | |
SK Hynix, Inc. | | | 453 | | | | 24,565 | | |
| | | | 134,480 | | |
Materials (0.3%): | |
LG Chem Ltd. | | | 104 | | | | 32,345 | | |
Lotte Chemical Corp. | | | 130 | | | | 32,276 | | |
POSCO | | | 121 | | | | 26,354 | | |
| | | | 90,975 | | |
| | | | 935,344 | | |
Luxembourg (0.3%): | |
Energy (0.1%): | |
Tenaris SA | | | 2,388 | | | | 25,825 | | |
Health Care (0.1%): | |
Eurofins Scientific | | | 50 | | | | 18,673 | | |
Materials (0.1%): | |
Arcelormittal | | | 1,239 | | | | 25,748 | | |
| | | | 70,246 | | |
Macau (0.2%): | |
Consumer Discretionary (0.2%): | |
Sands China Ltd. | | | 7,600 | | | | 33,293 | | |
Wynn Macau Ltd. | | | 9,200 | | | | 20,068 | | |
| | | | 53,361 | | |
Netherlands (3.1%): | |
Communication Services (0.3%): | |
Koninklijke KPN NV | | | 23,884 | | | | 70,045 | | |
See notes to financial statements.
42
Victory Portfolios II
VictoryShares International Volatility Wtd ETF | | Schedule of Portfolio Investments — continued
December 31, 2018 | |
(Unaudited)
Security Description | | Shares | | Value | |
Consumer Staples (0.8%): | |
Heineken Holding A | | | 555 | | | $ | 46,891 | | |
Heineken NV | | | 768 | | | | 67,922 | | |
Koninklijke Ahold Delhaize NV | | | 3,223 | | | | 81,506 | | |
| | | | 196,319 | | |
Financials (0.8%): | |
ABN AMRO Group NV (c) | | | 1,972 | | | | 46,402 | | |
Aegon NV | | | 8,832 | | | | 41,271 | | |
ING Groep NV | | | 4,688 | | | | 50,537 | | |
NN Group NV | | | 1,581 | | | | 63,029 | | |
| | | | 201,239 | | |
Health Care (0.2%): | |
Koninklijke Philips NV | | | 1,368 | | | | 48,473 | | |
Industrials (0.5%): | |
Randstad Holding NV | | | 965 | | | | 44,319 | | |
Wolters Kluwer NV | | | 1,223 | | | | 72,379 | | |
| | | | 116,698 | | |
Information Technology (0.1%): | |
| ASML Holding NV | | | 236 | | | | 37,083 | | |
Materials (0.4%): | |
AkzoNobel NV | | | 816 | | | | 65,810 | | |
Koninklijke DSM NV | | | 604 | | | | 49,432 | | |
| | | | 115,242 | | |
| | | | 785,099 | | |
Norway (0.9%): | |
Communication Services (0.3%): | |
Telenor ASA | | | 3,383 | | | | 65,580 | | |
Consumer Staples (0.2%): | |
Marine Harvest ASA | | | 2,694 | | | | 56,963 | | |
Energy (0.1%): | |
Aker BP ASA | | | 794 | | | | 20,032 | | |
Financials (0.2%): | |
DNB ASA | | | 2,770 | | | | 44,288 | | |
Materials (0.1%): | |
Norsk Hydro ASA | | | 7,453 | | | | 33,821 | | |
| | | | 220,684 | | |
Portugal (0.3%): | |
Consumer Staples (0.1%): | |
Jeronimo Martins SGPS SA | | | 3,037 | | | | 35,974 | | |
Energy (0.2%): | |
Galp Energia SGPS SA | | | 2,953 | | | | 46,668 | | |
| | | | 82,642 | | |
See notes to financial statements.
43
Victory Portfolios II
VictoryShares International Volatility Wtd ETF | | Schedule of Portfolio Investments — continued
December 31, 2018 | |
(Unaudited)
Security Description | | Shares | | Value | |
Russian Federation (0.1%): | |
Materials (0.1%): | |
Evraz PLC | | | 3,872 | | | $ | 23,710 | | |
Singapore (1.7%): | |
Communication Services (0.2%): | |
Singapore Telecommunications Ltd. | | | 27,700 | | | | 59,563 | | |
Consumer Discretionary (0.4%): | |
Genting Singapore Ltd. | | | 51,000 | | | | 36,493 | | |
Jardine Cycle & Carriage Ltd. | | | 2,100 | | | | 54,480 | | |
| | | | 90,973 | | |
Consumer Staples (0.3%): | |
Wilmar International Ltd. | | | 31,800 | | | | 72,814 | | |
Financials (0.6%): | |
DBS Group Holdings Ltd. | | | 3,100 | | | | 53,897 | | |
Oversea-Chinese Banking Corp. Ltd. | | | 7,200 | | | | 59,498 | | |
United Overseas Bank Ltd. | | | 3,000 | | | | 54,095 | | |
| | | | 167,490 | | |
Real Estate (0.2%): | |
CapitaLand Ltd. | | | 25,500 | | | | 58,201 | | |
| | | | 449,041 | | |
Spain (3.1%): | |
Communication Services (0.3%): | |
Telefonica SA | | | 9,209 | | | | 77,425 | | |
Consumer Discretionary (0.2%): | |
Industria de Diseno Textil SA | | | 1,872 | | | | 47,931 | | |
Energy (0.2%): | |
Repsol SA | | | 3,174 | | | | 51,196 | | |
Financials (0.6%): | |
Banco Bilbao Vizcaya Argentaria SA | | | 8,114 | | | | 43,089 | | |
Banco Santander SA | | | 10,891 | | | | 49,570 | | |
Bankia SA | | | 13,019 | | | | 38,181 | | |
CaixaBank SA | | | 10,581 | | | | 38,352 | | |
| | | | 169,192 | | |
Health Care (0.2%): | |
Grifols SA | | | 1,862 | | | | 48,848 | | |
Industrials (0.5%): | |
Aena SA (c) | | | 379 | | | | 58,940 | | |
Ferrovial SA | | | 3,279 | | | | 66,469 | | |
| | | | 125,409 | | |
Information Technology (0.2%): | |
Amadeus IT Holding SA | | | 711 | | | | 49,555 | | |
See notes to financial statements.
44
Victory Portfolios II
VictoryShares International Volatility Wtd ETF | | Schedule of Portfolio Investments — continued
December 31, 2018 | |
(Unaudited)
Security Description | | Shares | | Value | |
Utilities (0.9%): | |
Endesa SA | | | 3,415 | | | $ | 78,753 | | |
Iberdrola SA | | | 9,611 | | | | 77,270 | | |
Red Electrica Corp. SA | | | 3,432 | | | | 76,648 | | |
| | | | 232,671 | | |
| | | | 802,227 | | |
Sweden (2.5%): | |
Communication Services (0.2%): | |
TeliaSonera AB | | | 12,542 | | | | 59,439 | | |
Consumer Discretionary (0.2%): | |
Hennes & Mauritz AB, B Shares (a) | | | 2,938 | | | | 41,798 | | |
Consumer Staples (0.4%): | |
Essity AB, Class B | | | 2,191 | | | | 53,822 | | |
Swedish Match AB | | | 1,192 | | | | 46,977 | | |
| | | | 100,799 | | |
Financials (0.6%): | |
Skandinaviska Enskilda Banken AB, Class A | | | 5,479 | | | | 53,255 | | |
Svenska Handelsbanken AB | | | 4,421 | | | | 49,061 | | |
Swedbank AB, A Shares | | | 2,924 | | | | 65,276 | | |
| | | | 167,592 | | |
Health Care (0.1%): | |
Swedish Orphan Biovitrum AB (b) | | | 847 | | | | 18,454 | | |
Industrials (0.8%): | |
Alfa Laval AB | | | 1,910 | | | | 40,893 | | |
Atlas Copco AB, A Shares | | | 1,668 | | | | 39,638 | | |
Sandvik AB | | | 2,828 | | | | 40,338 | | |
| SKF AB, B Shares | | | 2,415 | | | | 36,655 | | |
Volvo AB, Class B | | | 3,004 | | | | 39,321 | | |
| | | | 196,845 | | |
Information Technology (0.2%): | |
Hexagon AB, B Shares | | | 1,028 | | | | 47,349 | | |
| | | | 632,276 | | |
Switzerland (6.4%): | |
Communication Services (0.3%): | |
Swisscom AG | | | 158 | | | | 75,535 | | |
Consumer Discretionary (0.3%): | |
CIE Financiere Richemont SA | | | 690 | | | | 44,244 | | |
The Swatch Group AG, B shares | | | 126 | | | | 36,768 | | |
| | | | 81,012 | | |
See notes to financial statements.
45
Victory Portfolios II
VictoryShares International Volatility Wtd ETF | | Schedule of Portfolio Investments — continued
December 31, 2018 | |
(Unaudited)
Security Description | | Shares | | Value | |
Consumer Staples (1.1%): | |
Barry Callebaut AG | | | 31 | | | $ | 48,306 | | |
Chocoladefabriken Lindt & Spruengli AG | | | 12 | | | | 74,504 | | |
Coca-Cola HBC AG | | | 1,845 | | | | 57,653 | | |
Nestle SA, Registered Shares | | | 1,109 | | | | 90,075 | | |
| | | | 270,538 | | |
Financials (1.0%): | |
Julius Baer Group Ltd. | | | 1,117 | | | | 39,803 | | |
Partners Group Holding AG | | | 100 | | | | 60,661 | | |
Swiss Life Holding AG | | | 209 | | | | 80,537 | | |
Zurich Insurance Group AG | | | 250 | | | | 74,580 | | |
| | | | 255,581 | | |
Health Care (1.2%): | |
Lonza Group AG, Registered Shares | | | 168 | | | | 43,552 | | |
Novartis AG | | | 812 | | | | 69,456 | | |
Roche Holding AG | | | 319 | | | | 79,028 | | |
Sonova Holding AG, Registered Shares | | | 305 | | | | 49,855 | | |
Straumann Holding AG | | | 61 | | | | 38,369 | | |
Vifor Pharma AG | | | 236 | | | | 25,678 | | |
| | | | 305,938 | | |
Industrials (1.5%): | |
ABB Ltd. | | | 2,351 | | | | 44,735 | | |
Adecco SA, Registered Shares | | | 892 | | | | 41,699 | | |
Ferguson PLC | | | 826 | | | | 52,812 | | |
Geberit AG | | | 178 | | | | 69,261 | | |
Kuehne + Nagel International AG | | | 508 | | | | 65,329 | | |
Schindler Holding AG | | | 297 | | | | 58,856 | | |
SGS SA | | | 29 | | | | 65,232 | | |
| | | | 397,924 | | |
Information Technology (0.2%): | |
Stmicroelectronics NV | | | 1,703 | | | | 23,860 | | |
Temenos AG | | | 190 | | | | 22,800 | | |
| | | | 46,660 | | |
Materials (0.8%): | |
EMS-Chemie Holding AG | | | 108 | | | | 51,334 | | |
Givaudan SA, Registered Shares | | | 31 | | | | 71,813 | | |
Glencore PLC | | | 7,917 | | | | 29,396 | | |
Sika AG, Registered Shares | | | 347 | | | | 44,006 | | |
| | | | 196,549 | | |
| | | | 1,629,737 | | |
United Arab Emirates (0.1%): | |
Health Care (0.1%): | |
NMC Health PLC | | | 896 | | | | 31,241 | | |
See notes to financial statements.
46
Victory Portfolios II
VictoryShares International Volatility Wtd ETF | | Schedule of Portfolio Investments — continued
December 31, 2018 | |
(Unaudited)
Security Description | | Shares | | Value | |
United Kingdom (10.1%): | |
Communication Services (0.9%): | |
BT Group PLC | | | 17,250 | | | $ | 52,343 | | |
Informa PLC | | | 7,434 | | | | 59,705 | | |
Pearson PLC | | | 5,162 | | | | 61,732 | | |
Vodafone Group PLC | | | 27,325 | | | | 53,244 | | |
| | | | 227,024 | | |
Consumer Discretionary (1.1%): | |
Burberry Group PLC | | | 1,723 | | | | 38,108 | | |
Compass Group PLC | | | 3,163 | | | | 66,511 | | |
InterContinental Hotels Group PLC | | | 1,081 | | | | 58,370 | | |
Next PLC | | | 676 | | | | 34,382 | | |
Persimmon PLC | | | 2,119 | | | | 52,119 | | |
Whitbread PLC | | | 724 | | | | 42,249 | | |
| | | | 291,739 | | |
Consumer Staples (1.9%): | |
Associated British Foods PLC | | | 2,014 | | | | 52,437 | | |
British American Tobacco PLC | | | 1,007 | | | | 32,083 | | |
Diageo PLC | | | 2,345 | | | | 83,528 | | |
Imperial Tobacco Group PLC | | | 1,568 | | | | 47,499 | | |
Reckitt Benckiser Group PLC | | | 647 | | | | 49,580 | | |
Sainsbury (J) PLC | | | 10,161 | | | | 34,315 | | |
Tesco PLC | | | 19,652 | | | | 47,610 | | |
Unilever NV | | | 1,460 | | | | 79,313 | | |
Unilever PLC | | | 1,348 | | | | 70,580 | | |
| | | | 496,945 | | |
Energy (0.4%): | |
| BP PLC | | | 7,561 | | | | 47,789 | | |
Royal Dutch Shell PLC, Class A | | | 1,817 | | | | 53,432 | | |
| | | | 101,221 | | |
Financials (2.0%): | |
| 3I Group PLC | | | 5,472 | | | | 53,933 | | |
Aviva PLC | | | 11,740 | | | | 56,181 | | |
Hargreaves Lansdown PLC | | | 2,028 | | | | 47,787 | | |
Legal & General Group PLC | | | 21,769 | | | | 64,085 | | |
Lloyds Banking Group PLC | | | 121,086 | | | | 80,011 | | |
London Stock Exchange Group PLC | | | 1,156 | | | | 59,842 | | |
Prudential PLC | | | 2,475 | | | | 44,221 | | |
Schroders PLC | | | 1,687 | | | | 52,523 | | |
Standard Life Aberdeen PLC | | | 14,642 | | | | 47,909 | | |
| | | | 506,492 | | |
Health Care (0.6%): | |
AstraZeneca PLC | | | 961 | | | | 71,927 | | |
Smith & Nephew PLC | | | 3,804 | | | | 70,972 | | |
| | | | 142,899 | | |
See notes to financial statements.
47
Victory Portfolios II
VictoryShares International Volatility Wtd ETF | | Schedule of Portfolio Investments — continued
December 31, 2018 | |
(Unaudited)
Security Description | | Shares | | Value | |
Industrials (1.4%): | |
Ashtead Group PLC | | | 1,610 | | | $ | 33,588 | | |
BAE Systems PLC | | | 9,310 | | | | 54,483 | | |
Bunzl PLC | | | 2,659 | | | | 80,277 | | |
International Consolidated Airlines Group SA | | | 6,037 | | | | 47,546 | | |
Intertek Group PLC | | | 802 | | | | 49,060 | | |
Melrose Industries PLC | | | 9,797 | | | | 20,457 | | |
RELX PLC | | | 3,917 | | | | 80,693 | | |
| | | | 366,104 | | |
Materials (1.1%): | |
Anglo American PLC | | | 1,612 | | | | 35,906 | | |
Antofagasta PLC | | | 3,697 | | | | 36,900 | | |
Croda International PLC | | | 988 | | | | 58,989 | | |
DS Smith PLC | | | 7,907 | | | | 30,160 | | |
Johnson Matthey PLC | | | 1,166 | | | | 41,592 | | |
Mondi PLC | | | 1,681 | | | | 34,994 | | |
Rio Tinto PLC | | | 914 | | | | 43,447 | | |
| | | | 281,988 | | |
Utilities (0.7%): | |
Centrica PLC | | | 30,196 | | | | 51,912 | | |
National Grid PLC | | | 5,959 | | | | 58,035 | | |
SSE PLC | | | 4,255 | | | | 58,645 | | |
| | | | 168,592 | | |
| | | | 2,583,004 | | |
United States (0.5%): | |
Consumer Discretionary (0.2%): | |
Carnival PLC | | | 786 | | | | 37,693 | | |
Industrials (0.3%): | |
Waste Connections, Inc. | | | 1,178 | | | | 87,448 | | |
| | | | 125,141 | | |
Total Common Stocks (Cost $27,316,195) | | | 25,595,037 | | |
Rights (0.0%) (d) | |
Spain (0.0%): (d) | |
Energy (0.0%): (d) | |
Repsol SA Expires 01/10/19 @ $0.41 (b) | | | 2,535 | | | | 1,162 | | |
Total Rights (Cost $1,189) | | | 1,162 | | |
Collateral for Securities Loaned^ (1.0%) | |
United States (1.0%): | |
BlackRock Liquidity Funds TempFund Portfolio, Institutional Class, 2.49% (e) | | | 48,151 | | | | 48,151 | | |
Fidelity Investments Money Market Government Portfolio, Class I, 2.28% (e) | | | 69,576 | | | | 69,576 | | |
Fidelity Investments Prime Money Market Portfolio, Class I, 2.46% (e) | | | 2,149 | | | | 2,149 | | |
Goldman Sachs Financial Square Prime Obligations Fund, Institutional Class,
2.55% (e) | | | 26,751 | | | | 26,751 | | |
See notes to financial statements.
48
Victory Portfolios II
VictoryShares International Volatility Wtd ETF | | Schedule of Portfolio Investments — continued
December 31, 2018 | |
(Unaudited)
Security Description | | Shares | | Value | |
JPMorgan Prime Money Market Fund, Capital Class, 2.49% (e) | | | 42,799 | | | $ | 42,799 | | |
Morgan Stanley Institutional Liquidity Prime Portfolio, Institutional Class,
2.58% (e) | | | 64,202 | | | | 64,202 | | |
Total Collateral for Securities Loaned (Cost $253,628) | | | 253,628 | | |
Total Investments (Cost $27,571,012) — 100.7% | | | 25,849,827 | | |
Liabilities in excess of other assets — (0.7)% | | | (188,324 | ) | |
NET ASSETS — 100.00% | | $ | 25,661,503 | | |
^ Purchased with cash collateral from securities on loan.
(a) All or a portion of this security is on loan.
(b) Non-income producing security.
(c) Rule 144A security or other security that is restricted as to resale to institutional investors. The Fund's Adviser has deemed this security to be liquid based upon procedures approved by the Board of Trustees. As of December 31, 2018, the fair value of these securities was $239,978 and amounted to 0.9% of net assets.
(d) Amount represents less than 0.05% of net assets.
(e) Rate disclosed is the daily yield on December 31, 2018.
ADR — American Depositary Receipt
PLC — Public Limited Company
See notes to financial statements.
49
Victory Portfolios II
VictoryShares Emerging Market Volatility Wtd ETF | | Schedule of Portfolio Investments
December 31, 2018 | |
(Unaudited)
Security Description | | Shares | | Value | |
Common Stocks (99.4%) | |
Brazil (5.3%): | |
Communication Services (0.2%): | |
TIM Participacoes SA | | | 10,600 | | | $ | 32,413 | | |
Consumer Discretionary (0.6%): | |
Kroton Educacional S.A. | | | 7,400 | | | | 16,938 | | |
Lojas Renner SA | | | 4,320 | | | | 47,265 | | |
Magazine Luiza SA | | | 600 | | | | 28,034 | | |
| | | | 92,237 | | |
Consumer Staples (1.0%): | |
Ambev SA | | | 10,600 | | | | 42,069 | | |
M Dias Branco SA | | | 2,400 | | | | 26,506 | | |
Natura Cosmeticos SA | | | 3,400 | | | | 39,481 | | |
Raia Drogasil SA | | | 1,600 | | | | 23,596 | | |
Sao Martinho SA | | | 9,500 | | | | 44,591 | | |
| | | | 176,243 | | |
Energy (0.2%): | |
Ultrapar Participacoes SA | | | 2,400 | | | | 32,947 | | |
Financials (0.7%): | |
B3 SA - Brasil Bolsa Balcao | | | 5,258 | | | | 36,376 | | |
Banco do Brasil SA | | | 3,300 | | | | 39,589 | | |
BB Seguridade Participacoes SA | | | 6,500 | | | | 46,276 | | |
| | | | 122,241 | | |
Health Care (0.6%): | |
Fleury SA | | | 4,700 | | | | 23,989 | | |
Hypermarcas S.A. | | | 4,800 | | | | 37,406 | | |
Odontoprev SA | | | 9,800 | | | | 34,772 | | |
| | | | 96,167 | | |
Industrials (0.6%): | |
CCR SA | | | 12,400 | | | | 35,837 | | |
Localiza Rent a Car SA | | | 4,360 | | | | 33,471 | | |
WEG SA | | | 7,020 | | | | 31,773 | | |
| | | | 101,081 | | |
Information Technology (0.1%): | |
Cielo SA | | | 6,792 | | | | 15,581 | | |
Materials (0.3%): | |
Cia Siderurgica Nacional SA | | | 8,900 | | | | 20,302 | | |
Vale SA | | | 2,400 | | | | 31,585 | | |
| | | | 51,887 | | |
Utilities (1.0%): | |
Cia de Saneamento Basico do Estado de Sao Paulo | | | 4,800 | | | | 39,016 | | |
EDP - Energias do Brasil SA | | | 7,700 | | | | 29,307 | | |
See notes to financial statements.
50
Victory Portfolios II
VictoryShares Emerging Market Volatility Wtd ETF | | Schedule of Portfolio Investments — continued
December 31, 2018 | |
(Unaudited)
Security Description | | Shares | | Value | |
Engie Brasil Energia SA | | | 5,975 | | | $ | 50,911 | | |
Equatorial Energia SA - ORD | | | 2,900 | | | | 55,796 | | |
| | | | 175,030 | | |
| | | | 895,827 | | |
Cayman Islands (0.1%): | |
Consumer Discretionary (0.1%): | |
Nexteer Automotive Group Ltd. | | | 11,000 | | | | 15,678 | | |
Chile (4.2%): | |
Consumer Discretionary (0.4%): | |
SACI Falabella | | | 8,344 | | | | 61,232 | | |
Consumer Staples (0.2%): | |
Cencosud SA | | | 20,409 | | | | 36,972 | | |
Energy (0.3%): | |
Empresas COPEC SA | | | 4,575 | | | | 54,934 | | |
Financials (1.7%): | |
Banco de Chile | | | 615,617 | | | | 88,027 | | |
Banco de Credito e Inversiones | | | 866 | | | | 56,295 | | |
Banco Santander Chile | | | 914,054 | | | | 68,124 | | |
Sociedad Matriz del Banco de Chile SA, Class B | | | 172,279 | | | | 78,679 | | |
| | | | 291,125 | | |
Materials (0.3%): | |
Empresas Cmpc SA | | | 13,696 | | | | 43,566 | | |
Utilities (1.3%): | |
AES Gener SA | | | 179,321 | | | | 49,875 | | |
Aguas Andinas SA | | | 123,273 | | | | 67,848 | | |
Colbun SA | | | 204,473 | | | | 41,086 | | |
Enersis SA | | | 374,537 | | | | 66,159 | | |
| | | | 224,968 | | |
| | | | 712,797 | | |
China (15.6%): | |
Communication Services (0.6%): | |
China Communications Services Corp. Ltd. | | | 32,000 | | | | 26,483 | | |
China Telecom Corp. Ltd. | | | 104,000 | | | | 53,129 | | |
Tencent Holdings Ltd. | | | 700 | | | | 28,071 | | |
| | | | 107,683 | | |
Consumer Discretionary (1.4%): | |
ANTA Sports Products Ltd. | | | 4,000 | | | | 19,183 | | |
BAIC Motor Corp. Ltd., Class H (a) | | | 22,500 | | | | 11,868 | | |
Brilliance China Automotive Holdings Ltd. | | | 10,000 | | | | 7,446 | | |
BYD Co. Ltd. | | | 4,500 | | | | 28,707 | | |
Chongqing Changan Automobile Co. Ltd. | | | 39,100 | | | | 17,428 | | |
Dongfeng Motor Group Co. Ltd. | | | 28,000 | | | | 25,389 | | |
Fuyao Glass Industry Group Co. Ltd. (a) | | | 7,600 | | | | 24,314 | | |
Great Wall Motor Co. Ltd., Class H | | | 48,000 | | | | 27,525 | | |
See notes to financial statements.
51
Victory Portfolios II
VictoryShares Emerging Market Volatility Wtd ETF | | Schedule of Portfolio Investments — continued
December 31, 2018 | |
(Unaudited)
Security Description | | Shares | | Value | |
Guangzhou Automobile Group Co. Ltd. | | | 20,800 | | | $ | 20,747 | | |
Minth Group Ltd. | | | 4,000 | | | | 12,899 | | |
Shenzhou International Group Holdings Ltd. | | | 2,000 | | | | 22,669 | | |
Zhongsheng Group Holdings Ltd. | | | 9,500 | | | | 18,830 | | |
| | | | 237,005 | | |
Consumer Staples (0.5%): | |
China Mengniu Dairy Co. Ltd. | | | 8,000 | | | | 24,930 | | |
China Resources Beer Holdings Co. Ltd. | | | 6,000 | | | | 20,958 | | |
Uni-President China Holdings Ltd. | | | 22,000 | | | | 19,106 | | |
Want Want China Holdings Ltd. | | | 34,000 | | | | 23,795 | | |
| | | | 88,789 | | |
Energy (0.5%): | |
China Petroleum & Chemical Corp., Class H | | | 32,000 | | | | 22,846 | | |
China Shenhua Energy Co. Ltd. | | | 12,000 | | | | 26,299 | | |
PetroChina Co. Ltd. | | | 42,000 | | | | 26,176 | | |
Yanzhou Coal Mining Co. Ltd. | | | 16,000 | | | | 12,914 | | |
| | | | 88,235 | | |
Financials (5.2%): | |
Agricultural Bank of China Ltd. | | | 78,000 | | | | 34,169 | | |
Bank of China Ltd. | | | 118,000 | | | | 50,937 | | |
Bank of Communications Co. Ltd., Class H | | | 68,000 | | | | 53,063 | | |
China Cinda Asset Management Co. | | | 140,000 | | | | 33,972 | | |
China CITIC Bank Corp. Ltd. | | | 59,000 | | | | 35,867 | | |
China Construction Bank Corp. | | | 49,000 | | | | 40,427 | | |
China Everbright Bank Co. Ltd. | | | 104,000 | | | | 45,027 | | |
China Galaxy Securities Co. Ltd. | | | 69,500 | | | | 31,421 | | |
China Huarong Asset Management Co. Ltd., Class H (a) | | | 125,000 | | | | 22,829 | | |
China International Capital Corp. Ltd., Class H (a) (b) | | | 14,000 | | | | 26,283 | | |
China Life Insurance Co. Ltd. | | | 23,000 | | | | 48,879 | | |
China Merchants Bank Co. Ltd., Class H | | | 8,500 | | | | 31,156 | | |
China Pacific Insurance Group Co. Ltd. | | | 9,800 | | | | 31,728 | | |
China Reinsurance Group Corp. | | | 208,000 | | | | 42,503 | | |
Chongqing Rural Commercial Bank Co. Ltd. | | | 62,000 | | | | 33,257 | | |
Citic Securities Co. Ltd. | | | 17,000 | | | | 29,310 | | |
Gf Securities Co. Ltd. | | | 29,200 | | | | 39,605 | | |
Haitong Securities Co. Ltd. | | | 37,600 | | | | 36,015 | | |
Huatai Securities Co. Ltd. (a) (b) | | | 21,200 | | | | 33,573 | | |
Industrial & Commercial Bank of China Ltd. | | | 59,000 | | | | 42,121 | | |
New China Life Insurance Co. Ltd., Class H | | | 5,500 | | | | 21,845 | | |
People's Insurance Co. Group of China Ltd. | | | 76,000 | | | | 30,575 | | |
PICC Property & Casualty Co. Ltd., Class H | | | 29,000 | | | | 29,667 | | |
Ping An Insurance Group Co. of China Ltd. | | | 4,000 | | | | 35,326 | | |
Postal Savings Bank of China Co. Ltd., Class H (a) | | | 58,000 | | | | 30,593 | | |
| | | | 890,148 | | |
Health Care (0.8%): | |
3SBio, Inc. (a) | | | 10,500 | | | | 13,464 | | |
China Resources Pharmaceutical Group Ltd. (a) | | | 18,000 | | | | 23,494 | | |
Guangzhou Baiyunshan Pharmaceutical Holdings Co. Ltd. | | | 4,000 | | | | 14,329 | | |
See notes to financial statements.
52
Victory Portfolios II
VictoryShares Emerging Market Volatility Wtd ETF | | Schedule of Portfolio Investments — continued
December 31, 2018 | |
(Unaudited)
Security Description | | Shares | | Value | |
Shandong Weigao Group Medical Polymer Co. Ltd., Class H | | | 20,000 | | | $ | 16,194 | | |
Shanghai Fosun Pharmaceutical Group Co. Ltd. | | | 5,500 | | | | 16,156 | | |
Shanghai Pharmaceuticals Holding Co. Ltd. | | | 10,500 | | | | 21,349 | | |
Sinopharm Group Co. Ltd. | | | 5,200 | | | | 21,849 | | |
| | | | 126,835 | | |
Industrials (2.6%): | |
Beijing Capital International Airport Co. Ltd. | | | 18,000 | | | | 19,103 | | |
China Communications Construction Co. Ltd. | | | 34,000 | | | | 32,133 | | |
China Conch Venture Holdings Ltd. | | | 9,000 | | | | 26,782 | | |
China Railway Construction Corp. Ltd. | | | 24,500 | | | | 33,981 | | |
China Railway Group Ltd. | | | 40,000 | | | | 36,424 | | |
China State Construction Int | | | 30,000 | | | | 23,831 | | |
Crrc Corp. Ltd., Class H | | | 50,000 | | | | 48,787 | | |
Fosun International Ltd. | | | 18,000 | | | | 26,207 | | |
Jiangsu Expressway Co. Ltd. | | | 26,000 | | | | 36,260 | | |
Metallurgical Corp. of China Ltd. | | | 155,000 | | | | 37,216 | | |
Shanghai Electric Group Co. Ltd. | | | 130,000 | | | | 41,507 | | |
Sinopec Engineering Group Co. Ltd., Class H | | | 28,000 | | | | 22,994 | | |
Weichai Power Co. Ltd. | | | 17,000 | | | | 19,432 | | |
Xinjiang Goldwind Science & Technology Co. Ltd. | | | 15,800 | | | | 14,004 | | |
Zhuzhou CSR Times Electric Co. Ltd. | | | 5,500 | | | | 30,485 | | |
| | | | 449,146 | | |
Information Technology (1.0%): | |
AAC Technologies Holdings, Inc. (b) | | | 2,000 | | | | 11,609 | | |
BOE Technology Group Co. Ltd. | | | 62,900 | | | | 18,235 | | |
China Railway Signal & Communication Corp. Ltd. (a) | | | 50,000 | | | | 34,994 | | |
Legend Holdings Corp. (a) | | | 10,100 | | | | 26,443 | | |
Semiconductor Manufacturing International Corp. (c) | | | 20,000 | | | | 17,497 | | |
Silergy Corp. | | | 1,000 | | | | 14,739 | | |
Sunny Optical Technology Group Co. Ltd. | | | 1,200 | | | | 10,667 | | |
TravelSky Technology Ltd. | | | 11,000 | | | | 28,167 | | |
| | | | 162,351 | | |
Materials (1.2%): | |
Aluminum Corp. of China Ltd. (c) | | | 56,000 | | | | 18,023 | | |
Angang Steel Co. Ltd. | | | 24,000 | | | | 16,552 | | |
Anhui Conch Cement Co. Ltd. | | | 4,000 | | | | 19,412 | | |
China Hongqiao Group Ltd. | | | 27,500 | | | | 15,629 | | |
China Molybdenum Co. Ltd. | | | 45,000 | | | | 16,552 | | |
China National Building Material Co. Ltd. | | | 22,000 | | | | 15,060 | | |
Jiangxi Copper Co. Ltd. | | | 32,000 | | | | 37,640 | | |
Maanshan Iron & Steel, Series H | | | 44,000 | | | | 19,387 | | |
Sinopec Shanghai Petrochemical Co. Ltd. | | | 56,000 | | | | 24,531 | | |
Zijin Mining Group Co. Ltd. | | | 74,000 | | | | 28,069 | | |
| | | | 210,855 | | |
Real Estate (1.0%): | |
China Vanke Co. Ltd. (b) | | | 7,100 | | | | 24,120 | | |
Cifi Holdings Group Co. Ltd. | | | 34,000 | | | | 18,064 | | |
Country Garden Holdings Co. Ltd. | | | 14,000 | | | | 17,039 | | |
See notes to financial statements.
53
Victory Portfolios II
VictoryShares Emerging Market Volatility Wtd ETF | | Schedule of Portfolio Investments — continued
December 31, 2018 | |
(Unaudited)
Security Description | | Shares | | Value | |
Guangzhou R&f Properties Co. Ltd., Class H | | | 11,600 | | | $ | 17,541 | | |
Logan Property Holdings Co. Ltd. | | | 18,000 | | | | 22,552 | | |
Longfor Properties Co. Ltd. | | | 8,500 | | | | 25,402 | | |
Red Star Macalline Group Corp. Ltd., Class H (a) | | | 25,200 | | | | 21,628 | | |
Sunac China Holdings Ltd. | | | 5,000 | | | | 16,283 | | |
| | | | 162,629 | | |
Utilities (0.8%): | |
CGN Power Co. Ltd., Class D (a) | | | 202,000 | | | | 47,985 | | |
China Longyuan Power Group Corp. Ltd. | | | 29,000 | | | | 19,741 | | |
China Resources Gas Group Ltd. (b) | | | 6,000 | | | | 23,755 | | |
ENN Energy Holdings Ltd. | | | 2,000 | | | | 17,739 | | |
Huadian Fuxin Energy Corp. Ltd., Class H | | | 114,000 | | | | 27,808 | | |
| | | | 137,028 | | |
| | | | 2,660,704 | | |
Colombia (0.8%): | |
Financials (0.3%): | |
Grupo de INV Suramericana | | | 5,776 | | | | 57,173 | | |
Materials (0.2%): | |
Grupo Argos SA | | | 7,456 | | | | 38,831 | | |
Utilities (0.3%): | |
Interconexion Electrica SA ESP | | | 9,568 | | | | 41,220 | | |
| | | | 137,224 | | |
Czech Republic (0.4%): | |
Financials (0.4%): | |
Komercni Banka AS | | | 1,817 | | | | 68,553 | | |
Egypt (0.5%): | |
Consumer Staples (0.2%): | |
Eastern Tobacco | | | 26,934 | | | | 24,521 | | |
Financials (0.2%): | |
Commercial International Bank | | | 9,048 | | | | 37,530 | | |
Industrials (0.1%): | |
Elsewedy Electric Co. | | | 22,925 | | | | 23,066 | | |
| | | | 85,117 | | |
Hong Kong (3.7%): | |
Communication Services (0.3%): | |
China Mobile Ltd. | | | 6,000 | | | | 57,739 | | |
Consumer Discretionary (0.3%): | |
Geely Automobile Holdings Ltd. | | | 11,000 | | | | 19,387 | | |
Haier Electronics Group Co. Ltd. | | | 10,000 | | | | 24,598 | | |
| | | | 43,985 | | |
Consumer Staples (0.1%): | |
Hengan International Group Co. Ltd. | | | 3,500 | | | | 25,479 | | |
See notes to financial statements.
54
Victory Portfolios II
VictoryShares Emerging Market Volatility Wtd ETF | | Schedule of Portfolio Investments — continued
December 31, 2018 | |
(Unaudited)
Security Description | | Shares | | Value | |
Energy (0.3%): | |
CNOOC Ltd. | | | 17,000 | | | $ | 26,271 | | |
Kunlun Energy Co. Ltd. | | | 30,000 | | | | 31,801 | | |
| | | | 58,072 | | |
Financials (0.3%): | |
BOC Hong Kong Holdings Ltd. | | | 10,500 | | | | 39,023 | | |
China Taiping Insurance Holdings Co. Ltd. | | | 7,000 | | | | 19,221 | | |
| | | | 58,244 | | |
Health Care (0.1%): | |
CSPC Pharmaceutical Group Ltd. | | | 8,000 | | | | 11,545 | | |
Industrials (0.7%): | |
China Everbright International Ltd. | | | 28,000 | | | | 25,103 | | |
China Merchants Holdings International | | | 22,000 | | | | 39,617 | | |
CITIC Ltd. | | | 32,000 | | | | 50,187 | | |
| | | | 114,907 | | |
Materials (0.1%): | |
China Resources Cement Holdings Ltd. | | | 16,000 | | | | 14,406 | | |
Real Estate (0.6%): | |
Agile Group Holdings Ltd. | | | 12,000 | | | | 14,115 | | |
China Overseas Land & Investment Ltd., Class H | | | 10,000 | | | | 34,355 | | |
China Resources Land Ltd. | | | 8,000 | | | | 30,753 | | |
Franshion Properties China Ltd. | | | 54,000 | | | | 24,276 | | |
| | | | 103,499 | | |
Utilities (0.9%): | |
Beijing Enterprises Holdings Ltd. | | | 8,000 | | | | 42,401 | | |
Beijing Enterprises Water Group Ltd. (b) | | | 50,000 | | | | 25,479 | | |
China Resources Power Holdings Co. Ltd. | | | 20,000 | | | | 38,467 | | |
Guangdong Investment Ltd. | | | 20,000 | | | | 38,672 | | |
| | | | 145,019 | | |
| | | | 632,895 | | |
Hungary (0.6%): | |
Energy (0.2%): | |
MOL Hungarian Oil & Gas PLC | | | 3,248 | | | | 35,708 | | |
Financials (0.2%): | |
OTP Bank Public Co. Ltd. | | | 936 | | | | 37,745 | | |
Health Care (0.2%): | |
Richter Gedeon Nyrt. | | | 1,839 | | | | 35,667 | | |
| | | | 109,120 | | |
India (13.6%): | |
Communication Services (0.7%): | |
Bharti Airtel Ltd. | | | 5,915 | | | | 26,479 | | |
Bharti Infratel Ltd. | | | 10,252 | | | | 38,037 | | |
Zee Entertainment Enterprises Ltd. | | | 6,946 | | | | 47,408 | | |
| | | | 111,924 | | |
See notes to financial statements.
55
Victory Portfolios II
VictoryShares Emerging Market Volatility Wtd ETF | | Schedule of Portfolio Investments — continued
December 31, 2018 | |
(Unaudited)
Security Description | | Shares | | Value | |
Consumer Discretionary (1.7%): | |
Apollo Tyres Ltd. | | | 10,804 | | | $ | 36,518 | | |
Bajaj Auto Ltd. | | | 998 | | | | 38,888 | | |
Eicher Motors Ltd. | | | 107 | | | | 35,497 | | |
Infibeam Avenues Ltd. | | | 11,197 | | | | 7,611 | | |
Mahindra & Mahindra Ltd. | | | 3,396 | | | | 39,106 | | |
Motherson Sumi Systems Ltd. | | | 11,294 | | | | 26,994 | | |
Page Industries Ltd. | | | 64 | | | | 23,139 | | |
Rajesh Exports Ltd. | | | 4,289 | | | | 35,082 | | |
Titan Co. Ltd. | | | 2,964 | | | | 39,530 | | |
| | | | 282,365 | | |
Consumer Staples (2.2%): | |
Britannia Industries Ltd. | | | 1,244 | | | | 55,518 | | |
Colgate-Palmolive (India) Ltd. | | | 3,278 | | | | 63,090 | | |
Dabur India Ltd. | | | 6,476 | | | | 39,951 | | |
Emami Ltd. | | | 4,922 | | | | 29,621 | | |
Glaxo Smithkline Consumer Healthcare Ltd. | | | 345 | | | | 37,784 | | |
Godrej Consumer Products Ltd. | | | 3,283 | | | | 38,124 | | |
Marico Ltd. | | | 7,763 | | | | 41,524 | | |
Nestle India Ltd. | | | 243 | | | | 38,586 | | |
Tata Global Beverages Ltd. | | | 8,364 | | | | 26,288 | | |
| | | | 370,486 | | |
Energy (0.2%): | |
Reliance Industries Ltd. | | | 2,411 | | | | 38,726 | | |
Financials (1.3%): | |
Bajaj Finserv Ltd. | | | 386 | | | | 35,814 | | |
Housing Development Finance Corp. Ltd. | | | 2,072 | | | | 58,424 | | |
ICICI Bank Ltd. | | | 6,282 | | | | 32,410 | | |
Indiabulls Housing Finance Ltd. | | | 1,816 | | | | 22,212 | | |
Kotak Mahindra Bank Ltd. | | | 2,669 | | | | 48,041 | | |
L&t Finance Holdings Ltd. | | | 11,472 | | | | 25,078 | | |
| | | | 221,979 | | |
Health Care (1.7%): | |
Aurobindo Pharma Ltd. | | | 3,362 | | | | 35,300 | | |
Biocon Ltd. | | | 3,994 | | | | 35,991 | | |
Cadila Healthcare Ltd. | | | 5,095 | | | | 25,432 | | |
Cipla Ltd. | | | 4,277 | | | | 31,829 | | |
Dr. Reddy's Laboratories Ltd. | | | 899 | | | | 33,696 | | |
Glenmark Pharmaceuticals Ltd. | | | 4,104 | | | | 40,744 | | |
Natco Pharma Ltd. | | | 3,690 | | | | 35,947 | | |
Sun Pharmaceutical Industries Ltd. | | | 3,280 | | | | 20,228 | | |
Torrent Pharmaceuticals Ltd. | | | 1,575 | | | | 39,966 | | |
| | | | 299,133 | | |
Industrials (1.4%): | |
ABB India Ltd. | | | 2,064 | | | | 39,524 | | |
Adani Enterprises Ltd. | | | 5,263 | | | | 12,138 | | |
Adani Ports And Special Economic Zone | | | 6,617 | | | | 36,750 | | |
See notes to financial statements.
56
Victory Portfolios II
VictoryShares Emerging Market Volatility Wtd ETF | | Schedule of Portfolio Investments — continued
December 31, 2018 | |
(Unaudited)
Security Description | | Shares | | Value | |
Amara Raja Batteries Ltd. | | | 3,118 | | | $ | 33,180 | | |
Godrej Industries Ltd. | | | 4,503 | | | | 35,249 | | |
Larsen & Toubro Ltd. | | | 2,288 | | | | 47,117 | | |
Voltas Ltd. | | | 4,208 | | | | 33,365 | | |
| | | | 237,323 | | |
Information Technology (1.6%): | |
HCL Technologies Ltd. | | | 2,555 | | | | 35,296 | | |
Hexaware Technologies Ltd. | | | 3,240 | | | | 15,451 | | |
Infosys Ltd. | | | 4,395 | | | | 41,487 | | |
Mindtree Ltd. | | | 1,732 | | | | 21,449 | | |
Mphasis Ltd. | | | 1,414 | | | | 20,630 | | |
Sterlite Technologies Ltd. | | | 4,263 | | | | 17,920 | | |
Tata Consultancy Services Ltd. | | | 1,484 | | | | 40,243 | | |
Tech Mahindra Ltd. | | | 3,066 | | | | 31,761 | | |
Wipro Ltd. | | | 11,360 | | | | 53,840 | | |
| | | | 278,077 | | |
Materials (2.2%): | |
ACC Ltd. | | | 1,396 | | | | 30,159 | | |
Ambuja Cements Ltd. | | | 9,785 | | | | 31,552 | | |
Asian Paints Ltd. | | | 2,662 | | | | 52,359 | | |
Berger Paints India Ltd. | | | 8,121 | | | | 38,425 | | |
Castrol India Ltd. | | | 15,574 | | | | 33,744 | | |
Grasim Industries Ltd. | | | 2,605 | | | | 30,809 | | |
JSW Steel Ltd. | | | 5,541 | | | | 24,348 | | |
Pidilite Industries Ltd. | | | 2,596 | | | | 41,199 | | |
Tata Steel Ltd. | | | 3,454 | | | | 25,781 | | |
Ultra Tech Cement Ltd. | | | 706 | | | | 40,363 | | |
UPL Ltd. | | | 2,848 | | | | 30,935 | | |
| | | | 379,674 | | |
Real Estate (0.1%): | |
DLF Ltd. | | | 8,775 | | | | 22,319 | | |
Utilities (0.5%): | |
Reliance Infrastructure Ltd. | | | 3,625 | | | | 16,420 | | |
Tata Power Co. Ltd. | | | 34,112 | | | | 37,529 | | |
Torrent Power Ltd. | | | 7,275 | | | | 27,283 | | |
| | | | 81,232 | | |
| | | | 2,323,238 | | |
Indonesia (3.4%): | |
Communication Services (0.3%): | |
PT Surya Citra Media TBK | | | 172,800 | | | | 22,479 | | |
PT Telekomunikasi Indonesia Persero TBK | | | 116,000 | | | | 30,261 | | |
| | | | 52,740 | | |
Consumer Discretionary (0.2%): | |
PT Astra International TBK | | | 59,800 | | | | 34,216 | | |
See notes to financial statements.
57
Victory Portfolios II
VictoryShares Emerging Market Volatility Wtd ETF | | Schedule of Portfolio Investments — continued
December 31, 2018 | |
(Unaudited)
Security Description | | Shares | | Value | |
Consumer Staples (0.6%): | |
PT Charoen Pokphand Indonesia TBK | | | 60,400 | | | $ | 30,358 | | |
PT Gudang Garam TBK | | | 6,700 | | | | 38,976 | | |
PT Indofood Sukses Makmur TBK | | | 75,700 | | | | 39,232 | | |
| | | | 108,566 | | |
Energy (0.4%): | |
PT Adaro Energy TBK | | | 159,200 | | | | 13,456 | | |
PT Indo Tambangraya Megah TBK | | | 9,700 | | | | 13,664 | | |
PT United Tractors TBK | | | 11,600 | | | | 22,070 | | |
Tambang Batubara Bukit Asam TBK PT | | | 80,900 | | | | 24,200 | | |
| | | | 73,390 | | |
Financials (0.9%): | |
Bank Danamon Indonesia TBK PT | | | 60,400 | | | | 31,933 | | |
PT Bank Central Asia TBK | | | 23,000 | | | | 41,600 | | |
PT Bank Mandiri Persero TBK | | | 55,300 | | | | 28,372 | | |
PT Bank Negara Indonesia Persero TBK | | | 43,600 | | | | 26,691 | | |
PT Bank Rakyat Indonesia Persero TBK | | | 114,600 | | | | 29,178 | | |
| | | | 157,774 | | |
Health Care (0.2%): | |
PT Kalbe Farma TBK | | | 264,000 | | | | 27,915 | | |
Industrials (0.3%): | |
PT Jasa Marga Persero TBK | | | 81,500 | | | | 24,266 | | |
PT Waskita Karya Persero TBK | | | 178,500 | | | | 20,861 | | |
| | | | 45,127 | | |
Materials (0.4%): | |
PT Indocement Tunggal Prakarsa TBK | | | 15,800 | | | | 20,279 | | |
PT Semen Indonesia Persero TBK | | | 34,100 | | | | 27,280 | | |
Vale Indonesia TBK PT (c) | | | 76,300 | | | | 17,304 | | |
| | | | 64,863 | | |
Utilities (0.1%): | |
PT Perusahaan Gas Negara Persero TBK | | | 111,800 | | | | 16,488 | | |
| | | | 581,079 | | |
Malaysia (7.0%): | |
Communication Services (0.6%): | |
Astro Malaysia Holdings BHD | | | 41,200 | | | | 12,968 | | |
DiGi.Com Berhad | | | 31,500 | | | | 34,322 | | |
Maxis Berhad | | | 30,500 | | | | 39,510 | | |
Telekom Malaysia Berhad | | | 27,800 | | | | 17,905 | | |
| | | | 104,705 | | |
Consumer Discretionary (0.3%): | |
Genting Berhad | | | 25,000 | | | | 36,925 | | |
Genting Malaysia Berhad | | | 27,100 | | | | 19,817 | | |
| | | | 56,742 | | |
See notes to financial statements.
58
Victory Portfolios II
VictoryShares Emerging Market Volatility Wtd ETF | | Schedule of Portfolio Investments — continued
December 31, 2018 | |
(Unaudited)
Security Description | | Shares | | Value | |
Consumer Staples (2.3%): | |
British American Tobacco Malaysia BHD | | | 2,300 | | | $ | 20,093 | | |
Fraser & Neave Holdings Berhad | | | 5,200 | | | | 42,179 | | |
IOI Corp. Berhad | | | 53,700 | | | | 57,861 | | |
Kuala Lumpur Kepong Berhad | | | 15,400 | | | | 92,177 | | |
PPB Group Berhad | | | 20,860 | | | | 88,794 | | |
Ql Resources BHD | | | 32,900 | | | | 54,249 | | |
Sime Darby Plantation BHD | | | 35,500 | | | | 40,915 | | |
| | | | 396,268 | | |
Energy (0.1%): | |
Dialog Group Berhad | | | 31,100 | | | | 23,419 | | |
Financials (1.4%): | |
CIMB Group Holdings Berhad | | | 25,200 | | | | 34,841 | | |
Hong Leong Bank Berhad | | | 10,400 | | | | 51,371 | | |
Malayan Banking Berhad | | | 21,700 | | | | 49,915 | | |
Public Bank Berhad | | | 9,300 | | | | 55,755 | | |
RHB Capital Berhad | | | 33,397 | | | | 42,777 | | |
| | | | 234,659 | | |
Health Care (0.6%): | |
Hartalega Holdings Berhad | | | 18,200 | | | | 27,058 | | |
IHH Healthcare Berhad | | | 37,400 | | | | 48,810 | | |
Top Glove Corp. | | | 14,900 | | | | 20,203 | | |
| | | | 96,071 | | |
Industrials (0.7%): | |
AirAsia Berhad | | | 35,800 | | | | 25,745 | | |
Gamuda Berhad | | | 20,200 | | | | 11,445 | | |
IJM Corp. BHD | | | 39,500 | | | | 15,494 | | |
MISC BHD | | | 21,800 | | | | 35,365 | | |
Sime Darby BHD | | | 59,200 | | | | 34,402 | | |
| | | | 122,451 | | |
Information Technology (0.1%): | |
Inari Amertron Berhad | | | 36,700 | | | | 13,329 | | |
Materials (0.5%): | |
Petronas Chemicals Group Berhad | | | 26,500 | | | | 59,609 | | |
Press Metal Aluminium Holdings BHD | | | 17,600 | | | | 20,583 | | |
| | | | 80,192 | | |
Utilities (0.4%): | |
Petronas Gas Berhad | | | 10,400 | | | | 48,349 | | |
YTL Power International BHD | | | 98,600 | | | | 19,815 | | |
| | | | 68,164 | | |
| | | | 1,196,000 | | |
Mexico (3.8%): | |
Communication Services (0.1%): | |
Grupo Televisa Sab | | | 9,009 | | | | 22,624 | | |
See notes to financial statements.
59
Victory Portfolios II
VictoryShares Emerging Market Volatility Wtd ETF | | Schedule of Portfolio Investments — continued
December 31, 2018 | |
(Unaudited)
Security Description | | Shares | | Value | |
Consumer Discretionary (0.3%): | |
Alsea SAB de CV | | | 11,607 | | | $ | 30,217 | | |
El Puerto de Liverpool Sab de CV | | | 4,917 | | | | 31,575 | | |
| | | | 61,792 | | |
Consumer Staples (1.3%): | |
Arca Continental SAB de CV | | | 7,679 | | | | 42,901 | | |
Gruma SAB de CV, Class B | | | 3,484 | | | | 39,490 | | |
Grupo Bimbo Sab | | | 16,186 | | | | 32,252 | | |
Grupo Lala SAB de CV | | | 25,867 | | | | 27,766 | | |
Kimberly-Clark de Mexico SAB de CV, Series A | | | 21,580 | | | | 34,235 | | |
Wal-Mart de Mexico SAB de CV | | | 16,280 | | | | 41,405 | | |
| | | | 218,049 | | |
Financials (0.4%): | |
Grupo Financiero Banorte SAB de CV | | | 5,635 | | | | 27,470 | | |
Grupo Financiero Inbursa SAB de CV | | | 25,214 | | | | 36,304 | | |
| | | | 63,774 | | |
Industrials (1.0%): | |
Grupo Aeroportuario del Centro Norte SAB de CV | | | 6,810 | | | | 32,460 | | |
Grupo Aeroportuario del Pacifico SAB de CV | | | 3,995 | | | | 32,500 | | |
Grupo Aeroportuario del Sureste SAB de CV | | | 2,352 | | | | 35,460 | | |
Grupo Carso SAB de CV | | | 7,660 | | | | 27,450 | | |
Promotora y Operadora de Infraestructura SAB de CV | | | 4,615 | | | | 44,189 | | |
| | | | 172,059 | | |
Materials (0.5%): | |
Grupo Mexico SAB de CV, Series B | | | 10,485 | | | | 21,581 | | |
Industrias Penoles SAB de CV | | | 1,691 | | | | 20,651 | | |
Mexichem SA de CV | | | 16,975 | | | | 43,146 | | |
| | | | 85,378 | | |
Utilities (0.2%): | |
Infraestructura Energetica, Class N | | | 8,290 | | | | 30,915 | | |
| | | | 654,591 | | |
Philippines (3.1%): | |
Communication Services (0.1%): | |
Globe Telecom, Inc. | | | 660 | | | | 23,849 | | |
Consumer Discretionary (0.3%): | |
Bloomberry Resorts Corp. | | | 114,900 | | | | 20,563 | | |
Jollibee Foods Corp. | | | 6,190 | | | | 34,352 | | |
| | | | 54,915 | | |
Consumer Staples (0.2%): | |
Universal Robina Corp. | | | 12,480 | | | | 30,144 | | |
Financials (1.0%): | |
Ayala Corp. | | | 1,665 | | | | 28,500 | | |
Bank of the Philippine Islands | | | 17,436 | | | | 31,171 | | |
BDO Unibank, Inc. | | | 14,730 | | | | 36,643 | | |
See notes to financial statements.
60
Victory Portfolios II
VictoryShares Emerging Market Volatility Wtd ETF | | Schedule of Portfolio Investments — continued
December 31, 2018 | |
(Unaudited)
Security Description | | Shares | | Value | |
Metro Pacific Investments Co. | | | 266,300 | | | $ | 23,500 | | |
Metropolitan Bank & Trust Co. | | | 28,180 | | | | 43,385 | | |
| | | | 163,199 | | |
Industrials (0.9%): | |
Aboitiz Equity Ventures, Inc. | | | 25,200 | | | | 26,360 | | |
Alliance Global Group, Inc. | | | 158,000 | | | | 35,759 | | |
International Container Terminal Services, Inc. | | | 20,640 | | | | 39,254 | | |
JG Summit Holdings, Inc. | | | 22,890 | | | | 24,248 | | |
SM Investments Corp. | | | 1,717 | | | | 29,961 | | |
| | | | 155,582 | | |
Real Estate (0.4%): | |
Ayala Land, Inc. | | | 41,500 | | | | 32,045 | | |
SM Prime Holdings, Inc. | | | 43,100 | | | | 29,345 | | |
| | | | 61,390 | | |
Utilities (0.2%): | |
Manila Electric Co. | | | 5,020 | | | | 36,280 | | |
| | | | 525,359 | | |
Poland (2.0%): | |
Communication Services (0.3%): | |
Cd Projekt SA (c) | | �� | 384 | | | | 14,950 | | |
Cyfrowy Polsat SA (c) | | | 5,494 | | | | 33,141 | | |
| | | | 48,091 | | |
Energy (0.6%): | |
Grupa Lotos SA | | | 1,569 | | | | 37,128 | | |
Polski Koncern Naftowy Orlen SA | | | 1,108 | | | | 32,041 | | |
Polskie Gornictwo Naftowe i Gazownictwo SA | | | 22,056 | | | | 40,752 | | |
| | | | 109,921 | | |
Financials (1.0%): | |
Bank Pekao SA | | | 1,194 | | | | 34,799 | | |
Bank Zachodni WBK SA | | | 290 | | | | 27,776 | | |
mBank SA | | | 322 | | | | 36,523 | | |
Powszechna Kasa Oszczednosci Bank Polski SA | | | 2,922 | | | | 30,838 | | |
Powszechny Zaklad Ubezpieczen na Zycie SA | | | 2,919 | | | | 34,264 | | |
| | | | 164,200 | | |
Materials (0.1%): | |
Jastrzebska Spolka Weglowa SA (c) | | | 1,217 | | | | 21,887 | | |
| | | | 344,099 | | |
Russian Federation (2.2%): | |
Communication Services (0.5%): | |
Mobile TeleSystems PJSC | | | 11,760 | | | | 40,283 | | |
Rostelecom PJSC | | | 49,570 | | | | 52,130 | | |
| | | | 92,413 | | |
See notes to financial statements.
61
Victory Portfolios II
VictoryShares Emerging Market Volatility Wtd ETF | | Schedule of Portfolio Investments — continued
December 31, 2018 | |
(Unaudited)
Security Description | | Shares | | Value | |
Consumer Staples (0.3%): | |
Magnit PJSC, GDR | | | 1,722 | | | $ | 21,921 | | |
X5 Retail Group NV, Registered Shares, GDR | | | 1,044 | | | | 25,870 | | |
| | | | 47,791 | | |
Energy (0.2%): | |
Tatneft PAO | | | 3,910 | | | | 41,525 | | |
Materials (0.8%): | |
ALROSA AO | | | 22,700 | | | | 32,220 | | |
MMC Norilsk Nickel PJSC | | | 174 | | | | 32,653 | | |
Phosagro OAO-GDR REG S | | | 2,694 | | | | 34,349 | | |
Severstal PJSC | | | 2,300 | | | | 31,212 | | |
| | | | 130,434 | | |
Utilities (0.4%): | |
Federal Grid Co. Unified Energy System PJSC | | | 16,520,000 | | | | 35,217 | | |
Inter RAO UES PJSC | | | 586,000 | | | | 32,720 | | |
| | | | 67,937 | | |
| | | | 380,100 | | |
South Africa (6.4%): | |
Communication Services (0.6%): | |
Naspers Ltd. | | | 115 | | | | 23,177 | | |
Telkom SA SOC Ltd. | | | 10,671 | | | | 47,060 | | |
Vodacom Group Ltd. | | | 3,546 | | | | 32,616 | | |
| | | | 102,853 | | |
Consumer Discretionary (0.8%): | |
Imperial Holdings Ltd. | | | 4,665 | | | | 22,104 | | |
Motus Holdings Ltd. (c) | | | 2,008 | | | | 12,314 | | |
Mr. Price Group Ltd. | | | 1,992 | | | | 34,167 | | |
The Foschini Group Ltd. | | | 2,347 | | | | 27,187 | | |
Truworths International Ltd. | | | 4,858 | | | | 29,823 | | |
| | | | 125,595 | | |
Consumer Staples (1.5%): | |
Avi Ltd. | | | 5,683 | | | | 40,261 | | |
Clicks Group Ltd. | | | 2,376 | | | | 31,697 | | |
DIS-Chem Pharmacies Ltd. (a) | | | 10,224 | | | | 20,653 | | |
Pick n Pay Stores Ltd. | | | 7,061 | | | | 33,344 | | |
Pioneer Foods Group Ltd. | | | 4,341 | | | | 25,539 | | |
Shoprite Holdings Ltd. | | | 2,441 | | | | 32,343 | | |
The SPAR Group Ltd. | | | 3,187 | | | | 46,080 | | |
Tiger Brands Ltd. | | | 1,479 | | | | 28,215 | | |
| | | | 258,132 | | |
Financials (2.0%): | |
Absa Group Ltd. | | | 2,944 | | | | 33,196 | | |
Capitec Bank Holdings Ltd. | | | 504 | | | | 39,263 | | |
Discovery Ltd. | | | 2,948 | | | | 32,824 | | |
FirstRand Ltd. | | | 5,842 | | | | 26,688 | | |
See notes to financial statements.
62
Victory Portfolios II
VictoryShares Emerging Market Volatility Wtd ETF | | Schedule of Portfolio Investments — continued
December 31, 2018 | |
(Unaudited)
Security Description | | Shares | | Value | |
Investec Ltd. | | | 6,198 | | | $ | 34,119 | | |
Nedbank Group Ltd. | | | 1,871 | | | | 35,816 | | |
Remgro Ltd. | | | 2,896 | | | | 39,298 | | |
RMB Holdings Ltd. | | | 5,344 | | | | 29,380 | | |
Sanlam Ltd. | | | 5,369 | | | | 29,855 | | |
Standard Bank Group Ltd. | | | 2,544 | | | | 31,697 | | |
| | | | 332,136 | | |
Health Care (0.3%): | |
Aspen Pharmacare Holdings Ltd. | | | 1,690 | | | | 15,877 | | |
Life Healthcare Group Holdings Ltd. | | | 21,143 | | | | 38,894 | | |
| | | | 54,771 | | |
Industrials (0.3%): | |
Barloword Ltd. | | | 3,146 | | | | 25,241 | | |
The Bidvest Group Ltd. | | | 2,114 | | | | 30,470 | | |
| | | | 55,711 | | |
Materials (0.9%): | |
African Rainbow Minerals Ltd. | | | 2,316 | | | | 22,973 | | |
Anglo American Platinum Ltd. | | | 897 | | | | 33,623 | | |
Assore Ltd. | | | 944 | | | | 19,076 | | |
Mondi Ltd. | | | 1,229 | | | | 26,511 | | |
Sappi Ltd. | | | 4,704 | | | | 26,763 | | |
Sasol Ltd. | | | 993 | | | | 29,407 | | |
| | | | 158,353 | | |
| | | | 1,087,551 | | |
Taiwan (17.4%): | |
Communication Services (1.4%): | |
Chunghwa Telecom Co. Ltd. | | | 23,000 | | | | 84,559 | | |
Far EasTone Telecommunications Co. Ltd. | | | 27,000 | | | | 67,113 | | |
Taiwan Mobile Co. Ltd. | | | 25,000 | | | | 86,625 | | |
| | | | 238,297 | | |
Consumer Discretionary (1.6%): | |
Cheng Shin Rubber Industry Co. Ltd. | | | 33,000 | | | | 43,859 | | |
Eclat Textile Co. Ltd. | | | 2,000 | | | | 22,644 | | |
Feng TAY Enterprise Co. Ltd. | | | 5,000 | | | | 28,550 | | |
Formosa Taffeta Co. Ltd. | | | 45,000 | | | | 50,584 | | |
Hotai Motor Co. Ltd. | | | 5,000 | | | | 41,564 | | |
Pou Chen Corp. | | | 43,000 | | | | 45,608 | | |
Ruentex Industries Ltd. | | | 12,000 | | | | 30,687 | | |
| | | | 263,496 | | |
Consumer Staples (0.4%): | |
President Chain Store Corp. | | | 3,000 | | | | 30,355 | | |
Uni-President Enterprises Corp. | | | 16,000 | | | | 36,335 | | |
| | | | 66,690 | | |
See notes to financial statements.
63
Victory Portfolios II
VictoryShares Emerging Market Volatility Wtd ETF | | Schedule of Portfolio Investments — continued
December 31, 2018 | |
(Unaudited)
Security Description | | Shares | | Value | |
Financials (5.4%): | |
Cathay Financial Holding Co. Ltd. | | | 32,000 | | | $ | 48,933 | | |
Chailease Holding Co. Ltd. | | | 10,000 | | | | 31,526 | | |
Chang Hwa Commercial Bank Ltd. | | | 190,035 | | | | 106,344 | | |
China Development Financial Holding Corp. | | | 170,000 | | | | 53,761 | | |
CTBC Financial Holding Co. Ltd. | | | 82,800 | | | | 54,417 | | |
E.Sun Financial Holding Co. Ltd. | | | 112,013 | | | | 73,252 | | |
First Financial Holding Co. Ltd. | | | 148,040 | | | | 96,330 | | |
Fubon Financial Holding Co. Ltd. | | | 36,000 | | | | 55,108 | | |
Hua Nan Financial Holdings Co. Ltd. | | | 174,606 | | | | 99,414 | | |
Mega Financial Holding Co. Ltd. | | | 80,000 | | | | 67,543 | | |
Taishin Financial Holding Co. Ltd. | | | 181,650 | | | | 77,126 | | |
Taiwan Cooperative Financial Holding Co. Ltd. | | | 194,472 | | | | 111,675 | | |
Yuanta Financial Holding Co. Ltd. | | | 102,000 | | | | 51,272 | | |
| | | | 926,701 | | |
Industrials (1.8%): | |
AirTac International Group | | | 2,000 | | | | 19,554 | | |
China Airlines Ltd. | | | 189,000 | | | | 67,640 | | |
Eva Airways Corp. | | | 137,000 | | | | 70,425 | | |
Far Eastern New Century Corp. | | | 31,000 | | | | 28,140 | | |
Hiwin Technologies Corp. | | | 2,060 | | | | 14,812 | | |
Taiwan High Speed Rail Corp. | | | 81,000 | | | | 80,510 | | |
Walsin Lihwa Corp. | | | 30,000 | | | | 16,349 | | |
| | | | 297,430 | | |
Information Technology (5.2%): | |
Accton Technology Corp. | | | 5,000 | | | | 16,040 | | |
Acer, Inc. | | | 30,000 | | | | 18,984 | | |
Advantech Co. Ltd. | | | 8,000 | | | | 54,789 | | |
Asustek Computer, Inc. | | | 6,000 | | | | 39,335 | | |
AU Optronics Corp. | | | 83,000 | | | | 33,215 | | |
Catcher Technology Co. Ltd. | | | 3,000 | | | | 21,961 | | |
Chroma ATE, Inc. | | | 4,000 | | | | 15,357 | | |
Compal Electronics, Inc. | | | 104,000 | | | | 59,045 | | |
Delta Electronics, Inc. | | | 8,000 | | | | 33,706 | | |
Foxconn Technology Co. Ltd. | | | 20,100 | | | | 39,564 | | |
General Interface Solution Holding Ltd. | | | 4,000 | | | | 11,713 | | |
Hon Hai Precision Industry Co. Ltd. | | | 14,400 | | | | 33,170 | | |
Inventec Corp. | | | 65,000 | | | | 46,631 | | |
Macronix International Co. Ltd. | | | 18,000 | | | | 10,746 | | |
MediaTek, Inc. | | | 3,000 | | | | 22,401 | | |
Micro-Star International Co. Ltd. | | | 6,000 | | | | 14,914 | | |
Nanya Technology Corp. | | | 10,000 | | | | 17,894 | | |
Novatek Microelectronics Corp. | | | 7,000 | | | | 32,340 | | |
Pegatron Corp. | | | 21,000 | | | | 35,118 | | |
Powertech Technology, Inc. | | | 13,000 | | | | 27,958 | | |
Quanta Computer, Inc. | | | 28,000 | | | | 48,009 | | |
Realtek Semiconductor Corp. | | | 6,000 | | | | 27,915 | | |
SYNNEX Technology International Corp. | | | 27,000 | | | | 31,976 | | |
Taiwan Semiconductor Manufacturing Co. Ltd. | | | 5,000 | | | | 36,683 | | |
See notes to financial statements.
64
Victory Portfolios II
VictoryShares Emerging Market Volatility Wtd ETF | | Schedule of Portfolio Investments — continued
December 31, 2018 | |
(Unaudited)
Security Description | | Shares | | Value | |
United Microelectronics Corp. | | | 55,000 | | | $ | 20,131 | | |
Walsin Technology Corp. | | | 1,000 | | | | 5,010 | | |
Winbond Electronics Corp. | | | 46,000 | | | | 20,279 | | |
Wistron Corp. | | | 58,000 | | | | 36,043 | | |
WPG Holdings Ltd. | | | 38,000 | | | | 45,683 | | |
Yageo Corp. | | | 198 | | | | 2,055 | | |
Zhen Ding Technology Holding Ltd. | | | 13,000 | | | | 33,921 | | |
| | | | 892,586 | | |
Materials (1.6%): | |
Asia Cement Corp. | | | 24,000 | | | | 26,510 | | |
China Steel Corp. | | | 91,000 | | | | 71,797 | | |
Formosa Chemicals & Fibre | | | 11,000 | | | | 37,578 | | |
Formosa Plastics Corp. | | | 13,000 | | | | 42,719 | | |
Nan Ya Plastics Corp. | | | 20,000 | | | | 49,128 | | |
TA Chen Stainless Pipe | | | 13,000 | | | | 17,785 | | |
Taiwan Cement Corp. | | | 25,800 | | | | 29,883 | | |
| | | | 275,400 | | |
| | | | 2,960,600 | | |
Thailand (7.7%): | |
Communication Services (0.9%): | |
Advanced Info Service Public Co. Ltd. | | | 7,900 | | | | 41,857 | | |
Intouch Holdings Public Co. Ltd. | | | 39,300 | | | | 57,639 | | |
Total Access Communication Public Co. Ltd. | | | 15,700 | | | | 20,856 | | |
Vgi Global Media PCL | | | 155,300 | | | | 37,206 | | |
| | | | 157,558 | | |
Consumer Discretionary (0.8%): | |
Home Product Center Public Co. Ltd. | | | 83,900 | | | | 39,170 | | |
Minor International Public Co. Ltd. | | | 26,000 | | | | 27,152 | | |
Robinson PCL | | | 19,000 | | | | 37,058 | | |
Siam Global House PCL | | | 50,800 | | | | 30,426 | | |
| | | | 133,806 | | |
Consumer Staples (0.9%): | |
Berli Jucker PCL | | | 22,000 | | | | 34,293 | | |
Charoen Pokphand Foods Public Co. Ltd. | | | 43,000 | | | | 32,490 | | |
CP ALL Public Co. Ltd. | | | 24,600 | | | | 51,947 | | |
Thai Union Group Public Co. Ltd. | | | 70,800 | | | | 35,229 | | |
| | | | 153,959 | | |
Energy (0.6%): | |
Esso Thailand PCL | | | 47,400 | | | | 14,850 | | |
IRPC Public Co. Ltd. | | | 169,600 | | | | 29,953 | | |
PTT PCL | | | 23,000 | | | | 32,496 | | |
Thai Oil PCL | | | 11,100 | | | | 22,587 | | |
| | | | 99,886 | | |
Financials (1.0%): | |
Bangkok Bank Public Co. Ltd. | | | 8,300 | | | | 51,751 | | |
Kasikornbank Public Co. Ltd. | | | 6,100 | | | | 34,662 | | |
See notes to financial statements.
65
Victory Portfolios II
VictoryShares Emerging Market Volatility Wtd ETF | | Schedule of Portfolio Investments — continued
December 31, 2018 | |
(Unaudited)
Security Description | | Shares | | Value | |
Krung Thai Bank Public Co. Ltd. | | | 85,500 | | | $ | 50,422 | | |
The Siam Commercial Bank Public Co. Ltd. | | | 9,200 | | | | 37,724 | | |
| | | | 174,559 | | |
Health Care (0.4%): | |
Bangkok Dusit Medical Services Public Co. Ltd. | | | 41,400 | | | | 31,536 | | |
Bumrungrad Hospital Public Co. Ltd. | | | 6,800 | | | | 39,161 | | |
| | | | 70,697 | | |
Industrials (1.0%): | |
Airports of Thailand PCL | | | 26,700 | | | | 52,690 | | |
Bangkok Expressway & Metro PCL | | | 182,700 | | | | 54,433 | | |
Bts Group Holdings PCL | | | 202,000 | | | | 59,252 | | |
| | | | 166,375 | | |
Materials (0.7%): | |
Indorama Ventures Public Co. Ltd. | | | 18,000 | | | | 29,993 | | |
PTT Global Chemical Public Co. Ltd. | | | 12,100 | | | | 26,480 | | |
The Siam Cement Public Co. Ltd. | | | 3,850 | | | | 51,558 | | |
| | | | 108,031 | | |
Real Estate (0.4%): | |
Central Pattana Public Co. Ltd. | | | 18,000 | | | | 41,327 | | |
Wha Corp. PCL (b) | | | 245,200 | | | | 32,234 | | |
| | | | 73,561 | | |
Utilities (1.0%): | |
Banpu Power PCL | | | 63,200 | | | | 43,288 | | |
Global Power Synergy PCL | | | 19,200 | | | | 34,499 | | |
Ratchaburi Electricity Generating Holdings Public Co. Ltd. | | | 62,400 | | | | 97,268 | | |
| | | | 175,055 | | |
| | | | 1,313,487 | | |
Turkey (1.6%): | |
Communication Services (0.2%): | |
Turkcell Iletisim Hizmetleri AS | | | 15,840 | | | | 36,493 | | |
Consumer Discretionary (0.3%): | |
Ford Otomotiv Sanayi AS | | | 2,320 | | | | 21,959 | | |
Tofas Turk Otomobil Fabrikasi AS | | | 8,264 | | | | 26,439 | | |
| | | | 48,398 | | |
Consumer Staples (0.3%): | |
BIM Birlesik Magazalar AS | | | 3,005 | | | | 49,491 | | |
Energy (0.2%): | |
Tupras Turkiye Petrol Rafinerileri AS | | | 1,332 | | | | 29,426 | | |
Industrials (0.5%): | |
Enka Insaat ve Sanayi AS | | | 1 | | | | — | (d) | |
KOC Holding AS | | | 12,447 | | | | 33,459 | | |
TAV Havalimanlari Holding AS | | | 4,029 | | | | 18,244 | | |
Turkiye Sise ve Cam Fabrikalari AS | | | 28,349 | | | | 30,429 | | |
| | | | 82,132 | | |
See notes to financial statements.
66
Victory Portfolios II
VictoryShares Emerging Market Volatility Wtd ETF | | Schedule of Portfolio Investments — continued
December 31, 2018 | |
(Unaudited)
Security Description | | Shares | | Value | |
Materials (0.1%): | |
Eregli Demir ve Celik Fabrikalari TAS | | | 12,763 | | | $ | 17,444 | | |
| | | | 263,384 | | |
Total Common Stocks (Cost $17,039,568) | | | 16,947,403 | | |
Rights (0.0%) (e) | |
Taiwan (0.0%): (e) | |
Industrials (0.0%): (e) | |
Eva Airways Corp. Expires 01/21/19 @ $0.00 (c) (f) (g) | | | 7,941 | | | | 723 | | |
Total Rights (Cost $—) | | | 723 | | |
Collateral for Securities Loaned^ (1.8%) | |
United States (1.8%): | |
BlackRock Liquidity Funds TempFund Portfolio, Institutional Class,
2.49% (h) | | | 59,045 | | | | 59,045 | | |
Fidelity Investments Money Market Government Portfolio, Class I,
2.28% (h) | | | 85,318 | | | | 85,318 | | |
Fidelity Investments Prime Money Market Portfolio, Class I, 2.46% (h) | | | 2,635 | | | | 2,635 | | |
Goldman Sachs Financial Square Prime Obligations Fund, Institutional
Class, 2.55% (h) | | | 32,803 | | | | 32,803 | | |
JPMorgan Prime Money Market Fund, Capital Class, 2.49% (h) | | | 52,482 | | | | 52,482 | | |
Morgan Stanley Institutional Liquidity Prime Portfolio, Institutional
Class, 2.58% (h) | | | 78,728 | | | | 78,728 | | |
Total Collateral for Securities Loaned (Cost $311,011) | | | 311,011 | | |
Total Investments (Cost $17,350,579) — 101.2% | | | 17,259,137 | | |
Liabilities in excess of other assets — (1.2)% | | | (210,287 | ) | |
NET ASSETS — 100.00% | | $ | 17,048,850 | | |
^ Purchased with cash collateral from securities on loan.
(a) Rule 144A security or other security that is restricted as to resale to institutional investors. The Fund's Adviser has deemed this security to be liquid based upon procedures approved by the Board of Trustees. As of December 31, 2018, the fair value of these securities was $338,120 and amounted to 2.0% of net assets.
(b) All or a portion of this security is on loan.
(c) Non-income producing security.
(d) Rounds to less than $1.
(e) Amount represents less than 0.05% of net assets.
(f) Security was fair valued based upon procedures approved by the Board of Trustees and represents 0.0% of the Fund's net assets as of December 31, 2018. This security is classified as Level 3 within the fair value hierarchy. (See Note 2)
(g) The Fund's Adviser has deemed this security to be illiquid based upon procedures approved by the Board of Trustees. As of December 31, 2018, illiquid securities were 0.0% of the Fund's net assets.
(h) Rate disclosed is the daily yield on December 31, 2018.
GDR — Global Depository Receipt
OAO — Russian Open Joint Stock Corporations
See notes to financial statements.
67
Victory Portfolios II
VictoryShares Emerging Market Volatility Wtd ETF | | Schedule of Portfolio Investments — continued
December 31, 2018 | |
(Unaudited)
PCL — Public Company Limited
PLC — Public Limited Company
Futures Contracts Purchased
| | | Number
of
Contracts | | Expiration
Date | | Notional
Amount | | Value | | Unrealized
Appreciation
(Depreciation) | |
Mini MSCI Emerging Markets
Index Futures | | | 3 | | | 3/15/19 | | $ | 145,422 | | | $ | 145,020 | | | $ | (402 | ) | |
| | | Total unrealized appreciation | | | | | | | | $ | — | | |
| | | Total unrealized depreciation | | | | | | | | | (402 | ) | |
| | | Total net unrealized appreciation(depreciation) | | | | | | | | $ | (402 | ) | |
See notes to financial statements.
68
Victory Portfolios II
VictoryShares US Large Cap High Div Volatility Wtd ETF | | Schedule of Portfolio Investments
December 31, 2018 | |
(Unaudited)
Security Description | | Shares | | Value | |
Common Stocks (99.6%) | |
Communication Services (4.6%): | |
AT&T, Inc. | | | 54,792 | | | $ | 1,563,764 | | |
CenturyLink, Inc. | | | 52,929 | | | | 801,874 | | |
Omnicom Group, Inc. | | | 25,692 | | | | 1,881,682 | | |
Verizon Communications, Inc. | | | 37,049 | | | | 2,082,895 | | |
Viacom, Inc., Class B | | | 47,497 | | | | 1,220,673 | | |
| | | | 7,550,888 | | |
Consumer Discretionary (10.9%): | |
Ford Motor Co. | | | 181,152 | | | | 1,385,812 | | |
Garmin Ltd. | | | 31,854 | | | | 2,016,995 | | |
Genuine Parts Co. | | | 21,819 | | | | 2,095,060 | | |
Harley-Davidson, Inc. | | | 34,280 | | | | 1,169,634 | | |
Kohl's Corp. | | | 13,462 | | | | 893,069 | | |
L Brands, Inc. | | | 32,960 | | | | 846,083 | | |
Las Vegas Sands Corp. | | | 22,991 | | | | 1,196,682 | | |
Leggett & Platt, Inc. (a) | | | 39,174 | | | | 1,403,997 | | |
Macy's, Inc. | | | 23,671 | | | | 704,922 | | |
McDonald's Corp. | | | 11,410 | | | | 2,026,073 | | |
Newell Brands, Inc. | | | 46,433 | | | | 863,189 | | |
Penske Automotive Group, Inc. | | | 28,830 | | | | 1,162,426 | | |
Target Corp. | | | 18,338 | | | | 1,211,959 | | |
The Gap, Inc. | | | 30,812 | | | | 793,717 | | |
| | | | 17,769,618 | | |
Consumer Staples (14.3%): | |
Altria Group, Inc. | | | 28,210 | | | | 1,393,292 | | |
Archer-Daniels-Midland Co. | | | 49,128 | | | | 2,012,775 | | |
Colgate-Palmolive Co. | | | 34,759 | | | | 2,068,856 | | |
General Mills, Inc. | | | 33,409 | | | | 1,300,946 | | |
Ingredion, Inc. | | | 15,063 | | | | 1,376,758 | | |
Kellogg Co. | | | 24,390 | | | | 1,390,474 | | |
Kimberly-Clark Corp. | | | 14,880 | | | | 1,695,427 | | |
Molson Coors Brewing Co., Class B | | | 18,217 | | | | 1,023,067 | | |
Philip Morris International, Inc. | | | 16,266 | | | | 1,085,918 | | |
The Clorox Co. | | | 10,953 | | | | 1,688,295 | | |
The Hershey Co. | | | 18,290 | | | | 1,960,322 | | |
The J.M. Smucker Co. | | | 14,358 | | | | 1,342,329 | | |
The Kraft Heinz Co. | | | 26,352 | | | | 1,134,190 | | |
The Procter & Gamble Co. | | | 29,887 | | | | 2,747,213 | | |
Walgreens Boots Alliance, Inc. | | | 20,316 | | | | 1,388,192 | | |
| | | | 23,608,054 | | |
Electric Utilities (17.0%): | |
Alliant Energy Corp. | | | 57,230 | | | | 2,417,968 | | |
American Electric Power Co., Inc. | | | 33,757 | | | | 2,522,998 | | |
Duke Energy Corp. | | | 30,924 | | | | 2,668,741 | | |
Eversource Energy | | | 40,546 | | | | 2,637,112 | | |
Exelon Corp. | | | 61,438 | | | | 2,770,854 | | |
IDACORP, Inc. | | | 23,225 | | | | 2,161,319 | | |
See notes to financial statements.
69
Victory Portfolios II
VictoryShares US Large Cap High Div Volatility Wtd ETF | | Schedule of Portfolio Investments — continued
December 31, 2018 | |
(Unaudited)
Security Description | | Shares | | Value | |
NextEra Energy, Inc. | | | 16,076 | | | $ | 2,794,330 | | |
OGE Energy Corp. (a) | | | 66,356 | | | | 2,600,492 | | |
Pinnacle West Capital Corp. | | | 31,311 | | | | 2,667,697 | | |
PPL Corp. | | | 65,757 | | | | 1,862,896 | | |
Xcel Energy, Inc. | | | 49,226 | | | | 2,425,365 | | |
| | | | 27,529,772 | | |
Energy (6.1%): | |
Chevron Corp. | | | 15,464 | | | | 1,682,329 | | |
Exxon Mobil Corp. | | | 24,452 | | | | 1,667,382 | | |
Occidental Petroleum Corp. | | | 21,277 | | | | 1,305,982 | | |
ONEOK, Inc. | | | 31,860 | | | | 1,718,847 | | |
Phillips 66 | | | 15,775 | | | | 1,359,016 | | |
The Williams Cos., Inc. | | | 58,036 | | | | 1,279,694 | | |
Valero Energy Corp. | | | 13,236 | | | | 992,303 | | |
| | | | 10,005,553 | | |
Financials (17.4%): | |
American Financial Group, Inc. | | | 21,832 | | | | 1,976,451 | | |
Ameriprise Financial, Inc. | | | 10,924 | | | | 1,140,138 | | |
BB&T Corp. | | | 34,496 | | | | 1,494,367 | | |
CNA Financial Corp. | | | 44,510 | | | | 1,965,117 | | |
Erie Indemnity Co., Class A | | | 17,859 | | | | 2,380,784 | | |
First American Financial Corp. | | | 35,869 | | | | 1,601,192 | | |
FNF Group | | | 48,542 | | | | 1,526,160 | | |
Huntington Bancshares, Inc. | | | 112,595 | | | | 1,342,132 | | |
Invesco Ltd. | | | 59,691 | | | | 999,227 | | |
KeyCorp | | | 74,011 | | | | 1,093,883 | | |
New York Community Bancorp, Inc. (a) | | | 146,502 | | | | 1,378,584 | | |
Old Republic International Corp. | | | 105,706 | | | | 2,174,373 | | |
PacWest Bancorp | | | 37,997 | | | | 1,264,540 | | |
People's United Financial, Inc. (a) | | | 124,331 | | | | 1,794,096 | | |
Principal Financial Group, Inc. | | | 29,814 | | | | 1,316,884 | | |
Prudential Financial, Inc. | | | 16,627 | | | | 1,355,932 | | |
Umpqua Holdings Corp. | | | 76,868 | | | | 1,222,201 | | |
Unum Group | | | 29,466 | | | | 865,711 | | |
Wells Fargo & Co. | | | 31,012 | | | | 1,429,033 | | |
| | | | 28,320,805 | | |
Gas Utilities (1.3%): | |
National Fuel Gas Co. (a) | | | 43,051 | | | | 2,203,350 | | |
Health Care (2.3%): | |
AbbVie, Inc. | | | 12,044 | | | | 1,110,336 | | |
Pfizer, Inc. | | | 60,680 | | | | 2,648,682 | | |
| | | | 3,759,018 | | |
Industrials (7.6%): | |
3M Co. | | | 8,265 | | | | 1,574,813 | | |
Eaton Corp. PLC, ADR | | | 22,138 | | | | 1,519,995 | | |
Emerson Electric Co. | | | 22,005 | | | | 1,314,799 | | |
Fastenal Co. | | | 23,650 | | | | 1,236,659 | | |
See notes to financial statements.
70
Victory Portfolios II
VictoryShares US Large Cap High Div Volatility Wtd ETF | | Schedule of Portfolio Investments — continued
December 31, 2018 | |
(Unaudited)
Security Description | | Shares | | Value | |
Hubbell, Inc. | | | 12,821 | | | $ | 1,273,638 | | |
Johnson Controls International PLC | | | 40,525 | | | | 1,201,566 | | |
MSC Industrial Direct Co., Inc., Class A | | | 20,989 | | | | 1,614,473 | | |
United Parcel Service, Inc., Class B | | | 14,649 | | | | 1,428,717 | | |
Watsco, Inc. | | | 8,727 | | | | 1,214,275 | | |
| | | | 12,378,935 | | |
Information Technology (2.5%): | |
Broadcom, Inc. | | | 5,141 | | | | 1,307,253 | | |
Paychex, Inc. | | | 31,024 | | | | 2,021,214 | | |
Seagate Technology PLC | | | 21,096 | | | | 814,095 | | |
| | | | 4,142,562 | | |
Materials (6.9%): | |
Air Products & Chemicals, Inc. | | | 13,297 | | | | 2,128,185 | | |
International Paper Co. | | | 31,028 | | | | 1,252,290 | | |
Lyondellbasell Industries NV, Class A | | | 13,783 | | | | 1,146,194 | | |
Nucor Corp. | | | 22,716 | | | | 1,176,916 | | |
Olin Corp. | | | 45,317 | | | | 911,325 | | |
Packaging Corp. of America | | | 15,046 | | | | 1,255,739 | | |
Sonoco Products Co. | | | 40,612 | | | | 2,157,716 | | |
WestRock Co. | | | 32,151 | | | | 1,214,022 | | |
| | | | 11,242,387 | | |
Multi-Utilities (8.7%): | |
Consolidated Edison, Inc. | | | 31,388 | | | | 2,399,926 | | |
Dominion Resources, Inc. | | | 31,606 | | | | 2,258,565 | | |
DTE Energy Co. | | | 23,408 | | | | 2,581,903 | | |
MDU Resources Group, Inc. | | | 83,697 | | | | 1,995,336 | | |
Public Service Enterprise Group, Inc. | | | 46,086 | | | | 2,398,776 | | |
WEC Energy Group, Inc. | | | 37,226 | | | | 2,578,273 | | |
| | | | 14,212,779 | | |
Total Common Stocks (Cost $177,032,358) | | | 162,723,721 | | |
Collateral for Securities Loaned^ (2.3%) | |
BlackRock Liquidity Funds TempFund Portfolio, Institutional Class, 2.49% (b) | | | 707,774 | | | | 707,774 | | |
Fidelity Investments Money Market Government Portfolio, Class I, 2.28% (b) | | | 1,022,700 | | | | 1,022,700 | | |
Fidelity Investments Prime Money Market Portfolio, Class I, 2.46% (b) | | | 31,581 | | | | 31,581 | | |
Goldman Sachs Financial Square Prime Obligations Fund, Institutional Class,
2.55% (b) | | | 393,212 | | | | 393,212 | | |
JPMorgan Prime Money Market Fund, Capital Class, 2.49% (b) | | | 629,100 | | | | 629,100 | | |
Morgan Stanley Institutional Liquidity Prime Portfolio, Institutional Class,
2.58% (b) | | | 943,710 | | | | 943,710 | | |
Total Collateral for Securities Loaned (Cost $3,728,077) | | | 3,728,077 | | |
Total Investments (Cost $180,760,435) — 101.9% | | | 166,451,798 | | |
Liabilities in excess of other assets — (1.9)% | | | (3,083,580 | ) | |
NET ASSETS — 100.00% | | $ | 163,368,218 | | |
^ Purchased with cash collateral from securities on loan.
See notes to financial statements.
71
Victory Portfolios II
VictoryShares US Large Cap High Div Volatility Wtd ETF | | Schedule of Portfolio Investments — continued
December 31, 2018 | |
(Unaudited)
(a) All or a portion of this security is on loan.
(b) Rate disclosed is the daily yield on December 31, 2018.
ADR — American Depositary Receipt
PLC — Public Limited Company
Futures Contracts Purchased
| | | Number
of
Contracts | | Expiration
Date | | Notional
Amount | | Value | | Unrealized
Appreciation
(Depreciation) | |
E-Mini S&P 500 Futures | | | 3 | | | 3/15/19 | | $ | 385,575 | | | $ | 375,780 | | | $ | (9,795 | ) | |
| | | Total unrealized appreciation | | | | | | | | $ | — | | |
| | | Total unrealized depreciation | | | | | | | | | (9,795 | ) | |
| | | Total net unrealized appreciation(depreciation) | | | | | | | | $ | (9,795 | ) | |
See notes to financial statements.
72
Victory Portfolios II
VictoryShares US Small Cap High Div Volatility Wtd ETF | | Schedule of Portfolio Investments
December 31, 2018 | |
(Unaudited)
Security Description | | Shares | | Value | |
Common Stocks (99.2%) | |
Communication Services (3.6%): | |
Emerald Expositions Events, Inc. | | | 29,957 | | | $ | 369,669 | | |
Marcus Corp. | | | 14,244 | | | | 562,638 | | |
Sinclair Broadcast Group, Inc., Class A | | | 14,345 | | | | 377,847 | | |
TEGNA, Inc. | | | 38,513 | | | | 418,637 | | |
| | | | 1,728,791 | | |
Consumer Discretionary (16.4%): | |
Acushnet Holdings Corp. | | | 21,495 | | | | 452,899 | | |
Bed Bath & Beyond, Inc. | | | 20,238 | | | | 229,094 | | |
Big Lots, Inc. | | | 10,463 | | | | 302,590 | | |
Bloomin' Brands, Inc. | | | 29,848 | | | | 533,981 | | |
Bluegreen Vacations Corp. (a) | | | 19,498 | | | | 252,109 | | |
Brinker International, Inc. | | | 10,969 | | | | 482,417 | | |
Chico's FAS, Inc. | | | 34,956 | | | | 196,453 | | |
Ethan Allen Interiors, Inc. | | | 27,855 | | | | 489,969 | | |
Group 1 Automotive, Inc. | | | 5,162 | | | | 272,141 | | |
Haverty Furniture Cos., Inc. | | | 23,666 | | | | 444,447 | | |
Jack in the Box, Inc. | | | 6,563 | | | | 509,486 | | |
La-Z-Boy, Inc. | | | 13,007 | | | | 360,424 | | |
LCI Industries (a) | | | 4,153 | | | | 277,420 | | |
MDC Holdings, Inc. | | | 15,799 | | | | 444,110 | | |
Nutrisystem, Inc. | | | 8,930 | | | | 391,849 | | |
Papa John's International, Inc. (a) | | | 8,104 | | | | 322,620 | | |
PetMed Express, Inc. (a) | | | 9,663 | | | | 224,761 | | |
Ruth's Hospitality Group, Inc. | | | 14,876 | | | | 338,131 | | |
Sturm Ruger & Co. | | | 8,103 | | | | 431,242 | | |
Tenneco, Inc. | | | 11,134 | | | | 304,961 | | |
The Buckle, Inc. (a) | | | 14,329 | | | | 277,123 | | |
The Cheesecake Factory, Inc. (a) | | | 9,528 | | | | 414,563 | | |
| | | | 7,952,790 | | |
Consumer Staples (3.7%): | |
B&G Foods, Inc. (a) | | | 11,529 | | | | 333,303 | | |
Ingles Markets, Inc., Class A | | | 11,222 | | | | 305,463 | | |
John B. Sanfilippo & Son, Inc. (a) | | | 7,265 | | | | 404,370 | | |
Universal Corp. | | | 4,874 | | | | 263,927 | | |
Vector Group Ltd. | | | 51,248 | | | | 498,643 | | |
| | | | 1,805,706 | | |
Energy (1.9%): | |
Arch Coal, Inc. | | | 4,474 | | | | 371,297 | | |
Evolution Petroleum Corp. | | | 46,677 | | | | 318,337 | | |
RPC, Inc. | | | 25,357 | | | | 250,274 | | |
| | | | 939,908 | | |
Financials (24.6%): | |
Capitol Federal Financial, Inc. | | | 88,931 | | | | 1,135,649 | | |
Cohen & Steers, Inc. | | | 18,268 | | | | 626,957 | | |
Federated Investors, Inc., Class B | | | 21,283 | | | | 565,064 | | |
See notes to financial statements.
73
Victory Portfolios II
VictoryShares US Small Cap High Div Volatility Wtd ETF | | Schedule of Portfolio Investments — continued
December 31, 2018 | |
(Unaudited)
Security Description | | Shares | | Value | |
First Busey Corp. | | | 26,437 | | | $ | 648,764 | | |
Hope Bancorp, Inc. | | | 38,455 | | | | 456,076 | | |
Horace Mann Educators Corp. | | | 16,280 | | | | 609,686 | | |
James River Group Holdings Ltd. | | | 17,382 | | | | 635,138 | | |
Legg Mason, Inc. | | | 18,768 | | | | 478,772 | | |
Northwest Bancshares, Inc. | | | 56,335 | | | | 954,315 | | |
Park National Corp. | | | 7,119 | | | | 604,759 | | |
ProAssurance Corp. | | | 10,903 | | | | 442,226 | | |
Provident Financial Services, Inc. | | | 34,342 | | | | 828,672 | | |
Safety Insurance Group, Inc. | | | 9,211 | | | | 753,552 | | |
Sandy Spring BanCorp | | | 21,375 | | | | 669,893 | | |
Southside Bancshares, Inc. | | | 22,732 | | | | 721,741 | | |
Trustmark Corp. (a) | | | 22,385 | | | | 636,406 | | |
Waddell & Reed Financial, Inc., Class A (a) | | | 23,380 | | | | 422,710 | | |
Westamerica BanCorp (a) | | | 11,438 | | | | 636,868 | | |
| | | | 11,827,248 | | |
Health Care (1.7%): | |
Meridian Bioscience, Inc. | | | 46,352 | | | | 804,671 | | |
Industrials (22.7%): | |
Acco Brands Corp. | | | 48,358 | | | | 327,867 | | |
Aircastle Ltd. | | | 30,227 | | | | 521,113 | | |
Allegiant Travel Co. | | | 2,889 | | | | 289,536 | | |
Altra Industrial Motion Corp. | | | 15,917 | | | | 400,313 | | |
Applied Industrial Technologies, Inc. | | | 7,733 | | | | 417,118 | | |
Brady Corp., Class A | | | 18,230 | | | | 792,276 | | |
Deluxe Corp. | | | 13,044 | | | | 501,411 | | |
Gorman-Rupp Co. | | | 20,393 | | | | 660,937 | | |
H&E Equipment Services, Inc. | | | 9,833 | | | | 200,790 | | |
Herman Miller, Inc. | | | 12,134 | | | | 367,054 | | |
HNI Corp. | | | 11,633 | | | | 412,157 | | |
KBR, Inc. | | | 25,706 | | | | 390,217 | | |
Kimball International, Inc., Class B | | | 44,103 | | | | 625,822 | | |
Knoll, Inc. | | | 27,045 | | | | 445,702 | | |
Matson, Inc. | | | 17,121 | | | | 548,214 | | |
Matthews International Corp., Class A | | | 12,841 | | | | 521,601 | | |
McGrath RentCorp | | | 11,699 | | | | 602,265 | | |
Mobile Mini, Inc. | | | 10,836 | | | | 344,043 | | |
Mueller Water Products, Inc., Class A | | | 46,295 | | | | 421,285 | | |
National Presto Industries, Inc. (a) | | | 4,426 | | | | 517,488 | | |
Pitney Bowes, Inc. | | | 62,783 | | | | 371,048 | | |
Steelcase, Inc., Class A | | | 36,105 | | | | 535,437 | | |
The Greenbrier Cos., Inc. | | | 8,443 | | | | 333,836 | | |
Wabash National Corp. | | | 27,765 | | | | 363,166 | | |
| | | | 10,910,696 | | |
Information Technology (8.5%): | |
Cass Information Systems, Inc. | | | 11,033 | | | | 583,866 | | |
CSG Systems International, Inc. | | | 18,520 | | | | 588,381 | | |
InterDigital, Inc. | | | 10,490 | | | | 696,851 | | |
ManTech International Corp., Class A | | | 8,564 | | | | 447,854 | | |
See notes to financial statements.
74
Victory Portfolios II
VictoryShares US Small Cap High Div Volatility Wtd ETF | | Schedule of Portfolio Investments — continued
December 31, 2018 | |
(Unaudited)
Security Description | | Shares | | Value | |
MTS Systems Corp. (a) | | | 11,590 | | | $ | 465,107 | | |
NIC, Inc. | | | 36,304 | | | | 453,074 | | |
Progress Software Corp. | | | 8,977 | | | | 318,594 | | |
The Hackett Group, Inc. | | | 33,043 | | | | 529,018 | | |
| | | | 4,082,745 | | |
Materials (3.0%): | |
Greif, Inc., Class A | | | 8,808 | | | | 326,865 | | |
Myers Industries, Inc. | | | 16,192 | | | | 244,661 | | |
Rayonier Advanced Materials, Inc. | | | 18,376 | | | | 195,704 | | |
Schnitzer Steel Industries, Inc. | | | 14,101 | | | | 303,877 | | |
Worthington Industries, Inc. | | | 10,913 | | | | 380,208 | | |
| | | | 1,451,315 | | |
Real Estate (2.0%): | |
Four Corners Property Trust, Inc. | | | 36,188 | | | | 948,126 | | |
Utilities (11.1%): | |
American States Water Co. | | | 11,955 | | | | 801,463 | | |
Chesapeake Utilities Corp. | | | 8,800 | | | | 715,440 | | |
MGE Energy, Inc. | | | 13,520 | | | | 810,659 | | |
Middlesex Water Co. | | | 12,661 | | | | 675,464 | | |
Otter Tail Corp. | | | 18,333 | | | | 910,050 | | |
SJW Corp. | | | 8,719 | | | | 484,951 | | |
Unitil Corp. | | | 17,833 | | | | 903,063 | | |
| | | | 5,301,090 | | |
Total Common Stocks (Cost $55,167,845) | | | 47,753,086 | | |
Rights (0.0%) (b) | |
Materials (0.0%): (b) | |
Schulman, Inc. (c) (d) (e) | | | 7,093 | | | | 14,186 | | |
Total Rights (Cost $14,186) | | | 14,186 | | |
Collateral for Securities Loaned^ (7.0%) | |
BlackRock Liquidity Funds TempFund Portfolio, Institutional Class, 2.49% (f) | | | 639,215 | | | | 639,215 | | |
Fidelity Investments Money Market Government Portfolio, Class I, 2.28% (f) | | | 923,635 | | | | 923,635 | | |
Fidelity Investments Prime Money Market Portfolio, Class I, 2.46% (f) | | | 28,522 | | | | 28,522 | | |
Goldman Sachs Financial Square Prime Obligations Fund, Institutional Class,
2.55% (f) | | | 355,123 | | | | 355,123 | | |
JPMorgan Prime Money Market Fund, Capital Class, 2.49% (f) | | | 568,162 | | | | 568,162 | | |
Morgan Stanley Institutional Liquidity Prime Portfolio, Institutional Class,
2.58% (f) | | | 852,296 | | | | 852,296 | | |
Total Collateral for Securities Loaned (Cost $3,366,953) | | | 3,366,953 | | |
Total Investments (Cost $58,548,984) — 106.2% | | | 51,134,225 | | |
Liabilities in excess of other assets — (6.2)% | | | (2,977,974 | ) | |
NET ASSETS — 100.00% | | $ | 48,156,251 | | |
^ Purchased with cash collateral from securities on loan.
(a) All or a portion of this security is on loan.
See notes to financial statements.
75
Victory Portfolios II
VictoryShares US Small Cap High Div Volatility Wtd ETF | | Schedule of Portfolio Investments — continued
December 31, 2018 | |
(Unaudited)
(b) Amount represents less than 0.05% of net assets.
(c) Non-income producing security.
(d) The Fund's Adviser has deemed this security to be illiquid based upon procedures approved by the Board of Trustees. As of December 31, 2018, illiquid securities were 0.0% of the Fund's net assets.
(e) Security was fair valued based upon procedures approved by the Board of Trustees and represents 0.0% of the Fund's net assets as of December 31, 2018. This security is classified as Level 3 within the fair value hierarchy. (See Note 2)
(f) Rate disclosed is the daily yield on December 31, 2018.
Futures Contracts Purchased
| | | Number
of
Contracts | | Expiration
Date | | Notional
Amount | | Value | | Unrealized
Appreciation
(Depreciation) | |
Russell 2000 Mini Index Futures | | | 5 | | | 3/15/19 | | $ | 352,100 | | | $ | 337,250 | | | $ | (14,850 | ) | |
| | | Total unrealized appreciation | | | | | | | | $ | — | | |
| | | Total unrealized depreciation | | | | | | | | | (14,850 | ) | |
| | | Total net unrealized appreciation(depreciation) | | | | | | | | $ | (14,850 | ) | |
See notes to financial statements.
76
Victory Portfolios II
VictoryShares International High Div Volatility Wtd ETF | | Schedule of Portfolio Investments
December 31, 2018 | |
(Unaudited)
Security Description | | Shares | | Value | |
Common Stocks (99.5%) | |
Australia (9.9%): | |
Communication Services (0.7%): | |
Telstra Corp. Ltd. | | | 145,448 | | | $ | 291,910 | | |
Consumer Staples (1.2%): | |
Wesfarmers Ltd. | | | 21,399 | | | | 485,529 | | |
Financials (4.8%): | |
Australia & New Zealand Banking Group Ltd. | | | 27,110 | | | | 466,963 | | |
Commonwealth Bank of Australia | | | 10,339 | | | | 527,052 | | |
National Australia Bank Ltd. | | | 32,140 | | | | 544,776 | | |
Westpac Banking Corp. (a) | | | 26,473 | | | | 466,803 | | |
| | | | 2,005,594 | | |
Materials (2.3%): | |
BHP Group PLC | | | 13,981 | | | | 294,273 | | |
RIO Tinto Ltd. | | | 7,665 | | | | 423,557 | | |
South32 Ltd. | | | 102,744 | | | | 242,381 | | |
| | | | 960,211 | | |
Utilities (0.9%): | |
AGL Energy Ltd. (a) | | | 27,190 | | | | 394,433 | | |
| | | | 4,137,677 | | |
Canada (12.1%): | |
Communication Services (4.1%): | |
BCE, Inc. | | | 21,747 | | | | 859,205 | | |
TELUS Corp. | | | 26,226 | | | | 869,397 | | |
| | | | 1,728,602 | | |
Energy (2.7%): | |
Enbridge, Inc. | | | 9,924 | | | | 308,335 | | |
Pembina Pipeline Corp. (a) | | | 14,148 | | | | 419,879 | | |
TransCanada Corp. | | | 10,785 | | | | 385,179 | | |
| | | | 1,113,393 | | |
Financials (1.5%): | |
Power Financial Corp. | | | 33,437 | | | | 632,731 | | |
Utilities (3.8%): | |
Fortis, Inc. | | | 25,211 | | | | 840,552 | | |
Hydro One Ltd. (b) | | | 51,686 | | | | 766,770 | | |
| | | | 1,607,322 | | |
| | | | 5,082,048 | | |
Denmark (0.6%): | |
Financials (0.6%): | |
Danske Bank A/S | | | 13,283 | | | | 262,798 | | |
See notes to financial statements.
77
Victory Portfolios II
VictoryShares International High Div Volatility Wtd ETF | | Schedule of Portfolio Investments — continued
December 31, 2018 | |
(Unaudited)
Security Description | | Shares | | Value | |
Finland (2.9%): | |
Financials (2.0%): | |
Nordea Bank AB | | | 39,265 | | | $ | 330,588 | | |
Sampo Oyj, Class A | | | 11,459 | | | | 504,222 | | |
| | | | 834,810 | | |
Utilities (0.9%): | |
Fortum Oyj | | | 16,918 | | | | 370,180 | | |
| | | | 1,204,990 | | |
France (12.6%): | |
Communication Services (1.3%): | |
Orange SA | | | 34,688 | | | | 562,496 | | |
Consumer Discretionary (0.6%): | |
Renault SA | | | 4,251 | | | | 265,654 | | |
Energy (1.0%): | |
Total SA | | | 7,863 | | | | 415,980 | | |
Financials (4.3%): | |
AXA SA | | | 16,233 | | | | 350,691 | | |
BNP Paribas SA | | | 8,010 | | | | 362,231 | | |
Credit Agricole SA | | | 39,414 | | | | 425,787 | | |
Natixis SA | | | 55,774 | | | | 263,181 | | |
Societe Generale SA | | | 12,264 | | | | 390,859 | | |
| | | | 1,792,749 | | |
Health Care (1.4%): | |
Sanofi | | | 6,763 | | | | 586,187 | | |
Industrials (1.0%): | |
Bouygues | | | 11,016 | | | | 395,506 | | |
Utilities (3.0%): | |
Gdf Suez | | | 31,561 | | | | 452,855 | | |
Suez Environnement Co. | | | 24,564 | | | | 324,459 | | |
Veolia Environnement SA | | | 23,120 | | | | 475,558 | | |
| | | | 1,252,872 | | |
| | | | 5,271,444 | | |
Germany (3.9%): | |
Communication Services (1.4%): | |
Deutsche Telekom AG, Registered Shares | | | 33,515 | | | | 569,008 | | |
Consumer Discretionary (1.7%): | |
Bayerische Motoren Werke AG | | | 4,643 | | | | 376,053 | | |
Daimler AG, Registered Shares | | | 6,098 | | | | 320,719 | | |
| | | | 696,772 | | |
Materials (0.8%): | |
BASF SE | | | 4,979 | | | | 344,516 | | |
| | | | 1,610,296 | | |
See notes to financial statements.
78
Victory Portfolios II
VictoryShares International High Div Volatility Wtd ETF | | Schedule of Portfolio Investments — continued
December 31, 2018 | |
(Unaudited)
Security Description | | Shares | | Value | |
Hong Kong (3.5%): | |
Consumer Staples (0.5%): | |
WH Group Ltd. (b) | | | 288,500 | | | $ | 222,178 | | |
Utilities (3.0%): | |
CK Infrastructure Holdings Ltd. | | | 93,000 | | | | 704,330 | | |
Power Assets Holdings Ltd. | | | 78,000 | | | | 542,912 | | |
| | | | 1,247,242 | | |
| | | | 1,469,420 | | |
Ireland (0.5%): | |
Communication Services (0.5%): | |
WPP PLC | | | 17,141 | | | | 184,936 | | |
Italy (6.7%): | |
Energy (2.0%): | |
Eni SpA | | | 24,573 | | | | 387,015 | | |
Snam SpA | | | 103,752 | | | | 453,917 | | |
| | | | 840,932 | | |
Financials (1.8%): | |
Assicurazioni Generali SpA | | | 28,380 | | | | 474,675 | | |
Intesa Sanpaolo SpA | | | 125,916 | | | | 279,813 | | |
| | | | 754,488 | | |
Industrials (0.5%): | |
Atlantia SpA | | | 10,338 | | | | 214,006 | | |
Utilities (2.4%): | |
Enel SpA | | | 89,646 | | | | 518,008 | | |
Terna Rete Elettrica Nazionale SpA | | | 81,645 | | | | 463,264 | | |
| | | | 981,272 | | |
| | | | 2,790,698 | | |
Japan (6.4%): | |
Consumer Discretionary (4.2%): | |
Bridgestone Corp. | | | 12,600 | | | | 487,030 | | |
Fuji Heavy Industries Ltd. | | | 16,800 | | | | 361,784 | | |
Nissan Motor Co. Ltd. | | | 60,300 | | | | 484,370 | | |
Sekisui House Ltd. | | | 28,300 | | | | 418,083 | | |
| | | | 1,751,267 | | |
Consumer Staples (0.9%): | |
Japan Tobacco, Inc. (a) | | | 16,000 | | | | 382,006 | | |
Information Technology (1.3%): | |
Canon, Inc. (a) | | | 19,100 | | | | 523,032 | | |
| | | | 2,656,305 | | |
Korea, Republic Of (2.4%): | |
Consumer Staples (1.1%): | |
KT&G Corp. | | | 5,022 | | | | 456,873 | | |
See notes to financial statements.
79
Victory Portfolios II
VictoryShares International High Div Volatility Wtd ETF | | Schedule of Portfolio Investments — continued
December 31, 2018 | |
(Unaudited)
Security Description | | Shares | | Value | |
Energy (1.3%): | |
SK Innovation Co. Ltd. | | | 1,835 | | | $ | 295,225 | | |
S-Oil Corp. | | | 3,020 | | | | 264,456 | | |
| | | | 559,681 | | |
| | | | 1,016,554 | | |
Macau (0.6%): | |
Consumer Discretionary (0.6%): | |
Sands China Ltd. | | | 60,000 | | | | 262,835 | | |
Netherlands (3.7%): | |
Communication Services (1.2%): | |
Koninklijke KPN NV | | | 176,506 | | | | 517,642 | | |
Financials (1.7%): | |
ABN AMRO Group NV (b) | | | 14,533 | | | | 341,969 | | |
ING Groep NV | | | 34,440 | | | | 371,264 | | |
| | | | 713,233 | | |
Industrials (0.8%): | |
Randstad Holding NV | | | 6,961 | | | | 319,697 | | |
| | | | 1,550,572 | | |
Norway (2.1%): | |
Communication Services (1.1%): | |
Telenor ASA | | | 23,836 | | | | 462,066 | | |
Consumer Staples (1.0%): | |
Marine Harvest ASA | | | 19,145 | | | | 404,809 | | |
| | | | 866,875 | | |
Portugal (0.6%): | |
Consumer Staples (0.6%): | |
Jeronimo Martins SGPS SA | | | 22,458 | | | | 266,025 | | |
Russian Federation (0.4%): | |
Materials (0.4%): | |
Evraz PLC | | | 28,852 | | | | 176,676 | | |
Singapore (1.0%): | |
Communication Services (1.0%): | |
Singapore Telecommunications Ltd. | | | 202,400 | | | | 435,221 | | |
Spain (6.4%): | |
Communication Services (1.4%): | |
Telefonica SA | | | 68,262 | | | | 573,914 | | |
Energy (0.9%): | |
Repsol SA | | | 23,441 | | | | 378,102 | | |
See notes to financial statements.
80
Victory Portfolios II
VictoryShares International High Div Volatility Wtd ETF | | Schedule of Portfolio Investments — continued
December 31, 2018 | |
(Unaudited)
Security Description | | Shares | | Value | |
Utilities (4.1%): | |
Endesa SA | | | 25,277 | | | $ | 582,908 | | |
Iberdrola SA | | | 71,118 | | | | 571,772 | | |
Red Electrica Corp. SA | | | 25,385 | | | | 566,932 | | |
| | | | 1,721,612 | | |
| | | | 2,673,628 | | |
Sweden (4.6%): | |
Communication Services (1.1%): | |
TeliaSonera AB | | | 93,722 | | | | 444,164 | | |
Consumer Discretionary (0.7%): | |
Hennes & Mauritz AB, B Shares (a) | | | 21,548 | | | | 306,553 | | |
Financials (2.1%): | |
Skandinaviska Enskilda Banken AB, Class A | | | 40,267 | | | | 391,392 | | |
Swedbank AB, A Shares | | | 21,420 | | | | 478,184 | | |
| | | | 869,576 | | |
Industrials (0.7%): | |
Atlas Copco AB, A Shares | | | 12,135 | | | | 288,371 | | |
| | | | 1,908,664 | | |
Switzerland (3.4%): | |
Communication Services (1.4%): | |
Swisscom AG | | | 1,179 | | | | 563,640 | | |
Financials (1.3%): | |
Zurich Insurance Group AG | | | 1,837 | | | | 548,015 | | |
Industrials (0.7%): | |
Adecco SA, Registered Shares | | | 6,550 | | | | 306,200 | | |
| | | | 1,417,855 | | |
United Kingdom (15.2%): | |
Communication Services (1.9%): | |
BT Group PLC | | | 127,535 | | | | 386,987 | | |
Vodafone Group PLC | | | 203,647 | | | | 396,819 | | |
| | | | 783,806 | | |
Consumer Discretionary (1.5%): | |
Next PLC | | | 5,022 | | | | 255,426 | | |
Persimmon PLC | | | 15,706 | | | | 386,305 | | |
| | | | 641,731 | | |
Consumer Staples (1.4%): | |
British American Tobacco PLC | | | 7,437 | | | | 236,944 | | |
Imperial Tobacco Group PLC | | | 11,590 | | | | 351,091 | | |
| | | | 588,035 | | |
Energy (1.8%): | |
| BP PLC | | | 55,901 | | | | 353,318 | | |
Royal Dutch Shell PLC, Class A | | | 13,412 | | | | 394,405 | | |
| | | | 747,723 | | |
See notes to financial statements.
81
Victory Portfolios II
VictoryShares International High Div Volatility Wtd ETF | | Schedule of Portfolio Investments — continued
December 31, 2018 | |
(Unaudited)
Security Description | | Shares | | Value | |
Financials (2.9%): | |
Aviva PLC | | | 86,786 | | | $ | 415,305 | | |
Legal & General Group PLC | | | 160,964 | | | | 473,858 | | |
Standard Life Aberdeen PLC | | | 108,160 | | | | 353,903 | | |
| | | | 1,243,066 | | |
Materials (2.7%): | |
Anglo American PLC | | | 11,905 | | | | 265,173 | | |
Antofagasta PLC | | | 27,529 | | | | 274,771 | | |
Mondi PLC | | | 12,517 | | | | 260,571 | | |
Rio Tinto PLC | | | 6,755 | | | | 321,101 | | |
| | | | 1,121,616 | | |
Utilities (3.0%): | |
Centrica PLC | | | 223,910 | | | | 384,940 | | |
National Grid PLC | | | 44,053 | | | | 429,032 | | |
SSE PLC | | | 31,482 | | | | 433,907 | | |
| | | | 1,247,879 | | |
| | | | 6,373,856 | | |
Total Common Stocks (Cost $47,933,404) | | | 41,619,373 | | |
Rights (0.0%) (c) | |
Spain (0.0%): (c) | |
Energy (0.0%): (c) | |
Repsol SA Expires 01/10/19 @ $0.41 (d) | | | 23,441 | | | | 10,741 | | |
Total Rights (Cost $10,995) | | | 10,741 | | |
Collateral for Securities Loaned^ (3.2%) | |
United States (3.2%): | |
BlackRock Liquidity Funds TempFund Portfolio, Institutional Class, 2.49% (e) | | | 259,592 | | | | 259,592 | | |
Fidelity Investments Money Market Government Portfolio, Class I, 2.28% (e) | | | 375,098 | | | | 375,098 | | |
Fidelity Investments Prime Money Market Portfolio, Class I, 2.46% (e) | | | 11,583 | | | | 11,583 | | |
Goldman Sachs Financial Square Prime Obligations Fund, Institutional Class,
2.55% (e) | | | 144,219 | | | | 144,219 | | |
JPMorgan Prime Money Market Fund, Capital Class, 2.49% (e) | | | 230,737 | | | | 230,737 | | |
Morgan Stanley Institutional Liquidity Prime Portfolio, Institutional Class,
2.58% (e) | | | 346,127 | | | | 346,127 | | |
Total Collateral for Securities Loaned (Cost $1,367,356) | | | 1,367,356 | | |
Total Investments (Cost $49,311,755) — 102.7% | | | 42,997,470 | | |
Liabilities in excess of other assets — (2.7)% | | | (1,138,111 | ) | |
NET ASSETS — 100.00% | | $ | 41,859,359 | | |
^ Purchased with cash collateral from securities on loan.
(a) All or a portion of this security is on loan.
See notes to financial statements.
82
Victory Portfolios II
VictoryShares International High Div Volatility Wtd ETF | | Schedule of Portfolio Investments — continued
December 31, 2018 | |
(Unaudited)
(b) Rule 144A security or other security that is restricted as to resale to institutional investors. The Fund's Adviser has deemed this security to be liquid based upon procedures approved by the Board of Trustees. As of December 31, 2018, the fair value of these securities was $1,330,917 and amounted to 3.2% of net assets.
(c) Amount represents less than 0.05% of net assets.
(d) Non-income producing security.
(e) Rate disclosed is the daily yield on December 31, 2018.
PLC — Public Limited Company
See notes to financial statements.
83
Victory Portfolios II
VictoryShares Emerging Market High Div Volatility Wtd ETF | | Schedule of Portfolio Investments
December 31, 2018 | |
(Unaudited)
Security Description | | Shares | | Value | |
Common Stocks (99.3%) | |
Brazil (10.0%): | |
Consumer Discretionary (0.5%): | |
Kroton Educacional S.A. | | | 39,100 | | | $ | 89,494 | | |
Financials (2.6%): | |
Banco do Brasil SA | | | 17,400 | | | | 208,739 | | |
BB Seguridade Participacoes SA | | | 34,300 | | | | 244,197 | | |
| | | | 452,936 | | |
Health Care (1.8%): | |
Fleury SA | | | 24,900 | | | | 127,093 | | |
Hypermarcas S.A. | | | 25,200 | | | | 196,382 | | |
| | | | 323,475 | | |
Industrials (1.1%): | |
CCR SA | | | 65,100 | | | | 188,145 | | |
Information Technology (0.5%): | |
Cielo SA | | | 35,800 | | | | 82,126 | | |
Utilities (3.5%): | |
Cia de Saneamento Basico do Estado de Sao Paulo | | | 25,400 | | | | 206,461 | | |
EDP - Energias do Brasil SA | | | 40,600 | | | | 154,530 | | |
Engie Brasil Energia SA | | | 31,450 | | | | 267,974 | | |
| | | | 628,965 | | |
| | | | 1,765,141 | | |
Chile (3.2%): | |
Utilities (3.2%): | |
Aguas Andinas SA | | | 647,682 | | | | 356,475 | | |
Colbun SA | | | 1,074,304 | | | | 215,867 | | |
| | | | 572,342 | | |
China (15.5%): | |
Consumer Discretionary (1.1%): | |
Chongqing Changan Automobile Co. Ltd. | | | 205,100 | | | | 91,418 | | |
Guangzhou Automobile Group Co. Ltd. | | | 110,000 | | | | 109,719 | | |
| | | | 201,137 | | |
Energy (1.9%): | |
China Petroleum & Chemical Corp., Class H | | | 172,000 | | | | 122,794 | | |
China Shenhua Energy Co. Ltd. | | | 64,000 | | | | 140,261 | | |
Yanzhou Coal Mining Co. Ltd. | | | 79,800 | | | | 64,411 | | |
| | | | 327,466 | | |
Financials (9.1%): | |
Agricultural Bank of China Ltd. | | | 410,000 | | | | 179,604 | | |
Bank of China Ltd. | | | 620,000 | | | | 267,637 | | |
Bank of Communications Co. Ltd., Class H | | | 358,000 | | | | 279,359 | | |
China Cinda Asset Management Co. | | | 734,000 | | | | 178,110 | | |
China CITIC Bank Corp. Ltd. | | | 309,000 | | | | 187,847 | | |
See notes to financial statements.
84
Victory Portfolios II
VictoryShares Emerging Market High Div Volatility Wtd ETF | | Schedule of Portfolio Investments — continued
December 31, 2018 | |
(Unaudited)
Security Description | | Shares | | Value | |
China Everbright Bank Co. Ltd. | | | 544,000 | | | $ | 235,525 | | |
China Huarong Asset Management Co. Ltd., Class H (a) | | | 657,000 | | | | 119,988 | | |
Chongqing Rural Commercial Bank Co. Ltd. | | | 324,000 | | | | 173,793 | | |
| | | | 1,621,863 | | |
Industrials (1.6%): | |
Jiangsu Expressway Co. Ltd. | | | 132,000 | | | | 184,092 | | |
Weichai Power Co. Ltd. | | | 90,000 | | | | 102,873 | | |
| | | | 286,965 | | |
Materials (0.7%): | |
Sinopec Shanghai Petrochemical Co. Ltd. | | | 296,000 | | | | 129,665 | | |
Real Estate (1.1%): | |
Cifi Holdings Group Co. Ltd. | | | 184,000 | | | | 97,757 | | |
Guangzhou R&f Properties Co. Ltd., Class H | | | 61,600 | | | | 93,148 | | |
| | | | 190,905 | | |
| | | | 2,758,001 | | |
Czech Republic (2.0%): | |
Financials (2.0%): | |
Komercni Banka AS | | | 9,547 | | | | 360,198 | | |
Egypt (1.4%): | |
Consumer Staples (0.7%): | |
Eastern Tobacco | | | 141,510 | | | | 128,833 | | |
Industrials (0.7%): | |
Elsewedy Electric Co. | | | 120,450 | | | | 121,192 | | |
| | | | 250,025 | | |
Hong Kong (2.7%): | |
Industrials (1.1%): | |
China Merchants Holdings International | | | 112,000 | | | | 201,686 | | |
Real Estate (0.4%): | |
Agile Group Holdings Ltd. | | | 64,000 | | | | 75,280 | | |
Utilities (1.2%): | |
China Resources Power Holdings Co. Ltd. | | | 108,000 | | | | 207,724 | | |
| | | | 484,690 | | |
India (1.1%): | |
Communication Services (1.1%): | |
Bharti Infratel Ltd. | | | 53,865 | | | | 199,850 | | |
Indonesia (3.0%): | |
Communication Services (0.9%): | |
PT Telekomunikasi Indonesia Persero TBK | | | 609,300 | | | | 158,948 | | |
Energy (1.5%): | |
PT Adaro Energy TBK | | | 836,300 | | | | 70,686 | | |
PT Indo Tambangraya Megah TBK | | | 50,700 | | | | 71,421 | | |
Tambang Batubara Bukit Asam TBK PT | | | 425,100 | | | | 127,160 | | |
| | | | 269,267 | | |
See notes to financial statements.
85
Victory Portfolios II
VictoryShares Emerging Market High Div Volatility Wtd ETF | | Schedule of Portfolio Investments — continued
December 31, 2018 | |
(Unaudited)
Security Description | | Shares | | Value | |
Materials (0.6%): | |
PT Indocement Tunggal Prakarsa TBK | | | 82,800 | | | $ | 106,272 | | |
| | | | 534,487 | | |
Malaysia (7.7%): | |
Communication Services (1.9%): | |
Astro Malaysia Holdings BHD | | | 216,400 | | | | 68,116 | | |
DiGi.Com Berhad | | | 165,500 | | | | 180,327 | | |
Telekom Malaysia Berhad | | | 146,100 | | | | 94,098 | | |
| | | | 342,541 | | |
Consumer Staples (0.6%): | |
British American Tobacco Malaysia BHD | | | 12,200 | | | | 106,580 | | |
Financials (2.5%): | |
CIMB Group Holdings Berhad | | | 132,500 | | | | 183,190 | | |
Malayan Banking Berhad | | | 114,000 | | | | 262,228 | | |
| | | | 445,418 | | |
Industrials (2.1%): | |
MISC BHD | | | 114,800 | | | | 186,237 | | |
Sime Darby BHD | | | 311,200 | | | | 180,843 | | |
| | | | 367,080 | | |
Utilities (0.6%): | |
YTL Power International BHD | | | 518,000 | | | | 104,102 | | |
| | | | 1,365,721 | | |
Mexico (1.7%): | |
Consumer Staples (1.0%): | |
Kimberly-Clark de Mexico SAB de CV, Series A | | | 113,382 | | | | 179,873 | | |
Materials (0.7%): | |
Grupo Mexico SAB de CV, Series B | | | 55,086 | | | | 113,381 | | |
| | | | 293,254 | | |
Philippines (0.7%): | |
Communication Services (0.7%): | |
Globe Telecom, Inc. | | | 3,475 | | | | 125,571 | | |
Poland (1.0%): | |
Financials (1.0%): | |
Bank Pekao SA | | | 6,273 | | | | 182,828 | | |
Russian Federation (9.3%): | |
Communication Services (2.7%): | |
Mobile TeleSystems PJSC | | | 61,800 | | | | 211,689 | | |
Rostelecom PJSC | | | 260,420 | | | | 273,871 | | |
| | | | 485,560 | | |
See notes to financial statements.
86
Victory Portfolios II
VictoryShares Emerging Market High Div Volatility Wtd ETF | | Schedule of Portfolio Investments — continued
December 31, 2018 | |
(Unaudited)
Security Description | | Shares | | Value | |
Consumer Staples (1.4%): | |
Magnit PJSC, GDR | | | 9,048 | | | $ | 115,181 | | |
X5 Retail Group NV, Registered Shares, GDR | | | 5,487 | | | | 135,968 | | |
| | | | 251,149 | | |
Energy (1.2%): | |
Tatneft PAO | | | 20,540 | | | | 218,137 | | |
Materials (2.9%): | |
ALROSA AO | | | 119,300 | | | | 169,332 | | |
MMC Norilsk Nickel PJSC | | | 914 | | | | 171,523 | | |
Severstal PJSC | | | 12,110 | | | | 164,340 | | |
| | | | 505,195 | | |
Utilities (1.1%): | |
Federal Grid Co. Unified Energy System PJSC | | | 86,770,000 | | | | 184,976 | | |
| | | | 1,645,017 | | |
South Africa (9.3%): | |
Communication Services (2.4%): | |
Telkom SA SOC Ltd. | | | 56,067 | | | | 247,262 | | |
Vodacom Group Ltd. | | | 18,631 | | | | 171,366 | | |
| | | | 418,628 | | |
Consumer Discretionary (1.7%): | |
The Foschini Group Ltd. | | | 12,331 | | | | 142,839 | | |
Truworths International Ltd. | | | 25,522 | | | | 156,677 | | |
| | | | 299,516 | | |
Financials (4.0%): | |
Absa Group Ltd. | | | 15,467 | | | | 174,403 | | |
Investec Ltd. | | | 32,564 | | | | 179,258 | | |
Nedbank Group Ltd. | | | 9,830 | | | | 188,174 | | |
Standard Bank Group Ltd. | | | 13,364 | | | | 166,511 | | |
| | | | 708,346 | | |
Materials (1.2%): | |
African Rainbow Minerals Ltd. | | | 12,167 | | | | 120,686 | | |
Assore Ltd. | | | 4,959 | | | | 100,209 | | |
| | | | 220,895 | | |
| | | | 1,647,385 | | |
Taiwan (18.5%): | |
Consumer Discretionary (2.2%): | |
Pou Chen Corp. | | | 224,000 | | | | 237,585 | | |
Ruentex Industries Ltd. | | | 63,000 | | | | 161,107 | | |
| | | | 398,692 | | |
Consumer Staples (2.0%): | |
President Chain Store Corp. | | | 16,000 | | | | 161,895 | | |
Uni-President Enterprises Corp. | | | 84,300 | | | | 191,441 | | |
| | | | 353,336 | | |
See notes to financial statements.
87
Victory Portfolios II
VictoryShares Emerging Market High Div Volatility Wtd ETF | | Schedule of Portfolio Investments — continued
December 31, 2018 | |
(Unaudited)
Security Description | | Shares | | Value | |
Financials (2.0%): | |
Mega Financial Holding Co. Ltd. | | | 418,000 | | | $ | 352,912 | | |
Information Technology (9.7%): | |
Asustek Computer, Inc. | | | 31,000 | | | | 203,231 | | |
AU Optronics Corp. | | | 434,000 | | | | 173,679 | | |
Compal Electronics, Inc. | | | 545,000 | | | | 309,417 | | |
Inventec Corp. | | | 340,000 | | | | 243,916 | | |
Pegatron Corp. | | | 109,000 | | | | 182,281 | | |
Quanta Computer, Inc. | | | 147,000 | | | | 252,047 | | |
Winbond Electronics Corp. | | | 243,000 | | | | 107,127 | | |
WPG Holdings Ltd. | | | 201,000 | | | | 241,637 | | |
| | | | 1,713,335 | | |
Materials (2.6%): | |
Formosa Chemicals & Fibre | | | 59,000 | | | | 201,555 | | |
Nan Ya Plastics Corp. | | | 105,000 | | | | 257,922 | | |
| | | | 459,477 | | |
| | | | 3,277,752 | | |
Thailand (8.9%): | |
Communication Services (1.7%): | |
Intouch Holdings Public Co. Ltd. | | | 206,300 | | | | 302,567 | | |
Energy (2.0%): | |
Esso Thailand PCL | | | 251,200 | | | | 78,699 | | |
IRPC Public Co. Ltd. | | | 890,900 | | | | 157,342 | | |
Thai Oil PCL | | | 58,400 | | | | 118,836 | | |
| | | | 354,877 | | |
Materials (2.3%): | |
PTT Global Chemical Public Co. Ltd. | | | 63,700 | | | | 139,404 | | |
The Siam Cement Public Co. Ltd. | | | 20,200 | | | | 270,512 | | |
| | | | 409,916 | | |
Utilities (2.9%): | |
Ratchaburi Electricity Generating Holdings Public Co. Ltd. | | | 327,600 | | | | 510,656 | | |
| | | | 1,578,016 | | |
Turkey (3.3%): | |
Communication Services (1.1%): | |
Turkcell Iletisim Hizmetleri AS | | | 83,226 | | | | 191,739 | | |
Consumer Discretionary (0.8%): | |
Tofas Turk Otomobil Fabrikasi AS | | | 43,420 | | | | 138,911 | | |
Energy (0.9%): | |
Tupras Turkiye Petrol Rafinerileri AS | | | 6,997 | | | | 154,577 | | |
See notes to financial statements.
88
Victory Portfolios II
VictoryShares Emerging Market High Div Volatility Wtd ETF | | Schedule of Portfolio Investments — continued
December 31, 2018 | |
(Unaudited)
Security Description | | Shares | | Value | |
Materials (0.5%): | |
Eregli Demir ve Celik Fabrikalari TAS | | | 67,055 | | | $ | 91,649 | | |
| | | | 576,876 | | |
Total Common Stocks (Cost $19,631,059) | | | 17,617,154 | | |
Total Investments (Cost $19,631,059) — 99.3% | | | 17,617,154 | | |
Other assets in excess of liabilities — 0.7% | | | 129,354 | | |
NET ASSETS — 100.00% | | $ | 17,746,508 | | |
(a) Rule 144A security or other security that is restricted as to resale to institutional investors. The Fund's Adviser has deemed this security to be liquid based upon procedures approved by the Board of Trustees. As of December 31, 2018, the fair value of these securities was $119,989 and amounted to 0.7% of net assets.
GDR — Global Depository Receipt
PCL — Public Company Limited
Futures Contracts Purchased
| | | Number
of
Contracts | | Expiration
Date | | Notional
Amount | | Value | | Unrealized
Appreciation
(Depreciation) | |
Mini MSCI Emerging Markets
Index Futures | | | 2 | | | 3/15/19 | | $ | 97,838 | | | $ | 96,680 | | | $ | (1,158 | ) | |
| | | Total unrealized appreciation | | | | | | | | $ | — | | |
| | | Total unrealized depreciation | | | | | | | | | (1,158 | ) | |
| | | Total net unrealized appreciation(depreciation) | | | | | | | | $ | (1,158 | ) | |
See notes to financial statements.
89
Victory Portfolios II
VictoryShares Dividend Accelerator ETF | | Schedule of Portfolio Investments
December 31, 2018 | |
(Unaudited)
Security Description | | Shares | | Value | |
Common Stocks (99.8%) | |
Aerospace & Defense (4.3%): | |
General Dynamics Corp. | | | 380 | | | $ | 59,740 | | |
Lockheed Martin Corp. | | | 1,050 | | | | 274,932 | | |
Northrop Grumman Corp. | | | 322 | | | | 78,858 | | |
| | | | 413,530 | | |
Air Freight & Logistics (1.4%): | |
Expeditors International of Washington, Inc. | | | 1,936 | | | | 131,822 | | |
Building Products (2.1%): | |
Lennox International, Inc. | | | 928 | | | | 203,102 | | |
Commercial Services & Supplies (3.7%): | |
Cintas Corp. | | | 364 | | | | 61,148 | | |
Rollins, Inc. | | | 4,441 | | | | 160,321 | | |
Waste Management, Inc. | | | 1,552 | | | | 138,112 | | |
| | | | 359,581 | | |
Consumer Discretionary (10.6%): | |
Leggett & Platt, Inc. | | | 1,546 | | | | 55,409 | | |
Lowe's Co., Inc. | | | 1,177 | | | | 108,708 | | |
McDonald's Corp. | | | 953 | | | | 169,224 | | |
Nike, Inc., Class B | | | 2,097 | | | | 155,472 | | |
Pool Corp. | | | 1,049 | | | | 155,934 | | |
Ross Stores, Inc. | | | 666 | | | | 55,411 | | |
The Home Depot, Inc. | | | 1,047 | | | | 179,895 | | |
The TJX Co., Inc. | | | 1,524 | | | | 68,184 | | |
VF Corp. | | | 1,015 | | | | 72,410 | | |
| | | | 1,020,647 | | |
Consumer Staples (21.9%): | |
Altria Group, Inc. | | | 841 | | | | 41,537 | | |
Brown-Forman Corp., Class B | | | 2,052 | | | | 97,634 | | |
Church & Dwight Co., Inc. | | | 1,173 | | | | 77,136 | | |
Colgate-Palmolive Co. | | | 2,908 | | | | 173,084 | | |
Costco Wholesale Corp. | | | 804 | | | | 163,783 | | |
Hormel Foods Corp. | | | 2,005 | | | | 85,573 | | |
Kimberly-Clark Corp. | | | 1,357 | | | | 154,617 | | |
McCormick & Co., Inc. | | | 1,058 | | | | 147,316 | | |
PepsiCo, Inc. | | | 2,664 | | | | 294,319 | | |
Sysco Corp. | | | 2,385 | | | | 149,444 | | |
The Clorox Co. | | | 852 | | | | 131,327 | | |
The Procter & Gamble Co. | | | 3,457 | | | | 317,767 | | |
Walgreens Boots Alliance, Inc. | | | 1,218 | | | | 83,226 | | |
Wal-Mart Stores, Inc. | | | 2,341 | | | | 218,064 | | |
| | | | 2,134,827 | | |
Electrical Equipment (1.5%): | |
Emerson Electric Co. | | | 2,513 | | | | 150,152 | | |
Energy (0.6%): | |
Exxon Mobil Corp. | | | 879 | | | | 59,939 | | |
See notes to financial statements.
90
Victory Portfolios II
VictoryShares Dividend Accelerator ETF | | Schedule of Portfolio Investments — continued
December 31, 2018 | |
(Unaudited)
Security Description | | Shares | | Value | |
Financials (14.9%): | |
Aflac, Inc. | | | 1,738 | | | $ | 79,183 | | |
American Financial Group, Inc. | | | 2,036 | | | | 184,319 | | |
Brown & Brown, Inc. | | | 3,111 | | | | 85,739 | | |
Cincinnati Financial Corp. | | | 924 | | | | 71,536 | | |
Commerce Bank, Inc. (a) | | | 2,765 | | | | 155,863 | | |
FactSet Research Systems, Inc. | | | 788 | | | | 157,702 | | |
Marsh & McLennan Co., Inc. | | | 1,797 | | | | 143,311 | | |
Old Republic International Corp. | | | 748 | | | | 15,386 | | |
S&P Global, Inc. | | | 238 | | | | 40,446 | | |
SEI Investments Co. | | | 1,631 | | | | 75,352 | | |
T. Rowe Price Group, Inc. | | | 769 | | | | 70,994 | | |
Torchmark Corp. | | | 2,122 | | | | 158,153 | | |
W.R. Berkley Corp. | | | 2,714 | | | | 200,591 | | |
| | | | 1,438,575 | | |
Health Care (4.1%): | |
Johnson & Johnson | | | 637 | | | | 82,205 | | |
UnitedHealth Group, Inc. | | | 964 | | | | 240,152 | | |
West Pharmaceutical Services, Inc. | | | 789 | | | | 77,346 | | |
| | | | 399,703 | | |
Industrial Conglomerates (3.5%): | |
3M Co. | | | 1,029 | | | | 196,066 | | |
Carlisle Cos., Inc. | | | 785 | | | | 78,908 | | |
Roper Technologies, Inc. | | | 224 | | | | 59,700 | | |
| | | | 334,674 | | |
Information Technology (13.1%): | |
Automatic Data Processing, Inc. | | | 2,539 | | | | 332,914 | | |
Broadridge Financial Solutions, Inc. | | | 1,371 | | | | 131,959 | | |
Intuit, Inc. | | | 1,287 | | | | 253,346 | | |
Jack Henry & Associates, Inc. | | | 873 | | | | 110,452 | | |
Mastercard, Inc., Class A | | | 726 | | | | 136,960 | | |
Texas Instruments, Inc. | | | 1,969 | | | | 186,071 | | |
Visa, Inc., Class A | | | 893 | | | | 117,822 | | |
| | | | 1,269,524 | | |
Machinery (8.6%): | |
Donaldson Co., Inc. | | | 2,344 | | | | 101,706 | | |
Dover Corp. | | | 1,638 | | | | 116,216 | | |
Graco, Inc. | | | 2,356 | | | | 98,599 | | |
IDEX Corp. | | | 1,332 | | | | 168,177 | | |
Illinois Tool Works, Inc. | | | 1,007 | | | | 127,577 | | |
Nordson Corp. | | | 302 | | | | 36,044 | | |
Stanley Black & Decker, Inc. | | | 359 | | | | 42,987 | | |
Toro Co. | | | 2,562 | | | | 143,165 | | |
| | | | 834,471 | | |
Materials (5.5%): | |
Air Products & Chemicals, Inc. | | | 1,167 | | | | 186,779 | | |
AptarGroup, Inc. | | | 1,703 | | | | 160,201 | | |
See notes to financial statements.
91
Victory Portfolios II
VictoryShares Dividend Accelerator ETF | | Schedule of Portfolio Investments — continued
December 31, 2018 | |
(Unaudited)
Security Description | | Shares | | Value | |
Ecolab, Inc. | | | 404 | | | $ | 59,529 | | |
PPG Industries, Inc. | | | 719 | | | | 73,503 | | |
The Sherwin-Williams Co. | | | 126 | | | | 49,576 | | |
| | | | 529,588 | | |
Trading Companies & Distributors (1.1%): | |
W.W. Grainger, Inc. | | | 369 | | | | 104,191 | | |
Utilities (2.9%): | |
Atmos Energy Corp. | | | 1,070 | | | | 99,210 | | |
Consolidated Edison, Inc. | | | 2,406 | | | | 183,964 | | |
| | | | 283,174 | | |
Total Common Stocks (Cost $9,906,078) | | | 9,667,500 | | |
Collateral for Securities Loaned^ (1.5%) | |
BlackRock Liquidity Funds TempFund Portfolio, Institutional Class, 2.49% (b) | | | 28,136 | | | | 28,136 | | |
Fidelity Investments Money Market Government Portfolio, Class I, 2.28% (b) | | | 40,656 | | | | 40,656 | | |
Fidelity Investments Prime Money Market Portfolio, Class I, 2.46% (b) | | | 1,255 | | | | 1,255 | | |
Goldman Sachs Financial Square Prime Obligations Fund, Institutional Class,
2.55% (b) | | | 15,631 | | | | 15,631 | | |
JPMorgan Prime Money Market Fund, Capital Class, 2.49% (b) | | | 25,009 | | | | 25,009 | | |
Morgan Stanley Institutional Liquidity Prime Portfolio, Institutional Class,
2.58% (b) | | | 37,516 | | | | 37,516 | | |
Total Collateral for Securities Loaned (Cost $148,203) | | | 148,203 | | |
Total Investments (Cost $10,054,281) — 101.3% | | | 9,815,703 | | |
Liabilities in excess of other assets — (1.3)% | | | (128,183 | ) | |
NET ASSETS — 100.00% | | $ | 9,687,520 | | |
^ Purchased with cash collateral from securities on loan.
(a) All or a portion of this security is on loan.
(b) Rate disclosed is the daily yield on December 31, 2018.
See notes to financial statements.
92
Victory Portfolios II
VictoryShares US Multi-Factor Minimum Volatility ETF | | Schedule of Portfolio Investments
December 31, 2018 | |
(Unaudited)
Security Description | | Shares | | Value | |
Common Stocks (99.3%) | |
Communication Services (2.2%): | |
Omnicom Group, Inc. | | | 4,940 | | | $ | 361,806 | | |
The Walt Disney Co. | | | 1,935 | | | | 212,173 | | |
| | | | 573,979 | | |
Consumer Discretionary (7.2%): | |
Best Buy Co., Inc. | | | 1,961 | | | | 103,855 | | |
Carnival Corp., Class A | | | 1,291 | | | | 63,646 | | |
Cracker Barrel Old Country Store, Inc. | | | 922 | | | | 147,390 | | |
Darden Restaurants, Inc. | | | 1,424 | | | | 142,201 | | |
Dollar General Corp. | | | 1,684 | | | | 182,007 | | |
H&R Block, Inc. | | | 8,955 | | | | 227,188 | | |
Kohl's Corp. | | | 4,091 | | | | 271,397 | | |
Las Vegas Sands Corp. | | | 1,146 | | | | 59,649 | | |
Six Flags Entertainment Corp. | | | 2,212 | | | | 123,054 | | |
Target Corp. | | | 5,412 | | | | 357,679 | | |
The Gap, Inc. | | | 5,982 | | | | 154,096 | | |
The Home Depot, Inc. | | | 387 | | | | 66,494 | | |
Williams-Sonoma, Inc. | | | 1,002 | | | | 50,551 | | |
| | | | 1,949,207 | | |
Consumer Staples (20.2%): | |
Flowers Foods, Inc. | | | 1,875 | | | | 34,631 | | |
General Mills, Inc. | | | 6,066 | | | | 236,210 | | |
Ingredion, Inc. | | | 4,735 | | | | 432,779 | | |
Keurig Dr Pepper, Inc. | | | 21,609 | | | | 554,055 | | |
Kimberly-Clark Corp. | | | 6,411 | | | | 730,469 | | |
PepsiCo, Inc. | | | 7,829 | | | | 864,948 | | |
Sysco Corp. | | | 2,479 | | | | 155,334 | | |
The Hershey Co. | | | 1,000 | | | | 107,180 | | |
The Kroger Co. | | | 19,497 | | | | 536,168 | | |
The Procter & Gamble Co. | | | 9,249 | | | | 850,168 | | |
Wal-Mart Stores, Inc. | | | 9,844 | | | | 916,968 | | |
| | | | 5,418,910 | | |
Energy (1.5%): | |
Valero Energy Corp. | | | 5,316 | | | | 398,541 | | |
Financials (18.6%): | |
Aflac, Inc. | | | 11,633 | | | | 529,999 | | |
Agnc Investment Corp. | | | 36,181 | | | | 634,615 | | |
Brown & Brown, Inc. | | | 27,969 | | | | 770,825 | | |
Everest Re Group Ltd. | | | 3,155 | | | | 687,033 | | |
First American Financial Corp. | | | 3,486 | | | | 155,615 | | |
FNF Group | | | 16,770 | | | | 527,249 | | |
Hanover Insurance Group, Inc. | | | 1,811 | | | | 211,470 | | |
Marsh & McLennan Co., Inc. | | | 870 | | | | 69,383 | | |
New Residential Investment Corp. | | | 27,237 | | | | 387,038 | | |
Old Republic International Corp. | | | 6,841 | | | | 140,719 | | |
The Allstate Corp. | | | 1,083 | | | | 89,488 | | |
See notes to financial statements.
93
Victory Portfolios II
VictoryShares US Multi-Factor Minimum Volatility ETF | | Schedule of Portfolio Investments — continued
December 31, 2018 | |
(Unaudited)
Security Description | | Shares | | Value | |
The Progressive Corp. | | | 3,742 | | | $ | 225,755 | | |
The Travelers Co., Inc. | | | 4,548 | | | | 544,623 | | |
| | | | 4,973,812 | | |
Health Care (19.5%): | |
AmerisourceBergen Corp. | | | 2,161 | | | | 160,778 | | |
CVS Health Corp. | | | 4,798 | | | | 314,365 | | |
Encompass Health Corp. | | | 1,142 | | | | 70,461 | | |
HCA Holdings, Inc. | | | 4,419 | | | | 549,945 | | |
Humana, Inc. | | | 1,869 | | | | 535,431 | | |
Johnson & Johnson | | | 8,811 | | | | 1,137,060 | | |
Pfizer, Inc. | | | 20,503 | | | | 894,956 | | |
UnitedHealth Group, Inc. | | | 2,964 | | | | 738,392 | | |
Universal Health Services, Inc., Class B | | | 1,194 | | | | 139,173 | | |
WellCare Health Plans, Inc. (a) | | | 2,848 | | | | 672,384 | | |
| | | | 5,212,945 | | |
Industrials (10.1%): | |
3M Co. | | | 844 | | | | 160,816 | | |
Expeditors International of Washington, Inc. | | | 1,544 | | | | 105,131 | | |
Lockheed Martin Corp. | | | 2,744 | | | | 718,489 | | |
Raytheon Co. | | | 4,088 | | | | 626,895 | | |
Republic Services, Inc., Class A | | | 781 | | | | 56,302 | | |
Spirit Aerosystems Holdings, Inc., Class A | | | 1,577 | | | | 113,686 | | |
Waste Management, Inc. | | | 10,162 | | | | 904,317 | | |
| | | | 2,685,636 | | |
Information Technology (17.2%): | |
Apple, Inc. | | | 8,414 | | | | 1,327,224 | | |
Cisco Systems, Inc. | | | 9,101 | | | | 394,347 | | |
F5 Networks, Inc. (a) | | | 674 | | | | 109,208 | | |
Intel Corp. | | | 10,536 | | | | 494,454 | | |
International Business Machines Corp. | | | 5,283 | | | | 600,519 | | |
MAXIMUS, Inc. | | | 1,291 | | | | 84,031 | | |
Microsoft Corp. | | | 15,541 | | | | 1,578,499 | | |
| | | | 4,588,282 | | |
Real Estate (0.2%): | |
Medical Properties Trust, Inc. | | | 2,826 | | | | 45,442 | | |
Utilities (2.6%): | |
IDACORP, Inc. | | | 7,561 | | | | 703,627 | | |
Total Common Stocks (Cost $28,048,882) | | | 26,550,381 | | |
Total Investments (Cost $28,048,882) — 99.3% | | | 26,550,381 | | |
Other assets in excess of liabilities — 0.7% | | | 180,999 | | |
NET ASSETS — 100.00% | | $ | 26,731,380 | | |
(a) Non-income producing security.
See notes to financial statements.
94
Victory Portfolios II
VictoryShares US Multi-Factor Minimum Volatility ETF | | Schedule of Portfolio Investments — continued
December 31, 2018 | |
(Unaudited)
Futures Contracts Purchased
| | | Number
of
Contracts | | Expiration
Date | | Notional
Amount | | Value | | Unrealized
Appreciation
(Depreciation) | |
E-Mini S&P 500 Futures | | | 1 | | | 3/15/19 | | $ | 123,829 | | | $ | 125,260 | | | $ | 1,431 | | |
| | | Total unrealized appreciation | | | | | | | | $ | 1,431 | | |
| | | Total unrealized depreciation | | | | | | | | | — | | |
| | | Total net unrealized appreciation(depreciation) | | | | | | | | $ | 1,431 | | |
See notes to financial statements.
95
Victory Portfolios II
VictoryShares US 500 Enhanced Volatility Wtd ETF | | Schedule of Portfolio Investments
December 31, 2018 | |
(Unaudited)
Security Description | | Shares | | Value | |
Common Stocks (99.9%) | |
Communication Services (3.1%): | |
AT&T, Inc. | | | 73,435 | | | $ | 2,095,835 | | |
Cable One, Inc. | | | 2,679 | | | | 2,197,048 | | |
Cargurus, Inc. (a) | | | 20,514 | | | | 691,937 | | |
CBS Corp., Class B | | | 34,247 | | | | 1,497,279 | | |
CenturyLink, Inc. | | | 70,933 | | | | 1,074,635 | | |
Charter Communications, Inc., Class A (a) | | | 4,896 | | | | 1,395,213 | | |
Comcast Corp., Class A | | | 51,854 | | | | 1,765,629 | | |
DISH Network Corp. (a) | | | 34,771 | | | | 868,232 | | |
Facebook, Inc., Class A (a) | | | 7,242 | | | | 949,354 | | |
InterActive Corp. (a) | | | 6,414 | | | | 1,174,019 | | |
Netflix, Inc. (a) | | | 3,503 | | | | 937,613 | | |
Omnicom Group, Inc. | | | 34,432 | | | | 2,521,799 | | |
The Walt Disney Co. | | | 27,142 | | | | 2,976,120 | | |
T-Mobile US, Inc. (a) | | | 31,172 | | | | 1,982,851 | | |
Verizon Communications, Inc. | | | 49,661 | | | | 2,791,942 | | |
Viacom, Inc., Class B | | | 63,661 | | | | 1,636,088 | | |
World Wrestling Entertainment, Inc. | | | 15,194 | | | | 1,135,296 | | |
Zayo Group Holdings, Inc. (a) | | | 66,079 | | | | 1,509,244 | | |
| | | | 29,200,134 | | |
Consumer Discretionary (12.8%): | |
Advance Auto Parts, Inc. | | | 10,995 | | | | 1,731,273 | | |
Amazon.com, Inc. (a) | | | 996 | | | | 1,495,962 | | |
American Eagle Outfitters, Inc. | | | 51,769 | | | | 1,000,695 | | |
Aramark | | | 54,549 | | | | 1,580,285 | | |
AutoZone, Inc. (a) | | | 2,763 | | | | 2,316,333 | | |
Best Buy Co., Inc. | | | 21,701 | | | | 1,149,285 | | |
Bright Horizons Family Solutions, Inc. (a) | | | 23,501 | | | | 2,619,186 | | |
Burlington Stores, Inc. (a) | | | 11,752 | | | | 1,911,698 | | |
CarMax, Inc. (a) | | | 22,582 | | | | 1,416,569 | | |
Carter's, Inc. | | | 19,979 | | | | 1,630,686 | | |
Chipotle Mexican Grill, Inc. (a) | | | 2,311 | | | | 997,867 | | |
D.R. Horton, Inc. | | | 36,493 | | | | 1,264,847 | | |
Darden Restaurants, Inc. | | | 14,924 | | | | 1,490,311 | | |
Dollar General Corp. | | | 19,473 | | | | 2,104,643 | | |
Dollar Tree, Inc. (a) | | | 15,422 | | | | 1,392,915 | | |
Domino's Pizza, Inc. | | | 7,114 | | | | 1,764,201 | | |
Dunkin' Brands Group, Inc. | | | 43,185 | | | | 2,769,021 | | |
Etsy, Inc. (a) | | | 20,533 | | | | 976,755 | | |
Five Below, Inc. (a) | | | 10,360 | | | | 1,060,035 | | |
Ford Motor Co. | | | 242,805 | | | | 1,857,458 | | |
Garmin Ltd. | | | 42,687 | | | | 2,702,941 | | |
Gentex Corp. | | | 88,811 | | | | 1,794,871 | | |
Genuine Parts Co. | | | 29,229 | | | | 2,806,568 | | |
Grand Canyon Education, Inc. (a) | | | 21,002 | | | | 2,019,132 | | |
GrubHub, Inc. (a) | | | 7,291 | | | | 560,022 | | |
Harley-Davidson, Inc. | | | 45,951 | | | | 1,567,848 | | |
Hilton Worldwide Holdings, Inc. | | | 33,976 | | | | 2,439,477 | | |
See notes to financial statements.
96
Victory Portfolios II
VictoryShares US 500 Enhanced Volatility Wtd ETF | | Schedule of Portfolio Investments — continued
December 31, 2018 | |
(Unaudited)
Security Description | | Shares | | Value | |
Hyatt Hotels Corp., Class A | | | 34,283 | | | $ | 2,317,531 | | |
Kohl's Corp. | | | 18,036 | | | | 1,196,508 | | |
L Brands, Inc. | | | 44,183 | | | | 1,134,178 | | |
Las Vegas Sands Corp. | | | 30,815 | | | | 1,603,921 | | |
Lear Corp. | | | 13,090 | | | | 1,608,237 | | |
Leggett & Platt, Inc. | | | 52,503 | | | | 1,881,707 | | |
Lennar Corp., Class A | | | 31,780 | | | | 1,244,187 | | |
LKQ Corp. (a) | | | 43,185 | | | | 1,024,780 | | |
Lowe's Co., Inc. | | | 16,710 | | | | 1,543,336 | | |
Macy's, Inc. | | | 31,745 | | | | 945,366 | | |
Marriott International, Inc., Class A | | | 18,514 | | | | 2,009,880 | | |
McDonald's Corp. | | | 15,296 | | | | 2,716,110 | | |
MGM Resorts International | | | 50,856 | | | | 1,233,767 | | |
Mohawk Industries, Inc. (a) | | | 7,912 | | | | 925,388 | | |
Newell Brands, Inc. | | | 62,238 | | | | 1,157,004 | | |
Nordstrom, Inc. | | | 21,276 | | | | 991,674 | | |
Norwegian Cruise Line Holdings Ltd. (a) | | | 37,677 | | | | 1,597,128 | | |
NVR, Inc. (a) | | | 626 | | | | 1,525,556 | | |
Ollie's Bargain Outlet Holdings, Inc. (a) | | | 20,704 | | | | 1,377,023 | | |
O'Reilly Automotive, Inc. (a) | | | 5,243 | | | | 1,805,322 | | |
Penske Automotive Group, Inc. | | | 38,634 | | | | 1,557,723 | | |
Polaris Industries, Inc. | | | 14,986 | | | | 1,149,126 | | |
Pool Corp. | | | 17,050 | | | | 2,534,483 | | |
PulteGroup, Inc. | | | 63,597 | | | | 1,652,886 | | |
PVH Corp. | | | 13,723 | | | | 1,275,553 | | |
Qurate Retail, Inc. (a) | | | 80,780 | | | | 1,576,825 | | |
Ross Stores, Inc. | | | 21,868 | | | | 1,819,418 | | |
Royal Caribbean Cruises Ltd. | | | 15,772 | | | | 1,542,344 | | |
Service Corp. International | | | 65,427 | | | | 2,634,092 | | |
Servicemaster Global Holdings, Inc. (a) | | | 60,792 | | | | 2,233,498 | | |
Stamps.com, Inc. (a) | | | 5,423 | | | | 844,036 | | |
Starbucks Corp. | | | 42,062 | | | | 2,708,793 | | |
Target Corp. | | | 24,582 | | | | 1,624,624 | | |
Texas Roadhouse, Inc. | | | 33,247 | | | | 1,984,846 | | |
The Gap, Inc. | | | 41,301 | | | | 1,063,914 | | |
The Home Depot, Inc. | | | 14,759 | | | | 2,535,891 | | |
The TJX Co., Inc. | | | 53,339 | | | | 2,386,387 | | |
Thor Industries, Inc. | | | 13,653 | | | | 709,956 | | |
Tiffany & Co. | | | 10,660 | | | | 858,237 | | |
Toll Brothers, Inc. | | | 39,932 | | | | 1,314,961 | | |
Tractor Supply Co. | | | 20,750 | | | | 1,731,380 | | |
Ulta Salon, Cosmetics & Fragrance, Inc. (a) | | | 6,622 | | | | 1,621,330 | | |
Urban Outfitters, Inc. (a) | | | 33,492 | | | | 1,111,934 | | |
Weight Watchers International, Inc. (a) | | | 15,271 | | | | 588,697 | | |
Williams-Sonoma, Inc. | | | 19,161 | | | | 966,672 | | |
Yum! Brands, Inc. | | | 32,264 | | | | 2,965,706 | | |
| | | | 119,252,799 | | |
Consumer Staples (7.5%): | |
Altria Group, Inc. | | | 37,806 | | | | 1,867,238 | | |
Archer-Daniels-Midland Co. | | | 65,839 | | | | 2,697,424 | | |
See notes to financial statements.
97
Victory Portfolios II
VictoryShares US 500 Enhanced Volatility Wtd ETF | | Schedule of Portfolio Investments — continued
December 31, 2018 | |
(Unaudited)
Security Description | | Shares | | Value | |
Brown-Forman Corp., Class B | | | 40,065 | | | $ | 1,906,293 | | |
Church & Dwight Co., Inc. | | | 42,665 | | | | 2,805,650 | | |
Colgate-Palmolive Co. | | | 46,584 | | | | 2,772,680 | | |
Conagra Brands, Inc. | | | 65,574 | | | | 1,400,661 | | |
Constellation Brands, Inc., Class A | | | 11,617 | | | | 1,868,246 | | |
Costco Wholesale Corp. | | | 13,507 | | | | 2,751,510 | | |
General Mills, Inc. | | | 44,786 | | | | 1,743,967 | | |
Hormel Foods Corp. | | | 67,079 | | | | 2,862,931 | | |
Ingredion, Inc. | | | 20,193 | | | | 1,845,640 | | |
Kellogg Co. | | | 32,685 | | | | 1,863,372 | | |
Kimberly-Clark Corp. | | | 19,950 | | | | 2,273,103 | | |
Lamb Weston Holdings, Inc. | | | 38,213 | | | | 2,810,947 | | |
McCormick & Co., Inc. | | | 19,998 | | | | 2,784,522 | | |
Molson Coors Brewing Co., Class B | | | 24,422 | | | | 1,371,540 | | |
Mondelez International, Inc., Class A | | | 62,487 | | | | 2,501,355 | | |
Monster Beverage Corp. (a) | | | 25,900 | | | | 1,274,798 | | |
National Beverage Corp. (b) | | | 13,137 | | | | 942,842 | | |
Nu Skin Enterprises, Inc., Class A | | | 22,845 | | | | 1,401,084 | | |
Philip Morris International, Inc. | | | 21,805 | | | | 1,455,702 | | |
Pilgrim's Pride Corp. (a) | | | 87,249 | | | | 1,353,232 | | |
Post Holdings, Inc. (a) | | | 21,259 | | | | 1,894,815 | | |
Sysco Corp. | | | 34,474 | | | | 2,160,141 | | |
The Clorox Co. | | | 14,677 | | | | 2,262,313 | | |
The Estee Lauder Cos., Inc., Class A | | | 15,342 | | | | 1,995,994 | | |
The Hershey Co. | | | 24,522 | | | | 2,628,268 | | |
The J.M. Smucker Co. | | | 19,244 | | | | 1,799,122 | | |
The Kraft Heinz Co. | | | 35,326 | | | | 1,520,431 | | |
The Kroger Co. | | | 48,413 | | | | 1,331,358 | | |
The Procter & Gamble Co. | | | 40,069 | | | | 3,683,142 | | |
Tyson Foods, Inc., Class A | | | 34,163 | | | | 1,824,304 | | |
US Foods Holding Corp. (a) | | | 50,520 | | | | 1,598,453 | | |
Walgreens Boots Alliance, Inc. | | | 27,218 | | | | 1,859,806 | | |
| | | | 69,112,884 | | |
Energy (3.0%): | |
Apache Corp. | | | 33,138 | | | | 869,873 | | |
Centennial Resource Development, Inc. (a) | | | 63,701 | | | | 701,985 | | |
Chevron Corp. | | | 20,739 | | | | 2,256,195 | | |
Cimarex Energy Co. | | | 17,850 | | | | 1,100,453 | | |
ConocoPhillips | | | 26,183 | | | | 1,632,510 | | |
Continental Resources, Inc. (a) | | | 23,490 | | | | 944,063 | | |
Core Laboratories N.V. | | | 14,482 | | | | 863,996 | | |
Diamondback Energy, Inc. | | | 10,718 | | | | 993,559 | | |
EOG Resources, Inc. | | | 17,204 | | | | 1,500,361 | | |
Exxon Mobil Corp. | | | 32,779 | | | | 2,235,200 | | |
HollyFrontier Corp. | | | 20,567 | | | | 1,051,385 | | |
Marathon Petroleum Corp. | | | 20,711 | | | | 1,222,156 | | |
Newfield Exploration Co. (a) | | | 48,570 | | | | 712,036 | | |
Occidental Petroleum Corp. | | | 28,513 | | | | 1,750,128 | | |
ONEOK, Inc. | | | 42,698 | | | | 2,303,556 | | |
PBF Energy, Inc. | | | 30,859 | | | | 1,008,164 | | |
See notes to financial statements.
98
Victory Portfolios II
VictoryShares US 500 Enhanced Volatility Wtd ETF | | Schedule of Portfolio Investments — continued
December 31, 2018 | |
(Unaudited)
Security Description | | Shares | | Value | |
Peabody Energy Corp. | | | 44,398 | | | $ | 1,353,251 | | |
Phillips 66 | | | 21,153 | | | | 1,822,331 | | |
The Williams Cos., Inc. | | | 77,787 | | | | 1,715,203 | | |
Valero Energy Corp. | | | 17,743 | | | | 1,330,193 | | |
| | | | 27,366,598 | | |
Financials (21.0%): | |
Affiliated Managers Group, Inc. | | | 14,512 | | | | 1,414,049 | | |
Aflac, Inc. | | | 76,320 | | | | 3,477,138 | | |
Ally Financial, Inc. | | | 89,276 | | | | 2,022,993 | | |
American Financial Group, Inc. | | | 29,251 | | | | 2,648,093 | | |
Ameriprise Financial, Inc. | | | 14,627 | | | | 1,526,620 | | |
Arthur J. Gallagher & Co. | | | 45,854 | | | | 3,379,440 | | |
Associated Banc-Corp. | | | 81,437 | | | | 1,611,638 | | |
Athene Holding Ltd., Class A (a) | | | 44,365 | | | | 1,767,058 | | |
Bank of America Corp. | | | 71,064 | | | | 1,751,017 | | |
Bank Ozk | | | 49,039 | | | | 1,119,560 | | |
BB&T Corp. | | | 46,226 | | | | 2,002,510 | | |
BlackRock, Inc., Class A | | | 4,601 | | | | 1,807,365 | | |
BOK Financial Corp. | | | 24,982 | | | | 1,831,930 | | |
Brown & Brown, Inc. | | | 112,898 | | | | 3,111,469 | | |
CBOE Holdings, Inc. | | | 22,026 | | | | 2,154,804 | | |
Citizens Financial Group, Inc. | | | 52,550 | | | | 1,562,312 | | |
CME Group, Inc. | | | 15,085 | | | | 2,837,789 | | |
CNA Financial Corp. | | | 59,649 | | | | 2,633,503 | | |
Comerica, Inc. | | | 23,742 | | | | 1,630,838 | | |
Commerce Bank, Inc. | | | 40,651 | | | | 2,291,497 | | |
Credit Acceptance Corp. (a) | | | 4,015 | | | | 1,532,766 | | |
Cullen/Frost Bankers, Inc. | | | 21,650 | | | | 1,903,901 | | |
Discover Financial Services | | | 30,419 | | | | 1,794,113 | | |
E*TRADE Financial Corp. | | | 34,122 | | | | 1,497,273 | | |
East West Bancorp, Inc. | | | 35,290 | | | | 1,536,174 | | |
Eaton Vance Corp. | | | 51,461 | | | | 1,810,398 | | |
Erie Indemnity Co., Class A | | | 23,924 | | | | 3,189,308 | | |
FactSet Research Systems, Inc. | | | 11,393 | | | | 2,280,081 | | |
Fifth Third BanCorp | | | 64,432 | | | | 1,516,085 | | |
First American Financial Corp. | | | 48,087 | | | | 2,146,604 | | |
First Citizens BancShares, Inc., Class A | | | 4,728 | | | | 1,782,692 | | |
First Republic Bank | | | 27,486 | | | | 2,388,533 | | |
FNF Group | | | 65,052 | | | | 2,045,235 | | |
Green Dot Corp. (a) | | | 17,905 | | | | 1,423,806 | | |
Hanover Insurance Group, Inc. | | | 22,494 | | | | 2,626,624 | | |
Huntington Bancshares, Inc. | | | 150,908 | | | | 1,798,823 | | |
IBERIABANK Corp. | | | 28,322 | | | | 1,820,538 | | |
Intercontinental Exchange, Inc. | | | 36,944 | | | | 2,782,992 | | |
Invesco Ltd. | | | 80,011 | | | | 1,339,384 | | |
JPMorgan Chase & Co. | | | 21,129 | | | | 2,062,613 | | |
Kemper Corp. | | | 21,084 | | | | 1,399,556 | | |
KeyCorp | | | 99,196 | | | | 1,466,117 | | |
Lincoln National Corp. | | | 31,838 | | | | 1,633,608 | | |
Loews Corp. | | | 63,260 | | | | 2,879,595 | | |
See notes to financial statements.
99
Victory Portfolios II
VictoryShares US 500 Enhanced Volatility Wtd ETF | | Schedule of Portfolio Investments — continued
December 31, 2018 | |
(Unaudited)
Security Description | | Shares | | Value | |
LPL Financial Holdings, Inc. | | | 28,569 | | | $ | 1,744,995 | | |
M&T Bank Corp. | | | 14,932 | | | | 2,137,217 | | |
MarketAxess Holdings, Inc. | | | 13,843 | | | | 2,925,163 | | |
Marsh & McLennan Co., Inc. | | | 40,925 | | | | 3,263,769 | | |
MGIC Investment Corp. (a) | | | 100,596 | | | | 1,052,234 | | |
Moody's Corp. | | | 15,461 | | | | 2,165,158 | | |
Morgan Stanley | | | 41,367 | | | | 1,640,202 | | |
Morningstar, Inc. | | | 20,309 | | | | 2,230,741 | | |
MSCI, Inc. | | | 15,124 | | | | 2,229,731 | | |
Nasdaq, Inc. | | | 31,154 | | | | 2,541,232 | | |
New York Community Bancorp, Inc. | | | 196,354 | | | | 1,847,691 | | |
Northern Trust Corp. | | | 21,667 | | | | 1,811,145 | | |
Old Republic International Corp. | | | 141,674 | | | | 2,914,234 | | |
Onemain Holdings, Inc. (a) | | | 53,795 | | | | 1,306,681 | | |
PacWest Bancorp | | | 50,933 | | | | 1,695,050 | | |
People's United Financial, Inc. | | | 166,645 | | | | 2,404,687 | | |
Pinnacle Financial Partners, Inc. | | | 34,668 | | | | 1,598,195 | | |
Primerica, Inc. | | | 19,189 | | | | 1,874,957 | | |
Principal Financial Group, Inc. | | | 39,967 | | | | 1,765,342 | | |
Prosperity Bancshares, Inc. | | | 32,371 | | | | 2,016,713 | | |
Prudential Financial, Inc. | | | 22,284 | | | | 1,817,260 | | |
Raymond James Financial, Inc. | | | 22,043 | | | | 1,640,220 | | |
Regions Financial Corp. | | | 109,364 | | | | 1,463,290 | | |
Reinsurance Group of America, Inc. | | | 18,055 | | | | 2,531,853 | | |
S&P Global, Inc. | | | 15,000 | | | | 2,549,100 | | |
Santander Consumer USA Holdings, Inc. | | | 70,937 | | | | 1,247,782 | | |
SEI Investments Co. | | | 35,617 | | | | 1,645,505 | | |
Signature Bank | | | 17,526 | | | | 1,801,848 | | |
SLM Corp. (a) | | | 199,584 | | | | 1,658,543 | | |
State Street Corp. | | | 22,567 | | | | 1,423,301 | | |
SunTrust Banks, Inc. | | | 32,470 | | | | 1,637,787 | | |
SVB Financial Group (a) | | | 4,216 | | | | 800,703 | | |
Synchrony Financial | | | 57,325 | | | | 1,344,845 | | |
Synovus Financial Corp. | | | 44,633 | | | | 1,427,810 | | |
T. Rowe Price Group, Inc. | | | 19,554 | | | | 1,805,225 | | |
TD Ameritrade Holding Corp. | | | 32,334 | | | | 1,583,073 | | |
Texas Capital Bancshares, Inc. (a) | | | 23,116 | | | | 1,180,996 | | |
The Allstate Corp. | | | 32,593 | | | | 2,693,160 | | |
The Bank of New York Mellon Corp. | | | 42,582 | | | | 2,004,335 | | |
The Charles Schwab Corp. | | | 38,115 | | | | 1,582,916 | | |
The PNC Financial Services Group, Inc. | | | 16,821 | | | | 1,966,543 | | |
The Progressive Corp. | | | 44,899 | | | | 2,708,757 | | |
The Travelers Co., Inc. | | | 22,400 | | | | 2,682,400 | | |
Torchmark Corp. | | | 32,649 | | | | 2,433,330 | | |
U.S. Bancorp | | | 53,398 | | | | 2,440,290 | | |
Umpqua Holdings Corp. | | | 103,026 | | | | 1,638,113 | | |
Unum Group | | | 39,489 | | | | 1,160,187 | | |
W.R. Berkley Corp. | | | 44,686 | | | | 3,302,742 | | |
Webster Financial Corp. | | | 32,595 | | | | 1,606,608 | | |
Wells Fargo & Co. | | | 41,564 | | | | 1,915,269 | | |
See notes to financial statements.
100
Victory Portfolios II
VictoryShares US 500 Enhanced Volatility Wtd ETF | | Schedule of Portfolio Investments — continued
December 31, 2018 | |
(Unaudited)
Security Description | | Shares | | Value | |
Western Alliance BanCorp (a) | | | 41,045 | | | $ | 1,620,867 | | |
Wintrust Financial Corp. | | | 25,640 | | | | 1,704,804 | | |
Zions BanCorp | | | 42,392 | | | | 1,727,050 | | |
| | | | 191,150,091 | | |
Health Care (9.0%): | |
AbbVie, Inc. | | | 16,147 | | | | 1,488,592 | | |
ABIOMED, Inc. (a) | | | 3,369 | | | | 1,095,060 | | |
Align Technology, Inc. (a) | | | 3,620 | | | | 758,137 | | |
Anthem, Inc. | | | 9,326 | | | | 2,449,287 | | |
athenahealth, Inc. (a) | | | 9,131 | | | | 1,204,653 | | |
BIO-RAD Laboratories, Inc., Class A (a) | | | 6,514 | | | | 1,512,681 | | |
Bio-Techne Corp. | | | 11,379 | | | | 1,646,769 | | |
Centene Corp. (a) | | | 15,899 | | | | 1,833,155 | | |
Cerner Corp. (a) | | | 31,913 | | | | 1,673,518 | | |
Chemed Corp. | | | 8,714 | | | | 2,468,502 | | |
Cigna Corp. | | | 10,901 | | | | 2,070,318 | | |
Danaher Corp. | | | 27,357 | | | | 2,821,053 | | |
Encompass Health Corp. | | | 28,240 | | | | 1,742,408 | | |
Exelixis, Inc. (a) | | | 53,396 | | | | 1,050,299 | | |
Globus Medical, Inc., Class A (a) | | | 38,200 | | | | 1,653,296 | | |
HCA Holdings, Inc. | | | 17,259 | | | | 2,147,883 | | |
HealthEquity, Inc. (a) | | | 15,530 | | | | 926,365 | | |
Henry Schein, Inc. (a) | | | 25,406 | | | | 1,994,879 | | |
Hill-Rom Holdings, Inc. | | | 26,620 | | | | 2,357,201 | | |
Humana, Inc. | | | 9,056 | | | | 2,594,363 | | |
ICU Medical, Inc. (a) | | | 6,057 | | | | 1,390,869 | | |
IDEXX Laboratories, Inc. (a) | | | 7,353 | | | | 1,367,805 | | |
Illumina, Inc. (a) | | | 4,565 | | | | 1,369,180 | | |
Integra LifeSciences Holdings Corp. (a) | | | 35,990 | | | | 1,623,149 | | |
IQVIA Holdings, Inc. (a) | | | 17,887 | | | | 2,077,933 | | |
Jazz Pharmaceuticals PLC (a) | | | 12,928 | | | | 1,602,555 | | |
Laboratory Corp. of America Holdings (a) | | | 16,393 | | | | 2,071,419 | | |
Masimo Corp. (a) | | | 16,588 | | | | 1,781,054 | | |
Medidata Solutions, Inc. (a) | | | 17,555 | | | | 1,183,558 | | |
Mednax, Inc. (a) | | | 39,631 | | | | 1,307,823 | | |
Mettler-Toledo International, Inc. (a) | | | 3,827 | | | | 2,164,475 | | |
Mylan NV (a) | | | 43,401 | | | | 1,189,187 | | |
Neogen Corp. (a) | | | 24,516 | | | | 1,397,412 | | |
Penumbra, Inc. (a) | | | 8,801 | | | | 1,075,482 | | |
Perrigo Co. PLC | | | 23,610 | | | | 914,888 | | |
Pfizer, Inc. | | | 81,338 | | | | 3,550,404 | | |
Quest Diagnostics, Inc. | | | 22,229 | | | | 1,851,009 | | |
Regeneron Pharmaceuticals, Inc. (a) | | | 4,368 | | | | 1,631,448 | | |
ResMed, Inc. | | | 25,011 | | | | 2,848,002 | | |
Thermo Fisher Scientific, Inc. | | | 10,976 | | | | 2,456,319 | | |
United Therapeutics Corp. (a) | | | 12,564 | | | | 1,368,220 | | |
UnitedHealth Group, Inc. | | | 10,095 | | | | 2,514,866 | | |
Universal Health Services, Inc., Class B | | | 17,948 | | | | 2,092,019 | | |
Veeva Systems, Inc. (a) | | | 14,592 | | | | 1,303,357 | | |
WellCare Health Plans, Inc. (a) | | | 7,005 | | | | 1,653,810 | | |
See notes to financial statements.
101
Victory Portfolios II
VictoryShares US 500 Enhanced Volatility Wtd ETF | | Schedule of Portfolio Investments — continued
December 31, 2018 | |
(Unaudited)
Security Description | | Shares | | Value | |
Zimmer Biomet Holdings, Inc. | | | 18,561 | | | $ | 1,925,147 | | |
Zoetis, Inc. | | | 25,971 | | | | 2,221,559 | | |
| | | | 83,421,368 | | |
Industrials (19.0%): | |
3M Co. | | | 11,083 | | | | 2,111,755 | | |
A.O. Smith Corp. | | | 39,483 | | | | 1,685,924 | | |
Acuity Brands, Inc. | | | 9,577 | | | | 1,100,876 | | |
AGCO Corp. | | | 31,308 | | | | 1,742,916 | | |
Air Lease Corp. | | | 55,113 | | | | 1,664,964 | | |
Alaska Air Group, Inc. | | | 22,440 | | | | 1,365,474 | | |
Allegion PLC | | | 29,038 | | | | 2,314,619 | | |
Allison Transmission Holdings, Inc. | | | 35,941 | | | | 1,578,169 | | |
AMERCO, Inc. | | | 5,410 | | | | 1,775,075 | | |
American Airlines Group, Inc. | | | 37,421 | | | | 1,201,588 | | |
AMETEK, Inc. | | | 34,299 | | | | 2,322,042 | | |
ASGN, Inc. (a) | | | 20,669 | | | | 1,126,461 | | |
C.H. Robinson Worldwide, Inc. | | | 22,302 | | | | 1,875,375 | | |
Carlisle Cos., Inc. | | | 17,016 | | | | 1,710,448 | | |
Cintas Corp. | | | 12,620 | | | | 2,120,034 | | |
Copart, Inc. (a) | | | 37,720 | | | | 1,802,262 | | |
Costar Group, Inc. (a) | | | 5,368 | | | | 1,810,841 | | |
CSX Corp. | | | 29,189 | | | | 1,813,513 | | |
Curtiss-Wright Corp. | | | 15,518 | | | | 1,584,698 | | |
Delta Air Lines, Inc. | | | 36,835 | | | | 1,838,068 | | |
Dover Corp. | | | 25,499 | | | | 1,809,154 | | |
Eaton Corp. PLC, ADR | | | 29,658 | | | | 2,036,318 | | |
EMCOR Group, Inc. | | | 27,953 | | | | 1,668,515 | | |
Emerson Electric Co. | | | 29,501 | | | | 1,762,685 | | |
Equifax, Inc. | | | 17,062 | | | | 1,588,984 | | |
Expeditors International of Washington, Inc. | | | 29,095 | | | | 1,981,079 | | |
Fastenal Co. | | | 31,709 | | | | 1,658,064 | | |
FedEx Corp. | | | 9,106 | | | | 1,469,071 | | |
Fortive Corp. | | | 27,548 | | | | 1,863,898 | | |
Fortune Brands Home & Security, Inc. | | | 40,699 | | | | 1,546,155 | | |
Gardner Denver Holdings, Inc. (a) | | | 55,969 | | | | 1,144,566 | | |
General Dynamics Corp. | | | 13,633 | | | | 2,143,244 | | |
Genesee & Wyoming, Inc., Class A (a) | | | 27,300 | | | | 2,020,746 | | |
Graco, Inc. | | | 55,678 | | | | 2,330,124 | | |
Harris Corp. | | | 13,554 | | | | 1,825,046 | | |
HEICO Corp. | | | 21,794 | | | | 1,688,599 | | |
Hexcel Corp. | | | 40,883 | | | | 2,344,231 | | |
Hubbell, Inc. | | | 17,173 | | | | 1,705,966 | | |
Huntington Ingalls Industries, Inc. | | | 7,878 | | | | 1,499,262 | | |
IDEX Corp. | | | 16,082 | | | | 2,030,513 | | |
Ingersoll-Rand PLC | | | 21,751 | | | | 1,984,344 | | |
Insperity, Inc. | | | 12,718 | | | | 1,187,352 | | |
J.B. Hunt Transport Services, Inc. | | | 19,204 | | | | 1,786,740 | | |
Jacobs Engineering Group, Inc. | | | 25,961 | | | | 1,517,680 | | |
Johnson Controls International PLC | | | 54,326 | | | | 1,610,766 | | |
Kansas City Southern | | | 19,635 | | | | 1,874,161 | | |
See notes to financial statements.
102
Victory Portfolios II
VictoryShares US 500 Enhanced Volatility Wtd ETF | | Schedule of Portfolio Investments — continued
December 31, 2018 | |
(Unaudited)
Security Description | | Shares | | Value | |
KAR Auction Services, Inc. | | | 48,341 | | | $ | 2,306,833 | | |
Kirby Corp. (a) | | | 22,648 | | | | 1,525,569 | | |
Knight-Swift Transportation Holdings, Inc. | | | 45,038 | | | | 1,129,103 | | |
L3 Technologies, Inc. | | | 12,042 | | | | 2,091,214 | | |
Landstar System, Inc. | | | 18,871 | | | | 1,805,389 | | |
Lennox International, Inc. | | | 9,972 | | | | 2,182,471 | | |
Lincoln Electric Holdings, Inc. | | | 24,675 | | | | 1,945,624 | | |
ManpowerGroup, Inc. | | | 17,397 | | | | 1,127,326 | | |
Masco Corp. | | | 57,057 | | | | 1,668,347 | | |
MSC Industrial Direct Co., Inc., Class A | | | 28,137 | | | | 2,164,297 | | |
Nordson Corp. | | | 16,121 | | | | 1,924,041 | | |
Norfolk Southern Corp. | | | 11,758 | | | | 1,758,291 | | |
Northrop Grumman Corp. | | | 7,164 | | | | 1,754,464 | | |
Old Dominion Freight Line, Inc. | | | 11,704 | | | | 1,445,327 | | |
Oshkosh Corp. | | | 25,405 | | | | 1,557,581 | | |
PACCAR, Inc. | | | 29,273 | | | | 1,672,659 | | |
Parker-Hannifin Corp. | | | 11,509 | | | | 1,716,452 | | |
Quanta Services, Inc. | | | 70,244 | | | | 2,114,344 | | |
Raytheon Co. | | | 12,563 | | | | 1,926,536 | | |
Republic Services, Inc., Class A | | | 45,548 | | | | 3,283,554 | | |
Robert Half International, Inc. | | | 27,776 | | | | 1,588,787 | | |
Rollins, Inc. | | | 70,593 | | | | 2,548,407 | | |
Roper Technologies, Inc. | | | 8,346 | | | | 2,224,376 | | |
Schneider National, Inc. | | | 65,444 | | | | 1,221,839 | | |
Sensata Technologies Holding PLC, ADR (a) | | | 41,639 | | | | 1,867,093 | | |
Snap-on, Inc. | | | 11,501 | | | | 1,670,980 | | |
Southwest Airlines Co. | | | 32,251 | | | | 1,499,026 | | |
Spirit Aerosystems Holdings, Inc., Class A | | | 24,460 | | | | 1,763,321 | | |
Stanley Black & Decker, Inc. | | | 14,236 | | | | 1,704,619 | | |
Stericycle, Inc. (a) | | | 30,220 | | | | 1,108,772 | | |
Teledyne Technologies, Inc. (a) | | | 9,793 | | | | 2,027,837 | | |
The Boeing Co. | | | 5,506 | | | | 1,775,685 | | |
The Middleby Corp. (a) | | | 11,309 | | | | 1,161,774 | | |
Toro Co. | | | 38,943 | | | | 2,176,135 | | |
TransDigm Group, Inc. (a) | | | 7,832 | | | | 2,663,350 | | |
TransUnion | | | 31,154 | | | | 1,769,547 | | |
Trex Co., Inc. (a) | | | 13,860 | | | | 822,730 | | |
Trinity Industries, Inc. | | | 92,529 | | | | 1,905,172 | | |
Union Pacific Corp. | | | 16,487 | | | | 2,278,998 | | |
United Continental Holdings, Inc. (a) | | | 21,039 | | | | 1,761,595 | | |
United Parcel Service, Inc., Class B | | | 19,623 | | | | 1,913,831 | | |
United Rentals, Inc. (a) | | | 9,771 | | | | 1,001,821 | | |
United Technologies Corp. | | | 22,396 | | | | 2,384,726 | | |
Verisk Analytics, Inc., Class A (a) | | | 24,912 | | | | 2,716,405 | | |
W.W. Grainger, Inc. | | | 4,899 | | | | 1,383,282 | | |
WABCO Holdings, Inc. (a) | | | 18,568 | | | | 1,993,089 | | |
Wabtec Corp. (b) | | | 23,521 | | | | 1,652,350 | | |
Waste Management, Inc. | | | 32,929 | | | | 2,930,352 | | |
Watsco, Inc. | | | 11,687 | | | | 1,626,129 | | |
Woodward, Inc. | | | 31,763 | | | | 2,359,674 | | |
See notes to financial statements.
103
Victory Portfolios II
VictoryShares US 500 Enhanced Volatility Wtd ETF | | Schedule of Portfolio Investments — continued
December 31, 2018 | |
(Unaudited)
Security Description | | Shares | | Value | |
XPO Logistics, Inc. (a) | | | 15,024 | | | $ | 856,969 | | |
Xylem, Inc. | | | 26,157 | | | | 1,745,195 | | |
| | | | 175,825,653 | | |
Information Technology (11.0%): | |
Accenture PLC, Class A | | | 13,206 | | | | 1,862,178 | | |
Adobe Systems, Inc. (a) | | | 7,155 | | | | 1,618,747 | | |
Advanced Micro Devices, Inc. (a) | | | 40,826 | | | | 753,648 | | |
Akamai Technologies, Inc. (a) | | | 24,482 | | | | 1,495,361 | | |
Alliance Data Systems Corp. | | | 8,439 | | | | 1,266,525 | | |
Analog Devices, Inc. | | | 22,494 | | | | 1,930,661 | | |
ANSYS, Inc. (a) | | | 13,555 | | | | 1,937,552 | | |
Apple, Inc. | | | 10,040 | | | | 1,583,710 | | |
Applied Materials, Inc. | | | 31,854 | | | | 1,042,900 | | |
Arrow Electronics, Inc. (a) | | | 29,474 | | | | 2,032,232 | | |
Aspen Technology, Inc. (a) | | | 19,414 | | | | 1,595,443 | | |
Automatic Data Processing, Inc. | | | 18,647 | | | | 2,444,995 | | |
Black Knight, Inc. (a) | | | 62,514 | | | | 2,816,881 | | |
Blackbaud, Inc. | | | 16,561 | | | | 1,041,687 | | |
Booz Allen Hamilton Holdings Corp. | | | 55,084 | | | | 2,482,636 | | |
Broadcom, Inc. | | | 6,905 | | | | 1,755,803 | | |
Broadridge Financial Solutions, Inc. | | | 15,584 | | | | 1,499,960 | | |
CACI International, Inc., Class A (a) | | | 11,106 | | | | 1,599,597 | | |
CDK Global, Inc. | | | 50,732 | | | | 2,429,047 | | |
CDW Corp. of Delaware | | | 27,547 | | | | 2,232,685 | | |
Coherent, Inc. (a) | | | 6,137 | | | | 648,742 | | |
CommScope Holding Co., Inc. (a) | | | 36,158 | | | | 592,630 | | |
DXC Technology Co. | | | 25,431 | | | | 1,352,166 | | |
F5 Networks, Inc. (a) | | | 12,996 | | | | 2,105,742 | | |
Fair Isaac Corp. (a) | | | 10,376 | | | | 1,940,312 | | |
Fidelity National Information Services, Inc. | | | 29,091 | | | | 2,983,282 | | |
First Data Corp., Class A (a) | | | 57,967 | | | | 980,222 | | |
Fiserv, Inc. (a) | | | 42,276 | | | | 3,106,862 | | |
FleetCor Technologies, Inc. (a) | | | 10,988 | | | | 2,040,691 | | |
Genpact Ltd. | | | 87,684 | | | | 2,366,591 | | |
Global Payments, Inc. | | | 19,126 | | | | 1,972,464 | | |
Hewlett Packard Enterprises Co. | | | 112,664 | | | | 1,488,291 | | |
HP, Inc. | | | 91,008 | | | | 1,862,024 | | |
IPG Photonics Corp. (a) | | | 5,589 | | | | 633,178 | | |
Jabil Circuit, Inc. | | | 65,471 | | | | 1,623,026 | | |
Jack Henry & Associates, Inc. | | | 17,435 | | | | 2,205,876 | | |
Leidos Holdings, Inc. | | | 35,138 | | | | 1,852,475 | | |
LogMeIn, Inc. | | | 13,187 | | | | 1,075,664 | | |
Marvell Technology Group Ltd., ADR | | | 72,700 | | | | 1,177,013 | | |
Mastercard, Inc., Class A | | | 11,098 | | | | 2,093,638 | | |
Micron Technology, Inc. (a) | | | 20,634 | | | | 654,717 | | |
MKS Instruments, Inc. | | | 13,756 | | | | 888,775 | | |
Monolithic Power Systems, Inc. | | | 12,613 | | | | 1,466,261 | | |
Nvidia Corp. | | | 5,278 | | | | 704,613 | | |
ON Semiconductor Corp. (a) | | | 72,267 | | | | 1,193,128 | | |
Paychex, Inc. | | | 41,570 | | | | 2,708,286 | | |
See notes to financial statements.
104
Victory Portfolios II
VictoryShares US 500 Enhanced Volatility Wtd ETF | | Schedule of Portfolio Investments — continued
December 31, 2018 | |
(Unaudited)
Security Description | | Shares | | Value | |
Paycom Software, Inc. (a) | | | 7,378 | | | $ | 903,436 | | |
PayPal Holdings, Inc. (a) | | | 21,063 | | | | 1,771,188 | | |
PTC, Inc. (a) | | | 21,233 | | | | 1,760,216 | | |
Sabre Corp. | | | 70,045 | | | | 1,515,774 | | |
Salesforce.com, Inc. (a) | | | 13,745 | | | | 1,882,653 | | |
Seagate Technology PLC | | | 28,273 | | | | 1,091,055 | | |
Skyworks Solutions, Inc. | | | 20,572 | | | | 1,378,735 | | |
Texas Instruments, Inc. | | | 18,045 | | | | 1,705,253 | | |
The Trade Desk, Inc., Class A (a) | | | 4,027 | | | | 467,374 | | |
Total System Services, Inc. | | | 27,106 | | | | 2,203,447 | | |
Tyler Technologies, Inc. (a) | | | 11,255 | | | | 2,091,403 | | |
Universal Display Corp. | | | 8,083 | | | | 756,326 | | |
VeriSign, Inc. (a) | | | 16,730 | | | | 2,480,892 | | |
Visa, Inc., Class A | | | 18,521 | | | | 2,443,661 | | |
WEX, Inc. (a) | | | 12,189 | | | | 1,707,191 | | |
Xilinx, Inc. | | | 22,549 | | | | 1,920,498 | | |
| | | | 103,218,019 | | |
Materials (5.6%): | |
Air Products & Chemicals, Inc. | | | 17,825 | | | | 2,852,891 | | |
AptarGroup, Inc. | | | 27,771 | | | | 2,612,418 | | |
Ball Corp. | | | 69,264 | | | | 3,184,758 | | |
Berry Global Group, Inc. (a) | | | 51,866 | | | | 2,465,191 | | |
Celanese Corp., Series A | | | 19,045 | | | | 1,713,479 | | |
Eastman Chemical Co. | | | 25,146 | | | | 1,838,424 | | |
Ecolab, Inc. | | | 21,344 | | | | 3,145,037 | | |
FMC Corp. | | | 24,209 | | | | 1,790,498 | | |
Freeport-McMoRan, Inc. | | | 83,941 | | | | 865,432 | | |
Huntsman Corp. | | | 56,850 | | | | 1,096,637 | | |
International Paper Co. | | | 41,577 | | | | 1,678,048 | | |
Lyondellbasell Industries NV, Class A | | | 18,469 | | | | 1,535,882 | | |
Martin Marietta Materials, Inc. | | | 11,147 | | | | 1,915,835 | | |
NewMarket Corp. | | | 5,941 | | | | 2,448,227 | | |
Nucor Corp. | | | 30,462 | | | | 1,578,237 | | |
Olin Corp. | | | 60,749 | | | | 1,221,662 | | |
Packaging Corp. of America | | | 20,163 | | | | 1,682,804 | | |
PPG Industries, Inc. | | | 22,305 | | | | 2,280,240 | | |
Reliance Steel & Aluminum Co. | | | 21,995 | | | | 1,565,384 | | |
RPM International, Inc. | | | 32,513 | | | | 1,911,114 | | |
Sonoco Products Co. | | | 54,449 | | | | 2,892,875 | | |
Steel Dynamics, Inc. | | | 36,461 | | | | 1,095,288 | | |
The Chemours Co. | | | 37,455 | | | | 1,056,980 | | |
The Sherwin-Williams Co. | | | 5,312 | | | | 2,090,060 | | |
U.S. Steel Corp. | | | 35,313 | | | | 644,109 | | |
Vulcan Materials Co. | | | 19,095 | | | | 1,886,586 | | |
Westlake Chemical Corp. | | | 18,235 | | | | 1,206,610 | | |
WestRock Co. | | | 43,102 | | | | 1,627,532 | | |
| | | | 51,882,238 | | |
See notes to financial statements.
105
Victory Portfolios II
VictoryShares US 500 Enhanced Volatility Wtd ETF | | Schedule of Portfolio Investments — continued
December 31, 2018 | |
(Unaudited)
Security Description | | Shares | | Value | |
Real Estate (0.4%): | |
CBRE Group, Inc., Class A (a) | | | 56,150 | | | $ | 2,248,246 | | |
Jones Lang LaSalle, Inc. | | | 14,021 | | | | 1,775,059 | | |
| | | | 4,023,305 | | |
Utilities (7.5%): | |
Alliant Energy Corp. | | | 76,718 | | | | 3,241,336 | | |
American Electric Power Co., Inc. | | | 45,242 | | | | 3,381,387 | | |
Aqua America, Inc. | | | 79,971 | | | | 2,734,208 | | |
Atmos Energy Corp. | | | 38,606 | | | | 3,579,548 | | |
Consolidated Edison, Inc. | | | 42,076 | | | | 3,217,131 | | |
Dominion Resources, Inc. | | | 42,356 | | | | 3,026,760 | | |
DTE Energy Co. | | | 31,365 | | | | 3,459,560 | | |
Duke Energy Corp. | | | 41,444 | | | | 3,576,617 | | |
Eversource Energy | | | 54,350 | | | | 3,534,924 | | |
Exelon Corp. | | | 82,341 | | | | 3,713,579 | | |
IDACORP, Inc. | | | 31,122 | | | | 2,896,213 | | |
MDU Resources Group, Inc. | | | 112,173 | | | | 2,674,204 | | |
National Fuel Gas Co. | | | 57,713 | | | | 2,953,751 | | |
NextEra Energy, Inc. | | | 21,552 | | | | 3,746,168 | | |
OGE Energy Corp. | | | 88,936 | | | | 3,485,402 | | |
Pinnacle West Capital Corp. | | | 41,969 | | | | 3,575,759 | | |
PPL Corp. | | | 88,124 | | | | 2,496,553 | | |
Public Service Enterprise Group, Inc. | | | 61,761 | | | | 3,214,660 | | |
UGI Corp. | | | 69,072 | | | | 3,684,992 | | |
WEC Energy Group, Inc. | | | 49,892 | | | | 3,455,520 | | |
Xcel Energy, Inc. | | | 65,973 | | | | 3,250,491 | | |
| | | | 68,898,763 | | |
Total Common Stocks (Cost $1,023,077,638) | | | 923,351,852 | | |
Investment Companies (0.0%) (c) | |
JPMorgan U.S. Treasury Plus Money Market Fund, Class L, 2.27% | | | 427,261 | | | | 427,261 | | |
Total Investment Companies (Cost $427,261) | | | 427,261 | | |
Collateral for Securities Loaned^ (0.2%) | |
BlackRock Liquidity Funds TempFund Portfolio, Institutional Class, 2.49% (d) | | | 300,577 | | | | 300,577 | | |
Fidelity Investments Money Market Government Portfolio, Class I, 2.28% (d) | | | 434,318 | | | | 434,318 | | |
Fidelity Investments Prime Money Market Portfolio, Class I, 2.46% (d) | | | 13,412 | | | | 13,412 | | |
Goldman Sachs Financial Square Prime Obligations Fund, Institutional Class,
2.55% (d) | | | 166,989 | | | | 166,989 | | |
JPMorgan Prime Money Market Fund, Capital Class, 2.49% (d) | | | 267,165 | | | | 267,165 | | |
Morgan Stanley Institutional Liquidity Prime Portfolio, Institutional Class,
2.58% (d) | | | 400,773 | | | | 400,773 | | |
Total Collateral for Securities Loaned (Cost $1,583,234) | | | 1,583,234 | | |
Total Investments (Cost $1,025,088,133) — 100.1% | | | 925,362,347 | | |
Liabilities in excess of other assets — (0.1)% | | | (735,703 | ) | |
NET ASSETS — 100.00% | | $ | 924,626,644 | | |
See notes to financial statements.
106
Victory Portfolios II
VictoryShares US 500 Enhanced Volatility Wtd ETF | | Schedule of Portfolio Investments — continued
December 31, 2018 | |
(Unaudited)
^ Purchased with cash collateral from securities on loan.
(a) Non-income producing security.
(b) All or a portion of this security is on loan.
(c) Amount represents less than 0.05% of net assets.
(d) Rate disclosed is the daily yield on December 31, 2018.
ADR — American Depositary Receipt
PLC — Public Limited Company
Futures Contracts Purchased
| | | Number
of
Contracts | | Expiration
Date | | Notional
Amount | | Value | | Unrealized
Appreciation
(Depreciation) | |
E-Mini S&P 500 Futures | | | 5 | | | 3/15/19 | | $ | 620,720 | | | $ | 626,300 | | | $ | 5,580 | | |
| | | Total unrealized appreciation | | | | | | | | $ | 5,580 | | |
| | | Total unrealized depreciation | | | | | | | | | — | | |
| | | Total net unrealized appreciation(depreciation) | | | | | | | | $ | 5,580 | | |
See notes to financial statements.
107
Victory Portfolios II
VictoryShares US EQ Income Enhanced Volatility Wtd ETF | | Schedule of Portfolio Investments
December 31, 2018 | |
(Unaudited)
Security Description | | Shares | | Value | |
Common Stocks (99.7%) | |
Communication Services (4.6%): | |
AT&T, Inc. | | | 270,874 | | | $ | 7,730,744 | | |
CenturyLink, Inc. | | | 261,647 | | | | 3,963,952 | | |
Omnicom Group, Inc. | | | 127,006 | | | | 9,301,919 | | |
Verizon Communications, Inc. | | | 183,156 | | | | 10,297,030 | | |
Viacom, Inc., Class B | | | 234,766 | | | | 6,033,486 | | |
| | | | 37,327,131 | | |
Consumer Discretionary (10.9%): | |
Ford Motor Co. | | | 895,497 | | | | 6,850,552 | | |
Garmin Ltd. | | | 157,476 | | | | 9,971,380 | | |
Genuine Parts Co. | | | 107,835 | | | | 10,354,317 | | |
Harley-Davidson, Inc. | | | 169,460 | | | | 5,781,975 | | |
Kohl's Corp. | | | 66,520 | | | | 4,412,937 | | |
L Brands, Inc. | | | 162,960 | | | | 4,183,183 | | |
Las Vegas Sands Corp. | | | 113,641 | | | | 5,915,014 | | |
Leggett & Platt, Inc. | | | 193,665 | | | | 6,940,954 | | |
Macy's, Inc. | | | 117,055 | | | | 3,485,898 | | |
McDonald's Corp. | | | 56,393 | | | | 10,013,705 | | |
Newell Brands, Inc. | | | 229,543 | | | | 4,267,204 | | |
Penske Automotive Group, Inc. | | | 142,508 | | | | 5,745,922 | | |
Target Corp. | | | 90,628 | | | | 5,989,604 | | |
The Gap, Inc. | | | 152,322 | | | | 3,923,815 | | |
| | | | 87,836,460 | | |
Consumer Staples (14.4%): | |
Altria Group, Inc. | | | 139,454 | | | | 6,887,633 | | |
Archer-Daniels-Midland Co. | | | 242,863 | | | | 9,950,096 | | |
Colgate-Palmolive Co. | | | 171,829 | | | | 10,227,262 | | |
General Mills, Inc. | | | 165,141 | | | | 6,430,591 | | |
Ingredion, Inc. | | | 74,466 | | | | 6,806,192 | | |
Kellogg Co. | | | 120,573 | | | | 6,873,867 | | |
Kimberly-Clark Corp. | | | 73,545 | | | | 8,379,717 | | |
Molson Coors Brewing Co., Class B | | | 90,082 | | | | 5,059,005 | | |
Philip Morris International, Inc. | | | 80,432 | | | | 5,369,640 | | |
The Clorox Co. | | | 54,147 | | | | 8,346,219 | | |
The Hershey Co. | | | 90,411 | | | | 9,690,251 | | |
The J.M. Smucker Co. | | | 70,989 | | | | 6,636,762 | | |
The Kraft Heinz Co. | | | 130,303 | | | | 5,608,241 | | |
The Procter & Gamble Co. | | | 147,771 | | | | 13,583,110 | | |
Walgreens Boots Alliance, Inc. | | | 100,417 | | | | 6,861,494 | | |
| | | | 116,710,080 | | |
Electric Utilities (17.0%): | |
Alliant Energy Corp. | | | 282,924 | | | | 11,953,539 | | |
American Electric Power Co., Inc. | | | 166,896 | | | | 12,473,807 | | |
Duke Energy Corp. | | | 152,890 | | | | 13,194,407 | | |
Eversource Energy | | | 200,450 | | | | 13,037,268 | | |
Exelon Corp. | | | 303,716 | | | | 13,697,592 | | |
IDACORP, Inc. | | | 114,793 | | | | 10,682,637 | | |
See notes to financial statements.
108
Victory Portfolios II
VictoryShares US EQ Income Enhanced Volatility Wtd ETF | | Schedule of Portfolio Investments — continued
December 31, 2018 | |
(Unaudited)
Security Description | | Shares | | Value | |
NextEra Energy, Inc. | | | 79,480 | | | $ | 13,815,214 | | |
OGE Energy Corp. | | | 328,021 | | | | 12,855,143 | | |
Pinnacle West Capital Corp. | | | 154,804 | | | | 13,189,301 | | |
PPL Corp. | | | 325,056 | | | | 9,208,836 | | |
Xcel Energy, Inc. | | | 243,344 | | | | 11,989,559 | | |
| | | | 136,097,303 | | |
Energy (6.1%): | |
Chevron Corp. | | | 76,474 | | | | 8,319,607 | | |
Exxon Mobil Corp. | | | 120,906 | | | | 8,244,580 | | |
Occidental Petroleum Corp. | | | 105,172 | | | | 6,455,457 | | |
ONEOK, Inc. | | | 157,514 | | | | 8,497,881 | | |
Phillips 66 | | | 78,003 | | | | 6,719,958 | | |
The Williams Cos., Inc. | | | 286,909 | | | | 6,326,343 | | |
Valero Energy Corp. | | | 65,438 | | | | 4,905,887 | | |
| | | | 49,469,713 | | |
Financials (17.3%): | |
American Financial Group, Inc. | | | 107,935 | | | | 9,771,356 | | |
Ameriprise Financial, Inc. | | | 53,957 | | | | 5,631,492 | | |
BB&T Corp. | | | 170,512 | | | | 7,386,580 | | |
CNA Financial Corp. | | | 220,009 | | | | 9,713,397 | | |
Erie Indemnity Co., Class A | | | 88,257 | | | | 11,765,542 | | |
First American Financial Corp. | | | 177,338 | | | | 7,916,368 | | |
FNF Group | | | 239,960 | | | | 7,544,342 | | |
Huntington Bancshares, Inc. | | | 556,609 | | | | 6,634,779 | | |
Invesco Ltd. | | | 295,075 | | | | 4,939,556 | | |
KeyCorp | | | 365,878 | | | | 5,407,677 | | |
New York Community Bancorp, Inc. | | | 724,219 | | | | 6,814,901 | | |
Old Republic International Corp. | | | 522,540 | | | | 10,748,648 | | |
PacWest Bancorp | | | 187,835 | | | | 6,251,149 | | |
People's United Financial, Inc. | | | 614,619 | | | | 8,868,953 | | |
Principal Financial Group, Inc. | | | 147,414 | | | | 6,511,276 | | |
Prudential Financial, Inc. | | | 82,197 | | | | 6,703,165 | | |
Umpqua Holdings Corp. | | | 379,988 | | | | 6,041,809 | | |
Unum Group | | | 145,649 | | | | 4,279,168 | | |
Wells Fargo & Co. | | | 153,306 | | | | 7,064,340 | | |
| | | | 139,994,498 | | |
Gas Utilities (1.4%): | |
National Fuel Gas Co. (a) | | | 212,834 | | | | 10,892,844 | | |
Health Care (2.3%): | |
AbbVie, Inc. | | | 59,522 | | | | 5,487,333 | | |
Pfizer, Inc. | | | 299,964 | | | | 13,093,429 | | |
| | | | 18,580,762 | | |
Industrials (7.6%): | |
3M Co. | | | 40,856 | | | | 7,784,702 | | |
Eaton Corp. PLC, ADR | | | 109,440 | | | | 7,514,151 | | |
Emerson Electric Co. | | | 108,798 | | | | 6,500,681 | | |
Fastenal Co. | | | 116,911 | | | | 6,113,276 | | |
Hubbell, Inc. | | | 63,351 | | | | 6,293,288 | | |
See notes to financial statements.
109
Victory Portfolios II
VictoryShares US EQ Income Enhanced Volatility Wtd ETF | | Schedule of Portfolio Investments — continued
December 31, 2018 | |
(Unaudited)
Security Description | | Shares | | Value | |
Johnson Controls International PLC | | | 200,343 | | | $ | 5,940,170 | | |
MSC Industrial Direct Co., Inc., Class A | | | 103,792 | | | | 7,983,681 | | |
United Parcel Service, Inc., Class B | | | 72,405 | | | | 7,061,660 | | |
Watsco, Inc. | | | 43,129 | | | | 6,000,969 | | |
| | | | 61,192,578 | | |
Information Technology (2.5%): | |
Broadcom, Inc. | | | 25,429 | | | | 6,466,086 | | |
Paychex, Inc. | | | 153,324 | | | | 9,989,059 | | |
Seagate Technology PLC | | | 104,260 | | | | 4,023,393 | | |
| | | | 20,478,538 | | |
Materials (6.9%): | |
Air Products & Chemicals, Inc. | | | 65,702 | | | | 10,515,605 | | |
International Paper Co. | | | 153,351 | | | | 6,189,246 | | |
Lyondellbasell Industries NV, Class A | | | 68,137 | | | | 5,666,273 | | |
Nucor Corp. | | | 112,311 | | | | 5,818,833 | | |
Olin Corp. | | | 224,029 | | | | 4,505,223 | | |
Packaging Corp. of America | | | 74,367 | | | | 6,206,670 | | |
Sonoco Products Co. | | | 200,781 | | | | 10,667,495 | | |
WestRock Co. | | | 158,929 | | | | 6,001,159 | | |
| | | | 55,570,504 | | |
Multi-Utilities (8.7%): | |
Consolidated Edison, Inc. | | | 155,179 | | | | 11,864,986 | | |
Dominion Resources, Inc. | | | 156,243 | | | | 11,165,125 | | |
DTE Energy Co. | | | 115,711 | | | | 12,762,923 | | |
MDU Resources Group, Inc. | | | 413,745 | | | | 9,863,681 | | |
Public Service Enterprise Group, Inc. | | | 227,811 | | | | 11,857,563 | | |
WEC Energy Group, Inc. | | | 184,036 | | | | 12,746,332 | | |
| | | | 70,260,610 | | |
Total Common Stocks (Cost $882,361,159) | | | 804,411,021 | | |
Investment Companies (0.1%) | |
JPMorgan U.S. Treasury Plus Money Market Fund, Class L, 2.27% | | | 823,070 | | | | 823,070 | | |
Total Investment Companies (Cost $823,070) | | | 823,070 | | |
Collateral for Securities Loaned^ (0.2%) | |
BlackRock Liquidity Funds TempFund Portfolio, Institutional Class, 2.49% (b) | | | 246,721 | | | | 246,721 | | |
Fidelity Investments Money Market Government Portfolio, Class I, 2.28% (b) | | | 356,500 | | | | 356,500 | | |
Fidelity Investments Prime Money Market Portfolio, Class I, 2.46% (b) | | | 11,009 | | | | 11,009 | | |
Goldman Sachs Financial Square Prime Obligations Fund, Institutional Class,
2.55% (b) | | | 137,069 | | | | 137,069 | | |
JPMorgan Prime Money Market Fund, Capital Class, 2.49% (b) | | | 219,296 | | | | 219,296 | | |
Morgan Stanley Institutional Liquidity Prime Portfolio, Institutional Class,
2.58% (b) | | | 328,964 | | | | 328,964 | | |
Total Collateral for Securities Loaned (Cost $1,299,559) | | | 1,299,559 | | |
Total Investments (Cost $884,483,788) — 100.0% | | | 806,533,650 | | |
Other assets in excess of liabilities — 0.0% | | | 329,122 | | |
NET ASSETS — 100.00% | | $ | 806,862,772 | | |
See notes to financial statements.
110
Victory Portfolios II
VictoryShares US EQ Income Enhanced Volatility Wtd ETF | | Schedule of Portfolio Investments — continued
December 31, 2018 | |
(Unaudited)
^ Purchased with cash collateral from securities on loan.
(a) All or a portion of this security is on loan.
(b) Rate disclosed is the daily yield on December 31, 2018.
ADR — American Depositary Receipt
PLC — Public Limited Company
Futures Contracts Purchased
| | | Number
of
Contracts | | Expiration
Date | | Notional
Amount | | Value | | Unrealized
Appreciation
(Depreciation) | |
E-Mini S&P 500 Futures | | | 11 | | | 3/15/19 | | $ | 1,385,244 | | | $ | 1,377,860 | | | $ | (7,384 | ) | |
| | | Total unrealized appreciation | | | | | | | | $ | — | | |
| | | Total unrealized depreciation | | | | | | | | | (7,384 | ) | |
| | | Total net unrealized appreciation(depreciation) | | | | | | | | $ | (7,384 | ) | |
See notes to financial statements.
111
Victory Portfolios II
VictoryShares US Discovery Enhanced Volatility Wtd ETF | | Schedule of Portfolio Investments
December 31, 2018 | |
(Unaudited)
Security Description | | Shares | | Value | |
Common Stocks (99.0%) | |
Communication Services (2.8%): | |
Cars.com, Inc. (a) | | | 11,448 | | | $ | 246,132 | | |
Emerald Expositions Events, Inc. | | | 21,494 | | | | 265,236 | | |
Gray Television, Inc. (a) | | | 13,556 | | | | 199,815 | | |
Loral Space & Communications, Inc. (a) | | | 11,859 | | | | 441,747 | | |
Marcus Corp. | | | 10,220 | | | | 403,690 | | |
MSG Networks, Inc., Class A (a) | | | 13,421 | | | | 316,199 | | |
QuinStreet, Inc. (a) | | | 11,993 | | | | 194,646 | | |
Shenandoah Telecommunications Co. | | | 8,651 | | | | 382,807 | | |
Sinclair Broadcast Group, Inc., Class A | | | 10,293 | | | | 271,118 | | |
Techtarget, Inc. (a) | | | 10,212 | | | | 124,689 | | |
TEGNA, Inc. | | | 27,632 | | | | 300,360 | | |
| | | | 3,146,439 | | |
Consumer Discretionary (16.0%): | |
Acushnet Holdings Corp. | | | 15,423 | | | | 324,963 | | |
American Axle & Manufacturing Holdings, Inc. (a) | | | 17,430 | | | | 193,473 | | |
American Outdoor Brands Corp. (a) | | | 11,273 | | | | 144,971 | | |
American Public Education, Inc. (a) | | | 5,186 | | | | 147,594 | | |
America's Car-Mart, Inc./TX (a) | | | 3,077 | | | | 222,929 | | |
Asbury Automotive Group, Inc. (a) | | | 5,544 | | | | 369,562 | | |
Bed Bath & Beyond, Inc. | | | 14,521 | | | | 164,378 | | |
Big Lots, Inc. | | | 7,507 | | | | 217,102 | | |
BJ's Restaurants, Inc. | | | 4,082 | | | | 206,427 | | |
Bloomin' Brands, Inc. | | | 21,415 | | | | 383,114 | | |
Bluegreen Vacations Corp. | | | 13,990 | | | | 180,891 | | |
Bojangles', Inc. (a) | | | 24,481 | | | | 393,654 | | |
Boot Barn Holdings, Inc. (a) | | | 7,965 | | | | 135,644 | | |
Brinker International, Inc. | | | 7,870 | | | | 346,123 | | |
Caleres, Inc. | | | 8,434 | | | | 234,718 | | |
Carriage Services, Inc. | | | 26,281 | | | | 407,355 | | |
Cavco Industries, Inc. (a) | | | 1,275 | | | | 166,235 | | |
Century Communities, Inc. (a) | | | 10,824 | | | | 186,822 | | |
Chico's FAS, Inc. | | | 25,080 | | | | 140,950 | | |
Chuy's Holdings, Inc. (a) | | | 10,638 | | | | 188,718 | | |
Citi Trends, Inc. | | | 8,648 | | | | 176,333 | | |
Conn's, Inc. (a) | | | 4,258 | | | | 80,306 | | |
Cooper-Standard Holding (a) | | | 3,173 | | | | 197,107 | | |
Dave & Buster's Entertainment, Inc. | | | 5,052 | | | | 225,117 | | |
Denny's Corp. (a) | | | 24,947 | | | | 404,391 | | |
Dorman Products, Inc. (a) | | | 5,748 | | | | 517,435 | | |
Ethan Allen Interiors, Inc. | | | 19,984 | | | | 351,519 | | |
Express, Inc. (a) | | | 20,762 | | | | 106,094 | | |
Fox Factory Holding Corp. (a) | | | 3,835 | | | | 225,766 | | |
Funko, Inc. (a) | | | 8,400 | | | | 110,460 | | |
Group 1 Automotive, Inc. | | | 3,703 | | | | 195,222 | | |
Haverty Furniture Cos., Inc. | | | 16,998 | | | | 319,222 | | |
Hooker Furniture Corp. | | | 6,815 | | | | 179,507 | | |
Installed Building Products, Inc. (a) | | | 5,607 | | | | 188,900 | | |
See notes to financial statements.
112
Victory Portfolios II
VictoryShares US Discovery Enhanced Volatility Wtd ETF | | Schedule of Portfolio Investments — continued
December 31, 2018 | |
(Unaudited)
Security Description | | Shares | | Value | |
International Speedway Corp., Class A | | | 13,630 | | | $ | 597,812 | | |
J. Jill, Inc. (a) | | | 22,650 | | | | 120,725 | | |
Jack in the Box, Inc. | | | 4,709 | | | | 365,560 | | |
Johnson Outdoors, Inc., A | | | 2,410 | | | | 141,563 | | |
La-Z-Boy, Inc. | | | 9,333 | | | | 258,617 | | |
LCI Industries | | | 2,980 | | | | 199,064 | | |
LGI Homes, Inc. (a) (b) | | | 4,311 | | | | 194,943 | | |
Lithia Motors, Inc. | | | 4,650 | | | | 354,935 | | |
M/I Homes, Inc. (a) | | | 14,465 | | | | 304,054 | | |
MarineMax, Inc. (a) | | | 8,708 | | | | 159,443 | | |
Mastercraft Boat Holdings, Inc. (a) | | | 12,304 | | | | 230,085 | | |
MDC Holdings, Inc. | | | 11,336 | | | | 318,655 | | |
Meritage Homes Corp. (a) | | | 7,811 | | | | 286,820 | | |
Michaels Cos., Inc. (a) | | | 15,113 | | | | 204,630 | | |
Monarch Casino & Resort, Inc. (a) | | | 10,687 | | | | 407,602 | | |
Monro Muffler Brake, Inc. | | | 4,259 | | | | 292,806 | | |
Murphy USA, Inc. (a) | | | 4,653 | | | | 356,606 | | |
Nautilus, Inc. (a) | | | 19,578 | | | | 213,400 | | |
Nutrisystem, Inc. | | | 6,407 | | | | 281,139 | | |
Oxford Industries, Inc. | | | 4,633 | | | | 329,128 | | |
Papa John's International, Inc. | | | 5,815 | | | | 231,495 | | |
PetMed Express, Inc. | | | 6,934 | | | | 161,285 | | |
Ruth's Hospitality Group, Inc. | | | 10,673 | | | | 242,597 | | |
Sally Beauty Holdings, Inc. (a) | | | 18,872 | | | | 321,768 | | |
Sleep Number Corp. (a) | | | 8,929 | | | | 283,317 | | |
Stoneridge, Inc. (a) | | | 8,263 | | | | 203,683 | | |
Sturm Ruger & Co. | | | 5,814 | | | | 309,421 | | |
Taylor Morrison Home Corp., Class A (a) | | | 18,102 | | | | 287,822 | | |
Tenneco, Inc. | | | 7,989 | | | | 218,819 | | |
The Buckle, Inc. (b) | | | 10,282 | | | | 198,854 | | |
The Cheesecake Factory, Inc. (b) | | | 6,836 | | | | 297,434 | | |
Tilly's, Inc. | | | 8,942 | | | | 97,110 | | |
Topbuild Corp. (a) | | | 4,890 | | | | 220,050 | | |
TRI Pointe Group, Inc. (a) | | | 22,111 | | | | 241,673 | | |
Unifi, Inc. (a) | | | 12,845 | | | | 293,380 | | |
William Lyon Homes, Class A (a) | | | 16,891 | | | | 180,565 | | |
Wingstop, Inc. | | | 4,191 | | | | 269,020 | | |
Winnebago Industries, Inc. | | | 6,053 | | | | 146,543 | | |
Zagg, Inc. (a) | | | 10,835 | | | | 105,966 | | |
| | | | 17,961,391 | | |
Consumer Staples (6.2%): | |
B&G Foods, Inc. (b) | | | 8,272 | | | | 239,144 | | |
Calavo Growers, Inc. | | | 3,672 | | | | 267,909 | | |
Central Garden & Pet Co., Class A (a) | | | 11,861 | | | | 370,656 | | |
Chefs' Warehouse, Inc. (a) | | | 10,470 | | | | 334,831 | | |
Craft Brew Alliance, Inc. (a) | | | 22,066 | | | | 315,765 | | |
Elf Beauty, Inc. (a) | | | 12,705 | | | | 110,025 | | |
Hostess Brands, Inc. (a) | | | 22,402 | | | | 245,078 | | |
Ingles Markets, Inc., Class A | | | 8,051 | | | | 219,148 | | |
Inter Parfums, Inc. | | | 6,053 | | | | 396,896 | | |
See notes to financial statements.
113
Victory Portfolios II
VictoryShares US Discovery Enhanced Volatility Wtd ETF | | Schedule of Portfolio Investments — continued
December 31, 2018 | |
(Unaudited)
Security Description | | Shares | | Value | |
J&J Snack Foods Corp. | | | 3,766 | | | $ | 544,526 | | |
John B. Sanfilippo & Son, Inc. | | | 5,212 | | | | 290,100 | | |
Medifast, Inc. | | | 671 | | | | 83,888 | | |
MGP Ingredients, Inc. | | | 3,283 | | | | 187,295 | | |
Natural Grocers By Vitamin Cottage, Inc. (a) | | | 7,456 | | | | 114,300 | | |
PriceSmart, Inc. | | | 5,157 | | | | 304,779 | | |
Primo Water Corp. (a) | | | 17,311 | | | | 242,527 | | |
Sanderson Farms, Inc. | | | 3,271 | | | | 324,778 | | |
The Simply Good Foods Co. (a) | | | 21,304 | | | | 402,646 | | |
Tootsie Roll Industries, Inc. | | | 19,733 | | | | 659,081 | | |
Turning Point Brands, Inc. | | | 7,941 | | | | 216,154 | | |
United Natural Foods, Inc. (a) | | | 7,824 | | | | 82,856 | | |
Universal Corp. | | | 3,497 | | | | 189,363 | | |
Vector Group Ltd. | | | 36,769 | | | | 357,762 | | |
WD-40 Co. | | | 3,191 | | | | 584,783 | | |
| | | | 7,084,290 | | |
Energy (3.0%): | |
Arch Coal, Inc. | | | 3,210 | | | | 266,397 | | |
C&j Energy Services, Inc. (a) | | | 12,022 | | | | 162,297 | | |
Callon Petroleum Co. (a) | | | 21,734 | | | | 141,054 | | |
Denbury Resources, Inc. (a) | | | 30,427 | | | | 52,030 | | |
Earthstone Energy, Inc., Class A (a) | | | 27,501 | | | | 124,305 | | |
Evolution Petroleum Corp. | | | 33,489 | | | | 228,395 | | |
Exterran Corp. (a) | | | 12,899 | | | | 228,312 | | |
Gulfport Energy Corp. (a) | | | 18,609 | | | | 121,889 | | |
Laredo Petroleum, Inc. (a) | | | 25,474 | | | | 92,216 | | |
Newpark Resources, Inc. (a) | | | 25,269 | | | | 173,598 | | |
Par Pacific Holdings, Inc. (a) | | | 15,181 | | | | 215,267 | | |
Propetro Holding Corp. (a) | | | 14,554 | | | | 179,305 | | |
Rex American Resources Corp. (a) | | | 4,472 | | | | 304,587 | | |
RPC, Inc. (b) | | | 18,193 | | | | 179,565 | | |
SEACOR Smit, Inc. (a) | | | 8,169 | | | | 302,253 | | |
Smart Sand, Inc. (a) | | | 33,804 | | | | 75,045 | | |
Solaris Oilfield Infrastructure, Inc., Class A | | | 12,670 | | | | 153,180 | | |
SRC Energy, Inc. (a) | | | 28,145 | | | | 132,282 | | |
U.S. Silica Holdings, Inc. | | | 13,326 | | | | 135,659 | | |
Unit Corp. (a) | | | 7,202 | | | | 102,845 | | |
| | | | 3,370,481 | | |
Financials (23.8%): | |
1st Source Corp. | | | 9,940 | | | | 400,980 | | |
Ameris Bancorp | | | 9,610 | | | | 304,349 | | |
AMERISAFE, Inc. | | | 8,039 | | | | 455,731 | | |
Axos Financial, Inc. (a) | | | 9,153 | | | | 230,473 | | |
BancFirst Corp. | | | 7,877 | | | | 393,062 | | |
Brookline BanCorp, Inc. | | | 33,305 | | | | 460,275 | | |
Capitol Federal Financial, Inc. | | | 63,772 | | | | 814,368 | | |
Centerstate Banks, Inc. | | | 16,936 | | | | 356,333 | | |
City Holding Co. | | | 6,904 | | | | 466,641 | | |
Cohen & Steers, Inc. | | | 13,110 | | | | 449,935 | | |
See notes to financial statements.
114
Victory Portfolios II
VictoryShares US Discovery Enhanced Volatility Wtd ETF | | Schedule of Portfolio Investments — continued
December 31, 2018 | |
(Unaudited)
Security Description | | Shares | | Value | |
Eagle Bancorp, Inc. (a) | | | 9,195 | | | $ | 447,888 | | |
Employers Holdings, Inc. | | | 11,672 | | | | 489,874 | | |
Enterprise Financial Services Corp. | | | 11,794 | | | | 443,808 | | |
FB Financial Corp. | | | 12,279 | | | | 430,011 | | |
FBL Financial Group, Inc., Class A | | | 5,540 | | | | 363,701 | | |
Federated Investors, Inc., Class B | | | 15,270 | | | | 405,419 | | |
First BanCorp | | | 12,694 | | | | 414,586 | | |
First Busey Corp. | | | 18,968 | | | | 465,475 | | |
First Commonwealth Financial Corp. | | | 31,997 | | | | 386,524 | | |
First Interstate BancSystem, Inc., Class A | | | 13,330 | | | | 487,345 | | |
First Merchants Corp. | | | 10,598 | | | | 363,193 | | |
First Midwest Bancorp, Inc. | | | 19,938 | | | | 394,972 | | |
Great Western BanCorp, Inc. | | | 11,702 | | | | 365,688 | | |
Heartland Financial USA, Inc. | | | 10,267 | | | | 451,235 | | |
Heritage Financial Corp. | | | 12,891 | | | | 383,121 | | |
Hilltop Holdings, Inc. | | | 21,280 | | | | 379,422 | | |
Hope Bancorp, Inc. | | | 27,590 | | | | 327,217 | | |
Horace Mann Educators Corp. | | | 11,681 | | | | 437,453 | | |
Independent Bank Corp. | | | 5,267 | | | | 370,323 | | |
Independent Bank Group, Inc. | | | 6,899 | | | | 315,767 | | |
James River Group Holdings Ltd. | | | 12,472 | | | | 455,727 | | |
Kearny Financial Corp. | | | 38,045 | | | | 487,737 | | |
Kinsale Capital Group, Inc. | | | 7,437 | | | | 413,200 | | |
Lakeland Financial Corp. | | | 12,537 | | | | 503,485 | | |
LegacyTexas Financial Group, Inc. | | | 8,757 | | | | 281,012 | | |
Legg Mason, Inc. | | | 13,465 | | | | 343,492 | | |
NBT Bancorp, Inc. | | | 14,390 | | | | 497,749 | | |
Nelnet, Inc., Class A | | | 8,456 | | | | 442,587 | | |
Northwest Bancshares, Inc. | | | 40,419 | | | | 684,698 | | |
Oceanfirst Financial Corp. | | | 22,668 | | | | 510,257 | | |
Pacific Premier Bancorp, Inc. (a) | | | 11,941 | | | | 304,734 | | |
Park National Corp. | | | 5,108 | | | | 433,925 | | |
PRA Group, Inc. (a) | | | 9,550 | | | | 232,734 | | |
ProAssurance Corp. | | | 7,823 | | | | 317,301 | | |
Provident Financial Services, Inc. | | | 24,639 | | | | 594,539 | | |
Renasant Corp. | | | 12,503 | | | | 377,341 | | |
S&T Bancorp, Inc. | | | 11,709 | | | | 443,069 | | |
Safety Insurance Group, Inc. | | | 6,609 | | | | 540,683 | | |
Sandy Spring BanCorp | | | 15,335 | | | | 480,599 | | |
Seacoast Banking Corp. of Florida (a) | | | 13,412 | | | | 348,980 | | |
ServisFirst Bancshares, Inc. | | | 11,307 | | | | 360,354 | | |
Simmons First National Corp., Class A | | | 15,434 | | | | 372,422 | | |
Southside Bancshares, Inc. | | | 16,309 | | | | 517,810 | | |
Tompkins Financial Corp. | | | 6,078 | | | | 455,911 | | |
Towne Bank | | | 19,626 | | | | 470,043 | | |
Trustmark Corp. | | | 16,060 | | | | 456,586 | | |
Union Bankshares Corp. | | | 12,600 | | | | 355,698 | | |
Universal Insurance Holdings, Inc. | | | 9,057 | | | | 343,441 | | |
Waddell & Reed Financial, Inc., Class A (b) | | | 16,776 | | | | 303,310 | | |
Walker & Dunlop, Inc. | | | 7,596 | | | | 328,527 | | |
Washington Federal, Inc. | | | 17,413 | | | | 465,101 | | |
See notes to financial statements.
115
Victory Portfolios II
VictoryShares US Discovery Enhanced Volatility Wtd ETF | | Schedule of Portfolio Investments — continued
December 31, 2018 | |
(Unaudited)
Security Description | | Shares | | Value | |
WesBanco, Inc. | | | 11,449 | | | $ | 420,064 | | |
Westamerica BanCorp | | | 8,207 | | | | 456,966 | | |
WisdomTree Investments, Inc. | | | 40,139 | | | | 266,924 | | |
| | | | 26,722,175 | | |
Health Care (7.1%): | |
Addus HomeCare Corp. (a) | | | 5,270 | | | | 357,728 | | |
AMN Healthcare Services, Inc. (a) | | | 4,447 | | | | 251,967 | | |
Atrion Corp. | | | 603 | | | | 446,871 | | |
Cambrex Corp. (a) (b) | | | 5,543 | | | | 209,304 | | |
CONMED Corp. | | | 6,817 | | | | 437,651 | | |
Corcept Therapeutics, Inc. (a) | | | 14,924 | | | | 199,385 | | |
CorVel Corp. (a) | | | 6,451 | | | | 398,156 | | |
Eagle Pharmaceuticals, Inc. (a) | | | 3,744 | | | | 150,846 | | |
Enanta Pharmaceuticals, Inc. (a) | | | 2,309 | | | | 163,546 | | |
Innoviva, Inc. (a) | | | 25,919 | | | | 452,286 | | |
Integer Holdings Corp. (a) | | | 4,604 | | | | 351,101 | | |
Lantheus Holdings, Inc. (a) | | | 12,730 | | | | 199,225 | | |
Lemaitre Vascular, Inc. | | | 7,712 | | | | 182,312 | | |
Magellan Health, Inc. (a) | | | 3,011 | | | | 171,296 | | |
Medpace Holdings, Inc. (a) | | | 3,488 | | | | 184,620 | | |
Meridian Bioscience, Inc. | | | 33,256 | | | | 577,324 | | |
Omnicell, Inc. (a) | | | 5,536 | | | | 339,025 | | |
Orthofix Medical, Inc. (a) | | | 5,760 | | | | 302,342 | | |
Phibro Animal Health Corp., Class A | | | 8,336 | | | | 268,086 | | |
Repligen Corp. (a) | | | 8,427 | | | | 444,440 | | |
Select Medical Holdings Corp. (a) | | | 20,145 | | | | 309,226 | | |
Supernus Pharmaceuticals, Inc. (a) | | | 5,840 | | | | 194,005 | | |
The Ensign Group, Inc. | | | 9,784 | | | | 379,521 | | |
Tivity Health, Inc. (a) | | | 13,262 | | | | 329,030 | | |
US Physical Therapy, Inc. | | | 3,475 | | | | 355,666 | | |
Varex Imaging Corp. (a) | | | 7,919 | | | | 187,522 | | |
| | | | 7,842,481 | | |
Industrials (23.1%): | |
AAON, Inc. | | | 9,899 | | | | 347,058 | | |
Acco Brands Corp. | | | 34,696 | | | | 235,239 | | |
Advanced Disposal Services, Inc. (a) | | | 25,632 | | | | 613,629 | | |
Aircastle Ltd. | | | 21,687 | | | | 373,884 | | |
Alamo Group, Inc. | | | 4,354 | | | | 336,651 | | |
Albany International Corp., Class A | | | 4,534 | | | | 283,058 | | |
Allegiant Travel Co. | | | 2,073 | | | | 207,757 | | |
Altra Industrial Motion Corp. | | | 11,420 | | | | 287,213 | | |
American Woodmark Corp. (a) | | | 2,804 | | | | 156,127 | | |
Apogee Enterprises, Inc. | | | 7,037 | | | | 210,054 | | |
Applied Industrial Technologies, Inc. | | | 5,548 | | | | 299,259 | | |
ArcBest Corp. | | | 4,108 | | | | 140,740 | | |
Atkore International Group, Inc. (a) | | | 11,405 | | | | 226,275 | | |
BMC Stock Holdings, Inc. (a) | | | 14,624 | | | | 226,380 | | |
Brady Corp., Class A | | | 13,080 | | | | 568,457 | | |
CBIZ, Inc. (a) | | | 25,786 | | | | 507,985 | | |
See notes to financial statements.
116
Victory Portfolios II
VictoryShares US Discovery Enhanced Volatility Wtd ETF | | Schedule of Portfolio Investments — continued
December 31, 2018 | |
(Unaudited)
Security Description | | Shares | | Value | |
Chart Industries, Inc. (a) | | | 4,010 | | | $ | 260,770 | | |
Comfort Systems USA, Inc. | | | 7,339 | | | | 320,568 | | |
Continental Building Products, Inc. (a) | | | 11,775 | | | | 299,674 | | |
Deluxe Corp. | | | 9,359 | | | | 359,760 | | |
DXP Enterprise, Inc. (a) | | | 5,144 | | | | 143,209 | | |
Dycom Industries, Inc. (a) | | | 2,460 | | | | 132,938 | | |
Echo Global Logistics, Inc. (a) | | | 10,783 | | | | 219,218 | | |
Encore Wire Corp. | | | 8,156 | | | | 409,268 | | |
EnPro Industries, Inc. | | | 5,196 | | | | 312,280 | | |
ESCO Technologies, Inc. | | | 7,787 | | | | 513,552 | | |
Federal Signal Corp. | | | 12,004 | | | | 238,880 | | |
Forward Air Corp. | | | 7,148 | | | | 392,068 | | |
Franklin Electric Co., Inc. | | | 8,029 | | | | 344,283 | | |
FTI Consulting, Inc. (a) | | | 4,813 | | | | 320,738 | | |
Gibraltar Industries, Inc. (a) | | | 7,474 | | | | 266,000 | | |
Global Brass & Copper Holdings, Inc. | | | 8,506 | | | | 213,926 | | |
GMS, Inc. (a) | | | 10,989 | | | | 163,297 | | |
Gorman-Rupp Co. | | | 14,634 | | | | 474,287 | | |
H&E Equipment Services, Inc. | | | 7,055 | | | | 144,063 | | |
Hawaiian Holdings, Inc. | | | 7,345 | | | | 193,981 | | |
Heartland Express, Inc. | | | 19,262 | | | | 352,495 | | |
Herman Miller, Inc. | | | 8,705 | | | | 263,326 | | |
HNI Corp. | | | 8,346 | | | | 295,699 | | |
Hub Group, Inc., Class A (a) | | | 6,641 | | | | 246,182 | | |
ICF International, Inc. | | | 5,844 | | | | 378,574 | | |
Insteel Industries, Inc. | | | 7,552 | | | | 183,363 | | |
Interface, Inc. | | | 18,261 | | | | 260,219 | | |
Kadant, Inc. | | | 5,093 | | | | 414,875 | | |
Kaman Corp., Class A | | | 7,569 | | | | 424,544 | | |
KBR, Inc. | | | 18,443 | | | | 279,965 | | |
Kforce, Inc. | | | 7,967 | | | | 246,340 | | |
Kimball International, Inc., Class B | | | 31,643 | | | | 449,014 | | |
Knoll, Inc. | | | 19,404 | | | | 319,778 | | |
Lindsay Corp. | | | 4,767 | | | | 458,823 | | |
Lydall, Inc. (a) | | | 9,147 | | | | 185,776 | | |
Marten Transport Ltd. | | | 15,000 | | | | 242,850 | | |
Matson, Inc. | | | 12,284 | | | | 393,334 | | |
Matthews International Corp., Class A | | | 9,213 | | | | 374,232 | | |
McGrath RentCorp | | | 8,394 | | | | 432,123 | | |
Mercury Systems, Inc. (a) | | | 4,165 | | | | 196,963 | | |
Milacron Holdings Corp. (a) | | | 19,586 | | | | 232,878 | | |
Mobile Mini, Inc. | | | 7,775 | | | | 246,856 | | |
Moog, Inc., Class A | | | 4,931 | | | | 382,054 | | |
Mueller Industries, Inc. | | | 13,721 | | | | 320,523 | | |
Mueller Water Products, Inc., Class A | | | 33,215 | | | | 302,257 | | |
Multi-Color Corp. | | | 5,841 | | | | 204,961 | | |
National Presto Industries, Inc. | | | 3,176 | | | | 371,338 | | |
Navigant Consulting, Inc. | | | 14,682 | | | | 353,102 | | |
NV5 Global, Inc. (a) | | | 2,617 | | | | 158,459 | | |
Patrick Industries, Inc. (a) | | | 4,007 | | | | 118,647 | | |
PGT, Inc. (a) | | | 13,947 | | | | 221,060 | | |
See notes to financial statements.
117
Victory Portfolios II
VictoryShares US Discovery Enhanced Volatility Wtd ETF | | Schedule of Portfolio Investments — continued
December 31, 2018 | |
(Unaudited)
Security Description | | Shares | | Value | |
Pitney Bowes, Inc. | | | 45,045 | | | $ | 266,216 | | |
Primoris Services Corp. | | | 17,656 | | | | 337,759 | | |
Raven Industries, Inc. | | | 5,541 | | | | 200,529 | | |
REV Group, Inc. | | | 13,698 | | | | 102,872 | | |
Rush Enterprises, Inc., Class A | | | 8,873 | | | | 305,941 | | |
Saia, Inc. (a) | | | 4,330 | | | | 241,701 | | |
SP Plus Corp. (a) | | | 13,607 | | | | 401,951 | | |
SPX Corp. (a) | | | 13,987 | | | | 391,775 | | |
SPX Flow, Inc. (a) | | | 6,645 | | | | 202,141 | | |
Steelcase, Inc., Class A | | | 25,905 | | | | 384,171 | | |
Sun Hydraulics Corp. | | | 7,287 | | | | 241,856 | | |
Sunrun, Inc. (a) | | | 14,231 | | | | 154,976 | | |
Systemax, Inc. | | | 9,018 | | | | 215,440 | | |
The Greenbrier Cos., Inc. | | | 6,057 | | | | 239,494 | | |
Thermon Group Holdings, Inc. (a) | | | 15,200 | | | | 308,256 | | |
TrueBlue, Inc. (a) | | | 11,828 | | | | 263,173 | | |
Universal Forest Products, Inc. | | | 12,454 | | | | 323,306 | | |
US Ecology, Inc. | | | 5,400 | | | | 340,092 | | |
Vectrus, Inc. (a) | | | 4,854 | | | | 104,749 | | |
Wabash National Corp. | | | 19,921 | | | | 260,567 | | |
Werner Enterprises, Inc. | | | 9,634 | | | | 284,588 | | |
WESCO International, Inc. (a) | | | 6,961 | | | | 334,128 | | |
| | | | 25,958,817 | | |
Information Technology (9.0%): | |
Alarm.com Holdings, Inc. (a) | | | 5,377 | | | | 278,905 | | |
Alpha & Omega Semiconductor Ltd. (a) | | | 21,673 | | | | 220,848 | | |
Amkor Technology, Inc. (a) | | | 35,237 | | | | 231,155 | | |
Anixter International, Inc. (a) | | | 3,268 | | | | 177,485 | | |
AppFolio, Inc. (a) | | | 3,187 | | | | 188,734 | | |
Applied Optoelectronics, Inc. (a) (b) | | | 4,021 | | | | 62,044 | | |
Axcelis Technologies, Inc. (a) | | | 13,379 | | | | 238,146 | | |
AXT, Inc. (a) | | | 24,181 | | | | 105,187 | | |
Badger Meter, Inc. | | | 6,947 | | | | 341,862 | | |
Brooks Automation, Inc. | | | 4,788 | | | | 125,350 | | |
Casa Systems, Inc. (a) | | | 10,579 | | | | 138,902 | | |
Cass Information Systems, Inc. | | | 7,916 | | | | 418,915 | | |
Cohu, Inc. | | | 11,605 | | | | 186,492 | | |
Control4 Corp. (a) | | | 7,009 | | | | 123,358 | | |
CSG Systems International, Inc. | | | 13,288 | | | | 422,160 | | |
Ebix, Inc. | | | 4,751 | | | | 202,203 | | |
Electro Scientific, Inc. (a) | | | 9,604 | | | | 287,736 | | |
ePlus, Inc. (a) | | | 4,815 | | | | 342,684 | | |
Evertec, Inc. | | | 20,541 | | | | 589,527 | | |
Fabrinet (a) | | | 6,443 | | | | 330,590 | | |
FormFactor, Inc. (a) | | | 14,776 | | | | 208,194 | | |
Ichor Holdings Ltd. (a) | | | 6,924 | | | | 112,861 | | |
Insight Enterprises, Inc. (a) | | | 6,156 | | | | 250,857 | | |
InterDigital, Inc. | | | 7,526 | | | | 499,952 | | |
KEMET Corp. | | | 9,686 | | | | 169,892 | | |
ManTech International Corp., Class A | | | 6,144 | | | | 321,300 | | |
See notes to financial statements.
118
Victory Portfolios II
VictoryShares US Discovery Enhanced Volatility Wtd ETF | | Schedule of Portfolio Investments — continued
December 31, 2018 | |
(Unaudited)
Security Description | | Shares | | Value | |
MTS Systems Corp. | | | 8,315 | | | $ | 333,681 | | |
Nanometrics, Inc. (a) | | | 4,434 | | | | 121,181 | | |
NIC, Inc. | | | 26,047 | | | | 325,067 | | |
PC Connection, Inc. | | | 10,484 | | | | 311,689 | | |
Perficient, Inc. (a) | | | 16,584 | | | | 369,160 | | |
Photronics, Inc. (a) | | | 25,196 | | | | 243,898 | | |
Presidio, Inc. | | | 20,842 | | | | 271,988 | | |
Progress Software Corp. | | | 6,441 | | | | 228,591 | | |
Rogers Corp. (a) | | | 2,223 | | | | 220,210 | | |
ScanSource, Inc. (a) | | | 8,054 | | | | 276,897 | | |
Tech Data Corp. (a) | | | 3,449 | | | | 282,163 | | |
The Hackett Group, Inc. | | | 23,708 | | | | 379,565 | | |
TTM Technologies, Inc. (a) | | | 15,948 | | | | 155,174 | | |
Ultra Clean Holdings, Inc. (a) | | | 13,247 | | | | 112,202 | | |
| | | | 10,206,805 | | |
Materials (3.1%): | |
Advansix, Inc. (a) | | | 7,961 | | | | 193,771 | | |
American Vanguard Corp. | | | 12,812 | | | | 194,614 | | |
Boise Cascade Co. | | | 9,724 | | | | 231,917 | | |
Carpenter Technology Corp. | | | 5,634 | | | | 200,627 | | |
Chase Corp. | | | 3,097 | | | | 309,855 | | |
Clearwater Paper Corp. (a) | | | 5,800 | | | | 141,346 | | |
Greif, Inc., Class A | | | 6,320 | | | | 234,535 | | |
Minerals Technologies, Inc. | | | 7,250 | | | | 372,214 | | |
Myers Industries, Inc. | | | 11,618 | | | | 175,548 | | |
Olympic Steel, Inc. | | | 11,638 | | | | 166,074 | | |
Rayonier Advanced Materials, Inc. | | | 13,184 | | | | 140,410 | | |
Schnitzer Steel Industries, Inc. | | | 10,117 | | | | 218,021 | | |
Stepan Co. | | | 3,976 | | | | 294,224 | | |
SunCoke Energy, Inc. (a) | | | 27,345 | | | | 233,800 | | |
Warrior Met Coal, Inc. | | | 7,685 | | | | 185,285 | | |
Worthington Industries, Inc. | | | 7,830 | | | | 272,798 | | |
| | | | 3,565,039 | | |
Real Estate (1.4%): | |
Four Corners Property Trust, Inc. | | | 25,963 | | | | 680,231 | | |
HFF, Inc., Class A | | | 5,495 | | | | 182,214 | | |
Marcus & Millichap, Inc. (a) | | | 13,630 | | | | 467,918 | | |
The RMR Group, Inc. | | | 4,261 | | | | 226,174 | | |
| | | | 1,556,537 | | |
Utilities (3.5%): | |
American States Water Co. | | | 8,577 | | | | 575,002 | | |
Chesapeake Utilities Corp. | | | 6,315 | | | | 513,410 | | |
MGE Energy, Inc. | | | 9,700 | | | | 581,612 | | |
Middlesex Water Co. | | | 9,084 | | | | 484,631 | | |
Otter Tail Corp. | | | 13,153 | | | | 652,915 | | |
SJW Corp. | | | 6,256 | | | | 347,959 | | |
Unitil Corp. | | | 12,794 | | | | 648,315 | | |
| | | | 3,803,844 | | |
Total Common Stocks (Cost $123,657,632) | | | 111,218,299 | | |
See notes to financial statements.
119
Victory Portfolios II
VictoryShares US Discovery Enhanced Volatility Wtd ETF | | Schedule of Portfolio Investments — continued
December 31, 2018 | |
(Unaudited)
Security Description | | Shares | | Value | |
Rights (0.0%) (c) | |
Materials (0.0%): (c) | |
Schulman, Inc. (a) (d) (e) | | | 4,224 | | | $ | 8,448 | | |
Total Rights (Cost $8,448) | | | 8,448 | | |
Investment Companies (0.8%) | |
JPMorgan U.S. Treasury Plus Money Market Fund, Class L, 2.27% | | | 942,820 | | | | 942,820 | | |
Total Investment Companies (Cost $942,820) | | | 942,820 | | |
Collateral for Securities Loaned^ (1.2%) | |
BlackRock Liquidity Funds TempFund Portfolio, Institutional Class, 2.49% (f) | | | 261,687 | | | | 261,687 | | |
Fidelity Investments Money Market Government Portfolio, Class I, 2.28% (f) | | | 378,125 | | | | 378,125 | | |
Fidelity Investments Prime Money Market Portfolio, Class I, 2.46% (f) | | | 11,677 | | | | 11,677 | | |
Goldman Sachs Financial Square Prime Obligations Fund, Institutional Class,
2.55% (f) | | | 145,383 | | | | 145,383 | | |
JPMorgan Prime Money Market Fund, Capital Class, 2.49% (f) | | | 232,599 | | | | 232,599 | | |
Morgan Stanley Institutional Liquidity Prime Portfolio, Institutional Class, 2.58% (f) | | | 348,918 | | | | 348,918 | | |
Total Collateral for Securities Loaned (Cost $1,378,389) | | | 1,378,389 | | |
Total Investments (Cost $125,987,289) — 101.0% | | | 113,547,956 | | |
Liabilities in excess of other assets — (1.0)% | | | (1,116,377 | ) | |
NET ASSETS — 100.00% | | $ | 112,431,579 | | |
^ Purchased with cash collateral from securities on loan.
(a) Non-income producing security.
(b) All or a portion of this security is on loan.
(c) Amount represents less than 0.05% of net assets.
(d) The Fund's Adviser has deemed this security to be illiquid based upon procedures approved by the Board of Trustees. As of December 31, 2018, illiquid securities were 0.0% of the Fund's net assets.
(e) Security was fair valued based upon procedures approved by the Board of Trustees and represents 0.0% of the Fund's net assets as of December 31, 2018. This security is classified as Level 3 within the fair value hierarchy. (See Note 2)
(f) Rate disclosed is the daily yield on December 31, 2018.
Futures Contracts Purchased
| | | Number
of
Contracts | | Expiration
Date | | Notional
Amount | | Value | | Unrealized
Appreciation
(Depreciation) | |
Russell 2000 Mini Index Futures | | | 16 | | | 3/15/19 | | $ | 1,121,279 | | | $ | 1,079,200 | | | $ | (42,079 | ) | |
| | | Total unrealized appreciation | | | | | | | | $ | — | | |
| | | Total unrealized depreciation | | | | | | | | | (42,079 | ) | |
| | | Total net unrealized appreciation(depreciation) | | | | | | | | $ | (42,079 | ) | |
See notes to financial statements.
120
Victory Portfolios II
VictoryShares Developed Enhanced Volatility Wtd ETF | | Schedule of Portfolio Investments
December 31, 2018 | |
(Unaudited)
Security Description | | Shares | | Value | |
Common Stocks (23.4%) | |
Australia (1.3%): | |
Communication Services (0.0%): (a) | |
Telstra Corp. Ltd. | | | 26,025 | | | $ | 52,231 | | |
Consumer Discretionary (0.0%): (a) | |
Aristocrat Leisure Ltd. | | | 2,627 | | | | 40,403 | | |
Consumer Staples (0.2%): | |
Treasury Wine Estates Ltd. | | | 3,849 | | | | 40,115 | | |
Wesfarmers Ltd. | | | 3,911 | | | | 88,738 | | |
Woolworths Ltd. | | | 6,204 | | | | 128,532 | | |
| | | | 257,385 | | |
Energy (0.1%): | |
Oil Search Ltd. | | | 12,286 | | | | 61,947 | | |
Santos Ltd. | | | 8,028 | | | | 30,980 | | |
Woodside Petroleum Ltd. | | | 3,089 | | | | 68,130 | | |
| | | | 161,057 | | |
Financials (0.5%): | |
Asx Ltd. | | | 2,429 | | | | 102,528 | | |
Australia & New Zealand Banking Group Ltd. | | | 4,736 | | | | 81,576 | | |
Commonwealth Bank of Australia | | | 1,792 | | | | 91,351 | | |
Insurance Australia Group Ltd. | | | 15,777 | | | | 77,771 | | |
Macquarie Group Ltd. | | | 958 | | | | 73,298 | | |
National Australia Bank Ltd. | | | 5,652 | | | | 95,802 | | |
Suncorp Group Ltd. | | | 9,852 | | | | 87,624 | | |
Westpac Banking Corp. | | | 4,673 | | | | 82,400 | | |
| | | | 692,350 | | |
Health Care (0.1%): | |
Cochlear Ltd. | | | 459 | | | | 56,103 | | |
CSL Ltd. | | | 485 | | | | 63,239 | | |
| | | | 119,342 | | |
Industrials (0.1%): | |
Brambles Ltd. | | | 10,335 | | | | 73,871 | | |
Cimic Group Ltd. | | | 1,386 | | | | 42,369 | | |
| | | | 116,240 | | |
Materials (0.2%): | |
BHP Billiton Ltd. | | | 3,002 | | | | 72,362 | | |
BHP Group PLC | | | 2,468 | | | | 51,947 | | |
Newcrest Mining Ltd. | | | 5,012 | | | | 76,942 | | |
RIO Tinto Ltd. | | | 1,351 | | | | 74,654 | | |
South32 Ltd. | | | 18,299 | | | | 43,169 | | |
| | | | 319,074 | | |
Utilities (0.1%): | |
AGL Energy Ltd. | | | 4,770 | | | | 69,196 | | |
| | | | 1,827,278 | | |
See notes to financial statements.
121
Victory Portfolios II
VictoryShares Developed Enhanced Volatility Wtd ETF | | Schedule of Portfolio Investments — continued
December 31, 2018 | |
(Unaudited)
Security Description | | Shares | | Value | |
Austria (0.1%): | |
Energy (0.0%): (a) | |
OMV AG | | | 1,101 | | | $ | 48,245 | | |
Financials (0.0%): (a) | |
Erste Group Bank AG | | | 1,848 | | | | 61,500 | | |
Utilities (0.1%): | |
Verbund AG, Class A (b) | | | 1,703 | | | | 72,653 | | |
| | | | 182,398 | | |
Belgium (0.4%): | |
Consumer Staples (0.1%): | |
Anheuser-Busch InBev SA/NV | | | 875 | | | | 57,838 | | |
Colruyt SA | | | 1,540 | | | | 109,805 | | |
| | | | 167,643 | | |
Financials (0.2%): | |
Ageas | | | 1,818 | | | | 81,849 | | |
Groupe Bruxelles Lambert SA | | | 1,091 | | | | 95,088 | | |
KBC Groep NV | | | 1,181 | | | | 76,685 | | |
| | | | 253,622 | | |
Health Care (0.0%): (a) | |
UCB SA | | | 928 | | | | 75,800 | | |
Materials (0.1%): | |
Solvay SA | | | 612 | | | | 61,220 | | |
Umicore SA | | | 1,013 | | | | 40,455 | | |
| | | | 101,675 | | |
| | | | 598,740 | | |
Bermuda (0.2%): | |
Industrials (0.1%): | |
Jardine Matheson Holdings Ltd. | | | 1,794 | | | | 124,826 | | |
Real Estate (0.1%): | |
Hongkong Land Holdings Ltd. | | | 15,876 | | | | 100,019 | | |
| | | | 224,845 | | |
Canada (2.5%): | |
Communication Services (0.3%): | |
BCE, Inc. | | | 3,843 | | | | 151,834 | | |
Rogers Communications, Inc. | | | 2,050 | | | | 105,068 | | |
TELUS Corp. | | | 4,626 | | | | 153,353 | | |
| | | | 410,255 | | |
Consumer Discretionary (0.1%): | |
Dollarama, Inc. | | | 1,944 | | | | 46,243 | | |
Magna International, Inc. | | | 1,017 | | | | 46,171 | | |
Restaurant Brands International, Inc. | | | 1,440 | | | | 75,239 | | |
| | | | 167,653 | | |
See notes to financial statements.
122
Victory Portfolios II
VictoryShares Developed Enhanced Volatility Wtd ETF | | Schedule of Portfolio Investments — continued
December 31, 2018 | |
(Unaudited)
Security Description | | Shares | | Value | |
Consumer Staples (0.3%): | |
Alimentation Couche-Tard, Inc., Class B | | | 1,387 | | | $ | 69,005 | | |
George Weston Ltd. | | | 1,461 | | | | 96,383 | | |
Loblaw Cos. Ltd. | | | 2,741 | | | | 122,712 | | |
Saputo, Inc. (b) | | | 2,676 | | | | 76,830 | | |
| | | | 364,930 | | |
Energy (0.2%): | |
Canadian Natural Resources Ltd. | | | 1,762 | | | | 42,520 | | |
Enbridge, Inc. | | | 1,747 | | | | 54,279 | | |
Husky Energy, Inc. | | | 3,577 | | | | 36,976 | | |
Pembina Pipeline Corp. (b) | | | 2,493 | | | | 73,986 | | |
Suncor Energy, Inc. | | | 1,783 | | | | 49,806 | | |
TransCanada Corp. | | | 1,907 | | | | 68,107 | | |
| | | | 325,674 | | |
Financials (1.0%): | |
Bank of Montreal | | | 2,333 | | | | 152,440 | | |
Brookfield Asset Management, Inc. | | | 1,847 | | | | 70,795 | | |
Canadian Imperial Bank of Commerce | | | 1,915 | | | | 142,650 | | |
Fairfax Financial Holdings Ltd. | | | 138 | | | | 60,758 | | |
Great-West Lifeco, Inc. | | | 6,410 | | | | 132,332 | | |
Intact Financial Corp. | | | 1,313 | | | | 95,411 | | |
National Bank of Canada | | | 3,076 | | | | 126,308 | | |
Power Corp. of Canada | | | 5,841 | | | | 104,967 | | |
Power Financial Corp. | | | 5,899 | | | | 111,627 | | |
Royal Bank of Canada | | | 1,953 | | | | 133,691 | | |
Sun Life Financial, Inc. | | | 3,032 | | | | 100,600 | | |
The Bank of Nova Scotia | | | 2,488 | | | | 124,036 | | |
The Toronto-Dominion Bank | | | 2,868 | | | | 142,581 | | |
| | | | 1,498,196 | | |
Industrials (0.1%): | |
Canadian National Railway Co. | | | 1,075 | | | | 79,629 | | |
Canadian Pacific Railway Ltd. | | | 445 | | | | 78,972 | | |
| | | | 158,601 | | |
Information Technology (0.2%): | |
CGI Group, Inc. (c) | | | 1,821 | | | | 111,394 | | |
Constellation Software, Inc. | | | 77 | | | | 49,295 | | |
Open Text Corp. | | | 2,076 | | | | 67,679 | | |
| | | | 228,368 | | |
Materials (0.1%): | |
Franco-Nevada Corp. | | | 1,295 | | | | 90,820 | | |
Teck Resources Ltd., Class B | | | 2,065 | | | | 44,462 | | |
| | | | 135,282 | | |
Utilities (0.2%): | |
Fortis, Inc. | | | 4,447 | | | | 148,266 | | |
Hydro One Ltd. (d) | | | 9,115 | | | | 135,222 | | |
| | | | 283,488 | | |
| | | | 3,572,447 | | |
See notes to financial statements.
123
Victory Portfolios II
VictoryShares Developed Enhanced Volatility Wtd ETF | | Schedule of Portfolio Investments — continued
December 31, 2018 | |
(Unaudited)
Security Description | | Shares | | Value | |
Denmark (0.4%): | |
Financials (0.0%): (a) | |
Danske Bank A/S | | | 2,333 | | | $ | 46,157 | | |
Health Care (0.2%): | |
Ambu A/S | | | 803 | | | | 19,301 | | |
Coloplast A/S | | | 765 | | | | 71,038 | | |
H. Lundbeck A/S | | | 833 | | | | 36,490 | | |
Novo Nordisk A/S, Class B | | | 1,469 | | | | 67,168 | | |
William Demant Holding A/S (b) (c) | | | 1,200 | | | | 34,056 | | |
| | | | 228,053 | | |
Industrials (0.1%): | |
DSV A/S | | | 769 | | | | 50,659 | | |
Rockwool International A/S, Class B | | | 119 | | | | 31,051 | | |
Vestas Wind Systems A/S | | | 859 | | | | 64,881 | | |
| | | | 146,591 | | |
Materials (0.1%): | |
Christian Hansen Holding A/S | | | 719 | | | | 63,632 | | |
Novozymes A/S, B Shares | | | 1,605 | | | | 71,662 | | |
| | | | 135,294 | | |
| | | | 556,095 | | |
Finland (0.3%): | |
Energy (0.0%): (a) | |
Neste Oyj | | | 513 | | | | 39,587 | | |
Financials (0.1%): | |
Nordea Bank AB | | | 6,884 | | | | 57,959 | | |
Sampo Oyj, Class A | | | 2,023 | | | | 89,017 | | |
| | | | 146,976 | | |
Industrials (0.1%): | |
Kone Oyj, Class B | | | 1,374 | | | | 65,543 | | |
Wartsila Oyj ABP, Class B | | | 2,988 | | | | 47,563 | | |
| | | | 113,106 | | |
Materials (0.1%): | |
Stora ENSO Oyj, R Shares | | | 2,749 | | | | 31,760 | | |
UPM-Kymmene Oyj | | | 1,758 | | | | 44,609 | | |
| | | | 76,369 | | |
Utilities (0.0%): (a) | |
Fortum Oyj | | | 2,985 | | | | 65,314 | | |
| | | | 441,352 | | |
France (2.6%): | |
Communication Services (0.2%): | |
Orange SA | | | 6,123 | | | | 99,290 | | |
Publicis Groupe SA | | | 961 | | | | 55,134 | | |
Vivendi Universal SA | | | 2,765 | | | | 67,406 | | |
| | | | 221,830 | | |
See notes to financial statements.
124
Victory Portfolios II
VictoryShares Developed Enhanced Volatility Wtd ETF | | Schedule of Portfolio Investments — continued
December 31, 2018 | |
(Unaudited)
Security Description | | Shares | | Value | |
Consumer Discretionary (0.4%): | |
Accor SA | | | 1,718 | | | $ | 73,037 | | |
Cie Generale des Etablissements Michelin | | | 610 | | | | 60,587 | | |
Hermes International | | | 140 | | | | 77,754 | | |
Kering | | | 104 | | | | 49,039 | | |
LVMH Moet Hennessy Louis Vuitton SA | | | 201 | | | | 59,454 | | |
Psa Peugeot Citroen | | | 1,896 | | | | 40,498 | | |
Renault SA | | | 746 | | | | 46,619 | | |
Seb SA | | | 387 | | | | 50,009 | | |
Sodexo SA | | | 517 | | | | 53,008 | | |
Valeo SA | | | 1,414 | | | | 41,323 | | |
| | | | 551,328 | | |
Consumer Staples (0.2%): | |
Danone SA | | | 1,283 | | | | 90,407 | | |
L'Oreal SA | | | 399 | | | | 91,967 | | |
Pernod Ricard SA | | | 810 | | | | 132,973 | | |
| | | | 315,347 | | |
Energy (0.0%): (a) | |
Total SA | | | 1,384 | | | | 73,218 | | |
Financials (0.3%): | |
AXA SA | | | 2,862 | | | | 61,829 | | |
BNP Paribas SA | | | 1,411 | | | | 63,809 | | |
CNP Assurances | | | 4,192 | | | | 88,939 | | |
Credit Agricole SA | | | 6,953 | | | | 75,113 | | |
Natixis SA | | | 9,834 | | | | 46,404 | | |
Societe Generale SA | | | 2,163 | | | | 68,936 | | |
| | | | 405,030 | | |
Health Care (0.3%): | |
BioMerieux | | | 737 | | | | 48,547 | | |
Essilor International SA | | | 765 | | | | 96,796 | | |
Ipsen SA | | | 500 | | | | 64,640 | | |
Sanofi | | | 1,194 | | | | 103,491 | | |
Sartorius Stedim Biotech | | | 554 | | | | 55,438 | | |
| | | | 368,912 | | |
Industrials (0.8%): | |
Aeroports de Paris | | | 358 | | | | 67,875 | | |
Airbus Group SE | | | 540 | | | | 51,939 | | |
Alstom SA | | | 2,575 | | | | 104,043 | | |
Bollore SA | | | 15,826 | | | | 63,456 | | |
Bouygues | | | 1,941 | | | | 69,688 | | |
Bureau Veritas SA | | | 3,862 | | | | 78,730 | | |
Compagnie de Saint-Gobain | | | 1,970 | | | | 65,820 | | |
Edenred | | | 1,613 | | | | 59,334 | | |
Eiffage SA | | | 1,098 | | | | 91,774 | | |
Legrand SA | | | 1,487 | | | | 83,982 | | |
Safran SA | | | 596 | | | | 71,964 | | |
Schneider Electric SA | | | 946 | | | | 64,721 | | |
See notes to financial statements.
125
Victory Portfolios II
VictoryShares Developed Enhanced Volatility Wtd ETF | | Schedule of Portfolio Investments — continued
December 31, 2018 | |
(Unaudited)
Security Description | | Shares | | Value | |
Teleperformance | | | 497 | | | $ | 79,483 | | |
Thales SA | | | 670 | | | | 78,290 | | |
Vinci SA | | | 1,031 | | | | 85,063 | | |
| | | | 1,116,162 | | |
Information Technology (0.1%): | |
Atos SE | | | 464 | | | | 37,996 | | |
Cap Gemini SA | | | 639 | | | | 63,540 | | |
Dassault Systemes SA | | | 495 | | | | 58,805 | | |
| | | | 160,341 | | |
Materials (0.1%): | |
Air Liquide SA | | | 752 | | | | 93,428 | | |
Arkema SA | | | 649 | | | | 55,732 | | |
| | | | 149,160 | | |
Utilities (0.2%): | |
Electricite de France SA | | | 4,310 | | | | 68,138 | | |
Gdf Suez | | | 5,566 | | | | 79,864 | | |
Suez Environnement Co. | | | 4,328 | | | | 57,167 | | |
Veolia Environnement SA | | | 4,079 | | | | 83,901 | | |
| | | | 289,070 | | |
| | | | 3,650,398 | | |
Germany (1.2%): | |
Communication Services (0.1%): | |
Deutsche Telekom AG, Registered Shares | | | 5,910 | | | | 100,338 | | |
United Internet AG, Registered Shares | | | 1,100 | | | | 48,138 | | |
| | | | 148,476 | | |
Consumer Discretionary (0.1%): | |
Bayerische Motoren Werke AG | | | 820 | | | | 66,414 | | |
Continental AG | | | 297 | | | | 41,084 | | |
Daimler AG, Registered Shares | | | 1,075 | | | | 56,539 | | |
| | | | 164,037 | | |
Consumer Staples (0.1%): | |
Beiersdorf AG | | | 798 | | | | 83,337 | | |
Financials (0.2%): | |
Commerzbank AG (c) | | | 5,234 | | | | 34,675 | | |
Deutsche Boerse AG | | | 627 | | | | 75,384 | | |
Hannover Rueck SE | | | 686 | | | | 92,498 | | |
| | | | 202,557 | | |
Health Care (0.1%): | |
Bayer AG | | | 621 | | | | 43,083 | | |
Fresenius Medical Care AG & Co. KGaA | | | 701 | | | | 45,485 | | |
Fresenius SE & Co. KGaA | | | 850 | | | | 41,268 | | |
Merck KGaA | | | 651 | | | | 67,106 | | |
| | | | 196,942 | | |
See notes to financial statements.
126
Victory Portfolios II
VictoryShares Developed Enhanced Volatility Wtd ETF | | Schedule of Portfolio Investments — continued
December 31, 2018 | |
(Unaudited)
Security Description | | Shares | | Value | |
Industrials (0.3%): | |
Brenntag AG | | | 1,426 | | | $ | 61,587 | | |
Deutsche Post AG | | | 1,772 | | | | 48,537 | | |
Hochtief AG | | | 450 | | | | 60,676 | | |
MTU Aero Engines Holding AG | | | 343 | | | | 62,242 | | |
Rational AG | | | 83 | | | | 47,162 | | |
Siemens AG | | | 613 | | | | 68,385 | | |
| | | | 348,589 | | |
Information Technology (0.1%): | |
Infineon Technologies AG | | | 2,226 | | | | 44,282 | | |
SAP SE | | | 682 | | | | 67,918 | | |
Wirecard AG | | | 205 | | | | 31,188 | | |
| | | | 143,388 | | |
Materials (0.1%): | |
BASF SE | | | 877 | | | | 60,683 | | |
Evonik Industries AG | | | 2,183 | | | | 54,518 | | |
Symrise AG | | | 783 | | | | 57,857 | | |
| | | | 173,058 | | |
Real Estate (0.1%): | |
Deutsche Wohnen AG | | | 2,220 | | | | 101,729 | | |
Vonovia SE | | | 1,766 | | | | 80,095 | | |
| | | | 181,824 | | |
| | | | 1,642,208 | | |
Hong Kong (1.2%): | |
Consumer Discretionary (0.1%): | |
Galaxy Entertainment Group Ltd. | | | 6,636 | | | | 42,206 | | |
Techtronic Industries Co. Ltd. | | | 6,852 | | | | 36,404 | | |
| | | | 78,610 | | |
Consumer Staples (0.0%): (a) | |
Sun Art Retail Group Ltd. | | | 37,412 | | | | 38,129 | | |
WH Group Ltd. (d) | | | 49,866 | | | | 38,402 | | |
| | | | 76,531 | | |
Financials (0.2%): | |
AIA Group Ltd. | | | 7,270 | | | | 60,351 | | |
Hang Seng Bank | | | 3,294 | | | | 73,957 | | |
Hong Kong Exchanges and Clearing Ltd. | | | 2,748 | | | | 79,527 | | |
The Bank of East Asia Ltd. | | | 20,998 | | | | 66,776 | | |
| | | | 280,611 | | |
Health Care (0.0%): (a) | |
Sino Biopharmaceutical Ltd. | | | 26,500 | | | | 17,463 | | |
Industrials (0.1%): | |
CK Hutchison Holdings Ltd. | | | 8,186 | | | | 78,619 | | |
MTR Corp. Ltd. | | | 16,138 | | | | 84,915 | | |
| | | | 163,534 | | |
See notes to financial statements.
127
Victory Portfolios II
VictoryShares Developed Enhanced Volatility Wtd ETF | | Schedule of Portfolio Investments — continued
December 31, 2018 | |
(Unaudited)
Security Description | | Shares | | Value | |
Information Technology (0.0%): (a) | |
Hanergy Thin Film Power Group Ltd. (c) (e) (f) | | | 24,455 | | | $ | 1,843 | | |
Real Estate (0.5%): | |
CK Asset Holdings Ltd. | | | 13,715 | | | | 100,366 | | |
Henderson Land Development Co. Ltd. | | | 15,044 | | | | 74,932 | | |
New World Development Co. Ltd. | | | 62,650 | | | | 82,893 | | |
Shimao Property Holdings Ltd. | | | 12,500 | | | | 33,365 | | |
Sino Land Co. Ltd. | | | 38,080 | | | | 65,266 | | |
Sun Hung KAI Properties Ltd. | | | 6,968 | | | | 99,314 | | |
Swire Pacific Ltd., Class A | | | 7,936 | | | | 83,820 | | |
Wharf Real Estate Investment | | | 9,000 | | | | 53,851 | | |
Wheelock & Co. Ltd. | | | 15,568 | | | | 88,974 | | |
| | | | 682,781 | | |
Utilities (0.3%): | |
China Gas Holdings Ltd. | | | 13,072 | | | | 46,578 | | |
CK Infrastructure Holdings Ltd. | | | 14,870 | | | | 112,617 | | |
CLP Holdings Ltd. | | | 8,536 | | | | 96,480 | | |
Hong Kong & China Gas Co. Ltd. (b) | | | 56,205 | | | | 116,286 | | |
Power Assets Holdings Ltd. | | | 12,036 | | | | 83,776 | | |
| | | | 455,737 | | |
| | | | 1,757,110 | | |
Ireland (0.3%): | |
Communication Services (0.0%): (a) | |
WPP PLC | | | 3,026 | | | | 32,648 | | |
Consumer Staples (0.1%): | |
Kerry Group PLC | | | 723 | | | | 71,645 | | |
Financials (0.0%): (a) | |
Bank of Ireland Group PLC | | | 8,090 | | | | 45,042 | | |
Industrials (0.1%): | |
Experian PLC | | | 3,790 | | | | 92,011 | | |
Kingspan Group PLC | | | 1,382 | | | | 59,180 | | |
Ryanair Holdings PLC, ADR (c) | | | 576 | | | | 41,092 | | |
| | | | 192,283 | | |
Materials (0.1%): | |
CRH PLC | | | 2,337 | | | | 61,845 | | |
Smurfit Kappa Group PLC | | | 1,131 | | | | 30,137 | | |
| | | | 91,982 | | |
| | | | 433,600 | | |
Israel (0.1%): | |
Financials (0.1%): | |
Bank Hapoalim BM | | | 11,280 | | | | 71,425 | | |
Bank Leumi Le-Israel B.M. | | | 12,692 | | | | 76,797 | | |
| | | | 148,222 | | |
See notes to financial statements.
128
Victory Portfolios II
VictoryShares Developed Enhanced Volatility Wtd ETF | | Schedule of Portfolio Investments — continued
December 31, 2018 | |
(Unaudited)
Security Description | | Shares | | Value | |
Italy (0.5%): | |
Communication Services (0.1%): | |
Telecom Italia SpA (c) | | | 83,102 | | | $ | 46,011 | | |
Consumer Discretionary (0.0%): (a) | |
Moncler SpA | | | 1,326 | | | | 43,946 | | |
Consumer Staples (0.1%): | |
Davide Campari - Milano SpA | | | 9,729 | | | | 82,309 | | |
Energy (0.1%): | |
Eni SpA | | | 4,320 | | | | 68,038 | | |
Snam SpA | | | 18,296 | | | | 80,046 | | |
| | | | 148,084 | | |
Financials (0.1%): | |
Assicurazioni Generali SpA | | | 4,994 | | | | 83,528 | | |
Intesa Sanpaolo SpA | | | 22,208 | | | | 49,351 | | |
UniCredit SpA | | | 3,507 | | | | 39,750 | | |
| | | | 172,629 | | |
Industrials (0.0%): (a) | |
Atlantia SpA | | | 1,810 | | | | 37,469 | | |
Utilities (0.1%): | |
Enel SpA | | | 15,810 | | | | 91,356 | | |
Terna Rete Elettrica Nazionale SpA | | | 14,396 | | | | 81,685 | | |
| | | | 173,041 | | |
| | | | 703,489 | | |
Japan (4.6%): | |
Communication Services (0.2%): | |
KDDI Corp. | | | 3,308 | | | | 79,206 | | |
Nintendo Co. Ltd. | | | 100 | | | | 26,722 | | |
Nippon Telegraph & Telephone Corp. | | | 2,064 | | | | 84,413 | | |
NTT DOCOMO, Inc. | | | 3,692 | | | | 83,297 | | |
SoftBank Group Corp. | | | 564 | | | | 37,595 | | |
Yahoo Japan Corp. | | | 13,130 | | | | 32,828 | | |
| | | | 344,061 | | |
Consumer Discretionary (0.8%): | |
Aisin Seiki Co. Ltd. | | | 1,410 | | | | 49,149 | | |
Bridgestone Corp. | | | 1,760 | | | | 68,030 | | |
Denso Corp. | | | 1,430 | | | | 63,847 | | |
Fuji Heavy Industries Ltd. | | | 3,050 | | | | 65,681 | | |
Honda Motor Co. Ltd. | | | 2,330 | | | | 61,540 | | |
Isuzu Motors Ltd. | | | 4,494 | | | | 63,500 | | |
Koito Manufacturing Co. Ltd. | | | 990 | | | | 51,311 | | |
Mitsubishi Motors Corp. | | | 7,300 | | | | 40,100 | | |
Nissan Motor Co. Ltd. | | | 10,576 | | | | 84,953 | | |
Nitori Holdings Co. Ltd. | | | 430 | | | | 53,873 | | |
Oriental Land Co. Ltd. | | | 708 | | | | 71,420 | | |
Panasonic Corp. | | | 5,900 | | | | 53,331 | | |
Rakuten, Inc. (b) | | | 7,000 | | | | 47,012 | | |
Sekisui House Ltd. | | | 5,272 | | | | 77,885 | | |
See notes to financial statements.
129
Victory Portfolios II
VictoryShares Developed Enhanced Volatility Wtd ETF | | Schedule of Portfolio Investments — continued
December 31, 2018 | |
(Unaudited)
Security Description | | Shares | | Value | |
Sharp Corp./Japan | | | 1,600 | | | $ | 16,089 | | |
Shimano, Inc. | | | 540 | | | | 76,474 | | |
Sumitomo Electric Industries Ltd. | | | 4,694 | | | | 62,621 | | |
Suzuki Motor Corp. | | | 804 | | | | 40,842 | | |
Toyota Industries Corp. | | | 1,208 | | | | 56,107 | | |
Toyota Motor Corp. | | | 1,324 | | | | 77,393 | | |
Zozo, Inc. | | | 1,100 | | | | 20,175 | | |
| | | | 1,201,333 | | |
Consumer Staples (0.4%): | |
Asahi Group Holdings Ltd. | | | 1,460 | | | | 56,873 | | |
Japan Tobacco, Inc. (b) | | | 3,044 | | | | 72,677 | | |
Kao Corp. | | | 918 | | | | 68,304 | | |
Kikkoman Corp. | | | 1,200 | | | | 64,714 | | |
Kose Corp. | | | 200 | | | | 31,499 | | |
MEIJI Holdings Co. Ltd. | | | 1,004 | | | | 82,086 | | |
Seven & i Holdings Co. Ltd. | | | 2,200 | | | | 96,018 | | |
Uni-Charm Corp. | | | 2,094 | | | | 68,004 | | |
Yakult Honsha Co. Ltd. | | | 770 | | | | 54,242 | | |
| | | | 594,417 | | |
Energy (0.0%): (a) | |
Idemitsu Kosan Co. Ltd. | | | 700 | | | | 23,059 | | |
JXTG Holdings, Inc. | | | 7,710 | | | | 40,572 | | |
| | | | 63,631 | | |
Financials (0.7%): | |
Daiwa Securities Group, Inc. | | | 16,400 | | | | 83,294 | | |
Japan Post Bank Co. Ltd. | | | 8,212 | | | | 90,670 | | |
Japan Post Holdings Co. Ltd. | | | 10,300 | | | | 118,893 | | |
Mitsubishi UFJ Financial Group, Inc. | | | 12,234 | | | | 60,048 | | |
Mizuho Financial Group, Inc. | | | 69,794 | | | | 108,458 | | |
Nomura Holdings, Inc. | | | 19,970 | | | | 76,680 | | |
ORIX Corp. | | | 5,068 | | | | 74,247 | | |
Resona Holdings, Inc. | | | 11,546 | | | | 55,702 | | |
Sumitomo Mitsui Financial Group, Inc. | | | 2,484 | | | | 82,619 | | |
Sumitomo Mitsui Trust Holdings, Inc. | | | 2,300 | | | | 84,411 | | |
T&D Holdings, Inc. | | | 4,200 | | | | 49,017 | | |
The Dai-ichi Life Insurance Co. Ltd. | | | 3,488 | | | | 54,680 | | |
| | | | 938,719 | | |
Health Care (0.4%): | |
Astellas Pharma, Inc. | | | 5,252 | | | | 67,166 | | |
Chugai Pharmaceutical Co. Ltd. | | | 1,130 | | | | 65,785 | | |
Eisai Co. Ltd. | | | 354 | | | | 27,463 | | |
Hoya Corp. | | | 1,118 | | | | 67,484 | | |
M3, Inc. | | | 2,200 | | | | 29,590 | | |
ONO Pharmaceutical Co. Ltd. | | | 1,884 | | | | 38,595 | | |
Otsuka Holdings Co. Ltd. | | | 1,400 | | | | 57,398 | | |
Shionogi & Co. Ltd. | | | 1,428 | | | | 81,713 | | |
Sysmex Corp. | | | 574 | | | | 27,634 | | |
Taisho Pharmaceutical Holdings | | | 500 | | | | 50,324 | | |
| | | | 513,152 | | |
See notes to financial statements.
130
Victory Portfolios II
VictoryShares Developed Enhanced Volatility Wtd ETF | | Schedule of Portfolio Investments — continued
December 31, 2018 | |
(Unaudited)
Security Description | | Shares | | Value | |
Industrials (1.0%): | |
Central Japan Railway Co. | | | 54 | | | $ | 11,414 | | |
Daikin Industries Ltd. | | | 466 | | | | 49,730 | | |
East Japan Railway Co. | | | 586 | | | | 51,927 | | |
FANUC Corp. | | | 230 | | | | 34,986 | | |
ITOCHU Corp. | | | 4,208 | | | | 71,688 | | |
Japan Airlines Co. Ltd. | | | 2,100 | | | | 74,561 | | |
Komatsu Ltd. | | | 1,788 | | | | 38,594 | | |
Kubota Corp. | | | 4,304 | | | | 61,326 | | |
Makita Corp. | | | 1,578 | | | | 56,229 | | |
Marubeni Corp. | | | 9,274 | | | | 65,364 | | |
Mitsubishi Corp. | | | 2,992 | | | | 82,451 | | |
Mitsubishi Electric Corp. | | | 4,752 | | | | 52,749 | | |
Mitsubishi Heavy Industries Ltd. | | | 2,200 | | | | 79,416 | | |
Mitsui & Co. Ltd. | | | 5,086 | | | | 78,455 | | |
Nidec Corp. | | | 454 | | | | 51,680 | | |
Recruit Holdings Co. Ltd. | | | 1,720 | | | | 41,788 | | |
Secom Co. Ltd. | | | 710 | | | | 59,047 | | |
SMC Corp. | | | 114 | | | | 34,578 | | |
Sumitomo Corp. | | | 5,298 | | | | 75,489 | | |
Taisei Corp. | | | 1,334 | | | | 57,272 | | |
Tokyu Corp. | | | 5,000 | | | | 81,896 | | |
Toyota Tsusho Corp. | | | 1,880 | | | | 55,667 | | |
West Japan Railway Co. | | | 1,200 | | | | 84,982 | | |
| | | | 1,351,289 | | |
Information Technology (0.4%): | |
Canon, Inc. | | | 3,114 | | | | 85,273 | | |
FUJIFILM Holdings Corp. | | | 1,960 | | | | 76,368 | | |
Fujitsu Ltd. | | | 1,063 | | | | 66,414 | | |
Hitachi Ltd. | | | 2,147 | | | | 57,510 | | |
Keyence Corp. | | | 114 | | | | 57,921 | | |
Murata Manufacturing Co. Ltd. | | | 334 | | | | 45,579 | | |
Nomura Research Institute Ltd. | | | 1,258 | | | | 46,777 | | |
NTT Data Corp. | | | 4,708 | | | | 51,767 | | |
Oracle Corp. Japan | | | 600 | | | | 38,325 | | |
ROHM Co. Ltd. | | | 600 | | | | 38,544 | | |
TDK Corp. | | | 400 | | | | 28,178 | | |
Tokyo Electron Ltd. | | | 326 | | | | 37,229 | | |
| | | | 629,885 | | |
Materials (0.3%): | |
Asahi Kasei Corp. | | | 5,068 | | | | 52,257 | | |
JFE Holdings, Inc. | | | 3,104 | | | | 49,765 | | |
Mitsubishi Chem Holdings | | | 7,748 | | | | 58,865 | | |
Nippon Paint Co. Ltd. (b) | | | 1,138 | | | | 39,044 | | |
Nippon Steel & Sumitomo Metal | | | 3,898 | | | | 67,314 | | |
Nitto Denko Corp. | | | 764 | | | | 38,643 | | |
Shin-Etsu Chemical Co. Ltd. | | | 670 | | | | 52,187 | | |
Toray Industries, Inc. | | | 10,880 | | | | 76,643 | | |
| | | | 434,718 | | |
See notes to financial statements.
131
Victory Portfolios II
VictoryShares Developed Enhanced Volatility Wtd ETF | | Schedule of Portfolio Investments — continued
December 31, 2018 | |
(Unaudited)
Security Description | | Shares | | Value | |
Real Estate (0.3%): | |
Daito Trust Construction Co. Ltd. | | | 440 | | | $ | 60,285 | | |
Daiwa House Industry Co. Ltd. | | | 2,300 | | | | 73,414 | | |
Mitsubishi Estate Co. Ltd. | | | 4,352 | | | | 68,681 | | |
Mitsui Fudosan Co. Ltd. | | | 3,078 | | | | 68,672 | | |
Sumitomo Realty & Development | | | 2,500 | | | | 91,842 | | |
| | | | 362,894 | | |
Utilities (0.1%): | |
Kansai Electric Power Co. | | | 4,300 | | | | 64,741 | | |
Tokyo Gas Co. Ltd. | | | 3,100 | | | | 78,794 | | |
| | | | 143,535 | | |
| | | | 6,577,634 | | |
Korea, Republic Of (0.8%): | |
Communication Services (0.1%): | |
NAVER Corp. | | | 463 | | | | 50,628 | | |
SK Telecom Co. Ltd. | | | 322 | | | | 77,780 | | |
| | | | 128,408 | | |
Consumer Discretionary (0.1%): | |
Hyundai Motor Co. | | | 558 | | | | 59,266 | | |
LG Electronics, Inc. | | | 626 | | | | 34,956 | | |
| | | | 94,222 | | |
Consumer Staples (0.1%): | |
Amorepacific Corp. | | | 206 | | | | 38,682 | | |
KT&G Corp. | | | 892 | | | | 81,149 | | |
LG Household & Health Care Ltd. | | | 38 | | | | 37,499 | | |
| | | | 157,330 | | |
Energy (0.1%): | |
SK Innovation Co. Ltd. | | | 325 | | | | 52,288 | | |
S-Oil Corp. | | | 518 | | | | 45,360 | | |
| | | | 97,648 | | |
Financials (0.1%): | |
Hana Financial Group, Inc. | | | 1,316 | | | | 42,758 | | |
KB Financial Group, Inc. | | | 1,372 | | | | 57,182 | | |
Shinhan Financial Group Co. Ltd. | | | 1,947 | | | | 69,106 | | |
Woori Bank | | | 3,859 | | | | 53,957 | | |
| | | | 223,003 | | |
Health Care (0.0%): (a) | |
Celltrion, Inc. (c) | | | 135 | | | | 26,851 | | |
Industrials (0.1%): | |
LG Corp. | | | 1,014 | | | | 63,528 | | |
Samsung C&T Corp. | | | 593 | | | | 56,074 | | |
SK Holdings Co. Ltd. | | | 280 | | | | 65,251 | | |
| | | | 184,853 | | |
See notes to financial statements.
132
Victory Portfolios II
VictoryShares Developed Enhanced Volatility Wtd ETF | | Schedule of Portfolio Investments — continued
December 31, 2018 | |
(Unaudited)
Security Description | | Shares | | Value | |
Information Technology (0.1%): | |
Samsung Electro-Mechanics Co. Ltd. | | | 264 | | | $ | 24,490 | | |
Samsung Electronics Co. Ltd. | | | 1,382 | | | | 47,937 | | |
Samsung SDI Co. Ltd. | | | 185 | | | | 36,314 | | |
Samsung SDS Co. Ltd. | | | 180 | | | | 32,912 | | |
SK Hynix, Inc. | | | 589 | | | | 31,939 | | |
| | | | 173,592 | | |
Materials (0.1%): | |
LG Chem Ltd. | | | 134 | | | | 41,676 | | |
Lotte Chemical Corp. | | | 160 | | | | 39,724 | | |
POSCO | | | 154 | | | | 33,541 | | |
| | | | 114,941 | | |
| | | | 1,200,848 | | |
Luxembourg (0.1%): | |
Energy (0.0%): (a) | |
Tenaris SA | | | 3,029 | | | | 32,757 | | |
Health Care (0.1%): | |
Eurofins Scientific | | | 94 | | | | 35,106 | | |
Materials (0.0%): (a) | |
Arcelormittal | | | 1,569 | | | | 32,605 | | |
| | | | 100,468 | | |
Macau (0.1%): | |
Consumer Discretionary (0.1%): | |
Sands China Ltd. | | | 10,800 | | | | 47,310 | | |
Wynn Macau Ltd. | | | 13,600 | | | | 29,667 | | |
| | | | 76,977 | | |
Netherlands (0.7%): | |
Communication Services (0.1%): | |
Koninklijke KPN NV | | | 31,147 | | | | 91,345 | | |
Consumer Staples (0.2%): | |
Heineken Holding A | | | 1,053 | | | | 88,965 | | |
Heineken NV | | | 970 | | | | 85,787 | | |
Koninklijke Ahold Delhaize NV | | | 4,178 | | | | 105,657 | | |
| | | | 280,409 | | |
Financials (0.2%): | |
ABN AMRO Group NV (d) | | | 2,561 | | | | 60,262 | | |
Aegon NV | | | 11,483 | | | | 53,659 | | |
ING Groep NV | | | 6,067 | | | | 65,402 | | |
NN Group NV | | | 2,026 | | | | 80,770 | | |
| | | | 260,093 | | |
Health Care (0.0%): (a) | |
Koninklijke Philips NV | | | 1,746 | | | | 61,866 | | |
See notes to financial statements.
133
Victory Portfolios II
VictoryShares Developed Enhanced Volatility Wtd ETF | | Schedule of Portfolio Investments — continued
December 31, 2018 | |
(Unaudited)
Security Description | | Shares | | Value | |
Industrials (0.1%): | |
Randstad Holding NV | | | 1,221 | | | $ | 56,077 | | |
Wolters Kluwer NV | | | 1,567 | | | | 92,737 | | |
| | | | 148,814 | | |
Information Technology (0.0%): (a) | |
| ASML Holding NV | | | 275 | | | | 43,211 | | |
Materials (0.1%): | |
AkzoNobel NV | | | 1,036 | | | | 83,553 | | |
Koninklijke DSM NV | | | 760 | | | | 62,200 | | |
| | | | 145,753 | | |
| | | | 1,031,491 | | |
Norway (0.2%): | |
Communication Services (0.1%): | |
Telenor ASA | | | 4,175 | | | | 80,934 | | |
Consumer Staples (0.1%): | |
Marine Harvest ASA | | | 3,347 | | | | 70,770 | | |
Energy (0.0%): (a) | |
Aker BP ASA | | | 1,506 | | | | 37,996 | | |
Financials (0.0%): (a) | |
DNB ASA | | | 3,442 | | | | 55,032 | | |
Materials (0.0%): (a) | |
Norsk Hydro ASA | | | 9,530 | | | | 43,246 | | |
| | | | 287,978 | | |
Portugal (0.1%): | |
Consumer Staples (0.0%): (a) | |
Jeronimo Martins SGPS SA | | | 3,961 | | | | 46,920 | | |
Energy (0.1%): | |
Galp Energia SGPS SA | | | 3,865 | | | | 61,080 | | |
| | | | 108,000 | | |
Russian Federation (0.0%): (a) | |
Materials (0.0%): (a) | |
Evraz PLC | | | 5,092 | | | | 31,181 | | |
Singapore (0.4%): | |
Communication Services (0.0%): (a) | |
Singapore Telecommunications Ltd. | | | 35,694 | | | | 76,753 | | |
Consumer Discretionary (0.1%): | |
Genting Singapore Ltd. | | | 64,070 | | | | 45,845 | | |
Jardine Cycle & Carriage Ltd. | | | 2,584 | | | | 67,037 | | |
| | | | 112,882 | | |
Consumer Staples (0.1%): | |
Wilmar International Ltd. | | | 41,462 | | | | 94,937 | | |
See notes to financial statements.
134
Victory Portfolios II
VictoryShares Developed Enhanced Volatility Wtd ETF | | Schedule of Portfolio Investments — continued
December 31, 2018 | |
(Unaudited)
Security Description | | Shares | | Value | |
Financials (0.1%): | |
DBS Group Holdings Ltd. | | | 3,778 | | | $ | 65,684 | | |
Oversea-Chinese Banking Corp. Ltd. | | | 9,138 | | | | 75,513 | | |
United Overseas Bank Ltd. | | | 3,992 | | | | 71,982 | | |
| | | | 213,179 | | |
Real Estate (0.1%): | |
CapitaLand Ltd. | | | 33,636 | | | | 76,771 | | |
| | | | 574,522 | | |
Spain (0.7%): | |
Communication Services (0.1%): | |
Telefonica SA | | | 12,049 | | | | 101,302 | | |
Consumer Discretionary (0.0%): (a) | |
Industria de Diseno Textil SA | | | 2,463 | | | | 63,063 | | |
Energy (0.1%): | |
Repsol SA | | | 4,139 | | | | 66,762 | | |
Financials (0.2%): | |
Banco Bilbao Vizcaya Argentaria SA | | | 10,590 | | | | 56,237 | | |
Banco Santander SA | | | 14,239 | | | | 64,808 | | |
Bankia SA | | | 17,124 | | | | 50,220 | | |
CaixaBank SA | | | 13,817 | | | | 50,082 | | |
| | | | 221,347 | | |
Health Care (0.0%): (a) | |
Grifols SA | | | 2,426 | | | | 63,644 | | |
Industrials (0.1%): | |
Aena SA (d) | | | 501 | | | | 77,912 | | |
Ferrovial SA | | | 4,279 | | | | 86,741 | | |
| | | | 164,653 | | |
Information Technology (0.0%): (a) | |
Amadeus IT Holding SA | | | 931 | | | | 64,889 | | |
Utilities (0.2%): | |
Endesa SA | | | 4,461 | | | | 102,874 | | |
Iberdrola SA | | | 12,556 | | | | 100,947 | | |
Red Electrica Corp. SA | | | 4,481 | | | | 100,076 | | |
| | | | 303,897 | | |
| | | | 1,049,557 | | |
Sweden (0.6%): | |
Communication Services (0.1%): | |
TeliaSonera AB | | | 16,500 | | | | 78,196 | | |
Consumer Discretionary (0.0%): (a) | |
Hennes & Mauritz AB, B Shares (b) | | | 3,761 | | | | 53,506 | | |
Consumer Staples (0.1%): | |
Essity AB, Class B | | | 3,208 | | | | 78,805 | | |
Swedish Match AB | | | 1,501 | | | | 59,155 | | |
| | | | 137,960 | | |
See notes to financial statements.
135
Victory Portfolios II
VictoryShares Developed Enhanced Volatility Wtd ETF | | Schedule of Portfolio Investments — continued
December 31, 2018 | |
(Unaudited)
Security Description | | Shares | | Value | |
Financials (0.2%): | |
Skandinaviska Enskilda Banken AB, Class A | | | 7,060 | | | $ | 68,623 | | |
Svenska Handelsbanken AB | | | 5,686 | | | | 63,099 | | |
Swedbank AB, A Shares | | | 3,737 | | | | 83,425 | | |
| | | | 215,147 | | |
Health Care (0.0%): (a) | |
Swedish Orphan Biovitrum AB (c) | | | 1,606 | | | | 34,991 | | |
Industrials (0.2%): | |
Alfa Laval AB | | | 2,415 | | | | 51,705 | | |
Atlas Copco AB, A Shares | | | 2,099 | | | | 49,880 | | |
Sandvik AB | | | 3,610 | | | | 51,492 | | |
| SKF AB, B Shares | | | 3,075 | | | | 46,673 | | |
Volvo AB, Class B | | | 3,839 | | | | 50,251 | | |
| | | | 250,001 | | |
Information Technology (0.0%): (a) | |
Hexagon AB, B Shares | | | 1,264 | | | | 58,219 | | |
| | | | 828,020 | | |
Switzerland (1.5%): | |
Communication Services (0.1%): | |
Swisscom AG | | | 209 | | | | 99,916 | | |
Consumer Discretionary (0.1%): | |
CIE Financiere Richemont SA | | | 898 | | | | 57,582 | | |
The Swatch Group AG, B shares | | | 165 | | | | 48,148 | | |
| | | | 105,730 | | |
Consumer Staples (0.2%): | |
Barry Callebaut AG | | | 39 | | | | 60,773 | | |
Chocoladefabriken Lindt & Spruengli AG | | | 15 | | | | 93,130 | | |
Coca-Cola HBC AG | | | 2,405 | | | | 75,152 | | |
Nestle SA, Registered Shares | | | 1,446 | | | | 117,446 | | |
| | | | 346,501 | | |
Financials (0.2%): | |
Julius Baer Group Ltd. | | | 1,455 | | | | 51,847 | | |
Partners Group Holding AG | | | 137 | | | | 83,106 | | |
Swiss Life Holding AG | | | 277 | | | | 106,740 | | |
Zurich Insurance Group AG | | | 327 | | | | 97,551 | | |
| | | | 339,244 | | |
Health Care (0.3%): | |
Lonza Group AG, Registered Shares | | | 215 | | | | 55,736 | | |
Novartis AG | | | 1,057 | | | | 90,413 | | |
Roche Holding AG | | | 414 | | | | 102,562 | | |
Sonova Holding AG, Registered Shares | | | 396 | | | | 64,730 | | |
Straumann Holding AG | | | 79 | | | | 49,692 | | |
Vifor Pharma AG | | | 309 | | | | 33,620 | | |
| | | | 396,753 | | |
See notes to financial statements.
136
Victory Portfolios II
VictoryShares Developed Enhanced Volatility Wtd ETF | | Schedule of Portfolio Investments — continued
December 31, 2018 | |
(Unaudited)
Security Description | | Shares | | Value | |
Industrials (0.4%): | |
ABB Ltd. | | | 3,050 | | | $ | 58,035 | | |
Adecco SA, Registered Shares | | | 1,160 | | | | 54,228 | | |
Ferguson PLC | | | 1,084 | | | | 69,308 | | |
Geberit AG | | | 235 | | | | 91,441 | | |
Kuehne + Nagel International AG | | | 664 | | | | 85,391 | | |
Schindler Holding AG | | | 389 | | | | 77,087 | | |
SGS SA | | | 34 | | | | 76,478 | | |
| | | | 511,968 | | |
Information Technology (0.0%): (a) | |
Stmicroelectronics NV | | | 2,117 | | | | 29,660 | | |
Temenos AG | | | 361 | | | | 43,320 | | |
| | | | 72,980 | | |
Materials (0.2%): | |
EMS-Chemie Holding AG | | | 145 | | | | 68,921 | | |
Givaudan SA, Registered Shares | | | 38 | | | | 88,029 | | |
Glencore PLC | | | 10,330 | | | | 38,355 | | |
Sika AG, Registered Shares | | | 453 | | | | 57,449 | | |
| | | | 252,754 | | |
| | | | 2,125,846 | | |
United Arab Emirates (0.0%): (a) | |
Health Care (0.0%): (a) | |
NMC Health PLC | | | 1,177 | | | | 41,039 | | |
United Kingdom (2.4%): | |
Communication Services (0.2%): | |
BT Group PLC | | | 22,520 | | | | 68,334 | | |
Informa PLC | | | 9,776 | | | | 78,514 | | |
Pearson PLC | | | 6,790 | | | | 81,202 | | |
Vodafone Group PLC | | | 35,956 | | | | 70,062 | | |
| | | | 298,112 | | |
Consumer Discretionary (0.3%): | |
Burberry Group PLC | | | 2,262 | | | | 50,029 | | |
Compass Group PLC | | | 4,128 | | | | 86,802 | | |
InterContinental Hotels Group PLC | | | 1,416 | | | | 76,459 | | |
Next PLC | | | 890 | | | | 45,267 | | |
Persimmon PLC | | | 2,769 | | | | 68,107 | | |
Whitbread PLC | | | 950 | | | | 55,437 | | |
| | | | 382,101 | | |
Consumer Staples (0.5%): | |
Associated British Foods PLC | | | 2,630 | | | | 68,475 | | |
British American Tobacco PLC | | | 1,310 | | | | 41,737 | | |
Diageo PLC | | | 3,060 | | | | 108,996 | | |
Imperial Tobacco Group PLC | | | 2,043 | | | | 61,888 | | |
Reckitt Benckiser Group PLC | | | 849 | | | | 65,059 | | |
Sainsbury (J) PLC | | | 13,368 | | | | 45,146 | | |
Tesco PLC | | | 25,656 | | | | 62,155 | | |
See notes to financial statements.
137
Victory Portfolios II
VictoryShares Developed Enhanced Volatility Wtd ETF | | Schedule of Portfolio Investments — continued
December 31, 2018 | |
(Unaudited)
Security Description | | Shares | | Value | |
Unilever NV | | | 1,894 | | | $ | 102,890 | | |
Unilever PLC | | | 1,762 | | | | 92,256 | | |
| | | | 648,602 | | |
Energy (0.1%): | |
| BP PLC | | | 9,868 | | | | 62,370 | | |
Royal Dutch Shell PLC, Class A | | | 2,367 | | | | 69,606 | | |
| | | | 131,976 | | |
Financials (0.5%): | |
| 3I Group PLC | | | 7,151 | | | | 70,482 | | |
Aviva PLC | | | 15,323 | | | | 73,326 | | |
Hargreaves Lansdown PLC | | | 2,653 | | | | 62,515 | | |
Legal & General Group PLC | | | 28,419 | | | | 83,662 | | |
Lloyds Banking Group PLC | | | 158,595 | | | | 104,796 | | |
London Stock Exchange Group PLC | | | 1,515 | | | | 78,426 | | |
Prudential PLC | | | 3,225 | | | | 57,622 | | |
Schroders PLC | | | 2,203 | | | | 68,588 | | |
Standard Life Aberdeen PLC | | | 19,095 | | | | 62,479 | | |
| | | | 661,896 | | |
Health Care (0.1%): | |
AstraZeneca PLC | | | 1,264 | | | | 94,605 | | |
Smith & Nephew PLC | | | 4,965 | | | | 92,634 | | |
| | | | 187,239 | | |
Industrials (0.3%): | |
Ashtead Group PLC | | | 2,098 | | | | 43,768 | | |
BAE Systems PLC | | | 12,172 | | | | 71,231 | | |
Bunzl PLC | | | 3,493 | | | | 105,456 | | |
International Consolidated Airlines Group SA | | | 7,887 | | | | 62,117 | | |
Intertek Group PLC | | | 1,053 | | | | 64,414 | | |
RELX PLC | | | 5,112 | | | | 105,311 | | |
| | | | 452,297 | | |
Materials (0.3%): | |
Anglo American PLC | | | 2,102 | | | | 46,820 | | |
Antofagasta PLC | | | 4,861 | | | | 48,518 | | |
Croda International PLC | | | 1,302 | | | | 77,737 | | |
DS Smith PLC | | | 10,402 | | | | 39,676 | | |
Johnson Matthey PLC | | | 1,531 | | | | 54,612 | | |
Mondi PLC | | | 2,206 | | | | 45,923 | | |
Rio Tinto PLC | | | 1,193 | | | | 56,710 | | |
| | | | 369,996 | | |
Utilities (0.1%): | |
Centrica PLC | | | 39,534 | | | | 67,966 | | |
National Grid PLC | | | 7,777 | | | | 75,740 | | |
SSE PLC | | | 5,557 | | | | 76,590 | | |
| | | | 220,296 | | |
| | | | 3,352,515 | | |
See notes to financial statements.
138
Victory Portfolios II
VictoryShares Developed Enhanced Volatility Wtd ETF | | Schedule of Portfolio Investments — continued
December 31, 2018 | |
(Unaudited)
Security Description | | Shares | | Value | |
United States (0.1%): | |
Consumer Discretionary (0.0%): (a) | |
Carnival PLC | | | 1,040 | | | $ | 49,874 | | |
Industrials (0.1%): | |
Waste Connections, Inc. | | | 1,475 | | | | 109,497 | | |
| | | | 159,371 | | |
Total Common Stocks (Cost $34,944,735) | | | 33,283,629 | | |
Rights (0.0%) (a) | |
Spain (0.0%): (a) | |
Energy (0.0%): (a) | |
Repsol SA Expires 01/10/19 @ $0.41 (c) | | | 4,139 | | | | 1,896 | | |
Total Rights (Cost $1,941) | | | 1,896 | | |
Investment Companies (76.3%) | |
United States (76.3%): | |
JPMorgan U.S. Treasury Plus Money Market Fund, Class L, 2.27% | | | 108,318,486 | | | | 108,318,486 | | |
Total Investment Companies (Cost $108,318,486) | | | 108,318,486 | | |
Collateral for Securities Loaned^ (0.3%) | |
United States (0.3%): | |
BlackRock Liquidity Funds TempFund Portfolio, Institutional Class, 2.49% (g) | | | 89,883 | | | | 89,883 | | |
Fidelity Investments Money Market Government Portfolio, Class I, 2.28% (g) | | | 129,877 | | | | 129,877 | | |
Fidelity Investments Prime Money Market Portfolio, Class I, 2.46% (g) | | | 4,011 | | | | 4,011 | | |
Goldman Sachs Financial Square Prime Obligations Fund, Institutional Class,
2.55% (g) | | | 49,936 | | | | 49,936 | | |
JPMorgan Prime Money Market Fund, Capital Class, 2.49% (g) | | | 79,892 | | | | 79,892 | | |
Morgan Stanley Institutional Liquidity Prime Portfolio, Institutional Class,
2.58% (g) | | | 119,844 | | | | 119,844 | | |
Total Collateral for Securities Loaned (Cost $473,443) | | | 473,443 | | |
Total Investments (Cost $143,738,605) — 100.0% | | | 142,077,454 | | |
Liabilities in excess of other assets — 0.0% | | | (52,979 | ) | |
NET ASSETS — 100.00% | | $ | 142,024,475 | | |
^ Purchased with cash collateral from securities on loan.
(a) Amount represents less than 0.05% of net assets.
(b) All or a portion of this security is on loan.
(c) Non-income producing security.
(d) Rule 144A security or other security that is restricted as to resale to institutional investors. The Fund's Adviser has deemed this security to be liquid based upon procedures approved by the Board of Trustees. As of December 31, 2018, the fair value of these securities was $311,799 and amounted to 0.2% of net assets.
(e) Security was fair valued based upon procedures approved by the Board of Trustees and represents 0.0% of the Fund's net assets as of December 31, 2018. This security is classified as Level 3 within the fair value hierarchy. (See Note 2)
See notes to financial statements.
139
Victory Portfolios II
VictoryShares Developed Enhanced Volatility Wtd ETF | | Schedule of Portfolio Investments — continued
December 31, 2018 | |
(Unaudited)
(f) The Fund's Adviser has deemed this security to be illiquid based upon procedures approved by the Board of Trustees. As of December 31, 2018, illiquid securities were 0.0% of the Fund's net assets.
(g) Rate disclosed is the daily yield on December 31, 2018.
ADR — American Depositary Receipt
PLC — Public Limited Company
Futures Contracts Purchased
| | | Number
of
Contracts | | Expiration
Date | | Notional
Amount | | Value | | Unrealized
Appreciation
(Depreciation) | |
Mini MSCI EAFE Index Futures | | | 7 | | | 3/15/19 | | $ | 613,558 | | | $ | 600,600 | | | $ | (12,958 | ) | |
| | | Total unrealized appreciation | | | | | | | | $ | — | | |
| | | Total unrealized depreciation | | | | | | | | | (12,958 | ) | |
| | | Total net unrealized appreciation(depreciation) | | | | | | | | $ | (12,958 | ) | |
See notes to financial statements.
140
Victory Portfolios II | | Statements of Assets and Liabilities
December 31, 2018 | |
(Unaudited)
| | | VictoryShares
US 500 Volatility
Wtd ETF | | VictoryShares
US Small Cap
Volatility
Wtd ETF | | VictoryShares
International
Volatility
Wtd ETF | |
ASSETS: | |
Investments, at value (Cost $672,302,281,
$40,170,397 and $27,571,012) | | $ | 617,016,302 | (a) | | $ | 33,776,501 | (b) | | $ | 25,849,827 | (c) | |
Foreign currency, at value (Cost $—, $—
and $4,706) | | | — | | | | — | | | | 4,707 | | |
Cash and cash equivalents | | | 322,152 | | | | 221,722 | | | | 204,730 | | |
Deposits with brokers for futures contracts | | | 44,460 | | | | 35,983 | | | | 5,760 | | |
Interest and dividends receivable | | | 711,724 | | | | 39,845 | | | | 37,982 | | |
Receivable for capital shares issued | | | 6,594,465 | | | | — | | | | 1,048,646 | | |
Variation margin receivable on open futures
contracts | | | 2,139 | | | | 1,620 | | | | — | | |
Reclaims receivable | | | — | | | | — | | | | 27,104 | | |
Total Assets | | | 624,691,242 | | | | 34,075,671 | | | | 27,178,756 | | |
LIABILITIES: | |
Payables: | | | | | | | | | | | | | |
Collateral received on loaned securities | | | 30,969,761 | | | | 1,486,600 | | | | 253,628 | | |
Investments purchased | | | 6,587,551 | | | | — | | | | 1,235,621 | | |
Accrued expenses and other payables: | |
Investment advisory fees | | | 140,207 | | | | 6,352 | | | | 3,542 | | |
Administration fees | | | 16,598 | | | | 956 | | | | 582 | | |
Custodian fees | | | 6,722 | | | | 759 | | | | 13,714 | | |
Chief Compliance Officer fees | | | 588 | | | | 66 | | | | 21 | | |
Trustees' fees | | | 1,776 | | | | 101 | | | | — | | |
Other accrued expenses | | | 60,738 | | | | 9,618 | | | | 10,145 | | |
Total Liabilities | | | 37,783,941 | | | | 1,504,452 | | | | 1,517,253 | | |
NET ASSETS: | |
Capital | | | 634,737,134 | | | | 38,434,100 | | | | 27,862,293 | | |
Total distributable earnings/(loss) | | | (47,829,833 | ) | | | (5,862,881 | ) | | | (2,200,790 | ) | |
Net Assets | | $ | 586,907,301 | | | $ | 32,571,219 | | | $ | 25,661,503 | | |
Shares Outstanding (unlimited shares
authorized, no par value): | | | 13,350,000 | | | | 800,000 | | | | 750,000 | | |
Net asset value: | | $ | 43.96 | | | $ | 40.71 | | | $ | 34.22 | | |
(a) Includes $30,509,804 of securities on loan.
(b) Includes $1,443,303 of securities on loan.
(c) Includes $348,960 of securities on loan.
See notes to financial statements.
141
Victory Portfolios II | | Statements of Assets and Liabilities
December 31, 2018 | |
(Unaudited)
| | | VictoryShares
Emerging Market
Volatility
Wtd ETF | | VictoryShares
US Large Cap
High Div Volatility
Wtd ETF | | VictoryShares
US Small Cap
High Div Volatility
Wtd ETF | |
ASSETS: | |
Investments, at value (Cost $17,350,579,
$180,760,435 and $58,548,984) | | $ | 17,259,137 | (a) | | $ | 166,451,798 | (b) | | $ | 51,134,225 | (c) | |
Foreign currency, at value (Cost $2,641,
$— and $—) | | | 2,662 | | | | — | | | | — | | |
Cash and cash equivalents | | | 102,854 | | | | 331,669 | | | | 304,156 | | |
Deposits with brokers for futures contracts | | | 19,067 | | | | 53,372 | | | | 46,995 | | |
Interest and dividends receivable | | | 16,559 | | | | 314,602 | | | | 59,936 | | |
Receivable for capital shares issued | | | — | | | | 4,135,905 | | | | — | | |
Variation margin receivable on open futures
contracts | | | — | | | | 2,880 | | | | 2,025 | | |
Receivable from Adviser | | | 10,011 | | | | — | | | | — | | |
Total Assets | | | 17,410,290 | | | | 171,290,226 | | | | 51,547,337 | | |
LIABILITIES: | |
Payables: | |
Collateral received on loaned securities | | | 311,011 | | | | 3,728,077 | | | | 3,366,953 | | |
Investments purchased | | | — | | | | 4,130,040 | | | | — | | |
Variation margin on open futures
contracts | | | 525 | | | | — | | | | — | | |
Accrued foreign capital gains taxes | | | 3,171 | | | | — | | | | — | | |
Accrued expenses and other payables: | |
Investment advisory fees | | | — | | | | 35,093 | | | | 10,350 | | |
Administration fees | | | 530 | | | | 4,438 | | | | 1,419 | | |
Custodian fees | | | 16,488 | | | | 800 | | | | 711 | | |
Chief Compliance Officer fees | | | 52 | | | | 154 | | | | 62 | | |
Trustees' fees | | | 30 | | | | 154 | | | | 124 | | |
Other accrued expenses | | | 29,633 | | | | 23,252 | | | | 11,467 | | |
Total Liabilities | | | 361,440 | | | | 7,922,008 | | | | 3,391,086 | | |
NET ASSETS: | |
Capital | | | 17,487,610 | | | | 178,008,163 | | | | 55,766,022 | | |
Total distributable earnings/(loss) | | | (438,760 | ) | | | (14,639,945 | ) | | | (7,609,771 | ) | |
Net Assets | | $ | 17,048,850 | | | $ | 163,368,218 | | | $ | 48,156,251 | | |
Shares Outstanding (unlimited shares
authorized, no par value): | | | 700,000 | | | | 3,950,000 | | | | 1,200,000 | | |
Net asset value: | | $ | 24.36 | | | $ | 41.36 | | | $ | 40.13 | | |
(a) Includes $159,667 of securities on loan.
(b) Includes $3,636,055 of securities on loan.
(c) Includes $3,272,170 of securities on loan.
See notes to financial statements.
142
Victory Portfolios II | | Statements of Assets and Liabilities
December 31, 2018 | |
(Unaudited)
| | | VictoryShares
International
High Div Volatility
Wtd ETF | | VictoryShares
Emerging Market
High Div Volatility
Wtd ETF | | VictoryShares
Dividend
Accelerator
ETF | |
ASSETS: | |
Investments, at value (Cost $49,311,755,
$19,631,059 and $10,054,281) | | $ | 42,997,470 | (a) | | $ | 17,617,154 | | | $ | 9,815,703 | (b) | |
Foreign currency, at value (Cost $17,071,
$577 and $—) | | | 17,071 | | | | 577 | | | | — | | |
Cash and cash equivalents | | | — | | | | 77,814 | | | | 11,114 | | |
Deposits with brokers for futures contracts | | | 44 | | | | 11,048 | | | | 50 | | |
Unrealized appreciation on foreign currency
spot contracts | | | — | | | | 1 | | | | — | | |
Interest and dividends receivable | | | 167,192 | | | | 53,633 | | | | 15,140 | | |
Reclaims receivable | | | 73,250 | | | | — | | | | — | | |
Receivable from Adviser | | | — | | | | 3,936 | | | | — | | |
Total Assets | | | 43,255,027 | | | | 17,764,163 | | | | 9,842,007 | | |
LIABILITIES: | |
Payables: | |
Collateral received on loaned securities | | | 1,367,356 | | | | — | | | | 148,203 | | |
Custodian | | | 792 | | | | — | | | | — | | |
Investments purchased | | | — | | | | 5,740 | | | | — | | |
Variation margin on open futures
contracts | | | — | | | | 350 | | | | — | | |
Accrued expenses and other payables: | |
Investment advisory fees | | | 10,543 | | | | — | | | | 1,031 | | |
Administration fees | | | 1,198 | | | | 404 | | | | 125 | | |
Custodian fees | | | 4,638 | | | | 6,663 | | | | — | | |
Chief Compliance Officer fees | | | 46 | | | | 19 | | | | 9 | | |
Trustees' fees | | | 6 | | | | — | | | | 99 | | |
Other accrued expenses | | | 11,089 | | | | 4,479 | | | | 5,020 | | |
Total Liabilities | | | 1,395,668 | | | | 17,655 | | | | 154,487 | | |
NET ASSETS: | |
Capital | | | 49,213,876 | | | | 21,249,594 | | | | 9,927,260 | | |
Total distributable earnings/(loss) | | | (7,354,517 | ) | | | (3,503,086 | ) | | | (239,740 | ) | |
Net Assets | | $ | 41,859,359 | | | $ | 17,746,508 | | | $ | 9,687,520 | | |
Shares Outstanding (unlimited shares
authorized, no par value): | | | 1,400,000 | | | | 800,000 | | | | 350,000 | | |
Net asset value: | | $ | 29.90 | | | $ | 22.18 | | | $ | 27.68 | | |
(a) Includes $2,166,864 of securities on loan.
(b) Includes $146,562 of securities on loan.
See notes to financial statements.
143
Victory Portfolios II | | Statements of Assets and Liabilities
December 31, 2018 | |
(Unaudited)
| | | VictoryShares
US Multi-Factor
Minimum Volatility
ETF | | VictoryShares
US 500
Enhanced Volatility
Wtd ETF | | VictoryShares
US EQ Income
Enhanced Volatility
Wtd ETF | |
ASSETS: | |
Investments, at value (Cost $28,048,882,
$1,025,088,133 and $884,483,788) | | $ | 26,550,381 | | | $ | 925,362,347 | (a) | | $ | 806,533,650 | (b) | |
Cash and cash equivalents | | | 106,148 | | | | — | | | | — | | |
Deposits with brokers for futures
contracts | | | 18,814 | | | | 57,640 | | | | 228,470 | | |
Interest and dividends receivable | | | 70,420 | | | | 1,178,093 | | | | 1,693,769 | | |
Variation margin receivable on open
futures contracts | | | 960 | | | | 4,058 | | | | 8,335 | | |
Total Assets | | | 26,746,723 | | | | 926,602,138 | | | | 808,464,224 | | |
LIABILITIES: | |
Payables: | |
Collateral received on loaned
securities | | | — | | | | 1,583,234 | | | | 1,299,559 | | |
Capital shares redeemed | | | — | | | | 19,063 | | | | 1,595 | | |
Accrued expenses and other payables: | |
Investment advisory fees | | | 7,827 | | | | 235,127 | | | | 195,562 | | |
Administration fees | | | 1,170 | | | | 27,446 | | | | 23,404 | | |
Custodian fees | | | 257 | | | | 8,984 | | | | 4,008 | | |
Chief Compliance Officer fees | | | 28 | | | | 956 | | | | 793 | | |
Trustees' fees | | | 188 | | | | 3,311 | | | | 2,747 | | |
Other accrued expenses | | | 5,873 | | | | 97,373 | | | | 73,784 | | |
Total Liabilities | | | 15,343 | | | | 1,975,494 | | | | 1,601,452 | | |
NET ASSETS: | |
Capital | | | 29,743,431 | | | | 1,014,645,354 | | | | 892,570,987 | | |
Total distributable earnings/(loss) | | | (3,012,051 | ) | | | (90,018,710 | ) | | | (85,708,215 | ) | |
Net Assets | | $ | 26,731,380 | | | $ | 924,626,644 | | | $ | 806,862,772 | | |
Shares Outstanding (unlimited shares
authorized, no par value): | | | 1,000,000 | | | | 21,050,000 | | | | 19,000,000 | | |
Net asset value: | | $ | 26.73 | | | $ | 43.93 | | | $ | 42.47 | | |
(a) Includes $1,579,110 of securities on loan.
(b) Includes $1,279,039 of securities on loan.
See notes to financial statements.
144
Victory Portfolios II | | Statements of Assets and Liabilities
December 31, 2018 | |
(Unaudited)
| | | VictoryShares
US Discovery
Enhanced Volatility
Wtd ETF | | VictoryShares
Developed
Enhanced Volatility
Wtd ETF | |
ASSETS: | |
Investments, at value (Cost $125,987,289 and $143,738,605) | | $ | 113,547,956 | (a) | | $ | 142,077,454 | (b) | |
Foreign currency, at value (Cost $— and $8,615) | | | — | | | | 8,615 | | |
Deposits with brokers for futures contracts | | | 144,973 | | | | 57,644 | | |
Interest and dividends receivable | | | 158,039 | | | | 266,369 | | |
Variation margin receivable on open futures contracts | | | 6,480 | | | | 280 | | |
Reclaims receivable | | | — | | | | 175,164 | | |
Total Assets | | | 113,857,448 | | | | 142,585,526 | | |
LIABILITIES: | |
Payables: | |
Collateral received on loaned securities | | | 1,378,389 | | | | 473,443 | | |
Accrued expenses and other payables: | |
Investment advisory fees | | | 25,208 | | | | 41,210 | | |
Administration fees | | | 3,147 | | | | 4,026 | | |
Custodian fees | | | 1,477 | | | | 18,449 | | |
Chief Compliance Officer fees | | | 115 | | | | 150 | | |
Trustees' fees | | | 111 | | | | — | | |
Other accrued expenses | | | 17,422 | | | | 23,773 | | |
Total Liabilities | | | 1,425,869 | | | | 561,051 | | |
NET ASSETS: | |
Capital | | | 133,663,534 | | | | 158,045,364 | | |
Total distributable earnings/(loss) | | | (21,231,955 | ) | | | (16,020,889 | ) | |
Net Assets | | $ | 112,431,579 | | | $ | 142,024,475 | | |
Shares Outstanding (unlimited shares authorized,
no par value): | | | 2,850,000 | | | | 4,600,000 | | |
Net asset value: | | $ | 39.45 | | | $ | 30.87 | | |
(a) Includes $1,336,147 of securities on loan.
(b) Includes $505,051 of securities on loan.
See notes to financial statements.
145
Victory Portfolios II | | Statements of Operations
For the Six Months Ended December 31, 2018 | |
(Unaudited)
| | | VictoryShares
US 500 Volatility
Wtd ETF | | VictoryShares
US Small Cap
Volatility
Wtd ETF | | VictoryShares
International
Volatility
Wtd ETF | |
Investment Income: | |
Dividends | | $ | 5,612,270 | | | $ | 341,010 | | | $ | 270,232 | | |
Interest | | | 16,274 | | | | 2,120 | | | | 821 | | |
Securities lending (net of fees) | | | 39,615 | | | | 8,414 | | | | 2,501 | | |
Foreign tax withholding | | | (423 | ) | | | — | | | | (34,791 | ) | |
Total Income | | | 5,667,736 | | | | 351,544 | | | | 238,763 | | |
Expenses: | |
Investment advisory fees | | | 951,896 | | | | 62,036 | | | | 42,338 | | |
Administration fees | | | 193,160 | | | | 12,580 | | | | 6,443 | | |
Custodian fees | | | 13,643 | | | | 1,593 | | | | 24,916 | | |
Servicing fees | | | 2,168 | | | | 2,114 | | | | 2,112 | | |
Trustees' fees | | | 23,809 | | | | 1,617 | | | | 903 | | |
Chief Compliance Officer fees | | | 2,461 | | | | 143 | | | | 87 | | |
Legal and audit fees | | | 29,886 | | | | 5,287 | | | | 4,937 | | |
Printing Fees | | | 33,823 | | | | 3,913 | | | | 1,808 | | |
Other expenses | | | 20,560 | | | | 2,218 | | | | 5,729 | | |
Total Expenses | | | 1,271,406 | | | | 91,501 | | | | 89,273 | | |
Expenses waived/reimbursed by Adviser | | | (160,728 | ) | | | (19,211 | ) | | | (41,593 | ) | |
Net Expenses | | | 1,110,678 | | | | 72,290 | | | | 47,680 | | |
Net Investment Income (Loss) | | | 4,557,058 | | | | 279,254 | | | | 191,083 | | |
Realized/Unrealized Gains (Losses) from
Investment Transactions: | |
Net realized gains (losses) from investment
transactions and foreign currency translations | | | 17,244,550 | | | | 2,444,282 | | | | 83,230 | | |
Net realized gains (losses) from futures transactions | | | (54,304 | ) | | | (18,388 | ) | | | (6,963 | ) | |
Net change in unrealized appreciation/depreciation
on investments and foreign currency translations | | | (90,844,789 | ) | | | (8,974,189 | ) | | | (2,663,133 | ) | |
Net change in unrealized appreciation/depreciation
on futures transactions | | | 68,514 | | | | (6,233 | ) | | | 54 | | |
Net realized/unrealized gains (losses) on investments | | | (73,586,029 | ) | | | (6,554,528 | ) | | | (2,586,812 | ) | |
Change in net assets resulting from operations | | $ | (69,028,971 | ) | | $ | (6,275,274 | ) | | $ | (2,395,729 | ) | |
See notes to financial statements.
146
Victory Portfolios II | | Statements of Operations
For the Six Months Ended December 31, 2018 | |
(Unaudited)
| | | VictoryShares
Emerging Market
Volatility
Wtd ETF | | VictoryShares
US Large Cap
High Div Volatility
Wtd ETF | | VictoryShares
US Small Cap
High Div Volatility
Wtd ETF | |
Investment Income: | |
Dividends | | $ | 308,918 | | | $ | 2,770,800 | | | $ | 857,402 | | |
Interest | | | 1,041 | | | | 6,311 | | | | 3,011 | | |
Securities lending (net of fees) | | | 2,328 | | | | 4,494 | | | | 18,752 | | |
Foreign tax withholding | | | (39,854 | ) | | | — | | | | — | | |
Total Income | | | 272,433 | | | | 2,781,605 | | | | 879,165 | | |
Expenses: | |
Investment advisory fees | | | 41,816 | | | | 229,052 | | | | 74,969 | | |
Administration fees | | | 5,656 | | | | 46,491 | | | | 15,215 | | |
Custodian fees | | | 63,205 | | | | 4,743 | | | | 1,730 | | |
Servicing fees | | | 2,120 | | | | 2,122 | | | | 2,122 | | |
Trustees' fees | | | 870 | | | | 5,955 | | | | 1,968 | | |
Chief Compliance Officer fees | | | 61 | | | | 608 | | | | 186 | | |
Legal and audit fees | | | 19,125 | | | | 9,010 | | | | 5,502 | | |
Printing Fees | | | 2,771 | | | | 12,501 | | | | 4,171 | | |
Other expenses | | | 7,070 | | | | 3,165 | | | | 1,803 | | |
Total Expenses | | | 142,694 | | | | 313,647 | | | | 107,666 | | |
Expenses waived/reimbursed
by Adviser | | | (96,259 | ) | | | (46,246 | ) | | | (20,160 | ) | |
Net Expenses | | | 46,435 | | | | 267,401 | | | | 87,506 | | |
Net Investment Income (Loss) | | | 225,998 | | | | 2,514,204 | | | | 791,659 | | |
Realized/Unrealized Gains (Losses) from
Investment Transactions: | |
Net realized gains (losses) from investment
transactions | | | (235,272 | ) | | | 6,106,679 | | | | 3,086,966 | | |
Net realized gains (losses) from futures
transactions | | | (22,394 | ) | | | (58,153 | ) | | | (62,854 | ) | |
Net change in unrealized appreciation/
depreciation on investments | | | (651,424 | ) | | | (19,168,648 | ) | | | (9,952,835 | ) | |
Net change in unrealized appreciation/
depreciation on futures transactions | | | 7,316 | | | | (47 | ) | | | (12,153 | ) | |
Net realized/unrealized gains (losses) on
investments | | | (901,774 | ) | | | (13,120,169 | ) | | | (6,940,876 | ) | |
Change in net assets resulting from
operations | | $ | (675,776 | ) | | $ | (10,605,965 | ) | | $ | (6,149,217 | ) | |
See notes to financial statements.
147
Victory Portfolios II | | Statements of Operations
For the Six Months Ended December 31, 2018 | |
(Unaudited)
| | | VictoryShares
International
High Div Volatility
Wtd ETF | | VictoryShares
Emerging Market
High Div Volatility
Wtd ETF | | VictoryShares
Dividend
Accelerator
ETF | |
Investment Income: | |
Dividends | | $ | 1,072,641 | | | $ | 712,420 | | | $ | 80,471 | | |
Interest | | | 1,810 | | | | 1,125 | | | | 143 | | |
Securities lending (net of fees) | | | 11,612 | | | | 888 | | | | 132 | | |
Foreign tax withholding | | | (168,211 | ) | | | (85,064 | ) | | | — | | |
Total Income | | | 917,852 | | | | 629,369 | | | | 80,746 | | |
Expenses: | |
Investment advisory fees | | | 90,375 | | | | 47,296 | | | | 11,899 | | |
Administration fees | | | 13,751 | | | | 6,396 | | | | 2,417 | | |
Custodian fees | | | 10,307 | | | | 31,961 | | | | 1,538 | | |
Servicing fees | | | 2,122 | | | | 2,494 | | | | 2,061 | | |
Trustees' fees | | | 1,868 | | | | 827 | | | | 232 | | |
Chief Compliance Officer fees | | | 185 | | | | 81 | | | | 32 | | |
Legal and audit fees | | | 6,008 | | | | 6,979 | | | | 3,886 | | |
Printing Fees | | | 3,991 | | | | 1,909 | | | | 469 | | |
Other expenses | | | 2,862 | | | | 1,718 | | | | 763 | | |
Total Expenses | | | 131,469 | | | | 99,661 | | | | 23,297 | | |
Expenses waived/reimbursed by Adviser | | | (29,848 | ) | | | (47,163 | ) | | | (9,390 | ) | |
Net Expenses | | | 101,621 | | | | 52,498 | | | | 13,907 | | |
Net Investment Income (Loss) | | | 816,231 | | | | 576,871 | | | | 66,839 | | |
Realized/Unrealized Gains (Losses) from
Investment Transactions: | |
Net realized gains (losses) from investment
transactions | | | (139,303 | ) | | | (1,529,612 | ) | | | 218,799 | | |
Net realized gains (losses) from futures
transactions | | | (65,924 | ) | | | (20,688 | ) | | | — | | |
Net change in unrealized appreciation/
depreciation on investments | | | (5,245,335 | ) | | | 110,650 | | | | (592,371 | ) | |
Net change in unrealized appreciation/
depreciation on futures transactions | | | 4,857 | | | | (414 | ) | | | — | | |
Net realized/unrealized gains (losses) on
investments | | | (5,445,705 | ) | | | (1,440,064 | ) | | | (373,572 | ) | |
Change in net assets resulting from operations | | $ | (4,629,474 | ) | | $ | (863,193 | ) | | $ | (306,733 | ) | |
See notes to financial statements.
148
Victory Portfolios II | | Statements of Operations
For the Six Months Ended December 31, 2018 | |
(Unaudited)
| | | VictoryShares
US Multi-Factor
Minimum Volatility
ETF | | VictoryShares
US 500
Enhanced Volatility
Wtd ETF | | VictoryShares
US EQ Income
Enhanced Volatility
Wtd ETF | |
Investment Income: | |
Dividends | | $ | 321,518 | | | $ | 9,402,916 | | | $ | 15,010,396 | | |
Interest | | | 533 | | | | 2,046 | | | | 2,781 | | |
Securities lending (net of fees) | | | 683 | | | | 56,948 | | | | 36,563 | | |
Foreign tax withholding | | | — | | | | (747 | ) | | | — | | |
Total Income | | | 322,734 | | | | 9,461,163 | | | | 15,049,740 | | |
Expenses: | |
Investment advisory fees | | | 31,000 | | | | 1,594,791 | | | | 1,235,598 | | |
Administration fees | | | 6,331 | | | | 323,584 | | | | 250,798 | | |
Custodian fees | | | 1,005 | | | | 24,025 | | | | 21,226 | | |
Servicing fees | | | 2,027 | | | | 2,168 | | | | 2,170 | | |
Trustees' fees | | | 529 | | | | 39,854 | | | | 31,027 | | |
Chief Compliance Officer fees | | | 58 | | | | 4,103 | | | | 3,196 | | |
Legal and audit fees | | | 3,947 | | | | 46,948 | | | | 37,820 | | |
Printing Fees | | | 755 | | | | 49,583 | | | | 36,906 | | |
Other expenses | | | 1,348 | | | | 34,170 | | | | 22,581 | | |
Total Expenses | | | 47,000 | | | | 2,119,226 | | | | 1,641,322 | | |
Expenses waived/reimbursed
by Adviser | | | (10,660 | ) | | | (258,981 | ) | | | (199,184 | ) | |
Net Expenses | | | 36,340 | | | | 1,860,245 | | | | 1,442,138 | | |
Net Investment Income (Loss) | | | 286,394 | | | | 7,600,918 | | | | 13,607,602 | | |
Realized/Unrealized Gains (Losses) from
Investment Transactions: | |
Net realized gains (losses) from investment
transactions | | | (1,358,197 | ) | | | 30,172,892 | | | | 24,303,809 | | |
Net realized gains (losses) from futures
transactions | | | (10,707 | ) | | | (82,704 | ) | | | (279,285 | ) | |
Net change in unrealized appreciation/
depreciation on investments | | | (1,671,812 | ) | | | (156,223,058 | ) | | | (97,264,240 | ) | |
Net change in unrealized appreciation/
depreciation on futures transactions | | | 1,431 | | | | 111,593 | | | | 49,549 | | |
Net realized/unrealized gains (losses) on
investments | | | (3,039,285 | ) | | | (126,021,277 | ) | | | (73,190,167 | ) | |
Change in net assets resulting from
operations | | $ | (2,752,891 | ) | | $ | (118,420,359 | ) | | $ | (59,582,565 | ) | |
(a) Rounds to less than $1.
See notes to financial statements.
149
Victory Portfolios II | | Statements of Operations
For the Six Months Ended December 31, 2018 | |
(Unaudited)
| | | VictoryShares
US Discovery
Enhanced Volatility
Wtd ETF | | VictoryShares
Developed
Enhanced Volatility
Wtd ETF | |
Investment Income: | |
Dividends | | $ | 969,864 | | | $ | 1,973,594 | | |
Interest | | | 636 | | | | 271 | | |
Securities lending (net of fees) | | | 24,574 | | | | 17,407 | | |
Foreign tax withholding | | | — | | | | (193,495 | ) | |
Total Income | | | 995,074 | | | | 1,797,777 | | |
Expenses: | |
Investment advisory fees | | | 185,788 | | | | 333,697 | | |
Administration fees | | | 37,694 | | | | 50,755 | | |
Custodian fees | | | 3,278 | | | | 37,525 | | |
Servicing fees | | | 2,122 | | | | 2,122 | | |
Trustees' fees | | | 4,729 | | | | 6,794 | | |
Chief Compliance Officer fees | | | 480 | | | | 682 | | |
Legal and audit fees | | | 8,639 | | | | 10,985 | | |
Printing Fees | | | 9,210 | | | | 11,479 | | |
Other expenses | | | 4,114 | | | | 9,218 | | |
Total Expenses | | | 256,054 | | | | 463,257 | | |
Expenses waived/reimbursed by Adviser | | | (39,344 | ) | | | (88,309 | ) | |
Net Expenses | | | 216,710 | | | | 374,948 | | |
Net Investment Income (Loss) | | | 778,364 | | | | 1,422,829 | | |
Realized/Unrealized Gains (Losses) from Investment
Transactions: | |
Net realized gains (losses) from investment transactions and
foreign currency translations | | | 300,439 | | | | (8,250,385 | ) | |
Net realized gains (losses) from futures transactions | | | (56,276 | ) | | | (125,613 | ) | |
Net change in unrealized appreciation/depreciation on
investments and foreign currency translations | | | (22,532,792 | ) | | | (5,969,015 | ) | |
Net change in unrealized appreciation/depreciation on
futures transactions | | | (26,105 | ) | | | (3,170 | ) | |
Net realized/unrealized gains (losses) on investments | | | (22,314,734 | ) | | | (14,348,183 | ) | |
Change in net assets resulting from operations | | $ | (21,536,370 | ) | | $ | (12,925,354 | ) | |
See notes to financial statements.
150
Victory Portfolios II | | Statements of Changes in Net Assets | |
| | | VictoryShares
US 500 Volatility
Wtd ETF | | VictoryShares
US Small Cap
Volatility Wtd ETF | | VictoryShares International
Volatility Wtd ETF | |
| | | Six
Months
Ended
December 31,
2018 | | Year
Ended
June 30,
2018 | | Six
Months
Ended
December 31,
2018 | | Year
Ended
June 30,
2018 | | Six
Months
Ended
December 31,
2018 | | Year
Ended
June 30,
2018 | |
| | | (Unaudited) | | | | (Unaudited) | | | | (Unaudited) | | | |
From Investment Activities: | |
Operations: | |
Net investment
income (loss) | | $ | 4,557,058 | | | $ | 5,705,606 | | | $ | 279,254 | | | $ | 352,570 | | | $ | 191,083 | | | $ | 478,765 | | |
Net realized gains (losses)
from investment
transactions | | | 17,190,246 | | | | 24,992,063 | | | | 2,425,894 | | | | 3,253,519 | | | | 76,267 | | | | 659,926 | | |
Net change in unrealized
appreciation/
depreciation
on investments | | | (90,776,275 | ) | | | 18,418,955 | | | | (8,980,422 | ) | | | 1,088,968 | | | | (2,663,079 | ) | | | (248,818 | ) | |
Change in net assets resulting
from operations | | | (69,028,971 | ) | | | 49,116,624 | | | | (6,275,274 | ) | | | 4,695,057 | | | | (2,395,729 | ) | | | 889,873 | | |
Distributions to Shareholders: (a) | |
Change in net assets resulting
from distributions to
shareholders | | | (5,005,900 | ) | | | (5,493,806 | ) | | | (299,888 | ) | | | (350,537 | ) | | | (248,952 | ) | | | (470,597 | ) | |
Change in net assets resulting
from capital transactions | | | 93,571,817 | | | | 230,826,334 | | | | (2,114,357 | ) | | | 11,477,938 | | | | 6,808,770 | | | | 8,057,297 | | |
Change in net assets | | | 19,536,946 | | | | 274,449,152 | | | | (8,689,519 | ) | | | 15,822,458 | | | | 4,164,089 | | | | 8,476,573 | | |
Net Assets: | |
Beginning of period | | | 567,370,355 | | | | 292,921,203 | | | | 41,260,738 | | | | 25,438,280 | | | | 21,497,414 | | | | 13,020,841 | | |
End of period | | $ | 586,907,301 | | | $ | 567,370,355 | | | $ | 32,571,219 | | | $ | 41,260,738 | | | $ | 25,661,503 | | | $ | 21,497,414 | | |
Capital Transactions: | |
Proceeds from shares
issued | | | 206,668,279 | | | | 382,162,595 | | | | 17,161,712 | | | | 34,043,827 | | | | 6,808,770 | | | | 12,040,236 | | |
Cost of shares redeemed | | | (113,096,462 | ) | | | (151,336,261 | ) | | | (19,276,069 | ) | | | (22,565,889 | ) | | | — | | | | (3,982,939 | ) | |
Change in net assets resulting
from capital transactions | | | 93,571,817 | | | | 230,826,334 | | | | (2,114,357 | ) | | | 11,477,938 | | | | 6,808,770 | | | | 8,057,297 | | |
Share Transactions: | |
Issued | | | 4,100,000 | | | | 7,950,000 | | | | 350,000 | | | | 750,000 | | | | 200,000 | | | | 300,000 | | |
Redeemed | | | (2,250,000 | ) | | | (3,100,000 | ) | | | (400,000 | ) | | | (500,000 | ) | | | — | | | | (100,000 | ) | |
Change in Shares | | | 1,850,000 | | | | 4,850,000 | | | | (50,000 | ) | | | 250,000 | | | | 200,000 | | | | 200,000 | | |
(a) Current and prior year distributions to shareholders have been reclassified and conform to amended GAAP presentation under Regulation S-X (See Item 10 in the Notes to Financial Statements).
See notes to financial statements.
151
Victory Portfolios II | | Statements of Changes in Net Assets | |
| | | VictoryShares
Emerging Market
Volatility Wtd ETF | | VictoryShares
US Large Cap High Div
Volatility Wtd ETF | | VictoryShares
US Small Cap High Div
Volatility Wtd ETF | |
| | | Six
Months
Ended
December 31,
2018 | | Year
Ended
June 30,
2018 | | Six
Months
Ended
December 31,
2018 | | Year
Ended
June 30,
2018 | | Six
Months
Ended
December 31,
2018 | | Year
Ended
June 30,
2018 | |
| | | (Unaudited) | | | | (Unaudited) | | | | (Unaudited) | | | |
From Investment Activities: | |
Operations: | |
Net investment
income (loss) | | $ | 225,998 | | | $ | 606,309 | | | $ | 2,514,204 | | | $ | 4,193,272 | | | $ | 791,659 | | | $ | 1,386,793 | | |
Net realized gains
(losses) from
investment
transactions | | | (257,666 | ) | | | 3,424,454 | | | | 6,048,526 | | | | 8,645,786 | | | | 3,024,112 | | | | 3,481,128 | | |
Net change in
unrealized
appreciation/
depreciation
on investments | | | (644,108 | ) | | | (1,912,020 | ) | | | (19,168,695 | ) | | | 525,911 | | | | (9,964,988 | ) | | | 1,836,675 | | |
Change in net assets resulting
from operations | | | (675,776 | ) | | | 2,118,743 | | | | (10,605,965 | ) | | | 13,364,969 | | | | (6,149,217 | ) | | | 6,704,596 | | |
Distributions to Shareholders: (a) | |
Change in net assets resulting
from distributions to
shareholders | | | (1,224,866 | ) | | | (1,624,922 | ) | | | (2,636,314 | ) | | | (4,292,079 | ) | | | (805,083 | ) | | | (1,457,987 | ) | |
Change in net assets resulting
from capital transactions | | | — | | | | (14,936,943 | ) | | | 32,423,213 | | | | 14,933,024 | | | | 11,445,540 | | | | 6,093,407 | | |
Change in net assets | | | (1,900,642 | ) | | | (14,443,122 | ) | | | 19,180,934 | | | | 24,005,914 | | | | 4,491,240 | | | | 11,340,016 | | |
Net Assets: | |
Beginning of period | | | 18,949,492 | | | | 33,392,614 | | | | 144,187,284 | | | | 120,181,370 | | | | 43,665,011 | | | | 32,324,995 | | |
End of period | | $ | 17,048,850 | | | $ | 18,949,492 | | | $ | 163,368,218 | | | $ | 144,187,284 | | | $ | 48,156,251 | | | $ | 43,665,011 | | |
Capital Transactions: | |
Proceeds from shares
issued | | | — | | | | 3,024,918 | | | | 83,268,052 | | | | 105,456,748 | | | | 33,061,648 | | | | 42,447,183 | | |
Cost of shares redeemed | | | — | | | | (17,961,861 | ) | | | (50,844,838 | ) | | | (90,523,724 | ) | | | (21,616,108 | ) | | | (36,353,776 | ) | |
Change in net assets resulting
from capital transactions | | | — | | | | (14,936,943 | ) | | | 32,423,214 | | | | 14,933,024 | | | | 11,445,540 | | | | 6,093,407 | | |
Share Transactions: | |
Issued | | | — | | | | 100,000 | | | | 1,850,000 | | | | 2,400,000 | | | | 700,000 | | | | 1,000,000 | | |
Redeemed | | | — | | | | (600,000 | ) | | | (1,100,000 | ) | | | (2,050,000 | ) | | | (450,000 | ) | | | (850,000 | ) | |
Change in Shares | | | — | | | | (500,000 | ) | | | 750,000 | | | | 350,000 | | | | 250,000 | | | | 150,000 | | |
(a) Current and prior year distributions to shareholders have been reclassified and conform to amended GAAP presentation under Regulation S-X (See Item 10 in the Notes to Financial Statements).
See notes to financial statements.
152
Victory Portfolios II | | Statements of Changes in Net Assets | |
| | | VictoryShares
International High Div
Volatility Wtd ETF | | VictoryShares
Emerging Market
High Div Volatility
Wtd ETF | | VictoryShares
Dividend
Accelerator ETF | |
| | | Six
Months
Ended
December 31,
2018 | | Year
Ended
June 30,
2018 | | Six
Months
Ended
December 31,
2018 | | For the
Period
October 25,
2017
through
June 30,
2018 | | Six
Months
Ended
December 31,
2018 | | Year
Ended
June 30,
2018 | |
| | | (Unaudited) | | | | (Unaudited) | | | | (Unaudited) | | | |
From Investment Activities: | |
Operations: | |
Net investment
income (loss) | | $ | 816,231 | | | $ | 1,675,655 | | | $ | 576,871 | | | $ | 410,601 | | | $ | 66,839 | | | $ | 120,160 | | |
Net realized gains
(losses) from
investment
transactions | | | (205,227 | ) | | | 1,539,234 | | | | (1,550,300 | ) | | | 120,539 | | | | 218,799 | | | | 319,823 | | |
Net change in
unrealized
appreciation/
depreciation
on investments | | | (5,240,478 | ) | | | (2,576,324 | ) | | | 110,236 | | | | (2,125,137 | ) | | | (592,371 | ) | | | 284,045 | | |
Change in net assets resulting
from operations | | | (4,629,474 | ) | | | 638,565 | | | | (863,193 | ) | | | (1,593,997 | ) | | | (306,733 | ) | | | 724,028 | | |
Distributions to Shareholders: (a) | |
Change in net assets resulting
from distributions to
shareholders | | | (966,296 | ) | | | (1,619,642 | ) | | | (710,958 | ) | | | (334,938 | ) | | | (75,074 | ) | | | (116,651 | ) | |
Change in net assets resulting
from capital transactions | | | 1,631,147 | | | | 14,263,656 | | | | (2,211,771 | ) | | | 23,461,365 | | | | 2,967,466 | | | | 2,601,811 | | |
Change in net assets | | | (3,964,623 | ) | | | 13,282,579 | | | | (3,785,922 | ) | | | 21,532,430 | | | | 2,585,659 | | | | 3,209,188 | | |
Net Assets: | |
Beginning of period | | | 45,823,982 | | | | 32,541,403 | | | | 21,532,430 | | | | — | | | | 7,101,861 | | | | 3,892,673 | | |
End of period | | $ | 41,859,359 | | | $ | 45,823,982 | | | $ | 17,746,508 | | | $ | 21,532,430 | | | $ | 9,687,520 | | | $ | 7,101,861 | | |
Capital Transactions: | |
Proceeds from shares
issued | | | 1,631,147 | | | | 26,698,800 | | | | 1,131,917 | | | | 23,461,365 | | | | 4,436,938 | | | | 6,794,590 | | |
Cost of shares redeemed | | | — | | | | (12,435,144 | ) | | | (3,343,688 | ) | | | — | | | | (1,469,472 | ) | | | (4,192,779 | ) | |
Change in net assets resulting
from capital transactions | | | 1,631,147 | | | | 14,263,656 | | | | (2,211,771 | ) | | | 23,461,365 | | | | 2,967,466 | | | | 2,601,811 | | |
Share Transactions: | |
Issued | | | 50,000 | | | | 750,000 | | | | 50,000 | | | | 900,000 | | | | 150,000 | | | | 250,000 | | |
Redeemed | | | — | | | | (350,000 | ) | | | (150,000 | ) | | | — | | | | (50,000 | ) | | | (150,000 | ) | |
Change in Shares | | | 50,000 | | | | 400,000 | | | | (100,000 | ) | | | 900,000 | | | | 100,000 | | | | 100,000 | | |
(a) Current and prior year distributions to shareholders have been reclassified and conform to amended GAAP presentation under Regulation S-X (See Item 10 in the Notes to Financial Statements).
See notes to financial statements.
153
Victory Portfolios II | | Statements of Changes in Net Assets | |
| | | VictoryShares
US Multi-Factor
Minimum
Volatility ETF | | VictoryShares
US 500
Enhanced Volatility
Wtd ETF | | VictoryShares
US EQ Income Enhanced
Volatility Wtd ETF | |
| | | Six
Months
Ended
December 31,
2018 | | Year
Ended
June 30,
2018 | | Six
Months
Ended
December 31,
2018 | | Year
Ended
June 30,
2018 | | Six
Months
Ended
December 31,
2018 | | Year
Ended
June 30,
2018 | |
| | | (Unaudited) | | | | (Unaudited) | | | | (Unaudited) | | | |
From Investment Activities: | |
Operations: | |
Net investment
income (loss) | | $ | 286,394 | | | $ | 109,618 | | | $ | 7,600,918 | | | $ | 8,989,753 | | | $ | 13,607,602 | | | $ | 18,850,437 | | |
Net realized gains
(losses) from
investment
transactions | | | (1,368,904 | ) | | | 126,449 | | | | 30,090,188 | | | | 41,515,455 | | | | 24,024,524 | | | | 36,578,511 | | |
Net change in
unrealized
appreciation/
depreciation
on investments | | | (1,670,381 | ) | | | 188,786 | | | | (156,111,465 | ) | | | 20,477,654 | | | | (97,214,691 | ) | | | 269,683 | | |
Change in net assets resulting
from operations | | | (2,752,891 | ) | | | 424,853 | | | | (118,420,359 | ) | | | 70,982,862 | | | | (59,582,565 | ) | | | 55,698,631 | | |
Distributions to Shareholders: (a) | |
Change in net assets resulting
from distributions to
shareholders | | | (315,420 | ) | | | (98,884 | ) | | | (8,406,401 | ) | | | (8,545,250 | ) | | | (14,441,645 | ) | | | (18,927,936 | ) | |
Change in net assets resulting
from capital transactions | | | 21,526,218 | | | | 5,464,103 | | | | 100,042,346 | | | | 473,126,725 | | | | 142,626,900 | | | | 229,562,322 | | |
Change in net assets | | | 18,457,907 | | | | 5,790,072 | | | | (26,784,414 | ) | | | 535,564,337 | | | | 68,602,690 | | | | 266,333,017 | | |
Net Assets: | |
Beginning of period | | | 8,273,473 | | | | 2,483,401 | | | | 951,411,058 | | | | 415,846,721 | | | | 738,260,082 | | | | 471,927,065 | | |
End of period | | $ | 26,731,380 | | | $ | 8,273,473 | | | $ | 924,626,644 | | | $ | 951,411,058 | | | $ | 806,862,772 | | | $ | 738,260,082 | | |
Capital Transactions: | |
Proceeds from shares
issued | | | 47,491,894 | | | | 8,142,957 | | | | 327,768,382 | | | | 705,160,890 | | | | 341,726,153 | | | | 645,087,685 | | |
Cost of shares redeemed | | | (25,965,676 | ) | | | (2,678,854 | ) | | | (227,726,036 | ) | | | (232,034,165 | ) | | | (199,099,253 | ) | | | (415,525,363 | ) | |
Change in net assets resulting
from capital transactions | | | 21,526,218 | | | | 5,464,103 | | | | 100,042,346 | | | | 473,126,725 | | | | 142,626,900 | | | | 229,562,322 | | |
Share Transactions: | |
Issued | | | 1,650,000 | | | | 300,000 | | | | 6,400,000 | | | | 14,600,000 | | | | 7,200,000 | | | | 14,250,000 | | |
Redeemed | | | (950,000 | ) | | | (100,000 | ) | | | (4,650,000 | ) | | | (4,750,000 | ) | | | (4,150,000 | ) | | | (9,200,000 | ) | |
Change in Shares | | | 700,000 | | | | 200,000 | | | | 1,750,000 | | | | 9,850,000 | | | | 3,050,000 | | | | 5,050,000 | | |
(a) Current and prior year distributions to shareholders have been reclassified and conform to amended GAAP presentation under Regulation S-X (See Item 10 in the Notes to Financial Statements).
See notes to financial statements.
154
Victory Portfolios II | | Statements of Changes in Net Assets | |
| | | VictoryShares
US Discovery
Enhanced Volatility
Wtd ETF | | VictoryShares
Developed Enhanced
Volatility Wtd ETF | |
| | | Six
Months
Ended
December 31,
2018 | | Year
Ended
June 30,
2018 | | Six
Months
Ended
December 31,
2018 | | Year
Ended
June 30,
2018 | |
| | | (Unaudited) | | | | (Unaudited) | | | |
From Investment Activities: | |
Operations: | |
Net investment income (loss) | | $ | 778,364 | | | $ | 937,200 | | | $ | 1,422,829 | | | $ | 3,753,566 | | |
Net realized gains (losses)
from investment
transactions | | | 244,163 | | | | 6,030,929 | | | | (8,375,998 | ) | | | 3,995,306 | | |
Net change in unrealized
appreciation/depreciation
on investments | | | (22,558,897 | ) | | | 5,475,692 | | | | (5,972,185 | ) | | | (2,480,069 | ) | |
Change in net assets
resulting from operations | | | (21,536,370 | ) | | | 12,443,821 | | | | (12,925,354 | ) | | | 5,268,803 | | |
Distributions to Shareholders: (a) | |
Change in net assets resulting
from distributions
to shareholders | | | (827,749 | ) | | | (914,103 | ) | | | (1,888,822 | ) | | | (3,545,391 | ) | |
Change in net assets resulting
from capital transactions | | | 18,638,502 | | | | 46,656,676 | | | | (22,264,645 | ) | | | 95,229,946 | | |
Change in net assets | | | (3,725,617 | ) | | | 58,186,394 | | | | (37,078,821 | ) | | | 96,953,358 | | |
Net Assets: | |
Beginning of period | | | 116,157,196 | | | | 57,970,802 | | | | 179,103,296 | | | | 82,149,938 | | |
End of period | | $ | 112,431,579 | | | $ | 116,157,196 | | | $ | 142,024,475 | | | $ | 179,103,296 | | |
Capital Transactions: | |
Proceeds from shares issued | | | 57,276,423 | | | | 86,697,217 | | | | 1,668,844 | | | | 112,807,667 | | |
Cost of shares redeemed | | | (38,637,921 | ) | | | (40,040,541 | ) | | | (23,933,489 | ) | | | (17,577,721 | ) | |
Change in net assets resulting
from capital transactions | | | 18,638,502 | | | | 46,656,676 | | | | (22,264,645 | ) | | | 95,229,946 | | |
Share Transactions: | |
Issued | | | 1,200,000 | | | | 1,950,000 | | | | 50,000 | | | | 3,250,000 | | |
Redeemed | | | (800,000 | ) | | | (900,000 | ) | | | (750,000 | ) | | | (500,000 | ) | |
Change in Shares | | | 400,000 | | | | 1,050,000 | | | | (700,000 | ) | | | 2,750,000 | | |
(a) Current and prior year distributions to shareholders have been reclassified and conform to amended GAAP presentation under Regulation S-X (See Item 10 in the Notes to Financial Statements).
See notes to financial statements.
155
Victory Portfolios II | | Financial Highlights | |
For a Share Outstanding Throughout Each Period
| | | VictoryShares US 500 Volatility Wtd ETF | |
| | | Six
Months
Ended
December 31,
2018 | | Year
Ended
June 30,
2018 | | Year
Ended
June 30,
2017 | | Year
Ended
June 30,
2016 | | Period
Ended
June 30,
2015(a) | |
| | | (Unaudited) | | | | | | | | | |
Net Asset Value, Beginning of Period | | $ | 49.34 | | | $ | 44.05 | | | $ | 37.24 | | | $ | 36.78 | | | $ | 35.00 | | |
Investment Activities: | |
Net investment income (loss) (b) | | | 0.36 | | | | 0.63 | | | | 0.60 | | | | 0.57 | | | | 0.49 | | |
Net realized and unrealized gains
(losses) on investments | | | (5.35 | ) | | | 5.26 | | | | 6.71 | | | | 0.42 | | | | 1.73 | | |
Total from Investment Activities | | | (4.99 | ) | | | 5.89 | | | | 7.31 | | | | 0.99 | | | | 2.22 | | |
Distributions to Shareholders: | |
Net investment income | | | (0.39 | ) | | | (0.60 | ) | | | (0.50 | ) | | | (0.51 | ) | | | (0.44 | ) | |
Net realized gains from investments | | | — | | | | — | | | | — | | | | (0.02 | ) | | | — | | |
Total Distributions to Shareholders | | | (0.39 | ) | | | (0.60 | ) | | | (0.50 | ) | | | (0.53 | ) | | | (0.44 | ) | |
Net Asset Value, End of Period | | $ | 43.96 | | | $ | 49.34 | | | $ | 44.05 | | | $ | 37.24 | | | $ | 36.78 | | |
Total Return (c) | | | (10.17 | )% | | | 13.42 | % | | | 19.72 | % | | | 2.78 | % | | | 6.38 | % | |
Ratios/Supplemental Data: | �� |
Net Assets at end of period (000) | | $ | 586,907 | | | $ | 567,370 | | | $ | 292,921 | | | $ | 44,689 | | | $ | 9,194 | | |
Ratio of net expenses to average net assets (d) | | | 0.35 | % | | | 0.35 | % | | | 0.35 | % | | | 0.35 | % | | | 0.54 | % | |
Ratio of net investment income (loss) to average
net assets (d) | | | 1.44 | % | | | 1.32 | % | | | 1.43 | % | | | 1.59 | % | | | 1.37 | % | |
Ratio of gross expenses to average
net assets (d) (e) | | | 0.40 | % | | | 0.41 | % | | | 0.47 | % | | | 0.74 | % | | | 1.39 | % | |
Portfolio turnover (c) (f) | | | 16 | % | | | 36 | % | | | 26 | % | | | 31 | % | | | 23 | % | |
(a) The Fund commenced operations on July 1, 2014.
(b) Per share net investment income (loss) has been calculated using the average daily shares method.
(c) Not annualized for periods less than one year.
(d) Annualized for periods less than one year.
(e) During the period, certain fees were reduced and/or reimbursed. If such fee reductions and/or reimbursements had not occurred, the ratios would have been as indicated.
(f) Excludes impact of in-kind transactions.
See notes to financial statements.
156
Victory Portfolios II | | Financial Highlights | |
For a Share Outstanding Throughout Each Period
| | | VictoryShares US Small Cap Volatility Wtd ETF | |
| | | Six
Months
Ended
December 31,
2018 | | Year
Ended
June 30,
2018 | | Year
Ended
June 30,
2017 | | Period
Ended
June 30,
2016(a) | |
| | | (Unaudited) | | | | | | | |
Net Asset Value, Beginning of Period | | $ | 48.54 | | | $ | 42.40 | | | $ | 34.35 | | | $ | 35.00 | | |
Investment Activities: | |
Net investment income (loss) (b) | | | 0.32 | | | | 0.50 | | | | 0.50 | | | | 0.41 | | |
Net realized and unrealized gains
(losses) on investments | | | (7.79 | ) | | | 6.14 | | | | 8.01 | | | | (0.72 | ) | |
Total from Investment Activities | | | (7.47 | ) | | | 6.64 | | | | 8.51 | | | | (0.31 | ) | |
Distributions to Shareholders: | |
Net investment income | | | (0.36 | ) | | | (0.50 | ) | | | (0.46 | ) | | | (0.34 | ) | |
Total Distributions to Shareholders | | | (0.36 | ) | | | (0.50 | ) | | | (0.46 | ) | | | (0.34 | ) | |
Net Asset Value, End of Period | | $ | 40.71 | | | $ | 48.54 | | | $ | 42.40 | | | $ | 34.35 | | |
Total Return (c) | | | (15.44 | )% | | | 15.75 | % | | | 24.86 | % | | | (0.86 | )% | |
Ratios/Supplemental Data: | |
Net Assets at end of period (000) | | $ | 32,571 | | | $ | 41,261 | | | $ | 25,438 | | | $ | 10,304 | | |
Ratio of net expenses to average
net assets (d) | | | 0.35 | % | | | 0.35 | % | | | 0.35 | % | | | 0.35 | % | |
Ratio of net investment income (loss)
to average net assets (d) | | | 1.35 | % | | | 1.10 | % | | | 1.25 | % | | | 1.28 | % | |
Ratio of gross expenses to average
net assets (d) (e) | | | 0.44 | % | | | 0.47 | % | | | 0.68 | % | | | 1.44 | % | |
Portfolio turnover (c) (f) | | | 29 | % | | | 47 | % | | | 47 | % | | | 50 | % | |
(a) The Fund commenced operations on July 7, 2015.
(b) Per share net investment income (loss) has been calculated using the average daily shares method.
(c) Not annualized for periods less than one year.
(d) Annualized for periods less than one year.
(e) During the period, certain fees were reduced and/or reimbursed. If such fee reductions and/or reimbursements had not occurred, the ratios would have been as indicated.
(f) Excludes impact of in-kind transactions.
See notes to financial statements.
157
Victory Portfolios II | | Financial Highlights | |
For a Share Outstanding Throughout Each Period
| | | VictoryShares International Volatility Wtd ETF | |
| | | Six
Months
Ended
December 31,
2018 | | Year
Ended
June 30,
2018 | | Year
Ended
June 30,
2017 | | Period
Ended
June 30,
2016(a) | |
| | | (Unaudited) | | | | | | | |
Net Asset Value, Beginning of Period | | $ | 39.09 | | | $ | 37.20 | | | $ | 32.11 | | | $ | 35.00 | | |
Investment Activities: | |
Net investment income (loss) (b) | | | 0.34 | | | | 1.04 | | | | 0.76 | | | | 0.85 | | |
Net realized and unrealized gains
(losses) on investments | | | (4.76 | ) | | | 1.81 | | | | 5.10 | | | | (3.15 | ) | |
Total from Investment Activities | | | (4.42 | ) | | | 2.85 | | | | 5.86 | | | | (2.30 | ) | |
Distributions to Shareholders: | |
Net investment income | | | (0.45 | ) | | | (0.96 | ) | | | (0.77 | ) | | | (0.59 | ) | |
Total Distributions to Shareholders | | | (0.45 | ) | | | (0.96 | ) | | | (0.77 | ) | | | (0.59 | ) | |
Net Asset Value, End of Period | | $ | 34.22 | | | $ | 39.09 | | | $ | 37.20 | | | $ | 32.11 | | |
Total Return (c) | | | (11.41 | )% | | | 7.62 | % | | | 18.44 | % | | | (6.58 | )% | |
Ratios/Supplemental Data: | |
Net Assets at end of period (000) | | $ | 25,662 | | | $ | 21,497 | | | $ | 13,021 | | | $ | 12,844 | | |
Ratio of net expenses to average
net assets (d) | | | 0.45 | % | | | 0.45 | % | | | 0.45 | % | | | 0.45 | % | |
Ratio of net investment income (loss)
to average net assets (d) | | | 1.80 | % | | | 2.61 | % | | | 2.25 | % | | | 2.99 | % | |
Ratio of gross expenses to average
net assets (d) (e) | | | 0.84 | % | | | 0.98 | % | | | 1.54 | % | | | 2.31 | % | |
Portfolio turnover (c) (f) | | | 28 | % | | | 37 | % | | | 46 | % | | | 31 | % | |
(a) The Fund commenced operations on August 19, 2015.
(b) Per share net investment income (loss) has been calculated using the average daily shares method.
(c) Not annualized for periods less than one year.
(d) Annualized for periods less than one year.
(e) During the period, certain fees were reduced and/or reimbursed. If such fee reductions and/or reimbursements had not occurred, the ratios would have been as indicated.
(f) Excludes impact of in-kind transactions.
See notes to financial statements.
158
Victory Portfolios II | | Financial Highlights | |
For a Share Outstanding Throughout Each Period
| | | VictoryShares Emerging Market Volatility Wtd ETF | |
| | | Six
Months
Ended
December 31,
2018 | | Year
Ended
June 30,
2018 | | Year
Ended
June 30,
2017 | | Period
Ended
June 30,
2016(a) | |
| | | (Unaudited) | | | | | | | |
Net Asset Value, Beginning of Period | | $ | 27.07 | | | $ | 27.83 | | | $ | 25.28 | | | $ | 25.00 | | |
Investment Activities: | |
Net investment income (loss) (b) | | | 0.32 | | | | 0.64 | | | | 0.55 | | | | 0.25 | | |
Net realized and unrealized gains
(losses) on investments | | | (1.28 | ) | | | 0.29 | | | | 2.64 | | | | 0.13 | | |
Total from Investment Activities | | | (0.96 | ) | | | 0.93 | | | | 3.19 | | | | 0.38 | | |
Distributions to Shareholders: | |
Net investment income | | | (0.34 | ) | | | (0.60 | ) | | | (0.52 | ) | | | (0.10 | ) | |
Net realized gains from investments | | | (1.41 | ) | | | (1.09 | ) | | | (0.12 | ) | | | — | | |
Total Distributions to Shareholders | | | (1.75 | ) | | | (1.69 | ) | | | (0.64 | ) | | | (0.10 | ) | |
Net Asset Value, End of Period | | $ | 24.36 | | | $ | 27.07 | | | $ | 27.83 | | | $ | 25.28 | | |
Total Return (c) | | | (3.58 | )% | | | 3.09 | % | | | 12.76 | % | | | 1.56 | % | |
Ratios/Supplemental Data: | |
Net Assets at end of period (000) | | $ | 17,049 | | | $ | 18,949 | | | $ | 33,393 | | | $ | 12,642 | | |
Ratio of net expenses to average
net assets (d) | | | 0.50 | % | | | 0.50 | % | | | 0.50 | % | | | 0.50 | % | |
Ratio of net investment income (loss)
to average net assets (d) | | | 2.43 | % | | | 2.19 | % | | | 2.11 | % | | | 3.70 | % | |
Ratio of gross expenses to average
net assets (d) (e) | | | 1.54 | % | | | 1.23 | % | | | 1.91 | % | | | 6.26 | % | |
Portfolio turnover (c) (f) | | | 40 | % | | | 53 | % | | | 38 | % | | | 1 | % | |
(a) The Fund commenced operations on March 22, 2016.
(b) Per share net investment income (loss) has been calculated using the average daily shares method.
(c) Not annualized for periods less than one year.
(d) Annualized for periods less than one year.
(e) During the period, certain fees were reduced and/or reimbursed. If such fee reductions and/or reimbursements had not occurred, the ratios would have been as indicated.
(f) Excludes impact of in-kind transactions.
See notes to financial statements.
159
Victory Portfolios II | | Financial Highlights | |
For a Share Outstanding Throughout Each Period
| | | VictoryShares US Large Cap High Div Volatility Wtd ETF | |
| | | Six
Months
Ended
December 31,
2018 | | Year
Ended
June 30,
2018 | | Year
Ended
June 30,
2017 | | Period
Ended
June 30,
2016(a) | |
| | | (Unaudited) | | | | | | | |
Net Asset Value, Beginning of Period | | $ | 45.06 | | | $ | 42.17 | | | $ | 37.58 | | | $ | 35.00 | | |
Investment Activities: | |
Net investment income (loss) (b) | | | 0.75 | | | | 1.34 | | | | 1.24 | | | | 1.28 | | |
Net realized and unrealized gains
(losses) on investments | | | (3.68 | ) | | | 2.92 | | | | 4.46 | | | | 2.35 | | |
Total from Investment Activities | | | (2.93 | ) | | | 4.26 | | | | 5.70 | | | | 3.63 | | |
Distributions to Shareholders: | |
Net investment income | | | (0.77 | ) | | | (1.37 | ) | | | (1.11 | ) | | | (1.05 | ) | |
Total Distributions to Shareholders | | | (0.77 | ) | | | (1.37 | ) | | | (1.11 | ) | | | (1.05 | ) | |
Net Asset Value, End of Period | | $ | 41.36 | | | $ | 45.06 | | | $ | 42.17 | | | $ | 37.58 | | |
Total Return (c) | | | (6.61 | )% | | | 10.23 | % | | | 15.37 | % | | | 10.62 | % | |
Ratios/Supplemental Data: | |
Net Assets at end of period (000) | | $ | 163,368 | | | $ | 144,187 | | | $ | 120,181 | | | $ | 41,333 | | |
Ratio of net expenses to average
net assets (d) | | | 0.35 | % | | | 0.35 | % | | | 0.35 | % | | | 0.35 | % | |
Ratio of net investment income (loss)
to average net assets (d) | | | 3.29 | % | | | 3.04 | % | | | 3.05 | % | | | 3.69 | % | |
Ratio of gross expenses to average
net assets (d) (e) | | | 0.41 | % | | | 0.42 | % | | | 0.45 | % | | | 0.72 | % | |
Portfolio turnover (c) (f) | | | 26 | % | | | 52 | % | | | 48 | % | | | 46 | % | |
(a) The Fund commenced operations on July 7, 2015.
(b) Per share net investment income (loss) has been calculated using the average daily shares method.
(c) Not annualized for periods less than one year.
(d) Annualized for periods less than one year.
(e) During the period, certain fees were reduced and/or reimbursed. If such fee reductions and/or reimbursements had not occurred, the ratios would have been as indicated.
(f) Excludes impact of in-kind transactions.
See notes to financial statements.
160
Victory Portfolios II | | Financial Highlights | |
For a Share Outstanding Throughout Each Period
| | | VictoryShares US Small Cap High Div Volatility Wtd ETF | |
| | | Six
Months
Ended
December 31,
2018 | | Year
Ended
June 30,
2018 | | Year
Ended
June 30,
2017 | | Period
Ended
June 30,
2016(a) | |
| | | (Unaudited) | | | | | | | |
Net Asset Value, Beginning of Period | | $ | 45.96 | | | $ | 40.41 | | | $ | 35.40 | | | $ | 35.00 | | |
Investment Activities: | |
Net investment income (loss) (b) | | | 0.72 | | | | 1.39 | | | | 1.43 | | | | 1.18 | | |
Net realized and unrealized gains
(losses) on investments | | | (5.83 | ) | | | 5.61 | | | | 4.93 | | | | 0.21 | | |
Total from Investment Activities | | | (5.11 | ) | | | 7.00 | | | | 6.36 | | | | 1.39 | | |
Distributions to Shareholders: | |
Net investment income | | | (0.72 | ) | | | (1.45 | ) | | | (1.35 | ) | | | (0.99 | ) | |
Total Distributions to Shareholders | | | (0.72 | ) | | | (1.45 | ) | | | (1.35 | ) | | | (0.99 | ) | |
Net Asset Value, End of Period | | $ | 40.13 | | | $ | 45.96 | | | $ | 40.41 | | | $ | 35.40 | | |
Total Return (c) | | | (11.22 | )% | | | 17.64 | % | | | 18.07 | % | | | 4.15 | % | |
Ratios/Supplemental Data: | |
Net Assets at end of period (000) | | $ | 48,156 | | | $ | 43,665 | | | $ | 32,325 | | | $ | 14,160 | | |
Ratio of net expenses to average
net assets (d) | | | 0.35 | % | | | 0.35 | % | | | 0.35 | % | | | 0.35 | % | |
Ratio of net investment income (loss)
to average net assets (d) | | | 3.17 | % | | | 3.23 | % | | | 3.65 | % | | | 3.59 | % | |
Ratio of gross expenses to average
net assets (d) (e) | | | 0.43 | % | | | 0.45 | % | | | 0.55 | % | | | 0.92 | % | |
Portfolio turnover (c) (f) | | | 52 | % | | | 68 | % | | | 65 | % | | | 78 | % | |
(a) The Fund commenced operations on July 7, 2015.
(b) Per share net investment income (loss) has been calculated using the average daily shares method.
(c) Not annualized for periods less than one year.
(d) Annualized for periods less than one year.
(e) During the period, certain fees were reduced and/or reimbursed. If such fee reductions and/or reimbursements had not occurred, the ratios would have been as indicated.
(f) Excludes impact of in-kind transactions.
See notes to financial statements.
161
Victory Portfolios II | | Financial Highlights | |
For a Share Outstanding Throughout Each Period
| | | VictoryShares International High Div Volatility Wtd ETF | |
| | | Six
Months
Ended
December 31,
2018 | | Year
Ended
June 30,
2018 | | Year
Ended
June 30,
2017 | | Period
Ended
June 30,
2016(a) | |
| | | (Unaudited) | | | | | | | |
Net Asset Value, Beginning of Period | | $ | 33.94 | | | $ | 34.25 | | | $ | 30.65 | | | $ | 35.00 | | |
Investment Activities: | |
Net investment income (loss) (b) | | | 0.59 | | | | 1.47 | | | | 1.40 | | | | 1.37 | | |
Net realized and unrealized gains
(losses) on investments | | | (3.93 | ) | | | (0.41 | ) | | | 3.47 | | | | (4.71 | ) | |
Total from Investment Activities | | | (3.34 | ) | | | 1.06 | | | | 4.87 | | | | (3.34 | ) | |
Distributions to Shareholders: | |
Net investment income | | | (0.70 | ) | | | (1.37 | ) | | | (1.27 | ) | | | (1.01 | ) | |
Total Distributions to Shareholders | | | (0.70 | ) | | | (1.37 | ) | | | (1.27 | ) | | | (1.01 | ) | |
Net Asset Value, End of Period | | $ | 29.90 | | | $ | 33.94 | | | $ | 34.25 | | | $ | 30.65 | | |
Total Return (c) | | | (9.97 | )% | | | 3.00 | % | | | 16.16 | % | | | (9.63 | )% | |
Ratios/Supplemental Data: | |
Net Assets at end of period (000) | | $ | 41,859 | | | $ | 45,824 | | | $ | 32,541 | | | $ | 16,855 | | |
Ratio of net expenses to average
net assets (d) | | | 0.45 | % | | | 0.45 | % | | | 0.45 | % | | | 0.45 | % | |
Ratio of net investment income (loss)
to average net assets (d) | | | 3.61 | % | | | 4.14 | % | | | 4.32 | % | | | 4.98 | % | |
Ratio of gross expenses to average
net assets (d) (e) | | | 0.58 | % | | | 0.60 | % | | | 0.77 | % | | | 1.17 | % | |
Portfolio turnover (c) (f) | | | 4 | % | | | 58 | % | | | 69 | % | | | 53 | % | |
(a) The Fund commenced operations on August 19, 2015.
(b) Per share net investment income (loss) has been calculated using the average daily shares method.
(c) Not annualized for periods less than one year.
(d) Annualized for periods less than one year.
(e) During the period, certain fees were reduced and/or reimbursed. If such fee reductions and/or reimbursements had not occurred, the ratios would have been as indicated.
(f) Excludes impact of in-kind transactions.
See notes to financial statements.
162
Victory Portfolios II | | Financial Highlights | |
For a Share Outstanding Throughout Each Period
| | | VictoryShares Emerging Market
High Div Volatility Wtd ETF | |
| | | Six
Months
Ended
December 31,
2018 | | Period
Ended
June 30,
2018(a) | |
| | | (Unaudited) | | | |
Net Asset Value, Beginning of Period | | $ | 23.92 | | | $ | 24.95 | | |
Investment Activities: | |
Net investment income (loss) (b) | | | 0.64 | | | | 0.78 | | |
Net realized and unrealized gains (losses) on investments | | | (1.59 | ) | | | (1.29 | ) | |
Total from Investment Activities | | | (0.95 | ) | | | (0.51 | ) | |
Distributions to Shareholders: | |
Net investment income | | | (0.65 | ) | | | (0.52 | ) | |
Net realized gains from investments | | | (0.14 | ) | | | — | | |
Total Distributions to Shareholders | | | (0.79 | ) | | | (0.52 | ) | |
Net Asset Value, End of Period | | $ | 22.18 | | | $ | 23.92 | | |
Total Return (c) | | | (4.06 | )% | | | (2.17 | )% | |
Ratios/Supplemental Data: | |
Net Assets at end of period (000) | | $ | 17,747 | | | $ | 21,532 | | |
Ratio of net expenses to average net assets (d) | | | 0.50 | % | | | 0.50 | % | |
Ratio of net investment income (loss) to average net assets (d) | | | 5.49 | % | | | 4.44 | % | |
Ratio of gross expenses to average net assets (d) (e) | | | 0.95 | % | | | 1.05 | % | |
Portfolio turnover (c) (f) | | | 9 | % | | | 52 | % | |
(a) The Fund commenced operations on October 26, 2017.
(b) Per share net investment income (loss) has been calculated using the average daily shares method.
(c) Not annualized for periods less than one year.
(d) Annualized for periods less than one year.
(e) During the period, certain fees were reduced and/or reimbursed. If such fee reductions and/or reimbursements had not occurred, the ratios would have been as indicated.
(f) Excludes impact of in-kind transactions.
See notes to financial statements.
163
Victory Portfolios II | | Financial Highlights | |
For a Share Outstanding Throughout Each Period
| | | VictoryShares Dividend Accelerator ETF | |
| | | Six
Months
Ended
December 31,
2018 | | Year
Ended
June 30,
2018 | | Period
Ended
June 30,
2017(a) | |
| | | (Unaudited) | | | | | |
Net Asset Value, Beginning of Period | | $ | 28.41 | | | $ | 25.95 | | | $ | 25.26 | | |
Investment Activities: | |
Net investment income (loss) (b) | | | 0.25 | | | | 0.48 | | | | 0.12 | | |
Net realized and unrealized gains (losses)
on investments | | | (0.71 | ) | | | 2.45 | | | | 0.65 | | |
Total from Investment Activities | | | (0.46 | ) | | | 2.93 | | | | 0.77 | | |
Distributions to Shareholders: | |
Net investment income | | | (0.27 | ) | | | (0.47 | ) | | | (0.08 | ) | |
Total Distributions to Shareholders | | | (0.27 | ) | | | (0.47 | ) | | | (0.08 | ) | |
Net Asset Value, End of Period | | $ | 27.68 | | | $ | 28.41 | | | $ | 25.95 | | |
Total Return (c) | | | (1.67 | )% | | | 11.33 | % | | | 3.05 | % | |
Ratios/Supplemental Data: | |
Net Assets at end of period (000) | | $ | 9,688 | | | $ | 7,102 | | | $ | 3,893 | | |
Ratio of net expenses to average net assets (d) | | | 0.35 | % | | | 0.35 | % | | | 0.35 | % | |
Ratio of net investment income (loss) to average
net assets (d) | | | 1.68 | % | | | 1.75 | % | | | 2.31 | % | |
Ratio of gross expenses to average net assets (d) (e) | | | 0.59 | % | | | 0.67 | % | | | 1.92 | % | |
Portfolio turnover (c) (f) | | | 12 | % | | | 43 | % | | | — | % | |
(a) The Fund commenced operations on April 18, 2017.
(b) Per share net investment income (loss) has been calculated using the average daily shares method.
(c) Not annualized for periods less than one year.
(d) Annualized for periods less than one year.
(e) During the period, certain fees were reduced and/or reimbursed. If such fee reductions and/or reimbursements had not occurred, the ratios would have been as indicated.
(f) Excludes impact of in-kind transactions.
See notes to financial statements.
164
Victory Portfolios II | | Financial Highlights | |
For a Share Outstanding Throughout Each Period
| | | VictoryShares US Multi-Factor
Minimum Volatility ETF | |
| | | Six
Months
Ended
December 31,
2018 | | Year
Ended
June 30,
2018 | | Period
Ended
June 30,
2017(a) | |
| | | (Unaudited) | | | | | |
Net Asset Value, Beginning of Period | | $ | 27.58 | | | $ | 24.83 | | | $ | 24.97 | | |
Investment Activities: | |
Net investment income (loss) (b) | | | 0.40 | | | | 0.63 | | | | 0.02 | | |
Net realized and unrealized gains (losses)
on investments | | | (0.86 | ) | | | 2.69 | | | | (0.16 | ) | |
Total from Investment Activities | | | (0.46 | ) | | | 3.32 | | | | (0.14 | ) | |
Distributions to Shareholders: | |
Net investment income | | | (0.39 | ) | | | (0.57 | ) | | | — | | |
Total Distributions to Shareholders | | | (0.39 | ) | | | (0.57 | ) | | | — | | |
Net Asset Value, End of Period | | $ | 26.73 | | | $ | 27.58 | | | $ | 24.83 | | |
Total Return (c) | | | (1.70 | )% | | | 13.41 | % | | | (0.54 | )% | |
Ratios/Supplemental Data: | |
Net Assets at end of period (000) | | $ | 26,731 | | | $ | 8,273 | | | $ | 2,483 | | |
Ratio of net expenses to average net assets (d) | | | 0.35 | % | | | 0.35 | % | | | 0.35 | % | |
Ratio of net investment income (loss) to average
net assets (d) | | | 2.76 | % | | | 2.33 | % | | | 3.20 | % | |
Ratio of gross expenses to average net assets (d) (e) | | | 0.45 | % | | | 0.74 | % | | | 7.21 | % | |
Portfolio turnover (c) (f) | | | 10 | % | | | 26 | % | | | — | % | |
(a) The Fund commenced operations on June 22, 2017.
(b) Per share net investment income (loss) has been calculated using the average daily shares method.
(c) Not annualized for periods less than one year.
(d) Annualized for periods less than one year.
(e) During the period, certain fees were reduced and/or reimbursed. If such fee reductions and/or reimbursements had not occurred, the ratios would have been as indicated.
(f) Excludes impact of in-kind transactions.
See notes to financial statements.
165
Victory Portfolios II | | Financial Highlights | |
For a Share Outstanding Throughout Each Period
| | | VictoryShares US 500 Enhanced Volatility Wtd ETF | |
| | | Six
Months
Ended
December 31,
2018 | | Year
Ended
June 30,
2018 | | Year
Ended
June 30,
2017 | | Year
Ended
June 30,
2016 | | Period
Ended
June 30,
2015(a) | |
| | | (Unaudited) | | | | | | | | | |
Net Asset Value, Beginning of Period | | $ | 49.30 | | | $ | 44.00 | | | $ | 37.23 | | | $ | 36.76 | | | $ | 35.00 | | |
Investment Activities: | |
Net investment income (loss) (b) | | | 0.36 | | | | 0.64 | | | | 0.58 | | | | 0.56 | | | | 0.49 | | |
Net realized and unrealized gains
(losses) on investments | | | (5.34 | ) | | | 5.25 | | | | 6.71 | | | | 0.45 | | | | 1.65 | | |
Total from Investment Activities | | | (4.98 | ) | | | 5.89 | | | | 7.29 | | | | 1.01 | | | | 2.14 | | |
Distributions to Shareholders: | |
Net investment income | | | (0.39 | ) | | | (0.59 | ) | | | (0.52 | ) | | | (0.54 | ) | | | (0.38 | ) | |
Total Distributions to Shareholders | | | (0.39 | ) | | | (0.59 | ) | | | (0.52 | ) | | | (0.54 | ) | | | (0.38 | ) | |
Net Asset Value, End of Period | | $ | 43.93 | | | $ | 49.30 | | | $ | 44.00 | | | $ | 37.23 | | | $ | 36.76 | | |
Total Return (c) | | | (10.17 | )% | | | 13.42 | % | | | 19.72 | % | | | 2.79 | % | | | 6.15 | % | |
Ratios/Supplemental Data: | |
Net Assets at end of period (000) | | $ | 924,627 | | | $ | 951,411 | | | $ | 415,847 | | | $ | 141,470 | | | $ | 86,397 | | |
Ratio of net expenses to average net assets (d) | | | 0.35 | % | | | 0.35 | % | | | 0.35 | % | | | 0.35 | % | | | 0.59 | % | |
Ratio of net investment income (loss) to average
net assets (d) | | | 1.43 | % | | | 1.32 | % | | | 1.42 | % | | | 1.56 | % | | | 1.34 | % | |
Ratio of gross expenses to average
net assets (d) (e) | | | 0.40 | % | | | 0.41 | % | | | 0.45 | % | | | 0.58 | % | | | 0.81 | % | |
Portfolio turnover (c) (f) | | | 1 | % | | | 37 | % | | | 26 | % | | | 36 | % | | | 13 | % | |
(a) The Fund commenced operations on July 1, 2014.
(b) Per share net investment income (loss) has been calculated using the average daily shares method.
(c) Not annualized for periods less than one year.
(d) Annualized for periods less than one year.
(e) During the period, certain fees were reduced and/or reimbursed. If such fee reductions and/or reimbursements had not occurred, the ratios would have been as indicated.
(f) Excludes impact of in-kind transactions.
See notes to financial statements.
166
Victory Portfolios II | | Financial Highlights | |
For a Share Outstanding Throughout Each Period
| | | VictoryShares US EQ Income Enhanced Volatility Wtd ETF | |
| | | Six
Months
Ended
December 31,
2018 | | Year
Ended
June 30,
2018 | | Year
Ended
June 30,
2017 | | Year
Ended
June 30,
2016 | | Period
Ended
June 30,
2015(a) | |
| | | (Unaudited) | | | | | | | | | |
Net Asset Value, Beginning of Period | | $ | 46.29 | | | $ | 43.30 | | | $ | 38.59 | | | $ | 35.38 | | | $ | 35.00 | | |
Investment Activities: | |
Net investment income (loss) (b) | | | 0.77 | | | | 1.39 | | | | 1.28 | | | | 1.27 | | | | 1.12 | | |
Net realized and unrealized gains
(losses) on investments | | | (3.78 | ) | | | 2.99 | | | | 4.58 | | | | 3.18 | | | | 0.20 | | |
Total from Investment Activities | | | (3.01 | ) | | | 4.38 | | | | 5.86 | | | | 4.45 | | | | 1.32 | | |
Distributions to Shareholders: | |
Net investment income | | | (0.81 | ) | | | (1.39 | ) | | | (1.15 | ) | | | (1.24 | ) | | | (0.94 | ) | |
Total Distributions to Shareholders | | | (0.81 | ) | | | (1.39 | ) | | | (1.15 | ) | | | (1.24 | ) | | | (0.94 | ) | |
Net Asset Value, End of Period | | $ | 42.47 | | | $ | 46.29 | | | $ | 43.30 | | | $ | 38.59 | | | $ | 35.38 | | |
Total Return (c) | | | (6.60 | )% | | | 10.23 | % | | | 15.35 | % | | | 12.89 | % | | | 3.77 | % | |
Ratios/Supplemental Data: | |
Net Assets at end of period (000) | | $ | 806,863 | | | $ | 738,260 | | | $ | 471,927 | | | $ | 156,278 | | | $ | 86,678 | | |
Ratio of net expenses to average net assets (d) | | | 0.35 | % | | | 0.35 | % | | | 0.35 | % | | | 0.35 | % | | | 0.59 | % | |
Ratio of net investment income (loss) to average
net assets (d) | | | 3.30 | % | | | 3.06 | % | | | 3.06 | % | | | 3.51 | % | | | 3.09 | % | |
Ratio of gross expenses to average
net assets (d) (e) | | | 0.40 | % | | | 0.41 | % | | | 0.43 | % | | | 0.56 | % | | | 0.77 | % | |
Portfolio turnover (c) (f) | | | 1 | % | | | 52 | % | | | 49 | % | | | 52 | % | | | 17 | % | |
(a) The Fund commenced operations on July 1, 2014.
(b) Per share net investment income (loss) has been calculated using the average daily shares method.
(c) Not annualized for periods less than one year.
(d) Annualized for periods less than one year.
(e) During the period, certain fees were reduced and/or reimbursed. If such fee reductions and/or reimbursements had not occurred, the ratios would have been as indicated.
(f) Excludes impact of in-kind transactions.
See notes to financial statements.
167
Victory Portfolios II | | Financial Highlights | |
For a Share Outstanding Throughout Each Period
| | | VictoryShares US Discovery Enhanced Volatility Wtd ETF | |
| | | Six
Months
Ended
December 31,
2018 | | Year
Ended
June 30,
2018 | | Year
Ended
June 30,
2017 | | Year
Ended
June 30,
2016 | | Period
Ended
June 30,
2015(a) | |
| | | (Unaudited) | | | | | | | | | |
Net Asset Value, Beginning of Period | | $ | 47.41 | | | $ | 41.41 | | | $ | 33.55 | | | $ | 39.23 | | | $ | 35.00 | | |
Investment Activities: | |
Net investment income (loss) (b) | | | 0.29 | | | | 0.50 | | | | 0.49 | | | | 0.34 | | | | 0.40 | | |
Net realized and unrealized gains
(losses) on investments | | | (7.94 | ) | | | 5.98 | | | | 7.84 | | | | (5.71 | )(c) | | | 4.16 | | |
Total from Investment Activities | | | (7.65 | ) | | | 6.48 | | | | 8.33 | | | | (5.37 | ) | | | 4.56 | | |
Distributions to Shareholders: | |
Net investment income | | | (0.31 | ) | | | (0.48 | ) | | | (0.47 | ) | | | (0.31 | ) | | | (0.33 | ) | |
Total Distributions to
Shareholders | | | (0.31 | ) | | | (0.48 | ) | | | (0.47 | ) | | | (0.31 | ) | | | (0.33 | ) | |
Net Asset Value, End of Period | | $ | 39.45 | | | $ | 47.41 | | | $ | 41.41 | | | $ | 33.55 | | | $ | 39.23 | | |
Total Return (d) | | | (16.21 | )% | | | 15.75 | % | | | 24.91 | % | | | (13.70 | )%(e) | | | 13.06 | % | |
Ratios/Supplemental Data: | |
Net Assets at end of period (000) | | $ | 112,432 | | | $ | 116,157 | | | $ | 57,971 | | | $ | 26,838 | | | $ | 23,538 | | |
Ratio of net expenses to average net assets (f) | | | 0.35 | % | | | 0.35 | % | | | 0.35 | % | | | 0.35 | % | | | 1.07 | % | |
Ratio of net investment income (loss) to average
net assets (f) | | | 1.26 | % | | | 1.13 | % | | | 1.25 | % | | | 1.00 | % | | | 1.15 | % | |
Ratio of gross expenses to average
net assets (f) (g) | | | 0.41 | % | | | 0.43 | % | | | 0.55 | % | | | 0.80 | % | | | 0.59 | % | |
Portfolio turnover (d) (h) | | | 90 | % | | | 47 | % | | | 50 | % | | | 221 | % | | | 10 | % | |
(a) The Fund commenced operations on July 31, 2014.
(b) Per share net investment income (loss) has been calculated using the average daily shares method.
(c) Includes $0.07 gain derived from a payment from affiliate.
(d) Not annualized for periods less than one year.
(e) Before payment from affiliate for the loss resulting from a trade error, the total return for the year would have been (13.88)%.
(f) Annualized for periods less than one year.
(g) During the period, certain fees were reduced and/or reimbursed. If such fee reductions and/or reimbursements had not occurred, the ratios would have been as indicated.
(h) Excludes impact of in-kind transactions.
See notes to financial statements.
168
Victory Portfolios II | | Financial Highlights | |
For a Share Outstanding Throughout Each Period
| | | VictoryShares Developed Enhanced Volatility Wtd ETF | |
| | | Six
Months
Ended
December 31,
2018 | | Year
Ended
June 30,
2018 | | Year
Ended
June 30,
2017 | | Year
Ended
June 30,
2016 | | Period
Ended
June 30,
2015(a) | |
| | | (Unaudited) | | | | | | | | | |
Net Asset Value, Beginning of Period | | $ | 33.79 | | | $ | 32.22 | | | $ | 29.00 | | | $ | 35.19 | | | $ | 35.00 | | |
Investment Activities: | |
Net investment income (loss) (b) | | | 0.28 | | | | 0.94 | | | | 0.78 | | | | 0.67 | | | | 0.80 | | |
Net realized and unrealized gains
(losses) on investments | | | (2.83 | ) | | | 1.45 | | | | 2.90 | (c) | | | (6.27 | ) | | | (0.18 | ) | |
Total from Investment Activities | | | (2.55 | ) | | | 2.39 | | | | 3.68 | | | | (5.60 | ) | | | 0.62 | | |
Distributions to Shareholders: | |
Net investment income | | | (0.37 | ) | | | (0.82 | ) | | | (0.46 | ) | | | (0.59 | ) | | | (0.42 | ) | |
Net realized gains from investments | | | — | | | | — | | | | — | | | | — | | | | (0.01 | ) | |
Total Distributions to
Shareholders | | | (0.37 | ) | | | (0.82 | ) | | | (0.46 | ) | | | (0.59 | ) | | | (0.43 | ) | |
Net Asset Value, End of Period | | $ | 30.87 | | | $ | 33.79 | | | $ | 32.22 | | | $ | 29.00 | | | $ | 35.19 | | |
Total Return (d) | | | (7.58 | )% | | | 7.41 | % | | | 12.79 | %(e) | | | (15.96 | )% | | | 1.77 | % | |
Ratios/Supplemental Data: | |
Net Assets at end of period (000) | | $ | 142,024 | | | $ | 179,103 | | | $ | 82,150 | | | $ | 34,797 | | | $ | 24,633 | | |
Ratio of net expenses to average net assets (f) | | | 0.45 | % | | | 0.45 | % | | | 0.45 | % | | | 0.45 | % | | | 0.63 | % | |
Ratio of net investment income (loss) to average
net assets (f) | | | 1.71 | % | | | 2.73 | % | | | 2.59 | % | | | 2.16 | % | | | 2.99 | % | |
Ratio of gross expenses to average
net assets (f) (g) | | | 0.56 | % | | | 0.58 | % | | | 0.86 | % | | | 1.36 | % | | | 1.58 | % | |
Portfolio turnover (d) (h) | | | 37 | % | | | 38 | % | | | 164 | % | | | 211 | % | | | 31 | % | |
(a) The Fund commenced operations on September 30, 2014.
(b) Per share net investment income (loss) has been calculated using the average daily shares method.
(c) Includes $0.07 gain derived from a payment from affiliate.
(d) Not annualized for periods less than one year.
(e) Before the payment from affiliate for the loss resulting from a trade error, the total return for the year would have been 12.55%.
(f) Annualized for periods less than one year.
(g) During the period, certain fees were reduced and/or reimbursed. If such fee reductions and/or reimbursements had not occurred, the ratios would have been as indicated.
(h) Excludes impact of in-kind transactions.
See notes to financial statements.
169
Victory Portfolios II | | Notes to Financial Statements
December 31, 2018 | |
(Unaudited)
1. Organization:
Victory Portfolios II (the "Trust") was organized on April 11, 2012 as a Delaware statutory trust. The Trust is registered under the Investment Company Act of 1940, as amended (the "1940 Act"), as an open-end investment company. The Trust is comprised of 20 funds, 18 of which are exchange-traded funds, and is authorized to issue an unlimited number of shares, which are units of beneficial interest with no par value. Each Fund is classified as diversified under the 1940 Act.
The accompanying financial statements are those of the following 14 Funds (collectively, the "Funds" and individually, a "Fund").
Funds (Legal Name) | | Funds (Short Name) | |
VictoryShares US 500 Volatility Wtd ETF | | US 500 Volatility Wtd ETF | |
VictoryShares US Small Cap Volatility Wtd ETF | | US Small Cap Volatility Wtd ETF | |
VictoryShares International Volatility Wtd ETF | | International Volatility Wtd ETF | |
VictoryShares Emerging Market Volatility Wtd ETF | | Emerging Market Volatility Wtd ETF | |
VictoryShares US Large Cap High Div Volatility
Wtd ETF | | US Large Cap High Div Volatility Wtd ETF
| |
VictoryShares US Small Cap High Div Volatility
Wtd ETF | | US Small Cap High Div Volatility Wtd ETF
| |
VictoryShares International High Div Volatility
Wtd ETF | | International High Div Volatility Wtd ETF
| |
VictoryShares Emerging Market High Div Volatility
Wtd ETF | | Emerging Market High Div Volatility Wtd ETF
| |
VictoryShares Dividend Accelerator ETF | | Dividend Accelerator ETF | |
VictoryShares US Multi-Factor Minimum
Volatility ETF | | US Multi-Factor Minimum Volatility ETF
| |
VictoryShares US 500 Enhanced Volatility Wtd ETF | | US 500 Enhanced Volatility Wtd ETF | |
VictoryShares US EQ Income Enhanced Volatility
Wtd ETF | | US EQ Income Enhanced Volatility Wtd ETF
| |
VictoryShares US Discovery Enhanced Volatility
Wtd ETF | | US Discovery Enhanced Volatility Wtd ETF
| |
VictoryShares Developed Enhanced Volatility
Wtd ETF | | Developed Enhanced Volatility Wtd ETF
| |
Under the Trust's organizational documents, its officers and trustees are indemnified against certain liabilities arising out of the performance of their duties to the Funds. In addition, in the normal course of business, the Funds enter into contracts with their vendors and others that provide for general indemnifications. The Funds' maximum exposure under these arrangements is unknown, as this would involve future claims that may be made against the Funds. However, based on experience, the Funds expect that risk of loss to be remote.
2. Significant Accounting Policies:
Shares of the Funds are listed and traded on Nasdaq Stock Market, LLC ("Exchange"). The Funds issue and redeem shares of a Fund ("Shares") at net asset value ("NAV") only in aggregations of 50,000 Shares (each a "Creation Unit"). Creation Units are issued and redeemed in exchange for a basket of securities included in the respective Fund's Index (the "Deposit Securities"), and/or with the deposit of a specified cash payment (the "Cash Component"), plus a transaction fee. Shares trade on the Exchange at market prices that may be below, at, or above NAV. Shares of a Fund may only be purchased or redeemed by certain financial institutions ("Authorized Participants"). An Authorized Participant is either (i) a broker-dealer or other participant in the clearing process through the Continuous Net Settlement System of the National Securities Clearing Corporation or (ii) a DTC participant and, in each case, must have executed a Participant Agreement with the Distributor. Most retail investors do not qualify as Authorized Participants nor have the resources to buy and sell whole Creation Units. Therefore, they are unable to purchase or redeem the shares directly from a Fund. In addition, shares
170
Victory Portfolios II | | Notes to Financial Statements — continued
December 31, 2018 | |
(Unaudited)
may be issued in advance of receipt of Deposit Securities subject to various conditions, including a requirement to maintain on deposit with the Trust cash equal to up to 105% of the market value of the missing Deposit Securities. In each instance of such cash creations or redemptions, transaction fees may be imposed and may be higher than the transaction fees associated with in-kind creations or redemptions.
Each Fund may issue an unlimited number of shares of beneficial interest, with no par value. Shares of each Fund have equal rights and privileges. A purchase (i.e., creation) transaction fee is imposed for the transfer and other transactional costs associated with the purchase of Creation Units. In addition, a variable fee may be charged on all cash transactions or substitutes for Creation Units. Variable fees received by each Fund are displayed in the Capital Share Transaction section of the Statements of Changes in Net Assets as an increase to Paid-In-Capital.
The Transaction Fees for each Fund are listed below:
| | | Fee for In-Kind and
Cash Purchases and
Redemptions | | Maximum
Additional Variable
Charge for Cash
Purchases and
Redemptions* | |
US 500 Volatility Wtd ETF | | $ | 750 | | | | 2.00 | % | |
US Small Cap Volatility Wtd ETF | | | 750 | | | | 2.00 | % | |
International Volatility Wtd ETF | | | 6,000 | | | | 2.00 | % | |
Emerging Market Volatility Wtd ETF | | | 9,000 | | | | 2.00 | % | |
US Large Cap High Div Volatility Wtd ETF | | | 250 | | | | 2.00 | % | |
US Small Cap High Div Volatility Wtd ETF | | | 250 | | | | 2.00 | % | |
International High Div Volatility Wtd ETF | | | 1,500 | | | | 2.00 | % | |
Emerging Market High Div Volatility Wtd ETF | | | 3,400 | | | | 2.00 | % | |
Dividend Accelerator ETF | | | 250 | | | | 2.00 | % | |
US Multi-Factor Minimum Volatility ETF | | | 250 | | | | 2.00 | % | |
US 500 Enhanced Volatility Wtd ETF | | | 750 | | | | 2.00 | % | |
US EQ Income Enhanced Volatility Wtd ETF | | | 250 | | | | 2.00 | % | |
US Discovery Enhanced Volatility Wtd ETF | | | 750 | | | | 2.00 | % | |
Developed Enhanced Volatility Wtd ETF | | | 4,500 | | | | 2.00 | % | |
* As a percentage of the amount invested.
The following is a summary of significant accounting policies followed by the Trust in the preparation of its financial statements. The policies are in conformity with accounting principles generally accepted in the United States of America ("GAAP"). The preparation of financial statements in accordance with GAAP requires management to make estimates and assumptions that affect the reported amounts of assets and liabilities and disclosure of contingent assets and liabilities at the date of the financial statements and the reported amounts of income and expenses for the period. Actual results could differ from those estimates. The Funds follow the specialized accounting and reporting requirements under GAAP that are applicable to investment companies.
Investment Valuation:
The Funds record investments at fair value. Fair value is defined as the price that would be received to sell an asset or paid to transfer a liability in an orderly transaction between market participants at the measurement date.
The valuation techniques described below maximize the use of observable inputs and minimize the use of unobservable inputs in determining fair value. The inputs used for valuing the Funds' investments are summarized in the three broad levels listed below:
• Level 1 — quoted prices in active markets for identical securities
171
Victory Portfolios II | | Notes to Financial Statements — continued
December 31, 2018 | |
(Unaudited)
• Level 2 — other significant observable inputs (including quoted prices for similar securities or interest rates applicable to those securities, etc.)
• Level 3 — significant unobservable inputs (including the Funds' own assumptions in determining the fair value of investments)
Changes in valuation techniques may result in transfers in or out of an assigned level within the disclosure hierarchy. The inputs or methodologies used for valuation techniques are not necessarily an indication of the risk associated with entering into those investments.
Portfolio securities listed or traded on securities exchanges, American Depositary Receipts ("ADRs") and Rights, are valued at the closing price on the exchange or system where the security is principally traded, if available, or at the Nasdaq Official Closing Price. If there have been no sales for that day on the exchange or system, then a security is valued at the last available bid quotation on the exchange or system where the security is principally traded. In each of these situations, valuations are typically categorized as Level 1 in the fair value hierarchy. Futures contracts are valued at the settlement price established each day by the board of trade or an exchange on which they are traded. These valuations are typically categorized as Level 1 in the fair value hierarchy.
Futures contracts are valued at the settlement price established each day by the board of trade or an exchange on which they are traded. These valuations are typically categorized as Level 1 in the fair value hierarchy.
Investments in open-end investment companies are valued at net asset value. These valuations are typically categorized as Level 1 in the fair value hierarchy.
Investments for which there are no such quotations, or for which quotations do not appear reliable, are valued at fair value in accordance with procedures established by and under the general supervision and responsibility of the Trust's Board of Trustees ("Board"). These valuations are typically categorized as Level 2 or Level 3 in the fair value hierarchy, based on the observability of inputs used to determine the fair value.
A summary of the valuations as of December 31, 2018, based upon the three levels defined above, is included in the table below while the breakdown, by category, of investments is disclosed in the Schedules of Portfolio Investments:
| | | LEVEL 1 —
Quoted Prices | | LEVEL 2 —
Other Significant
Observable Inputs | | LEVEL 3 —
Other Significant
Unobservable Inputs | | Total | |
| | | Investments
in
Securities | | Other
Financial
Investments^ | | Investments
in
Securities | | Other
Financial
Investments^ | | Investments
in
Securities | | Other
Financial
Investments^ | | Investments
in
Securities | | Other
Financial
Investments^ | |
VictoryShares US 500 Volatility Wtd ETF | |
Common Stocks | | $ | 586,046,541 | | | $ | — | | | $ | — | | | $ | — | | | $ | — | | | $ | — | | | $ | 586,046,541 | | | $ | — | | |
Collateral for
Securities
Loaned | | | 30,969,761 | | | | — | | | | — | | | | — | | | | — | | | | — | | | | 30,969,761 | | | | — | | |
Futures Contracts | | | — | | | | 4,805 | | | | — | | | | — | | | | — | | | | — | | | | — | | | | 4,805 | | |
Total | | | 617,016,302 | | | | 4,805 | | | | — | | | | — | | | | — | | | | — | | | | 617,016,302 | | | | 4,805 | | |
VictoryShares US Small Cap Volatility Wtd ETF | |
Common Stocks | | | 32,286,959 | | | | — | | | | — | | | | — | | | | — | | | | — | | | | 32,286,959 | | | | — | | |
Rights | | | — | | | | — | | | | 2,942 | | | | — | | | | — | | | | — | | | | 2,942 | | | | — | | |
Collateral for
Securities
Loaned | | | 1,486,600 | | | | — | | | | — | | | | — | | | | — | | | | — | | | | 1,486,600 | | | | — | | |
Futures Contracts | | | — | | | | (12,191 | ) | | | — | | | | — | | | | — | | | | — | | | | — | | | | (12,191 | ) | |
Total | | | 33,773,559 | | | | (12,191 | ) | | | 2,942 | | | | — | | | | — | | | | — | | | | 33,776,501 | | | | (12,191 | ) | |
172
Victory Portfolios II | | Notes to Financial Statements — continued
December 31, 2018 | |
(Unaudited)
| | | LEVEL 1 —
Quoted Prices | | LEVEL 2 —
Other Significant
Observable Inputs | | LEVEL 3 —
Other Significant
Unobservable Inputs | | Total | |
| | | Investments
in
Securities | | Other
Financial
Investments^ | | Investments
in
Securities | | Other
Financial
Investments^ | | Investments
in
Securities | | Other
Financial
Investments^ | | Investments
in
Securities | | Other
Financial
Investments^ | |
VictoryShares International Volatility Wtd ETF | |
Common Stocks | | $ | 25,595,037 | | | $ | — | | | $ | — | | | $ | — | | | $ | — | | | $ | — | | | $ | 25,595,037 | | | $ | — | | |
Rights | | | 1,162 | | | | — | | | | — | | | | — | | | | — | | | | — | | | | 1,162 | | | | — | | |
Collateral for
Securities
Loaned | | | 253,628 | | | | — | | | | — | | | | — | | | | — | | | | — | | | | 253,628 | | | | — | | |
Total | | | 25,849,827 | | | | — | | | | — | | | | — | | | | — | | | | — | | | | 25,849,827 | | | | — | | |
VictoryShares Emerging Market Volatility Wtd ETF | |
Common Stocks | | | 16,947,403 | | | | — | | | | — | | | | — | | | | — | | | | — | | | | 16,947,403 | | | | — | | |
Rights | | | — | | | | — | | | | 723 | | | | — | | | | — | | | | — | | | | 723 | | | | — | | |
Collateral for
Securities
Loaned | | | 311,011 | | | | — | | | | — | | | | — | | | | — | | | | — | | | | 311,011 | | | | — | | |
Futures Contracts | | | — | | | | (402 | ) | | | — | | | | — | | | | — | | | | — | | | | — | | | | (402 | ) | |
Total | | | 17,258,414 | | | | (402 | ) | | | 723 | | | | — | | | | — | | | | — | | | | 17,259,137 | | | | (402 | ) | |
VictoryShares US Large Cap High Div Volatility Wtd ETF | |
Common Stocks | | | 162,723,721 | | | | — | | | | — | | | | — | | | | — | | | | — | | | | 162,723,721 | | | | — | | |
Collateral for
Securities
Loaned | | | 3,728,077 | | | | — | | | | — | | | | — | | | | — | | | | — | | | | 3,728,077 | | | | — | | |
Futures Contracts | | | — | | | | (9,795 | ) | | | — | | | | — | | | | — | | | | — | | | | — | | | | (9,795 | ) | |
Total | | | 166,451,798 | | | | (9,795 | ) | | | — | | | | — | | | | — | | | | — | | | | 166,451,798 | | | | (9,795 | ) | |
VictoryShares US Small Cap High Div Volatility Wtd ETF | |
Common Stocks | | | 47,753,086 | | | | — | | | | — | | | | — | | | | — | | | | — | | | | 47,753,086 | | | | — | | |
Rights | | | — | | | | — | | | | 14,186 | | | | — | | | | — | | | | — | | | | 14,186 | | | | — | | |
Collateral for
Securities
Loaned | | | 3,366,953 | | | | — | | | | — | | | | — | | | | — | | | | — | | | | 3,366,953 | | | | — | | |
Futures Contracts | | | — | | | | (14,850 | ) | | | — | | | | — | | | | — | | | | — | | | | — | | | | (14,850 | ) | |
Total | | | 51,120,039 | | | | (14,850 | ) | | | 14,186 | | | | — | | | | — | | | | — | | | | 51,134,225 | | | | (14,850 | ) | |
VictoryShares International High Div Volatility Wtd ETF | |
Common Stocks | | | 41,619,373 | | | | — | | | | — | | | | — | | | | — | | | | — | | | | 41,619,373 | | | | — | | |
Rights | | | 10,741 | | | | — | | | | — | | | | — | | | | — | | | | — | | | | 10,741 | | | | — | | |
Collateral for
Securities
Loaned | | | 1,367,356 | | | | — | | | | — | | | | — | | | | — | | | | — | | | | 1,367,356 | | | | — | | |
Total | | | 42,997,470 | | | | — | | | | — | | | | — | | | | — | | | | — | | | | 42,997,470 | | | | — | | |
VictoryShares Emerging Market High Div Volatility Wtd ETF | |
Common Stocks | | | 17,617,154 | | | | — | | | | — | | | | — | | | | — | | | | — | | | | 17,617,154 | | | | — | | |
Futures Contracts | | | — | | | | (1,158 | ) | | | — | | | | — | | | | — | | | | — | | | | — | | | | (1,158 | ) | |
Total | | | 17,617,154 | | | | (1,158 | ) | | | — | | | | — | | | | — | | | | — | | | | 17,617,154 | | | | (1,158 | ) | |
VictoryShares Dividend Accelerator ETF | |
Common Stocks | | | 9,667,500 | | | | — | | | | — | | | | — | | | | — | | | | — | | | | 9,667,500 | | | | — | | |
Collateral for
Securities
Loaned | | | 148,203 | | | | — | | | | — | | | | — | | | | — | | | | — | | | | 148,203 | | | | — | | |
Total | | | 9,815,703 | | | | — | | | | — | | | | — | | | | — | | | | — | | | | 9,815,703 | | | | — | | |
173
Victory Portfolios II | | Notes to Financial Statements — continued
December 31, 2018 | |
(Unaudited)
| | | LEVEL 1 —
Quoted Prices | | LEVEL 2 —
Other Significant
Observable Inputs | | LEVEL 3 —
Other Significant
Unobservable Inputs | | Total | |
| | | Investments
in
Securities | | Other
Financial
Investments^ | | Investments
in
Securities | | Other
Financial
Investments^ | | Investments
in
Securities | | Other
Financial
Investments^ | | Investments
in
Securities | | Other
Financial
Investments^ | |
VictoryShares US Multi-Factor Minimum Volatility ETF | |
Common Stocks | | $ | 26,550,381 | | | $ | — | | | $ | — | | | $ | — | | | $ | — | | | $ | — | | | $ | 26,550,381 | | | $ | — | | |
Futures Contracts | | | — | | | | 1,431 | | | | — | | | | — | | | | — | | | | — | | | | — | | | | 1,431 | | |
Total | | | 26,550,381 | | | | 1,431 | | | | — | | | | — | | | | — | | | | — | | | | 26,550,381 | | | | 1,431 | | |
VictoryShares US 500 Enhanced Volatility Wtd ETF | |
Common Stocks | | | 923,351,852 | | | | — | | | | — | | | | — | | | | — | | | | — | | | | 923,351,852 | | | | — | | |
Investment
Companies | | | 427,261 | | | | — | | | | — | | | | — | | | | — | | | | — | | | | 427,261 | | | | — | | |
Collateral for
Securities
Loaned | | | 1,583,234 | | | | — | | | | — | | | | — | | | | — | | | | — | | | | 1,583,234 | | | | — | | |
Futures Contracts | | | — | | | | 5,580 | | | | — | | | | — | | | | — | | | | — | | | | — | | | | 5,580 | | |
Total | | | 925,362,347 | | | | 5,580 | | | | — | | | | — | | | | — | | | | — | | | | 925,362,347 | | | | 5,580 | | |
VictoryShares US EQ Income Enhanced Volatility Wtd ETF | |
Common Stocks | | | 804,411,021 | | | | — | | | | — | | | | — | | | | — | | | | — | | | | 804,411,021 | | | | — | | |
Investment
Companies | | | 823,070 | | | | — | | | | — | | | | — | | | | — | | | | — | | | | 823,070 | | | | — | | |
Collateral for
Securities
Loaned | | | 1,299,559 | | | | — | | | | — | | | | — | | | | — | | | | — | | | | 1,299,559 | | | | — | | |
Futures Contracts | | | — | | | | (7,384 | ) | | | — | | | | — | | | | — | | | | — | | | | — | | | | (7,384 | ) | |
Total | | | 806,533,650 | | | | (7,384 | ) | | | — | | | | — | | | | — | | | | — | | | | 806,533,650 | | | | (7,384 | ) | |
VictoryShares US Discovery Enhanced Volatility Wtd ETF | |
Common Stocks | | | 111,218,299 | | | | — | | | | — | | | | — | | | | — | | | | — | | | | 111,218,299 | | | | — | | |
Rights | | | — | | | | — | | | | 8,448 | | | | — | | | | — | | | | — | | | | 8,448 | | | | — | | |
Investment
Companies | | | 942,820 | | | | — | | | | — | | | | — | | | | — | | | | — | | | | 942,820 | | | | — | | |
Collateral for
Securities
Loaned | | | 1,378,389 | | | | — | | | | — | | | | — | | | | — | | | | — | | | | 1,378,389 | | | | — | | |
Futures Contracts | | | — | | | | (42,079 | ) | | | — | | | | — | | | | — | | | | — | | | | — | | | | (42,079 | ) | |
Total | | | 113,539,508 | | | | (42,079 | ) | | | 8,448 | | | | — | | | | — | | | | — | | | | 113,547,956 | | | | (42,079 | ) | |
VictoryShares Developed Enhanced Volatility Wtd ETF | |
Common Stocks | | | 33,281,786 | | | | — | | | | — | | | | — | | | | 1,843 | | | | — | | | | 33,283,629 | | | | — | | |
Rights | | | 1,896 | | | | — | | | | — | | | | — | | | | — | | | | — | | | | 1,896 | | | | — | | |
Investment
Companies | | | 108,318,486 | | | | — | | | | — | | | | — | | | | — | | | | — | | | | 108,318,486 | | | | — | | |
Collateral for
Securities
Loaned | | | 473,443 | | | | — | | | | — | | | | — | | | | — | | | | — | | | | 473,443 | | | | — | | |
Futures Contracts | | | — | | | | (12,958 | ) | | | — | | | | — | | | | — | | | | — | | | | — | | | | (12,958 | ) | |
Total | | | 142,075,611 | | | | (12,958 | ) | | | — | | | | — | | | | 1,843 | | | | — | | | | 142,077,454 | | | | (12,958 | ) | |
174
Victory Portfolios II | | Notes to Financial Statements — continued
December 31, 2018 | |
(Unaudited)
The following is a reconciliation of assets in which significant unobservable inputs (Level 3) were used in determining fair value:
| | | Investments
In Securities | |
Developed Enhanced Volatility Wtd ETF | |
Balance as of June 30, 2018 | | $ | 563 | | |
Realized Gain (Loss) | | | (272 | ) | |
Change in Unrealized Appreciation/Depreciation | | | 1,552 | | |
Purchases | | | — | | |
Sale Proceeds | | | — | | |
Transfers into Level 3 | | | — | | |
Transfers out of Level 3 | | | — | | |
Balance as of December 31, 2018 | | $ | 1,843 | | |
The following is a summary of quantitative information about Level 3 Fair Value Measurements:
Developed
Enhanced
Volatility Wtd
ETF | | Fair Value
as of
12/31/2018* | | Valuation
Techniques | | Unobservable
Input | | Input Values | | Impact to valuation from an increase to input | |
Common Stocks
| | $ | 1,843
| | | Market
Comparables
| | Discount
| | | (95.7
| %) | | Any change to the discount would result
in direct and proportional changes
in the fair value of the security. | |
* Level 3 securities are typically valued by the Adviser, pursuant to fair valuation procedures approved by the Board of Trustees.
Real Estate Investment Trusts ("REITs"):
The Funds may invest in REITs which report information on the source of their distributions annually. REITs are pooled investment vehicles that invest primarily in income-producing real estate or real estate related loans or interests (such as mortgages). Certain distributions received from REITs during the year are recorded as realized gains or return of capital as estimated by the Funds or when such information becomes known.
Investment Companies:
The Funds may invest in portfolios of open-end investment companies. These investment companies value securities in their portfolios for which market quotations are readily available at their market values (generally the last reported sale price) and all other securities and assets at their fair value by the methods established by the board of directors of the underlying funds.
Derivative Instruments:
Foreign Exchange Currency Contracts:
The Developed Enhanced Volatility Wtd ETF, International Volatility Wtd ETF, International High Div Volatility Wtd ETF, Emerging Market Volatility Wtd ETF, and Emerging Market High Div Volatility Wtd ETF may enter into foreign exchange currency contracts to convert U.S. dollars to and from various foreign currencies. A foreign exchange currency contract is an obligation by a Fund to purchase or sell a specific currency at a future date at a price (in U.S. dollars) set at the time of the contract. The Funds do not engage in "cross-currency" foreign exchange contracts (i.e., contracts to purchase or sell one foreign currency in exchange for another foreign currency). The Funds' foreign exchange currency contracts might be considered spot contracts (typically a contract of one week or less) or forward contracts (typically a contract term over one week). A spot contract is entered into for purposes of hedging against foreign currency fluctuations relating to a specific portfolio transaction, such as the delay between a security transaction trade date and settlement date. Forward contracts are entered into for purposes of hedging portfolio holdings or concentrations of such holdings. The Funds enter
175
Victory Portfolios II | | Notes to Financial Statements — continued
December 31, 2018 | |
(Unaudited)
into foreign exchange currency contracts solely for spot or forward hedging purposes, and not for speculative purposes (i.e., the Funds do not enter into such contracts solely for the purpose of earning foreign currency gains). Each foreign exchange currency contract is adjusted daily by the prevailing spot or forward rate of the underlying currency, and any appreciation or depreciation is recorded for financial statement purposes as unrealized until the contract settlement date, at which time the Fund records realized gains or losses equal to the difference between the value of a contract at the time it was opened and the value at the time it was closed. A Fund could be exposed to risk if a counterparty is unable to meet the terms of a foreign exchange currency contract or if the value of the foreign currency changes unfavorably. In addition, the use of foreign exchange currency contracts does not eliminate fluctuations in the underlying prices of the securities. As of December 31, 2018, the Funds had no open forward foreign exchange currency contracts.
Futures Contracts:
The Funds may enter into contracts for the future delivery of securities or foreign currencies and futures contracts based on a specific security, class of securities, foreign currency or an index, and purchase or sell options on any such futures contracts. A futures contract on a securities index is an agreement obligating either party to pay, and entitling the other party to receive, while the contract is outstanding, cash payments based on the level of a specified securities index. No physical delivery of the underlying asset is made. A Fund may enter into futures contracts in an effort to hedge against market risks. The acquisition of put and call options on futures contracts will give the Fund the right (but not the obligation), for a specified price, to sell or to purchase the underlying futures contract, upon exercise of the option, at any time during the option period. Futures transactions involve brokerage costs and require the Fund to segregate assets to cover contracts that would require it to purchase securities or currencies. A good faith margin deposit, known as initial margin, of cash or government securities with a broker or custodian is required to initiate and maintain open positions in futures contracts. Subsequent payments, known as variation margin, are made or received by the Fund based on the change in the market value of the position and are recorded as unrealized appreciation or depreciation until the contract is closed out, at which time the gain or loss is realized. A Fund may lose the expected benefit of futures transactions if interest rates, exchange rates or securities prices change in an unanticipated manner. Such unanticipated changes may also result in lower overall performance than if the Fund had not entered into any futures transactions. In addition, the value of a Fund's futures positions may not prove to be perfectly or even highly correlated with the value of its portfolio securities or foreign currencies, limiting a Fund's ability to hedge effectively against interest rate, exchange rate and/or market risk and giving rise to additional risks. There is no assurance of liquidity in the secondary market for purposes of closing out futures positions. The collateral held by the Funds is presented on the Statements of Assets and Liabilities under Deposit with broker for futures contracts.
As of December 31, 2018, the Funds entered into Futures Contracts primarily for the strategy of hedging or other purposes, including but not limited to, providing liquidity and equitizing cash.
Offsetting of Financial Assets and Derivatives Assets:
The Funds are subject to various Master Netting Arrangements, which govern the terms of certain transactions with select counterparties. The Master Netting Arrangements allow the Funds to close out and net total exposure to a counterparty in the event of a default with respect to all the transactions governed under a single agreement with a counterparty. The Master Netting Arrangements also specify collateral posting arrangements at pre-arranged exposure levels. Under the Master Netting Arrangements, collateral is routinely transferred if the total net exposure to certain transactions (net of existing collateral already in place) governed under the relevant Master Netting Arrangement with a counterparty in a given account exceeds a specified threshold depending on the counterparty and the type of Master Netting Arrangement.
176
Victory Portfolios II | | Notes to Financial Statements — continued
December 31, 2018 | |
(Unaudited)
The table below, as of December 31, 2018, discloses both gross information and net information about instruments and transactions eligible for offset in the Statements of Assets and Liabilities and instruments and transactions that are subject to an agreement similar to a master netting agreement as well as amounts related to collateral held at clearing brokers and counterparties.
Assets | | Gross Amounts
of Recognized
Assets | | Gross Amounts
Available for
Offset | | Net Amounts
Presented in the
Statements of
Assets and
Liabilities | | Cash
Collateral
Received | | Net Amount | |
US 500 Volatility Wtd ETF | |
Futures | |
Goldman Sachs & Co. | | $ | 2,139 | | | $ | — | | | $ | 2,139 | | | $ | — | | | $ | 2,139 | | |
US Small Cap Volatility Wtd ETF | |
Futures | |
Goldman Sachs & Co. | | | 1,620 | | | | — | | | | 1,620 | | | | — | | | | 1,620 | | |
US Large Cap High Div Volatility Wtd ETF | |
Futures | |
Goldman Sachs & Co. | | | 2,880 | | | | — | | | | 2,880 | | | | — | | | | 2,880 | | |
US Small Cap High Div Volatility Wtd ETF | |
Futures | |
Goldman Sachs & Co. | | | 2,025 | | | | — | | | | 2,025 | | | | — | | | | 2,025 | | |
US Multi-Factor Minimum Volatility ETF | |
Futures | |
Goldman Sachs & Co. | | | 960 | | | | — | | | | 960 | | | | — | | | | 960 | | |
US 500 Enhanced Volatility Wtd ETF | |
Futures | |
Goldman Sachs & Co. | | | 4,058 | | | | — | | | | 4,058 | | | | — | | | | 4,058 | | |
US EQ Income Enhanced
Volatility Wtd ETF | |
Futures | |
Goldman Sachs & Co. | | | 8,335 | | | | — | | | | 8,335 | | | | — | | | | 8,335 | | |
US Discovery Enhanced Volatility Wtd ETF | |
Futures | |
Goldman Sachs & Co. | | | 6,480 | | | | — | | | | 6,480 | | | | — | | | | 6,480 | | |
Developed Enhanced Volatility Wtd ETF | |
Futures | |
Goldman Sachs & Co. | | | 280 | | | | — | | | | 280 | | | | — | | | | 280 | | |
Liabilities | | Gross Amounts
of Recognized
Liabilities | | Gross Amounts
Available for
Offset | | Net Amounts
Presented in the
Statements of
Assets and
Liabilities | | Cash
Collateral
Received | | Net Amount | |
Emerging Market Volatility Wtd ETF | |
Futures | |
Goldman Sachs & Co. | | $ | 525 | | | $ | — | | | $ | 525 | | | $ | (525 | ) | | $ | — | | |
Emerging Market High Div Volatility Wtd ETF | |
Futures | |
Goldman Sachs & Co. | | | 350 | | | | — | | | | 350 | | | | (350 | ) | | | — | | |
177
Victory Portfolios II | | Notes to Financial Statements — continued
December 31, 2018 | |
(Unaudited)
Summary of Derivative Instruments:
The following table summarizes the fair values of derivative instruments on the Statements of Assets and Liabilities, categorized by risk exposure, as of December 31, 2018:
| | | Asset Location | | Liability Location | |
Risk Exposure | | Variation Margin
Receivable on Open
Futures Contracts* | | Variation Margin
Payable on Open
Futures Contracts* | |
Futures Contracts | |
Equity Risk | |
US 500 Volatility Wtd ETF | | $ | 4,805 | | | $ | — | | |
US Small Cap Volatility Wtd ETF | | | — | | | | 12,191 | | |
Emerging Market Volatility Wtd ETF | | | — | | | | 402 | | |
US Large Cap High Div Volatility Wtd ETF | | | — | | | | 9,795 | | |
US Small Cap High Div Volatility Wtd ETF | | | — | | | | 14,850 | | |
Emerging Market High Div Volatility Wtd ETF | | | — | | | | 1,158 | | |
US Multi-Factor Minimum Volatility ETF | | | 1431 | | | | — | | |
US 500 Enhanced Volatility Wtd ETF | | | 5,580 | | | | — | | |
US EQ Income Enhanced Volatility Wtd ETF | | | — | | | | 7,384 | | |
US Discovery Enhanced Volatility Wtd ETF | | | — | | | | 42,079 | | |
Developed Enhanced Volatility ETF | | | — | | | | 12,958 | | |
* Includes cumulative appreciation (depreciation) of futures contracts as reported on the Schedules of Portfolio Investments. Only current day's variation margin is reported within the Statements of Assets and Liabilities.
The following table presents the effect of derivative instruments on the Statements of Operations, categorized by risk exposure, for the six months ended December 31, 2018:
| | | Net Realized
Gains (Losses) on
Derivatives
Recognized as a
Result from
Operations | | Net Change in Unrealized
Appreciation/Depreciation
on Derivatives Recognized
as a Result of Operations | |
Risk Exposure | | Net Realized
Gains (Losses) from
Futures Contracts | | Net Change in Unrealized
Appreciation (Depreciation)
on Futures Contracts | |
Futures Contracts | |
Equity Risk | |
US 500 Volatility Wtd ETF | | $ | (54,304 | ) | | $ | 68,514 | | |
US Small Cap Volatility Wtd ETF | | | (18,388 | ) | | | (6,233 | ) | |
International Volatility Wtd ETF | | | (6,963 | ) | | | 54 | | |
Emerging Market Volatility Wtd ETF | | | (22,394 | ) | | | 7,316 | | |
US Large Cap High Div Volatility Wtd ETF | | | (58,153 | ) | | | (47 | ) | |
US Small Cap High Div Volatility Wtd ETF | | | (62,854 | ) | | | (12,153 | ) | |
International High Div Volatility Wtd ETF | | | (65,924 | ) | | | 4,857 | | |
Emerging Market High Div Volatility Wtd ETF | | | (20,688 | ) | | | (414 | ) | |
US Multi-Factor Minimum Volatility ETF | | | (10,707 | ) | | | 1,431 | | |
US 500 Enhanced Volatility Wtd ETF | | | (82,704 | ) | | | 111,593 | | |
US EQ Income Enhanced Volatility Wtd ETF | | | (279,285 | ) | | | 49,549 | | |
US Discovery Enhanced Volatility Wtd ETF | | | (56,276 | ) | | | (26,105 | ) | |
Developed Enhanced Volatility ETF | | | (125,613 | ) | | | (3,170 | ) | |
All open derivative positions at period end are reflected in each respective Fund's Schedule of Portfolio Investments. The underlying face value of open derivative positions relative to each Fund's net assets at period end is generally representative of the notional amount of open positions to net assets throughout the period.
178
Victory Portfolios II | | Notes to Financial Statements — continued
December 31, 2018 | |
(Unaudited)
Investment Transactions and Related Income:
Changes in holdings of investments are accounted for no later than one business day following the trade date. For financial reporting purposes, however, investment transactions are accounted for on trade date on the last business day of the reporting period. Interest income is recognized on an accrual basis and includes, where applicable, the amortization of premiums or accretion of discounts. Dividend income is recorded on the ex-dividend date. Gains or losses realized on sales of securities are determined by comparing the identified cost of the security lot sold with the net sales proceeds.
Withholding taxes on interest, dividends and gains as a result of certain investments in ADRs by the Funds have been provided for in accordance with each investment's applicable country's tax rules and rates.
Securities Lending:
The Trust has entered into a Master Securities Lending Agreement ("MSLA") with Citibank, N.A. ("Citibank" or the "Agent"). Under the terms of the MSLA, the Funds may lend securities to certain broker-dealers and banks in exchange for collateral in the amount of at least 102% of the value of U.S. securities loaned or at least 105% of the value of non-U.S. securities loaned, marked-to-market daily. Any collateral shortfalls associated with increases in the valuation of the securities loaned are adjusted the next business day. The collateral can be received in the form of cash collateral and/or non-cash collateral. Non-cash collateral can include U.S. Government Securities, letters of credit and certificates of deposit. The cash collateral is invested in short-term instruments or cash equivalents as noted in the Funds' Schedules of Portfolio Investments. The Trust does not have effective control of the non-cash collateral and therefore it is not disclosed in the Funds' Schedules of Portfolio Investments. The Funds continue to benefit from interest or dividends on the securities loaned and may also earn a return from the collateral. The Funds pay various fees in connection with the investment of cash collateral. The Funds pay the Agent fees based on the investment income received from securities lending activities. Securities lending income is disclosed on the Statements of Operations. Although risk is mitigated by the collateral, the Funds could experience a delay in recovering their securities and possible loss of income or value if the borrower fails to return them.
Securities lending transactions are entered into by a Fund under the MSLA, which permits the Fund, under certain circumstances such as an event of default, to offset amounts payable by the Fund to the same counterparty against amounts receivable from the counterparty to create a net payment due to or from the Fund.
The following table is a summary of the Funds' securities lending transactions which are subject to offset under the MSLA as of December 31, 2018. These transactions are accounted for as secured borrowings with an overnight and continuous contractual maturity for cash collateral, and greater than overnight and continuous contractual maturity for non-cash collateral.
| | | Gross
Amount of
Recognized
Assets
(Value of | | Value of
Cash | | Value of Non-cash Collateral Received
by Maturity | | | |
Fund | | Securities
on Loan) | | Collateral
Received | | <30 Days | | Between 30 &
90 Days | | >90 Days | | Net Amount | |
US 500 Volatility Wtd ETF | | $ | 30,509,804 | | | $ | 30,969,761 | | | $ | — | | | $ | — | | | $ | — | | | $ | 459,957 | | |
US Small Cap Volatility
Wtd ETF | | | 1,443,303 | | | | 1,486,600 | | | | — | | | | — | | | | — | | | | 43,297 | | |
International Volatility
Wtd ETF | | | 348,960 | | | | 253,628 | | | | — | | | | — | | | | 453,878 | | | | 358,546 | | |
Emerging Market Volatility
Wtd ETF | | | 159,667 | | | | 311,011 | | | | 24,454 | | | | 383 | | | | 471,148 | | | | 647,329 | | |
US Large Cap High Div
Volatility Wtd ETF | | | 3,636,055 | | | | 3,728,077 | | | | — | | | | — | | | | — | | | | 92,022 | | |
US Small Cap High Div
Volatility Wtd ETF | | | 3,272,170 | | | | 3,366,953 | | | | — | | | | — | | | | — | | | | 94,783 | | |
179
Victory Portfolios II | | Notes to Financial Statements — continued
December 31, 2018 | |
(Unaudited)
| | | Gross
Amount of
Recognized
Assets
(Value of | | Value of
Cash | | Value of Non-cash Collateral Received
by Maturity | | | |
Fund | | Securities
on Loan) | | Collateral
Received | | <30 Days | | Between 30 &
90 Days | | >90 Days | | Net Amount | |
International High Div
Volatility Wtd ETF | | $ | 2,166,864 | | | $ | 1,367,356 | | | $ | — | | | $ | — | | | $ | 1,243,268 | | | $ | 443,760 | | |
Emerging Market High Div
Volatility Wtd ETF | | | — | | | | — | | | | — | | | | — | | | | — | | | | — | | |
Dividend Accelerator ETF | | | 146,562 | | | | 148,203 | | | | — | | | | — | | | | — | | | | 1,641 | | |
US Multi-Factor Minimum
Volatility ETF | | | — | | | | — | | | | — | | | | — | | | | — | | | | — | | |
US 500 Enhanced Volatility
Wtd ETF | | | 1,579,110 | | | | 1,583,234 | | | | — | | | | — | | | | — | | | | 4,124 | | |
US EQ Income Enhanced
Volatility Wtd ETF | | | 1,279,039 | | | | 1,299,559 | | | | — | | | | — | | | | — | | | | 20,520 | | |
US Discovery Enhanced
Volatility Wtd ETF | | | 1,336,147 | | | | 1,378,389 | | | | — | | | | — | | | | — | | | | 42,242 | | |
Developed Enhanced
Volatility Wtd ETF | | | 505,051 | | | | 473,443 | | | | — | | | | — | | | | 420,947 | | | | 389,339 | | |
Foreign Currency Translations:
The accounting records of the Funds are maintained in U.S. dollars. Investment securities and other assets and liabilities of a Fund denominated in a foreign currency are translated into U.S. dollars at current exchange rates. Purchases and sales of securities, income receipts and expense payments are translated into U.S. dollars at the exchange rates on the date of the transactions. The Funds do not isolate the portion of the results of operations resulting from changes in foreign exchange rates on investments from fluctuations arising from changes in market prices of securities held. Such fluctuations are disclosed as net change in unrealized appreciation/depreciation on investments and foreign currency translations on the Statements of Operations. Any realized gains or losses from these fluctuations are disclosed as net realized gains or losses from investment transactions and foreign currency translations on the Statements of Operations.
Foreign Taxes:
The Funds may be subject to foreign taxes related to foreign income received (a portion of which may be reclaimable), capital gains on the sale of securities, and certain foreign currency transactions. All foreign taxes are recorded in accordance with the applicable regulations and rates that exist in the foreign jurisdictions in which the Funds invest.
Dividends to Shareholders:
Dividends from net investment income, if any, are declared and paid monthly for the Funds. Distributable net realized gains, if any, are declared and distributed at least annually from each Fund.
The amounts of dividends from net investment income and distributions from net realized gains are determined in accordance with federal income tax regulations, which may differ from GAAP. To the extent these "book/tax" differences are permanent in nature (e.g., net operating loss, distribution reclassification, and deemed distribution due to shareholder redemptions), such amounts are reclassified within the components of net assets based on their federal tax-basis treatment; temporary differences (e.g., wash sales) do not require reclassification. To the extent dividends and distributions exceed net investment income and net realized gains for tax purposes, they are reported as distributions of capital. Net investment losses incurred by a Fund may be reclassified as an offset to capital on the accompanying Statements of Assets and Liabilities.
180
Victory Portfolios II | | Notes to Financial Statements — continued
December 31, 2018 | |
(Unaudited)
Federal Income Taxes:
It is the policy of each Fund to continue to qualify as a regulated investment company by complying with the provisions available to certain investment companies, as defined in applicable sections of the Internal Revenue Code, and to make distributions of net investment income and net realized gains sufficient to relieve it from all, or substantially all, federal income taxes. Accordingly, no provision for federal income taxes is required in the financial statements. The Funds have a tax year end of June 30.
Management of the Funds has reviewed tax positions taken in tax years that remain subject to examination by all major tax jurisdictions, including federal (i.e., the last four tax year ends and the interim tax period since then). Management believes that there is no tax liability resulting from unrecognized tax benefits related to uncertain tax positions taken.
Allocations:
Expenses directly attributable to a Fund are charged to the Fund, while expenses which are attributable to more than one fund in the Trust, or jointly with an affiliated trust, are allocated among the respective funds in the Trust and/or affiliated trust based upon net assets or another appropriate basis.
Affiliated Securities Transactions:
Pursuant to Rule 17a-7 under the 1940 Act, the Funds may engage in securities transactions with affiliated investment companies and advisory accounts managed by the Adviser and any applicable sub-adviser. Any such purchase or sale transaction must be effected without brokerage commission or other remuneration, except for customary transfer fees. The transaction must be effected at the current market price, which is either the security's last sale price on an exchange or, if there are no transactions in the security that day, at the average of the highest bid and lowest asked price. For the six months ended December 31, 2018, the Funds did not engage in any Rule 17a-7 transactions under the 1940 Act.
3. Purchases and Sales of Securities:
Purchases and sales of securities (excluding securities maturing less than one year from acquisition and in-kind transactions) for the six months ended December 31, 2018 were as follows:
Fund | | Purchases | | Sales | |
US 500 Volatility Wtd ETF | | $ | 104,573,783 | | | $ | 101,559,613 | | |
US Small Cap Volatility Wtd ETF | | | 11,602,392 | | | | 11,531,839 | | |
International Volatility Wtd ETF | | | 6,305,547 | | | | 6,043,140 | | |
Emerging Market Volatility Wtd ETF | | | 7,294,922 | | | | 8,289,300 | | |
US Large Cap High Div Volatility Wtd ETF | | | 40,338,423 | | | | 40,003,488 | | |
US Small Cap High Div Volatility Wtd ETF | | | 25,367,141 | | | | 25,098,336 | | |
International High Div Volatility Wtd ETF | | | 19,274,300 | | | | 1,823,781 | | |
Emerging Market High Div Volatility Wtd ETF | | | 14,475,397 | | | | 1,773,584 | | |
Dividend Accelerator ETF | | | 957,441 | | | | 957,667 | | |
US Multi-Factor Minimum Volatility ETF | | | 1,839,152 | | | | 2,015,294 | | |
US 500 Enhanced Volatility Wtd ETF | | | 181,211,119 | | | | 13,972,683 | | |
US EQ Income Enhanced Volatility Wtd ETF | | | 225,264,767 | | | | 9,811,062 | | |
US Discovery Enhanced Volatility Wtd ETF | | | 130,342,003 | | | | 96,650,017 | | |
Developed Enhanced Volatility Wtd ETF | | | 48,739,608 | | | | 120,777,760 | | |
For the six months ended December 31, 2018, there were no purchases or sales of U.S. Government Securities.
In-kind transactions associated with purchases and sales for the six months ended December 31, 2018 were as follows:
| | | Purchases | | Sales | |
US 500 Volatility Wtd ETF | | $ | 205,995,475 | | | $ | 113,015,500 | | |
US Small Cap Volatility Wtd ETF | | | 17,129,381 | | | | 19,227,870 | | |
International Volatility Wtd ETF | | | 6,557,788 | | | | — | | |
Emerging Market Volatility Wtd ETF | | | — | | | | — | | |
181
Victory Portfolios II | | Notes to Financial Statements — continued
December 31, 2018 | |
(Unaudited)
| | | Purchases | | Sales | |
US Large Cap High Div Volatility Wtd ETF | | $ | 82,589,036 | | | $ | 50,470,943 | | |
US Small Cap High Div Volatility Wtd ETF | | | 32,964,736 | | | | 21,771,604 | | |
International High Div Volatility Wtd ETF | | | 1,630,060 | | | | — | | |
Emerging Market High Div Volatility Wtd ETF | | | 656,147 | | | | 1,937,740 | | |
Dividend Accelerator ETF | | | 4,430,751 | | | | 1,473,737 | | |
US Multi-Factor Minimum Volatility ETF | | | 47,412,637 | | | | 25,894,712 | | |
US 500 Enhanced Volatility Wtd ETF | | | 328,865,531 | | | | 227,815,869 | | |
US EQ Income Enhanced Volatility Wtd ETF | | | 338,767,528 | | | | 198,339,146 | | |
US Discovery Enhanced Volatility Wtd ETF | | | 55,526,847 | | | | 38,565,854 | | |
Developed Enhanced Volatility Wtd ETF | | | 1,652,562 | | | | 17,632,907 | | |
4. Fees and Transactions with Affiliates and Related Parties:
Investment advisory services are provided to the Funds by Victory Capital Management Inc. ("VCM" or the "Adviser"), a New York corporation registered as an investment adviser with the Securities and Exchange Commission ("SEC"). The Adviser is a wholly-owned indirect subsidiary of Victory Capital Holdings, Inc., a publicly traded Delaware corporation and a wholly-owned direct subsidiary of Victory Capital Operating, LLC.
Under the terms of the Investment Advisory Agreements, the Adviser is entitled to receive fees based on a percentage of the average daily net assets of each Fund. The rates at which the Adviser is paid by each Fund are included in the table below. The Adviser may use its resources to assist with the Funds' distribution and marketing expenses.
| | | Adviser Fee Rate | |
US 500 Volatility Wtd ETF | | | 0.30 | % | |
US Small Cap Volatility Wtd ETF | | | 0.30 | % | |
International Volatility Wtd ETF | | | 0.40 | % | |
Emerging Market Volatility Wtd ETF | | | 0.45 | % | |
US Large Cap High Div Volatility Wtd ETF | | | 0.30 | % | |
US Small Cap High Div Volatility Wtd ETF | | | 0.30 | % | |
International High Div Volatility Wtd ETF | | | 0.40 | % | |
Emerging Market High Div Volatility Wtd ETF | | | 0.45 | % | |
Dividend Accelerator ETF | | | 0.30 | % | |
US Multi-Factor Minimum Volatility ETF | | | 0.30 | % | |
US 500 Enhanced Volatility Wtd ETF | | | 0.30 | % | |
US EQ Income Enhanced Volatility Wtd ETF | | | 0.30 | % | |
US Discovery Enhanced Volatility Wtd ETF | | | 0.30 | % | |
Developed Enhanced Volatility ETF | | | 0.40 | % | |
VCM also serves as the Funds' administrator and fund accountant. Under an Administration and Fund Accounting Agreement, VCM is paid for its services an annual fee at a rate of 0.08% of the first $15 billion in average daily net assets of the Trust, Victory Variable Insurance Funds and Victory Portfolios (collectively, the "Trusts"), 0.05% of the average daily net assets above $15 billion to $30 billion of the Trusts and 0.04% of the average daily net assets over $30 billion of the Trusts.
Citi Fund Services Ohio, Inc. ("Citi"), an affiliate of Citibank, N.A., acts as sub-administrator and sub-fund accountant to the Funds pursuant to a Sub-Administration and Sub-Fund Accounting Services Agreement between VCM and Citi. VCM pays Citi a fee for providing these services. The Trust reimburses VCM and Citi for all of their reasonable out-of-pocket expenses incurred in providing these services.
Citibank, N.A. also serves as the Funds' Transfer Agent.
Foreside Fund Services, LLC ("Foreside") serves as the Funds' distributor.
The Chief Compliance Officer ("CCO") is an employee of the Adviser, which pays the compensation of the CCO and his support staff. The Trust has entered into an Agreement to provide compliance services with the Adviser, pursuant to which the Adviser furnishes its compliance personnel, including the
182
Victory Portfolios II | | Notes to Financial Statements — continued
December 31, 2018 | |
(Unaudited)
services of the CCO, and other resources reasonably necessary to provide the Trust with compliance oversight services related to the design, administration and oversight of a compliance program for the Trust in accordance with Rule 38a-1 under the 1940 Act. Funds in the Trust, Victory Variable Insurance Funds, Victory Institutional Funds and Victory Portfolios (collectively, the "Victory Funds Complex"), in the aggregate, compensate the Adviser for these services.
The Victory Funds Complex pays an annual retainer to each Independent Trustee, plus an additional annual retainer to the Chairman of the Board. The aggregate amount of the fees and expenses of the Independent Trustees are allocated amongst all the funds in the Victory Funds Complex and are presented in the Statements of Operations.
Shearman & Sterling LLP provides legal services to the Trust.
The Adviser has entered into expense limitation agreements with the Funds. Under the terms of the agreements, the Adviser has agreed to waive fees or reimburse certain expenses to the extent that ordinary operating expenses incurred by the Funds in any fiscal year exceed the expense limit for such Fund. Such excess amount will be the liability of the Adviser. Interest, taxes, brokerage commissions, other expenditures which are capitalized in accordance with GAAP, and other extraordinary expenses not incurred in the ordinary course of a Fund's business are excluded from the expense limits. As of December 31, 2018, the expense limits (excluding voluntary waivers) are as follows:
| | | In effect July 1, 2018
until October 31, 2019 | |
US 500 Volatility Wtd ETF | | | 0.35 | % | |
US Small Cap Volatility Wtd ETF | | | 0.35 | % | |
International Volatility Wtd ETF | | | 0.45 | % | |
Emerging Market Volatility Wtd ETF | | | 0.50 | % | |
US Large Cap High Div Volatility Wtd ETF | | | 0.35 | % | |
US Small Cap High Div Volatility Wtd ETF | | | 0.35 | % | |
International High Div Volatility Wtd ETF | | | 0.45 | % | |
Emerging Market High Div Volatility Wtd ETF | | | 0.50 | % | |
Dividend Accelerator ETF | | | 0.35 | % | |
US Multi-Factor Minimum Volatility ETF | | | 0.35 | % | |
US 500 Enhanced Volatility Wtd ETF | | | 0.35 | % | |
US EQ Income Enhanced Volatility Wtd ETF | | | 0.35 | % | |
US Discovery Enhanced Volatility Wtd ETF | | | 0.35 | % | |
Developed Enhanced Volatility Wtd ETF | | | 0.45 | % | |
The Funds have agreed to repay fees and expenses that were waived or reimbursed by the Adviser for a period up to three fiscal years after such waiver or reimbursement was made to the extent such payments or repayments would not cause the expenses of a class to exceed the original expense limitation in place at the time of the waiver or reimbursement or any expense limitation agreement in place at the time of repayment. Amounts repaid to the Adviser during the year, if any, are reflected on the Statements of Operations as "Recoupment of prior expenses waived/reimbursed by Adviser".
As of December 31, 2018, the following amounts are available to be repaid to the Adviser:
Fund | | Expires
6/30/19 | | Expires
6/30/20 | | Expires
6/30/21 | | Expires
6/30/22 | | Total | |
US 500 Volatility Wtd ETF | | $ | 99,395 | | | $ | 144,075 | | | $ | 149,989 | | | $ | 74,785 | | | $ | 468,244 | | |
US Small Cap Volatility Wtd ETF | | | 81,175 | | | | 57,777 | | | | 29,566 | | | | 13,603 | | | | 182,121 | | |
International Volatility Wtd ETF | | | 141,495 | | | | 137,905 | | | | 91,734 | | | | 38,719 | | | | 409,853 | | |
Emerging Market Volatility Wtd ETF | | | 135,767 | | | | 328,831 | | | | 194,086 | | | | 93,736 | | | | 752,420 | | |
US Large Cap High Div Volatility Wtd ETF | | | 76,158 | | | | 75,818 | | | | 59,758 | | | | 25,560 | | | | 237,294 | | |
US Small Cap High Div Volatility Wtd ETF | | | 51,660 | | | | 45,472 | | | | 29,681 | | | | 13,400 | | | | 140,213 | | |
International High Div Volatility Wtd ETF | | | 74,062 | | | | 73,555 | | | | 47,955 | | | | 23,718 | | | | 219,290 | | |
Emerging Market High Div Volatility Wtd ETF | | | — | | | | — | | | | 47,982 | | | | 44,310 | | | | 92,292 | | |
Dividend Accelerator ETF | | | — | | | | 11,553 | | | | 20,087 | | | | 8,314 | | | | 39,954 | | |
US Multi-Factor Minimum Volatility ETF | | | — | | | | 4,204 | | | | 16,990 | | | | 7,880 | | | | 29,074 | | |
US 500 Enhanced Volatility Wtd ETF | | | 271,284 | | | | 212,940 | | | | 219,577 | | | | 115,054 | | | | 818,855 | | |
183
Victory Portfolios II | | Notes to Financial Statements — continued
December 31, 2018 | |
(Unaudited)
Fund | | Expires
6/30/19 | | Expires
6/30/20 | | Expires
6/30/21 | | Expires
6/30/22 | | Total | |
US EQ Income Enhanced Volatility Wtd ETF | | $ | 219,924 | | | $ | 217,731 | | | $ | 178,795 | | | $ | 87,697 | | | $ | 704,147 | | |
US Discovery Enhanced Volatility Wtd ETF | | | 124,242 | | | | 73,330 | | | | 48,147 | | | | 22,566 | | | | 268,285 | | |
Developed Enhanced Volatility Wtd ETF | | | 285,869 | | | | 185,004 | | | | 140,353 | | | | 65,645 | | | | 676,871 | | |
The Adviser may voluntarily waive or reimburse additional fees to assist the Funds in maintaining competitive expense ratios. Voluntary waivers and reimbursements applicable to the Funds are not available to be recouped at a future time. The Adviser voluntarily waived the following administration fees for the six months ended December 31, 2018:
US 500 Volatility Wtd ETF | | $ | 85,943 | | |
US Small Cap Volatility Wtd ETF | | | 5,608 | | |
International Volatility Wtd ETF | | | 2,873 | | |
Emerging Market Volatility Wtd ETF | | | 2,523 | | |
US Large Cap High Div Volatility Wtd ETF | | | 20,685 | | |
US Small Cap High Div Volatility Wtd ETF | | | 6,761 | | |
International High Div Volatility Wtd ETF | | | 6,130 | | |
Emerging Market High Div Volatility Wtd ETF | | | 2,853 | | |
Dividend Accelerator ETF | | | 1,076 | | |
US Multi-Factor Minimum Volatility ETF | | | 2,781 | | |
US 500 Enhanced Volatility Wtd ETF | | | 143,927 | | |
US EQ Income Enhanced Volatility Wtd ETF | | | 111,487 | | |
US Discovery Enhanced Volatility Wtd ETF | | | 16,778 | | |
Developed Enhanced Volatility ETF | | | 22,664 | | |
Certain officers and/or interested trustees of the Funds are also officers and/or employees of the Adviser, Administrator, Fund Accountant, Sub-Administrator, Sub-Fund Accountant, and Legal.
5. Risks:
Each Fund may be subject to other risks in addition to these identified risks.
An investment in the Funds' shares represents an indirect investment in the securities owned by the Funds, some of which will be traded on a national securities exchange or in the over-the-counter markets. The value of the securities in which the Funds invest, like other market investments, may move up or down, sometimes rapidly and unpredictably. The value of the securities in which the Funds invest may affect the value of the Funds' shares. An investment in the Funds' shares at any point in time may be worth less than the original investment, even after taking into account the reinvestment of the Funds' distributions.
The Developed Enhanced Volatility Wtd ETF, International Volatility Wtd ETF, Emerging Market Volatility Wtd ETF, International High Div Volatility Wtd ETF and Emerging Market High Div Volatility Wtd ETF invest in securities of foreign issuers in various countries. Investing on an international basis involves certain risks not involved in domestic investments including the risk of nationalization or expropriation of assets, imposition of currency exchange controls or restrictions on the repatriation of foreign currency, confiscatory taxation, political or financial instability and diplomatic developments, which could affect the value of a Fund's investments in certain foreign countries. Governments of many countries have exercised and continue to exercise substantial influence over many aspects of the private sector through the ownership or control of many companies, including some of the largest in these countries. As a result, government actions in the future could have a significant effect on economic conditions which may adversely affect prices of certain portfolio securities. There is also generally less government supervision and regulation of stock exchanges, brokers and listed companies than in the U.S. Dividends or interest on, or proceeds from the sale of, foreign securities may be subject to foreign withholding taxes, and special U.S. tax considerations may apply. Moreover, foreign economies may differ favorably or unfavorably from the U.S. economy in such respects as growth of gross national product, rate of inflation, capital re-investment, resource self-sufficiency and balance of payments
184
Victory Portfolios II | | Notes to Financial Statements — continued
December 31, 2018 | |
(Unaudited)
position. The Schedule of Portfolio Investments includes information on each Fund's holdings, including industry and/or geographic composition, as relevant.
The Funds will be subject to credit risk with respect to the amount each expects to receive from counterparties for financial instruments entered into by the Funds. The Funds may be negatively impacted if a counterparty becomes bankrupt or otherwise fails to perform its obligations due to financial difficulties. The Funds may experience significant delays in obtaining any recovery in bankruptcy or other reorganization proceeding and the Funds may obtain only limited recovery or may obtain no recovery in such circumstances. The Funds typically enter into transactions with counterparties whose credit ratings are investment grade, as determined by a nationally recognized statistical rating organization or, if unrated, judged by the Adviser to be of comparable quality.
6. Borrowing:
Line of Credit:
The Victory Funds Complex participates in a short-term, demand note "Line of Credit" agreement with Citibank. Under the agreement with Citibank, the Victory Funds Complex may borrow up to $250 million, of which $100 million is committed and $150 million is uncommitted. $40 million of the Line of Credit is reserved for use by the Victory Floating Rate Fund, another series of the Victory Funds Complex, with that Fund paying the related commitment fees for that amount. The purpose of the agreement is to meet temporary or emergency cash needs, including redemption requests that might otherwise require the untimely disposition of securities. The current agreement was amended on July 27, 2018 with a new termination date of July 26, 2019. Citibank receives an annual commitment fee of 0.15% on $100 million for providing the Line of Credit. For the six months ended December 31, 2018, Citibank earned approximately $76,000 in commitment fees from the Victory Funds Complex. Each fund in the Victory Funds Complex pays a pro-rata portion of the commitment fees plus any interest on amounts borrowed. Interest accrued by each Fund during the period is presented on the Statements of Operations under Interest expense on line of credit.
The average loans for the days outstanding and average interest rate for each Fund during the six months ended December 31, 2018 were as follows:
Fund | | Amount
Outstanding at
December 31, 2018 | | Average
Borrowing* | | Days
Borrowing
Outstanding | | Average
Interest
Rate* | | Maximum
Borrowing
During
the Period | |
Developed Enhanced
Volatility ETF | | $ | — | | | $ | 3,250,000 | | | | 2 | | | | 3.22 | % | | $ | 4,100,000 | | |
Emerging Market High Div
Volatility Wtd ETF | | | — | | | | 1,830,000 | | | | 5 | | | | 3.24 | % | | | 4,100,000 | | |
Emerging Market Volatility
Wtd ETF | | | — | | | | 1,112,500 | | | | 8 | | | | 3.31 | % | | | 2,400,000 | | |
International
Volatility Wtd ETF | | | — | | | | 500,000 | | | | 1 | | | | 3.22 | % | | | 500,000 | | |
US Discovery Enhanced
Volatility Wtd ETF | | | — | | | | 20,650,000 | | | | 2 | | | | 3.30 | % | | | 40,000,000 | | |
* For the six months ended December 31, 2018, based on the number of days borrowings were outstanding.
7. Federal Income Tax Information:
The tax character of current year distributions paid and the tax basis of current components of accumulated earnings (deficit) will be determined at the end of the current tax year ending June 30, 2019.
185
Victory Portfolios II | | Notes to Financial Statements — continued
December 31, 2018 | |
(Unaudited)
The tax character of distributions paid during the most recent tax year ended June 30, 2018 were as follows (total distributions paid may differ from the Statements of Changes in Net Assets because, for tax purposes, dividends are recognized when actually paid):
| | | Year Ended June 30, 2018 | |
| | | Distributions paid from | |
| | | Ordinary
Income | | Net
Long-Term
Capital Gains | | Total
Taxable
Distributions | | Total
Distributions
Paid | |
US 500 Volatility Wtd ETF | | $ | 5,493,806 | | | $ | — | | | $ | 5,493,806 | | | $ | 5,493,806 | | |
US Small Cap Volatility Wtd ETF | | | 350,537 | | | | — | | | | 350,537 | | | | 350,537 | | |
International Volatility Wtd ETF | | | 470,597 | | | | — | | | | 470,597 | | | | 470,597 | | |
Emerging Market Volatility Wtd ETF | | | 1,460,731 | | | | 164,191 | | | | 1,624,922 | | | | 1,624,922 | | |
US Large Cap High Div Volatility
Wtd ETF | | | 4,292,079 | | | | — | | | | 4,292,079 | | | | 4,292,079 | | |
US Small Cap High Div Volatility
Wtd ETF | | | 1,457,987 | | | | — | | | | 1,457,987 | | | | 1,457,987 | | |
International High Div Volatility
Wtd ETF | | | 1,619,642 | | | | — | | | | 1,619,642 | | | | 1,619,642 | | |
Emerging Market High Div Volatility
Wtd ETF | | | 334,938 | | | | — | | | | 334,938 | | | | 334,938 | | |
Dividend Accelerator ETF | | | 116,651 | | | | — | | | | 116,651 | | | | 116,651 | | |
US Multi-Factor Minimum
Volatility ETF | | | 98,875 | | | | 9 | | | | 98,884 | | | | 98,884 | | |
US 500 Enhanced Volatility
Wtd ETF | | | 8,545,250 | | | | — | | | | 8,545,250 | | | | 8,545,250 | | |
US EQ Income Enhanced Volatility
Wtd ETF | | | 18,927,936 | | | | — | | | | 18,927,936 | | | | 18,927,936 | | |
US Discovery Enhanced Volatility
Wtd ETF | | | 914,103 | | | | — | | | | 914,103 | | | | 914,103 | | |
Developed Enhanced Volatility
Wtd ETF | | | 3,545,391 | | | | — | | | | 3,545,391 | | | | 3,545,391 | | |
As of the most recent tax year ended June 30, 2018, the components of accumulated earnings (deficit) on a tax basis were as follows:
| | | Undistributed
Ordinary
Income | | Undistributed
Long-Term
Capital Gains | | Accumulated
Earnings | �� | Accumulated
Capital and
Other
Losses | | Qualified
Late-Year
Losses* | | Unrealized
Appreciation
(Depreciation)** | | Total
Accumulated
Earnings
(Deficit) | |
US 500 Volatility
Wtd ETF | | $ | 470,528 | | | $ | — | | | $ | 470,528 | | | $ | (9,492,420 | ) | | $ | — | | | $ | 35,226,930 | | | $ | 26,205,038 | | |
US Small Cap Volatility
Wtd ETF | | | 21,536 | | | | — | | | | 21,536 | | | | (1,852,738 | ) | | | — | | | | 2,543,483 | | | | 712,281 | | |
International Volatility
Wtd ETF | | | 56,209 | | | | — | | | | 56,209 | | | | (530,605 | ) | | | — | | | | 918,287 | | | | 443,891 | | |
Emerging Market
Volatility Wtd
ETF | | | 415,019 | | | | 584,060 | | | | 999,079 | | | | — | | | | — | | | | 462,803 | | | | 1,461,882 | | |
US Large Cap High Div
Volatility Wtd
ETF | | | 130,562 | | | | — | | | | 130,562 | | | | (6,196,442 | ) | | | — | | | | 4,668,214 | | | | (1,397,666 | ) | |
US Small Cap High Div
Volatility Wtd
ETF | | | 15,645 | | | | — | | | | 15,645 | | | | (3,162,220 | ) | | | — | | | | 2,491,104 | | | | (655,471 | ) | |
International High Div
Volatility Wtd
ETF | | | 163,477 | | | | — | | | | 163,477 | | | | (782,720 | ) | | | (10,238 | ) | | | (1,129,267 | ) | | | (1,758,748 | ) | |
186
Victory Portfolios II | | Notes to Financial Statements — continued
December 31, 2018 | |
(Unaudited)
| | | Undistributed
Ordinary
Income | | Undistributed
Long-Term
Capital Gains | | Accumulated
Earnings | | Accumulated
Capital and
Other
Losses | | Qualified
Late-Year
Losses* | | Unrealized
Appreciation
(Depreciation)** | | Total
Accumulated
Earnings
(Deficit) | |
Emerging Market
High Div Volatility
Wtd ETF | | $ | 199,635 | | | $ | — | | | $ | 199,635 | | | $ | — | | | $ | — | | | $ | (2,128,571 | ) | | $ | (1,928,936 | ) | |
Dividend Accelerator
ETF | | | 8,321 | | | | — | | | | 8,321 | | | | (219,881 | ) | | | — | | | | 353,627 | | | | 142,067 | | |
US Multi-Factor
Minimum
Volatility ETF | | | 12,708 | | | | — | | | | 12,708 | | | | (128,204 | ) | | | — | | | | 171,757 | | | | 56,261 | | |
US 500 Enhanced
Volatility Wtd ETF | | | 805,102 | | | | — | | | | 805,102 | | | | (19,630,500 | ) | | | — | | | | 55,633,448 | | | | 36,808,050 | | |
US EQ Income
Enhanced Volatility
Wtd ETF | | | 840,475 | | | | — | | | | 840,475 | | | | (31,336,433 | ) | | | — | | | | 18,811,953 | | | | (11,684,005 | ) | |
US Discovery
Enhanced Volatility
Wtd ETF | | | 68,759 | | | | — | | | | 68,759 | | | | (8,938,341 | ) | | | — | | | | 10,001,747 | | | | 1,132,165 | | |
Developed Enhanced
Volatility Wtd ETF | | | 461,520 | | | | — | | | | 461,520 | | | | (5,852,164 | ) | | | — | | | | 4,183,931 | | | | (1,206,713 | ) | |
* Under the current tax law, net investment losses realized after October 31 or December 31 of a Fund's fiscal year may be deferred and treated as occurring on the first business day of the following fiscal year for tax purposes.
** The difference between the book-basis and tax-basis of unrealized appreciation (depreciation) is attributable primarily to tax deferral of losses on wash sales.
As of the most recent tax year ended June 30, 2018, the following Funds had net capital loss carry-forwards ("CLCFs") (no expiration) as summarized in the tables below. CLCFs subject to expiration are applied as short-term capital loss regardless of whether the originating capital loss was short-term or long-term. CLCFs that are not subject to expiration are applied as either short-term or long-term depending on the originating capital loss and must be utilized before those that are subject to expiration.
| | | Short-Term
Amount | | Long-Term
Amount | | Total | |
US 500 Volatility Wtd ETF | | $ | 7,759,276 | | | $ | 1,733,144 | | | $ | 9,492,420 | | |
US Small Cap Volatility Wtd ETF | | | 1,327,291 | | | | 525,447 | | | | 1,852,738 | | |
International Volatility Wtd ETF | | | 334,173 | | | | 196,432 | | | | 530,605 | | |
US Large Cap High Div Volatility Wtd ETF | | | 4,504,746 | | | | 1,691,696 | | | | 6,196,442 | | |
US Small Cap High Div Volatility Wtd ETF | | | 2,143,764 | | | | 1,018,456 | | | | 3,162,220 | | |
International High Div Volatility Wtd ETF | | | 342,094 | | | | 440,626 | | | | 782,720 | | |
Dividend Accelerator ETF | | | 169,518 | | | | 50,363 | | | | 219,881 | | |
US Multi-Factor Minimum Volatility ETF | | | 128,204 | | | | — | | | | 128,204 | | |
US 500 Enhanced Volatility Wtd ETF | | | 14,385,063 | | | | 5,245,437 | | | | 19,630,500 | | |
US EQ Income Enhanced Volatility Wtd ETF | | | 23,267,688 | | | | 8,068,745 | | | | 31,336,433 | | |
US Discovery Enhanced Volatility Wtd ETF | | | 7,610,477 | | | | 1,327,864 | | | | 8,938,341 | | |
Developed Enhanced Volatility Wtd ETF | | | 5,489,277 | | | | 362,887 | | | | 5,852,164 | | |
187
Victory Portfolios II | | Notes to Financial Statements — continued
December 31, 2018 | |
(Unaudited)
At December 31, 2018, the cost basis for federal income tax purposes, gross unrealized appreciation, gross unrealized depreciation, and net unrealized appreciation (depreciation) for investments were as follows:
| | Cost of
Investments
for Federal
Tax Purposes | | Gross
Unrealized
Appreciation | | Gross
Unrealized
Depreciation | | Net
Unrealized
Appreciation
(Depreciation) | |
US 500 Volatility Wtd ETF | | $ | 672,496,807 | | | $ | 20,115,820 | | �� | $ | (75,591,520 | ) | | $ | (55,475,700 | ) | |
US Small Cap Volatility Wtd ETF | | | 40,197,846 | | | | 689,282 | | | | (7,122,818 | ) | | | (6,433,536 | ) | |
International Volatility Wtd ETF | | | 27,596,315 | | | | 803,752 | | | | (2,550,240 | ) | | | (1,746,488 | ) | |
Emerging Market Volatility
Wtd ETF | | | 17,406,388 | | | | 1,517,602 | | | | (1,665,255 | ) | | | (147,653 | ) | |
US Large Cap High Div Volatility
Wtd ETF | | | 180,848,666 | | | | 3,909,057 | | | | (18,315,720 | ) | | | (14,406,663 | ) | |
US Small Cap High Div Volatility
Wtd ETF | | | 58,588,845 | | | | 1,270,166 | | | | (8,739,636 | ) | | | (7,469,470 | ) | |
International High Div Volatility
Wtd ETF | | | 49,371,044 | | | | 472,268 | | | | (6,845,842 | ) | | | (6,373,574 | ) | |
Emerging Market High Div
Volatility Wtd ETF | | | 19,791,043 | | | | 295,399 | | | | (2,470,446 | ) | | | (2,175,047 | ) | |
Dividend Accelerator ETF | | | 10,054,389 | | | | 232,381 | | | | (471,067 | ) | | | (238,686 | ) | |
US Multi-Factor Minimum Volatility
ETF | | | 28,054,957 | | | | 125,400 | | | | (1,628,545 | ) | | | (1,503,145 | ) | |
US 500 Enhanced Volatility
Wtd ETF | | | 1,025,554,052 | | | | 28,223,316 | | | | (128,409,441 | ) | | | (100,186,125 | ) | |
US EQ Income Enhanced Volatility
Wtd ETF | | | 884,876,586 | | | | 22,371,642 | | | | (100,721,962 | ) | | | (78,350,320 | ) | |
US Discovery Enhanced Volatility
Wtd ETF | | | 126,012,403 | | | | 788,165 | | | | (13,294,691 | ) | | | (12,506,526 | ) | |
Developed Enhanced Volatility
ETF | | | 143,822,786 | | | | 1,933,626 | | | | (3,691,916 | ) | | | (1,758,290 | ) | |
8. Recent Accounting Pronouncements:
In October 2016, the SEC released its Final Rules on Investment Company Reporting Modernization (the "Rules"). The Rules introduced a new regulatory reporting form for investment companies — Form N-PORT. The Funds' compliance date for Form N-PORT was June 1, 2018, and the Funds will make their initial filing with the SEC on Form N-PORT for the period ending March 31, 2019. Effective with the period ended June 30, 2018, the Funds were required to maintain, and make available to the SEC upon request, the information required to be included in Form N-PORT. Form N-PORT will replace Form N-Q filings effective with the requirement to file the Form N-PORT with the SEC for the period ending March 31, 2019. The Funds' adoption of this amendment has no effect on the Fund's net assets or results of operations.
In August 2018, the FASB issued ASU No. 2018-13, "Fair Value Measurements" ("ASU 2018-13"). This update makes certain removals from, changes to and additions to existing disclosure requirements for fair value measurements. ASU 2018-13 does not change fair value measurements already required or permitted by existing standards. ASU 2018-13 is effective for financial statements issued for fiscal years beginning after December 15, 2019, and interim periods within those fiscal years. As permitted, the Funds have early adopted ASU 2018-13 with the financial statements prepared as of December 31, 2018.
In August 2018, the SEC adopted amendments to certain financial statement disclosure requirements to conform them to GAAP for investment companies. These amendments made certain disclosure requirements effective under Regulation S-X. The Funds' adoption of these amendments, effective with the financial statements prepared as of December 31, 2018 had no effect on the Funds' net assets or results of operations. As a result of adopting these amendments, the distributions to shareholders in
188
Victory Portfolios II | | Notes to Financial Statements — continued
December 31, 2018 | |
(Unaudited)
the June 30, 2018 Statements of Changes in Net Assets presented herein have been reclassified to conform to the current year presentation, which includes all distributions to each class of shareholders, other than tax basis return of capital distributions, in one line item per share class. Distributions to shareholders for the year ended June 30, 2018 from net investment income and net realized gains in the Funds were as follows:
| | | US 500
Volatility Wtd ETF | | US Small Cap
Volatility Wtd ETF | | International
Volatility Wtd ETF | |
Distributions to Shareholders: | |
From net investment income: | | $ | (5,493,806 | ) | | $ | (350,537 | ) | | $ | (470,597 | ) | |
From net Realized Gains: | | | — | | | | — | | | | — | | |
| | | Emerging Market
Volatility Wtd ETF | | US Large Cap
High Div
Volatility Wtd ETF | | US Small Cap
High Div
volatility Wtd ETF | |
Distributions to Shareholders: | |
From net investment income: | | $ | (592,927 | ) | | $ | (4,292,079 | ) | | $ | (1,457,987 | ) | |
From net Realized Gains: | | | (1,031,995 | ) | | | — | | | | — | | |
| | | International
High Div
Volatility Wtd ETF | | Emerging Market
High Div
Volatility Wtd ETF | | Dividend
Accelerator ETF | |
Distributions to Shareholders: | |
From net investment income: | | $ | (1,619,642 | ) | | $ | (334,938 | ) | | $ | (116,651 | ) | |
From net Realized Gains: | | | — | | | | — | | | | — | | |
| | | US Multi-factor
Minimum
Volatility ETF | | US 500 Enhanced
Volatility Wtd ETF | | US EQ Income
Enhanced
Volatility Wtd ETF | |
Distributions to Shareholders: | |
From net investment income: | | $ | (98,884 | ) | | $ | (8,545,250 | ) | | $ | (18,927,936 | ) | |
From net Realized Gains: | | | — | | | | — | | | | — | | |
| | | US Discovery
Enhanced
Volatility Wtd ETF | | Developed
Enhanced
Volatility Wtd ETF | |
Distributions to Shareholders: | |
From net investment income: | | $ | (914,103 | ) | | $ | (3,545,391 | ) | |
From net Realized Gains: | | | — | | | | — | | |
9. Subsequent Events:
The Funds have evaluated the need for additional disclosures or adjustments resulting from subsequent events through the date these financial statements were issued. Based on this evaluation, there were no subsequent events to report that would have a material impact on the Funds' financial statements.
189
Victory Portfolios II | | Supplemental Information
December 31, 2018 | |
(Unaudited)
Trustee and Officer Information
Board of Trustees:
Overall responsibility for management of the Trust rests with the Board. The Trust is managed by the Board in accordance with the laws of the State of Delaware. There are currently ten Trustees, nine of whom are not "interested persons" of the Trust within the meaning of that term under the 1940 Act ("Independent Trustees") and one of whom is an "interested person" of the Trust within the meaning of that term under the 1940 Act ("Interested Trustee"). The Trustees, in turn, elect the officers of the Trust to actively supervise its day-to-day operations. The following tables list the Trustees, their ages, position with the Trust, commencement of service, principal occupations during the past five years and any directorships of other investment companies or companies whose securities are registered under the Securities Exchange Act of 1934, as amended, or who file reports under that Act. Each Trustee oversees 20 portfolios in the Trust, nine portfolios in Victory Variable Insurance Funds, one portfolio in Victory Institutional Funds and 42 portfolios in Victory Portfolios, each a registered investment company that, together with the Trust, comprise the Victory Funds Complex. Each Trustee's address is c/o Victory Portfolios II, 4900 Tiedeman Road, 4th Floor, Brooklyn, Ohio 44144. Each Trustee has an indefinite term.
Name and Age | | Position
Held with
the Trust | | Date
Commenced
Service | | Principal Occupation
During Past 5 Years | | Other
Directorships
Held During
Past 5 Years | |
Independent Trustees. | |
David Brooks Adcock, 67 | | Trustee | | May 2015 | | Consultant (since 2006). | | Chair and Trustee, Turner Funds (December 2016-December 2017). | |
Nigel D. T. Andrews, 71 | | Vice Chair and Trustee | | May 2015 | | Retired. | | Director, TCG BDC II, Inc. (since 2017); Director, TCG BDC I, Inc. (formerly Carlyle GMS Finance, Inc.) (since 2012); Director, Old Mutual US Asset Management (2002-2014). | |
E. Lee Beard, 67* | | Trustee | | May 2015 | | Retired (since 2015); Consultant, The Henlee Group, LLC (consulting) (2005-2015). | | None. | |
190
Victory Portfolios II | | Supplemental Information — continued
December 31, 2018 | |
(Unaudited)
Name and Age | | Position
Held with
the Trust | | Date
Commenced
Service | | Principal Occupation
During Past 5 Years | | Other
Directorships
Held During
Past 5 Years | |
Dennis M. Bushe, 75 | | Trustee | | July 2016 | | Retired. | | Trustee, RS Investment Trust and RS Variable Products Trust (November 2011-July 2016). | |
Sally M. Dungan, 64 | | Trustee | | May 2015 | | Chief Investment Officer, Tufts University (since 2002). | | None. | |
John L. Kelly, 65 | | Trustee | | May 2015 | | Partner, McCarvill Capital Partners (September 2016-September 2017); Advisor (January 2016-April 2016) and Managing Partner (August 2014-January 2016), Endgate Commodities LLC; Chief Operating Officer, Liquidnet Holdings, Inc. (2011-2014). | | Director, Caledonia Mining Corporation (since May 2012). | |
David L. Meyer, 61* | | Trustee | | May 2015 | | Retired. | | None. | |
Gloria S. Nelund, 57 | | Trustee | | July 2016 | | Chair, CEO and Co-Founder of TriLinc Global, LLC, an investment firm. | | TriLinc Global Impact Fund, LLC (since 2012); Trustee, RS Investment Trust and RS Variable Products Trust (November 2007-July 2016). | |
Leigh A. Wilson, 74 | | Chair and Trustee | | May 2015 | | Private Investor. | | Chair (since 2013), Caledonia Mining Corporation. | |
Interested Trustee. | |
David C. Brown, 46** | | Trustee | | May 2015 | | Chairman and Chief Executive Officer (since 2013), Co-Chief Executive Officer (2011-2013), the Adviser; Chairman and Chief Executive Officer, Victory Capital Holdings, Inc. (since 2013). | | None. | |
* The Board has designated Mr. Meyer and Ms. Beard as its Audit Committee Financial Experts.
** Mr. Brown is an "Interested Person" by reason of his relationship with the Adviser.
The Statement of Additional Information includes additional information about the Trustees of the Trust and is available, without charge, by calling 800-539-3863.
191
Victory Portfolios II | | Supplemental Information — continued
December 31, 2018 | |
(Unaudited)
Officers:
The officers of the Trust, their ages, commencement of service and their principal occupations during the past five years, are detailed in the following table. Each officer serves until the earlier of his or her resignation, removal, retirement, death, or the election of a successor. The mailing address of each officer of the Trust is 4900 Tiedeman Road, 4th Floor, Brooklyn, Ohio 44144. The officers of the Trust receive no compensation directly from the Trust for performing the duties of their offices.
Name and Age | | Position with
the Trust | | Date
Commenced
Service | | Principal Occupation During Past 5 Years | |
Christopher K. Dyer, 57 | | President | | May 2015 | | Director of Mutual Fund Administration, the Adviser. | |
Scott A. Stahorsky, 49 | | Vice President | | May 2015 | | Manager, Fund Administration, the Adviser (since 2015); Senior Analyst, Fund Administration, the Adviser (prior to 2015). | |
Erin G. Wagner, 45 | | Secretary | | May 2015 | | Associate General Counsel, the Adviser (since 2013). | |
Allan Shaer, 53 | | Treasurer | | December 2017 | | Senior Vice President, Financial Administration, Citi Fund Services Ohio, Inc. (since 2016); Vice President, Mutual Fund Administration, JP Morgan Chase (2011-2016). | |
Christopher A. Ponte, 34* | | Assistant Treasurer | | May 2015 | | Manager, Fund Administration, the Adviser (since 2017); Senior Analyst, Fund Administration, the Adviser (prior to 2017); Chief Financial Officer, Victory Capital Advisers, Inc. (since 2018). | |
Colin Kinney, 45 | | Chief Compliance Officer | | July 2017 | | Chief Compliance Officer (since 2013) and Chief Risk Officer (2009-2017), the Adviser. | |
Chuck Booth, 58 | | Anti-Money Laundering Compliance Officer and Identity Theft Officer | | May 2015 | | Director, Regulatory Administration and CCO Support Services, Citi Fund Services Ohio, Inc. | |
Jay G. Baris, 65 | | Assistant Secretary | | May 2015 | | Partner, Shearman & Sterling LLP (since 2018); Partner, Morrison & Foerster LLP (2011-2017). | |
* On December 5, 2017, Mr. Ponte resigned as Treasurer and accepted the position of Assistant Treasurer of the Trust.
192
Victory Portfolios II | | Supplemental Information — continued
December 31, 2018 | |
(Unaudited)
Proxy Voting and Form N-Q Information
Proxy Voting:
Information regarding the policies and procedures that each Fund uses to determine how to vote proxies relating to portfolio securities is available without charge, upon request, by calling 800-539-3863. The information is also included in the Funds' Statement of Additional Information, which is available on the SEC's website at www.sec.gov.
Information relating to how the Funds voted proxies relating to portfolio securities held during the most recent twelve months ended June 30 is available on the SEC's website at www.sec.gov.
Availability of Schedules of Portfolio Investments:
The Trust expects to file a complete list of Schedules of Portfolio Investments with the SEC for the first and third quarter of each fiscal year on Form N-PORT beginning March 1, 2019. Prior to that date, the Trust has filed a complete list of Schedules of Portfolio Investments with the SEC for the first and third quarters of each fiscal year on Form N-Q. Forms N-PORT and Forms N-Q are available on the SEC's website at www.sec.gov.
Expense Examples
As a shareholder of the Funds, you may incur two types of costs: (1) transaction costs, including sales charges (loads) on purchases; and (2) ongoing costs, including management fees, distribution and service (12b-1) fees, and other Fund expenses. These examples are intended to help you understand your ongoing costs (in dollars) of investing in the Funds and to compare these costs with the ongoing costs of investing in other mutual funds.
These examples are based on an investment of $1,000 invested at the beginning of the period and held for the entire period from July 1, 2018 through December 31, 2018.
The Actual Expense figures in the table below provide information about actual account values and actual expenses. You may use the information below, together with the amount you invested, to estimate the expenses that you paid over the period. Simply divide your account value by $1,000 (for example, an $8,600 account value divided by $1,000 = 8.6), then multiply the result by the number in the table under the heading entitled "Actual Expenses Paid During Period" to estimate the expenses you paid on your account during this period.
The Hypothetical Expense figures in the table below provide information about hypothetical account values and hypothetical expenses based on each Fund's actual expense ratio and an assumed rate of return of 5% per year before expenses, which is not the Fund's actual return. The hypothetical account values and expenses may not be used to estimate the actual ending account balance or expenses you paid for the period. You may use this information to compare this 5% hypothetical example with the 5% hypothetical examples that appear in shareholder reports of other funds.
Please note the expenses shown in the table are meant to highlight your ongoing costs only and do not reflect any transactional costs. Therefore, the table is useful in comparing ongoing costs only, and will not help you determine the relative total costs of owning different funds. In addition, if these transactional costs were included, your costs would have been higher.
| | Beginning
Account
Value
7/1/18 | | Actual
Ending
Account
Value
12/31/18 | | Hypothetical
Ending
Account
Value
12/31/18 | | Actual
Expenses
Paid
During
Period
7/1/18-
12/31/18* | | Hypothetical
Expenses
Paid
During
Period
7/1/18-
12/31/18* | | Annualized
Expense
Ratio
During
Period
7/1/18-
12/31/18 | |
US 500 Volatility
Wtd ETF | | $ | 1,000.00 | | | $ | 898.30 | | | $ | 1,023.44 | | | $ | 1.67 | | | $ | 1.79 | | | | 0.35 | % | |
US Small Cap Volatility
Wtd ETF | | | 1,000.00 | | | | 845.60 | | | | 1,023.44 | | | | 1.63 | | | | 1.79 | | | | 0.35 | | |
International Volatility
Wtd ETF | | | 1,000.00 | | | | 885.90 | | | | 1,022.94 | | | | 2.14 | | | | 2.29 | | | | 0.45 | | |
193
Victory Portfolios II | | Supplemental Information — continued
December 31, 2018 | |
(Unaudited)
| | Beginning
Account
Value
7/1/18 | | Actual
Ending
Account
Value
12/31/18 | | Hypothetical
Ending
Account
Value
12/31/18 | | Actual
Expenses
Paid
During
Period
7/1/18-
12/31/18* | | Hypothetical
Expenses
Paid
During
Period
7/1/18-
12/31/18* | | Annualized
Expense
Ratio
During
Period
7/1/18-
12/31/18 | |
Emerging Market Volatility
Wtd ETF | | $ | 1,000.00 | | | $ | 964.20 | | | $ | 1,022.68 | | | $ | 2.48 | | | $ | 2.55 | | | | 0.50 | % | |
US Large Cap High Div
Volatility Wtd ETF | | | 1,000.00 | | | | 933.90 | | | | 1,023.44 | | | | 1.71 | | | | 1.79 | | | | 0.35 | | |
US Small Cap High Div
Volatility Wtd ETF | | | 1,000.00 | | | | 887.80 | | | | 1,023.44 | | | | 1.67 | | | | 1.79 | | | | 0.35 | | |
International High Div
Volatility Wtd ETF | | | 1,000.00 | | | | 900.30 | | | | 1,022.94 | | | | 2.16 | | | | 2.29 | | | | 0.45 | | |
Emerging Market High Div
Volatility Wtd ETF | | | 1,000.00 | | | | 959.40 | | | | 1,022.68 | | | | 2.47 | | | | 2.55 | | | | 0.50 | | |
Dividend Accelerator ETF | | | 1,000.00 | | | | 983.30 | | | | 1,023.44 | | | | 1.75 | | | | 1.79 | | | | 0.35 | | |
US Multi-Factor Minimum
Volatility ETF | | | 1,000.00 | | | | 983.00 | | | | 1,023.44 | | | | 1.75 | | | | 1.79 | | | | 0.35 | | |
US 500 Enhanced Volatility
Wtd ETF | | | 1,000.00 | | | | 898.30 | | | | 1,023.44 | | | | 1.67 | | | | 1.79 | | | | 0.35 | | |
US EQ Income Enhanced
Volatility Wtd ETF | | | 1,000.00 | | | | 934.00 | | | | 1,023.44 | | | | 1.71 | | | | 1.79 | | | | 0.35 | | |
US Discovery Enhanced
Volatility Wtd ETF | | | 1,000.00 | | | | 837.90 | | | | 1,023.44 | | | | 1.62 | | | | 1.79 | | | | 0.35 | | |
Developed Enhanced
Volatility Wtd ETF | | | 1,000.00 | | | | 924.20 | | | | 1,022.94 | | | | 2.18 | | | | 2.29 | | | | 0.45 | | |
* Expenses are equal to the average account value multiplied by the Fund's annualized expense ratio multiplied by 184/365 (the number of days in the most recent fiscal half-year divided by the number of days in the fiscal year).
194
Victory Portfolios II | | Supplemental Information — continued
December 31, 2018 | |
(Unaudited)
Considerations of the Board in Continuing the Investment Advisory Agreement (the "Agreement")
The Board approved the Agreement on behalf of each of the Funds at a meeting, which was called for that purpose, on December 5, 2018. The Board also considered information relating to the Funds and the Agreement provided throughout the year and, more specifically, at a meeting on October 23, 2018. In considering whether to approve the Agreement, the Board requested, and the Adviser provided, information that the Board believed to be reasonably necessary to reach its conclusions. The Board, including the Independent Trustees, evaluated this information along with other information obtained throughout the year and was advised by legal counsel to the Funds and by independent legal counsel to the Independent Trustees. In addition, in 2017 the Independent Trustees, through their counsel, retained an independent consultant to assist with a review of the overall process for conducting the annual review of these advisory arrangements. The Board considered each Fund's advisory fee, expense ratio and investment performance as significant factors in determining whether the Agreement should be continued. In considering whether the compensation paid to the Adviser was fair and reasonable, the Board also evaluated, among other things, the following factors:
• The requirements of the Funds for the services provided by the Adviser;
• The nature, quality and extent of the services provided and expected to be provided;
• The performance of the Funds as compared to comparable funds;
• The fees payable for the services and whether the fee arrangements provided for economies of scale that would benefit Fund shareholders as the Funds grow;
• Whether the fee would be sufficient to enable the Adviser to attract and retain experienced personnel and continue to provide quality services to the Funds;
• Fees paid by other clients of the Adviser whose accounts are managed in a similar investment style and any differences in the services provided to the other clients compared to those provided to the Funds;
• Total expenses of each Fund, taking into consideration any distribution or shareholder servicing fees;
• Management's commitment to operating the Funds at competitive expense levels;
• The profitability of the Adviser (as reflected by comparing fees earned against an estimate of the Adviser's costs) with respect to the Adviser's relationship with the Funds;
• Research and other service benefits received by the Adviser obtained through payment of client commissions for securities transactions;
• Other benefits received by the Adviser, and its affiliates, including revenues paid to the Adviser, or its affiliates, by the Funds for administration and fund accounting services, and distribution;
• The capabilities and financial condition of the Adviser;
• Current economic and industry trends; and
• The historical relationship between each Fund and the Adviser.
The Board reviewed each Fund's current management fee in the context of the Adviser's profitability of the Fund. In addition, the Board compared each Fund's gross management fee and total expense ratio on a net and gross basis, taking into consideration any distribution or shareholder servicing fees, with the median gross management fee and median expense ratio of a universe of comparable exchange-traded funds ("ETFs") compiled by an independent consultant, FUSE Research Network, LLC ("FUSE"), and a peer group of funds with similar investment strategies selected by FUSE from the universe. The Board reviewed the factors and methodology used by FUSE in the selection of each Fund's peer group, including FUSE's selection of a broad universe of funds using the standard Retail Morningstar Categories, the more specific universe of comparable funds, and peer groups of funds with comparable investment strategies and asset levels, among other factors. The Board also reviewed any changes to FUSE's methodology as compared to the prior year, including as a result of input from the Adviser, if any.
The Board also reviewed the fee of a comparable mutual fund managed by the Adviser that is comparable to the VictoryShares US 500 Enhanced Volatility Wtd ETF and the differences in the services provided to the mutual fund. The Board noted that none of the advisory fee arrangements for the Funds included breakpoints, which are generally viewed as a method by which the investment adviser shares any economies of scale with a fund as a fund grows. The Board also considered the Adviser's commitment to limit expenses as discussed in more detail below.
195
Victory Portfolios II | | Supplemental Information — continued
December 31, 2018 | |
(Unaudited)
The Board found that the gross annual management fee paid by each Fund was within the range of management fees paid by each Fund's respective peer group. The Board also found that each Fund's net annual expense ratio was reasonable as compared with each Fund's respective peer group. The Board considered the Adviser's contractual agreement with each Fund to waive its fees and reimburse expenses for a specified period of time, as described in the Fund's prospectus.
With the understanding that each Fund had only one year of performance history, the Board reviewed each Fund's performance over a one-year period against the Fund's benchmark index noting that each Fund's investment objective is to track its proprietary benchmark index before fees and expenses. The Board recognized that the performance of each Fund is net of expenses, while the performance of each benchmark index is gross returns, and as a result, each Fund will generally underperform its benchmark index due to fees and expenses. The Board also considered each Fund's tracking error as a factor in evaluating performance. The Board considered the additional resources that the Adviser has committed to enhance portfolio analysis, compliance and trading systems.
The Board reviewed various other specific factors with respect to each Fund, as described below. In their deliberations, the Trustees did not rank the importance of any particular information or factor considered and each Trustee may have attributed different weights to various factors.
VictoryShares US 500 Volatility Wtd ETF
Noting that the Fund commenced operations in 2014, the Board compared the Fund's one- and three-year performance for the period ended June 30, 2018, to that of the median performance of the peer group and benchmark index for the same period and considered the fact that the Fund outperformed the peer group for the one- and three-year periods, and underperformed the benchmark index for the one- and three-year periods.
Having considered, among other things: (1) the Fund's management fee compared to comparable ETFs; (2) the Fund's total expense ratio compared to comparable ETFs; (3) that the Adviser's willingness to limit the expenses for a period of time would provide stability to the Fund's expenses during that period; and (4) that the Fund's performance in relation to its benchmark index and peer group was within an acceptable range, the Board concluded that the Agreement continued to be in the best interests of the Fund's shareholders.
VictoryShares US Small Cap Volatility Wtd ETF
Noting that the Fund commenced operations in 2015, the Board compared the Fund's one-year performance for the period ended June 30, 2018, to that of the median performance of the peer group and benchmark index for the same period and considered the fact that the Fund underperformed the benchmark index and matched the peer group. The Board noted the Fund's low tracking error for the period.
Having considered, among other things: (1) the Fund's management fee compared to comparable ETFs; (2) the Fund's total expense ratio compared to comparable ETFs; (3) that the Adviser's willingness to limit the expenses for a period of time would provide stability to the Fund's expenses during that period; and (4) that the Fund's performance in relation to its benchmark index and peer group was within an acceptable range, the Board concluded that the Agreement continued to be in the best interests of the Fund's shareholders.
VictoryShares International Volatility Wtd ETF
Noting that the Fund commenced operations in 2015, the Board compared the Fund's one-year performance for the period ended June 30, 2018, to that of the median performance of the peer group and benchmark index for the same period and considered the fact that the Fund underperformed both the benchmark index and the peer group. The Board noted the Fund's low tracking error for the period.
Having considered, among other things: (1) the Fund's management fee compared to comparable ETFs; (2) the Fund's total expense ratio compared to comparable ETFs; (3) that the Adviser's willingness to limit the expenses for a period of time would provide stability to the Fund's expenses during that period; and (4) that the Fund's performance in relation to its benchmark index and peer group was within an acceptable range, the Board concluded that the Agreement continued to be in the best interests of the Fund's shareholders.
VictoryShares Emerging Market Volatility Wtd ETF
Noting that the Fund commenced operations in 2016, the Board compared the Fund's one-year performance for the period ended June 30, 2018, to that of the median performance of the peer group and benchmark index
196
Victory Portfolios II | | Supplemental Information — continued
December 31, 2018 | |
(Unaudited)
for the same period and considered the fact that the Fund underperformed both the benchmark index and the peer group. The Board noted the Fund's higher tracking error for the period relative to its peers.
Having considered, among other things: (1) the Fund's management fee compared to comparable ETFs; (2) the Fund's total expense ratio compared to comparable ETFs; (3) that the Adviser's willingness to limit the expenses for a period of time would provide stability to the Fund's expenses during that period; and (4) that the Fund's performance in relation to its benchmark index and peer group was within an acceptable range, the Board concluded that the Agreement continued to be in the best interests of the Fund's shareholders.
VictoryShares US Large Cap High Div Volatility Wtd ETF
Noting that the Fund commenced operations in 2015, the Board compared the Fund's one-year performance for the period ended June 30, 2018, to that of the median performance of the peer group and benchmark index for the same period and considered the fact that the Fund underperformed both the benchmark index and the peer group. The Board noted the Fund's low tracking error for the period.
Having considered, among other things: (1) the Fund's management fee compared to comparable ETFs; (2) the Fund's total expense ratio compared to comparable ETFs; (3) that the Adviser's willingness to limit the expenses for a period of time would provide stability to the Fund's expenses during that period; and (4) that the Fund's performance in relation to its benchmark index and peer group was within an acceptable range, the Board concluded that the Agreement continued to be in the best interests of the Fund's shareholders.
VictoryShares US Small Cap High Div Volatility Wtd ETF
Noting that the Fund commenced operations in 2015, the Board compared the Fund's one-year performance for the period ended June 30, 2018, to that of the median performance of the peer group and benchmark index for the same period and considered the fact that the Fund underperformed the benchmark index and outperformed the peer group. The Board noted the Fund's low tracking error for the period.
Having considered, among other things: (1) the Fund's management fee compared to comparable ETFs; (2) the Fund's total expense ratio compared to comparable ETFs; (3) that the Adviser's willingness to limit the expenses for a period of time would provide stability to the Fund's expenses during that period; and (4) that the Fund's performance in relation to its benchmark index and peer group was within an acceptable range, the Board concluded that the Agreement continued to be in the best interests of the Fund's shareholders.
VictoryShares International High Div Volatility Wtd ETF
Noting that the Fund commenced operations in 2015, the Board compared the Fund's one-year performance for the period ended June 30, 2018, to that of the median performance of the peer group and benchmark index for the same period and considered the fact that the Fund underperformed both the benchmark index and peer group. The Board noted the Fund's low tracking error for the period relative to its peers.
Having considered, among other things: (1) the Fund's management fee compared to comparable ETFs; (2) the Fund's total expense ratio compared to comparable ETFs; (3) that the Adviser's willingness to limit the expenses for a period of time would provide stability to the Fund's expenses during that period; and (4) that the Fund's performance in relation to its benchmark index and peer group was within an acceptable range, the Board concluded that the Agreement continued to be in the best interests of the Fund's shareholders.
VictoryShares Emerging Market High Div Volatility Wtd ETF
The Board considered the Fund with the understanding that since the Fund began operations on October 25, 2017, comparative fee, expense and performance data was not yet available.
VictoryShares Dividend Accelerator ETF
Noting that the Fund commenced operations in 2017, the Board compared the Fund's one-year performance for the period ended June 30, 2018, to that of the median performance of the peer group for the same period and considered the fact that the Fund matched the performance of the peer group. The Board noted the Fund's low tracking error for the period relative to its peers.
Having considered, among other things: (1) the Fund's management fee compared to comparable ETFs; (2) the Fund's total expense ratio compared to comparable ETFs; (3) that the Adviser's willingness to limit the expenses
197
Victory Portfolios II | | Supplemental Information — continued
December 31, 2018 | |
(Unaudited)
for a period of time would provide stability to the Fund's expenses during that period; and (4) that the Fund's performance in relation to its benchmark index and peer group was within an acceptable range, the Board concluded that the Agreement continued to be in the best interests of the Fund's shareholders.
VictoryShares US Multi-Factor Minimum Volatility ETF
Noting that the Fund commenced operations in 2017, the Board compared the Fund's one-year performance for the period ended June 30, 2018, to that of the median performance of the peer group for the same period and considered the fact that the Fund outperformed the peer group. The Board noted the Fund's higher tracking error for the period relative to its peers.
Having considered, among other things: (1) the Fund's management fee compared to comparable ETFs; (2) the Fund's total expense ratio compared to comparable ETFs; (3) that the Adviser's willingness to limit the expenses for a period of time would provide stability to the Fund's expenses during that period; and (4) that the Fund's performance in relation to its benchmark index and peer group was within an acceptable range, the Board concluded that the Agreement continued to be in the best interests of the Fund's shareholders.
VictoryShares US 500 Enhanced Volatility Wtd ETF
Noting that the Fund commenced operations in 2014, the Board compared the Fund's one- and three-year performance for the period ended June 30, 2018, to that of the median performance of the peer group and benchmark index for the same periods and considered the fact that the Fund underperformed the benchmark index for both periods, underperformed the peer group for the one-year period, and outperformed the peer group for the three-year period. The Board noted the Fund's low tracking error for the periods.
Having considered, among other things: (1) the Fund's management fee compared to comparable ETFs; (2) the Fund's total expense ratio compared to comparable ETFs; (3) that the Adviser's willingness to limit the expenses for a period of time would provide stability to the Fund's expenses during that period; and (4) that the Fund's performance in relation to its benchmark index and peer group was within an acceptable range, the Board concluded that the Agreement continued to be in the best interests of the Fund's shareholders.
VictoryShares US EQ Income Enhanced Volatility Wtd ETF
Noting that the Fund commenced operations in 2014, the Board compared the Fund's one- and three-year performance for the periods ended June 30, 2018, to that of the median performance of the peer group and benchmark index for the same periods and considered the fact that the Fund underperformed the benchmark index for both periods, underperformed the peer group for the one-year period, and outperformed the peer group for the three-year period. The Board noted the Fund's low tracking error for the periods.
Having considered, among other things: (1) the Fund's management fee compared to comparable ETFs; (2) the Fund's total expense ratio compared to comparable ETFs; (3) that the Adviser's willingness to limit the expenses for a period of time would provide stability to the Fund's expenses during that period; and (4) that the Fund's performance in relation to its benchmark index and peer group was within an acceptable range, the Board concluded that the Agreement continued to be in the best interests of the Fund's shareholders.
VictoryShares US Discovery Enhanced Volatility Wtd ETF
Noting that the Fund commenced operations in 2014, the Board compared the Fund's one- and three-year performance for the periods ended June 30, 2018, to that of the median performance of the peer group and benchmark index for the same periods and considered the fact that the Fund underperformed the benchmark index for both periods, outperformed the peer group for the one-year period, and underperformed the peer group for the three-year period. The Board noted the Fund's low tracking error for the periods. The Board brought the Fund's underperformance to management's attention and discussed with the Adviser any steps that had been or could be taken to enhance performance in the future.
Having considered, among other things: (1) the Fund's management fee compared to comparable ETFs; (2) the Fund's total expense ratio compared to comparable ETFs; (3) that the Adviser's willingness to limit the expenses for a period of time would provide stability to the Fund's expenses during that period; and (4) that the Fund's performance in relation to its benchmark index and peer group was within an acceptable range, the Board concluded that the Agreement continued to be in the best interests of the Fund's shareholders.
198
Victory Portfolios II | | Supplemental Information — continued
December 31, 2018 | |
(Unaudited)
VictoryShares Developed Enhanced Volatility Wtd ETF
Noting that the Fund commenced operations in 2014, the Board compared the Fund's one- and three-year performance for the periods ended June 30, 2018, to that of the median performance of the peer group and benchmark index for the same periods and considered the fact that the Fund underperformed both the peer group and benchmark index for the periods reviewed. The Board noted the Fund's higher tracking error for the periods relative to its peers.
Having considered, among other things: (1) the Fund's management fee compared to comparable ETFs; (2) the Fund's total expense ratio compared to comparable ETFs; (3) that the Adviser's willingness to limit the expenses for a period of time would provide stability to the Fund's expenses during that period; and (4) that the Fund's performance in relation to its benchmark index and peer group was within an acceptable range, the Board concluded that the Agreement continued to be in the best interests of the Fund's shareholders.
Conclusion
Based on its review of the information requested and provided, and following extended discussions, the Board determined that the Agreement, on behalf of the Funds discussed above, was consistent with the best interests of each Fund and its shareholders, and the Board unanimously approved the Agreement, on behalf of each Fund, for an additional annual period on the basis of the foregoing review and discussions and the following considerations, among others:
• The fairness and reasonableness of the investment advisory fee payable to the Adviser under the Agreement in light of the investment advisory services provided, the costs of these services, the profitability of the Adviser's relationship with the Fund and the comparability of the fee paid to the fees paid by other investment companies, to the extent applicable;
• The nature, quality and extent of the investment advisory services provided by the Adviser;
• The Adviser's entrepreneurial commitment to the management of the Funds and the creation of a broad-based family of funds, which could entail a substantial commitment of the Adviser's resources to the successful operation of the Funds;
• The Adviser's representations regarding its staffing and capabilities to manage the Funds, including the retention of personnel with relevant portfolio management experience;
• The Adviser's efforts to enhance investment results by, among other things, developing quality portfolio management teams; and
• The overall high quality of the personnel, operations, financial condition, investment management capabilities, methodologies and performance of the Adviser.
199
Privacy Policy
Protecting the Privacy of Information
The Trust respects your right to privacy. We also know that you expect us to conduct and process your business in an accurate and efficient manner. To do so, we must collect and maintain certain personal information about you. This is the information we collect from you on applications or other forms, and from the transactions you make with us or third parties. It may include your name, address, social security number, account transactions and balances, and information about investment goals and risk tolerance.
We do not disclose any information about you or about former customers to anyone except as permitted or required by law. Specifically, we may disclose the information we collect to companies that perform services on our behalf, such as the transfer agent that processes shareholder accounts and printers and mailers that assist us in the distribution of investor materials. We may also disclose this information to companies that perform marketing services on our behalf. This allows us to continue to offer you Victory investment products and services that meet your investing needs, and to effect transactions that you request or authorize. These companies will use this information only in connection with the services for which we hired them. They are not permitted to use or share this information for any other purpose.
To protect your personal information internally, we permit access only by authorized employees and maintain physical, electronic and procedural safeguards to guard your personal information.*
* You may have received communications regarding information about privacy policies from other financial institutions which gave you the opportunity to "opt-out" of certain information sharing with companies which are not affiliated with that financial institution. The Trust does not share information with other companies for purposes of marketing solicitations for products other than the Trust. Therefore, the Trust does not provide opt-out options to their shareholders.
The Victory Funds
P.O. Box 182593
Columbus, Ohio
43218-2593

Visit our website at: | | Call Victory at: | |
www.vcm.com | | 866-376-7890 | |
VPII-VICTORYSHARESETF-SAR (12/18)
Item 2. Code of Ethics.
Not applicable — only for annual reports.
Item 3. Audit Committee Financial Expert.
Not applicable — only for annual reports.
Item 4. Principal Accountant Fees and Services.
Not applicable — only for annual reports.
Item 5. Audit Committee of Listed Registrants.
Not applicable.
Item 6. Investments.
(a) Not applicable.
(b) Not applicable.
Item 7. Disclosure of Proxy Voting Policies and Procedures for Closed-End Management Investment Companies.
Not applicable.
Item 8. Portfolio Managers of Closed-End Management Investment Companies.
Not applicable.
Item 9. Purchases of Equity Securities by Closed-End Management Investment Company and Affiliated Purchasers.
Not applicable.
Item 10. Submission of Matters to a Vote of Security Holders.
Not applicable.
Item 11. Controls and Procedures.
(a)The registrant’s principal executive officer and principal financial officer have concluded, based on their evaluation of the registrant’s disclosure controls and procedures as conducted within 90 days of the filing date of this report, that these disclosure controls and procedures are adequately designed and are operating effectively to ensure that information required to be disclosed by the registrant on Form N-CSR is recorded, processed, summarized and reported within the time periods specified in the Securities and Exchange Commission’s rules and forms.
(b)There were no changes in the registrant’s internal control over financial reporting (as defined in Rule 30a-3(d) under the Investment Company Act of 1940 (17 CFR 270.30a-3(d)) that occurred during the period covered by this report that have materially affected or are reasonably likely to materially affect, the registrant’s internal control over financial reporting.
Item 12. Disclosure of Securities Lending Activities for Closed-End Management Investment Companies.
(a)(1) Not applicable.
(a)(2) Not applicable.
(a)(3) Not applicable.
(a)(4) Not applicable.
(b) Not applicable.
Item 13. Exhibits.
(a)(1) Not applicable.
(a)(2) Certifications pursuant to Rule 30a-2(a) are attached hereto.
(a)(3) Not applicable.
(b) Certifications pursuant to Rule 30a-2(b) are furnished herewith.
SIGNATURES
Pursuant to the requirements of the Securities Exchange Act of 1934 and the Investment Company Act of 1940, the registrant has duly caused this report to be signed on its behalf by the undersigned, thereunto duly authorized.
(Registrant) | Victory Portfolios II | |
| | |
By (Signature and Title)* | /s/ Allan Shaer | |
| Allan Shaer, Principal Financial Officer | |
| | |
Date | March 7, 2019 | |
| | | | |
Pursuant to the requirements of the Securities Exchange Act of 1934 and the Investment Company Act of 1940, this report has been signed below by the following persons on behalf of the registrant and in the capacities and on the dates indicated.
By (Signature and Title)* | /s/ Christopher K. Dyer | |
| Christopher K. Dyer, Principal Executive Officer | |
| |
Date | March 7, 2019 | |
| | |
| | |
By (Signature and Title)* | /s/ Allan Shaer | |
| Allan Shaer, Principal Financial Officer | |
| | |
Date | March 7, 2019 | |
| | | |