UNITED STATES
SECURITIES AND EXCHANGE COMMISSION
Washington, D.C. 20549
FORM N-CSR
CERTIFIED SHAREHOLDER REPORT OF REGISTERED
MANAGEMENT INVESTMENT COMPANIES
Investment Company Act file number: 811-22696
Victory Portfolios II
(Exact name of registrant as specified in charter)
| | 4900 Tiedeman Road, 4th Floor, Brooklyn, Ohio | 44144 | |
| | (Address of principal executive offices) | (Zip code) | |
Citi Fund Services Ohio, Inc., 4400 Easton Commons, Suite 200, Columbus, OH 43219
(Name and address of agent for service)
Registrant’s telephone number, including area code: 800-539-3863
Date of fiscal year end: June 30
Date of reporting period: December 31, 2020
Item 1. Reports to Stockholders.

December 31, 2020
Semi Annual Report
Victory US 500 Enhanced Volatility Wtd Index Fund
Victory Market Neutral Income Fund
As permitted by regulations adopted by the Securities and Exchange Commission, paper copies of the Victory Funds' shareholder reports may no longer be sent by mail, unless you specifically request paper copies of the reports from the Victory Funds or from your financial intermediary, such as a broker-dealer or bank. Instead, the reports will be made available on www.VictoryFunds.com, and you will be notified by mail each time a report is posted and provided with a website link to access the report. If you already elected to receive shareholder reports electronically, you will not be affected by this change, and you need not take any action.
You may elect to receive all future reports in paper free of charge. If you invest through a financial intermediary, you can contact your financial intermediary to request that you continue to receive paper copies of your reports. If you invest directly with the Victory Funds, you can call 800-539-3863 (800-235-8396 for Member Class) or send an e-mail request to TA.Processing@FISGlobal.com. Your election to receive reports in paper will apply to all Victory Funds you hold directly or through your financial intermediary.
www.vcm.com
News, Information And Education 24 Hours A Day, 7 Days A Week
The Victory Funds site gives fund shareholders, prospective shareholders, and investment professionals a convenient way to access fund information, get guidance, and track fund performance anywhere they can access the Internet. The site includes:
• Detailed performance records
• Daily share prices
• The latest fund news
• Investment resources to help you become a better investor
• A section dedicated to investment professionals
Whether you're a potential investor searching for the fund that matches your investment philosophy, a seasoned investor interested in planning tools, or an investment professional, www.vcm.com has what you seek. Visit us anytime. We're always open.
Table of Contents
Financial Statements | |
Victory US 500 Enhanced Volatility Wtd
Index Fund | |
Investment Objectives & Portfolio Holdings | | | 3 | | |
Schedule of Portfolio Investments | | | 5-16 | | |
Statement of Assets and Liabilities | | | 34 | | |
Statement of Operations | | | 35 | | |
Statements of Changes in Net Assets | | | 36-37 | | |
Financial Highlights | | | 38-39 | | |
Victory Market Neutral Income Fund | |
Investment Objectives & Portfolio Holdings | | | 4 | | |
Schedule of Portfolio Investments | | | 17-33 | | |
Statement of Assets and Liabilities | | | 34 | | |
Statement of Operations | | | 35 | | |
Statements of Changes in Net Assets | | | 36-37 | | |
Financial Highlights | | | 40-41 | | |
Notes to Financial Statements | | | 42 | | |
Supplemental Information | | | 54 | | |
Proxy Voting and Portfolio Holdings Information | | | 54 | | |
Expense Examples | | | 54 | | |
Advisory Contract Approval | | | 55 | | |
Privacy Policy (inside back cover) | | | |
IRA DISTRIBUTION WITHHOLDING DISCLOSURE
We generally must withhold federal income tax at a rate of 10% of the taxable portion of your distribution and, if you live in a state that requires state income tax withholding, at your state's tax rate. However, you may elect not to have withholding apply or to have income tax withheld at a higher rate. Any withholding election that you make will apply to any subsequent distribution unless and until you change or revoke the election. If you wish to make a withholding election, or change or revoke a prior withholding election, call 800-539-3863 (800-235-8396 for Member Class) and form W-4P (OMB No. 1545-0074 withholding certificate for pension or annuity payments) will be electronically sent.
If you do not have a withholding election in place by the date of a distribution, federal income tax will be withheld from the taxable portion of your distribution at a rate of 10%. If you must pay estimated taxes, you may be subject to estimated tax penalties if your estimated tax payments are not sufficient and sufficient tax is not withheld from your distribution.
For more specific information, please consult your tax adviser.
1
The Victory Funds are distributed by Victory Capital Services, Inc. Victory Capital Management Inc. is the investment adviser to the Funds and receives fees from the Funds for performing services for the Funds.
This report is not authorized for distribution to prospective investors unless preceded or accompanied by a current prospectus of the Victory Funds.
For additional information about any Victory Fund, including fees, expenses, and risks, view our prospectus online at www.vcm.com or call 800-539-3863 (800-235-8396 for Member Class). Read it carefully before you invest or send money.
The information in this semi annual report is based on data obtained from recognized services and sources and is believed to be reliable. Any opinions, projections, or recommendations in this report are subject to change without notice and are not intended as individual investment advice. Past investment performance of the Funds, markets or securities mentioned herein should not be considered to be indicative of future results.
• NOT FDIC INSURED • NO BANK GUARANTEE
• MAY LOSE VALUE

Call Victory at:
800-539-FUND (800-539-3863)
800-235-8396 for Member Class
Visit our website at:
www.vcm.com
2
Victory Portfolios II
Victory US 500 Enhanced Volatility Wtd Index Fund | | December 31, 2020 | |
(Unaudited)
Investment Objective & Portfolio Holdings:
Victory US 500 Enhanced Volatility Wtd Index Fund seeks to provide investment results that track the performance of the Nasdaq Victory US Large Cap 500 Long/Cash Volatility Weighted Index before fees and expenses.
Sector Allocation*:
December 31, 2020
(% of Net Assets)
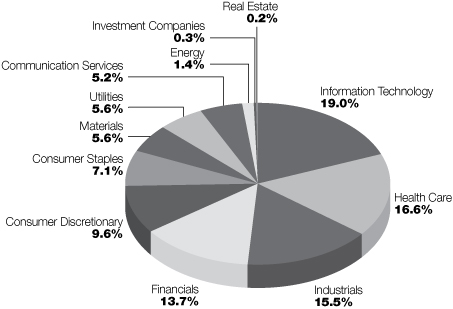
* Does not include futures, money market instruments, and short-term investments purchased with cash collateral from securities loaned.
Refer to the Schedule of Portfolio Investments for a complete list of securities.
Percentages are of the net assets of the Fund and may not equal 100%.
3
Victory Portfolios II
Victory Market Neutral Income Fund | | December 31, 2020 | |
(Unaudited)
Investment Objective & Portfolio Holdings:
Victory Market Neutral Income Fund objective is high current income.
Sector Allocation*:
December 31, 2020
(% of Net Assets)

* Does not include futures, money market instruments, and short-term investments purchased with cash collateral from securities loaned.
Refer to the Schedule of Portfolio Investments for a complete list of securities.
Percentages are of the net assets of the Fund and may not equal 100%.
4
Victory Portfolios II
Victory US 500 Enhanced Volatility Wtd Index Fund | | Schedule of Portfolio Investments
December 31, 2020 | |
(Unaudited)
Security Description | | Shares | | Value | |
Common Stocks (99.5%) | |
Communication Services (5.2%): | |
Activision Blizzard, Inc. | | | 1,796 | | | $ | 166,759 | | |
Alphabet, Inc., Class A (a) | | | 94 | | | | 164,748 | | |
Altice USA, Inc., Class A (a) (b) | | | 4,384 | | | | 166,022 | | |
ANGI Homeservices, Inc., Class A (a) (b) | | | 6,236 | | | | 82,284 | | |
AT&T, Inc. | | | 5,251 | | | | 151,019 | | |
Cable One, Inc. | | | 68 | | | | 151,485 | | |
CenturyLink, Inc. (b) | | | 9,877 | | | | 96,301 | | |
Charter Communications, Inc., Class A (a) | | | 276 | | | | 182,588 | | |
Comcast Corp., Class A | | | 3,343 | | | | 175,173 | | |
Discovery, Inc., Class A (a) (b) | | | 5,210 | | | | 156,769 | | |
DISH Network Corp., Class A (a) | | | 2,530 | | | | 81,820 | | |
Electronic Arts, Inc. | | | 1,172 | | | | 168,299 | | |
Facebook, Inc., Class A (a) | | | 441 | | | | 120,464 | | |
Fox Corp., Class A | | | 4,256 | | | | 123,935 | | |
Liberty Broadband Corp., Class C (a) | | | 1,099 | | | | 174,049 | | |
Netflix, Inc. (a) | | | 247 | | | | 133,560 | | |
Omnicom Group, Inc. | | | 2,282 | | | | 142,328 | | |
Sirius XM Holdings, Inc. (b) | | | 22,750 | | | | 144,918 | | |
Take-Two Interactive Software, Inc. (a) | | | 818 | | | | 169,972 | | |
The Interpublic Group of Cos., Inc. | | | 5,613 | | | | 132,018 | | |
The New York Times Co., Class A | | | 3,315 | | | | 171,618 | | |
T-Mobile U.S., Inc. (a) | | | 1,179 | | | | 158,988 | | |
Verizon Communications, Inc. | | | 3,741 | | | | 219,783 | | |
ViacomCBS, Inc., Class B | | | 2,721 | | | | 101,384 | | |
| | | | 3,536,284 | | |
Consumer Discretionary (9.6%): | |
Advance Auto Parts, Inc. | | | 751 | | | | 118,290 | | |
Amazon.com, Inc. (a) | | | 47 | | | | 153,076 | | |
Aptiv PLC | | | 883 | | | | 115,046 | | |
AutoZone, Inc. (a) | | | 112 | | | | 132,769 | | |
Best Buy Co., Inc. | | | 987 | | | | 98,493 | | |
Booking Holdings, Inc. (a) | | | 61 | | | | 135,863 | | |
BorgWarner, Inc. | | | 2,810 | | | | 108,578 | | |
Bright Horizons Family Solutions, Inc. (a) | | | 662 | | | | 114,519 | | |
CarMax, Inc. (a) | | | 905 | | | | 85,486 | | |
Chegg, Inc. (a) | | | 1,273 | | | | 114,990 | | |
Chipotle Mexican Grill, Inc. (a) | | | 87 | | | | 120,644 | | |
D.R. Horton, Inc. | | | 1,368 | | | | 94,283 | | |
Dollar General Corp. | | | 907 | | | | 190,742 | | |
Dollar Tree, Inc. (a) | | | 1,255 | | | | 135,590 | | |
Domino's Pizza, Inc. | | | 315 | | | | 120,790 | | |
eBay, Inc. | | | 3,060 | | | | 153,765 | | |
Etsy, Inc. (a) | | | 720 | | | | 128,095 | | |
Floor & Decor Holdings, Inc., Class A (a) | | | 1,207 | | | | 112,070 | | |
Garmin Ltd. | | | 1,456 | | | | 174,224 | | |
General Motors Co. | | | 3,135 | | | | 130,542 | | |
Gentex Corp. | | | 5,340 | | | | 181,187 | | |
See notes to financial statements.
5
Victory Portfolios II
Victory US 500 Enhanced Volatility Wtd Index Fund | | Schedule of Portfolio Investments — continued
December 31, 2020 | |
(Unaudited)
Security Description | | Shares | | Value | |
Genuine Parts Co. | | | 1,141 | | | $ | 114,591 | | |
Hasbro, Inc. | | | 1,296 | | | | 121,228 | | |
Hilton Worldwide Holdings, Inc. | | | 1,264 | | | | 140,633 | | |
Las Vegas Sands Corp. (c) | | | 1,910 | | | | 113,836 | | |
Lear Corp. | | | 847 | | | | 134,698 | | |
Lennar Corp., Class A | | | 1,111 | | | | 84,692 | | |
LKQ Corp. (a) | | | 2,661 | | | | 93,774 | | |
Lowe's Cos., Inc. | | | 681 | | | | 109,307 | | |
Marriott International, Inc., Class A | | | 830 | | | | 109,494 | | |
McDonald's Corp. | | | 631 | | | | 135,400 | | |
MGM Resorts International | | | 2,581 | | | | 81,327 | | |
Mohawk Industries, Inc. (a) | | | 822 | | | | 115,861 | | |
NIKE, Inc., Class B | | | 1,218 | | | | 172,310 | | |
NVR, Inc. (a) | | | 22 | | | | 89,757 | | |
O'Reilly Automotive, Inc. (a) | | | 280 | | | | 126,720 | | |
Pool Corp. | | | 397 | | | | 147,882 | | |
PulteGroup, Inc. | | | 1,903 | | | | 82,057 | | |
Ross Stores, Inc. | | | 1,113 | | | | 136,688 | | |
Service Corp. International | | | 2,863 | | | | 140,574 | | |
Starbucks Corp. | | | 1,435 | | | | 153,515 | | |
Target Corp. (c) | | | 972 | | | | 171,587 | | |
Tesla, Inc. (a) | | | 136 | | | | 95,971 | | |
The Home Depot, Inc. | | | 442 | | | | 117,404 | | |
The TJX Cos., Inc. | | | 2,042 | | | | 139,448 | | |
Tractor Supply Co. | | | 1,007 | | | | 141,565 | | |
Ulta Beauty, Inc. (a) | | | 377 | | | | 108,259 | | |
Vail Resorts, Inc. | | | 520 | | | | 145,059 | | |
VF Corp. | | | 1,490 | | | | 127,261 | | |
Whirlpool Corp. | | | 500 | | | | 90,245 | | |
Williams-Sonoma, Inc. | | | 959 | | | | 97,665 | | |
Yum! Brands, Inc. | | | 1,294 | | | | 140,477 | | |
| | | | 6,498,327 | | |
Consumer Staples (7.1%): | |
Archer-Daniels-Midland Co. | | | 3,163 | | | | 159,447 | | |
Brown-Forman Corp., Class B | | | 1,956 | | | | 155,365 | | |
Campbell Soup Co. | | | 3,432 | | | | 165,938 | | |
Casey's General Stores, Inc. | | | 722 | | | | 128,964 | | |
Church & Dwight Co., Inc. | | | 1,816 | | | | 158,410 | | |
Colgate-Palmolive Co. | | | 2,185 | | | | 186,839 | | |
Conagra Brands, Inc. | | | 3,889 | | | | 141,015 | | |
Costco Wholesale Corp. | | | 578 | | | | 217,779 | | |
General Mills, Inc. | | | 2,873 | | | | 168,933 | | |
Herbalife Nutrition Ltd. (a) | | | 2,094 | | | | 100,617 | | |
Hormel Foods Corp. | | | 3,682 | | | | 171,619 | | |
Kellogg Co. | | | 2,501 | | | | 155,637 | | |
Kimberly-Clark Corp. | | | 1,151 | | | | 155,189 | | |
Lamb Weston Holdings, Inc. | | | 1,564 | | | | 123,149 | | |
McCormick & Co., Inc. | | | 1,429 | | | | 136,612 | | |
Mondelez International, Inc., Class A | | | 2,773 | | | | 162,137 | | |
Monster Beverage Corp. (a) | | | 1,895 | | | | 175,250 | | |
See notes to financial statements.
6
Victory Portfolios II
Victory US 500 Enhanced Volatility Wtd Index Fund | | Schedule of Portfolio Investments — continued
December 31, 2020 | |
(Unaudited)
Security Description | | Shares | | Value | |
PepsiCo, Inc. | | | 1,066 | | | $ | 158,088 | | |
Philip Morris International, Inc. | | | 1,777 | | | | 147,118 | | |
Sysco Corp. | | | 1,366 | | | | 101,439 | | |
The Boston Beer Co., Inc., Class A (a) | | | 118 | | | | 117,326 | | |
The Clorox Co. | | | 837 | | | | 169,007 | | |
The Coca-Cola Co. | | | 3,308 | | | | 181,410 | | |
The Estee Lauder Cos., Inc., Class A | | | 612 | | | | 162,908 | | |
The Hershey Co. | | | 985 | | | | 150,045 | | |
The J.M. Smucker Co. | | | 1,430 | | | | 165,308 | | |
The Kroger Co. | | | 5,124 | | | | 162,738 | | |
The Procter & Gamble Co. | | | 1,214 | | | | 168,916 | | |
Tyson Foods, Inc., Class A | | | 1,801 | | | | 116,056 | | |
Walgreens Boots Alliance, Inc. | | | 3,270 | | | | 130,408 | | |
Walmart, Inc. | | | 1,288 | | | | 185,665 | | |
| | | | 4,779,332 | | |
Energy (1.4%): | |
Cabot Oil & Gas Corp. | | | 5,736 | | | | 93,382 | | |
Cheniere Energy, Inc. (a) | | | 2,035 | | | | 122,162 | | |
ConocoPhillips | | | 2,130 | | | | 85,179 | | |
EOG Resources, Inc. | | | 1,774 | | | | 88,469 | | |
Exxon Mobil Corp. | | | 2,842 | | | | 117,147 | | |
Kinder Morgan, Inc. | | | 7,246 | | | | 99,053 | | |
ONEOK, Inc. | | | 2,167 | | | | 83,169 | | |
Pioneer Natural Resources Co. | | | 708 | | | | 80,634 | | |
The Williams Cos., Inc. | | | 4,126 | | | | 82,726 | | |
Valero Energy Corp. | | | 1,487 | | | | 84,120 | | |
| | | | 936,041 | | |
Financials (13.7%): | |
Aflac, Inc. | | | 2,648 | | | | 117,757 | | |
Ally Financial, Inc. | | | 3,180 | | | | 113,399 | | |
American Express Co. | | | 890 | | | | 107,610 | | |
Ameriprise Financial, Inc. | | | 504 | | | | 97,942 | | |
Arch Capital Group Ltd. (a) | | | 3,111 | | | | 112,214 | | |
Ares Management Corp., Class A | | | 2,601 | | | | 122,377 | | |
Arthur J. Gallagher & Co. | | | 1,282 | | | | 158,596 | | |
Assurant, Inc. | | | 923 | | | | 125,731 | | |
Athene Holding Ltd., Class A (a) | | | 1,829 | | | | 78,903 | | |
Bank of America Corp. | | | 3,770 | | | | 114,269 | | |
Berkshire Hathaway, Inc., Class B (a) | | | 730 | | | | 169,265 | | |
BlackRock, Inc., Class A | | | 195 | | | | 140,700 | | |
Brown & Brown, Inc. | | | 3,143 | | | | 149,010 | | |
Cboe Global Markets, Inc. | | | 1,410 | | | | 131,299 | | |
Chubb Ltd. | | | 943 | | | | 145,147 | | |
Cincinnati Financial Corp. | | | 1,240 | | | | 108,339 | | |
Citigroup, Inc. | | | 1,623 | | | | 100,074 | | |
Citizens Financial Group, Inc. | | | 2,913 | | | | 104,169 | | |
CME Group, Inc. | | | 667 | | | | 121,427 | | |
Commerce Bancshares, Inc. | | | 2,021 | | | | 132,780 | | |
Credit Acceptance Corp. (a) (b) | | | 223 | | | | 77,189 | | |
See notes to financial statements.
7
Victory Portfolios II
Victory US 500 Enhanced Volatility Wtd Index Fund | | Schedule of Portfolio Investments — continued
December 31, 2020 | |
(Unaudited)
Security Description | | Shares | | Value | |
Discover Financial Services | | | 1,245 | | | $ | 112,710 | | |
Erie Indemnity Co., Class A (b) | | | 533 | | | | 130,905 | | |
Everest Re Group Ltd. | | | 522 | | | | 122,195 | | |
FactSet Research Systems, Inc. | | | 354 | | | | 117,705 | | |
Fidelity National Financial, Inc. | | | 3,109 | | | | 121,531 | | |
Fifth Third Bancorp | | | 3,695 | | | | 101,871 | | |
First Republic Bank | | | 1,040 | | | | 152,806 | | |
Franklin Resources, Inc. (b) | | | 5,163 | | | | 129,023 | | |
Globe Life, Inc. | | | 1,271 | | | | 120,694 | | |
Huntington Bancshares, Inc. | | | 9,604 | | | | 121,299 | | |
Interactive Brokers Group, Inc. | | | 2,261 | | | | 137,740 | | |
Intercontinental Exchange, Inc. | | | 1,367 | | | | 157,601 | | |
JPMorgan Chase & Co. | | | 1,042 | | | | 132,407 | | |
KeyCorp | | | 6,149 | | | | 100,905 | | |
KKR & Co., Inc. | | | 2,861 | | | | 115,842 | | |
Lincoln National Corp. | | | 1,661 | | | | 83,565 | | |
LPL Financial Holdings, Inc. | | | 1,030 | | | | 107,347 | | |
M&T Bank Corp. | | | 947 | | | | 120,553 | | |
Markel Corp. (a) | | | 101 | | | | 104,363 | | |
MarketAxess Holdings, Inc. | | | 257 | | | | 146,634 | | |
Marsh & McLennan Cos., Inc. | | | 1,328 | | | | 155,376 | | |
MetLife, Inc. | | | 2,445 | | | | 114,793 | | |
Moody's Corp. | | | 371 | | | | 107,679 | | |
Morgan Stanley | | | 1,865 | | | | 127,808 | | |
Morningstar, Inc. | | | 1,110 | | | | 257,043 | | |
MSCI, Inc. | | | 289 | | | | 129,047 | | |
Nasdaq, Inc. | | | 978 | | | | 129,820 | | |
Northern Trust Corp. | | | 1,327 | | | | 123,597 | | |
Principal Financial Group, Inc. | | | 2,055 | | | | 101,949 | | |
Raymond James Financial, Inc. | | | 1,278 | | | | 122,266 | | |
Regions Financial Corp. | | | 7,088 | | | | 114,259 | | |
RenaissanceRe Holdings Ltd. | | | 705 | | | | 116,903 | | |
S&P Global, Inc. | | | 326 | | | | 107,166 | | |
SEI Investments Co. | | | 2,355 | | | | 135,342 | | |
State Street Corp. | | | 1,431 | | | | 104,148 | | |
SVB Financial Group (a) | | | 337 | | | | 130,699 | | |
Synchrony Financial | | | 2,987 | | | | 103,679 | | |
T. Rowe Price Group, Inc. | | | 841 | | | | 127,319 | | |
The Allstate Corp. | | | 1,369 | | | | 150,494 | | |
The Bank of New York Mellon Corp. | | | 3,213 | | | | 136,360 | | |
The Blackstone Group, Inc., Class A | | | 1,970 | | | | 127,676 | | |
The Charles Schwab Corp. | | | 3,002 | | | | 159,226 | | |
The Goldman Sachs Group, Inc. | | | 521 | | | | 137,393 | | |
The Hartford Financial Services Group, Inc. | | | 2,134 | | | | 104,523 | | |
The PNC Financial Services Group, Inc. | | | 882 | | | | 131,418 | | |
The Progressive Corp. | | | 1,621 | | | | 160,283 | | |
The Travelers Cos., Inc. | | | 995 | | | | 139,668 | | |
Tradeweb Markets, Inc., Class A (b) | | | 2,362 | | | | 147,507 | | |
Truist Financial Corp. | | | 2,187 | | | | 104,823 | | |
U.S. Bancorp | | | 2,679 | | | | 124,815 | | |
See notes to financial statements.
8
Victory Portfolios II
Victory US 500 Enhanced Volatility Wtd Index Fund | | Schedule of Portfolio Investments — continued
December 31, 2020 | |
(Unaudited)
Security Description | | Shares | | Value | |
Voya Financial, Inc. | | | 2,226 | | | $ | 130,911 | | |
W.R. Berkley Corp. | | | 1,881 | | | | 124,936 | | |
Wells Fargo & Co. | | | 3,852 | | | | 116,253 | | |
| | | | 9,271,072 | | |
Health Care (16.6%): | |
Abbott Laboratories | | | 1,311 | | | | 143,541 | | |
AbbVie, Inc. | | | 1,762 | | | | 188,798 | | |
ABIOMED, Inc. (a) | | | 424 | | | | 137,461 | | |
Agilent Technologies, Inc. | | | 1,537 | | | | 182,119 | | |
Alexion Pharmaceuticals, Inc. (a) | | | 1,321 | | | | 206,394 | | |
Align Technology, Inc. (a) | | | 299 | | | | 159,780 | | |
Amedisys, Inc. (a) | | | 469 | | | | 137,572 | | |
AmerisourceBergen Corp. | | | 1,372 | | | | 134,127 | | |
Amgen, Inc. | | | 592 | | | | 136,113 | | |
Anthem, Inc. | | | 369 | | | | 118,482 | | |
Avantor, Inc. (a) | | | 3,893 | | | | 109,588 | | |
Baxter International, Inc. | | | 1,722 | | | | 138,173 | | |
Becton, Dickinson & Co. | | | 636 | | | | 159,140 | | |
Biogen, Inc. (a) | | | 431 | | | | 105,535 | | |
BioMarin Pharmaceutical, Inc. (a) | | | 1,263 | | | | 110,752 | | |
Bio-Rad Laboratories, Inc., Class A (a) | | | 297 | | | | 173,133 | | |
Bio-Techne Corp. | | | 615 | | | | 195,293 | | |
Boston Scientific Corp. (a) | | | 3,155 | | | | 113,422 | | |
Catalent, Inc. (a) | | | 1,162 | | | | 120,929 | | |
Centene Corp. (a) | | | 1,732 | | | | 103,972 | | |
Cerner Corp. | | | 2,455 | | | | 192,668 | | |
Charles River Laboratories International, Inc. (a) | | | 513 | | | | 128,178 | | |
Chemed Corp. | | | 257 | | | | 136,881 | | |
Cigna Corp. | | | 618 | | | | 128,655 | | |
CRISPR Therapeutics AG (a) | | | 1,048 | | | | 160,459 | | |
CVS Health Corp. | | | 2,403 | | | | 164,125 | | |
Danaher Corp. | | | 832 | | | | 184,820 | | |
DaVita, Inc. (a) | | | 1,606 | | | | 188,544 | | |
DexCom, Inc. (a) | | | 258 | | | | 95,388 | | |
Edwards Lifesciences Corp. (a) | | | 1,520 | | | | 138,670 | | |
Eli Lilly & Co. | | | 959 | | | | 161,918 | | |
Encompass Health Corp. | | | 2,022 | | | | 167,199 | | |
Exelixis, Inc. (a) | | | 4,818 | | | | 96,697 | | |
HCA Healthcare, Inc. | | | 676 | | | | 111,175 | | |
Henry Schein, Inc. (a) | | | 2,005 | | | | 134,054 | | |
Hologic, Inc. (a) | | | 2,096 | | | | 152,652 | | |
Horizon Therapeutics PLC (a) | | | 1,407 | | | | 102,922 | | |
Humana, Inc. | | | 264 | | | | 108,311 | | |
IDEXX Laboratories, Inc. (a) | | | 372 | | | | 185,952 | | |
Illumina, Inc. (a) | | | 374 | | | | 138,380 | | |
Insulet Corp. (a) | | | 571 | | | | 145,965 | | |
Intuitive Surgical, Inc. (a) | | | 172 | | | | 140,713 | | |
Ionis Pharmaceuticals, Inc. (a) | | | 2,560 | | | | 144,742 | | |
IQVIA Holdings, Inc. (a) | | | 688 | | | | 123,269 | | |
Jazz Pharmaceuticals PLC (a) | | | 937 | | | | 154,652 | | |
See notes to financial statements.
9
Victory Portfolios II
Victory US 500 Enhanced Volatility Wtd Index Fund | | Schedule of Portfolio Investments — continued
December 31, 2020 | |
(Unaudited)
Security Description | | Shares | | Value | |
Johnson & Johnson (c) | | | 1,205 | | | $ | 189,643 | | |
Laboratory Corp. of America Holdings (a) | | | 605 | | | | 123,148 | | |
LHC Group, Inc. (a) | | | 541 | | | | 115,406 | | |
Masimo Corp. (a) | | | 708 | | | | 190,012 | | |
McKesson Corp. | | | 806 | | | | 140,180 | | |
Medtronic PLC | | | 1,286 | | | | 150,642 | | |
Merck & Co., Inc. | | | 2,063 | | | | 168,753 | | |
Mettler-Toledo International, Inc. (a) | | | 144 | | | | 164,114 | | |
Molina Healthcare, Inc. (a) | | | 589 | | | | 125,269 | | |
Neurocrine Biosciences, Inc. (a) | | | 1,170 | | | | 112,145 | | |
Novocure Ltd. (a) | | | 1,225 | | | | 211,973 | | |
Penumbra, Inc. (a) (b) | | | 597 | | | | 104,475 | | |
PerkinElmer, Inc. | | | 1,364 | | | | 195,734 | | |
Perrigo Co. PLC | | | 2,402 | | | | 107,417 | | |
Pfizer, Inc. | | | 4,640 | | | | 170,798 | | |
PRA Health Sciences, Inc. (a) | | | 1,006 | | | | 126,193 | | |
Quest Diagnostics, Inc. | | | 1,218 | | | | 145,149 | | |
Quidel Corp. (a) | | | 408 | | | | 73,297 | | |
Regeneron Pharmaceuticals, Inc. (a) | | | 221 | | | | 106,767 | | |
Repligen Corp. (a) | | | 791 | | | | 151,579 | | |
ResMed, Inc. | | | 626 | | | | 133,063 | | |
Stryker Corp. | | | 577 | | | | 141,388 | | |
Syneos Health, Inc. (a) | | | 1,384 | | | | 94,292 | | |
Teleflex, Inc. | | | 328 | | | | 134,995 | | |
The Cooper Cos., Inc. | | | 455 | | | | 165,311 | | |
Thermo Fisher Scientific, Inc. | | | 373 | | | | 173,736 | | |
UnitedHealth Group, Inc. | | | 372 | | | | 130,453 | | |
Universal Health Services, Inc., Class B | | | 770 | | | | 105,875 | | |
Veeva Systems, Inc., Class A (a) | | | 446 | | | | 121,424 | | |
Vertex Pharmaceuticals, Inc. (a) | | | 496 | | | | 117,225 | | |
Waters Corp. (a) | | | 652 | | | | 161,318 | | |
West Pharmaceutical Services, Inc. | | | 527 | | | | 149,304 | | |
Zimmer Biomet Holdings, Inc. | | | 810 | | | | 124,813 | | |
Zoetis, Inc. | | | 895 | | | | 148,123 | | |
| | | | 11,235,327 | | |
Industrials (15.5%): | |
3M Co. | | | 911 | | | | 159,234 | | |
Allegion PLC | | | 1,211 | | | | 140,936 | | |
AMERCO, Inc. | | | 352 | | | | 159,793 | | |
AMETEK, Inc. | | | 1,195 | | | | 144,522 | | |
AO Smith Corp. | | | 3,114 | | | | 170,709 | | |
C.H. Robinson Worldwide, Inc. | | | 1,899 | | | | 178,259 | | |
Carlisle Cos., Inc. | | | 923 | | | | 144,154 | | |
Caterpillar, Inc. | | | 906 | | | | 164,910 | | |
Cintas Corp. | | | 321 | | | | 113,461 | | |
Copart, Inc. (a) | | | 1,223 | | | | 155,627 | | |
CoStar Group, Inc. (a) (c) | | | 149 | | | | 137,718 | | |
CSX Corp. | | | 1,569 | | | | 142,387 | | |
Cummins, Inc. | | | 615 | | | | 139,667 | | |
Deere & Co. | | | 581 | | | | 156,318 | | |
See notes to financial statements.
10
Victory Portfolios II
Victory US 500 Enhanced Volatility Wtd Index Fund | | Schedule of Portfolio Investments — continued
December 31, 2020 | |
(Unaudited)
Security Description | | Shares | | Value | |
Dover Corp. | | | 1,081 | | | $ | 136,476 | | |
Eaton Corp. PLC | | | 1,043 | | | | 125,306 | | |
Emerson Electric Co. | | | 1,501 | | | | 120,635 | | |
Enphase Energy, Inc. (a) | | | 716 | | | | 125,637 | | |
Equifax, Inc. | | | 830 | | | | 160,057 | | |
Expeditors International of Washington, Inc. | | | 1,998 | | | | 190,030 | | |
Fastenal Co. | | | 3,069 | | | | 149,859 | | |
FedEx Corp. | | | 476 | | | | 123,579 | | |
Fortive Corp. | | | 1,996 | | | | 141,357 | | |
Fortune Brands Home & Security, Inc. | | | 1,147 | | | | 98,321 | | |
Generac Holdings, Inc. (a) | | | 582 | | | | 132,353 | | |
General Dynamics Corp. | | | 939 | | | | 139,742 | | |
General Electric Co. | | | 14,434 | | | | 155,887 | | |
Graco, Inc. | | | 2,307 | | | | 166,911 | | |
HEICO Corp. | | | 903 | | | | 119,557 | | |
Honeywell International, Inc. | | | 753 | | | | 160,163 | | |
Howmet Aerospace, Inc. (a) | | | 4,352 | | | | 124,206 | | |
Hubbell, Inc. | | | 838 | | | | 131,390 | | |
IAA, Inc. (a) | | | 1,928 | | | | 125,281 | | |
IDEX Corp. | | | 832 | | | | 165,734 | | |
Illinois Tool Works, Inc. | | | 661 | | | | 134,765 | | |
J.B. Hunt Transport Services, Inc. | | | 998 | | | | 136,377 | | |
Jacobs Engineering Group, Inc. | | | 1,480 | | | | 161,261 | | |
Johnson Controls International PLC | | | 3,254 | | | | 151,604 | | |
Kansas City Southern | | | 605 | | | | 123,499 | | |
Knight-Swift Transportation Holdings, Inc. | | | 3,188 | | | | 133,322 | | |
L3Harris Technologies, Inc. | | | 754 | | | | 142,522 | | |
Lennox International, Inc. | | | 515 | | | | 141,095 | | |
Lockheed Martin Corp. | | | 343 | | | | 121,758 | | |
Masco Corp. | | | 2,342 | | | | 128,646 | | |
Nordson Corp. | | | 587 | | | | 117,958 | | |
Norfolk Southern Corp. | | | 542 | | | | 128,785 | | |
Northrop Grumman Corp. | | | 410 | | | | 124,935 | | |
Old Dominion Freight Line, Inc. | | | 670 | | | | 130,771 | | |
PACCAR, Inc. | | | 1,842 | | | | 158,928 | | |
Parker-Hannifin Corp. | | | 454 | | | | 123,674 | | |
Quanta Services, Inc. | | | 2,251 | | | | 162,117 | | |
Republic Services, Inc. (c) | | | 1,716 | | | | 165,251 | | |
Rockwell Automation, Inc. | | | 492 | | | | 123,399 | | |
Rollins, Inc. | | | 4,396 | | | | 171,751 | | |
Roper Technologies, Inc. | | | 329 | | | | 141,829 | | |
Snap-on, Inc. | | | 786 | | | | 134,516 | | |
Southwest Airlines Co. | | | 2,409 | | | | 112,283 | | |
Stanley Black & Decker, Inc. | | | 539 | | | | 96,244 | | |
Teledyne Technologies, Inc. (a) | | | 349 | | | | 136,801 | | |
Textron, Inc. | | | 2,108 | | | | 101,880 | | |
The Toro Co. | | | 1,996 | | | | 189,301 | | |
Trane Technologies PLC | | | 1,051 | | | | 152,563 | | |
TransDigm Group, Inc. (a) | | | 154 | | | | 95,303 | | |
TransUnion | | | 1,427 | | | | 141,587 | | |
See notes to financial statements.
11
Victory Portfolios II
Victory US 500 Enhanced Volatility Wtd Index Fund | | Schedule of Portfolio Investments — continued
December 31, 2020 | |
(Unaudited)
Security Description | | Shares | | Value | |
Trex Co., Inc. (a) | | | 1,197 | | | $ | 100,213 | | |
Union Pacific Corp. | | | 695 | | | | 144,712 | | |
United Parcel Service, Inc., Class B | | | 850 | | | | 143,140 | | |
United Rentals, Inc. (a) | | | 476 | | | | 110,389 | | |
Verisk Analytics, Inc. | | | 782 | | | | 162,335 | | |
W.W. Grainger, Inc. | | | 359 | | | | 146,594 | | |
Waste Management, Inc. | | | 1,403 | | | | 165,456 | | |
Watsco, Inc. | | | 632 | | | | 143,180 | | |
Westinghouse Air Brake Technologies Corp. | | | 1,586 | | | | 116,095 | | |
XPO Logistics, Inc. (a) | | | 896 | | | | 106,803 | | |
Xylem, Inc. | | | 1,497 | | | | 152,380 | | |
| | | | 10,476,198 | | |
Information Technology (19.0%): | |
Accenture PLC, Class A | | | 570 | | | | 148,890 | | |
Adobe, Inc. (a) | | | 235 | | | | 117,528 | | |
Advanced Micro Devices, Inc. (a) | | | 1,029 | | | | 94,370 | | |
Akamai Technologies, Inc. (a) | | | 1,332 | | | | 139,847 | | |
Amphenol Corp., Class A | | | 1,246 | | | | 162,939 | | |
Analog Devices, Inc. | | | 941 | | | | 139,014 | | |
ANSYS, Inc. (a) | | | 370 | | | | 134,606 | | |
Apple, Inc. | | | 1,005 | | | | 133,353 | | |
Applied Materials, Inc. | | | 1,554 | | | | 134,110 | | |
Arista Networks, Inc. (a) | | | 538 | | | | 156,327 | | |
Aspen Technology, Inc. (a) | | | 803 | | | | 104,591 | | |
Autodesk, Inc. (a) | | | 461 | | | | 140,762 | | |
Automatic Data Processing, Inc. | | | 893 | | | | 157,347 | | |
Black Knight, Inc. (a) | | | 1,990 | | | | 175,816 | | |
Booz Allen Hamilton Holding Corp. | | | 1,818 | | | | 158,493 | | |
Broadcom, Inc. | | | 311 | | | | 136,171 | | |
Broadridge Financial Solutions, Inc. | | | 1,126 | | | | 172,503 | | |
Cadence Design Systems, Inc. (a) | | | 1,149 | | | | 156,758 | | |
CDW Corp. | | | 991 | | | | 130,604 | | |
Ceridian HCM Holding, Inc. (a) | | | 1,186 | | | | 126,380 | | |
Ciena Corp. (a) | | | 2,339 | | | | 123,616 | | |
Cisco Systems, Inc. | | | 3,133 | | | | 140,202 | | |
Citrix Systems, Inc. | | | 971 | | | | 126,327 | | |
Cognex Corp. | | | 1,456 | | | | 116,895 | | |
Cognizant Technology Solutions Corp., Class A | | | 1,697 | | | | 139,069 | | |
Corning, Inc. | | | 3,367 | | | | 121,212 | | |
Datadog, Inc., Class A (a) | | | 1,076 | | | | 105,921 | | |
Dell Technologies, Inc., Class C (a) | | | 1,639 | | | | 120,122 | | |
Dolby Laboratories, Inc., Class A | | | 1,888 | | | | 183,382 | | |
Dropbox, Inc., Class A (a) | | | 5,117 | | | | 113,546 | | |
Entegris, Inc. | | | 1,609 | | | | 154,625 | | |
EPAM Systems, Inc. (a) | | | 320 | | | | 114,672 | | |
F5 Networks, Inc. (a) | | | 1,062 | | | | 186,848 | | |
Fair Isaac Corp. (a) | | | 229 | | | | 117,028 | | |
Fidelity National Information Services, Inc. | | | 836 | | | | 118,261 | | |
First Solar, Inc. (a) | | | 1,330 | | | | 131,564 | | |
Fiserv, Inc. (a) | | | 1,216 | | | | 138,454 | | |
FleetCor Technologies, Inc. (a) | | | 431 | | | | 117,590 | | |
See notes to financial statements.
12
Victory Portfolios II
Victory US 500 Enhanced Volatility Wtd Index Fund | | Schedule of Portfolio Investments — continued
December 31, 2020 | |
(Unaudited)
Security Description | | Shares | | Value | |
Fortinet, Inc. (a) | | | 789 | | | $ | 117,190 | | |
Gartner, Inc. (a) | | | 906 | | | | 145,132 | | |
Genpact Ltd. | | | 2,757 | | | | 114,030 | | |
Global Payments, Inc. | | | 580 | | | | 124,944 | | |
HP, Inc. | | | 5,143 | | | | 126,466 | | |
Intel Corp. | | | 2,066 | | | | 102,928 | | |
International Business Machines Corp. | | | 1,134 | | | | 142,748 | | |
Intuit, Inc. | | | 349 | | | | 132,568 | | |
IPG Photonics Corp. (a) | | | 652 | | | | 145,911 | | |
Jack Henry & Associates, Inc. | | | 868 | | | | 140,607 | | |
Juniper Networks, Inc. | | | 6,414 | | | | 144,379 | | |
Keysight Technologies, Inc. (a) | | | 1,276 | | | | 168,547 | | |
KLA Corp. | | | 457 | | | | 118,322 | | |
Lam Research Corp. | | | 264 | | | | 124,679 | | |
Leidos Holdings, Inc. | | | 1,417 | | | | 148,955 | | |
Marvell Technology Group Ltd. | | | 2,818 | | | | 133,968 | | |
Mastercard, Inc., Class A | | | 329 | | | | 117,433 | | |
Microchip Technology, Inc. | | | 826 | | | | 114,079 | | |
Micron Technology, Inc. (a) | | | 2,156 | | | | 162,088 | | |
Microsoft Corp. (c) | | | 579 | | | | 128,781 | | |
MKS Instruments, Inc. | | | 770 | | | | 115,847 | | |
Monolithic Power Systems, Inc. | | | 353 | | | | 129,279 | | |
Motorola Solutions, Inc. | | | 822 | | | | 139,789 | | |
NetApp, Inc. | | | 2,340 | | | | 155,002 | | |
NortonLifeLock, Inc. | | | 4,345 | | | | 90,289 | | |
Nuance Communications, Inc. (a) (b) | | | 4,293 | | | | 189,278 | | |
NVIDIA Corp. | | | 190 | | | | 99,218 | | |
Oracle Corp. | | | 2,354 | | | | 152,280 | | |
Paychex, Inc. | | | 1,485 | | | | 138,372 | | |
Paycom Software, Inc. (a) | | | 289 | | | | 130,700 | | |
Paylocity Holding Corp. (a) | | | 656 | | | | 135,077 | | |
PayPal Holdings, Inc. (a) | | | 562 | | | | 131,620 | | |
PTC, Inc. (a) | | | 1,418 | | | | 169,607 | | |
Qorvo, Inc. (a) | | | 807 | | | | 134,180 | | |
QUALCOMM, Inc. | | | 937 | | | | 142,743 | | |
salesforce.com, Inc. (a) | | | 400 | | | | 89,012 | | |
Seagate Technology PLC (b) | | | 2,722 | | | | 169,200 | | |
ServiceNow, Inc. (a) (c) | | | 240 | | | | 132,103 | | |
Skyworks Solutions, Inc. | | | 717 | | | | 109,615 | | |
SolarWinds Corp. (a) | | | 5,387 | | | | 80,536 | | |
Square, Inc., Class A (a) | | | 507 | | | | 110,343 | | |
SS&C Technologies Holdings, Inc. | | | 1,923 | | | | 139,898 | | |
SYNNEX Corp. | | | 1,517 | | | | 123,544 | | |
Synopsys, Inc. (a) | | | 628 | | | | 162,803 | | |
Teradyne, Inc. | | | 1,260 | | | | 151,061 | | |
Texas Instruments, Inc. | | | 908 | | | | 149,030 | | |
The Trade Desk, Inc., Class A (a) | | | 168 | | | | 134,568 | | |
The Western Union Co. | | | 5,583 | | | | 122,491 | | |
Trimble, Inc. (a) | | | 1,975 | | | | 131,871 | | |
Tyler Technologies, Inc. (a) | | | 471 | | | | 205,602 | | |
Universal Display Corp. | | | 599 | | | | 137,650 | | |
VeriSign, Inc. (a) | | | 659 | | | | 142,608 | | |
See notes to financial statements.
13
Victory Portfolios II
Victory US 500 Enhanced Volatility Wtd Index Fund | | Schedule of Portfolio Investments — continued
December 31, 2020 | |
(Unaudited)
Security Description | | Shares | | Value | |
Visa, Inc., Class A | | | 619 | | | $ | 135,394 | | |
VMware, Inc., Class A (a) (b) | | | 891 | | | | 124,972 | | |
WEX, Inc. (a) | | | 455 | | | | 92,606 | | |
Xilinx, Inc. | | | 1,209 | | | | 171,399 | | |
Zebra Technologies Corp. (a) | | | 409 | | | | 157,191 | | |
Zoom Video Communications, Inc., Class A (a) | | | 264 | | | | 89,052 | | |
| | | | 12,959,328 | | |
Materials (5.6%): | |
Air Products & Chemicals, Inc. | | | 450 | | | | 122,949 | | |
Albemarle Corp. | | | 1,077 | | | | 158,879 | | |
AptarGroup, Inc. | | | 1,397 | | | | 191,235 | | |
Avery Dennison Corp. | | | 1,003 | | | | 155,575 | | |
Ball Corp. | | | 1,766 | | | | 164,556 | | |
Berry Global Group, Inc. (a) | | | 2,441 | | | | 137,160 | | |
Celanese Corp. | | | 1,029 | | | | 133,708 | | |
CF Industries Holdings, Inc. | | | 3,021 | | | | 116,943 | | |
Corteva, Inc. | | | 3,797 | | | | 147,020 | | |
Crown Holdings, Inc. (a) | | | 1,465 | | | | 146,793 | | |
Eastman Chemical Co. | | | 1,534 | | | | 153,830 | | |
FMC Corp. | | | 1,002 | | | | 115,160 | | |
International Flavors & Fragrances, Inc. (b) | | | 1,087 | | | | 118,309 | | |
International Paper Co. | | | 3,022 | | | | 150,254 | | |
LyondellBasell Industries NV, Class A | | | 1,246 | | | | 114,208 | | |
Martin Marietta Materials, Inc. | | | 504 | | | | 143,121 | | |
Newmont Corp. | | | 1,844 | | | | 110,437 | | |
Nucor Corp. | | | 2,561 | | | | 136,220 | | |
Packaging Corp. of America | | | 1,226 | | | | 169,078 | | |
PPG Industries, Inc. | | | 1,075 | | | | 155,037 | | |
Reliance Steel & Aluminum Co. | | | 1,154 | | | | 138,191 | | |
Royal Gold, Inc. | | | 730 | | | | 77,643 | | |
RPM International, Inc. | | | 1,477 | | | | 134,082 | | |
The Scotts Miracle-Gro Co. | | | 637 | | | | 126,852 | | |
The Sherwin-Williams Co. | | | 193 | | | | 141,838 | | |
Vulcan Materials Co. | | | 884 | | | | 131,106 | | |
Westlake Chemical Corp. | | | 1,394 | | | | 113,750 | | |
Westrock Co. | | | 2,819 | | | | 122,711 | | |
| | | | 3,826,645 | | |
Real Estate (0.2%): | |
CBRE Group, Inc., Class A (a) | | | 1,971 | | | | 123,621 | | |
Utilities (5.6%): | |
Alliant Energy Corp. | | | 2,655 | | | | 136,812 | | |
Ameren Corp. (b) | | | 1,593 | | | | 124,350 | | |
American Electric Power Co., Inc. (c) | | | 1,810 | | | | 150,719 | | |
American Water Works Co., Inc. | | | 903 | | | | 138,584 | | |
Atmos Energy Corp. | | | 1,358 | | | | 129,594 | | |
CMS Energy Corp. | | | 2,351 | | | | 143,434 | | |
Consolidated Edison, Inc. (c) | | | 1,876 | | | | 135,579 | | |
Dominion Energy, Inc. | | | 1,533 | | | | 115,282 | | |
DTE Energy Co. | | | 980 | | | | 118,982 | | |
Duke Energy Corp. (c) | | | 1,670 | | | | 152,904 | | |
See notes to financial statements.
14
Victory Portfolios II
Victory US 500 Enhanced Volatility Wtd Index Fund | | Schedule of Portfolio Investments — continued
December 31, 2020 | |
(Unaudited)
Security Description | | Shares | | Value | |
Edison International | | | 2,344 | | | $ | 147,250 | | |
Entergy Corp. | | | 1,189 | | | | 118,710 | | |
Essential Utilities, Inc. | | | 2,667 | | | | 126,122 | | |
Evergy, Inc. (c) | | | 2,068 | | | | 114,795 | | |
Eversource Energy (c) | | | 1,414 | | | | 122,325 | | |
Exelon Corp. | | | 3,038 | | | | 128,264 | | |
FirstEnergy Corp. | | | 3,656 | | | | 111,910 | | |
NextEra Energy, Inc. (c) | | | 1,918 | | | | 147,974 | | |
NRG Energy, Inc. | | | 3,419 | | | | 128,384 | | |
Pinnacle West Capital Corp. | | | 1,717 | | | | 137,274 | | |
PPL Corp. | | | 4,221 | | | | 119,032 | | |
Public Service Enterprise Group, Inc. | | | 2,623 | | | | 152,920 | | |
Sempra Energy | | | 951 | | | | 121,167 | | |
The AES Corp. | | | 5,282 | | | | 124,127 | | |
The Southern Co. (c) | | | 2,248 | | | | 138,095 | | |
UGI Corp. | | | 3,183 | | | | 111,278 | | |
Vistra Corp. | | | 5,738 | | | | 112,809 | | |
WEC Energy Group, Inc. (c) | | | 1,357 | | | | 124,885 | | |
Xcel Energy, Inc. (c) | | | 2,032 | | | | 135,473 | | |
| | | | 3,769,034 | | |
Total Common Stocks (Cost $48,254,390) | | | 67,411,209 | | |
Investment Companies (0.3%) | |
BlackRock Liquidity Funds T-Fund, Institutional Class, 0.02% (d) | | | 205,931 | | | | 205,931 | | |
Total Investment Companies (Cost $205,931) | | | 205,931 | | |
Collateral for Securities Loaned^ (2.5%) | |
BlackRock Liquidity Funds TempFund Portfolio, Institutional Class, 0.08% (d) | | | 29,337 | | | | 29,337 | | |
Fidelity Investments Money Market Government Portfolio I Shares, 0.01% (d) | | | 1,007,906 | | | | 1,007,906 | | |
Goldman Sachs Financial Square Prime Obligations Fund, Institutional
Class, 0.04% (d) | | | 14,641 | | | | 14,641 | | |
JPMorgan Prime Money Market Fund, Capital Class, 0.12% (d) | | | 116,741 | | | | 116,741 | | |
Morgan Stanley Institutional Liquidity Prime Portfolio, Institutional
Class, 0.09% (d) | | | 524,889 | | | | 524,889 | | |
Total Collateral for Securities Loaned (Cost $1,693,514) | | | 1,693,514 | | |
Total Investments (Cost $50,153,835) — 102.3% | | | 69,310,654 | | |
Liabilities in excess of other assets — (2.3)% | | | (1,563,224 | ) | |
NET ASSETS — 100.00% | | $ | 67,747,430 | | |
^ Purchased with cash collateral from securities on loan.
(a) Non-income producing security.
(b) All or a portion of this security is on loan.
(c) All or a portion of this security has been segregated as collateral for derivative instruments.
(d) Rate disclosed is the daily yield on December 31, 2020.
PLC — Public Limited Company
See notes to financial statements.
15
Victory Portfolios II
Victory US 500 Enhanced Volatility Wtd Index Fund | | Schedule of Portfolio Investments — continued
December 31, 2020 | |
(Unaudited)
Futures Contracts Purchased
| | | Number of
Contracts | | Expiration
Date | | Notional
Amount | | Value | | Unrealized
Appreciation
(Depreciation) | |
E-Mini S&P 500 Futures | | | 2 | | | 3/19/21 | | $ | 365,471 | | | $ | 374,880 | | | $ | 9,409 | | |
| | | Total unrealized appreciation | | | | | | | | | | | | $ | 9,409 | | |
| | | Total unrealized depreciation | | | | | | | | | | | | | — | | |
| | | Total net unrealized appreciation (depreciation) | | | | | | | | | | | | $ | 9,409 | | |
See notes to financial statements.
16
Victory Portfolios II
Victory Market Neutral Income Fund | | Schedule of Portfolio Investments
December 31, 2020 | |
(Unaudited)
Security Description | | Shares | | Value | |
Common Stocks (83.3%) | |
Australia (1.3%): | |
Communication Services (0.2%): | |
Telstra Corp. Ltd. | | | 534,637 | | | $ | 1,227,616 | | |
Financials (0.4%): | |
Insurance Australia Group Ltd. | | | 249,104 | | | | 903,843 | | |
National Australia Bank Ltd. | | | 56,154 | | | | 978,792 | | |
| | | | 1,882,635 | | |
Materials (0.7%): | |
BHP Group Ltd. | | | 31,028 | | | | 1,013,632 | | |
Fortescue Metals Group Ltd. | | | 55,555 | | | | 1,003,264 | | |
Rio Tinto Ltd. | | | 15,723 | | | | 1,382,439 | | |
| | | | 3,399,335 | | |
| | | | 6,509,586 | | |
Austria (0.3%): | |
Energy (0.1%): | |
OMV AG | | | 17,119 | | | | 683,698 | | |
Financials (0.2%): | |
Erste Group Bank AG (a) | | | 26,534 | | | | 808,195 | | |
| | | | 1,491,893 | | |
Bermuda (0.3%): | |
Industrials (0.3%): | |
Triton International Ltd. | | | 28,800 | | | | 1,397,088 | | |
Brazil (0.7%): | |
Consumer Discretionary (0.1%): | |
Petrobras Distribuidora SA | | | 131,600 | | | | 561,646 | | |
Financials (0.2%): | |
BB Seguridade Participacoes SA | | | 155,000 | | | | 887,147 | | |
Industrials (0.1%): | |
CCR SA | | | 195,200 | | | | 507,853 | | |
Utilities (0.3%): | |
Centrais Eletricas Brasileiras SA | | | 63,500 | | | | 452,096 | | |
Engie Brasil Energia SA | | | 112,100 | | | | 952,312 | | |
| | | | 1,404,408 | | |
| | | | 3,361,054 | | |
Canada (2.0%): | |
Communication Services (0.5%): | |
BCE, Inc. (b) (c) | | | 22,287 | | | | 953,156 | | |
Shaw Communications, Inc., Class B (b) | | | 48,096 | | | | 844,240 | | |
TELUS Corp. (b) (c) | | | 51,346 | | | | 1,017,076 | | |
| | | | 2,814,472 | | |
See notes to financial statements.
17
Victory Portfolios II
Victory Market Neutral Income Fund | | Schedule of Portfolio Investments — continued
December 31, 2020 | |
(Unaudited)
Security Description | | Shares | | Value | |
Energy (0.4%): | |
Canadian Natural Resources Ltd. | | | 21,806 | | | $ | 524,119 | | |
Enbridge, Inc. | | | 21,649 | | | | 692,489 | | |
Pembina Pipeline Corp. (c) | | | 16,131 | | | | 381,506 | | |
TC Energy Corp. | | | 14,356 | | | | 583,738 | | |
| | | | 2,181,852 | | |
Financials (0.5%): | |
Great-West Lifeco, Inc. | | | 33,531 | | | | 799,612 | | |
Power Corp. of Canada (c) | | | 28,756 | | | | 660,437 | | |
The Bank of Nova Scotia | | | 18,047 | | | | 975,590 | | |
| | | | 2,435,639 | | |
Materials (0.2%): | |
Nutrien Ltd. (c) | | | 20,452 | | | | 984,113 | | |
Utilities (0.4%): | |
Algonquin Power & Utilities Corp. (c) | | | 54,392 | | | | 895,350 | | |
Emera, Inc. | | | 22,214 | | | | 944,274 | | |
| | | | 1,839,624 | | |
| | | | 10,255,700 | | |
Chile (0.3%): | |
Utilities (0.3%): | |
Colbun SA | | | 4,779,035 | | | | 844,797 | | |
Enel Americas SA | | | 4,739,068 | | | | 773,599 | | |
| | | | 1,618,396 | | |
China (3.1%): | |
Energy (0.4%): | |
China Petroleum & Chemical Corp., Class H | | | 2,182,000 | | | | 971,764 | | |
China Shenhua Energy Co. Ltd., Class H | | | 635,500 | | | | 1,197,948 | | |
| | | | 2,169,712 | | |
Financials (2.2%): | |
Agricultural Bank of China Ltd., Class H (b) | | | 3,820,000 | | | | 1,399,089 | | |
Bank of China Ltd., Class H (b) | | | 4,350,000 | | | | 1,472,321 | | |
Bank of Communications Co. Ltd., Class H | | | 2,516,000 | | | | 1,330,909 | | |
China CITIC Bank Corp. Ltd., Class H | | | 2,737,000 | | | | 1,162,673 | | |
China Everbright Bank Co. Ltd., Class H | | | 2,367,000 | | | | 902,759 | | |
China Minsheng Banking Corp. Ltd., Class H (c) | | | 2,427,000 | | | | 1,383,552 | | |
GF Securities Co. Ltd., Class H | | | 682,600 | | | | 965,152 | | |
Industrial & Commercial Bank of China Ltd., Class H | | | 2,478,000 | | | | 1,592,141 | | |
PICC Property & Casualty Co. Ltd., Class H | | | 1,078,000 | | | | 815,550 | | |
| | | | 11,024,146 | | |
Information Technology (0.1%): | |
China Railway Signal & Communication Corp. Ltd., Class H (d) | | | 2,298,000 | | | | 771,448 | | |
See notes to financial statements.
18
Victory Portfolios II
Victory Market Neutral Income Fund | | Schedule of Portfolio Investments — continued
December 31, 2020 | |
(Unaudited)
Security Description | | Shares | | Value | |
Utilities (0.4%): | |
CGN Power Co. Ltd., Class H (d) | | | 5,370,000 | | | $ | 1,158,064 | | |
Huaneng Power International, Inc., Class H | | | 1,832,000 | | | | 668,761 | | |
| | | | 1,826,825 | | |
| | | | 15,792,131 | | |
Czech Republic (0.5%): | |
Financials (0.2%): | |
Komercni Banka A/S (a) | | | 39,563 | | | | 1,211,511 | | |
Utilities (0.3%): | |
CEZ A/S (b) | | | 57,457 | | | | 1,380,169 | | |
| | | | 2,591,680 | | |
Egypt (0.2%): | |
Consumer Staples (0.2%): | |
Eastern Co. SAE | | | 1,048,250 | | | | 871,232 | | |
Finland (0.8%): | |
Financials (0.2%): | |
Nordea Bank Abp (a) | | | 111,226 | | | | 911,962 | | |
Information Technology (0.1%): | |
Nokia Oyj (a) | | | 158,339 | | | | 611,478 | | |
Materials (0.3%): | |
UPM-Kymmene Oyj | | | 34,741 | | | | 1,295,383 | | |
Utilities (0.2%): | |
Fortum Oyj | | | 41,246 | | | | 996,381 | | |
| | | | 3,815,204 | | |
France (1.4%): | |
Communication Services (0.4%): | |
Orange SA | | | 99,548 | | | | 1,184,970 | | |
Publicis Groupe SA | | | 19,359 | | | | 962,045 | | |
| | | | 2,147,015 | | |
Consumer Discretionary (0.2%): | |
Sodexo SA | | | 9,276 | | | | 784,405 | | |
Financials (0.5%): | |
BNP Paribas SA (a) | | | 14,839 | | | | 783,283 | | |
CNP Assurances | | | 34,444 | | | | 559,541 | | |
Credit Agricole SA | | | 63,266 | | | | 799,702 | | |
Natixis SA (a) | | | 148,181 | | | | 507,680 | | |
| | | | 2,650,206 | | |
Industrials (0.3%): | |
Alstom SA (a) | | | 15,546 | | | | 885,373 | | |
Bouygues SA | | | 16,105 | | | | 662,281 | | |
| | | | 1,547,654 | | |
| | | | 7,129,280 | | |
See notes to financial statements.
19
Victory Portfolios II
Victory Market Neutral Income Fund | | Schedule of Portfolio Investments — continued
December 31, 2020 | |
(Unaudited)
Security Description | | Shares | | Value | |
Germany (1.0%): | |
Consumer Discretionary (0.2%): | |
Bayerische Motoren Werke AG | | | 10,238 | | | $ | 903,455 | | |
Materials (0.4%): | |
BASF SE | | | 13,385 | | | | 1,057,851 | | |
Evonik Industries AG | | | 28,011 | | | | 915,409 | | |
| | | | 1,973,260 | | |
Utilities (0.4%): | |
E.ON SE | | | 95,285 | | | | 1,054,979 | | |
Uniper SE (c) | | | 34,146 | | | | 1,183,002 | | |
| | | | 2,237,981 | | |
| | | | 5,114,696 | | |
Hong Kong (1.7%): | |
Consumer Staples (0.2%): | |
WH Group Ltd. (d) | | | 1,007,500 | | | | 844,869 | | |
Energy (0.1%): | |
CNOOC Ltd. | | | 622,000 | | | | 570,655 | | |
Financials (0.3%): | |
Hang Seng Bank Ltd. | | | 77,600 | | | | 1,339,269 | | |
Industrials (0.2%): | |
CK Hutchison Holdings Ltd. | | | 159,500 | | | | 1,113,638 | | |
Real Estate (0.5%): | |
Henderson Land Development Co. Ltd. | | | 322,000 | | | | 1,250,899 | | |
Sino Land Co. Ltd. | | | 918,000 | | | | 1,194,646 | | |
| | | | 2,445,545 | | |
Utilities (0.4%): | |
CK Infrastructure Holdings Ltd. | | | 193,500 | | | | 1,039,206 | | |
Power Assets Holdings Ltd. (b) | | | 236,000 | | | | 1,278,131 | | |
| | | | 2,317,337 | | |
| | | | 8,631,313 | | |
Hungary (0.2%): | |
Energy (0.2%): | |
MOL Hungarian Oil & Gas PLC (a) | | | 137,904 | | | | 1,018,453 | | |
India (1.3%): | |
Communication Services (0.3%): | |
Indus Towers Ltd. | | | 191,067 | | | | 602,897 | | |
Sun TV Network Ltd. | | | 113,363 | | | | 747,795 | | |
| | | | 1,350,692 | | |
Consumer Discretionary (0.2%): | |
Bajaj Auto Ltd. | | | 20,683 | | | | 976,264 | | |
Consumer Staples (0.2%): | |
ITC Ltd. | | | 301,756 | | | | 864,238 | | |
See notes to financial statements.
20
Victory Portfolios II
Victory Market Neutral Income Fund | | Schedule of Portfolio Investments — continued
December 31, 2020 | |
(Unaudited)
Security Description | | Shares | | Value | |
Energy (0.1%): | |
Hindustan Petroleum Corp. Ltd. | | | 240,875 | | | $ | 718,882 | | |
Financials (0.2%): | |
Power Finance Corp. Ltd. | | | 498,446 | | | | 780,249 | | |
Industrials (0.1%): | |
Bharat Electronics Ltd. | | | 419,367 | | | | 690,342 | | |
Utilities (0.2%): | |
Torrent Power Ltd. | | | 211,805 | | | | 921,023 | | |
| | | | 6,301,690 | | |
Indonesia (0.6%): | |
Communication Services (0.2%): | |
PT Telkom Indonesia Persero Tbk | | | 4,155,500 | | | | 980,419 | | |
Consumer Staples (0.1%): | |
PT Gudang Garam Tbk (a) | | | 206,900 | | | | 604,360 | | |
Energy (0.3%): | |
PT Adaro Energy Tbk | | | 7,195,300 | | | | 733,799 | | |
PT United Tractors Tbk | | | 382,500 | | | | 725,468 | | |
| | | | 1,459,267 | | |
| | | | 3,044,046 | | |
Ireland (0.5%): | |
Industrials (0.2%): | |
Eaton Corp. PLC | | | 8,882 | | | | 1,067,084 | | |
Information Technology (0.3%): | |
Seagate Technology PLC (c) | | | 23,171 | | | | 1,440,309 | | |
| | | | 2,507,393 | | |
Italy (1.0%): | |
Energy (0.2%): | |
Snam SpA | | | 161,465 | | | | 911,772 | | |
Financials (0.4%): | |
Assicurazioni Generali SpA | | | 65,280 | | | | 1,142,801 | | |
Poste Italiane SpA (d) | | | 80,209 | | | | 820,334 | | |
| | | | 1,963,135 | | |
Utilities (0.4%): | |
Enel SpA | | | 100,456 | | | | 1,021,982 | | |
Terna Rete Elettrica Nazionale SpA | | | 132,556 | | | | 1,018,454 | | |
| | | | 2,040,436 | | |
| | | | 4,915,343 | | |
Japan (2.6%): | |
Communication Services (0.3%): | |
Softbank Corp. | | | 132,000 | | | | 1,657,104 | | |
See notes to financial statements.
21
Victory Portfolios II
Victory Market Neutral Income Fund | | Schedule of Portfolio Investments — continued
December 31, 2020 | |
(Unaudited)
Security Description | | Shares | | Value | |
Consumer Discretionary (0.4%): | |
Sekisui House Ltd. | | | 54,400 | | | $ | 1,108,387 | | |
Subaru Corp. | | | 40,200 | | | | 804,476 | | |
| | | | 1,912,863 | | |
Consumer Staples (0.3%): | |
Japan Tobacco, Inc. | | | 76,900 | | | | 1,568,001 | | |
Financials (0.5%): | |
Japan Post Holdings Co. Ltd. | | | 150,400 | | | | 1,171,657 | | |
Sumitomo Mitsui Financial Group, Inc. | | | 37,500 | | | | 1,162,600 | | |
| | | | 2,334,257 | | |
Health Care (0.2%): | |
Takeda Pharmaceutical Co. Ltd. | | | 29,800 | | | | 1,078,600 | | |
Industrials (0.7%): | |
Mitsubishi Corp. | | | 56,800 | | | | 1,400,428 | | |
Mitsui & Co. Ltd. | | | 60,400 | | | | 1,107,552 | | |
Sumitomo Corp. | | | 82,800 | | | | 1,097,504 | | |
| | | | 3,605,484 | | |
Information Technology (0.2%): | |
Canon, Inc. (c) | | | 54,400 | | | | 1,054,019 | | |
| | | | 13,210,328 | | |
Korea, Republic Of (0.9%): | |
Consumer Staples (0.3%): | |
KT&G Corp. | | | 16,716 | | | | 1,279,989 | | |
Financials (0.3%): | |
KB Financial Group, Inc. | | | 22,287 | | | | 885,255 | | |
Shinhan Financial Group Co. Ltd. | | | 29,992 | | | | 890,037 | | |
| | | | 1,775,292 | | |
Materials (0.3%): | |
POSCO | | | 5,783 | | | | 1,445,186 | | |
| | | | 4,500,467 | | |
Luxembourg (0.2%): | |
Materials (0.2%): | |
Orion Engineered Carbons SA | | | 57,114 | | | | 978,934 | | |
Macau (0.2%): | |
Consumer Discretionary (0.2%): | |
Sands China Ltd. | | | 190,000 | | | | 829,833 | | |
Malaysia (1.1%): | |
Financials (0.6%): | |
CIMB Group Holdings Bhd | | | 1,093,300 | | | | 1,171,281 | | |
Malayan Banking Bhd (b) | | | 819,800 | | | | 1,726,909 | | |
| | | | 2,898,190 | | |
See notes to financial statements.
22
Victory Portfolios II
Victory Market Neutral Income Fund | | Schedule of Portfolio Investments — continued
December 31, 2020 | |
(Unaudited)
Security Description | | Shares | | Value | |
Utilities (0.5%): | |
Petronas Gas Bhd (b) | | | 292,100 | | | $ | 1,249,286 | | |
Tenaga Nasional Bhd | | | 553,100 | | | | 1,435,668 | | |
| | | | 2,684,954 | | |
| | | | 5,583,144 | | |
Mexico (1.2%): | |
Consumer Staples (0.2%): | |
Kimberly-Clark de Mexico SAB de CV, Class A | | | 562,936 | | | | 961,793 | | |
Financials (0.2%): | |
Grupo Financiero Banorte SAB de CV, Class O (a) | | | 194,155 | | | | 1,072,843 | | |
Industrials (0.2%): | |
Grupo Aeroportuario del Pacifico SAB de CV, Class B (a) | | | 70,530 | | | | 787,539 | | |
Materials (0.4%): | |
Grupo Mexico SAB de CV, Class B | | | 287,627 | | | | 1,216,187 | | |
Orbia Advance Corp. SAB de CV | | | 385,210 | | | | 905,212 | | |
| | | | 2,121,399 | | |
Utilities (0.2%): | |
Infraestructura Energetica Nova SAB de CV (a) | | | 285,108 | | | | 1,111,666 | | |
| | | | 6,055,240 | | |
Netherlands (1.2%): | |
Communication Services (0.2%): | |
Koninklijke KPN NV | | | 377,400 | | | | 1,146,882 | | |
Consumer Staples (0.2%): | |
X5 Retail Group NV, GDR | | | 18,205 | | | | 657,367 | | |
Financials (0.4%): | |
ABN AMRO Bank NV (a) (d) | | | 59,700 | | | | 584,919 | | |
ING Groep NV (a) | | | 70,503 | | | | 655,442 | | |
NN Group NV | | | 19,648 | | | | 849,279 | | |
| | | | 2,089,640 | | |
Industrials (0.2%): | |
Randstad NV | | | 14,323 | | | | 927,048 | | |
Materials (0.2%): | |
LyondellBasell Industries NV, Class A | | | 10,604 | | | | 971,962 | | |
| | | | 5,792,899 | | |
Norway (0.7%): | |
Communication Services (0.3%): | |
Telenor ASA | | | 79,266 | | | | 1,347,619 | | |
Consumer Staples (0.2%): | |
Mowi ASA (c) | | | 47,602 | | | | 1,064,475 | | |
Financials (0.2%): | |
DNB ASA (a) | | | 49,849 | | | | 978,345 | | |
| | | | 3,390,439 | | |
See notes to financial statements.
23
Victory Portfolios II
Victory Market Neutral Income Fund | | Schedule of Portfolio Investments — continued
December 31, 2020 | |
(Unaudited)
Security Description | | Shares | | Value | |
Philippines (0.5%): | |
Communication Services (0.3%): | |
Globe Telecom, Inc. | | | 20,235 | | | $ | 856,339 | | |
PLDT, Inc. | | | 28,320 | | | | 790,818 | | |
| | | | 1,647,157 | | |
Utilities (0.2%): | |
Manila Electric Co. | | | 131,070 | | | | 797,878 | | |
| | | | 2,445,035 | | |
Poland (0.5%): | |
Financials (0.5%): | |
Bank Polska Kasa Opieki SA (a) | | | 47,866 | | | | 787,528 | | |
Powszechny Zaklad Ubezpieczen SA (a) | | | 122,140 | | | | 1,062,891 | | |
Santander Bank Polska SA (a) | | | 14,162 | | | | 705,572 | | |
| | | | 2,555,991 | | |
Portugal (0.2%): | |
Utilities (0.2%): | |
Energias de Portugal SA (c) | | | 185,627 | | | | 1,164,940 | | |
Russian Federation (2.3%): | |
Communication Services (0.5%): | |
Mobile TeleSystems PJSC | | | 283,760 | | | | 1,277,520 | | |
Rostelecom PJSC (b) | | | 883,700 | | | | 1,163,258 | | |
| | | | 2,440,778 | | |
Consumer Staples (0.2%): | |
Magnit PJSC | | | 14,218 | | | | 1,095,247 | | |
Energy (0.1%): | |
Tatneft PJSC | | | 85,115 | | | | 595,110 | | |
Materials (1.1%): | |
Alrosa PJSC | | | 1,018,070 | | | | 1,364,812 | | |
MMC Norilsk Nickel PJSC | | | 3,132 | | | | 1,007,205 | | |
PhosAgro PJSC, GDR (b) | | | 94,856 | | | | 1,293,589 | | |
Severstal PJSC | | | 104,519 | | | | 1,872,557 | | |
| | | | 5,538,163 | | |
Utilities (0.4%): | |
Federal Grid Co. Unified Energy System PJSC | | | 324,600,000 | | | | 981,539 | | |
RusHydro PJSC | | | 79,317,000 | | | | 846,039 | | |
| | | | 1,827,578 | | |
| | | | 11,496,876 | | |
Singapore (0.3%): | |
Communication Services (0.3%): | |
Singapore Telecommunications Ltd. | | | 771,500 | | | | 1,347,454 | | |
See notes to financial statements.
24
Victory Portfolios II
Victory Market Neutral Income Fund | | Schedule of Portfolio Investments — continued
December 31, 2020 | |
(Unaudited)
Security Description | | Shares | | Value | |
South Africa (1.7%): | |
Communication Services (0.3%): | |
MTN Group Ltd. | | | 120,054 | | | $ | 495,737 | | |
Vodacom Group Ltd. | | | 132,116 | | | | 1,116,429 | | |
| | | | 1,612,166 | | |
Consumer Staples (0.3%): | |
The SPAR Group Ltd. | | | 105,195 | | | | 1,355,264 | | |
Energy (0.2%): | |
Exxaro Resources Ltd. | | | 88,127 | | | | 836,608 | | |
Financials (0.5%): | |
Absa Group Ltd. | | | 116,154 | | | | 950,060 | | |
FirstRand Ltd. | | | 281,897 | | | | 982,747 | | |
Standard Bank Group Ltd. | | | 95,242 | | | | 825,308 | | |
| | | | 2,758,115 | | |
Industrials (0.2%): | |
The Bidvest Group Ltd. | | | 93,918 | | | | 1,006,125 | | |
Materials (0.2%): | |
African Rainbow Minerals Ltd. | | | 44,888 | | | | 800,324 | | |
| | | | 8,368,602 | | |
Spain (0.8%): | |
Industrials (0.1%): | |
Aena SME SA (a) (d) | | | 4,260 | | | | 740,503 | | |
Utilities (0.7%): | |
Endesa SA | | | 36,568 | | | | 1,002,892 | | |
Naturgy Energy Group SA | | | 47,453 | | | | 1,103,336 | | |
Red Electrica Corp. SA | | | 59,574 | | | | 1,222,962 | | |
| | | | 3,329,190 | | |
| | | | 4,069,693 | | |
Sweden (0.4%): | |
Communication Services (0.2%): | |
Telia Co. AB | | | 296,299 | | | | 1,224,237 | | |
Consumer Staples (0.2%): | |
ICA Gruppen AB | | | 20,567 | | | | 1,029,251 | | |
| | | | 2,253,488 | | |
Switzerland (0.8%): | |
Communication Services (0.2%): | |
Swisscom AG, Registered Shares | | | 2,334 | | | | 1,257,372 | | |
Financials (0.2%): | |
Zurich Insurance Group AG | | | 2,293 | | | | 966,647 | | |
Industrials (0.2%): | |
Adecco Group AG | | | 14,722 | | | | 980,867 | | |
Materials (0.2%): | |
LafargeHolcim Ltd. | | | 18,675 | | | | 1,025,377 | | |
| | | | 4,230,263 | | |
See notes to financial statements.
25
Victory Portfolios II
Victory Market Neutral Income Fund | | Schedule of Portfolio Investments — continued
December 31, 2020 | |
(Unaudited)
Security Description | | Shares | | Value | |
Taiwan (3.9%): | |
Industrials (0.2%): | |
Far Eastern New Century Corp. | | | 1,215,000 | | | $ | 1,254,030 | | |
Information Technology (3.1%): | |
Asustek Computer, Inc. | | | 141,000 | | | | 1,259,275 | | |
Catcher Technology Co. Ltd. | | | 138,000 | | | | 1,014,751 | | |
Compal Electronics, Inc. (b) | | | 2,464,000 | | | | 1,818,416 | | |
Foxconn Technology Co. Ltd. | | | 668,000 | | | | 1,272,573 | | |
Inventec Corp. | | | 1,626,000 | | | | 1,390,919 | | |
Lite-On Technology Corp. | | | 741,000 | | | | 1,314,752 | | |
Novatek Microelectronics Corp. | | | 98,000 | | | | 1,289,559 | | |
Pegatron Corp. | | | 450,000 | | | | 1,080,390 | | |
Quanta Computer, Inc. (b) | | | 424,000 | | | | 1,223,462 | | |
Synnex Technology International Corp. | | | 946,000 | | | | 1,585,076 | | |
Wistron Corp. | | | 751,000 | | | | 830,977 | | |
WPG Holdings Ltd. (b) | | | 971,000 | | | | 1,484,609 | | |
| | | | 15,564,759 | | |
Materials (0.6%): | |
Asia Cement Corp. | | | 858,000 | | | | 1,321,509 | | |
Formosa Plastics Corp. | | | 464,000 | | | | 1,593,772 | | |
| | | | 2,915,281 | | |
| | | | 19,734,070 | | |
Thailand (1.1%): | |
Communication Services (0.3%): | |
Intouch Holdings PCL | | | 598,500 | | | | 1,123,216 | | |
Total Access Communication PCL | | | 593,200 | | | | 657,918 | | |
| | | | 1,781,134 | | |
Energy (0.3%): | |
PTT Exploration & Production PCL | | | 176,900 | | | | 580,219 | | |
PTT PCL | | | 544,900 | | | | 773,717 | | |
| | | | 1,353,936 | | |
Financials (0.4%): | |
Krung Thai Bank PCL | | | 2,586,800 | | | | 957,788 | | |
The Siam Commercial Bank PCL | | | 296,400 | | | | 865,102 | | |
| | | | 1,822,890 | | |
Utilities (0.1%): | |
Ratch Group PCL | | | 458,300 | | | | 809,507 | | |
| | | | 5,767,467 | | |
Turkey (0.4%): | |
Consumer Discretionary (0.2%): | |
Ford Otomotiv Sanayi A/S | | | 68,014 | | | | 1,155,597 | | |
Industrials (0.2%): | |
Enka Insaat ve Sanayi A/S | | | 972,829 | | | | 966,962 | | |
| | | | 2,122,559 | | |
See notes to financial statements.
26
Victory Portfolios II
Victory Market Neutral Income Fund | | Schedule of Portfolio Investments — continued
December 31, 2020 | |
(Unaudited)
Security Description | | Shares | | Value | |
United Kingdom (2.6%): | |
Communication Services (0.2%): | |
BT Group PLC (a) | | | 534,449 | | | $ | 963,180 | | |
Consumer Staples (0.7%): | |
British American Tobacco PLC | | | 30,376 | | | | 1,127,902 | | |
Imperial Brands PLC | | | 57,887 | | | | 1,213,975 | | |
Tesco PLC | | | 452,735 | | | | 1,428,514 | | |
| | | | 3,770,391 | | |
Financials (0.5%): | |
Legal & General Group PLC | | | 180,111 | | | | 656,302 | | |
Natwest Group PLC | | | 431,223 | | | | 985,623 | | |
Phoenix Group Holdings PLC | | | 80,595 | | | | 772,227 | | |
| | | | 2,414,152 | | |
Health Care (0.2%): | |
GlaxoSmithKline PLC (b) | | | 62,683 | | | | 1,146,801 | | |
Industrials (0.2%): | |
BAE Systems PLC | | | 134,181 | | | | 894,690 | | |
Materials (0.4%): | |
BHP Group PLC | | | 30,391 | | | | 802,336 | | |
Rio Tinto PLC | | | 13,155 | | | | 990,070 | | |
| | | | 1,792,406 | | |
Utilities (0.4%): | |
National Grid PLC | | | 89,931 | | | | 1,062,595 | | |
SSE PLC | | | 45,317 | | | | 928,099 | | |
| | | | 1,990,694 | | |
| | | | 12,972,314 | | |
United States (42.5%): | |
Communication Services (1.9%): | |
AT&T, Inc. | | | 44,700 | | | | 1,285,572 | | |
CenturyLink, Inc. | | | 84,083 | | | | 819,809 | | |
National CineMedia, Inc. | | | 136,519 | | | | 507,851 | | |
Omnicom Group, Inc. | | | 19,429 | | | | 1,211,787 | | |
Sinclair Broadcast Group, Inc., Class A (c) | | | 33,180 | | | | 1,056,783 | | |
Telephone & Data Systems, Inc. | | | 41,550 | | | | 771,583 | | |
The Interpublic Group of Cos., Inc. | | | 47,780 | | | | 1,123,786 | | |
Verizon Communications, Inc. | | | 31,846 | | | | 1,870,952 | | |
ViacomCBS, Inc., Class B | | | 23,164 | | | | 863,091 | | |
| | | | 9,511,214 | | |
Consumer Discretionary (3.4%): | |
Big Lots, Inc. (c) | | | 11,618 | | | | 498,761 | | |
Brinker International, Inc. | | | 9,817 | | | | 555,348 | | |
Dana, Inc. | | | 42,585 | | | | 831,259 | | |
Dave & Buster's Entertainment, Inc. | | | 20,154 | | | | 605,023 | | |
Franchise Group, Inc. (c) | | | 19,106 | | | | 581,778 | | |
General Motors Co. | | | 26,689 | | | | 1,111,330 | | |
See notes to financial statements.
27
Victory Portfolios II
Victory Market Neutral Income Fund | | Schedule of Portfolio Investments — continued
December 31, 2020 | |
(Unaudited)
Security Description | | Shares | | Value | |
Genuine Parts Co. | | | 9,714 | | | $ | 975,577 | | |
H&R Block, Inc. | | | 60,459 | | | | 958,880 | | |
Hasbro, Inc. | | | 11,030 | | | | 1,031,746 | | |
Kontoor Brands, Inc. | | | 31,819 | | | | 1,290,579 | | |
Las Vegas Sands Corp. (b) | | | 16,257 | | | | 968,917 | | |
MDC Holdings, Inc. | | | 16,246 | | | | 789,555 | | |
PetMed Express, Inc. (b) (c) | | | 24,351 | | | | 780,693 | | |
Rent-A-Center, Inc. | | | 27,638 | | | | 1,058,259 | | |
Steven Madden Ltd. | | | 35,861 | | | | 1,266,610 | | |
The Buckle, Inc. (c) | | | 46,214 | | | | 1,349,449 | | |
Vail Resorts, Inc. | | | 4,422 | | | | 1,233,561 | | |
VF Corp. | | | 12,682 | | | | 1,083,170 | | |
| | | | 16,970,495 | | |
Consumer Staples (4.1%): | |
Archer-Daniels-Midland Co. | | | 26,921 | | | | 1,357,088 | | |
B&G Foods, Inc. (c) | | | 27,334 | | | | 757,972 | | |
General Mills, Inc. | | | 24,457 | | | | 1,438,071 | | |
Inter Parfums, Inc. | | | 17,551 | | | | 1,061,660 | | |
Kellogg Co. | | | 21,290 | | | | 1,324,877 | | |
Medifast, Inc. | | | 5,852 | | | | 1,148,982 | | |
Nu Skin Enterprises, Inc., Class A | | | 12,401 | | | | 677,467 | | |
PepsiCo, Inc. | | | 9,070 | | | | 1,345,081 | | |
Philip Morris International, Inc. | | | 15,125 | | | | 1,252,199 | | |
SpartanNash Co. | | | 39,458 | | | | 686,964 | | |
Sysco Corp. | | | 11,632 | | | | 863,792 | | |
The Coca-Cola Co. | | | 28,162 | | | | 1,544,404 | | |
The J.M. Smucker Co. | | | 12,173 | | | | 1,407,199 | | |
Universal Corp. | | | 33,440 | | | | 1,625,518 | | |
Vector Group Ltd. | | | 115,359 | | | | 1,343,932 | | |
Walgreens Boots Alliance, Inc. | | | 27,840 | | | | 1,110,259 | | |
Weis Markets, Inc. (b) (c) | | | 29,808 | | | | 1,425,120 | | |
| | | | 20,370,585 | | |
Energy (1.6%): | |
Arch Resources, Inc. | | | 18,716 | | | | 819,199 | | |
Brigham Minerals, Inc. | | | 56,704 | | | | 623,177 | | |
ConocoPhillips | | | 18,131 | | | | 725,059 | | |
CVR Energy, Inc. | | | 37,307 | | | | 555,874 | | |
EOG Resources, Inc. | | | 15,106 | | | | 753,336 | | |
Exxon Mobil Corp. | | | 24,194 | | | | 997,277 | | |
Kinder Morgan, Inc. | | | 61,681 | | | | 843,179 | | |
Murphy Oil Corp. | | | 38,959 | | | | 471,404 | | |
ONEOK, Inc. | | | 18,444 | | | | 707,881 | | |
The Williams Cos., Inc. | | | 35,122 | | | | 704,196 | | |
Valero Energy Corp. | | | 12,661 | | | | 716,233 | | |
| | | | 7,916,815 | | |
Financials (11.0%): | |
Aflac, Inc. | | | 22,539 | | | | 1,002,309 | | |
Ally Financial, Inc. | | | 27,073 | | | | 965,423 | | |
See notes to financial statements.
28
Victory Portfolios II
Victory Market Neutral Income Fund | | Schedule of Portfolio Investments — continued
December 31, 2020 | |
(Unaudited)
Security Description | | Shares | | Value | |
Ares Management Corp., Class A | | | 22,138 | | | $ | 1,041,593 | | |
Associated Bancorp | | | 65,323 | | | | 1,113,757 | | |
B. Riley Financial, Inc. | | | 34,545 | | | | 1,527,580 | | |
BGC Partners, Inc., Class A | | | 290,843 | | | | 1,163,372 | | |
Cathay General Bancorp | | | 34,799 | | | | 1,120,180 | | |
Cincinnati Financial Corp. | | | 10,561 | | | | 922,715 | | |
Citigroup, Inc. | | | 13,814 | | | | 851,771 | | |
Citizens Financial Group, Inc. | | | 24,801 | | | | 886,884 | | |
Discover Financial Services | | | 10,599 | | | | 959,527 | | |
FBL Financial Group, Inc., Class A | | | 20,498 | | | | 1,076,350 | | |
Fidelity National Financial, Inc. | | | 26,468 | | | | 1,034,634 | | |
Fifth Third Bancorp | | | 31,454 | | | | 867,187 | | |
First Commonwealth Financial Corp. | | | 112,873 | | | | 1,234,831 | | |
First Financial Bancorp | | | 55,943 | | | | 980,681 | | |
First Hawaiian, Inc. | | | 57,856 | | | | 1,364,244 | | |
FNB Corp. | | | 95,943 | | | | 911,459 | | |
Franklin Resources, Inc. (c) | | | 43,953 | | | | 1,098,385 | | |
Fulton Financial Corp. | | | 89,984 | | | | 1,144,597 | | |
Hope Bancorp, Inc. | | | 108,488 | | | | 1,183,604 | | |
Huntington Bancshares, Inc. | | | 81,754 | | | | 1,032,553 | | |
Investors Bancorp, Inc. | | | 114,623 | | | | 1,210,419 | | |
JPMorgan Chase & Co. | | | 8,874 | | | | 1,127,619 | | |
KeyCorp | | | 52,343 | | | | 858,949 | | |
Lincoln National Corp. | | | 14,139 | | | | 711,333 | | |
M&T Bank Corp. | | | 8,060 | | | | 1,026,038 | | |
Mercury General Corp. | | | 27,174 | | | | 1,418,755 | | |
MetLife, Inc. | | | 20,813 | | | | 977,170 | | |
Navient Corp. | | | 75,334 | | | | 739,780 | | |
Northern Trust Corp. | | | 11,295 | | | | 1,052,016 | | |
Northwest Bancshares, Inc. (b) | | | 113,018 | | | | 1,439,849 | | |
Principal Financial Group, Inc. | | | 17,490 | | | | 867,679 | | |
Provident Financial Services, Inc. | | | 59,792 | | | | 1,073,864 | | |
Regions Financial Corp. | | | 60,342 | | | | 972,713 | | |
S&T Bancorp, Inc. | | | 47,585 | | | | 1,182,011 | | |
Safety Insurance Group, Inc. (b) | | | 17,595 | | | | 1,370,651 | | |
Sandy Spring Bancorp, Inc. | | | 36,783 | | | | 1,184,045 | | |
State Street Corp. | | | 12,181 | | | | 886,533 | | |
Synchrony Financial | | | 25,430 | | | | 882,675 | | |
The Bank of New York Mellon Corp. | | | 27,351 | | | | 1,160,776 | | |
The Blackstone Group, Inc., Class A | | | 16,771 | | | | 1,086,929 | | |
The Hartford Financial Services Group, Inc. | | | 18,168 | | | | 889,869 | | |
The PNC Financial Services Group, Inc. | | | 7,513 | | | | 1,119,437 | | |
The Travelers Cos., Inc. | | | 8,473 | | | | 1,189,355 | | |
Truist Financial Corp. | | | 18,618 | | | | 892,361 | | |
U.S. Bancorp | | | 22,803 | | | | 1,062,392 | | |
Waddell & Reed Financial, Inc., Class A | | | 75,869 | | | | 1,932,383 | | |
Webster Financial Corp. | | | 26,208 | | | | 1,104,667 | | |
Wells Fargo & Co. | | | 32,789 | | | | 989,572 | | |
WesBanco, Inc. | | | 42,497 | | | | 1,273,210 | | |
| | | | 55,166,686 | | |
See notes to financial statements.
29
Victory Portfolios II
Victory Market Neutral Income Fund | | Schedule of Portfolio Investments — continued
December 31, 2020 | |
(Unaudited)
Security Description | | Shares | | Value | |
Health Care (1.4%): | |
AbbVie, Inc. | | | 15,003 | | | $ | 1,607,571 | | |
CVS Health Corp. | | | 20,458 | | | | 1,397,281 | | |
Merck & Co., Inc. | | | 17,559 | | | | 1,436,326 | | |
National Healthcare Corp. (b) | | | 19,450 | | | | 1,291,675 | | |
Pfizer, Inc. | | | 39,500 | | | | 1,453,995 | | |
| | | | 7,186,848 | | |
Industrials (5.2%): | |
3M Co. | | | 7,752 | | | | 1,354,972 | | |
ACCO Brands Corp. | | | 132,342 | | | | 1,118,290 | | |
Apogee Enterprises, Inc. | | | 31,085 | | | | 984,773 | | |
Caterpillar, Inc. | | | 7,715 | | | | 1,404,284 | | |
Emerson Electric Co. | | | 12,777 | | | | 1,026,887 | | |
Ennis, Inc. (b) | | | 67,381 | | | | 1,202,751 | | |
GATX Corp. (c) | | | 14,978 | | | | 1,245,870 | | |
General Dynamics Corp. | | | 7,991 | | | | 1,189,221 | | |
GrafTech International Ltd. | | | 109,118 | | | | 1,163,198 | | |
H&E Equipment Services, Inc. | | | 35,773 | | | | 1,066,393 | | |
Healthcare Services Group (c) | | | 41,768 | | | | 1,173,681 | | |
HNI Corp. | | | 25,883 | | | | 891,928 | | |
Hyster-Yale Materials Handling, Inc. | | | 20,774 | | | | 1,237,092 | | |
KAR Auction Services, Inc. | | | 45,412 | | | | 845,117 | | |
Knoll, Inc. | | | 59,299 | | | | 870,509 | | |
Macquarie Infrastructure Corp. | | | 22,296 | | | | 837,215 | | |
McGrath RentCorp | | | 14,743 | | | | 989,255 | | |
National Presto Industries, Inc. | | | 14,502 | | | | 1,282,412 | | |
Snap-on, Inc. | | | 6,687 | | | | 1,144,413 | | |
Steelcase, Inc., Class A | | | 71,258 | | | | 965,546 | | |
Systemax, Inc. | | | 50,220 | | | | 1,802,396 | | |
The Greenbrier Cos., Inc. | | | 27,084 | | | | 985,316 | | |
Trinity Industries, Inc. (c) | | | 52,590 | | | | 1,387,850 | | |
| | | | 26,169,369 | | |
Information Technology (2.9%): | |
Benchmark Electronics, Inc. | | | 41,657 | | | | 1,125,156 | | |
Broadcom, Inc. | | | 2,647 | | | | 1,158,989 | | |
Cass Information Systems, Inc. | | | 26,789 | | | | 1,042,360 | | |
Cisco Systems, Inc. | | | 26,668 | | | | 1,193,393 | | |
HP, Inc. | | | 43,786 | | | | 1,076,698 | | |
International Business Machines Corp. | | | 9,655 | | | | 1,215,371 | | |
Juniper Networks, Inc. | | | 54,604 | | | | 1,229,136 | | |
MTS Systems Corp. | | | 25,872 | | | | 1,504,715 | | |
NetApp, Inc. | | | 19,922 | | | | 1,319,633 | | |
Paychex, Inc. | | | 12,642 | | | | 1,177,982 | | |
The Western Union Co. | | | 47,528 | | | | 1,042,764 | | |
Vishay Intertechnology, Inc. | | | 59,636 | | | | 1,235,062 | | |
| | | | 14,321,259 | | |
See notes to financial statements.
30
Victory Portfolios II
Victory Market Neutral Income Fund | | Schedule of Portfolio Investments — continued
December 31, 2020 | |
(Unaudited)
Security Description | | Shares | | Value | |
Materials (4.8%): | |
Avient Corp. | | | 27,154 | | | $ | 1,093,763 | | |
Cabot Corp. | | | 24,207 | | | | 1,086,410 | | |
Carpenter Technology Corp. | | | 32,160 | | | | 936,499 | | |
CF Industries Holdings, Inc. | | | 25,716 | | | | 995,466 | | |
Cleveland-Cliffs, Inc. (c) | | | 103,280 | | | | 1,503,757 | | |
Compass Minerals International, Inc. | | | 17,935 | | | | 1,106,948 | | |
Domtar Corp. | | | 26,773 | | | | 847,366 | | |
Eastman Chemical Co. | | | 13,061 | | | | 1,309,757 | | |
Greif, Inc., Class A (c) | | | 23,970 | | | | 1,123,714 | | |
International Paper Co. | | | 25,727 | | | | 1,279,146 | | |
Kaiser Aluminum Corp. | | | 14,148 | | | | 1,399,237 | | |
Myers Industries, Inc. | | | 45,076 | | | | 936,679 | | |
Nucor Corp. | | | 21,799 | | | | 1,159,489 | | |
Packaging Corp. of America | | | 10,439 | | | | 1,439,643 | | |
Schnitzer Steel Industries, Inc. | | | 43,193 | | | | 1,378,289 | | |
Schweitzer-Mauduit International, Inc. | | | 31,480 | | | | 1,265,811 | | |
Sensient Technologies Corp. | | | 23,265 | | | | 1,716,259 | | |
Tredegar Corp. | | | 69,662 | | | | 1,163,355 | | |
W.R. Grace & Co. | | | 24,365 | | | | 1,335,689 | | |
Westrock Co. | | | 23,998 | | | | 1,044,633 | | |
| | | | 24,121,910 | | |
Real Estate (0.6%): | |
Kennedy-Wilson Holdings, Inc. | | | 66,827 | | | | 1,195,535 | | |
Newmark Group, Inc., Class A | | | 96,913 | | | | 706,496 | | |
The RMR Group, Inc., Class A | | | 35,161 | | | | 1,357,918 | | |
| | | | 3,259,949 | | |
Utilities (5.6%): | |
ALLETE, Inc. | | | 19,145 | | | | 1,185,841 | | |
American Electric Power Co., Inc. (b) | | | 15,407 | | | | 1,282,941 | | |
Avista Corp. | | | 27,690 | | | | 1,111,477 | | |
Consolidated Edison, Inc. (b) | | | 15,971 | | | | 1,154,224 | | |
Dominion Energy, Inc. | | | 13,050 | | | | 981,360 | | |
DTE Energy Co. | | | 8,340 | | | | 1,012,560 | | |
Duke Energy Corp. (b) | | | 14,216 | | | | 1,301,617 | | |
Edison International | | | 19,954 | | | | 1,253,510 | | |
Entergy Corp. | | | 10,121 | | | | 1,010,481 | | |
Evergy, Inc. (b) | | | 17,606 | | | | 977,309 | | |
Exelon Corp. | | | 25,865 | | | | 1,092,020 | | |
FirstEnergy Corp. | | | 31,122 | | | | 952,645 | | |
New Jersey Resources Corp. | | | 28,117 | | | | 999,559 | | |
Northwest Natural Holding Co. | | | 17,568 | | | | 807,952 | | |
NorthWestern Corp. | | | 19,644 | | | | 1,145,442 | | |
Otter Tail Corp. (b) | | | 23,602 | | | | 1,005,681 | | |
Pinnacle West Capital Corp. | | | 14,621 | | | | 1,168,949 | | |
PPL Corp. | | | 35,930 | | | | 1,013,226 | | |
Public Service Enterprise Group, Inc. | | | 22,331 | | | | 1,301,897 | | |
Sempra Energy | | | 8,096 | | | | 1,031,511 | | |
South Jersey Industries, Inc. (c) | | | 45,522 | | | | 980,999 | | |
See notes to financial statements.
31
Victory Portfolios II
Victory Market Neutral Income Fund | | Schedule of Portfolio Investments — continued
December 31, 2020 | |
(Unaudited)
Security Description | | Shares | | Value | |
Spire, Inc. | | | 18,700 | | | $ | 1,197,548 | | |
The AES Corp. | | | 44,967 | | | | 1,056,725 | | |
The Southern Co. (b) | | | 19,138 | | | | 1,175,647 | | |
UGI Corp. | | | 27,096 | | | | 947,276 | | |
Unitil Corp. (b) | | | 25,424 | | | | 1,125,521 | | |
| | | | 28,273,918 | | |
| | | | 213,269,048 | | |
Total Common Stocks (Cost $378,656,052) | | | 418,505,262 | | |
Collateral for Securities Loaned^ (2.7%) | |
United States (2.7%): | |
BlackRock Liquidity Funds TempFund Portfolio, Institutional
Class, 0.08% (e) | | | 231,522 | | | | 231,522 | | |
Fidelity Investments Money Market Government Portfolio I
Shares, 0.01% (e) | | | 7,954,121 | | | | 7,954,121 | | |
Goldman Sachs Financial Square Prime Obligations Fund, Institutional
Class, 0.04% (e) | | | 115,541 | | | | 115,541 | | |
JPMorgan Prime Money Market Fund, Capital Class, 0.12% (e) | | | 921,286 | | | | 921,286 | | |
Morgan Stanley Institutional Liquidity Prime Portfolio, Institutional
Class, 0.09% (e) | | | 4,142,280 | | | | 4,142,280 | | |
Total Collateral for Securities Loaned (Cost $13,364,750) | | | 13,364,750 | | |
Total Investments (Cost $392,020,802) — 86.0% | | | 431,870,012 | | |
Other assets in excess of liabilities — 14.0% | | | 70,282,476 | | |
NET ASSETS — 100.00% | | $ | 502,152,488 | | |
^ Purchased with cash collateral from securities on loan.
(a) Non-income producing security.
(b) All or a portion of this security has been segregated as collateral for derivative instruments.
(c) All or a portion of this security is on loan.
(d) Rule 144A security or other security that is restricted as to resale to institutional investors. The Fund's Adviser has deemed this security to be liquid based upon procedures approved by the Board of Trustees. As of December 31, 2020, the fair value of these securities was $4,920,137 and amounted to 1.0% of net assets.
(e) Rate disclosed is the daily yield on December 31, 2020.
GDR — Global Depositary Receipt
PCL — Public Company Limited
PLC — Public Limited Company
Futures Contracts Purchased
| | | Number of
Contracts | | Expiration
Date | | Notional
Amount | | Value | | Unrealized
Appreciation
(Depreciation) | |
NASDAQ 100 E-Mini Futures | | | 994 | | | 3/19/21 | | $ | 249,878,123 | | | $ | 256,163,740 | | | $ | 6,285,617 | | |
See notes to financial statements.
32
Victory Portfolios II
Victory Market Neutral Income Fund | | Schedule of Portfolio Investments — continued
December 31, 2020 | |
(Unaudited)
Futures Contracts Sold
| | | Number of
Contracts | | Expiration
Date | | Notional
Amount | | Value | | Unrealized
Appreciation
(Depreciation) | |
E-Mini MSCI EAFE Index Futures | | | 885 | | | 3/19/21 | | $ | 93,874,265 | | | $ | 94,287,900 | | | $ | (413,635 | ) | |
E-Mini MSCI Emerging Markets
Index Futures | | | 980 | | | 3/19/21 | | | 61,692,870 | | | | 63,121,800 | | | | (1,428,930 | ) | |
E-Mini Russell 2000 Index
Futures | | | 1,245 | | | 3/19/21 | | | 120,768,384 | | | | 122,931,300 | | | | (2,162,916 | ) | |
E-Mini S&P 500 Futures | | | 2,232 | | | 3/19/21 | | | 411,972,757 | | | | 418,366,080 | | | | (6,393,323 | ) | |
| | | | | | | | | | | | | | | | | | | $ | (10,398,804 | ) | |
| | | Total unrealized appreciation | | | | | | | | $ | 6,285,617 | | |
| | | Total unrealized depreciation | | | | | | | | | (10,398,804 | ) | |
| | | Total net unrealized appreciation (depreciation) | | | | | | | | $ | (4,113,187 | ) | |
See notes to financial statements.
33
Victory Portfolios II | | Statements of Assets and Liabilities
December 31, 2020 | |
(Unaudited)
| | | Victory
US 500
Enhanced
Volatility Wtd
Index Fund | | Victory
Market Neutral
Income Fund | |
ASSETS: | |
Investments, at value (Cost $50,153,835 and $392,020,802) | | $ | 69,310,654 | (a) | | $ | 431,870,012 | (b) | |
Foreign currency, at value (Cost $— and $3,017,940) | | | — | | | | 3,037,239 | | |
Cash and cash equivalents | | | — | | | | 62,466,280 | | |
Deposit with brokers for futures contracts | | | 137,003 | | | | 53,934,933 | | |
Receivables: | |
Interest and dividends | | | 72,790 | | | | 631,898 | | |
Capital shares issued | | | 348 | | | | 898,657 | | |
Investments sold | | | 25,552 | | | | 555,217 | | |
Variation margin on open futures contracts | | | 2,460 | | | | 1,839,233 | | |
Reclaims | | | — | | | | 36,341 | | |
From Adviser | | | 32,328 | | | | 212,951 | | |
Prepaid expenses | | | 1,079 | | | | 32,980 | | |
Total Assets | | | 69,582,214 | | | | 555,515,741 | | |
LIABILITIES: | |
Payables: | |
Collateral received on loaned securities | | | 1,693,514 | | | | 13,364,750 | | |
Payable to custodian | | | 41,999 | | | | — | | |
Investments purchased | | | — | | | | 36,717,673 | | |
Capital shares redeemed | | | 6 | | | | 219,862 | | |
Variation margin on open futures contracts | | | — | | | | 2,745,360 | | |
Accrued foreign capital gains taxes | | | — | | | | 93,069 | | |
Accrued expenses and other payables: | |
Investment advisory fees | | | 39,995 | | | | 167,750 | | |
Administration fees | | | 3,450 | | | | 17,276 | | |
Custodian fees | | | 4,368 | | | | 9,982 | | |
Transfer agent fees | | | 16,323 | | | | — | | |
Compliance fees | | | 51 | | | | 156 | | |
Trustees' fees | | | — | | | | 412 | | |
| 12b-1 fees | | | 13,634 | | | | 2,683 | | |
Other accrued expenses | | | 21,444 | | | | 24,280 | | |
Total Liabilities | | | 1,834,784 | | | | 53,363,253 | | |
NET ASSETS: | |
Capital | | | 49,197,231 | | | | 505,223,159 | | |
Total accumulated earnings/(loss) | | | 18,550,199 | | | | (3,070,671 | ) | |
Net Assets | | $ | 67,747,430 | | | $ | 502,152,488 | | |
Net Assets | |
Class A Shares | | $ | 30,093,489 | | | $ | 21,854,330 | | |
Class C Shares | | | 24,038,693 | | | | 926,490 | | |
Class I Shares | | | 13,615,248 | | | | 478,941,514 | | |
Member Class | | | — | | | | 430,154 | | |
Total | | $ | 67,747,430 | | | $ | 502,152,488 | | |
Shares (unlimited number of shares authorized with a par value
of $0.001 per share): | |
Class A Shares | | | 2,070,399 | | | | 2,293,457 | | |
Class C Shares | | | 1,719,495 | | | | 98,185 | | |
Class I Shares | | | 935,708 | | | | 49,968,833 | | |
Member Class | | | — | | | | 45,139 | | |
Total | | | 4,725,602 | | | | 52,405,614 | | |
Net asset value, offering (except Class A Shares) and redemption
price per share: | |
Class A Shares | | $ | 14.54 | | | $ | 9.53 | | |
Class C Shares (c) | | | 13.98 | | | | 9.44 | | |
Class I Shares | | | 14.55 | | | | 9.58 | | |
Member Class | | | — | | | | 9.53 | | |
Maximum Sales Charge — Class A Shares | | | 5.75 | % | | | 5.75 | % | |
Maximum offering price
(100%/(100%-maximum sales charge) of net asset value
adjusted to the nearest cent) per share — Class A Shares | | $ | 15.43 | | | $ | 10.11 | | |
(a) Includes $1,658,343 of securities on loan.
(b) Includes $12,897,893 of securities on loan.
(c) Redemption price per share varies by the length of time shares are held.
See notes to financial statements.
34
Victory Portfolios II | | Statements of Operations
For the Six Months Ended December 31, 2020 | |
(Unaudited)
| | | Victory
US 500
Enhanced
Volatility Wtd
Index Fund | | Victory
Market Neutral
Income Fund | |
Investment Income: | |
Dividends | | $ | 507,095 | | | $ | 4,530,050 | | |
Interest | | | — | | | | 4,886 | | |
Securities lending (net of fees) | | | 1,581 | | | | 22,442 | | |
Foreign tax withholding | | | — | | | | (306,350 | ) | |
Total Income | | | 508,676 | | | | 4,251,028 | | |
Expenses: | |
Investment advisory fees | | | 236,241 | | | | 712,394 | | |
Administration fees | | | 20,416 | | | | 71,582 | | |
Sub-Administration fees | | | 8,899 | | | | 8,405 | | |
12b-1 fees — Class A Shares | | | 35,779 | | | | 11,236 | | |
12b-1 fees — Class C Shares | | | 122,249 | | | | 3,564 | | |
Custodian fees | | | 5,571 | | | | 83,082 | | |
Transfer agent fees — Class A Shares | | | 14,935 | | | | 2,116 | | |
Transfer agent fees — Class C Shares | | | 13,695 | | | | 260 | | |
Transfer agent fees — Class I Shares | | | 6,246 | | | | 65,028 | | |
Transfer agent fees — Member Class (a) | | | — | | | | 15 | | |
Trustees' fees | | | 3,124 | | | | 8,501 | | |
Compliance fees | | | 319 | | | | 951 | | |
Legal and audit fees | | | 7,144 | | | | 19,240 | | |
State registration and filing fees | | | 25,761 | | | | 34,275 | | |
Broker interest fees | | | — | | | | 56,205 | | |
Other expenses | | | 14,168 | | | | 31,307 | | |
Total Expenses | | | 514,547 | | | | 1,108,161 | | |
Expenses waived/reimbursed by Adviser | | | (104,694 | ) | | | (528,413 | ) | |
Expenses waived/reimbursed by Distributor | | | (500 | ) | | | (10,000 | ) | |
Net Expenses | | | 409,353 | | | | 569,748 | | |
Net Investment Income (Loss) | | | 99,323 | | | | 3,681,280 | | |
Realized/Unrealized Gains (Losses) from Investments: | |
Net realized gains (losses) from investment securities and
foreign currency translations | | | 1,311,787 | | | | 4,133,341 | | |
Foreign taxes on realized gains | | | — | | | | (1,583 | ) | |
Net realized gains (losses) from futures contracts | | | 94,395 | | | | (31,161,452 | ) | |
Net change in unrealized appreciation/depreciation on investment
securities and foreign currency translations | | | 10,916,086 | | | | 37,312,131 | | |
Net change in unrealized appreciation/depreciation on futures
contracts | | | (311 | ) | | | (9,693,238 | ) | |
Net change in accrued foreign taxes on unrealized gains | | | — | | | | (71,554 | ) | |
Net realized/unrealized gains (losses) on investments | | | 12,321,957 | | | | 517,645 | | |
Change in net assets resulting from operations | | $ | 12,421,280 | | | $ | 4,198,925 | | |
(a) Victory Market Neutral Income Fund Member Class commenced operations on November 3, 2020.
See notes to financial statements.
35
Victory Portfolios II | | Statements of Changes in Net Assets | |
| | | Victory US 500
Enhanced Volatility Wtd
Index Fund | | Victory Market Neutral
Income Fund | |
| | | Six
Months
Ended
December 31,
2020
(unaudited) | | Year
Ended
June 30,
2020 | | Six
Months
Ended
December 31,
2020
(unaudited) | | Year
Ended
June 30,
2020 | |
From Investment Activities: | |
Operations: | |
Net investment income (loss) | | $ | 99,323 | | | $ | 282,179 | | | $ | 3,681,280 | | | $ | 4,852,563 | | |
Net realized gains (losses) from
investments | | | 1,406,182 | | | | 10,001,368 | | | | (27,029,694 | ) | | | (2,547,963 | ) | |
Net change in unrealized
appreciation/depreciation
on investments | | | 10,915,775 | | | | (5,353,313 | ) | | | 27,547,339 | | | | 7,737,659 | | |
Change in net assets resulting
from operations | | | 12,421,280 | | | | 4,930,234 | | | | 4,198,925 | | | | 10,042,259 | | |
Distributions to Shareholders: | |
Class A Shares | | | (3,047,556 | ) | | | (3,629,656 | ) | | | (710,221 | ) | | | (475,577 | ) | |
Class C Shares | | | (2,479,942 | ) | | | (3,821,175 | ) | | | (28,816 | ) | | | (6,981 | ) | |
Class I Shares | | | (1,441,847 | ) | | | (2,728,622 | ) | | | (9,271,362 | ) | | | (4,070,545 | ) | |
Member Class (a) | | | — | | | | — | | | | (6,188 | ) | | | — | | |
Change in net assets resulting from
distributions to shareholders | | | (6,969,345 | ) | | | (10,179,453 | ) | | | (10,016,587 | ) | | | (4,553,103 | ) | |
Change in net assets resulting from
capital transactions | | | (4,517,571 | ) | | | (23,493,549 | ) | | | 319,755,356 | | | | 94,738,075 | | |
Change in net assets | | | 934,364 | | | | (28,742,768 | ) | | | 313,937,694 | | | | 100,277,231 | | |
Net Assets: | |
Beginning of period | | | 66,813,066 | | | | 95,555,834 | | | | 188,214,794 | | | | 87,987,563 | | |
End of period | | $ | 67,747,430 | | | $ | 66,813,066 | | | $ | 502,152,488 | | | $ | 188,214,794 | | |
(a) Victory Market Neutral Income Fund Member Class commenced operations on November 3, 2020.
(continues on next page)
See notes to financial statements.
36
Victory Portfolios II | | Statements of Changes in Net Assets | |
(continued)
| | | Victory US 500
Enhanced Volatility Wtd
Index Fund | | Victory Market Neutral
Income Fund | |
| | | Six
Months
Ended
December 31,
2020
(unaudited) | | Year
Ended
June 30,
2020 | | Six
Months
Ended
December 31,
2020
(unaudited) | | Year
Ended
June 30,
2020 | |
Capital Transactions: | |
Class A Shares | |
Proceeds from shares issued | | $ | 1,364,929 | | | $ | 1,011,964 | | | $ | 11,361,868 | | | $ | 10,172,219 | | |
Distributions reinvested | | | 3,021,095 | | | | 3,601,418 | | | | 690,930 | | | | 470,960 | | |
Cost of shares redeemed | | | (3,008,940 | ) | | | (9,875,436 | ) | | | (2,604,673 | ) | | | (31,050,301 | ) | |
Total Class A Shares | | $ | 1,377,084 | | | $ | (5,262,054 | ) | | $ | 9,448,125 | | | $ | (20,407,122 | ) | |
Class C Shares | |
Proceeds from shares issued | | $ | 261,064 | | | $ | 744,798 | | | $ | 359,121 | | | $ | 286,307 | | |
Distributions reinvested | | | 2,452,286 | | | | 3,779,973 | | | | 28,816 | | | | 6,981 | | |
Cost of shares redeemed | | | (6,868,146 | ) | | | (11,854,457 | ) | | | (67,986 | ) | | | (120,324 | ) | |
Total Class C Shares | | $ | (4,154,796 | ) | | $ | (7,329,686 | ) | | $ | 319,951 | | | $ | 172,964 | | |
Class I Shares | |
Proceeds from shares issued | | $ | 845,039 | | | $ | 2,905,460 | | | $ | 314,724,018 | | | $ | 136,738,767 | | |
Distributions reinvested | | | 1,421,148 | | | | 2,572,276 | | | | 8,860,761 | | | | 3,984,071 | | |
Cost of shares redeemed | | | (4,006,046 | ) | | | (16,379,545 | ) | | | (14,033,392 | ) | | | (25,750,605 | ) | |
Total Class I Shares | | $ | (1,739,859 | ) | | $ | (10,901,809 | ) | | $ | 309,551,387 | | | $ | 114,972,233 | | |
Member Class (a) | |
Proceeds from shares issued | | $ | — | | | $ | — | | | $ | 429,705 | | | $ | — | | |
Distributions reinvested | | | — | | | | — | | | | 6,188 | | | | — | | |
Total Member Class | | $ | — | | | $ | — | | | $ | 435,893 | | | $ | — | | |
Change in net assets resulting from
capital transactions | | $ | (4,517,571 | ) | | $ | (23,493,549 | ) | | $ | 319,755,356 | | | $ | 94,738,075 | | |
Share Transactions: | |
Class A Shares | |
Issued | | | 100,613 | | | | 73,351 | | | | 1,173,081 | | | | 1,055,922 | | |
Reinvested | | | 211,080 | | | | 266,210 | | | | 72,036 | | | | 49,332 | | |
Redeemed | | | (208,165 | ) | | | (715,630 | ) | | | (268,274 | ) | | | (3,220,943 | ) | |
Total Class A Shares | | | 103,528 | | | | (376,069 | ) | | | 976,843 | | | | (2,115,689 | ) | |
Class C Shares | |
Issued | | | 18,529 | | | | 55,810 | | | | 37,682 | | | | 29,942 | | |
Reinvested | | | 178,089 | | | | 287,964 | | | | 3,032 | | | | 735 | | |
Redeemed | | | (497,640 | ) | | | (887,789 | ) | | | (7,134 | ) | | | (12,813 | ) | |
Total Class C Shares | | | (301,022 | ) | | | (544,015 | ) | | | 33,580 | | | | 17,864 | | |
Class I Shares | |
Issued | | | 57,850 | | | | 205,422 | | | | 32,718,274 | | | | 14,290,486 | | |
Reinvested | | | 99,190 | | | | 189,857 | | | | 918,585 | | | | 414,197 | | |
Redeemed | | | (276,913 | ) | | | (1,198,037 | ) | | | (1,446,421 | ) | | | (2,675,738 | ) | |
Total Class I Shares | | | (119,873 | ) | | | (802,758 | ) | | | 32,190,438 | | | | 12,028,945 | | |
Member Class (a) | |
Issued | | | — | | | | — | | | | 44,495 | | | | — | | |
Reinvested | | | — | | | | — | | | | 644 | | | | — | | |
Total Member Class | | | — | | | | — | | | | 45,139 | | | | — | | |
Change in Shares | | | (317,367 | ) | | | (1,722,842 | ) | | | 33,246,000 | | | | 9,931,120 | | |
(a) Victory Market Neutral Income Fund Member Class commenced operations on November 3, 2020.
See notes to financial statements.
37
Victory Portfolios II | | Financial Highlights | |
For a Share Outstanding Throughout Each Period
| | | | Investment Activities | | Distributions to
Shareholders From | |
| | | Net Asset
Value,
Beginning of
Period | | Net
Investment
Income
(Loss)(a) | | Net Realized
and Unrealized
Gains (Losses)
on Investments | | Total from
Investment
Activities | | Net
Investment
Income | | Net Realized
Gains From
Investments | |
Victory US 500 Enhanced Volatility Wtd Index Fund | |
Class A | |
Six Months Ended
12/31/20 (unaudited) | | $ | 13.42 | | | | 0.04 | | | | 2.69 | | | | 2.73 | | | | (0.02 | ) | | | (1.59 | ) | |
Year Ended 6/30/20 | | $ | 14.26 | | | | 0.08 | | | | 0.88 | | | | 0.96 | | | | (0.07 | ) | | | (1.73 | ) | |
Year Ended 6/30/19 | | $ | 16.50 | | | | 0.13 | | | | (0.36 | ) | | | (0.23 | ) | | | (0.12 | ) | | | (1.89 | ) | |
Year Ended 6/30/18 | | $ | 16.04 | | | | 0.11 | | | | 1.91 | | | | 2.02 | | | | (0.10 | ) | | | (1.46 | ) | |
Year Ended 6/30/17 | | $ | 13.80 | | | | 0.11 | | | | 2.48 | | | | 2.59 | | | | (0.11 | ) | | | (0.24 | ) | |
Year Ended 6/30/16 | | $ | 14.15 | | | | 0.13 | | | | 0.16 | | | | 0.29 | | | | (0.12 | ) | | | (0.52 | ) | |
Class C | |
Six Months Ended
12/31/20 (unaudited) | | $ | 12.99 | | | | (0.02 | ) | | | 2.60 | | | | 2.58 | | | | — | (f) | | | (1.59 | ) | |
Year Ended 6/30/20 | | $ | 13.90 | | | | (0.03 | ) | | | 0.87 | | | | 0.84 | | | | (0.02 | ) | | | (1.73 | ) | |
Year Ended 6/30/19 | | $ | 16.16 | | | | 0.02 | | | | (0.35 | ) | | | (0.33 | ) | | | (0.04 | ) | | | (1.89 | ) | |
Year Ended 6/30/18 | | $ | 15.78 | | | | (0.02 | ) | | | 1.86 | | | | 1.84 | | | | — | (f) | | | (1.46 | ) | |
Year Ended 6/30/17 | | $ | 13.59 | | | | — | (f) | | | 2.44 | | | | 2.44 | | | | (0.01 | ) | | | (0.24 | ) | |
Year Ended 6/30/16 | | $ | 13.95 | | | | 0.02 | | | | 0.17 | | | | 0.19 | | | | (0.03 | ) | | | (0.52 | ) | |
Class I | |
Six Months Ended
12/31/20 (unaudited) | | $ | 13.43 | | | | 0.06 | | | | 2.69 | | | | 2.75 | | | | (0.04 | ) | | | (1.59 | ) | |
Year Ended 6/30/20 | | $ | 14.26 | | | | 0.12 | | | | 0.88 | | | | 1.00 | | | | (0.10 | ) | | | (1.73 | ) | |
Year Ended 6/30/19 | | $ | 16.50 | | | | 0.17 | | | | (0.36 | ) | | | (0.19 | ) | | | (0.16 | ) | | | (1.89 | ) | |
Year Ended 6/30/18 | | $ | 16.05 | | | | 0.15 | | | | 1.90 | | | | 2.05 | | | | (0.14 | ) | | | (1.46 | ) | |
Year Ended 6/30/17 | | $ | 13.80 | | | | 0.15 | | | | 2.48 | | | | 2.63 | | | | (0.14 | ) | | | (0.24 | ) | |
Year Ended 6/30/16 | | $ | 14.15 | | | | 0.16 | | | | 0.16 | | | | 0.32 | | | | (0.15 | ) | | | (0.52 | ) | |
(a) Per share net investment income (loss) has been calculated using the average daily shares method.
(b) Not annualized for periods less than one year.
(c) Annualized for periods less than one year.
(d) Portfolio turnover is calculated on the basis of the Fund as a whole without distinguishing between the classes of shares issued.
(e) Portfolio turnover increased significantly due to changes in the volume and timing of purchases and sales of portfolio holdings during the year.
(f) Amount is less than $0.005 per share
See notes to financial statements.
38
Victory Portfolios II | | Financial Highlights — continued | |
For a Share Outstanding Throughout Each Period
| | | | | Ratios to Average Net Assets | | Supplemental Data | |
| | | Total
Distributions | | Net Asset
Value,
End of
Period | | Total
Return
(excludes
sales
charge)(b) | | Net
Expenses(c) | | Net
Investment
Income
(Loss)(c) | | Gross
Expenses(c) | | Net Assets,
End of
Period
(000's) | | Portfolio
Turnover(b)(d) | |
Victory US 500 Enhanced Volatility Wtd Index Fund | |
Class A | |
Six Months Ended
12/31/20 (unaudited) | | | (1.61 | ) | | $ | 14.54 | | | | 20.59 | % | | | 0.99 | % | | | 0.52 | % | | | 1.28 | % | | $ | 30,093 | | | | 40 | % | |
Year Ended 6/30/20 | | | (1.80 | ) | | $ | 13.42 | | | | 6.71 | % | | | 0.99 | % | | | 0.56 | % | | | 1.28 | % | | $ | 26,394 | | | | 54 | % | |
Year Ended 6/30/19 | | | (2.01 | ) | | $ | 14.26 | | | | (0.01 | )% | | | 0.99 | % | | | 0.84 | % | | | 1.25 | % | | $ | 33,406 | | | | 120 | %(e) | |
Year Ended 6/30/18 | | | (1.56 | ) | | $ | 16.50 | | | | 12.79 | % | | | 0.99 | % | | | 0.67 | % | | | 1.19 | % | | $ | 51,671 | | | | 45 | % | |
Year Ended 6/30/17 | | | (0.35 | ) | | $ | 16.04 | | | | 18.89 | % | | | 0.99 | % | | | 0.75 | % | | | 1.35 | % | | $ | 36,721 | | | | 38 | % | |
Year Ended 6/30/16 | | | (0.64 | ) | | $ | 13.80 | | | | 2.17 | % | | | 0.99 | % | | | 0.92 | % | | | 1.28 | % | | $ | 62,700 | | | | 46 | % | |
Class C | |
Six Months Ended
12/31/20 (unaudited) | | | (1.59 | ) | | $ | 13.98 | | | | 20.06 | % | | | 1.74 | % | | | (0.24 | )% | | | 2.06 | % | | $ | 24,039 | | | | 40 | % | |
Year Ended 6/30/20 | | | (1.75 | ) | | $ | 12.99 | | | | 5.96 | % | | | 1.74 | % | | | (0.19 | )% | | | 2.03 | % | | $ | 26,240 | | | | 54 | % | |
Year Ended 6/30/19 | | | (1.93 | ) | | $ | 13.90 | | | | (0.73 | )% | | | 1.74 | % | | | 0.10 | % | | | 2.00 | % | | $ | 35,649 | | | | 120 | %(e) | |
Year Ended 6/30/18 | | | (1.46 | ) | | $ | 16.16 | | | | 11.78 | % | | | 1.74 | % | | | (0.11 | )% | | | 1.97 | % | | $ | 41,410 | | | | 45 | % | |
Year Ended 6/30/17 | | | (0.25 | ) | | $ | 15.78 | | | | 18.09 | % | | | 1.74 | % | | | 0.01 | % | | | 2.12 | % | | $ | 57,620 | | | | 38 | % | |
Year Ended 6/30/16 | | | (0.55 | ) | | $ | 13.59 | | | | 1.42 | % | | | 1.74 | % | | | 0.16 | % | | | 2.11 | % | | $ | 58,249 | | | | 46 | % | |
Class I | |
Six Months Ended
12/31/20 (unaudited) | | | (1.63 | ) | | $ | 14.55 | | | | 20.71 | % | | | 0.74 | % | | | 0.76 | % | | | 1.07 | % | | $ | 13,615 | | | | 40 | % | |
Year Ended 6/30/20 | | | (1.83 | ) | | $ | 13.43 | | | | 6.97 | % | | | 0.74 | % | | | 0.86 | % | | | 1.02 | % | | $ | 14,179 | | | | 54 | % | |
Year Ended 6/30/19 | | | (2.05 | ) | | $ | 14.26 | | | | 0.24 | % | | | 0.74 | % | | | 1.10 | % | | | 1.00 | % | | $ | 26,501 | | | | 120 | %(e) | |
Year Ended 6/30/18 | | | (1.60 | ) | | $ | 16.50 | | | | 12.97 | % | | | 0.74 | % | | | 0.91 | % | | | 0.95 | % | | $ | 36,400 | | | | 45 | % | |
Year Ended 6/30/17 | | | (0.38 | ) | | $ | 16.05 | | | | 19.24 | % | | | 0.74 | % | | | 1.00 | % | | | 1.13 | % | | $ | 32,751 | | | | 38 | % | |
Year Ended 6/30/16 | | | (0.67 | ) | | $ | 13.80 | | | | 2.42 | % | | | 0.74 | % | | | 1.14 | % | | | 1.11 | % | | $ | 44,170 | | | | 46 | % | |
See notes to financial statements.
39
Victory Portfolios II | | Financial Highlights | |
For a Share Outstanding Throughout Each Period
| | | | Investment Activities | | Distributions to
Shareholders From | |
| | | Net Asset
Value,
Beginning of
Period | | Net
Investment
Income
(Loss)(a) | | Net Realized
and Unrealized
Gains (Losses)
on Investments | | Total from
Investment
Activities | | Net
Investment
Income | | Net Realized
Gains From
Investments | |
Victory Market Neutral Income Fund | |
Class A | |
Six Months Ended
12/31/20 (unaudited) | | $ | 9.77 | | | | 0.13 | | | | (0.01 | )(e) | | | 0.12 | | | | (0.11 | ) | | | (0.25 | ) | |
Year Ended 6/30/20 | | $ | 9.51 | | | | 0.27 | | | | 0.23 | | | | 0.50 | | | | (0.24 | ) | | | — | | |
Year Ended 6/30/19 | | $ | 9.61 | | | | 0.32 | | | | (0.13 | ) | | | 0.19 | | | | (0.27 | ) | | | (0.02 | ) | |
Year Ended 6/30/18 | | $ | 9.40 | | | | 0.24 | | | | 0.26 | | | | 0.50 | | | | (0.29 | ) | | | — | | |
Year Ended 6/30/17 | | $ | 9.21 | | | | 0.24 | | | | 0.20 | | | | 0.44 | | | | (0.25 | ) | | | — | | |
Year Ended 6/30/16 | | $ | 9.41 | | | | 0.26 | | | | (0.02 | ) | | | 0.24 | | | | (0.21 | ) | | | (0.23 | ) | |
Class C | |
Six Months Ended
12/31/20 (unaudited) | | $ | 9.69 | | | | 0.10 | | | | (0.02 | )(e) | | | 0.08 | | | | (0.08 | ) | | | (0.25 | ) | |
Year Ended 6/30/20 | | $ | 9.43 | | | | 0.21 | | | | 0.22 | | | | 0.43 | | | | (0.17 | ) | | | — | | |
Year Ended 6/30/19 | | $ | 9.54 | | | | 0.25 | | | | (0.14 | ) | | | 0.11 | | | | (0.20 | ) | | | (0.02 | ) | |
Year Ended 6/30/18 | | $ | 9.33 | | | | 0.17 | | | | 0.26 | | | | 0.43 | | | | (0.22 | ) | | | — | | |
Year Ended 6/30/17 | | $ | 9.15 | | | | 0.17 | | | | 0.20 | | | | 0.37 | | | | (0.19 | ) | | | — | | |
Year Ended 6/30/16 | | $ | 9.36 | | | | 0.19 | | | | (0.02 | ) | | | 0.17 | | | | (0.15 | ) | | | (0.23 | ) | |
Class I | |
Six Months Ended
12/31/20 (unaudited) | | $ | 9.83 | | | | 0.15 | | | | (0.02 | )(e) | | | 0.13 | | | | (0.13 | ) | | | (0.25 | ) | |
Year Ended 6/30/20 | | $ | 9.55 | | | | 0.31 | | | | 0.23 | | | | 0.54 | | | | (0.26 | ) | | | — | | |
Year Ended 6/30/19 | | $ | 9.65 | | | | 0.38 | | | | (0.16 | ) | | | 0.22 | | | | (0.30 | ) | | | (0.02 | ) | |
Year Ended 6/30/18 | | $ | 9.44 | | | | 0.26 | | | | 0.26 | | | | 0.52 | | | | (0.31 | ) | | | — | | |
Year Ended 6/30/17 | | $ | 9.24 | | | | 0.27 | | | | 0.20 | | | | 0.47 | | | | (0.27 | ) | | | — | | |
Year Ended 6/30/16 | | $ | 9.44 | | | | 0.30 | | | | (0.04 | ) | | | 0.26 | | | | (0.23 | ) | | | (0.23 | ) | |
Member Class | |
11/3/20(h) through
12/31/20 | | $ | 9.62 | | | | 0.27 | | | | (0.09 | )(e) | | | 0.18 | | | | (0.02 | ) | | | (0.25 | ) | |
(a) Per share net investment income (loss) has been calculated using the average daily shares method.
(b) Not annualized for period less than one year.
(c) Annualized for periods less than one year.
(d) Portfolio turnover is calculated on the basis of the Fund as a whole without distinguishing between the classes of shares issued.
(e) The amount shown for a share outstanding throughout the period does not accord with the change in net assets resulting from operations during the period because of the timing of sales and purchases of fund shares in relation to fluctuating market values during the period.
(f) The net expense ratios include broker interest fees which are excluded from the expense limits of the Fund. The net expense ratios excluding broker interest fees for the period ended December 31, 2020, are 0.75%, 1.50%, 0.40% and 0.55% for Class A, Class C, Class I and Member Class shares, respectively.
(g) Portfolio turnover increased significantly due to changes in the volume and timing of purchases and sales of portfolio holdings during the year.
(h) Commencement of operations.
See notes to financial statements.
40
Victory Portfolios II | | Financial Highlights — continued | |
For a Share Outstanding Throughout Each Period
| | | | | Ratios to Average Net Assets | | Supplemental Data | |
| | | Total
Distributions | | Net Asset
Value,
End of
Period | | Total
Return
(excludes
sales
charge)(b) | | Net
Expenses(c) | | Net
Investment
Income
(Loss)(c) | | Gross
Expenses(c) | | Net Assets,
End of
Period
(000's) | | Portfolio
Turnover(b)(d) | |
Victory Market Neutral Income Fund | |
Class A | |
Six Months Ended
12/31/20 (unaudited) | | | (0.36 | ) | | $ | 9.53 | | | | 1.24 | % | | | 0.80 | %(f) | | | 2.75 | % | | | 1.13 | % | | $ | 21,854 | | | | 43 | % | |
Year Ended 6/30/20 | | | (0.24 | ) | | $ | 9.77 | | | | 5.31 | % | | | 0.75 | % | | | 2.78 | % | | | 1.17 | % | | $ | 12,870 | | | | 119 | %(g) | |
Year Ended 6/30/19 | | | (0.29 | ) | | $ | 9.51 | | | | 1.99 | % | | | 0.75 | % | | | 3.36 | % | | | 1.03 | % | | $ | 32,627 | | | | 82 | %% | |
Year Ended 6/30/18 | | | (0.29 | ) | | $ | 9.61 | | | | 5.37 | % | | | 0.89 | % | | | 2.55 | % | | | 1.18 | % | | $ | 23,847 | | | | 69 | % | |
Year Ended 6/30/17 | | | (0.25 | ) | | $ | 9.40 | | | | 4.77 | % | | | 0.90 | % | | | 2.59 | % | | �� | 1.25 | % | | $ | 24,998 | | | | 63 | % | |
Year Ended 6/30/16 | | | (0.44 | ) | | $ | 9.21 | | | | 2.54 | % | | | 0.90 | % | | | 2.72 | % | | | 1.06 | % | | $ | 29,649 | | | | 92 | % | |
Class C | |
Six Months Ended
12/31/20 (unaudited) | | | (0.33 | ) | | $ | 9.44 | | | | 0.81 | % | | | 1.55 | %(f) | | | 2.03 | % | | | 2.21 | % | | $ | 926 | | | | 43 | % | |
Year Ended 6/30/20 | | | (0.17 | ) | | $ | 9.69 | | | | 4.59 | % | | | 1.50 | % | | | 2.20 | % | | | 2.62 | % | | $ | 626 | | | | 119 | %(g) | |
Year Ended 6/30/19 | | | (0.22 | ) | | $ | 9.43 | | | | 1.19 | % | | | 1.50 | % | | | 2.57 | % | | | 2.56 | % | | $ | 441 | | | | 82 | % | |
Year Ended 6/30/18 | | | (0.22 | ) | | $ | 9.54 | | | | 4.64 | % | | | 1.64 | % | | | 1.79 | % | | | 2.51 | % | | $ | 311 | | | | 69 | % | |
Year Ended 6/30/17 | | | (0.19 | ) | | $ | 9.33 | | | | 4.02 | % | | | 1.65 | % | | | 1.88 | % | | | 3.00 | % | | $ | 519 | | | | 63 | % | |
Year Ended 6/30/16 | | | (0.38 | ) | | $ | 9.15 | | | | 1.75 | % | | | 1.65 | % | | | 2.00 | % | | | 2.48 | % | | $ | 518 | | | | 92 | % | |
Class I | |
Six Months Ended
12/31/20 (unaudited) | | | (0.38 | ) | | $ | 9.58 | | | | 1.28 | % | | | 0.45 | %(f) | | | 3.10 | % | | | 0.90 | % | | $ | 478,942 | | | | 43 | % | |
Year Ended 6/30/20 | | | (0.26 | ) | | $ | 9.83 | | | | 5.79 | % | | | 0.40 | % | | | 3.23 | % | | | 0.89 | % | | $ | 174,719 | | | | 119 | %(g) | |
Year Ended 6/30/19 | | | (0.32 | ) | | $ | 9.55 | | | | 2.25 | % | | | 0.40 | % | | | 3.91 | % | | | 1.05 | % | | $ | 54,920 | | | | 82 | % | |
Year Ended 6/30/18 | | | (0.31 | ) | | $ | 9.65 | | | | 5.62 | % | | | 0.64 | % | | | 2.72 | % | | | 1.09 | % | | $ | 19,483 | | | | 69 | % | |
Year Ended 6/30/17 | | | (0.27 | ) | | $ | 9.44 | | | | 5.11 | % | | | 0.65 | % | | | 2.83 | % | | | 1.13 | % | | $ | 31,140 | | | | 63 | % | |
Year Ended 6/30/16 | | | (0.46 | ) | | $ | 9.24 | | | | 2.77 | % | | | 0.65 | % | | | 3.16 | % | | | 1.05 | % | | $ | 43,866 | | | | 92 | % | |
Member Class | |
11/3/20(h) through
12/31/20 | | | (0.27 | ) | | $ | 9.53 | | | | 1.87 | % | | | 0.70 | %(f) | | | 17.17 | % | | | 10.06 | % | | $ | 430 | | | | 43 | % | |
See notes to financial statements.
41
Victory Portfolios II | | Notes to Financial Statements
December 31, 2020 | |
(Unaudited)
1. Organization:
Victory Portfolios II (the "Trust") was organized on April 11, 2012 as a Delaware statutory trust as a successor to the "Compass EMP Funds Trust." The Trust is registered under the Investment Company Act of 1940, as amended (the "1940 Act"), as an open-end investment company. The Trust is comprised of 27 funds, 25 of which are Exchange-Traded Funds ("ETFs"), and is authorized to issue an unlimited number of shares, which are units of beneficial interest with no par value. Each Fund is classified as diversified under the 1940 Act.
The accompanying financial statements are those of the two following Funds (collectively, the "Funds" and individually, a "Fund").
Funds (Legal Name) | | Funds (Short Name) | | Investment Share
Classes Offered | |
Victory US 500 Enhanced Volatility
Wtd Index Fund | | US 500 Enhanced Volatility Wtd
Index Fund | | Classes A, C and I
| |
Victory Market Neutral Income Fund
| | Market Neutral Income Fund
| | Classes A, C, I and
Member Class* | |
* Member Class commenced operations on November 3, 2020.
Each class of shares of a Fund has substantially identical rights and privileges, except with respect to sales charges, fees paid under distribution plans, expenses allocable exclusively to each class of shares, voting rights on matters solely affecting a single class of shares, and the exchange privilege of each class of shares.
Under the Trust's organizational documents, its officers and trustees are indemnified against certain liabilities arising out of the performance of their duties to the Funds. In addition, in the normal course of business, the Funds enter into contracts with their vendors and others that provide for general indemnifications. The Funds' maximum exposure under these arrangements is unknown, as this would involve future claims that may be made against the Funds. However, based on experience, the Funds expect that risk of loss to be remote.
2. Significant Accounting Policies:
The following is a summary of significant accounting policies followed by the Trust in the preparation of its financial statements. The policies are in conformity with Generally Accepted Accounting Principles in the United States of America ("GAAP"). The preparation of financial statements in accordance with GAAP requires management to make estimates and assumptions that affect the reported amounts of assets and liabilities and disclosure of contingent assets and liabilities at the date of the financial statements and the reported amounts of income and expenses for the period. Actual results could differ from those estimates. The Funds follow the specialized accounting and reporting requirements under GAAP that are applicable to investment companies.
Investment Valuation:
The Funds record investments at fair value. Fair value is defined as the price that would be received to sell an asset or paid to transfer a liability in an orderly transaction between market participants at the measurement date.
The valuation techniques described below maximize the use of observable inputs and minimize the use of unobservable inputs in determining fair value. The inputs used for valuing the Funds' investments are summarized in the three broad levels listed below:
• Level 1 — quoted prices in active markets for identical securities
• Level 2 — other significant observable inputs (including quoted prices for similar securities or interest rates applicable to those securities, etc.)
• Level 3 — significant unobservable inputs (including the Funds' own assumptions in determining the fair value of investments)
42
Victory Portfolios II | | Notes to Financial Statements — continued
December 31, 2020 | |
(Unaudited)
Changes in valuation techniques may result in transfers in or out of an assigned level within the disclosure hierarchy. The inputs or methodologies used for valuation techniques are not necessarily an indication of the risk associated with entering into those investments.
Portfolio securities listed or traded on securities exchanges, including ETFs, American Depositary Receipts ("ADRs") and Rights, are valued at the closing price on the exchange or system where the security is principally traded, if available, or at the Nasdaq Official Closing Price. If there have been no sales for that day on the exchange or system, then a security is valued at the last available bid quotation on the exchange or system where the security is principally traded. In each of these situations, valuations are typically categorized as Level 1 in the fair value hierarchy.
Investments in open-end investment companies are valued at net asset value ("NAV"). These valuations are typically categorized as Level 1 in the fair value hierarchy.
Futures contracts are valued at the settlement price established each day by the board of trade or an exchange on which they are traded. These valuations are typically categorized as Level 1 in the fair value hierarchy.
Options are generally valued at the last quoted sales price or, in the absence of a sale, at the mean between the current bid and ask prices. These valuations are typically categorized as Level 1 in the fair value hierarchy.
Investments for which there are no such quotations, or for which quotations do not appear reliable, are valued at fair value in accordance with procedures established by and under the general supervision and responsibility of the Trust's Board of Trustees (the "Board"). These valuations are typically categorized as Level 2 or Level 3 in the fair value hierarchy, based on the observability of inputs used to determine the fair value.
In accordance with procedures adopted by the Board, fair value pricing may be used if events materially affecting the value of foreign securities occur between the time the exchange on which they are traded closes and the time the Funds' NAVs are calculated. The Market Neutral Income Fund uses a systematic valuation model, provided daily by an independent third party to fair value its international equity securities. To the extent this model is utilized, these valuations are considered as Level 2 in the fair value hierarchy.
A summary of the valuations as of December 31, 2020, based upon the three levels defined above, is included in the table below while the breakdown, by category, of investments is disclosed on the Schedules of Portfolio Investments.
| | | Level 1 | | Level 2 | | Level 3 | | Total | |
US 500 Enhanced Volatility Wtd Index Fund | |
Common Stocks | | $ | 67,411,209 | | | $ | — | | | $ | — | | | $ | 67,411,209 | | |
Investment Companies | | | 205,931 | | | | — | | | | — | | | | 205,931 | | |
Collateral for Securities Loaned | | | 1,693,514 | | | | — | | | | — | | | | 1,693,514 | | |
Total | | $ | 69,310,654 | | | $ | — | | | $ | — | | | $ | 69,310,654 | | |
Other Financial Investments^: | |
Assets: | |
Futures Contracts | | $ | 9,409 | | | $ | — | | | $ | — | | | $ | 9,409 | | |
Total | | $ | 9,409 | | | $ | — | | | $ | — | | | $ | 9,409 | | |
Market Neutral Income Fund | |
Common Stocks | | $ | 359,424,651 | | | $ | 59,080,611 | | | $ | — | | | $ | 418,505,262 | | |
Collateral for Securities Loaned | | | 13,364,750 | | | | — | | | | — | | | | 13,364,750 | | |
Total | | $ | 372,789,401 | | | $ | 59,080,611 | | | $ | — | | | $ | 431,870,012 | | |
Other Financial Investments^: | |
Assets: | |
Futures Contracts | | $ | 6,285,617 | | | $ | — | | | $ | — | | | $ | 6,285,617 | | |
Liabilities: | |
Futures Contracts | | $ | (10,398,804 | ) | | $ | — | | | $ | — | | | $ | (10,398,804 | ) | |
Total | | $ | (4,113,187 | ) | | $ | — | | | $ | — | | | $ | (4,113,187 | ) | |
^ Futures contracts are valued at the unrealized appreciation (depreciation) on the investment.
43
Victory Portfolios II | | Notes to Financial Statements — continued
December 31, 2020 | |
(Unaudited)
For the six months ended December 31, 2020, there were no transfers in or out of the Level 3 fair value hierarchy.
Investment Companies:
Open-End Funds:
The Funds may invest in portfolios of open-end investment companies. These investment companies value securities in their portfolios for which market quotations are readily available at their market values (generally the last reported sale price) and all other securities and assets at their fair value by the methods established by the board of directors of the underlying funds.
Derivative Instruments:
Foreign Exchange Currency Contracts:
The Funds may enter into foreign exchange currency contracts to convert U.S. dollars to and from various foreign currencies. A foreign exchange currency contract is an obligation by a Fund to purchase or sell a specific currency at a future date at a price (in U.S. dollars) set at the time of the contract. The Funds do not engage in "cross-currency" foreign exchange contracts (i.e., contracts to purchase or sell one foreign currency in exchange for another foreign currency). The Funds' foreign exchange currency contracts might be considered spot contracts (typically a contract of one week or less) or forward contracts (typically a contract term over one week). A spot contract is entered into for purposes of hedging against foreign currency fluctuations relating to a specific portfolio transaction, such as the delay between a security transaction trade date and settlement date. Forward contracts are entered into for purposes of hedging portfolio holdings or concentrations of such holdings. Each foreign exchange currency contract is adjusted daily by the prevailing spot or forward rate of the underlying currency, and any appreciation or depreciation is recorded for financial statement purposes as unrealized until the contract settlement date, at which time the Fund records realized gains or losses equal to the difference between the value of a contract at the time it was opened and the value at the time it was closed. A Fund could be exposed to risk if a counterparty is unable to meet the terms of a foreign exchange currency contract or if the value of the foreign currency changes unfavorably. In addition, the use of foreign exchange currency contracts does not eliminate fluctuations in the underlying prices of the securities. As of December 31, 2020, the Funds had no open forward foreign exchange currency contracts.
Futures Contracts:
The Funds may enter into contracts for the future delivery of securities or foreign currencies and futures contracts based on a specific security, class of securities, foreign currency or an index, and purchase or sell options on any such futures contracts. A futures contract on a securities index is an agreement obligating either party to pay, and entitling the other party to receive, while the contract is outstanding, cash payments based on the level of a specified securities index. No physical delivery of the underlying asset is made. A Fund may enter into futures contracts in an effort to hedge against market risks. The acquisition of put and call options on futures contracts will give the Fund the right (but not the obligation), for a specified price, to sell or to purchase the underlying futures contract, upon exercise of the option, at any time during the option period. Futures transactions involve brokerage costs and require the Fund to segregate assets to cover contracts that would require it to purchase securities or currencies. A good faith margin deposit, known as initial margin, of cash or government securities with a broker or custodian is required to initiate and maintain open positions in futures contracts. Subsequent payments, known as variation margin, are made or received by the Fund based on the change in the market value of the position and are recorded as unrealized appreciation or depreciation until the contract is closed out, at which time the gain or loss is realized. A Fund may lose the expected benefit of futures transactions if interest rates, exchange rates or securities prices change in an unanticipated manner. Such unanticipated changes may also result in lower overall performance than if the Fund had not entered into any futures transactions. In addition, the value of a Fund's futures positions may not prove to be perfectly or even highly correlated with the value of its portfolio securities or foreign currencies, limiting a Fund's ability to hedge effectively against interest rate, exchange rate and/or market risk and giving rise to additional risks. There is no assurance of liquidity in the secondary
44
Victory Portfolios II | | Notes to Financial Statements — continued
December 31, 2020 | |
(Unaudited)
market for purposes of closing out futures positions. The collateral held by the Funds is presented on the Statements of Assets and Liabilities under Deposit with brokers for futures contracts.
During the six months ended December 31, 2020, the Funds entered into futures contracts primarily for the strategy of hedging or other purposes, including but not limited to, providing liquidity and equitizing cash.
Options Transactions:
The Funds may purchase or sell options to aid in hedging against equity price risk incurred in the normal course of pursuing its investment objective. When a Fund writes a call option, an amount equal to the premium received is included as a liability. The amount of the liability is subsequently marked-to-market to reflect the current market value of the option. If an option expires on its stipulated expiration date or if the Fund enters into a closing purchase transaction, a gain or loss is realized. If a written call option is exercised, a gain or loss is realized for the sale of the underlying security and the proceeds from the sale are increased by the premium originally received. As a writer of an option, the Fund has no control over whether the option will be exercised and, as a result, retains the market risk of an unfavorable change in the price of the security underlying the written option.
The Funds may purchase put and call options. Put options are purchased to hedge against a decline in the value of securities held in the Fund's portfolio. If such a decline occurs, the put options will permit the Fund to sell the securities underlying such options at the exercise price, or to close out the options at a profit. The premium paid for a put or call option plus any transaction costs will reduce the benefit, if any, realized by the Fund upon exercise of the option, and, unless the price of the underlying security rises or declines sufficiently, the option may expire worthless to the Fund. In addition, in the event that the price of the security in connection with which an option was purchased moves in a direction favorable to the Fund, the benefits realized by the Fund as a result of such favorable movement will be reduced by the amount of the premium paid for the option and related transaction costs. Written and purchased options are non-income producing securities. With purchased options, there is minimal counterparty risk to the Fund since these options are exchange-traded. The collateral held by the Funds, if any, is presented on the Schedules of Portfolio Investments. During the six months ended December 31, 2020, the Funds did not engage in any options trading activity.
Offsetting of Financial Assets and Derivatives Assets:
The Funds are subject to various Master Netting Arrangements, which govern the terms of certain transactions with select counterparties. The Master Netting Arrangements allow the Funds to close out and net total exposure to a counterparty in the event of a default with respect to all the transactions governed under a single agreement with a counterparty. The Master Netting Arrangements also specify collateral posting arrangements at pre-arranged exposure levels. Under the Master Netting Arrangements, collateral is routinely transferred if the total net exposure to certain transactions (net of existing collateral already in place) governed under the relevant Master Netting Arrangement with a counterparty in a given account exceeds a specified threshold depending on the counterparty and the type of Master Netting Arrangement.
The table below, as of December 31, 2020, discloses both gross information and net information about instruments and transactions eligible for offset on the Statements of Assets and Liabilities and
45
Victory Portfolios II | | Notes to Financial Statements — continued
December 31, 2020 | |
(Unaudited)
instruments and transactions that are subject to an agreement similar to a master netting agreement as well as amounts related to collateral held at clearing brokers and counterparties.
| | | | Gross Amounts not offset in
the Statements of
Assets and Liabilities | |
| | Gross Amounts
of Recognized
Assets | | Gross Amounts
of Available for
Offset | | Net Amounts
Presented in the
Statements of
Assets and
Liabilities | | Financial
Instruments
for offset | | Cash
Collateral
Received | | Net
Amount | |
US 500 Enhanced Volatility Wtd Index Fund | |
Futures-Goldman Sachs & Co. | | $ | 2,460 | | | $ | — | | | $ | 2,460 | | | $ | — | | | $ | — | | | $ | 2,460 | | |
Market Neutral Income Fund | |
Futures-Goldman Sachs & Co. | | | 1,839,233 | | | | — | | | | 1,839,233 | | | | (1,839,233 | ) | | | — | | | | — | | |
| | | | Gross Amounts not offset in
the Statements of
Assets and Liabilities | |
| | Gross Amounts
of Recognized
Liabilities | | Gross Amounts
of Available for
Offset | | Net Amounts
Presented in the
Statements of
Assets and
Liabilities | | Financial
Instruments
for offset | | Cash
Collateral
Pledged* | | Net
Amount | |
Market Neutral Income Fund | |
Futures-Goldman Sachs & Co. | | $ | 2,745,360 | | | $ | — | | | $ | 2,745,360 | | | $ | (1,839,233 | ) | | $ | (906,127 | ) | | $ | — | | |
* Cash collateral pledged may be in excess of the amounts shown in the table. The total cash collateral pledged by each Fund is disclosed on the Statements of Assets and Liabilities.
Summary of Derivative Instruments:
The following table summarizes the fair values of derivative instruments on the Statements of Assets and Liabilities, categorized by risk exposure, as of December 31, 2020:
| | | Assets | | Liabilities | |
| | | Variation Margin
Receivable on Open
Futures Contracts* | | Variation Margin
Payable on Open
Futures Contracts* | |
Equity Risk Exposure: | |
US 500 Enhanced Volatility Wtd Index Fund | | $ | 9,409 | | | $ | — | | |
Market Neutral Income Fund | | | 6,285,617 | | | | 10,398,804 | | |
* Includes cumulative unrealized appreciation (depreciation) of futures contracts as reported on the Schedules of Portfolio Investments. Only current day's variation margin is reported within the Statements of Assets and Liabilities.
46
Victory Portfolios II | | Notes to Financial Statements — continued
December 31, 2020 | |
(Unaudited)
The following table presents the effect of derivative instruments on the Statements of Operations, categorized by risk exposure, for the six months ended December 31, 2020:
| | | Net Realized Gains (Losses)
on Derivatives
Recognized as a
Result from Operations | | Net Change in Unrealized
Appreciation/Depreciation
on Derivatives Recognized
as a Result of Operations | |
| | | Net Realized
Gains (Losses)
from Futures
Contracts | | Net Change in
Unrealized
Appreciation/
Depreciation
on Futures
Contracts | |
Equity Risk Exposure: | |
US 500 Enhanced Volatility
Wtd Index Fund | | $ | 94,395 | | | $ | (311 | ) | |
Market Neutral Income Fund | | | (31,161,452 | ) | | | (9,693,238 | ) | |
All open derivative positions at period end are reflected on each respective Fund's Schedule of Portfolio Investments. The underlying face value of open derivative positions relative to the US 500 Enhanced Volatility Wtd Index Fund's net assets at period end is generally representative of the notional amount of open positions to net assets throughout the period. The volume associated with futures contracts in the Market Neutral Income Fund was 82% based on average monthly notional amounts in comparison to net assets during the period.
Investment Transactions and Related Income:
Changes in holdings of investments are accounted for no later than one business day following the trade date. For financial reporting purposes, however, investment transactions are accounted for on trade date on the last business day of the reporting period. Interest income is determined on the basis of coupon interest accrued using the effective interest method which adjusts, where applicable, the amortization of premiums or accretion of discounts. Dividend income is recorded on the ex-dividend date. Gains or losses realized on sales of securities are determined by comparing the identified cost of the security lot sold with the net sales proceeds.
Withholding taxes on interest, dividends and gains as a result of certain investments in ADRs by the Funds have been provided for in accordance with each investment's applicable country's tax rules and rates.
Securities Lending:
The Trust has entered into a Master Securities Lending Agreement ("MSLA") with Citibank, N.A. ("Citibank" or the "Agent"). Under the terms of the MSLA, the Funds may lend securities to certain broker-dealers and banks in exchange for collateral in the amount of at least 102% of the value of U.S. securities loaned or at least 105% of the value of non-U.S. securities loaned, marked-to-market daily. Any collateral shortfalls associated with increases in the valuation of the securities loaned are adjusted the next business day. The collateral can be received in the form of cash collateral and/or non-cash collateral. Non-cash collateral can include U.S. Government Securities, letters of credit and certificates of deposit. The cash collateral is invested in short-term instruments or cash equivalents, primarily open-end investment companies, as noted on the Funds' Schedules of Portfolio Investments. The Trust does not have effective control of the non-cash collateral and therefore it is not disclosed on the Funds' Schedules of Portfolio Investments. During the time portfolio securities are on loan, the borrower will pay the Funds any dividends or interest paid on such securities plus any fee negotiated between the parties to the lending agreement. The Funds also earn a return from the collateral. The Funds pay the Agent various fees in connection with the investment of cash collateral and fees based on the investment income received from securities lending activities. Securities lending income (net of these fees) is disclosed on the Statements of Operations. Although risk is mitigated by the collateral, the Funds could experience a delay in recovering their securities and possible loss of income or value if the borrower fails to return them.
47
Victory Portfolios II | | Notes to Financial Statements — continued
December 31, 2020 | |
(Unaudited)
Securities lending transactions are entered into by a Fund under the MSLA, which permits the Fund, under certain circumstances such as an event of default, to offset amounts payable by the Fund to the same counterparty against amounts receivable from the counterparty to create a net payment due to or from the Fund.
The following table is a summary of the Funds' securities lending transactions which are subject to offset under the MSLA as of December 31, 2020. These transactions are accounted for as secured borrowings with an overnight and continuous contractual maturity for cash collateral and greater than overnight and continuous contractual maturity for non-cash collateral.
| | | Gross
Amount of
Recognized
Assets
(Value of | | Value of
Cash | | Value of Non-cash Collateral
Received by Maturity | |
| | | Securities
on Loan | | Collateral
Received* | | < 30 Days | | Between 30
and 90 Days | | > 90 Days | |
US 500 Enhanced Volatility
Wtd Index Fund | | $ | 1,658,343 | | | $ | 1,658,343 | | | $ | — | | | $ | — | | | $ | — | | |
Market Neutral Income
Fund | | | 12,897,893 | | | | 12,897,893 | | | | — | | | | — | | | | — | | |
* Collateral received in excess of the market value of securities on loan is not presented in this table. The total cash collateral received by each Fund is disclosed on the Statements of Assets and Liabilities.
Foreign Currency Translations:
The accounting records of the Funds are maintained in U.S. dollars. Investment securities and other assets and liabilities of a Fund denominated in a foreign currency are translated into U.S. dollars at current exchange rates. Purchases and sales of securities, income receipts and expense payments are translated into U.S. dollars at the exchange rates on the date of the transactions. The Funds do not isolate the portion of the results of operations resulting from changes in foreign exchange rates on investments from fluctuations arising from changes in market prices of securities held. Such fluctuations are disclosed as net change in unrealized appreciation/depreciation on investment securities and foreign currency translations on the Statements of Operations. Any realized gains or losses from these fluctuations including foreign currency arising from in-kind redemptions, are disclosed as net realized gains (losses) from investment transactions and foreign currency translations on the Statements of Operations.
Foreign Taxes:
The Funds may be subject to foreign taxes related to foreign income received (a portion of which may be reclaimable), capital gains on the sale of securities, and certain foreign currency transactions. All foreign taxes are recorded in accordance with the applicable regulations and rates that exist in the foreign jurisdictions in which the Funds invest.
Federal Income Taxes:
It is the policy of each Fund to continue to qualify as a regulated investment company by complying with the provisions available to certain investment companies, as defined in applicable sections of the Internal Revenue Code, and to make distributions of net investment income and net realized gains sufficient to relieve it from all, or substantially all, federal income taxes. Accordingly, no provision for federal income taxes is required in the financial statements. The Funds have a tax year end of June 30.
Management of the Funds has reviewed tax positions taken in tax years that remain subject to examination by all major tax jurisdictions, including federal (i.e., the last four tax years, which includes the current fiscal tax year end). Management believes that there is no tax liability resulting from unrecognized tax benefits related to uncertain tax positions taken.
48
Victory Portfolios II | | Notes to Financial Statements — continued
December 31, 2020 | |
(Unaudited)
Allocations:
Expenses directly attributable to a Fund are charged to the Fund, while expenses which are attributable to more than one fund in the Trust, or jointly with an affiliated trust, are allocated among the respective funds in the Trust and/or affiliated trust based upon net assets or another appropriate basis.
Income, expenses (other than class-specific expenses such as transfer agent fees, state registration fees, printing fees and 12b-1 fees), and realized and unrealized gains or losses on investments are allocated to each class of shares based on its relative net assets on the date income is earned or expenses and realized and unrealized gains and losses are incurred.
3. Purchases and Sales of Securities:
Purchases and sales of securities (excluding securities maturing less than one year from acquisition) for the six months ended December 31, 2020, were as follows:
| | | Purchases | | Sales | |
US 500 Enhanced Volatility Wtd Index Fund | | $ | 42,610,529 | | | $ | 22,822,946 | | |
Market Neutral Income Fund | | | 314,005,480 | | | | 90,164,777 | | |
For the six months ended December 31, 2020, there were no purchases or sales of U.S. Government Securities.
4. Fees and Transactions with Affiliates and Related Parties:
Investment advisory services are provided to the Funds by Victory Capital Management Inc. ("VCM" or the "Adviser"), a New York corporation registered as an investment adviser with the Securities and Exchange Commission ("SEC"). The Adviser is a wholly owned indirect subsidiary of Victory Capital Holdings, Inc., a publicly traded Delaware corporation and a wholly owned direct subsidiary of Victory Capital Operating, LLC. Amounts incurred and paid to VCM for the six months ended December 31, 2020, are reflected on the Statements of Operations as Investment advisory fees.
Under the terms of the Investment Advisory Agreement, the Adviser is entitled to receive fees based on a percentage of the average daily net assets of each Fund. The rates at which the Adviser is paid by each Fund are included in the table below. The Adviser may use its resources to assist with the Funds' distribution and marketing expenses.
| | | Flat Rate | |
US 500 Enhanced Volatility Wtd Index Fund | | | 0.70 | % | |
Market Neutral Income Fund | | | 0.60 | % | |
VCM also serves as the Funds' administrator and fund accountant. Under the Administration and Fund Accounting Agreement, VCM is paid for its services an annual fee at a rate of 0.08% of the first $15 billion in average daily net assets of the Trust, Victory Variable Insurance Funds and Victory Portfolios (collectively, the "Victory Funds Complex"), 0.05% of the average daily net assets above $15 billion to $30 billion of the Victory Funds Complex and 0.04% of the average daily net assets over $30 billion of the Victory Funds Complex. Amounts incurred for the six months ended December 31, 2020, are reflected on the Statements of Operations as Administration fees.
Citi Fund Services Ohio, Inc. ("Citi"), an affiliate of Citibank, acts as Sub-Administrator and Sub-Fund Accountant to the Funds pursuant to the Sub-Administration and Sub-Fund Accounting Services Agreement between VCM and Citi. VCM pays Citi a fee for providing these services. The Funds reimburse VCM and Citi for out-of-pocket expenses incurred in providing these services and certain other expenses specifically allocated to the Funds. Amounts incurred for the six months ended December 31, 2020, are reflected on the Statements of Operations as Sub-Administration fees.
Citibank serves as the Funds' custodian. The Funds pay Citibank a fee for providing these services. Amounts incurred for the six months ended December 31, 2020, are reflected on the Statements of Operations as Custodian fees.
49
Victory Portfolios II | | Notes to Financial Statements — continued
December 31, 2020 | |
(Unaudited)
FIS Investor Services, LLC ("FIS") serves as the Funds' transfer agent. Under the Transfer Agent Agreement, the Trust pays FIS a fee for its services and reimburses FIS for all of their reasonable out-of-pocket expenses incurred in providing these services. Amounts incurred for the six months ended December 31, 2020, are reflected on the Statements of Operations as Transfer agent fees.
Victory Capital Transfer Agency, Inc., an affiliate of the Adviser, serves as sub-transfer agent for the Member Class shares of the Funds. Victory Capital Transfer Agency, Inc. receives no fee or other compensation for these services.
The Chief Compliance Officer ("CCO") is an employee of the Adviser, which pays the compensation of the CCO and his support staff. The Trust has entered into an agreement to provide compliance services with the Adviser, pursuant to which the Adviser furnishes its compliance personnel, including the services of the CCO, and other resources reasonably necessary to provide the Trust with compliance oversight services related to the design, administration and oversight of a compliance program for the Trust in accordance with Rule 38a-1 under the 1940 Act. The Funds in the Victory Funds Complex, in aggregate, compensate the Adviser for these services. Amounts incurred for the six months ended December 31, 2020, are reflected on the Statements of Operations as Compliance fees.
Sidley Austin LLP provides legal services to the Trust.
Victory Capital Services, Inc. (the "Distributor"), an affiliate of the Adviser, serves as distributor for the continuous offering of the shares of the Fund pursuant to a Distribution Agreement between the Distributor and the Trust. Effective December 31, 2020, the Distributor's name was changed from Victory Capital Advisers, Inc. Amounts incurred for the six months ended December 31, 2020, are reflected on the Statements of Operations as 12b-1 fees.
Pursuant to the Distribution and Service Plans (the "Plans") adopted in accordance with Rule 12b-1 under the 1940 Act, the Distributor may receive a monthly distribution and service fees, at an annual rate of up to 0.25% of the average daily net assets for Class A Shares, and at an annual rate of up to 1.00% of the average daily net assets of Class C Shares of the Funds. The distribution and service fees paid to the Distributor may be used by the Distributor to pay for activities primarily intended to result in the sale of Class A or Class C Shares of the Funds.
The Plans are characterized as reimbursement plans since the distribution fees will be paid to the Distributor as reimbursement for, or in anticipation of, expenses incurred for distribution-related activity. If the aggregate payments received by the Distributor for a particular class of shares of the Funds in any fiscal year exceed the expenditures made by the Distributor in that year pursuant to the Plans, the Distributor will reimburse the Funds for the amount of the excess. For the six months ended December 31, 2020, the Distributor reimbursed $500 to the US 500 Enhanced Volatility Wtd Index Fund and $10,000 to the Market Neutral Income Fund.
In addition, the Distributor is entitled to receive commission on sales of Class A Shares of the Funds. For the six months ended December 31, 2020, the Distributor received approximately $1,327 from commissions earned on sales of Class A Shares. A $15 fee may be charged for redemptions made by wire. The redemption fee is paid directly to and retained by the Funds, and is designed to deter excessive short- term trading and to offset brokerage commissions, market impact and other costs that may be associated with short- term money movement in and out of the Funds.
The Adviser has entered into expense limitation agreements with certain Funds. Under the terms of the agreements, the Adviser has agreed to waive fees or reimburse certain expenses to the extent that ordinary operating expenses incurred by certain classes of a Fund in any fiscal year exceed the expense limit for such classes of the Fund. Such excess amounts will be the liability of the Adviser. Interest, taxes, brokerage commissions, other expenditures which are capitalized in accordance with GAAP, and other extraordinary expenses not incurred in the ordinary course of a Fund's business are excluded
50
Victory Portfolios II | | Notes to Financial Statements — continued
December 31, 2020 | |
(Unaudited)
from the expense limits. As of December 31, 2020, the expense limits (excluding voluntary waivers) are as follows:
| | | In effect July 1, 2020 until October 31, 2021 | |
| | | Class A
Shares | | Class C
Shares | | Class I
Shares | | Member
Class | |
US 500 Enhanced Volatility
Wtd Index Fund | | | 0.99 | % | | | 1.74 | % | | | 0.74 | % | | | N/A | | |
Market Neutral Income Fund | | | 0.75 | % | | | 1.50 | % | | | 0.40 | % | | | 0.55 | %(a) | |
(a) In effect June 10, 2020, until at least October 31, 2021.
The Funds have agreed to repay fees and expenses that were waived or reimbursed by the Adviser for a period up to three fiscal years after such waiver or reimbursement was made to the extent such payments or repayments would not cause the expenses of a class to exceed the original expense limitation in place at the time of the waiver or reimbursement or any expense limitation agreement in place at the time of repayment. Amounts repaid to the Adviser during the six months, if any, are reflected on the Statements of Operations as Recoupment of prior expenses waived/reimbursed by Adviser.
As of December 31, 2020, the following amounts are available to be repaid to the Adviser. The Funds have not recorded any amounts available to be repaid as a liability due to an assessment that such repayment is not probable at December 31, 2020.
| | | Expires
June 30, 2021 | | Expires
June 30, 2022 | | Expires
June 30, 2023 | | Expires
June 30, 2024 | | Total | |
US 500 Enhanced Volatility
Wtd Index Fund | | $ | 283,259 | | | $ | 292,081 | | | $ | 229,910 | | | $ | 104,694 | | | $ | 909,944 | | |
Market Neutral Income
Fund | | | 197,955 | | | | 258,188 | | | | 670,257 | | | | 528,413 | | | | 1,654,813 | | |
The Adviser may voluntarily waive or reimburse additional fees to assist the Funds in maintaining competitive expense ratios. Voluntary waivers and reimbursements applicable to the Funds are not available to be recouped at a future time. There were no voluntary waivers or reimbursements for the six months ended December 31, 2020.
Certain officers and/or interested trustees of the Funds are also officers and/or employees of the Adviser, Administrator, Fund Accountant, Sub-Administrator, Sub-Fund Accountant, Custodian, Distributor and Legal Counsel.
5. Risks:
Each Fund may be subject to other risks in addition to these identified risks.
Equity Risk — An investment in the Funds' shares represents an indirect investment in the securities owned by the Funds, some of which will be traded on a national securities exchange or in the over-the-counter markets. The value of the securities in which the Funds invest, like other market investments, may move up or down, sometimes rapidly and unpredictably. The value of the securities in which the Funds invest may affect the value of the Funds' shares. An investment in the Funds' shares at any point in time may be worth less than the original investment, even after taking into account the reinvestment of the Funds' distributions.
Foreign Securities Risk — The Market Neutral Income Fund invests in securities of foreign issuers in various countries. Investing on an international basis involves certain risks not involved in domestic investments including the risk of nationalization or expropriation of assets, imposition of currency exchange controls or restrictions on the repatriation of foreign currency, confiscatory taxation, political or financial instability and diplomatic developments, which could affect the value of the Fund's investments in certain foreign countries. Governments of many countries have exercised and continue to exercise substantial influence over many aspects of the private sector through the ownership or control of many companies, including some of the largest in these countries. As a result, government actions in the future could have a significant effect on economic conditions which may adversely affect
51
Victory Portfolios II | | Notes to Financial Statements — continued
December 31, 2020 | |
(Unaudited)
prices of certain portfolio securities. There is also generally less government supervision and regulation of stock exchanges, brokers and listed companies than in the United States. Dividends or interest on, or proceeds from the sale of, foreign securities may be subject to foreign withholding taxes, and special U.S. tax considerations may apply. Moreover, foreign economies may differ favorably or unfavorably from the U.S. economy in such respects as growth of gross national product, rate of inflation, capital reinvestment, resource self- sufficiency and balance of payments position. The Schedule of Portfolio Investments includes information on each Fund's holdings, including industry and/or geographic composition, as relevant.
Geopolitical/Natural Disaster Risk — An outbreak of disease called COVID-19 has spread internationally. The transmission of COVID-19 and efforts to contain its spread have resulted in international, national and local border closings and other significant travel restrictions and disruptions, significant disruptions to business operations, supply chains and consumer activity, significant challenges in healthcare service preparation and delivery, quarantines and general concern and uncertainty. These negative impacts have caused significant volatility and declines in global financial markets, which have caused losses for Fund investors during and subsequent to period end. The impact of the COVID-19 pandemic may last for an extended period of time, and could result in a substantial economic downturn or recession. Public health crises may exacerbate other pre-existing political, social, economic, market and financial risks. The extent of the impact to the financial performance of the Funds' investments will depend on future developments, including (i) the duration and spread of the outbreak, (ii) the restrictions and advisories, (iii) the effects on the financial markets, and (iv) the effects on the economy overall, all of which are highly uncertain and cannot be predicted.
6. Borrowing and Interfund Lending:
Line of Credit:
For the six months ended December 31, 2020, the Victory Funds Complex and the USAA Mutual Funds Complex (another series of mutual funds managed by the Adviser) participated in a short-term demand note "Line of Credit" with Citibank. The Line of Credit agreement with Citibank was renewed on June 29, 2020, with a termination date of June 28, 2021. Under the agreement with Citibank, the Victory Funds Complex and USAA Mutual Funds Complex, combined, may borrow up to $600 million, of which $300 million is committed and $300 million is uncommitted. $40 million of the Line of Credit is reserved for use by the Victory Floating Rate Fund (herein, the "Fund"), another series of the Victory Funds Complex, with that Fund paying the related commitment fees for that amount. The purpose of the agreement is to meet temporary or emergency cash needs. For the six months ended December 31, 2020, Citibank received an annual commitment fee of 0.15% on $300 million for providing the Line of Credit. Each fund in the Victory Funds Complex pays a pro-rata portion of the commitment fees plus any interest (one month LIBOR plus one percent) on amounts borrowed. Effective June 29, 2020, under an amended Line of Credit agreement, Citibank will also receive an annual upfront fee of 0.10% on the $300 million committed line of credit. Each fund in the Victory Funds Complex will pay a pro-rata portion of the upfront fee. Interest charged to each Fund during the period, if applicable, is presented on the Statements of Operations under Line of credit fees.
The Funds did not utilize the Line of Credit during the six months ended December 31, 2020.
Interfund Lending:
The Trust and Adviser rely on an exemptive order granted by the SEC in March 2017 (the "Order"), permitting the establishment and operation of an Interfund Lending Facility (the "Facility"). The Facility allows each Fund to directly borrow money from or lend money to any other Victory Fund, that is permitted to participate in the Facility, relying upon the Order at rates beneficial to both the borrowing and lending funds. Advances under the Facility are allowed for temporary or emergency purposes, including the meeting of redemption requests that otherwise might require the untimely disposition of securities, and are subject to each Fund's borrowing restrictions. The interfund loan rate is determined, as specified in the Order, by averaging the current repurchase agreement rate and the current bank loan rate. As a Borrower, interest charged to each Fund during the period, as applicable, is presented
52
Victory Portfolios II | | Notes to Financial Statements — continued
December 31, 2020 | |
(Unaudited)
on the Statements of Operations under Interest expense on interfund lending. As a Lender, interest earned by each Fund during the period, if applicable, is presented on the Statements of Operations under Interfund lending income.
The Funds did not utilize the Facility during the six months ended December 31, 2020.
7. Federal Income Tax Information:
Dividends from net investment income, if any, are declared and paid quarterly for each Fund. Distributable net realized gains, if any, are declared and distributed at least annually from each Fund.
The amounts of dividends from net investment income and distributions from net realized gains (collectively, distributions to shareholders) are determined in accordance with federal income tax regulations, which may differ from GAAP. To the extent these "book/tax" differences are permanent in nature (e.g., net operating loss and distribution reclassification), such amounts are reclassified within the components of net assets based on their federal tax-basis treatment; temporary differences (e.g., wash sales) do not require reclassification. To the extent dividends and distributions exceed net investment income and net realized gains for tax purposes, they are reported as distributions of capital. Net investment losses incurred by a Fund may be reclassified as an offset to capital on the accompanying Statements of Assets and Liabilities.
The tax character of current year distributions paid and the tax basis of the current components of accumulated earnings (deficit) will be determined at the end of the current tax year ending June 30, 2021.
As of the most recent tax year ended June 30, 2020, the following Funds had net capital loss carryforwards ("CLCFs") as summarized in the tables below. CLCFs are applied as either short-term or long-term depending on the originating capital loss.
| | | Short-Term
Amount | | Long-Term
Amount | | Total | |
Market Neutral Income Fund | | $ | 1,011,865 | | | $ | 3,526,994 | | | $ | 4,538,859 | | |
8. Fund Ownership:
Ownership of more than 25% of the voting securities of a fund creates presumptions of control of the fund, under section 2(a)(9) of the 1940 Act. As of December 31, 2020, the shareholders listed below held more than 25% of the shares outstanding of the Funds and may be deemed to control those Funds. Shareholders of record may hold Fund shares for the benefit of their customers.
| | | Shareholder | | Percent | |
US 500 Enhanced Volatility
Wtd Index Fund | | LPL Financial Corp. | | | 34.3 | % | |
Market Neutral Income Fund | | Charles Schwab & Co., Inc. | | | 26.1 | % | |
Market Neutral Income Fund | | Gerlach Co. LLC | | | 39.5 | % | |
53
Victory Portfolios II | | Supplemental Information
December 31, 2020 | |
(Unaudited)
Proxy Voting and Portfolio Holdings Information
Proxy Voting:
Information regarding the policies and procedures each Fund uses to determine how to vote proxies relating to portfolio securities is available without charge, upon request, by calling 800-539-3863. The information is also included in the Funds' Statement of Additional Information, which is available on the SEC's website at www.sec.gov.
Information relating to how the Funds voted proxies relating to portfolio securities held during the most recent twelve months ended June 30 is available on the SEC's website at www.sec.gov.
Availability of Schedules of Portfolio Investments:
The Trust files a complete list of Schedules of Portfolio Investments with the SEC for the first and third quarter of each fiscal year on Form N-PORT. Form N-PORT is available on the SEC's web site at www.sec.gov.
Expense Examples
As a shareholder of the Funds, you may incur two types of costs: (1) transaction costs, including sales charges (loads) on purchases; and (2) ongoing costs, including management fees, distribution and service (12b-1) fees and other Fund expenses. These examples are intended to help you understand your ongoing costs (in dollars) of investing in the Funds and to compare these costs with the ongoing costs of investing in other mutual funds.
These examples are based on an investment of $1,000 invested at the beginning of the period and held for the entire period from July 1, 2020, through December 31, 2020 (unless noted otherwise).
The Actual Expense figures in the table below provide information about actual account values and actual expenses. You may use the information below, together with the amount you invested, to estimate the expenses that you paid over the period. Simply divide your account value by $1,000 (for example, an $8,600 account value divided by $1,000 = 8.6), then multiply the result by the number in the table under the heading entitled "Actual Expenses Paid During Period" to estimate the expenses you paid on your account during this period.
The Hypothetical Expense figures in the table below provide information about hypothetical account values and hypothetical expenses based on each Fund's actual expense ratio and an assumed rate of return of 5% per year before expenses, which is not the Fund's actual return. The hypothetical account values and expenses may not be used to estimate the actual ending account balance or expenses you paid for the period. You may use this information to compare this 5% hypothetical example with the 5% hypothetical examples that appear in shareholder reports of other funds.
Please note the expenses shown in the table are meant to highlight your ongoing costs only and do not reflect any transactional costs. Therefore, the table is useful in comparing ongoing costs only, and will not help you determine the relative total costs of owning different funds. In addition, if these transactional costs were included, your costs would have been higher.
| | Beginning
Account
Value
7/1/20 | | Actual
Ending
Account
Value
12/31/20 | | Hypothetical
Ending
Account
Value
12/31/20 | | Actual
Expenses
Paid
During
Period
7/1/20-
12/31/20* | | Hypothetical
Expenses
Paid
During
Period
7/1/20-
12/31/20* | | Annualized
Expense
Ratio
During
Period
7/1/20-
12/31/20 | |
US 500 Enhanced Volatility Wtd Index Fund | |
Class A Shares | | $ | 1,000.00 | | | $ | 1,205.90 | | | $ | 1,020.21 | | | $ | 5.50 | | | $ | 5.04 | | | | 0.99 | % | |
Class C Shares | | | 1,000.00 | | | | 1,200.60 | | | | 1,016.43 | | | | 9.65 | | | | 8.84 | | | | 1.74 | % | |
Class I Shares | | | 1,000.00 | | | | 1,207.10 | | | | 1,021.48 | | | | 4.12 | | | | 3.77 | | | | 0.74 | % | |
Market Neutral Income Fund | |
Class A Shares | | | 1,000.00 | | | | 1,012.40 | | | | 1,021.17 | | | | 4.06 | | | | 4.08 | | | | 0.80 | % | |
Class C Shares | | | 1,000.00 | | | | 1,008.10 | | | | 1,017.39 | | | | 7.85 | | | | 7.88 | | | | 1.55 | % | |
Class I Shares | | | 1,000.00 | | | | 1,012.80 | | | | 1,022.94 | | | | 2.28 | | | | 2.29 | | | | 0.45 | % | |
Member Class** | | | 1,000.00 | | | | 1,018.70 | | | | 1,021.68 | | | | 1.14 | | | | 3.57 | | | | 0.70 | % | |
* Expenses are equal to the average account value multiplied by the Fund's annualized expense ratio multiplied by 184/365 (the number of days in the most recent fiscal half-year divided by the number of days in the fiscal year).
** Actual Expenses Paid are equal to the average account value multiplied by the Fund's annualized expense ratio multiplied by 59/365 to reflect the stub period from commencement of operations November 3, 2020, through December 31, 2020.
54
Victory Portfolios II | | Supplemental Information — continued
December 31, 2020 | |
(Unaudited)
Considerations of the Board in Continuing the Investment Advisory Agreement (the "Agreement")
The Board approved the Agreement on behalf of each of the Funds at a meeting, which was called for that purpose, on December 2, 2020. The Board also considered information relating to the Funds and the Agreement provided throughout the year and, more specifically, at a meeting on October 27, 2020 called for the purpose of reviewing the Agreement. In considering whether to approve the Agreement, the Board requested, and the Adviser provided, information that the Board believed to be reasonably necessary to reach its conclusions.
The Board, including the Independent Trustees, evaluated this information along with other information obtained throughout the year and was advised by legal counsel to the Funds, which also serves as independent legal counsel to the Independent Trustees. In addition, the Independent Trustees considered a past review of their overall process for conducting the annual review of the Funds' advisory arrangements by an independent consultant retained through their counsel.
The Board took into consideration regular reports from the Adviser throughout the COVID-19 pandemic public health crisis concerning how the ongoing pandemic has affected market volatility, investment risk and the implementation and effectiveness of business continuity plans. These reports also had confirmed that the pandemic had no material impact on the Adviser's operations.
The Board considered each Fund's advisory fee, expense ratio and investment performance as significant factors in determining whether the Agreement should be continued. In considering whether the compensation paid to the Adviser was fair and reasonable, the Board also evaluated, among other things, the following factors:
• The requirements of the Funds for the services provided by the Adviser;
• The nature, quality and extent of the services provided and expected to be provided;
• The performance of the Funds as compared to comparable funds;
• The fees payable for the services and whether the fee arrangements provided for economies of scale that would benefit Fund shareholders as the Funds grow;
• Whether the fee would be sufficient to enable the Adviser to attract and retain experienced personnel and continue to provide quality services to the Funds;
• The fees paid by other clients of the Adviser whose accounts are managed in a similar investment style and any differences in the services provided to the other clients compared to those provided to the Funds;
• The total expenses of each Fund;
• Management's commitment to operating the Funds at competitive expense levels;
• The profitability of the Adviser (as reflected by comparing fees earned against an estimate of the Adviser's costs) with respect to the Adviser's relationship with the Funds;
• Research and other service benefits received by the Adviser obtained through payment of client commissions for securities transactions;
• Other benefits received by the Adviser, and its affiliates, including revenues paid to the Adviser, or its affiliates, by the Funds for administration and fund accounting services, and distribution;
• The capabilities and financial condition of the Adviser;
• Current economic and industry trends; and
• The historical relationship between each Fund and the Adviser.
The Board reviewed each Fund's current management fee, comprised of the advisory fee plus the administrative services fee paid to the Adviser, in the context of the Adviser's profitability with respect to each Fund individually. In addition, the Board compared each Fund's gross management fee and total operating expense ratio on a net and gross basis with the median gross management fee and median expense ratio of a universe of comparable mutual funds compiled by an independent consultant and a peer group of funds with similar investment strategies selected by that independent consultant from the universe. The Board reviewed the factors and methodology used by the independent consultant in the selection of each Fund's peer group, including the independent consultant's selection of a broad universe of funds, the more specific universe of comparable funds, and peer
55
Victory Portfolios II | | Supplemental Information — continued
December 31, 2020 | |
(Unaudited)
groups of funds with comparable investment strategies and asset levels, among other factors. The Board also reviewed any changes to the independent consultant's methodology as compared to the prior year, including those resulting from the Adviser's input, if any. The Board noted that none of the advisory fee arrangements for the Funds included breakpoints, which are generally viewed as a method by which an investment adviser shares any economies of scale with a fund as a fund grows. The Board also considered the Adviser's commitment to limit expenses as discussed in more detail below, and would consider breakpoints at a future time if a Fund's assets were to grow significantly.
The Board also reviewed the compliance and administrative services provided to the Funds by the Adviser and its affiliates, including the Adviser's oversight of the Funds' day-to-day operations and oversight of Fund accounting, assistance in meeting legal and regulatory requirements, and other services necessary for the operation of the Funds and the Trust.
The Board found that the gross annual management fee paid by each Fund was within the range of management fees paid by each Fund's respective peer group. The Board also found that each Fund's Class A net annual expense ratio, taking into account any shareholder servicing or distribution fees, was reasonable as compared with each Fund's respective peer group. The Board considered the Adviser's contractual agreement with each Fund to waive its fees and reimburse expenses of certain classes for a specified period of time, as described in the Fund's prospectus.
The Board reviewed each Fund's performance over one- and three-year periods against the performance of the Fund's selected peer group and benchmark index. The Board recognized that the performance of the Funds and the peer group funds are net of expenses, while the performance of the benchmark index is gross returns.
The Board reviewed various other specific factors with respect to each Fund, as described below. In their deliberations, the Trustees did not rank the importance of any particular information or factor considered and each Trustee may have attributed different weights to various factors.
US 500 Enhanced Volatility Wtd Index Fund
Noting that the Fund commenced operations in 2012, the Board compared the Fund's Class A performance for the one-, three- and five-year periods ended June 30, 2020, to that of the median performance of the Fund's peer group for the same periods and considered the fact that the Fund underperformed the benchmark index for all of the periods reviewed, and underperformed the peer group median for all of the periods reviewed, with the exception of the one-year period. The Board noted that the Fund's investment objective is to track its benchmark index before fees and expenses. The Board recognized that the performance of the Fund is net of expenses, while the performance of the benchmark index is gross returns and as a result, the Fund generally will underperform its benchmarks due to fees and expenses. The Board discussed with the Adviser the Fund's rules-based rebalancing in light of market conditions and that the Fund performed in accordance with the Adviser's expectations.
Having considered, among other things: (1) the Fund's management fee compared to comparable mutual funds; (2) the Fund's total expense ratio compared to comparable mutual funds; (3) that the Adviser's willingness to limit the expenses of certain classes for a period of time would provide stability to the Fund's expenses for those share classes during that period; and (4) the Fund's performance during the periods reviewed, the Board concluded that the Agreement continued to be in the best interests of the Fund's shareholders.
Market Neutral Income Fund
Noting that the Fund commenced operations in 2012, the Board compared the Fund's Class A performance for the one-, three- and five-year periods ended June 30, 2020, to that of the median performance of the Fund's peer group and benchmark index for the same periods and considered the fact that the Fund outperformed both the benchmark index and the peer group median for all of the periods reviewed.
Having considered, among other things: (1) the Fund's management fee compared to comparable mutual funds; (2) the Fund's total expense ratio compared to comparable mutual funds; (3) that the Adviser's willingness to limit the expenses of certain classes for a period of time would provide stability to the Fund's expenses for those share classes during that period; and (4) the Fund's performance during the periods reviewed, the Board concluded that the Agreement continued to be in the best interests of the Fund's shareholders.
56
Victory Portfolios II | | Supplemental Information — continued
December 31, 2020 | |
(Unaudited)
Conclusion
Based on its review of the information requested and provided, and following extended discussions, the Board determined that the Agreement, on behalf of the Funds discussed above, was consistent with the best interests of each Fund and its shareholders, and the Board unanimously approved the Agreement, on behalf of each Fund, for an additional annual period on the basis of the foregoing review and discussions and the following considerations, among others:
• The fairness and reasonableness of the investment advisory fee payable to the Adviser under the Agreement in light of the investment advisory services provided, the costs of these services, the profitability of the Adviser's relationship with the Fund and the comparability of the fee paid to the fees paid by other investment companies;
• The nature, quality and extent of the investment advisory services provided by the Adviser;
• The Adviser's entrepreneurial commitment to the management of the Funds and the creation of a broad-based family of funds, which could entail a substantial commitment of the Adviser's resources to the successful operation of the Funds;
• The Adviser's representations regarding its staffing and capabilities to manage the Funds, including the retention of personnel with relevant portfolio management experience;
• The Adviser's efforts to enhance investment results by, among other things, developing quality portfolio management teams; and
• The overall high quality of the personnel, operations, financial condition, investment management capabilities, methodologies and performance of the Adviser.
57
Privacy Policy
Protecting the Privacy of Information
The Trust respects your right to privacy. We also know that you expect us to conduct and process your business in an accurate and efficient manner. To do so, we must collect and maintain certain personal information about you. This is the information we collect from you on applications or other forms, and from the transactions you make with us or third parties. It may include your name, address, social security number, account transactions and balances, and information about investment goals and risk tolerance.
We do not disclose any information about you or about former customers to anyone except as permitted or required by law. Specifically, we may disclose the information we collect to companies that perform services on our behalf, such as the transfer agent that processes shareholder accounts and printers and mailers that assist us in the distribution of investor materials. We may also disclose this information to companies that perform marketing services on our behalf. This allows us to continue to offer you Victory investment products and services that meet your investing needs, and to effect transactions that you request or authorize. These companies will use this information only in connection with the services for which we hired them. They are not permitted to use or share this information for any other purpose.
To protect your personal information internally, we permit access only by authorized employees and maintain physical, electronic and procedural safeguards to guard your personal information.*
* You may have received communications regarding information about privacy policies from other financial institutions which gave you the opportunity to "opt-out" of certain information sharing with companies which are not affiliated with that financial institution. The Trust does not share information with other companies for purposes of marketing solicitations for products other than the Trust. Therefore, the Trust does not provide opt-out options to their shareholders.
Victory Funds
P.O. Box 182593
Columbus, Ohio 43218-2593

Visit our website at: | | Call Victory at: | |
www.vcm.com | | 800-539-FUND (800-539-3863) | |
| | 800-235-8396 for Member Class | |

December 31, 2020
Semi Annual Report
VictoryShares US 500 Volatility Wtd ETF
VictoryShares US Small Cap Volatility Wtd ETF
VictoryShares International Volatility Wtd ETF
VictoryShares Emerging Market Volatility Wtd ETF
VictoryShares US Large Cap High Div Volatility Wtd ETF
VictoryShares US Small Cap High Div Volatility Wtd ETF
VictoryShares International High Div Volatility Wtd ETF
VictoryShares Emerging Market High Div Volatility Wtd ETF
VictoryShares Dividend Accelerator ETF
VictoryShares US Multi-Factor Minimum Volatility ETF
VictoryShares US 500 Enhanced Volatility Wtd ETF
VictoryShares US EQ Income Enhanced Volatility Wtd ETF
VictoryShares US Discovery Enhanced Volatility Wtd ETF
VictoryShares Developed Enhanced Volatility Wtd ETF
VictoryShares Nasdaq Next 50 ETF
VictoryShares Top Veteran Employers ETF
VictoryShares Protect America ETF
As permitted by regulations adopted by the Securities and Exchange Commission, paper copies of the VictoryShares' shareholder reports may no longer be sent by mail, unless you specifically request paper copies of the reports from your financial intermediary, such as a broker-dealer or bank. Instead, the reports will be made available on www.VictorySharesLiterature.com, and you will be notified by mail each time a report is posted and provided with a website link to access the report. If you already elected to receive shareholder reports electronically, you will not be affected by this change, and you need not take any action.
You can inform your financial intermediary that you wish to continue receiving paper copies of your reports. Your election to receive reports in paper will apply to all VictoryShares you hold through your financial intermediary.
www.vcm.com
News, Information And Education 24 Hours A Day, 7 Days A Week
The Victory Funds site gives fund shareholders, prospective shareholders, and investment professionals a convenient way to access fund information, get guidance, and track fund performance anywhere they can access the Internet. The site includes:
• Detailed performance records
• Daily share prices
• The latest fund news
• Investment resources to help you become a better investor
• A section dedicated to investment professionals
Whether you're a potential investor searching for the fund that matches your investment philosophy, a seasoned investor interested in planning tools, or an investment professional, www.vcm.com has what you seek. Visit us anytime. We're always open.
Table of Contents
Financial Statements | |
Victory Portfolios II Exchange-Traded Funds | |
VictoryShares US 500 Volatility Wtd ETF | |
Investment Objectives & Portfolio Holdings | | | 5 | | |
Schedule of Portfolio Investments | | | 10-21 | | |
Statement of Assets and Liabilities | | | 154 | | |
Statement of Operations | | | 160 | | |
Statement of Changes in Net Assets | | | 166 | | |
Financial Highlights | | | 172 | | |
VictoryShares US Small Cap Volatility Wtd ETF | |
Investment Objectives & Portfolio Holdings | | | 5 | | |
Schedule of Portfolio Investments | | | 22-33 | | |
Statement of Assets and Liabilities | | | 154 | | |
Statement of Operations | | | 160 | | |
Statement of Changes in Net Assets | | | 166 | | |
Financial Highlights | | | 172 | | |
VictoryShares International Volatility Wtd ETF | |
Investment Objectives & Portfolio Holdings | | | 5 | | |
Schedule of Portfolio Investments | | | 34-53 | | |
Statement of Assets and Liabilities | | | 154 | | |
Statement of Operations | | | 160 | | |
Statement of Changes in Net Assets | | | 166 | | |
Financial Highlights | | | 172 | | |
VictoryShares Emerging Market Volatility Wtd ETF | |
Investment Objectives & Portfolio Holdings | | | 5 | | |
Schedule of Portfolio Investments | | | 54-71 | | |
Statement of Assets and Liabilities | | | 155 | | |
Statement of Operations | | | 161 | | |
Statement of Changes in Net Assets | | | 167 | | |
Financial Highlights | | | 174 | | |
VictoryShares US Large Cap High Div Volatility
Wtd ETF | |
Investment Objectives & Portfolio Holdings | | | 6 | | |
Schedule of Portfolio Investments | | | 72-75 | | |
Statement of Assets and Liabilities | | | 155 | | |
Statement of Operations | | | 161 | | |
Statement of Changes in Net Assets | | | 167 | | |
Financial Highlights | | | 174 | | |
VictoryShares US Small Cap High Div Volatility
Wtd ETF | |
Investment Objectives & Portfolio Holdings | | | 6 | | |
Schedule of Portfolio Investments | | | 76-79 | | |
Statement of Assets and Liabilities | | | 155 | | |
Statement of Operations | | | 161 | | |
Statement of Changes in Net Assets | | | 167 | | |
Financial Highlights | | | 174 | | |
1
Table of Contents (continued)
VictoryShares International High Div Volatility
Wtd ETF | |
Investment Objectives & Portfolio Holdings | | | 6 | | |
Schedule of Portfolio Investments | | | 80-86 | | |
Statement of Assets and Liabilities | | | 156 | | |
Statement of Operations | | | 162 | | |
Statement of Changes in Net Assets | | | 168 | | |
Financial Highlights | | | 176 | | |
VictoryShares Emerging Market High Div Volatility
Wtd ETF | |
Investment Objectives & Portfolio Holdings | | | 6 | | |
Schedule of Portfolio Investments | | | 87-92 | | |
Statement of Assets and Liabilities | | | 156 | | |
Statement of Operations | | | 162 | | |
Statement of Changes in Net Assets | | | 168 | | |
Financial Highlights | | | 176 | | |
VictoryShares Dividend Accelerator ETF | |
Investment Objectives & Portfolio Holdings | | | 7 | | |
Schedule of Portfolio Investments | | | 93-95 | | |
Statement of Assets and Liabilities | | | 156 | | |
Statement of Operations | | | 162 | | |
Statement of Changes in Net Assets | | | 168 | | |
Financial Highlights | | | 176 | | |
VictoryShares US Multi-Factor Minimum
Volatility ETF | |
Investment Objectives & Portfolio Holdings | | | 7 | | |
Schedule of Portfolio Investments | | | 96-98 | | |
Statement of Assets and Liabilities | | | 157 | | |
Statement of Operations | | | 163 | | |
Statement of Changes in Net Assets | | | 169 | | |
Financial Highlights | | | 178 | | |
VictoryShares US 500 Enhanced Volatility Wtd ETF | |
Investment Objectives & Portfolio Holdings | | | 7 | | |
Schedule of Portfolio Investments | | | 99-110 | | |
Statement of Assets and Liabilities | | | 157 | | |
Statement of Operations | | | 163 | | |
Statement of Changes in Net Assets | | | 169 | | |
Financial Highlights | | | 178 | | |
VictoryShares US EQ Income Enhanced Volatility
Wtd ETF | |
Investment Objectives & Portfolio Holdings | | | 7 | | |
Schedule of Portfolio Investments | | | 111-114 | | |
Statement of Assets and Liabilities | | | 157 | | |
Statement of Operations | | | 163 | | |
Statement of Changes in Net Assets | | | 169 | | |
Financial Highlights | | | 178 | | |
VictoryShares US Discovery Enhanced Volatility
Wtd ETF | |
Investment Objectives & Portfolio Holdings | | | 8 | | |
Schedule of Portfolio Investments | | | 115-126 | | |
Statement of Assets and Liabilities | | | 158 | | |
Statement of Operations | | | 164 | | |
Statement of Changes in Net Assets | | | 170 | | |
Financial Highlights | | | 180 | | |
2
Table of Contents (continued)
VictoryShares Developed Enhanced Volatility
Wtd ETF | |
Investment Objectives & Portfolio Holdings | | | 8 | | |
Schedule of Portfolio Investments | | | 127-146 | | |
Statement of Assets and Liabilities | | | 158 | | |
Statement of Operations | | | 164 | | |
Statement of Changes in Net Assets | | | 170 | | |
Financial Highlights | | | 180 | | |
Notes to Financial Statements | | | 184 | | |
Supplemental Information | |
Proxy Voting and Portfolio Holdings Information | | | 202 | | |
Expense Examples | | | 202 | | |
Advisory Contract Approval | | | 204 | | |
Privacy Policy (inside back cover) | | | |
IRA DISTRIBUTION WITHHOLDING DISCLOSURE
We generally must withhold federal income tax at a rate of 10% of the taxable portion of your distribution and, if you live in a state that requires state income tax withholding, at your state's tax rate. However, you may elect not to have withholding apply or to have income tax withheld at a higher rate. Any withholding election that you make will apply to any subsequent distribution unless and until you change or revoke the election. If you wish to make a withholding election, or change or revoke a prior withholding election, call 866-376-7890.
If you do not have a withholding election in place by the date of a distribution, federal income tax will be withheld from the taxable portion of your distribution at a rate of 10%. If you must pay estimated taxes, you may be subject to estimated tax penalties if your estimated tax payments are not sufficient and sufficient tax is not withheld from your distribution.
For more specific information, please consult your tax adviser.
The VictoryShares are distributed by Foreside Fund Services, LLC. Victory Capital Management Inc. is the investment adviser to the Funds and receives fees from the Funds for performing services for the Funds.
This report is not authorized for distribution to prospective investors unless preceded or accompanied by a current prospectus of the VictoryShares.
For additional information about any VictoryShares, including fees, expenses, and risks, view our prospectus online at www.vcm.com or call 866-376-7890. Read it carefully before you invest or send money.
The information in this semi annual report is based on data obtained from recognized services and sources and is believed to be reliable. Any opinions, projections, or recommendations in this report are subject to change without notice and are not intended as individual investment advice. Past investment performance of the ETFs, markets or securities mentioned herein should not be considered to be indicative of future results.
• NOT FDIC INSURED • NO BANK GUARANTEE • MAY LOSE VALUE

Call Victory at:
866-376-7890
Visit our website at:
www.vcm.com
3
This page is intentionally left blank.
4
Victory Portfolios II | | December 31, 2020 | |
(Unaudited)
Investment Objectives & Portfolio Holdings:
VictoryShares US 500 Volatility Wtd ETF
Seeks to provide investment results that track the performance of the Nasdaq Victory US Large Cap 500 Volatility Weighted Index before fees and expenses.
Sector Allocation*:
December 31, 2020
(% of Net Assets)
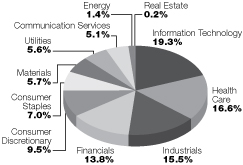
* Does not include futures, money market instruments, and short-term investments purchased with cash collateral from securities loaned.
Percentages are of the net assets of the Fund and may not equal 100%.
VictoryShares US Small Cap Volatility
Wtd ETF
Seeks to provide investment results that track the performance of the Nasdaq Victory US Small Cap 500 Volatility Weighted Index before fees and expenses.
Sector Allocation*:
December 31, 2020
(% of Net Assets)
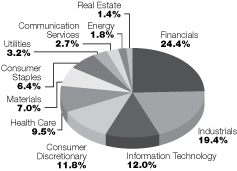
* Does not include futures, money market instruments, and short-term investments purchased with cash collateral from securities loaned.
Percentages are of the net assets of the Fund and may not equal 100%.
VictoryShares International Volatility
Wtd ETF
Seeks to provide investment results that track the performance of the Nasdaq Victory International 500 Volatility Weighted Index before fees and expenses.
Sector Allocation*:
December 31, 2020
(% of Net Assets)
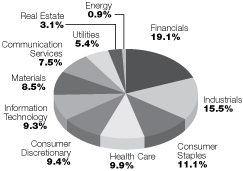
* Does not include futures, money market instruments, and short-term investments purchased with cash collateral from securities loaned.
Percentages are of the net assets of the Fund and may not equal 100%.
VictoryShares Emerging Market Volatility
Wtd ETF
Seeks to provide investment results that track the performance of the Nasdaq Victory Emerging Market 500 Volatility Weighted Index before fees and expenses.
Sector Allocation*:
December 31, 2020
(% of Net Assets)

* Does not include futures, money market instruments, and short-term investments purchased with cash collateral from securities loaned.
Percentages are of the net assets of the Fund and may not equal 100%.
Refer to the Schedule of Portfolio Investments for a complete list of securities.
5
Victory Portfolios II | | December 31, 2020 | |
(Unaudited)
Investment Objectives & Portfolio Holdings: (continued)
VictoryShares US Large Cap High Div
Volatility Wtd ETF
Seeks to provide investment results that track the performance of the Nasdaq Victory US Large Cap High Dividend 100 Volatility Weighted Index before fees and expenses.
Sector Allocation*:
December 31, 2020
(% of Net Assets)
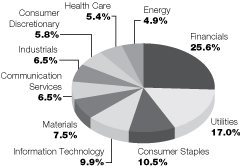
* Does not include futures, money market instruments, and short-term investments purchased with cash collateral from securities loaned.
Percentages are of the net assets of the Fund and may not equal 100%.
VictoryShares US Small Cap High Div
Volatility Wtd ETF
Seeks to provide investment results that track the performance of the Nasdaq Victory US Small Cap High Dividend 100 Volatility Weighted Index before fees and expenses.
Sector Allocation*:
December 31, 2020
(% of Net Assets)

* Does not include futures, money market instruments, and short-term investments purchased with cash collateral from securities loaned.
Percentages are of the net assets of the Fund and may not equal 100%.
VictoryShares International High Div
Volatility Wtd ETF
Seeks to provide investment results that track the performance of the Nasdaq Victory International High Dividend 100 Volatility Weighted Index before fees and expenses.
Sector Allocation*:
December 31, 2020
(% of Net Assets)

* Does not include futures, money market instruments, and short-term investments purchased with cash collateral from securities loaned.
Percentages are of the net assets of the Fund and may not equal 100%.
VictoryShares Emerging Market High Div
Volatility Wtd ETF
Seeks to provide investment results that track the performance of the Nasdaq Victory Emerging Market High Dividend 100 Volatility Weighted Index before fees and expenses.
Sector Allocation*:
December 31, 2020
(% of Net Assets)
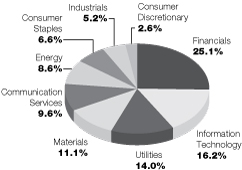
* Does not include futures, money market instruments, and short-term investments purchased with cash collateral from securities loaned.
Percentages are of the net assets of the Fund and may not equal 100%.
Refer to the Schedule of Portfolio Investments for a complete list of securities.
6
Victory Portfolios II | | December 31, 2020 | |
(Unaudited)
Investment Objectives & Portfolio Holdings: (continued)
VictoryShares Dividend Accelerator ETF
Seeks to provide investment results that track the performance of the Nasdaq Victory Dividend Accelerator Index before fees and expenses.
Sector Allocation*:
December 31, 2020
(% of Net Assets)
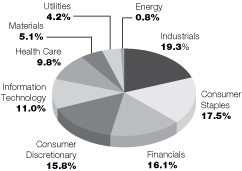
* Does not include futures, money market instruments, and short-term investments purchased with cash collateral from securities loaned.
Percentages are of the net assets of the Fund and may not equal 100%.
VictoryShares US Multi-Factor Minimum
Volatility ETF
Seeks to provide investment results that track the performance of the Nasdaq Victory US Multi-Factor Minimum Volatility Index before fees and expenses.
Sector Allocation*:
December 31, 2020
(% of Net Assets)

* Does not include futures, money market instruments, and short-term investments purchased with cash collateral from securities loaned.
Percentages are of the net assets of the Fund and may not equal 100%.
VictoryShares US 500 Enhanced
Volatility Wtd ETF
Seeks to provide investment results that track the performance of the Nasdaq Victory US Large Cap 500 Long/Cash Volatility Weighted Index before fees and expenses.
Sector Allocation*:
December 31, 2020
(% of Net Assets)

* Does not include futures, money market instruments, and short-term investments purchased with cash collateral from securities loaned.
Percentages are of the net assets of the Fund and may not equal 100%.
VictoryShares US EQ Income Enhanced Volatility Wtd ETF Total
Seeks to provide investment results that track the performance of the Nasdaq Victory US Large Cap High Dividend 100 Long/Cash Volatility Weighted Index before fees and expenses.
Sector Allocation*:
December 31, 2020
(% of Net Assets)
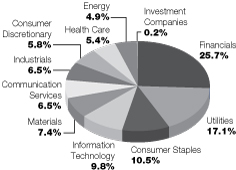
* Does not include futures, money market instruments, and short-term investments purchased with cash collateral from securities loaned.
Percentages are of the net assets of the Fund and may not equal 100%.
Refer to the Schedule of Portfolio Investments for a complete list of securities.
7
Victory Portfolios II | | December 31, 2020 | |
(Unaudited)
Investment Objectives & Portfolio Holdings: (continued)
VictoryShares US Discovery Enhanced Volatility Wtd ETF
Seeks to provide investment results that track the performance of the Nasdaq Victory US Small Cap 500 Long/Cash Volatility Weighted Index before fees and expenses.
Sector Allocation*:
December 31, 2020
(% of Net Assets)

* Does not include futures, money market instruments, and short-term investments purchased with cash collateral from securities loaned.
Percentages are of the net assets of the Fund and may not equal 100%.
VictoryShares Developed Enhanced
Volatility Wtd ETF
Seeks to provide investment results that track the performance of the Nasdaq Victory International 500 Long/Cash Volatility Weighted Index before fees and expenses.
Sector Allocation*:
December 31, 2020
(% of Net Assets)
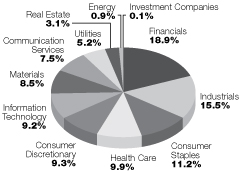
* Does not include futures, money market instruments, and short-term investments purchased with cash collateral from securities loaned.
Percentages are of the net assets of the Fund and may not equal 100%.
VictoryShares Nasdaq Next 50 ETF
Seeks to provide investment results that track the performance of the Nasdaq Q-50 Index before fees and expenses.
Sector Allocation*:
December 31, 2020
(% of Net Assets)

* Does not include futures, money market instruments, and short-term investments purchased with cash collateral from securities loaned.
Percentages are of the net assets of the Fund and may not equal 100%.
VictoryShares Top Veteran Employers ETF
Seeks to provide investment results that track the performance of the Veterans Select Index before fees and expenses.
Sector Allocation*:
December 31, 2020
(% of Net Assets)

* Does not include futures, money market instruments, and short-term investments purchased with cash collateral from securities loaned.
Percentages are of the net assets of the Fund and may not equal 100%.
Refer to the Schedule of Portfolio Investments for a complete list of securities.
8
Victory Portfolios II | | December 31, 2020 | |
(Unaudited)
Investment Objectives & Portfolio Holdings: (continued)
VictoryShares Protect America ETF
Seeks to provide investment results that track the performance of the Nasdaq Yewno Aerospace & Defense IndexTM before fees and expenses.
Sector Allocation*:
December 31, 2020
(% of Net Assets)
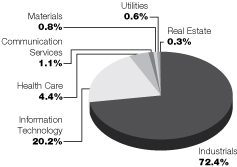
* Does not include futures, money market instruments, and short-term investments purchased with cash collateral from securities loaned.
Percentages are of the net assets of the Fund and may not equal 100%.
Refer to the Schedule of Portfolio Investments for a complete list of securities.
9
Victory Portfolios II
VictoryShares US 500 Volatility Wtd ETF | | Schedule of Portfolio Investments
December 31, 2020 | |
(Unaudited)
Security Description | | Shares | | Value | |
Common Stocks (99.7%) | |
Communication Services (5.1%): | |
Activision Blizzard, Inc. | | | 18,121 | | | $ | 1,682,535 | | |
Alphabet, Inc., Class A (a) | | | 949 | | | | 1,663,255 | | |
Altice USA, Inc., Class A (a) (b) | | | 44,246 | | | | 1,675,596 | | |
ANGI Homeservices, Inc., Class A (a) (b) | | | 62,939 | | | | 830,480 | | |
AT&T, Inc. | | | 52,994 | | | | 1,524,107 | | |
Cable One, Inc. | | | 684 | | | | 1,523,760 | | |
CenturyLink, Inc. | | | 99,681 | | | | 971,890 | | |
Charter Communications, Inc., Class A (a) | | | 2,781 | | | | 1,839,772 | | |
Comcast Corp., Class A | | | 33,736 | | | | 1,767,766 | | |
Discovery, Inc., Class A (a) (b) | | | 52,579 | | | | 1,582,102 | | |
DISH Network Corp., Class A (a) | | | 25,535 | | | | 825,802 | | |
Electronic Arts, Inc. | | | 11,829 | | | | 1,698,644 | | |
Facebook, Inc., Class A (a) | | | 4,448 | | | | 1,215,016 | | |
Fox Corp., Class A | | | 42,951 | | | | 1,250,733 | | |
Liberty Broadband Corp., Class C (a) | | | 11,091 | | | | 1,756,482 | | |
Netflix, Inc. (a) | | | 2,499 | | | | 1,351,284 | | |
Omnicom Group, Inc. | | | 23,035 | | | | 1,436,693 | | |
Sirius XM Holdings, Inc. (b) | | | 229,596 | | | | 1,462,527 | | |
Take-Two Interactive Software, Inc. (a) | | | 8,255 | | | | 1,715,307 | | |
The Interpublic Group of Cos., Inc. | | | 56,645 | | | | 1,332,290 | | |
The New York Times Co., Class A | | | 33,456 | | | | 1,732,017 | | |
T-Mobile U.S., Inc. (a) | | | 11,899 | | | | 1,604,580 | | |
Verizon Communications, Inc. | | | 37,756 | | | | 2,218,165 | | |
ViacomCBS, Inc., Class B | | | 27,463 | | | | 1,023,271 | | |
| | | | 35,684,074 | | |
Consumer Discretionary (9.5%): | |
Advance Auto Parts, Inc. | | | 7,578 | | | | 1,193,611 | | |
Amazon.com, Inc. (a) | | | 473 | | | | 1,540,528 | | |
Aptiv PLC | | | 8,915 | | | | 1,161,535 | | |
AutoZone, Inc. (a) | | | 1,133 | | | | 1,343,104 | | |
Best Buy Co., Inc. | | | 9,964 | | | | 994,308 | | |
Booking Holdings, Inc. (a) | | | 620 | | | | 1,380,907 | | |
BorgWarner, Inc. | | | 28,360 | | | | 1,095,830 | | |
Bright Horizons Family Solutions, Inc. (a) | | | 6,680 | | | | 1,155,573 | | |
CarMax, Inc. (a) | | | 9,128 | | | | 862,231 | | |
Chegg, Inc. (a) | | | 12,846 | | | | 1,160,379 | | |
Chipotle Mexican Grill, Inc. (a) | | | 875 | | | | 1,213,371 | | |
D.R. Horton, Inc. | | | 13,805 | | | | 951,441 | | |
Dollar General Corp. | | | 9,151 | | | | 1,924,455 | | |
Dollar Tree, Inc. (a) | | | 12,663 | | | | 1,368,111 | | |
Domino's Pizza, Inc. | | | 3,177 | | | | 1,218,252 | | |
eBay, Inc. | | | 30,879 | | | | 1,551,670 | | |
Etsy, Inc. (a) | | | 7,271 | | | | 1,293,584 | | |
Floor & Decor Holdings, Inc., Class A (a) | | | 12,184 | | | | 1,131,284 | | |
Garmin Ltd. | | | 14,697 | | | | 1,758,643 | | |
General Motors Co. | | | 31,641 | | | | 1,317,531 | | |
Gentex Corp. | | | 53,890 | | | | 1,828,489 | | |
See notes to financial statements.
10
Victory Portfolios II
VictoryShares US 500 Volatility Wtd ETF | | Schedule of Portfolio Investments — continued
December 31, 2020 | |
(Unaudited)
Security Description | | Shares | | Value | |
Genuine Parts Co. | | | 11,514 | | | $ | 1,156,351 | | |
Hasbro, Inc. | | | 13,073 | | | | 1,222,848 | | |
Hilton Worldwide Holdings, Inc. | | | 12,760 | | | | 1,419,678 | | |
Las Vegas Sands Corp. | | | 19,271 | | | | 1,148,552 | | |
Lear Corp. | | | 8,547 | | | | 1,359,229 | | |
Lennar Corp., Class A | | | 11,214 | | | | 854,843 | | |
LKQ Corp. (a) | | | 26,852 | | | | 946,264 | | |
Lowe's Cos., Inc. | | | 6,870 | | | | 1,102,704 | | |
Marriott International, Inc., Class A | | | 8,382 | | | | 1,105,753 | | |
McDonald's Corp. | | | 6,365 | | | | 1,365,802 | | |
MGM Resorts International | | | 26,043 | | | | 820,615 | | |
Mohawk Industries, Inc. (a) | | | 8,296 | | | | 1,169,321 | | |
NIKE, Inc., Class B | | | 12,288 | | | | 1,738,383 | | |
NVR, Inc. (a) | | | 221 | | | | 901,649 | | |
O'Reilly Automotive, Inc. (a) | | | 2,824 | | | | 1,278,058 | | |
Pool Corp. | | | 4,003 | | | | 1,491,118 | | |
PulteGroup, Inc. | | | 19,204 | | | | 828,076 | | |
Ross Stores, Inc. | | | 11,232 | | | | 1,379,402 | | |
Service Corp. International | | | 28,897 | | | | 1,418,843 | | |
Starbucks Corp. | | | 14,484 | | | | 1,549,498 | | |
Target Corp. | | | 9,810 | | | | 1,731,759 | | |
Tesla, Inc. (a) | | | 1,372 | | | | 968,179 | | |
The Home Depot, Inc. | | | 4,459 | | | | 1,184,400 | | |
The TJX Cos., Inc. | | | 20,608 | | | | 1,407,320 | | |
Tractor Supply Co. | | | 10,164 | | | | 1,428,854 | | |
Ulta Beauty, Inc. (a) | | | 3,808 | | | | 1,093,505 | | |
Vail Resorts, Inc. | | | 5,243 | | | | 1,462,587 | | |
VF Corp. | | | 15,032 | | | | 1,283,883 | | |
Whirlpool Corp. | | | 5,044 | | | | 910,392 | | |
Williams-Sonoma, Inc. | | | 9,675 | | | | 985,302 | | |
Yum! Brands, Inc. | | | 13,062 | | | | 1,418,011 | | |
| | | | 65,576,016 | | |
Consumer Staples (7.0%): | |
Archer-Daniels-Midland Co. | | | 31,916 | | | | 1,608,886 | | |
Brown-Forman Corp., Class B | | | 19,740 | | | | 1,567,948 | | |
Campbell Soup Co. (b) | | | 34,632 | | | | 1,674,457 | | |
Casey's General Stores, Inc. | | | 7,287 | | | | 1,301,604 | | |
Church & Dwight Co., Inc. | | | 18,325 | | | | 1,598,490 | | |
Colgate-Palmolive Co. | | | 22,047 | | | | 1,885,238 | | |
Conagra Brands, Inc. | | | 39,249 | | | | 1,423,169 | | |
Costco Wholesale Corp. | | | 5,684 | | | | 2,141,618 | | |
General Mills, Inc. | | | 28,996 | | | | 1,704,965 | | |
Herbalife Nutrition Ltd. (a) | | | 21,133 | | | | 1,015,441 | | |
Hormel Foods Corp. | | | 37,160 | | | | 1,732,027 | | |
Kellogg Co. | | | 25,241 | | | | 1,570,747 | | |
Kimberly-Clark Corp. | | | 11,620 | | | | 1,566,725 | | |
Lamb Weston Holdings, Inc. | | | 15,785 | | | | 1,242,911 | | |
McCormick & Co., Inc. | | | 14,422 | | | | 1,378,743 | | |
Mondelez International, Inc., Class A | | | 27,983 | | | | 1,636,166 | | |
Monster Beverage Corp. (a) | | | 19,123 | | | | 1,768,495 | | |
See notes to financial statements.
11
Victory Portfolios II
VictoryShares US 500 Volatility Wtd ETF | | Schedule of Portfolio Investments — continued
December 31, 2020 | |
(Unaudited)
Security Description | | Shares | | Value | |
PepsiCo, Inc. | | | 10,755 | | | $ | 1,594,967 | | |
Philip Morris International, Inc. | | | 17,932 | | | | 1,484,590 | | |
Sysco Corp. | | | 13,788 | | | | 1,023,897 | | |
The Boston Beer Co., Inc., Class A (a) | | | 1,191 | | | | 1,184,199 | | |
The Clorox Co. | | | 8,446 | | | | 1,705,416 | | |
The Coca-Cola Co. | | | 33,390 | | | | 1,831,108 | | |
The Estee Lauder Cos., Inc., Class A | | | 6,180 | | | | 1,645,054 | | |
The Hershey Co. | | | 9,938 | | | | 1,513,856 | | |
The J.M. Smucker Co. | | | 14,432 | | | | 1,668,339 | | |
The Kroger Co. | | | 51,708 | | | | 1,642,246 | | |
The Procter & Gamble Co. | | | 12,248 | | | | 1,704,187 | | |
Tyson Foods, Inc., Class A | | | 18,179 | | | | 1,171,455 | | |
Walgreens Boots Alliance, Inc. | | | 33,005 | | | | 1,316,239 | | |
Walmart, Inc. | | | 13,003 | | | | 1,874,382 | | |
| | | | 48,177,565 | | |
Energy (1.4%): | |
Cabot Oil & Gas Corp. | | | 57,889 | | | | 942,433 | | |
Cheniere Energy, Inc. (a) | | | 20,533 | | | | 1,232,595 | | |
ConocoPhillips | | | 21,495 | | | | 859,585 | | |
EOG Resources, Inc. | | | 17,906 | | | | 892,972 | | |
Exxon Mobil Corp. | | | 28,682 | | | | 1,182,272 | | |
Kinder Morgan, Inc. | | | 73,124 | | | | 999,605 | | |
ONEOK, Inc. | | | 21,865 | | | | 839,179 | | |
Pioneer Natural Resources Co. | | | 7,147 | | | | 813,972 | | |
The Williams Cos., Inc. | | | 41,637 | | | | 834,822 | | |
Valero Energy Corp. | | | 15,008 | | | | 849,003 | | |
| | | | 9,446,438 | | |
Financials (13.8%): | |
Aflac, Inc. | | | 26,720 | | | | 1,188,238 | | |
Ally Financial, Inc. | | | 32,093 | | | | 1,144,436 | | |
American Express Co. | | | 8,987 | | | | 1,086,618 | | |
Ameriprise Financial, Inc. | | | 5,089 | | | | 988,945 | | |
Arch Capital Group Ltd. (a) | | | 31,396 | | | | 1,132,454 | | |
Ares Management Corp., Class A | | | 26,244 | | | | 1,234,780 | | |
Arthur J. Gallagher & Co. | | | 12,944 | | | | 1,601,302 | | |
Assurant, Inc. | | | 9,312 | | | | 1,268,481 | | |
Athene Holding Ltd., Class A (a) | | | 18,457 | | | | 796,235 | | |
Bank of America Corp. | | | 38,049 | | | | 1,153,265 | | |
Berkshire Hathaway, Inc., Class B (a) | | | 7,362 | | | | 1,707,027 | | |
BlackRock, Inc., Class A | | | 1,969 | | | | 1,420,712 | | |
Brown & Brown, Inc. | | | 31,717 | | | | 1,503,703 | | |
Cboe Global Markets, Inc. | | | 14,228 | | | | 1,324,911 | | |
Chubb Ltd. | | | 9,517 | | | | 1,464,857 | | |
Cincinnati Financial Corp. | | | 12,519 | | | | 1,093,785 | | |
Citigroup, Inc. | | | 16,376 | | | | 1,009,744 | | |
Citizens Financial Group, Inc. | | | 29,403 | | | | 1,051,451 | | |
CME Group, Inc. | | | 6,726 | | | | 1,224,468 | | |
Commerce Bancshares, Inc. | | | 20,392 | | | | 1,339,754 | | |
Credit Acceptance Corp. (a) (b) | | | 2,247 | | | | 777,777 | | |
See notes to financial statements.
12
Victory Portfolios II
VictoryShares US 500 Volatility Wtd ETF | | Schedule of Portfolio Investments — continued
December 31, 2020 | |
(Unaudited)
Security Description | | Shares | | Value | |
Discover Financial Services | | | 12,566 | | | $ | 1,137,600 | | |
Erie Indemnity Co., Class A | | | 5,346 | | | | 1,312,978 | | |
Everest Re Group Ltd. | | | 5,273 | | | | 1,234,356 | | |
FactSet Research Systems, Inc. | | | 3,572 | | | | 1,187,690 | | |
Fidelity National Financial, Inc. | | | 31,378 | | | | 1,226,566 | | |
Fifth Third Bancorp | | | 37,291 | | | | 1,028,113 | | |
First Republic Bank | | | 10,493 | | | | 1,541,736 | | |
Franklin Resources, Inc. | | | 52,107 | | | | 1,302,154 | | |
Globe Life, Inc. | | | 12,831 | | | | 1,218,432 | | |
Huntington Bancshares, Inc. | | | 96,920 | | | | 1,224,100 | | |
Interactive Brokers Group, Inc. | | | 22,822 | | | | 1,390,316 | | |
Intercontinental Exchange, Inc. | | | 13,796 | | | | 1,590,541 | | |
JPMorgan Chase & Co. | | | 10,520 | | | | 1,336,776 | | |
KeyCorp | | | 62,055 | | | | 1,018,323 | | |
KKR & Co., Inc. | | | 28,875 | | | | 1,169,149 | | |
Lincoln National Corp. | | | 16,759 | | | | 843,145 | | |
LPL Financial Holdings, Inc. | | | 10,394 | | | | 1,083,263 | | |
M&T Bank Corp. | | | 9,553 | | | | 1,216,097 | | |
Markel Corp. (a) | | | 1,016 | | | | 1,049,833 | | |
MarketAxess Holdings, Inc. | | | 2,594 | | | | 1,480,033 | | |
Marsh & McLennan Cos., Inc. | | | 13,405 | | | | 1,568,385 | | |
MetLife, Inc. | | | 24,672 | | | | 1,158,350 | | |
Moody's Corp. | | | 3,746 | | | | 1,087,239 | | |
Morgan Stanley | | | 18,820 | | | | 1,289,735 | | |
Morningstar, Inc. | | | 11,205 | | | | 2,594,743 | | |
MSCI, Inc. | | | 2,923 | | | | 1,305,207 | | |
Nasdaq, Inc. | | | 9,866 | | | | 1,309,613 | | |
Northern Trust Corp. | | | 13,389 | | | | 1,247,051 | | |
Principal Financial Group, Inc. | | | 20,734 | | | | 1,028,614 | | |
Raymond James Financial, Inc. | | | 12,898 | | | | 1,233,952 | | |
Regions Financial Corp. | | | 71,535 | | | | 1,153,144 | | |
RenaissanceRe Holdings Ltd. | | | 7,113 | | | | 1,179,478 | | |
S&P Global, Inc. | | | 3,295 | | | | 1,083,165 | | |
SEI Investments Co. | | | 23,761 | | | | 1,365,545 | | |
State Street Corp. | | | 14,440 | | | | 1,050,943 | | |
SVB Financial Group (a) | | | 3,396 | | | | 1,317,071 | | |
Synchrony Financial | | | 30,146 | | | | 1,046,368 | | |
T. Rowe Price Group, Inc. | | | 8,484 | | | | 1,284,393 | | |
The Allstate Corp. | | | 13,814 | | | | 1,518,573 | | |
The Bank of New York Mellon Corp. | | | 32,426 | | | | 1,376,159 | | |
The Blackstone Group, Inc., Class A | | | 19,880 | | | | 1,288,423 | | |
The Charles Schwab Corp. | | | 30,295 | | | | 1,606,847 | | |
The Goldman Sachs Group, Inc. | | | 5,260 | | | | 1,387,115 | | |
The Hartford Financial Services Group, Inc. | | | 21,539 | | | | 1,054,980 | | |
The PNC Financial Services Group, Inc. | | | 8,904 | | | | 1,326,696 | | |
The Progressive Corp. | | | 16,353 | | | | 1,616,984 | | |
The Travelers Cos., Inc. | | | 10,045 | | | | 1,410,017 | | |
Tradeweb Markets, Inc., Class A | | | 23,835 | | | | 1,488,496 | | |
Truist Financial Corp. | | | 22,070 | | | | 1,057,815 | | |
U.S. Bancorp | | | 27,035 | | | | 1,259,561 | | |
See notes to financial statements.
13
Victory Portfolios II
VictoryShares US 500 Volatility Wtd ETF | | Schedule of Portfolio Investments — continued
December 31, 2020 | |
(Unaudited)
Security Description | | Shares | | Value | |
Voya Financial, Inc. | | | 22,460 | | | $ | 1,320,873 | | |
W.R. Berkley Corp. | | | 18,986 | | | | 1,261,050 | | |
Wells Fargo & Co. | | | 38,872 | | | | 1,173,157 | | |
| | | | 93,553,886 | | |
Health Care (16.6%): | |
Abbott Laboratories | | | 13,232 | | | | 1,448,772 | | |
AbbVie, Inc. | | | 17,788 | | | | 1,905,984 | | |
ABIOMED, Inc. (a) | | | 4,273 | | | | 1,385,307 | | |
Agilent Technologies, Inc. | | | 15,512 | | | | 1,838,018 | | |
Alexion Pharmaceuticals, Inc. (a) | | | 13,334 | | | | 2,083,304 | | |
Align Technology, Inc. (a) | | | 3,020 | | | | 1,613,828 | | |
Amedisys, Inc. (a) | | | 4,729 | | | | 1,387,158 | | |
AmerisourceBergen Corp. | | | 13,846 | | | | 1,353,585 | | |
Amgen, Inc. | | | 5,981 | | | | 1,375,152 | | |
Anthem, Inc. | | | 3,726 | | | | 1,196,381 | | |
Avantor, Inc. (a) | | | 39,294 | | | | 1,106,126 | | |
Baxter International, Inc. | | | 17,385 | | | | 1,394,972 | | |
Becton, Dickinson & Co. | | | 6,417 | | | | 1,605,662 | | |
Biogen, Inc. (a) | | | 4,351 | | | | 1,065,386 | | |
BioMarin Pharmaceutical, Inc. (a) | | | 12,747 | | | | 1,117,784 | | |
Bio-Rad Laboratories, Inc., Class A (a) | | | 2,993 | | | | 1,744,739 | | |
Bio-Techne Corp. | | | 6,206 | | | | 1,970,716 | | |
Boston Scientific Corp. (a) | | | 31,840 | | | | 1,144,648 | | |
Catalent, Inc. (a) | | | 11,727 | | | | 1,220,429 | | |
Centene Corp. (a) | | | 17,474 | | | | 1,048,964 | | |
Cerner Corp. | | | 24,775 | | | | 1,944,342 | | |
Charles River Laboratories International, Inc. (a) | | | 5,177 | | | | 1,293,525 | | |
Chemed Corp. | | | 2,595 | | | | 1,382,123 | | |
Cigna Corp. | | | 6,237 | | | | 1,298,419 | | |
CRISPR Therapeutics AG (a) | | | 10,575 | | | | 1,619,138 | | |
CVS Health Corp. | | | 24,252 | | | | 1,656,412 | | |
Danaher Corp. | | | 8,400 | | | | 1,865,975 | | |
DaVita, Inc. (a) | | | 16,212 | | | | 1,903,288 | | |
DexCom, Inc. (a) | | | 2,600 | | | | 961,272 | | |
Edwards Lifesciences Corp. (a) | | | 15,339 | | | | 1,399,377 | | |
Eli Lilly & Co. | | | 9,674 | | | | 1,633,358 | | |
Encompass Health Corp. | | | 20,409 | | | | 1,687,620 | | |
Exelixis, Inc. (a) | | | 48,623 | | | | 975,864 | | |
HCA Healthcare, Inc. | | | 6,821 | | | | 1,121,782 | | |
Henry Schein, Inc. (a) | | | 20,234 | | | | 1,352,845 | | |
Hologic, Inc. (a) | | | 21,151 | | | | 1,540,427 | | |
Horizon Therapeutics PLC (a) (b) | | | 14,201 | | | | 1,038,803 | | |
Humana, Inc. | | | 2,667 | | | | 1,094,190 | | |
IDEXX Laboratories, Inc. (a) | | | 3,754 | | | | 1,876,511 | | |
Illumina, Inc. (a) | | | 3,781 | | | | 1,398,970 | | |
Insulet Corp. (a) | | | 5,759 | | | | 1,472,173 | | |
Intuitive Surgical, Inc. (a) | | | 1,738 | | | | 1,421,858 | | |
Ionis Pharmaceuticals, Inc. (a) | | | 25,830 | | | | 1,460,428 | | |
IQVIA Holdings, Inc. (a) | | | 6,942 | | | | 1,243,798 | | |
Jazz Pharmaceuticals PLC (a) | | | 9,457 | | | | 1,560,878 | | |
See notes to financial statements.
14
Victory Portfolios II
VictoryShares US 500 Volatility Wtd ETF | | Schedule of Portfolio Investments — continued
December 31, 2020 | |
(Unaudited)
Security Description | | Shares | | Value | |
Johnson & Johnson | | | 12,157 | | | $ | 1,913,269 | | |
Laboratory Corp. of America Holdings (a) | | | 6,103 | | | | 1,242,266 | | |
LHC Group, Inc. (a) | | | 5,458 | | | | 1,164,301 | | |
Masimo Corp. (a) | | | 7,140 | | | | 1,916,232 | | |
McKesson Corp. | | | 8,134 | | | | 1,414,665 | | |
Medtronic PLC | | | 12,975 | | | | 1,519,892 | | |
Merck & Co., Inc. | | | 20,818 | | | | 1,702,912 | | |
Mettler-Toledo International, Inc. (a) | | | 1,452 | | | | 1,654,815 | | |
Molina Healthcare, Inc. (a) | | | 5,946 | | | | 1,264,595 | | |
Neurocrine Biosciences, Inc. (a) | | | 11,806 | | | | 1,131,605 | | |
Novocure Ltd. (a) | | | 12,370 | | | | 2,140,505 | | |
Penumbra, Inc. (a) (b) | | | 6,023 | | | | 1,054,025 | | |
PerkinElmer, Inc. | | | 13,768 | | | | 1,975,709 | | |
Perrigo Co. PLC | | | 24,245 | | | | 1,084,236 | | |
Pfizer, Inc. | | | 46,784 | | | | 1,722,119 | | |
PRA Health Sciences, Inc. (a) | | | 10,151 | | | | 1,273,341 | | |
Quest Diagnostics, Inc. | | | 12,293 | | | | 1,464,957 | | |
Quidel Corp. (a) | | | 4,122 | | | | 740,517 | | |
Regeneron Pharmaceuticals, Inc. (a) | | | 2,235 | | | | 1,079,751 | | |
Repligen Corp. (a) | | | 7,982 | | | | 1,529,591 | | |
ResMed, Inc. | | | 6,319 | | | | 1,343,167 | | |
Stryker Corp. | | | 5,821 | | | | 1,426,378 | | |
Syneos Health, Inc. (a) | | | 13,970 | | | | 951,776 | | |
Teleflex, Inc. | | | 3,315 | | | | 1,364,355 | | |
The Cooper Cos., Inc. | | | 4,593 | | | | 1,668,729 | | |
Thermo Fisher Scientific, Inc. | | | 3,766 | | | | 1,754,127 | | |
UnitedHealth Group, Inc. | | | 3,760 | | | | 1,318,557 | | |
Universal Health Services, Inc., Class B | | | 7,774 | | | | 1,068,925 | | |
Veeva Systems, Inc., Class A (a) | | | 4,499 | | | | 1,224,853 | | |
Vertex Pharmaceuticals, Inc. (a) | | | 5,001 | | | | 1,181,936 | | |
Waters Corp. (a) | | | 6,582 | | | | 1,628,518 | | |
West Pharmaceutical Services, Inc. | | | 5,321 | | | | 1,507,493 | | |
Zimmer Biomet Holdings, Inc. | | | 8,176 | | | | 1,259,840 | | |
Zoetis, Inc. | | | 9,029 | | | | 1,494,300 | | |
| | | | 113,392,548 | | |
Industrials (15.5%): | |
3M Co. | | | 9,191 | | | | 1,606,495 | | |
Allegion PLC | | | 12,224 | | | | 1,422,629 | | |
AMERCO, Inc. | | | 3,536 | | | | 1,605,203 | | |
AMETEK, Inc. | | | 12,060 | | | | 1,458,536 | | |
AO Smith Corp. | | | 31,428 | | | | 1,722,883 | | |
C.H. Robinson Worldwide, Inc. | | | 19,162 | | | | 1,798,737 | | |
Carlisle Cos., Inc. | | | 9,316 | | | | 1,454,973 | | |
Caterpillar, Inc. | | | 9,145 | | | | 1,664,573 | | |
Cintas Corp. | | | 3,243 | | | | 1,146,271 | | |
Copart, Inc. (a) | | | 12,339 | | | | 1,570,138 | | |
CoStar Group, Inc. (a) | | | 1,500 | | | | 1,386,420 | | |
CSX Corp. | | | 15,832 | | | | 1,436,754 | | |
Cummins, Inc. | | | 6,204 | | | | 1,408,928 | | |
Deere & Co. | | | 5,866 | | | | 1,578,247 | | |
See notes to financial statements.
15
Victory Portfolios II
VictoryShares US 500 Volatility Wtd ETF | | Schedule of Portfolio Investments — continued
December 31, 2020 | |
(Unaudited)
Security Description | | Shares | | Value | |
Dover Corp. | | | 10,908 | | | $ | 1,377,135 | | |
Eaton Corp. PLC | | | 10,530 | | | | 1,265,074 | | |
Emerson Electric Co. | | | 15,147 | | | | 1,217,364 | | |
Enphase Energy, Inc. (a) | | | 7,227 | | | | 1,268,122 | | |
Equifax, Inc. | | | 8,381 | | | | 1,616,192 | | |
Expeditors International of Washington, Inc. | | | 20,169 | | | | 1,918,273 | | |
Fastenal Co. | | | 30,719 | | | | 1,500,009 | | |
FedEx Corp. | | | 4,800 | | | | 1,246,176 | | |
Fortive Corp. | | | 20,144 | | | | 1,426,598 | | |
Fortune Brands Home & Security, Inc. | | | 11,579 | | | | 992,552 | | |
Generac Holdings, Inc. (a) | | | 5,870 | | | | 1,334,897 | | |
General Dynamics Corp. | | | 9,476 | | | | 1,410,218 | | |
General Electric Co. | | | 145,673 | | | | 1,573,268 | | |
Graco, Inc. | | | 23,280 | | | | 1,684,308 | | |
HEICO Corp. | | | 9,111 | | | | 1,206,296 | | |
Honeywell International, Inc. | | | 7,601 | | | | 1,616,733 | | |
Howmet Aerospace, Inc. (a) | | | 43,918 | | | | 1,253,420 | | |
Hubbell, Inc. | | | 8,451 | | | | 1,325,032 | | |
IAA, Inc. (a) | | | 19,455 | | | | 1,264,186 | | |
IDEX Corp. | | | 8,395 | | | | 1,672,284 | | |
Illinois Tool Works, Inc. | | | 6,674 | | | | 1,360,695 | | |
J.B. Hunt Transport Services, Inc. | | | 10,071 | | | | 1,376,202 | | |
Jacobs Engineering Group, Inc. | | | 14,937 | | | | 1,627,536 | | |
Johnson Controls International PLC | | | 32,835 | | | | 1,529,783 | | |
Kansas City Southern | | | 6,101 | | | | 1,245,397 | | |
Knight-Swift Transportation Holdings, Inc. | | | 32,170 | | | | 1,345,349 | | |
L3Harris Technologies, Inc. | | | 7,607 | | | | 1,437,875 | | |
Lennox International, Inc. | | | 5,201 | | | | 1,424,918 | | |
Lockheed Martin Corp. | | | 3,458 | | | | 1,227,521 | | |
Masco Corp. | | | 23,633 | | | | 1,298,161 | | |
Nordson Corp. | | | 5,925 | | | | 1,190,629 | | |
Norfolk Southern Corp. | | | 5,466 | | | | 1,298,776 | | |
Northrop Grumman Corp. | | | 4,138 | | | | 1,260,931 | | |
Old Dominion Freight Line, Inc. | | | 6,762 | | | | 1,319,807 | | |
PACCAR, Inc. | | | 18,441 | | | | 1,591,089 | | |
Parker-Hannifin Corp. | | | 4,583 | | | | 1,248,455 | | |
Quanta Services, Inc. | | | 22,712 | | | | 1,635,718 | | |
Republic Services, Inc. | | | 17,316 | | | | 1,667,531 | | |
Rockwell Automation, Inc. | | | 4,959 | | | | 1,243,767 | | |
Rollins, Inc. | | | 44,368 | | | | 1,733,457 | | |
Roper Technologies, Inc. | | | 3,320 | | | | 1,431,219 | | |
Snap-on, Inc. | | | 7,930 | | | | 1,357,140 | | |
Southwest Airlines Co. | | | 24,311 | | | | 1,133,136 | | |
Stanley Black & Decker, Inc. | | | 5,441 | | | | 971,545 | | |
Teledyne Technologies, Inc. (a) | | | 3,523 | | | | 1,380,946 | | |
Textron, Inc. | | | 21,279 | | | | 1,028,414 | | |
The Toro Co. | | | 20,139 | | | | 1,909,984 | | |
Trane Technologies PLC | | | 10,612 | | | | 1,540,438 | | |
TransDigm Group, Inc. (a) | | | 1,560 | | | | 965,406 | | |
TransUnion | | | 14,403 | | | | 1,429,066 | | |
See notes to financial statements.
16
Victory Portfolios II
VictoryShares US 500 Volatility Wtd ETF | | Schedule of Portfolio Investments — continued
December 31, 2020 | |
(Unaudited)
Security Description | | Shares | | Value | |
Trex Co., Inc. (a) | | | 12,078 | | | $ | 1,011,170 | | |
Union Pacific Corp. | | | 7,017 | | | | 1,461,080 | | |
United Parcel Service, Inc., Class B | | | 8,582 | | | | 1,445,209 | | |
United Rentals, Inc. (a) | | | 4,802 | | | | 1,113,632 | | |
Verisk Analytics, Inc. | | | 7,895 | | | | 1,638,923 | | |
W.W. Grainger, Inc. | | | 3,621 | | | | 1,478,599 | | |
Waste Management, Inc. | | | 14,154 | | | | 1,669,181 | | |
Watsco, Inc. | | | 6,380 | | | | 1,445,389 | | |
Westinghouse Air Brake Technologies Corp. | | | 16,009 | | | | 1,171,859 | | |
XPO Logistics, Inc. (a) | | | 9,043 | | | | 1,077,926 | | |
Xylem, Inc. | | | 15,105 | | | | 1,537,538 | | |
| | | | 105,690,321 | | |
Information Technology (19.3%): | |
Accenture PLC, Class A | | | 5,752 | | | | 1,502,480 | | |
Adobe, Inc. (a) | | | 2,373 | | | | 1,186,785 | | |
Advanced Micro Devices, Inc. (a) | | | 10,388 | | | | 952,683 | | |
Akamai Technologies, Inc. (a) | | | 13,445 | | | | 1,411,591 | | |
Amphenol Corp., Class A | | | 12,573 | | | | 1,644,171 | | |
Analog Devices, Inc. | | | 9,500 | | | | 1,403,435 | | |
ANSYS, Inc. (a) | | | 3,731 | | | | 1,357,338 | | |
Apple, Inc. | | | 10,143 | | | | 1,345,875 | | |
Applied Materials, Inc. | | | 15,678 | | | | 1,353,011 | | |
Arista Networks, Inc. (a) | | | 5,426 | | | | 1,576,633 | | |
Aspen Technology, Inc. (a) | | | 8,105 | | | | 1,055,676 | | |
Autodesk, Inc. (a) | | | 4,653 | | | | 1,420,747 | | |
Automatic Data Processing, Inc. | | | 9,014 | | | | 1,588,267 | | |
Black Knight, Inc. (a) | | | 20,085 | | | | 1,774,511 | | |
Booz Allen Hamilton Holding Corp. | | | 18,344 | | | | 1,599,230 | | |
Broadcom, Inc. | | | 3,141 | | | | 1,375,287 | | |
Broadridge Financial Solutions, Inc. | | | 11,365 | | | | 1,741,118 | | |
Cadence Design Systems, Inc. (a) | | | 11,599 | | | | 1,582,452 | | |
CDW Corp. | | | 10,003 | | | | 1,318,295 | | |
Ceridian HCM Holding, Inc. (a) | | | 11,971 | | | | 1,275,630 | | |
Ciena Corp. (a) | | | 23,602 | | | | 1,247,366 | | |
Cisco Systems, Inc. | | | 31,618 | | | | 1,414,906 | | |
Citrix Systems, Inc. | | | 9,802 | | | | 1,275,240 | | |
Cognex Corp. | | | 14,308 | | | | 1,148,718 | | |
Cognizant Technology Solutions Corp., Class A | | | 17,132 | | | | 1,403,967 | | |
Corning, Inc. | | | 33,986 | | | | 1,223,496 | | |
Datadog, Inc., Class A (a) | | | 10,855 | | | | 1,068,566 | | |
Dell Technologies, Inc., Class C (a) | | | 16,542 | | | | 1,212,363 | | |
Dolby Laboratories, Inc., Class A | | | 19,057 | | | | 1,851,007 | | |
Dropbox, Inc., Class A (a) | | | 51,637 | | | | 1,145,825 | | |
Entegris, Inc. | | | 16,239 | | | | 1,560,568 | | |
EPAM Systems, Inc. (a) | | | 3,232 | | | | 1,158,187 | | |
F5 Networks, Inc. (a) | | | 10,722 | | | | 1,886,428 | | |
Fair Isaac Corp. (a) | | | 2,306 | | | | 1,178,458 | | |
Fidelity National Information Services, Inc. | | | 8,437 | | | | 1,193,498 | | |
First Solar, Inc. (a) | | | 13,422 | | | | 1,327,704 | | |
Fiserv, Inc. (a) | | | 12,276 | | | | 1,397,745 | | |
See notes to financial statements.
17
Victory Portfolios II
VictoryShares US 500 Volatility Wtd ETF | | Schedule of Portfolio Investments — continued
December 31, 2020 | |
(Unaudited)
Security Description | | Shares | | Value | |
FleetCor Technologies, Inc. (a) | | | 4,352 | | | $ | 1,187,356 | | |
Fortinet, Inc. (a) | | | 7,967 | | | | 1,183,339 | | |
Gartner, Inc. (a) | | | 9,139 | | | | 1,463,976 | | |
Genpact Ltd. | | | 27,823 | | | | 1,150,759 | | |
Global Payments, Inc. | | | 5,850 | | | | 1,260,207 | | |
HP, Inc. | | | 51,909 | | | | 1,276,442 | | |
Intel Corp. | | | 20,851 | | | | 1,038,797 | | |
International Business Machines Corp. | | | 11,449 | | | | 1,441,200 | | |
Intuit, Inc. | | | 3,520 | | | | 1,337,072 | | |
IPG Photonics Corp. (a) | | | 6,580 | | | | 1,472,538 | | |
Jack Henry & Associates, Inc. | | | 8,762 | | | | 1,419,356 | | |
Juniper Networks, Inc. | | | 64,733 | | | | 1,457,140 | | |
Keysight Technologies, Inc. (a) | | | 12,875 | | | | 1,700,659 | | |
KLA Corp. | | | 4,608 | | | | 1,193,057 | | |
Lam Research Corp. | | | 2,665 | | | | 1,258,600 | | |
Leidos Holdings, Inc. | | | 14,297 | | | | 1,502,901 | | |
Marvell Technology Group Ltd. | | | 28,435 | | | | 1,351,800 | | |
Mastercard, Inc., Class A | | | 3,319 | | | | 1,184,684 | | |
Microchip Technology, Inc. | | | 8,337 | | | | 1,151,423 | | |
Micron Technology, Inc. (a) | | | 21,759 | | | | 1,635,842 | | |
Microsoft Corp. | | | 5,844 | | | | 1,299,822 | | |
MKS Instruments, Inc. | | | 7,774 | | | | 1,169,598 | | |
Monolithic Power Systems, Inc. | | | 3,567 | | | | 1,306,342 | | |
Motorola Solutions, Inc. | | | 8,290 | | | | 1,409,797 | | |
NetApp, Inc. | | | 23,617 | | | | 1,564,390 | | |
NortonLifeLock, Inc. | | | 43,848 | | | | 911,161 | | |
Nuance Communications, Inc. (a) | | | 43,330 | | | | 1,910,420 | | |
NVIDIA Corp. | | | 1,917 | | | | 1,001,057 | | |
Oracle Corp. | | | 23,759 | | | | 1,536,970 | | |
Paychex, Inc. | | | 14,991 | | | | 1,396,861 | | |
Paycom Software, Inc. (a) | | | 2,921 | | | | 1,321,022 | | |
Paylocity Holding Corp. (a) | | | 6,625 | | | | 1,364,154 | | |
PayPal Holdings, Inc. (a) | | | 5,675 | | | | 1,329,085 | | |
PTC, Inc. (a) | | | 14,316 | | | | 1,712,337 | | |
Qorvo, Inc. (a) | | | 8,142 | | | | 1,353,770 | | |
QUALCOMM, Inc. | | | 9,461 | | | | 1,441,289 | | |
salesforce.com, Inc. (a) | | | 4,036 | | | | 898,131 | | |
Seagate Technology PLC | | | 27,473 | | | | 1,707,722 | | |
ServiceNow, Inc. (a) | | | 2,427 | | | | 1,335,894 | | |
Skyworks Solutions, Inc. | | | 7,236 | | | | 1,106,240 | | |
SolarWinds Corp. (a) (b) | | | 54,365 | | | | 812,757 | | |
Square, Inc., Class A (a) | | | 5,117 | | | | 1,113,664 | | |
SS&C Technologies Holdings, Inc. | | | 19,410 | | | | 1,412,078 | | |
SYNNEX Corp. | | | 15,344 | | | | 1,249,615 | | |
Synopsys, Inc. (a) | | | 6,334 | | | | 1,642,026 | | |
Teradyne, Inc. | | | 12,720 | | | | 1,525,001 | | |
Texas Instruments, Inc. | | | 9,168 | | | | 1,504,744 | | |
The Trade Desk, Inc., Class A (a) | | | 1,694 | | | | 1,356,894 | | |
The Western Union Co. | | | 56,347 | | | | 1,236,253 | | |
Trimble, Inc. (a) | | | 19,929 | | | | 1,330,659 | | |
See notes to financial statements.
18
Victory Portfolios II
VictoryShares US 500 Volatility Wtd ETF | | Schedule of Portfolio Investments — continued
December 31, 2020 | |
(Unaudited)
Security Description | | Shares | | Value | |
Tyler Technologies, Inc. (a) | | | 4,755 | | | $ | 2,075,652 | | |
Universal Display Corp. | | | 6,040 | | | | 1,387,992 | | |
VeriSign, Inc. (a) | | | 6,654 | | | | 1,439,926 | | |
Visa, Inc., Class A | | | 6,245 | | | | 1,365,969 | | |
VMware, Inc., Class A (a) (b) | | | 8,990 | | | | 1,260,937 | | |
WEX, Inc. (a) | | | 4,594 | | | | 935,017 | | |
Xilinx, Inc. | | | 12,202 | | | | 1,729,878 | | |
Zebra Technologies Corp. (a) | | | 4,130 | | | | 1,587,283 | | |
Zoom Video Communications, Inc., Class A (a) | | | 2,667 | | | | 899,632 | | |
| | | | 130,768,444 | | |
Materials (5.7%): | |
Air Products & Chemicals, Inc. | | | 4,544 | | | | 1,241,512 | | |
Albemarle Corp. | | | 10,870 | | | | 1,603,541 | | |
AptarGroup, Inc. | | | 14,100 | | | | 1,930,150 | | |
Avery Dennison Corp. | | | 10,121 | | | | 1,569,868 | | |
Ball Corp. | | | 17,821 | | | | 1,660,561 | | |
Berry Global Group, Inc. (a) | | | 24,637 | | | | 1,384,353 | | |
Celanese Corp. | | | 10,387 | | | | 1,349,687 | | |
CF Industries Holdings, Inc. | | | 30,486 | | | | 1,180,113 | | |
Corteva, Inc. | | | 38,323 | | | | 1,483,867 | | |
Crown Holdings, Inc. (a) | | | 14,782 | | | | 1,481,156 | | |
Eastman Chemical Co. | | | 15,484 | | | | 1,552,735 | | |
FMC Corp. | | | 10,113 | | | | 1,162,287 | | |
International Flavors & Fragrances, Inc. (b) | | | 10,970 | | | | 1,193,975 | | |
International Paper Co. | | | 30,502 | | | | 1,516,559 | | |
LyondellBasell Industries NV, Class A | | | 12,573 | | | | 1,152,441 | | |
Martin Marietta Materials, Inc. | | | 5,092 | | | | 1,445,975 | | |
Newmont Corp. | | | 18,611 | | | | 1,114,613 | | |
Nucor Corp. | | | 25,845 | | | | 1,374,695 | | |
Packaging Corp. of America | | | 12,374 | | | | 1,706,499 | | |
PPG Industries, Inc. | | | 10,848 | | | | 1,564,498 | | |
Reliance Steel & Aluminum Co. | | | 11,646 | | | | 1,394,608 | | |
Royal Gold, Inc. | | | 7,360 | | | | 782,810 | | |
RPM International, Inc. | | | 14,905 | | | | 1,353,076 | | |
The Scotts Miracle-Gro Co. | | | 6,435 | | | | 1,281,466 | | |
The Sherwin-Williams Co. | | | 1,950 | | | | 1,433,075 | | |
Vulcan Materials Co. | | | 8,922 | | | | 1,323,222 | | |
Westlake Chemical Corp. | | | 14,066 | | | | 1,147,786 | | |
Westrock Co. | | | 28,448 | | | | 1,238,341 | | |
| | | | 38,623,469 | | |
Real Estate (0.2%): | |
CBRE Group, Inc., Class A (a) | | | 19,888 | | | | 1,247,375 | | |
Utilities (5.6%): | |
Alliant Energy Corp. | | | 26,798 | | | | 1,380,901 | | |
Ameren Corp. | | | 16,083 | | | | 1,255,439 | | |
American Electric Power Co., Inc. | | | 18,270 | | | | 1,521,343 | | |
American Water Works Co., Inc. | | | 9,111 | | | | 1,398,265 | | |
Atmos Energy Corp. | | | 13,700 | | | | 1,307,391 | | |
CMS Energy Corp. | | | 23,726 | | | | 1,447,523 | | |
See notes to financial statements.
19
Victory Portfolios II
VictoryShares US 500 Volatility Wtd ETF | | Schedule of Portfolio Investments — continued
December 31, 2020 | |
(Unaudited)
Security Description | | Shares | | Value | |
Consolidated Edison, Inc. | | | 18,938 | | | $ | 1,368,649 | | |
Dominion Energy, Inc. | | | 15,469 | | | | 1,163,269 | | |
DTE Energy Co. | | | 9,886 | | | | 1,200,259 | | |
Duke Energy Corp. | | | 16,854 | | | | 1,543,151 | | |
Edison International | | | 23,657 | | | | 1,486,133 | | |
Entergy Corp. | | | 11,996 | | | | 1,197,681 | | |
Essential Utilities, Inc. | | | 26,920 | | | | 1,273,047 | | |
Evergy, Inc. | | | 20,872 | | | | 1,158,605 | | |
Eversource Energy | | | 14,269 | | | | 1,234,411 | | |
Exelon Corp. | | | 30,662 | | | | 1,294,550 | | |
FirstEnergy Corp. | | | 36,897 | | | | 1,129,417 | | |
NextEra Energy, Inc. | | | 19,358 | | | | 1,493,470 | | |
NRG Energy, Inc. | | | 34,504 | | | | 1,295,625 | | |
Pinnacle West Capital Corp. | | | 17,334 | | | | 1,385,853 | | |
PPL Corp. | | | 42,595 | | | | 1,201,179 | | |
Public Service Enterprise Group, Inc. | | | 26,473 | | | | 1,543,377 | | |
Sempra Energy | | | 9,596 | | | | 1,222,626 | | |
The AES Corp. | | | 53,310 | | | | 1,252,785 | | |
The Southern Co. | | | 22,689 | | | | 1,393,785 | | |
UGI Corp. | | | 32,122 | | | | 1,122,985 | | |
Vistra Corp. | | | 57,906 | | | | 1,138,432 | | |
WEC Energy Group, Inc. | | | 13,693 | | | | 1,260,167 | | |
Xcel Energy, Inc. | | | 20,510 | | | | 1,367,402 | | |
| | | | 38,037,720 | | |
Total Common Stocks (Cost $534,140,194) | | | 680,197,856 | | |
Collateral for Securities Loaned^ (1.3%) | |
BlackRock Liquidity Funds TempFund Portfolio, Institutional Class, 0.08% (c) | | | 158,308 | | | | 158,308 | | |
Fidelity Investments Money Market Government Portfolio I Shares, 0.01% (c) | | | 5,438,792 | | | | 5,438,792 | | |
Goldman Sachs Financial Square Prime Obligations Fund, Institutional Class,
0.04% (c) | | | 79,003 | | | | 79,003 | | |
JPMorgan Prime Money Market Fund, Capital Class, 0.12% (c) | | | 629,948 | | | | 629,948 | | |
Morgan Stanley Institutional Liquidity Prime Portfolio, Institutional Class,
0.09% (c) | | | 2,832,368 | | | | 2,832,368 | | |
Total Collateral for Securities Loaned (Cost $9,138,419) | | | 9,138,419 | | |
Total Investments (Cost $543,278,613) — 101.0% | | | 689,336,275 | | |
Liabilities in excess of other assets — (1.0)% | | | (7,160,074 | ) | |
NET ASSETS — 100.00% | | $ | 682,176,201 | | |
^ Purchased with cash collateral from securities on loan.
(a) Non-income producing security.
(b) All or a portion of this security is on loan.
(c) Rate disclosed is the daily yield on December 31, 2020.
PLC — Public Limited Company
See notes to financial statements.
20
Victory Portfolios II
VictoryShares US 500 Volatility Wtd ETF | | Schedule of Portfolio Investments — continued
December 31, 2020 | |
(Unaudited)
Futures Contracts Purchased
| | | Number of
Contracts | | Expiration
Date | | Notional
Amount | | Value | | Unrealized
Appreciation
(Depreciation) | |
E-Mini S&P 500 Futures | | | 9 | | | 3/19/21 | | $ | 1,656,049 | | | $ | 1,686,960 | | | $ | 30,911 | | |
| | | Total unrealized appreciation | | | | | | | | $ | 30,911 | | |
| | | Total unrealized depreciation | | | | | | | | | — | | |
| | | Total net unrealized appreciation (depreciation) | | | | | | | | $ | 30,911 | | |
See notes to financial statements.
21
Victory Portfolios II
VictoryShares US Small Cap Volatility Wtd ETF | | Schedule of Portfolio Investments
December 31, 2020 | |
(Unaudited)
Security Description | | Shares | | Value | |
Common Stocks (99.5%) | |
Communication Services (2.7%): | |
AMC Networks, Inc., Class A (a) (b) | | | 1,397 | | | $ | 49,971 | | |
Cargurus, Inc. (a) | | | 1,295 | | | | 41,090 | | |
Consolidated Communications Holdings, Inc. (a) | | | 3,504 | | | | 17,135 | | |
Gray Television, Inc. (a) | | | 1,689 | | | | 30,216 | | |
MSG Networks, Inc., Class A (a) (b) | | | 4,160 | | | | 61,318 | | |
National CineMedia, Inc. | | | 5,317 | | | | 19,779 | | |
QuinStreet, Inc. (a) | | | 2,445 | | | | 52,421 | | |
Sciplay Corp., Class A (a) | | | 2,796 | | | | 38,725 | | |
Shenandoah Telecommunications Co. | | | 727 | | | | 31,443 | | |
Sinclair Broadcast Group, Inc., Class A | | | 1,292 | | | | 41,150 | | |
TechTarget, Inc. (a) | | | 1,189 | | | | 70,283 | | |
TEGNA, Inc. | | | 2,772 | | | | 38,669 | | |
Telephone & Data Systems, Inc. | | | 1,618 | | | | 30,046 | | |
WideOpenWest, Inc. (a) | | | 4,492 | | | | 47,930 | | |
| | | | 570,176 | | |
Consumer Discretionary (11.8%): | |
1-800-Flowers.com, Inc., Class A (a) | | | 1,160 | | | | 30,160 | | |
Acushnet Holdings Corp. | | | 1,441 | | | | 58,418 | | |
Adtalem Global Education, Inc. (a) | | | 1,399 | | | | 47,497 | | |
American Public Education, Inc. (a) | | | 1,098 | | | | 33,467 | | |
America's Car-Mart, Inc. (a) | | | 258 | | | | 28,339 | | |
Asbury Automotive Group, Inc. (a) | | | 278 | | | | 40,516 | | |
Big Lots, Inc. | | | 452 | | | | 19,404 | | |
Boot Barn Holdings, Inc. (a) | | | 811 | | | | 35,165 | | |
Brinker International, Inc. | | | 382 | | | | 21,610 | | |
Cavco Industries, Inc. (a) | | | 152 | | | | 26,668 | | |
Century Communities, Inc. (a) | | | 649 | | | | 28,413 | | |
Cooper Tire & Rubber Co. | | | 1,040 | | | | 42,120 | | |
Core-Mark Holding Co., Inc. | | | 1,207 | | | | 35,450 | | |
Crocs, Inc. (a) | | | 598 | | | | 37,471 | | |
Dana, Inc. | | | 1,659 | | | | 32,384 | | |
Dave & Buster's Entertainment, Inc. | | | 785 | | | | 23,566 | | |
Denny's Corp. (a) | | | 1,858 | | | | 27,275 | | |
Dorman Products, Inc. (a) | | | 511 | | | | 44,365 | | |
El Pollo Loco Holdings, Inc. (a) | | | 1,810 | | | | 32,761 | | |
Franchise Group, Inc. | | | 744 | | | | 22,655 | | |
Gentherm, Inc. (a) | | | 1,001 | | | | 65,284 | | |
G-III Apparel Group Ltd. (a) | | | 1,369 | | | | 32,500 | | |
Graham Holdings Co., Class B | | | 85 | | | | 45,337 | | |
Green Brick Partners, Inc. (a) | | | 2,339 | | | | 53,704 | | |
Group 1 Automotive, Inc. | | | 278 | | | | 36,457 | | |
GrowGeneration Corp. (a) | | | 1,273 | | | | 51,200 | | |
H&R Block, Inc. | | | 2,355 | | | | 37,350 | | |
Hibbett Sports, Inc. (a) | | | 753 | | | | 34,774 | | |
Hilton Grand Vacations, Inc. (a) | | | 1,191 | | | | 37,338 | | |
Installed Building Products, Inc. (a) | | | 288 | | | | 29,356 | | |
iRobot Corp. (a) | | | 485 | | | | 38,941 | | |
See notes to financial statements.
22
Victory Portfolios II
VictoryShares US Small Cap Volatility Wtd ETF | | Schedule of Portfolio Investments — continued
December 31, 2020 | |
(Unaudited)
Security Description | | Shares | | Value | |
Jack in the Box, Inc. | | | 283 | | | $ | 26,262 | | |
Johnson Outdoors, Inc., Class A | | | 523 | | | | 58,905 | | |
Kontoor Brands, Inc. | | | 1,239 | | | | 50,254 | | |
La-Z-Boy, Inc. | | | 1,062 | | | | 42,310 | | |
LCI Industries | | | 314 | | | | 40,720 | | |
LGI Homes, Inc. (a) | | | 234 | | | | 24,769 | | |
Lumber Liquidators Holdings, Inc. (a) | | | 878 | | | | 26,990 | | |
M/I Homes, Inc. (a) | | | 493 | | | | 21,835 | | |
Malibu Boats, Inc., Class A (a) | | | 575 | | | | 35,903 | | |
MarineMax, Inc. (a) | | | 916 | | | | 32,087 | | |
MDC Holdings, Inc. | | | 633 | | | | 30,764 | | |
Monarch Casino & Resort, Inc. (a) | | | 528 | | | | 32,324 | | |
Monro, Inc. | | | 815 | | | | 43,440 | | |
Perdoceo Education Corp. (a) | | | 2,612 | | | | 32,990 | | |
PetMed Express, Inc. (b) | | | 948 | | | | 30,393 | | |
Rent-A-Center, Inc. | | | 1,077 | | | | 41,238 | | |
Revolve Group, Inc. (a) | | | 1,284 | | | | 40,022 | | |
Sally Beauty Holdings, Inc. (a) | | | 2,552 | | | | 33,278 | | |
Shoe Carnival, Inc. | | | 708 | | | | 27,739 | | |
Shutterstock, Inc. | | | 812 | | | | 58,221 | | |
Skyline Champion Corp. (a) | | | 1,010 | | | | 31,249 | | |
Sleep Number Corp. (a) | | | 511 | | | | 41,830 | | |
Sportsman's Warehouse Holdings, Inc. (a) | | | 1,982 | | | | 34,784 | | |
Standard Motor Products, Inc. | | | 1,021 | | | | 41,310 | | |
Steven Madden Ltd. | | | 1,397 | | | | 49,342 | | |
Strategic Education, Inc. | | | 352 | | | | 33,556 | | |
Stride, Inc. (a) | | | 832 | | | | 17,663 | | |
Sturm Ruger & Co., Inc. | | | 779 | | | | 50,690 | | |
The Buckle, Inc. | | | 1,798 | | | | 52,502 | | |
The Michaels Cos., Inc. (a) | | | 1,288 | | | | 16,757 | | |
TRI Pointe Group, Inc. (a) | | | 1,538 | | | | 26,531 | | |
Universal Electronics, Inc. (a) | | | 953 | | | | 49,994 | | |
W.W. International, Inc. (a) | | | 1,016 | | | | 24,790 | | |
Winmark Corp. | | | 292 | | | | 54,253 | | |
Winnebago Industries, Inc. | | | 503 | | | | 30,150 | | |
Wolverine World Wide, Inc. | | | 1,209 | | | | 37,781 | | |
XPEL, Inc. (a) | | | 1,107 | | | | 57,077 | | |
Zumiez, Inc. (a) | | | 1,249 | | | | 45,938 | | |
| | | | 2,556,586 | | |
Consumer Staples (6.4%): | |
B&G Foods, Inc. (b) | | | 1,065 | | | | 29,532 | | |
BellRing Brands, Inc., Class A (a) | | | 2,083 | | | | 50,638 | | |
Calavo Growers, Inc. | | | 668 | | | | 46,379 | | |
Cal-Maine Foods, Inc. (a) | | | 1,340 | | | | 50,304 | | |
Central Garden & Pet Co., Class A (a) | | | 1,342 | | | | 48,755 | | |
Coca-Cola Consolidated, Inc. | | | 152 | | | | 40,473 | | |
Edgewell Personal Care Co. | | | 1,028 | | | | 35,548 | | |
elf Beauty, Inc. (a) | | | 1,608 | | | | 40,506 | | |
Fresh Del Monte Produce, Inc. | | | 1,470 | | | | 35,383 | | |
Hostess Brands, Inc. (a) | | | 5,772 | | | | 84,503 | | |
See notes to financial statements.
23
Victory Portfolios II
VictoryShares US Small Cap Volatility Wtd ETF | | Schedule of Portfolio Investments — continued
December 31, 2020 | |
(Unaudited)
Security Description | | Shares | | Value | |
Ingles Markets, Inc., Class A | | | 1,047 | | | $ | 44,665 | | |
Inter Parfums, Inc. | | | 684 | | | | 41,375 | | |
J & J Snack Foods Corp. | | | 283 | | | | 43,970 | | |
John B Sanfilippo & Son, Inc. | | | 686 | | | | 54,098 | | |
Medifast, Inc. | | | 228 | | | | 44,766 | | |
MGP Ingredients, Inc. | | | 967 | | | | 45,507 | | |
Nu Skin Enterprises, Inc., Class A | | | 483 | | | | 26,386 | | |
PriceSmart, Inc. | | | 754 | | | | 68,682 | | |
SpartanNash Co. | | | 1,537 | | | | 26,759 | | |
Sprouts Farmers Market, Inc. (a) | | | 1,859 | | | | 37,366 | | |
The Simply Good Foods Co. (a) | | | 1,415 | | | | 44,374 | | |
Tootsie Roll Industries, Inc. (b) | | | 2,309 | | | | 68,577 | | |
Turning Point Brands, Inc. | | | 1,217 | | | | 54,230 | | |
Universal Corp. | | | 1,303 | | | | 63,339 | | |
USANA Health Sciences, Inc. (a) | | | 452 | | | | 34,849 | | |
Vector Group Ltd. | | | 4,493 | | | | 52,343 | | |
WD-40 Co. | | | 265 | | | | 70,405 | | |
Weis Markets, Inc. | | | 1,161 | | | | 55,507 | | |
| | | | 1,339,219 | | |
Energy (1.8%): | |
Arch Resources, Inc. | | | 729 | | | | 31,908 | | |
Brigham Minerals, Inc. | | | 2,209 | | | | 24,277 | | |
Cactus, Inc., Class A | | | 1,037 | | | | 27,035 | | |
Clean Energy Fuels Corp. (a) | | | 7,820 | | | | 61,465 | | |
CVR Energy, Inc. | | | 1,453 | | | | 21,650 | | |
Helix Energy Solutions Group, Inc. (a) | | | 4,313 | | | | 18,115 | | |
International Seaways, Inc. | | | 1,785 | | | | 29,149 | | |
Murphy Oil Corp. | | | 1,517 | | | | 18,356 | | |
ProPetro Holding Corp. (a) | | | 2,507 | | | | 18,527 | | |
Renewable Energy Group, Inc. (a) | | | 682 | | | | 48,299 | | |
SEACOR Holdings, Inc. (a) | | | 1,025 | | | | 42,485 | | |
Talos Energy, Inc. (a) | | | 2,769 | | | | 22,817 | | |
World Fuel Services Corp. | | | 1,102 | | | | 34,338 | | |
| | | | 398,421 | | |
Financials (24.4%): | |
1st Source Corp. | | | 1,091 | | | | 43,967 | | |
American Equity Investment Life Holding Co. | | | 949 | | | | 26,249 | | |
American National Group, Inc. | | | 627 | | | | 60,267 | | |
Ameris Bancorp | | | 1,170 | | | | 44,542 | | |
AMERISAFE, Inc. | | | 712 | | | | 40,890 | | |
Associated Bancorp | | | 2,544 | | | | 43,375 | | |
Assured Guaranty Ltd. | | | 1,357 | | | | 42,732 | | |
Atlantic Union Bankshares Corp. | | | 1,370 | | | | 45,128 | | |
Axos Financial, Inc. (a) | | | 1,205 | | | | 45,224 | | |
B. Riley Financial, Inc. | | | 1,346 | | | | 59,520 | | |
BancFirst Corp. | | | 635 | | | | 37,275 | | |
BancorpSouth Bank | | | 1,526 | | | | 41,873 | | |
Bank of Hawaii Corp. | | | 698 | | | | 53,480 | | |
Bank OZK | | | 1,396 | | | | 43,653 | | |
See notes to financial statements.
24
Victory Portfolios II
VictoryShares US Small Cap Volatility Wtd ETF | | Schedule of Portfolio Investments — continued
December 31, 2020 | |
(Unaudited)
Security Description | | Shares | | Value | |
BankUnited, Inc. | | | 1,150 | | | $ | 39,997 | | |
Banner Corp. | | | 839 | | | | 39,089 | | |
BGC Partners, Inc., Class A | | | 11,328 | | | | 45,312 | | |
Brighthouse Financial, Inc. (a) | | | 771 | | | | 27,914 | | |
Brightsphere Investment Group, Inc. | | | 1,861 | | | | 35,880 | | |
Brookline Bancorp, Inc. | | | 4,025 | | | | 48,461 | | |
Capitol Federal Financial, Inc. | | | 5,229 | | | | 65,363 | | |
Cathay General Bancorp | | | 1,355 | | | | 43,617 | | |
City Holding Co. | | | 696 | | | | 48,407 | | |
CNO Financial Group, Inc. | | | 1,826 | | | | 40,592 | | |
Cohen & Steers, Inc. | | | 511 | | | | 37,967 | | |
Columbia Banking System, Inc. | | | 1,195 | | | | 42,901 | | |
Columbia Financial, Inc. (a) | | | 5,282 | | | | 82,188 | | |
CVB Financial Corp. | | | 2,313 | | | | 45,104 | | |
Eagle Bancorp, Inc. | | | 1,209 | | | | 49,932 | | |
Employers Holdings, Inc. | | | 1,445 | | | | 46,515 | | |
Encore Capital Group, Inc. (a) | | | 450 | | | | 17,528 | | |
Enterprise Financial Services Corp. | | | 1,083 | | | | 37,851 | | |
Evercore, Inc. | | | 533 | | | | 58,438 | | |
FB Financial Corp. | | | 1,217 | | | | 42,266 | | |
FBL Financial Group, Inc., Class A | | | 798 | | | | 41,903 | | |
Federal Agricultural Mortgage Corp., Class C | | | 547 | | | | 40,615 | | |
Federated Hermes, Inc. | | | 1,278 | | | | 36,921 | | |
First Bancorp, Inc. | | | 4,751 | | | | 43,804 | | |
First Busey Corp. | | | 1,927 | | | | 41,527 | | |
First Commonwealth Financial Corp. | | | 4,396 | | | | 48,092 | | |
First Financial Bancorp | | | 2,179 | | | | 38,198 | | |
First Hawaiian, Inc. | | | 2,253 | | | | 53,125 | | |
First Interstate BancSystem, Inc., Class A | | | 1,145 | | | | 46,682 | | |
First Merchants Corp. | | | 1,393 | | | | 52,111 | | |
First Midwest Bancorp, Inc. | | | 2,922 | | | | 46,518 | | |
FirstCash, Inc. | | | 719 | | | | 50,359 | | |
Flagstar Bancorp, Inc. | | | 1,024 | | | | 41,738 | | |
FNB Corp. | | | 3,737 | | | | 35,502 | | |
Focus Financial Partners, Inc., Class A (a) | | | 830 | | | | 36,105 | | |
Fulton Financial Corp. | | | 3,494 | | | | 44,444 | | |
German American Bancorp, Inc. | | | 1,521 | | | | 50,330 | | |
Green Dot Corp., Class A (a) | | | 483 | | | | 26,951 | | |
Heartland Financial USA, Inc. | | | 951 | | | | 38,392 | | |
Heritage Financial Corp. | | | 1,849 | | | | 43,248 | | |
Hilltop Holdings, Inc. | | | 1,588 | | | | 43,686 | | |
Home BancShares, Inc. | | | 1,872 | | | | 36,467 | | |
Hope Bancorp, Inc. | | | 4,226 | | | | 46,106 | | |
Horace Mann Educators Corp. | | | 1,066 | | | | 44,815 | | |
Independent Bank Corp. | | | 613 | | | | 44,774 | | |
Independent Bank Group, Inc. | | | 604 | | | | 37,762 | | |
International Bancshares Corp. | | | 948 | | | | 35,493 | | |
Investors Bancorp, Inc. | | | 4,465 | | | | 47,150 | | |
Kearny Financial Corp. | | | 5,590 | | | | 59,030 | | |
Lakeland Financial Corp. | | | 814 | | | | 43,614 | | |
See notes to financial statements.
25
Victory Portfolios II
VictoryShares US Small Cap Volatility Wtd ETF | | Schedule of Portfolio Investments — continued
December 31, 2020 | |
(Unaudited)
Security Description | | Shares | | Value | |
Live Oak Bancshares, Inc. | | | 1,283 | | | $ | 60,890 | | |
Mercury General Corp. | | | 1,059 | | | | 55,290 | | |
Moelis & Co., Class A | | | 1,337 | | | | 62,518 | | |
Mr. Cooper Group, Inc. (a) | | | 1,310 | | | | 40,649 | | |
National Bank Holdings Corp., Class A | | | 1,427 | | | | 46,749 | | |
National Western Life Group, Inc., Class A | | | 144 | | | | 29,727 | | |
Navient Corp. | | | 2,934 | | | | 28,812 | | |
NBT Bancorp, Inc. | | | 1,408 | | | | 45,197 | | |
Nelnet, Inc., Class A | | | 725 | | | | 51,649 | | |
NMI Holdings, Inc., Class A (a) | | | 1,500 | | | | 33,975 | | |
Northwest Bancshares, Inc. | | | 4,402 | | | | 56,081 | | |
Oceanfirst Financial Corp. | | | 2,309 | | | | 43,017 | | |
Old National Bancorp | | | 2,955 | | | | 48,935 | | |
Pacific Premier Bancorp, Inc. | | | 1,327 | | | | 41,575 | | |
Palomar Holdings, Inc. (a) | | | 300 | | | | 26,652 | | |
Park National Corp. | | | 396 | | | | 41,584 | | |
Piper Sandler Cos. | | | 438 | | | | 44,194 | | |
PJT Partners, Inc., Class A | | | 606 | | | | 45,602 | | |
PRA Group, Inc. (a) | | | 661 | | | | 26,215 | | |
Premier Financial Corp. | | | 1,568 | | | | 36,064 | | |
Provident Financial Services, Inc. | | | 2,329 | | | | 41,829 | | |
Radian Group, Inc. | | | 1,502 | | | | 30,416 | | |
Renasant Corp. | | | 1,470 | | | | 49,510 | | |
S&T Bancorp, Inc. | | | 1,854 | | | | 46,053 | | |
Safety Insurance Group, Inc. | | | 685 | | | | 53,362 | | |
Sandy Spring Bancorp, Inc. | | | 1,433 | | | | 46,128 | | |
Seacoast Banking Corp. of Florida (a) | | | 1,588 | | | | 46,767 | | |
ServisFirst Bancshares, Inc. | | | 956 | | | | 38,517 | | |
Simmons First National Corp., Class A | | | 2,028 | | | | 43,785 | | |
SLM Corp. | | | 4,814 | | | | 59,645 | | |
Southside Bancshares, Inc. | | | 1,511 | | | | 46,886 | | |
Sterling Bancorp | | | 2,008 | | | | 36,104 | | |
Stewart Information Services Corp. | | | 869 | | | | 42,025 | | |
Stock Yards Bancorp, Inc. | | | 879 | | | | 35,582 | | |
StoneX Group, Inc. (a) | | | 588 | | | | 34,045 | | |
Tompkins Financial Corp. (b) | | | 567 | | | | 40,030 | | |
Towne Bank | | | 2,069 | | | | 48,580 | | |
TriCo Bancshares | | | 1,432 | | | | 50,521 | | |
Triumph Bancorp, Inc. (a) | | | 964 | | | | 46,802 | | |
Trupanion, Inc. (a) | | | 472 | | | | 56,503 | | |
Trustmark Corp. | | | 1,681 | | | | 45,908 | | |
UMB Financial Corp. | | | 695 | | | | 47,948 | | |
United Community Banks, Inc. | | | 1,747 | | | | 49,685 | | |
Veritex Holdings, Inc. | | | 1,615 | | | | 41,441 | | |
Victory Capital Holdings, Inc., Class A (c) | | | 2,255 | | | | 55,947 | | |
Virtus Investment Partners, Inc. | | | 223 | | | | 48,391 | | |
Waddell & Reed Financial, Inc., Class A | | | 2,955 | | | | 75,265 | | |
Walker & Dunlop, Inc. | | | 511 | | | | 47,022 | | |
Washington Federal, Inc. | | | 1,599 | | | | 41,158 | | |
Webster Financial Corp. | | | 1,021 | | | | 43,035 | | |
See notes to financial statements.
26
Victory Portfolios II
VictoryShares US Small Cap Volatility Wtd ETF | | Schedule of Portfolio Investments — continued
December 31, 2020 | |
(Unaudited)
Security Description | | Shares | | Value | |
WesBanco, Inc. | | | 1,655 | | | $ | 49,584 | | |
Westamerica Bancorp | | | 769 | | | | 42,518 | | |
White Mountains Insurance Group Ltd. | | | 57 | | | | 57,038 | | |
Wintrust Financial Corp. | | | 614 | | | | 37,509 | | |
WSFS Financial Corp. | | | 1,080 | | | | 48,470 | | |
| | | | 5,308,342 | | |
Health Care (9.5%): | |
Acadia Healthcare Co., Inc. (a) | | | 809 | | | | 40,660 | | |
Addus HomeCare Corp. (a) | | | 327 | | | | 38,288 | | |
AMN Healthcare Services, Inc. (a) | | | 649 | | | | 44,294 | | |
Amphastar Pharmaceuticals, Inc. (a) | | | 2,413 | | | | 48,525 | | |
Anika Therapeutics, Inc. (a) | | | 923 | | | | 41,775 | | |
Antares Pharma, Inc. (a) | | | 11,102 | | | | 44,297 | | |
Atrion Corp. | | | 77 | | | | 49,452 | | |
BioLife Solutions, Inc. (a) | | | 1,342 | | | | 53,532 | | |
BioTelemetry, Inc. (a) | | | 946 | | | | 68,187 | | |
Brookdale Senior Living, Inc. (a) | | | 6,864 | | | | 30,408 | | |
Cantel Medical Corp. | | | 444 | | | | 35,014 | | |
Castle Biosciences, Inc. (a) | | | 662 | | | | 44,453 | | |
Coherus Biosciences, Inc. (a) | | | 1,850 | | | | 32,153 | | |
Corcept Therapeutics, Inc. (a) | | | 3,622 | | | | 94,752 | | |
CorVel Corp. (a) | | | 423 | | | | 44,838 | | |
Enanta Pharmaceuticals, Inc. (a) | | | 792 | | | | 33,343 | | |
Fulgent Genetics, Inc. (a) (b) | | | 605 | | | | 31,521 | | |
Hanger, Inc. (a) | | | 1,606 | | | | 35,316 | | |
HealthStream, Inc. (a) | | | 2,181 | | | | 47,633 | | |
HMS Holdings Corp. (a) | | | 2,063 | | | | 75,815 | | |
Innoviva, Inc. (a) | | | 3,559 | | | | 44,096 | | |
Inogen, Inc. (a) | | | 982 | | | | 43,876 | | |
Integer Holdings Corp. (a) | | | 495 | | | | 40,189 | | |
Ironwood Pharmaceuticals, Inc. (a) | | | 4,264 | | | | 48,567 | | |
Lantheus Holdings, Inc. (a) | | | 2,489 | | | | 33,577 | | |
LeMaitre Vascular, Inc. (b) | | | 1,079 | | | | 43,700 | | |
Luminex Corp. | | | 1,458 | | | | 33,709 | | |
Magellan Health, Inc. (a) | | | 443 | | | | 36,698 | | |
Meridian Bioscience, Inc. (a) | | | 1,980 | | | | 37,006 | | |
National Healthcare Corp. | | | 758 | | | | 50,339 | | |
National Research Corp. | | | 582 | | | | 24,881 | | |
NextGen Healthcare, Inc. (a) | | | 1,685 | | | | 30,734 | | |
Omnicell, Inc. (a) | | | 654 | | | | 78,494 | | |
Phibro Animal Health Corp., Class A | | | 1,620 | | | | 31,460 | | |
Prestige Consumer Healthcare, Inc. (a) | | | 1,395 | | | | 48,644 | | |
R1 RCM, Inc. (a) | | | 2,378 | | | | 57,119 | | |
Select Medical Holdings Corp. (a) | | | 1,321 | | | | 36,539 | | |
SIGA Technologies, Inc. (a) | | | 5,685 | | | | 41,330 | | |
Simulations Plus, Inc. | | | 625 | | | | 44,950 | | |
STAAR Surgical Co. (a) | | | 767 | | | | 60,761 | | |
Supernus Pharmaceuticals, Inc. (a) | | | 1,871 | | | | 47,074 | | |
Surmodics, Inc. (a) | | | 821 | | | | 35,730 | | |
The Pennant Group, Inc. (a) | | | 553 | | | | 32,107 | | |
See notes to financial statements.
27
Victory Portfolios II
VictoryShares US Small Cap Volatility Wtd ETF | | Schedule of Portfolio Investments — continued
December 31, 2020 | |
(Unaudited)
Security Description | | Shares | | Value | |
U.S. Physical Therapy, Inc. | | | 327 | | | $ | 39,322 | | |
Vanda Pharmaceuticals, Inc. (a) | | | 3,711 | | | | 48,763 | | |
Zynex, Inc. (a) (b) | | | 1,682 | | | | 22,640 | | |
| | | | 2,026,561 | | |
Industrials (19.4%): | |
AAON, Inc. | | | 687 | | | | 45,775 | | |
AAR Corp. | | | 1,015 | | | | 36,763 | | |
ACCO Brands Corp. | | | 5,155 | | | | 43,560 | | |
AeroVironment, Inc. (a) | | | 518 | | | | 45,014 | | |
Alamo Group, Inc. | | | 369 | | | | 50,904 | | |
Albany International Corp. | | | 603 | | | | 44,272 | | |
Ameresco, Inc., Class A (a) | | | 940 | | | | 49,106 | | |
American Woodmark Corp. (a) | | | 260 | | | | 24,401 | | |
Apogee Enterprises, Inc. | | | 1,211 | | | | 38,364 | | |
Applied Industrial Technologies, Inc. | | | 559 | | | | 43,596 | | |
ArcBest Corp. | | | 1,040 | | | | 44,377 | | |
Arcosa, Inc. | | | 783 | | | | 43,010 | | |
Astec Industries, Inc. | | | 793 | | | | 45,899 | | |
Atkore International Group, Inc. (a) | | | 879 | | | | 36,136 | | |
AZZ, Inc. | | | 1,062 | | | | 50,381 | | |
Barnes Group, Inc. | | | 726 | | | | 36,801 | | |
Brady Corp., Class A | | | 919 | | | | 48,541 | | |
Casella Waste Systems, Inc. (a) | | | 766 | | | | 47,454 | | |
CBIZ, Inc. (a) | | | 1,979 | | | | 52,661 | | |
Chart Industries, Inc. (a) | | | 327 | | | | 38,517 | | |
Cimpress PLC (a) | | | 232 | | | | 20,356 | | |
Columbus McKinnon Corp. | | | 904 | | | | 34,750 | | |
Comfort Systems USA, Inc. | | | 656 | | | | 34,545 | | |
Construction Partners, Inc., Class A (a) | | | 1,778 | | | | 51,758 | | |
CSW Industrials, Inc. | | | 621 | | | | 69,497 | | |
Dycom Industries, Inc. (a) | | | 366 | | | | 27,640 | | |
Echo Global Logistics, Inc. (a) | | | 1,380 | | | | 37,012 | | |
Encore Wire Corp. | | | 850 | | | | 51,484 | | |
Energy Recovery, Inc. (a) | | | 4,304 | | | | 58,706 | | |
Ennis, Inc. | | | 2,625 | | | | 46,856 | | |
EnPro Industries, Inc. | | | 547 | | | | 41,309 | | |
ESCO Technologies, Inc. | | | 475 | | | | 49,030 | | |
Evoqua Water Technologies Corp. (a) | | | 1,298 | | | | 35,020 | | |
Federal Signal Corp. | | | 1,451 | | | | 48,130 | | |
Forrester Research, Inc. (a) | | | 831 | | | | 34,819 | | |
Forward Air Corp. | | | 754 | | | | 57,937 | | |
Foundation Building Materials, Inc. (a) | | | 1,738 | | | | 33,387 | | |
Franklin Electric Co., Inc. | | | 661 | | | | 45,748 | | |
GATX Corp. | | | 583 | | | | 48,494 | | |
Gibraltar Industries, Inc. (a) | | | 609 | | | | 43,811 | | |
GMS, Inc. (a) | | | 1,032 | | | | 31,455 | | |
GrafTech International Ltd. | | | 4,250 | | | | 45,305 | | |
Great Lakes Dredge & Dock Corp. (a) | | | 4,083 | | | | 53,773 | | |
Griffon Corp. | | | 1,246 | | | | 25,393 | | |
H&E Equipment Services, Inc. | | | 1,393 | | | | 41,525 | | |
See notes to financial statements.
28
Victory Portfolios II
VictoryShares US Small Cap Volatility Wtd ETF | | Schedule of Portfolio Investments — continued
December 31, 2020 | |
(Unaudited)
Security Description | | Shares | | Value | |
Healthcare Services Group | | | 1,627 | | | $ | 45,719 | | |
Heartland Express, Inc. | | | 2,805 | | | | 50,770 | | |
Helios Technologies, Inc. | | | 812 | | | | 43,271 | | |
Herc Holdings, Inc. (a) | | | 524 | | | | 34,799 | | |
HNI Corp. | | | 1,008 | | | | 34,736 | | |
Hub Group, Inc., Class A (a) | | | 881 | | | | 50,217 | | |
Hyster-Yale Materials Handling, Inc. | | | 809 | | | | 48,176 | | |
ICF International, Inc. | | | 595 | | | | 44,226 | | |
Insperity, Inc. | | | 397 | | | | 32,324 | | |
JELD-WEN Holding, Inc. (a) | | | 1,049 | | | | 26,603 | | |
Kadant, Inc. | | | 321 | | | | 45,255 | | |
Kaman Corp. | | | 712 | | | | 40,677 | | |
KAR Auction Services, Inc. | | | 1,769 | | | | 32,921 | | |
Kforce, Inc. | | | 1,105 | | | | 46,509 | | |
Knoll, Inc. | | | 2,310 | | | | 33,911 | | |
Korn Ferry | | | 1,212 | | | | 52,723 | | |
Kratos Defense & Security Solutions, Inc. (a) | | | 1,664 | | | | 45,644 | | |
Lindsay Corp. | | | 426 | | | | 54,724 | | |
Macquarie Infrastructure Corp. | | | 868 | | | | 32,593 | | |
Marten Transport Ltd. | | | 2,164 | | | | 37,286 | | |
Matson, Inc. | | | 802 | | | | 45,690 | | |
McGrath RentCorp | | | 574 | | | | 38,515 | | |
Meritor, Inc. (a) | | | 1,405 | | | | 39,214 | | |
Moog, Inc., Class A | | | 484 | | | | 38,381 | | |
Mueller Industries, Inc. | | | 1,063 | | | | 37,322 | | |
Mueller Water Products, Inc., Class A | | | 3,664 | | | | 45,360 | | |
MYR Group, Inc. (a) | | | 761 | | | | 45,736 | | |
National Presto Industries, Inc. | | | 565 | | | | 49,963 | | |
NV5 Global, Inc. (a) | | | 540 | | | | 42,541 | | |
Patrick Industries, Inc. | | | 406 | | | | 27,750 | | |
PGT Innovations, Inc. (a) | | | 1,592 | | | | 32,381 | | |
Primoris Services Corp. | | | 1,456 | | | | 40,200 | | |
Raven Industries, Inc. | | | 1,367 | | | | 45,234 | | |
Rush Enterprises, Inc., Class A | | | 1,300 | | | | 53,846 | | |
SkyWest, Inc. | | | 547 | | | | 22,050 | | |
Spirit Airlines, Inc. (a) | | | 1,012 | | | | 24,743 | | |
SPX Corp. (a) | | | 844 | | | | 46,032 | | |
Standex International Corp. | | | 594 | | | | 46,047 | | |
Steelcase, Inc., Class A | | | 2,775 | | | | 37,601 | | |
Systemax, Inc. | | | 1,955 | | | | 70,165 | | |
Tennant Co. | | | 582 | | | | 40,839 | | |
Terex Corp. | | | 1,600 | | | | 55,823 | | |
The Brink's Co. | | | 612 | | | | 44,064 | | |
The Gorman-Rupp Co. | | | 1,185 | | | | 38,453 | | |
The Greenbrier Cos., Inc. | | | 1,055 | | | | 38,381 | | |
TriMas Corp. (a) | | | 1,736 | | | | 54,978 | | |
Trinity Industries, Inc. | | | 2,048 | | | | 54,047 | | |
Triton International Ltd. | | | 1,122 | | | | 54,428 | | |
Valmont Industries, Inc. | | | 357 | | | | 62,450 | | |
Vectrus, Inc. (a) | | | 889 | | | | 44,201 | | |
See notes to financial statements.
29
Victory Portfolios II
VictoryShares US Small Cap Volatility Wtd ETF | | Schedule of Portfolio Investments — continued
December 31, 2020 | |
(Unaudited)
Security Description | | Shares | | Value | |
Welbilt, Inc. (a) | | | 3,013 | | | $ | 39,772 | | |
WESCO International, Inc. (a) | | | 566 | | | | 44,431 | | |
| | | | 4,166,994 | | |
Information Technology (11.9%): | |
A10 Networks, Inc. (a) | | | 4,092 | | | | 40,347 | | |
ACM Research, Inc., Class A (a) | | | 222 | | | | 18,038 | | |
Advanced Energy Industries, Inc. (a) | | | 421 | | | | 40,824 | | |
Alarm.com Holdings, Inc. (a) | | | 686 | | | | 70,967 | | |
Amkor Technology, Inc. | | | 2,337 | | | | 35,242 | | |
Axcelis Technologies, Inc. (a) | | | 1,239 | | | | 36,080 | | |
Badger Meter, Inc. | | | 654 | | | | 61,515 | | |
Benchmark Electronics, Inc. | | | 1,622 | | | | 43,810 | | |
Cass Information Systems, Inc. | | | 1,043 | | | | 40,583 | | |
CEVA, Inc. (a) | | | 867 | | | | 39,449 | | |
ChannelAdvisor Corp. (a) | | | 1,480 | | | | 23,650 | | |
CommVault Systems, Inc. (a) | | | 1,025 | | | | 56,754 | | |
CSG Systems International, Inc. | | | 1,399 | | | | 63,053 | | |
CTS Corp. | | | 1,914 | | | | 65,708 | | |
Digital Turbine, Inc. (a) | | | 948 | | | | 53,619 | | |
Diodes, Inc. (a) | | | 817 | | | | 57,599 | | |
Ebix, Inc. | | | 875 | | | | 33,224 | | |
Endurance International Group Holdings, Inc. (a) | | | 3,633 | | | | 34,332 | | |
ePlus, Inc. (a) | | | 493 | | | | 43,359 | | |
EVERTEC, Inc. | | | 1,183 | | | | 46,516 | | |
ExlService Holdings, Inc. (a) | | | 576 | | | | 49,035 | | |
FormFactor, Inc. (a) | | | 1,366 | | | | 58,764 | | |
GreenSky, Inc., Class A (a) | | | 5,797 | | | | 26,840 | | |
Ichor Holdings Ltd. (a) | | | 997 | | | | 30,055 | | |
Insight Enterprises, Inc. (a) | | | 641 | | | | 48,774 | | |
InterDigital, Inc. | | | 621 | | | | 37,682 | | |
Knowles Corp. (a) | | | 3,021 | | | | 55,677 | | |
Methode Electronics, Inc. | | | 1,502 | | | | 57,497 | | |
MicroStrategy, Inc. (a) | | | 346 | | | | 134,438 | | |
Mitek Systems, Inc. (a) | | | 3,533 | | | | 62,817 | | |
MTS Systems Corp. | | | 1,008 | | | | 58,625 | | |
NCR Corp. (a) | | | 1,206 | | | | 45,310 | | |
NETGEAR, Inc. (a) | | | 1,214 | | | | 49,325 | | |
NetScout Systems, Inc. (a) | | | 1,825 | | | | 50,042 | | |
NIC, Inc. | | | 2,608 | | | | 67,365 | | |
OneSpan, Inc. (a) | | | 1,330 | | | | 27,504 | | |
OSI Systems, Inc. (a) | | | 626 | | | | 58,356 | | |
PC Connection, Inc. | | | 856 | | | | 40,480 | | |
Perficient, Inc. (a) | | | 643 | | | | 30,639 | | |
Photronics, Inc. (a) | | | 3,734 | | | | 41,671 | | |
Plexus Corp. (a) | | | 498 | | | | 38,949 | | |
Progress Software Corp. | | | 1,478 | | | | 66,791 | | |
Rogers Corp. (a) | | | 315 | | | | 48,916 | | |
Sanmina Corp. (a) | | | 1,353 | | | | 43,147 | | |
SPS Commerce, Inc. (a) | | | 581 | | | | 63,091 | | |
SunPower Corp. (a) (b) | | | 2,088 | | | | 53,536 | | |
See notes to financial statements.
30
Victory Portfolios II
VictoryShares US Small Cap Volatility Wtd ETF | | Schedule of Portfolio Investments — continued
December 31, 2020 | |
(Unaudited)
Security Description | | Shares | | Value | |
Super Micro Computer, Inc. (a) | | | 1,290 | | | $ | 40,841 | | |
Sykes Enterprises, Inc. (a) | | | 1,244 | | | | 46,861 | | |
Synaptics, Inc. (a) | | | 400 | | | | 38,560 | | |
Teradata Corp. (a) | | | 1,806 | | | | 40,581 | | |
TTEC Holdings, Inc. | | | 704 | | | | 51,343 | | |
Ultra Clean Holdings, Inc. (a) | | | 1,141 | | | | 35,542 | | |
Verra Mobility Corp. (a) | | | 2,912 | | | | 39,079 | | |
Vishay Intertechnology, Inc. | | | 2,323 | | | | 48,109 | | |
| | | | 2,590,911 | | |
Materials (7.0%): | |
Avient Corp. | | | 1,058 | | | | 42,616 | | |
Boise Cascade Co. | | | 728 | | | | 34,798 | | |
Cabot Corp. | | | 943 | | | | 42,322 | | |
Carpenter Technology Corp. | | | 1,253 | | | | 36,487 | | |
Chase Corp. | | | 297 | | | | 30,000 | | |
Clearwater Paper Corp. (a) | | | 693 | | | | 26,161 | | |
Cleveland-Cliffs, Inc. | | | 4,023 | | | | 58,576 | | |
Commercial Metals Co. | | | 1,696 | | | | 34,836 | | |
Compass Minerals International, Inc. | | | 699 | | | | 43,142 | | |
Domtar Corp. | | | 1,043 | | | | 33,011 | | |
Element Solutions, Inc. | | | 3,654 | | | | 64,785 | | |
Forterra, Inc. (a) | | | 1,525 | | | | 26,222 | | |
Futurefuel Corp. | | | 3,027 | | | | 38,443 | | |
GCP Applied Technologies, Inc. (a) | | | 1,295 | | | | 30,627 | | |
Greif, Inc., Class A | | | 934 | | | | 43,786 | | |
H.B. Fuller Co. | | | 813 | | | | 42,178 | | |
Hawkins, Inc. | | | 768 | | | | 40,174 | | |
Ingevity Corp. (a) | | | 551 | | | | 41,727 | | |
Innospec, Inc. | | | 496 | | | | 45,002 | | |
Kaiser Aluminum Corp. | | | 551 | | | | 54,494 | | |
Koppers Holdings, Inc. (a) | | | 842 | | | | 26,237 | | |
Livent Corp. (a) (b) | | | 2,971 | | | | 55,974 | | |
Materion Corp. | | | 646 | | | | 41,163 | | |
Minerals Technologies, Inc. | | | 658 | | | | 40,875 | | |
Myers Industries, Inc. | | | 1,756 | | | | 36,490 | | |
Orion Engineered Carbons SA | | | 2,224 | | | | 38,119 | | |
PQ Group Holdings, Inc. | | | 3,649 | | | | 52,035 | | |
Schnitzer Steel Industries, Inc. | | | 1,682 | | | | 53,673 | | |
Schweitzer-Mauduit International, Inc. | | | 1,226 | | | | 49,298 | | |
Sensient Technologies Corp. | | | 906 | | | | 66,835 | | |
Stepan Co. | | | 339 | | | | 40,449 | | |
Summit Materials, Inc., Class A (a) | | | 1,430 | | | | 28,715 | | |
Tredegar Corp. | | | 2,711 | | | | 45,274 | | |
W.R. Grace & Co. | | | 949 | | | | 52,024 | | |
Warrior Met Coal, Inc. | | | 1,748 | | | | 37,267 | | |
Worthington Industries, Inc. | | | 742 | | | | 38,094 | | |
| | | | 1,511,909 | | |
See notes to financial statements.
31
Victory Portfolios II
VictoryShares US Small Cap Volatility Wtd ETF | | Schedule of Portfolio Investments — continued
December 31, 2020 | |
(Unaudited)
Security Description | | Shares | | Value | |
Real Estate (1.4%): | |
Forestar Group, Inc. (a) | | | 1,988 | | | $ | 40,118 | | |
Kennedy-Wilson Holdings, Inc. | | | 2,603 | | | | 46,568 | | |
Marcus & Millichap, Inc. (a) | | | 1,262 | | | | 46,984 | | |
Newmark Group, Inc., Class A | | | 3,775 | | | | 27,520 | | |
The RMR Group, Inc., Class A | | | 1,370 | | | | 52,909 | | |
The St. Joe Co. | | | 2,053 | | | | 87,150 | | |
| | | | 301,249 | | |
Utilities (3.2%): | |
ALLETE, Inc. | | | 746 | | | | 46,207 | | |
American States Water Co. | | | 527 | | | | 41,902 | | |
Avista Corp. | | | 1,079 | | | | 43,311 | | |
California Water Service Group | | | 886 | | | | 47,871 | | |
Chesapeake Utilities Corp. | | | 511 | | | | 55,296 | | |
MGE Energy, Inc. | | | 559 | | | | 39,147 | | |
Middlesex Water Co. | | | 674 | | | | 48,845 | | |
New Jersey Resources Corp. | | | 1,095 | | | | 38,927 | | |
Northwest Natural Holding Co. | | | 684 | | | | 31,457 | | |
NorthWestern Corp. | | | 765 | | | | 44,608 | | |
Otter Tail Corp. | | | 919 | | | | 39,159 | | |
SJW Group | | | 587 | | | | 40,714 | | |
South Jersey Industries, Inc. | | | 1,773 | | | | 38,208 | | |
Spire, Inc. | | | 728 | | | | 46,621 | | |
The York Water Co. | | | 807 | | | | 37,606 | | |
Unitil Corp. | | | 990 | | | | 43,827 | | |
| | | | 683,706 | | |
Total Common Stocks (Cost $17,924,680) | | | 21,454,074 | | |
Collateral for Securities Loaned^ (1.6%) | |
BlackRock Liquidity Funds TempFund Portfolio, Institutional Class, 0.08% (d) | | | 5,977 | | | | 5,977 | | |
Fidelity Investments Money Market Government Portfolio I Shares, 0.01% (d) | | | 205,362 | | | | 205,362 | | |
Goldman Sachs Financial Square Prime Obligations Fund, Institutional Class,
0.04% (d) | | | 2,983 | | | | 2,983 | | |
JPMorgan Prime Money Market Fund, Capital Class, 0.12% (d) | | | 23,786 | | | | 23,786 | | |
Morgan Stanley Institutional Liquidity Prime Portfolio, Institutional Class,
0.09% (d) | | | 106,946 | | | | 106,946 | | |
Total Collateral for Securities Loaned (Cost $345,054) | | | 345,054 | | |
Total Investments (Cost $18,269,734) — 101.1% | | | 21,799,128 | | |
Liabilities in excess of other assets — (1.1)% | | | (253,236 | ) | |
NET ASSETS — 100.00% | | $ | 21,545,892 | | |
^ Purchased with cash collateral from securities on loan.
(a) Non-income producing security.
(b) All or a portion of this security is on loan.
(c) Affiliated security (See Note 8).
(d) Rate disclosed is the daily yield on December 31, 2020.
See notes to financial statements.
32
Victory Portfolios II
VictoryShares US Small Cap Volatility Wtd ETF | | Schedule of Portfolio Investments — continued
December 31, 2020 | |
(Unaudited)
PLC — Public Limited Company
Futures Contracts Purchased
| | | Number of
Contracts | | Expiration
Date | | Notional
Amount | | Value | | Unrealized
Appreciation
(Depreciation) | |
E-Mini Russell 2000 Index Futures | | | 1 | | | 3/19/21 | | $ | 95,082 | | | $ | 98,740 | | | $ | 3,658 | | |
| | | Total unrealized appreciation | | | | | | | | $ | 3,658 | | |
| | | Total unrealized depreciation | | | | | | | | | — | | |
| | | Total net unrealized appreciation (depreciation) | | | | | | | | $ | 3,658 | | |
See notes to financial statements.
33
Victory Portfolios II
VictoryShares International Volatility Wtd ETF | | Schedule of Portfolio Investments
December 31, 2020 | |
(Unaudited)
Security Description | | Shares | | Value | |
Common Stocks (99.8%) | |
Australia (4.3%): | |
Communication Services (0.4%): | |
REA Group Ltd. | | | 1,815 | | | $ | 208,256 | | |
Telstra Corp. Ltd. | | | 122,859 | | | | 282,206 | | |
| | | | 490,462 | | |
Consumer Discretionary (0.1%): | |
Aristocrat Leisure Ltd. | | | 6,280 | | | | 150,060 | | |
Consumer Staples (0.7%): | |
Coles Group Ltd. | | | 18,759 | | | | 262,295 | | |
Wesfarmers Ltd. | | | 6,128 | | | | 238,063 | | |
Woolworths Group Ltd. | | | 8,730 | | | | 264,521 | | |
| | | | 764,879 | | |
Financials (1.6%): | |
ASX Ltd. | | | 3,762 | | | | 208,782 | | |
Australia & New Zealand Banking Group Ltd. | | | 11,419 | | | | 199,801 | | |
Commonwealth Bank of Australia | | | 3,589 | | | | 227,150 | | |
Insurance Australia Group Ltd. | | | 62,415 | | | | 226,115 | | |
Macquarie Group Ltd. | | | 1,664 | | | | 177,616 | | |
Magellan Financial Group Ltd. | | | 2,958 | | | | 122,347 | | |
National Australia Bank Ltd. | | | 12,403 | | | | 216,062 | | |
Suncorp Group Ltd. | | | 24,027 | | | | 180,385 | | |
Westpac Banking Corp. | | | 12,590 | | | | 187,974 | | |
| | | | 1,746,232 | | |
Health Care (0.5%): | |
CSL Ltd. | | | 861 | | | | 187,935 | | |
Ramsay Health Care Ltd. | | | 3,569 | | | | 171,057 | | |
Sonic Healthcare Ltd. | | | 8,233 | | | | 204,024 | | |
| | | | 563,016 | | |
Industrials (0.2%): | |
Brambles Ltd. | | | 27,836 | | | | 227,434 | | |
Materials (0.8%): | |
BHP Group Ltd. | | | 6,850 | | | | 224,030 | | |
Fortescue Metals Group Ltd. | | | 12,269 | | | | 221,577 | | |
Newcrest Mining Ltd. | | | 6,881 | | | | 136,734 | | |
Rio Tinto Ltd. | | | 3,469 | | | | 304,372 | | |
| | | | 886,713 | | |
| | | | 4,828,796 | | |
Austria (0.5%): | |
Energy (0.1%): | |
OMV AG | | | 3,784 | | | | 152,530 | | |
Financials (0.2%): | |
Erste Group Bank AG (a) | | | 5,860 | | | | 178,519 | | |
See notes to financial statements.
34
Victory Portfolios II
VictoryShares International Volatility Wtd ETF | | Schedule of Portfolio Investments — continued
December 31, 2020 | |
(Unaudited)
Security Description | | Shares | | Value | |
Utilities (0.2%): | |
Verbund AG | | | 2,731 | | | $ | 233,013 | | |
| | | | 564,062 | | |
Belgium (1.3%): | |
Consumer Staples (0.2%): | |
Etablissements Franz Colruyt | | | 2,826 | | | | 167,315 | | |
Financials (0.7%): | |
Ageas SA/NV | | | 3,478 | | | | 185,143 | | |
Groupe Bruxelles Lambert SA | | | 2,095 | | | | 211,171 | | |
KBC Group NV (a) | | | 2,357 | | | | 164,913 | | |
Sofina SA | | | 724 | | | | 244,968 | | |
| | | | 806,195 | | |
Health Care (0.2%): | |
Galapagos NV (a) | | | 1,002 | | | | 98,502 | | |
UCB SA | | | 1,615 | | | | 166,655 | | |
| | | | 265,157 | | |
Materials (0.2%): | |
Umicore SA | | | 3,486 | | | | 167,302 | | |
| | | | 1,405,969 | | |
Canada (7.6%): | |
Communication Services (0.7%): | |
BCE, Inc. (b) | | | 4,972 | | | | 212,639 | | |
Rogers Communications, Inc. | | | 4,683 | | | | 218,052 | | |
Shaw Communications, Inc., Class B (b) | | | 10,621 | | | | 186,433 | | |
TELUS Corp. (b) (c) | | | 11,273 | | | | 223,299 | | |
| | | | 840,423 | | |
Consumer Discretionary (0.4%): | |
Dollarama, Inc. | | | 5,879 | | | | 239,650 | | |
Restaurant Brands International, Inc. | | | 2,547 | | | | 155,758 | | |
| | | | 395,408 | | |
Consumer Staples (1.1%): | |
Alimentation Couche-Tard, Inc., Class B | | | 5,916 | | | | 201,647 | | |
George Weston Ltd. (c) | | | 3,002 | | | | 224,272 | | |
Loblaw Cos. Ltd. | | | 4,535 | | | | 223,810 | | |
Metro, Inc. | | | 6,286 | | | | 280,541 | | |
Saputo, Inc. (c) | | | 8,879 | | | | 248,573 | | |
| | | | 1,178,843 | | |
Energy (0.4%): | |
Canadian Natural Resources Ltd. | | | 4,809 | | | | 115,587 | | |
Enbridge, Inc. | | | 4,846 | | | | 155,009 | | |
Pembina Pipeline Corp. (c) | | | 3,555 | | | | 84,078 | | |
TC Energy Corp. | | | 3,165 | | | | 128,694 | | |
| | | | 483,368 | | |
See notes to financial statements.
35
Victory Portfolios II
VictoryShares International Volatility Wtd ETF | | Schedule of Portfolio Investments — continued
December 31, 2020 | |
(Unaudited)
Security Description | | Shares | | Value | |
Financials (2.0%): | |
Bank of Montreal | | | 2,378 | | | $ | 180,830 | | |
Brookfield Asset Management, Inc., Class A (c) | | | 4,301 | | | | 177,826 | | |
Canadian Imperial Bank of Commerce | | | 2,093 | | | | 178,794 | | |
Great-West Lifeco, Inc. | | | 7,178 | | | | 171,173 | | |
Intact Financial Corp. | | | 1,973 | | | | 233,653 | | |
Manulife Financial Corp. | | | 9,314 | | | | 165,759 | | |
National Bank of Canada | | | 2,611 | | | | 146,973 | | |
Power Corp. of Canada (c) | | | 6,241 | | | | 143,337 | | |
Royal Bank of Canada | | | 2,470 | | | | 202,984 | | |
Sun Life Financial, Inc. | | | 4,248 | | | | 188,919 | | |
The Bank of Nova Scotia | | | 3,995 | | | | 215,963 | | |
The Toronto-Dominion Bank | | | 3,422 | | | | 193,376 | | |
| | | | 2,199,587 | | |
Industrials (0.8%): | |
Canadian National Railway Co. | | | 2,119 | | | | 232,995 | | |
Canadian Pacific Railway Ltd. (c) | | | 621 | | | | 215,440 | | |
Thomson Reuters Corp. | | | 3,259 | | | | 266,773 | | |
Waste Connections, Inc. | | | 2,247 | | | | 230,438 | | |
| | | | 945,646 | | |
Information Technology (0.6%): | |
CGI, Inc. (a) | | | 3,283 | | | | 260,509 | | |
Constellation Software, Inc. | | | 200 | | | | 259,750 | | |
Open Text Corp. | | | 4,583 | | | | 208,282 | | |
Topicus.com, Inc. (a) (d) (f) | | | 372 | �� | | | 1,407 | | |
| | | | 729,948 | | |
Materials (0.8%): | |
Aginco Eagle Mines Ltd. | | | 1,760 | | | | 123,893 | | |
Barrick Gold Corp. | | | 5,204 | | | | 118,579 | | |
Franco-Nevada Corp. | | | 1,169 | | | | 146,596 | | |
Kinross Gold Corp. | | | 13,128 | | | | 96,343 | | |
Kirkland Lake Gold Ltd. (b) (c) | | | 2,259 | | | | 93,363 | | |
Nutrien Ltd. | | | 4,612 | | | | 221,921 | | |
Wheaton Precious Metals Corp. (c) | | | 3,098 | | | | 129,402 | | |
| | | | 930,097 | | |
Utilities (0.8%): | |
Algonquin Power & Utilities Corp. (c) | | | 11,871 | | | | 195,409 | | |
Emera, Inc. | | | 4,958 | | | | 210,755 | | |
Fortis, Inc. | | | 5,011 | | | | 204,739 | | |
Hydro One Ltd. (e) | | | 11,318 | | | | 254,782 | | |
| | | | 865,685 | | |
| | | | 8,569,005 | | |
Denmark (2.9%): | |
Consumer Staples (0.2%): | |
Carlsberg A/S, Class B | | | 1,747 | | | | 279,685 | | |
See notes to financial statements.
36
Victory Portfolios II
VictoryShares International Volatility Wtd ETF | | Schedule of Portfolio Investments — continued
December 31, 2020 | |
(Unaudited)
Security Description | | Shares | | Value | |
Financials (0.4%): | |
Danske Bank A/S | | | 12,042 | | | $ | 198,974 | | |
Tryg A/S | | | 7,950 | | | | 250,713 | | |
| | | | 449,687 | | |
Health Care (0.9%): | |
Coloplast A/S, Class B | | | 1,555 | | | | 237,306 | | |
Genmab A/S (a) | | | 537 | | | | 217,131 | | |
GN Store Nord A/S | | | 2,576 | | | | 206,033 | | |
Novo Nordisk A/S, Class B | | | 4,526 | | | | 317,007 | | |
| | | | 977,477 | | |
Industrials (0.7%): | |
AP Moller - Maersk A/S, Class B | | | 105 | | | | 234,343 | | |
DSV PANALPINA A/S | | | 1,217 | | | | 203,786 | | |
Vestas Wind Systems A/S | | | 1,242 | | | | 293,505 | | |
| | | | 731,634 | | |
Materials (0.4%): | |
Christian Hansen Holding A/S (a) | | | 2,104 | | | | 216,362 | | |
Novozymes A/S, B Shares | | | 4,365 | | | | 250,446 | | |
| | | | 466,808 | | |
Utilities (0.3%): | |
Orsted A/S (e) | | | 1,695 | | | | 346,018 | | |
| | | | 3,251,309 | | |
Finland (2.0%): | |
Communication Services (0.2%): | |
Elisa Oyj | | | 3,915 | | | | 214,575 | | |
Consumer Staples (0.2%): | |
Kesko Oyj, Class B | | | 8,720 | | | | 224,106 | | |
Energy (0.2%): | |
Neste Oyj | | | 2,909 | | | | 210,215 | | |
Financials (0.3%): | |
Nordea Bank Abp (a) | | | 23,498 | | | | 192,069 | | |
Sampo Oyj, Class A | | | 4,015 | | | | 169,541 | | |
| | | | 361,610 | | |
Industrials (0.3%): | |
Kone Oyj, Class B | | | 3,561 | | | | 289,083 | | |
Information Technology (0.1%): | |
Nokia Oyj (a) | | | 34,758 | | | | 133,781 | | |
Materials (0.5%): | |
Stora Enso Oyj, Class R | | | 13,188 | | | | 252,026 | | |
UPM-Kymmene Oyj | | | 7,668 | | | | 285,395 | | |
| | | | 537,421 | | |
See notes to financial statements.
37
Victory Portfolios II
VictoryShares International Volatility Wtd ETF | | Schedule of Portfolio Investments — continued
December 31, 2020 | |
(Unaudited)
Security Description | | Shares | | Value | |
Utilities (0.2%): | |
Fortum Oyj | | | 9,112 | | | $ | 219,266 | | |
| | | | 2,190,057 | | |
France (8.0%): | |
Communication Services (0.8%): | |
Iliad SA | | | 922 | | | | 189,317 | | |
Orange SA | | | 21,973 | | | | 261,259 | | |
Publicis Groupe SA | | | 4,272 | | | | 212,695 | | |
Vivendi SA | | | 7,735 | | | | 249,245 | | |
| | | | 912,516 | | |
Consumer Discretionary (1.2%): | |
Cie Generale des Etablissements Michelin SCA | | | 1,650 | | | | 211,523 | | |
Hermes International | | | 284 | | | | 305,137 | | |
Kering SA | | | 300 | | | | 217,816 | | |
LVMH Moet Hennessy Louis Vuitton SE | | | 457 | | | | 285,196 | | |
SEB SA | | | 1,115 | | | | 202,933 | | |
Sodexo SA | | | 2,048 | | | | 173,162 | | |
| | | | 1,395,767 | | |
Consumer Staples (1.2%): | |
Carrefour SA | | | 13,270 | | | | 227,415 | | |
Danone SA | | | 4,115 | | | | 270,222 | | |
L'Oreal SA | | | 749 | | | | 284,350 | | |
Pernod Ricard SA | | | 1,648 | | | | 315,642 | | |
Remy Cointreau SA | | | 1,159 | | | | 215,613 | | |
| | | | 1,313,242 | | |
Financials (0.9%): | |
Amundi SA (e) | | | 2,212 | | | | 180,490 | | |
AXA SA | | | 7,998 | | | | 190,623 | | |
BNP Paribas SA (a) | | | 3,277 | | | | 172,542 | | |
CNP Assurances | | | 7,609 | | | | 122,499 | | |
Credit Agricole SA | | | 13,973 | | | | 176,141 | | |
Natixis SA (a) | | | 32,513 | | | | 110,764 | | |
| | | | 953,059 | | |
Health Care (0.5%): | |
BioMerieux | | | 1,112 | | | | 156,748 | | |
Sanofi | | | 2,894 | | | | 278,205 | | |
Sartorius Stedim Biotech | | | 473 | | | | 168,245 | | |
| | | | 603,198 | | |
Industrials (2.3%): | |
Alstom SA (a) | | | 3,428 | | | | 195,169 | | |
Bollore SA | | | 44,748 | | | | 184,858 | | |
Bouygues SA | | | 3,555 | | | | 146,122 | | |
Bureau Veritas SA | | | 8,891 | | | | 236,320 | | |
Cie de Saint-Gobain (a) | | | 3,862 | | | | 176,903 | | |
Edenred | | | 3,521 | | | | 199,604 | | |
Eiffage SA | | | 1,676 | | | | 161,812 | | |
See notes to financial statements.
38
Victory Portfolios II
VictoryShares International Volatility Wtd ETF | | Schedule of Portfolio Investments — continued
December 31, 2020 | |
(Unaudited)
Security Description | | Shares | | Value | |
Getlink SE | | | 10,950 | | | $ | 189,662 | | |
Legrand SA | | | 2,311 | | | | 206,070 | | |
Safran SA (a) | | | 892 | | | | 126,336 | | |
Schneider Electric SE | | | 1,542 | | | | 222,823 | | |
Teleperformance | | | 556 | | | | 184,253 | | |
Thales SA | | | 2,161 | | | | 197,710 | | |
Vinci SA | | | 1,525 | | | | 151,556 | | |
| | | | 2,579,198 | | |
Information Technology (0.5%): | |
Atos SE (a) | | | 2,165 | | | | 197,758 | | |
Capgemini SE | | | 1,228 | | | | 190,199 | | |
Dassault Systemes SA | | | 1,043 | | | | 211,678 | | |
| | | | 599,635 | | |
Materials (0.4%): | |
Air Liquide SA | | | 1,465 | | | | 240,239 | | |
Arkema SA | | | 1,492 | | | | 170,401 | | |
| | | | 410,640 | | |
Utilities (0.2%): | |
Veolia Environnement SA | | | 7,635 | | | | 186,615 | | |
| | | | 8,953,870 | | |
Germany (7.3%): | |
Communication Services (0.6%): | |
Deutsche Telekom AG | | | 14,039 | | | | 256,456 | | |
Scout24 AG (e) | | | 3,031 | | | | 248,242 | | |
United Internet AG, Registered Shares | | | 4,722 | | | | 198,589 | | |
| | | | 703,287 | | |
Consumer Discretionary (0.8%): | |
adidas AG (a) | | | 598 | | | | 217,602 | | |
Bayerische Motoren Werke AG | | | 2,261 | | | | 199,485 | | |
Puma SE (a) | | | 1,862 | | | | 209,883 | | |
Zalando SE (a) (e) | | | 2,038 | | | | 226,685 | | |
| | | | 853,655 | | |
Consumer Staples (0.2%): | |
Beiersdorf AG | | | 2,496 | | | | 287,933 | | |
Financials (0.8%): | |
Allianz SE | | | 798 | | | | 195,633 | | |
Deutsche Boerse AG | | | 1,110 | | | | 188,803 | | |
Hannover Rueck SE | | | 1,059 | | | | 168,551 | | |
Muenchener Rueckversicherungs-Gesellschaft AG, Class R | | | 561 | | | | 166,381 | | |
Talanx AG | | | 4,236 | | | | 164,334 | | |
| | | | 883,702 | | |
Health Care (0.9%): | |
Carl Zeiss Meditec AG | | | 1,596 | | | | 212,301 | | |
Fresenius Medical Care AG & Co. KGaA | | | 3,385 | | | | 281,990 | | |
See notes to financial statements.
39
Victory Portfolios II
VictoryShares International Volatility Wtd ETF | | Schedule of Portfolio Investments — continued
December 31, 2020 | |
(Unaudited)
Security Description | | Shares | | Value | |
Fresenius SE & Co. KGaA | | | 4,086 | | | $ | 188,860 | | |
Merck KGaA | | | 1,766 | | | | 302,757 | | |
| | | | 985,908 | | |
Industrials (0.9%): | |
Brenntag AG | | | 3,028 | | | | 234,275 | | |
Deutsche Post AG, Registered Shares | | | 4,138 | | | | 204,709 | | |
KION Group AG | | | 1,886 | | | | 163,934 | | |
MTU Aero Engines AG | | | 599 | | | | 156,139 | | |
Siemens AG, Registered Shares | | | 1,468 | | | | 210,731 | | |
| | | | 969,788 | | |
Information Technology (0.8%): | |
Bechtle AG | | | 1,000 | | | | 217,914 | | |
Infineon Technologies AG | | | 5,024 | | | | 192,634 | | |
Nemetschek SE | | | 1,991 | | | | 146,892 | | |
SAP SE | | | 1,373 | | | | 179,820 | | |
TeamViewer AG (a) (e) | | | 2,775 | | | | 148,568 | | |
| | | | 885,828 | | |
Materials (1.0%): | |
BASF SE | | | 2,950 | | | | 233,212 | | |
Covestro AG (e) | | | 3,814 | | | | 235,175 | | |
Evonik Industries AG | | | 6,180 | | | | 201,403 | | |
HeidelbergCement AG | | | 2,436 | | | | 182,164 | | |
Symrise AG | | | 1,922 | | | | 254,492 | | |
| | | | 1,106,446 | | |
Real Estate (0.7%): | |
Deutsche Wohnen SE | | | 5,615 | | | | 299,656 | | |
LEG Immobilien AG | | | 1,582 | | | | 245,531 | | |
Vonovia SE | | | 3,514 | | | | 256,510 | | |
| | | | 801,697 | | |
Utilities (0.6%): | |
E.ON SE | | | 21,027 | | | | 232,803 | | |
RWE AG | | | 4,877 | | | | 205,941 | | |
Uniper SE | | | 7,533 | | | | 259,851 | | |
| | | | 698,595 | | |
| | | | 8,176,839 | | |
Hong Kong (4.4%): | |
Consumer Discretionary (0.3%): | |
Galaxy Entertainment Group Ltd. | | | 22,484 | | | | 174,745 | | |
Techtronic Industries Co. Ltd. | | | 12,416 | | | | 177,138 | | |
| | | | 351,883 | | |
Consumer Staples (0.3%): | |
Sun Art Retail Group Ltd. | | | 147,410 | | | | 149,840 | | |
WH Group Ltd. (e) | | | 222,768 | | | | 186,785 | | |
| | | | 336,625 | | |
See notes to financial statements.
40
Victory Portfolios II
VictoryShares International Volatility Wtd ETF | | Schedule of Portfolio Investments — continued
December 31, 2020 | |
(Unaudited)
Security Description | | Shares | | Value | |
Financials (0.7%): | |
AIA Group Ltd. | | | 22,236 | | | $ | 272,493 | | |
Hang Seng Bank Ltd. | | | 17,108 | | | | 295,057 | | |
Hong Kong Exchanges and Clearing Ltd. | | | 4,734 | | | | 259,533 | | |
| | | | 827,083 | | |
Health Care (0.1%): | |
Sino Biopharmaceutical Ltd. | | | 164,318 | | | | 158,972 | | |
Industrials (0.5%): | |
CK Hutchison Holdings Ltd. | | | 35,900 | | | | 250,534 | | |
MTR Corp. Ltd. | | | 57,926 | | | | 323,920 | | |
| | | | 574,454 | | |
Real Estate (1.4%): | |
CK Asset Holdings Ltd. | | | 39,505 | | | | 202,820 | | |
Hang Lung Properties Ltd. | | | 83,276 | | | | 219,679 | | |
Henderson Land Development Co. Ltd. | | | 70,790 | | | | 276,231 | | |
New World Development Co. Ltd. | | | 45,044 | | | | 209,758 | | |
Shimao Group Holdings Ltd. | | | 39,428 | | | | 125,625 | | |
Sino Land Co. Ltd. | | | 200,620 | | | | 261,379 | | |
Sun Hung Kai Properties Ltd. | | | 20,840 | | | | 268,827 | | |
| | | | 1,564,319 | | |
Utilities (1.1%): | |
CK Infrastructure Holdings Ltd. | | | 43,264 | | | | 232,443 | | |
CLP Holdings Ltd. | | | 37,014 | | | | 342,342 | | |
Hong Kong and China Gas Co. Ltd. | | | 208,952 | | | | 312,126 | | |
Power Assets Holdings Ltd. (b) | | | 51,808 | | | | 280,686 | | |
| | | | 1,167,597 | | |
| | | | 4,980,933 | | |
Ireland (1.4%): | |
Consumer Discretionary (0.2%): | |
Flutter Entertainment PLC | | | 958 | | | | 197,921 | | |
Consumer Staples (0.2%): | |
Kerry Group PLC | | | 1,915 | | | | 285,144 | | |
Industrials (0.6%): | |
DCC PLC | | | 2,141 | | | | 151,580 | | |
Experian PLC | | | 4,988 | | | | 189,393 | | |
Kingspan Group PLC (a) | | | 2,115 | | | | 156,687 | | |
Ryanair Holdings PLC, ADR (a) | | | 1,872 | | | | 205,883 | | |
| | | | 703,543 | | |
Materials (0.4%): | |
CRH PLC | | | 4,237 | | | | 180,262 | | |
Smurfit Kappa Group PLC | | | 4,918 | | | | 231,281 | | |
| | | | 411,543 | | |
| | | | 1,598,151 | | |
See notes to financial statements.
41
Victory Portfolios II
VictoryShares International Volatility Wtd ETF | | Schedule of Portfolio Investments — continued
December 31, 2020 | |
(Unaudited)
Security Description | | Shares | | Value | |
Israel (0.6%): | |
Financials (0.2%): | |
Bank Hapoalim BM | | | 35,434 | | | $ | 242,702 | | |
Isracard Ltd. | | | 1 | | | | 3 | | |
| | | | 242,705 | | |
Health Care (0.1%): | |
Teva Pharmaceutical Industries Ltd. (a) | | | 13,565 | | | | 129,080 | | |
Information Technology (0.3%): | |
Nice Ltd. (a) | | | 889 | | | | 249,213 | | |
| | | | 620,998 | | |
Italy (2.4%): | |
Communication Services (0.4%): | |
Infrastrutture Wireless Italiane SpA (e) | | | 20,511 | | | | 248,786 | | |
Telecom Italia SpA | | | 309,144 | | | | 142,513 | | |
| | | | 391,299 | | |
Consumer Discretionary (0.3%): | |
Moncler SpA | | | 4,477 | | | | 274,197 | | |
Energy (0.2%): | |
Snam SpA | | | 35,433 | | | | 199,137 | | |
Financials (0.7%): | |
Assicurazioni Generali SpA | | | 14,410 | | | | 251,001 | | |
FinecoBank Banca Fineco SpA (a) | | | 10,956 | | | | 179,328 | | |
Intesa Sanpaolo SpA (a) | | | 79,184 | | | | 184,992 | | |
Poste Italiane SpA (e) | | | 17,660 | | | | 179,475 | | |
| | | | 794,796 | | |
Health Care (0.3%): | |
DiaSorin SpA | | | 921 | | | | 191,361 | | |
Recordati Industria Chimica e Farmaceutica SpA | | | 3,348 | | | | 185,380 | | |
| | | | 376,741 | | |
Information Technology (0.1%): | |
Nexi SpA (a) (e) | | | 7,844 | | | | 156,560 | | |
Utilities (0.4%): | |
Enel SpA | | | 22,074 | | | | 223,148 | | |
Terna Rete Elettrica Nazionale SpA | | | 29,046 | | | | 221,747 | | |
| | | | 444,895 | | |
| | | | 2,637,625 | | |
Japan (20.0%): | |
Communication Services (1.5%): | |
KDDI Corp. | | | 9,100 | | | | 270,250 | | |
Nexon Co. Ltd. | | | 7,100 | | | | 218,694 | | |
Nintendo Co. Ltd. (b) | | | 600 | | | | 382,584 | | |
Nippon Telegraph & Telephone Corp. | | | 12,900 | | | | 330,560 | | |
See notes to financial statements.
42
Victory Portfolios II
VictoryShares International Volatility Wtd ETF | | Schedule of Portfolio Investments — continued
December 31, 2020 | |
(Unaudited)
Security Description | | Shares | | Value | |
Softbank Corp. | | | 28,900 | | | $ | 361,950 | | |
Z Holdings Corp. | | | 23,400 | | | | 141,524 | | |
| | | | 1,705,562 | | |
Consumer Discretionary (3.4%): | |
Bandai Namco Holdings, Inc. | | | 3,900 | | | | 337,189 | | |
Bridgestone Corp. | | | 8,500 | | | | 278,613 | | |
Fast Retailing Co. Ltd. | | | 300 | | | | 268,704 | | |
Honda Motor Co. Ltd. | | | 6,800 | | | | 189,529 | | |
Nitori Holdings Co. Ltd. | | | 1,300 | | | | 272,240 | | |
Oriental Land Co. Ltd. | | | 1,700 | | | | 280,589 | | |
Pan Pacific International Holdings Corp. | | | 9,200 | | | | 212,801 | | |
Panasonic Corp. | | | 19,800 | | | | 228,321 | | |
Sekisui House Ltd. | | | 11,900 | | | | 242,057 | | |
Shimano, Inc. | | | 1,100 | | | | 256,621 | | |
Sony Corp. | | | 3,300 | | | | 328,753 | | |
Subaru Corp. | | | 8,900 | | | | 177,802 | | |
Suzuki Motor Corp. | | | 3,500 | | | | 162,118 | | |
Toyota Industries Corp. | | | 4,000 | | | | 317,319 | | |
Toyota Motor Corp. | | | 3,900 | | | | 300,584 | | |
| | | | 3,853,240 | | |
Consumer Staples (1.5%): | |
Asahi Group Holdings Ltd. | | | 6,200 | | | | 254,870 | | |
Japan Tobacco, Inc. | | | 16,900 | | | | 344,090 | | |
Kao Corp. | | | 3,600 | | | | 277,916 | | |
Kirin Holdings Co. Ltd. | | | 11,100 | | | | 261,695 | | |
Seven & i Holdings Co. Ltd. | | | 6,200 | | | | 219,738 | | |
Unicharm Corp. | | | 5,800 | | | | 274,831 | | |
| | | | 1,633,140 | | |
Financials (2.6%): | |
Dai-ichi Life Holdings, Inc. | | | 12,200 | | | | 183,402 | | |
Japan Exchange Group, Inc. | | | 9,500 | | | | 242,745 | | |
Japan Post Bank Co. Ltd. | | | 30,500 | | | | 250,227 | | |
Japan Post Holdings Co. Ltd. | | | 33,200 | | | | 258,165 | | |
Mitsubishi UFJ Financial Group, Inc. | | | 56,500 | | | | 249,609 | | |
Mizuho Financial Group, Inc. | | | 17,470 | | | | 221,252 | | |
MS&AD Insurance Group Holdings, Inc. | | | 11,000 | | | | 334,667 | | |
Nomura Holdings, Inc. | | | 38,200 | | | | 201,656 | | |
ORIX Corp. | | | 15,400 | | | | 236,355 | | |
Sompo Holdings, Inc. | | | 5,300 | | | | 214,228 | | |
Sumitomo Mitsui Financial Group, Inc. | | | 8,500 | | | | 262,476 | | |
Tokio Marine Holdings, Inc. | | | 5,300 | | | | 272,495 | | |
| | | | 2,927,277 | | |
Health Care (3.0%): | |
Astellas Pharma, Inc. | | | 14,400 | | | | 222,332 | | |
Chugai Pharmaceutical Co. Ltd. | | | 5,200 | | | | 277,176 | | |
Daiichi Sankyo Co. Ltd. | | | 6,400 | | | | 219,140 | | |
Eisai Co. Ltd. | | | 2,100 | | | | 149,954 | | |
Hoya Corp. | | | 2,300 | | | | 317,910 | | |
See notes to financial statements.
43
Victory Portfolios II
VictoryShares International Volatility Wtd ETF | | Schedule of Portfolio Investments — continued
December 31, 2020 | |
(Unaudited)
Security Description | | Shares | | Value | |
Kyowa Kirin Co. Ltd. | | | 9,000 | | | $ | 245,312 | | |
M3, Inc. | | | 3,100 | | | | 292,554 | | |
Olympus Corp. | | | 8,100 | | | | 177,040 | | |
Ono Pharmaceutical Co. Ltd. | | | 9,100 | | | | 273,952 | | |
Otsuka Holdings Co. Ltd. | | | 5,200 | | | | 222,526 | | |
Shionogi & Co. Ltd. | | | 4,000 | | | | 218,326 | | |
Sysmex Corp. | | | 2,600 | | | | 312,282 | | |
Takeda Pharmaceutical Co. Ltd. | | | 6,400 | | | | 232,778 | | |
Terumo Corp. | | | 5,300 | | | | 221,364 | | |
| | | | 3,382,646 | | |
Industrials (3.5%): | |
Central Japan Railway Co. | | | 1,500 | | | | 211,982 | | |
Daikin Industries Ltd. | | | 1,300 | | | | 288,609 | | |
FANUC Corp. | | | 1,100 | | | | 270,205 | | |
ITOCHU Corp. | | | 10,900 | | | | 312,937 | | |
Komatsu Ltd. | | | 9,400 | | | | 256,533 | | |
Kubota Corp. | | | 12,700 | | | | 276,905 | | |
Mitsubishi Corp. | | | 12,400 | | | | 305,196 | | |
Mitsubishi Electric Corp. | | | 18,000 | | | | 271,465 | | |
Mitsui & Co. Ltd. | | | 13,100 | | | | 239,756 | | |
Nidec Corp. | | | 2,400 | | | | 301,744 | | |
Recruit Holdings Co. Ltd. | | | 3,900 | | | | 163,230 | | |
Secom Co. Ltd. | | | 3,100 | | | | 285,768 | | |
SG Holdings Co. Ltd. | | | 9,200 | | | | 250,585 | | |
SMC Corp. | | | 400 | | | | 243,898 | | |
Sumitomo Corp. | | | 18,100 | | | | 239,399 | | |
| | | | 3,918,212 | | |
Information Technology (3.3%): | |
Canon, Inc. (c) | | | 12,000 | | | | 229,911 | | |
FUJIFILM Holdings Corp. | | | 4,500 | | | | 237,030 | | |
Fujitsu Ltd. | | | 1,700 | | | | 245,433 | | |
Hitachi Ltd. | | | 5,600 | | | | 220,496 | | |
Keyence Corp. | | | 700 | | | | 393,259 | | |
Kyocera Corp. | | | 4,500 | | | | 275,736 | | |
Murata Manufacturing Co. Ltd. | | | 4,400 | | | | 397,210 | | |
NEC Corp. | | | 3,800 | | | | 203,913 | | |
Nomura Research Institute Ltd. | | | 7,278 | | | | 260,483 | | |
NTT Data Corp. | | | 17,700 | | | | 241,909 | | |
Obic Co. Ltd. | | | 1,200 | | | | 240,953 | | |
Omron Corp. | | | 3,100 | | | | 276,250 | | |
Oracle Corp. | | | 1,900 | | | | 247,530 | | |
Tokyo Electron Ltd. | | | 700 | | | | 260,364 | | |
| | | | 3,730,477 | | |
Materials (0.5%): | |
Nippon Paint Holdings Co. Ltd. | | | 2,200 | | | | 241,437 | | |
Shin-Etsu Chemical Co. Ltd. | | | 1,600 | | | | 279,582 | | |
| | | | 521,019 | | |
See notes to financial statements.
44
Victory Portfolios II
VictoryShares International Volatility Wtd ETF | | Schedule of Portfolio Investments — continued
December 31, 2020 | |
(Unaudited)
Security Description | | Shares | | Value | |
Real Estate (0.7%): | |
Daiwa House Industry Co. Ltd. | | | 7,300 | | | $ | 216,652 | | |
Mitsubishi Estate Co. Ltd. | | | 11,800 | | | | 189,390 | | |
Mitsui Fudosan Co. Ltd. | | | 10,000 | | | | 209,076 | | |
Sumitomo Realty & Development Co. Ltd. | | | 5,200 | | | | 160,221 | | |
| | | | 775,339 | | |
| | | | 22,446,912 | | |
Korea, Republic Of (5.5%): | |
Communication Services (0.7%): | |
NAVER Corp. | | | 701 | | | | 188,770 | | |
NCSoft Corp. | | | 253 | | | | 216,851 | | |
Netmarble Corp. (a) (e) | | | 1,317 | | | | 159,442 | | |
SK Telecom Co. Ltd. | | | 1,317 | | | | 288,571 | | |
| | | | 853,634 | | |
Consumer Discretionary (0.9%): | |
Hyundai Mobis Co. Ltd. | | | 847 | | | | 199,234 | | |
Hyundai Motor Co. | | | 1,004 | | | | 177,470 | | |
Kia Motors Corp. | | | 4,535 | | | | 260,527 | | |
LG Electronics, Inc. | | | 2,700 | | | | 335,574 | | |
| | | | 972,805 | | |
Consumer Staples (0.7%): | |
Amorepacific Corp. | | | 1,254 | | | | 237,823 | | |
KT&G Corp. | | | 3,742 | | | | 286,283 | | |
LG Household & Health Care Ltd. | | | 164 | | | | 244,596 | | |
| | | | 768,702 | | |
Financials (0.5%): | |
KB Financial Group, Inc. | | | 5,044 | | | | 201,537 | | |
Samsung Life Insurance Co. Ltd. | | | 2,622 | | | | 190,941 | | |
Shinhan Financial Group Co. Ltd. | | | 6,847 | | | | 202,031 | | |
| | | | 594,509 | | |
Health Care (0.6%): | |
Celltrion Healthcare Co. Ltd. (a) | | | 1,655 | | | | 248,426 | | |
Celltrion, Inc. (a) | | | 598 | | | | 197,552 | | |
Samsung Biologics Co. Ltd. (a) (e) | | | 247 | | | | 187,831 | | |
| | | | 633,809 | | |
Industrials (0.4%): | |
LG Corp. | | | 2,423 | | | | 195,187 | | |
Samsung C&T Corp. | | | 1,919 | | | | 243,806 | | |
| | | | 438,993 | | |
Information Technology (1.3%): | |
Samsung Electro-Mechanics Co. Ltd. | | | 1,572 | | | | 257,610 | | |
Samsung Electronics Co. Ltd. | | | 5,070 | | | | 378,079 | | |
Samsung SDI Co. Ltd. | | | 361 | | | | 208,717 | | |
See notes to financial statements.
45
Victory Portfolios II
VictoryShares International Volatility Wtd ETF | | Schedule of Portfolio Investments — continued
December 31, 2020 | |
(Unaudited)
Security Description | | Shares | | Value | |
Samsung SDS Co. Ltd. | | | 1,636 | | | $ | 268,851 | | |
SK Hynix, Inc. | | | 3,001 | | | | 327,397 | | |
| | | | 1,440,654 | | |
Materials (0.4%): | |
LG Chem Ltd. | | | 215 | | | | 163,101 | | |
POSCO | | | 1,274 | | | | 319,028 | | |
| | | | 482,129 | | |
| | | | 6,185,235 | | |
Luxembourg (0.3%): | |
Health Care (0.1%): | |
Eurofins Scientific SE (a) | | | 2,206 | | | | 184,932 | | |
Real Estate (0.2%): | |
Aroundtown SA | | | 27,321 | | | | 204,239 | | |
| | | | 389,171 | | |
Macau (0.2%): | |
Consumer Discretionary (0.2%): | |
Sands China Ltd. | | | 41,474 | | | | 182,166 | | |
Netherlands (3.4%): | |
Communication Services (0.2%): | |
Koninklijke KPN NV | | | 82,507 | | | | 250,644 | | |
Consumer Staples (1.0%): | |
Davide Campari-Milano NV | | | 18,446 | | | | 210,446 | | |
Heineken Holding NV | | | 3,015 | | | | 283,760 | | |
Heineken NV | | | 2,819 | | | | 314,106 | | |
Koninklijke Ahold Delhaize NV | | | 9,608 | | | | 271,221 | | |
| | | | 1,079,533 | | |
Financials (0.6%): | |
ABN AMRO Bank NV (a) (e) | | | 12,970 | | | | 127,059 | | |
Euronext NV (e) | | | 1,592 | | | | 175,307 | | |
ING Groep NV (a) | | | 15,352 | | | | 143,287 | | |
NN Group NV | | | 4,341 | | | | 188,398 | | |
| | | | 634,051 | | |
Health Care (0.2%): | |
Koninklijke Philips NV | | | 4,948 | | | | 264,604 | | |
Industrials (0.4%): | |
Randstad NV | | | 3,164 | | | | 205,762 | | |
Wolters Kluwer NV | | | 3,313 | | | | 279,473 | | |
| | | | 485,235 | | |
Information Technology (0.5%): | |
Adyen NV (a) (e) | | | 124 | | | | 288,541 | | |
| ASML Holding NV | | | 495 | | | | 240,374 | | |
| | | | 528,915 | | |
See notes to financial statements.
46
Victory Portfolios II
VictoryShares International Volatility Wtd ETF | | Schedule of Portfolio Investments — continued
December 31, 2020 | |
(Unaudited)
Security Description | | Shares | | Value | |
Materials (0.5%): | |
Akzo Nobel NV | | | 2,202 | | | $ | 236,320 | | |
Koninklijke DSM NV | | | 1,677 | | | | 288,421 | | |
| | | | 524,741 | | |
| | | | 3,767,723 | | |
New Zealand (0.5%): | |
Consumer Staples (0.1%): | |
a2 Milk Co. Ltd. (a) | | | 19,080 | | | | 165,652 | | |
Health Care (0.2%): | |
Fisher & Paykel Healthcare Corp. Ltd. (c) | | | 7,662 | | | | 181,707 | | |
Information Technology (0.2%): | |
Xero Ltd. (a) | | | 2,356 | | | | 266,626 | | |
| | | | 613,985 | | |
Norway (1.5%): | |
Communication Services (0.4%): | |
Schibsted ASA, Class A (a) | | | 4,516 | | | | 193,228 | | |
Telenor ASA | | | 16,898 | | | | 287,986 | | |
| | | | 481,214 | | |
Consumer Staples (0.5%): | |
Mowi ASA | | | 10,509 | | | | 234,464 | | |
Orkla ASA, Class A | | | 25,409 | | | | 258,218 | | |
| | | | 492,682 | | |
Financials (0.4%): | |
DNB ASA (a) | | | 11,004 | | | | 215,944 | | |
Gjensidige Forsikring ASA | | | 11,931 | | | | 266,747 | | |
| | | | 482,691 | | |
Materials (0.2%): | |
Yara International ASA | | | 5,718 | | | | 237,780 | | |
| | | | 1,694,367 | | |
Portugal (0.5%): | |
Consumer Staples (0.3%): | |
Jeronimo Martins SGPS SA | | | 15,409 | | | | 260,120 | | |
Utilities (0.2%): | |
Energias de Portugal SA | | | 40,762 | | | | 256,720 | | |
| | | | 516,840 | | |
Russian Federation (0.1%): | |
Materials (0.1%): | |
Polymetal International PLC | | | 6,344 | | | | 146,116 | | |
Singapore (1.6%): | |
Communication Services (0.3%): | |
Singapore Telecommunications Ltd. | | | 170,700 | | | | 298,431 | | |
See notes to financial statements.
47
Victory Portfolios II
VictoryShares International Volatility Wtd ETF | | Schedule of Portfolio Investments — continued
December 31, 2020 | |
(Unaudited)
Security Description | | Shares | | Value | |
Consumer Staples (0.2%): | |
Wilmar International Ltd. | | | 61,600 | | | $ | 216,787 | | |
Financials (0.9%): | |
DBS Group Holdings Ltd. | | | 16,900 | | | | 320,272 | | |
Oversea-Chinese Banking Corp. Ltd. | | | 45,100 | | | | 343,379 | | |
United Overseas Bank Ltd. | | | 18,700 | | | | 319,710 | | |
| | | | 983,361 | | |
Real Estate (0.2%): | |
CapitaLand Ltd. (c) | | | 115,000 | | | | 285,476 | | |
| | | | 1,784,055 | | |
Spain (1.8%): | |
Consumer Discretionary (0.2%): | |
Industria de Diseno Textil SA | | | 7,069 | | | | 224,849 | | |
Financials (0.2%): | |
CaixaBank SA | | | 70,571 | | | | 181,110 | | |
Health Care (0.2%): | |
Grifols SA | | | 7,901 | | | | 230,466 | | |
Industrials (0.1%): | |
Aena SME SA (a) (e) | | | 943 | | | | 163,796 | | |
Information Technology (0.2%): | |
Amadeus IT Group SA | | | 2,448 | | | | 178,097 | | |
Utilities (0.9%): | |
Endesa SA | | | 8,068 | | | | 220,259 | | |
Iberdrola SA | | | 17,875 | | | | 255,460 | | |
Naturgy Energy Group SA | | | 10,479 | | | | 242,689 | | |
Red Electrica Corp. SA | | | 13,152 | | | | 269,492 | | |
| | | | 987,900 | | |
| | | | 1,966,218 | | |
Sweden (5.6%): | |
Communication Services (0.4%): | |
Tele2 AB, B Shares | | | 17,275 | | | | 228,126 | | |
Telia Co. AB (c) | | | 63,063 | | | | 260,417 | | |
| | | | 488,543 | | |
Consumer Discretionary (0.3%): | |
Evolution Gaming Group AB (e) | | | 1,866 | | | | 189,418 | | |
Hennes & Mauritz AB, Class B (a) (c) | | | 9,390 | | | | 196,391 | | |
| | | | 385,809 | | |
Consumer Staples (0.7%): | |
Essity AB, Class B | | | 7,994 | | | | 257,109 | | |
ICA Gruppen AB (c) | | | 4,538 | | | | 226,740 | | |
Swedish Match AB | | | 3,176 | | | | 246,316 | | |
| | | | 730,165 | | |
See notes to financial statements.
48
Victory Portfolios II
VictoryShares International Volatility Wtd ETF | | Schedule of Portfolio Investments — continued
December 31, 2020 | |
(Unaudited)
Security Description | | Shares | | Value | |
Financials (1.6%): | |
EQT AB (c) | | | 6,271 | | | $ | 160,439 | | |
Industrivarden AB, Class C | | | 7,751 | | | | 250,236 | | |
Investor AB, Class B | | | 3,565 | | | | 259,752 | | |
Kinnevik AB, Class B | | | 4,825 | | | | 243,779 | | |
L E Lundbergforetagen AB, Class B (a) | | | 4,691 | | | | 251,326 | | |
Skandinaviska Enskilda Banken AB, Class A (a) | | | 18,732 | | | | 192,472 | | |
Svenska Handelsbanken AB, Class A (a) | | | 18,415 | | | | 184,961 | | |
Swedbank AB, Class A (a) | | | 11,063 | | | | 193,876 | | |
| | | | 1,736,841 | | |
Industrials (1.8%): | |
Alfa Laval AB (a) | | | 7,397 | | | | 203,548 | | |
Assa Abloy AB, Class B | | | 9,099 | | | | 224,051 | | |
Atlas Copco AB, Class A | | | 4,294 | | | | 219,875 | | |
Epiroc AB, Class A | | | 13,496 | | | | 245,589 | | |
Nibe Industrier AB, Class B | | | 6,460 | | | | 211,856 | | |
Sandvik AB (a) | | | 8,888 | | | | 217,558 | | |
Skanska AB, Class B | | | 9,638 | | | | 245,761 | | |
| SKF AB, Class B | | | 8,636 | | | | 224,096 | | |
Volvo AB, Class B | | | 9,373 | | | | 220,882 | | |
| | | | 2,013,216 | | |
Information Technology (0.4%): | |
Hexagon AB, Class B | | | 2,617 | | | | 238,603 | | |
Telefonaktiebolaget LM Ericsson, Class B | | | 16,342 | | | | 194,026 | | |
| | | | 432,629 | | |
Materials (0.4%): | |
Boliden AB | | | 5,511 | | | | 195,275 | | |
Svenska Cellulosa AB SCA, Class B (a) | | | 16,129 | | | | 281,049 | | |
| | | | 476,324 | | |
| | | | 6,263,527 | | |
Switzerland (7.4%): | |
Communication Services (0.2%): | |
Swisscom AG, Registered Shares | | | 511 | | | | 275,478 | | |
Consumer Discretionary (0.5%): | |
Cie Financiere Richemont SA, Registered Shares | | | 3,117 | | | | 282,045 | | |
The Swatch Group AG, B Shares | | | 932 | | | | 254,325 | | |
| | | | 536,370 | | |
Consumer Staples (1.1%): | |
Barry Callebaut AG, Registered Shares | | | 164 | | | | 389,894 | | |
Chocoladefabriken Lindt & Spruengli AG | | | 30 | | | | 292,542 | | |
Coca-Cola HBC AG | | | 6,179 | | | | 200,821 | | |
Nestle SA, Registered Shares | | | 2,786 | | | | 328,213 | | |
| | | | 1,211,470 | | |
See notes to financial statements.
49
Victory Portfolios II
VictoryShares International Volatility Wtd ETF | | Schedule of Portfolio Investments — continued
December 31, 2020 | |
(Unaudited)
Security Description | | Shares | | Value | |
Financials (1.3%): | |
Banque Cantonale Vaudoise, Registered Shares | | | 2,788 | | | $ | 303,372 | | |
Credit Suisse Group AG, Registered Shares | | | 13,303 | | | | 171,361 | | |
Julius Baer Group Ltd. | | | 3,329 | | | | 191,841 | | |
Partners Group Holding AG | | | 195 | | | | 229,152 | | |
Swiss Life Holding AG | | | 436 | | | | 203,171 | | |
UBS Group AG | | | 14,300 | | | | 201,493 | | |
Zurich Insurance Group AG | | | 509 | | | | 214,815 | | |
| | | | 1,515,205 | | |
Health Care (1.3%): | |
Lonza Group AG, Registered Shares | | | 380 | | | | 244,231 | | |
Novartis AG, Registered Shares | | | 3,356 | | | | 317,208 | | |
Roche Holding AG | | | 793 | | | | 276,878 | | |
Sonova Holding AG (a) | | | 899 | | | | 233,638 | | |
Straumann Holding AG, Class R | | | 181 | | | | 210,962 | | |
Vifor Pharma AG | | | 1,246 | | | | 195,700 | | |
| | | | 1,478,617 | | |
Industrials (1.5%): | |
ABB Ltd., Registered Shares | | | 7,930 | | | | 221,413 | | |
Adecco Group AG | | | 3,247 | | | | 217,053 | | |
Geberit AG, Registered Shares | | | 438 | | | | 274,282 | | |
Kuehne + Nagel International AG | | | 1,305 | | | | 296,095 | | |
Schindler Holding AG | | | 1,193 | | | | 321,638 | | |
SGS SA, Registered Shares | | | 104 | | | | 313,763 | | |
| | | | 1,644,244 | | |
Information Technology (0.5%): | |
Logitech International SA, Class R | | | 2,988 | | | | 290,089 | | |
Stmicroelectronics NV | | | 4,642 | | | | 173,224 | | |
Temenos AG | | | 1,092 | | | | 152,572 | | |
| | | | 615,885 | | |
Materials (1.0%): | |
EMS-Chemie Holding AG | | | 328 | | | | 316,140 | | |
Givaudan SA, Registered Shares | | | 68 | | | | 286,599 | | |
LafargeHolcim Ltd. | | | 4,119 | | | | 226,289 | | |
Sika AG, Registered Shares | | | 880 | | | | 240,434 | | |
| | | | 1,069,462 | | |
| | | | 8,346,731 | | |
United Kingdom (8.7%): | |
Communication Services (0.4%): | |
BT Group PLC (a) | | | 118,947 | | | | 215,086 | | |
Informa PLC (a) | | | 24,837 | | | | 186,438 | | |
| | | | 401,524 | | |
Consumer Discretionary (0.5%): | |
Compass Group PLC | | | 9,418 | | | | 175,516 | | |
JD Sports Fashion PLC (a) | | | 11,399 | | | | 134,038 | | |
See notes to financial statements.
50
Victory Portfolios II
VictoryShares International Volatility Wtd ETF | | Schedule of Portfolio Investments — continued
December 31, 2020 | |
(Unaudited)
Security Description | | Shares | | Value | |
Next PLC (a) | | | 1,768 | | | $ | 171,296 | | |
Persimmon PLC | | | 3,766 | | | | 142,479 | | |
| | | | 623,329 | | |
Consumer Staples (1.4%): | |
Associated British Foods PLC (a) | | | 6,393 | | | | 197,899 | | |
British American Tobacco PLC | | | 6,704 | | | | 248,225 | | |
Diageo PLC | | | 6,474 | | | | 254,757 | | |
Imperial Brands PLC | | | 12,780 | | | | 268,314 | | |
Tesco PLC | | | 100,533 | | | | 318,079 | | |
Unilever PLC | | | 4,431 | | | | 266,089 | | |
| | | | 1,553,363 | | |
Financials (2.1%): | |
| 3i Group PLC | | | 11,999 | | | | 189,984 | | |
Admiral Group PLC | | | 7,202 | | | | 286,162 | | |
Aviva PLC | | | 41,588 | | | | 184,919 | | |
Barclays PLC | | | 85,854 | | | | 172,185 | | |
Hargreaves Lansdown PLC | | | 6,726 | | | | 140,246 | | |
Legal & General Group PLC | | | 40,213 | | | | 146,365 | | |
Lloyds Banking Group PLC (a) | | | 400,594 | | | | 199,593 | | |
London Stock Exchange Group PLC | | | 1,821 | | | | 224,285 | | |
Natwest Group PLC | | | 95,714 | | | | 219,403 | | |
Phoenix Group Holdings PLC | | | 17,800 | | | | 170,511 | | |
Schroders PLC | | | 4,403 | | | | 200,894 | | |
Standard Chartered PLC | | | 30,908 | | | | 196,891 | | |
| | | | 2,331,438 | | |
Health Care (0.6%): | |
AstraZeneca PLC | | | 2,199 | | | | 220,210 | | |
GlaxoSmithKline PLC (b) | | | 13,835 | | | | 253,860 | | |
Smith & Nephew PLC | | | 8,777 | | | | 181,211 | | |
| | | | 655,281 | | |
Industrials (1.5%): | |
Ashtead Group PLC | | | 3,551 | | | | 166,924 | | |
BAE Systems PLC | | | 29,841 | | | | 199,438 | | |
Bunzl PLC | | | 6,215 | | | | 207,600 | | |
Ferguson PLC | | | 1,686 | | | | 204,799 | | |
Intertek Group PLC | | | 2,626 | | | | 202,793 | | |
RELX PLC | | | 10,542 | | | | 258,372 | | |
Rentokil Initial PLC (a) | | | 25,268 | | | | 176,061 | | |
Spirax-Sarco Engineering PLC | | | 1,705 | | | | 263,314 | | |
| | | | 1,679,301 | | |
Information Technology (0.5%): | |
AVEVA Group PLC | | | 2,174 | | | | 95,180 | | |
Halma PLC | | | 7,420 | | | | 248,459 | | |
The Sage Group PLC | | | 23,894 | | | | 190,141 | | |
| | | | 533,780 | | |
See notes to financial statements.
51
Victory Portfolios II
VictoryShares International Volatility Wtd ETF | | Schedule of Portfolio Investments — continued
December 31, 2020 | |
(Unaudited)
Security Description | | Shares | | Value | |
Materials (1.3%): | |
Anglo American PLC | | | 5,438 | | | $ | 180,271 | | |
Antofagasta PLC | | | 10,944 | | | | 215,552 | | |
BHP Group PLC | | | 6,713 | | | | 176,689 | | |
Croda International PLC | | | 3,545 | | | | 319,713 | | |
Fresnillo PLC | | | 8,402 | | | | 129,757 | | |
Mondi PLC | | | 10,175 | | | | 239,221 | | |
Rio Tinto PLC | | | 2,905 | | | | 217,268 | | |
| | | | 1,478,471 | | |
Utilities (0.4%): | |
National Grid PLC | | | 19,853 | | | | 234,804 | | |
SSE PLC | | | 10,007 | | | | 205,238 | | |
| | | | 440,042 | | |
| | | | 9,696,529 | | |
Total Common Stocks (Cost $94,093,743) | | | 111,777,189 | | |
Collateral for Securities Loaned^ (2.3%) | |
United States (2.3%): | |
BlackRock Liquidity Funds TempFund Portfolio, Institutional Class, 0.08% (g) | | | 46,351 | | | | 46,351 | | |
Fidelity Investments Money Market Government Portfolio I Shares, 0.01% (g) | | | 1,592,429 | | | | 1,592,429 | | |
Goldman Sachs Financial Square Prime Obligations Fund, Institutional Class,
0.04% (g) | | | 23,131 | | | | 23,131 | | |
JPMorgan Prime Money Market Fund, Capital Class, 0.12% (g) | | | 184,443 | | | | 184,443 | | |
Morgan Stanley Institutional Liquidity Prime Portfolio, Institutional Class,
0.09% (g) | | | 829,292 | | | | 829,292 | | |
Total Collateral for Securities Loaned (Cost $2,675,646) | | | 2,675,646 | | |
Total Investments (Cost $96,769,389) — 102.1% | | | 114,452,835 | | |
Liabilities in excess of other assets — (2.1)% | | | (2,399,831 | ) | |
NET ASSETS — 100.00% | | $ | 112,053,004 | | |
^ Purchased with cash collateral from securities on loan.
(a) Non-income producing security.
(b) All or a portion of this security has been segregated as collateral for derivative instruments.
(c) All or a portion of this security is on loan.
(d) Security was fair valued based upon procedures approved by the Board of Trustees and represents less than 0.05% of the Fund's net assets as of December 31, 2020. This security is classified as Level 3 within the fair value hierarchy. (See Note 2)
(e) Rule 144A security or other security that is restricted as to resale to institutional investors. The Fund's Adviser has deemed this security to be liquid based upon procedures approved by the Board of Trustees. As of December 31, 2020, the fair value of these securities was $3,702,960 and amounted to 3.3% of net assets.
(f) The Fund's Adviser has deemed this security to be illiquid based upon procedures approved by the Board of Trustees. As of December 31, 2020, illiquid securities were less than 0.05% of the Fund's net assets.
(g) Rate disclosed is the daily yield on December 31, 2020.
See notes to financial statements.
52
Victory Portfolios II
VictoryShares International Volatility Wtd ETF | | Schedule of Portfolio Investments — continued
December 31, 2020 | |
(Unaudited)
ADR — American Depositary Receipt
PLC — Public Limited Company
Futures Contracts Purchased
| | | Number of
Contracts | | Expiration
Date | | Notional
Amount | | Value | | Unrealized
Appreciation
(Depreciation) | |
E-Mini MSCI EAFE Index Futures | | | 1 | | | 3/19/21 | | $ | 106,839 | | | $ | 106,540 | | | $ | (299 | ) | |
| | | Total unrealized appreciation | | | | | | | | $ | — | | |
| | | Total unrealized depreciation | | | | | | | | | (299 | ) | |
| | | Total net unrealized appreciation (depreciation) | | | | | | | | $ | (299 | ) | |
See notes to financial statements.
53
Victory Portfolios II
VictoryShares Emerging Market Volatility Wtd ETF | | Schedule of Portfolio Investments
December 31, 2020 | |
(Unaudited)
Security Description | | Shares | | Value | |
Common Stocks (100.2%) | |
Bermuda (0.3%): | |
Utilities (0.3%): | |
China Gas Holdings Ltd. | | | 6,312 | | | $ | 25,078 | | |
Brazil (4.9%): | |
Communication Services (0.2%): | |
TIM SA | | | 4,947 | | | | 13,954 | | |
Consumer Discretionary (0.4%): | |
Lojas Renner SA | | | 1,262 | | | | 10,580 | | |
Magazine Luiza SA | | | 2,100 | | | | 10,088 | | |
Petrobras Distribuidora SA | | | 2,600 | | | | 11,078 | | |
| | | | 31,746 | | |
Consumer Staples (1.1%): | |
Ambev SA | | | 6,500 | | | | 19,586 | | |
Atacadao SA | | | 4,200 | | | | 15,680 | | |
| BRF SA (a) | | | 2,800 | | | | 11,882 | | |
Cia Brasileira de Distribuicao | | | 1,200 | | | | 17,340 | | |
M Dias Branco SA | | | 1,900 | | | | 12,460 | | |
Marfrig Global Foods SA (a) | | | 2,637 | | | | 7,367 | | |
Raia Drogasil SA | | | 4,000 | | | | 19,284 | | |
| | | | 103,599 | | |
Energy (0.2%): | |
Cosan SA | | | 700 | | | | 10,207 | | |
Ultrapar Participacoes SA | | | 2,400 | | | | 10,970 | | |
| | | | 21,177 | | |
Financials (0.6%): | |
B3 SA- Brasil Bolsa Balcao | | | 1,058 | | | | 12,626 | | |
Banco do Brasil SA | | | 1,600 | | | | 11,953 | | |
BB Seguridade Participacoes SA | | | 3,046 | | | | 17,377 | | |
Porto Seguro SA | | | 1,709 | | | | 16,123 | | |
| | | | 58,079 | | |
Health Care (0.4%): | |
Hapvida Participacoes E Investimentos SA (b) | | | 4,500 | | | | 13,222 | | |
Hypera SA | | | 2,100 | | | | 13,848 | | |
Notre Dame Intermedica Participacoes SA | | | 700 | | | | 10,558 | | |
| | | | 37,628 | | |
Industrials (0.7%): | |
CCR SA | | | 3,832 | | | | 9,938 | | |
Cia de Locacao das Americas | | | 2,107 | | | | 11,890 | | |
Cosan Logistica SA (a) | | | 2,750 | | | | 9,801 | | |
Localiza Rent a Car SA | | | 918 | | | | 12,187 | | |
Rumo SA (a) | | | 2,500 | | | | 9,261 | | |
WEG SA | | | 920 | | | | 13,416 | | |
| | | | 66,493 | | |
See notes to financial statements.
54
Victory Portfolios II
VictoryShares Emerging Market Volatility Wtd ETF | | Schedule of Portfolio Investments — continued
December 31, 2020 | |
(Unaudited)
Security Description | | Shares | | Value | |
Information Technology (0.1%): | |
TOTVS SA | | | 1,958 | | | $ | 10,827 | | |
Materials (0.3%): | |
Duratex SA | | | 3,088 | | | | 11,380 | | |
Vale SA | | | 1,000 | | | | 16,837 | | |
| | | | 28,217 | | |
Utilities (0.9%): | |
Centrais Eletricas Brasileiras SA | | | 1,289 | | | | 9,101 | | |
Cia de Saneamento Basico do Estado de Sao Paulo | | | 1,200 | | | | 10,267 | | |
Energias do Brasil SA | | | 4,500 | | | | 17,025 | | |
Eneva SA (a) | | | 1,426 | | | | 17,050 | | |
Engie Brasil Energia SA | | | 2,275 | | | | 19,247 | | |
Equatorial Energia SA | | | 3,400 | | | | 15,161 | | |
| | | | 87,851 | | |
| | | | 459,571 | | |
Chile (1.5%): | |
Communication Services (0.1%): | |
Empresa Nacional de Telecomunicaciones SA | | | 2,237 | | | | 13,896 | | |
Consumer Discretionary (0.2%): | |
SACI Falabella | | | 3,874 | | | | 14,355 | | |
Consumer Staples (0.2%): | |
Cencosud SA | | | 8,714 | | | | 15,531 | | |
Financials (0.6%): | |
Banco de Chile | | | 170,014 | | | | 17,379 | | |
Banco de Credito e Inversiones SA | | | 515 | | | | 20,237 | | |
Banco Santander Chile | | | 388,684 | | | | 18,674 | | |
| | | | 56,290 | | |
Real Estate (0.1%): | |
Cencosud Shopping SA | | | 7,750 | | | | 12,432 | | |
Utilities (0.3%): | |
Colbun SA | | | 94,065 | | | | 16,633 | | |
Enel Americas SA | | | 93,281 | | | | 15,247 | | |
| | | | 31,880 | | |
| | | | 144,384 | | |
China (16.6%): | |
Communication Services (0.5%): | |
China Telecom Corp. Ltd., Class H | | | 53,615 | | | | 14,870 | | |
China Tower Corp. Ltd. (b) | | | 88,799 | | | | 13,058 | | |
Tencent Holdings Ltd. | | | 247 | | | | 17,970 | | |
| | | | 45,898 | | |
Consumer Discretionary (2.2%): | |
ANTA Sports Products Ltd. | | | 1,195 | | | | 18,945 | | |
BYD Co. Ltd., Class H | | | 1,163 | | | | 30,484 | | |
Fuyao Glass Industry Group Co. Ltd., Class H (b) | | | 5,098 | | | | 28,015 | | |
See notes to financial statements.
55
Victory Portfolios II
VictoryShares Emerging Market Volatility Wtd ETF | | Schedule of Portfolio Investments — continued
December 31, 2020 | |
(Unaudited)
Security Description | | Shares | | Value | |
Great Wall Motor Co. Ltd., Class H | | | 13,440 | | | $ | 46,117 | | |
Guangzhou Automobile Group Co. Ltd. | | | 15,064 | | | | 16,750 | | |
Li Ning Co. Ltd. | | | 2,926 | | | | 20,118 | | |
Meituan Dianping, Class B (a) | | | 361 | | | | 13,719 | | |
Shenzhou International Group Holdings Ltd. | | | 908 | | | | 17,803 | | |
Zhongsheng Group Holdings Ltd. | | | 2,931 | | | | 20,889 | | |
| | | | 212,840 | | |
Consumer Staples (1.5%): | |
Anhui Gujing Distillery Co. Ltd., Class B | | | 1,400 | | | | 19,502 | | |
China Feihe Ltd. (b) | | | 5,901 | | | | 13,824 | | |
China Mengniu Dairy Co. Ltd. | | | 3,549 | | | | 21,425 | | |
Hengan International Group Co. Ltd. | | | 2,382 | | | | 16,869 | | |
Tingyi Cayman Islands Holding Corp. | | | 9,323 | | | | 15,923 | | |
Tsingtao Brewery Co. Ltd., Class H | | | 2,000 | | | | 20,949 | | |
Want Want China Holdings Ltd. | | | 28,045 | | | | 20,295 | | |
Yihai International Holding Ltd. | | | 1,122 | | | | 16,644 | | |
| | | | 145,431 | | |
Energy (0.5%): | |
China Petroleum & Chemical Corp., Class H | | | 44,095 | | | | 19,738 | | |
China Shenhua Energy Co. Ltd., Class H | | | 12,446 | | | | 23,440 | | |
| | | | 43,178 | | |
Financials (5.6%): | |
Agricultural Bank of China Ltd., Class H | | | 76,940 | | | | 28,187 | | |
Bank of China Ltd., Class H | | | 85,451 | | | | 29,211 | | |
Bank of Communications Co. Ltd., Class H | | | 49,206 | | | | 26,024 | | |
China CITIC Bank Corp. Ltd., Class H | | | 53,834 | | | | 22,847 | | |
China Construction Bank Corp., Class H | | | 39,784 | | | | 30,227 | | |
China Everbright Bank Co. Ltd., Class H | | | 47,091 | | | | 17,920 | | |
China Galaxy Securities Co. Ltd., Class H | | | 22,196 | | | | 13,915 | | |
China International Capital Corp. Ltd., Class H (a) (b) | | | 6,056 | | | | 16,405 | | |
China Life Insurance Co. Ltd., Class H | | | 5,889 | | | | 12,990 | | |
China Merchants Bank Co. Ltd., Class H | | | 4,069 | | | | 25,719 | | |
China Merchants Securities Co. Ltd., Class H (b) | | | 8,885 | | | | 13,295 | | |
China Minsheng Banking Corp. Ltd., Class H | | | 47,452 | | | | 27,055 | | |
China Pacific Insurance Group Co. Ltd., Class H | | | 5,839 | | | | 22,860 | | |
CITIC Securities Co. Ltd., Class H | | | 5,817 | | | | 13,117 | | |
CSC Financial Co. Ltd., Class H (b) | | | 7,063 | | | | 9,384 | | |
GF Securities Co. Ltd., Class H | | | 13,561 | | | | 19,173 | | |
Guotai Junan Securities Co. Ltd. (b) | | | 9,450 | | | | 13,775 | | |
Haitong Securities Co. Ltd. | | | 15,416 | | | | 13,781 | | |
Huatai Securities Co. Ltd., Class H (b) | | | 9,119 | | | | 14,351 | | |
Industrial & Commercial Bank of China Ltd., Class H | | | 49,098 | | | | 31,857 | | |
New China Life Insurance Co. Ltd., Class H | | | 3,524 | | | | 13,751 | | |
Orient Securities Co. Ltd., Class H (b) | | | 23,657 | | | | 16,662 | | |
People's Insurance Co. Group of China Ltd. | | | 50,371 | | | | 15,984 | | |
PICC Property & Casualty Co. Ltd., Class H | | | 22,091 | | | | 16,727 | | |
Ping An Insurance Group Co. of China Ltd. | | | 2,899 | | | | 35,526 | | |
Postal Savings Bank of China Co. Ltd., Class H (b) | | | 48,038 | | | | 27,142 | | |
| | | | 527,885 | | |
See notes to financial statements.
56
Victory Portfolios II
VictoryShares Emerging Market Volatility Wtd ETF | | Schedule of Portfolio Investments — continued
December 31, 2020 | |
(Unaudited)
Security Description | | Shares | | Value | |
Health Care (0.7%): | |
Shandong Weigao Group Medical Polymer Co. Ltd., Class H | | | 4,847 | | | $ | 10,954 | | |
Shanghai Fosun Pharmaceutical Group Co. Ltd. | | | 2,968 | | | | 14,185 | | |
Wuxi AppTec Co. Ltd., Class H (b) | | | 949 | | | | 18,583 | | |
Wuxi Biologics Cayman, Inc. (a) (b) | | | 1,686 | | | | 22,358 | | |
| | | | 66,080 | | |
Industrials (1.6%): | |
Airtac International Group | | | 1,000 | | | | 32,032 | | |
China Railway Group Ltd., Class H | | | 39,687 | | | | 17,508 | | |
Country Garden Services Holdings Co. Ltd. | | | 2,348 | | | | 15,886 | | |
Fosun International Ltd. | | | 17,504 | | | | 27,502 | | |
Shanghai Electric Group Co. Ltd. (a) | | | 62,982 | | | | 19,336 | | |
Weichai Power Co. Ltd. | | | 8,136 | | | | 16,330 | | |
Zoomlion Heavy Industry Science and Technology Co. Ltd., Class H | | | 15,475 | | | | 18,565 | | |
| | | | 147,159 | | |
Information Technology (1.4%): | |
China Railway Signal & Communication Corp. Ltd., Class H (b) | | | 45,183 | | | | 15,154 | | |
Kingdee International Software Group Co. Ltd. | | | 4,675 | | | | 19,056 | | |
Shanghai Baosight Software Co. Ltd., Class B | | | 5,900 | | | | 23,995 | | |
Sunny Optical Technology Group Co. Ltd. | | | 821 | | | | 17,972 | | |
Xiaomi Corp., Class B (a) (b) | | | 4,230 | | | | 18,116 | | |
Xinyi Solar Holdings Ltd. | | | 11,574 | | | | 30,233 | | |
ZTE Corp., Class H | | | 3,509 | | | | 8,827 | | |
| | | | 133,353 | | |
Materials (0.8%): | |
Anhui Conch Cement Co. Ltd., Class H | | | 2,884 | | | | 18,062 | | |
China Molybdenum Co. Ltd. | | | 28,240 | | | | 18,433 | | |
China National Building Material Co. Ltd., Class H | | | 9,283 | | | | 11,160 | | |
Shandong Gold Mining Co. Ltd., Class H (b) | | | 4,611 | | | | 10,647 | | |
Zijin Mining Group Co. Ltd., Class H | | | 18,650 | | | | 21,122 | | |
| | | | 79,424 | | |
Real Estate (0.9%): | |
China Vanke Co. Ltd. | | | 5,506 | | | | 18,999 | | |
Country Garden Holdings Co. Ltd. | | | 14,758 | | | | 20,408 | | |
Logan Group Co. Ltd. | | | 8,200 | | | | 13,434 | | |
Longfor Group Holdings Ltd. (b) | | | 3,514 | | | | 20,579 | | |
Sunac China Holdings Ltd. | | | 3,460 | | | | 12,787 | | |
Sunac Services Holdings Ltd. (a) (b) | | | 105 | | | | 233 | | |
| | | | 86,440 | | |
Utilities (0.9%): | |
CGN Power Co. Ltd., Class H (b) | | | 105,225 | | | | 22,668 | | |
China Resources Gas Group Ltd. | | | 4,596 | | | | 24,456 | | |
ENN Energy Holdings Ltd. | | | 1,635 | | | | 24,001 | | |
Huaneng Power International, Inc., Class H | | | 37,244 | | | | 13,596 | | |
| | | | 84,721 | | |
| | | | 1,572,409 | | |
See notes to financial statements.
57
Victory Portfolios II
VictoryShares Emerging Market Volatility Wtd ETF | | Schedule of Portfolio Investments — continued
December 31, 2020 | |
(Unaudited)
Security Description | | Shares | | Value | |
Colombia (0.3%): | |
Financials (0.1%): | |
Grupo de Inversiones Suramericana SA | | | 1,921 | | | $ | 14,225 | | |
Utilities (0.2%): | |
Interconexion Electrica SA ESP | | | 2,464 | | | | 18,548 | | |
| | | | 32,773 | | |
Czech Republic (0.5%): | |
Financials (0.2%): | |
Komercni Banka A/S (a) | | | 776 | | | | 23,775 | | |
Utilities (0.3%): | |
CEZ A/S | | | 1,127 | | | | 27,065 | | |
| | | | 50,840 | | |
Egypt (0.4%): | |
Consumer Staples (0.2%): | |
Eastern Co. SAE | | | 20,572 | | | | 17,109 | | |
Financials (0.2%): | |
Commercial International Bank | | | 4,281 | | | | 16,160 | | |
| | | | 33,269 | | |
Hong Kong (2.3%): | |
Communication Services (0.2%): | |
China Mobile Ltd. | | | 2,913 | | | | 16,609 | | |
Consumer Discretionary (0.2%): | |
Geely Automobile Holdings Ltd. | | | 5,864 | | | | 20,045 | | |
Consumer Staples (0.2%): | |
China Resources Beer Holdings Co. Ltd. | | | 2,397 | | | | 22,077 | | |
Energy (0.1%): | |
CNOOC Ltd. | | | 12,785 | | | | 11,841 | | |
Financials (0.3%): | |
BOC Hong Kong Holdings Ltd. | | | 8,766 | | | | 26,573 | | |
Health Care (0.1%): | |
CSPC Pharmaceutical Group Ltd. | | | 11,721 | | | | 11,990 | | |
Information Technology (0.4%): | |
BYD Electronic International Co. Ltd. | | | 2,343 | | | | 12,271 | | |
Lenovo Group Ltd. | | | 25,816 | | | | 24,377 | | |
| | | | 36,648 | | |
Materials (0.2%): | |
China Resources Cement Holdings Ltd. | | | 13,945 | | | | 15,578 | | |
Real Estate (0.3%): | |
China Overseas Land & Investment Ltd., Class H | | | 6,983 | | | | 15,187 | | |
China Resources Land Ltd. | | | 4,540 | | | | 18,741 | | |
| | | | 33,928 | | |
See notes to financial statements.
58
Victory Portfolios II
VictoryShares Emerging Market Volatility Wtd ETF | | Schedule of Portfolio Investments — continued
December 31, 2020 | |
(Unaudited)
Security Description | | Shares | | Value | |
Utilities (0.3%): | |
Guangdong Investment Ltd. | | | 13,864 | | | $ | 24,966 | | |
| | | | 220,255 | | |
Hungary (0.6%): | |
Energy (0.2%): | |
MOL Hungarian Oil & Gas PLC (a) | | | 2,708 | | | | 20,013 | | |
Financials (0.2%): | |
OTP Bank Nyrt (a) | | | 402 | | | | 18,123 | | |
Health Care (0.2%): | |
Richter Gedeon Nyrt | | | 820 | | | | 20,587 | | |
| | | | 58,723 | | |
India (18.2%): | |
Communication Services (0.6%): | |
Indus Towers Ltd. | | | 3,747 | | | | 11,790 | | |
Info Edge India Ltd. | | | 288 | | | | 18,755 | | |
Sun TV Network Ltd. | | | 2,224 | | | | 14,634 | | |
Zee Entertainment Enterprises Ltd. | | | 3,086 | | | | 9,440 | | |
| | | | 54,619 | | |
Consumer Discretionary (3.0%): | |
Bajaj Auto Ltd. | | | 406 | | | | 19,138 | | |
Balkrishna Industries Ltd. | | | 734 | | | | 16,539 | | |
Bata India Ltd. | | | 932 | | | | 20,150 | | |
Bharat Forge Ltd. | | | 1,590 | | | | 11,432 | | |
Bosch Ltd. | | | 77 | | | | 13,474 | | |
Eicher Motors Ltd. | | | 510 | | | | 17,667 | | |
Exide Industries Ltd. | | | 7,712 | | | | 20,187 | | |
Hero MotoCorp Ltd. | | | 339 | | | | 14,430 | | |
Jubilant Foodworks Ltd. | | | 470 | | | | 17,955 | | |
Maruti Suzuki India Ltd. | | | 138 | | | | 14,449 | | |
Motherson Sumi Systems Ltd. | | | 6,120 | | | | 13,838 | | |
MRF Ltd. | | | 24 | | | | 24,883 | | |
Page Industries Ltd. | | | 72 | | | | 27,209 | | |
Titan Co. Ltd. | | | 1,009 | | | | 21,642 | | |
TVS Motor Co. Ltd. | | | 2,510 | | | | 16,662 | | |
Whirlpool of India Ltd. | | | 512 | | | | 18,423 | | |
| | | | 288,078 | | |
Consumer Staples (2.1%): | |
Britannia Industries Ltd. | | | 331 | | | | 16,202 | | |
Colgate-Palmolive India Ltd. | | | 1,122 | | | | 24,037 | | |
Dabur India Ltd. | | | 3,068 | | | | 22,423 | | |
Godrej Consumer Products Ltd. | | | 1,788 | | | | 18,113 | | |
Hindustan Unilever Ltd. | | | 603 | | | | 19,770 | | |
ITC Ltd. | | | 5,919 | | | | 16,932 | | |
Marico Ltd. | | | 4,170 | | | | 22,981 | | |
Nestle India Ltd. | | | 88 | | | | 22,150 | | |
See notes to financial statements.
59
Victory Portfolios II
VictoryShares Emerging Market Volatility Wtd ETF | | Schedule of Portfolio Investments — continued
December 31, 2020 | |
(Unaudited)
Security Description | | Shares | | Value | |
Tata Consumer Products Ltd. | | | 1,933 | | | $ | 15,607 | | |
United Breweries Ltd. | | | 1,407 | | | | 22,846 | | |
| | | | 201,061 | | |
Energy (0.6%): | |
Bharat Petroleum Corp. Ltd. | | | 2,173 | | | | 11,335 | | |
Hindustan Petroleum Corp. Ltd. | | | 4,724 | | | | 14,089 | | |
Petronet LNG Ltd. | | | 5,355 | | | | 18,147 | | |
Reliance Industries Ltd. | | | 463 | | | | 12,581 | | |
| | | | 56,152 | | |
Financials (2.1%): | |
Axis Bank Ltd. (a) | | | 1,434 | | | | 12,178 | | |
Bajaj Finance Ltd. | | | 213 | | | | 15,437 | | |
Bajaj Finserv Ltd. | | | 136 | | | | 16,578 | | |
Bajaj Holdings & Investment Ltd. | | | 330 | | | | 13,896 | | |
HDFC Bank Ltd. (a) | | | 985 | | | | 19,364 | | |
Housing Development Finance Corp. Ltd. | | | 516 | | | | 18,070 | | |
ICICI Bank Ltd. (a) | | | 2,192 | | | | 16,052 | | |
IndusInd Bank Ltd. (a) | | | 807 | | | | 9,885 | | |
Kotak Mahindra Bank Ltd. (a) | | | 715 | | | | 19,529 | | |
Muthoot Finance Ltd. | | | 690 | | | | 11,432 | | |
Power Finance Corp. Ltd. | | | 9,778 | | | | 15,297 | | |
REC Ltd. | | | 9,726 | | | | 17,825 | | |
State Bank of India (a) | | | 4,609 | | | | 17,345 | | |
| | | | 202,888 | | |
Health Care (2.4%): | |
Apollo Hospitals Enterprise Ltd. | | | 623 | | | | 20,574 | | |
Aurobindo Pharma Ltd. | | | 884 | | | | 11,147 | | |
Biocon Ltd. (a) | | | 3,371 | | | | 21,473 | | |
Cadila Healthcare Ltd. | | | 3,068 | | | | 20,019 | | |
Cipla Ltd. | | | 1,694 | | | | 19,011 | | |
Divi's Laboratories Ltd. | | | 418 | | | | 21,980 | | |
Dr. Reddy's Laboratories Ltd. | | | 318 | | | | 22,655 | | |
Glenmark Pharmaceuticals Ltd. | | | 1,619 | | | | 10,936 | | |
Ipca Laboratories Ltd. | | | 589 | | | | 17,645 | | |
Natco Pharma Ltd. | | | 1,569 | | | | 20,658 | | |
Sun Pharmaceutical Industries Ltd. | | | 2,337 | | | | 18,947 | | |
Torrent Pharmaceuticals Ltd. | | | 442 | | | | 16,955 | | |
| | | | 222,000 | | |
Industrials (2.0%): | |
Adani Enterprises Ltd. | | | 2,972 | | | | 19,507 | | |
Adani Ports & Special Economic Zone Ltd. | | | 3,012 | | | | 19,943 | | |
Bharat Electronics Ltd. | | | 8,226 | | | | 13,505 | | |
Container Corp. of India Ltd. | | | 2,333 | | | | 12,750 | | |
Escorts Ltd. | | | 742 | | | | 12,800 | | |
Godrej Industries Ltd. (a) | | | 2,793 | | | | 16,140 | | |
Havells India Ltd. | | | 2,061 | | | | 25,843 | | |
Larsen & Toubro Ltd. | | | 1,240 | | | | 21,853 | | |
See notes to financial statements.
60
Victory Portfolios II
VictoryShares Emerging Market Volatility Wtd ETF | | Schedule of Portfolio Investments — continued
December 31, 2020 | |
(Unaudited)
Security Description | | Shares | | Value | |
Siemens Ltd. | | | 1,098 | | | $ | 23,678 | | |
Voltas Ltd. | | | 1,848 | | | | 20,883 | | |
| | | | 186,902 | | |
Information Technology (1.6%): | |
HCL Technologies Ltd. | | | 1,738 | | | | 22,507 | | |
Infosys Ltd. | | | 1,218 | | | | 20,935 | | |
Mindtree Ltd. | | | 846 | | | | 19,225 | | |
Mphasis Ltd. | | | 1,018 | | | | 21,456 | | |
Tata Consultancy Services Ltd. | | | 588 | | | | 23,039 | | |
Tech Mahindra Ltd. | | | 1,567 | | | | 20,873 | | |
Wipro Ltd. | | | 4,425 | | | | 23,393 | | |
| | | | 151,428 | | |
Materials (2.6%): | |
ACC Ltd. | | | 956 | | | | 21,166 | | |
Ambuja Cements Ltd. | | | 5,941 | | | | 20,235 | | |
Asian Paints Ltd. | | | 704 | | | | 26,638 | | |
Berger Paints India Ltd. | | | 2,288 | | | | 23,783 | | |
Grasim Industries Ltd. | | | 1,452 | | | | 18,440 | | |
Hindalco Industries Ltd. | | | 4,310 | | | | 14,190 | | |
Jindal Steel & Power Ltd. (a) | | | 3,168 | | | | 11,553 | | |
JSW Steel Ltd. | | | 3,316 | | | | 17,573 | | |
Pidilite Industries Ltd. | | | 961 | | | | 23,224 | | |
Shree Cement Ltd. | | | 60 | | | | 19,720 | | |
The Ramco Cements Ltd. | | | 1,690 | | | | 18,421 | | |
UltraTech Cement Ltd. | | | 298 | | | | 21,569 | | |
UPL Ltd. | | | 1,754 | | | | 11,196 | | |
| | | | 247,708 | | |
Utilities (1.2%): | |
GAIL India Ltd. | | | 10,364 | | | | 17,483 | | |
Indraprastha Gas Ltd. | | | 2,942 | | | | 20,228 | | |
NTPC Ltd. | | | 13,002 | | | | 17,680 | | |
Power Grid Corp. of India Ltd. | | | 7,545 | | | | 19,606 | | |
Tata Power Co. Ltd. | | | 16,635 | | | | 17,224 | | |
Torrent Power Ltd. | | | 4,154 | | | | 18,046 | | |
| | | | 110,267 | | |
| | | | 1,721,103 | | |
Indonesia (3.3%): | |
Communication Services (0.5%): | |
PT Telkom Indonesia Persero Tbk | | | 81,583 | | | | 19,234 | | |
PT Tower Bersama Infrastructure Tbk | | | 129,180 | | | | 14,997 | | |
PT XL Axiata Tbk | | | 62,232 | | | | 12,101 | | |
| | | | 46,332 | | |
Consumer Discretionary (0.3%): | |
PT ACE Hardware Indonesia Tbk | | | 125,909 | | | | 15,380 | | |
PT Astra International Tbk | | | 37,589 | | | | 16,130 | | |
| | | | 31,510 | | |
See notes to financial statements.
61
Victory Portfolios II
VictoryShares Emerging Market Volatility Wtd ETF | | Schedule of Portfolio Investments — continued
December 31, 2020 | |
(Unaudited)
Security Description | | Shares | | Value | |
Consumer Staples (0.4%): | |
PT Charoen Pokphand Indonesia Tbk | | | 25,993 | | | $ | 12,080 | | |
PT Gudang Garam Tbk (a) | | | 4,063 | | | | 11,865 | | |
PT Indofood Sukses Makmur Tbk | | | 25,524 | | | | 12,453 | | |
| | | | 36,398 | | |
Energy (0.3%): | |
PT Adaro Energy Tbk | | | 141,299 | | | | 14,392 | | |
PT United Tractors Tbk | | | 7,596 | | | | 14,391 | | |
| | | | 28,783 | | |
Financials (0.6%): | |
PT Bank Central Asia Tbk | | | 7,616 | | | | 18,362 | | |
PT Bank Mandiri Persero Tbk | | | 29,722 | | | | 13,390 | | |
PT Bank Negara Indonesia Persero Tbk | | | 33,399 | | | | 14,689 | | |
PT Bank Rakyat Indonesia Persero Tbk | | | 49,268 | | | | 14,633 | | |
| | | | 61,074 | | |
Health Care (0.1%): | |
PT Kalbe Farma Tbk | | | 125,959 | | | | 13,278 | | |
Industrials (0.2%): | |
PT Jasa Marga Persero Tbk | | | 43,655 | | | | 14,396 | | |
Materials (0.7%): | |
PT Barito Pacific Tbk (a) | | | 147,510 | | | | 11,557 | | |
PT Indah Kiat Pulp & Paper Corp. Tbk | | | 14,737 | | | | 10,942 | | |
PT Indocement Tunggal Prakarsa Tbk | | | 12,994 | | | | 13,397 | | |
PT Semen Indonesia Persero Tbk | | | 14,621 | | | | 12,939 | | |
PT Vale Indonesia Tbk (a) | | | 41,338 | | | | 15,016 | | |
| | | | 63,851 | | |
Utilities (0.2%): | |
PT Perusahaan Gas Negara Tbk | | | 120,352 | | | | 14,187 | | |
| | | | 309,809 | | |
Malaysia (5.6%): | |
Communication Services (0.6%): | |
Axiata Group Bhd | | | 29,200 | | | | 27,166 | | |
Telekom Malaysia Bhd | | | 23,300 | | | | 31,356 | | |
| | | | 58,522 | | |
Consumer Staples (1.3%): | |
IOI Corp. Bhd | | | 24,400 | | | | 26,525 | | |
Kuala Lumpur Kepong Bhd | | | 4,800 | | | | 28,275 | | |
PPB Group Bhd | | | 6,360 | | | | 29,300 | | |
QL Resources Bhd | | | 14,050 | | | | 20,271 | | |
Sime Darby Plantation Bhd | | | 14,900 | | | | 18,495 | | |
| | | | 122,866 | | |
Energy (0.2%): | |
Dialog Group Bhd | | | 25,400 | | | | 21,798 | | |
See notes to financial statements.
62
Victory Portfolios II
VictoryShares Emerging Market Volatility Wtd ETF | | Schedule of Portfolio Investments — continued
December 31, 2020 | |
(Unaudited)
Security Description | | Shares | | Value | |
Financials (1.5%): | |
CIMB Group Holdings Bhd | | | 21,800 | | | $ | 23,318 | | |
Hong Leong Bank Bhd | | | 6,900 | | | | 31,239 | | |
Malayan Banking Bhd | | | 16,400 | | | | 34,513 | | |
Public Bank Bhd | | | 4,900 | | | | 25,110 | | |
RHB Bank Bhd | | | 18,300 | | | | 24,810 | | |
| | | | 138,990 | | |
Health Care (0.2%): | |
Hartalega Holdings Bhd | | | 3,000 | | | | 9,060 | | |
Kossan Rubber Industries | | | 5,800 | | | | 6,493 | | |
Supermax Corp. Bhd (a) | | | 1,431 | | | | 2,139 | | |
Top Glove Corp. Bhd | | | 1,700 | | | | 2,588 | | |
| | | | 20,280 | | |
Industrials (0.8%): | |
Gamuda Bhd | | | 18,000 | | | | 17,418 | | |
Malaysia Airports Holdings Bhd | | | 10,600 | | | | 15,610 | | |
Sime Darby Bhd | | | 39,800 | | | | 22,870 | | |
Westports Holdings Bhd | | | 14,900 | | | | 15,938 | | |
| | | | 71,836 | | |
Materials (0.5%): | |
Petronas Chemicals Group Bhd | | | 9,900 | | | | 18,298 | | |
Press Metal Aluminium Holdings Bhd | | | 12,200 | | | | 25,462 | | |
| | | | 43,760 | | |
Utilities (0.5%): | |
Petronas Gas Bhd | | | 5,800 | | | | 24,787 | | |
Tenaga Nasional Bhd | | | 10,800 | | | | 27,994 | | |
| | | | 52,781 | | |
| | | | 530,833 | | |
Mexico (4.2%): | |
Communication Services (0.3%): | |
America Movil SAB de CV, Class L | | | 32,383 | | | | 23,586 | | |
Consumer Discretionary (0.2%): | |
El Puerto de Liverpool SAB de CV (a) | | | 5,130 | | | | 18,022 | | |
Consumer Staples (1.2%): | |
Arca Continental SAB de CV | | | 5,561 | | | | 26,745 | | |
Gruma SAB de CV, Class B | | | 1,588 | | | | 18,912 | | |
Grupo Bimbo SAB de CV | | | 7,589 | | | | 16,495 | | |
Kimberly-Clark de Mexico SAB de CV, Class A | | | 11,044 | | | | 18,869 | | |
Wal-Mart de Mexico SAB de CV | | | 9,731 | | | | 27,382 | | |
| | | | 108,403 | | |
Financials (1.0%): | |
Grupo Elektra SAB de CV | | | 879 | | | | 58,308 | | |
Grupo Financiero Banorte SAB de CV, Class O (a) | | | 3,809 | | | | 21,048 | | |
Grupo Financiero Inbursa SAB de CV (a) | | | 17,318 | | | | 17,462 | | |
| | | | 96,818 | | |
See notes to financial statements.
63
Victory Portfolios II
VictoryShares Emerging Market Volatility Wtd ETF | | Schedule of Portfolio Investments — continued
December 31, 2020 | |
(Unaudited)
Security Description | | Shares | | Value | |
Industrials (0.9%): | |
Alfa SAB de CV, Class A | | | 15,304 | | | $ | 11,062 | | |
Grupo Aeroportuario del Centro Norte SAB de CV (a) | | | 2,468 | | | | 15,927 | | |
Grupo Aeroportuario del Pacifico SAB de CV, Class B (a) | | | 1,384 | | | | 15,454 | | |
Grupo Aeroportuario del Sureste SAB de CV (a) | | | 1,234 | | | | 20,421 | | |
Promotora y Operadora de Infraestructura SAB de CV | | | 2,449 | | | | 21,620 | | |
| | | | 84,484 | | |
Materials (0.4%): | |
Grupo Mexico SAB de CV, Class B | | | 5,643 | | | | 23,861 | | |
Orbia Advance Corp. SAB de CV | | | 7,557 | | | | 17,758 | | |
| | | | 41,619 | | |
Utilities (0.2%): | |
Infraestructura Energetica Nova SAB de CV (a) | | | 5,594 | | | | 21,811 | | |
| | | | 394,743 | | |
Morocco (0.3%): | |
Financials (0.3%): | |
Attijariwafa Bank | | | 587 | | | | 27,908 | | |
Netherlands (0.1%): | |
Consumer Staples (0.1%): | |
X5 Retail Group NV, GDR | | | 357 | | | | 12,895 | | |
Philippines (2.5%): | |
Communication Services (0.3%): | |
Globe Telecom, Inc. | | | 400 | | | | 16,910 | | |
PLDT, Inc. | | | 560 | | | | 15,627 | | |
| | | | 32,537 | | |
Consumer Staples (0.3%): | |
Puregold Price Club, Inc. | | | 14,200 | | | | 12,124 | | |
Universal Robina Corp. | | | 5,080 | | | | 16,133 | | |
| | | | 28,257 | | |
Financials (0.8%): | |
Ayala Corp. | | | 795 | | | | 13,691 | | |
Bank of the Philippine Islands | | | 9,746 | | | | 16,511 | | |
BDO Unibank, Inc. | | | 6,120 | | | | 13,611 | | |
Metro Pacific Investments Co. | | | 157,700 | | | | 14,056 | | |
Metropolitan Bank & Trust Co. | | | 21,452 | | | | 21,912 | | |
| | | | 79,781 | | |
Industrials (0.5%): | |
International Container Terminal Services, Inc. | | | 5,490 | | | | 14,119 | | |
JG Summit Holdings, Inc. | | | 9,925 | | | | 14,799 | | |
SM Investments Corp. | | | 897 | | | | 19,595 | | |
| | | | 48,513 | | |
See notes to financial statements.
64
Victory Portfolios II
VictoryShares Emerging Market Volatility Wtd ETF | | Schedule of Portfolio Investments — continued
December 31, 2020 | |
(Unaudited)
Security Description | | Shares | | Value | |
Real Estate (0.4%): | |
Ayala Land, Inc. | | | 20,000 | | | $ | 17,034 | | |
SM Prime Holdings, Inc. | | | 23,200 | | | | 18,601 | | |
| | | | 35,635 | | |
Utilities (0.2%): | |
Manila Electric Co. | | | 2,570 | | | | 15,628 | | |
| | | | 240,351 | | |
Poland (1.9%): | |
Communication Services (0.5%): | |
CD Projekt SA (a) | | | 118 | | | | 8,692 | | |
Cyfrowy Polsat SA | | | 2,519 | | | | 20,452 | | |
Orange Polska SA (a) | | | 8,024 | | | | 14,178 | | |
| | | | 43,322 | | |
Consumer Staples (0.2%): | |
Dino Polska SA (a) (b) | | | 226 | | | | 17,537 | | |
Energy (0.3%): | |
Polski Koncern Naftowy ORLEN SA | | | 1,103 | | | | 17,071 | | |
Polskie Gornictwo Naftowe i Gazownictwo SA | | | 11,091 | | | | 16,481 | | |
| | | | 33,552 | | |
Financials (0.7%): | |
Bank Polska Kasa Opieki SA (a) | | | 939 | | | | 15,383 | | |
Powszechna Kasa Oszczednosci Bank Polski SA (a) | | | 2,614 | | | | 20,130 | | |
Powszechny Zaklad Ubezpieczen SA (a) | | | 2,395 | | | | 20,781 | | |
Santander Bank Polska SA (a) | | | 278 | | | | 13,842 | | |
| | | | 70,136 | | |
Materials (0.2%): | |
KGHM Polska Miedz SA (a) | | | 337 | | | | 16,536 | | |
| | | | 181,083 | | |
Russian Federation (3.0%): | |
Communication Services (0.7%): | |
Mobile TeleSystems PJSC | | | 5,561 | | | | 24,951 | | |
Rostelecom PJSC | | | 17,339 | | | | 22,758 | | |
Sistema PJSFC | | | 55,155 | | | | 21,435 | | |
| | | | 69,144 | | |
Consumer Staples (0.2%): | |
Magnit PJSC | | | 280 | | | | 21,537 | | |
Energy (0.1%): | |
Tatneft PJSC | | | 1,669 | | | | 11,600 | | |
Financials (0.3%): | |
Moscow Exchange MICEX PJSC | | | 11,618 | | | | 25,155 | | |
Materials (1.1%): | |
Alrosa PJSC | | | 19,976 | | | | 26,653 | | |
MMC Norilsk Nickel PJSC | | | 62 | | | | 19,935 | | |
See notes to financial statements.
65
Victory Portfolios II
VictoryShares Emerging Market Volatility Wtd ETF | | Schedule of Portfolio Investments — continued
December 31, 2020 | |
(Unaudited)
Security Description | | Shares | | Value | |
PhosAgro PJSC, GDR | | | 1,861 | | | $ | 25,384 | | |
Severstal PJSC | | | 2,050 | | | | 36,591 | | |
| | | | 108,563 | | |
Utilities (0.6%): | |
Federal Grid Co. Unified Energy System PJSC | | | 6,358,380 | | | | 19,162 | | |
Inter RAO UES PJSC | | | 231,737 | | | | 16,705 | | |
RusHydro PJSC | | | 1,554,847 | | | | 16,503 | | |
| | | | 52,370 | | |
| | | | 288,369 | | |
South Africa (4.8%): | |
Communication Services (0.8%): | |
MTN Group Ltd. | | | 2,356 | | | | 9,655 | | |
MultiChoice Group | | | 3,239 | | | | 29,551 | | |
Naspers Ltd., Class N | | | 95 | | | | 19,529 | | |
Vodacom Group Ltd. | | | 2,592 | | | | 21,952 | | |
| | | | 80,687 | | |
Consumer Discretionary (0.5%): | |
Mr. Price Group Ltd. | | | 1,890 | | | | 21,959 | | |
Pepkor Holdings Ltd. (b) | | | 23,438 | | | | 21,751 | | |
| | | | 43,710 | | |
Consumer Staples (1.2%): | |
Bid Corp. Ltd. | | | 910 | | | | 16,297 | | |
Clicks Group Ltd. | | | 1,248 | | | | 21,469 | | |
Shoprite Holdings Ltd. | | | 2,499 | | | | 23,820 | | |
The SPAR Group Ltd. | | | 2,064 | | | | 26,636 | | |
Tiger Brands Ltd. | | | 1,652 | | | | 23,415 | | |
| | | | 111,637 | | |
Energy (0.2%): | |
Exxaro Resources Ltd. | | | 1,729 | | | | 16,351 | | |
Financials (1.1%): | |
Absa Group Ltd. | | | 2,278 | | | | 18,590 | | |
Capitec Bank Holdings Ltd. (a) | | | 164 | | | | 15,997 | | |
Discovery Ltd. | | | 1,486 | | | | 15,534 | | |
FirstRand Ltd. | | | 5,530 | | | | 19,217 | | |
Sanlam Ltd. | | | 4,061 | | | | 16,244 | | |
Standard Bank Group Ltd. | | | 1,868 | | | | 16,163 | | |
| | | | 101,745 | | |
Health Care (0.2%): | |
Aspen Pharmacare Holdings Ltd. (a) | | | 1,742 | | | | 14,870 | | |
Industrials (0.2%): | |
The Bidvest Group Ltd. | | | 1,842 | | | | 19,692 | | |
Materials (0.6%): | |
African Rainbow Minerals Ltd. | | | 880 | | | | 15,693 | | |
Anglo American Platinum Ltd. | | | 112 | | | | 11,005 | | |
AngloGold Ashanti Ltd. | | | 291 | | | | 6,786 | | |
See notes to financial statements.
66
Victory Portfolios II
VictoryShares Emerging Market Volatility Wtd ETF | | Schedule of Portfolio Investments — continued
December 31, 2020 | |
(Unaudited)
Security Description | | Shares | | Value | |
Gold Fields Ltd. | | | 601 | | | $ | 5,629 | | |
Impala Platinum Holdings Ltd. | | | 766 | | | | 10,530 | | |
Northam Platinum Ltd. (a) | | | 821 | | | | 11,712 | | |
| | | | 61,355 | | |
| | | | 450,047 | | |
Taiwan (19.6%): | |
Communication Services (1.6%): | |
Chunghwa Telecom Co. Ltd. | | | 18,000 | | | | 69,830 | | |
Far EasTone Telecommunications Co. Ltd. | | | 18,000 | | | | 39,207 | | |
Taiwan Mobile Co. Ltd. | | | 12,000 | | | | 42,239 | | |
| | | | 151,276 | | |
Consumer Discretionary (1.8%): | |
Cheng Shin Rubber Industry Co. Ltd. | | | 17,000 | | | | 26,652 | | |
Eclat Textile Co. Ltd. | | | 1,000 | | | | 15,037 | | |
Feng TAY Enterprise Co. Ltd. | | | 2,920 | | | | 20,733 | | |
Giant Manufacturing Co. Ltd. | | | 1,373 | | | | 13,438 | | |
Hotai Motor Co. Ltd. | | | 1,000 | | | | 22,885 | | |
Merida Industry Co. Ltd. | | | 1,000 | | | | 8,400 | | |
momo.com, Inc. | | | 1,000 | | | | 22,671 | | |
Nien Made Enterprise Co. Ltd. | | | 1,215 | | | | 14,097 | | |
Pou Chen Corp. | | | 21,000 | | | | 23,469 | | |
| | | | 167,382 | | |
Consumer Staples (0.7%): | |
President Chain Store Corp. | | | 4,000 | | | | 37,940 | | |
Uni-President Enterprises Corp. | | | 13,000 | | | | 31,231 | | |
| | | | 69,171 | | |
Financials (5.0%): | |
Cathay Financial Holding Co. Ltd. | | | 25,000 | | | | 37,593 | | |
Chailease Holding Co. Ltd. | | | 3,960 | | | | 23,678 | | |
Chang Hwa Commercial Bank Ltd. | | | 46,306 | | | | 29,583 | | |
China Development Financial Holding Corp. | | | 91,000 | | | | 30,121 | | |
China Life Insurance Co. Ltd. | | | 28,620 | | | | 22,613 | | |
CTBC Financial Holding Co. Ltd. | | | 40,800 | | | | 28,607 | | |
E.Sun Financial Holding Co. Ltd. | | | 25,748 | | | | 23,414 | | |
First Financial Holding Co. Ltd. | | | 36,831 | | | | 27,987 | | |
Fubon Financial Holding Co. Ltd. | | | 19,000 | | | | 31,614 | | |
Hua Nan Financial Holdings Co. Ltd. | | | 46,700 | | | | 30,333 | | |
Mega Financial Holding Co. Ltd. | | | 33,000 | | | | 35,000 | | |
Shin Kong Financial Holding Co. Ltd. | | | 77,000 | | | | 24,144 | | |
Sinopac Financial Holdings Co. Ltd. | | | 67,792 | | | | 27,626 | | |
Taishin Financial Holding Co. Ltd. | | | 56,008 | | | | 26,412 | | |
Taiwan Cooperative Financial Holding Co. Ltd. | | | 41,472 | | | | 30,037 | | |
The Shanghai Commercial & Savings Bank Ltd. | | | 14,274 | | | | 20,880 | | |
Yuanta Financial Holding Co. Ltd. | | | 33,800 | | | | 24,721 | | |
| | | | 474,363 | | |
See notes to financial statements.
67
Victory Portfolios II
VictoryShares Emerging Market Volatility Wtd ETF | | Schedule of Portfolio Investments — continued
December 31, 2020 | |
(Unaudited)
Security Description | | Shares | | Value | |
Industrials (1.3%): | |
Evergreen Marine Corp. Ltd. (a) | | | 30,000 | | | $ | 43,457 | | |
Far Eastern New Century Corp. | | | 24,000 | | | | 24,729 | | |
Hiwin Technologies Corp. (c) | | | 1,374 | | | | 18,803 | | |
Taiwan High Speed Rail Corp. | | | 23,000 | | | | 25,949 | | |
Voltronic Power Technology Corp. | | | 200 | | | | 7,972 | | |
| | | | 120,910 | | |
Information Technology (7.7%): | |
Accton Technology Corp. | | | 3,000 | | | | 33,740 | | |
Acer, Inc. | | | 25,000 | | | | 21,043 | | |
Advantech Co. Ltd. | | | 2,098 | | | | 26,135 | | |
ASE Technology Holding Co. Ltd. | | | 7,895 | | | | 22,845 | | |
ASMedia Technology, Inc. | | | 53 | | | | 2,962 | | |
Asustek Computer, Inc. | | | 3,000 | | | | 26,747 | | |
Catcher Technology Co. Ltd. | | | 3,000 | | | | 21,995 | | |
Chroma ATE, Inc. | | | 3,000 | | | | 17,938 | | |
Compal Electronics, Inc. | | | 48,000 | | | | 35,363 | | |
Delta Electronics, Inc. | | | 3,000 | | | | 28,081 | | |
Foxconn Technology Co. Ltd. | | | 13,100 | | | | 24,897 | | |
Hon Hai Precision Industry Co. Ltd. | | | 9,400 | | | | 30,779 | | |
Inventec Corp. | | | 32,000 | | | | 27,334 | | |
Lite-On Technology Corp. | | | 14,650 | | | | 25,966 | | |
MediaTek, Inc. | | | 1,000 | | | | 26,587 | | |
Micro-Star International Co. Ltd. | | | 4,000 | | | | 18,863 | | |
Nan Ya Printed Circuit Board Corp. | | | 3,000 | | | | 19,433 | | |
Nanya Technology Corp. | | | 8,000 | | | | 24,714 | | |
Novatek Microelectronics Corp. | | | 2,000 | | | | 26,266 | | |
Pegatron Corp. | | | 9,000 | | | | 21,558 | | |
Quanta Computer, Inc. | | | 8,000 | | | | 23,035 | | |
Realtek Semiconductor Corp. | | | 1,000 | | | | 13,898 | | |
Synnex Technology International Corp. | | | 18,531 | | | | 30,998 | | |
Taiwan Semiconductor Manufacturing Co. Ltd. | | | 1,000 | | | | 18,863 | | |
Unimicron Technology Corp. | | | 5,000 | | | | 15,553 | | |
United Microelectronics Corp. | | | 26,698 | | | | 44,802 | | |
Walsin Technology Corp. | | | 2,000 | | | | 16,407 | | |
Wistron Corp. | | | 15,000 | | | | 16,550 | | |
WPG Holdings Ltd. | | | 19,000 | | | | 29,010 | | |
Yageo Corp. | | | 1,198 | | | | 22,087 | | |
Zhen Ding Technology Holding Ltd. | | | 3,000 | | | | 12,172 | | |
| | | | 726,621 | | |
Materials (1.5%): | |
Asia Cement Corp. | | | 17,000 | | | | 26,138 | | |
Formosa Chemicals & Fibre | | | 10,000 | | | | 30,146 | | |
Formosa Plastics Corp. | | | 9,004 | | | | 30,892 | | |
Nan Ya Plastics Corp. | | | 10,000 | | | | 25,590 | | |
Taiwan Cement Corp. | | | 17,424 | | | | 26,790 | | |
| | | | 139,556 | | |
| | | | 1,849,279 | | |
See notes to financial statements.
68
Victory Portfolios II
VictoryShares Emerging Market Volatility Wtd ETF | | Schedule of Portfolio Investments — continued
December 31, 2020 | |
(Unaudited)
Security Description | | Shares | | Value | |
Thailand (6.1%): | |
Communication Services (0.9%): | |
Advanced Info Service PCL | | | 4,200 | | | $ | 24,676 | | |
Intouch Holdings PCL | | | 11,700 | | | | 21,970 | | |
Total Access Communication PCL | | | 11,600 | | | | 12,876 | | |
True Corp. PCL | | | 141,500 | | | | 16,249 | | |
VGI PCL | | | 49,900 | | | | 11,078 | | |
| | | | 86,849 | | |
Consumer Discretionary (0.2%): | |
Home Product Center PCL | | | 27,600 | | | | 12,623 | | |
Siam Global House PCL | | | 18,613 | | | | 10,563 | | |
| | | | 23,186 | | |
Consumer Staples (1.0%): | |
Berli Jucker PCL | | | 11,600 | | | | 13,457 | | |
Carabao Group PCL | | | 3,100 | | | | 11,849 | | |
Charoen Pokphand Foods PCL | | | 15,200 | | | | 13,573 | | |
| CP ALL PCL | | | 12,700 | | | | 24,696 | | |
Osotspa PCL | | | 11,100 | | | | 13,154 | | |
Thai Union Group PCL | | | 34,700 | | | | 15,754 | | |
| | | | 92,483 | | |
Energy (0.3%): | |
PTT Exploration & Production PCL | | | 3,500 | | | | 11,479 | | |
PTT PCL | | | 10,800 | | | | 15,323 | | |
| | | | 26,802 | | |
Financials (0.9%): | |
Bangkok Bank PCL | | | 4,200 | | | | 16,615 | | |
Kasikornbank PCL | | | 4,600 | | | | 17,352 | | |
Krung Thai Bank PCL | | | 50,800 | | | | 18,824 | | |
Muangthai Capital PCL | | | 6,400 | | | | 12,605 | | |
The Siam Commercial Bank PCL | | | 5,800 | | | | 16,942 | | |
| | | | 82,338 | | |
Health Care (0.4%): | |
Bangkok Dusit Medical Services PCL | | | 26,800 | | | | 18,609 | | |
Bumrungrad Hospital PCL | | | 4,800 | | | | 19,228 | | |
| | | | 37,837 | | |
Industrials (0.5%): | |
Airports of Thailand PCL | | | 7,600 | | | | 15,793 | | |
Bangkok Expressway & Metro PCL | | | 53,800 | | | | 14,907 | | |
BTS Group Holdings PCL | | | 45,100 | | | | 14,002 | | |
| | | | 44,702 | | |
Information Technology (0.5%): | |
Delta Electronics Thailand PCL | | | 2,700 | | | | 43,805 | | |
See notes to financial statements.
69
Victory Portfolios II
VictoryShares Emerging Market Volatility Wtd ETF | | Schedule of Portfolio Investments — continued
December 31, 2020 | |
(Unaudited)
Security Description | | Shares | | Value | |
Materials (0.4%): | |
The Siam Cement PCL | | | 1,550 | | | $ | 19,559 | | |
TOA Paint Thailand PCL | | | 12,700 | | | | 14,203 | | |
| | | | 33,762 | | |
Real Estate (0.1%): | |
Central Pattana PCL | | | 8,000 | | | | 12,752 | | |
Utilities (0.9%): | |
B Grimm Power PCL | | | 8,000 | | | | 12,953 | | |
Electricity Generating PCL | | | 2,100 | | | | 13,495 | | |
Energy Absolute PCL | | | 9,700 | | | | 15,948 | | |
Global Power Synergy PCL | | | 5,800 | | | | 14,279 | | |
Gulf Energy Development PCL | | | 13,200 | | | | 15,092 | | |
Ratch Group PCL | | | 9,129 | | | | 16,152 | | |
| | | | 87,919 | | |
| | | | 572,435 | | |
Turkey (3.2%): | |
Communication Services (0.3%): | |
Turkcell Iletisim Hizmetleri A/S | | | 10,375 | | | | 22,503 | | |
Consumer Discretionary (0.5%): | |
Arcelik A/S (a) | | | 6,160 | | | | 25,227 | | |
Ford Otomotiv Sanayi A/S | | | 1,334 | | | | 22,644 | | |
| | | | 47,871 | | |
Consumer Staples (0.2%): | |
BIM Birlesik Magazalar A/S | | | 1,890 | | | | 19,223 | | |
Financials (0.8%): | |
Akbank TAS (a) | | | 27,406 | | | | 25,586 | | |
Turkiye Garanti Bankasi A/S (a) | | | 17,475 | | | | 24,413 | | |
Turkiye Is Bankasi A/S (a) | | | 26,838 | | | | 25,308 | | |
| | | | 75,307 | | |
Industrials (1.0%): | |
Aselsan Elektronik Sanayi Ve Ticaret A/S | | | 6,564 | | | | 16,138 | | |
Enka Insaat ve Sanayi A/S | | | 19,085 | | | | 18,948 | | |
KOC Holding A/S | | | 8,648 | | | | 24,605 | | |
Turk Hava Yollari AO (a) | | | 10,201 | | | | 17,742 | | |
Turkiye Sise ve Cam Fabrikalari A/S | | | 19,317 | | | | 19,023 | | |
| | | | 96,456 | | |
Materials (0.4%): | |
Eregli Demir ve Celik Fabrikalari TAS | | | 18,420 | | | | 37,049 | | |
| | | | 298,409 | | |
Total Common Stocks (Cost $6,928,446) | | | 9,474,566 | | |
Total Investments (Cost $6,928,446) — 100.2% | | | 9,474,566 | | |
Liabilities in excess of other assets — (0.2)% | | | (14,830 | ) | |
NET ASSETS — 100.00% | | $ | 9,459,736 | | |
See notes to financial statements.
70
Victory Portfolios II
VictoryShares Emerging Market Volatility Wtd ETF | | Schedule of Portfolio Investments — continued
December 31, 2020 | |
(Unaudited)
(a) Non-income producing security.
(b) Rule 144A security or other security that is restricted as to resale to institutional investors. The Fund's Adviser has deemed this security to be liquid based upon procedures approved by the Board of Trustees. As of December 31, 2020, the fair value of these securities was $346,759 and amounted to 3.7% of net assets.
(c) The Fund's Adviser has deemed this security to be illiquid based upon procedures approved by the Board of Trustees. As of December 31, 2020, illiquid securities were 0.2% of the Fund's net assets.
GDR — Global Depositary Receipt
PCL — Public Company Limited
PLC — Public Limited Company
See notes to financial statements.
71
Victory Portfolios II
VictoryShares US Large Cap High Div Volatility Wtd ETF | | Schedule of Portfolio Investments
December 31, 2020 | |
(Unaudited)
Security Description | | Shares | | Value | |
Common Stocks (99.6%) | |
Banks (10.5%): | |
Citigroup, Inc. | | | 23,320 | | | $ | 1,437,911 | | |
Citizens Financial Group, Inc. | | | 41,863 | | | | 1,497,021 | | |
Fifth Third Bancorp | | | 53,096 | | | | 1,463,857 | | |
Huntington Bancshares, Inc. | | | 138,003 | | | | 1,742,978 | | |
JPMorgan Chase & Co. | | | 14,976 | | | | 1,902,999 | | |
KeyCorp | | | 88,358 | | | | 1,449,955 | | |
M&T Bank Corp. | | | 13,606 | | | | 1,732,044 | | |
Regions Financial Corp. | | | 101,860 | | | | 1,641,983 | | |
The PNC Financial Services Group, Inc. | | | 12,679 | | | | 1,889,171 | | |
Truist Financial Corp. | | | 31,426 | | | | 1,506,248 | | |
U.S. Bancorp | | | 38,492 | | | | 1,793,342 | | |
Wells Fargo & Co. | | | 55,345 | | | | 1,670,312 | | |
| | | | 19,727,821 | | |
Capital Markets (5.7%): | |
Ares Management Corp., Class A | | | 37,369 | | | | 1,758,211 | | |
Franklin Resources, Inc. | | | 74,194 | | | | 1,854,108 | | |
Northern Trust Corp. | | | 19,065 | | | | 1,775,714 | | |
State Street Corp. | | | 20,562 | | | | 1,496,502 | | |
The Bank of New York Mellon Corp. | | | 46,172 | | | | 1,959,541 | | |
The Blackstone Group, Inc., Class A | | | 28,310 | | | | 1,834,771 | | |
| | | | 10,678,847 | | |
Communication Services (6.5%): | |
AT&T, Inc. | | | 75,456 | | | | 2,170,115 | | |
CenturyLink, Inc. | | | 141,928 | | | | 1,383,798 | | |
Omnicom Group, Inc. | | | 32,799 | | | | 2,045,674 | | |
The Interpublic Group of Cos., Inc. | | | 80,656 | | | | 1,897,029 | | |
Verizon Communications, Inc. | | | 53,750 | | | | 3,157,812 | | |
ViacomCBS, Inc., Class B | | | 39,100 | | | | 1,456,866 | | |
| | | | 12,111,294 | | |
Consumer Discretionary (5.8%): | |
General Motors Co. | | | 45,051 | | | | 1,875,924 | | |
Genuine Parts Co. | | | 16,394 | | | | 1,646,449 | | |
Hasbro, Inc. | | | 18,615 | | | | 1,741,247 | | |
Las Vegas Sands Corp. | | | 27,442 | | | | 1,635,543 | | |
Vail Resorts, Inc. | | | 7,465 | | | | 2,082,437 | | |
VF Corp. | | | 21,406 | | | | 1,828,286 | | |
| | | | 10,809,886 | | |
Consumer Finance (2.5%): | |
Ally Financial, Inc. | | | 45,700 | | | | 1,629,662 | | |
Discover Financial Services | | | 17,892 | | | | 1,619,763 | | |
Synchrony Financial | | | 42,927 | | | | 1,489,996 | | |
| | | | 4,739,421 | | |
See notes to financial statements.
72
Victory Portfolios II
VictoryShares US Large Cap High Div Volatility Wtd ETF | | Schedule of Portfolio Investments — continued
December 31, 2020 | |
(Unaudited)
Security Description | | Shares | | Value | |
Consumer Staples (10.5%): | |
Archer-Daniels-Midland Co. | | | 45,446 | | | $ | 2,290,933 | | |
General Mills, Inc. | | | 41,282 | | | | 2,427,381 | | |
Kellogg Co. | | | 35,938 | | | | 2,236,422 | | |
PepsiCo, Inc. | | | 15,312 | | | | 2,270,770 | | |
Philip Morris International, Inc. | | | 25,535 | | | | 2,114,043 | | |
Sysco Corp. | | | 19,631 | | | | 1,457,798 | | |
The Coca-Cola Co. | | | 47,539 | | | | 2,607,038 | | |
The J.M. Smucker Co. | | | 20,550 | | | | 2,375,580 | | |
Walgreens Boots Alliance, Inc. | | | 46,995 | | | | 1,874,161 | | |
| | | | 19,654,126 | | |
Energy (4.9%): | |
ConocoPhillips | | | 30,607 | | | | 1,223,974 | | |
EOG Resources, Inc. | | | 25,496 | | | | 1,271,486 | | |
Exxon Mobil Corp. | | | 40,839 | | | | 1,683,383 | | |
Kinder Morgan, Inc. | | | 104,118 | | | | 1,423,293 | | |
ONEOK, Inc. | | | 31,134 | | | | 1,194,923 | | |
The Williams Cos., Inc. | | | 59,287 | | | | 1,188,704 | | |
Valero Energy Corp. | | | 21,370 | | | | 1,208,901 | | |
| | | | 9,194,664 | | |
Health Care (5.4%): | |
AbbVie, Inc. | | | 25,324 | | | | 2,713,467 | | |
CVS Health Corp. | | | 34,535 | | | | 2,358,741 | | |
Merck & Co., Inc. | | | 29,643 | | | | 2,424,797 | | |
Pfizer, Inc. | | | 66,911 | | | | 2,462,994 | | |
| | | | 9,959,999 | | |
Industrials (6.5%): | |
3M Co. | | | 13,086 | | | | 2,287,302 | | |
Caterpillar, Inc. | | | 13,023 | | | | 2,370,447 | | |
Eaton Corp. PLC | | | 14,991 | | | | 1,801,019 | | |
Emerson Electric Co. | | | 21,565 | | | | 1,733,179 | | |
General Dynamics Corp. | | | 13,490 | | | | 2,007,582 | | |
Snap-on, Inc. | | | 11,289 | | | | 1,931,999 | | |
| | | | 12,131,528 | | |
Information Technology (9.9%): | |
Broadcom, Inc. | | | 4,468 | | | | 1,956,314 | | |
Cisco Systems, Inc. | | | 45,016 | | | | 2,014,466 | | |
HP, Inc. | | | 73,908 | | | | 1,817,398 | | |
International Business Machines Corp. | | | 16,301 | | | | 2,051,970 | | |
Juniper Networks, Inc. | | | 92,172 | | | | 2,074,792 | | |
NetApp, Inc. | | | 33,627 | | | | 2,227,452 | | |
Paychex, Inc. | | | 21,343 | | | | 1,988,741 | | |
Seagate Technology PLC | | | 39,115 | | | | 2,431,388 | | |
The Western Union Co. | | | 80,226 | | | | 1,760,158 | | |
| | | | 18,322,679 | | |
See notes to financial statements.
73
Victory Portfolios II
VictoryShares US Large Cap High Div Volatility Wtd ETF | | Schedule of Portfolio Investments — continued
December 31, 2020 | |
(Unaudited)
Security Description | | Shares | | Value | |
Insurance (6.9%): | |
Aflac, Inc. | | | 38,044 | | | $ | 1,691,817 | | |
Cincinnati Financial Corp. | | | 17,823 | | | | 1,557,196 | | |
Fidelity National Financial, Inc. | | | 44,674 | | | | 1,746,306 | | |
Lincoln National Corp. | | | 23,865 | | | | 1,200,648 | | |
MetLife, Inc. | | | 35,130 | | | | 1,649,354 | | |
Principal Financial Group, Inc. | | | 29,522 | | | | 1,464,586 | | |
The Hartford Financial Services Group, Inc. | | | 30,668 | | | | 1,502,119 | | |
The Travelers Cos., Inc. | | | 14,305 | | | | 2,007,992 | | |
| | | | 12,820,018 | | |
Materials (7.5%): | |
CF Industries Holdings, Inc. | | | 43,409 | | | | 1,680,362 | | |
Eastman Chemical Co. | | | 22,050 | | | | 2,211,174 | | |
International Paper Co. | | | 43,427 | | | | 2,159,190 | | |
LyondellBasell Industries NV, Class A | | | 17,898 | | | | 1,640,531 | | |
Nucor Corp. | | | 36,798 | | | | 1,957,286 | | |
Packaging Corp. of America | | | 17,621 | | | | 2,430,112 | | |
Westrock Co. | | | 40,505 | | | | 1,763,183 | | |
| | | | 13,841,838 | | |
Utilities (17.0%): | |
American Electric Power Co., Inc. | | | 26,012 | | | | 2,166,019 | | |
Consolidated Edison, Inc. | | | 26,964 | | | | 1,948,688 | | |
Dominion Energy, Inc. | | | 22,026 | | | | 1,656,355 | | |
DTE Energy Co. | | | 14,077 | | | | 1,709,089 | | |
Duke Energy Corp. | | | 23,998 | | | | 2,197,257 | | |
Edison International | | | 33,686 | | | | 2,116,155 | | |
Entergy Corp. | | | 17,083 | | | | 1,705,567 | | |
Evergy, Inc. | | | 29,718 | | | | 1,649,646 | | |
Exelon Corp. | | | 43,657 | | | | 1,843,199 | | |
FirstEnergy Corp. | | | 52,533 | | | | 1,608,035 | | |
Pinnacle West Capital Corp. | | | 24,682 | | | | 1,973,326 | | |
PPL Corp. | | | 60,647 | | | | 1,710,245 | | |
Public Service Enterprise Group, Inc. | | | 37,696 | | | | 2,197,677 | | |
Sempra Energy | | | 13,665 | | | | 1,741,058 | | |
The AES Corp. | | | 75,902 | | | | 1,783,697 | | |
The Southern Co. | | | 32,308 | | | | 1,984,680 | | |
UGI Corp. | | | 45,737 | | | | 1,598,966 | | |
| | | | 31,589,659 | | |
Total Common Stocks (Cost $173,077,090) | | | 185,581,780 | | |
Total Investments (Cost $173,077,090) — 99.6% | | | 185,581,780 | | |
Other assets in excess of liabilities — 0.4% | | | 712,626 | | |
NET ASSETS — 100.00% | | $ | 186,294,406 | | |
PLC — Public Limited Company
See notes to financial statements.
74
Victory Portfolios II
VictoryShares US Large Cap High Div Volatility Wtd ETF | | Schedule of Portfolio Investments — continued
December 31, 2020 | |
(Unaudited)
Futures Contracts Purchased
| | | Number of
Contracts | | Expiration
Date | | Notional
Amount | | Value | | Unrealized
Appreciation
(Depreciation) | |
E-Mini S&P 500 Futures | | | 2 | | | 3/19/21 | | $ | 369,321 | | | $ | 374,880 | | | $ | 5,559 | | |
| | | Total unrealized appreciation | | | | | | | | $ | 5,559 | | |
| | | Total unrealized depreciation | | | | | | | | | — | | |
| | | Total net unrealized appreciation (depreciation) | | | | | | | | $ | 5,559 | | |
See notes to financial statements.
75
Victory Portfolios II
VictoryShares US Small Cap High Div Volatility Wtd ETF | | Schedule of Portfolio Investments
December 31, 2020 | |
(Unaudited)
Security Description | | Shares | | Value | |
Common Stocks (99.5%) | |
Communication Services (2.1%): | |
National CineMedia, Inc. | | | 123,837 | | | $ | 460,674 | | |
Sinclair Broadcast Group, Inc., Class A (a) | | | 30,097 | | | | 958,589 | | |
Telephone & Data Systems, Inc. | | | 37,689 | | | | 699,885 | | |
| | | | 2,119,148 | | |
Consumer Discretionary (9.7%): | |
Big Lots, Inc. (a) | | | 10,537 | | | | 452,353 | | |
Brinker International, Inc. | | | 8,904 | | | | 503,699 | | |
Dana, Inc. | | | 38,629 | | | | 754,038 | | |
Dave & Buster's Entertainment, Inc. | | | 18,280 | | | | 548,766 | | |
Franchise Group, Inc. (a) | | | 17,330 | | | | 527,699 | | |
H&R Block, Inc. | | | 54,841 | | | | 869,778 | | |
Kontoor Brands, Inc. | | | 28,865 | | | | 1,170,765 | | |
MDC Holdings, Inc. | | | 14,737 | | | | 716,218 | | |
PetMed Express, Inc. (a) | | | 22,089 | | | | 708,173 | | |
Rent-A-Center, Inc. | | | 25,071 | | | | 959,969 | | |
Steven Madden Ltd. | | | 32,532 | | | | 1,149,030 | | |
The Buckle, Inc. (a) | | | 41,922 | | | | 1,224,122 | | |
| | | | 9,584,610 | | |
Consumer Staples (7.9%): | |
B&G Foods, Inc. (a) | | | 24,794 | | | | 687,538 | | |
Inter Parfums, Inc. | | | 15,920 | | | | 963,001 | | |
Medifast, Inc. | | | 5,310 | | | | 1,042,565 | | |
Nu Skin Enterprises, Inc., Class A | | | 11,248 | | | | 614,478 | | |
SpartanNash Co. | | | 35,793 | | | | 623,156 | | |
Universal Corp. | | | 30,335 | | | | 1,474,584 | | |
Vector Group Ltd. | | | 104,644 | | | | 1,219,103 | | |
Weis Markets, Inc. | | | 27,041 | | | | 1,292,830 | | |
| | | | 7,917,255 | | |
Energy (2.3%): | |
Arch Resources, Inc. | | | 16,976 | | | | 743,039 | | |
Brigham Minerals, Inc. | | | 51,436 | | | | 565,282 | | |
CVR Energy, Inc. | | | 33,839 | | | | 504,201 | | |
Murphy Oil Corp. | | | 35,337 | | | | 427,578 | | |
| | | | 2,240,100 | | |
Financials (24.3%): | |
Associated Bancorp | | | 59,253 | | | | 1,010,264 | | |
B. Riley Financial, Inc. | | | 31,336 | | | | 1,385,678 | | |
BGC Partners, Inc., Class A | | | 263,827 | | | | 1,055,308 | | |
Cathay General Bancorp | | | 31,566 | | | | 1,016,110 | | |
FBL Financial Group, Inc., Class A | | | 18,593 | | | | 976,318 | | |
First Commonwealth Financial Corp. | | | 102,388 | | | | 1,120,125 | | |
First Financial Bancorp | | | 50,745 | | | | 889,560 | | |
First Hawaiian, Inc. | | | 52,481 | | | | 1,237,501 | | |
FNB Corp. | | | 87,030 | | | | 826,785 | | |
Fulton Financial Corp. | | | 81,626 | | | | 1,038,283 | | |
See notes to financial statements.
76
Victory Portfolios II
VictoryShares US Small Cap High Div Volatility Wtd ETF | | Schedule of Portfolio Investments — continued
December 31, 2020 | |
(Unaudited)
Security Description | | Shares | | Value | |
Hope Bancorp, Inc. | | | 98,410 | | | $ | 1,073,653 | | |
Investors Bancorp, Inc. | | | 103,976 | | | | 1,097,987 | | |
Mercury General Corp. | | | 24,652 | | | | 1,287,081 | | |
Navient Corp. | | | 68,335 | | | | 671,050 | | |
Northwest Bancshares, Inc. | | | 102,520 | | | | 1,306,105 | | |
Provident Financial Services, Inc. | | | 54,238 | | | | 974,114 | | |
S&T Bancorp, Inc. | | | 43,167 | | | | 1,072,268 | | |
Safety Insurance Group, Inc. | | | 15,962 | | | | 1,243,440 | | |
Sandy Spring Bancorp, Inc. | | | 33,368 | | | | 1,074,116 | | |
Waddell & Reed Financial, Inc., Class A | | | 68,824 | | | | 1,752,947 | | |
Webster Financial Corp. | | | 23,773 | | | | 1,002,032 | | |
WesBanco, Inc. | | | 38,551 | | | | 1,154,988 | | |
| | | | 24,265,713 | | |
Health Care (1.2%): | |
National Healthcare Corp. | | | 17,644 | | | | 1,171,738 | | |
Industrials (19.6%): | |
ACCO Brands Corp. | | | 120,045 | | | | 1,014,380 | | |
Apogee Enterprises, Inc. | | | 28,197 | | | | 893,281 | | |
Ennis, Inc. | | | 61,122 | | | | 1,091,029 | | |
GATX Corp. | | | 13,588 | | | | 1,130,250 | | |
GrafTech International Ltd. | | | 98,981 | | | | 1,055,137 | | |
H&E Equipment Services, Inc. | | | 32,449 | | | | 967,305 | | |
Healthcare Services Group | | | 37,888 | | | | 1,064,654 | | |
HNI Corp. | | | 23,478 | | | | 809,052 | | |
Hyster-Yale Materials Handling, Inc. | | | 18,844 | | | | 1,122,160 | | |
KAR Auction Services, Inc. | | | 41,192 | | | | 766,583 | | |
Knoll, Inc. | | | 53,790 | | | | 789,637 | | |
Macquarie Infrastructure Corp. | | | 20,225 | | | | 759,449 | | |
McGrath RentCorp | | | 13,373 | | | | 897,328 | | |
National Presto Industries, Inc. | | | 13,156 | | | | 1,163,385 | | |
Steelcase, Inc., Class A | | | 64,639 | | | | 875,858 | | |
Systemax, Inc. | | | 45,556 | | | | 1,635,004 | | |
The Greenbrier Cos., Inc. | | | 24,567 | | | | 893,747 | | |
Trinity Industries, Inc. | | | 47,707 | | | | 1,258,988 | | |
Triton International Ltd. | | | 26,126 | | | | 1,267,372 | | |
| | | | 19,454,599 | | |
Information Technology (4.5%): | |
Benchmark Electronics, Inc. | | | 37,786 | | | | 1,020,600 | | |
Cass Information Systems, Inc. | | | 24,301 | | | | 945,552 | | |
MTS Systems Corp. | | | 23,471 | | | | 1,365,073 | | |
Vishay Intertechnology, Inc. | | | 54,097 | | | | 1,120,349 | | |
| | | | 4,451,574 | | |
Materials (16.2%): | |
Avient Corp. | | | 24,631 | | | | 992,137 | | |
Cabot Corp. | | | 21,957 | | | | 985,430 | | |
Carpenter Technology Corp. | | | 29,172 | | | | 849,489 | | |
Cleveland-Cliffs, Inc. (a) | | | 93,686 | | | | 1,364,068 | | |
Compass Minerals International, Inc. | | | 16,268 | | | | 1,004,061 | | |
See notes to financial statements.
77
Victory Portfolios II
VictoryShares US Small Cap High Div Volatility Wtd ETF | | Schedule of Portfolio Investments — continued
December 31, 2020 | |
(Unaudited)
Security Description | | Shares | | Value | |
Domtar Corp. | | | 24,285 | | | $ | 768,620 | | |
Greif, Inc., Class A | | | 21,743 | | | | 1,019,311 | | |
Kaiser Aluminum Corp. | | | 12,834 | | | | 1,269,283 | | |
Myers Industries, Inc. | | | 40,888 | | | | 849,653 | | |
Orion Engineered Carbons SA | | | 51,808 | | | | 887,989 | | |
Schnitzer Steel Industries, Inc. | | | 39,182 | | | | 1,250,298 | | |
Schweitzer-Mauduit International, Inc. | | | 28,557 | | | | 1,148,277 | | |
Sensient Technologies Corp. | | | 21,105 | | | | 1,556,916 | | |
Tredegar Corp. | | | 62,730 | | | | 1,047,591 | | |
W.R. Grace & Co. | | | 22,102 | | | | 1,211,632 | | |
| | | | 16,204,755 | | |
Real Estate (3.0%): | |
Kennedy-Wilson Holdings, Inc. | | | 60,619 | | | | 1,084,474 | | |
Newmark Group, Inc., Class A | | | 87,910 | | | | 640,864 | | |
The RMR Group, Inc., Class A | | | 31,896 | | | | 1,231,823 | | |
| | | | 2,957,161 | | |
Utilities (8.7%): | |
ALLETE, Inc. | | | 17,367 | | | | 1,075,712 | | |
Avista Corp. | | | 25,118 | | | | 1,008,237 | | |
New Jersey Resources Corp. | | | 25,504 | | | | 906,667 | | |
Northwest Natural Holding Co. | | | 15,936 | | | | 732,897 | | |
NorthWestern Corp. | | | 17,819 | | | | 1,039,025 | | |
Otter Tail Corp. | | | 21,410 | | | | 912,280 | | |
South Jersey Industries, Inc. (a) | | | 41,294 | | | | 889,886 | | |
Spire, Inc. | | | 16,965 | | | | 1,086,438 | | |
Unitil Corp. | | | 23,062 | | | | 1,020,955 | | |
| | | | 8,672,097 | | |
Total Common Stocks (Cost $84,657,095) | | | 99,038,750 | | |
Collateral for Securities Loaned^ (2.9%) | |
BlackRock Liquidity Funds TempFund Portfolio, Institutional Class, 0.08% (b) | | | 49,970 | | | | 49,970 | | |
Fidelity Investments Money Market Government Portfolio I Shares, 0.01% (b) | | | 1,716,755 | | | | 1,716,755 | | |
Goldman Sachs Financial Square Prime Obligations Fund, Institutional Class,
0.04% (b) | | | 24,937 | | | | 24,937 | | |
JPMorgan Prime Money Market Fund, Capital Class, 0.12% (b) | | | 198,843 | | | | 198,843 | | |
Morgan Stanley Institutional Liquidity Prime Portfolio, Institutional Class,
0.09% (b) | | | 894,037 | | | | 894,037 | | |
Total Collateral for Securities Loaned (Cost $2,884,542) | | | 2,884,542 | | |
Total Investments (Cost $87,541,637) — 102.4% | | | 101,923,292 | | |
Liabilities in excess of other assets — (2.4)% | | | (2,407,931 | ) | |
NET ASSETS — 100.00% | | $ | 99,515,361 | | |
^ Purchased with cash collateral from securities on loan.
(a) All or a portion of this security is on loan.
(b) Rate disclosed is the daily yield on December 31, 2020.
See notes to financial statements.
78
Victory Portfolios II
VictoryShares US Small Cap High Div Volatility Wtd ETF | | Schedule of Portfolio Investments — continued
December 31, 2020 | |
(Unaudited)
Futures Contracts Purchased
| | | Number of
Contracts | | Expiration
Date | | Notional
Amount | | Value | | Unrealized
Appreciation
(Depreciation) | |
E-Mini Russell 2000 Index Futures | | | 4 | | | 3/19/21 | | $ | 392,469 | | | $ | 394,960 | | | $ | 2,491 | | |
| | | Total unrealized appreciation | | | | | | | | $ | 2,491 | | |
| | | Total unrealized depreciation | | | | | | | | | — | | |
| | | Total net unrealized appreciation (depreciation) | | | | | | | | $ | 2,491 | | |
See notes to financial statements.
79
Victory Portfolios II
VictoryShares International High Div Volatility Wtd ETF | | Schedule of Portfolio Investments
December 31, 2020 | |
(Unaudited)
Security Description | | Shares | | Value | |
Common Stocks (98.8%) | |
Australia (6.6%): | |
Communication Services (1.3%): | |
Telstra Corp. Ltd. | | | 123,983 | | | $ | 284,788 | | |
Financials (1.9%): | |
Insurance Australia Group Ltd. | | | 57,638 | | | | 208,809 | | |
National Australia Bank Ltd. | | | 12,513 | | | | 217,978 | | |
| | | | 426,787 | | |
Materials (3.4%): | |
BHP Group Ltd. | | | 6,912 | | | | 226,058 | | |
Fortescue Metals Group Ltd. | | | 12,377 | | | | 223,527 | | |
Rio Tinto Ltd. | | | 3,504 | | | | 307,443 | | |
| | | | 757,028 | | |
| | | | 1,468,603 | | |
Austria (1.5%): | |
Energy (0.7%): | |
OMV AG | | | 3,814 | | | | 153,740 | | |
Financials (0.8%): | |
Erste Group Bank AG (a) | | | 5,910 | | | | 180,042 | | |
| | | | 333,782 | | |
Canada (10.2%): | |
Communication Services (2.8%): | |
BCE, Inc. (b) | | | 4,964 | | | | 212,297 | | |
Shaw Communications, Inc., Class B (b) | | | 10,717 | | | | 188,118 | | |
TELUS Corp. (b) (c) | | | 11,441 | | | | 226,627 | | |
| | | | 627,042 | | |
Energy (2.2%): | |
Canadian Natural Resources Ltd. | | | 4,856 | | | | 116,716 | | |
Enbridge, Inc. | | | 4,822 | | | | 154,242 | | |
Pembina Pipeline Corp. (c) | | | 3,593 | | | | 84,976 | | |
TC Energy Corp. | | | 3,198 | | | | 130,036 | | |
| | | | 485,970 | | |
Financials (2.4%): | |
Great-West Lifeco, Inc. | | | 7,469 | | | | 178,113 | | |
Power Corp. of Canada (c) | | | 6,407 | | | | 147,149 | | |
The Bank of Nova Scotia | | | 4,020 | | | | 217,314 | | |
| | | | 542,576 | | |
Materials (1.0%): | |
Nutrien Ltd. | | | 4,557 | | | | 219,274 | | |
See notes to financial statements.
80
Victory Portfolios II
VictoryShares International High Div Volatility Wtd ETF | | Schedule of Portfolio Investments — continued
December 31, 2020 | |
(Unaudited)
Security Description | | Shares | | Value | |
Utilities (1.8%): | |
Algonquin Power & Utilities Corp. | | | 12,117 | | | $ | 199,459 | | |
Emera, Inc. | | | 4,948 | | | | 210,330 | | |
| | | | 409,789 | | |
| | | | 2,284,651 | | |
Finland (3.7%): | |
Financials (0.8%): | |
Nordea Bank Abp (a) | | | 23,714 | | | | 193,834 | | |
Information Technology (0.6%): | |
Nokia Oyj (a) | | | 35,058 | | | | 134,936 | | |
Materials (1.3%): | |
UPM-Kymmene Oyj | | | 7,741 | | | | 288,111 | | |
Utilities (1.0%): | |
Fortum Oyj | | | 9,189 | | | | 221,119 | | |
| | | | 838,000 | | |
France (7.1%): | |
Communication Services (2.1%): | |
Orange SA | | | 22,182 | | | | 263,744 | | |
Publicis Groupe SA | | | 4,314 | | | | 214,786 | | |
| | | | 478,530 | | |
Consumer Discretionary (0.8%): | |
Sodexo SA | | | 2,067 | | | | 174,769 | | |
Financials (2.6%): | |
BNP Paribas SA (a) | | | 3,305 | | | | 174,016 | | |
CNP Assurances | | | 7,672 | | | | 123,514 | | |
Credit Agricole SA | | | 14,094 | | | | 177,666 | | |
Natixis SA (a) | | | 32,794 | | | | 111,721 | | |
| | | | 586,917 | | |
Industrials (1.6%): | |
Alstom SA (a) | | | 3,462 | | | | 197,105 | | |
Bouygues SA | | | 3,586 | | | | 147,396 | | |
| | | | 344,501 | | |
| | | | 1,584,717 | | |
Germany (5.1%): | |
Consumer Discretionary (0.9%): | |
Bayerische Motoren Werke AG | | | 2,280 | | | | 201,161 | | |
Materials (2.0%): | |
BASF SE | | | 2,981 | | | | 235,663 | | |
Evonik Industries AG | | | 6,240 | | | | 203,358 | | |
| | | | 439,021 | | |
See notes to financial statements.
81
Victory Portfolios II
VictoryShares International High Div Volatility Wtd ETF | | Schedule of Portfolio Investments — continued
December 31, 2020 | |
(Unaudited)
Security Description | | Shares | | Value | |
Utilities (2.2%): | |
E.ON SE | | | 21,220 | | | $ | 234,940 | | |
Uniper SE | | | 7,609 | | | | 262,472 | | |
| | | | 497,412 | | |
| | | | 1,137,594 | | |
Hong Kong (8.0%): | |
Consumer Staples (0.8%): | |
WH Group Ltd. (d) | | | 224,866 | | | | 188,544 | | |
Financials (1.3%): | |
Hang Seng Bank Ltd. | | | 17,237 | | | | 297,282 | | |
Industrials (1.1%): | |
CK Hutchison Holdings Ltd. | | | 35,083 | | | | 244,832 | | |
Real Estate (2.5%): | |
Henderson Land Development Co. Ltd. | | | 72,534 | | | | 283,036 | | |
Sino Land Co. Ltd. | | | 205,348 | | | | 267,539 | | |
| | | | 550,575 | | |
Utilities (2.3%): | |
CK Infrastructure Holdings Ltd. | | | 42,835 | | | | 230,138 | | |
Power Assets Holdings Ltd. (b) | | | 52,707 | | | | 285,557 | | |
| | | | 515,695 | | |
| | | | 1,796,928 | | |
Italy (4.8%): | |
Energy (0.9%): | |
Snam SpA | | | 35,755 | | | | 200,946 | | |
Financials (1.9%): | |
Assicurazioni Generali SpA | | | 14,544 | | | | 253,334 | | |
Poste Italiane SpA (d) | | | 17,822 | | | | 181,122 | | |
| | | | 434,456 | | |
Utilities (2.0%): | |
Enel SpA | | | 22,280 | | | | 225,231 | | |
Terna Rete Elettrica Nazionale SpA | | | 29,313 | | | | 223,785 | | |
| | | | 449,016 | | |
| | | | 1,084,418 | | |
Japan (13.1%): | |
Communication Services (1.6%): | |
Softbank Corp. | | | 29,500 | | | | 369,464 | | |
Consumer Discretionary (1.9%): | |
Sekisui House Ltd. | | | 12,100 | | | | 246,126 | | |
Subaru Corp. | | | 9,000 | | | | 179,799 | | |
| | | | 425,925 | | |
Consumer Staples (1.6%): | |
Japan Tobacco, Inc. | | | 17,100 | | | | 348,162 | | |
See notes to financial statements.
82
Victory Portfolios II
VictoryShares International High Div Volatility Wtd ETF | | Schedule of Portfolio Investments — continued
December 31, 2020 | |
(Unaudited)
Security Description | | Shares | | Value | |
Financials (2.3%): | |
Japan Post Holdings Co. Ltd. | | | 33,500 | | | $ | 260,498 | | |
Sumitomo Mitsui Financial Group, Inc. | | | 8,400 | | | | 259,388 | | |
| | | | 519,886 | | |
Health Care (1.1%): | |
Takeda Pharmaceutical Co. Ltd. | | | 6,600 | | | | 240,052 | | |
Industrials (3.6%): | |
Mitsubishi Corp. | | | 12,700 | | | | 312,579 | | |
Mitsui & Co. Ltd. | | | 13,500 | | | | 247,077 | | |
Sumitomo Corp. | | | 18,500 | | | | 244,690 | | |
| | | | 804,346 | | |
Information Technology (1.0%): | |
Canon, Inc. (c) | | | 12,000 | | | | 229,911 | | |
| | | | 2,937,746 | | |
Korea, Republic Of (4.6%): | |
Consumer Staples (1.3%): | |
KT&G Corp. | | | 3,779 | | | | 289,113 | | |
Financials (1.8%): | |
KB Financial Group, Inc. | | | 5,093 | | | | 203,495 | | |
Shinhan Financial Group Co. Ltd. | | | 6,912 | | | | 203,949 | | |
| | | | 407,444 | | |
Materials (1.5%): | |
POSCO | | | 1,290 | | | | 323,035 | | |
| | | | 1,019,592 | | |
Macau (0.8%): | |
Consumer Discretionary (0.8%): | |
Sands China Ltd. | | | 42,414 | | | | 186,295 | | |
Netherlands (4.1%): | |
Communication Services (1.1%): | |
Koninklijke KPN NV | | | 83,259 | | | | 252,929 | | |
Financials (2.1%): | |
ABN AMRO Bank NV (a) (d) | | | 13,084 | | | | 128,176 | | |
ING Groep NV (a) | | | 15,485 | | | | 144,528 | | |
NN Group NV | | | 4,378 | | | | 190,004 | | |
| | | | 462,708 | | |
Industrials (0.9%): | |
Randstad NV | | | 3,192 | | | | 207,583 | | |
| | | | 923,220 | | |
Norway (3.3%): | |
Communication Services (1.3%): | |
Telenor ASA | | | 17,052 | | | | 290,610 | | |
Consumer Staples (1.0%): | |
Mowi ASA | | | 10,607 | | | | 236,650 | | |
See notes to financial statements.
83
Victory Portfolios II
VictoryShares International High Div Volatility Wtd ETF | | Schedule of Portfolio Investments — continued
December 31, 2020 | |
(Unaudited)
Security Description | | Shares | | Value | |
Financials (1.0%): | |
DNB ASA (a) | | | 11,105 | | | $ | 217,926 | | |
| | | | 745,186 | | |
Portugal (1.2%): | |
Utilities (1.2%): | |
Energias de Portugal SA | | | 41,137 | | | | 259,082 | | |
Singapore (1.4%): | |
Communication Services (1.4%): | |
Singapore Telecommunications Ltd. | | | 171,900 | | | | 300,529 | | |
Spain (4.0%): | |
Industrials (0.7%): | |
Aena SME SA (a) (d) | | | 947 | | | | 164,490 | | |
Utilities (3.3%): | |
Endesa SA | | | 8,146 | | | | 222,389 | | |
Naturgy Energy Group SA | | | 10,574 | | | | 244,889 | | |
Red Electrica Corp. SA | | | 13,275 | | | | 272,012 | | |
| | | | 739,290 | | |
| | | | 903,780 | | |
Sweden (2.2%): | |
Communication Services (1.2%): | |
Telia Co. AB (c) | | | 63,645 | | | | 262,821 | | |
Consumer Staples (1.0%): | |
ICA Gruppen AB | | | 4,581 | | | | 228,888 | | |
| | | | 491,709 | | |
Switzerland (4.2%): | |
Communication Services (1.2%): | |
Swisscom AG, Registered Shares | | | 521 | | | | 280,869 | | |
Financials (1.0%): | |
Zurich Insurance Group AG | | | 511 | | | | 215,659 | | |
Industrials (1.0%): | |
Adecco Group AG | | | 3,278 | | | | 219,126 | | |
Materials (1.0%): | |
LafargeHolcim Ltd. | | | 4,160 | | | | 228,542 | | |
| | | | 944,196 | | |
United Kingdom (12.9%): | |
Communication Services (1.0%): | |
BT Group PLC (a) | | | 120,033 | | | | 217,050 | | |
Consumer Staples (3.7%): | |
British American Tobacco PLC | | | 6,767 | | | | 250,558 | | |
Imperial Brands PLC | | | 12,898 | | | | 270,792 | | |
Tesco PLC | | | 101,457 | | | | 321,002 | | |
| | | | 842,352 | | |
See notes to financial statements.
84
Victory Portfolios II
VictoryShares International High Div Volatility Wtd ETF | | Schedule of Portfolio Investments — continued
December 31, 2020 | |
(Unaudited)
Security Description | | Shares | | Value | |
Financials (2.4%): | |
Legal & General Group PLC | | | 40,577 | | | $ | 147,690 | | |
Natwest Group PLC | | | 96,590 | | | | 221,410 | | |
Phoenix Group Holdings PLC | | | 17,958 | | | | 172,025 | | |
| | | | 541,125 | | |
Health Care (1.1%): | |
GlaxoSmithKline PLC (b) | | | 13,966 | | | | 256,264 | | |
Industrials (0.9%): | |
BAE Systems PLC | | | 30,119 | | | | 201,296 | | |
Materials (1.8%): | |
BHP Group PLC | | | 6,770 | | | | 178,189 | | |
Rio Tinto PLC | | | 2,932 | | | | 219,288 | | |
| | | | 397,477 | | |
Utilities (2.0%): | |
National Grid PLC | | | 20,039 | | | | 237,004 | | |
SSE PLC | | | 10,098 | | | | 207,104 | | |
| | | | 444,108 | | |
| | | | 2,899,672 | | |
Total Common Stocks (Cost $21,321,209) | | | 22,139,700 | | |
Collateral for Securities Loaned^ (1.3%) | |
United States (1.3%): | |
BlackRock Liquidity Funds TempFund Portfolio, Institutional Class, 0.08% (e) | | | 5,169 | | | | 5,169 | | |
Fidelity Investments Money Market Government Portfolio I Shares, 0.01% (e) | | | 177,570 | | | | 177,570 | | |
Goldman Sachs Financial Square Prime Obligations Fund, Institutional Class,
0.04% (e) | | | 2,579 | | | | 2,579 | | |
JPMorgan Prime Money Market Fund, Capital Class, 0.12% (e) | | | 20,567 | | | | 20,567 | | |
Morgan Stanley Institutional Liquidity Prime Portfolio, Institutional Class,
0.09% (e) | | | 92,473 | | | | 92,473 | | |
Total Collateral for Securities Loaned (Cost $298,358) | | | 298,358 | | |
Total Investments (Cost $21,619,567) — 100.1% | | | 22,438,058 | | |
Liabilities in excess of other assets — (0.1)% | | | (29,958 | ) | |
NET ASSETS — 100.00% | | $ | 22,408,100 | | |
^ Purchased with cash collateral from securities on loan.
(a) Non-income producing security.
(b) All or a portion of this security has been segregated as collateral for derivative instruments.
(c) All or a portion of this security is on loan.
(d) Rule 144A security or other security that is restricted as to resale to institutional investors. The Fund's Adviser has deemed this security to be liquid based upon procedures approved by the Board of Trustees. As of December 31, 2020, the fair value of these securities was $662,332 and amounted to 3.0% of net assets.
(e) Rate disclosed is the daily yield on December 31, 2020.
PLC — Public Limited Company
See notes to financial statements.
85
Victory Portfolios II
VictoryShares International High Div Volatility Wtd ETF | | Schedule of Portfolio Investments — continued
December 31, 2020 | |
(Unaudited)
Futures Contracts Purchased
| | | Number of
Contracts | | Expiration
Date | | Notional
Amount | | Value | | Unrealized
Appreciation
(Depreciation) | |
E-Mini MSCI EAFE Index Futures | | | 1 | | | 3/19/21 | | $ | 106,874 | | | $ | 106,540 | | | $ | (334 | ) | |
| | | Total unrealized appreciation | | | | | | | | $ | — | | |
| | | Total unrealized depreciation | | | | | | | | | (334 | ) | |
| | | Total net unrealized appreciation (depreciation) | | | | | | | | $ | (334 | ) | |
See notes to financial statements.
86
Victory Portfolios II
VictoryShares Emerging Market High Div Volatility Wtd ETF | | Schedule of Portfolio Investments
December 31, 2020 | |
(Unaudited)
Security Description | | Shares | | Value | |
Common Stocks (99.0%) | |
Brazil (3.3%): | |
Consumer Discretionary (0.5%): | |
Petrobras Distribuidora SA | | | 21,400 | | | $ | 91,182 | | |
Financials (0.9%): | |
BB Seguridade Participacoes SA | | | 25,847 | | | | 147,454 | | |
Industrials (0.5%): | |
CCR SA | | | 32,466 | | | | 84,200 | | |
Utilities (1.4%): | |
Centrais Eletricas Brasileiras SA | | | 10,600 | | | | 74,839 | | |
Engie Brasil Energia SA | | | 18,600 | | | | 157,358 | | |
| | | | 232,197 | | |
| | | | 555,033 | | |
Chile (1.6%): | |
Utilities (1.6%): | |
Colbun SA | | | 790,708 | | | | 139,815 | | |
Enel Americas SA | | | 784,094 | | | | 128,162 | | |
| | | | 267,977 | | |
China (15.8%): | |
Energy (2.2%): | |
China Petroleum & Chemical Corp., Class H | | | 362,893 | | | | 162,437 | | |
China Shenhua Energy Co. Ltd., Class H | | | 105,953 | | | | 199,545 | | |
| | | | 361,982 | | |
Financials (11.0%): | |
Agricultural Bank of China Ltd., Class H | | | 636,001 | | | | 232,998 | | |
Bank of China Ltd., Class H | | | 724,492 | | | | 247,659 | | |
Bank of Communications Co. Ltd., Class H | | | 419,087 | | | | 221,648 | | |
China CITIC Bank Corp. Ltd., Class H | | | 456,252 | | | | 193,631 | | |
China Everbright Bank Co. Ltd., Class H | | | 394,086 | | | | 149,964 | | |
China Minsheng Banking Corp. Ltd., Class H | | | 404,377 | | | | 230,560 | | |
GF Securities Co. Ltd., Class H | | | 113,489 | | | | 160,450 | | |
Industrial & Commercial Bank of China Ltd., Class H | | | 412,971 | | | | 267,955 | | |
PICC Property & Casualty Co. Ltd., Class H | | | 179,393 | | | | 135,837 | | |
| | | | 1,840,702 | | |
Information Technology (0.8%): | |
China Railway Signal & Communication Corp. Ltd., Class H (a) | | | 381,908 | | | | 128,088 | | |
Utilities (1.8%): | |
CGN Power Co. Ltd., Class H (a) | | | 893,428 | | | | 192,465 | | |
Huaneng Power International, Inc., Class H | | | 303,699 | | | | 110,867 | | |
| | | | 303,332 | | |
| | | | 2,634,104 | | |
See notes to financial statements.
87
Victory Portfolios II
VictoryShares Emerging Market High Div Volatility Wtd ETF | | Schedule of Portfolio Investments — continued
December 31, 2020 | |
(Unaudited)
Security Description | | Shares | | Value | |
Czech Republic (2.6%): | |
Financials (1.2%): | |
Komercni Banka A/S (b) | | | 6,591 | | | $ | 201,929 | | |
Utilities (1.4%): | |
CEZ A/S | | | 9,572 | | | | 229,875 | | |
| | | | 431,804 | | |
Egypt (0.9%): | |
Consumer Staples (0.9%): | |
Eastern Co. SAE | | | 176,169 | | | | 146,508 | | |
Hong Kong (0.6%): | |
Energy (0.6%): | |
CNOOC Ltd. | | | 103,414 | | | | 95,781 | | |
Hungary (1.0%): | |
Energy (1.0%): | |
MOL Hungarian Oil & Gas PLC (b) | | | 22,992 | | | | 169,914 | | |
India (6.3%): | |
Communication Services (1.3%): | |
Indus Towers Ltd. | | | 31,826 | | | | 100,144 | | |
Sun TV Network Ltd. | | | 18,883 | | | | 124,250 | | |
| | | | 224,394 | | |
Consumer Discretionary (1.0%): | |
Bajaj Auto Ltd. | | | 3,442 | | | | 162,250 | | |
Consumer Staples (0.9%): | |
ITC Ltd. | | | 50,265 | | | | 143,786 | | |
Energy (0.7%): | |
Hindustan Petroleum Corp. Ltd. | | | 40,123 | | | | 119,662 | | |
Financials (0.8%): | |
Power Finance Corp. Ltd. | | | 83,034 | | | | 129,900 | | |
Industrials (0.7%): | |
Bharat Electronics Ltd. | | | 69,859 | | | | 114,691 | | |
Utilities (0.9%): | |
Torrent Power Ltd. | | | 35,281 | | | | 153,269 | | |
| | | | 1,047,952 | | |
Indonesia (3.0%): | |
Communication Services (1.0%): | |
PT Telkom Indonesia Persero Tbk | | | 693,722 | | | | 163,549 | | |
Consumer Staples (0.6%): | |
PT Gudang Garam Tbk (b) | | | 34,481 | | | | 100,692 | | |
See notes to financial statements.
88
Victory Portfolios II
VictoryShares Emerging Market High Div Volatility Wtd ETF | | Schedule of Portfolio Investments — continued
December 31, 2020 | |
(Unaudited)
Security Description | | Shares | | Value | |
Energy (1.4%): | |
PT Adaro Energy Tbk | | | 1,200,947 | | | $ | 122,318 | | |
PT United Tractors Tbk | | | 63,828 | | | | 120,928 | | |
| | | | 243,246 | | |
| | | | 507,487 | | |
Malaysia (5.6%): | |
Financials (2.9%): | |
CIMB Group Holdings Bhd | | | 182,100 | | | | 194,783 | | |
Malayan Banking Bhd | | | 136,600 | | | | 287,472 | | |
| | | | 482,255 | | |
Utilities (2.7%): | |
Petronas Gas Bhd | | | 48,700 | | | | 208,126 | | |
Tenaga Nasional Bhd | | | 91,900 | | | | 238,208 | | |
| | | | 446,334 | | |
| | | | 928,589 | | |
Mexico (6.0%): | |
Consumer Staples (0.9%): | |
Kimberly-Clark de Mexico SAB de CV, Class A | | | 93,610 | | | | 159,936 | | |
Financials (1.1%): | |
Grupo Financiero Banorte SAB de CV, Class O (b) | | | 32,348 | | | | 178,745 | | |
Industrials (0.8%): | |
Grupo Aeroportuario del Pacifico SAB de CV, Class B (b) | | | 11,569 | | | | 129,180 | | |
Materials (2.1%): | |
Grupo Mexico SAB de CV, Class B | | | 47,921 | | | | 202,627 | | |
Orbia Advance Corp. SAB de CV | | | 64,179 | | | | 150,815 | | |
| | | | 353,442 | | |
Utilities (1.1%): | |
Infraestructura Energetica Nova SAB de CV (b) | | | 47,502 | | | | 185,215 | | |
| | | | 1,006,518 | | |
Netherlands (0.7%): | |
Consumer Staples (0.7%): | |
X5 Retail Group NV, GDR | | | 3,032 | | | | 109,516 | | |
Philippines (2.0%): | |
Communication Services (1.3%): | |
Globe Telecom, Inc. | | | 2,725 | | | | 115,197 | | |
PLDT, Inc. | | | 3,795 | | | | 105,900 | | |
| | | | 221,097 | | |
Utilities (0.7%): | |
Manila Electric Co. | | | 17,490 | | | | 106,353 | | |
| | | | 327,450 | | |
See notes to financial statements.
89
Victory Portfolios II
VictoryShares Emerging Market High Div Volatility Wtd ETF | | Schedule of Portfolio Investments — continued
December 31, 2020 | |
(Unaudited)
Security Description | | Shares | | Value | |
Poland (2.5%): | |
Financials (2.5%): | |
Bank Polska Kasa Opieki SA (b) | | | 7,975 | | | $ | 130,653 | | |
Powszechny Zaklad Ubezpieczen SA (b) | | | 20,348 | | | | 176,555 | | |
Santander Bank Polska SA (b) | | | 2,360 | | | | 117,510 | | |
| | | | 424,718 | | |
Russian Federation (11.4%): | |
Communication Services (2.4%): | |
Mobile TeleSystems PJSC | | | 47,260 | | | | 212,040 | | |
Rostelecom PJSC | | | 147,210 | | | | 193,220 | | |
| | | | 405,260 | | |
Consumer Staples (1.1%): | |
Magnit PJSC | | | 2,367 | | | | 182,063 | | |
Energy (0.6%): | |
Tatneft PJSC | | | 14,159 | | | | 98,407 | | |
Materials (5.5%): | |
Alrosa PJSC | | | 169,550 | | | | 226,224 | | |
MMC Norilsk Nickel PJSC | | | 522 | | | | 167,842 | | |
PhosAgro PJSC, GDR | | | 15,802 | | | | 215,539 | | |
Severstal PJSC | | | 17,409 | | | | 310,733 | | |
| | | | 920,338 | | |
Utilities (1.8%): | |
Federal Grid Co. Unified Energy System PJSC | | | 54,065,287 | | | | 162,938 | | |
RusHydro PJSC | | | 13,212,548 | | | | 140,236 | | |
| | | | 303,174 | | |
| | | | 1,909,242 | | |
South Africa (8.3%): | |
Communication Services (1.6%): | |
MTN Group Ltd. | | | 19,999 | | | | 81,957 | | |
Vodacom Group Ltd. | | | 22,009 | | | | 186,396 | | |
| | | | 268,353 | | |
Consumer Staples (1.4%): | |
The SPAR Group Ltd. | | | 17,524 | | | | 226,145 | | |
Energy (0.8%): | |
Exxaro Resources Ltd. | | | 14,681 | | | | 138,838 | | |
Financials (2.7%): | |
Absa Group Ltd. | | | 19,344 | | | | 157,860 | | |
FirstRand Ltd. | | | 46,961 | | | | 163,192 | | |
Standard Bank Group Ltd. | | | 15,866 | | | | 137,277 | | |
| | | | 458,329 | | |
Industrials (1.0%): | |
The Bidvest Group Ltd. | | | 15,646 | | | | 167,267 | | |
See notes to financial statements.
90
Victory Portfolios II
VictoryShares Emerging Market High Div Volatility Wtd ETF | | Schedule of Portfolio Investments — continued
December 31, 2020 | |
(Unaudited)
Security Description | | Shares | | Value | |
Materials (0.8%): | |
African Rainbow Minerals Ltd. | | | 7,474 | | | $ | 133,278 | | |
| | | | 1,392,210 | | |
Taiwan (19.5%): | |
Industrials (1.2%): | |
Far Eastern New Century Corp. | | | 201,000 | | | | 207,102 | | |
Information Technology (15.4%): | |
Asustek Computer, Inc. | | | 23,000 | | | | 205,057 | | |
Catcher Technology Co. Ltd. | | | 22,000 | | | | 161,298 | | |
Compal Electronics, Inc. | | | 409,000 | | | | 301,324 | | |
Foxconn Technology Co. Ltd. | | | 111,000 | | | | 210,962 | | |
Inventec Corp. | | | 270,000 | | | | 230,630 | | |
Lite-On Technology Corp. | | | 124,059 | | | | 219,886 | | |
Novatek Microelectronics Corp. | | | 17,000 | | | | 223,262 | | |
Pegatron Corp. | | | 74,000 | | | | 177,250 | | |
Quanta Computer, Inc. | | | 70,000 | | | | 201,552 | | |
Synnex Technology International Corp. | | | 157,000 | | | | 262,626 | | |
Wistron Corp. | | | 124,000 | | | | 136,812 | | |
WPG Holdings Ltd. | | | 159,000 | | | | 242,770 | | |
| | | | 2,573,429 | | |
Materials (2.9%): | |
Asia Cement Corp. | | | 142,000 | | | | 218,330 | | |
Formosa Plastics Corp. | | | 77,773 | | | | 266,837 | | |
| | | | 485,167 | | |
| | | | 3,265,698 | | |
Thailand (5.8%): | |
Communication Services (1.8%): | |
Intouch Holdings PCL | | | 100,100 | | | | 187,966 | | |
Total Access Communication PCL | | | 98,800 | | | | 109,665 | | |
| | | | 297,631 | | |
Energy (1.4%): | |
PTT Exploration & Production PCL | | | 29,100 | | | | 95,444 | | |
PTT PCL | | | 90,600 | | | | 128,540 | | |
| | | | 223,984 | | |
Financials (1.8%): | |
Krung Thai Bank PCL | | | 430,900 | | | | 159,670 | | |
The Siam Commercial Bank PCL | | | 49,800 | | | | 145,465 | | |
| | | | 305,135 | | |
Utilities (0.8%): | |
Ratch Group PCL | | | 76,500 | | | | 135,350 | | |
| | | | 962,100 | | |
Turkey (2.1%): | |
Consumer Discretionary (1.1%): | |
Ford Otomotiv Sanayi A/S | | | 11,331 | | | | 192,335 | | |
See notes to financial statements.
91
Victory Portfolios II
VictoryShares Emerging Market High Div Volatility Wtd ETF | | Schedule of Portfolio Investments — continued
December 31, 2020 | |
(Unaudited)
Security Description | | Shares | | Value | |
Industrials (1.0%): | |
Enka Insaat ve Sanayi A/S | | | 162,069 | | | $ | 160,912 | | |
| | | | 353,247 | | |
Total Common Stocks (Cost $16,289,140) | | | 16,535,848 | | |
Total Investments (Cost $16,289,140) — 99.0% | | | 16,535,848 | | |
Other assets in excess of liabilities — 1.0% | | | 164,606 | | |
NET ASSETS — 100.00% | | $ | 16,700,454 | | |
(a) Rule 144A security or other security that is restricted as to resale to institutional investors. The Fund's Adviser has deemed this security to be liquid based upon procedures approved by the Board of Trustees. As of December 31, 2020, the fair value of these securities was $320,553 and amounted to 1.9% of net assets.
(b) Non-income producing security.
GDR — Global Depositary Receipt
PCL — Public Company Limited
PLC — Public Limited Company
Futures Contracts Purchased
| | | Number of
Contracts | | Expiration
Date | | Notional
Amount | | Value | | Unrealized
Appreciation
(Depreciation) | |
E-Mini MSCI Emerging Markets
Index Futures | | | 1 | | | 3/19/21 | | $ | 62,269 | | | $ | 64,410 | | | $ | 2,141 | | |
| | | Total unrealized appreciation | | | | | | | | $ | 2,141 | | |
| | | Total unrealized depreciation | | | | | | | | | — | | |
| | | Total net unrealized appreciation (depreciation) | | | | | | | | $ | 2,141 | | |
See notes to financial statements.
92
Victory Portfolios II
VictoryShares Dividend Accelerator ETF | | Schedule of Portfolio Investments
December 31, 2020 | |
(Unaudited)
Security Description | | Shares | | Value | |
Common Stocks (99.6%) | |
Consumer Discretionary (15.8%): | |
Gentex Corp. | | | 219,240 | | | $ | 7,438,813 | | |
Lowe's Cos., Inc. | | | 17,757 | | | | 2,850,176 | | |
McDonald's Corp. | | | 38,908 | | | | 8,348,879 | | |
NIKE, Inc., Class B | | | 47,056 | | | | 6,657,012 | | |
Pool Corp. | | | 13,367 | | | | 4,979,208 | | |
Ross Stores, Inc. | | | 23,251 | | | | 2,855,455 | | |
Target Corp. | | | 57,588 | | | | 10,166,010 | | |
The TJX Cos., Inc. | | | 51,900 | | | | 3,544,251 | | |
VF Corp. | | | 43,007 | | | | 3,673,228 | | |
| | | | 50,513,032 | | |
Consumer Staples (17.5%): | |
Archer-Daniels-Midland Co. | | | 101,882 | | | | 5,135,872 | | |
Brown-Forman Corp., Class B | | | 46,992 | | | | 3,732,575 | | |
Colgate-Palmolive Co. | | | 82,765 | | | | 7,077,235 | | |
Costco Wholesale Corp. | | | 13,748 | | | | 5,179,972 | | |
Hormel Foods Corp. | | | 50,923 | | | | 2,373,521 | | |
Kimberly-Clark Corp. | | | 27,752 | | | | 3,741,802 | | |
Lancaster Colony Corp. | | | 33,560 | | | | 6,165,978 | | |
McCormick & Co., Inc. | | | 24,160 | | | | 2,309,696 | | |
PepsiCo, Inc. | | | 22,007 | | | | 3,263,638 | | |
Sysco Corp. | | | 40,213 | | | | 2,986,217 | | |
The Clorox Co. | | | 15,303 | | | | 3,089,982 | | |
The Coca-Cola Co. | | | 52,985 | | | | 2,905,697 | | |
The Procter & Gamble Co. | | | 26,754 | | | | 3,722,552 | | |
Walmart, Inc. | | | 28,974 | | | | 4,176,602 | | |
| | | | 55,861,339 | | |
Energy (0.8%): | |
Exxon Mobil Corp. | | | 63,715 | | | | 2,626,332 | | |
Financials (16.1%): | |
Aflac, Inc. | | | 87,150 | | | | 3,875,561 | | |
American Financial Group, Inc. | | | 89,854 | | | | 7,873,007 | | |
Brown & Brown, Inc. | | | 52,630 | | | | 2,495,188 | | |
Cincinnati Financial Corp. | | | 15,252 | | | | 1,332,567 | | |
CME Group, Inc. | | | 26,940 | | | | 4,904,427 | | |
Commerce Bancshares, Inc. | | | 60,865 | | | | 3,998,831 | | |
Old Republic International Corp. | | | 62,501 | | | | 1,231,895 | | |
RLI Corp. | | | 40,445 | | | | 4,212,347 | | |
S&P Global, Inc. | | | 3,656 | | | | 1,201,837 | | |
SEI Investments Co. | | | 48,999 | | | | 2,815,973 | | |
T. Rowe Price Group, Inc. | | | 16,926 | | | | 2,562,427 | | |
The Allstate Corp. | | | 52,628 | | | | 5,785,396 | | |
W.R. Berkley Corp. | | | 132,896 | | | | 8,826,951 | | |
| | | | 51,116,407 | | |
See notes to financial statements.
93
Victory Portfolios II
VictoryShares Dividend Accelerator ETF | | Schedule of Portfolio Investments — continued
December 31, 2020 | |
(Unaudited)
Security Description | | Shares | | Value | |
Health Care (9.8%): | |
Chemed Corp. | | | 8,260 | | | $ | 4,399,359 | | |
Humana, Inc. | | | 14,873 | | | | 6,101,946 | | |
Johnson & Johnson | | | 17,621 | | | | 2,773,193 | | |
Medtronic PLC | | | 44,896 | | | | 5,259,117 | | |
Merck & Co., Inc. | | | 53,021 | | | | 4,337,118 | | |
UnitedHealth Group, Inc. | | | 18,503 | | | | 6,488,631 | | |
West Pharmaceutical Services, Inc. | | | 6,964 | | | | 1,972,971 | | |
| | | | 31,332,335 | | |
Industrials (19.3%): | |
3M Co. | | | 43,835 | | | | 7,661,920 | | |
Carlisle Cos., Inc. | | | 19,716 | | | | 3,079,245 | | |
Cintas Corp. | | | 5,221 | | | | 1,845,415 | | |
CSX Corp. | | | 43,705 | | | | 3,966,229 | | |
Dover Corp. | | | 37,664 | | | | 4,755,080 | | |
Emerson Electric Co. | | | 89,209 | | | | 7,169,727 | | |
General Dynamics Corp. | | | 16,515 | | | | 2,457,762 | | |
IDEX Corp. | | | 30,429 | | | | 6,061,457 | | |
Illinois Tool Works, Inc. | | | 18,234 | | | | 3,717,548 | | |
L3Harris Technologies, Inc. | | | 23,327 | | | | 4,409,270 | | |
Nordson Corp. | | | 7,338 | | | | 1,474,571 | | |
Republic Services, Inc. | | | 51,409 | | | | 4,950,686 | | |
Roper Technologies, Inc. | | | 3,726 | | | | 1,606,241 | | |
W.W. Grainger, Inc. | | | 12,323 | | | | 5,031,974 | | |
Waste Management, Inc. | | | 32,800 | | | | 3,868,104 | | |
| | | | 62,055,229 | | |
Information Technology (11.0%): | |
Automatic Data Processing, Inc. | | | 25,047 | | | | 4,413,281 | | |
Intuit, Inc. | | | 19,152 | | | | 7,274,887 | | |
Jack Henry & Associates, Inc. | | | 31,964 | | | | 5,177,848 | | |
Mastercard, Inc., Class A | | | 14,877 | | | | 5,310,196 | | |
Microsoft Corp. | | | 19,930 | | | | 4,432,831 | | |
Texas Instruments, Inc. | | | 30,120 | | | | 4,943,596 | | |
Visa, Inc., Class A | | | 16,472 | | | | 3,602,921 | | |
| | | | 35,155,560 | | |
Materials (5.1%): | |
Air Products & Chemicals, Inc. | | | 11,881 | | | | 3,246,127 | | |
Ecolab, Inc. | | | 10,569 | | | | 2,286,709 | | |
Nucor Corp. | | | 22,183 | | | | 1,179,914 | | |
PPG Industries, Inc. | | | 20,002 | | | | 2,884,688 | | |
Sonoco Products Co. | | | 78,910 | | | | 4,675,418 | | |
The Sherwin-Williams Co. | | | 2,599 | | | | 1,910,031 | | |
| | | | 16,182,887 | | |
See notes to financial statements.
94
Victory Portfolios II
VictoryShares Dividend Accelerator ETF | | Schedule of Portfolio Investments — continued
December 31, 2020 | |
(Unaudited)
Security Description | | Shares | | Value | |
Utilities (4.2%): | |
Consolidated Edison, Inc. | | | 72,445 | | | $ | 5,235,600 | | |
Xcel Energy, Inc. | | | 122,527 | | | | 8,168,875 | | |
| | | | 13,404,475 | | |
Total Common Stocks (Cost $267,942,254) | | | 318,247,596 | | |
Total Investments (Cost $267,942,254) — 99.6% | | | 318,247,596 | | |
Other assets in excess of liabilities — 0.4% | | | 1,188,519 | | |
NET ASSETS — 100.00% | | $ | 319,436,115 | | |
PLC — Public Limited Company
Futures Contracts Purchased
| | | Number of
Contracts | | Expiration
Date | | Notional
Amount | | Value | | Unrealized
Appreciation
(Depreciation) | |
E-Mini S&P 500 Futures | | | 5 | | | 3/19/21 | | $ | 922,633 | | | $ | 937,200 | | | $ | 14,567 | | |
| | | Total unrealized appreciation | | | | | | | | $ | 14,567 | | |
| | | Total unrealized depreciation | | | | | | | | | — | | |
| | | Total net unrealized appreciation (depreciation) | | | | | | | | $ | 14,567 | | |
See notes to financial statements.
95
Victory Portfolios II
VictoryShares US Multi-Factor Minimum Volatility ETF | | Schedule of Portfolio Investments
December 31, 2020 | |
(Unaudited)
Security Description | | Shares | | Value | |
Common Stocks (99.6%) | |
Communication Services (3.1%): | |
Verizon Communications, Inc. | | | 76,704 | | | $ | 4,506,360 | | |
Consumer Discretionary (11.6%): | |
AutoZone, Inc. (a) | | | 2,455 | | | | 2,910,255 | | |
Best Buy Co., Inc. | | | 3,100 | | | | 309,349 | | |
BorgWarner, Inc. | | | 8,905 | | | | 344,089 | | |
eBay, Inc. | | | 82,328 | | | | 4,136,982 | | |
Helen of Troy Ltd. (a) | | | 1,782 | | | | 395,943 | | |
Lowe's Cos., Inc. | | | 3,290 | | | | 528,078 | | |
Mohawk Industries, Inc. (a) | | | 3,535 | | | | 498,258 | | |
NVR, Inc. (a) | | | 85 | | | | 346,788 | | |
Target Corp. | | | 28,481 | | | | 5,027,751 | | |
Tractor Supply Co. | | | 18,184 | | | | 2,556,307 | | |
| | | | 17,053,800 | | |
Consumer Staples (17.8%): | |
Altria Group, Inc. | | | 8,928 | | | | 366,048 | | |
Campbell Soup Co. | | | 38,189 | | | | 1,846,438 | | |
Casey's General Stores, Inc. | | | 2,392 | | | | 427,259 | | |
Church & Dwight Co., Inc. | | | 3,681 | | | | 321,094 | | |
Flowers Foods, Inc. | | | 14,180 | | | | 320,893 | | |
Kimberly-Clark Corp. | | | 7,454 | | | | 1,005,023 | | |
Philip Morris International, Inc. | | | 4,600 | | | | 380,834 | | |
The Clorox Co. | | | 20,157 | | | | 4,070,101 | | |
The J.M. Smucker Co. | | | 21,839 | | | | 2,524,589 | | |
The Kroger Co. | | | 124,914 | | | | 3,967,269 | | |
The Procter & Gamble Co. | | | 38,293 | | | | 5,328,088 | | |
Walgreens Boots Alliance, Inc. | | | 9,605 | | | | 383,047 | | |
Walmart, Inc. | | | 35,953 | | | | 5,182,625 | | |
| | | | 26,123,308 | | |
Energy (0.2%): | |
Cabot Oil & Gas Corp. | | | 19,873 | | | | 323,532 | | |
Financials (10.1%): | |
Erie Indemnity Co., Class A | | | 2,113 | | | | 518,953 | | |
Everest Re Group Ltd. | | | 2,538 | | | | 594,120 | | |
Fidelity National Financial, Inc. | | | 58,536 | | | | 2,288,172 | | |
First American Financial Corp. | | | 15,048 | | | | 776,928 | | |
Huntington Bancshares, Inc. | | | 37,623 | | | | 475,178 | | |
Jefferies Financial Group, Inc. | | | 19,167 | | | | 471,508 | | |
The Allstate Corp. | | | 38,923 | | | | 4,278,806 | | |
The Travelers Cos., Inc. | | | 39,205 | | | | 5,503,207 | | |
| | | | 14,906,872 | | |
Health Care (17.9%): | |
AbbVie, Inc. | | | 47,303 | | | | 5,068,517 | | |
Biogen, Inc. (a) | | | 2,169 | | | | 531,101 | | |
Cardinal Health, Inc. | | | 7,348 | | | | 393,559 | | |
Cerner Corp. | | | 46,757 | | | | 3,669,489 | | |
See notes to financial statements.
96
Victory Portfolios II
VictoryShares US Multi-Factor Minimum Volatility ETF | | Schedule of Portfolio Investments — continued
December 31, 2020 | |
(Unaudited)
Security Description | | Shares | | Value | |
DaVita, Inc. (a) | | | 4,028 | | | $ | 472,887 | | |
Gilead Sciences, Inc. | | | 59,185 | | | | 3,448,118 | | |
Johnson & Johnson | | | 39,753 | | | | 6,256,327 | | |
McKesson Corp. | | | 2,316 | | | | 402,799 | | |
Medpace Holdings, Inc. (a) | | | 3,087 | | | | 429,710 | | |
Merck & Co., Inc. | | | 60,706 | | | | 4,965,751 | | |
Universal Health Services, Inc., Class B | | | 3,224 | | | | 443,300 | | |
| | | | 26,081,558 | | |
Industrials (14.8%): | |
3M Co. | | | 26,524 | | | | 4,636,130 | | |
AO Smith Corp. | | | 6,535 | | | | 358,248 | | |
C.H. Robinson Worldwide, Inc. | | | 27,783 | | | | 2,607,990 | | |
Dover Corp. | | | 3,184 | | | | 401,980 | | |
Fortune Brands Home & Security, Inc. | | | 3,987 | | | | 341,766 | | |
Hubbell, Inc. | | | 2,521 | | | | 395,268 | | |
Huntington Ingalls Industries, Inc. | | | 2,451 | | | | 417,846 | | |
J.B. Hunt Transport Services, Inc. | | | 2,729 | | | | 372,918 | | |
Lockheed Martin Corp. | | | 6,821 | | | | 2,421,319 | | |
Masco Corp. | | | 6,258 | | | | 343,752 | | |
Republic Services, Inc. | | | 43,772 | | | | 4,215,244 | | |
Robert Half International, Inc. | | | 6,517 | | | | 407,182 | | |
Tetra Tech, Inc. | | | 3,613 | | | | 418,313 | | |
W.W. Grainger, Inc. | | | 967 | | | | 394,865 | | |
Waste Management, Inc. | | | 31,966 | | | | 3,769,750 | | |
| | | | 21,502,571 | | |
Information Technology (24.1%): | |
Apple, Inc. | | | 66,096 | | | | 8,770,278 | | |
Automatic Data Processing, Inc. | | | 2,473 | | | | 435,743 | | |
CDW Corp. | | | 5,295 | | | | 697,828 | | |
Citrix Systems, Inc. | | | 24,781 | | | | 3,224,008 | | |
F5 Networks, Inc. (a) | | | 2,810 | | | | 494,391 | | |
International Business Machines Corp. | | | 27,105 | | | | 3,411,977 | | |
Microsoft Corp. | | | 38,022 | | | | 8,456,854 | | |
NetApp, Inc. | | | 24,974 | | | | 1,654,278 | | |
Oracle Corp. | | | 76,498 | | | | 4,948,656 | | |
Paychex, Inc. | | | 4,325 | | | | 403,004 | | |
QUALCOMM, Inc. | | | 4,903 | | | | 746,923 | | |
Texas Instruments, Inc. | | | 2,417 | | | | 396,702 | | |
The Western Union Co. | | | 64,861 | | | | 1,423,050 | | |
| | | | 35,063,692 | | |
Total Common Stocks (Cost $129,791,152) | | | 145,561,693 | | |
Total Investments (Cost $129,791,152) — 99.6% | | | 145,561,693 | | |
Other assets in excess of liabilities — 0.4% | | | 583,764 | | |
NET ASSETS — 100.00% | | $ | 146,145,457 | | |
(a) Non-income producing security.
See notes to financial statements.
97
Victory Portfolios II
VictoryShares US Multi-Factor Minimum Volatility ETF | | Schedule of Portfolio Investments — continued
December 31, 2020 | |
(Unaudited)
Futures Contracts Purchased
| | | Number of
Contracts | | Expiration
Date | | Notional
Amount | | Value | | Unrealized
Appreciation
(Depreciation) | |
E-Mini S&P 500 Futures | | | 3 | | | 3/19/21 | | $ | 552,637 | | | $ | 562,320 | | | $ | 9,683 | | |
| | | Total unrealized appreciation | | | | | | | | $ | 9,683 | | |
| | | Total unrealized depreciation | | | | | | | | | — | | |
| | | Total net unrealized appreciation (depreciation) | | | | | | | | $ | 9,683 | | |
See notes to financial statements.
98
Victory Portfolios II
VictoryShares US 500 Enhanced Volatility Wtd ETF | | Schedule of Portfolio Investments
December 31, 2020 | |
(Unaudited)
Security Description | | Shares | | Value | |
Common Stocks (99.7%) | |
Communication Services (5.1%): | |
Activision Blizzard, Inc. | | | 20,035 | | | $ | 1,860,250 | | |
Alphabet, Inc., Class A (a) | | | 1,045 | | | | 1,831,509 | | |
Altice USA, Inc., Class A (a) (b) | | | 48,914 | | | | 1,852,373 | | |
ANGI Homeservices, Inc., Class A (a) (b) | | | 69,580 | | | | 918,108 | | |
AT&T, Inc. | | | 58,582 | | | | 1,684,818 | | |
Cable One, Inc. | | | 755 | | | | 1,681,929 | | |
CenturyLink, Inc. | | | 110,193 | | | | 1,074,382 | | |
Charter Communications, Inc., Class A (a) | | | 3,078 | | | | 2,036,251 | | |
Comcast Corp., Class A | | | 37,295 | | | | 1,954,258 | | |
Discovery, Inc., Class A (a) (b) | | | 58,124 | | | | 1,748,951 | | |
DISH Network Corp., Class A (a) | | | 28,230 | | | | 912,958 | | |
Electronic Arts, Inc. | | | 13,077 | | | | 1,877,857 | | |
Facebook, Inc., Class A (a) | | | 4,914 | | | | 1,342,308 | | |
Fox Corp., Class A | | | 47,481 | | | | 1,382,647 | | |
Liberty Broadband Corp., Class C (a) | | | 12,265 | | | | 1,942,408 | | |
Netflix, Inc. (a) | | | 2,758 | | | | 1,491,333 | | |
Omnicom Group, Inc. | | | 25,464 | | | | 1,588,190 | | |
Sirius XM Holdings, Inc. (b) | | | 253,814 | | | | 1,616,795 | | |
Take-Two Interactive Software, Inc. (a) | | | 9,130 | | | | 1,897,123 | | |
The Interpublic Group of Cos., Inc. | | | 62,623 | | | | 1,472,893 | | |
The New York Times Co., Class A | | | 36,985 | | | | 1,914,713 | | |
T-Mobile U.S., Inc. (a) | | | 13,151 | | | | 1,773,412 | | |
Verizon Communications, Inc. | | | 41,735 | | | | 2,451,931 | | |
ViacomCBS, Inc., Class B | | | 30,356 | | | | 1,131,065 | | |
| | | | 39,438,462 | | |
Consumer Discretionary (9.5%): | |
Advance Auto Parts, Inc. | | | 8,382 | | | | 1,320,249 | | |
Amazon.com, Inc. (a) | | | 521 | | | | 1,696,861 | | |
Aptiv PLC | | | 9,859 | | | | 1,284,529 | | |
AutoZone, Inc. (a) | | | 1,250 | | | | 1,481,800 | | |
Best Buy Co., Inc. | | | 11,018 | | | | 1,099,486 | | |
Booking Holdings, Inc. (a) | | | 687 | | | | 1,530,134 | | |
BorgWarner, Inc. | | | 31,350 | | | | 1,211,364 | | |
Bright Horizons Family Solutions, Inc. (a) | | | 7,387 | | | | 1,277,877 | | |
CarMax, Inc. (a) | | | 10,094 | | | | 953,479 | | |
Chegg, Inc. (a) | | | 14,205 | | | | 1,283,138 | | |
Chipotle Mexican Grill, Inc. (a) | | | 967 | | | | 1,340,949 | | |
D.R. Horton, Inc. | | | 15,261 | | | | 1,051,788 | | |
Dollar General Corp. | | | 10,119 | | | | 2,128,026 | | |
Dollar Tree, Inc. (a) | | | 14,001 | | | | 1,512,668 | | |
Domino's Pizza, Inc. | | | 3,516 | | | | 1,348,245 | | |
eBay, Inc. | | | 34,136 | | | | 1,715,334 | | |
Etsy, Inc. (a) | | | 8,036 | | | | 1,429,685 | | |
Floor & Decor Holdings, Inc., Class A (a) | | | 13,473 | | | | 1,250,968 | | |
Garmin Ltd. | | | 16,246 | | | | 1,943,996 | | |
General Motors Co. | | | 34,978 | | | | 1,456,484 | | |
Gentex Corp. | | | 59,573 | | | | 2,021,312 | | |
See notes to financial statements.
99
Victory Portfolios II
VictoryShares US 500 Enhanced Volatility Wtd ETF | | Schedule of Portfolio Investments — continued
December 31, 2020 | |
(Unaudited)
Security Description | | Shares | | Value | |
Genuine Parts Co. | | | 12,731 | | | $ | 1,278,574 | | |
Hasbro, Inc. (b) | | | 14,456 | | | | 1,352,214 | | |
Hilton Worldwide Holdings, Inc. | | | 14,104 | | | | 1,569,211 | | |
Las Vegas Sands Corp. | | | 21,305 | | | | 1,269,778 | | |
Lear Corp. | | | 9,449 | | | | 1,502,674 | | |
Lennar Corp., Class A | | | 12,395 | | | | 944,871 | | |
LKQ Corp. (a) | | | 29,686 | | | | 1,046,135 | | |
Lowe's Cos., Inc. | | | 7,591 | | | | 1,218,431 | | |
Marriott International, Inc., Class A | | | 9,263 | | | | 1,221,975 | | |
McDonald's Corp. | | | 7,036 | | | | 1,509,785 | | |
MGM Resorts International | | | 28,791 | | | | 907,204 | | |
Mohawk Industries, Inc. (a) | | | 9,172 | | | | 1,292,793 | | |
NIKE, Inc., Class B | | | 13,583 | | | | 1,921,587 | | |
NVR, Inc. (a) | | | 244 | | | | 995,486 | | |
O'Reilly Automotive, Inc. (a) | | | 3,123 | | | | 1,413,376 | | |
Pool Corp. | | | 4,422 | | | | 1,647,195 | | |
PulteGroup, Inc. | | | 21,231 | | | | 915,481 | | |
Ross Stores, Inc. | | | 12,414 | | | | 1,524,563 | | |
Service Corp. International | | | 31,946 | | | | 1,568,548 | | |
Starbucks Corp. | | | 16,010 | | | | 1,712,750 | | |
Target Corp. | | | 10,847 | | | | 1,914,821 | | |
Tesla, Inc. (a) | | | 1,514 | | | | 1,068,384 | | |
The Home Depot, Inc. | | | 4,926 | | | | 1,308,444 | | |
The TJX Cos., Inc. | | | 22,782 | | | | 1,555,783 | | |
Tractor Supply Co. | | | 11,232 | | | | 1,578,996 | | |
Ulta Beauty, Inc. (a) | | | 4,205 | | | | 1,207,508 | | |
Vail Resorts, Inc. | | | 5,797 | | | | 1,617,131 | | |
VF Corp. | | | 16,620 | | | | 1,419,514 | | |
Whirlpool Corp. | | | 5,576 | | | | 1,006,412 | | |
Williams-Sonoma, Inc. | | | 10,693 | | | | 1,088,975 | | |
Yum! Brands, Inc. | | | 14,444 | | | | 1,568,041 | | |
| | | | 72,485,012 | | |
Consumer Staples (7.0%): | |
Archer-Daniels-Midland Co. | | | 35,283 | | | | 1,778,616 | | |
Brown-Forman Corp., Class B | | | 21,821 | | | | 1,733,242 | | |
Campbell Soup Co. | | | 38,284 | | | | 1,851,031 | | |
Casey's General Stores, Inc. | | | 8,053 | | | | 1,438,427 | | |
Church & Dwight Co., Inc. | | | 20,261 | | | | 1,767,367 | | |
Colgate-Palmolive Co. | | | 24,374 | | | | 2,084,221 | | |
Conagra Brands, Inc. | | | 43,388 | | | | 1,573,249 | | |
Costco Wholesale Corp. | | | 6,284 | | | | 2,367,686 | | |
General Mills, Inc. | | | 32,051 | | | | 1,884,599 | | |
Herbalife Nutrition Ltd. (a) (b) | | | 23,362 | | | | 1,122,544 | | |
Hormel Foods Corp. | | | 41,081 | | | | 1,914,786 | | |
Kellogg Co. | | | 27,902 | | | | 1,736,341 | | |
Kimberly-Clark Corp. | | | 12,845 | | | | 1,731,891 | | |
Lamb Weston Holdings, Inc. | | | 17,450 | | | | 1,374,013 | | |
McCormick & Co., Inc. | | | 15,946 | | | | 1,524,438 | | |
Mondelez International, Inc., Class A | | | 30,935 | | | | 1,808,769 | | |
Monster Beverage Corp. (a) | | | 21,137 | | | | 1,954,750 | | |
See notes to financial statements.
100
Victory Portfolios II
VictoryShares US 500 Enhanced Volatility Wtd ETF | | Schedule of Portfolio Investments — continued
December 31, 2020 | |
(Unaudited)
Security Description | | Shares | | Value | |
PepsiCo, Inc. | | | 11,889 | | | $ | 1,763,139 | | |
Philip Morris International, Inc. | | | 19,825 | | | | 1,641,312 | | |
Sysco Corp. | | | 15,244 | | | | 1,132,019 | | |
The Boston Beer Co., Inc., Class A (a) | | | 1,311 | | | | 1,303,514 | | |
The Clorox Co. | | | 9,340 | | | | 1,885,933 | | |
The Coca-Cola Co. | | | 36,912 | | | | 2,024,254 | | |
The Estee Lauder Cos., Inc., Class A | | | 6,830 | | | | 1,818,078 | | |
The Hershey Co. | | | 10,982 | | | | 1,672,888 | | |
The J.M. Smucker Co. | | | 15,956 | | | | 1,844,514 | | |
The Kroger Co. | | | 57,163 | | | | 1,815,497 | | |
The Procter & Gamble Co. | | | 13,541 | | | | 1,884,095 | | |
Tyson Foods, Inc., Class A | | | 20,096 | | | | 1,294,986 | | |
Walgreens Boots Alliance, Inc. | | | 36,488 | | | | 1,455,141 | | |
Walmart, Inc. | | | 14,371 | | | | 2,071,580 | | |
| | | | 53,252,920 | | |
Energy (1.4%): | |
Cabot Oil & Gas Corp. | | | 63,994 | | | | 1,041,822 | | |
Cheniere Energy, Inc. (a) | | | 22,702 | | | | 1,362,802 | | |
ConocoPhillips | | | 23,761 | | | | 950,202 | | |
EOG Resources, Inc. | | | 19,798 | | | | 987,326 | | |
Exxon Mobil Corp. | | | 31,709 | | | | 1,307,045 | | |
Kinder Morgan, Inc. | | | 80,837 | | | | 1,105,042 | | |
ONEOK, Inc. | | | 24,174 | | | | 927,798 | | |
Pioneer Natural Resources Co. | | | 7,905 | | | | 900,300 | | |
The Williams Cos., Inc. | | | 46,029 | | | | 922,881 | | |
Valero Energy Corp. | | | 16,594 | | | | 938,723 | | |
| | | | 10,443,941 | | |
Financials (13.8%): | |
Aflac, Inc. | | | 29,539 | | | | 1,313,599 | | |
Ally Financial, Inc. | | | 35,481 | | | | 1,265,252 | | |
American Express Co. | | | 9,935 | | | | 1,201,241 | | |
Ameriprise Financial, Inc. | | | 5,623 | | | | 1,092,718 | | |
Arch Capital Group Ltd. (a) | | | 34,705 | | | | 1,251,809 | | |
Ares Management Corp., Class A | | | 29,015 | | | | 1,365,156 | | |
Arthur J. Gallagher & Co. | | | 14,308 | | | | 1,770,043 | | |
Assurant, Inc. | | | 10,297 | | | | 1,402,657 | | |
Athene Holding Ltd., Class A (a) | | | 20,401 | | | | 880,099 | | |
Bank of America Corp. | | | 42,063 | | | | 1,274,930 | | |
Berkshire Hathaway, Inc., Class B (a) | | | 8,143 | | | | 1,888,117 | | |
BlackRock, Inc., Class A | | | 2,177 | | | | 1,570,793 | | |
Brown & Brown, Inc. | | | 35,064 | | | | 1,662,384 | | |
Cboe Global Markets, Inc. | | | 15,729 | | | | 1,464,684 | | |
Chubb Ltd. | | | 10,516 | | | | 1,618,623 | | |
Cincinnati Financial Corp. | | | 13,838 | | | | 1,209,026 | | |
Citigroup, Inc. | | | 18,106 | | | | 1,116,416 | | |
Citizens Financial Group, Inc. | | | 32,502 | | | | 1,162,272 | | |
CME Group, Inc. | | | 7,438 | | | | 1,354,088 | | |
Commerce Bancshares, Inc. (b) | | | 22,544 | | | | 1,481,140 | | |
Credit Acceptance Corp. (a) (b) | | | 2,482 | | | | 859,119 | | |
See notes to financial statements.
101
Victory Portfolios II
VictoryShares US 500 Enhanced Volatility Wtd ETF | | Schedule of Portfolio Investments — continued
December 31, 2020 | |
(Unaudited)
Security Description | | Shares | | Value | |
Discover Financial Services | | | 13,888 | | | $ | 1,257,281 | | |
Erie Indemnity Co., Class A | | | 5,905 | | | | 1,450,268 | | |
Everest Re Group Ltd. | | | 5,828 | | | | 1,364,276 | | |
FactSet Research Systems, Inc. | | | 3,945 | | | | 1,311,713 | | |
Fidelity National Financial, Inc. | | | 34,686 | | | | 1,355,876 | | |
Fifth Third Bancorp | | | 41,222 | | | | 1,136,491 | | |
First Republic Bank | | | 11,602 | | | | 1,704,681 | | |
Franklin Resources, Inc. (b) | | | 57,603 | | | | 1,439,499 | | |
Globe Life, Inc. | | | 14,186 | | | | 1,347,103 | | |
Huntington Bancshares, Inc. | | | 107,146 | | | | 1,353,254 | | |
Interactive Brokers Group, Inc. | | | 25,227 | | | | 1,536,829 | | |
Intercontinental Exchange, Inc. | | | 15,252 | | | | 1,758,403 | | |
JPMorgan Chase & Co. | | | 11,629 | | | | 1,477,697 | | |
KeyCorp | | | 68,599 | | | | 1,125,710 | | |
KKR & Co., Inc. | | | 31,924 | | | | 1,292,603 | | |
Lincoln National Corp. | | | 18,530 | | | | 932,244 | | |
LPL Financial Holdings, Inc. | | | 11,486 | | | | 1,197,071 | | |
M&T Bank Corp. | | | 10,565 | | | | 1,344,925 | | |
Markel Corp. (a) | | | 1,127 | | | | 1,164,529 | | |
MarketAxess Holdings, Inc. | | | 2,870 | | | | 1,637,507 | | |
Marsh & McLennan Cos., Inc. | | | 14,817 | | | | 1,733,589 | | |
MetLife, Inc. | | | 27,276 | | | | 1,280,608 | | |
Moody's Corp. | | | 4,140 | | | | 1,201,594 | | |
Morgan Stanley | | | 20,806 | | | | 1,425,835 | | |
Morningstar, Inc. | | | 12,386 | | | | 2,868,225 | | |
MSCI, Inc. | | | 3,227 | | | | 1,440,952 | | |
Nasdaq, Inc. | | | 10,906 | | | | 1,447,662 | | |
Northern Trust Corp. | | | 14,801 | | | | 1,378,565 | | |
Principal Financial Group, Inc. | | | 22,922 | | | | 1,137,160 | | |
Raymond James Financial, Inc. | | | 14,260 | | | | 1,364,254 | | |
Regions Financial Corp. | | | 79,084 | | | | 1,274,834 | | |
RenaissanceRe Holdings Ltd. | | | 7,858 | | | | 1,303,014 | | |
S&P Global, Inc. | | | 3,642 | | | | 1,197,235 | | |
SEI Investments Co. | | | 26,271 | | | | 1,509,794 | | |
State Street Corp. | | | 15,964 | | | | 1,161,860 | | |
SVB Financial Group (a) | | | 3,758 | | | | 1,457,465 | | |
Synchrony Financial | | | 33,328 | | | | 1,156,815 | | |
T. Rowe Price Group, Inc. | | | 9,383 | | | | 1,420,492 | | |
The Allstate Corp. | | | 15,270 | | | | 1,678,631 | | |
The Bank of New York Mellon Corp. | | | 35,847 | | | | 1,521,347 | | |
The Blackstone Group, Inc., Class A | | | 21,980 | | | | 1,424,524 | | |
The Charles Schwab Corp. | | | 33,488 | | | | 1,776,204 | | |
The Goldman Sachs Group, Inc. | | | 5,815 | | | | 1,533,474 | | |
The Hartford Financial Services Group, Inc. | | | 23,808 | | | | 1,166,116 | | |
The PNC Financial Services Group, Inc. | | | 9,848 | | | | 1,467,352 | | |
The Progressive Corp. | | | 18,080 | | | | 1,787,751 | | |
The Travelers Cos., Inc. | | | 11,107 | | | | 1,559,090 | | |
Tradeweb Markets, Inc., Class A (b) | | | 26,352 | | | | 1,645,682 | | |
Truist Financial Corp. | | | 24,402 | | | | 1,169,588 | | |
U.S. Bancorp | | | 29,882 | | | | 1,392,202 | | |
See notes to financial statements.
102
Victory Portfolios II
VictoryShares US 500 Enhanced Volatility Wtd ETF | | Schedule of Portfolio Investments — continued
December 31, 2020 | |
(Unaudited)
Security Description | | Shares | | Value | |
Voya Financial, Inc. | | | 24,832 | | | $ | 1,460,370 | | |
W.R. Berkley Corp. | | | 20,991 | | | | 1,394,222 | | |
Wells Fargo & Co. | | | 42,973 | | | | 1,296,925 | | |
| | | | 103,425,557 | | |
Health Care (16.6%): | |
Abbott Laboratories | | | 14,624 | | | | 1,601,182 | | |
AbbVie, Inc. | | | 19,662 | | | | 2,106,783 | | |
ABIOMED, Inc. (a) | | | 4,727 | | | | 1,532,493 | | |
Agilent Technologies, Inc. | | | 17,151 | | | | 2,032,222 | | |
Alexion Pharmaceuticals, Inc. (a) | | | 14,742 | | | | 2,303,290 | | |
Align Technology, Inc. (a) | | | 3,341 | | | | 1,785,364 | | |
Amedisys, Inc. (a) | | | 5,232 | | | | 1,534,703 | | |
AmerisourceBergen Corp. | | | 15,305 | | | | 1,496,217 | | |
Amgen, Inc. | | | 6,608 | | | | 1,519,311 | | |
Anthem, Inc. | | | 4,119 | | | | 1,322,570 | | |
Avantor, Inc. (a) | | | 43,435 | | | | 1,222,695 | | |
Baxter International, Inc. | | | 19,215 | | | | 1,541,812 | | |
Becton, Dickinson & Co. | | | 7,090 | | | | 1,774,060 | | |
Biogen, Inc. (a) | | | 4,811 | | | | 1,178,021 | | |
BioMarin Pharmaceutical, Inc. (a) | | | 14,090 | | | | 1,235,552 | | |
Bio-Rad Laboratories, Inc., Class A (a) | | | 3,313 | | | | 1,931,280 | | |
Bio-Techne Corp. | | | 6,857 | | | | 2,177,440 | | |
Boston Scientific Corp. (a) | | | 35,195 | | | | 1,265,260 | | |
Catalent, Inc. (a) | | | 12,966 | | | | 1,349,372 | | |
Centene Corp. (a) | | | 19,320 | | | | 1,159,780 | | |
Cerner Corp. | | | 27,388 | | | | 2,149,410 | | |
Charles River Laboratories International, Inc. (a) | | | 5,728 | | | | 1,431,198 | | |
Chemed Corp. | | | 2,870 | | | | 1,528,591 | | |
Cigna Corp. | | | 6,890 | | | | 1,434,360 | | |
CRISPR Therapeutics AG (a) (b) | | | 11,687 | | | | 1,789,397 | | |
CVS Health Corp. | | | 26,812 | | | | 1,831,260 | | |
Danaher Corp. | | | 9,282 | | | | 2,061,903 | | |
DaVita, Inc. (a) | | | 17,922 | | | | 2,104,042 | | |
DexCom, Inc. (a) | | | 2,876 | | | | 1,063,315 | | |
Edwards Lifesciences Corp. (a) | | | 16,957 | | | | 1,546,987 | | |
Eli Lilly & Co. | | | 10,693 | | | | 1,805,406 | | |
Encompass Health Corp. | | | 22,560 | | | | 1,865,486 | | |
Exelixis, Inc. (a) | | | 53,750 | | | | 1,078,763 | | |
HCA Healthcare, Inc. | | | 7,539 | | | | 1,239,864 | | |
Henry Schein, Inc. (a) | | | 22,365 | | | | 1,495,324 | | |
Hologic, Inc. (a) | | | 23,384 | | | | 1,703,057 | | |
Horizon Therapeutics PLC (a) | | | 15,701 | | | | 1,148,528 | | |
Humana, Inc. | | | 2,946 | | | | 1,208,655 | | |
IDEXX Laboratories, Inc. (a) | | | 4,149 | | | | 2,073,961 | | |
Illumina, Inc. (a) | | | 4,176 | | | | 1,545,120 | | |
Insulet Corp. (a) | | | 6,364 | | | | 1,626,829 | | |
Intuitive Surgical, Inc. (a) | | | 1,922 | | | | 1,572,388 | | |
Ionis Pharmaceuticals, Inc. (a) | | | 28,556 | | | | 1,614,556 | | |
IQVIA Holdings, Inc. (a) | | | 7,678 | | | | 1,375,667 | | |
Jazz Pharmaceuticals PLC (a) | | | 10,453 | | | | 1,725,268 | | |
See notes to financial statements.
103
Victory Portfolios II
VictoryShares US 500 Enhanced Volatility Wtd ETF | | Schedule of Portfolio Investments — continued
December 31, 2020 | |
(Unaudited)
Security Description | | Shares | | Value | |
Johnson & Johnson | | | 13,442 | | | $ | 2,115,501 | | |
Laboratory Corp. of America Holdings (a) | | | 6,748 | | | | 1,373,555 | | |
LHC Group, Inc. (a) | | | 6,034 | | | | 1,287,173 | | |
Masimo Corp. (a) | | | 7,898 | | | | 2,119,665 | | |
McKesson Corp. | | | 8,990 | | | | 1,563,541 | | |
Medtronic PLC | | | 14,342 | | | | 1,680,022 | | |
Merck & Co., Inc. | | | 23,014 | | | | 1,882,545 | | |
Mettler-Toledo International, Inc. (a) | | | 1,609 | | | | 1,833,745 | | |
Molina Healthcare, Inc. (a) | | | 6,572 | | | | 1,397,733 | | |
Neurocrine Biosciences, Inc. (a) | | | 13,053 | | | | 1,251,130 | | |
Novocure Ltd. (a) | | | 13,669 | | | | 2,365,284 | | |
Penumbra, Inc. (a) (b) | | | 6,661 | | | | 1,165,675 | | |
PerkinElmer, Inc. | | | 15,222 | | | | 2,184,358 | | |
Perrigo Co. PLC | | | 26,804 | | | | 1,198,675 | | |
Pfizer, Inc. | | | 51,692 | | | | 1,902,783 | | |
PRA Health Sciences, Inc. (a) | | | 11,218 | | | | 1,407,186 | | |
Quest Diagnostics, Inc. | | | 13,588 | | | | 1,619,282 | | |
Quidel Corp. (a) | | | 4,559 | | | | 819,024 | | |
Regeneron Pharmaceuticals, Inc. (a) | | | 2,469 | | | | 1,192,799 | | |
Repligen Corp. (a) | | | 8,819 | | | | 1,689,985 | | |
ResMed, Inc. | | | 6,987 | | | | 1,485,157 | | |
Stryker Corp. | | | 6,440 | | | | 1,578,058 | | |
Syneos Health, Inc. (a) | | | 15,447 | | | | 1,052,404 | | |
Teleflex, Inc. | | | 3,663 | | | | 1,507,581 | | |
The Cooper Cos., Inc. | | | 5,078 | | | | 1,844,939 | | |
Thermo Fisher Scientific, Inc. | | | 4,161 | | | | 1,938,111 | | |
UnitedHealth Group, Inc. | | | 4,155 | | | | 1,457,075 | | |
Universal Health Services, Inc., Class B | | | 8,594 | | | | 1,181,675 | | |
Veeva Systems, Inc., Class A (a) | | | 4,979 | | | | 1,355,533 | | |
Vertex Pharmaceuticals, Inc. (a) | | | 5,531 | | | | 1,307,197 | | |
Waters Corp. (a) | | | 7,276 | | | | 1,800,228 | | |
West Pharmaceutical Services, Inc. | | | 5,879 | | | | 1,665,579 | | |
Zimmer Biomet Holdings, Inc. | | | 9,035 | | | | 1,392,203 | | |
Zoetis, Inc. | | | 9,979 | | | | 1,651,525 | | |
| | | | 125,355,668 | | |
Industrials (15.5%): | |
3M Co. | | | 10,161 | | | | 1,776,041 | | |
Allegion PLC | | | 13,516 | | | | 1,572,992 | | |
AMERCO, Inc. | | | 3,907 | | | | 1,773,622 | | |
AMETEK, Inc. | | | 13,332 | | | | 1,612,373 | | |
AO Smith Corp. | | | 34,747 | | | | 1,904,831 | | |
C.H. Robinson Worldwide, Inc. | | | 21,185 | | | | 1,988,636 | | |
Carlisle Cos., Inc. | | | 10,301 | | | | 1,608,810 | | |
Caterpillar, Inc. | | | 10,113 | | | | 1,840,768 | | |
Cintas Corp. | | | 3,588 | | | | 1,268,214 | | |
Copart, Inc. (a) | | | 13,637 | | | | 1,735,308 | | |
CoStar Group, Inc. (a) | | | 1,660 | | | | 1,534,305 | | |
CSX Corp. | | | 17,499 | | | | 1,588,034 | | |
Cummins, Inc. | | | 6,855 | | | | 1,556,771 | | |
Deere & Co. | | | 6,488 | | | | 1,745,596 | | |
See notes to financial statements.
104
Victory Portfolios II
VictoryShares US 500 Enhanced Volatility Wtd ETF | | Schedule of Portfolio Investments — continued
December 31, 2020 | |
(Unaudited)
Security Description | | Shares | | Value | |
Dover Corp. | | | 12,061 | | | $ | 1,522,701 | | |
Eaton Corp. PLC | | | 11,640 | | | | 1,398,430 | | |
Emerson Electric Co. | | | 16,743 | | | | 1,345,635 | | |
Enphase Energy, Inc. (a) | | | 7,989 | | | | 1,401,830 | | |
Equifax, Inc. | | | 9,262 | | | | 1,786,084 | | |
Expeditors International of Washington, Inc. | | | 22,296 | | | | 2,120,572 | | |
Fastenal Co. | | | 33,958 | | | | 1,658,169 | | |
FedEx Corp. | | | 5,308 | | | | 1,378,063 | | |
Fortive Corp. | | | 22,270 | | | | 1,577,161 | | |
Fortune Brands Home & Security, Inc. | | | 12,802 | | | | 1,097,387 | | |
Generac Holdings, Inc. (a) | | | 6,491 | | | | 1,476,118 | | |
General Dynamics Corp. | | | 10,473 | | | | 1,558,592 | | |
General Electric Co. | | | 161,038 | | | | 1,739,210 | | |
Graco, Inc. | | | 25,733 | | | | 1,861,783 | | |
HEICO Corp. | | | 10,077 | | | | 1,334,195 | | |
Honeywell International, Inc. | | | 8,407 | | | | 1,788,170 | | |
Howmet Aerospace, Inc. (a) | | | 48,553 | | | | 1,385,703 | | |
Hubbell, Inc. | | | 9,348 | | | | 1,465,673 | | |
IAA, Inc. (a) | | | 21,510 | | | | 1,397,720 | | |
IDEX Corp. | | | 9,277 | | | | 1,847,978 | | |
Illinois Tool Works, Inc. | | | 7,373 | | | | 1,503,207 | | |
J.B. Hunt Transport Services, Inc. | | | 11,134 | | | | 1,521,461 | | |
Jacobs Engineering Group, Inc. | | | 16,511 | | | | 1,799,039 | | |
Johnson Controls International PLC | | | 36,300 | | | | 1,691,217 | | |
Kansas City Southern | | | 6,746 | | | | 1,377,061 | | |
Knight-Swift Transportation Holdings, Inc. | | | 35,565 | | | | 1,487,328 | | |
L3Harris Technologies, Inc. | | | 8,413 | | | | 1,590,225 | | |
Lennox International, Inc. | | | 5,753 | | | | 1,576,149 | | |
Lockheed Martin Corp. | | | 3,826 | | | | 1,358,153 | | |
Masco Corp. | | | 26,128 | | | | 1,435,211 | | |
Nordson Corp. | | | 6,549 | | | | 1,316,022 | | |
Norfolk Southern Corp. | | | 6,043 | | | | 1,435,877 | | |
Northrop Grumman Corp. | | | 4,576 | | | | 1,394,399 | | |
Old Dominion Freight Line, Inc. | | | 7,477 | | | | 1,459,361 | | |
PACCAR, Inc. | | | 20,385 | | | | 1,758,818 | | |
Parker-Hannifin Corp. | | | 5,067 | | | | 1,380,301 | | |
Quanta Services, Inc. | | | 25,109 | | | | 1,808,350 | | |
Republic Services, Inc. | | | 19,143 | | | | 1,843,471 | | |
Rockwell Automation, Inc. | | | 5,487 | | | | 1,376,194 | | |
Rollins, Inc. | | | 49,044 | | | | 1,916,149 | | |
Roper Technologies, Inc. | | | 3,668 | | | | 1,581,238 | | |
Snap-on, Inc. | | | 8,764 | | | | 1,499,871 | | |
Southwest Airlines Co. | | | 26,876 | | | | 1,252,690 | | |
Stanley Black & Decker, Inc. | | | 6,017 | | | | 1,074,396 | | |
Teledyne Technologies, Inc. (a) | | | 3,894 | | | | 1,526,370 | | |
Textron, Inc. | | | 23,522 | | | | 1,136,818 | | |
The Toro Co. | | | 22,264 | | | | 2,111,519 | | |
Trane Technologies PLC | | | 11,727 | | | | 1,702,290 | | |
TransDigm Group, Inc. (a) | | | 1,723 | | | | 1,066,279 | | |
TransUnion | | | 15,926 | | | | 1,580,178 | | |
See notes to financial statements.
105
Victory Portfolios II
VictoryShares US 500 Enhanced Volatility Wtd ETF | | Schedule of Portfolio Investments — continued
December 31, 2020 | |
(Unaudited)
Security Description | | Shares | | Value | |
Trex Co., Inc. (a) | | | 13,351 | | | $ | 1,117,746 | | |
Union Pacific Corp. | | | 7,757 | | | | 1,615,163 | | |
United Parcel Service, Inc., Class B | | | 9,485 | | | | 1,597,274 | | |
United Rentals, Inc. (a) | | | 5,309 | | | | 1,231,210 | | |
Verisk Analytics, Inc. | | | 8,728 | | | | 1,811,845 | | |
W.W. Grainger, Inc. | | | 4,009 | | | | 1,637,035 | | |
Waste Management, Inc. | | | 15,650 | | | | 1,845,605 | | |
Watsco, Inc. | | | 7,051 | | | | 1,597,404 | | |
Westinghouse Air Brake Technologies Corp. | | | 17,697 | | | | 1,295,420 | | |
XPO Logistics, Inc. (a) | | | 9,994 | | | | 1,191,285 | | |
Xylem, Inc. | | | 16,699 | | | | 1,699,791 | | |
| | | | 116,846,895 | | |
Information Technology (19.3%): | |
Accenture PLC, Class A | | | 6,355 | | | | 1,659,990 | | |
Adobe, Inc. (a) | | | 2,625 | | | | 1,312,815 | | |
Advanced Micro Devices, Inc. (a) | | | 11,479 | | | | 1,052,739 | | |
Akamai Technologies, Inc. (a) | | | 14,859 | | | | 1,560,046 | | |
Amphenol Corp., Class A | | | 13,895 | | | | 1,817,049 | | |
Analog Devices, Inc. | | | 10,498 | | | | 1,550,870 | | |
ANSYS, Inc. (a) | | | 4,124 | | | | 1,500,311 | | |
Apple, Inc. | | | 11,210 | | | | 1,487,455 | | |
Applied Materials, Inc. | | | 17,334 | | | | 1,495,924 | | |
Arista Networks, Inc. (a) | | | 6,001 | | | | 1,743,711 | | |
Aspen Technology, Inc. (a) | | | 8,960 | | | | 1,167,040 | | |
Autodesk, Inc. (a) | | | 5,142 | | | | 1,570,058 | | |
Automatic Data Processing, Inc. | | | 9,963 | | | | 1,755,481 | | |
Black Knight, Inc. (a) | | | 22,205 | | | | 1,961,813 | | |
Booz Allen Hamilton Holding Corp. | | | 20,282 | | | | 1,768,185 | | |
Broadcom, Inc. | | | 3,468 | | | | 1,518,464 | | |
Broadridge Financial Solutions, Inc. | | | 12,566 | | | | 1,925,111 | | |
Cadence Design Systems, Inc. (a) | | | 12,823 | | | | 1,749,442 | | |
CDW Corp. | | | 11,063 | | | | 1,457,993 | | |
Ceridian HCM Holding, Inc. (a) | | | 13,238 | | | | 1,410,641 | | |
Ciena Corp. (a) | | | 26,095 | | | | 1,379,121 | | |
Cisco Systems, Inc. | | | 34,950 | | | | 1,564,013 | | |
Citrix Systems, Inc. | | | 10,839 | | | | 1,410,154 | | |
Cognex Corp. | | | 15,814 | | | | 1,269,627 | | |
Cognizant Technology Solutions Corp., Class A | | | 18,937 | | | | 1,551,887 | | |
Corning, Inc. | | | 37,569 | | | | 1,352,484 | | |
Datadog, Inc., Class A (a) | | | 12,002 | | | | 1,181,477 | | |
Dell Technologies, Inc., Class C (a) | | | 18,289 | | | | 1,340,401 | | |
Dolby Laboratories, Inc., Class A | | | 21,068 | | | | 2,046,334 | | |
Dropbox, Inc., Class A (a) | | | 57,085 | | | | 1,266,716 | | |
Entegris, Inc. | | | 17,951 | | | | 1,725,091 | | |
EPAM Systems, Inc. (a) | | | 3,575 | | | | 1,281,101 | | |
F5 Networks, Inc. (a) | | | 11,854 | | | | 2,085,592 | | |
Fair Isaac Corp. (a) | | | 2,554 | | | | 1,305,196 | | |
Fidelity National Information Services, Inc. | | | 9,329 | | | | 1,319,680 | | |
First Solar, Inc. (a) | | | 14,835 | | | | 1,467,478 | | |
Fiserv, Inc. (a) | | | 13,571 | | | | 1,545,194 | | |
See notes to financial statements.
106
Victory Portfolios II
VictoryShares US 500 Enhanced Volatility Wtd ETF | | Schedule of Portfolio Investments — continued
December 31, 2020 | |
(Unaudited)
Security Description | | Shares | | Value | |
FleetCor Technologies, Inc. (a) | | | 4,813 | | | $ | 1,313,131 | | |
Fortinet, Inc. (a) | | | 8,804 | | | | 1,307,658 | | |
Gartner, Inc. (a) | | | 10,107 | | | | 1,619,040 | | |
Genpact Ltd. | | | 30,759 | | | | 1,272,192 | | |
Global Payments, Inc. | | | 6,471 | | | | 1,393,983 | | |
HP, Inc. | | | 57,383 | | | | 1,411,048 | | |
Intel Corp. | | | 23,049 | | | | 1,148,301 | | |
International Business Machines Corp. | | | 12,653 | | | | 1,592,760 | | |
Intuit, Inc. | | | 3,890 | | | | 1,477,617 | | |
IPG Photonics Corp. (a) | | | 7,273 | | | | 1,627,625 | | |
Jack Henry & Associates, Inc. | | | 9,686 | | | | 1,569,035 | | |
Juniper Networks, Inc. | | | 71,565 | | | | 1,610,928 | | |
Keysight Technologies, Inc. (a) | | | 14,236 | | | | 1,880,433 | | |
KLA Corp. | | | 5,094 | | | | 1,318,888 | | |
Lam Research Corp. | | | 2,944 | | | | 1,390,363 | | |
Leidos Holdings, Inc. | | | 15,802 | | | | 1,661,106 | | |
Marvell Technology Group Ltd. | | | 31,437 | | | | 1,494,515 | | |
Mastercard, Inc., Class A | | | 3,667 | | | | 1,308,899 | | |
Microchip Technology, Inc. | | | 9,216 | | | | 1,272,822 | | |
Micron Technology, Inc. (a) | | | 24,051 | | | | 1,808,154 | | |
Microsoft Corp. | | | 6,464 | | | | 1,437,723 | | |
MKS Instruments, Inc. | | | 8,596 | | | | 1,293,268 | | |
Monolithic Power Systems, Inc. | | | 3,940 | | | | 1,442,946 | | |
Motorola Solutions, Inc. | | | 9,167 | | | | 1,558,940 | | |
NetApp, Inc. | | | 26,111 | | | | 1,729,592 | | |
NortonLifeLock, Inc. | | | 48,472 | | | | 1,007,248 | | |
Nuance Communications, Inc. (a) | | | 47,900 | | | | 2,111,911 | | |
NVIDIA Corp. | | | 2,122 | | | | 1,108,108 | | |
Oracle Corp. | | | 26,265 | | | | 1,699,083 | | |
Paychex, Inc. | | | 16,568 | | | | 1,543,806 | | |
Paycom Software, Inc. (a) | | | 3,225 | | | | 1,458,506 | | |
Paylocity Holding Corp. (a) | | | 7,321 | | | | 1,507,467 | | |
PayPal Holdings, Inc. (a) | | | 6,275 | | | | 1,469,605 | | |
PTC, Inc. (a) (b) | | | 15,822 | | | | 1,892,469 | | |
Qorvo, Inc. (a) | | | 8,999 | | | | 1,496,264 | | |
QUALCOMM, Inc. | | | 10,457 | | | | 1,593,019 | | |
salesforce.com, Inc. (a) | | | 4,457 | | | | 991,816 | | |
Seagate Technology PLC | | | 30,366 | | | | 1,887,551 | | |
ServiceNow, Inc. (a) | | | 2,683 | | | | 1,476,804 | | |
Skyworks Solutions, Inc. | | | 7,999 | | | | 1,222,887 | | |
SolarWinds Corp. (a) (b) | | | 60,098 | | | | 898,465 | | |
Square, Inc., Class A (a) | | | 5,653 | | | | 1,230,319 | | |
SS&C Technologies Holdings, Inc. | | | 21,459 | | | | 1,561,142 | | |
SYNNEX Corp. | | | 16,963 | | | | 1,381,467 | | |
Synopsys, Inc. (a) | | | 7,003 | | | | 1,815,458 | | |
Teradyne, Inc. | | | 14,061 | | | | 1,685,773 | | |
Texas Instruments, Inc. | | | 10,136 | | | | 1,663,622 | | |
The Trade Desk, Inc., Class A (a) | | | 1,876 | | | | 1,502,676 | | |
The Western Union Co. | | | 62,288 | | | | 1,366,599 | | |
Trimble, Inc. (a) | | | 22,032 | | | | 1,471,077 | | |
Tyler Technologies, Inc. (a) | | | 5,260 | | | | 2,296,096 | | |
See notes to financial statements.
107
Victory Portfolios II
VictoryShares US 500 Enhanced Volatility Wtd ETF | | Schedule of Portfolio Investments — continued
December 31, 2020 | |
(Unaudited)
Security Description | | Shares | | Value | |
Universal Display Corp. | | | 6,682 | | | $ | 1,535,524 | | |
VeriSign, Inc. (a) | | | 7,352 | | | | 1,590,973 | | |
Visa, Inc., Class A | | | 6,906 | | | | 1,510,549 | | |
VMware, Inc., Class A (a) (b) | | | 9,938 | | | | 1,393,904 | | |
WEX, Inc. (a) | | | 5,079 | | | | 1,033,729 | | |
Xilinx, Inc. | | | 13,493 | | | | 1,912,903 | | |
Zebra Technologies Corp. (a) | | | 4,567 | | | | 1,755,235 | | |
Zoom Video Communications, Inc., Class A (a) | | | 2,947 | | | | 994,082 | | |
| | | | 144,563,788 | | |
Materials (5.7%): | |
Air Products & Chemicals, Inc. | | | 5,026 | | | | 1,373,204 | | |
Albemarle Corp. | | | 12,021 | | | | 1,773,337 | | |
AptarGroup, Inc. | | | 15,583 | | | | 2,133,157 | | |
Avery Dennison Corp. | | | 11,186 | | | | 1,735,060 | | |
Ball Corp. | | | 19,697 | | | | 1,835,366 | | |
Berry Global Group, Inc. (a) | | | 27,238 | | | | 1,530,503 | | |
Celanese Corp. | | | 11,478 | | | | 1,491,451 | | |
CF Industries Holdings, Inc. | | | 33,700 | | | | 1,304,527 | | |
Corteva, Inc. | | | 42,366 | | | | 1,640,412 | | |
Crown Holdings, Inc. (a) | | | 16,340 | | | | 1,637,268 | | |
Eastman Chemical Co. | | | 17,121 | | | | 1,716,894 | | |
FMC Corp. | | | 11,178 | | | | 1,284,688 | | |
International Flavors & Fragrances, Inc. (b) | | | 12,126 | | | | 1,319,794 | | |
International Paper Co. | | | 33,717 | | | | 1,676,409 | | |
LyondellBasell Industries NV, Class A | | | 13,895 | | | | 1,273,616 | | |
Martin Marietta Materials, Inc. | | | 5,627 | | | | 1,597,899 | | |
Newmont Corp. | | | 20,574 | | | | 1,232,177 | | |
Nucor Corp. | | | 28,571 | | | | 1,519,691 | | |
Packaging Corp. of America | | | 13,682 | | | | 1,886,885 | | |
PPG Industries, Inc. | | | 11,995 | | | | 1,729,919 | | |
Reliance Steel & Aluminum Co. | | | 12,873 | | | | 1,541,542 | | |
Royal Gold, Inc. | | | 8,141 | | | | 865,877 | | |
RPM International, Inc. | | | 16,477 | | | | 1,495,782 | | |
The Scotts Miracle-Gro Co. | | | 7,109 | | | | 1,415,686 | | |
The Sherwin-Williams Co. | | | 2,157 | | | | 1,585,201 | | |
Vulcan Materials Co. | | | 9,867 | | | | 1,463,375 | | |
Westlake Chemical Corp. | | | 15,547 | | | | 1,268,635 | | |
Westrock Co. | | | 31,450 | | | | 1,369,019 | | |
| | | | 42,697,374 | | |
Real Estate (0.2%): | |
CBRE Group, Inc., Class A (a) | | | 21,988 | | | | 1,379,087 | | |
Utilities (5.6%): | |
Alliant Energy Corp. (b) | | | 29,621 | | | | 1,526,370 | | |
Ameren Corp. | | | 17,775 | | | | 1,387,517 | | |
American Electric Power Co., Inc. | | | 20,192 | | | | 1,681,388 | | |
American Water Works Co., Inc. | | | 10,077 | | | | 1,546,517 | | |
Atmos Energy Corp. | | | 15,147 | | | | 1,445,478 | | |
CMS Energy Corp. | | | 26,226 | | | | 1,600,048 | | |
Consolidated Edison, Inc. | | | 20,935 | | | | 1,512,972 | | |
See notes to financial statements.
108
Victory Portfolios II
VictoryShares US 500 Enhanced Volatility Wtd ETF | | Schedule of Portfolio Investments — continued
December 31, 2020 | |
(Unaudited)
Security Description | | Shares | | Value | |
Dominion Energy, Inc. | | | 17,102 | | | $ | 1,286,070 | | |
DTE Energy Co. | | | 10,928 | | | | 1,326,768 | | |
Duke Energy Corp. | | | 18,633 | | | | 1,706,037 | | |
Edison International | | | 26,152 | | | | 1,642,869 | | |
Entergy Corp. | | | 13,264 | | | | 1,324,278 | | |
Essential Utilities, Inc. | | | 29,761 | | | | 1,407,398 | | |
Evergy, Inc. | | | 23,071 | | | | 1,280,671 | | |
Eversource Energy | | | 15,772 | | | | 1,364,436 | | |
Exelon Corp. | | | 33,897 | | | | 1,431,131 | | |
FirstEnergy Corp. | | | 40,789 | | | | 1,248,551 | | |
NextEra Energy, Inc. | | | 21,396 | | | | 1,650,701 | | |
NRG Energy, Inc. | | | 38,147 | | | | 1,432,420 | | |
Pinnacle West Capital Corp. | | | 19,161 | | | | 1,531,922 | | |
PPL Corp. | | | 47,089 | | | | 1,327,910 | | |
Public Service Enterprise Group, Inc. | | | 29,268 | | | | 1,706,325 | | |
Sempra Energy | | | 10,611 | | | | 1,351,948 | | |
The AES Corp. | | | 58,934 | | | | 1,384,949 | | |
The Southern Co. | | | 25,085 | | | | 1,540,972 | | |
UGI Corp. | | | 35,511 | | | | 1,241,465 | | |
Vistra Corp. | | | 64,015 | | | | 1,258,535 | | |
WEC Energy Group, Inc. | | | 15,140 | | | | 1,393,334 | | |
Xcel Energy, Inc. | | | 22,675 | | | | 1,511,742 | | |
| | | | 42,050,722 | | |
Total Common Stocks (Cost $588,596,199) | | | 751,939,426 | | |
Investment Companies (0.2%) | |
BlackRock Liquidity Funds T-Fund, Institutional Class, 0.02% (c) | | | 1,579,670 | | | | 1,579,670 | | |
Total Investment Companies (Cost $1,579,670) | | | 1,579,670 | | |
Collateral for Securities Loaned^ (1.7%) | |
BlackRock Liquidity Funds TempFund Portfolio, Institutional Class, 0.08% (c) | | | 215,895 | | | | 215,895 | | |
Fidelity Investments Money Market Government Portfolio I Shares, 0.01% (c) | | | 7,417,274 | | | | 7,417,274 | | |
Goldman Sachs Financial Square Prime Obligations Fund, Institutional Class,
0.04% (c) | | | 107,743 | | | | 107,743 | | |
JPMorgan Prime Money Market Fund, Capital Class, 0.12% (c) | | | 859,105 | | | | 859,105 | | |
Morgan Stanley Institutional Liquidity Prime Portfolio, Institutional Class,
0.09% (c) | | | 3,862,705 | | | | 3,862,705 | | |
Total Collateral for Securities Loaned (Cost $12,462,722) | | | 12,462,722 | | |
Total Investments (Cost $602,638,591) — 101.6% | | | 765,981,818 | | |
Liabilities in excess of other assets — (1.6)% | | | (11,799,850 | ) | |
NET ASSETS — 100.00% | | $ | 754,181,968 | | |
^ Purchased with cash collateral from securities on loan.
(a) Non-income producing security.
(b) All or a portion of this security is on loan.
(c) Rate disclosed is the daily yield on December 31, 2020.
PLC — Public Limited Company
See notes to financial statements.
109
Victory Portfolios II
VictoryShares US 500 Enhanced Volatility Wtd ETF | | Schedule of Portfolio Investments — continued
December 31, 2020 | |
(Unaudited)
Futures Contracts Purchased
| | | Number of
Contracts | | Expiration
Date | | Notional
Amount | | Value | | Unrealized
Appreciation
(Depreciation) | |
E-Mini S&P 500 Futures | | | 10 | | | 3/19/21 | | $ | 1,838,390 | | | $ | 1,874,400 | | | $ | 36,010 | | |
| | | Total unrealized appreciation | | | | | | | | $ | 36,010 | | |
| | | Total unrealized depreciation | | | | | | | | | — | | |
| | | Total net unrealized appreciation (depreciation) | | | | | | | | $ | 36,010 | | |
See notes to financial statements.
110
Victory Portfolios II
VictoryShares US EQ Income Enhanced Volatility Wtd ETF | | Schedule of Portfolio Investments
December 31, 2020 | |
(Unaudited)
Security Description | | Shares | | Value | |
Common Stocks (99.6%) | |
Banks (10.6%): | |
Citigroup, Inc. | | | 80,705 | | | $ | 4,976,270 | | |
Citizens Financial Group, Inc. | | | 144,886 | | | | 5,181,123 | | |
Fifth Third Bancorp | | | 183,758 | | | | 5,066,208 | | |
Huntington Bancshares, Inc. | | | 477,617 | | | | 6,032,303 | | |
JPMorgan Chase & Co. | | | 51,839 | | | | 6,587,182 | | |
KeyCorp | | | 305,792 | | | | 5,018,047 | | |
M&T Bank Corp. | | | 47,084 | | | | 5,993,793 | | |
Regions Financial Corp. | | | 352,522 | | | | 5,682,655 | | |
The PNC Financial Services Group, Inc. | | | 43,887 | | | | 6,539,163 | | |
Truist Financial Corp. | | | 108,766 | | | | 5,213,154 | | |
U.S. Bancorp | | | 133,214 | | | | 6,206,440 | | |
Wells Fargo & Co. | | | 191,550 | | | | 5,780,979 | | |
| | | | 68,277,317 | | |
Capital Markets (5.7%): | |
Ares Management Corp., Class A | | | 129,330 | | | | 6,084,977 | | |
Franklin Resources, Inc. | | | 256,775 | | | | 6,416,807 | | |
Northern Trust Corp. | | | 65,978 | | | | 6,145,191 | | |
State Street Corp. | | | 71,159 | | | | 5,178,952 | | |
The Bank of New York Mellon Corp. | | | 159,790 | | | | 6,781,488 | | |
The Blackstone Group, Inc., Class A | | | 97,972 | | | | 6,349,565 | | |
| | | | 36,956,980 | | |
Communication Services (6.5%): | |
AT&T, Inc. | | | 261,143 | | | | 7,510,473 | | |
CenturyLink, Inc. | | | 491,206 | | | | 4,789,259 | | |
Omnicom Group, Inc. | | | 113,511 | | | | 7,079,681 | | |
The Interpublic Group of Cos., Inc. | | | 279,146 | | | | 6,565,514 | | |
Verizon Communications, Inc. | | | 186,049 | | | | 10,930,378 | | |
ViacomCBS, Inc., Class B (a) | | | 135,322 | | | | 5,042,098 | | |
| | | | 41,917,403 | | |
Consumer Discretionary (5.8%): | |
General Motors Co. | | | 155,913 | | | | 6,492,217 | | |
Genuine Parts Co. | | | 56,746 | | | | 5,699,001 | | |
Hasbro, Inc. | | | 64,432 | | | | 6,026,969 | | |
Las Vegas Sands Corp. | | | 94,967 | | | | 5,660,033 | | |
Vail Resorts, Inc. | | | 25,840 | | | | 7,208,327 | | |
VF Corp. | | | 74,085 | | | | 6,327,600 | | |
| | | | 37,414,147 | | |
Consumer Finance (2.5%): | |
Ally Financial, Inc. | | | 158,156 | | | | 5,639,843 | | |
Discover Financial Services | | | 61,916 | | | | 5,605,255 | | |
Synchrony Financial | | | 148,560 | | | | 5,156,518 | | |
| | | | 16,401,616 | | |
See notes to financial statements.
111
Victory Portfolios II
VictoryShares US EQ Income Enhanced Volatility Wtd ETF | | Schedule of Portfolio Investments — continued
December 31, 2020 | |
(Unaudited)
Security Description | | Shares | | Value | |
Consumer Staples (10.5%): | |
Archer-Daniels-Midland Co. | | | 157,280 | | | $ | 7,928,485 | | |
General Mills, Inc. (a) | | | 142,881 | | | | 8,401,402 | | |
Kellogg Co. | | | 124,381 | | | | 7,740,230 | | |
PepsiCo, Inc. | | | 52,997 | | | | 7,859,455 | | |
Philip Morris International, Inc. | | | 88,370 | | | | 7,316,152 | | |
Sysco Corp. | | | 67,949 | | | | 5,045,893 | | |
The Coca-Cola Co. | | | 164,531 | | | | 9,022,880 | | |
The J.M. Smucker Co. | | | 71,121 | | | | 8,221,588 | | |
Walgreens Boots Alliance, Inc. | | | 162,649 | | | | 6,486,442 | | |
| | | | 68,022,527 | | |
Energy (4.9%): | |
ConocoPhillips | | | 105,922 | | | | 4,235,821 | | |
EOG Resources, Inc. | | | 88,243 | | | | 4,400,678 | | |
Exxon Mobil Corp. | | | 141,342 | | | | 5,826,117 | | |
Kinder Morgan, Inc. | | | 360,343 | | | | 4,925,889 | | |
ONEOK, Inc. | | | 107,752 | | | | 4,135,522 | | |
The Williams Cos., Inc. | | | 205,179 | | | | 4,113,839 | | |
Valero Energy Corp. | | | 73,967 | | | | 4,184,313 | | |
| | | | 31,822,179 | | |
Health Care (5.4%): | |
AbbVie, Inc. | | | 87,652 | | | | 9,391,912 | | |
CVS Health Corp. | | | 119,520 | | | | 8,163,216 | | |
Merck & Co., Inc. | | | 102,587 | | | | 8,391,617 | | |
Pfizer, Inc. | | | 230,764 | | | | 8,494,422 | | |
| | | | 34,441,167 | | |
Industrials (6.5%): | |
3M Co. | | | 45,294 | | | | 7,916,938 | | |
Caterpillar, Inc. | | | 45,073 | | | | 8,204,187 | | |
Eaton Corp. PLC | | | 51,887 | | | | 6,233,704 | | |
Emerson Electric Co. | | | 74,637 | | | | 5,998,576 | | |
General Dynamics Corp. | | | 46,690 | | | | 6,948,406 | | |
Snap-on, Inc. | | | 39,070 | | | | 6,686,440 | | |
| | | | 41,988,251 | | |
Information Technology (9.8%): | |
Broadcom, Inc. | | | 15,470 | | | | 6,773,540 | | |
Cisco Systems, Inc. | | | 155,800 | | | | 6,972,050 | | |
HP, Inc. | | | 255,798 | | | | 6,290,073 | | |
International Business Machines Corp. | | | 56,411 | | | | 7,101,017 | | |
Juniper Networks, Inc. | | | 319,004 | | | | 7,180,780 | | |
NetApp, Inc. | | | 116,386 | | | | 7,709,408 | | |
Paychex, Inc. | | | 73,863 | | | | 6,882,554 | | |
Seagate Technology PLC | | | 135,372 | | | | 8,414,724 | | |
The Western Union Co. | | | 277,662 | | | | 6,091,904 | | |
| | | | 63,416,050 | | |
See notes to financial statements.
112
Victory Portfolios II
VictoryShares US EQ Income Enhanced Volatility Wtd ETF | | Schedule of Portfolio Investments — continued
December 31, 2020 | |
(Unaudited)
Security Description | | Shares | | Value | |
Insurance (6.9%): | |
Aflac, Inc. | | | 131,672 | | | $ | 5,855,454 | | |
Cincinnati Financial Corp. | | | 61,690 | | | | 5,389,855 | | |
Fidelity National Financial, Inc. | | | 154,622 | | | | 6,044,174 | | |
Lincoln National Corp. | | | 82,595 | | | | 4,155,354 | | |
MetLife, Inc. | | | 121,586 | | | | 5,708,463 | | |
Principal Financial Group, Inc. | | | 102,178 | | | | 5,069,051 | | |
The Hartford Financial Services Group, Inc. | | | 106,135 | | | | 5,198,492 | | |
The Travelers Cos., Inc. | | | 49,506 | | | | 6,949,157 | | |
| | | | 44,370,000 | | |
Materials (7.4%): | |
CF Industries Holdings, Inc. | | | 150,227 | | | | 5,815,287 | | |
Eastman Chemical Co. | | | 76,311 | | | | 7,652,467 | | |
International Paper Co. | | | 150,303 | | | | 7,473,065 | | |
LyondellBasell Industries NV, Class A | | | 61,950 | | | | 5,678,337 | | |
Nucor Corp. | | | 127,359 | | | | 6,774,225 | | |
Packaging Corp. of America | | | 60,984 | | | | 8,410,304 | | |
Westrock Co. | | | 140,189 | | | | 6,102,427 | | |
| | | | 47,906,112 | | |
Utilities (17.1%): | |
American Electric Power Co., Inc. | | | 90,020 | | | | 7,495,965 | | |
Consolidated Edison, Inc. | | | 93,314 | | | | 6,743,803 | | |
Dominion Energy, Inc. | | | 76,233 | | | | 5,732,722 | | |
DTE Energy Co. | | | 48,716 | | | | 5,914,610 | | |
Duke Energy Corp. | | | 83,057 | | | | 7,604,700 | | |
Edison International | | | 116,577 | | | | 7,323,367 | | |
Entergy Corp. | | | 59,118 | | | | 5,902,341 | | |
Evergy, Inc. | | | 102,849 | | | | 5,709,148 | | |
Exelon Corp. | | | 151,100 | | | | 6,379,442 | | |
FirstEnergy Corp. | | | 181,813 | | | | 5,565,296 | | |
Pinnacle West Capital Corp. | | | 85,415 | | | | 6,828,929 | | |
PPL Corp. | | | 209,899 | | | | 5,919,152 | | |
Public Service Enterprise Group, Inc. | | | 130,460 | | | | 7,605,817 | | |
Sempra Energy | | | 47,292 | | | | 6,025,474 | | |
The AES Corp. | | | 262,695 | | | | 6,173,333 | | |
The Southern Co. | | | 111,814 | | | | 6,868,734 | | |
UGI Corp. | | | 158,294 | | | | 5,533,958 | | |
| | | | 109,326,791 | | |
Total Common Stocks (Cost $543,135,711) | | | 642,260,540 | | |
Investment Companies (0.2%) | |
BlackRock Liquidity Funds T-Fund, Institutional Class, 0.02% (b) | | | 1,498,833 | | | | 1,498,833 | | |
Total Investment Companies (Cost $1,498,833) | | | 1,498,833 | | |
See notes to financial statements.
113
Victory Portfolios II
VictoryShares US EQ Income Enhanced Volatility Wtd ETF | | Schedule of Portfolio Investments — continued
December 31, 2020 | |
(Unaudited)
Security Description | | Shares | | Value | |
Collateral for Securities Loaned^ (0.7%) | |
BlackRock Liquidity Funds TempFund Portfolio, Institutional Class, 0.08% (b) | | | 77,152 | | | $ | 77,152 | | |
Fidelity Investments Money Market Government Portfolio I Shares, 0.01% (b) | | | 2,650,619 | | | | 2,650,619 | | |
Goldman Sachs Financial Square Prime Obligations Fund, Institutional Class,
0.04% (b) | | | 38,503 | | | | 38,503 | | |
JPMorgan Prime Money Market Fund, Capital Class, 0.12% (b) | | | 307,008 | | | | 307,008 | | |
Morgan Stanley Institutional Liquidity Prime Portfolio, Institutional Class,
0.09% (b) | | | 1,380,367 | | | | 1,380,367 | | |
Total Collateral for Securities Loaned (Cost $4,453,649) | | | 4,453,649 | | |
Total Investments (Cost $549,088,193) — 100.5% | | | 648,213,022 | | |
Liabilities in excess of other assets — (0.5)% | | | (2,949,964 | ) | |
NET ASSETS — 100.00% | | $ | 645,263,058 | | |
^ Purchased with cash collateral from securities on loan.
(a) All or a portion of this security is on loan.
(b) Rate disclosed is the daily yield on December 31, 2020.
PLC — Public Limited Company
Futures Contracts Purchased
| | | Number of
Contracts | | Expiration
Date | | Notional
Amount | | Value | | Unrealized
Appreciation
(Depreciation) | |
E-Mini S&P 500 Futures | | | 9 | | | 3/19/21 | | $ | 1,654,249 | | | $ | 1,686,960 | | | $ | 32,711 | | |
| | | Total unrealized appreciation | | | | | | | | $ | 32,711 | | |
| | | Total unrealized depreciation | | | | | | | | | — | | |
| | | Total net unrealized appreciation (depreciation) | | | | | | | | $ | 32,711 | | |
See notes to financial statements.
114
Victory Portfolios II
VictoryShares US Discovery Enhanced Volatility Wtd ETF | | Schedule of Portfolio Investments
December 31, 2020 | |
(Unaudited)
Security Description | | Shares | | Value | |
Common Stocks (99.7%) | |
Communication Services (2.7%): | |
AMC Networks, Inc., Class A (a) (b) | | | 3,098 | | | $ | 110,815 | | |
Cargurus, Inc. (a) | | | 2,871 | | | | 91,097 | | |
Consolidated Communications Holdings, Inc. (a) | | | 7,770 | | | | 37,995 | | |
Gray Television, Inc. (a) | | | 3,745 | | | | 66,998 | | |
MSG Networks, Inc., Class A (a) (b) | | | 9,227 | | | | 136,006 | | |
National CineMedia, Inc. | | | 11,792 | | | | 43,866 | | |
QuinStreet, Inc. (a) | | | 5,421 | | | | 116,226 | | |
Sciplay Corp., Class A (a) | | | 6,202 | | | | 85,898 | | |
Shenandoah Telecommunications Co. | | | 1,612 | | | | 69,719 | | |
Sinclair Broadcast Group, Inc., Class A | | | 2,866 | | | | 91,282 | | |
TechTarget, Inc. (a) | | | 2,638 | | | | 155,932 | | |
TEGNA, Inc. | | | 6,149 | | | | 85,779 | | |
Telephone & Data Systems, Inc. | | | 3,589 | | | | 66,648 | | |
WideOpenWest, Inc. (a) | | | 9,962 | | | | 106,295 | | |
| | | | 1,264,556 | | |
Consumer Discretionary (11.9%): | |
1-800-Flowers.com, Inc., Class A (a) | | | 2,571 | | | | 66,846 | | |
Acushnet Holdings Corp. | | | 3,196 | | | | 129,566 | | |
Adtalem Global Education, Inc. (a) | | | 3,102 | | | | 105,312 | | |
American Public Education, Inc. (a) | | | 2,434 | | | | 74,188 | | |
America's Car-Mart, Inc. (a) | | | 572 | | | | 62,828 | | |
Asbury Automotive Group, Inc. (a) | | | 616 | | | | 89,776 | | |
Big Lots, Inc. | | | 1,003 | | | | 43,059 | | |
Boot Barn Holdings, Inc. (a) | | | 1,799 | | | | 78,005 | | |
Brinker International, Inc. | | | 847 | | | | 47,915 | | |
Cavco Industries, Inc. (a) | | | 336 | | | | 58,951 | | |
Century Communities, Inc. (a) | | | 1,439 | | | | 62,999 | | |
Cooper Tire & Rubber Co. | | | 2,305 | | | | 93,353 | | |
Core-Mark Holding Co., Inc. | | | 2,677 | | | | 78,623 | | |
Crocs, Inc. (a) | | | 1,326 | | | | 83,087 | | |
Dana, Inc. | | | 3,678 | | | | 71,795 | | |
Dave & Buster's Entertainment, Inc. | | | 1,740 | | | | 52,235 | | |
Denny's Corp. (a) | | | 4,120 | | | | 60,482 | | |
Dorman Products, Inc. (a) | | | 1,132 | | | | 98,280 | | |
El Pollo Loco Holdings, Inc. (a) (b) | | | 4,013 | | | | 72,635 | | |
Franchise Group, Inc. | | | 1,650 | | | | 50,243 | | |
Gentherm, Inc. (a) | | | 2,219 | | | | 144,722 | | |
G-III Apparel Group Ltd. (a) | | | 3,036 | | | | 72,075 | | |
Graham Holdings Co., Class B | | | 188 | | | | 100,275 | | |
Green Brick Partners, Inc. (a) | | | 5,186 | | | | 119,072 | | |
Group 1 Automotive, Inc. | | | 616 | | | | 80,782 | | |
GrowGeneration Corp. (a) | | | 2,822 | | | | 113,501 | | |
H&R Block, Inc. | | | 5,222 | | | | 82,821 | | |
Hibbett Sports, Inc. (a) | | | 1,670 | | | | 77,121 | | |
Hilton Grand Vacations, Inc. (a) | | | 2,641 | | | | 82,795 | | |
Installed Building Products, Inc. (a) | | | 638 | | | | 65,031 | | |
iRobot Corp. (a) (b) | | | 1,077 | | | | 86,472 | | |
See notes to financial statements.
115
Victory Portfolios II
VictoryShares US Discovery Enhanced Volatility Wtd ETF | | Schedule of Portfolio Investments — continued
December 31, 2020 | |
(Unaudited)
Security Description | | Shares | | Value | |
Jack in the Box, Inc. | | | 628 | | | $ | 58,278 | | |
Johnson Outdoors, Inc., Class A | | | 1,161 | | | | 130,763 | | |
Kontoor Brands, Inc. | | | 2,749 | | | | 111,499 | | |
La-Z-Boy, Inc. | | | 2,356 | | | | 93,863 | | |
LCI Industries | | | 698 | | | | 90,517 | | |
LGI Homes, Inc. (a) | | | 519 | | | | 54,936 | | |
Lumber Liquidators Holdings, Inc. (a) | | | 1,948 | | | | 59,882 | | |
M/I Homes, Inc. (a) | | | 1,094 | | | | 48,453 | | |
Malibu Boats, Inc., Class A (a) | | | 1,275 | | | | 79,611 | | |
MarineMax, Inc. (a) | | | 2,031 | | | | 71,146 | | |
MDC Holdings, Inc. | | | 1,404 | | | | 68,234 | | |
Monarch Casino & Resort, Inc. (a) | | | 1,171 | | | | 71,689 | | |
Monro, Inc. | | | 1,807 | | | | 96,313 | | |
Perdoceo Education Corp. (a) | | | 5,793 | | | | 73,166 | | |
PetMed Express, Inc. (b) | | | 2,104 | | | | 67,454 | | |
Rent-A-Center, Inc. | | | 2,388 | | | | 91,437 | | |
Revolve Group, Inc. (a) | | | 2,848 | | | | 88,772 | | |
Sally Beauty Holdings, Inc. (a) | | | 5,659 | | | | 73,793 | | |
Shoe Carnival, Inc. | | | 1,570 | | | | 61,513 | | |
Shutterstock, Inc. | | | 1,802 | | | | 129,204 | | |
Skyline Champion Corp. (a) | | | 2,239 | | | | 69,275 | | |
Sleep Number Corp. (a) | | | 1,134 | | | | 92,829 | | |
Sportsman's Warehouse Holdings, Inc. (a) | | | 4,396 | | | | 77,150 | | |
Standard Motor Products, Inc. | | | 2,264 | | | | 91,601 | | |
Steven Madden Ltd. | | | 3,098 | | | | 109,421 | | |
Strategic Education, Inc. | | | 781 | | | | 74,453 | | |
Stride, Inc. (a) | | | 1,850 | | | | 39,276 | | |
Sturm Ruger & Co., Inc. | | | 1,729 | | | | 112,506 | | |
The Buckle, Inc. (b) | | | 3,990 | | | | 116,507 | | |
The Michaels Cos., Inc. (a) | | | 2,856 | | | | 37,157 | | |
TRI Pointe Group, Inc. (a) | | | 3,411 | | | | 58,840 | | |
Universal Electronics, Inc. (a) | | | 2,114 | | | | 110,901 | | |
W.W. International, Inc. (a) | | | 2,254 | | | | 54,998 | | |
Winmark Corp. | | | 659 | | | | 122,441 | | |
Winnebago Industries, Inc. | | | 1,115 | | | | 66,833 | | |
Wolverine World Wide, Inc. | | | 2,682 | | | | 83,813 | | |
XPEL, Inc. (a) | | | 2,455 | | | | 126,580 | | |
Zumiez, Inc. (a) | | | 2,769 | | | | 101,844 | | |
| | | | 5,671,793 | | |
Consumer Staples (6.4%): | |
B&G Foods, Inc. (b) | | | 2,360 | | | | 65,443 | | |
BellRing Brands, Inc., Class A (a) | | | 4,620 | | | | 112,313 | | |
Calavo Growers, Inc. | | | 1,482 | | | | 102,895 | | |
Cal-Maine Foods, Inc. (a) | | | 2,970 | | | | 111,494 | | |
Central Garden & Pet Co., Class A (a) | | | 2,975 | | | | 108,082 | | |
Coca-Cola Consolidated, Inc. | | | 336 | | | | 89,467 | | |
Edgewell Personal Care Co. | | | 2,279 | | | | 78,808 | | |
elf Beauty, Inc. (a) | | | 3,565 | | | | 89,802 | | |
Fresh Del Monte Produce, Inc. | | | 3,260 | | | | 78,468 | | |
Hostess Brands, Inc. (a) | | | 12,800 | | | | 187,392 | | |
See notes to financial statements.
116
Victory Portfolios II
VictoryShares US Discovery Enhanced Volatility Wtd ETF | | Schedule of Portfolio Investments — continued
December 31, 2020 | |
(Unaudited)
Security Description | | Shares | | Value | |
Ingles Markets, Inc., Class A | | | 2,322 | | | $ | 99,057 | | |
Inter Parfums, Inc. | | | 1,516 | | | | 91,703 | | |
J & J Snack Foods Corp. | | | 627 | | | | 97,417 | | |
John B Sanfilippo & Son, Inc. | | | 1,521 | | | | 119,946 | | |
Medifast, Inc. | | | 506 | | | | 99,348 | | |
MGP Ingredients, Inc. | | | 2,144 | | | | 100,896 | | |
Nu Skin Enterprises, Inc., Class A | | | 1,072 | | | | 58,563 | | |
PriceSmart, Inc. | | | 1,673 | | | | 152,393 | | |
SpartanNash Co. | | | 3,409 | | | | 59,351 | | |
Sprouts Farmers Market, Inc. (a) | | | 4,122 | | | | 82,852 | | |
The Simply Good Foods Co. (a) | | | 3,138 | | | | 98,408 | | |
Tootsie Roll Industries, Inc. (b) | | | 5,122 | | | | 152,123 | | |
Turning Point Brands, Inc. | | | 2,700 | | | | 120,312 | | |
Universal Corp. | | | 2,889 | | | | 140,435 | | |
USANA Health Sciences, Inc. (a) | | | 1,003 | | | | 77,331 | | |
Vector Group Ltd. | | | 9,965 | | | | 116,092 | | |
WD-40 Co. (b) | | | 589 | | | | 156,485 | | |
Weis Markets, Inc. | | | 2,575 | | | | 123,111 | | |
| | | | 2,969,987 | | |
Energy (1.8%): | |
Arch Resources, Inc. | | | 1,616 | | | | 70,732 | | |
Brigham Minerals, Inc. | | | 4,897 | | | | 53,818 | | |
Cactus, Inc., Class A | | | 2,300 | | | | 59,961 | | |
Clean Energy Fuels Corp. (a) | | | 17,343 | | | | 136,315 | | |
CVR Energy, Inc. | | | 3,222 | | | | 48,008 | | |
Helix Energy Solutions Group, Inc. (a) | | | 9,565 | | | | 40,173 | | |
International Seaways, Inc. | | | 3,958 | | | | 64,634 | | |
Murphy Oil Corp. | | | 3,365 | | | | 40,717 | | |
ProPetro Holding Corp. (a) | | | 5,560 | | | | 41,088 | | |
Renewable Energy Group, Inc. (a) | | | 1,513 | | | | 107,151 | | |
SEACOR Holdings, Inc. (a) | | | 2,273 | | | | 94,216 | | |
Talos Energy, Inc. (a) | | | 6,141 | | | | 50,602 | | |
World Fuel Services Corp. | | | 2,445 | | | | 76,186 | | |
| | | | 883,601 | | |
Financials (24.5%): | |
1st Source Corp. | | | 2,419 | | | | 97,486 | | |
American Equity Investment Life Holding Co. | | | 2,104 | | | | 58,197 | | |
American National Group, Inc. | | | 1,390 | | | | 133,606 | | |
Ameris Bancorp | | | 2,594 | | | | 98,754 | | |
AMERISAFE, Inc. | | | 1,581 | | | | 90,797 | | |
Associated Bancorp | | | 5,642 | | | | 96,196 | | |
Assured Guaranty Ltd. | | | 3,009 | | | | 94,753 | | |
Atlantic Union Bankshares Corp. | | | 3,038 | | | | 100,072 | | |
Axos Financial, Inc. (a) | | | 2,673 | | | | 100,318 | | |
B. Riley Financial, Inc. | | | 2,983 | | | | 131,908 | | |
BancFirst Corp. | | | 1,407 | | | | 82,591 | | |
BancorpSouth Bank | | | 3,384 | | | | 92,857 | | |
Bank of Hawaii Corp. | | | 1,547 | | | | 118,530 | | |
Bank OZK | | | 3,094 | | | | 96,749 | | |
See notes to financial statements.
117
Victory Portfolios II
VictoryShares US Discovery Enhanced Volatility Wtd ETF | | Schedule of Portfolio Investments — continued
December 31, 2020 | |
(Unaudited)
Security Description | | Shares | | Value | |
BankUnited, Inc. | | | 2,550 | | | $ | 88,689 | | |
Banner Corp. | | | 1,859 | | | | 86,611 | | |
BGC Partners, Inc., Class A | | | 25,121 | | | | 100,484 | | |
Brighthouse Financial, Inc. (a) | | | 1,710 | | | | 61,911 | | |
Brightsphere Investment Group, Inc. | | | 4,126 | | | | 79,549 | | |
Brookline Bancorp, Inc. | | | 8,926 | | | | 107,469 | | |
Capitol Federal Financial, Inc. | | | 11,715 | | | | 146,437 | | |
Cathay General Bancorp | | | 3,005 | | | | 96,731 | | |
City Holding Co. | | | 1,544 | | | | 107,385 | | |
CNO Financial Group, Inc. | | | 4,049 | | | | 90,009 | | |
Cohen & Steers, Inc. | | | 1,152 | | | | 85,594 | | |
Columbia Banking System, Inc. | | | 2,650 | | | | 95,135 | | |
Columbia Financial, Inc. (a) | | | 11,714 | | | | 182,269 | | |
CVB Financial Corp. | | | 5,129 | | | | 100,016 | | |
Eagle Bancorp, Inc. | | | 2,681 | | | | 110,725 | | |
Employers Holdings, Inc. | | | 3,204 | | | | 103,137 | | |
Encore Capital Group, Inc. (a) | | | 998 | | | | 38,872 | | |
Enterprise Financial Services Corp. | | | 2,402 | | | | 83,950 | | |
Evercore, Inc. | | | 1,181 | | | | 129,485 | | |
FB Financial Corp. | | | 2,698 | | | | 93,702 | | |
FBL Financial Group, Inc., Class A | | | 1,770 | | | | 92,943 | | |
Federal Agricultural Mortgage Corp., Class C | | | 1,212 | | | | 89,991 | | |
Federated Hermes, Inc. | | | 2,950 | | | | 85,226 | | |
First Bancorp, Inc. | | | 10,535 | | | | 97,133 | | |
First Busey Corp. | | | 4,274 | | | | 92,105 | | |
First Commonwealth Financial Corp. | | | 9,749 | | | | 106,654 | | |
First Financial Bancorp | | | 4,832 | | | | 84,705 | | |
First Hawaiian, Inc. | | | 4,997 | | | | 117,828 | | |
First Interstate BancSystem, Inc., Class A | | | 2,539 | | | | 103,515 | | |
First Merchants Corp. | | | 3,090 | | | | 115,596 | | |
First Midwest Bancorp, Inc. | | | 6,480 | | | | 103,162 | | |
FirstCash, Inc. | | | 1,593 | | | | 111,574 | | |
Flagstar Bancorp, Inc. | | | 2,271 | | | | 92,566 | | |
FNB Corp. | | | 8,287 | | | | 78,727 | | |
Focus Financial Partners, Inc., Class A (a) | | | 1,840 | | | | 80,040 | | |
Fulton Financial Corp. | | | 7,768 | | | | 98,809 | | |
German American Bancorp, Inc. | | | 3,373 | | | | 111,613 | | |
Green Dot Corp., Class A (a) | | | 1,071 | | | | 59,762 | | |
Heartland Financial USA, Inc. | | | 2,108 | | | | 85,100 | | |
Heritage Financial Corp. | | | 4,099 | | | | 95,876 | | |
Hilltop Holdings, Inc. | | | 3,520 | | | | 96,835 | | |
Home BancShares, Inc. | | | 4,151 | | | | 80,861 | | |
Hope Bancorp, Inc. | | | 9,370 | | | | 102,227 | | |
Horace Mann Educators Corp. | | | 2,363 | | | | 99,341 | | |
Independent Bank Corp. | | | 1,359 | | | | 99,261 | | |
Independent Bank Group, Inc. | | | 1,338 | | | | 83,652 | | |
International Bancshares Corp. | | | 2,103 | | | | 78,736 | | |
Investors Bancorp, Inc. | | | 9,901 | | | | 104,555 | | |
Kearny Financial Corp. | | | 12,398 | | | | 130,923 | | �� |
Lakeland Financial Corp. | | | 1,806 | | | | 96,765 | | |
See notes to financial statements.
118
Victory Portfolios II
VictoryShares US Discovery Enhanced Volatility Wtd ETF | | Schedule of Portfolio Investments — continued
December 31, 2020 | |
(Unaudited)
Security Description | | Shares | | Value | |
Live Oak Bancshares, Inc. (b) | | | 2,845 | | | $ | 135,023 | | |
Mercury General Corp. | | | 2,348 | | | | 122,589 | | |
Moelis & Co., Class A | | | 2,966 | | | | 138,690 | | |
Mr. Cooper Group, Inc. (a) | | | 2,906 | | | | 90,173 | | |
National Bank Holdings Corp., Class A | | | 3,165 | | | | 103,685 | | |
National Western Life Group, Inc., Class A | | | 320 | | | | 66,061 | | |
Navient Corp. | | | 6,507 | | | | 63,899 | | |
NBT Bancorp, Inc. | | | 3,122 | | | | 100,216 | | |
Nelnet, Inc., Class A | | | 1,608 | | | | 114,554 | | |
NMI Holdings, Inc., Class A (a) | | | 3,327 | | | | 75,357 | | |
Northwest Bancshares, Inc. | | | 9,763 | | | | 124,381 | | |
Oceanfirst Financial Corp. | | | 5,121 | | | | 95,404 | | |
Old National Bancorp | | | 6,554 | | | | 108,534 | | |
Pacific Premier Bancorp, Inc. | | | 2,942 | | | | 92,173 | | |
Palomar Holdings, Inc. (a) | | | 667 | | | | 59,256 | | |
Park National Corp. (b) | | | 878 | | | | 92,199 | | |
Piper Sandler Cos. | | | 972 | | | | 98,075 | | |
PJT Partners, Inc., Class A | | | 1,344 | | | | 101,136 | | |
PRA Group, Inc. (a) | | | 1,467 | | | | 58,181 | | |
Premier Financial Corp. | | | 3,477 | | | | 79,971 | | |
Provident Financial Services, Inc. | | | 5,165 | | | | 92,763 | | |
Radian Group, Inc. | | | 3,331 | | | | 67,453 | | |
Renasant Corp. (b) | | | 3,260 | | | | 109,797 | | |
S&T Bancorp, Inc. | | | 4,111 | | | | 102,117 | | |
Safety Insurance Group, Inc. | | | 1,520 | | | | 118,408 | | |
Sandy Spring Bancorp, Inc. | | | 3,178 | | | | 102,300 | | |
Seacoast Banking Corp. of Florida (a) | | | 3,522 | | | | 103,723 | | |
ServisFirst Bancshares, Inc. | | | 2,120 | | | | 85,415 | | |
Simmons First National Corp., Class A | | | 4,498 | | | | 97,112 | | |
SLM Corp. | | | 10,677 | | | | 132,288 | | |
Southside Bancshares, Inc. | | | 3,357 | | | | 104,168 | | |
Sterling Bancorp | | | 4,454 | | | | 80,083 | | |
Stewart Information Services Corp. | | | 1,928 | | | | 93,238 | | |
Stock Yards Bancorp, Inc. | | | 1,950 | | | | 78,936 | | |
StoneX Group, Inc. (a) | | | 1,304 | | | | 75,502 | | |
Tompkins Financial Corp. (b) | | | 1,258 | | | | 88,815 | | |
Towne Bank | | | 4,588 | | | | 107,726 | | |
TriCo Bancshares | | | 3,177 | | | | 112,085 | | |
Triumph Bancorp, Inc. (a) | | | 2,139 | | | | 103,848 | | |
Trupanion, Inc. (a) | | | 1,048 | | | | 125,455 | | |
Trustmark Corp. | | | 3,728 | | | | 101,812 | | |
UMB Financial Corp. | | | 1,541 | | | | 106,314 | | |
United Community Banks, Inc. | | | 3,875 | | | | 110,205 | | |
Veritex Holdings, Inc. | | | 3,583 | | | | 91,940 | | |
Victory Capital Holdings, Inc., Class A (c) | | | 5,002 | | | | 124,100 | | |
Virtus Investment Partners, Inc. | | | 495 | | | | 107,415 | | |
Waddell & Reed Financial, Inc., Class A | | | 6,554 | | | | 166,929 | | |
Walker & Dunlop, Inc. | | | 1,134 | | | | 104,351 | | |
Washington Federal, Inc. | | | 3,547 | | | | 91,300 | | |
Webster Financial Corp. | | | 2,264 | | | | 95,428 | | |
See notes to financial statements.
119
Victory Portfolios II
VictoryShares US Discovery Enhanced Volatility Wtd ETF | | Schedule of Portfolio Investments — continued
December 31, 2020 | |
(Unaudited)
Security Description | | Shares | | Value | |
WesBanco, Inc. | | | 3,671 | | | $ | 109,983 | | |
Westamerica Bancorp | | | 1,706 | | | | 94,325 | | |
White Mountains Insurance Group Ltd. | | | 126 | | | | 126,083 | | |
Wintrust Financial Corp. | | | 1,362 | | | | 83,205 | | |
WSFS Financial Corp. | | | 2,395 | | | | 107,488 | | |
| | | | 11,778,722 | | |
Health Care (9.5%): | |
Acadia Healthcare Co., Inc. (a) | | | 1,794 | | | | 90,166 | | |
Addus HomeCare Corp. (a) | | | 724 | | | | 84,773 | | |
AMN Healthcare Services, Inc. (a) | | | 1,439 | | | | 98,212 | | |
Amphastar Pharmaceuticals, Inc. (a) | | | 5,350 | | | | 107,589 | | |
Anika Therapeutics, Inc. (a) | | | 2,046 | | | | 92,602 | | |
Antares Pharma, Inc. (a) | | | 24,618 | | | | 98,226 | | |
Atrion Corp. | | | 171 | | | | 109,823 | | |
BioLife Solutions, Inc. (a) | | | 2,976 | | | | 118,713 | | |
BioTelemetry, Inc. (a) | | | 2,098 | | | | 151,224 | | |
Brookdale Senior Living, Inc. (a) | | | 15,221 | | | | 67,429 | | |
Cantel Medical Corp. | | | 985 | | | | 77,677 | | |
Castle Biosciences, Inc. (a) | | | 1,468 | | | | 98,576 | | |
Coherus Biosciences, Inc. (a) | | | 4,102 | | | | 71,293 | | |
Corcept Therapeutics, Inc. (a) | | | 8,033 | | | | 210,143 | | |
CorVel Corp. (a) | | | 937 | | | | 99,322 | | |
Enanta Pharmaceuticals, Inc. (a) (b) | | | 1,756 | | | | 73,928 | | |
Fulgent Genetics, Inc. (a) (b) | | | 1,341 | | | | 69,866 | | |
Hanger, Inc. (a) | | | 3,562 | | | | 78,328 | | |
HealthStream, Inc. (a) | | | 4,837 | | | | 105,640 | | |
HMS Holdings Corp. (a) | | | 4,574 | | | | 168,095 | | |
Innoviva, Inc. (a) | | | 7,893 | | | | 97,794 | | |
Inogen, Inc. (a) | | | 2,176 | | | | 97,224 | | |
Integer Holdings Corp. (a) | | | 1,096 | | | | 88,984 | | |
Ironwood Pharmaceuticals, Inc. (a) | | | 9,456 | | | | 107,704 | | |
Lantheus Holdings, Inc. (a) | | | 5,519 | | | | 74,451 | | |
LeMaitre Vascular, Inc. (b) | | | 2,392 | | | | 96,876 | | |
Luminex Corp. | | | 3,234 | | | | 74,770 | | |
Magellan Health, Inc. (a) | | | 982 | | | | 81,349 | | |
Meridian Bioscience, Inc. (a) | | | 4,392 | | | | 82,086 | | |
National Healthcare Corp. | | | 1,681 | | | | 111,635 | | |
National Research Corp. | | | 1,292 | | | | 55,233 | | |
NextGen Healthcare, Inc. (a) | | | 3,736 | | | | 68,145 | | |
Omnicell, Inc. (a) | | | 1,451 | | | | 174,148 | | |
Phibro Animal Health Corp., Class A | | | 3,592 | | | | 69,757 | | |
Prestige Consumer Healthcare, Inc. (a) | | | 3,094 | | | | 107,888 | | |
R1 RCM, Inc. (a) | | | 5,275 | | | | 126,706 | | |
Select Medical Holdings Corp. (a) | | | 2,931 | | | | 81,071 | | |
SIGA Technologies, Inc. (a) | | | 12,607 | | | | 91,653 | | |
Simulations Plus, Inc. | | | 1,387 | | | | 99,753 | | |
STAAR Surgical Co. (a) | | | 1,701 | | | | 134,754 | | |
Supernus Pharmaceuticals, Inc. (a) | | | 4,151 | | | | 104,439 | | |
Surmodics, Inc. (a) | | | 1,822 | | | | 79,293 | | |
The Pennant Group, Inc. (a) | | | 1,227 | | | | 71,240 | | |
See notes to financial statements.
120
Victory Portfolios II
VictoryShares US Discovery Enhanced Volatility Wtd ETF | | Schedule of Portfolio Investments — continued
December 31, 2020 | |
(Unaudited)
Security Description | | Shares | | Value | |
U.S. Physical Therapy, Inc. | | | 726 | | | $ | 87,302 | | |
Vanda Pharmaceuticals, Inc. (a) | | | 8,230 | | | | 108,142 | | |
Zynex, Inc. (a) (b) | | | 3,731 | | | | 50,219 | | |
| | | | 4,494,241 | | |
Industrials (19.4%): | |
AAON, Inc. | | | 1,522 | | | | 101,411 | | |
AAR Corp. | | | 2,251 | | | | 81,531 | | |
ACCO Brands Corp. | | | 11,431 | | | | 96,592 | | |
AeroVironment, Inc. (a) | | | 1,148 | | | | 99,761 | | |
Alamo Group, Inc. | | | 817 | | | | 112,705 | | |
Albany International Corp. | | | 1,336 | | | | 98,089 | | |
Ameresco, Inc., Class A (a) | | | 2,083 | | | | 108,816 | | |
American Woodmark Corp. (a) | | | 576 | | | | 54,058 | | |
Apogee Enterprises, Inc. | | | 2,684 | | | | 85,029 | | |
Applied Industrial Technologies, Inc. | | | 1,239 | | | | 96,630 | | |
ArcBest Corp. | | | 2,306 | | | | 98,397 | | |
Arcosa, Inc. | | | 1,735 | | | | 95,304 | | |
Astec Industries, Inc. | | | 1,757 | | | | 101,695 | | |
Atkore International Group, Inc. (a) | | | 1,949 | | | | 80,123 | | |
AZZ, Inc. | | | 2,355 | | | | 111,721 | | |
Barnes Group, Inc. | | | 1,610 | | | | 81,611 | | |
Brady Corp., Class A | | | 2,039 | | | | 107,700 | | |
Casella Waste Systems, Inc. (a) | | | 1,699 | | | | 105,253 | | |
CBIZ, Inc. (a) | | | 4,388 | | | | 116,765 | | |
Chart Industries, Inc. (a) | | | 725 | | | | 85,398 | | |
Cimpress PLC (a) | | | 513 | | | | 45,011 | | |
Columbus McKinnon Corp. | | | 2,003 | | | | 76,995 | | |
Comfort Systems USA, Inc. | | | 1,454 | | | | 76,568 | | |
Construction Partners, Inc., Class A (a) | | | 3,943 | | | | 114,781 | | |
CSW Industrials, Inc. | | | 1,377 | | | | 154,099 | | |
Dycom Industries, Inc. (a) | | | 812 | | | | 61,322 | | |
Echo Global Logistics, Inc. (a) | | | 3,059 | | | | 82,042 | | |
Encore Wire Corp. | | | 1,883 | | | | 114,053 | | |
Energy Recovery, Inc. (a) | | | 9,545 | | | | 130,193 | | |
Ennis, Inc. | | | 5,820 | | | | 103,887 | | |
EnPro Industries, Inc. | | | 1,212 | | | | 91,530 | | |
ESCO Technologies, Inc. | | | 1,052 | | | | 108,587 | | |
Evoqua Water Technologies Corp. (a) | | | 2,878 | | | | 77,648 | | |
Federal Signal Corp. | | | 3,218 | | | | 106,741 | | |
Forrester Research, Inc. (a) | | | 1,842 | | | | 77,180 | | |
Forward Air Corp. | | | 1,672 | | | | 128,477 | | |
Foundation Building Materials, Inc. (a) | | | 3,854 | | | | 74,035 | | |
Franklin Electric Co., Inc. | | | 1,464 | | | | 101,323 | | |
GATX Corp. | | | 1,293 | | | | 107,552 | | |
Gibraltar Industries, Inc. (a) | | | 1,349 | | | | 97,047 | | |
GMS, Inc. (a) | | | 2,288 | | | | 69,738 | | |
GrafTech International Ltd. | | | 9,425 | | | | 100,471 | | |
Great Lakes Dredge & Dock Corp. (a) | | | 9,054 | | | | 119,240 | | |
Griffon Corp. | | | 2,762 | | | | 56,290 | | |
H&E Equipment Services, Inc. | | | 3,089 | | | | 92,083 | | |
See notes to financial statements.
121
Victory Portfolios II
VictoryShares US Discovery Enhanced Volatility Wtd ETF | | Schedule of Portfolio Investments — continued
December 31, 2020 | |
(Unaudited)
Security Description | | Shares | | Value | |
Healthcare Services Group | | | 3,607 | | | $ | 101,357 | | |
Heartland Express, Inc. | | | 6,220 | | | | 112,582 | | |
Helios Technologies, Inc. | | | 1,799 | | | | 95,869 | | |
Herc Holdings, Inc. (a) | | | 1,161 | | | | 77,102 | | |
HNI Corp. | | | 2,235 | | | | 77,018 | | |
Hub Group, Inc., Class A (a) | | | 1,954 | | | | 111,378 | | |
Hyster-Yale Materials Handling, Inc. | | | 1,794 | | | | 106,833 | | |
ICF International, Inc. | | | 1,319 | | | | 98,041 | | |
Insperity, Inc. | | | 879 | | | | 71,568 | | |
JELD-WEN Holding, Inc. (a) | | | 2,327 | | | | 59,013 | | |
Kadant, Inc. | | | 713 | | | | 100,519 | | |
Kaman Corp. | | | 1,580 | | | | 90,265 | | |
KAR Auction Services, Inc. | | | 3,923 | | | | 73,007 | | |
Kforce, Inc. | | | 2,450 | | | | 103,121 | | |
Knoll, Inc. | | | 5,122 | | | | 75,191 | | |
Korn Ferry | | | 2,688 | | | | 116,927 | | |
Kratos Defense & Security Solutions, Inc. (a) | | | 3,692 | | | | 101,272 | | |
Lindsay Corp. | | | 945 | | | | 121,395 | | |
Macquarie Infrastructure Corp. | | | 1,926 | | | | 72,321 | | |
Marten Transport Ltd. | | | 4,811 | | | | 82,894 | | |
Matson, Inc. | | | 1,778 | | | | 101,293 | | |
McGrath RentCorp | | | 1,274 | | | | 85,485 | | |
Meritor, Inc. (a) | | | 3,116 | | | | 86,968 | | |
Moog, Inc., Class A | | | 1,074 | | | | 85,168 | | |
Mueller Industries, Inc. | | | 2,357 | | | | 82,754 | | |
Mueller Water Products, Inc., Class A | | | 8,126 | | | | 100,600 | | |
MYR Group, Inc. (a) | | | 1,687 | | | | 101,389 | | |
National Presto Industries, Inc. | | | 1,253 | | | | 110,803 | | |
NV5 Global, Inc. (a) | | | 1,197 | | | | 94,300 | | |
Patrick Industries, Inc. | | | 900 | | | | 61,515 | | |
PGT Innovations, Inc. (a) | | | 3,532 | | | | 71,841 | | |
Primoris Services Corp. | | | 3,229 | | | | 89,153 | | |
Raven Industries, Inc. | | | 3,032 | | | | 100,329 | | |
Rush Enterprises, Inc., Class A | | | 2,884 | | | | 119,455 | | |
SkyWest, Inc. | | | 1,214 | | | | 48,936 | | |
Spirit Airlines, Inc. (a) | | | 2,245 | | | | 54,891 | | |
SPX Corp. (a) | | | 1,872 | | | | 102,099 | | |
Standex International Corp. | | | 1,317 | | | | 102,094 | | |
Steelcase, Inc., Class A | | | 6,155 | | | | 83,400 | | |
Systemax, Inc. | | | 4,336 | | | | 155,619 | | |
Tennant Co. | | | 1,291 | | | | 90,589 | | |
Terex Corp. | | | 3,549 | | | | 123,825 | | |
The Brink's Co. | | | 1,358 | | | | 97,776 | | |
The Gorman-Rupp Co. | | | 2,628 | | | | 85,279 | | |
The Greenbrier Cos., Inc. | | | 2,339 | | | | 85,093 | | |
TriMas Corp. (a) | | | 3,850 | | | | 121,930 | | |
Trinity Industries, Inc. | | | 4,543 | | | | 119,890 | | |
Triton International Ltd. | | | 2,488 | | | | 120,693 | | |
Valmont Industries, Inc. | | | 791 | | | | 138,369 | | |
Vectrus, Inc. (a) | | | 1,971 | | | | 97,998 | | |
See notes to financial statements.
122
Victory Portfolios II
VictoryShares US Discovery Enhanced Volatility Wtd ETF | | Schedule of Portfolio Investments — continued
December 31, 2020 | |
(Unaudited)
Security Description | | Shares | | Value | |
Welbilt, Inc. (a) | | | 6,683 | | | $ | 88,216 | | |
WESCO International, Inc. (a) | | | 1,255 | | | | 98,518 | | |
| | | | 9,239,423 | | |
Information Technology (11.9%): | |
A10 Networks, Inc. (a) | | | 9,072 | | | | 89,450 | | |
ACM Research, Inc., Class A (a) | | | 492 | | | | 39,975 | | |
Advanced Energy Industries, Inc. (a) | | | 932 | | | | 90,376 | | |
Alarm.com Holdings, Inc. (a) | | | 1,521 | | | | 157,347 | | |
Amkor Technology, Inc. | | | 5,181 | | | | 78,129 | | |
Axcelis Technologies, Inc. (a) | | | 2,747 | | | | 79,993 | | |
Badger Meter, Inc. | | | 1,449 | | | | 136,293 | | |
Benchmark Electronics, Inc. | | | 3,598 | | | | 97,182 | | |
Cass Information Systems, Inc. | | | 2,313 | | | | 89,999 | | |
CEVA, Inc. (a) | | | 1,922 | | | | 87,451 | | |
ChannelAdvisor Corp. (a) | | | 3,281 | | | | 52,430 | | |
CommVault Systems, Inc. (a) | | | 2,272 | | | | 125,801 | | |
CSG Systems International, Inc. | | | 3,102 | | | | 139,807 | | |
CTS Corp. | | | 4,244 | | | | 145,697 | | |
Digital Turbine, Inc. (a) | | | 2,102 | | | | 118,889 | | |
Diodes, Inc. (a) | | | 1,812 | | | | 127,746 | | |
Ebix, Inc. | | | 1,940 | | | | 73,662 | | |
Endurance International Group Holdings, Inc. (a) | | | 8,056 | | | | 76,129 | | |
ePlus, Inc. (a) | | | 1,093 | | | | 96,129 | | |
EVERTEC, Inc. | | | 2,623 | | | | 103,136 | | |
ExlService Holdings, Inc. (a) | | | 1,277 | | | | 108,711 | | |
FormFactor, Inc. (a) | | | 3,028 | | | | 130,264 | | |
GreenSky, Inc., Class A (a) | | | 12,855 | | | | 59,519 | | |
Ichor Holdings Ltd. (a) | | | 2,210 | | | | 66,620 | | |
Insight Enterprises, Inc. (a) | | | 1,421 | | | | 108,124 | | |
InterDigital, Inc. | | | 1,377 | | | | 83,556 | | |
Knowles Corp. (a) | | | 6,700 | | | | 123,481 | | |
Methode Electronics, Inc. | | | 3,332 | | | | 127,549 | | |
MicroStrategy, Inc. (a) | | | 768 | | | | 298,407 | | |
Mitek Systems, Inc. (a) | | | 7,835 | | | | 139,306 | | |
MTS Systems Corp. | | | 2,235 | | | | 129,988 | | |
NCR Corp. (a) | | | 2,676 | | | | 100,537 | | |
NETGEAR, Inc. (a) | | | 2,692 | | | | 109,376 | | |
NetScout Systems, Inc. (a) | | | 4,048 | | | | 110,996 | | |
NIC, Inc. | | | 5,783 | | | | 149,374 | | |
OneSpan, Inc. (a) | | | 2,949 | | | | 60,985 | | |
OSI Systems, Inc. (a) | | | 1,388 | | | | 129,389 | | |
PC Connection, Inc. | | | 1,898 | | | | 89,756 | | |
Perficient, Inc. (a) | | | 1,427 | | | | 67,997 | | |
Photronics, Inc. (a) | | | 8,281 | | | | 92,416 | | |
Plexus Corp. (a) | | | 1,105 | | | | 86,422 | | |
Progress Software Corp. | | | 3,278 | | | | 148,133 | | |
Rogers Corp. (a) | | | 698 | | | | 108,392 | | |
Sanmina Corp. (a) | | | 3,000 | | | | 95,670 | | |
SPS Commerce, Inc. (a) | | | 1,288 | | | | 139,864 | | |
SunPower Corp. (a) (b) | | | 4,631 | | | | 118,739 | | |
See notes to financial statements.
123
Victory Portfolios II
VictoryShares US Discovery Enhanced Volatility Wtd ETF | | Schedule of Portfolio Investments — continued
December 31, 2020 | |
(Unaudited)
Security Description | | Shares | | Value | |
Super Micro Computer, Inc. (a) | | | 2,862 | | | $ | 90,611 | | |
Sykes Enterprises, Inc. (a) | | | 2,759 | | | | 103,932 | | |
Synaptics, Inc. (a) | | | 889 | | | | 85,700 | | |
Teradata Corp. (a) | | | 4,005 | | | | 89,992 | | |
TTEC Holdings, Inc. | | | 1,562 | | | | 113,917 | | |
Ultra Clean Holdings, Inc. (a) | | | 2,530 | | | | 78,810 | | |
Verra Mobility Corp. (a) | | | 6,459 | | | | 86,680 | | |
Vishay Intertechnology, Inc. | | | 5,152 | | | | 106,698 | | |
| | | | 5,745,532 | | |
Materials (7.0%): | |
Avient Corp. | | | 2,345 | | | | 94,457 | | |
Boise Cascade Co. | | | 1,673 | | | | 79,969 | | |
Cabot Corp. | | | 2,090 | | | | 93,799 | | |
Carpenter Technology Corp. | | | 2,777 | | | | 80,866 | | |
Chase Corp. | | | 659 | | | | 66,566 | | |
Clearwater Paper Corp. (a) | | | 1,536 | | | | 57,984 | | |
Cleveland-Cliffs, Inc. (b) | | | 8,920 | | | | 129,876 | | |
Commercial Metals Co. | | | 3,760 | | | | 77,230 | | |
Compass Minerals International, Inc. | | | 1,549 | | | | 95,604 | | |
Domtar Corp. | | | 2,312 | | | | 73,175 | | |
Element Solutions, Inc. | | | 8,103 | | | | 143,666 | | |
Forterra, Inc. (a) | | | 3,381 | | | | 58,136 | | |
Futurefuel Corp. | | | 6,712 | | | | 85,242 | | |
GCP Applied Technologies, Inc. (a) | | | 2,870 | | | | 67,876 | | |
Greif, Inc., Class A | | | 2,070 | | | | 97,042 | | |
H.B. Fuller Co. | | | 1,802 | | | | 93,488 | | |
Hawkins, Inc. | | | 1,704 | | | | 89,136 | | |
Ingevity Corp. (a) | | | 1,221 | | | | 92,466 | | |
Innospec, Inc. | | | 1,100 | | | | 99,803 | | |
Kaiser Aluminum Corp. | | | 1,223 | | | | 120,955 | | |
Koppers Holdings, Inc. (a) | | | 1,868 | | | | 58,207 | | |
Livent Corp. (a) (b) | | | 6,590 | | | | 124,156 | | |
Materion Corp. | | | 1,434 | | | | 91,374 | | |
Minerals Technologies, Inc. | | | 1,460 | | | | 90,695 | | |
Myers Industries, Inc. | | | 3,894 | | | | 80,917 | | |
Orion Engineered Carbons SA | | | 4,934 | | | | 84,569 | | |
PQ Group Holdings, Inc. | | | 8,093 | | | | 115,406 | | |
Schnitzer Steel Industries, Inc. | | | 3,731 | | | | 119,056 | | |
Schweitzer-Mauduit International, Inc. | | | 2,720 | | | | 109,371 | | |
Sensient Technologies Corp. | | | 2,010 | | | | 148,278 | | |
Stepan Co. | | | 753 | | | | 89,848 | | |
Summit Materials, Inc., Class A (a) | | | 3,173 | | | | 63,714 | | |
Tredegar Corp. | | | 6,015 | | | | 100,451 | | |
W.R. Grace & Co. | | | 2,104 | | | | 115,341 | | |
Warrior Met Coal, Inc. | | | 3,878 | | | | 82,679 | | |
Worthington Industries, Inc. | | | 1,647 | | | | 84,557 | | |
| | | | 3,355,955 | | |
Real Estate (1.4%): | |
Forestar Group, Inc. (a) | | | 4,407 | | | | 88,933 | | |
See notes to financial statements.
124
Victory Portfolios II
VictoryShares US Discovery Enhanced Volatility Wtd ETF | | Schedule of Portfolio Investments — continued
December 31, 2020 | |
(Unaudited)
Security Description | | Shares | | Value | |
Kennedy-Wilson Holdings, Inc. | | | 5,773 | | | $ | 103,279 | | |
Marcus & Millichap, Inc. (a) (b) | | | 2,798 | | | | 104,170 | | |
Newmark Group, Inc., Class A | | | 8,371 | | | | 61,025 | | |
The RMR Group, Inc., Class A | | | 3,038 | | | | 117,328 | | |
The St. Joe Co. | | | 4,554 | | | | 193,316 | | |
| | | | 668,051 | | |
Utilities (3.2%): | |
ALLETE, Inc. | | | 1,653 | | | | 102,387 | | |
American States Water Co. | | | 1,167 | | | | 92,788 | | |
Avista Corp. | | | 2,391 | | | | 95,975 | | |
California Water Service Group | | | 1,965 | | | | 106,169 | | |
Chesapeake Utilities Corp. | | | 1,132 | | | | 122,493 | | |
MGE Energy, Inc. | | | 1,241 | | | | 86,907 | | |
Middlesex Water Co. | | | 1,494 | | | | 108,270 | | |
New Jersey Resources Corp. | | | 2,429 | | | | 86,351 | | |
Northwest Natural Holding Co. | | | 1,518 | | | | 69,813 | | |
NorthWestern Corp. | | | 1,697 | | | | 98,952 | | |
Otter Tail Corp. | | | 2,039 | | | | 86,882 | | |
SJW Group | | | 1,303 | | | | 90,376 | | |
South Jersey Industries, Inc. | | | 3,933 | | | | 84,756 | | |
Spire, Inc. | | | 1,616 | | | | 103,489 | | |
The York Water Co. | | | 1,791 | | | | 83,461 | | |
Unitil Corp. | | | 2,196 | | | | 97,217 | | |
| | | | 1,516,286 | | |
Total Common Stocks (Cost $35,973,436) | | | 47,588,147 | | |
Investment Companies (0.2%) | |
BlackRock Liquidity Funds T-Fund, Institutional Class, 0.02% (d) | | | 106,420 | | | | 106,420 | | |
Total Investment Companies (Cost $106,420) | | | 106,420 | | |
Collateral for Securities Loaned^ (2.5%) | |
BlackRock Liquidity Funds TempFund Portfolio, Institutional Class, 0.08% (d) | | | 20,769 | | | | 20,769 | | |
Fidelity Investments Money Market Government Portfolio I Shares, 0.01% (d) | | | 713,533 | | | | 713,533 | | |
Goldman Sachs Financial Square Prime Obligations Fund, Institutional Class,
0.04% (d) | | | 10,365 | | | | 10,365 | | |
JPMorgan Prime Money Market Fund, Capital Class, 0.12% (d) | | | 82,645 | | | | 82,645 | | |
Morgan Stanley Institutional Liquidity Prime Portfolio, Institutional Class,
0.09% (d) | | | 371,588 | | | | 371,588 | | |
Total Collateral for Securities Loaned (Cost $1,198,900) | | | 1,198,900 | | |
Total Investments (Cost $37,278,756) — 102.4% | | | 48,893,467 | | |
Liabilities in excess of other assets — (2.4)% | | | (1,160,800 | ) | |
NET ASSETS — 100.00% | | $ | 47,732,667 | | |
^ Purchased with cash collateral from securities on loan.
(a) Non-income producing security.
(b) All or a portion of this security is on loan.
See notes to financial statements.
125
Victory Portfolios II
VictoryShares US Discovery Enhanced Volatility Wtd ETF | | Schedule of Portfolio Investments — continued
December 31, 2020 | |
(Unaudited)
(c) Affiliated security (See Note 8).
(d) Rate disclosed is the daily yield on December 31, 2020.
PLC — Public Limited Company
Futures Contracts Purchased
| | | Number of
Contracts | | Expiration
Date | | Notional
Amount | | Value | | Unrealized
Appreciation
(Depreciation) | |
E-Mini Russell 2000 Index Futures | | | 1 | | | 3/19/21 | | $ | 95,082 | | | $ | 98,740 | | | $ | 3,658 | | |
| | | Total unrealized appreciation | | | | | | | | $ | 3,658 | | |
| | | Total unrealized depreciation | | | | | | | | | — | | |
| | | Total net unrealized appreciation (depreciation) | | | | | | | | $ | 3,658 | | |
See notes to financial statements.
126
Victory Portfolios II
VictoryShares Developed Enhanced Volatility Wtd ETF | | Schedule of Portfolio Investments
December 31, 2020 | |
(Unaudited)
Security Description | | Shares | | Value | |
Common Stocks (99.1%) | |
Australia (4.3%): | |
Communication Services (0.5%): | |
REA Group Ltd. | | | 687 | | | $ | 78,828 | | |
Telstra Corp. Ltd. | | | 46,572 | | | | 106,975 | | |
| | | | 185,803 | | |
Consumer Discretionary (0.1%): | |
Aristocrat Leisure Ltd. | | | 2,380 | | | | 56,870 | | |
Consumer Staples (0.7%): | |
Coles Group Ltd. | | | 7,112 | | | | 99,443 | | |
Wesfarmers Ltd. | | | 2,324 | | | | 90,284 | | |
Woolworths Group Ltd. | | | 3,309 | | | | 100,263 | | |
| | | | 289,990 | | |
Financials (1.5%): | |
ASX Ltd. | | | 1,429 | | | | 79,306 | | |
Australia & New Zealand Banking Group Ltd. | | | 4,329 | | | | 75,745 | | |
Commonwealth Bank of Australia | | | 1,360 | | | | 86,075 | | |
Insurance Australia Group Ltd. | | | 21,652 | | | | 78,440 | | |
Macquarie Group Ltd. | | | 630 | | | | 67,247 | | |
Magellan Financial Group Ltd. | | | 1,120 | | | | 46,325 | | |
National Australia Bank Ltd. | | | 4,700 | | | | 81,875 | | |
Suncorp Group Ltd. | | | 9,107 | | | | 68,372 | | |
Westpac Banking Corp. | | | 4,771 | | | | 71,233 | | |
| | | | 654,618 | | |
Health Care (0.5%): | |
CSL Ltd. | | | 326 | | | | 71,158 | | |
Ramsay Health Care Ltd. | | | 1,353 | | | | 64,847 | | |
Sonic Healthcare Ltd. | | | 3,120 | | | | 77,318 | | |
| | | | 213,323 | | |
Industrials (0.2%): | |
Brambles Ltd. | | | 10,554 | | | | 86,231 | | |
Materials (0.8%): | |
BHP Group Ltd. | | | 2,597 | | | | 84,935 | | |
Fortescue Metals Group Ltd. | | | 4,650 | | | | 83,979 | | |
Newcrest Mining Ltd. | | | 2,607 | | | | 51,804 | | |
Rio Tinto Ltd. | | | 1,316 | | | | 115,466 | | |
| | | | 336,184 | | |
| | | | 1,823,019 | | |
Austria (0.5%): | |
Energy (0.1%): | |
OMV AG | | | 1,432 | | | | 57,723 | | |
Financials (0.2%): | |
Erste Group Bank AG (a) | | | 2,221 | | | | 67,660 | | |
See notes to financial statements.
127
Victory Portfolios II
VictoryShares Developed Enhanced Volatility Wtd ETF | | Schedule of Portfolio Investments — continued
December 31, 2020 | |
(Unaudited)
Security Description | | Shares | | Value | |
Utilities (0.2%): | |
Verbund AG (b) | | | 1,036 | | | $ | 88,393 | | |
| | | | 213,776 | | |
Belgium (1.2%): | |
Consumer Staples (0.2%): | |
Etablissements Franz Colruyt | | | 1,071 | | | | 63,410 | | |
Financials (0.7%): | |
Ageas SA/NV | | | 1,318 | | | | 70,160 | | |
Groupe Bruxelles Lambert SA | | | 797 | | | | 80,336 | | |
KBC Group NV (a) | | | 891 | | | | 62,341 | | |
Sofina SA | | | 275 | | | | 93,047 | | |
| | | | 305,884 | | |
Health Care (0.2%): | |
Galapagos NV (a) | | | 379 | | | | 37,258 | | |
UCB SA | | | 612 | | | | 63,153 | | |
| | | | 100,411 | | |
Materials (0.1%): | |
Umicore SA | | | 1,321 | | | | 63,398 | | |
| | | | 533,103 | | |
Canada (7.6%): | |
Communication Services (0.7%): | |
BCE, Inc. | | | 1,866 | | | | 79,804 | | |
Rogers Communications, Inc. | | | 1,741 | | | | 81,065 | | |
Shaw Communications, Inc., Class B | | | 4,025 | | | | 70,652 | | |
TELUS Corp. (b) | | | 4,297 | | | | 85,116 | | |
| | | | 316,637 | | |
Consumer Discretionary (0.4%): | |
Dollarama, Inc. | | | 2,253 | | | | 91,841 | | |
Restaurant Brands International, Inc. | | | 966 | | | | 59,074 | | |
| | | | 150,915 | | |
Consumer Staples (1.1%): | |
Alimentation Couche-Tard, Inc., Class B | | | 2,269 | | | | 77,339 | | |
George Weston Ltd. (b) | | | 1,138 | | | | 85,017 | | |
Loblaw Cos. Ltd. | | | 1,678 | | | | 82,812 | | |
Metro, Inc. | | | 2,425 | | | | 108,227 | | |
Saputo, Inc. | | | 3,357 | | | | 93,981 | | |
| | | | 447,376 | | |
Energy (0.4%): | |
Canadian Natural Resources Ltd. | | | 1,825 | | | | 43,865 | | |
Enbridge, Inc. | | | 1,812 | | | | 57,961 | | |
Pembina Pipeline Corp. (b) | | | 1,349 | | | | 31,904 | | |
TC Energy Corp. | | | 1,201 | | | | 48,835 | | |
| | | | 182,565 | | |
See notes to financial statements.
128
Victory Portfolios II
VictoryShares Developed Enhanced Volatility Wtd ETF | | Schedule of Portfolio Investments — continued
December 31, 2020 | |
(Unaudited)
Security Description | | Shares | | Value | |
Financials (2.0%): | |
Bank of Montreal | | | 902 | | | $ | 68,591 | | |
Brookfield Asset Management, Inc., Class A | | | 1,631 | | | | 67,434 | | |
Canadian Imperial Bank of Commerce | | | 794 | | | | 67,827 | | |
Great-West Lifeco, Inc. | | | 2,807 | | | | 66,938 | | |
Intact Financial Corp. | | | 749 | | | | 88,701 | | |
Manulife Financial Corp. | | | 3,522 | | | | 62,680 | | |
National Bank of Canada | | | 990 | | | | 55,727 | | |
Power Corp. of Canada (b) | | | 2,406 | | | | 55,259 | | |
Royal Bank of Canada | | | 936 | | | | 76,920 | | |
Sun Life Financial, Inc. | | | 1,556 | | | | 69,199 | | |
The Bank of Nova Scotia | | | 1,511 | | | | 81,682 | | |
The Toronto-Dominion Bank | | | 1,297 | | | | 73,293 | | |
| | | | 834,251 | | |
Industrials (0.8%): | |
Canadian National Railway Co. | | | 805 | | | | 88,514 | | |
Canadian Pacific Railway Ltd. (b) | | | 236 | | | | 81,874 | | |
Thomson Reuters Corp. | | | 1,237 | | | | 101,258 | | |
Waste Connections, Inc. | | | 853 | | | | 87,478 | | |
| | | | 359,124 | | |
Information Technology (0.6%): | |
CGI, Inc. (a) | | | 1,246 | | | | 98,871 | | |
Constellation Software, Inc. | | | 76 | | | | 98,705 | | |
Open Text Corp. | | | 1,698 | | | | 77,169 | | |
Topicus.com, Inc. (a) (c) (f) | | | 141 | | | | 534 | | |
| | | | 275,279 | | |
Materials (0.8%): | |
Aginco Eagle Mines Ltd. | | | 669 | | | | 47,093 | | |
Barrick Gold Corp. | | | 1,965 | | | | 44,775 | | |
Franco-Nevada Corp. | | | 444 | | | | 55,679 | | |
Kinross Gold Corp. | | | 4,831 | | | | 35,454 | | |
Kirkland Lake Gold Ltd. (b) | | | 857 | | | | 35,419 | | |
Nutrien Ltd. (b) | | | 1,711 | | | | 82,330 | | |
Wheaton Precious Metals Corp. | | | 1,175 | | | | 49,079 | | |
| | | | 349,829 | | |
Utilities (0.8%): | |
Algonquin Power & Utilities Corp. | | | 4,553 | | | | 74,947 | | |
Emera, Inc. | | | 1,860 | | | | 79,065 | | |
Fortis, Inc. | | | 1,882 | | | | 76,895 | | |
Hydro One Ltd. (d) | | | 4,317 | | | | 97,181 | | |
| | | | 328,088 | | |
| | | | 3,244,064 | | |
Denmark (2.9%): | |
Consumer Staples (0.2%): | |
Carlsberg A/S, Class B | | | 664 | | | | 106,303 | | |
See notes to financial statements.
129
Victory Portfolios II
VictoryShares Developed Enhanced Volatility Wtd ETF | | Schedule of Portfolio Investments — continued
December 31, 2020 | |
(Unaudited)
Security Description | | Shares | | Value | |
Financials (0.4%): | |
Danske Bank A/S | | | 4,556 | | | $ | 75,280 | | |
Tryg A/S | | | 3,012 | | | | 94,987 | | |
| | | | 170,267 | | |
Health Care (0.9%): | |
Coloplast A/S, Class B | | | 592 | | | | 90,344 | | |
Genmab A/S (a) | | | 204 | | | | 82,486 | | |
GN Store Nord A/S | | | 977 | | | | 78,142 | | |
Novo Nordisk A/S, Class B | | | 1,716 | | | | 120,191 | | |
| | | | 371,163 | | |
Industrials (0.7%): | |
AP Moller — Maersk A/S, Class B | | | 40 | | | | 89,273 | | |
DSV PANALPINA A/S | | | 460 | | | | 77,027 | | |
Vestas Wind Systems A/S | | | 470 | | | | 111,069 | | |
| | | | 277,369 | | |
Materials (0.4%): | |
Christian Hansen Holding A/S (a) | | | 798 | | | | 82,061 | | |
Novozymes A/S, B Shares | | | 1,654 | | | | 94,900 | | |
| | | | 176,961 | | |
Utilities (0.3%): | |
Orsted A/S (b) (d) | | | 643 | | | | 131,262 | | |
| | | | 1,233,325 | | |
Finland (1.9%): | |
Communication Services (0.2%): | |
Elisa Oyj | | | 1,487 | | | | 81,500 | | |
Consumer Staples (0.2%): | |
Kesko Oyj, Class B | | | 3,306 | | | | 84,965 | | |
Energy (0.2%): | |
Neste Oyj | | | 1,104 | | | | 79,779 | | |
Financials (0.3%): | |
Nordea Bank Abp (a) | | | 8,907 | | | | 72,804 | | |
Sampo Oyj, Class A (b) | | | 1,520 | | | | 64,185 | | |
| | | | 136,989 | | |
Industrials (0.2%): | |
Kone Oyj, Class B | | | 1,350 | | | | 109,594 | | |
Information Technology (0.1%): | |
Nokia Oyj (a) | | | 13,168 | | | | 50,683 | | |
Materials (0.5%): | |
Stora Enso Oyj, Class R | | | 4,998 | | | | 95,513 | | |
UPM-Kymmene Oyj | | | 2,907 | | | | 108,195 | | |
| | | | 203,708 | | |
Utilities (0.2%): | |
Fortum Oyj | | | 3,453 | | | | 83,091 | | |
| | | | 830,309 | | |
See notes to financial statements.
130
Victory Portfolios II
VictoryShares Developed Enhanced Volatility Wtd ETF | | Schedule of Portfolio Investments — continued
December 31, 2020 | |
(Unaudited)
Security Description | | Shares | | Value | |
France (8.0%): | |
Communication Services (0.8%): | |
Iliad SA | | | 350 | | | $ | 71,866 | | |
Orange SA | | | 8,332 | | | | 99,068 | | |
Publicis Groupe SA | | | 1,620 | | | | 80,657 | | |
Vivendi SA | | | 2,933 | | | | 94,510 | | |
| | | | 346,101 | | |
Consumer Discretionary (1.2%): | |
Cie Generale des Etablissements Michelin SCA | | | 626 | | | | 80,251 | | |
Hermes International | | | 109 | | | | 117,112 | | |
Kering SA | | | 113 | | | | 82,044 | | |
LVMH Moet Hennessy Louis Vuitton SE | | | 172 | | | | 107,339 | | |
SEB SA | | | 421 | | | | 76,623 | | |
Sodexo SA | | | 776 | | | | 65,612 | | |
| | | | 528,981 | | |
Consumer Staples (1.2%): | |
Carrefour SA | | | 5,032 | | | | 86,236 | | |
Danone SA | | | 1,561 | | | | 102,507 | | |
L'Oreal SA | | | 283 | | | | 107,438 | | |
Pernod Ricard SA | | | 626 | | | | 119,898 | | |
Remy Cointreau SA | | | 441 | | | | 82,041 | | |
| | | | 498,120 | | |
Financials (0.9%): | |
Amundi SA (d) | | | 839 | | | | 68,459 | | |
AXA SA | | | 3,033 | | | | 72,288 | | |
BNP Paribas SA (a) | | | 1,242 | | | | 65,394 | | |
CNP Assurances | | | 2,883 | | | | 46,414 | | |
Credit Agricole SA | | | 5,295 | | | | 66,748 | | |
Natixis SA (a) | | | 12,318 | | | | 41,964 | | |
| | | | 361,267 | | |
Health Care (0.5%): | |
BioMerieux | | | 421 | | | | 59,344 | | |
Sanofi | | | 1,099 | | | | 105,649 | | |
Sartorius Stedim Biotech (b) | | | 179 | | | | 63,670 | | |
| | | | 228,663 | | |
Industrials (2.3%): | |
Alstom SA (a) | | | 1,302 | | | | 74,128 | | |
Bollore SA | | | 16,963 | | | | 70,076 | | |
Bouygues SA | | | 1,348 | | | | 55,407 | | |
Bureau Veritas SA | | | 3,371 | | | | 89,600 | | |
Cie de Saint-Gobain (a) | | | 1,467 | | | | 67,198 | | |
Edenred | | | 1,336 | | | | 75,737 | | |
Eiffage SA | | | 636 | | | | 61,404 | | |
Getlink SE (b) | | | 4,150 | | | | 71,881 | | |
Legrand SA | | | 878 | | | | 78,290 | | |
Safran SA (a) | | | 336 | | | | 47,589 | | |
Schneider Electric SE | | | 586 | | | | 84,679 | | |
See notes to financial statements.
131
Victory Portfolios II
VictoryShares Developed Enhanced Volatility Wtd ETF | | Schedule of Portfolio Investments — continued
December 31, 2020 | |
(Unaudited)
Security Description | | Shares | | Value | |
Teleperformance | | | 208 | | | $ | 68,929 | | |
Thales SA | | | 819 | | | | 74,930 | | |
Vinci SA | | | 576 | | | | 57,243 | | |
| | | | 977,091 | | |
Information Technology (0.5%): | |
Atos SE (a) | | | 822 | | | | 75,084 | | |
Capgemini SE | | | 465 | | | | 72,022 | | |
Dassault Systemes SA | | | 397 | | | | 80,571 | | |
| | | | 227,677 | | |
Materials (0.4%): | |
Air Liquide SA | | | 556 | | | | 91,176 | | |
Arkema SA | | | 566 | | | | 64,643 | | |
| | | | 155,819 | | |
Utilities (0.2%): | |
Veolia Environnement SA | | | 2,896 | | | | 70,784 | | |
| | | | 3,394,503 | | |
Germany (7.3%): | |
Communication Services (0.6%): | |
Deutsche Telekom AG | | | 5,324 | | | | 97,256 | | |
Scout24 AG (d) | | | 1,149 | | | | 94,105 | | |
United Internet AG, Registered Shares | | | 1,791 | | | | 75,322 | | |
| | | | 266,683 | | |
Consumer Discretionary (0.8%): | |
adidas AG (a) (b) | | | 227 | | | | 82,601 | | |
Bayerische Motoren Werke AG | | | 857 | | | | 75,612 | | |
Puma SE (a) (b) | | | 704 | | | | 79,354 | | |
Zalando SE (a) (b) (d) | | | 771 | | | | 85,758 | | |
| | | | 323,325 | | |
Consumer Staples (0.2%): | |
Beiersdorf AG | | | 947 | | | | 109,244 | | |
Financials (0.8%): | |
Allianz SE | | | 303 | | | | 74,282 | | |
Deutsche Boerse AG | | | 420 | | | | 71,439 | | |
Hannover Rueck SE | | | 401 | | | | 63,823 | | |
Muenchener Rueckversicherungs-Gesellschaft AG, Class R | | | 210 | | | | 62,282 | | |
Talanx AG | | | 1,605 | | | | 62,265 | | |
| | | | 334,091 | | |
Health Care (0.9%): | |
Carl Zeiss Meditec AG | | | 605 | | | | 80,478 | | |
Fresenius Medical Care AG & Co. KGaA | | | 1,286 | | | | 107,131 | | |
Fresenius SE & Co. KGaA | | | 1,552 | | | | 71,735 | | |
Merck KGaA | | | 671 | | | | 115,034 | | |
| | | | 374,378 | | |
See notes to financial statements.
132
Victory Portfolios II
VictoryShares Developed Enhanced Volatility Wtd ETF | | Schedule of Portfolio Investments — continued
December 31, 2020 | |
(Unaudited)
Security Description | | Shares | | Value | |
Industrials (0.9%): | |
Brenntag AG | | | 1,149 | | | $ | 88,898 | | |
Deutsche Post AG, Registered Shares | | | 1,571 | | | | 77,718 | | |
KION Group AG (b) | | | 714 | | | | 62,062 | | |
MTU Aero Engines AG | | | 224 | | | | 58,389 | | |
Siemens AG, Registered Shares | | | 562 | | | | 80,675 | | |
| | | | 367,742 | | |
Information Technology (0.8%): | |
Bechtle AG | | | 378 | | | | 82,372 | | |
Infineon Technologies AG | | | 1,903 | | | | 72,966 | | |
Nemetschek SE | | | 754 | | | | 55,629 | | |
SAP SE (b) | | | 522 | | | | 68,365 | | |
TeamViewer AG (a) (d) | | | 1,050 | | | | 56,215 | | |
| | | | 335,547 | | |
Materials (1.0%): | |
BASF SE | | | 1,121 | | | | 88,621 | | |
Covestro AG (d) | | | 1,448 | | | | 89,285 | | |
Evonik Industries AG | | | 2,345 | | | | 76,422 | | |
HeidelbergCement AG | | | 922 | | | | 68,947 | | |
Symrise AG | | | 730 | | | | 96,659 | | |
| | | | 419,934 | | |
Real Estate (0.7%): | |
Deutsche Wohnen SE | | | 2,130 | | | | 113,672 | | |
LEG Immobilien AG | | | 600 | | | | 93,122 | | |
Vonovia SE | | | 1,332 | | | | 97,231 | | |
| | | | 304,025 | | |
Utilities (0.6%): | |
E.ON SE | | | 7,972 | | | | 88,263 | | |
RWE AG | | | 1,850 | | | | 78,120 | | |
Uniper SE | | | 2,857 | | | | 98,552 | | |
| | | | 264,935 | | |
| | | | 3,099,904 | | |
Hong Kong (4.4%): | |
Consumer Discretionary (0.3%): | |
Galaxy Entertainment Group Ltd. | | | 8,546 | | | | 66,419 | | |
Techtronic Industries Co. Ltd. | | | 5,025 | | | | 71,691 | | |
| | | | 138,110 | | |
Consumer Staples (0.3%): | |
Sun Art Retail Group Ltd. | | | 55,686 | | | | 56,604 | | |
WH Group Ltd. (d) | | | 83,893 | | | | 70,342 | | |
| | | | 126,946 | | |
Financials (0.8%): | |
AIA Group Ltd. | | | 8,427 | | | | 103,269 | | |
Hang Seng Bank Ltd. | | | 6,585 | | | | 113,570 | | |
Hong Kong Exchanges and Clearing Ltd. | | | 1,855 | | | | 101,697 | | |
| | | | 318,536 | | |
See notes to financial statements.
133
Victory Portfolios II
VictoryShares Developed Enhanced Volatility Wtd ETF | | Schedule of Portfolio Investments — continued
December 31, 2020 | |
(Unaudited)
Security Description | | Shares | | Value | |
Health Care (0.1%): | |
Sino Biopharmaceutical Ltd. | | | 61,394 | | | $ | 59,397 | | |
Industrials (0.5%): | |
CK Hutchison Holdings Ltd. | | | 13,523 | | | | 94,372 | | |
MTR Corp. Ltd. | | | 21,661 | | | | 121,128 | | |
| | | | 215,500 | | |
Real Estate (1.4%): | |
CK Asset Holdings Ltd. | | | 14,729 | | | | 75,619 | | |
Hang Lung Properties Ltd. | | | 32,315 | | | | 85,246 | | |
Henderson Land Development Co. Ltd. | | | 27,618 | | | | 107,769 | | |
New World Development Co. Ltd. | | | 16,899 | | | | 78,694 | | |
Shimao Group Holdings Ltd. | | | 14,697 | | | | 46,827 | | |
Sino Land Co. Ltd. | | | 75,959 | | | | 98,964 | | |
Sun Hung Kai Properties Ltd. | | | 7,864 | | | | 101,442 | | |
| | | | 594,561 | | |
Utilities (1.0%): | |
China Common Rich Renewable Energy INV Ltd. (a) (c) (f) | | | 26,000 | | | | 671 | | |
CK Infrastructure Holdings Ltd. | | | 16,422 | | | | 88,230 | | |
CLP Holdings Ltd. | | | 13,950 | | | | 129,023 | | |
Hong Kong and China Gas Co. Ltd. | | | 79,394 | | | | 118,596 | | |
Power Assets Holdings Ltd. | | | 19,687 | | | | 106,661 | | |
| | | | 443,181 | | |
| | | | 1,896,231 | | |
Ireland (1.4%): | |
Consumer Discretionary (0.2%): | |
Flutter Entertainment PLC | | | 363 | | | | 74,995 | | |
Consumer Staples (0.2%): | |
Kerry Group PLC | | | 728 | | | | 108,399 | | |
Industrials (0.6%): | |
DCC PLC | | | 812 | | | | 57,489 | | |
Experian PLC | | | 1,890 | | | | 71,763 | | |
Kingspan Group PLC (a) | | | 803 | | | | 59,489 | | |
Ryanair Holdings PLC, ADR (a) | | | 707 | | | | 77,756 | | |
| | | | 266,497 | | |
Materials (0.4%): | |
CRH PLC | | | 1,606 | | | | 68,327 | | |
Smurfit Kappa Group PLC | | | 1,862 | | | | 87,565 | | |
| | | | 155,892 | | |
| | | | 605,783 | | |
Israel (0.6%): | |
Financials (0.2%): | |
Bank Hapoalim BM | | | 13,417 | | | | 91,898 | | |
Isracard Ltd. | | | — | (e) | | | 2 | | |
| | | | 91,900 | | |
See notes to financial statements.
134
Victory Portfolios II
VictoryShares Developed Enhanced Volatility Wtd ETF | | Schedule of Portfolio Investments — continued
December 31, 2020 | |
(Unaudited)
Security Description | | Shares | | Value | |
Health Care (0.1%): | |
Teva Pharmaceutical Industries Ltd. (a) | | | 5,123 | | | $ | 48,749 | | |
Information Technology (0.3%): | |
Nice Ltd. (a) | | | 338 | | | | 94,751 | | |
| | | | 235,400 | | |
Italy (2.3%): | |
Communication Services (0.4%): | |
Infrastrutture Wireless Italiane SpA (b) (d) | | | 7,778 | | | | 94,343 | | |
Telecom Italia SpA | | | 117,184 | | | | 54,021 | | |
| | | | 148,364 | | |
Consumer Discretionary (0.2%): | |
Moncler SpA | | | 1,697 | | | | 103,934 | | |
Energy (0.2%): | |
Snam SpA | | | 13,430 | | | | 75,478 | | |
Financials (0.7%): | |
Assicurazioni Generali SpA | | | 5,464 | | | | 95,174 | | |
FinecoBank Banca Fineco SpA (a) (b) | | | 4,152 | | | | 67,960 | | |
Intesa Sanpaolo SpA (a) | | | 30,015 | | | | 70,122 | | |
Poste Italiane SpA (d) | | | 6,694 | | | | 68,030 | | |
| | | | 301,286 | | |
Health Care (0.3%): | |
DiaSorin SpA | | | 350 | | | | 72,721 | | |
Recordati Industria Chimica e Farmaceutica SpA | | | 1,269 | | | | 70,265 | | |
| | | | 142,986 | | |
Information Technology (0.1%): | |
Nexi SpA (a) (d) | | | 2,972 | | | | 59,319 | | |
Utilities (0.4%): | |
Enel SpA | | | 8,370 | | | | 84,613 | | |
Terna Rete Elettrica Nazionale SpA | | | 11,010 | | | | 84,054 | | |
| | | | 168,667 | | |
| | | | 1,000,034 | | |
Japan (19.8%): | |
Communication Services (1.5%): | |
KDDI Corp. | | | 3,508 | | | | 104,180 | | |
Nexon Co. Ltd. | | | 2,800 | | | | 86,246 | | |
Nintendo Co. Ltd. | | | 200 | | | | 127,528 | | |
Nippon Telegraph & Telephone Corp. | | | 4,928 | | | | 126,279 | | |
Softbank Corp. | | | 11,000 | | | | 137,766 | | |
Z Holdings Corp. | | | 8,830 | | | | 53,404 | | |
| | | | 635,403 | | |
Consumer Discretionary (3.4%): | |
Bandai Namco Holdings, Inc. | | | 1,500 | | | | 129,688 | | |
Bridgestone Corp. | | | 3,160 | | | | 103,578 | | |
Fast Retailing Co. Ltd. | | | 100 | | | | 89,568 | | |
See notes to financial statements.
135
Victory Portfolios II
VictoryShares Developed Enhanced Volatility Wtd ETF | | Schedule of Portfolio Investments — continued
December 31, 2020 | |
(Unaudited)
Security Description | | Shares | | Value | |
Honda Motor Co. Ltd. | | | 2,700 | | | $ | 75,254 | | |
Nitori Holdings Co. Ltd. | | | 530 | | | | 110,990 | | |
Oriental Land Co. Ltd. | | | 608 | | | | 100,352 | | |
Pan Pacific International Holdings Corp. | | | 3,400 | | | | 78,644 | | |
Panasonic Corp. | | | 7,600 | | | | 87,639 | | |
Sekisui House Ltd. | | | 4,472 | | | | 90,965 | | |
Shimano, Inc. | | | 440 | | | | 102,648 | | |
Sony Corp. | | | 1,300 | | | | 129,509 | | |
Subaru Corp. | | | 3,300 | | | | 65,926 | | |
Suzuki Motor Corp. | | | 1,300 | | | | 60,215 | | |
Toyota Industries Corp. | | | 1,508 | | | | 119,629 | | |
Toyota Motor Corp. | | | 1,424 | | | | 109,752 | | |
| | | | 1,454,357 | | |
Consumer Staples (1.5%): | |
Asahi Group Holdings Ltd. | | | 2,360 | | | | 97,015 | | |
Japan Tobacco, Inc. | | | 6,444 | | | | 131,202 | | |
Kao Corp. | | | 1,418 | | | | 109,468 | | |
Kirin Holdings Co. Ltd. | | | 4,200 | | | | 99,020 | | |
Seven & i Holdings Co. Ltd. | | | 2,400 | | | | 85,060 | | |
Unicharm Corp. | | | 2,194 | | | | 103,962 | | |
| | | | 625,727 | | |
Financials (2.6%): | |
Dai-ichi Life Holdings, Inc. | | | 4,688 | | | | 70,474 | | |
Japan Exchange Group, Inc. | | | 3,600 | | | | 91,988 | | |
Japan Post Bank Co. Ltd. | | | 11,812 | | | | 96,908 | | |
Japan Post Holdings Co. Ltd. | | | 12,600 | | | | 97,978 | | |
Mitsubishi UFJ Financial Group, Inc. | | | 21,500 | | | | 94,984 | | |
Mizuho Financial Group, Inc. | | | 6,600 | | | | 83,587 | | |
MS&AD Insurance Group Holdings, Inc. | | | 4,100 | | | | 124,740 | | |
Nomura Holdings, Inc. | | | 14,500 | | | | 76,545 | | |
ORIX Corp. | | | 5,768 | | | | 88,526 | | |
Sompo Holdings, Inc. | | | 2,000 | | | | 80,841 | | |
Sumitomo Mitsui Financial Group, Inc. | | | 3,084 | | | | 95,232 | | |
Tokio Marine Holdings, Inc. | | | 2,000 | | | | 102,828 | | |
| | | | 1,104,631 | | |
Health Care (3.0%): | |
Astellas Pharma, Inc. | | | 5,552 | | | | 85,721 | | |
Chugai Pharmaceutical Co. Ltd. | | | 1,890 | | | | 100,743 | | |
Daiichi Sankyo Co. Ltd. | | | 2,500 | | | | 85,601 | | |
Eisai Co. Ltd. | | | 854 | | | | 60,981 | | |
Hoya Corp. | | | 918 | | | | 126,887 | | |
Kyowa Kirin Co. Ltd. | | | 3,300 | | | | 89,948 | | |
M3, Inc. | | | 1,200 | | | | 113,247 | | |
Olympus Corp. | | | 3,000 | | | | 65,571 | | |
Ono Pharmaceutical Co. Ltd. | | | 3,384 | | | | 101,874 | | |
Otsuka Holdings Co. Ltd. | | | 2,000 | | | | 85,587 | | |
Shionogi & Co. Ltd. | | | 1,528 | | | | 83,401 | | |
Sysmex Corp. | | | 974 | | | | 116,986 | | |
See notes to financial statements.
136
Victory Portfolios II
VictoryShares Developed Enhanced Volatility Wtd ETF | | Schedule of Portfolio Investments — continued
December 31, 2020 | |
(Unaudited)
Security Description | | Shares | | Value | |
Takeda Pharmaceutical Co. Ltd. | | | 2,500 | | | $ | 90,929 | | |
Terumo Corp. | | | 2,000 | | | | 83,533 | | |
| | | | 1,291,009 | | |
Industrials (3.4%): | |
Central Japan Railway Co. | | | 554 | | | | 78,292 | | |
Daikin Industries Ltd. | | | 466 | | | | 103,455 | | |
FANUC Corp. | | | 430 | | | | 105,626 | | |
ITOCHU Corp. | | | 4,200 | | | | 120,581 | | |
Komatsu Ltd. | | | 3,488 | | | | 95,190 | | |
Kubota Corp. | | | 4,804 | | | | 104,744 | | |
Mitsubishi Corp. | | | 4,692 | | | | 115,482 | | |
Mitsubishi Electric Corp. | | | 6,852 | | | | 103,337 | | |
Mitsui & Co. Ltd. | | | 4,986 | | | | 91,254 | | |
Nidec Corp. | | | 954 | | | | 119,943 | | |
Recruit Holdings Co. Ltd. | | | 1,520 | | | | 63,618 | | |
Secom Co. Ltd. | | | 1,210 | | | | 111,542 | | |
SG Holdings Co. Ltd. | | | 3,400 | | | | 92,608 | | |
SMC Corp. | | | 114 | | | | 69,511 | | |
Sumitomo Corp. | | | 6,898 | | | | 91,236 | | |
| | | | 1,466,419 | | |
Information Technology (3.2%): | |
Canon, Inc. (b) | | | 4,614 | | | | 88,401 | | |
FUJIFILM Holdings Corp. | | | 1,660 | | | | 87,438 | | |
Fujitsu Ltd. | | | 600 | | | | 86,623 | | |
Hitachi Ltd. | | | 2,200 | | | | 86,623 | | |
Keyence Corp. | | | 228 | | | | 128,090 | | |
Kyocera Corp. | | | 1,700 | | | | 104,167 | | |
Murata Manufacturing Co. Ltd. | | | 1,602 | | | | 144,621 | | |
NEC Corp. | | | 1,400 | | | | 75,126 | | |
Nomura Research Institute Ltd. | | | 2,874 | | | | 102,862 | | |
NTT Data Corp. | | | 6,708 | | | | 91,680 | | |
Obic Co. Ltd. | | | 500 | | | | 100,397 | | |
Omron Corp. | | | 1,200 | | | | 106,935 | | |
Oracle Corp. | | | 700 | | | | 91,195 | | |
Tokyo Electron Ltd. | | | 226 | | | | 84,060 | | |
| | | | 1,378,218 | | |
Materials (0.5%): | |
Nippon Paint Holdings Co. Ltd. | | | 838 | | | | 91,966 | | |
Shin-Etsu Chemical Co. Ltd. | | | 570 | | | | 99,601 | | |
| | | | 191,567 | | |
Real Estate (0.7%): | |
Daiwa House Industry Co. Ltd. | | | 2,900 | | | | 86,067 | | |
Mitsubishi Estate Co. Ltd. | | | 4,452 | | | | 71,455 | | |
Mitsui Fudosan Co. Ltd. | | | 3,678 | | | | 76,898 | | |
Sumitomo Realty & Development Co. Ltd. | | | 2,000 | | | | 61,623 | | |
| | | | 296,043 | | |
| | | | 8,443,374 | | |
See notes to financial statements.
137
Victory Portfolios II
VictoryShares Developed Enhanced Volatility Wtd ETF | | Schedule of Portfolio Investments — continued
December 31, 2020 | |
(Unaudited)
Security Description | | Shares | | Value | |
Korea, Republic Of (5.5%): | |
Communication Services (0.7%): | |
NAVER Corp. | | | 266 | | | $ | 71,631 | | |
NCSoft Corp. | | | 94 | | | | 80,569 | | |
Netmarble Corp. (a) (d) | | | 500 | | | | 60,532 | | |
SK Telecom Co. Ltd. | | | 500 | | | | 109,556 | | |
| | | | 322,288 | | |
Consumer Discretionary (0.9%): | |
Hyundai Mobis Co. Ltd. | | | 321 | | | | 75,507 | | |
Hyundai Motor Co. | | | 383 | | | | 67,700 | | |
Kia Motors Corp. | | | 1,720 | | | | 98,811 | | |
LG Electronics, Inc. | | | 1,023 | | | | 127,145 | | |
| | | | 369,163 | | |
Consumer Staples (0.7%): | |
Amorepacific Corp. | | | 476 | | | | 90,274 | | |
KT&G Corp. | | | 1,419 | | | | 108,561 | | |
LG Household & Health Care Ltd. | | | 62 | | | | 92,469 | | |
| | | | 291,304 | | |
Financials (0.5%): | |
KB Financial Group, Inc. | | | 1,914 | | | | 76,475 | | |
Samsung Life Insurance Co. Ltd. | | | 995 | | | | 72,459 | | |
Shinhan Financial Group Co. Ltd. | | | 2,596 | | | | 76,599 | | |
| | | | 225,533 | | |
Health Care (0.6%): | |
Celltrion Healthcare Co. Ltd. (a) | | | 628 | | | | 94,288 | | |
Celltrion, Inc. (a) | | | 226 | | | | 74,841 | | |
Samsung Biologics Co. Ltd. (a) (d) | | | 92 | | | | 69,961 | | |
| | | | 239,090 | | |
Industrials (0.4%): | |
LG Corp. | | | 918 | | | | 73,951 | | |
Samsung C&T Corp. | | | 728 | | | | 92,491 | | |
| | | | 166,442 | | |
Information Technology (1.3%): | |
Samsung Electro-Mechanics Co. Ltd. | | | 596 | | | | 97,669 | | |
Samsung Electronics Co. Ltd. | | | 1,921 | | | | 143,253 | | |
Samsung SDI Co. Ltd. | | | 135 | | | | 78,052 | | |
Samsung SDS Co. Ltd. | | | 620 | | | | 101,887 | | |
SK Hynix, Inc. | | | 1,136 | | | | 123,933 | | |
| | | | 544,794 | | |
Materials (0.4%): | |
LG Chem Ltd. | | | 81 | | | | 61,447 | | |
POSCO | | | 484 | | | | 121,201 | | |
| | | | 182,648 | | |
| | | | 2,341,262 | | |
See notes to financial statements.
138
Victory Portfolios II
VictoryShares Developed Enhanced Volatility Wtd ETF | | Schedule of Portfolio Investments — continued
December 31, 2020 | |
(Unaudited)
Security Description | | Shares | | Value | |
Luxembourg (0.3%): | |
Health Care (0.1%): | |
Eurofins Scientific SE (a) | | | 839 | | | $ | 70,334 | | |
Real Estate (0.2%): | |
Aroundtown SA | | | 10,355 | | | | 77,409 | | |
| | | | 147,743 | | |
Macau (0.2%): | |
Consumer Discretionary (0.2%): | |
Sands China Ltd. | | | 15,747 | | | | 69,166 | | |
Netherlands (3.3%): | |
Communication Services (0.2%): | |
Koninklijke KPN NV | | | 31,275 | | | | 95,009 | | |
Consumer Staples (0.9%): | |
Davide Campari-Milano NV (b) | | | 6,994 | | | | 79,793 | | |
Heineken Holding NV | | | 1,143 | | | | 107,575 | | |
Heineken NV | | | 1,068 | | | | 119,001 | | |
Koninklijke Ahold Delhaize NV | | | 3,640 | | | | 102,752 | | |
| | | | 409,121 | | |
Financials (0.6%): | |
ABN AMRO Bank NV (a) (b) (d) | | | 4,916 | | | | 48,159 | | |
Euronext NV (d) | | | 605 | | | | 66,621 | | |
ING Groep NV (a) | | | 5,817 | | | | 54,293 | | |
NN Group NV | | | 1,644 | | | | 71,349 | | |
| | | | 240,422 | | |
Health Care (0.2%): | |
Koninklijke Philips NV | | | 1,875 | | | | 100,269 | | |
Industrials (0.4%): | |
Randstad NV | | | 1,198 | | | | 77,909 | | |
Wolters Kluwer NV | | | 1,254 | | | | 105,783 | | |
| | | | 183,692 | | |
Information Technology (0.5%): | |
Adyen NV (a) (d) | | | 48 | | | | 111,693 | | |
| ASML Holding NV | | | 186 | | | | 90,323 | | |
| | | | 202,016 | | |
Materials (0.5%): | |
Akzo Nobel NV | | | 835 | | | | 89,613 | | |
Koninklijke DSM NV | | | 635 | | | | 109,211 | | |
| | | | 198,824 | | |
| | | | 1,429,353 | | |
New Zealand (0.5%): | |
Consumer Staples (0.1%): | |
a2 Milk Co. Ltd. (a) | | | 7,454 | | | | 64,715 | | |
See notes to financial statements.
139
Victory Portfolios II
VictoryShares Developed Enhanced Volatility Wtd ETF | | Schedule of Portfolio Investments — continued
December 31, 2020 | |
(Unaudited)
Security Description | | Shares | | Value | |
Health Care (0.2%): | |
Fisher & Paykel Healthcare Corp. Ltd. | | | 2,906 | | | $ | 68,917 | | |
Information Technology (0.2%): | |
Xero Ltd. (a) | | | 892 | | | | 100,947 | | |
| | | | 234,579 | | |
Norway (1.5%): | |
Communication Services (0.4%): | |
Schibsted ASA, Class A (a) | | | 1,711 | | | | 73,210 | | |
Telenor ASA | | | 6,405 | | | | 109,158 | | |
| | | | 182,368 | | |
Consumer Staples (0.5%): | |
Mowi ASA | | | 3,984 | | | | 88,886 | | |
Orkla ASA, Class A | | | 9,633 | | | | 97,895 | | |
| | | | 186,781 | | |
Financials (0.4%): | |
DNB ASA (a) | | | 4,173 | | | | 81,891 | | |
Gjensidige Forsikring ASA | | | 4,537 | | | | 101,436 | | |
| | | | 183,327 | | |
Materials (0.2%): | |
Yara International ASA | | | 2,161 | | | | 89,864 | | |
| | | | 642,340 | | |
Portugal (0.5%): | |
Consumer Staples (0.3%): | |
Jeronimo Martins SGPS SA | | | 5,842 | | | | 98,619 | | |
Utilities (0.2%): | |
Energias de Portugal SA (b) | | | 15,454 | | | | 97,330 | | |
| | | | 195,949 | | |
Russian Federation (0.1%): | |
Materials (0.1%): | |
Polymetal International PLC | | | 2,404 | | | | 55,369 | | |
Singapore (1.6%): | |
Communication Services (0.3%): | |
Singapore Telecommunications Ltd. | | | 64,500 | | | | 112,764 | | |
Consumer Staples (0.2%): | |
Wilmar International Ltd. | | | 23,162 | | | | 81,513 | | |
Financials (0.9%): | |
DBS Group Holdings Ltd. | | | 6,478 | | | | 122,765 | | |
Oversea-Chinese Banking Corp. Ltd. | | | 16,938 | | | | 128,961 | | |
United Overseas Bank Ltd. | | | 7,192 | | | | 122,960 | | |
| | | | 374,686 | | |
Real Estate (0.2%): | |
CapitaLand Ltd. | | | 43,536 | | | | 108,074 | | |
| | | | 677,037 | | |
See notes to financial statements.
140
Victory Portfolios II
VictoryShares Developed Enhanced Volatility Wtd ETF | | Schedule of Portfolio Investments — continued
December 31, 2020 | |
(Unaudited)
Security Description | | Shares | | Value | |
Spain (1.7%): | |
Consumer Discretionary (0.2%): | |
Industria de Diseno Textil SA | | | 2,681 | | | $ | 85,276 | | |
Financials (0.2%): | |
CaixaBank SA | | | 26,752 | | | | 68,655 | | |
Health Care (0.2%): | |
Grifols SA | | | 2,997 | | | | 87,420 | | |
Industrials (0.1%): | |
Aena SME SA (a) (d) | | | 357 | | | | 62,010 | | |
Information Technology (0.1%): | |
Amadeus IT Group SA | | | 929 | | | | 67,587 | | |
Utilities (0.9%): | |
Endesa SA | | | 3,061 | | | | 83,567 | | |
Iberdrola SA | | | 6,779 | | | | 96,882 | | |
Naturgy Energy Group SA | | | 3,971 | | | | 91,966 | | |
Red Electrica Corp. SA | | | 4,986 | | | | 102,166 | | |
| | | | 374,581 | | |
| | | | 745,529 | | |
Sweden (5.6%): | |
Communication Services (0.4%): | |
Tele2 AB, B Shares | | | 6,568 | | | | 86,734 | | |
Telia Co. AB | | | 23,907 | | | | 98,724 | | |
| | | | 185,458 | | |
Consumer Discretionary (0.4%): | |
Evolution Gaming Group AB (b) (d) | | | 707 | | | | 71,768 | | |
Hennes & Mauritz AB, Class B (a) | | | 3,561 | | | | 74,478 | | |
| | | | 146,246 | | |
Consumer Staples (0.7%): | |
Essity AB, Class B | | | 3,032 | | | | 97,518 | | |
ICA Gruppen AB (b) | | | 1,722 | | | | 86,039 | | |
Swedish Match AB | | | 1,203 | | | | 93,299 | | |
| | | | 276,856 | | |
Financials (1.5%): | |
EQT AB (b) | | | 2,379 | | | | 60,865 | | |
Industrivarden AB, Class C | | | 2,938 | | | | 94,851 | | |
Investor AB, Class B | | | 1,352 | | | | 98,509 | | |
Kinnevik AB, Class B | | | 1,827 | | | | 92,308 | | |
L E Lundbergforetagen AB, Class B (a) | | | 1,778 | | | | 95,258 | | |
Skandinaviska Enskilda Banken AB, Class A (a) | | | 7,103 | | | | 72,984 | | |
Svenska Handelsbanken AB, Class A (a) | | | 6,982 | | | | 70,127 | | |
Swedbank AB, Class A (a) | | | 4,194 | | | | 73,499 | | |
| | | | 658,401 | | |
See notes to financial statements.
141
Victory Portfolios II
VictoryShares Developed Enhanced Volatility Wtd ETF | | Schedule of Portfolio Investments — continued
December 31, 2020 | |
(Unaudited)
Security Description | | Shares | | Value | |
Industrials (1.8%): | |
Alfa Laval AB (a) | | | 2,805 | | | $ | 77,187 | | |
Assa Abloy AB, Class B | | | 3,450 | | | | 84,952 | | |
Atlas Copco AB, Class A | | | 1,628 | | | | 83,362 | | |
Epiroc AB, Class A | | | 5,118 | | | | 93,133 | | |
Nibe Industrier AB, Class B | | | 2,448 | | | | 80,282 | | |
Sandvik AB (a) | | | 3,369 | | | | 82,466 | | |
Skanska AB, Class B | | | 3,653 | | | | 93,148 | | |
| SKF AB, Class B | | | 3,274 | | | | 84,957 | | |
Volvo AB, Class B | | | 3,553 | | | | 83,729 | | |
| | | | 763,216 | | |
Information Technology (0.4%): | |
Hexagon AB, Class B | | | 991 | | | | 90,354 | | |
Telefonaktiebolaget LM Ericsson, Class B | | | 6,196 | | | | 73,564 | | |
| | | | 163,918 | | |
Materials (0.4%): | |
Boliden AB | | | 2,090 | | | | 74,056 | | |
Svenska Cellulosa AB SCA, Class B (a) | | | 6,115 | | | | 106,554 | | |
| | | | 180,610 | | |
| | | | 2,374,705 | | |
Switzerland (7.5%): | |
Communication Services (0.2%): | |
Swisscom AG, Registered Shares | | | 195 | | | | 105,124 | | |
Consumer Discretionary (0.5%): | |
Cie Financiere Richemont SA, Registered Shares | | | 1,183 | | | | 107,045 | | |
The Swatch Group AG, B Shares (b) | | | 353 | | | | 96,327 | | |
| | | | 203,372 | | |
Consumer Staples (1.1%): | |
Barry Callebaut AG, Registered Shares | | | 63 | | | | 149,776 | | |
Chocoladefabriken Lindt & Spruengli AG | | | 12 | | | | 117,017 | | |
Coca-Cola HBC AG | | | 2,342 | | | | 76,117 | | |
Nestle SA, Registered Shares | | | 1,058 | | | | 124,641 | | |
| | | | 467,551 | | |
Financials (1.3%): | |
Banque Cantonale Vaudoise, Registered Shares | | | 1,059 | | | | 115,234 | | |
Credit Suisse Group AG, Registered Shares | | | 5,043 | | | | 64,961 | | |
Julius Baer Group Ltd. | | | 1,262 | | | | 72,725 | | |
Partners Group Holding AG | | | 75 | | | | 88,136 | | |
Swiss Life Holding AG | | | 165 | | | | 76,888 | | |
UBS Group AG | | | 5,422 | | | | 76,398 | | |
Zurich Insurance Group AG | | | 191 | | | | 80,608 | | |
| | | | 574,950 | | |
Health Care (1.3%): | |
Lonza Group AG, Registered Shares | | | 144 | | | | 92,551 | | |
Novartis AG, Registered Shares | | | 1,272 | | | | 120,229 | | |
See notes to financial statements.
142
Victory Portfolios II
VictoryShares Developed Enhanced Volatility Wtd ETF | | Schedule of Portfolio Investments — continued
December 31, 2020 | |
(Unaudited)
Security Description | | Shares | | Value | |
Roche Holding AG | | | 302 | | | $ | 105,444 | | |
Sonova Holding AG (a) | | | 342 | | | | 88,881 | | |
Straumann Holding AG, Class R (b) | | | 69 | | | | 80,422 | | |
Vifor Pharma AG | | | 472 | | | | 74,133 | | |
| | | | 561,660 | | |
Industrials (1.5%): | |
ABB Ltd., Registered Shares | | | 3,007 | | | | 83,958 | | |
Adecco Group AG | | | 1,233 | | | | 82,423 | | |
Geberit AG, Registered Shares | | | 167 | | | | 104,578 | | |
Kuehne + Nagel International AG | | | 495 | | | | 112,312 | | |
Schindler Holding AG | | | 452 | | | | 121,861 | | |
SGS SA, Registered Shares | | | 39 | | | | 117,661 | | |
| | | | 622,793 | | |
Information Technology (0.6%): | |
Logitech International SA, Class R | | | 1,133 | | | | 109,997 | | |
Stmicroelectronics NV | | | 1,757 | | | | 65,565 | | |
Temenos AG | | | 415 | | | | 57,983 | | |
| | | | 233,545 | | |
Materials (1.0%): | |
EMS-Chemie Holding AG | | | 125 | | | | 120,480 | | |
Givaudan SA, Registered Shares | | | 27 | | | | 113,797 | | |
LafargeHolcim Ltd. | | | 1,562 | | | | 85,813 | | |
Sika AG, Registered Shares | | | 334 | | | | 91,255 | | |
| | | | 411,345 | | |
| | | | 3,180,340 | | |
United Kingdom (8.6%): | |
Communication Services (0.3%): | |
BT Group PLC (a) | | | 45,090 | | | | 81,534 | | |
Informa PLC (a) | | | 9,416 | | | | 70,681 | | |
| | | | 152,215 | | |
Consumer Discretionary (0.5%): | |
Compass Group PLC | | | 3,571 | | | | 66,550 | | |
JD Sports Fashion PLC (a) | | | 4,321 | | | | 50,810 | | |
Next PLC (a) | | | 669 | | | | 64,817 | | |
Persimmon PLC | | | 1,427 | | | | 53,988 | | |
| | | | 236,165 | | |
Consumer Staples (1.4%): | |
Associated British Foods PLC (a) | | | 2,423 | | | | 75,006 | | |
British American Tobacco PLC | | | 2,543 | | | | 94,158 | | |
Diageo PLC | | | 2,455 | | | | 96,606 | | |
Imperial Brands PLC | | | 4,846 | | | | 101,741 | | |
Tesco PLC | | | 38,110 | | | | 120,577 | | |
Unilever PLC | | | 1,680 | | | | 100,887 | | |
| | | | 588,975 | | |
See notes to financial statements.
143
Victory Portfolios II
VictoryShares Developed Enhanced Volatility Wtd ETF | | Schedule of Portfolio Investments — continued
December 31, 2020 | |
(Unaudited)
Security Description | | Shares | | Value | |
Financials (2.1%): | |
| 3i Group PLC | | | 4,550 | | | $ | 72,042 | | |
Admiral Group PLC | | | 2,732 | | | | 108,552 | | |
Aviva PLC | | | 15,765 | | | | 70,098 | | |
Barclays PLC | | | 32,545 | | | | 65,271 | | |
Hargreaves Lansdown PLC | | | 2,552 | | | | 53,213 | | |
Legal & General Group PLC | | | 15,242 | | | | 55,477 | | |
Lloyds Banking Group PLC (a) | | | 151,859 | | | | 75,663 | | |
London Stock Exchange Group PLC | | | 689 | | | | 84,861 | | |
Natwest Group PLC | | | 36,282 | | | | 83,168 | | |
Phoenix Group Holdings PLC | | | 6,745 | | | | 64,612 | | |
Schroders PLC | | | 1,668 | | | | 76,105 | | |
Standard Chartered PLC | | | 11,715 | | | | 74,627 | | |
| | | | 883,689 | | |
Health Care (0.6%): | |
AstraZeneca PLC | | | 836 | | | | 83,718 | | |
GlaxoSmithKline PLC | | | 5,247 | | | | 96,278 | | |
Smith & Nephew PLC | | | 3,326 | | | | 68,669 | | |
| | | | 248,665 | | |
Industrials (1.5%): | |
Ashtead Group PLC | | | 1,346 | | | | 63,273 | | |
BAE Systems PLC | | | 11,315 | | | | 75,622 | | |
Bunzl PLC | | | 2,355 | | | | 78,664 | | |
Ferguson PLC | | | 638 | | | | 77,498 | | |
Intertek Group PLC | | | 995 | | | | 76,839 | | |
RELX PLC | | | 3,997 | | | | 97,962 | | |
Rentokil Initial PLC (a) | | | 9,578 | | | | 66,737 | | |
Spirax-Sarco Engineering PLC | | | 647 | | | | 99,920 | | |
| | | | 636,515 | | |
Information Technology (0.5%): | |
AVEVA Group PLC | | | 823 | | | | 36,032 | | |
Halma PLC | | | 2,815 | | | | 94,261 | | |
The Sage Group PLC | | | 9,058 | | | | 72,080 | | |
| | | | 202,373 | | |
Materials (1.3%): | |
Anglo American PLC | | | 2,062 | | | | 68,356 | | |
Antofagasta PLC | | | 4,147 | | | | 81,679 | | |
BHP Group PLC | | | 2,544 | | | | 66,959 | | |
Croda International PLC | | | 1,346 | | | | 121,392 | | |
Fresnillo PLC | | | 3,186 | | | | 49,203 | | |
Mondi PLC | | | 3,856 | | | | 90,657 | | |
Rio Tinto PLC | | | 1,100 | | | | 82,270 | | |
| | | | 560,516 | | |
See notes to financial statements.
144
Victory Portfolios II
VictoryShares Developed Enhanced Volatility Wtd ETF | | Schedule of Portfolio Investments — continued
December 31, 2020 | |
(Unaudited)
Security Description | | Shares | | Value | |
Utilities (0.4%): | |
National Grid PLC | | | 7,527 | | | $ | 89,022 | | |
SSE PLC | | | 3,792 | | | | 77,772 | | |
| | | | 166,794 | | |
| | | | 3,675,907 | | |
Total Common Stocks (Cost $36,698,372) | | | 42,322,104 | | |
Investment Companies (0.2%) | |
United States (0.2%): | |
BlackRock Liquidity Funds T-Fund, Institutional Class, 0.02% (g) | | | 63,180 | | | | 63,180 | | |
Total Investment Companies (Cost $63,180) | | | 63,180 | | |
Collateral for Securities Loaned^ (3.7%) | |
United States (3.7%): | |
BlackRock Liquidity Funds TempFund Portfolio, Institutional Class, 0.08% (g) | | | 27,672 | | | | 27,672 | | |
Fidelity Investments Money Market Government Portfolio I Shares, 0.01% (g) | | | 950,689 | | | | 950,689 | | |
Goldman Sachs Financial Square Prime Obligations Fund, Institutional Class,
0.04% (g) | | | 13,810 | | | | 13,810 | | |
JPMorgan Prime Money Market Fund, Capital Class, 0.12% (g) | | | 110,113 | | | | 110,113 | | |
Morgan Stanley Institutional Liquidity Prime Portfolio, Institutional Class,
0.09% (g) | | | 495,092 | | | | 495,092 | | |
Total Collateral for Securities Loaned (Cost $1,597,376) | | | 1,597,376 | | |
Total Investments (Cost $38,358,928) — 103.0% | | | 43,982,660 | | |
Liabilities in excess of other assets — (3.0)% | | | (1,296,253 | ) | |
NET ASSETS — 100.00% | | $ | 42,686,407 | | |
^ Purchased with cash collateral from securities on loan.
(a) Non-income producing security.
(b) All or a portion of this security is on loan.
(c) Security was fair valued based upon procedures approved by the Board of Trustees and represents less than 0.05% of the Fund's net assets as of December 31, 2020. This security is classified as Level 3 within the fair value hierarchy. (See Note 2)
(d) Rule 144A security or other security that is restricted as to resale to institutional investors. The Fund's Adviser has deemed this security to be liquid based upon procedures approved by the Board of Trustees. As of December 31, 2020, the fair value of these securities was $1,405,043 and amounted to 3.3% of net assets.
(e) Rounds to less than 1.
(f) The Fund's Adviser has deemed this security to be illiquid based upon procedures approved by the Board of Trustees. As of December 31, 2020, illiquid securities were less than 0.05% of the Fund's net assets.
(g) Rate disclosed is the daily yield on December 31, 2020.
ADR — American Depositary Receipt
PLC — Public Limited Company
See notes to financial statements.
145
Victory Portfolios II
VictoryShares Developed Enhanced Volatility Wtd ETF | | Schedule of Portfolio Investments — continued
December 31, 2020 | |
(Unaudited)
Futures Contracts Purchased
| | | Number of
Contracts | | Expiration
Date | | Notional
Amount | | Value | | Unrealized
Appreciation
(Depreciation) | |
E-Mini MSCI EAFE Index Futures | | | 1 | | | 3/19/21 | | $ | 104,904 | | | $ | 106,540 | | | $ | 1,636 | | |
| | | Total unrealized appreciation | | | | | | | | $ | 1,636 | | |
| | | Total unrealized depreciation | | | | | | | | | — | | |
| | | Total net unrealized appreciation (depreciation) | | | | | | | | $ | 1,636 | | |
See notes to financial statements.
146
Victory Portfolios II
VictoryShares Nasdaq Next 50 ETF | | Schedule of Portfolio Investments
December 31, 2020 | |
(Unaudited)
Security Description | | Shares | | Value | |
Common Stocks (99.6%) | |
Communication Services (9.4%): | |
Liberty Broadband Corp., Class C (a) | | | 17,638 | | | $ | 2,793,330 | | |
Take-Two Interactive Software, Inc. (a) | | | 13,567 | | | | 2,819,087 | | |
ViacomCBS, Inc., Class B | | | 66,631 | | | | 2,482,671 | | |
Yandex NV, Class A (a) | | | 37,348 | | | | 2,598,674 | | |
| | | | 10,693,762 | | |
Consumer Discretionary (16.9%): | |
DraftKings, Inc., Class A (a) | | | 46,197 | | | | 2,150,932 | | |
Etsy, Inc. (a) | | | 14,872 | | | | 2,645,878 | | |
Expedia Group, Inc. | | | 16,033 | | | | 2,122,769 | | |
Garmin Ltd. | | | 22,555 | | | | 2,698,931 | | |
Pool Corp. | | | 4,738 | | | | 1,764,905 | | |
Roku, Inc. (a) | | | 12,855 | | | | 4,268,117 | | |
Tractor Supply Co. | | | 13,740 | | | | 1,931,569 | | |
Ulta Beauty, Inc. (a) | | | 6,643 | | | | 1,907,604 | | |
| | | | 19,490,705 | | |
Electronic Equipment, Instruments & Components (5.3%): | |
Cognex Corp. | | | 20,594 | | | | 1,653,389 | | |
Trimble, Inc. (a) | | | 29,501 | | | | 1,969,782 | | |
Zebra Technologies Corp. (a) | | | 6,286 | | | | 2,415,898 | | |
| | | | 6,039,069 | | |
Health Care (17.7%): | |
Alnylam Pharmaceuticals, Inc. (a) | | | 13,699 | | | | 1,780,459 | | |
AstraZeneca PLC, ADR | | | 57,685 | | | | 2,883,673 | | |
BeiGene Ltd., ADR (a) | | | 5,576 | | | | 1,440,783 | | |
BioMarin Pharmaceutical, Inc. (a) | | | 21,410 | | | | 1,877,443 | | |
Hologic, Inc. (a) | | | 30,309 | | | | 2,207,404 | | |
Horizon Therapeutics PLC (a) | | | 26,031 | | | | 1,904,168 | | |
Insulet Corp. (a) | | | 7,777 | | | | 1,988,035 | | |
Masimo Corp. (a) | | | 6,494 | | | | 1,742,860 | | |
Novocure Ltd. (a) | | | 12,006 | | | | 2,077,518 | | |
Royalty Pharma PLC, Class A (b) | | | 45,774 | | | | 2,290,989 | | |
| | | | 20,193,332 | | |
Industrials (9.1%): | |
C.H. Robinson Worldwide, Inc. | | | 16,034 | | | | 1,505,112 | | |
Enphase Energy, Inc. (a) | | | 14,900 | | | | 2,614,503 | | |
Expeditors International of Washington, Inc. | | | 19,963 | | | | 1,898,681 | | |
J.B. Hunt Transport Services, Inc. | | | 12,463 | | | | 1,703,069 | | |
Old Dominion Freight Line, Inc. | | | 13,835 | | | | 2,700,315 | | |
| | | | 10,421,680 | | |
IT Services (7.2%): | |
Akamai Technologies, Inc. (a) | | | 19,196 | | | | 2,015,388 | | |
MongoDB, Inc. (a) | | | 6,943 | | | | 2,492,815 | | |
StoneCo Ltd., Class A (a) | | | 26,635 | | | | 2,235,209 | | |
Wix.com Ltd. (a) | | | 6,560 | | | | 1,639,738 | | |
| | | | 8,383,150 | | |
See notes to financial statements.
147
Victory Portfolios II
VictoryShares Nasdaq Next 50 ETF | | Schedule of Portfolio Investments — continued
December 31, 2020 | |
(Unaudited)
Security Description | | Shares | | Value | |
Semiconductors & Semiconductor Equipment (7.4%): | |
Monolithic Power Systems, Inc. | | | 5,320 | | | $ | 1,948,344 | | |
Qorvo, Inc. (a) | | | 13,452 | | | | 2,236,664 | | |
SolarEdge Technologies, Inc. (a) | | | 6,041 | | | | 1,927,804 | | |
Teradyne, Inc. | | | 19,583 | | | | 2,347,805 | | |
| | | | 8,460,617 | | |
Software (22.0%): | |
Citrix Systems, Inc. | | | 14,519 | | | | 1,888,922 | | |
Coupa Software, Inc. (a) | | | 8,119 | | | | 2,751,610 | | |
Crowdstrike Holdings, Inc., Class A (a) | | | 21,748 | | | | 4,606,660 | | |
Datadog, Inc., Class A (a) | | | 24,534 | | | | 2,415,127 | | |
Fortinet, Inc. (a) | | | 19,144 | | | | 2,843,458 | | |
NortonLifeLock, Inc. | | | 69,797 | | | | 1,450,382 | | |
SS&C Technologies Holdings, Inc. | | | 30,185 | | | | 2,195,959 | | |
The Trade Desk, Inc., Class A (a) | | | 4,946 | | | | 3,961,746 | | |
Zscaler, Inc. (a) | | | 15,822 | | | | 3,159,812 | | |
| | | | 25,273,676 | | |
Technology Hardware, Storage & Peripherals (3.3%): | |
Logitech International SA, Class R (b) | | | 19,950 | | | | 1,938,941 | | |
Seagate Technology PLC | | | 30,300 | | | | 1,883,448 | | |
| | | | 3,822,389 | | |
Utilities (1.3%): | |
Alliant Energy Corp. | | | 29,454 | | | | 1,517,765 | | |
Total Common Stocks (Cost $99,277,592) | | | 114,296,145 | | |
Collateral for Securities Loaned^ (1.7%) | |
BlackRock Liquidity Funds TempFund Portfolio, Institutional Class, 0.08% (c) | | | 33,553 | | | | 33,553 | | |
Fidelity Investments Money Market Government Portfolio I Shares, 0.01% (c) | | | 1,152,725 | | | | 1,152,725 | | |
Goldman Sachs Financial Square Prime Obligations Fund, Institutional Class,
0.04% (c) | | | 16,744 | | | | 16,744 | | |
JPMorgan Prime Money Market Fund, Capital Class, 0.12% (c) | | | 133,514 | | | | 133,514 | | |
Morgan Stanley Institutional Liquidity Prime Portfolio, Institutional Class,
0.09% (c) | | | 600,306 | | | | 600,306 | | |
Total Collateral for Securities Loaned (Cost $1,936,842) | | | 1,936,842 | | |
Total Investments (Cost $101,214,434) — 101.3% | | | 116,232,987 | | |
Liabilities in excess of other assets — (1.3)% | | | (1,477,854 | ) | |
NET ASSETS — 100.00% | | $ | 114,755,133 | | |
^ Purchased with cash collateral from securities on loan.
(a) Non-income producing security.
(b) All or a portion of this security is on loan.
(c) Rate disclosed is the daily yield on December 31, 2020.
ADR — American Depositary Receipt
PLC — Public Limited Company
See notes to financial statements.
148
Victory Portfolios II
VictoryShares Nasdaq Next 50 ETF | | Schedule of Portfolio Investments — continued
December 31, 2020 | |
(Unaudited)
Futures Contracts Purchased
| | | Number of
Contracts | | Expiration
Date | | Notional
Amount | | Value | | Unrealized
Appreciation
(Depreciation) | |
NASDAQ 100 E-Mini Futures | | | 2 | | | 3/19/21 | | $ | 510,723 | | | $ | 515,420 | | | $ | 4,697 | | |
| | | Total unrealized appreciation | | | | | | | | $ | 4,697 | | |
| | | Total unrealized depreciation | | | | | | | | | — | | |
| | | Total net unrealized appreciation (depreciation) | | | | | | | | $ | 4,697 | | |
See notes to financial statements.
149
Victory Portfolios II
VictoryShares Top Veteran Employers ETF | | Schedule of Portfolio Investments
December 31, 2020 | |
(Unaudited)
Security Description | | Shares | | Value | |
Common Stocks (99.7%) | |
Aerospace & Defense (7.9%): | |
General Dynamics Corp. | | | 378 | | | $ | 56,254 | | |
Lockheed Martin Corp. | | | 155 | | | | 55,022 | | |
Northrop Grumman Corp. | | | 187 | | | | 56,983 | | |
The Boeing Co. | | | 268 | | | | 57,368 | | |
| | | | 225,627 | | |
Airlines (2.0%): | |
Southwest Airlines Co. | | | 1,220 | | | | 56,864 | | |
Commercial Services & Supplies (2.0%): | |
Waste Management, Inc. | | | 474 | | | | 55,899 | | |
Communication Services (6.0%): | |
AT&T, Inc. | | | 1,966 | | | | 56,542 | | |
Comcast Corp., Class A | | | 1,125 | | | | 58,950 | | |
Verizon Communications, Inc. | | | 936 | | | | 54,990 | | |
| | | | 170,482 | | |
Construction & Engineering (1.9%): | |
AECOM (a) | | | 1,089 | | | | 54,210 | | |
Consumer Discretionary (8.0%): | |
Amazon.com, Inc. (a) | | | 18 | | | | 58,625 | | |
General Motors Co. | | | 1,289 | | | | 53,674 | | |
Hilton Worldwide Holdings, Inc. | | | 545 | | | | 60,637 | | |
The Home Depot, Inc. | | | 204 | | | | 54,186 | | |
| | | | 227,122 | | |
Consumer Staples (7.8%): | |
Brown-Forman Corp., Class B | | | 701 | | | | 55,680 | | |
Hormel Foods Corp. | | | 1,198 | | | | 55,839 | | |
Kellogg Co. | | | 884 | | | | 55,011 | | |
Walmart, Inc. | | | 370 | | | | 53,336 | | |
| | | | 219,866 | | |
Electrical Equipment (2.0%): | |
Eaton Corp. PLC | | | 467 | | | | 56,105 | | |
Financials (23.6%): | |
Bank of America Corp. | | | 2,007 | | | | 60,832 | | |
Capital One Financial Corp. | | | 660 | | | | 65,241 | | |
Citigroup, Inc. | | | 1,026 | | | | 63,263 | | |
JPMorgan Chase & Co. | | | 479 | | | | 60,867 | | |
Marsh & McLennan Cos., Inc. | | | 493 | | | | 57,681 | | |
Prudential Financial, Inc. | | | 747 | | | | 58,318 | | |
The Allstate Corp. | | | 552 | | | | 60,681 | | |
The Charles Schwab Corp. | | | 1,159 | | | | 61,473 | | |
The Progressive Corp. | | | 649 | | | | 64,174 | | |
The Travelers Cos., Inc. | | | 436 | | | | 61,201 | | |
U.S. Bancorp | | | 1,308 | | | | 60,940 | | |
| | | | 674,671 | | |
See notes to financial statements.
150
Victory Portfolios II
VictoryShares Top Veteran Employers ETF | | Schedule of Portfolio Investments — continued
December 31, 2020 | |
(Unaudited)
Security Description | | Shares | | Value | |
Health Care (8.2%): | |
CVS Health Corp. | | | 834 | | | $ | 56,962 | | |
DaVita, Inc. (a) | | | 514 | | | | 60,344 | | |
Humana, Inc. | | | 141 | | | | 57,848 | | |
Merck & Co., Inc. | | | 703 | | | | 57,505 | | |
| | | | 232,659 | | |
Industrial Conglomerates (2.1%): | |
General Electric Co. | | | 5,552 | | | | 59,962 | | |
Information Technology (12.2%): | |
Accenture PLC, Class A | | | 227 | | | | 59,295 | | |
Booz Allen Hamilton Holding Corp. | | | 651 | | | | 56,754 | | |
CACI International, Inc., Class A (a) | | | 238 | | | | 59,341 | | |
CDW Corp. | | | 433 | | | | 57,065 | | |
Fiserv, Inc. (a) | | | 491 | | | | 55,905 | | |
Leidos Holdings, Inc. | | | 561 | | | | 58,972 | | |
| | | | 347,332 | | |
Road & Rail (6.0%): | |
J.B. Hunt Transport Services, Inc. | | | 418 | | | | 57,120 | | |
Union Pacific Corp. | | | 277 | | | | 57,677 | | |
Werner Enterprises, Inc. | | | 1,401 | | | | 54,947 | | |
| | | | 169,744 | | |
Trading Companies & Distributors (2.0%): | |
United Rentals, Inc. (a) | | | 249 | | | | 57,746 | | |
Utilities (8.0%): | |
Dominion Energy, Inc. | | | 720 | | | | 54,144 | | |
Exelon Corp. | | | 1,376 | | | | 58,095 | | |
The Southern Co. | | | 944 | | | | 57,990 | | |
Xcel Energy, Inc. | | | 839 | | | | 55,936 | | |
| | | | 226,165 | | |
Total Common Stocks (Cost $2,577,619) | | | 2,834,454 | | |
Total Investments (Cost $2,577,619) — 99.7% | | | 2,834,454 | | |
Other assets in excess of liabilities — 0.3% | | | 7,506 | | |
NET ASSETS — 100.00% | | $ | 2,841,960 | | |
(a) Non-income producing security.
PLC — Public Limited Company
See notes to financial statements.
151
Victory Portfolios II
VictoryShares Protect America ETF | | Schedule of Portfolio Investments
December 31, 2020 | |
(Unaudited)
Security Description | | Shares | | Value | |
Common Stocks (99.8%) | |
Aerospace & Defense (54.6%): | |
AeroVironment, Inc. (a) | | | 208 | | | $ | 18,075 | | |
CAE, Inc. (a) | | | 983 | | | | 27,268 | | |
Cubic Corp. | | | 229 | | | | 14,207 | | |
General Dynamics Corp. | | | 1,445 | | | | 215,045 | | |
Huntington Ingalls Industries, Inc. | | | 710 | | | | 121,041 | | |
L3Harris Technologies, Inc. | | | 442 | | | | 83,547 | | |
Lockheed Martin Corp. | | | 523 | | | | 185,655 | | |
Maxar Technologies, Inc. | | | 1,110 | | | | 42,835 | | |
Moog, Inc., Class A | | | 148 | | | | 11,736 | | |
Northrop Grumman Corp. | | | 635 | | | | 193,497 | | |
Parsons Corp. (a) | | | 1,342 | | | | 48,862 | | |
Raytheon Technologies Corp. | | | 3,478 | | | | 248,712 | | |
Teledyne Technologies, Inc. (a) | | | 48 | | | | 18,815 | | |
Textron, Inc. | | | 403 | | | | 19,477 | | |
The Boeing Co. | | | 1,210 | | | | 259,014 | | |
Vectrus, Inc. (a) | | | 1,731 | | | | 86,065 | | |
| | | | 1,593,851 | | |
Air Freight & Logistics (1.4%): | |
FedEx Corp. | | | 152 | | | | 39,462 | | |
United Parcel Service, Inc., Class B | | | 4 | | | | 674 | | |
| | | | 40,136 | | |
Communication Services (1.1%): | |
AT&T, Inc. | | | 288 | | | | 8,283 | | |
Gogo, Inc. (a) | | | 40 | | | | 385 | | |
Iridium Communications, Inc. (a) | | | 436 | | | | 17,146 | | |
Verizon Communications, Inc. | | | 99 | | | | 5,816 | | |
| | | | 31,630 | | |
Construction & Engineering (5.2%): | |
AECOM (a) | | | 377 | | | | 18,767 | | |
Jacobs Engineering Group, Inc. | | | 1,078 | | | | 117,459 | | |
Tutor Perini Corp. (a) | | | 1,311 | | | | 16,977 | | |
| | | | 153,203 | | |
Health Care (4.4%): | |
Cigna Corp. | | | 138 | | | | 28,729 | | |
Humana, Inc. | | | 241 | | | | 98,875 | | |
| | | | 127,604 | | |
Industrial Conglomerates (6.6%): | |
3M Co. | | | 100 | | | | 17,479 | | |
General Electric Co. | | | 16,057 | | | | 173,415 | | |
Honeywell International, Inc. | | | 8 | | | | 1,702 | | |
| | | | 192,596 | | |
Information Technology (20.2%): | |
Booz Allen Hamilton Holding Corp. | | | 1,205 | | | | 105,052 | | |
CACI International, Inc., Class A (a) | | | 344 | | | | 85,770 | | |
See notes to financial statements.
152
Victory Portfolios II
VictoryShares Protect America ETF | | Schedule of Portfolio Investments — continued
December 31, 2020 | |
(Unaudited)
Security Description | | Shares | | Value | |
Cisco Systems, Inc. | | | 40 | | | $ | 1,790 | | |
Conduent, Inc. (a) | | | 4,210 | | | | 20,208 | | |
DXC Technology Co. | | | 830 | | | | 21,373 | | |
FLIR Systems, Inc. | | | 74 | | | | 3,243 | | |
KBR, Inc. | | | 526 | | | | 16,269 | | |
Leidos Holdings, Inc. | | | 1,123 | | | | 118,049 | | |
ManTech International Corp., Class A | | | 439 | | | | 39,045 | | |
Microsoft Corp. | | | 116 | | | | 25,801 | | |
Science Applications International Corp. | | | 1,276 | | | | 120,760 | | |
ViaSat, Inc. (a) | | | 1,038 | | | | 33,891 | | |
| | | | 591,251 | | |
Machinery (3.9%): | |
Caterpillar, Inc. | | | 76 | | | | 13,834 | | |
Cummins, Inc. | | | 56 | | | | 12,718 | | |
Oshkosh Corp. | | | 1,026 | | | | 88,307 | | |
| | | | 114,859 | | |
Materials (0.8%): | |
Ball Corp. | | | 244 | | | | 22,736 | | |
Professional Services (0.7%): | |
ASGN, Inc. (a) | | | 228 | | | | 19,045 | | |
Real Estate (0.3%): | |
The GEO Group, Inc. | | | 950 | | | | 8,417 | | |
Utilities (0.6%): | |
Duke Energy Corp. | | | 204 | | | | 18,678 | | |
Total Common Stocks (Cost $2,580,846) | | | 2,914,006 | | |
Total Investments (Cost $2,580,846) — 99.8% | | | 2,914,006 | | |
Other assets in excess of liabilities — 0.2% | | | 6,510 | | |
NET ASSETS — 100.00% | | $ | 2,920,516 | | |
(a) Non-income producing security.
See notes to financial statements.
153
Victory Portfolios II | | Statements of Assets and Liabilities
December 31, 2020 | |
(Unaudited)
| | | VictoryShares
US 500 Volatility
Wtd ETF | | VictoryShares
US Small Cap
Volatility
Wtd ETF | | VictoryShares
International
Volatility
Wtd ETF | |
ASSETS: | |
Affiliated investments, at value (Cost $—,
$38,567 and $—) | | $ | — | | | $ | 55,947 | | | $ | — | | |
Unaffiliated investments, at value
(Cost $543,278,613, $18,231,167 and
$96,769,389) | | | 689,336,275 | (a) | | | 21,743,181 | (b) | | | 114,452,835 | (c) | |
Foreign currency, at value (Cost $—, $—
and $26,699) | | | — | | | | — | | | | 26,777 | | |
Cash and cash equivalents | | | 1,385,237 | | | | 72,278 | | | | 8,423 | | |
Deposit with brokers for futures contracts | | | 241,869 | | | | 19,454 | | | | 30,220 | | |
Receivables: | |
Interest and dividends | | | 563,387 | | | | 12,605 | | | | 173,086 | | |
Variation margin on open
futures contracts | | | 11,076 | | | | — | | | | — | | |
Reclaims | | | — | | | | — | | | | 88,611 | | |
From Adviser | | | 7,131 | | | | 3,558 | | | | 11,653 | | |
Prepaid expenses | | | 10,515 | | | | 282 | | | | 1,378 | | |
Total Assets | | | 691,555,490 | | | | 21,907,305 | | | | 114,792,983 | | |
LIABILITIES: | |
Payables: | |
Collateral received on loaned securities | | | 9,138,419 | | | | 345,054 | | | | 2,675,646 | | |
Variation margin on open futures
contracts | | | — | | | | 85 | | | | 299 | | |
Accrued expenses and other payables: | |
Investment advisory fees | | | 170,854 | | | | 5,331 | | | | 37,339 | | |
Administration fees | | | 8,699 | | | | 240 | | | | 1,859 | | |
Custodian fees | | | 5,803 | | | | 451 | | | | 5,157 | | |
Compliance fees | | | 474 | | | | 17 | | | | 68 | | |
Trustees' fees | | | 1,889 | | | | — | | | | — | | |
Other accrued expenses | | | 53,151 | | | | 10,235 | | | | 19,611 | | |
Total Liabilities | | | 9,379,289 | | | | 361,413 | | | | 2,739,979 | | |
NET ASSETS: | |
Capital | | | 577,094,966 | | | | 26,121,634 | | | | 102,422,273 | | |
Total accumulated earnings/(loss) | | | 105,081,235 | | | | (4,575,742 | ) | | | 9,630,731 | | |
Net Assets | | $ | 682,176,201 | | | $ | 21,545,892 | | | $ | 112,053,004 | | |
Shares Outstanding (unlimited shares
authorized, no par value): | | | 10,950,000 | | | | 400,000 | | | | 2,700,000 | | |
Net asset value: | | $ | 62.30 | | | $ | 53.86 | | | $ | 41.50 | | |
(a) Includes $8,941,082 of securities on loan.
(b) Includes $337,004 of securities on loan.
(c) Includes $2,538,487 of securities on loan.
See notes to financial statements.
154
Victory Portfolios II | | Statements of Assets and Liabilities
December 31, 2020 | |
(Unaudited)
| | | VictoryShares
Emerging Market
Volatility
Wtd ETF | | VictoryShares
US Large Cap
High Div Volatility
Wtd ETF | | VictoryShares
US Small Cap
High Div Volatility
Wtd ETF | |
ASSETS: | |
Investments, at value (Cost $6,928,446,
$173,077,090 and $87,541,637) | | $ | 9,474,566 | | | $ | 185,581,780 | | | $ | 101,923,292 | (a) | |
Foreign currency, at value (Cost $14,519,
$— and $—) | | | 14,814 | | | | — | | | | — | | |
Cash and cash equivalents | | | 8,892 | | | | 229,989 | | | | 299,567 | | |
Deposit with brokers for futures contracts | | | 11,314 | | | | 131,908 | | | | 67,363 | | |
Receivables: | |
Interest and dividends | | | 12,435 | | | | 422,100 | | | | 145,541 | | |
Investments sold | | | 2,038 | | | | — | | | | — | | |
Variation margin on open
futures contracts | | | — | | | | 2,466 | | | | — | | |
From Adviser | | | 31,261 | | | | 5,134 | | | | 3,419 | | |
Prepaid expenses | | | 705 | | | | 3,244 | | | | 1,059 | | |
Total Assets | | | 9,556,025 | | | | 186,376,621 | | | | 102,440,241 | | |
LIABILITIES: | |
Payables: | |
Collateral received on loaned securities | | | — | | | | — | | | | 2,884,542 | | |
Variation margin on open futures
contracts | | | — | | | | — | | | | 249 | | |
Accrued foreign capital gains taxes | | | 58,697 | | | | — | | | | — | | |
Accrued expenses and other payables: | |
Investment advisory fees | | | 3,503 | | | | 47,067 | | | | 23,566 | | |
Administration fees | | | 24 | | | | 2,375 | | | | 1,453 | | |
Custodian fees | | | — | | | | 2,503 | | | | 898 | | |
Compliance fees | | | 19 | | | | 171 | | | | 58 | | |
Trustees' fees | | | — | | | | 536 | | | | — | | |
Other accrued expenses | | | 34,046 | | | | 29,563 | | | | 14,114 | | |
Total Liabilities | | | 96,289 | | | | 82,215 | | | | 2,924,880 | | |
NET ASSETS: | |
Capital | | | 13,216,763 | | | | 219,065,559 | | | | 107,494,084 | | |
Total accumulated earnings/(loss) | | | (3,757,027 | ) | | | (32,771,153 | ) | | | (7,978,723 | ) | |
Net Assets | | $ | 9,459,736 | | | $ | 186,294,406 | | | $ | 99,515,361 | | |
Shares Outstanding (unlimited shares
authorized, no par value): | | | 350,000 | | | | 3,950,000 | | | | 2,000,000 | | |
Net asset value: | | $ | 27.03 | | | $ | 47.16 | | | $ | 49.76 | | |
(a) Includes $2,796,236 of securities on loan.
See notes to financial statements.
155
Victory Portfolios II | | Statements of Assets and Liabilities
December 31, 2020 | |
(Unaudited)
| | | VictoryShares
International
High Div Volatility
Wtd ETF | | VictoryShares
Emerging Market
High Div Volatility
Wtd ETF | | VictoryShares
Dividend
Accelerator
ETF | |
ASSETS: | |
Investments, at value (Cost $21,619,567,
$16,289,140 and $267,942,254) | | $ | 22,438,058 | (a) | | $ | 16,535,848 | | | $ | 318,247,596 | | |
Foreign currency, at value (Cost $11,370,
$195,099 and $—) | | | 11,372 | | | | 194,955 | | | | — | | |
Cash and cash equivalents | | | 80,343 | | | | — | | | | 735,926 | | |
Deposit with brokers for futures contracts | | | 23,353 | | | | 51,879 | | | | 108,090 | | |
Receivables: | |
Interest and dividends | | | 95,665 | | | | 31,059 | | | | 420,920 | | |
Capital shares issued | | | — | | | | — | | | | 1,984,075 | | |
Investments sold | | | — | | | | 72,210 | | | | — | | |
Variation margin on open
futures contracts | | | — | | | | — | | | | 6,156 | | |
Reclaims | | | 75,282 | | | | 2,512 | | | | — | | |
From Adviser | | | 6,289 | | | | 13,848 | | | | 5,550 | | |
Prepaid expenses | | | 1,057 | | | | 380 | | | | 3,917 | | |
Total Assets | | | 22,731,419 | | | | 16,902,691 | | | | 321,512,230 | | |
LIABILITIES: | |
Payables: | |
Collateral received on loaned securities | | | 298,358 | | | | — | | | | — | | |
Payable to custodian | | | — | | | | 117,255 | | | | — | | |
Investments purchased | | | — | | | | 46,260 | | | | 1,975,836 | | |
Variation margin on open
futures contracts | | | 860 | | | | 105 | | | | — | | |
Accrued expenses and other payables: | |
Investment advisory fees | | | 7,543 | | | | 7,958 | | | | 78,301 | | |
Administration fees | | | 111 | | | | 107 | | | | 5,283 | | |
Custodian fees | | | 2,454 | | | | 8,693 | | | | 1,631 | | |
Compliance fees | | | 40 | | | | 22 | | | | 163 | | |
Trustees' fees | | | — | | | | — | | | | 172 | | |
Other accrued expenses | | | 13,953 | | | | 21,837 | | | | 14,729 | | |
Total Liabilities | | | 323,319 | | | | 202,237 | | | | 2,076,115 | | |
NET ASSETS: | |
Capital | | | 35,571,362 | | | | 22,717,869 | | | | 274,647,888 | | |
Total accumulated earnings/(loss) | | | (13,163,262 | ) | | | (6,017,415 | ) | | | 44,788,227 | | |
Net Assets | | $ | 22,408,100 | | | $ | 16,700,454 | | | $ | 319,436,115 | | |
Shares Outstanding (unlimited shares
authorized, no par value): | | | 750,000 | | | | 750,000 | | | | 8,050,000 | | |
Net asset value: | | $ | 29.88 | | | $ | 22.27 | | | $ | 39.68 | | |
(a) Includes $283,989 of securities on loan.
See notes to financial statements.
156
Victory Portfolios II | | Statements of Assets and Liabilities
December 31, 2020 | |
(Unaudited)
| | | VictoryShares
US Multi-Factor
Minimum Volatility
ETF | | VictoryShares
US 500
Enhanced Volatility
Wtd ETF | | VictoryShares
US EQ Income
Enhanced Volatility
Wtd ETF | |
ASSETS: | |
Investments, at value (Cost $129,791,152,
$602,638,591 and $549,088,193) | | $ | 145,561,693 | | | $ | 765,981,818 | (a) | | $ | 648,213,022 | (b) | |
Cash and cash equivalents | | | 428,123 | | | | — | | | | — | | |
Deposit with brokers for futures
contracts | | | 40,243 | | | | 266,607 | | | | 241,864 | | |
Receivables: | |
Interest and dividends | | | 158,536 | | | | 621,193 | | | | 1,449,735 | | |
Variation margin on open
futures contracts | | | 3,696 | | | | 12,306 | | | | 11,082 | | |
From Adviser | | | 3,910 | | | | 6,901 | | | | 8,283 | | |
Prepaid expenses | | | 2,562 | | | | 10,126 | | | | 9,277 | | |
Total Assets | | | 146,198,763 | | | | 766,898,951 | | | | 649,933,263 | | |
LIABILITIES: | |
Payables: | |
Collateral received on loaned
securities | | | — | | | | 12,462,722 | | | | 4,453,649 | | |
Accrued expenses and other payables: | |
Investment advisory fees | | | 36,725 | | | | 188,259 | | | | 162,446 | | |
Administration fees | | | 2,360 | | | | 9,108 | | | | 8,616 | | |
Custodian fees | | | 1,463 | | | | 6,780 | | | | 6,489 | | |
Compliance fees | | | 87 | | | | 514 | | | | 443 | | |
Trustees' fees | | | — | | | | 2,739 | | | | 2,031 | | |
Other accrued expenses | | | 12,671 | | | | 46,861 | | | | 36,531 | | |
Total Liabilities | | | 53,306 | | | | 12,716,983 | | | | 4,670,205 | | |
NET ASSETS: | |
Capital | | | 136,572,601 | | | | 659,744,736 | | | | 626,778,562 | | |
Total accumulated earnings/(loss) | | | 9,572,856 | | | | 94,437,232 | | | | 18,484,496 | | |
Net Assets | | $ | 146,145,457 | | | $ | 754,181,968 | | | $ | 645,263,058 | | |
Shares Outstanding (unlimited shares
authorized, no par value): | | | 4,300,000 | | | | 12,100,000 | | | | 12,000,000 | | |
Net asset value: | | $ | 33.99 | | | $ | 62.33 | | | $ | 53.77 | | |
(a) Includes $12,140,263 of securities on loan.
(b) Includes $4,399,668 of securities on loan.
See notes to financial statements.
157
Victory Portfolios II | | Statements of Assets and Liabilities
December 31, 2020 | |
(Unaudited)
| | | VictoryShares
US Discovery
Enhanced Volatility
Wtd ETF | | VictoryShares
Developed
Enhanced Volatility
Wtd ETF | | VictoryShares
Nasdaq
Next 50 ETF | |
ASSETS: | |
Affiliated investments, at value
(Cost $86,490, $— and $—) | | $ | 124,100 | | | $ | — | | | $ | — | | |
Unaffiliated investments, at value
(Cost $37,192,266, $38,358,928 and
$101,214,434) | | | 48,769,367 | (a) | | | 43,982,660 | (b) | | | 116,232,987 | (c) | |
Foreign currency, at value (Cost $—,
$22,024 and $—) | | | — | | | | 22,154 | | | | — | | |
Cash and cash equivalents | | | — | | | | — | | | | 362,694 | | |
Deposit with brokers for futures
contracts | | | 32,306 | | | | 50,736 | | | | 61,082 | | |
Receivables: | |
Interest and dividends | | | 28,007 | | | | 65,913 | | | | 51,864 | | |
Variation margin on open futures
contracts | | | — | | | | — | | | | 1,760 | | |
Reclaims | | | — | | | | 202,391 | | | | — | | |
From Adviser | | | 4,038 | | | | 22,941 | | | | 6,875 | | |
Prepaid expenses | | | 672 | | | | 813 | | | | 420 | | |
Total Assets | | | 48,958,490 | | | | 44,347,608 | | | | 116,717,682 | | |
LIABILITIES: | |
Payables: | |
Collateral received on loaned
securities | | | 1,198,900 | | | | 1,597,376 | | | | 1,936,842 | | |
Variation margin on open futures
contracts | | | 85 | | | | 860 | | | | — | | |
Accrued expenses and other payables: | |
Investment advisory fees | | | 11,885 | | | | 14,230 | | | | 13,947 | | |
Administration fees | | | 393 | | | | 105 | | | | 10 | | |
Custodian fees | | | 676 | | | | 23,433 | | | | — | | |
Compliance fees | | | 42 | | | | 48 | | | | 74 | | |
Trustees' fees | | | — | | | | — | | | | 875 | | |
Other accrued expenses | | | 13,842 | | | | 25,149 | | | | 10,801 | | |
Total Liabilities | | | 1,225,823 | | | | 1,661,201 | | | | 1,962,549 | | |
NET ASSETS: | |
Capital | | | 70,174,628 | | | | 62,664,085 | | | | 95,920,559 | | |
Total accumulated earnings/(loss) | | | (22,441,961 | ) | | | (19,977,678 | ) | | | 18,834,574 | | |
Net Assets | | $ | 47,732,667 | | | $ | 42,686,407 | | | $ | 114,755,133 | | |
Shares Outstanding (unlimited shares
authorized, no par value): | | | 950,000 | | | | 1,350,000 | | | | 3,625,000 | | |
Net asset value: | | $ | 50.24 | | | $ | 31.62 | | | $ | 31.66 | | |
(a) Includes $1,172,578 of securities on loan.
(b) Includes $1,513,094 of securities on loan.
(c) Includes $1,910,686 of securities on loan.
See notes to financial statements.
158
Victory Portfolios II | | Statements of Assets and Liabilities
December 31, 2020 | |
(Unaudited)
| | | VictoryShares
Top Veteran
Employers ETF | | VictoryShares
Protect America
ETF | |
ASSETS: | |
Investments, at value (Cost $2,577,619 and $2,580,846) | | $ | 2,834,454 | | | $ | 2,914,006 | | |
Cash and cash equivalents | | | 515 | | | | 1,363 | | |
Deposit with brokers for futures contracts | | | 1,000 | | | | 1,000 | | |
Receivables: | |
Interest and dividends | | | 2,229 | | | | 372 | | |
From Adviser | | | 4,453 | | | | 4,460 | | |
Prepaid expenses | | | 7,162 | | | | 7,173 | | |
Total Assets | | | 2,849,813 | | | | 2,928,374 | | |
LIABILITIES: | |
Accrued expenses and other payables: | |
Investment advisory fees | | | 1,312 | | | | 1,361 | | |
Administration fees | | | 51 | | | | 51 | | |
Custodian fees | | | 461 | | | | 452 | | |
Compliance fees | | | 38 | | | | 37 | | |
Trustees' fees | | | 149 | | | | 146 | | |
Other accrued expenses | | | 5,842 | | | | 5,811 | | |
Total Liabilities | | | 7,853 | | | | 7,858 | | |
NET ASSETS: | |
Capital | | | 2,562,420 | | | | 2,586,933 | | |
Total accumulated earnings/(loss) | | | 279,540 | | | | 333,583 | | |
Net Assets | | $ | 2,841,960 | | | $ | 2,920,516 | | |
Shares Outstanding (unlimited shares
authorized, no par value): | | | 100,000 | | | | 100,000 | | |
Net asset value: | | $ | 28.42 | | | $ | 29.21 | | |
See notes to financial statements.
159
Victory Portfolios II | | Statements of Operations
For the Six Months Ended December 31, 2020 | |
(Unaudited)
| | | VictoryShares
US 500 Volatility
Wtd ETF | | VictoryShares
US Small Cap
Volatility
Wtd ETF | | VictoryShares
International
Volatility
Wtd ETF | |
Investment Income: | |
Dividends | | $ | 5,265,403 | | | $ | 176,982 | | | $ | 1,076,038 | | |
Income distributed from affiliated investments | | | — | | | | 254 | | | | — | | |
Interest | | | 185 | | | | 7 | | | | — | | |
Securities lending (net of fees) | | | 17,845 | | | | 685 | | | | 14,150 | | |
Foreign tax withholding | | | — | | | | (122 | ) | | | (140,558 | ) | |
Total Income | | | 5,283,433 | | | | 177,806 | | | | 949,630 | | |
Expenses: | |
Investment advisory fees | | | 999,353 | | | | 27,080 | | | | 187,466 | | |
Administration fees | | | 201,540 | | | | 5,452 | | | | 28,309 | | |
Sub-Administration fees | | | 8,925 | | | | 8,925 | | | | 8,925 | | |
Custodian fees | | | 16,016 | | | | 1,652 | | | | 44,955 | | |
Servicing fees | | | 2,106 | | | | 2,065 | | | | 2,065 | | |
Trustees' fees | | | 28,841 | | | | 965 | | | | 3,799 | | |
Compliance fees | | | 3,128 | | | | 84 | | | | 408 | | |
Legal and audit fees | | | 32,020 | | | | 4,175 | | | | 7,988 | | |
Printing fees | | | 41,689 | | | | 2,799 | | | | 2,440 | | |
Other expenses | | | 9,539 | | | | 2,485 | | | | 9,949 | | |
Total Expenses | | | 1,343,157 | | | | 55,682 | | | | 296,304 | | |
Expenses waived/reimbursed by Adviser | | | (173,977 | ) | | | (23,950 | ) | | | (84,464 | ) | |
Net Expenses | | | 1,169,180 | | | | 31,732 | | | | 211,840 | | |
Net Investment Income (Loss) | | | 4,114,253 | | | | 146,074 | | | | 737,790 | | |
Realized/Unrealized Gains (Losses)
from Investments: | |
Net realized gains (losses) from unaffiliated
investment securities and foreign currency
translations | | | (9,191,720 | ) | | | (516,489 | ) | | | (1,187,098 | ) | |
Net realized gains (losses) from futures contracts | | | 405,760 | | | | 10,638 | | | | 60,304 | | |
Net realized gains (losses) from in-kind redemptions
on unaffiliated securities | | | 26,356,778 | | | | — | | | | — | | |
Net change in unrealized appreciation/depreciation
on unaffiliated investment securities and foreign
currency translations | | | 121,467,628 | | | | 5,966,941 | | | | 18,495,851 | | |
Net change in unrealized appreciation/depreciation
on affiliated investment securities | | | — | | | | 17,519 | | | | — | | |
Net change in unrealized appreciation/depreciation
on futures contracts | | | (16,866 | ) | | | 842 | | | | 3,555 | | |
Net realized/unrealized gains (losses) on investments | | | 139,021,580 | | | | 5,479,451 | | | | 17,372,612 | | |
Change in net assets resulting from operations | | $ | 143,135,833 | | | $ | 5,625,525 | | | $ | 18,110,402 | | |
See notes to financial statements.
160
Victory Portfolios II | | Statements of Operations
For the Six Months Ended December 31, 2020 | |
(Unaudited)
| | | VictoryShares
Emerging Market
Volatility
Wtd ETF | | VictoryShares
US Large Cap
High Div Volatility
Wtd ETF | | VictoryShares
US Small Cap
High Div Volatility
Wtd ETF | |
Investment Income: | |
Dividends | | $ | 655,519 | | | $ | 3,673,373 | | | $ | 1,736,570 | | |
Interest | | | 14 | | | | 88 | | | | 60 | | |
Securities lending (net of fees) | | | 4,560 | | | | 688 | | | | 6,015 | | |
Foreign tax withholding | | | (103,131 | ) | | | — | | | | (1,282 | ) | |
Total Income | | | 556,962 | | | | 3,674,149 | | | | 1,741,363 | | |
Expenses: | |
Investment advisory fees | | | 69,010 | | | | 277,613 | | | | 105,627 | | |
Administration fees | | | 9,347 | | | | 55,996 | | | | 21,248 | | |
Sub-Administration fees | | | 10,410 | | | | 8,925 | | | | 8,925 | | |
Custodian fees | | | 89,019 | | | | 5,462 | | | | 2,723 | | |
Servicing fees | | | 2,064 | | | | 2,065 | | | | 2,065 | | |
Trustees' fees | | | 1,820 | | | | 8,709 | | | | 3,080 | | |
Compliance fees | | | 182 | | | | 920 | | | | 315 | | |
Legal and audit fees | | | 14,529 | | | | 11,264 | | | | 5,731 | | |
Printing fees | | | 1,870 | | | | 19,924 | | | | 6,588 | | |
Line of credit fees | | | 64 | | | | — | | | | — | | |
Other expenses | | | 9,683 | | | | 3,787 | | | | 2,511 | | |
Total Expenses | | | 207,998 | | | | 394,665 | | | | 158,813 | | |
Expenses waived/reimbursed by Adviser | | | (131,501 | ) | | | (69,982 | ) | | | (34,928 | ) | |
Net Expenses | | | 76,497 | | | | 324,683 | | | | 123,885 | | |
Net Investment Income (Loss) | | | 480,465 | | | | 3,349,466 | | | | 1,617,478 | | |
Realized/Unrealized Gains (Losses)
from Investments: | |
Net realized gains (losses) from investment
securities and foreign currency
translations | | | (1,820,054 | ) | | | (5,868,120 | ) | | | (1,716,115 | ) | |
Foreign taxes on realized gains | | | (89,279 | ) | | | — | | | | — | | |
Net realized gains (losses) from futures
contracts | | | 39,783 | | | | 173,946 | | | | 84,588 | | |
Net realized gains (losses) from in-kind
redemptions | | | — | | | | (121,808 | ) | | | (31,622 | ) | |
Net change in unrealized appreciation/
depreciation on investment securities
and foreign currency translations | | | 5,128,708 | | | | 38,269,823 | | | | 24,074,433 | | |
Net change in unrealized appreciation/
depreciation on futures contracts | | | (81 | ) | | | 7,707 | | | | (4,223 | ) | |
Net change in accrued foreign taxes on
unrealized gains | | | (58,697 | ) | | | — | | | | — | | |
Net realized/unrealized gains (losses)
on investments | | | 3,200,380 | | | | 32,461,548 | | | | 22,407,061 | | |
Change in net assets resulting from operations | | $ | 3,680,845 | | | $ | 35,811,014 | | | $ | 24,024,539 | | |
See notes to financial statements.
161
Victory Portfolios II | | Statements of Operations
For the Six Months Ended December 31, 2020 | |
(Unaudited)
| | | VictoryShares
International
High Div Volatility
Wtd ETF | | VictoryShares
Emerging Market
High Div Volatility
Wtd ETF | | VictoryShares
Dividend
Accelerator
ETF | |
Investment Income: | |
Dividends | | $ | 1,177,092 | | | $ | 660,545 | | | $ | 3,033,187 | | |
Interest | | | — | | | | 7 | | | | 97 | | |
Securities lending (net of fees) | | | 14,142 | | | | 6 | | | | 61 | | |
Foreign tax withholding | | | (164,505 | ) | | | (88,240 | ) | | | — | | |
Total Income | | | 1,026,729 | | | | 572,318 | | | | 3,033,345 | | |
Expenses: | |
Investment advisory fees | | | 107,524 | | | | 48,397 | | | | 415,654 | | |
Administration fees | | | 16,331 | | | | 6,508 | | | | 83,692 | | |
Sub-Administration fees | | | 8,925 | | | | 9,916 | | | | 8,947 | | |
Custodian fees | | | 14,758 | | | | 43,794 | | | | 6,401 | | |
Servicing fees | | | 2,065 | | | | 2,010 | | | | 2,010 | | |
Trustees' fees | | | 2,806 | | | | 1,209 | | | | 10,524 | | |
Compliance fees | | | 289 | | | | 110 | | | | 1,179 | | |
Legal and audit fees | | | 6,549 | | | | 7,067 | | | | 15,662 | | |
Line of credit fees | | | — | | | | 42 | | | | — | | |
Other expenses | | | 8,023 | | | | 8,360 | | | | 12,918 | | |
Total Expenses | | | 167,270 | | | | 127,413 | | | | 556,987 | | |
Expenses waived/reimbursed by Adviser | | | (46,462 | ) | | | (73,518 | ) | | | (69,946 | ) | |
Net Expenses | | | 120,808 | | | | 53,895 | | | | 487,041 | | |
Net Investment Income (Loss) | | | 905,921 | | | | 518,423 | | | | 2,546,304 | | |
Realized/Unrealized Gains (Losses)
from Investments: | |
Net realized gains (losses) from investment
securities and foreign currency translations | | | (2,375,967 | ) | | | (1,469,366 | ) | | | 2,006,200 | | |
Net realized gains (losses) from futures contracts | | | 48,701 | | | | 58,383 | | | | 196,233 | | |
Net realized gains (losses) from in-kind
redemptions | | | 1,456,257 | | | | 106,717 | | | | 1,388,307 | | |
Net change in unrealized appreciation/
depreciation on investment securities
and foreign currency translations | | | 9,618,312 | | | | 3,920,478 | | | | 45,682,714 | | |
Net change in unrealized appreciation/
depreciation on futures contracts | | | (73 | ) | | | 789 | | | | 9,112 | | |
Net realized/unrealized gains (losses) on
investments | | | 8,747,230 | | | | 2,617,001 | | | | 49,282,566 | | |
Change in net assets resulting from operations | | $ | 9,653,151 | | | $ | 3,135,424 | | | $ | 51,828,870 | | |
See notes to financial statements.
162
Victory Portfolios II | | Statements of Operations
For the Six Months Ended December 31, 2020 | |
(Unaudited)
| | | VictoryShares
US Multi-Factor
Minimum Volatility
ETF | | VictoryShares
US 500
Enhanced Volatility
Wtd ETF | | VictoryShares
US EQ Income
Enhanced Volatility
Wtd ETF | |
Investment Income: | |
Dividends | | $ | 1,910,818 | | | $ | 5,079,999 | | | $ | 9,770,490 | | |
Interest | | | 154 | | | | — | | | | — | | |
Securities lending (net of fees) | | | 201 | | | | 14,427 | | | | 3,178 | | |
Total Income | | | 1,911,173 | | | | 5,094,426 | | | | 9,773,668 | | |
Expenses: | |
Investment advisory fees | | | 229,830 | | | | 1,001,908 | | | | 900,250 | | |
Administration fees | | | 46,373 | | | | 201,811 | | | | 181,416 | | |
Sub-Administration fees | | | 8,947 | | | | 8,925 | | | | 8,925 | | |
Custodian fees | | | 4,695 | | | | 13,615 | | | | 13,143 | | |
Servicing fees | | | 1,974 | | | | 2,106 | | | | 2,106 | | |
Trustees' fees | | | 6,592 | | | | 27,945 | | | | 25,426 | | |
Compliance fees | | | 708 | | | | 3,024 | | | | 2,748 | | |
Legal and audit fees | | | 10,065 | | | | 33,436 | | | | 32,634 | | |
Other expenses | | | 10,305 | | | | 48,549 | | | | 46,466 | | |
Total Expenses | | | 319,489 | | | | 1,341,319 | | | | 1,213,114 | | |
Expenses waived/reimbursed
by Adviser | | | (50,715 | ) | | | (167,886 | ) | | | (159,240 | ) | |
Net Expenses | | | 268,774 | | | | 1,173,433 | | | | 1,053,874 | | |
Net Investment Income (Loss) | | | 1,642,399 | | | | 3,920,993 | | | | 8,719,794 | | |
Realized/Unrealized Gains (Losses)
from Investments: | |
Net realized gains (losses) from
investment securities | | | 399,117 | | | | 4,235,692 | | | | 19,757,767 | | |
Net realized gains (losses) from futures
contracts | | | 81,832 | | | | 412,036 | | | | 585,293 | | |
Net realized gains (losses) from in-kind
redemptions | | | 4,402,329 | | | | 1,425,159 | | | | 3,048,577 | | |
Net change in unrealized appreciation/
depreciation on investment securities | | | 10,142,769 | | | | 117,490,350 | | | | 63,972,663 | | |
Net change in unrealized appreciation/
depreciation on futures contracts | | | 17,532 | | | | 63,483 | | | | 47,455 | | |
Net realized/unrealized gains (losses)
on investments | | | 15,043,579 | | | | 123,626,720 | | | | 87,411,755 | | |
Change in net assets resulting
from operations | | $ | 16,685,978 | | | $ | 127,547,713 | | | $ | 96,131,549 | | |
See notes to financial statements.
163
Victory Portfolios II | | Statements of Operations
For the Six Months Ended December 31, 2020 | |
(Unaudited)
| | | VictoryShares
US Discovery
Enhanced Volatility
Wtd ETF | | VictoryShares
Developed
Enhanced Volatility
Wtd ETF | | VictoryShares
Nasdaq Next
50 ETF(a) | |
Investment Income: | |
Dividends | | $ | 368,763 | | | $ | 489,578 | | | $ | 173,515 | | |
Income distributed from affiliated investments | | | 535 | | | | — | | | | — | | |
Interest | | | — | | | | 155 | | | | 16 | | |
Securities lending (net of fees) | | | 1,540 | | | | 5,501 | | | | 7,802 | | |
Foreign tax withholding | | | (226 | ) | | | (64,206 | ) | | | (1,497 | ) | |
Total Income | | | 370,612 | | | | 431,028 | | | | 179,836 | | |
Expenses: | |
Investment advisory fees | | | 64,326 | | | | 90,012 | | | | 36,891 | | |
Administration fees | | | 12,956 | | | | 13,622 | | | | 14,646 | | |
Sub-Administration fees | | | 8,928 | | | | 8,925 | | | | — | | |
Custodian fees | | | 2,098 | | | | 73,929 | | | | — | | |
Servicing fees | | | 2,048 | | | | 2,065 | | | | 1,183 | | |
Trustees' fees | | | 2,039 | | | | 2,388 | | | | 1,396 | | |
Compliance fees | | | 202 | | | | 233 | | | | 178 | | |
Legal and audit fees | | | 5,217 | | | | 5,930 | | | | 5,159 | | |
Printing fees | | | 6,094 | | | | 6,856 | | | | 2,963 | | |
Other expenses | | | 2,773 | | | | 9,082 | | | | 12,132 | | |
Total Expenses | | | 106,681 | | | | 213,042 | | | | 74,548 | | |
Expenses waived/reimbursed by Adviser | | | (31,329 | ) | | | (111,571 | ) | | | (29,604 | ) | |
Net Expenses | | | 75,352 | | | | 101,471 | | | | 44,944 | | |
Net Investment Income (Loss) | | | 295,260 | | | | 329,557 | | | | 134,892 | | |
Realized/Unrealized Gains (Losses)
from Investments: | |
Net realized gains (losses) from unaffiliated
investment securities and foreign
currency translations | | | 2,257,044 | | | | (704,770 | ) | | | (466,702 | ) | |
Net realized gains (losses) from affiliated
investment securities | | | 9 | | | | — | | | | — | | |
Net realized gains (losses) from futures
contracts | | | 45,452 | | | | 36,648 | | | | 33,145 | | |
Net realized gains (losses) from in-kind
redemptions on unaffiliated securities | | | 985,068 | | | | 1,717,516 | | | | 4,248,059 | | |
Net realized gains (losses) from in-kind
redemptions on affiliated securities | | | 2,577 | | | | — | | | | — | | |
Net change in unrealized appreciation/
depreciation on unaffiliated investment
securities | | | 7,651,192 | | | | 6,293,738 | | | | 15,018,553 | | |
Net change in unrealized appreciation/
depreciation on affiliated investment
securities | | | 33,491 | | | | — | | | | — | | |
Net change in unrealized appreciation/
depreciation on futures contracts | | | (3,154 | ) | | | 2,009 | | | | 4,697 | | |
Net realized/unrealized gains (losses) on
investments | | | 10,971,679 | | | | 7,345,141 | | | | 18,837,752 | | |
Change in net assets resulting from
operations | | $ | 11,266,939 | | | $ | 7,674,698 | | | $ | 18,972,644 | | |
(a) VictoryShares Nasdaq Next 50 ETF Fund commenced operations on September 9, 2020.
See notes to financial statements.
164
Victory Portfolios II | | Statements of Operations
For the Six Months Ended December 31, 2020 | |
(Unaudited)
| | | VictoryShares
Top Veteran
Employers
ETF(a) | | VictoryShares
Protect
America
ETF(b) | |
Investment Income: | |
Dividends | | $ | 8,518 | | | $ | 7,430 | | |
Interest | | | — | (c) | | | — | (c) | |
Securities lending (net of fees) | | | — | | | | 1 | | |
Total Income | | | 8,518 | | | | 7,431 | | |
Expenses: | |
Investment advisory fees | | | 2,421 | | | | 2,448 | | |
Administration fees | | | 261 | | | | 264 | | |
Sub-Administration fees | | | 2,731 | | | | 2,683 | | |
Custodian fees | | | 462 | | | | 452 | | |
Servicing fees | | | 360 | | | | 360 | | |
Trustees' fees | | | 149 | | | | 146 | | |
Compliance fees | | | 38 | | | | 37 | | |
Legal and audit fees | | | 1,680 | | | | 1,654 | | |
Registration and filing fees | | | 605 | | | | 587 | | |
Printing fees | | | 1,520 | | | | 1,502 | | |
Other expenses | | | 720 | | | | 715 | | |
Total Expenses | | | 10,947 | | | | 10,848 | | |
Expenses waived/reimbursed by Adviser | | | (8,295 | ) | | | (8,165 | ) | |
Net Expenses | | | 2,652 | | | | 2,683 | | |
Net Investment Income (Loss) | | | 5,866 | | | | 4,748 | | |
Realized/Unrealized Gains (Losses) from Investments: | |
Net realized gains (losses) from investment securities | | | 22,681 | | | | 409 | | |
Net change in unrealized appreciation/depreciation on investment
securities | | | 256,835 | | | | 333,160 | | |
Net realized/unrealized gains (losses) on investments | | | 279,516 | | | | 333,569 | | |
Change in net assets resulting from operations | | $ | 285,382 | | | $ | 338,317 | | |
(a) VictoryShares Top Veteran Employers ETF Fund commenced on November 3, 2020.
(b) VictoryShares Protect America ETF Fund commenced on November 4, 2020.
(c) Rounds to less than $1.
See notes to financial statements.
165
Victory Portfolios II | | Statements of Changes in Net Assets | |
| | | VictoryShares
US 500 Volatility
Wtd ETF | | VictoryShares
US Small Cap
Volatility Wtd ETF | | VictoryShares International
Volatility Wtd ETF | |
| | | Six
Months
Ended
December 31,
2020
(unaudited) | | Year
Ended
June 30,
2020 | | Six
Months
Ended
December 31,
2020
(unaudited) | | Year
Ended
June 30,
2020 | | Six
Months
Ended
December 31,
2020
(unaudited) | | Year
Ended
June 30,
2020 | |
From Investment Activities: | |
Operations: | |
Net investment income
(loss) | | $ | 4,114,253 | | | $ | 11,430,747 | | | $ | 146,074 | | | $ | 325,336 | | | $ | 737,790 | | | $ | 1,712,775 | | |
Net realized gains (losses)
from investments | | | 17,570,818 | | | | (8,106,151 | ) | | | (505,851 | ) | | | (2,962,991 | ) | | | (1,126,794 | ) | | | (4,588,893 | ) | |
Net change in unrealized
appreciation/
depreciation
on investments | | | 121,450,762 | | | | (37,017,453 | ) | | | 5,985,302 | | | | (729,592 | ) | | | 18,499,406 | | | | (3,660,392 | ) | |
Change in net assets resulting
from operations | | | 143,135,833 | | | | (33,692,857 | ) | | | 5,625,525 | | | | (3,367,247 | ) | | | 18,110,402 | | | | (6,536,510 | ) | |
Change in net assets resulting
from distributions to
shareholders | | | (4,832,909 | ) | | | (11,639,455 | ) | | | (169,044 | ) | | | (333,395 | ) | | | (1,046,819 | ) | | | (1,636,991 | ) | |
Change in net assets resulting
from capital transactions | | | (126,131,590 | ) | | | (16,437,793 | ) | | | — | | | | (10,023,892 | ) | | | 11,869,461 | | | | 55,078,264 | | |
Change in net assets | | | 12,171,334 | | | | (61,770,105 | ) | | | 5,456,481 | | | | (13,724,534 | ) | | | 28,933,044 | | | | 46,904,763 | | |
Net Assets: | |
Beginning of period | | | 670,004,867 | | | | 731,774,972 | | | | 16,089,411 | | | | 29,813,945 | | | | 83,119,960 | | | | 36,215,197 | | |
End of period | | $ | 682,176,201 | | | $ | 670,004,867 | | | $ | 21,545,892 | | | $ | 16,089,411 | | | $ | 112,053,004 | | | $ | 83,119,960 | | |
Capital Transactions: | |
Proceeds from shares
issued | | | 3,066,868 | | | | 176,174,573 | | | | — | | | | 4,863,773 | | | | 11,869,461 | | | | 63,002,989 | | |
Cost of shares redeemed | | | (129,198,458 | ) | | | (192,612,366 | ) | | | — | | | | (14,887,665 | ) | | | — | | | | (7,924,725 | ) | |
Change in net assets resulting
from capital transactions | | | (126,131,590 | ) | | | (16,437,793 | ) | | | — | | | | (10,023,892 | ) | | | 11,869,461 | | | | 55,078,264 | | |
Share Transactions: | |
Issued | | | 50,000 | | | | 3,300,000 | | | | — | | | | 100,000 | | | | 300,000 | | | | 1,700,000 | | |
Redeemed | | | (2,350,000 | ) | | | (4,000,000 | ) | | | — | | | | (350,000 | ) | | | — | | | | (250,000 | ) | |
Change in Shares | | | (2,300,000 | ) | | | (700,000 | ) | | | — | | | | (250,000 | ) | | | 300,000 | | | | 1,450,000 | | |
See notes to financial statements.
166
Victory Portfolios II | | Statements of Changes in Net Assets | |
| | | VictoryShares
Emerging Market
Volatility Wtd ETF | | VictoryShares
US Large Cap High Div
Volatility Wtd ETF | | VictoryShares
US Small Cap High Div
Volatility Wtd ETF | |
| | | Six
Months
Ended
December 31,
2020
(unaudited) | | Year
Ended
June 30,
2020 | | Six
Months
Ended
December 31,
2020
(unaudited) | | Year
Ended
June 30,
2020 | | Six
Months
Ended
December 31,
2020
(unaudited) | | Year
Ended
June 30,
2020 | |
From Investment Activities: | |
Operations: | |
Net investment income
(loss) | | $ | 480,465 | | | $ | 1,024,423 | | | $ | 3,349,466 | | | $ | 10,457,657 | | | $ | 1,617,478 | | | $ | 3,214,648 | | |
Net realized gains (losses)
from investments | | | (1,869,550 | ) | | | (4,295,294 | ) | | | (5,815,982 | ) | | | (27,598,774 | ) | | | (1,663,149 | ) | | | (11,297,828 | ) | |
Net change in unrealized
appreciation/
depreciation
on investments | | | 5,069,930 | | | | (3,714,989 | ) | | | 38,277,530 | | | | (42,199,209 | ) | | | 24,070,210 | | | | (8,242,123 | ) | |
Change in net assets resulting
from operations | | | 3,680,845 | | | | (6,985,860 | ) | | | 35,811,014 | | | | (59,340,326 | ) | | | 24,024,539 | | | | (16,325,303 | ) | |
Change in net assets resulting
from distributions to
shareholders | | | (648,898 | ) | | | (831,383 | ) | | | (3,653,099 | ) | | | (10,982,914 | ) | | | (2,060,082 | ) | | | (3,347,836 | ) | |
Change in net assets resulting
from capital transactions | | | (36,210,638 | ) | | | 32,121,357 | | | | (39,498,810 | ) | | | (67,568,336 | ) | | | 11,409,162 | | | | 10,537,591 | | |
Change in net assets | | | (33,178,691 | ) | | | 24,304,114 | | | | (7,340,895 | ) | | | (137,891,576 | ) | | | 33,373,619 | | | | (9,135,548 | ) | |
Net Assets: | |
Beginning of period | | | 42,638,427 | | | | 18,334,313 | | | | 193,635,301 | | | | 331,526,877 | | | | 66,141,742 | | | | 75,277,290 | | |
End of period | | $ | 9,459,736 | | | $ | 42,638,427 | | | $ | 186,294,406 | | | $ | 193,635,301 | | | $ | 99,515,361 | | | $ | 66,141,742 | | |
Capital Transactions: | |
Proceeds from shares
issued | | | 1,146,316 | | | | 35,201,851 | | | | — | | | | 175,033,492 | | | | 20,531,238 | | | | 61,100,744 | | |
Cost of shares redeemed | | | (37,356,954 | ) | | | (3,080,494 | ) | | | (39,498,810 | ) | | | (242,601,828 | ) | | | (9,122,076 | ) | | | (50,563,153 | ) | |
Change in net assets resulting
from capital transactions | | | (36,210,638 | ) | | | 32,121,357 | | | | (39,498,810 | ) | | | (67,568,336 | ) | | | 11,409,162 | | | | 10,537,591 | | |
Share Transactions: | |
Issued | | | 50,000 | | | | 1,350,000 | | | | — | | | | 3,700,000 | | | | 450,000 | | | | 1,400,000 | | |
Redeemed | | | (1,600,000 | ) | | | (150,000 | ) | | | (950,000 | ) | | | (5,850,000 | ) | | | (250,000 | ) | | | (1,300,000 | ) | |
Change in Shares | | | (1,550,000 | ) | | | 1,200,000 | | | | (950,000 | ) | | | (2,150,000 | ) | | | 200,000 | | | | 100,000 | | |
See notes to financial statements.
167
Victory Portfolios II | | Statements of Changes in Net Assets | |
| | | VictoryShares
International High Div
Volatility Wtd ETF | | VictoryShares
Emerging Market
High Div Volatility
Wtd ETF | | VictoryShares
Dividend
Accelerator ETF | |
| | | Six
Months
Ended
December 31,
2020
(unaudited) | | Year
Ended
June 30,
2020 | | Six
Months
Ended
December 31,
2020
(unaudited) | | Year
Ended
June 30,
2020 | | Six
Months
Ended
December 31,
2020
(unaudited) | | Year
Ended
June 30,
2020 | |
From Investment Activities: | |
Operations: | |
Net investment income
(loss) | | $ | 905,921 | | | $ | 2,619,735 | | | $ | 518,423 | | | $ | 1,591,736 | | | $ | 2,546,304 | | | $ | 2,715,156 | | |
Net realized gains (losses)
from investments | | | (871,009 | ) | | | (11,187,546 | ) | | | (1,304,266 | ) | | | (6,079,435 | ) | | | 3,590,740 | | | | (5,716,266 | ) | |
Net change in unrealized
appreciation/
depreciation
on investments | | | 9,618,239 | | | | (7,487,291 | ) | | | 3,921,267 | | | | (3,444,499 | ) | | | 45,691,826 | | | | 3,435,766 | | |
Change in net assets resulting
from operations | | | 9,653,151 | | | | (16,055,102 | ) | | | 3,135,424 | | | | (7,932,198 | ) | | | 51,828,870 | | | | 434,656 | | |
Change in net assets resulting
from distributions to
shareholders | | | (1,203,437 | ) | | | (2,460,188 | ) | | | (579,505 | ) | | | (1,690,396 | ) | | | (2,920,871 | ) | | | (2,413,888 | ) | |
Change in net assets resulting
from capital transactions | | | (48,083,645 | ) | | | 40,017,292 | | | | (7,534,639 | ) | | | (8,949,498 | ) | | | 35,251,507 | | | | 220,806,252 | | |
Change in net assets | | | (39,633,931 | ) | | | 21,502,002 | | | | (4,978,720 | ) | | | (18,572,092 | ) | | | 84,159,506 | | | | 218,827,020 | | |
Net Assets: | |
Beginning of period | | | 62,042,031 | | | | 40,540,029 | | | | 21,679,174 | | | | 40,251,266 | | | | 235,276,609 | | | | 16,449,589 | | |
End of period | | $ | 22,408,100 | | | $ | 62,042,031 | | | $ | 16,700,454 | | | $ | 21,679,174 | | | $ | 319,436,115 | | | $ | 235,276,609 | | |
Capital Transactions: | |
Proceeds from shares
issued | | | — | | | | 51,700,753 | | | | — | | | | 5,939,593 | | | | 40,836,449 | | | | 239,360,512 | | |
Cost of shares redeemed | | | (48,083,645 | ) | | | (11,683,461 | ) | | | (7,534,639 | ) | | | (14,889,091 | ) | | | (5,584,942 | ) | | | (18,554,260 | ) | |
Change in net assets resulting
from capital transactions | | | (48,083,645 | ) | | | 40,017,292 | | | | (7,534,639 | ) | | | (8,949,498 | ) | | | 35,251,507 | | | | 220,806,252 | | |
Share Transactions: | |
Issued | | | — | | | | 1,600,000 | | | | — | | | | 250,000 | | | | 1,100,000 | | | | 7,150,000 | | |
Redeemed | | | (1,700,000 | ) | | | (400,000 | ) | | | (350,000 | ) | | | (800,000 | ) | | | (150,000 | ) | | | (550,000 | ) | |
Change in Shares | | | (1,700,000 | ) | | | 1,200,000 | | | | (350,000 | ) | | | (550,000 | ) | | | 950,000 | | | | 6,600,000 | | |
See notes to financial statements.
168
Victory Portfolios II | | Statements of Changes in Net Assets | |
| | | VictoryShares
US Multi-Factor
Minimum
Volatility ETF | | VictoryShares
US 500
Enhanced Volatility
Wtd ETF | | VictoryShares
US EQ Income Enhanced
Volatility Wtd ETF | |
| | Six
Months
Ended
December 31,
2020
(unaudited) | |
Year
Ended
June 30,
2020 | | Six
Months
Ended
December 31,
2020
(unaudited) | |
Year
Ended
June 30,
2020 | | Six
Months
Ended
December 31,
2020
(unaudited) | |
Year
Ended
June 30,
2020 | |
From Investment Activities: | |
Operations: | |
Net investment income
(loss) | | $ | 1,642,399 | | | $ | 3,305,520 | | | $ | 3,920,993 | | | $ | 8,359,234 | | | $ | 8,719,794 | | | $ | 19,107,515 | | |
Net realized gains
(losses) from
investments | | | 4,883,278 | | | | (6,565,700 | ) | | | 6,072,887 | | | | 54,278,678 | | | | 23,391,637 | | | | 6,923,829 | | |
Net change in unrealized
appreciation/
depreciation
on investments | | | 10,160,301 | | | | 2,884,358 | | | | 117,553,833 | | | | (16,435,854 | ) | | | 64,020,118 | | | | 408,079 | | |
Change in net assets resulting
from operations | | | 16,685,978 | | | | (375,822 | ) | | | 127,547,713 | | | | 46,202,058 | | | | 96,131,549 | | | | 26,439,423 | | |
Change in net assets resulting
from distributions to
shareholders | | | (1,808,618 | ) | | | (3,232,593 | ) | | | (4,095,328 | ) | | | (9,141,838 | ) | | | (9,451,505 | ) | | | (19,790,977 | ) | |
Change in net assets resulting
from capital transactions | | | (23,914,217 | ) | | | 115,578,154 | | | | 21,116,345 | | | | (256,176,351 | ) | | | (7,309,012 | ) | | | (137,570,641 | ) | |
Change in net assets | | | (9,036,857 | ) | | | 111,969,739 | | | | 144,568,730 | | | | (219,116,131 | ) | | | 79,371,032 | | | | (130,922,195 | ) | |
Net Assets: | |
Beginning of period | | | 155,182,314 | | | | 43,212,575 | | | | 609,613,238 | | | | 828,729,369 | | | | 565,892,026 | | | | 696,814,221 | | |
End of period | | $ | 146,145,457 | | | $ | 155,182,314 | | | $ | 754,181,968 | | | $ | 609,613,238 | | | $ | 645,263,058 | | | $ | 565,892,026 | | |
Capital Transactions: | |
Proceeds from shares
issued | | | 8,105,277 | | | | 153,857,553 | | | | 26,579,724 | | | | 2,604,112 | | | | 12,681,671 | | | | 39,877,087 | | |
Cost of shares redeemed | | | (32,019,494 | ) | | | (38,279,399 | ) | | | (5,463,379 | ) | | | (258,780,463 | ) | | | (19,990,683 | ) | | | (177,447,728 | ) | |
Change in net assets resulting
from capital transactions | | | (23,914,217 | ) | | | 115,578,154 | | | | 21,116,345 | | | | (256,176,351 | ) | | | (7,309,012 | ) | | | (137,570,641 | ) | |
Share Transactions: | |
Issued | | | 250,000 | | | | 4,900,000 | | | | 450,000 | | | | 50,000 | | | | 250,000 | | | | 900,000 | | |
Redeemed | | | (1,000,000 | ) | | | (1,250,000 | ) | | | (100,000 | ) | | | (5,250,000 | ) | | | (400,000 | ) | | | (4,050,000 | ) | |
Change in Shares | | | (750,000 | ) | | | 3,650,000 | | | | 350,000 | | | | (5,200,000 | ) | | | (150,000 | ) | | | (3,150,000 | ) | |
See notes to financial statements.
169
Victory Portfolios II | | Statements of Changes in Net Assets | |
| | | VictoryShares
US Discovery
Enhanced
Volatility Wtd ETF | | VictoryShares
Developed
Enhanced
Volatility Wtd ETF | | VictoryShares
Nasdaq
Next 50 ETF | |
| |
Six
Months
Ended
December 31,
2020
(unaudited) | |
Year
Ended
June 30,
2020 | |
Six
Months
Ended
December 31,
2020
(unaudited) | |
Year
Ended
June 30,
2020 | | For the Period
September 9,
2020(a)
through
December 31,
2020
(unaudited) | |
From Investment Activities: | |
Operations: | |
Net investment income (loss) | | $ | 295,260 | | | $ | 666,883 | | | $ | 329,557 | | | $ | 1,380,661 | | | $ | 134,892 | | |
Net realized gains (losses)
from investments | | | 3,290,150 | | | | (1,534,257 | ) | | | 1,049,394 | | | | (11,742,934 | ) | | | 3,814,502 | | |
Net change in unrealized
appreciation/depreciation
on investments | | | 7,681,529 | | | | 1,632,537 | | | | 6,295,747 | | | | (2,332,722 | ) | | | 15,023,250 | | |
Change in net assets resulting
from operations | | | 11,266,939 | | | | 765,163 | | | | 7,674,698 | | | | (12,694,995 | ) | | | 18,972,644 | | |
Change in net assets resulting
from distributions to shareholders | | | (314,273 | ) | | | (764,303 | ) | | | (401,549 | ) | | | (1,518,775 | ) | | | (138,070 | ) | |
Change in net assets resulting
from capital transactions | | | (422,626 | ) | | | (55,411,980 | ) | | | (13,041,929 | ) | | | (48,077,018 | ) | | | 95,920,559 | | |
Change in net assets | | | 10,530,040 | | | | (55,411,120 | ) | | | (5,768,780 | ) | | | (62,290,788 | ) | | | 114,755,133 | | |
Net Assets: | |
Beginning of period | | | 37,202,627 | | | | 92,613,747 | | | | 48,455,187 | | | | 110,745,975 | | | | — | | |
End of period | | $ | 47,732,667 | | | $ | 37,202,627 | | | $ | 42,686,407 | | | $ | 48,455,187 | | | $ | 114,755,133 | | |
Capital Transactions: | |
Proceeds from shares issued | | | 4,039,461 | | | | 6,387,747 | | | | — | | | | — | | | | 116,637,798 | | |
Cost of shares redeemed | | | (4,462,087 | ) | | | (61,799,727 | ) | | | (13,041,929 | ) | | | (48,077,018 | ) | | | (20,717,239 | ) | |
Change in net assets resulting
from capital transactions | | | (422,626 | ) | | | (55,411,980 | ) | | | (13,041,929 | ) | | | (48,077,018 | ) | | | 95,920,559 | | |
Share Transactions: | |
Issued | | | 100,000 | | | | 200,000 | | | | — | | | | — | | | | 4,275,000 | | |
Redeemed | | | (100,000 | ) | | | (1,700,000 | ) | | | (450,000 | ) | | | (1,650,000 | ) | | | (650,000 | ) | |
Change in Shares | | | — | | | | (1,500,000 | ) | | | (450,000 | ) | | | (1,650,000 | ) | | | 3,625,000 | | |
(a) Commencement of operations.
See notes to financial statements.
170
Victory Portfolios II | | Statements of Changes in Net Assets | |
| | | VictoryShares
Top Veteran
Employers ETF | | VictoryShares
Protect
America ETF | |
| | | For the Period
November 3,
2020(a)
through
December 31,
2020
(unaudited) | | For the Period
November 4,
2020(a)
through
December 31,
2020
(unaudited) | |
From Investment Activities: | |
Operations: | |
Net investment income (loss) | | $ | 5,866 | | | $ | 4,748 | | |
Net realized gains (losses) from investments | | | 22,681 | | | | 409 | | |
Net change in unrealized appreciation/depreciation
on investments | | | 256,835 | | | | 333,160 | | |
Change in net assets resulting from operations | | | 285,382 | | | | 338,317 | | |
Change in net assets resulting from distributions to shareholders | | | (5,842 | ) | | | (4,734 | ) | |
Change in net assets resulting from capital transactions | | | 2,562,420 | | | | 2,586,933 | | |
Change in net assets | | | 2,841,960 | | | | 2,920,516 | | |
Net Assets: | |
Beginning of period | | | — | | | | — | | |
End of period | | $ | 2,841,960 | | | $ | 2,920,516 | | |
Capital Transactions: | |
Proceeds from shares issued | | | 2,562,420 | | | | 2,586,933 | | |
Change in net assets resulting from capital transactions | | | 2,562,420 | | | | 2,586,933 | | |
Share Transactions: | |
Issued | | | 100,000 | | | | 100,000 | | |
Change in Shares | | | 100,000 | | | | 100,000 | | |
(a) Commencement of operations
See notes to financial statements.
171
Victory Portfolios II | | Financial Highlights | |
| | | | | Investment Activities | | Distributions to
Shareholders From | |
| | | Net Asset
Value,
Beginning of
Period | | Net
Investment
Income
(Loss)(a) | | Net Realized
and Unrealized
Gains (Losses)
on Investments | | Total from
Investment
Activities | | Net
Investment
Income | | Net Realized
Gains from
Investments | |
VictoryShares US 500 Volatility Wtd ETF | |
Six Months Ended
12/31/20 (unaudited) | | $ | 50.57 | | | | 0.35 | | | | 11.79 | | | | 12.14 | | | | (0.41 | ) | | | — | | |
Year Ended 6/30/20 | | $ | 52.46 | | | | 0.77 | | | | (1.88 | ) | | | (1.11 | ) | | | (0.78 | ) | | | — | | |
Year Ended 6/30/19 | | $ | 49.34 | | | | 0.73 | | | | 3.09 | | | | 3.82 | | | | (0.70 | ) | | | — | | |
Year Ended 6/30/18 | | $ | 44.05 | | | | 0.63 | | | | 5.26 | | | | 5.89 | | | | (0.60 | ) | | | — | | |
Year Ended 6/30/17 | | $ | 37.24 | | | | 0.60 | | | | 6.71 | | | | 7.31 | | | | (0.50 | ) | | | — | | |
Year Ended 6/30/16 | | $ | 36.78 | | | | 0.57 | | | | 0.42 | | | | 0.99 | | | | (0.51 | ) | | | (0.02 | ) | |
VictoryShares US Small Cap Volatility Wtd ETF | |
Six Months Ended
12/31/20 (unaudited) | | $ | 40.22 | | | | 0.37 | | | | 13.69 | | | | 14.06 | | | | (0.42 | ) | | | — | | |
Year Ended 6/30/20 | | $ | 45.87 | | | | 0.59 | | | | (5.62 | ) | | | (5.03 | ) | | | (0.62 | ) | | | — | | |
Year Ended 6/30/19 | | $ | 48.54 | | | | 0.63 | | | | (2.62 | ) | | | (1.99 | ) | | | (0.68 | ) | | | — | | |
Year Ended 6/30/18 | | $ | 42.40 | | | | 0.50 | | | | 6.14 | | | | 6.64 | | | | (0.50 | ) | | | — | | |
Year Ended 6/30/17 | | $ | 34.35 | | | | 0.50 | | | | 8.01 | | | | 8.51 | | | | (0.46 | ) | | | — | | |
7/7/15(e) through
6/30/16 | | $ | 35.00 | | | | 0.41 | | | | (0.72 | ) | | | (0.31 | ) | | | (0.34 | ) | | | — | | |
VictoryShares International Volatility Wtd ETF | |
Six Months Ended
12/31/20 (unaudited) | | $ | 34.63 | | | | 0.30 | | | | 6.99 | | | | 7.29 | | | | (0.42 | ) | | | — | | |
Year Ended 6/30/20 | | $ | 38.12 | | | | 0.77 | | | | (3.51 | ) | | | (2.74 | ) | | | (0.75 | ) | | | — | | |
Year Ended 6/30/19 | | $ | 39.09 | | | | 1.17 | | | | (1.07 | ) | | | 0.10 | | | | (1.07 | ) | | | — | | |
Year Ended 6/30/18 | | $ | 37.20 | | | | 1.04 | | | | 1.81 | | | | 2.85 | | | | (0.96 | ) | | | — | | |
Year Ended 6/30/17 | | $ | 32.11 | | | | 0.76 | | | | 5.10 | | | | 5.86 | | | | (0.77 | ) | | | — | | |
8/19/15(e) through
6/30/16 | | $ | 35.00 | | | | 0.85 | | | | (3.15 | ) | | | (2.30 | ) | | | (0.59 | ) | | | — | | |
(a) Per share net investment income (loss) has been calculated using the average daily shares method.
(b) Not annualized for periods less than one year.
(c) Annualized for periods less than one year.
(d) Excludes impact of in-kind transaction.
(e) Commencement of operations.
See notes to financial statements.
172
Victory Portfolios II | | Financial Highlights — continued | |
| | | | | Ratios to Average Net Assets | | Supplemental Data | |
| | | Total
Distributions | | Net Asset
Value,
End of
Period | | Total
Return(b) | | Net
Expenses(c) | | Net
Investment
Income
(Loss)(c) | | Gross
Expenses(c) | | Net Assets,
End of
Period
(000's) | | Portfolio
Turnover(b)(d) | |
VictoryShares US 500 Volatility Wtd ETF | |
Six Months Ended
12/31/20 (unaudited) | | | (0.41 | ) | | $ | 62.30 | | | | 24.10 | % | | | 0.35 | % | | | 1.23 | % | | | 0.40 | % | | $ | 682,176 | | | | 20 | % | |
Year Ended 6/30/20 | | | (0.78 | ) | | $ | 50.57 | | | | (2.12 | )% | | | 0.35 | % | | | 1.49 | % | | | 0.40 | % | | $ | 670,005 | | | | 28 | % | |
Year Ended 6/30/19 | | | (0.70 | ) | | $ | 52.46 | | | | 7.86 | % | | | 0.35 | % | | | 1.48 | % | | | 0.40 | % | | $ | 731,775 | | | | 46 | % | |
Year Ended 6/30/18 | | | (0.60 | ) | | $ | 49.34 | | | | 13.42 | % | | | 0.35 | % | | | 1.32 | % | | | 0.41 | % | | $ | 567,370 | | | | 36 | % | |
Year Ended 6/30/17 | | | (0.50 | ) | | $ | 44.05 | | | | 19.72 | % | | | 0.35 | % | | | 1.43 | % | | | 0.47 | % | | $ | 292,921 | | | | 26 | % | |
Year Ended 6/30/16 | | | (0.53 | ) | | $ | 37.24 | | | | 2.78 | % | | | 0.35 | % | | | 1.59 | % | | | 0.74 | % | | $ | 44,689 | | | | 31 | % | |
VictoryShares US Small Cap Volatility Wtd ETF | |
Six Months Ended
12/31/20 (unaudited) | | | (0.42 | ) | | $ | 53.86 | | | | 35.12 | % | | | 0.35 | % | | | 1.61 | % | | | 0.61 | % | | $ | 21,546 | | | | 37 | % | |
Year Ended 6/30/20 | | | (0.62 | ) | | $ | 40.22 | | | | (11.00 | )% | | | 0.35 | % | | | 1.35 | % | | | 0.55 | % | | $ | 16,089 | | | | 50 | % | |
Year Ended 6/30/19 | | | (0.68 | ) | | $ | 45.87 | | | | (4.07 | )% | | | 0.35 | % | | | 1.36 | % | | | 0.46 | % | | $ | 29,814 | | | | 62 | % | |
Year Ended 6/30/18 | | | (0.50 | ) | | $ | 48.54 | | | | 15.75 | % | | | 0.35 | % | | | 1.10 | % | | | 0.47 | % | | $ | 41,261 | | | | 47 | % | |
Year Ended 6/30/17 | | | (0.46 | ) | | $ | 42.40 | | | | 24.86 | % | | | 0.35 | % | | | 1.25 | % | | | 0.68 | % | | $ | 25,438 | | | | 47 | % | |
7/7/15(e) through
6/30/16 | | | (0.34 | ) | | $ | 34.35 | | | | (0.86 | )% | | | 0.35 | % | | | 1.28 | % | | | 1.44 | % | | $ | 10,304 | | | | 50 | % | |
VictoryShares International Volatility Wtd ETF | |
Six Months Ended
12/31/20 (unaudited) | | | (0.42 | ) | | $ | 41.50 | | | | 21.16 | % | | | 0.45 | % | | | 1.57 | % | | | 0.63 | % | | $ | 112,053 | | | | 25 | % | |
Year Ended 6/30/20 | | | (0.75 | ) | | $ | 34.63 | | | | (7.23 | )% | | | 0.45 | % | | | 2.12 | % | | | 0.64 | % | | $ | 83,120 | | | | 41 | % | |
Year Ended 6/30/19 | | | (1.07 | ) | | $ | 38.12 | | | | 0.33 | % | | | 0.45 | % | | | 3.14 | % | | | 0.73 | % | | $ | 36,215 | | | | 53 | % | |
Year Ended 6/30/18 | | | (0.96 | ) | | $ | 39.09 | | | | 7.62 | % | | | 0.45 | % | | | 2.61 | % | | | 0.98 | % | | $ | 21,497 | | | | 37 | % | |
Year Ended 6/30/17 | | | (0.77 | ) | | $ | 37.20 | | | | 18.44 | % | | | 0.45 | % | | | 2.25 | % | | | 1.54 | % | | $ | 13,021 | | | | 46 | % | |
8/19/15(e) through
6/30/16 | | | (0.59 | ) | | $ | 32.11 | | | | (6.58 | )% | | | 0.45 | % | | | 2.99 | % | | | 2.31 | % | | $ | 12,844 | | | | 31 | % | |
See notes to financial statements.
173
Victory Portfolios II | | Financial Highlights | |
| | | | Investment Activities | | Distributions to
Shareholders From | |
| | | Net Asset
Value,
Beginning of
Period | | Net
Investment
Income
(Loss)(a) | | Net Realized
and Unrealized
Gains (Losses)
on Investments | | Total from
Investment
Activities | | Net
Investment
Income | | Net Realized
Gains from
Investments | |
VictoryShares Emerging Market Volatility Wtd ETF | |
Six Months Ended
12/31/20 (unaudited) | | $ | 22.44 | | | | 0.37 | | | | 4.57 | | | | 4.94 | | | | (0.35 | ) | | | — | | |
Year Ended 6/30/20 | | $ | 26.19 | | | | 0.56 | | | | (3.76 | ) | | | (3.20 | ) | | | (0.55 | ) | | | — | | |
Year Ended 6/30/19 | | $ | 27.07 | | | | 0.63 | | | | 0.43 | | | | 1.06 | | | | (0.53 | ) | | | (1.41 | ) | |
Year Ended 6/30/18 | | $ | 27.83 | | | | 0.64 | | | | 0.29 | | | | 0.93 | | | | (0.60 | ) | | | (1.09 | ) | |
Year Ended 6/30/17 | | $ | 25.28 | | | | 0.55 | | | | 2.64 | | | | 3.19 | | | | (0.52 | ) | | | (0.12 | ) | |
3/22/16(e) through
6/30/16 | | $ | 25.00 | | | | 0.25 | | | | 0.13 | | | | 0.38 | | | | (0.10 | ) | | | — | | |
VictoryShares US Large Cap High Div Volatility Wtd ETF | |
Six Months Ended
12/31/20 (unaudited) | | $ | 39.52 | | | | 0.77 | | | | 7.72 | | | | 8.49 | | | | (0.85 | ) | | | — | | |
Year Ended 6/30/20 | | $ | 47.03 | | | | 1.58 | | | | (7.44 | ) | | | (5.86 | ) | | | (1.65 | ) | | | — | | |
Year Ended 6/30/19 | | $ | 45.06 | | | | 1.51 | | | | 1.83 | | | | 3.34 | | | | (1.37 | ) | | | — | | |
Year Ended 6/30/18 | | $ | 42.17 | | | | 1.34 | | | | 2.92 | | | | 4.26 | | | | (1.37 | ) | | | — | | |
Year Ended 6/30/17 | | $ | 37.58 | | | | 1.24 | | | | 4.46 | | | | 5.70 | | | | (1.11 | ) | | | — | | |
7/7/15(e) through
6/30/16 | | $ | 35.00 | | | | 1.28 | | | | 2.35 | | | | 3.63 | | | | (1.05 | ) | | | — | | |
VictoryShares US Small Cap High Div Volatility Wtd ETF | |
Six Months Ended
12/31/20 (unaudited) | | $ | 36.75 | | | | 0.95 | | | | 13.22 | | | | 14.17 | | | | (1.16 | ) | | | — | | |
Year Ended 6/30/20 | | $ | 44.28 | | | | 1.53 | | | | (7.47 | ) | | | (5.94 | ) | | | (1.59 | ) | | | — | | |
Year Ended 6/30/19 | | $ | 45.96 | | | | 1.38 | | | | (1.74 | ) | | | (0.36 | ) | | | (1.32 | ) | | | — | | |
Year Ended 6/30/18 | | $ | 40.41 | | | | 1.39 | | | | 5.61 | | | | 7.00 | | | | (1.45 | ) | | | — | | |
Year Ended 6/30/17 | | $ | 35.40 | | | | 1.43 | | | | 4.93 | | | | 6.36 | | | | (1.35 | ) | | | — | | |
7/7/15(e) through
6/30/16 | | $ | 35.00 | | | | 1.18 | | | | 0.21 | | | | 1.39 | | | | (0.99 | ) | | | — | | |
(a) Per share net investment income (loss) has been calculated using the average daily shares method.
(b) Not annualized for periods less than one year.
(c) Annualized for periods less than one year.
(d) Excludes impact of in-kind transactions.
(e) Commencement of operations.
See notes to financial statements.
174
Victory Portfolios II | | Financial Highlights — continued | |
| | | | | Ratios to Average Net Assets | | Supplemental Data | |
| | | Total
Distributions | | Net Asset
Value,
End of
Period | | Total
Return(b) | | Net
Expenses(c) | | Net
Investment
Income
(Loss)(c) | | Gross
Expenses(c) | | Net Assets,
End of
Period
(000's) | | Portfolio
Turnover(b)(d) | |
VictoryShares Emerging Market Volatility Wtd ETF | |
Six Months Ended
12/31/20 (unaudited) | | | (0.35 | ) | | $ | 27.03 | | | | 22.22 | % | | | 0.50 | % | | | 3.14 | % | | | 1.36 | % | | $ | 9,460 | | | | 49 | % | |
Year Ended 6/30/20 | | | (0.55 | ) | | $ | 22.44 | | | | (12.35 | )% | | | 0.50 | % | | | 2.35 | % | | | 1.03 | % | | $ | 42,638 | | | | 47 | % | |
Year Ended 6/30/19 | | | (1.94 | ) | | $ | 26.19 | | | | 4.46 | % | | | 0.50 | % | | | 2.44 | % | | | 1.41 | % | | $ | 18,334 | | | | 60 | % | |
Year Ended 6/30/18 | | | (1.69 | ) | | $ | 27.07 | | | | 3.09 | % | | | 0.50 | % | | | 2.19 | % | | | 1.23 | % | | $ | 18,949 | | | | 53 | % | |
Year Ended 6/30/17 | | | (0.64 | ) | | $ | 27.83 | | | | 12.76 | % | | | 0.50 | % | | | 2.11 | % | | | 1.91 | % | | $ | 33,393 | | | | 38 | % | |
3/22/16(e) through
6/30/16 | | | (0.10 | ) | | $ | 25.28 | | | | 1.56 | % | | | 0.50 | % | | | 3.70 | % | | | 6.26 | % | | $ | 12,642 | | | | 1 | % | |
VictoryShares US Large Cap High Div Volatility Wtd ETF | |
Six Months Ended
12/31/20 (unaudited) | | | (0.85 | ) | | $ | 47.16 | | | | 21.73 | % | | | 0.35 | % | | | 3.61 | % | | | 0.43 | % | | $ | 186,294 | | | | 35 | % | |
Year Ended 6/30/20 | | | (1.65 | ) | | $ | 39.52 | | | | (12.78 | )% | | | 0.35 | % | | | 3.47 | % | | | 0.41 | % | | $ | 193,635 | | | | 56 | % | |
Year Ended 6/30/19 | | | (1.37 | ) | | $ | 47.03 | | | | 7.59 | % | | | 0.35 | % | | | 3.33 | % | | | 0.42 | % | | $ | 331,527 | | | | 66 | % | |
Year Ended 6/30/18 | | | (1.37 | ) | | $ | 45.06 | | | | 10.23 | % | | | 0.35 | % | | | 3.04 | % | | | 0.42 | % | | $ | 144,187 | | | | 52 | % | |
Year Ended 6/30/17 | | | (1.11 | ) | | $ | 42.17 | | | | 15.37 | % | | | 0.35 | % | | | 3.05 | % | | | 0.45 | % | | $ | 120,181 | | | | 48 | % | |
7/7/15(e) through
6/30/16 | | | (1.05 | ) | | $ | 37.58 | | | | 10.62 | % | | | 0.35 | % | | | 3.69 | % | | | 0.72 | % | | $ | 41,333 | | | | 46 | % | |
VictoryShares US Small Cap High Div Volatility Wtd ETF | |
Six Months Ended
12/31/20 (unaudited) | | | (1.16 | ) | | $ | 49.76 | | | | 39.13 | % | | | 0.35 | % | | | 4.57 | % | | | 0.45 | % | | $ | 99,515 | | | | 49 | % | |
Year Ended 6/30/20 | | | (1.59 | ) | | $ | 36.75 | | | | (13.61 | )% | | | 0.35 | % | | | 3.69 | % | | | 0.44 | % | | $ | 66,142 | | | | 68 | % | |
Year Ended 6/30/19 | | | (1.32 | ) | | $ | 44.28 | | | | (0.70 | )% | | | 0.35 | % | | | 3.10 | % | | | 0.44 | % | | $ | 75,277 | | | | 83 | % | |
Year Ended 6/30/18 | | | (1.45 | ) | | $ | 45.96 | | | | 17.64 | % | | | 0.35 | % | | | 3.23 | % | | | 0.45 | % | | $ | 43,665 | | | | 68 | % | |
Year Ended 6/30/17 | | | (1.35 | ) | | $ | 40.41 | | | | 18.07 | % | | | 0.35 | % | | | 3.65 | % | | | 0.55 | % | | $ | 32,325 | | | | 65 | % | |
7/7/15(e) through
6/30/16 | | | (0.99 | ) | | $ | 35.40 | | | | 4.15 | % | | | 0.35 | % | | | 3.59 | % | | | 0.92 | % | | $ | 14,160 | | | | 78 | % | |
See notes to financial statements.
175
Victory Portfolios II | | Financial Highlights | |
| | | | Investment Activities | | Distributions to
Shareholders From | |
| | | Net Asset
Value,
Beginning of
Period | | Net
Investment
Income
(Loss)(a) | | Net Realized
and Unrealized
Gains (Losses)
on Investments | | Total from
Investment
Activities | | Net
Investment
Income | | Net Realized
Gains from
Investments | |
VictoryShares International High Div Volatility Wtd ETF | |
Six Months Ended
12/31/20 (unaudited) | | $ | 25.32 | | | | 0.46 | | | | 4.72 | | | | 5.18 | | | | (0.62 | ) | | | — | | |
Year Ended 6/30/20 | | $ | 32.43 | | | | 1.02 | | | | (7.13 | ) | | | (6.11 | ) | | | (1.00 | ) | | | — | | |
Year Ended 6/30/19 | | $ | 33.94 | | | | 1.63 | | | | (1.48 | ) | | | 0.15 | | | | (1.66 | ) | | | — | | |
Year Ended 6/30/18 | | $ | 34.25 | | | | 1.47 | | | | (0.41 | ) | | | 1.06 | | | | (1.37 | ) | | | — | | |
Year Ended 6/30/17 | | $ | 30.65 | | | | 1.40 | | | | 3.47 | | | | 4.87 | | | | (1.27 | ) | | | — | | |
8/19/15(e) through
6/30/16 | | $ | 35.00 | | | | 1.37 | | | | (4.71 | ) | | | (3.34 | ) | | | (1.01 | ) | | | — | | |
VictoryShares Emerging Market High Div Volatility Wtd ETF | |
Six Months Ended
12/31/20 (unaudited) | | $ | 19.71 | | | | 0.49 | | | | 2.60 | | | | 3.09 | | | | (0.53 | ) | | | — | | |
Year Ended 6/30/20 | | $ | 24.39 | | | | 0.94 | | | | (4.63 | ) | | | (3.69 | ) | | | (0.99 | ) | | | — | | |
Year Ended 6/30/19 | | $ | 23.92 | | | | 1.31 | | | | 0.35 | | | | 1.66 | | | | (1.05 | ) | | | (0.14 | ) | |
10/26/17(e) through
6/30/18 | | $ | 24.95 | | | | 0.78 | | | | (1.29 | ) | | | (0.51 | ) | | | (0.52 | ) | | | — | | |
VictoryShares Dividend Accelerator ETF | |
Six Months Ended
12/31/20 (unaudited) | | $ | 33.14 | | | | 0.34 | | | | 6.58 | | | | 6.92 | | | | (0.38 | ) | | | — | | |
Year Ended 6/30/20 | | $ | 32.90 | | | | 0.55 | | | | 0.19 | (g) | | | 0.74 | | | | (0.50 | ) | | | — | | |
Year Ended 6/30/19 | | $ | 28.41 | | | | 0.48 | | | | 4.47 | | | | 4.95 | | | | (0.46 | ) | | | — | | |
Year Ended 6/30/18 | | $ | 25.95 | | | | 0.48 | | | | 2.45 | | | | 2.93 | | | | (0.47 | ) | | | — | | |
4/18/17(e) through
6/30/17 | | $ | 25.26 | | | | 0.12 | | | | 0.65 | | | | 0.77 | | | | (0.08 | ) | | | — | | |
(a) Per share net investment income (loss) has been calculated using the average daily shares method.
(b) Not annualized for periods less than one year.
(c) Annualized for periods less than one year.
(d) Excludes impact of in-kind transactions.
(e) Commencement of operations.
(f) During the period the Fund paid interest fees. Excluding these fees, the ratio of net expense to average net assets for the year was 0.50%.
(g) The amount shown for a share outstanding throughout the period does not accord with the change in aggregate gains and losses in the portfolio of securities during the period because of the timing of sales and purchases of fund shares in relation to fluctuating market values during the period.
See notes to financial statements.
176
Victory Portfolios II | | Financial Highlights — continued | |
| | | | | Ratios to Average Net Assets | | Supplemental Data | |
| | | Total
Distributions | | Net Asset
Value,
End of
Period | | Total
Return(b) | | Net
Expenses(c) | | Net
Investment
Income
(Loss)(c) | | Gross
Expenses(c) | | Net Assets,
End of
Period
(000's) | | Portfolio
Turnover(b)(d) | |
VictoryShares International High Div Volatility Wtd ETF | |
Six Months Ended
12/31/20 (unaudited) | | | (0.62 | ) | | $ | 29.88 | | | | 20.68 | % | | | 0.45 | % | | | 3.37 | % | | | 0.62 | % | | $ | 22,408 | | | | 62 | % | |
Year Ended 6/30/20 | | | (1.00 | ) | | $ | 25.32 | | | | (19.22 | )% | | | 0.45 | % | | | 3.45 | % | | | 0.57 | % | | $ | 62,042 | | | | 71 | % | |
Year Ended 6/30/19 | | | (1.66 | ) | | $ | 32.43 | | | | 0.58 | % | | | 0.45 | % | | | 5.06 | % | | | 0.59 | % | | $ | 40,540 | | | | 76 | % | |
Year Ended 6/30/18 | | | (1.37 | ) | | $ | 33.94 | | | | 3.00 | % | | | 0.45 | % | | | 4.14 | % | | | 0.60 | % | | $ | 45,824 | | | | 58 | % | |
Year Ended 6/30/17 | | | (1.27 | ) | | $ | 34.25 | | | | 16.16 | % | | | 0.45 | % | | | 4.32 | % | | | 0.77 | % | | $ | 32,541 | | | | 69 | % | |
8/19/15(e) through
6/30/16 | | | (1.01 | ) | | $ | 30.65 | | | | (9.63 | )% | | | 0.45 | % | | | 4.98 | % | | | 1.17 | % | | $ | 16,855 | | | | 53 | % | |
VictoryShares Emerging Market High Div Volatility Wtd ETF | |
Six Months Ended
12/31/20 (unaudited) | | | (0.53 | ) | | $ | 22.27 | | | | 15.97 | % | | | 0.50 | % | | | 4.81 | % | | | 1.18 | % | | $ | 16,700 | | | | 52 | % | |
Year Ended 6/30/20 | | | (0.99 | ) | | $ | 19.71 | | | | (15.55 | )% | | | 0.50 | % | | | 4.24 | % | | | 0.85 | % | | $ | 21,679 | | | | 86 | % | |
Year Ended 6/30/19 | | | (1.19 | ) | | $ | 24.39 | | | | 7.30 | % | | | 0.51 | %(f) | | | 5.52 | % | | | 0.88 | % | | $ | 40,251 | | | | 103 | % | |
10/26/17(e) through
6/30/18 | | | (0.52 | ) | | $ | 23.92 | | | | (2.17 | )% | | | 0.50 | % | | | 4.44 | % | | | 1.05 | % | | $ | 21,532 | | | | 52 | % | |
VictoryShares Dividend Accelerator ETF | |
Six Months Ended
12/31/20 (unaudited) | | | (0.38 | ) | | $ | 39.68 | | | | 20.99 | % | | | 0.35 | % | | | 1.83 | % | | | 0.40 | % | | $ | 319,436 | | | | 11 | % | |
Year Ended 6/30/20 | | | (0.50 | ) | | $ | 33.14 | | | | 2.23 | % | | | 0.35 | % | | | 1.65 | % | | | 0.42 | % | | $ | 235,277 | | | | 74 | % | |
Year Ended 6/30/19 | | | (0.46 | ) | | $ | 32.90 | | | | 17.60 | % | | | 0.35 | % | | | 1.57 | % | | | 0.59 | % | | $ | 16,450 | | | | 62 | % | |
Year Ended 6/30/18 | | | (0.47 | ) | | $ | 28.41 | | | | 11.33 | % | | | 0.35 | % | | | 1.75 | % | | | 0.67 | % | | $ | 7,102 | | | | 43 | % | |
4/18/17(e) through
6/30/17 | | | (0.08 | ) | | $ | 25.95 | | | | 3.05 | % | | | 0.35 | % | | | 2.31 | % | | | 1.92 | % | | $ | 3,893 | | | | — | % | |
See notes to financial statements.
177
Victory Portfolios II | | Financial Highlights | |
| | | | Investment Activities | | Distributions to
Shareholders From | |
| | | Net Asset
Value,
Beginning of
Period | | Net
Investment
Income
(Loss)(a) | | Net Realized
and Unrealized
Gains (Losses)
on Investments | | Total from
Investment
Activities | | Net
Investment
Income | | Net Realized
Gains from
Investments | |
VictoryShares US Multi-Factor Minimum Volatility ETF | |
Six Months Ended
12/31/20 (unaudited) | | $ | 30.73 | | | | 0.35 | | | | 3.30 | | | | 3.65 | | | | (0.39 | ) | | | — | | |
Year Ended 6/30/20 | | $ | 30.87 | | | | 0.70 | | | | (0.14 | )(e) | | | 0.56 | | | | (0.70 | ) | | | — | | |
Year Ended 6/30/19 | | $ | 27.58 | | | | 0.73 | | | | 3.20 | | | | 3.93 | | | | (0.64 | ) | | | — | | |
Year Ended 6/30/18 | | $ | 24.83 | | | | 0.63 | | | | 2.69 | | | | 3.32 | | | | (0.57 | ) | | | — | | |
6/22/17(f) through
6/30/17 | | $ | 24.97 | | | | 0.02 | | | | (0.16 | ) | | | (0.14 | ) | | | — | | | | — | | |
VictoryShares US 500 Enhanced Volatility Wtd ETF | |
Six Months Ended
12/31/20 (unaudited) | | $ | 51.88 | | | | 0.33 | | | | 10.46 | | | | 10.79 | | | | (0.34 | ) | | | — | | |
Year Ended 6/30/20 | | $ | 48.89 | | | | 0.60 | | | | 3.04 | | | | 3.64 | | | | (0.65 | ) | | | — | | |
Year Ended 6/30/19 | | $ | 49.30 | | | | 0.73 | | | | (0.42 | ) | | | 0.31 | | | | (0.72 | ) | | | — | | |
Year Ended 6/30/18 | | $ | 44.00 | | | | 0.64 | | | | 5.25 | | | | 5.89 | | | | (0.59 | ) | | | — | | |
Year Ended 6/30/17 | | $ | 37.23 | | | | 0.58 | | | | 6.71 | | | | 7.29 | | | | (0.52 | ) | | | — | | |
Year Ended 6/30/16 | | $ | 36.76 | | | | 0.56 | | | | 0.45 | | | | 1.01 | | | | (0.54 | ) | | | — | | |
VictoryShares US EQ Income Enhanced Volatility Wtd ETF | |
Six Months Ended
12/31/20 (unaudited) | | $ | 46.58 | | | | 0.72 | | | | 7.25 | | | | 7.97 | | | | (0.78 | ) | | | — | | |
Year Ended 6/30/20 | | $ | 45.54 | | | | 1.39 | | | | 1.09 | | | | 2.48 | | | | (1.44 | ) | | | — | | |
Year Ended 6/30/19 | | $ | 46.29 | | | | 1.46 | | | | (0.80 | ) | | | 0.66 | | | | (1.41 | ) | | | — | | |
Year Ended 6/30/18 | | $ | 43.30 | | | | 1.39 | | | | 2.99 | | | | 4.38 | | | | (1.39 | ) | | | — | | |
Year Ended 6/30/17 | | $ | 38.59 | | | | 1.28 | | | | 4.58 | | | | 5.86 | | | | (1.15 | ) | | | — | | |
Year Ended 6/30/16 | | $ | 35.38 | | | | 1.27 | | | | 3.18 | | | | 4.45 | | | | (1.24 | ) | | | — | | |
(a) Per share net investment income (loss) has been calculated using the average daily shares method.
(b) Not annualized for periods less than one year.
(c) Annualized for periods less than one year.
(d) Excludes impact of in-kind transactions.
(e) The amount shown for a share outstanding throughout the period does not accord with the change in aggregate gains and losses in the portfolio of securities during the period because of the timing of sales and purchases of fund shares in relation to fluctuating market values during the period.
(f) Commencement of operations.
(g) Portfolio turnover increased significantly due to changes in the volume and timing of purchases and sales of portfolio holdings during the year.
See notes to financial statements.
178
Victory Portfolios II | | Financial Highlights — continued | |
| | | | | Ratios to Average Net Assets | | Supplemental Data | |
| | | Total
Distributions | | Net Asset
Value,
End of
Period | | Total
Return(b) | | Net
Expenses(c) | | Net
Investment
Income
(Loss)(c) | | Gross
Expenses(c) | | Net Assets,
End of
Period
(000's) | | Portfolio
Turnover(b)(d) | |
VictoryShares US Multi-Factor Minimum Volatility ETF | |
Six Months Ended
12/31/20 (unaudited) | | | (0.39 | ) | | $ | 33.99 | | | | 11.94 | % | | | 0.35 | % | | | 2.14 | % | | | 0.42 | % | | $ | 146,145 | | | | 29 | % | |
Year Ended 6/30/20 | | | (0.70 | ) | | $ | 30.73 | | | | 1.82 | % | | | 0.35 | % | | | 2.23 | % | | | 0.42 | % | | $ | 155,182 | | | | 69 | % | |
Year Ended 6/30/19 | | | (0.64 | ) | | $ | 30.87 | | | | 14.47 | % | | | 0.35 | % | | | 2.50 | % | | | 0.48 | % | | $ | 43,213 | | | | 34 | % | |
Year Ended 6/30/18 | | | (0.57 | ) | | $ | 27.58 | | | | 13.41 | % | | | 0.35 | % | | | 2.33 | % | | | 0.74 | % | | $ | 8,273 | | | | 26 | % | |
6/22/17(f) through
6/30/17 | | | — | | | $ | 24.83 | | | | (0.54 | )% | | | 0.35 | % | | | 3.20 | % | | | 7.21 | % | | $ | 2,483 | | | | — | % | |
VictoryShares US 500 Enhanced Volatility Wtd ETF | |
Six Months Ended
12/31/20 (unaudited) | | | (0.34 | ) | | $ | 62.33 | | | | 20.86 | % | | | 0.35 | % | | | 1.17 | % | | | 0.40 | % | | $ | 754,182 | | | | 22 | % | |
Year Ended 6/30/20 | | | (0.65 | ) | | $ | 51.88 | | | | 7.49 | % | | | 0.35 | % | | | 1.20 | % | | | 0.40 | % | | $ | 609,613 | | | | 56 | % | |
Year Ended 6/30/19 | | | (0.72 | ) | | $ | 48.89 | | | | 0.69 | % | | | 0.35 | % | | | 1.51 | % | | | 0.40 | % | | $ | 828,729 | | | | 116 | %(g) | |
Year Ended 6/30/18 | | | (0.59 | ) | | $ | 49.30 | | | | 13.42 | % | | | 0.35 | % | | | 1.32 | % | | | 0.41 | % | | $ | 951,411 | | | | 37 | % | |
Year Ended 6/30/17 | | | (0.52 | ) | | $ | 44.00 | | | | 19.72 | % | | | 0.35 | % | | | 1.42 | % | | | 0.45 | % | | $ | 415,847 | | | | 26 | % | |
Year Ended 6/30/16 | | | (0.54 | ) | | $ | 37.23 | | | | 2.79 | % | | | 0.35 | % | | | 1.56 | % | | | 0.58 | % | | $ | 141,470 | | | | 36 | % | |
VictoryShares US EQ Income Enhanced Volatility Wtd ETF | |
Six Months Ended
12/31/20 (unaudited) | | | (0.78 | ) | | $ | 53.77 | | | | 17.27 | % | | | 0.35 | % | | | 2.90 | % | | | 0.40 | % | | $ | 645,263 | | | | 33 | % | |
Year Ended 6/30/20 | | | (1.44 | ) | | $ | 46.58 | | | | 5.49 | % | | | 0.35 | % | | | 3.02 | % | | | 0.40 | % | | $ | 565,892 | | | | 116 | % | |
Year Ended 6/30/19 | | | (1.41 | ) | | $ | 45.54 | | | | 1.52 | % | | | 0.35 | % | | | 3.22 | % | | | 0.40 | % | | $ | 696,814 | | | | 143 | %(g) | |
Year Ended 6/30/18 | | | (1.39 | ) | | $ | 46.29 | | | | 10.23 | % | | | 0.35 | % | | | 3.06 | % | | | 0.41 | % | | $ | 738,260 | | | | 52 | % | |
Year Ended 6/30/17 | | | (1.15 | ) | | $ | 43.30 | | | | 15.35 | % | | | 0.35 | % | | | 3.06 | % | | | 0.43 | % | | $ | 471,927 | | | | 49 | % | |
Year Ended 6/30/16 | | | (1.24 | ) | | $ | 38.59 | | | | 12.89 | % | | | 0.35 | % | | | 3.51 | % | | | 0.56 | % | | $ | 156,278 | | | | 52 | % | |
See notes to financial statements.
179
Victory Portfolios II | | Financial Highlights | |
| | | | Investment Activities | | Distributions to
Shareholders From | | | |
| | | Net Asset
Value,
Beginning of
Period | | Net
Investment
Income
(Loss)(a) | | Net Realized
and Unrealized
Gains (Losses)
on Investments | | Total from
Investment
Activities | | Net
Investment
Income | | Total
Distributions | | Net Asset
Value,
End of
Period | | Total
Return(b) | |
VictoryShares US Discovery Enhanced Volatility Wtd ETF | |
Six Months Ended
12/31/20 (unaudited) | | $ | 39.16 | | | | 0.30 | | | | 11.10 | | | | 11.40 | | | | (0.32 | ) | | | (0.32 | ) | | $ | 50.24 | | | | 29.23 | % | |
Year Ended 6/30/20 | | $ | 37.80 | | | | 0.44 | | | | 1.42 | (e) | | | 1.86 | | | | (0.50 | ) | | | (0.50 | ) | | $ | 39.16 | | | | 5.00 | % | |
Year Ended 6/30/19 | | $ | 47.41 | | | | 0.64 | | | | (9.61 | ) | | | (8.97 | ) | | | (0.64 | ) | | | (0.64 | ) | | $ | 37.80 | | | | (19.04 | )% | |
Year Ended 6/30/18 | | $ | 41.41 | | | | 0.50 | | | | 5.98 | | | | 6.48 | | | | (0.48 | ) | | | (0.48 | ) | | $ | 47.41 | | | | 15.75 | % | |
Year Ended 6/30/17 | | $ | 33.55 | | | | 0.49 | | | | 7.84 | | | | 8.33 | | | | (0.47 | ) | | | (0.47 | ) | | $ | 41.41 | | | | 24.91 | % | |
Year Ended 6/30/16 | | $ | 39.23 | | | | 0.34 | | | | (5.71 | )(g) | | | (5.37 | ) | | | (0.31 | ) | | | (0.31 | ) | | $ | 33.55 | | | | (13.70 | )% | |
VictoryShares Developed Enhanced Volatility Wtd ETF | |
Six Months Ended
12/31/20 (unaudited) | | $ | 26.92 | | | | 0.21 | | | | 4.76 | | | | 4.97 | | | | (0.27 | ) | | | (0.27 | ) | | $ | 31.62 | | | | 18.54 | % | |
Year Ended 6/30/20 | | $ | 32.10 | | | | 0.52 | | | | (5.14 | ) | | | (4.62 | ) | | | (0.56 | ) | | | (0.56 | ) | | $ | 26.92 | | | | (14.55 | )% | |
Year Ended 6/30/19 | | $ | 33.79 | | | | 0.85 | | | | (1.59 | ) | | | (0.74 | ) | | | (0.95 | ) | | | (0.95 | ) | | $ | 32.10 | | | | (2.16 | )% | |
Year Ended 6/30/18 | | $ | 32.22 | | | | 0.94 | | | | 1.45 | | | | 2.39 | | | | (0.82 | ) | | | (0.82 | ) | | $ | 33.79 | | | | 7.41 | % | |
Year Ended 6/30/17 | | $ | 29.00 | | | | 0.78 | | | | 2.90 | (g) | | | 3.68 | | | | (0.46 | ) | | | (0.46 | ) | | $ | 32.22 | | | | 12.79 | %(h) | |
Year Ended 6/30/16 | | $ | 35.19 | | | | 0.67 | | | | (6.27 | ) | | | (5.60 | ) | | | (0.59 | ) | | | (0.59 | ) | | $ | 29.00 | | | | (15.96 | )% | |
VictoryShares Nasdaq Next 50 ETF | |
9/9/20(i) through
12/31/20 | | $ | 25.45 | | | | 0.05 | | | | 6.20 | | | | 6.25 | | | | (0.04 | ) | | | (0.04 | ) | | $ | 31.66 | | | | 24.55 | % | |
(a) Per share net investment income (loss) has been calculated using the average daily shares method.
(b) Not annualized for periods less than one year.
(c) Annualized for periods less than one year.
(d) Excludes impact of in-kind transactions.
(e) The amount shown for a share outstanding throughout the period does not accord with the change in aggregate gains and losses in the portfolio of securities during the period because of the timing of sales and purchases of fund shares in relation to fluctuating market values during the period.
(f) Portfolio turnover increased significantly due to changes in the volume and timing of purchases and sales of portfolio holdings during the year.
(g) Includes $0.07 gain derived from a payment from affiliate.
(h) Before the payment from affiliate for the loss resulting from a trade error, the total return for the year would have been 12.55%.
(i) Commencement of operations.
See notes to financial statements.
180
Victory Portfolios II | | Financial Highlights — continued | |
| | | Ratios to Average Net Assets | | Supplemental Data | |
| | | Net
Expenses(c) | | Net
Investment
Income
(Loss)(c) | | Gross
Expenses(c) | | Net Assets,
End of
Period
(000's) | | Portfolio
Turnover(b)(d) | |
VictoryShares US Discovery Enhanced Volatility Wtd ETF | |
Six Months Ended
12/31/20 (unaudited) | | | 0.35 | % | | | 1.37 | % | | | 0.50 | % | | $ | 47,733 | | | | 37 | % | |
Year Ended 6/30/20 | | | 0.35 | % | | | 1.19 | % | | | 0.47 | % | | $ | 37,203 | | | | 232 | % | |
Year Ended 6/30/19 | | | 0.35 | % | | | 1.48 | % | | | 0.42 | % | | $ | 92,614 | | | | 398 | %(f) | |
Year Ended 6/30/18 | | | 0.35 | % | | | 1.13 | % | | | 0.43 | % | | $ | 116,157 | | | | 47 | % | |
Year Ended 6/30/17 | | | 0.35 | % | | | 1.25 | % | | | 0.55 | % | | $ | 57,971 | | | | 50 | % | |
Year Ended 6/30/16 | | | 0.35 | % | | | 1.00 | % | | | 0.80 | % | | $ | 26,838 | | | | 221 | % | |
VictoryShares Developed Enhanced Volatility Wtd ETF | |
Six Months Ended
12/31/20 (unaudited) | | | 0.45 | % | | | 1.46 | % | | | 0.94 | % | | $ | 42,686 | | | | 36 | % | |
Year Ended 6/30/20 | | | 0.45 | % | | | 1.69 | % | | | 0.65 | % | | $ | 48,455 | | | | 33 | % | |
Year Ended 6/30/19 | | | 0.45 | % | | | 2.63 | % | | | 0.56 | % | | $ | 110,746 | | | | 154 | %(f) | |
Year Ended 6/30/18 | | | 0.45 | % | | | 2.73 | % | | | 0.58 | % | | $ | 179,103 | | | | 38 | % | |
Year Ended 6/30/17 | | | 0.45 | % | | | 2.59 | % | | | 0.86 | % | | $ | 82,150 | | | | 164 | % | |
Year Ended 6/30/16 | | | 0.45 | % | | | 2.16 | % | | | 1.36 | % | | $ | 34,797 | | | | 211 | % | |
VictoryShares Nasdaq Next 50 ETF | |
9/9/20(i) through
12/31/20 | | | 0.18 | % | | | 0.54 | % | | | 0.30 | % | | $ | 114,755 | | | | 46 | % | |
See notes to financial statements.
181
Victory Portfolios II | | Financial Highlights | |
| | | | | Investment Activities | | Distributions to
Shareholders From | | | |
| | | Net Asset
Value,
Beginning of
Period | | Net
Investment
Income
(Loss)(a) | | Net Realized
and Unrealized
Gains (Losses)
on Investments | | Total from
Investment
Activities | | Net
Investment
Income | | Total
Distributions | | Net Asset
Value,
End of
Period | | Total
Return(b) | |
VictoryShares Top Veteran Employers ETF | |
11/3/20(d) through
12/31/20 | | $ | 25.62 | | | | 0.06 | | | | 2.80 | | | | 2.86 | | | | (0.06 | ) | | | (0.06 | ) | | $ | 28.42 | | | | 11.14 | % | |
VictoryShares Protect America ETF | |
11/4/20(d) through
12/31/20 | | $ | 25.87 | | | | 0.05 | | | | 3.34 | | | | 3.39 | | | | (0.05 | ) | | | (0.05 | ) | | $ | 29.21 | | | | 13.08 | % | |
(a) Per share net investment income (loss) has been calculated using the average daily shares method.
(b) Not annualized for periods less than one year.
(c) Annualized for periods less than one year.
(d) Commencement of operations.
(e) Amount is less than 0.5%.
See notes to financial statements.
182
Victory Portfolios II | | Financial Highlights — continued | |
| | | Ratios to Average Net Assets | | Supplemental Data | |
| | | Net
Expenses(c) | | Net
Investment
Income
(Loss)(c) | | Gross
Expenses(c) | | Net Assets,
End of
Period
(000's) | | Portfolio
Turnover(b) | |
VictoryShares Top Veteran Employers ETF | |
11/3/20(d) through
12/31/20 | | | 0.60 | % | | | 1.33 | % | | | 2.48 | % | | $ | 2,842 | | | | 5 | % | |
VictoryShares Protect America ETF | |
11/4/20(d) through
12/31/20 | | | 0.60 | % | | | 1.06 | % | | | 2.43 | % | | $ | 2,921 | | | | — | %(e) | |
See notes to financial statements.
183
Victory Portfolios II | | Notes to Financial Statements
December 31, 2020 | |
(Unaudited)
1. Organization:
Victory Portfolios II (the "Trust") was organized on April 11, 2012, as a Delaware statutory trust as a successor to a company named "Compass EMP Funds Trust." The Trust is registered under the Investment Company Act of 1940, as amended (the "1940 Act"), as an open-end investment company. The Trust is comprised of 27 funds, 25 of which are Exchange-Traded Funds ("ETFs"), and is authorized to issue an unlimited number of shares, which are units of beneficial interest with no par value. Each Fund is classified as diversified under the 1940 Act.
The accompanying financial statements are those of the following 17 Funds (collectively, the "Funds" and individually, a "Fund").
Funds (Legal Name) | | Funds (Short Name) | |
VictoryShares US 500 Volatility Wtd ETF | | US 500 Volatility Wtd ETF | |
VictoryShares US Small Cap Volatility Wtd ETF | | US Small Cap Volatility Wtd ETF | |
VictoryShares International Volatility Wtd ETF | | International Volatility Wtd ETF | |
VictoryShares Emerging Market Volatility Wtd ETF | | Emerging Market Volatility Wtd ETF | |
VictoryShares US Large Cap High Div Volatility
Wtd ETF | | US Large Cap High Div Volatility Wtd ETF
| |
VictoryShares US Small Cap High Div Volatility
Wtd ETF | | US Small Cap High Div Volatility Wtd ETF
| |
VictoryShares International High Div Volatility
Wtd ETF | | International High Div Volatility Wtd ETF
| |
VictoryShares Emerging Market High Div Volatility
Wtd ETF | | Emerging Market High Div Volatility Wtd ETF
| |
VictoryShares Dividend Accelerator ETF | | Dividend Accelerator ETF | |
VictoryShares US Multi-Factor Minimum Volatility
ETF | | US Multi-Factor Minimum Volatility ETF
| |
VictoryShares US 500 Enhanced Volatility Wtd ETF | | US 500 Enhanced Volatility Wtd ETF | |
VictoryShares US EQ Income Enhanced Volatility
Wtd ETF | | US EQ Income Enhanced Volatility Wtd ETF
| |
VictoryShares US Discovery Enhanced Volatility
Wtd ETF | | US Discovery Enhanced Volatility Wtd ETF
| |
VictoryShares Developed Enhanced Volatility
Wtd ETF | | Developed Enhanced Volatility Wtd ETF
| |
VictoryShares Nasdaq Next 50 ETF | | Nasdaq Next 50 ETF* | |
VictoryShares Top Veteran Employers ETF | | Top Veteran Employers ETF** | |
VictoryShares Protect America ETF | | Protect America ETF*** | |
* Commenced operations on September 9, 2020.
** Commenced operations on November 3, 2020.
*** Commenced operations on November 4, 2020.
Under the Trust's organizational documents, its officers and trustees are indemnified against certain liabilities arising out of the performance of their duties to the Funds. In addition, in the normal course of business, the Funds enter into contracts with their vendors and others that provide for general indemnifications. The Funds' maximum exposure under these arrangements is unknown, as this would involve future claims that may be made against the Funds. However, based on experience, the Funds expect that risk of loss to be remote.
2. Significant Accounting Policies:
Shares of the Funds are listed and traded on Nasdaq Stock Market, LLC. (the "Exchange"). The Funds issue and redeem shares of a Fund ("Shares") at net asset value ("NAV") only in aggregations of 50,000 Shares, or 25,000 Share in the case of Nasdaq Next 50 ETF, Top Veteran Employers ETF, and Protect America ETF, (each a "Creation Unit"). Creation Units are issued and redeemed in exchange for a basket of securities included in the respective Fund's Index (the "Deposit Securities"), and/or with the deposit of a specified cash payment (the "Cash Component"), plus a transaction fee. Shares trade on the
184
Victory Portfolios II | | Notes to Financial Statements — continued
December 31, 2020 | |
(Unaudited)
Exchange at market prices that may be below, at, or above NAV. Shares of a Fund may only be purchased or redeemed by certain financial institutions ("Authorized Participants"). An Authorized Participant is either (i) a broker-dealer or other participant in the clearing process through the Continuous Net Settlement System of the National Securities Clearing Corporation or (ii) a DTC participant and, in each case, must have executed a Participant Agreement with the Distributor. Only Authorized Participants may purchase or redeem the shares directly from a Fund. In addition, shares may be issued in advance of receipt of Deposit Securities subject to various conditions, including a requirement to maintain on deposit with the Trust cash equal to up to 105% of the market value of the missing Deposit Securities. In each instance of such cash creations or redemptions, transaction fees may be imposed and may be higher than the transaction fees associated with in-kind creations or redemptions.
Each Fund may issue an unlimited number of shares of beneficial interest, with no par value. Shares of each Fund have equal rights and privileges. A purchase (i.e., creation) transaction fee is imposed for the transfer and other transactional costs associated with the purchase of Creation Units. In addition, a variable fee may be charged on all cash transactions or substitutes for Creation Units. Variable fees received by each Fund are displayed in the Capital Share Transaction section of the Statements of Changes in Net Assets as an increase to Capital.
The Transaction Fees for each Fund are listed below:
| | | Fee for In-Kind and
Cash Purchases and
Redemptions | | Maximum
Additional Variable
Charge for Cash
Purchases and
Redemptions* | |
US 500 Volatility Wtd ETF | | $ | 750 | | | | 2.00 | % | |
US Small Cap Volatility Wtd ETF | | | 750 | | | | 2.00 | % | |
International Volatility Wtd ETF | | | 6,000 | | | | 2.00 | % | |
Emerging Market Volatility Wtd ETF | | | 9,000 | | | | 2.00 | % | |
US Large Cap High Div Volatility Wtd ETF | | | 250 | | | | 2.00 | % | |
US Small Cap High Div Volatility Wtd ETF | | | 250 | | | | 2.00 | % | |
International High Div Volatility Wtd ETF | | | 1,500 | | | | 2.00 | % | |
Emerging Market High Div Volatility Wtd ETF | | | 3,400 | | | | 2.00 | % | |
Dividend Accelerator ETF | | | 250 | | | | 2.00 | % | |
US Multi-Factor Minimum Volatility ETF | | | 250 | | | | 2.00 | % | |
US 500 Enhanced Volatility Wtd ETF | | | 750 | | | | 2.00 | % | |
US EQ Income Enhanced Volatility Wtd ETF | | | 250 | | | | 2.00 | % | |
US Discovery Enhanced Volatility Wtd ETF | | | 750 | | | | 2.00 | % | |
Developed Enhanced Volatility Wtd ETF | | | 4,500 | | | | 2.00 | % | |
Nasdaq Next 50 ETF | | | 250 | | | | 2.00 | % | |
Top Veteran Employers ETF | | | 250 | | | | 2.00 | % | |
Protect America ETF | | | 250 | | | | 2.00 | % | |
* As a percentage of the amount invested.
The following is a summary of significant accounting policies followed by the Trust in the preparation of its financial statements. The policies are in conformity with Generally Accepted Accounting Principles in the United States of America ("GAAP"). The preparation of financial statements in accordance with GAAP requires management to make estimates and assumptions that affect the reported amounts of assets and liabilities and disclosure of contingent assets and liabilities at the date of the financial statements and the reported amounts of income and expenses for the period. Actual results could differ from those estimates. The Funds follow the specialized accounting and reporting requirements under GAAP that are applicable to investment companies.
Investment Valuation:
The Funds record investments at fair value. Fair value is defined as the price that would be received to sell an asset or paid to transfer a liability in an orderly transaction between market participants at the measurement date.
185
Victory Portfolios II | | Notes to Financial Statements — continued
December 31, 2020 | |
(Unaudited)
The valuation techniques described below maximize the use of observable inputs and minimize the use of unobservable inputs in determining fair value. The inputs used for valuing the Funds' investments are summarized in the three broad levels listed below:
• Level 1 — quoted prices in active markets for identical securities
• Level 2 — other significant observable inputs (including quoted prices for similar securities or interest rates applicable to those securities, etc.)
• Level 3 — significant unobservable inputs (including the Funds' own assumptions in determining the fair value of investments)
Changes in valuation techniques may result in transfers in or out of an assigned level within the disclosure hierarchy. The inputs or methodologies used for valuation techniques are not necessarily an indication of the risk associated with entering into those investments.
Portfolio securities listed or traded on securities exchanges, including American Depositary Receipts ("ADRs") and Rights, are valued at the closing price on the exchange or system where the security is principally traded, if available, or at the Nasdaq Official Closing Price. If there have been no sales for that day on the exchange or system, then a security is valued at the last available bid quotation on the exchange or system where the security is principally traded. In each of these situations, valuations are typically categorized as Level 1 in the fair value hierarchy.
Investments in open-end investment companies are valued at NAV. These valuations are typically categorized as Level 1 in the fair value hierarchy.
Futures contracts are valued at the settlement price established each day by the board of trade or an exchange on which they are traded. These valuations are typically categorized as Level 1 in the fair value hierarchy.
Investments for which there are no such quotations, or for which quotations do not appear reliable, are valued at fair value in accordance with procedures established by and under the general supervision and responsibility of the Trust's Board of Trustees (the "Board"). These valuations are typically categorized as Level 2 or Level 3 in the fair value hierarchy, based on the observability of inputs used to determine the fair value.
A summary of the valuations as of December 31, 2020, based upon the three levels defined above, is included in the table below while the breakdown, by category, of investments is disclosed on the Schedules of Portfolio Investments.
| | | LEVEL 1 | | LEVEL 2 | | LEVEL 3 | | TOTAL | |
US 500 Volatility Wtd ETF | |
Common Stocks | | $ | 680,197,856 | | | $ | — | | | $ | — | | | $ | 680,197,856 | | |
Collateral for Securities Loaned | | | 9,138,419 | | | | — | | | | — | | | | 9,138,419 | | |
Total | | $ | 689,336,275 | | | $ | — | | | $ | — | | | $ | 689,336,275 | | |
Other Financial Investments^: | |
Assets: | |
Futures | | $ | 30,911 | | | $ | — | | | $ | — | | | $ | 30,911 | | |
Total | | $ | 30,911 | | | $ | — | | | $ | — | | | $ | 30,911 | | |
US Small Cap Volatility Wtd ETF | |
Common Stocks | | $ | 21,454,074 | | | $ | — | | | $ | — | | | $ | 21,454,074 | | |
Collateral for Securities Loaned | | | 345,054 | | | | — | | | | — | | | | 345,054 | | |
Total | | $ | 21,799,128 | | | $ | — | | | $ | — | | | $ | 21,799,128 | | |
Other Financial Investments^: | |
Assets: | |
Futures | | $ | 3,658 | | | $ | — | | | $ | — | | | $ | 3,658 | | |
Total | | $ | 3,658 | | | $ | — | | | $ | — | | | $ | 3,658 | | |
186
Victory Portfolios II | | Notes to Financial Statements — continued
December 31, 2020 | |
(Unaudited)
| | | LEVEL 1 | | LEVEL 2 | | LEVEL 3 | | TOTAL | |
International Volatility Wtd ETF | |
Common Stocks | | $ | 111,775,782 | | | $ | — | | | $ | 1,407 | | | $ | 111,777,189 | | |
Collateral for Securities Loaned | | | 2,675,646 | | | | — | | | | — | | | | 2,675,646 | | |
Total | | $ | 114,451,428 | | | $ | — | | | $ | 1,407 | | | $ | 114,452,835 | | |
Other Financial Investments^: | |
Liabilities: | |
Futures | | $ | (299 | ) | | $ | — | | | $ | — | | | $ | (299 | ) | |
Total | | $ | (299 | ) | | $ | — | | | $ | — | | | $ | (299 | ) | |
Emerging Market Volatility Wtd ETF | |
Common Stocks | | $ | 9,455,957 | | | $ | 18,609 | | | $ | — | | | $ | 9,474,566 | | |
Total | | $ | 9,455,957 | | | $ | 18,609 | | | $ | — | | | $ | 9,474,566 | | |
US Large Cap High Div Volatility Wtd ETF | |
Common Stocks | | $ | 185,581,780 | | | $ | — | | | $ | — | | | $ | 185,581,780 | | |
Total | | $ | 185,581,780 | | | $ | — | | | $ | — | | | $ | 185,581,780 | | |
Other Financial Investments^: | |
Assets: | |
Futures | | $ | 5,559 | | | $ | — | | | $ | — | | | $ | 5,559 | | |
Total | | $ | 5,559 | | | $ | — | | | $ | — | | | $ | 5,559 | | |
US Small Cap High Div Volatility Wtd ETF | |
Common Stocks | | $ | 99,038,750 | | | $ | — | | | $ | — | | | $ | 99,038,750 | | |
Collateral for Securities Loaned | | | 2,884,542 | | | | — | | | | — | | | | 2,884,542 | | |
Total | | $ | 101,923,292 | | | $ | — | | | $ | — | | | $ | 101,923,292 | | |
Other Financial Investments^: | |
Assets: | |
Futures | | $ | 2,491 | | | $ | — | | | $ | — | | | $ | 2,491 | | |
Total | | $ | 2,491 | | | $ | — | | | $ | — | | | $ | 2,491 | | |
International High Div Volatility Wtd ETF | |
Common Stocks | | $ | 22,139,700 | | | $ | — | | | $ | — | | | $ | 22,139,700 | | |
Collateral for Securities Loaned | | | 298,358 | | | | — | | | | — | | | | 298,358 | | |
Total | | $ | 22,438,058 | | | $ | — | | | $ | — | | | $ | 22,438,058 | | |
Other Financial Investments^: | |
Liabilities: | |
Futures | | $ | (334 | ) | | $ | — | | | $ | — | | | $ | (334 | ) | |
Total | | $ | (334 | ) | | $ | — | | | $ | — | | | $ | (334 | ) | |
Emerging Market High Div Volatility Wtd ETF | |
Common Stocks | | $ | 16,535,848 | | | $ | — | | | $ | — | | | $ | 16,535,848 | | |
Total | | $ | 16,535,848 | | | $ | — | | | $ | — | | | $ | 16,535,848 | | |
Other Financial Investments^: | |
Assets: | |
Futures | | $ | 2,141 | | | $ | — | | | $ | — | | | $ | 2,141 | | |
Total | | $ | 2,141 | | | $ | — | | | $ | — | | | $ | 2,141 | | |
187
Victory Portfolios II | | Notes to Financial Statements — continued
December 31, 2020 | |
(Unaudited)
| | | LEVEL 1 | | LEVEL 2 | | LEVEL 3 | | TOTAL | |
Dividend Accelerator ETF | |
Common Stocks | | $ | 318,247,596 | | | $ | — | | | $ | — | | | $ | 318,247,596 | | |
Total | | $ | 318,247,596 | | | $ | — | | | $ | — | | | $ | 318,247,596 | | |
Other Financial Investments^: | |
Assets: | |
Futures | | $ | 14,567 | | | $ | — | | | $ | — | | | $ | 14,567 | | |
Total | | $ | 14,567 | | | $ | — | | | $ | — | | | $ | 14,567 | | |
US Multi-Factor Minimum Volatility ETF | |
Common Stocks | | $ | 145,561,693 | | | $ | — | | | $ | — | | | $ | 145,561,693 | | |
Total | | $ | 145,561,693 | | | $ | — | | | $ | — | | | $ | 145,561,693 | | |
Other Financial Investments^: | |
Assets: | |
Futures | | $ | 9,683 | | | $ | — | | | $ | — | | | $ | 9,683 | | |
Total | | $ | 9,683 | | | $ | — | | | $ | — | | | $ | 9,683 | | |
US 500 Enhanced Volatility Wtd ETF | |
Common Stocks | | $ | 751,939,426 | | | $ | — | | | $ | — | | | $ | 751,939,426 | | |
Investment Companies | | | 1,579,670 | | | | — | | | | — | | | | 1,579,670 | | |
Collateral for Securities Loaned | | | 12,462,722 | | | | — | | | | — | | | | 12,462,722 | | |
Total | | $ | 765,981,818 | | | $ | — | | | $ | — | | | $ | 765,981,818 | | |
Other Financial Investments^: | |
Assets: | |
Futures | | $ | 36,010 | | | $ | — | | | $ | — | | | $ | 36,010 | | |
Total | | $ | 36,010 | | | $ | — | | | $ | — | | | $ | 36,010 | | |
US EQ Income Enhanced Volatility Wtd ETF | |
Common Stocks | | $ | 642,260,540 | | | $ | — | | | $ | — | | | $ | 642,260,540 | | |
Investment Companies | | | 1,498,833 | | | | — | | | | — | | | | 1,498,833 | | |
Collateral for Securities Loaned | | | 4,453,649 | | | | — | | | | — | | | | 4,453,649 | | |
Total | | $ | 648,213,022 | | | $ | — | | | $ | — | | | $ | 648,213,022 | | |
Other Financial Investments^: | |
Assets: | |
Futures | | $ | 32,711 | | | $ | — | | | $ | — | | | $ | 32,711 | | |
Total | | $ | 32,711 | | | $ | — | | | $ | — | | | $ | 32,711 | | |
US Discovery Enhanced Volatility Wtd ETF | |
Common Stocks | | $ | 47,588,147 | | | $ | — | | | $ | — | | | $ | 47,588,147 | | |
Investment Companies | | | 106,420 | | | | — | | | | — | | | | 106,420 | | |
Collateral for Securities Loaned | | | 1,198,900 | | | | — | | | | — | | | | 1,198,900 | | |
Total | | $ | 48,893,467 | | | $ | — | | | $ | — | | | $ | 48,893,467 | | |
Other Financial Investments^: | |
Assets: | |
Futures | | $ | 3,658 | | | $ | — | | | $ | — | | | $ | 3,658 | | |
Total | | $ | 3,658 | | | $ | — | | | $ | — | | | $ | 3,658 | | |
Developed Enhanced Volatility Wtd ETF | |
Common Stocks | | $ | 42,320,899 | | | $ | — | | | $ | 1,205 | | | $ | 42,322,104 | | |
Investment Companies | | | 63,180 | | | | — | | | | — | | | | 63,180 | | |
Collateral for Securities Loaned | | | 1,597,376 | | | | — | | | | — | | | | 1,597,376 | | |
Total | | $ | 43,981,455 | | | $ | — | | | $ | 1,205 | | | $ | 43,982,660 | | |
188
Victory Portfolios II | | Notes to Financial Statements — continued
December 31, 2020 | |
(Unaudited)
| | | LEVEL 1 | | LEVEL 2 | | LEVEL 3 | | TOTAL | |
Other Financial Investments^: | |
Assets: | |
Futures | | $ | 1,636 | | | $ | — | | | $ | — | | | $ | 1,636 | | |
Total | | $ | 1,636 | | | $ | — | | | $ | — | | | $ | 1,636 | | |
Nasdaq Next 50 ETF | |
Common Stocks | | $ | 114,296,145 | | | $ | — | | | $ | — | | | $ | 114,296,145 | | |
Collateral for Securities Loaned | | | 1,936,842 | | | | — | | | | — | | | | 1,936,842 | | |
Total | | $ | 116,232,987 | | | $ | — | | | $ | — | | | $ | 116,232,987 | | |
Other Financial Investments^: | |
Assets: | |
Futures | | $ | 4,697 | | | $ | — | | | $ | — | | | $ | 4,697 | | |
Total | | $ | 4,697 | | | $ | — | | | $ | — | | | $ | 4,697 | | |
Top Veteran Employers ETF | |
Common Stocks | | $ | 2,834,454 | | | $ | — | | | $ | — | | | $ | 2,834,454 | | |
Total | | $ | 2,834,454 | | | $ | — | | | $ | — | | | $ | 2,834,454 | | |
Protect America ETF | |
Common Stocks | | $ | 2,914,006 | | | $ | — | | | $ | — | | | $ | 2,914,006 | | |
Total | | $ | 2,914,006 | | | $ | — | | | $ | — | | | $ | 2,914,006 | | |
^ Futures Contracts are valued at the unrealized appreciation (depreciation) on the investment.
For the six months ended December 31, 2020, there were no transfers in or out of the Level 3 fair value hierarchy.
Real Estate Investment Trusts ("REITs"):
The Funds may invest in REITs, which report information on the source of their distributions annually. REITs are pooled investment vehicles that invest primarily in income-producing real estate or real- estate related loans or interests (such as mortgages). Certain distributions received from REITs during the year are recorded as realized gains or return of capital as estimated by the Funds or when such information becomes known.
Investment Companies:
Open-end Funds:
The Funds may invest in portfolios of open-end investment companies. These investment companies value securities in their portfolios for which market quotations are readily available at their market values (generally the last reported sale price) and all other securities and assets at their fair value by the methods established by the board of directors of the underlying funds.
Derivative Instruments:
Foreign Exchange Currency Contracts:
The Developed Enhanced Volatility Wtd ETF, International Volatility Wtd ETF, International High Div Volatility Wtd ETF and Emerging Market Volatility Wtd ETF may enter into foreign exchange currency contracts to convert U.S. dollars to and from various foreign currencies. A foreign exchange currency contract is an obligation by a Fund to purchase or sell a specific currency at a future date at a price (in U.S. dollars) set at the time of the contract. The Funds do not engage in "cross-currency" foreign exchange contracts (i.e., contracts to purchase or sell one foreign currency in exchange for another foreign currency). The Funds' foreign exchange currency contracts might be considered spot contracts (typically a contract of one week or less) or forward contracts (typically a contract term over one week).
189
Victory Portfolios II | | Notes to Financial Statements — continued
December 31, 2020 | |
(Unaudited)
A spot contract is entered into for purposes of hedging against foreign currency fluctuations relating to a specific portfolio transaction, such as the delay between a security transaction trade date and settlement date. Forward contracts are entered into for purposes of hedging portfolio holdings or concentrations of such holdings. The Developed Enhanced Volatility Wtd ETF, International Volatility Wtd ETF, Emerging Market Volatility Wtd ETF and International High Div Volatility Wtd ETF enter into foreign exchange currency contracts solely for spot or forward hedging purposes, and not for speculative purposes (i.e., the Funds do not enter into such contracts solely for the purpose of earning foreign currency gains). Each foreign exchange currency contract is adjusted daily by the prevailing spot or forward rate of the underlying currency, and any appreciation or depreciation is recorded for financial statement purposes as unrealized until the contract settlement date, at which time the Fund records realized gains or losses equal to the difference between the value of a contract at the time it was opened and the value at the time it was closed. A Fund could be exposed to risk if a counterparty is unable to meet the terms of a foreign exchange currency contract or if the value of the foreign currency changes unfavorably. In addition, the use of foreign exchange currency contracts does not eliminate fluctuations in the underlying prices of the securities. As of December 31, 2020, the Funds had no open forward foreign exchange currency contracts.
Futures Contracts:
The Funds may enter into contracts for the future delivery of securities or foreign currencies and futures contracts based on a specific security, class of securities, foreign currency or an index, and purchase or sell options on any such futures contracts. A futures contract on a securities index is an agreement obligating either party to pay, and entitling the other party to receive, while the contract is outstanding, cash payments based on the level of a specified securities index. No physical delivery of the underlying asset is made. A Fund may enter into futures contracts in an effort to hedge against market risks. The acquisition of put and call options on futures contracts will give the Fund the right (but not the obligation), for a specified price, to sell or to purchase the underlying futures contract, upon exercise of the option, at any time during the option period. Futures transactions involve brokerage costs and require the Fund to segregate assets to cover contracts that would require it to purchase securities or currencies. A good faith margin deposit, known as initial margin, of cash or government securities with a broker or custodian is required to initiate and maintain open positions in futures contracts. Subsequent payments, known as variation margin, are made or received by the Fund based on the change in the market value of the position and are recorded as unrealized appreciation or depreciation until the contract is closed out, at which time the gain or loss is realized. A Fund may lose the expected benefit of futures transactions if interest rates, exchange rates or securities prices change in an unanticipated manner. Such unanticipated changes may also result in lower overall performance than if the Fund had not entered into any futures transactions. In addition, the value of a Fund's futures positions may not prove to be perfectly or even highly correlated with the value of its portfolio securities or foreign currencies, limiting a Fund's ability to hedge effectively against interest rate, exchange rate and/or market risk and giving rise to additional risks. There is no assurance of liquidity in the secondary market for purposes of closing out futures positions. The collateral held by the Funds is presented on the Statements of Assets and Liabilities under Deposit with broker for futures contracts.
As of December 31, 2020, the Funds entered into futures contracts primarily for the strategy of hedging or other purposes, including but not limited to, providing liquidity and equitizing cash.
Offsetting of Financial Assets and Derivatives Assets:
The Funds are subject to various Master Netting Arrangements, which govern the terms of certain transactions with select counterparties. The Master Netting Arrangements allow the Funds to close out and net total exposure to a counterparty in the event of a default with respect to all the transactions governed under a single agreement with a counterparty. The Master Netting Arrangements also specify collateral posting arrangements at pre-arranged exposure levels. Under the Master Netting Arrangements, collateral is routinely transferred if the total net exposure to certain transactions (net of existing collateral already in place) governed under the relevant Master Netting Arrangement with a counterparty in a given account exceeds a specified threshold depending on the counterparty and the type of Master Netting Arrangement.
190
Victory Portfolios II | | Notes to Financial Statements — continued
December 31, 2020 | |
(Unaudited)
The table below, as of December 31, 2020, discloses both gross information and net information about instruments and transactions eligible for offset on the Statements of Assets and Liabilities and instruments and transactions that are subject to an agreement similar to a master netting agreement as well as amounts related to collateral held at clearing brokers and counterparties.
| | | | | Gross Amounts not Offset in the
Statement of Assets and Liabilities | |
| | | Gross Amounts
of Recognized
Assets | | Gross Amounts
Available for
Offset | | Net Amounts
Presented in the
Statements of
Assets and
Liabilities | | Financial
Instruments
for Offset | | Cash
Collateral
Received | | Net
Amount | |
US 500 Volatility Wtd ETF | |
Futures
Goldman Sachs & Co | | $ | 11,076 | | | $ | — | | | $ | 11,076 | | | $ | — | | | $ | — | | | $ | 11,076 | | |
US Large Cap High Div Volatility Wtd ETF | |
Futures
Goldman Sachs & Co | | | 2,466 | | | | — | | | | 2,466 | | | | — | | | | — | | | | 2,466 | | |
Dividend Accelerator ETF | |
Futures
Goldman Sachs & Co | | | 6,156 | | | | — | | | | 6,156 | | | | — | | | | — | | | | 6,156 | | |
US Multi-Factor Minimum Volatility ETF | |
Futures
Goldman Sachs & Co | | | 3,696 | | | | — | | | | 3,696 | | | | — | | | | — | | | | 3,696 | | |
US 500 Enhanced Volatility Wtd ETF | |
Futures
Goldman Sachs & Co | | | 12,306 | | | | — | | | | 12,306 | | | | — | | | | — | | | | 12,306 | | |
US EQ Income Enhanced Volatility
Wtd ETF | |
Futures
Goldman Sachs & Co | | | 11,082 | | | | — | | | | 11,082 | | | | — | | | | — | | | | 11,082 | | |
Nasdaq Next 50 ETF | |
Futures
Goldman Sachs & Co | | | 1,760 | | | | — | | | | 1,760 | | | | — | | | | — | | | | 1,760 | | |
| | | | | Gross Amounts not Offset in the
Statement of Assets and Liabilities | |
| | | Gross Amounts
of Recognized
Liabilities | | Gross Amounts
Available for
Offset | | Net Amounts
Presented in the
Statements of
Assets and
Liabilities | | Financial
Instruments
for Offset | | Cash
Collateral
Pledged** | | Net
Amount | |
US Small Cap Volatility Wtd ETF | |
Futures
Goldman Sachs & Co | | $ | 85 | | | $ | — | | | $ | 85 | | | $ | — | | | $ | (85 | ) | | $ | — | | |
International Volatility Wtd ETF | |
Futures
Goldman Sachs & Co | | | 299 | | | | — | | | | 299 | | | | — | | | | (299 | ) | | | — | | |
US Small Cap High Div Volatility Wtd ETF | |
Futures
Goldman Sachs & Co | | | 249 | | | | — | | | | 249 | | | | — | | | | (249 | ) | | | — | | |
International High Div Volatility Wtd ETF | |
Futures
Goldman Sachs & Co | | | 860 | | | | — | | | | 860 | | | | — | | | | (860 | ) | | | — | | |
Emerging Market High Div Volatility
Wtd ETF | |
Futures
Goldman Sachs & Co | | | 105 | | | | — | | | | 105 | | | | — | | | | (105 | ) | | | — | | |
US Discovery Enhanced Volatility
Wtd ETF | |
Futures
Goldman Sachs & Co | | | 85 | | | | — | | | | 85 | | | | — | | | | (85 | ) | | | — | | |
Developed Enhanced Volatility Wtd ETF | |
Futures
Goldman Sachs & Co | | | 860 | | | | — | | | | 860 | | | | — | | | | (860 | ) | | | — | | |
** Cash collateral pledged may be in excess of the amounts shown in the table. The total cash collateral pledged by each Fund is disclosed on the Statements of Assets and Liabilities.
191
Victory Portfolios II | | Notes to Financial Statements — continued
December 31, 2020 | |
(Unaudited)
Summary of Derivative Instruments:
The following table summarizes the fair values of derivative instruments on the Statements of Assets and Liabilities, categorized by risk exposure, as of December 31, 2020:
| | | Assets | | Liabilities | |
| | | Variation Margin
Receivable on Open
Futures Contracts* | | Variation Margin
Payable on Open
Futures Contracts* | |
Equity Risk Exposure: | |
US 500 Volatility Wtd ETF | | $ | 30,911 | | | $ | — | | |
US Small Cap Volatility Wtd ETF | | | 3,658 | | | | — | | |
International Volatility Wtd ETF | | | — | | | | 299 | | |
US Large Cap High Div Volatility Wtd ETF | | | 5,559 | | | | — | | |
US Small Cap High Div Volatility Wtd ETF | | | 2,491 | | | | — | | |
International High Div Volatility Wtd ETF | | | — | | | | 334 | | |
Emerging Market High Div Volatility Wtd ETF | | | 2,141 | | | | — | | |
Dividend Accelerator ETF | | | 14,567 | | | | — | | |
US Multi-Factor Minimum Volatility ETF | | | 9,683 | | | | — | | |
US 500 Enhanced Volatility Wtd ETF | | | 36,010 | | | | — | | |
US EQ Income Enhanced Volatility Wtd ETF | | | 32,711 | | | | — | | |
US Discovery Enhanced Volatility Wtd ETF | | | 3,658 | | | | — | | |
Developed Enhanced Volatility Wtd ETF | | | 1,636 | | | | — | | |
Nasdaq Next 50 ETF | | | 4,697 | | | | — | | |
* Includes cumulative appreciation/depreciation of futures contracts a as reported on the Schedules of Portfolio Investments. Only current day's variation margin for futures contracts are reported within the Statements of Assets and Liabilities.
The following table presents the effect of derivative instruments on the Statements of Operations, categorized by risk exposure, for the six months ended December 31, 2020:
| | | Net Realized
Gains (Losses) on
Derivatives
Recognized as a
Result from
Operations | | Net Change in Unrealized
Appreciation/Depreciation
on Derivatives Recognized
as a Result of Operations | |
| | | Net Realized
Gains (Losses) from
Futures Contracts | | Net Change in Unrealized
Appreciation/Depreciation
on Futures Contracts | |
Equity Risk Exposure: | |
US 500 Volatility Wtd ETF | | $ | 405,760 | | | $ | (16,866 | ) | |
US Small Cap Volatility Wtd ETF | | | 10,638 | | | | 842 | | |
International Volatility Wtd ETF | | | 60,304 | | | | 3,555 | | |
Emerging Market Volatility Wtd ETF | | | 39,783 | | | | (81 | ) | |
US Large Cap High Div Volatility Wtd ETF | | | 173,946 | | | | 7,707 | | |
US Small Cap High Div Volatility Wtd ETF | | | 84,588 | | | | (4,223 | ) | |
International High Div Volatility Wtd ETF | | | 48,701 | | | | (73 | ) | |
Emerging Market High Div Volatility Wtd ETF | | | 58,383 | | | | 789 | | |
Dividend Accelerator ETF | | | 196,233 | | | | 9,112 | | |
US Multi-Factor Minimum Volatility ETF | | | 81,832 | | | | 17,532 | | |
US 500 Enhanced Volatility Wtd ETF | | | 412,036 | | | | 63,483 | | |
US EQ Income Enhanced Volatility Wtd ETF | | | 585,293 | | | | 47,455 | | |
US Discovery Enhanced Volatility Wtd ETF | | | 45,452 | | | | (3,154 | ) | |
Developed Enhanced Volatility Wtd ETF | | | 36,648 | | | | 2,009 | | |
Nasdaq Next 50 ETF | | | 33,145 | | | | 4,697 | | |
192
Victory Portfolios II | | Notes to Financial Statements — continued
December 31, 2020 | |
(Unaudited)
All open derivative positions at period end are reflected on each respective Fund's Schedule of Portfolio Investments. The underlying face value of open derivative positions relative to each Fund's net assets at period end is generally representative of the notional amount of open positions to net assets throughout the period.
Investment Transactions and Related Income:
Changes in holdings of investments are accounted for no later than one business day following the trade date. For financial reporting purposes, however, investment transactions are accounted for on trade date on the last business day of the reporting period. Interest income is determined on the basis of coupon interest accrued using the effective interest method which adjusts, where applicable, the amortization of premiums or accretion of discounts. Dividend income is recorded on the ex-dividend date. Gains or losses realized on sales of securities are recorded on the identified cost basis.
Withholding taxes on interest, dividends and gains as a result of certain investments in ADRs by the Funds have been provided for in accordance with each investment's applicable country's tax rules and rates.
Securities Lending:
The Trust has entered into a Master Securities Lending Agreement ("MSLA") with Citibank, N.A. ("Citibank" or the "Agent"). Under the terms of the MSLA, the Funds may lend securities to certain broker-dealers and banks in exchange for collateral in the amount of at least 102% of the value of U.S. securities loaned or at least 105% of the value of non-U.S. securities loaned, marked-to-market daily. Any collateral shortfalls associated with increases in the valuation of the securities loaned are adjusted the next business day. The collateral can be received in the form of cash collateral and/or non-cash collateral. Non-cash collateral can include U.S. Government Securities, letters of credit and certificates of deposit. The cash collateral is invested in short-term instruments or cash equivalents, primarily open-end investment companies, as noted on the Funds' Schedules of Portfolio Investments. The Trust does not have effective control of the non-cash collateral and therefore it is not disclosed on the Funds' Schedules of Portfolio Investments. During the time portfolio securities are on loan, the borrower will pay the Funds any dividends or interest paid on such securities plus any fee negotiated between the parties to the lending agreement. The Funds also earn a return from the collateral. The Funds pay the Agent various fees in connection with the investment of cash collateral and fees based on the investment income received from securities lending activities. Securities lending income (net of these fees) is disclosed on the Statements of Operations. Although risk is mitigated by the collateral, the Funds could experience a delay in recovering their securities and possible loss of income or value if the borrower fails to return them.
Securities lending transactions are entered into by a Fund under the MSLA, which permits the Fund, under certain circumstances such as an event of default, to offset amounts payable by the Fund to the same counterparty against amounts receivable from the counterparty to create a net payment due to or from the Fund.
The following table is a summary of the Funds' securities lending transactions which are subject to offset under the MSLA as of December 31, 2020. These transactions are accounted for as secured borrowings with an overnight and continuous contractual maturity for cash collateral and greater than overnight and continuous contractual maturity for non-cash collateral.
| | | Gross
Amount of
Recognized
Assets
(Value of | | Value of
Cash | | Value of Non-cash Collateral
Received by Maturity | | | |
| | | Securities
on Loan) | | Collateral
Received* | | <30 Days | | Between
30 & 90 days | | >90 Days | | Net
Amount | |
US 500 Volatility
Wtd ETF | | $ | 8,941,082 | | | $ | 8,941,082 | | | $ | — | | | $ | — | | | $ | — | | | $ | — | | |
US Small Cap Volatility
Wtd ETF | | | 337,004 | | | | 337,004 | | | | — | | | | — | | | | — | | | | — | | |
International Volatility
Wtd ETF | | | 2,538,487 | | | | 2,538,487 | | | | — | | | | — | | | | — | | | | — | | |
193
Victory Portfolios II | | Notes to Financial Statements — continued
December 31, 2020 | |
(Unaudited)
| | | Gross
Amount of
Recognized
Assets
(Value of | | Value of
Cash | | Value of Non-cash Collateral
Received by Maturity | | | |
| | | Securities
on Loan) | | Collateral
Received* | | <30 Days | | Between
30 & 90 days | | >90 Days | | Net
Amount | |
US Small Cap High Div
Volatility Wtd ETF | | $ | 2,796,236 | | | $ | 2,796,236 | | | $ | — | | | $ | — | | | $ | — | | | $ | — | | |
International High Div
Volatility Wtd ETF | | | 283,989 | | | | 283,989 | | | | — | | | | — | | | | — | | | | — | | |
US 500 Enhanced
Volatility Wtd ETF | | | 12,140,263 | | | | 12,140,263 | | | | — | | | | — | | | | — | | | | — | | |
US EQ Income Enhanced
Volatility Wtd ETF | | | 4,399,668 | | | | 4,399,668 | | | | — | | | | — | | | | — | | | | — | | |
US Discovery Enhanced
Volatility Wtd ETF | | | 1,172,578 | | | | 1,172,578 | | | | — | | | | — | | | | — | | | | — | | |
Developed Enhanced
Volatility Wtd ETF | | | 1,513,094 | | | | 1,513,094 | | | | — | | | | — | | | | — | | | | — | | |
Nasdaq Next 50 ETF | | | 1,910,686 | | | | 1,910,686 | | | | — | | | | — | | | | — | | | | — | | |
* Collateral received in excess of the market value of securities on loan is not presented in this table. The total cash collateral received by each Fund is disclosed on the Statements of Assets and Liabilities.
Foreign Currency Translations:
The accounting records of the Funds are maintained in U.S. dollars. Investment securities and other assets and liabilities of a Fund denominated in a foreign currency are translated into U.S. dollars at current exchange rates. Purchases and sales of securities, income receipts and expense payments are translated into U.S. dollars at the exchange rates on the date of the transactions. The Funds do not isolate the portion of the results of operations resulting from changes in foreign exchange rates on investments from fluctuations arising from changes in market prices of securities held. Such fluctuations are disclosed as Net change in unrealized appreciation/depreciation on investments and foreign currency translations on the Statements of Operations. Any realized gains or losses from these fluctuations, including foreign currency arising from in-kind redemptions, are disclosed as Net realized gains (losses) from investment transactions and foreign currency translations on the Statements of Operations.
Foreign Taxes:
The Funds may be subject to foreign taxes related to foreign income received (a portion of which may be reclaimable), capital gains on the sale of securities, and certain foreign currency transactions. All foreign taxes are recorded in accordance with the applicable regulations and rates that exist in the foreign jurisdictions in which the Funds invest.
Federal Income Taxes:
It is the policy of each Fund to continue to qualify as a regulated investment company by complying with the provisions available to certain investment companies, as defined in applicable sections of the Internal Revenue Code, and to make distributions of net investment income and net realized gains sufficient to relieve it from all, or substantially all, federal income taxes. Accordingly, no provision for federal income taxes is required in the financial statements. The Funds have a tax year end of June 30.
Management of the Funds has reviewed tax positions taken in tax years that remain subject to examination by all major tax jurisdictions, including federal (i.e., the last four tax years, which includes the current fiscal tax year end). Management believes that there is no tax liability resulting from unrecognized tax benefits related to uncertain tax positions taken.
194
Victory Portfolios II | | Notes to Financial Statements — continued
December 31, 2020 | |
(Unaudited)
Allocations:
Expenses directly attributable to a Fund are charged to the Fund, while expenses which are attributable to more than one fund in the Trust, or jointly with an affiliated trust, are allocated among the respective funds in the Trust and/or affiliated trust based upon net assets or another appropriate basis.
3. Purchases and Sales of Securities:
Purchases and sales of securities (excluding securities maturing less than one year from acquisition) and in-kind transactions associated with purchases and sales for the six months ended December 31, 2020, were as follows:
| | | Excluding in-kind transactions | | Associated
with in-kind transactions | |
| | | Purchases | | Sales | | Purchases | | Sales | |
US 500 Volatility Wtd ETF | | $ | 131,264,003 | | | $ | 131,336,696 | | | $ | 3,058,314 | | | $ | 128,698,769 | | |
US Small Cap Volatility Wtd ETF | | | 6,567,310 | | | | 6,612,704 | | | | — | | | | — | | |
| International Volatility Wtd ETF | | | 24,683,467 | | | | 23,273,209 | | | | 10,664,088 | | | | — | | |
Emerging Market
Volatility Wtd ETF | | | 14,027,144 | | | | 50,722,731 | | | | 335,529 | | | | — | | |
US Large Cap High Div
Volatility Wtd ETF | | | 63,598,452 | | | | 63,208,398 | | | | — | | | | 39,244,481 | | |
US Small Cap High Div
Volatility Wtd ETF | | | 34,131,196 | | | | 34,542,925 | | | | 20,403,389 | | | | 9,094,711 | | |
International High Div
Volatility Wtd ETF | | | 30,789,157 | | | | 32,889,775 | | | | — | | | | 45,842,188 | | |
Emerging Market High Div
Volatility Wtd ETF | | | 10,633,065 | | | | 13,391,101 | | | | — | | | | 4,693,822 | | |
| Dividend Accelerator ETF | | | 30,191,576 | | | | 30,657,427 | | | | 40,575,507 | | | | 5,559,937 | | |
US Multi-Factor Minimum
Volatility ETF | | | 43,619,761 | | | | 43,698,499 | | | | 8,071,416 | | | | 31,876,117 | | |
US 500 Enhanced
Volatility Wtd ETF | | | 408,943,563 | | | | 130,233,176 | | | | 26,449,739 | | | | 5,438,098 | | |
US EQ Income Enhanced
Volatility Wtd ETF | | | 285,538,937 | | | | 157,694,296 | | | | 10,505,789 | | | | 16,684,543 | | |
US Discovery Enhanced
Volatility Wtd ETF | | | 21,182,883 | | | | 12,734,916 | | | | 3,178,640 | | | | 4,025,855 | | |
Developed Enhanced
Volatility Wtd ETF | | | 34,255,724 | | | | 13,458,126 | | | | — | | | | 11,118,815 | | |
Nasdaq Next 50 ETF | | | 32,379,430 | | | | 32,781,832 | | | | 116,508,794 | | | | 20,610,158 | | |
Top Veteran Employers ETF | | | 143,174 | | | | 150,656 | | | | 2,562,420 | | | | — | | |
Protect America ETF | | | 8,320 | | | | 6,506 | | | | 2,578,623 | | | | — | | |
For the six months ended December 31, 2020, there were no purchases or sales of U.S. Government Securities.
4. Fees and Transactions with Affiliates and Related Parties:
Investment advisory services are provided to the Funds by Victory Capital Management Inc. ("VCM" or the "Adviser"), a New York corporation registered as an investment adviser with the Securities and Exchange Commission ("SEC"). The Adviser is a wholly owned indirect subsidiary of Victory Capital Holdings, Inc., a publicly traded Delaware corporation, and a wholly owned direct subsidiary of Victory Capital Operating, LLC. Amounts incurred and paid to VCM for the six months ended December 31, 2020, are reflected on the Statements of Operations as Investment advisory fees.
195
Victory Portfolios II | | Notes to Financial Statements — continued
December 31, 2020 | |
(Unaudited)
Under the terms of the Investment Advisory Agreement, the Adviser is entitled to receive fees based on a percentage of the average daily net assets of each Fund. The rates at which the Adviser is paid by each Fund are included in the table below.
| | | Flat Rate | |
US 500 Volatility Wtd ETF | | | 0.30 | % | |
US Small Cap Volatility Wtd ETF | | | 0.30 | % | |
International Volatility Wtd ETF | | | 0.40 | % | |
Emerging Market Volatility Wtd ETF | | | 0.45 | % | |
US Large Cap High Div Volatility Wtd ETF | | | 0.30 | % | |
US Small Cap High Div Volatility Wtd ETF | | | 0.30 | % | |
International High Div Volatility Wtd ETF | | | 0.40 | % | |
Emerging Market High Div Volatility Wtd ETF | | | 0.45 | % | |
Dividend Accelerator ETF | | | 0.30 | % | |
US Multi-Factor Minimum Volatility ETF | | | 0.30 | % | |
US 500 Enhanced Volatility Wtd ETF | | | 0.30 | % | |
US EQ Income Enhanced Volatility Wtd ETF | | | 0.30 | % | |
US Discovery Enhanced Volatility Wtd ETF | | | 0.30 | % | |
Developed Enhanced Volatility Wtd ETF | | | 0.40 | % | |
Nasdaq Next 50 ETF | | | 0.25 | % | |
Top Veteran Employers ETF | | | 0.55 | % | |
Protect America ETF | | | 0.55 | % | |
VCM also serves as the Funds' administrator and fund accountant. Under the Administration and Fund Accounting Agreement, VCM is paid for its services an annual fee at a rate of 0.08% of the first $15 billion in average daily net assets of the Trust, Victory Variable Insurance Funds and Victory Portfolios (collectively, the "Victory Funds Complex"), 0.05% of the average daily net assets above $15 billion to $30 billion of the Victory Funds Complex and 0.04% of the average daily net assets over $30 billion of the Victory Funds Complex. Amounts incurred for the six months ended December 31, 2020, are reflected on the Statements of Operations as Administration fees.
Citi Fund Services Ohio, Inc. ("Citi"), an affiliate of Citibank, acts as sub-administrator and sub-fund accountant to the Funds pursuant to the Sub-Administration and Sub-Fund Accounting Services Agreement between VCM and Citi. VCM pays Citi a fee for providing these services. The Funds reimburse VCM and Citi for out-of-pocket expenses incurred in providing these services and certain other expenses specifically allocated to the Funds. Amounts incurred for the six months ended December 31, 2020, are reflected on the Statements of Operations as Sub-Administration fees.
Citibank serves as the Funds' custodian. The Funds pay Citibank a fee for providing these services. Amounts incurred for the six months ended December 31, 2020, are reflected on the Statements of Operations as Custodian fees.
Citibank also serves as the Funds' Transfer Agent. Amounts incurred for the six months ended December 31, 2020, are reflected on the Statements of Operations as Transfer agent fees.
Foreside Fund Services, LLC ("Foreside") serves as the Funds' distributor.
The Chief Compliance Officer ("CCO") is an employee of the Adviser, which pays the compensation of the CCO and his support staff. The Trust has entered into an Agreement to provide compliance services with the Adviser, pursuant to which the Adviser furnishes its compliance personnel, including the services of the CCO, and other resources reasonably necessary to provide the Trust with compliance oversight services related to the design, administration and oversight of a compliance program for the Trust in accordance with Rule 38a-1 under the 1940 Act. The Funds in the Victory Funds Complex, in aggregate, compensate the Adviser for these services. Amounts incurred for the six ended December 31, 2020, are reflected on the Statements of Operations as Compliance fees.
Sidley Austin LLP provides legal services to the Trust.
The Adviser has entered into expense limitation agreements with certain Funds. Under the terms of the agreements, the Adviser has agreed to waive fees or reimburse certain expenses to the extent that ordinary operating expenses incurred by certain Funds in any fiscal year exceed the expense limit for
196
Victory Portfolios II | | Notes to Financial Statements — continued
December 31, 2020 | |
(Unaudited)
such Fund. Such excess amounts will be the liability of the Adviser. Interest, taxes, brokerage commissions, other expenditures which are capitalized in accordance with GAAP, and other extraordinary expenses not incurred in the ordinary course of a Fund's business are excluded from the expense limits. As of December 31, 2020, the expense limits (excluding voluntary waivers) are as follows:
| | In effect through
October 31, 2021 | |
US 500 Volatility Wtd ETF | | | 0.35 | % | |
US Small Cap Volatility Wtd ETF | | | 0.35 | % | |
International Volatility Wtd ETF | | | 0.45 | % | |
Emerging Market Volatility Wtd ETF | | | 0.50 | % | |
US Large Cap High Div Volatility Wtd ETF | | | 0.35 | % | |
US Small Cap High Div Volatility Wtd ETF | | | 0.35 | % | |
International High Div Volatility Wtd ETF | | | 0.45 | % | |
Emerging Market High Div Volatility Wtd ETF | | | 0.50 | % | |
Dividend Accelerator ETF | | | 0.35 | % | |
US Multi-Factor Minimum Volatility ETF | | | 0.35 | % | |
US 500 Enhanced Volatility Wtd ETF | | | 0.35 | % | |
US EQ Income Enhanced Volatility Wtd ETF | | | 0.35 | % | |
US Discovery Enhanced Volatility Wtd ETF | | | 0.35 | % | |
Developed Enhanced Volatility Wtd ETF | | | 0.45 | % | |
Nasdaq Next 50 ETF | | | 0.18 | %(a) | |
Top Veteran Employers ETF | | | 0.60 | %(b) | |
Protect America ETF | | | 0.60 | %(b) | |
(a) In effect from June 1, 2020, until at least May 30, 2022.
(b) In effect from June 18, 2020, until at least November 2, 2021.
The Funds have agreed to repay fees and expenses that were waived or reimbursed by the Adviser for a period up to three fiscal years after such waiver or reimbursement was made to the extent such payments or repayments would not cause the expenses of a class to exceed the original expense limitation in place at the time of the waiver or reimbursement or any expense limitation agreement in place at the time of repayment. Amounts repaid to the Adviser during the year, if any, are reflected on the Statements of Operations as Recoupment of prior expenses waived/reimbursed by Adviser.
As of December 31, 2020, the following amounts are available to be repaid to the Adviser. The Funds have not recorded any amounts available to be repaid as a liability due to an assessment that such repayment is not probable at December 31, 2020.
| | | Expires
June 30, 2021 | | Expires
June 30, 2022 | | Expires
June 30, 2023 | | Expires
June 30, 2024 | | Total | |
US 500 Volatility Wtd ETF | | $ | 149,989 | | | $ | 180,818 | | | $ | 99,179 | | | $ | 50,838 | | | $ | 480,824 | | |
US Small Cap Volatility Wtd ETF | | | 29,566 | | | | 29,837 | | | | 39,631 | | | | 20,622 | | | | 119,656 | | |
International Volatility Wtd ETF | | | 91,734 | | | | 76,477 | | | | 121,119 | | | | 67,181 | | | | 356,511 | | |
Emerging Market Volatility
Wtd ETF | | | 194,086 | | | | 159,736 | | | | 212,048 | | | | 125,769 | | | | 691,639 | | |
US Large Cap High Div Volatility
Wtd ETF | | | 59,758 | | | | 85,683 | | | | 64,858 | | | | 35,767 | | | | 246,066 | | |
US Small Cap High Div Volatility
Wtd ETF | | | 29,681 | | | | 35,161 | | | | 45,375 | | | | 21,962 | | | | 132,179 | | |
International High Div Volatility
Wtd ETF | | | 47,955 | | | | 48,516 | | | | 63,200 | | | | 36,464 | | | | 196,135 | | |
Emerging Market High Div
Volatility Wtd ETF | | | 47,982 | | | | 93,761 | | | | 117,270 | | | | 69,541 | | | | 328,554 | | |
Dividend Accelerator ETF | | | 20,087 | | | | 21,708 | | | | 51,403 | | | | 18,854 | | | | 112,052 | | |
US Multi-Factor Minimum
Volatility ETF | | | 16,990 | | | | 28,089 | | | | 47,372 | | | | 22,375 | | | | 114,826 | | |
197
Victory Portfolios II | | Notes to Financial Statements — continued
December 31, 2020 | |
(Unaudited)
| | | Expires
June 30, 2021 | | Expires
June 30, 2022 | | Expires
June 30, 2023 | | Expires
June 30, 2024 | | Total | |
US 500 Enhanced Volatility
Wtd ETF | | $ | 219,577 | | | $ | 226,258 | | | $ | 90,547 | | | $ | 44,656 | | | $ | 581,038 | | |
US EQ Income Enhanced
Volatility Wtd ETF | | | 178,795 | | | | 183,343 | | | | 75,542 | | | | 48,440 | | | | 486,120 | | |
US Discovery Enhanced
Volatility Wtd ETF | | | 48,147 | | | | 50,577 | | | | 45,253 | | | | 23,418 | | | | 167,395 | | |
Developed Enhanced Volatility
Wtd ETF | | | 140,353 | | | | 126,154 | | | | 132,700 | | | | 103,246 | | | | 502,453 | | |
Nasdaq Next 50 ETF | | | N/A | | | | N/A | | | | N/A | | | | 18,734 | | | | 18,734 | | |
Top Veteran Employers ETF | | | N/A | | | | N/A | | | | N/A | | | | 8,137 | | | | 8,137 | | |
Protect America ETF | | | N/A | | | | N/A | | | | N/A | | | | 8,005 | | | | 8,005 | | |
The Adviser voluntarily waived the following administration fees for the six months ended December 31, 2020, to assist the Funds in maintaining competitive expense ratios. Voluntary waivers and reimbursements applicable to the Funds are not available to be recouped at a future time.
US 500 Volatility Wtd ETF | | $ | 123,139 | | |
US Small Cap Volatility Wtd ETF | | | 3,328 | | |
International Volatility Wtd ETF | | | 17,283 | | |
Emerging Market Volatility Wtd ETF | | | 5,732 | | |
US Large Cap High Div Volatility Wtd ETF | | | 34,215 | | |
US Small Cap High Div Volatility Wtd ETF | | | 12,966 | | |
International High Div Volatility Wtd ETF | | | 9,998 | | |
Emerging Market High Div Volatility Wtd ETF | | | 3,977 | | |
Dividend Accelerator ETF | | | 51,092 | | |
US Multi-Factor Minimum Volatility ETF | | | 28,340 | | |
US 500 Enhanced Volatility Wtd ETF | | | 123,230 | | |
US EQ Income Enhanced Volatility Wtd ETF | | | 110,800 | | |
US Discovery Enhanced Volatility Wtd ETF | | | 7,911 | | |
Developed Enhanced Volatility Wtd ETF | | | 8,325 | | |
Nasdaq Next 50 ETF | | | 10,870 | | |
Top Veteran Employers ETF | | | 158 | | |
Protect America ETF | | | 160 | | |
Certain officers and/or interested trustees of the Funds are also officers of the Advisor and /or employees of the Adviser, Administrator, Fund Accountant, Sub-Administrator, Sub-Fund Accountant, Custodian Distributor, and Legal Counsel.
5. Risks:
Each Fund may be subject to other risks in addition to these identified risks.
Equity Risk — An investment in the Funds' Shares represents an indirect investment in the securities owned by the Funds, some of which will be traded on a national securities exchange or in the over-the-counter markets. The value of the securities in which the Funds invest, like other market investments, may move up or down, sometimes rapidly and unpredictably. The value of the securities in which the Funds invest may affect the value of the Funds' Shares. An investment in the Funds' Shares at any point in time may be worth less than the original investment, even after taking into account the reinvestment of the Funds' distributions.
Foreign Securities Risk — The Developed Enhanced Volatility Wtd ETF, International Volatility Wtd ETF, Emerging Market Volatility Wtd ETF, International High Div Volatility Wtd ETF and Emerging Market High Div Volatility Wtd ETF invest in securities of foreign issuers in various countries. Investing on an international basis involves certain risks not involved in domestic investments including the risk of nationalization or expropriation of assets, imposition of currency exchange controls or restrictions on the repatriation of foreign currency, confiscatory taxation, political or financial instability and
198
Victory Portfolios II | | Notes to Financial Statements — continued
December 31, 2020 | |
(Unaudited)
diplomatic developments, which could affect the value of a Fund's investments in certain foreign countries. Governments of many countries have exercised and continue to exercise substantial influence over many aspects of the private sector through the ownership or control of many companies, including some of the largest in these countries. As a result, government actions in the future could have a significant effect on economic conditions which may adversely affect prices of certain portfolio securities. There is also generally less government supervision and regulation of stock exchanges, brokers and listed companies than in the U.S. Dividends or interest on, or proceeds from the sale of, foreign securities may be subject to foreign withholding taxes, and special U.S. tax considerations may apply. Moreover, foreign economies may differ favorably or unfavorably from the U.S. economy in such respects as growth of gross national product, rate of inflation, capital re-investment, resource self-sufficiency and balance of payments position. The Schedule of Portfolio Investments includes information on each Fund's holdings, including industry and/or geographic composition, as relevant.
Passive Investment Risk — Each Fund is designed to track its index and is not actively managed. A Fund will not buy or sell shares of an equity security due to current or projected performance of a security, industry or sector, unless that security is added to or removed, respectively, from its index. A Fund does not, therefore, seek returns in excess of its index, and does not attempt to take defensive positions or hedge against potential risks unless such defensive positions are also taken by its index. Different types of investment styles, for example passively managed or actively managed, or growth or value, tend to perform differently and shift into and out of favor with investors depending on changes in market and economic sentiment and conditions. As a result, a Fund's performance may at times be worse than the performance of other mutual funds that invest more broadly or that have different investment styles.
Geopolitical/Natural Disaster Risk — An outbreak of disease called COVID-19 has spread internationally. The transmission of COVID-19 and efforts to contain its spread have resulted in international, national and local border closings and other significant travel restrictions and disruptions, significant disruptions to business operations, supply chains and consumer activity, significant challenges in healthcare service preparation and delivery, quarantines and general concern and uncertainty. These negative impacts have caused significant volatility and declines in global financial markets, which have caused losses for Fund investors during and subsequent to period end. The impact of the COVID-19 pandemic may last for an extended period of time, and could result in a substantial economic downturn or recession. Public health crises may exacerbate other pre-existing political, social, economic, market and financial risks. The extent of the impact to the financial performance of the Fund's investments will depend on future developments, including (i) the duration and spread of the outbreak, (ii) the restrictions and advisories, (iii) the effects on the financial markets, and (iv) the effects on the economy overall, all of which are highly uncertain and cannot be predicted.
6. Borrowing:
Line of Credit:
For the six months ended December 31, 2020, the Victory Funds Complex and the USAA Mutual Funds Complex (another series of mutual funds managed by the Adviser) participated in a short-term demand note "Line of Credit" with Citibank. The Line of Credit agreement with Citibank was renewed on June 29, 2020, with a termination date of June 28, 2021. Under the agreement with Citibank, the Victory Funds Complex and USAA Mutual Funds Complex, combined, may borrow up to $600 million, of which $300 million is committed and $300 million is uncommitted. $40 million of the Line of Credit is reserved for use by the Victory Floating Rate Fund (herein, the "Fund"), another series of the Victory Funds Complex, with that Fund paying the related commitment fees for that amount. The purpose of the agreement is to meet temporary or emergency cash needs. For the six months ended December 31, 2020, Citibank received an annual commitment fee of 0.15% on $300 million for providing the Line of Credit. Each fund in the Victory Funds Complex pays a pro-rata portion of the commitment fees plus any interest (one month LIBOR plus one percent) on amounts borrowed. Effective June 29, 2020, under an amended Line of Credit agreement, Citibank will also receive an annual upfront fee of 0.10% on the $300 million committed line of credit. Each fund in the Victory Funds Complex will pay a pro-rata portion of the upfront fee. Interest charged to each Fund during the period, if applicable, is presented on the Statements of Operations under Line of credit fees.
199
Victory Portfolios II | | Notes to Financial Statements — continued
December 31, 2020 | |
(Unaudited)
The average loans under the line of credit agreement with Citibank for the days outstanding and average interest rate for each Fund during the six months ended December 31, 2020, were as follows:
| | | Amount
Outstanding at
December 31, 2020 | | Average
Borrowings* | | Days
Outstanding | | Average
Rate* | | Maximum
Borrowing
During the
Period | |
Emerging Market Volatility
Wtd ETF | | $ | — | | | $ | 4,400,000 | | | | 2 | | | | 1.22 | % | | $ | 6,200,000 | | |
Emerging Market High Div
Volatility Wtd ETF | | | — | | | | 4,600,000 | | | | 1 | | | | 1.23 | % | | | 4,600,000 | | |
* For the six months ended December 31, 2020, based on the number of days borrowings were outstanding.
7. Federal Income Tax Information:
Dividends from net investment income, if any, are declared and paid monthly for the Funds. Distributable net realized gains, if any, are declared and distributed at least annually from each Fund.
The amounts of dividends from net investment income and distributions from net realized gains (collectively, distributions to shareholders) are determined in accordance with federal income tax regulations, which may differ from GAAP. To the extent these "book/tax" differences are permanent in nature (e.g., net operating loss and distribution reclassification), such amounts are reclassified within the components of net assets based on their federal tax-basis treatment; temporary differences (e.g., wash sales) do not require reclassification. To the extent dividends and distributions exceed net investment income and net realized gains for tax purposes, they are reported as distributions of capital. Net investment losses incurred by a Fund may be reclassified as an offset to capital on the accompanying Statements of Assets and Liabilities.
The tax character of current year distributions paid and the tax basis of the current components of accumulated earnings (deficit) will be determined at the end of the current tax year ending June 30, 2021.
As of the most current tax year ended June 30, 2020, the following Funds had net capital loss carryforwards as summarized in the tables below.
| | | Short-Term
Amount | | Long-Term
Amount | | Total | |
US 500 Volatility Wtd ETF | | $ | 32,958,055 | | | $ | 25,479,268 | | | $ | 58,437,323 | | |
US Small Cap Volatility Wtd ETF | | | 4,443,491 | | | | 3,158,135 | | | | 7,601,626 | | |
International Volatility Wtd ETF | | | 4,186,566 | | | | 2,407,692 | | | | 6,594,258 | | |
Emerging Market Volatility Wtd ETF | | | 2,791,319 | | | | 1,277,516 | | | | 4,068,835 | | |
US Large Cap High Div Volatility Wtd ETF | | | 22,487,331 | | | | 16,942,183 | | | | 39,429,514 | | |
US Small Cap High Div Volatility Wtd ETF | | | 16,058,099 | | | | 4,666,454 | | | | 20,724,553 | | |
International High Div Volatility Wtd ETF | | | 8,712,930 | | | | 4,358,658 | | | | 13,071,588 | | |
Emerging Market High Div Volatility Wtd ETF | | | 2,831,466 | | | | 2,033,753 | | | | 4,865,219 | | |
Dividend Accelerator ETF | | | 8,938,322 | | | | 91,497 | | | | 9,029,819 | | |
US Multi-Factor Minimum Volatility ETF | | | 10,848,711 | | | | 210,780 | | | | 11,059,491 | | |
US 500 Enhanced Volatility Wtd ETF | | | 38,875,453 | | | | 14,497,655 | | | | 53,373,108 | | |
US EQ Income Enhanced Volatility Wtd ETF | | | 32,133,200 | | | | 30,604,876 | | | | 62,738,076 | | |
US Discovery Enhanced Volatility Wtd ETF | | | 30,433,081 | | | | 2,335,068 | | | | 32,768,149 | | |
Developed Enhanced Volatility Wtd ETF | | | 16,934,183 | | | | 9,592,148 | | | | 26,526,331 | | |
200
Victory Portfolios II | | Notes to Financial Statements — continued
December 31, 2020 | |
(Unaudited)
8. Affiliated Securities:
An affiliated security is a security in which the Fund has ownership of at least 5% of the security's outstanding voting shares, an investment company managed by VCM or an issuer under common control with a Fund under VCM. The Fund does not invest in affiliated securities for the purpose of exercising management or control. These securities are noted as affiliated on the Fund's Schedule of Portfolio Investments. Transactions in affiliated securities during the six months ended December 31, 2020, were as follows:
US Small Cap
Volatility Wtd ETF | | Fair Value
6/30/20 | | Purchases
at Cost | | Proceeds
from
Sales | | Realized
Gains
(Losses) | | Capital
Gain
Distribution | | Net
Change in
Unrealized
Appreciation/
Depreciation | | Fair Value
12/31/20 | | Dividend
Income | |
Victory Capital
Holdings, Inc. | | $ | 27,676 | | | $ | 10,752 | | | $ | — | | | $ | — | | | $ | — | | | $ | 17,519 | | | $ | 55,947 | | | $ | 254 | | |
US Discovery Enhanced
Volatility Wtd ETF | | Fair Value
6/30/20 | | Purchases
at Cost | | Proceeds
from
Sales | | Realized
Gains
(Losses) | | Capital
Gain
Distribution | | Net
Change in
Unrealized
Appreciation/
Depreciation | | Fair Value
12/31/20 | | Dividend
Income | |
Victory Capital
Holdings, Inc. | | $ | 50,212 | | | $ | 48,192 | | | $ | (10,381 | ) | | $ | 2,586 | | | $ | — | | | $ | 33,491 | | | $ | 124,100 | | | $ | 535 | | |
201
Victory Portfolios II | | Supplemental Information
December 31, 2020 | |
(Unaudited)
Proxy Voting and Portfolio Holdings Information
Proxy Voting:
Information regarding the policies and procedures each Fund uses to determine how to vote proxies relating to portfolio securities is available without charge, upon request, by calling 800-539-3863. The information is also included in the Funds' Statement of Additional Information, which is available on the SEC's website at www.sec.gov.
Information relating to how the Funds voted proxies relating to portfolio securities held during the most recent twelve months ended June 30 is available on the SEC's website at www.sec.gov.
Availability of Schedules of Portfolio Investments:
The Trust files a complete list of Schedules of Portfolio Investments with the SEC for the first and third quarter of each fiscal year on Form N-PORT. Forms N-PORT are available on the SEC's web site at www.sec.gov.
Expense Examples
As a shareholder of the Funds, you may incur two types of costs: (1) transaction costs and (2) ongoing costs, including management fees, and other Fund expenses. These examples are intended to help you understand your ongoing costs (in dollars) of investing in the Funds and to compare these costs with the ongoing costs of investing in other mutual funds.
These examples are based on an investment of $1,000 invested at the beginning of the period and held for the entire period from July 1, 2020, through December 31, 2020.
The Actual Expense figures in the table below provide information about actual account values and actual expenses. You may use the information below, together with the amount you invested, to estimate the expenses that you paid over the period. Simply divide your account value by $1,000 (for example, an $8,600 account value divided by $1,000 = 8.6), then multiply the result by the number in the table under the heading entitled "Actual Expenses Paid During Period" to estimate the expenses you paid on your account during this period.
The Hypothetical Expense figures in the table below provide information about hypothetical account values and hypothetical expenses based on each Fund's actual expense ratio and an assumed rate of return of 5% per year before expenses, which is not the Fund's actual return. The hypothetical account values and expenses may not be used to estimate the actual ending account balance or expenses you paid for the period. You may use this information to compare this 5% hypothetical example with the 5% hypothetical examples that appear in shareholder reports of other funds.
Please note the expenses shown in the table are meant to highlight your ongoing costs only and do not reflect any transactional costs. Therefore, the table is useful in comparing ongoing costs only, and will not help you determine the relative total costs of owning different funds. In addition, if these transactional costs were included, your costs would have been higher.
| | | Beginning
Account
Value
7/1/20 | | Actual
Ending
Account
Value
12/31/20 | | Hypothetical
Ending
Account
Value
12/31/20 | | Actual
Expenses
Paid
During
Period
7/1/20-
12/31/20* | | Hypothetical
Expenses
Paid
During
Period
7/1/20-
12/31/20* | | Annualized
Expense
Ratio
During
Period
7/1/20-
12/31/20 | |
US 500 Volatility
Wtd ETF | | $ | 1,000.00 | | | $ | 1,241.00 | | | $ | 1,023.44 | | | $ | 1.98 | | | $ | 1.79 | | | | 0.35 | % | |
US Small Cap Volatility
Wtd ETF | | | 1,000.00 | | | | 1,351.20 | | | | 1,023.44 | | | | 2.07 | | | | 1.79 | | | | 0.35 | % | |
International Volatility
Wtd ETF | | | 1,000.00 | | | | 1,211.60 | | | | 1,022.94 | | | | 2.51 | | | | 2.29 | | | | 0.45 | % | |
Emerging Market
Volatility Wtd ETF | | | 1,000.00 | | | | 1,222.20 | | | | 1,022.68 | | | | 2.80 | | | | 2.55 | | | | 0.50 | % | |
US Large Cap High Div
Volatility Wtd ETF | | | 1,000.00 | | | | 1,217.30 | | | | 1,023.44 | | | | 1.96 | | | | 1.79 | | | | 0.35 | % | |
202
Victory Portfolios II | | Supplemental Information — continued
December 31, 2020 | |
(Unaudited)
| | | Beginning
Account
Value
7/1/20 | | Actual
Ending
Account
Value
12/31/20 | | Hypothetical
Ending
Account
Value
12/31/20 | | Actual
Expenses
Paid
During
Period
7/1/20-
12/31/20* | | Hypothetical
Expenses
Paid
During
Period
7/1/20-
12/31/20* | | Annualized
Expense
Ratio
During
Period
7/1/20-
12/31/20 | |
US Small Cap High Div
Volatility Wtd ETF | | $ | 1,000.00 | | | $ | 1,391.30 | | | $ | 1,023.44 | | | $ | 2.11 | | | $ | 1.79 | | | | 0.35 | % | |
International High Div
Volatility Wtd ETF | | | 1,000.00 | | | | 1,206.80 | | | | 1,022.94 | | | | 2.50 | | | | 2.29 | | | | 0.45 | % | |
Emerging Market High Div
Volatility Wtd ETF | | | 1,000.00 | | | | 1,159.70 | | | | 1,022.68 | | | | 2.72 | | | | 2.55 | | | | 0.50 | % | |
Dividend Accelerator
ETF | | | 1,000.00 | | | | 1,209.90 | | | | 1,023.44 | | | | 1.95 | | | | 1.79 | | | | 0.35 | % | |
US Multi-Factor Minimum
Volatility ETF | | | 1,000.00 | | | | 1,119.40 | | | | 1,023.44 | | | | 1.87 | | | | 1.79 | | | | 0.35 | % | |
US 500 Enhanced
Volatility Wtd ETF | | | 1,000.00 | | | | 1,208.60 | | | | 1,023.44 | | | | 1.95 | | | | 1.79 | | | | 0.35 | % | |
US EQ Income Enhanced
Volatility Wtd ETF | | | 1,000.00 | | | | 1,172.70 | | | | 1,023.44 | | | | 1.92 | | | | 1.79 | | | | 0.35 | % | |
US Discovery Enhanced
Volatility Wtd ETF | | | 1,000.00 | | | | 1,292.30 | | | | 1,023.44 | | | | 2.02 | | | | 1.79 | | | | 0.35 | % | |
Developed Enhanced
Volatility Wtd ETF | | | 1,000.00 | | | | 1,185.40 | | | | 1,022.94 | | | | 2.48 | | | | 2.29 | | | | 0.45 | % | |
Nasdaq Next 50 ETF** | | | 1,000.00 | | | | 1,245.50 | | | | 1,024.30 | | | | 0.63 | | | | 0.92 | | | | 0.18 | % | |
Top Veteran
Employers ETF*** | | | 1,000.00 | | | | 1,111.40 | | | | 1,022.18 | | | | 1.01 | | | | 3.06 | | | | 0.60 | % | |
Protect America
ETF**** | | | 1,000.00 | | | | 1,130.80 | | | | 1,022.18 | | | | 1.00 | | | | 3.06 | | | | 0.60 | % | |
* Expenses are equal to the average account value multiplied by the Fund's annualized expense ratio multiplied by 184/365 (the number of days in the most recent fiscal half-year divided by the number of days in the fiscal year).
** Actual Expenses Paid are equal to the average account value multiplied by the Fund's annualized expense ratio multiplied by 113/365 to reflect the stub period from commencement of operations September 9, 2020, through December 31, 2020.
*** Actual Expenses Paid are equal to the average account value multiplied by the Fund's annualized expense ratio multiplied by 58/365 to reflect the stub period from commencement of operations November 3, 2020, through December 31, 2020.
**** Actual Expenses Paid are equal to the average account value multiplied by the Fund's annualized expense ratio multiplied by 57/365 to reflect the stub period from commencement of operations November 4, 2020, through December 31, 2020.
203
Victory Portfolios II | | Supplemental Information — continued
December 31, 2020 | |
(Unaudited)
Considerations of the Board in Continuing the Investment Advisory Agreement (the "Agreement")
The Board approved the Agreement on behalf of each of the Funds at a meeting, which was called for that purpose, on December 2, 2020. The Board also considered information relating to the Funds and the Agreement provided throughout the year and, more specifically, at a meeting on October 27, 2020 called for the purpose of reviewing the Agreement. In considering whether to approve the Agreement, the Board requested, and the Adviser provided, information that the Board believed to be reasonably necessary to reach its conclusions.
The Board, including the Independent Trustees, evaluated this information along with other information obtained throughout the year and was advised by legal counsel to the Funds, which also serves as independent legal counsel to the Independent Trustees. In addition, the Independent Trustees considered a past review of their overall process for conducting the annual review of the Funds' advisory arrangements by an independent consultant retained through their counsel.
The Board took into consideration regular reports from the Adviser throughout the COVID-19 pandemic public health crisis concerning how the ongoing pandemic has affected market volatility, investment risk and the implementation and effectiveness of business continuity plans. These reports also had confirmed that the pandemic had no material impact on the Adviser's operations.
The Board considered each Fund's advisory fee, expense ratio and investment performance as significant factors in determining whether the Agreement should be continued. In considering whether the compensation paid to the Adviser was fair and reasonable, the Board also evaluated, among other things, the following factors:
• The requirements of the Funds for the services provided by the Adviser;
• The nature, quality and extent of the services provided and expected to be provided;
• The performance of the Funds as compared to comparable funds;
• The fees payable for the services and whether the fee arrangements provided for economies of scale that would benefit Fund shareholders as the Funds grow;
• Whether the fee would be sufficient to enable the Adviser to attract and retain experienced personnel and continue to provide quality services to the Funds;
• Fees paid by other clients of the Adviser whose accounts are managed in a similar investment style and any differences in the services provided to the other clients compared to those provided to the Funds;
• Total expenses of each Fund;
• Management's commitment to operating the Funds at competitive expense levels;
• The profitability of the Adviser (as reflected by comparing fees earned against an estimate of the Adviser's costs) with respect to the Adviser's relationship with the Funds;
• Research and other service benefits received by the Adviser obtained through payment of client commissions for securities transactions;
• Other benefits received by the Adviser, and its affiliates, including revenues paid to the Adviser, or its affiliates, by the Funds for administration and fund accounting services, and distribution;
• The capabilities and financial condition of the Adviser;
• Current economic and industry trends; and
• The historical relationship between each Fund and the Adviser.
The Board reviewed each Fund's current management fee in the context of the Adviser's profitability with respect to each Fund. In addition, the Board compared each Fund's gross management fee and total expense ratio on a net and gross basis with the median gross management fee and median expense ratio of a universe of comparable exchange-traded funds ("ETFs") compiled by an independent consultant and a peer group of funds with similar investment strategies selected by that independent consultant from the universe. The Board reviewed the factors and methodology used by the independent consultant in the selection of each Fund's peer group, including the independent consultant's selection of a broad universe of funds, the more specific universe of comparable funds, and peer groups of funds with comparable investment strategies and asset levels, among
204
Victory Portfolios II | | Supplemental Information — continued
December 31, 2020 | |
(Unaudited)
other factors. The Board also reviewed any changes to the independent consultant's methodology as compared to the prior year, including those resulting from the Adviser's input, if any.
The Board also reviewed the fee of a comparable mutual fund managed by the Adviser that is comparable to the VictoryShares US 500 Enhanced Volatility Wtd ETF and the differences in the services provided to the mutual fund. The Board noted that none of the advisory fee arrangements for the Funds included breakpoints, which are generally viewed as a method by which an investment adviser shares any economies of scale with a fund as a fund grows. The Board also considered the Adviser's commitment to limit expenses as discussed in more detail below, and would consider breakpoints at a future time if a Fund's assets were to grow significantly.
The Board also reviewed the compliance and administrative services provided to the Funds by the Adviser and its affiliates, including the Adviser's oversight of the Funds' day-to-day operations and oversight of Fund accounting, assistance in meeting legal and regulatory requirements, and other services necessary for the operation of the Funds and the Trust.
The Board found that the gross annual management fee paid by each Fund was within the range of management fees paid by each Fund's respective peer group. The Board also found that each Fund's net annual expense ratio was reasonable as compared with each Fund's respective peer group. The Board considered the Adviser's contractual agreement with each Fund to waive its fees and reimburse expenses for a specified period of time, as described in the Fund's prospectus.
The Board reviewed each Fund's performance over one- and three-year periods against the performance of the Fund's selected peer group and benchmark index, noting that each Fund's investment objective is to track its proprietary benchmark index before fees and expenses. The Board noted that each Fund's investment objective is to track a custom index. The Board recognized that the performance of each Fund is net of expenses, while the performance of each benchmark index reflects gross returns, and as a result, each Fund will generally underperform its benchmark index due to fees and expenses. The Board also considered each Fund's tracking error as a factor in evaluating performance.
The Board reviewed various other specific factors with respect to each Fund, as described below. In their deliberations, the Trustees did not rank the importance of any particular information or factor considered and each Trustee may have attributed different weights to various factors.
VictoryShares US 500 Volatility Wtd ETF
Noting that the Fund commenced operations in 2014, the Board compared the Fund's one-, three- and five-year performance for the periods ended June 30, 2020, to that of the median performance of the Fund's peer group and benchmark index for the same periods and considered the fact that the Fund underperformed the benchmark index for all of the periods reviewed, and outperformed the peer group median for all of the periods reviewed, with the exception of the one-year period. The Board noted the Fund's tracking error for the periods relative to its peers.
Having considered, among other things: (1) the Fund's management fee compared to comparable ETFs; (2) the Fund's total expense ratio compared to comparable ETFs; (3) that the Adviser's willingness to limit the expenses for a period of time would provide stability to the Fund's expenses during that period; and (4) that the Fund's performance in relation to its benchmark index and peer group was within an acceptable range, the Board concluded that the Agreement continued to be in the best interests of the Fund's shareholders.
VictoryShares US Small Cap Volatility Wtd ETF
Noting that the Fund commenced operations in 2015, the Board compared the Fund's one- and three-year performance for the periods ended June 30, 2020, to that of the median performance of the Fund's peer group and benchmark index for the same periods and considered the fact that the Fund underperformed the benchmark index for both of the periods reviewed, underperformed the peer group median for the three-year period, and matched the peer group median for the one-year period. The Board noted the Fund's tracking error for the periods relative to its peers.
Having considered, among other things: (1) the Fund's management fee compared to comparable ETFs; (2) the Fund's total expense ratio compared to comparable ETFs; (3) that the Adviser's willingness to limit the expenses
205
Victory Portfolios II | | Supplemental Information — continued
December 31, 2020 | |
(Unaudited)
for a period of time would provide stability to the Fund's expenses during that period; and (4) that the Fund's performance in relation to its benchmark index and peer group was within an acceptable range, the Board concluded that the Agreement continued to be in the best interests of the Fund's shareholders.
VictoryShares International Volatility Wtd ETF
Noting that the Fund commenced operations in 2015, the Board compared the Fund's one- and three-year performance for the periods ended June 30, 2020, to that of the median performance of the Fund's peer group and benchmark index for the same periods and considered the fact that the Fund underperformed the benchmark index for both of the periods reviewed, outperformed the peer group median for the three-year period, and underperformed the peer group median for the one-year period. The Board noted the Fund's tracking error for the periods relative to its peers.
Having considered, among other things: (1) the Fund's management fee compared to comparable ETFs; (2) the Fund's total expense ratio compared to comparable ETFs; (3) that the Adviser's willingness to limit the expenses for a period of time would provide stability to the Fund's expenses during that period; and (4) that the Fund's performance in relation to its benchmark index and peer group was within an acceptable range, the Board concluded that the Agreement continued to be in the best interests of the Fund's shareholders.
VictoryShares Emerging Market Volatility Wtd ETF
Noting that the Fund commenced operations in 2016, the Board compared the Fund's one- and three-year performance for the periods ended June 30, 2020, to that of the median performance of the Fund's peer group and benchmark index for the same periods and considered the fact that the Fund underperformed the benchmark index for both of the periods reviewed, outperformed the peer group median for the one-year period, and underperformed the peer group median for the three-year period. The Board noted the Fund's tracking error for the periods relative to its peers.
Having considered, among other things: (1) the Fund's management fee compared to comparable ETFs; (2) the Fund's total expense ratio compared to comparable ETFs; (3) that the Adviser's willingness to limit the expenses for a period of time would provide stability to the Fund's expenses during that period; and (4) that the Fund's performance in relation to its benchmark index and peer group was within an acceptable range, the Board concluded that the Agreement continued to be in the best interests of the Fund's shareholders.
VictoryShares US Large Cap High Div Volatility Wtd ETF
Noting that the Fund commenced operations in 2015, the Board compared the Fund's one- and three-year performance for the periods ended June 30, 2020, to that of the median performance of the Fund's peer group and benchmark index for the same periods and considered the fact that the Fund underperformed both the benchmark index and the peer group median for both of the periods reviewed. The Board noted the Fund's tracking error for the periods relative to its peers.
Having considered, among other things: (1) the Fund's management fee compared to comparable ETFs; (2) the Fund's total expense ratio compared to comparable ETFs; (3) that the Adviser's willingness to limit the expenses for a period of time would provide stability to the Fund's expenses during that period; and (4) that the Fund's performance in relation to its benchmark index and peer group was within an acceptable range, the Board concluded that the Agreement continued to be in the best interests of the Fund's shareholders.
VictoryShares US Small Cap High Div Volatility Wtd ETF
Noting that the Fund commenced operations in 2015, the Board compared the Fund's one- and three-year performance for the periods ended June 30, 2020, to that of the median performance of the Fund's peer group and benchmark index for the same periods and considered the fact that the Fund underperformed the benchmark index for both of the periods reviewed, and outperformed the peer group median for both of the periods reviewed. The Board noted the Fund's tracking error for the periods relative to its peers.
Having considered, among other things: (1) the Fund's management fee compared to comparable ETFs; (2) the Fund's total expense ratio compared to comparable ETFs; (3) that the Adviser's willingness to limit the expenses for a period of time would provide stability to the Fund's expenses during that period; and (4) that the Fund's
206
Victory Portfolios II | | Supplemental Information — continued
December 31, 2020 | |
(Unaudited)
performance in relation to its benchmark index and peer group was within an acceptable range, the Board concluded that the Agreement continued to be in the best interests of the Fund's shareholders.
VictoryShares International High Div Volatility Wtd ETF
Noting that the Fund commenced operations in 2015, the Board compared the Fund's one- and three-year performance for the periods ended June 30, 2020, to that of the median performance of the Fund's peer group and benchmark index for the same periods and considered the fact that the Fund underperformed both the benchmark index and the peer group median for both of the periods reviewed. The Board noted the Fund's tracking error for the periods relative to its peers.
Having considered, among other things: (1) the Fund's management fee compared to comparable ETFs; (2) the Fund's total expense ratio compared to comparable ETFs; (3) that the Adviser's willingness to limit the expenses for a period of time would provide stability to the Fund's expenses during that period; and (4) that the Fund's performance in relation to its benchmark index and peer group was within an acceptable range, the Board concluded that the Agreement continued to be in the best interests of the Fund's shareholders.
VictoryShares Emerging Market High Div Volatility Wtd ETF
Noting that the Fund commenced operations in 2017, the Board compared the Fund's one-year performance for the period ended June 30, 2020, to that of the median performance of the Fund's peer group and benchmark index for the same period and considered the fact that the Fund underperformed both the benchmark index and the peer group median. The Board noted the Fund's tracking error for the period relative to its peers.
Having considered, among other things: (1) the Fund's management fee compared to comparable ETFs; (2) the Fund's total expense ratio compared to comparable ETFs; (3) that the Adviser's willingness to limit the expenses for a period of time would provide stability to the Fund's expenses during that period; and (4) that the Fund's performance in relation to its benchmark index and peer group was within an acceptable range, the Board concluded that the Agreement continued to be in the best interests of the Fund's shareholders.
VictoryShares Dividend Accelerator ETF
Noting that the Fund commenced operations in 2017, the Board compared the Fund's one- and three-year performance for the periods ended June 30, 2020, to that of the median performance of the Fund's peer group and benchmark index for the same periods and considered the fact that the Fund underperformed the benchmark index for both of the periods reviewed, and outperformed the peer group median for both of the periods reviewed. The Board noted the Fund's tracking error for the period relative to its peers.
Having considered, among other things: (1) the Fund's management fee compared to comparable ETFs; (2) the Fund's total expense ratio compared to comparable ETFs; (3) that the Adviser's willingness to limit the expenses for a period of time would provide stability to the Fund's expenses during that period; and (4) that the Fund's performance in relation to its benchmark index and peer group was within an acceptable range, the Board concluded that the Agreement continued to be in the best interests of the Fund's shareholders.
VictoryShares US Multi-Factor Minimum Volatility ETF
Noting that the Fund commenced operations in 2017, the Board compared the Fund's one- and three-year performance for the periods ended June 30, 2020, to that of the median performance of the Fund's peer group and benchmark index for the same periods and considered the fact that the Fund underperformed the benchmark index for both of the periods reviewed, and outperformed the peer group median for both of the periods reviewed. The Board noted the Fund's tracking error for the period relative to its peers.
Having considered, among other things: (1) the Fund's management fee compared to comparable ETFs; (2) the Fund's total expense ratio compared to comparable ETFs; (3) that the Adviser's willingness to limit the expenses for a period of time would provide stability to the Fund's expenses during that period; and (4) that the Fund's performance in relation to its benchmark index and peer group was within an acceptable range, the Board concluded that the Agreement continued to be in the best interests of the Fund's shareholders.
207
Victory Portfolios II | | Supplemental Information — continued
December 31, 2020 | |
(Unaudited)
VictoryShares US 500 Enhanced Volatility Wtd ETF
Noting that the Fund commenced operations in 2014, the Board compared the Fund's one-, three- and five-year performance for the periods ended June 30, 2020, to that of the median performance of the Fund's peer group and benchmark index for the same periods and considered the fact that the Fund underperformed the benchmark index for all of the periods reviewed, outperformed the peer group median for the one-year period, underperformed the peer group median for the three-year period, and matched the peer group median for the five-year period. The Board noted the Fund's tracking error for the periods relative to its peers, and discussed with the Adviser the Fund's rules-based rebalancing in light of market conditions and that the Fund performed in accordance with the Adviser's expectations.
Having considered, among other things: (1) the Fund's management fee compared to comparable ETFs; (2) the Fund's total expense ratio compared to comparable ETFs; (3) that the Adviser's willingness to limit the expenses for a period of time would provide stability to the Fund's expenses during that period; and (4) that the Fund's performance in relation to its benchmark index and peer group was within an acceptable range, the Board concluded that the Agreement continued to be in the best interests of the Fund's shareholders.
VictoryShares US EQ Income Enhanced Volatility Wtd ETF
Noting that the Fund commenced operations in 2014, the Board compared the Fund's one-, three- and five-year performance for the periods ended June 30, 2020, to that of the median performance of the Fund's peer group and benchmark index for the same periods and considered the fact that the Fund underperformed the benchmark index for all of the periods reviewed, and outperformed the peer group median for all of the periods reviewed. The Board noted the Fund's tracking error for the periods relative to its peers, and discussed with the Adviser the Fund's rules-based rebalancing in light of market conditions and that the Fund performed in accordance with the Adviser's expectations.
Having considered, among other things: (1) the Fund's management fee compared to comparable ETFs; (2) the Fund's total expense ratio compared to comparable ETFs; (3) that the Adviser's willingness to limit the expenses for a period of time would provide stability to the Fund's expenses during that period; and (4) that the Fund's performance in relation to its benchmark index and peer group was within an acceptable range, the Board concluded that the Agreement continued to be in the best interests of the Fund's shareholders.
VictoryShares US Discovery Enhanced Volatility Wtd ETF
Noting that the Fund commenced operations in 2014, the Board compared the Fund's one-, three- and five-year performance for the periods ended June 30, 2020, to that of the median performance of the Fund's peer group and benchmark index for the same periods and considered the fact that the Fund underperformed the benchmark index for all of the periods reviewed, and underperformed the peer group median for all of the periods reviewed, with the exception of the one-year period. The Board noted the Fund's tracking error for the periods relative to its peers, and discussed with the Adviser the Fund's rules-based rebalancing in light of market conditions and that the Fund performed in accordance with the Adviser's expectations.
Having considered, among other things: (1) the Fund's management fee compared to comparable ETFs; (2) the Fund's total expense ratio compared to comparable ETFs; (3) that the Adviser's willingness to limit the expenses for a period of time would provide stability to the Fund's expenses during that period; and (4) that the Fund's performance in relation to its benchmark index and peer group was within an acceptable range, the Board concluded that the Agreement continued to be in the best interests of the Fund's shareholders.
VictoryShares Developed Enhanced Volatility Wtd ETF
Noting that the Fund commenced operations in 2014, the Board compared the Fund's one-, three- and five-year performance for the periods ended June 30, 2020, to that of the median performance of the Fund's peer group and benchmark index for the same periods and considered the fact that the Fund underperformed both the benchmark index and the peer group median for all of the periods reviewed. The Board noted the Fund's tracking error for the periods relative to its peers, and discussed with the Adviser the Fund's rules-based rebalancing in light of market conditions and that the Fund performed in accordance with the Adviser's expectations.
208
Victory Portfolios II | | Supplemental Information — continued
December 31, 2020 | |
(Unaudited)
Having considered, among other things: (1) the Fund's management fee compared to comparable ETFs; (2) the Fund's total expense ratio compared to comparable ETFs; (3) that the Adviser's willingness to limit the expenses for a period of time would provide stability to the Fund's expenses during that period; and (4) that the Fund's performance in relation to its benchmark index and peer group was within an acceptable range, the Board concluded that the Agreement continued to be in the best interests of the Fund's shareholders.
Conclusion
Based on its review of the information requested and provided, and following extended discussions, the Board determined that the Agreement, on behalf of the Funds discussed above, was consistent with the best interests of each Fund and its shareholders, and the Board unanimously approved the Agreement, on behalf of each Fund, for an additional annual period on the basis of the foregoing review and discussions and the following considerations, among others:
• The fairness and reasonableness of the investment advisory fee payable to the Adviser under the Agreement in light of the investment advisory services provided, the costs of these services, the profitability of the Adviser's relationship with the Fund and the comparability of the fee paid to the fees paid by other investment companies, to the extent applicable;
• The nature, quality and extent of the investment advisory services provided by the Adviser;
• The Adviser's entrepreneurial commitment to the management of the Funds and the creation of a broad-based family of funds, which could entail a substantial commitment of the Adviser's resources to the successful operation of the Funds;
• The Adviser's representations regarding its staffing and capabilities to manage the Funds, including the retention of personnel with relevant portfolio management experience;
• The Adviser's efforts to enhance investment results by, among other things, developing quality portfolio management teams; and
• The overall high quality of the personnel, operations, financial condition, investment management capabilities, methodologies and performance of the Adviser.
Considerations of the Board in Approving the Investment Advisory Agreement (the "Agreement")
The Board approved the Agreement on behalf of the VictoryShares Nasdaq Next 50 ETF (the "Fund") at meetings, which were called for that purpose, on May 12, 2020 and August 25, 2020. In considering whether to approve the Agreement, the Board requested, and the Adviser provided, information that the Board believed to be reasonably necessary to reach its conclusions.
The Board, including the Independent Trustees, evaluated the information provided and its extensive experience with the Adviser and was advised by legal counsel to the Fund, which also serves as independent legal counsel to the Independent Trustees. The Board reviewed numerous factors with respect to the Fund. The Board recognized that management was proposing to add the Fund as an investment portfolio of the Trust and that the Fund had not yet commenced operations and thus had no performance record or historical expenses. In considering whether the compensation to be paid to the Adviser was fair and reasonable, the Board also evaluated, among other things, the following factors:
• The requirements of the Fund for the services to be provided by the Adviser;
• The nature, quality and extent of the services provided to the other exchange-traded funds in the Trust and expected to be provided to the Fund;
• The proposed fees to be paid for the services and whether the fee arrangements provide for economies of scale that would benefit Fund shareholders as the Fund grows;
• Fees paid by other clients of the Adviser whose accounts are managed in a similar investment style and any differences in the services provided to the other clients compared to those provided to the Fund;
• The estimated total expenses of the Fund;
209
Victory Portfolios II | | Supplemental Information — continued
December 31, 2020 | |
(Unaudited)
• Management's commitments to operating the Fund at a competitive expense level;
• The expected profitability of the Adviser with respect to the Adviser's relationship with the Fund;
• Research and other service benefits expected to be received by the Adviser obtained through payment of client commissions for securities transactions;
• Other benefits expected to be received by the Adviser, including revenues to be paid to affiliates of the Adviser by the Fund for administration and fund accounting services;
• The capabilities and financial condition of the Adviser;
• Current economic and industry trends; and
• The historical relationship between the Trust and the Adviser.
The Board reviewed the Fund's proposed gross management fee both in the context of the Adviser's expected profitability from the Fund and the historical costs associated with operating similar funds. The Board acknowledged that the Fund's profitability is inherently difficult to estimate in a startup phase. In addition, the Board compared the Fund's expected operating expense ratio, with the understanding that no distribution or shareholder servicing fees were being proposed to be paid at this time, and management fee with comparable exchange-traded funds in a peer group of funds with similar investment strategies. The Board considered the Adviser's commitment to competitive total operating expense ratios through its contractual agreement to waive its fees and reimburse expenses for a specified period of time, noting that this could result in substantial initial subsidies by the Adviser. The Trustees noted that no breakpoints in the advisory fee schedule for the Fund were being proposed at this time.
The Board reviewed various other factors with respect to the Fund. In their deliberations, the Trustees did not rank the importance of any particular information or factor considered and each Trustee attributed different weights to various factors.
Approval of the Agreement on Behalf of the Fund
Based on its review of the information requested and provided, and following extended discussions, the Board determined that the Agreement, on behalf of the Fund, was consistent with the best interests of the Fund and its future shareholders, and the Board unanimously approved the Agreement, on behalf of the Fund, for an initial two year period on the basis of the foregoing review and discussions and the following considerations, among others:
• The fairness and reasonableness of the investment advisory fee to be paid to the Adviser under the Agreement in light of the investment advisory services to be provided, the costs of these services, the expected profitability of the Adviser's relationship with the Fund and the comparability of the fee to be paid to the fees paid by other investment companies;
• The nature, quality and extent of the investment advisory services to be provided by Adviser;
• The Adviser's entrepreneurial commitment to the management of the Fund and its inclusion in a broad-based family of funds, which could entail a substantial commitment of the Adviser's resources to the successful operation of the Fund;
• The Adviser's representations regarding its staffing and capabilities to manage the Fund, including the retention of personnel with relevant portfolio management experience;
• The Adviser's efforts to enhance investment results by, among other things, developing quality portfolio management teams; and
• The overall high quality of the personnel, operations, financial condition, investment management capabilities, methodologies and performance of the Adviser.
Considerations of the Board in Approving the Investment Advisory Agreements (the "Agreement")
The Board approved the Agreement on behalf of each of the VictoryShares Top Veteran Employers ETF and VictoryShares Protect America ETF (the "Funds") at a meeting, which was called for that purpose, on June 18,
210
Victory Portfolios II | | Supplemental Information — continued
December 31, 2020 | |
(Unaudited)
2020. In considering whether to approve the Agreement, the Board requested, and the Adviser provided, information that the Board believed to be reasonably necessary to reach its conclusions.
The Board, including the Independent Trustees, evaluated the information provided and its extensive experience with the Adviser and was advised by legal counsel to the Funds, which also serves as independent legal counsel to the Independent Trustees. The Board reviewed numerous factors with respect to the Funds. The Board recognized that management was proposing to add the Funds as investment portfolios of the Trust and that the Funds had not yet commenced operations and thus had no performance record or historical expenses. In considering whether the compensation to be paid to the Adviser was fair and reasonable, the Board also evaluated, among other things, the following factors:
• The requirements of the Funds for the services to be provided by the Adviser;
• The nature, quality and extent of the services provided to the other exchange-traded funds in the Trust and expected to be provided to the Funds;
• The proposed fees to be paid for the services and whether the fee arrangements provide for economies of scale that would benefit shareholders as the Funds grow;
• Fees paid by other clients of the Adviser whose accounts are managed in a similar investment style and any differences in the services provided to the other clients compared to those provided to the Funds;
• The estimated total expenses of the Funds;
• Management's commitments to operating the Funds at competitive expense levels;
• The expected profitability of the Adviser with respect to the Adviser's relationship with the Funds;
• Research and other service benefits expected to be received by the Adviser obtained through payment of client commissions for securities transactions;
• Other benefits expected to be received by the Adviser, including revenues to be paid to affiliates of the Adviser by the Funds for administration and fund accounting services;
• The capabilities and financial condition of the Adviser;
• Current economic and industry trends; and
• The historical relationship between the Trust and the Adviser.
The Board reviewed the Funds' proposed gross management fee both in the context of the Adviser's expected profitability from the Funds and the historical costs associated with operating similar funds. The Board acknowledged that each Fund's profitability is inherently difficult to estimate in a startup phase. In addition, the Board compared the Funds' expected operating expense ratio, with the understanding that no distribution or shareholder servicing fees were being proposed to be paid at this time, and management fee with comparable exchange-traded funds in a peer group of funds with similar investment strategies. The Board considered the Adviser's commitment to competitive total operating expense ratios through its contractual agreement to waive its fees and reimburse expenses for a specified period of time, noting that this could result in substantial initial subsidies by the Adviser. The Trustees noted that no breakpoints in the advisory fee schedule for the Funds were being proposed at this time.
The Board reviewed various other factors with respect to the Funds. In their deliberations, the Trustees did not rank the importance of any particular information or factor considered and each Trustee attributed different weights to various factors.
Approval of the Agreement on Behalf of the Funds
Based on its review of the information requested and provided, and following extended discussions, the Board determined that the Agreement, on behalf of the Funds, was consistent with the best interests of the Funds and their future shareholders, and the Board unanimously approved the Agreement, on behalf of the Funds, for an
211
Victory Portfolios II | | Supplemental Information — continued
December 31, 2020 | |
(Unaudited)
initial two year period on the basis of the foregoing review and discussions and the following considerations, among others:
• The fairness and reasonableness of the investment advisory fee to be paid to the Adviser under the Agreement in light of the investment advisory services to be provided, the costs of these services, the expected profitability of the Adviser's relationship with the Funds and the comparability of the fee to be paid to the fees paid by other investment companies;
• The nature, quality and extent of the investment advisory services to be provided by Adviser;
• The Adviser's entrepreneurial commitment to the management of the Funds and its inclusion in a broad-based family of funds, which would entail a substantial commitment of the Adviser's resources to the successful operation of the Funds;
• The Adviser's representations regarding its staffing and capabilities to manage the Funds, including the retention of personnel with relevant portfolio management experience;
• The Adviser's efforts to enhance investment results by, among other things, developing quality portfolio management teams; and
• The overall high quality of the personnel, operations, financial condition, investment management capabilities, methodologies and performance of the Adviser.
212
Privacy Policy
Protecting the Privacy of Information
The Trust respects your right to privacy. We also know that you expect us to conduct and process your business in an accurate and efficient manner. To do so, we must collect and maintain certain personal information about you. This is the information we collect from you on applications or other forms, and from the transactions you make with us or third parties. It may include your name, address, social security number, account transactions and balances, and information about investment goals and risk tolerance.
We do not disclose any information about you or about former customers to anyone except as permitted or required by law. Specifically, we may disclose the information we collect to companies that perform services on our behalf, such as the transfer agent that processes shareholder accounts and printers and mailers that assist us in the distribution of investor materials. We may also disclose this information to companies that perform marketing services on our behalf. This allows us to continue to offer you Victory investment products and services that meet your investing needs, and to effect transactions that you request or authorize. These companies will use this information only in connection with the services for which we hired them. They are not permitted to use or share this information for any other purpose.
To protect your personal information internally, we permit access only by authorized employees and maintain physical, electronic and procedural safeguards to guard your personal information.*
* You may have received communications regarding information about privacy policies from other financial institutions which gave you the opportunity to "opt-out" of certain information sharing with companies which are not affiliated with that financial institution. The Trust does not share information with other companies for purposes of marketing solicitations for products other than the Trust. Therefore, the Trust does not provide opt-out options to their shareholders.
The Victory Funds
P.O. Box 182593
Columbus, Ohio
43218-2593

Visit our website at: | | Call Victory at: | |
www.vcm.com | | | 866-376-7890 | | |
VPII-VICTORYSHARESETF-SAR (12/20)

December 31, 2020
Semi Annual Report
VictoryShares USAA Core Short-Term Bond ETF
VictoryShares USAA Core Intermediate-Term Bond ETF
As permitted by regulations adopted by the Securities and Exchange Commission, paper copies of the VictoryShares' shareholder reports may no longer be sent by mail, unless you specifically request paper copies of the reports from your financial intermediary, such as a broker-dealer or bank. Instead, the reports will be made available on www.VictorySharesLiterature.com, and you will be notified by mail each time a report is posted and provided with a website link to access the report. If you already elected to receive shareholder reports electronically, you will not be affected by this change, and you need not take any action.
You can inform your financial intermediary that you wish to continue receiving paper copies of your reports. Your election to receive reports in paper will apply to all VictoryShares you hold through your financial intermediary.
vcm.com
News, Information And Education 24 Hours A Day, 7 Days A Week
The Victory Funds site gives fund shareholders, prospective shareholders, and investment professionals a convenient way to access fund information, get guidance, and track fund performance anywhere they can access the Internet. The site includes:
• Detailed performance records
• Daily share prices
• The latest fund news
• Investment resources to help you become a better investor
• A section dedicated to investment professionals
Whether you're a potential investor searching for the fund that matches your investment philosophy, a seasoned investor interested in planning tools, or an investment professional, www.vcm.com has what you seek. Visit us anytime. We're always open.
Table of Contents
Financial Statements | |
Victory Portfolios II Exchange-Traded Funds | |
VictoryShares USAA Core Short-Term Bond ETF | |
Investment Objectives & Portfolio Holdings | | | 3 | | |
Schedule of Portfolio Investments | | | 4 | | |
Statement of Assets and Liabilities | | | 35 | | |
Statement of Operations | | | 36 | | |
Statements of Changes in Net Assets | | | 37 | | |
Financial Highlights | | | 38-39 | | |
VictoryShares USAA Core Intermediate-Term Bond ETF | |
Investment Objectives & Portfolio Holdings | | | 3 | | |
Schedule of Portfolio Investments | | | 17 | | |
Statement of Assets and Liabilities | | | 35 | | |
Statement of Operations | | | 36 | | |
Statements of Changes in Net Assets | | | 37 | | |
Financial Highlights | | | 38-39 | | |
Notes to Financial Statements | | | 40 | | |
Supplemental Information (unaudited) | |
Proxy Voting and Portfolio Holdings Information | | | 50 | | |
Expense Examples | | | 50 | | |
Advisory Contract Approval | | | 51 | | |
Privacy Policy (inside back cover) | | | |
1
IRA DISTRIBUTION WITHHOLDING DISCLOSURE
We generally must withhold federal income tax at a rate of 10% of the taxable portion of your distribution and, if you live in a state that requires state income tax withholding, at your state's tax rate. However, you may elect not to have withholding apply or to have income tax withheld at a higher rate. Any withholding election that you make will apply to any subsequent distribution unless and until you change or revoke the election. If you wish to make a withholding election, or change or revoke a prior withholding election, call 866-376-7890.
If you do not have a withholding election in place by the date of a distribution, federal income tax will be withheld from the taxable portion of your distribution at a rate of 10%. If you must pay estimated taxes, you may be subject to estimated tax penalties if your estimated tax payments are not sufficient and sufficient tax is not withheld from your distribution.
For more specific information, please consult your tax adviser.
The VictoryShares are distributed by Foreside Fund Services, LLC. Victory Capital Management Inc. is the investment adviser to the Funds and receives fees from the Funds for performing services for the Funds.
This report is not authorized for distribution to prospective investors unless preceded or accompanied by a current prospectus of the VictoryShares.
For additional information about any VictoryShares, including fees, expenses, and risks, view our prospectus online at www.vcm.com or call 866-376-7890. Read it carefully before you invest or send money.
The information in this semi annual report is based on data obtained from recognized services and sources and is believed to be reliable. Any opinions, projections, or recommendations in this report are subject to change without notice and are not intended as individual investment advice. Past investment performance of the ETFs, markets or securities mentioned herein should not be considered to be indicative of future results.
This report is for the information of the shareholders and others who have received a copy of the currently effective prospectus of the Funds, managed by Victory Capital Management Inc. It may be used as sales literature only when preceded or accompanied by a current prospectus, which provides further details about the Funds.
• NOT FDIC INSURED • NO BANK GUARANTEE • MAY LOSE VALUE

Call Victory at:
866-376-7890
Visit our website at:
www.vcm.com
2
Victory Portfolios II | | December 31, 2020 | |
(Unaudited)
Investment Objectives & Portfolio Holdings:
VictoryShares USAA Core Short-Term
Bond ETF
Seeks high current income consistent with preservation of principal.
Sector Allocation*:
December 31, 2020
(% of Net Assets)
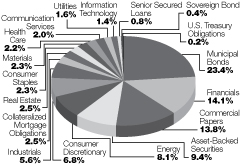
* Does not include futures, money market instruments, and short-term investments purchased with cash collateral from securities loaned.
Percentages are of the net assets of the Fund and may not equal 100%.
VictoryShares USAA Core Intermediate-Term Bond ETF
Seeks high current income without undue risk to principal.
Sector Allocation*:
December 31, 2020
(% of Net Assets)
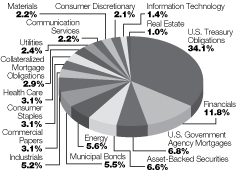
* Does not include futures, money market instruments, and short-term investments purchased with cash collateral from securities loaned.
Percentages are of the net assets of the Fund and may not equal 100%.
Refer to the Schedule of Portfolio Investments for a complete list of securities.
3
Victory Portfolios II
VictoryShares USAA Core Short-Term Bond ETF | | Schedule of Portfolio Investments
December 31, 2020 | |
(Unaudited)
Security Description | | Principal
Amount | | Value | |
Asset-Backed Securities (9.4%) | |
AmeriCredit Automobile Receivables Trust, Series 2017-3, Class D, 3.18%,
7/18/23, Callable 4/18/22 @ 100 | | $ | 500,000 | | | $ | 514,193 | | |
AmeriCredit Automobile Receivables Trust, Series 2017-2, Class D, 3.42%,
4/18/23, Callable 12t/18/21 @ 100 | | | 820,000 | | | | 842,411 | | |
AmeriCredit Automobile Receivables Trust, Series 2017-4, Class C, 2.60%,
9/18/23, Callable 6/18/22 @ 100 | | | 500,000 | | | | 508,052 | | |
Bank of The West Auto Trust, Series 2018-1, Class C, 3.98%, 5/15/24,
Callable 3/15/22 @ 100 (a) | | | 400,000 | | | | 415,981 | | |
Bank of The West Auto Trust, Series 2017-1, Class C, 2.96%, 2/15/24,
Callable 3/15/22 @ 100 (a) | | | 500,000 | | | | 513,149 | | |
Canadian Pacer Auto Receivables Trust, Series 2018-2A, Class B, 3.63%,
1/19/24, Callable 2/19/22 @ 100 (a) | | | 500,000 | | | | 514,037 | | |
CarMax Auto Owner Trust, Series 2020-4, Class A3, 0.50%, 8/15/25,
Callable 10/15/24 @ 100 | | | 1,000,000 | | | | 1,000,006 | | |
CARS LP, Series 2020-1A, Class A1, 2.69%, 2/15/50, Callable
2/15/23 @ 100 (a) | | | 605,309 | | | | 623,460 | | |
CNH Equipment Trust, Series 2017-B, Class B, 2.47%, 12/16/24, Callable
6/15/21 @ 100 | | | 500,000 | | | | 503,786 | | |
CNH Equipment Trust, Series 2018-B, Class B, 3.56%, 2/17/26, Callable
3/15/23 @ 100 | | | 350,000 | | | | 371,823 | | |
Credit Acceptance Auto Loan Trust, Series 2018-1A, Class B, 3.60%,
4/15/27, Callable 6/15/21 @ 100 (a) | | | 500,000 | | | | 504,675 | | |
Drive Auto Receivables Trust, Series 2020-2, Class C, 2.28%, 8/17/26,
Callable 11/15/23 @ 100 | | | 750,000 | | | | 773,645 | | |
Drive Auto Receivables Trust, Series 2018-4, Class C, 3.66%, 11/15/24,
Callable 9/15/22 @ 100 | | | 210,738 | | | | 212,488 | | |
Evergreen Credit Card Trust, Series 2019-2, Class B, 2.27%, 9/15/24 (a) | | | 750,000 | | | | 770,031 | | |
Exeter Automobile Receivables Trust, Series 2020-3A, Class C, 1.32%,
7/15/25, Callable 7/15/25 @ 100 | | | 472,000 | | | | 473,641 | | |
Ford Credit Auto Owner Trust, Series 2018-B, Class A3, 3.24%, 4/15/23,
Callable 8/15/22 @ 100 | | | 256,426 | | | | 260,392 | | |
GM Financial Automobile Leasing Trust, Series 2020-1, Class B, 1.84%,
12/20/23, Callable 8/20/22 @ 100 | | | 489,000 | | | | 497,843 | | |
GM Financial Automobile Leasing Trust, Series 2020-3, Class A4, 0.51%,
10/21/24, Callable 4/20/23 @ 100 | | | 1,000,000 | | | | 1,003,559 | | |
GM Financial Consumer Automobile Receivables Trust, Series 2018-3,
Class A3, 3.02%, 5/16/23, Callable 5/16/22 @ 100 | | | 277,351 | | | | 280,676 | | |
GreatAmerica Leasing Receivables Funding LLC, Series 2018-1, Class A4,
2.83%, 6/17/24, Callable 11/15/21 @ 100 (a) | | | 478,628 | | | | 484,253 | | |
Honda Auto Receivables Owner Trust, Series 2020-3, Class A3, 0.37%,
10/18/24, Callable 11/18/23 @ 100 | | | 1,000,000 | | | | 1,001,154 | | |
Hyundai Auto Receivables Trust, Series 2020-C, Class A3, 0.38%, 5/15/25,
Callable 3/15/25 @ 100 | | | 1,000,000 | | | | 1,000,284 | | |
InSite Issuer LLC, Series 2020-1A, Class A, 1.50%, 9/15/50, Callable
9/15/24 @ 100 (a) | | | 554,000 | | | | 556,557 | | |
Kubota Credit Owner Trust, Series 2020-1A, Class A2, 1.92%, 12/15/22,
Callable 10/15/23 @ 100 (a) | | | 949,551 | | | | 956,649 | | |
Mercedes-Benz Auto Lease Trust, Series 2020-B, Class A3, 0.40%, 11/15/23,
Callable 5/15/23 @ 100 | | | 1,000,000 | | | | 1,001,972 | | |
See notes to financial statements.
4
Victory Portfolios II
VictoryShares USAA Core Short-Term Bond ETF | | Schedule of Portfolio Investments — continued
December 31, 2020 | |
(Unaudited)
Security Description | | Principal
Amount | | Value | |
MMAF Equipment Finance LLC, Series 2016-A, Class A4, 1.76%, 1/17/23,
Callable 6/15/25 @ 100 (a) | | $ | 29,490 | | | $ | 29,633 | | |
Nissan Auto Lease Trust 2020-B, Series 2020-B, Class A3, 0.43%, 10/16/23,
Callable 6/15/23 @ 100 | | | 1,000,000 | | | | 1,001,328 | | |
Nissan Auto Receivables Owner Trust, Series 2017-B, Class A4, 1.95%,
10/16/23, Callable 9/15/21 @ 100 | | | 761,104 | | | | 765,513 | | |
OSCAR US Funding Trust LLC, Series 2017-1A, Class A4, 3.30%, 5/10/24 (a) | | | 259,555 | | | | 262,889 | | |
PSNH Funding LLC, Series 2018-1, Class A1, 3.09%, 2/1/26 | | | 297,496 | | | | 309,558 | | |
Santander Drive Auto Receivables Trust, Series 2020-4, Class C, 1.01%,
1/15/26, Callable 11/15/25 @ 100 | | | 1,000,000 | | | | 1,003,430 | | |
Santander Drive Auto Receivables Trust, Series 2019-3, Class C, 2.49%,
10/15/25, Callable 4/15/23 @ 100 | | | 750,000 | | | | 766,835 | | |
SCF Equipment Leasing LLC, Series 2019-2A, Class A2, 2.47%, 4/20/26,
Callable 10/20/24 @ 100 (a) | | | 750,000 | | | | 772,898 | | |
SCF Equipment Leasing LLC, Series 2017-2A, Class A, 3.41%, 12/20/23,
Callable 1/20/21 @ 100 (a) | | | 27,515 | | | | 27,687 | | |
Synchrony Card Issuance Trust, Series 2018-A1, Class A, 3.38%, 9/15/24 | | | 370,000 | | | | 378,008 | | |
Vantage Data Centers LLC, Series 2020-1A, Class A2, 1.65%, 9/15/45,
Callable 9/15/23 @ 100 (a) | | | 1,000,000 | | | | 1,001,059 | | |
Westlake Automobile Receivables Trust, Series 2019-2A, Class C, 2.84%,
7/15/24, Callable 3/15/23 @ 100 (a) | | | 500,000 | | | | 512,260 | | |
World Omni Select Auto Trust, Series 2020-A, Class A3, 0.55%, 7/15/25,
Callable 3/15/24 @ 100 | | | 1,000,000 | | | | 1,003,828 | | |
Total Asset-Backed Securities (Cost $23,163,974) | | | 23,419,643 | | |
Collateralized Mortgage Obligations (2.5%) | |
BBCMS Mortgage Trust, Series 2020-BID, Class A, 2.30%
(LIBOR01M+214bps), 10/15/37 (a) (b) | | | 1,000,000 | | | | 1,000,225 | | |
Citigroup Commercial Mortgage Trust, Series 2019-SMRT, Class B, 4.38%,
1/10/36 (a) | | | 500,000 | | | | 536,743 | | |
JPMorgan Chase Commercial Mortgage Securities Trust, Series 2013-C10,
Class A5, 3.14%, 12/15/47, Callable 2/15/23 @ 100 | | | 981,542 | | | | 1,027,949 | | |
Madison Park Funding Ltd., Series 2013-11A, Class AR, 1.37%
(LIBOR03M+116bps), 7/23/29, Callable 1/23/21 @ 100 (a) (b) | | | 500,000 | | | | 499,887 | | |
Oaktree EIF Ltd., Series 2016-IIIA, Class B, 2.22% (LIBOR03M+200bps),
10/20/27, Callable 1/20/21 @ 100 (a) (b) | | | 500,000 | | | | 500,052 | | |
Palmer Square Loan Funding Ltd., Series 2018-2A, Class A1, 0.89%
(LIBOR03M+65bps), 7/15/26, Callable 1/15/21 @ 100 (a) (b) | | | 182,049 | | | | 181,593 | | |
Palmer Square Loan Funding Ltd., Series 2018-2A, Class A2, 1.29%
(LIBOR03M+105bps), 7/15/26, Callable 1/15/21 @ 100 (a) (b) | | | 500,000 | | | | 498,377 | | |
Palmer Square Loan Funding Ltd., Series 2020-1A, Class A1, 1.02%
(LIBOR03M+80bps), 2/20/28, Callable 2/20/21 @ 100 (a) (b) | | | 439,942 | | | | 438,870 | | |
WFRBS Commercial Mortgage Trust, Series 2012-C9, Class ASB, 2.45%,
11/15/45, Callable 7/15/22 @ 100 | | | 228,491 | | | | 232,165 | | |
WFRBS Commercial Mortgage Trust, Series 2012-C7, Class AS, 4.09%,
6/15/45 (c) | | | 225,017 | | | | 230,975 | | |
WFRBS Commercial Mortgage Trust, Series 2011-C5, Class A4, 3.67%,
11/15/44, Callable 9/15/21 @ 100 | | | 961,965 | | | | 975,760 | | |
Total Collateralized Mortgage Obligations (Cost $6,077,465) | | | 6,122,596 | | |
See notes to financial statements.
5
Victory Portfolios II
VictoryShares USAA Core Short-Term Bond ETF | | Schedule of Portfolio Investments — continued
December 31, 2020 | |
(Unaudited)
Security Description | | Principal
Amount | | Value | |
Senior Secured Loans (0.8%) | |
Berry Global, Inc., Term W Loans, First Lien, 2.15% (LIBOR01M+200bps),
10/1/22 (b) (d) | | $ | 1,000,000 | | | $ | 998,320 | | |
The Boeing Company, First Lien, 2/6/22 (b) (k) | | | 1,000,000 | | | | 986,500 | | |
Total Senior Secured Loans (Cost $1,983,496) | | | 1,984,820 | | |
Corporate Bonds (38.3%) | |
Communication Services (1.1%): | |
Qwest Corp., 6.75%, 12/1/21 | | | 1,000,000 | | | | 1,045,160 | | |
Sprint Corp., 7.25%, 9/15/21 | | | 1,500,000 | | | | 1,560,675 | | |
Sprint Spectrum, 3.36%, 3/20/23 (a) | | | 234,375 | | | | 236,538 | | |
| | | | 2,842,373 | | |
Consumer Discretionary (6.0%): | |
Association of American Medical Colleges, 2.12%, 10/1/24 | | | 750,000 | | | | 752,556 | | |
Expedia Group, Inc., 6.25%, 5/1/25, Callable 2/1/25 @ 100 (a) | | | 1,000,000 | | | | 1,159,790 | | |
Howard University
2.64%, 10/1/21 | | | 500,000 | | | | 505,140 | | |
2.74%, 10/1/22 | | | 500,000 | | | | 518,450 | | |
Hyatt Hotels Corp., 5.38%, 8/15/21, Callable 5/15/21 @ 100 | | | 1,456,000 | | | | 1,479,588 | | |
International Game Technology PLC, 6.25%, 2/15/22, Callable 8/15/21 @ 100 (a) | | | 431,000 | | | | 441,934 | | |
Lennar Corp.
6.25%, 12/15/21, Callable 6/15/21 @ 100 | | | 1,606,000 | | | | 1,647,949 | | |
5.38%, 10/1/22 | | | 500,000 | | | | 537,180 | | |
Macys Retail Holdings, Inc., 3.45%, 1/15/21 (e) | | | 999,000 | | | | 998,570 | | |
Meritage Homes Corp., 7.00%, 4/1/22 | | | 733,000 | | | | 778,446 | | |
Newell Brands, Inc., 3.65%, 4/1/21, Callable 3/1/21 @ 100 (f) | | | 750,000 | | | | 746,955 | | |
PulteGroup, Inc., 4.25%, 3/1/21, Callable 2/1/21 @ 100 | | | 1,500,000 | | | | 1,503,210 | | |
QVC, Inc., 4.38%, 3/15/23 | | | 667,000 | | | | 701,150 | | |
Toll Brothers Finance Corp., 5.88%, 2/15/22, Callable 11/15/21 @ 100 | | | 2,154,000 | | | | 2,240,289 | | |
Wyndham Destinations, Inc., 5.63%, 3/1/21 | | | 904,000 | | | | 908,520 | | |
| | | | 14,919,727 | | |
Consumer Staples (1.9%): | |
Altria Group, Inc., 4.75%, 5/5/21 | | | 500,000 | | | | 507,450 | | |
Energizer Holdings, Inc., 7.75%, 1/15/27 (a) | | | 750,000 | | | | 833,370 | | |
Nestle Holdings, Inc., 2.38%, 11/17/22 | | | 1,000,000 | | | | 1,038,340 | | |
Smithfield Foods, Inc., 2.65%, 10/3/21, Callable 9/3/21 @ 100 (a) | | | 920,000 | | | | 936,735 | | |
Unilever Capital Corp., 2.60%, 5/5/24, Callable 3/5/24 @ 100 | | | 750,000 | | | | 800,040 | | |
Walmart, Inc., 3.55%, 6/26/25, Callable 4/26/25 @ 100 | | | 750,000 | | | | 848,933 | | |
| | | | 4,964,868 | | |
Energy (5.6%): | |
Continental Resources, Inc., 4.50%, 4/15/23, Callable 1/15/23 @ 100 (l) | | | 1,230,000 | | | | 1,267,588 | | |
DCP Midstream Operating LP, 4.75%, 9/30/21, Callable 6/30/21 @ 100 (a) | | | 781,000 | | | | 791,489 | | |
Energy Transfer Operating LP, 5.20%, 2/1/22, Callable 11/1/21 @ 100 | | | 1,000,000 | | | | 1,035,930 | | |
EQM Midstream Partners LP
4.75%, 7/15/23, Callable 6/15/23 @ 100 (l) | | | 400,000 | | | | 419,676 | | |
4.00%, 8/1/24, Callable 5/1/24 @ 100 | | | 250,000 | | | | 257,515 | | |
Exxon Mobil Corp., 2.99%, 3/19/25, Callable 2/19/25 @ 100 (l) | | | 750,000 | | | | 821,138 | | |
See notes to financial statements.
6
Victory Portfolios II
VictoryShares USAA Core Short-Term Bond ETF | | Schedule of Portfolio Investments — continued
December 31, 2020 | |
(Unaudited)
Security Description | | Principal
Amount | | Value | |
Gray Oak Pipeline LLC, 2.00%, 9/15/23 (a) | | $ | 833,000 | | | $ | 847,369 | | |
HollyFrontier Corp., 2.63%, 10/1/23 | | | 1,000,000 | | | | 1,022,120 | | |
Marathon Petroleum Corp., 4.50%, 5/1/23, Callable 4/1/23 @ 100 (l) | | | 1,000,000 | | | | 1,086,209 | | |
Midwest Connector Capital Co. LLC, 3.63%, 4/1/22, Callable 3/1/22 @ 100 (a) | | | 1,000,000 | | | | 1,015,860 | | |
MPLX LP, 3.50%, 12/1/22, Callable 11/1/22 @ 100 | | | 271,000 | | | | 284,677 | | |
Newfield Exploration Co., 5.75%, 1/30/22 | | | 1,307,000 | | | | 1,356,404 | | |
Occidental Petroleum Corp., 2.70%, 8/15/22 | | | 750,000 | | | | 754,388 | | |
Phillips 66, 0.90%, 2/15/24, Callable 11/19/21 @ 100 | | | 462,000 | | | | 463,275 | | |
USX Corp., 8.13%, 7/15/23 | | | 400,000 | | | | 461,576 | | |
Valero Energy Corp.
2.70%, 4/15/23 (l) | | | 698,000 | | | | 728,887 | | |
1.20%, 3/15/24 | | | 500,000 | | | | 503,680 | | |
Western Midstream Operating LP, 3.10%, 2/1/25, Callable 1/1/25 @ 100 | | | 632,000 | | | | 649,077 | | |
| | | | 13,766,858 | | |
Financials (11.9%): | |
Alexander Funding Trust, 1.84%, 11/15/23 (a) | | | 1,800,000 | | | | 1,821,006 | | |
American International Group, Inc., 3.30%, 3/1/21, Callable 2/1/21 @ 100 | | | 623,000 | | | | 624,312 | | |
Ares Capital Corp., 3.25%, 7/15/25, Callable 6/15/25 @ 100 | | | 750,000 | | | | 793,605 | | |
Associated Bank NA, 3.50%, 8/13/21, Callable 7/13/21 @ 100 | | | 500,000 | | | | 505,500 | | |
Assurant, Inc., 1.50% (LIBOR03M+125bps), 3/26/21, Callable 1/27/21 @ 100 (b) | | | 66,000 | | | | 66,003 | | |
Athene Global Funding
2.80%, 5/26/23 (a) | | | 750,000 | | | | 783,638 | | |
1.20%, 10/13/23 (a) | | | 500,000 | | | | 504,425 | | |
Cadence Bancorp, 4.75% (LIBOR03M+303bps), 6/30/29, Callable
6/30/24 @ 100 (b) | | | 500,000 | | | | 477,825 | | |
CIT Group, Inc.
4.13%, 3/9/21, Callable 2/9/21 @ 100 | | | 750,000 | | | | 751,628 | | |
5.00%, 8/15/22 | | | 1,740,000 | | | | 1,850,002 | | |
Citigroup, Inc., 3.14% (LIBOR03M+72bps), 1/24/23, Callable 1/24/22 @ 100 (b) | | | 400,000 | | | | 411,392 | | |
First Citizens BancShares, Inc., 3.37% (SOFR+247bps), 3/15/30, Callable
3/15/25 @ 100 (b) | | | 1,000,000 | | | | 1,008,110 | | |
First Horizon National Corp., 3.55%, 5/26/23, Callable 4/26/23 @ 100 | | | 750,000 | | | | 795,608 | | |
Flagstar Bancorp, Inc., 6.13%, 7/15/21 | | | 500,000 | | | | 511,005 | | |
FNB Corp., 2.20%, 2/24/23, Callable 1/24/23 @ 100 | | | 476,000 | | | | 485,715 | | |
Ford Motor Credit Co. LLC
3.20%, 1/15/21 (l) | | | 1,750,000 | | | | 1,748,618 | | |
3.38%, 11/13/25, Callable 10/13/25 @ 100 | | | 1,000,000 | | | | 1,021,760 | | |
Fulton Financial Corp., 3.25% (SOFR+230bps), 3/15/30, Callable
3/15/25 @ 100 (b) | | | 1,000,000 | | | | 1,005,510 | | |
Harley-Davidson Financial Services, Inc., 2.85%, 1/15/21 (a) | | | 1,500,000 | | | | 1,501,140 | | |
HSBC Finance Corp., 6.68%, 1/15/21 | | | 1,480,000 | | | | 1,482,131 | | |
Infinity Property & Casualty Corp., 5.00%, 9/19/22 | | | 500,000 | | | | 532,915 | | |
Ladder Capital Finance Holdings LLLP/Ladder Capital Finance Corp.,
5.88%, 8/1/21, Callable 1/27/21 @ 100 (a) | | | 525,000 | | | | 524,948 | | |
Main Street Capital Corp., 5.20%, 5/1/24 | | | 500,000 | | | | 542,340 | | |
OneMain Finance Corp., 7.75%, 10/1/21 | | | 1,500,000 | | | | 1,578,240 | | |
Primerica, Inc., 4.75%, 7/15/22 | | | 400,000 | | | | 425,636 | | |
Protective Life Global Funding, 3.10%, 4/15/24 (a) | | | 500,000 | | | | 539,435 | | |
Reliance Standard Life Global Funding II, 2.75%, 5/7/25 (a) | | | 750,000 | | | | 793,664 | | |
See notes to financial statements.
7
Victory Portfolios II
VictoryShares USAA Core Short-Term Bond ETF | | Schedule of Portfolio Investments — continued
December 31, 2020 | |
(Unaudited)
Security Description | | Principal
Amount | | Value | |
Santander Holdings USA, Inc.
3.40%, 1/18/23, Callable 12/18/22 @ 100 | | $ | 250,000 | | | $ | 262,550 | | |
3.45%, 6/2/25, Callable 5/2/25 @ 100 | | | 314,000 | | | | 343,105 | | |
Synovus Bank, 2.29% (SOFR+95bps), 2/10/23, Callable 2/10/22 @ 100 (b) | | | 358,000 | | | | 362,625 | | |
TCF National Bank, 5.50% (LIBOR03M+509bps), 5/6/30, Callable
5/6/25 @ 100 (b) | | | 750,000 | | | | 780,660 | | |
TIAA FSB Holdings, Inc., 6.00% (LIBOR03M+470bps), 3/15/26, Callable
3/15/21 @ 100 (b) | | | 750,000 | | | | 752,573 | | |
Truist Bank, 1.25%, 3/9/23, Callable 2/9/23 @ 100 | | | 1,000,000 | | | | 1,019,579 | | |
UMB Financial Corp., 3.70% (H15T5Y+344bps), 9/17/30, Callable
9/17/25 @ 100 (b) | | | 750,000 | | | | 773,130 | | |
US Bank NA, 2.85%, 1/23/23, Callable 12/23/22 @ 100 | | | 500,000 | | | | 525,380 | | |
WEA Finance LLC, 3.15%, 4/5/22, Callable 3/5/22 @ 100 (a) | | | 700,000 | | | | 712,495 | | |
Zions Bancorp NA, 3.35%, 3/4/22, Callable 2/4/22 @ 100 (l) | | | 500,000 | | | | 514,205 | | |
| | | | 29,132,413 | | |
Health Care (2.2%): | |
Centene Corp., 4.75%, 1/15/25, Callable 2/11/21 @ 102.38 | | | 1,070,000 | | | | 1,098,291 | | |
Fresenius Medical Care U.S. Finance, Inc., 5.75%, 2/15/21 (a) | | | 750,000 | | | | 754,080 | | |
Gilead Sciences, Inc., 0.38% (LIBOR03M+15bps), 9/17/21 (b) | | | 1,000,000 | | | | 1,000,270 | | |
Shire Acquisitions Investments Ireland DAC, 2.40%, 9/23/21 | | | 1,000,000 | | | | 1,012,440 | | |
SSM Health Care Corp., 3.69%, 6/1/23, Callable 3/1/23 @ 100 | | | 500,000 | | | | 534,555 | | |
Teva Pharmaceutical Finance Co. LLC, 0.25%, 2/1/26, Callable 2/1/21 @ 100 | | | 1,000,000 | | | | 995,000 | | |
| | | | 5,394,636 | | |
Industrials (4.1%): | |
Air Lease Corp.
2.50%, 3/1/21 | | | 263,000 | | | | 263,742 | | |
3.50%, 1/15/22 | | | 500,000 | | | | 513,595 | | |
2.25%, 1/15/23 | | | 250,000 | | | | 256,715 | | |
Aircastle Ltd.
5.13%, 3/15/21 | | | 1,000,000 | | | | 1,007,570 | | |
4.25%, 6/15/26, Callable 4/15/26 @ 100 | | | 500,000 | | | | 529,670 | | |
Carrier Global Corp., 1.92%, 2/15/23, Callable 1/15/23 @ 100 | | | 750,000 | | | | 772,628 | | |
Delta Air Lines Pass Through Trust, 2.00%, 12/10/29 | | | 970,103 | | | | 971,267 | | |
Delta Air Lines, Inc./SkyMiles IP Ltd., 4.50%, 10/20/25 (a) | | | 1,370,000 | | | | 1,468,982 | | |
Howmet Aerospace, Inc.
5.40%, 4/15/21, Callable 1/15/21 @ 100 | | | 1,136,000 | | | | 1,137,681 | | |
6.88%, 5/1/25, Callable 4/1/25 @ 100 (l) | | | 1,000,000 | | | | 1,179,450 | | |
PACCAR Financial Corp., 2.65%, 4/6/23, MTN | | | 750,000 | | | | 789,210 | | |
Southwest Airlines Co.
4.75%, 5/4/23 | | | 500,000 | | | | 543,355 | | |
5.25%, 5/4/25, Callable 4/4/25 @ 100 | | | 750,000 | | | | 869,453 | | |
| | | | 10,303,318 | | |
Information Technology (1.0%): | |
Broadcom, Inc., 3.13%, 4/15/21 | | | 500,000 | | | | 503,215 | | |
Microchip Technology, Inc., 3.92%, 6/1/21 | | | 600,000 | | | | 607,740 | | |
Oracle Corp., 2.50%, 4/1/25, Callable 3/1/25 @ 100 | | | 500,000 | | | | 537,285 | | |
VeriSign, Inc., 4.63%, 5/1/23, Callable 2/11/21 @ 100.77 | | | 1,000,000 | | | | 1,010,490 | | |
| | | | 2,658,730 | | |
See notes to financial statements.
8
Victory Portfolios II
VictoryShares USAA Core Short-Term Bond ETF | | Schedule of Portfolio Investments — continued
December 31, 2020 | |
(Unaudited)
Security Description | | Principal
Amount | | Value | |
Materials (1.9%): | |
Ball Corp., 5.00%, 3/15/22 | | $ | 1,126,000 | | | $ | 1,177,660 | | |
Commercial Metals Co., 4.88%, 5/15/23, Callable 2/15/23 @ 100 | | | 125,000 | | | | 131,644 | | |
Graphic Packaging International LLC, 4.75%, 4/15/21, Callable 1/15/21 @ 100 | | | 1,000,000 | | | | 999,114 | | |
LYB Americas Finance Co. LLC, 3/29/22 (d) (f) | | | 2,000,000 | | | | 1,997,500 | | |
Reliance Steel & Aluminum Co., 4.50%, 4/15/23, Callable 1/15/23 @ 100 | | | 400,000 | | | | 431,672 | | |
Reynolds Group Issuer, Inc./Reynolds Group Issuer LLC/Reynolds Group
Issuer, 5.13%, 7/15/23, Callable 2/11/21 @ 101.28 (a) | | | 38,000 | | | | 38,466 | | |
| | | | 4,776,056 | | |
Real Estate (1.8%): | |
Boston Properties LP, 4.13%, 5/15/21, Callable 2/15/21 @ 100 | | | 750,000 | | | | 753,015 | | |
Lexington Realty Trust, 4.25%, 6/15/23, Callable 3/15/23 @ 100 | | | 1,000,000 | | | | 1,062,670 | | |
Office Properties Income Trust, 4.00%, 7/15/22, Callable 6/15/22 @ 100 | | | 1,000,000 | | | | 1,021,820 | | |
SBA Tower Trust, 2.84%, 1/15/25 (a) | | | 750,000 | | | | 796,050 | | |
Senior Housing Properties Trust, 6.75%, 12/15/21, Callable 6/15/21 @ 100 | | | 500,000 | | | | 508,290 | | |
VICI Properties LP/VICI Note Co., Inc., 3.50%, 2/15/25, Callable
2/15/22 @ 101.75 (a) | | | 364,000 | | | | 372,241 | | |
| | | | 4,514,086 | | |
Utilities (0.8%): | |
Dominion Energy, Inc., 2.72%, 8/15/21 (f) (g) | | | 500,000 | | | | 506,735 | | |
National Fuel Gas Co., 4.90%, 12/1/21, Callable 9/1/21 @ 100 | | | 500,000 | | | | 513,675 | | |
Public Service Electric & Gas Co., 3.25%, 9/1/23, MTN, Callable 8/1/23 @ 100 | | | 500,000 | | | | 536,760 | | |
Sierra Pacific Power Co., 3.38%, 8/15/23, Callable 5/15/23 @ 100 | | | 500,000 | | | | 534,695 | | |
| | | | 2,091,865 | | |
Total Corporate Bonds (Cost $93,345,089) | | | 95,364,930 | | |
Yankee Dollars (11.0%) | |
Communication Services (0.9%): | |
Pearson Funding Four PLC, 3.75%, 5/8/22 (a) | | | 750,000 | | | | 768,765 | | |
Videotron Ltd., 5.00%, 7/15/22 | | | 1,524,000 | | | | 1,602,273 | | |
| | | | 2,371,038 | | |
Consumer Discretionary (0.8%): | |
Fiat Chrysler Automobiles NV, 5.25%, 4/15/23 | | | 1,000,000 | | | | 1,072,640 | | |
Nissan Motor Co. Ltd., 3.04%, 9/15/23 (a) | | | 1,000,000 | | | | 1,045,870 | | |
| | | | 2,118,510 | | |
Consumer Staples (0.4%): | |
Alimentation Couche-Tard, Inc., 2.70%, 7/26/22, Callable 6/26/22 @ 100 (a) | | | 500,000 | | | | 516,310 | | |
Reckitt Benckiser Treasury Services PLC, 2.38%, 6/24/22, Callable
5/24/22 @ 100 (a) | | | 400,000 | | | | 411,332 | | |
| | | | 927,642 | | |
Energy (2.5%): | |
Aker BP ASA, 2.88%, 1/15/26, Callable 12/15/25 @ 100 (a) | | | 437,000 | | | | 448,786 | | |
BG Energy Capital PLC, 4.00%, 10/15/21 (a) | | | 650,000 | | | | 667,758 | | |
Cenovus Energy, Inc., 3.00%, 8/15/22, Callable 5/15/22 @ 100 | | | 1,000,000 | | | | 1,018,210 | | |
Galaxy Pipeline Assets Bidco Ltd., 1.75%, 9/30/27 (a) | | | 500,000 | | | | 508,750 | | |
Petroleos Mexicanos, 3.87% (LIBOR03M+365bps), 3/11/22 (b) | | | 500,000 | | | | 504,775 | | |
See notes to financial statements.
9
Victory Portfolios II
VictoryShares USAA Core Short-Term Bond ETF | | Schedule of Portfolio Investments — continued
December 31, 2020 | |
(Unaudited)
Security Description | | Principal
Amount | | Value | |
Suncor Energy Ventures Corp., 4.50%, 4/1/22 (a) | | $ | 1,597,000 | | | $ | 1,647,704 | | |
TOTAL SE, 0.50%, 12/2/22 | | | 1,000,000 | | | | 1,023,201 | | |
| | | | 5,819,184 | | |
Financials (2.2%): | |
BAT International Finance PLC, 1.67%, 3/25/26, Callable 2/25/26 @ 100 | | | 1,000,000 | | | | 1,025,300 | | |
BBVA Bancomer SA, 6.50%, 3/10/21 (a) | | | 1,400,000 | | | | 1,414,028 | | |
Ontario Teachers' Finance Trust, 0.38%, 9/29/23 (a) | | | 1,000,000 | | | | 1,000,900 | | |
Park Aerospace Holdings Ltd., 3.63%, 3/15/21, Callable 2/15/21 @ 100 (a) | | | 725,000 | | | | 727,081 | | |
Santander UK Group Holdings PLC
3.13%, 1/8/21 | | | 1,040,000 | | | | 1,040,225 | | |
3.37% (LIBOR03M+108bps), 1/5/24, Callable 1/5/23 @ 100 (b) | | | 250,000 | | | | 262,975 | | |
| | | | 5,470,509 | | |
Industrials (1.5%): | |
AerCap Ireland Capital DAC/AerCap Global Aviation Trust
4.50%, 5/15/21 | | | 1,000,000 | | | | 1,011,980 | | |
3.15%, 2/15/24, Callable 1/15/24 @ 100 | | | 1,000,000 | | | | 1,050,080 | | |
CK Hutchison International Ltd., 2.75%, 3/29/23 (a) | | | 750,000 | | | | 782,017 | | |
Heathrow Funding Ltd., 4.88%, 7/15/21 (a) | | | 475,000 | | | | 484,581 | | |
Smiths Group PLC, 3.63%, 10/12/22 (a) | | | 500,000 | | | | 524,185 | | |
| | | | 3,852,843 | | |
Information Technology (0.4%): | |
TSMC Global Ltd., 0.75%, 9/28/25, Callable 8/28/25 @ 100 (a) | | | 1,000,000 | | | | 997,880 | | |
Materials (0.4%): | |
FMG Resources August 2006 Pty Ltd., 4.75%, 5/15/22, Callable
2/15/22 @ 100 (a) | | | 1,000,000 | | | | 1,030,820 | | |
Real Estate (0.7%): | |
Scentre Group Trust 1/Scentre Group Trust 2, 2.38%, 4/28/21, Callable
3/29/21 @ 100 (a) (l) | | | 1,607,000 | | | | 1,610,439 | | |
Sovereign Bond (0.4%): | |
Province of Alberta Canada, 3.35%, 11/1/23 | | | 1,000,000 | | | | 1,084,110 | | |
Utilities (0.8%): | |
EDP Finance BV
5.25%, 1/14/21 (a) (e) | | | 2,000,000 | | | | 2,003,080 | | |
| | | | 2,003,080 | | |
Total Yankee Dollars (Cost $26,976,081) | | | 27,286,055 | | |
Municipal Bonds (23.4%) | |
Alabama (0.4%): | |
City of Birmingham, GO, 0.86%, 3/1/24 | | | 1,015,000 | | | | 1,020,938 | | |
California (2.6%): | |
California Statewide Communities Development Authority Revenue, 2.15%,
11/15/30, Continuously Callable @ 100 | | | 1,240,000 | | | | 1,254,223 | | |
California Statewide Communities Development Authority Revenue
(NBGA — California Health Insurance Construction Loan Insurance
Program), 2.05%, 8/1/30 | | | 1,660,000 | | | | 1,681,944 | | |
City of Gardena Revenue, 1.30%, 4/1/23 | | | 565,000 | | | | 568,757 | | |
See notes to financial statements.
10
Victory Portfolios II
VictoryShares USAA Core Short-Term Bond ETF | | Schedule of Portfolio Investments — continued
December 31, 2020 | |
(Unaudited)
Security Description | | Principal
Amount | | Value | |
City of Montebello Revenue (INS — Assured Guaranty Corp.), 1.94%, 6/1/21 | | $ | 1,000,000 | | | $ | 1,004,990 | | |
County of Riverside Revenue, 2.17%, 2/15/21 | | | 1,000,000 | | | | 1,001,600 | | |
Placentia Public Financing Authority Revenue
Series A, 1.72%, 6/1/22 | | | 200,000 | | | | 198,694 | | |
Series A, 1.93%, 6/1/23 | | | 300,000 | | | | 298,251 | | |
San Jose Redevelopment Agency Successor Agency Tax Allocation,
Series A-T, 2.63%, 8/1/22 | | | 250,000 | | | | 258,733 | | |
| | | | 6,267,192 | | |
Colorado (2.6%): | |
City & County of Denver Co. Airport System Revenue
Series C, 0.88%, 11/15/23 | | | 500,000 | | | | 501,640 | | |
Series C, 1.12%, 11/15/24 | | | 500,000 | | | | 502,350 | | |
City of Loveland Electric & Communications Enterprise Revenue, 2.85%,
12/1/23 | | | 600,000 | | | | 637,086 | | |
Colorado Health Facilities Authority Revenue
2.80%, 12/1/26 | | | 500,000 | | | | 504,185 | | |
Series B, 2.24%, 11/1/22 | | | 750,000 | | | | 774,555 | | |
County of El Paso Co. Revenue, Series B, 1.05%, 6/1/24 | | | 1,230,000 | | | | 1,248,868 | | |
Denver City & County Housing Authority Revenue, 1.33%, 6/1/24, Continuously
Callable @ 100 | | | 750,000 | | | | 750,098 | | |
Denver City & County Housing Authority Revenue, 2.15%, 12/1/24 | | | 750,000 | | | | 791,115 | | |
Park Creek Metropolitan District Revenue, Series B, 2.43%, 12/1/23 | | | 700,000 | | | | 735,924 | | |
| | | | 6,445,821 | | |
Florida (0.5%): | |
Hillsborough County IDA Revenue, 2.16%, 8/1/25 | | | 1,250,000 | | | | 1,275,425 | | |
Hawaii (0.8%): | |
State of Hawaii Airports System Revenue
Series B, 0.90%, 7/1/23 | | | 300,000 | | | | 300,399 | | |
Series E, 1.39%, 7/1/25 | | | 1,500,000 | | | | 1,524,449 | | |
| | | | 1,824,848 | | |
Illinois (0.1%): | |
Chicago O'Hare International Airport Revenue, Series D, 0.96%, 1/1/23 | | | 165,000 | | | | 164,627 | | |
Indiana (0.4%): | |
Indiana Finance Authority Revenue, 2.48%, 3/1/24 (l) | | | 1,000,000 | | | | 1,052,110 | | |
Maine (0.2%): | |
Maine State Housing Authority Revenue, Series H, 1.70%, 11/15/26 | | | 600,000 | | | | 597,972 | | |
Maryland (0.2%): | |
County of Howard, GO, Series C, 1.34%, 8/15/23 | | | 500,000 | | | | 513,620 | | |
Michigan (1.2%): | |
Ecorse Public School District, GO, 2.00%, 5/1/24 | | | 750,000 | | | | 781,418 | | |
Michigan Finance Authority Revenue
2.21%, 12/1/23 | | | 185,000 | | | | 192,796 | | |
2.31%, 12/1/24 | | | 105,000 | | | | 110,822 | | |
2.37%, 9/1/49, (Put Date 9/1/23) (h) | | | 446,000 | | | | 463,577 | | |
Series A-1, 2.33%, 6/1/30 | | | 1,000,000 | | | | 1,003,960 | | |
Ypsilanti School District, GO, 1.89%, 5/1/24 | | | 510,000 | | | | 520,603 | | |
| | | | 3,073,176 | | |
See notes to financial statements.
11
Victory Portfolios II
VictoryShares USAA Core Short-Term Bond ETF | | Schedule of Portfolio Investments — continued
December 31, 2020 | |
(Unaudited)
Security Description | | Principal
Amount | | Value | |
Mississippi (0.1%): | |
Medical Center Educational Building Corp. Revenue, 0.67%, 6/1/23 | | $ | 280,000 | | | $ | 279,944 | | |
Missouri (0.6%): | |
Missouri State Environmental Improvement & Energy Resources Authority
Revenue, Series B, 0.70%, 1/1/24 | | | 1,495,000 | | | | 1,501,189 | | |
Nebraska (0.7%): | |
City of Grand Island Combined Utility System Revenue, Series B, 0.76%,
8/15/23 | | | 1,000,000 | | | | 1,005,410 | | |
Papio-Missouri River Natural Resource District Special Tax, 2.09%, 12/15/24,
Continuously Callable @ 100 | | | 670,000 | | | | 700,626 | | |
| | | | 1,706,036 | | |
Nevada (0.9%): | |
State of Nevada Department of Business & Industry Revenue, Series A, 0.50%,
1/1/50, (Put Date 7/1/2021) (a) (h) | | | 2,000,000 | | | | 1,999,053 | | |
New Jersey (1.6%): | |
Essex County Improvement Authority Revenue, Series B, 1.96%, 8/1/22 (a) | | | 350,000 | | | | 349,766 | | |
New Jersey Educational Facilities Authority Revenue, 2.47%, 9/1/21 | | | 300,000 | | | | 302,790 | | |
South Jersey Transportation Authority Revenue
Series B, 2.10%, 11/1/24 | | | 750,000 | | | | 753,135 | | |
Series B, 2.20%, 11/1/25 | | | 750,000 | | | | 753,548 | | |
South Jersey Transportation Authority System Revenue, Series B, 3.02%,
11/1/25 | | | 425,000 | | | | 443,012 | | |
Township of Weehawken, GO, 1.10%, 12/30/21 | | | 1,501,000 | | | | 1,503,942 | | |
| | | | 4,106,193 | | |
New York (1.1%): | |
County of Suffolk, GO
Series C, 1.05%, 6/15/23 | | | 1,250,000 | | | | 1,250,375 | | |
Series D, 1.30%, 6/25/21 | | | 500,000 | | | | 502,030 | | |
Madison County Capital Resource Corp. Revenue, 2.18%, 7/1/23 | | | 500,000 | | | | 516,815 | | |
New York State Dormitory Authority Revenue, Series B, 3.18%, 3/15/22 | | | 500,000 | | | | 515,440 | | |
| | | | 2,784,660 | | |
Ohio (0.1%): | |
Hamilton County Health Care Facilities Revenue, 2.37%, 6/1/22 | | | 325,000 | | | | 332,628 | | |
Oklahoma (1.1%): | |
Oklahoma Turnpike Authority Revenue
Series B, 0.49%, 1/1/22 | | | 750,000 | | | | 749,580 | | |
Series B, 0.63%, 1/1/23 | | | 560,000 | | | | 560,325 | | |
The University of Oklahoma Revenue
Series B, 0.93%, 7/1/24 | | | 350,000 | | | | 351,743 | | |
Series C, 0.72%, 7/1/23 | | | 1,250,000 | | | | 1,252,875 | | |
| | | | 2,914,523 | | |
Pennsylvania (0.4%): | |
School District of Scranton, GO (INS — Build America Mutual Assurance Co.),
2.46%, 4/1/22 | | | 500,000 | | | | 510,210 | | |
State Public School Building Authority Revenue, 2.75%, 4/1/25 | | | 500,000 | | | | 517,875 | | |
| | | | 1,028,085 | | |
See notes to financial statements.
12
Victory Portfolios II
VictoryShares USAA Core Short-Term Bond ETF | | Schedule of Portfolio Investments — continued
December 31, 2020 | |
(Unaudited)
Security Description | | Principal
Amount | | Value | |
Rhode Island (0.2%): | |
Rhode Island Commerce Corp. Revenue, 2.86%, 5/1/24 | | $ | 500,000 | | | $ | 530,815 | | |
South Carolina (0.2%): | |
Charleston Educational Excellence Finance Corp. Revenue, 0.65%, 12/1/23 | | | 600,000 | | | | 602,934 | | |
Tennessee (0.2%): | |
Metropolitan Government Nashville & Davidson County Sports Authority
Revenue, 1.03%, 8/1/24 | | | 600,000 | | | | 603,810 | | |
Texas (4.8%): | |
Boerne School District, GO
0.64%, 2/1/24 | | | 400,000 | | | | 399,708 | | |
0.79%, 2/1/25 | | | 250,000 | | | | 250,163 | | |
Central Texas Turnpike System Revenue, Series B, 1.98%, 8/15/42, (Put Date
8/15/22) (h) | | | 1,000,000 | | | | 1,005,270 | | |
City of Houston, GO
2.62%, 3/1/21 | | | 150,000 | | | | 150,546 | | |
2.77%, 3/1/22 | | | 150,000 | | | | 154,149 | | |
Clear Creek Independent School District, GO, Series B, 5.00%, 2/15/24 | | | 1,000,000 | | | | 1,131,780 | | |
Dallas-Fort Worth International Airport Revenue, 2.04%, 11/1/24 | | | 750,000 | | | | 784,800 | | |
Denton Independent School District, GO, Series A, 0.75%, 8/15/24 | | | 500,000 | | | | 486,645 | | |
Harris County Cultural Education Facilities Finance Corp. Revenue
1.59%, 11/15/23 | | | 675,000 | | | | 679,151 | | |
1.84%, 11/15/24 | | | 500,000 | | | | 505,045 | | |
Series B, 2.30%, 5/15/24 | | | 600,000 | | | | 619,968 | | |
Lubbock Texas Water & Wastewater System Revenue, Series B, 1.93%, 2/15/24 | | | 750,000 | | | | 777,285 | | |
North Texas Tollway Authority Revenue, 0.92%, 1/1/24 | | | 1,000,000 | | | | 1,003,090 | | |
Port of Port Arthur Navigation District Revenue, Series B, 0.17%, 4/1/40,
Continuously Callable @ 100 (f) | | | 500,000 | | | | 500,000 | | |
State of Texas, GO, 3.11%, 10/1/23 | | | 500,000 | | | | 537,845 | | |
Tarrant County Cultural Education Facilities Finance Corp. Revenue
1.07%, 9/1/23 (d) | | | 525,000 | | | | 526,323 | | |
1.36%, 9/1/24 (d) | | | 700,000 | | | | 704,564 | | |
Texas A&M University Revenue, Series A, 2.95%, 5/15/23 | | | 500,000 | | | | 530,945 | | |
White Settlement Independent School District, GO (NBGA — Texas Permanent
School Fund), Series A, 1.01%, 8/15/25 | | | 920,000 | | | | 878,315 | | |
| | | | 11,625,592 | | |
Virginia (1.4%): | |
County of Arlington, GO, Series B, 0.64%, 8/1/24 | | | 2,000,000 | | | | 2,016,599 | | |
Virginia Small Business Financing Authority Revenue, 2.25%, 7/1/50,
(Put Date 12/29/22) (a) (h) | | | 1,250,000 | | | | 1,252,263 | | |
| | | | 3,268,862 | | |
Washington (0.2%): | |
Washington State University Revenue, Series A, 0.86%, 10/1/23 | | | 480,000 | | | | 478,781 | | |
West Virginia (0.6%): | |
Tobacco Settlement Finance Authority Revenue, Series A, 1.19%, 6/1/23 | | | 1,500,000 | | | | 1,501,380 | | |
See notes to financial statements.
13
Victory Portfolios II
VictoryShares USAA Core Short-Term Bond ETF | | Schedule of Portfolio Investments — continued
December 31, 2020 | |
(Unaudited)
Security Description | | Shares or
Principal
Amount | | Value | |
Wisconsin (0.2%): | |
Public Finance Authority Revenue (LOC — Citizens Financial Group), 3.75%,
2/1/22, Continuously Callable @ 100 | | $ | 500,000 | | | $ | 500,465 | | |
Total Municipal Bonds (Cost $57,192,318) | | | 58,000,679 | | |
U.S. Treasury Obligations (0.2%) | |
U.S. Treasury Notes, 1.13%, 7/31/21 (l) | | | 470,000 | | | | 472,754 | | |
Total U.S. Treasury Obligations (Cost $465,564) | | | 472,754 | | |
Commercial Papers (13.8%) | |
Albemarle Corp., 0.44%, 1/19/21 (i) | | | 2,400,000 | | | | 2,399,440 | | |
Ameren Corp., 0.15%, 1/4/21 (i) | | | 2,400,000 | | | | 2,399,960 | | |
American Honda Finance, 0.20%, 1/7/21 (i) | | | 870,000 | | | | 869,966 | | |
American Honda Finance, 0.20%, 1/6/21 (i) | | | 1,600,000 | | | | 1,599,947 | | |
CenterPoint Energy Resources Corp., 0.12%, 1/11/21 (i) | | | 2,000,000 | | | | 1,999,927 | | |
Dominion Resources, Inc., 0.16%, 1/12/21 (i) | | | 700,000 | | | | 699,962 | | |
Enable Midstream Partners LP, 0.40%, 1/5/21 (i) | | | 1,000,000 | | | | 999,944 | | |
Energy Transfer Operating LP, 0.44%, 1/21/21 (i) | | | 1,400,000 | | | | 1,399,639 | | |
Eversource Energy, 0.15%, 1/4/21 (a) (i) | | | 1,500,000 | | | | 1,499,975 | | |
Hyundai Capital America, 0.15%, 1/6/21 (i) | | | 700,000 | | | | 699,983 | | |
Hyundai Capital America, 0.15%, 1/7/21 (a) (i) | | | 1,700,000 | | | | 1,699,950 | | |
Intercontinental Exchange, Inc., 0.32%, 1/4/21 (i) | | | 1,500,000 | | | | 1,499,948 | | |
Jabil, Inc., 0.62%, 1/4/21 (i) | | | 2,400,000 | | | | 2,399,835 | | |
National Rural Utilities Cooperative Finance Corp., 0.14%, 1/29/21 (i) | | | 2,400,000 | | | | 2,399,739 | | |
Plains All American Pipeline, 0.15%, 1/6/21 (i) | | | 1,000,000 | | | | 999,975 | | |
Plains Midstream Canada, 0.47%, 1/14/21 (i) | | | 1,400,000 | | | | 1,399,745 | | |
Public Service Enterprise, 0.19%, 1/20/21 (i) | | | 500,000 | | | | 499,948 | | |
Puget Sound Energy, Inc., 0.17%, 1/14/21 (i) | | | 2,100,000 | | | | 2,099,864 | | |
Puget Sound Energy, Inc., 0.15%, 1/7/21 (i) | | | 266,000 | | | | 265,992 | | |
Starbucks Corp., 0.15%, 1/5/21 (i) | | | 250,000 | | | | 249,995 | | |
TransCanada PipeLine USA Ltd., 0.17%, 1/14/21 (a) (i) | | | 2,400,000 | | | | 2,399,843 | | |
Viatris, Inc., 0.65%, 3/22/21 (a) (i) | | | 1,500,000 | | | | 1,497,803 | | |
Wisconsin Power & Light Co., 0.10%, 1/4/21 (i) | | | 2,400,000 | | | | 2,399,973 | | |
Total Commercial Papers (Cost $34,380,577) | | | 34,381,353 | | |
Collateral for Securities Loaned^ (0.8%) | |
BlackRock Liquidity Funds TempFund Portfolio, Institutional Class, 0.08% (j) | | | 32,458 | | | | 32,458 | | |
Fidelity Investments Money Market Government Portfolio I Shares, 0.01% (j) | | | 1,115,110 | | | | 1,115,110 | | |
Goldman Sachs Financial Square Prime Obligations Fund, Institutional Class,
0.04% (j) | | | 16,198 | | | | 16,198 | | |
JPMorgan Prime Money Market Fund, Capital Class, 0.12% (j) | | | 129,158 | | | | 129,158 | | |
Morgan Stanley Institutional Liquidity Prime Portfolio, Institutional Class,
0.09% (j) | | | 580,718 | | | | 580,718 | | |
Total Collateral for Securities Loaned (Cost $1,873,642) | | | 1,873,642 | | |
Total Investments (Cost $245,458,206) — 100.2% | | | 248,906,472 | | |
Liabilities in excess of other assets — (0.2)% | | | (546,235 | ) | |
NET ASSETS — 100.00% | | $ | 248,360,237 | | |
See notes to financial statements.
14
Victory Portfolios II
VictoryShares USAA Core Short-Term Bond ETF | | Schedule of Portfolio Investments — continued
December 31, 2020 | |
(Unaudited)
^ Purchased with cash collateral from securities on loan.
(a) Rule 144A security or other security that is restricted as to resale to institutional investors. The Fund's Adviser has deemed this security to be liquid based upon procedures approved by the Board of Trustees. As of December 31, 2020, the fair value of these securities was $54,762,020 and amounted to 22.0% of net assets.
(b) Variable or Floating-Rate Security. Rate disclosed is as of December 31, 2020.
(c) The rate for certain asset-backed and mortgage-backed securities may vary based on factors relating to the pool of assets underlying the security. The rate disclosed is the rate in effect at December 31, 2020.
(d) Security or a portion of the security purchased on a delayed-delivery and/or when-issued basis.
(e) All or a portion of this security is on loan.
(f) Variable Rate Demand Notes that provide the rights to sell the security at face value on either that day or within the rate-reset period. The interest rate is reset on the put date at a stipulated daily, weekly, monthly, quarterly, or other specified time interval to reflect current market conditions. These securities do not indicate a reference rate and spread in their description.
(g) Stepped-coupon security converts to coupon form on 8/15/21 with a rate of 2.715%.
(h) Put Bond.
(i) Rate represents the effective yield at December 31, 2020.
(j) Rate disclosed is the daily yield on December 31, 2020.
(k) The rates for this senior secured loan will be known on settlement date of the loan, subsequent to this report date. Senior secured loans have rates that will fluctuate over time in line with prevailing interest rates.
(l) All or a portion of this security has been segregated as collateral for securities purchased on a when-issued basis.
bps — Basis points
Continuously callable — Investment is continuously callable or will be continuously callable on any date after the first call date until its maturity.
GO — General Obligation
H15T5Y — 5 Year Treasury Constant Maturity Rate, rate disclosed as of December 31, 2020.
IDA — Industrial Development Authority
LIBOR — London InterBank Offered Rate
LIBOR01M — 1 Month US Dollar LIBOR, rate disclosed as of December 31, 2020, based on the last reset date of the security
LIBOR03M — 3 Month US Dollar LIBOR, rate disclosed as of December 31, 2020, based on the last reset date of the security
LLC — Limited Liability Company
LOC — Letter of Credit
LP — Limited Partnership
MTN — Medium Term Note
PLC — Public Limited Company
SOFR — Secured Overnight Financing Rate
Credit Enhancements — Adds the financial strength of the provider of the enhancement to support the issuer's ability to repay the principal and interest payments when due. The enhancement may be provided by a high-quality bank, insurance company or other corporation, or a collateral trust. The enhancements do not guarantee the market values of the securities.
See notes to financial statements.
15
Victory Portfolios II
VictoryShares USAA Core Short-Term Bond ETF | | Schedule of Portfolio Investments — continued
December 31, 2020 | |
(Unaudited)
INS Principal and interest payments are insured by the name listed. Although bond insurance reduces the risk of loss due to default by an issuer, such bonds remain subject to the risk that value may fluctuate for other reasons, and there is no assurance that the insurance company will meet its obligations.
LOC Principal and interest payments are guaranteed by a bank letter of credit or other bank credit agreement.
NBGA Principal and interest payments or, under certain circumstances, underlying mortgages, are guaranteed by a nonbank guarantee agreement from the name listed.
See notes to financial statements.
16
Victory Portfolios II
VictoryShares USAA Core Intermediate-Term Bond ETF | | Schedule of Portfolio Investments
December 31, 2020 | |
(Unaudited)
Security Description | | Principal
Amount | | Value | |
Asset-Backed Securities (6.6%) | |
American Express Credit Account Master Trust, Series 2019-2, Class B,
2.86%, 11/15/24 | | $ | 2,076,000 | | | $ | 2,136,755 | | |
AmeriCredit Automobile Receivables Trust, Series 2017-2, Class D, 3.42%,
4/18/23, Callable 12/18/21 @ 100 | | | 1,000,000 | | | | 1,027,331 | | |
ARI Fleet Lease Trust, Series 2020-A, Class A3, 1.80%, 8/15/28, Callable
3/15/23 @ 100 (a) | | | 900,000 | | | | 920,009 | | |
Avis Budget Rental Car Funding AESOP LLC, Series 2016-2A, Class B,
3.36%, 11/20/22, Callable 12/20/21 @ 100 (a) | | | 1,250,000 | | | | 1,263,054 | | |
Avis Budget Rental Car Funding AESOP LLC, Series 2019-2A, Class B, 3.55%,
9/22/25, Callable 10/20/24 @ 100 (a) | | | 500,000 | | | | 521,094 | | |
Bank of The West Auto Trust, Series 2019-1, Class C, 2.90%, 4/15/25,
Callable 7/15/23 @ 100 (a) | | | 1,062,000 | | | | 1,111,908 | | |
Bank of The West Auto Trust, Series 2017-1, Class C, 2.96%, 2/15/24,
Callable 3/15/22 @ 100 (a) | | | 500,000 | | | | 513,149 | | |
BCC Funding Corp. XVI LLC, Series 2019-1A, Class A2, 2.46%, 8/20/24,
Callable 7/20/23 @ 100 (a) | | | 754,630 | | | | 762,566 | | |
BCC Funding XVII LLC, Series 2020-1, Class A2, 0.91%, 8/20/25, Callable
7/20/24 @ 100 (a) | | | 1,250,000 | | | | 1,253,544 | | |
Canadian Pacer Auto Receivables Trust, Series 2018-2A, Class B, 3.63%,
1/19/24, Callable 2/19/22 @ 100 (a) | | | 500,000 | | | | 514,037 | | |
Canadian Pacer Auto Receivables Trust, Series 2020-1A, Class A4, 1.89%,
3/19/25, Callable 7/19/23 @ 100 (a) | | | 433,000 | | | | 445,303 | | |
CarMax Auto Owner Trust, Series 2020-1, Class B, 2.21%, 9/15/25, Callable
11/15/23 @ 100 | | | 1,275,000 | | | | 1,326,477 | | |
Credit Acceptance Auto Loan Trust, Series 2020-1A, Class B, 2.39%,
4/16/29 (a) | | | 823,000 | | | | 854,806 | | |
Dell Equipment Finance Trust, Series 2020-1, Class A3, 2.24%, 2/22/23,
Callable 10/22/22 @ 100 (a) | | | 687,500 | | | | 706,388 | | |
DT Auto Owner Trust, Series 2018-2A, Class D, 4.15%, 3/15/24, Callable
6/15/22 @ 100 (a) | | | 2,155,000 | | | | 2,207,234 | | |
Enterprise Fleet Financing LLC, Series 2020-1, Class A3, 1.86%, 12/22/25 (a) | | | 820,000 | | | | 847,887 | | |
Exeter Automobile Receivables Trust, Series 2020-1A, Class B, 2.26%,
4/15/24, Callable 6/15/23 @ 100 (a) | | | 513,000 | | | | 519,032 | | |
Exeter Automobile Receivables Trust, Series 2017-3A, Class D, 5.28%,
10/15/24, Callable 6/15/22 @ 100 (a) | | | 500,000 | | | | 525,114 | | |
Exeter Automobile Receivables Trust, Series 2019-1A, Class C, 3.82%,
12/16/24, Callable 1/15/23 @ 100 (a) | | | 1,000,000 | | | | 1,014,906 | | |
ExteNet LLC, Series 2019-1A, Class A2, 3.20%, 7/26/49, Callable
1/25/23 @ 100 (a) | | | 500,000 | | | | 518,255 | | |
Flagship Credit Auto Trust, Series 2020-2, Class D, 5.75%, 4/15/26,
Callable 2/15/24 @ 100 (a) | | | 1,000,000 | | | | 1,128,468 | | |
Ford Credit Auto Owner Trust, Series 2020-1, Class B, 2.29%, 8/15/31,
Callable 2/15/25 @ 100 (a) | | | 1,500,000 | | | | 1,580,045 | | |
GM Financial Consumer Automobile Receivables Trust, Series 2020-1,
Class A4, 1.90%, 3/17/25, Callable 5/16/23 @ 100 | | | 1,000,000 | | | | 1,034,423 | | |
GM Financial Consumer Automobile Receivables Trust, Series 2020-2,
Class A4, 1.74%, 8/18/25, Callable 10/16/23 @ 100 | | | 750,000 | | | | 775,316 | | |
Hertz Vehicle Financing II LP, Series 2019-3A, Class A, 2.67%, 12/26/25 (a) | | | 187,986 | | | | 188,220 | | |
See notes to financial statements.
17
Victory Portfolios II
VictoryShares USAA Core Intermediate-Term Bond ETF | | Schedule of Portfolio Investments — continued
December 31, 2020 | |
(Unaudited)
Security Description | | Principal
Amount | | Value | |
HPEFS Equipment Trust, Series 2020-1A, Class B, 1.89%, 2/20/30, Callable
2/20/23 @ 100 (a) | | $ | 385,000 | | | $ | 392,741 | | |
HPEFS Equipment Trust, Series 2019-1A, Class C, 2.49%, 9/20/29, Callable
7/20/22 @ 100 (a) | | | 500,000 | | | | 509,527 | | |
Hyundai Auto Receivables Trust, Series 2020-C, Class B, 0.81%, 11/16/26,
Callable 3/15/25 @ 100 | | | 1,271,000 | | | | 1,271,839 | | |
InSite Issuer LLC, Series 2016-1A, Class A, 2.88%, 11/15/46, Callable
11/15/22 @ 100 (a) | | | 1,000,000 | | | | 1,032,270 | | |
John Deere Owner Trust, Series 2020-A, Class A4, 1.21%, 11/16/26,
Callable 8/15/23 @ 100 | | | 2,000,000 | | | | 2,036,931 | | |
Kubota Credit Owner Trust, Series 2020-1A, Class A4, 2.26%, 7/15/26,
Callable 10/15/23 @ 100 (a) | | | 433,000 | | | | 453,243 | | |
MMAF Equipment Finance LLC, Series 2017-B, Class A4, 2.41%, 11/15/24,
Callable 10/15/27 @ 100 (a) | | | 1,000,000 | | | | 1,015,132 | | |
Navient Student Loan Trust, Series 2018-2A, Class B,
1.30% (LIBOR01M+115bps), 3/25/67, Callable 4/25/33 @ 100 (a) (b) | | | 1,000,000 | | | | 923,020 | | |
NP SPE LLC, Series 2019-1A, Class A2, 3.24%, 9/20/49 (a) | | | 500,000 | | | | 501,971 | | |
OSCAR US Funding Trust LLC, Series 2018-1A, Class A3, 3.23%, 5/10/22 (a) | | | 106,392 | | | | 106,795 | | |
Pawnee Equipment Receivables LLC, Series 2020-1, Class B, 1.84%, 1/15/26,
Callable 4/15/24 @ 100 (a) | | | 1,000,000 | | | | 1,004,553 | | |
Prestige Auto Receivables Trust, Series 2020-1A, Class C, 1.31%, 11/16/26,
Callable 12/15/24 @ 100 (a) | | | 929,000 | | | | 929,106 | | |
PSNH Funding LLC, Series 2018-1, Class A3, 3.81%, 2/1/35 | | | 1,000,000 | | | | 1,149,630 | | |
Santander Consumer Auto Receivables Trust, Series 2020-AA, Class D,
5.49%, 4/15/26, Callable 5/15/24 @ 100 (a) | | | 1,000,000 | | | | 1,098,564 | | |
SCF Equipment Leasing LLC, Series 2019-1A, Class B, 3.49%, 1/20/26,
Callable 1/20/21 @ 100 (a) | | | 500,000 | | | | 500,467 | | |
SCF Equipment Leasing LLC, Series 2019-1A, Class A2, 3.23%, 10/20/24,
Callable 1/20/21 @ 100 (a) | | | 327,269 | | | | 327,573 | | |
SLM Student Loan Trust, Series 2006-10, Class B, 0.43% (LIBOR03M+22bps),
3/25/44, Callable 4/25/32 @ 100 (b) | | | 234,537 | | | | 210,356 | | |
SLM Student Loan Trust, Series 2007-1, Class B, 0.43% (LIBOR03M+22bps),
1/27/42, Callable 1/25/29 @ 100 (b) | | | 372,122 | | | | 340,210 | | |
Synchrony Credit Card Master Note Trust, Series 2018-2, Class A, 3.47%,
5/15/26 | | | 2,000,000 | | | | 2,142,105 | | |
Transportation Finance Equipment Trust, Series 2019-1, Class A4, 1.88%,
3/25/24, Callable 7/23/23 @ 100 (a) | | | 1,280,000 | | | | 1,317,610 | | |
VB-S1 Issuer LLC, Series 2018-1A, Class C, 3.41%, 2/15/48, Callable
2/15/22 @ 100 (a) | | | 500,000 | | | | 513,666 | | |
Westlake Automobile Receivables Trust, Series 2018-2A, Class D, 4.00%,
1/16/24, Callable 3/15/22 @ 100 (a) | | | 507,000 | | | | 517,430 | | |
Westlake Automobile Receivables Trust, Series 2018-3A, Class D, 4.00%,
10/16/23, Callable 5/15/22 @ 100 (a) | | | 860,000 | | | | 886,423 | | |
Total Asset-Backed Securities (Cost $42,080,842) | | | 42,876,483 | | |
Collateralized Mortgage Obligations (2.9%) | |
Benchmark Mortgage Trust, Series 2020-B17, Class ASB, 2.18%, 3/15/53,
Callable 11/15/29 @ 100 | | | 1,000,000 | | | | 1,053,887 | | |
BX Commercial Mortgage Trust, Series 2019-XL, Class B,
1.24% (LIBOR01M+108bps), 10/15/36 (a) (b) | | | 243,970 | | | | 243,949 | | |
See notes to financial statements.
18
Victory Portfolios II
VictoryShares USAA Core Intermediate-Term Bond ETF | | Schedule of Portfolio Investments — continued
December 31, 2020 | |
(Unaudited)
| Security Description | | Shares or
Principal
Amount | | Value | |
BX Trust, Series 2019-OC11, Class A, 3.20%, 12/9/41 (a) | | $ | 923,077 | | | $ | 1,010,777 | | |
Citigroup Commercial Mortgage Trust, Series 2017-P8, Class AS, 3.79%,
9/15/50 (c) | | | 500,000 | | | | 565,853 | | |
Citigroup Commercial Mortgage Trust, Series 2020-GC46, Class AAB, 2.61%,
1/15/53 | | | 732,000 | | | | 794,798 | | |
Citigroup Commercial Mortgage Trust, Series 2019-SMRT, Class C, 4.68%,
1/10/24 (a) | | | 500,000 | | | | 530,607 | | |
Citigroup Commercial Mortgage Trust, Series 2020-555, Class A, 2.65%,
12/10/41 (a) | | | 2,000,000 | | | | 2,112,333 | | |
COMM Mortgage Trust, Series 2015-LC23, Class AM, 4.16%, 10/10/48 (c) | | | 250,000 | | | | 273,104 | | |
COMM Mortgage Trust, Series 2014-277P, Class A, 3.61%, 8/10/49, Callable
8/10/24 @ 100 (a) (c) | | | 1,000,000 | | | | 1,079,953 | | |
COMM Mortgage Trust, Series 2020-CX, Class A, 2.17%, 11/10/46 (a) | | | 1,500,000 | | | | 1,564,060 | | |
COMM Mortgage Trust, Series 2015-PC1, Class B, 4.43%, 7/10/50, Callable
6/10/25 @ 100 (c) | | | 865,000 | | | | 909,958 | | |
DBJPM Mortgage Trust, Series 2016-SFC, Class A, 2.83%, 8/10/36 (a) | | | 250,000 | | | | 246,029 | | |
FREMF Mortgage Trust, Series 2019-K99, Class B, 3.65%, 9/25/29, Callable
9/25/29 @ 100 (a) (c) | | | 1,000,000 | | | | 1,106,275 | | |
GS Mortgage Securities Corp. Trust, Series 2012-ALOH, Class A, 3.55%,
4/10/34 (a) | | | 1,000,000 | | | | 1,008,904 | | |
GS Mortgage Securities Corp. Trust, Series 2017-GPTX, Class A, 2.86%,
5/10/34 (a) | | | 1,000,000 | | | | 993,199 | | |
GS Mortgage Securities Trust, Series 2020-GC45, Class AAB, 2.84%, 2/13/53 | | | 357,000 | | | | 392,763 | | |
Houston Galleria Mall Trust, Series 2015-HGLR, Class A1A2, 3.09%, 3/5/37 (a) | | | 1,000,000 | | | | 1,023,966 | | |
JP Morgan Chase Commercial Mortgage Securities Trust, Series 2010-C2,
Class B, 5.07%, 11/15/43 (a) (c) | | | 979,000 | | | | 977,954 | | |
JP Morgan Chase Commercial Mortgage Securities Trust, Series 2010-C2,
Class C, 5.65%, 11/15/43 (a) (c) | | | 813,000 | | | | 701,469 | | |
Manhattan West, Series 2020-1MW, Class A, 2.13%, 9/10/40 (a) | | | 750,000 | | | | 784,146 | | |
VLS Commercial Mortgage Trust, Series 2020-LAB, Class A, 2.13%,
10/10/42 (a) | | | 1,000,000 | | | | 1,036,391 | | |
Wells Fargo Commercial Mortgage Trust, Series 2018-AUS, Class A, 4.06%,
7/17/36 (a) (c) | | | 250,000 | | | | 278,736 | | |
Total Collateralized Mortgage Obligations (Cost $18,427,887) | | | 18,689,111 | | |
Common Stocks (0.0%) (d) | |
Energy (0.0%): (d) | |
Whiting Petroleum Corp. (e) | | | 7,782 | | | | 194,550 | | |
Total Common Stocks (Cost $500,000) | | | 194,550 | | |
Corporate Bonds (31.6%) | |
Communication Services (1.9%): | |
AT&T, Inc., 4.35%, 3/1/29, Callable 12/1/28 @ 100 | | | 1,000,000 | | | | 1,192,670 | | |
CenturyLink, Inc., 4.50%, 1/15/29, Callable 1/15/24 @ 102.25 (a) | | | 1,000,000 | | | | 1,017,400 | | |
Charter Communications Operating LLC/Charter Communications
Operating Capital
4.50%, 2/1/24, Callable 1/1/24 @ 100 | | | 500,000 | | | | 555,040 | | |
3.75%, 2/15/28, Callable 11/15/27 @ 100 | | | 500,000 | | | | 560,710 | | |
2.30%, 2/1/32, Callable 11/1/31 @ 100 | | | 500,000 | | | | 499,340 | | |
See notes to financial statements.
19
Victory Portfolios II
VictoryShares USAA Core Intermediate-Term Bond ETF | | Schedule of Portfolio Investments — continued
December 31, 2020 | |
(Unaudited)
Security Description | | Principal
Amount | | Value | |
Comcast Corp., 3.55%, 5/1/28, Callable 2/1/28 @ 100 | | $ | 750,000 | | | $ | 863,978 | | |
Fox Corp., 4.71%, 1/25/29, Callable 10/25/28 @ 100 | | | 1,000,000 | | | | 1,214,190 | | |
Meredith Corp., 6.88%, 2/1/26, Callable 2/11/21 @ 103.44 | | | 500,000 | | | | 489,805 | | |
The Walt Disney Co., 2.20%, 1/13/28 | | | 666,000 | | | | 711,355 | | |
T-Mobile USA, Inc.
4.75%, 2/1/28, Callable 2/1/23 @ 102.38 | | | 643,000 | | | | 690,826 | | |
3.88%, 4/15/30, Callable 1/15/30 @ 100 (a) (l) | | | 1,039,000 | | | | 1,201,178 | | |
2.25%, 11/15/31, Callable 8/15/31 @ 100 (a) | | | 1,000,000 | | | | 1,025,700 | | |
Verizon Communications, Inc.
3.15%, 3/22/30, Callable 12/22/29 @ 100 | | | 200,000 | | | | 224,270 | | |
1.75%, 1/20/31, Callable 10/20/30 @ 100 | | | 1,000,000 | | | | 996,280 | | |
ViacomCBS, Inc., 3.38%, 2/15/28, Callable 11/15/27 @ 100 | | | 1,000,000 | | | | 1,123,310 | | |
| | | | 12,366,052 | | |
Consumer Discretionary (1.8%): | |
AutoNation, Inc., 4.75%, 6/1/30, Callable 3/1/30 @ 100 | | | 600,000 | | | | 722,784 | | |
AutoZone, Inc., 3.75%, 6/1/27, Callable 3/1/27 @ 100 | | | 500,000 | | | | 574,400 | | |
D.R. Horton, Inc., 4.75%, 2/15/23, Callable 11/15/22 @ 100 (l) | | | 500,000 | | | | 538,245 | | |
Daimler Finance North America LLC
3.70%, 5/4/23 (a) | | | 1,000,000 | | | | 1,072,320 | | |
3.45%, 1/6/27 (a) | | | 1,000,000 | | | | 1,115,150 | | |
General Motors Co., 6.80%, 10/1/27, Callable 8/1/27 @ 100 (l) | | | 750,000 | | | | 964,755 | | |
Hasbro, Inc.
3.55%, 11/19/26, Callable 9/19/26 @ 100 | | | 600,000 | | | | 669,618 | | |
3.90%, 11/19/29, Callable 8/19/29 @ 100 (l) | | | 1,350,000 | | | | 1,532,615 | | |
Murphy Oil USA, Inc., 4.75%, 9/15/29, Callable 9/15/24 @ 102.38 | | | 1,000,000 | | | | 1,065,340 | | |
Newell Brands, Inc., 4.70%, 4/1/26, Callable 1/1/26 @ 100 | | | 500,000 | | | | 551,175 | | |
O'Reilly Automotive, Inc., 4.20%, 4/1/30, Callable 1/1/30 @ 100 | | | 500,000 | | | | 602,915 | | |
VF Corp., 2.95%, 4/23/30, Callable 1/23/30 @ 100 | | | 500,000 | | | | 552,555 | | |
Volkswagen Group of America Finance LLC, 3.20%, 9/26/26, Callable
7/26/26 @ 100 (a) | | | 1,000,000 | | | | 1,105,960 | | |
| | | | 11,067,832 | | |
Consumer Staples (2.3%): | |
Altria Group, Inc., 3.40%, 5/6/30, Callable 2/6/30 @ 100 | | | 435,000 | | | | 486,117 | | |
Anheuser-Busch InBev Worldwide, Inc.
3.65%, 2/1/26, Callable 11/1/25 @ 100 | | | 1,000,000 | | | | 1,131,050 | | |
4.38%, 4/15/38, Callable 10/15/37 @ 100 | | | 500,000 | | | | 617,370 | | |
5.45%, 1/23/39, Callable 7/23/38 @ 100 | | | 500,000 | | | | 677,090 | | |
BAT Capital Corp.
2.73%, 3/25/31, Callable 12/25/30 @ 100 | | | 1,000,000 | | | | 1,035,230 | | |
4.39%, 8/15/37, Callable 2/15/37 @ 100 | | | 1,250,000 | | | | 1,398,937 | | |
Bunge Ltd. Finance Corp.
4.35%, 3/15/24, Callable 2/15/24 @ 100 | | | 500,000 | | | | 552,420 | | |
3.25%, 8/15/26, Callable 5/15/26 @ 100 | | | 502,000 | | | | 558,701 | | |
Constellation Brands, Inc., 3.50%, 5/9/27, Callable 2/9/27 @ 100 | | | 750,000 | | | | 851,160 | | |
General Mills, Inc., 4.55%, 4/17/38, Callable 10/17/37 @ 100 | | | 1,000,000 | | | | 1,290,609 | | |
Kraft Heinz Foods Co., 3.75%, 4/1/30, Callable 1/1/30 @ 100 (a) | | | 1,000,000 | | | | 1,069,710 | | |
Mars, Inc., 3.88%, 4/1/39, Callable 10/1/38 @ 100 (a) | | | 1,000,000 | | | | 1,221,270 | | |
McCormick & Co., Inc., 2.50%, 4/15/30, Callable 1/15/30 @ 100 | | | 375,000 | | | | 401,693 | | |
Mondelez International, Inc., 2.75%, 4/13/30, Callable 1/13/30 @ 100 | | | 375,000 | | | | 411,818 | | |
See notes to financial statements.
20
Victory Portfolios II
VictoryShares USAA Core Intermediate-Term Bond ETF | | Schedule of Portfolio Investments — continued
December 31, 2020 | |
(Unaudited)
Security Description | | Principal
Amount | | Value | |
PepsiCo, Inc., 2.75%, 3/19/30, Callable 12/19/29 @ 100 | | $ | 1,000,000 | | | $ | 1,117,640 | | |
Smithfield Foods, Inc., 5.20%, 4/1/29, Callable 1/1/29 @ 100 (a) | | | 500,000 | | | | 597,075 | | |
Sysco Corp., 5.95%, 4/1/30, Callable 1/1/30 @ 100 | | | 391,000 | | | | 514,016 | | |
The Kroger Co., 3.50%, 2/1/26, Callable 11/1/25 @ 100 | | | 500,000 | | | | 562,165 | | |
| | | | 14,494,071 | | |
Energy (5.0%): | |
Boardwalk Pipelines LP
4.45%, 7/15/27, Callable 4/15/27 @ 100 | | | 1,500,000 | | | | 1,691,129 | | |
4.80%, 5/3/29, Callable 2/3/29 @ 100 (l) | | | 500,000 | | | | 572,495 | | |
Buckeye Partners LP, 4.13%, 12/1/27, Callable 9/1/27 @ 100 | | | 1,000,000 | | | | 1,020,430 | | |
Cameron LNG LLC, 3.30%, 1/15/35, Callable 9/15/34 @ 100 (a) | | | 1,091,000 | | | | 1,227,626 | | |
Chevron Phillips Chemical Co. LLC/Chevron Phillips Chemical Co. LP
3.30%, 5/1/23, Callable 4/1/23 @ 100 (a) | | | 250,000 | | | | 264,738 | | |
3.70%, 6/1/28, Callable 3/1/28 @ 100 (a) | | | 250,000 | | | | 285,688 | | |
Continental Resources, Inc., 4.50%, 4/15/23, Callable 1/15/23 @ 100 (l) | | | 109,000 | | | | 112,331 | | |
Diamondback Energy, Inc., 3.25%, 12/1/26, Callable 10/1/26 @ 100 | | | 1,000,000 | | | | 1,068,750 | | |
Enable Midstream Partners LP, 4.15%, 9/15/29, Callable 6/15/29 @ 100 | | | 1,000,000 | | | | 985,300 | | |
Energy Transfer Operating LP
3.75%, 5/15/30, Callable 2/15/30 @ 100 | | | 1,000,000 | | | | 1,077,690 | | |
3.23% (LIBOR03M+302bps), 11/1/66, Callable 2/11/21 @ 100 (b) | | | 500,000 | | | | 348,945 | | |
EnLink Midstream Partners LP, 4.85%, 7/15/26, Callable 4/15/26 @ 100 | | | 500,000 | | | | 487,665 | | |
Enterprise Products Operating LLC, 2.80%, 1/31/30, Callable
10/31/29 @ 100 (f) | | | 1,000,000 | | | | 1,085,430 | | |
EOG Resources, Inc., 4.38%, 4/15/30, Callable 1/15/30 @ 100 | | | 231,000 | | | | 281,557 | | |
EQM Midstream Partners LP, 4.75%, 7/15/23, Callable 6/15/23 @ 100 (l) | | | 500,000 | | | | 524,595 | | |
EQT Corp., 8.75%, 2/1/30, Callable 11/1/29 @ 100 (g) | | | 514,000 | | | | 630,627 | | |
Exxon Mobil Corp., 2.61%, 10/15/30, Callable 7/15/30 @ 100 | | | 1,500,000 | | | | 1,638,044 | | |
Florida Gas Transmission Co. LLC, 2.55%, 7/1/30, Callable 4/1/30 @ 100 (a) | | | 750,000 | | | | 790,673 | | |
Gray Oak Pipeline LLC, 3.45%, 10/15/27, Callable 8/15/27 @ 100 (a) | | | 1,334,000 | | | | 1,397,939 | | |
HollyFrontier Corp., 4.50%, 10/1/30, Callable 7/1/30 @ 100 (f) | | | 2,000,000 | | | | 2,108,459 | | |
Marathon Petroleum Corp., 4.70%, 5/1/25, Callable 4/1/25 @ 100 | | | 469,000 | | | | 537,587 | | |
Midwest Connector Capital Co. LLC, 4.63%, 4/1/29, Callable 1/1/29 @ 100 (a) | | | 500,000 | | | | 522,360 | | |
MPLX LP
4.25%, 12/1/27, Callable 9/1/27 @ 100 | | | 500,000 | | | | 584,380 | | |
4.00%, 3/15/28, Callable 12/15/27 @ 100 | | | 750,000 | | | | 863,243 | | |
4.80%, 2/15/29, Callable 11/15/28 @ 100 (l) | | | 250,000 | | | | 300,348 | | |
Murphy Oil Corp., 5.75%, 8/15/25, Callable 2/11/21 @ 104.31 | | | 500,000 | | | | 498,700 | | |
Newfield Exploration Co., 5.38%, 1/1/26, Callable 10/1/25 @ 100 | | | 500,000 | | | | 536,385 | | |
NuStar Logistics LP, 6.00%, 6/1/26, Callable 3/1/26 @ 100 | | | 500,000 | | | | 540,515 | | |
Occidental Petroleum Corp.
3.40%, 4/15/26, Callable 1/15/26 @ 100 | | | 1,000,000 | | | | 953,260 | | |
4.40%, 8/15/49, Callable 2/15/49 @ 100 | | | 500,000 | | | | 421,275 | | |
ONEOK, Inc., 4.55%, 7/15/28, Callable 4/15/28 @ 100 | | | 500,000 | | | | 571,830 | | |
Pioneer Natural Resources Co., 1.90%, 8/15/30, Callable 5/15/30 @ 100 | | | 750,000 | | | | 743,535 | | |
Plains All American Pipeline LP/PAA Finance Corp., 3.55%, 12/15/29,
Callable 9/15/29 @ 100 | | | 2,280,000 | | | | 2,387,182 | | |
Rockies Express Pipeline LLC, 4.95%, 7/15/29, Callable 4/15/29 @ 100 (a) | | | 2,000,000 | | | | 2,078,659 | | |
Sabal Trail Transmission LLC, 4.25%, 5/1/28, Callable 2/1/28 @ 100 (a) | | | 1,000,000 | | | | 1,152,450 | | |
Southwestern Energy Co., 7.75%, 10/1/27, Callable 10/1/22 @ 103.88 | | | 500,000 | | | | 537,075 | | |
See notes to financial statements.
21
Victory Portfolios II
VictoryShares USAA Core Intermediate-Term Bond ETF | | Schedule of Portfolio Investments — continued
December 31, 2020 | |
(Unaudited)
Security Description | | Principal
Amount | | Value | |
Valero Energy Corp., 2.15%, 9/15/27, Callable 7/15/27 @ 100 | | $ | 636,000 | | | $ | 650,844 | | |
Western Midstream Operating LP, 3.10%, 2/1/25, Callable 1/1/25 @ 100 | | | 421,000 | | | | 432,375 | | |
| | | | 31,912,114 | | |
Financials (7.9%): | |
Alexander Funding Trust, 1.84%, 11/15/23 (a) | | | 1,000,000 | | | | 1,011,670 | | |
Amcor Finance USA, Inc., 3.63%, 4/28/26, Callable 1/28/26 @ 100 | | | 1,250,000 | | | | 1,399,063 | | |
American Equity Investment Life Holding Co., 5.00%, 6/15/27, Callable
3/15/27 @ 100 | | | 500,000 | | | | 564,895 | | |
Ares Capital Corp., 4.25%, 3/1/25, Callable 1/1/25 @ 100 | | | 500,000 | | | | 543,100 | | |
Athene Global Funding, 2.80%, 5/26/23 (a) | | | 1,000,000 | | | | 1,044,850 | | |
Athene Holding Ltd., 3.50%, 1/15/31, Callable 10/15/30 @ 100 | | | 1,000,000 | | | | 1,062,580 | | |
AXA Equitable Holdings, Inc., 4.35%, 4/20/28, Callable 1/20/28 @ 100 | | | 1,000,000 | | | | 1,181,690 | | |
Bank of America Corp., 3.70% (LIBOR03M+151bps), 4/24/28, Callable
4/24/27 @ 100 (b) | | | 1,000,000 | | | | 1,140,299 | | |
BB&T Corp., 4.25%, 9/30/24 | | | 750,000 | | | | 835,673 | | |
Belrose Funding Trust, 2.33%, 8/15/30, Callable 5/15/30 @ 100 (a) | | | 1,000,000 | | | | 1,029,320 | | |
BMW US Capital LLC, 3.75%, 4/12/28, Callable 1/12/28 @ 100 (a) | | | 1,000,000 | | | | 1,154,630 | | |
Cadence Bancorp, 4.75% (LIBOR03M+303bps), 6/30/29, Callable
6/30/24 @ 100 (b) | | | 500,000 | | | | 477,825 | | |
Capital One Financial Corp., 3.75%, 7/28/26, Callable 6/28/26 @ 100 | | | 1,000,000 | | | | 1,130,770 | | |
CIT Group, Inc., 5.25%, 3/7/25, Callable 12/7/24 @ 100 | | | 500,000 | | | | 570,730 | | |
Citizens Financial Group, Inc., 2.50%, 2/6/30, Callable 11/6/29 @ 100 | | | 2,000,000 | | | | 2,141,039 | | |
CNO Financial Group, Inc., 5.25%, 5/30/29, Callable 2/28/29 @ 100 | | | 500,000 | | | | 603,085 | | |
Credit Acceptance Corp., 6.63%, 3/15/26, Callable 3/15/22 @ 103.31 | | | 500,000 | | | | 532,450 | | |
Fifth Third Bancorp, 3.95%, 3/14/28, Callable 2/14/28 @ 100 | | | 500,000 | | | | 590,780 | | |
First Citizens BancShares, Inc., 3.37% (SOFR+247bps), 3/15/30, Callable
3/15/25 @ 100 (b) | | | 1,000,000 | | | | 1,008,110 | | |
First Horizon Bank, 5.75%, 5/1/30, Callable 2/1/30 @ 100 | | | 500,000 | | | | 585,380 | | |
Ford Motor Credit Co. LLC
4.54%, 8/1/26, Callable 6/1/26 @ 100 | | | 1,400,000 | | | | 1,487,990 | | |
5.11%, 5/3/29, Callable 2/3/29 @ 100 | | | 500,000 | | | | 557,060 | | |
FS KKR Capital Corp., 4.63%, 7/15/24, Callable 6/15/24 @ 100 | | | 1,000,000 | | | | 1,053,910 | | |
Glencore Funding LLC
4.00%, 3/27/27, Callable 12/27/26 @ 100 (a) | | | 500,000 | | | | 565,345 | | |
2.50%, 9/1/30, Callable 6/1/30 @ 100 (a) | | | 500,000 | | | | 511,030 | | |
Global Atlantic Financial Co., 4.40%, 10/15/29, Callable 7/15/29 @ 100 (a) | | | 1,714,000 | | | | 1,895,529 | | |
Hyundai Capital America
3.40%, 6/20/24 (a) | | | 500,000 | | | | 537,145 | | |
3.50%, 11/2/26, Callable 9/2/26 @ 100 (a) | | | 500,000 | | | | 550,525 | | |
ILFC E-Capital Trust I, 3.23%, 12/21/65, Callable 2/11/21 @ 100 (a) (g) | | | 500,000 | | | | 331,970 | | |
JPMorgan Chase & Co., 2.52% (SOFR+204bps), 4/22/31, Callable
4/22/30 @ 100 (b) | | | 750,000 | | | | 804,930 | | |
KeyBank NA
3.40%, 5/20/26, MTN | | | 500,000 | | | | 560,355 | | |
3.90%, 4/13/29 | | | 1,000,000 | | | | 1,157,389 | | |
KeyCorp, 2.25%, 4/6/27, MTN | | | 500,000 | | | | 535,320 | | |
KKR Group Finance Co. LLC, 3.75%, 7/1/29, Callable 4/1/29 @ 100 (a) | | | 500,000 | | | | 583,200 | | |
Lincoln National Corp., 3.80%, 3/1/28, Callable 12/1/27 @ 100 | | | 500,000 | | | | 577,215 | | |
Main Street Capital Corp., 4.50%, 12/1/22 | | | 500,000 | | | | 524,740 | | |
Mercury General Corp., 4.40%, 3/15/27, Callable 12/15/26 @ 100 | | | 1,000,000 | | | | 1,107,620 | | |
See notes to financial statements.
22
Victory Portfolios II
VictoryShares USAA Core Intermediate-Term Bond ETF | | Schedule of Portfolio Investments — continued
December 31, 2020 | |
(Unaudited)
Security Description | | Principal
Amount | | Value | |
New York Community Bancorp, Inc., 5.90% (LIBOR03M+278bps), 11/6/28,
Callable 11/6/23 @ 100 (b) | | $ | 500,000 | | | $ | 516,885 | | |
Old Republic International Corp., 3.88%, 8/26/26, Callable 7/26/26 @ 100 | | | 500,000 | | | | 574,670 | | |
Pine Street Trust I, 4.57%, 2/15/29, Callable 11/15/28 @ 100 (a) | | | 500,000 | | | | 590,340 | | |
PPL Capital Funding, Inc., 4.13%, 4/15/30, Callable 1/15/30 @ 100 | | | 1,000,000 | | | | 1,191,150 | | |
Prudential Financial, Inc., 4.35%, 2/25/50, Callable 8/25/49 @ 100 | | | 500,000 | | | | 653,840 | | |
Regions Financial Corp., 2.25%, 5/18/25, Callable 4/18/25 @ 100 | | | 750,000 | | | | 795,338 | | |
Santander Holdings USA, Inc.
4.45%, 12/3/21, Callable 11/3/21 @ 100 | | | 250,000 | | | | 258,090 | | |
3.40%, 1/18/23, Callable 12/18/22 @ 100 | | | 250,000 | | | | 262,550 | | |
4.40%, 7/13/27, Callable 4/14/27 @ 100 | | | 750,000 | | | | 854,228 | | |
Synchrony Financial
4.50%, 7/23/25, Callable 4/23/25 @ 100 | | | 500,000 | | | | 562,725 | | |
3.95%, 12/1/27, Callable 9/1/27 @ 100 | | | 500,000 | | | | 561,850 | | |
5.15%, 3/19/29, Callable 12/19/28 @ 100 | | | 500,000 | | | | 604,715 | | |
Synovus Bank/Columbus GA, 4.00% (H15T5Y+363bps), 10/29/30, Callable
10/29/25 @ 100 (b) | | | 500,000 | | | | 527,605 | | |
Synovus Financial Corp., 5.90% (USSW5+338bps), 2/7/29, Callable
2/7/24 @ 100 (b) | | | 500,000 | | | | 538,230 | | |
TCF National Bank, 4.12% (LIBOR03M+238bps), 7/2/29, Callable
7/2/24 @ 100 (b) | | | 1,000,000 | | | | 983,500 | | |
Texas Capital Bank NA, 5.25%, 1/31/26 | | | 250,000 | | | | 268,938 | | |
The Goldman Sachs Group, Inc., 0.96% (LIBOR03M+75bps), 2/23/23 (b) | | | 500,000 | | | | 504,185 | | |
The PNC Financial Services Group, Inc., 2.55%, 1/22/30, Callable
10/24/29 @ 100 | | | 1,500,000 | | | | 1,642,799 | | |
The Progressive Corp., 3.20%, 3/26/30, Callable 12/26/29 @ 100 | | | 400,000 | | | | 461,880 | | |
Torchmark Corp., 4.55%, 9/15/28, Callable 6/15/28 @ 100 | | | 500,000 | | | | 599,925 | | |
Toyota Motor Credit Corp., 3.38%, 4/1/30, MTN | | | 536,000 | | | | 628,916 | | |
Truist Bank, 2.25%, 3/11/30, Callable 12/11/29 @ 100 | | | 1,050,000 | | | | 1,102,448 | | |
UMB Financial Corp., 3.70% (H15T5Y+344bps), 9/17/30, Callable
9/17/25 @ 100 (b) | | | 375,000 | | | | 386,565 | | |
Wells Fargo & Co.
2.19% (SOFR+200bps), 4/30/26, Callable 4/30/25 @ 100 (b) | | | 750,000 | | | | 789,398 | | |
3.00%, 10/23/26 | | | 1,000,000 | | | | 1,108,070 | | |
Zions Bancorp NA, 3.25%, 10/29/29, Callable 7/29/29 @ 100 | | | 1,000,000 | | | | 1,050,890 | | |
| | | | 49,968,942 | | |
Health Care (2.4%): | |
AbbVie, Inc., 3.20%, 11/21/29, Callable 8/21/29 @ 100 | | | 1,000,000 | | | | 1,126,400 | | |
Anthem, Inc., 2.88%, 9/15/29, Callable 6/15/29 @ 100 | | | 323,000 | | | | 358,104 | | |
Boston Medical Center Corp., 3.91%, 7/1/28 | | | 500,000 | | | | 574,050 | | |
Bristol Myers Squibb Co., 3.90%, 2/20/28, Callable 11/20/27 @ 100 | | | 500,000 | | | | 593,445 | | |
CVS Health Corp.
4.30%, 3/25/28, Callable 12/25/27 @ 100 | | | 282,000 | | | | 334,241 | | |
3.25%, 8/15/29, Callable 5/15/29 @ 100 (l) | | | 500,000 | | | | 563,055 | | |
1.75%, 8/21/30, Callable 5/21/30 @ 100 | | | 1,000,000 | | | | 1,004,340 | | |
DENTSPLY SIRONA, Inc., 3.25%, 6/1/30, Callable 3/1/30 @ 100 | | | 750,000 | | | | 835,088 | | |
Duke University Health System, Inc., 2.60%, 6/1/30 | | | 500,000 | | | | 534,735 | | |
Eastern Maine Healthcare Systems, 3.71%, 7/1/26 | | | 435,000 | | | | 455,686 | | |
Fresenius Medical Care U.S. Finance III, Inc., 2.38%, 2/16/31, Callable
11/16/30 @ 100 (a) | | | 1,000,000 | | | | 1,014,730 | | |
See notes to financial statements.
23
Victory Portfolios II
VictoryShares USAA Core Intermediate-Term Bond ETF | | Schedule of Portfolio Investments — continued
December 31, 2020 | |
(Unaudited)
Security Description | | Principal
Amount | | Value | |
Gilead Sciences, Inc., 1.20%, 10/1/27, Callable 8/1/27 @ 100 | | $ | 1,000,000 | | | $ | 1,007,270 | | |
HCA, Inc., 4.50%, 2/15/27, Callable 8/15/26 @ 100 | | | 500,000 | | | | 581,900 | | |
Mercy Health, 4.30%, 7/1/28 | | | 250,000 | | | | 287,253 | | |
Orlando Health Obligated Group
3.78%, 10/1/28, Callable 7/1/28 @ 100 | | | 500,000 | | | | 579,285 | | |
2.89%, 10/1/35 | | | 1,000,000 | | | | 1,027,080 | | |
Premier Health Partners, 2.91%, 11/15/26, Callable 5/15/26 @ 100 | | | 750,000 | | | | 749,543 | | |
Quest Diagnostics, Inc., 3.45%, 6/1/26, Callable 3/1/26 @ 100 | | | 1,250,000 | | | | 1,407,549 | | |
Southern Illinois Healthcare Enterprises, Inc., 3.97%, 5/15/50, Callable
11/15/49 @ 100 | | | 1,000,000 | | | | 1,154,390 | | |
Universal Health Services, Inc., 2.65%, 10/15/30, Callable 7/15/30 @ 100 (a) | | | 333,000 | | | | 345,864 | | |
Upjohn, Inc., 2.30%, 6/22/27, Callable 4/22/27 @ 100 (a) | | | 1,250,000 | | | | 1,327,513 | | |
| | | | 15,861,521 | | |
Industrials (4.1%): | |
Acuity Brands Lighting, Inc., 2.15%, 12/15/30, Callable 9/15/30 @ 100 | | | 2,000,000 | | | | 2,028,720 | | |
American Airlines Pass Through Trust
3.70%, 4/1/28 | | | 338,525 | | | | 317,117 | | |
3.85%, 8/15/29 | | | 469,965 | | | | 394,610 | | |
3.60%, 4/15/31 | | | 432,347 | | | | 395,567 | | |
Aramark Services, Inc., 5.00%, 2/1/28, Callable 2/1/23 @ 102.5 (a) | | | 500,000 | | | | 526,790 | | |
Arconic, Inc.
5.13%, 10/1/24, Callable 7/1/24 @ 100 | | | 250,000 | | | | 274,958 | | |
5.90%, 2/1/27 | | | 250,000 | | | | 295,103 | | |
Ashtead Capital, Inc., 4.25%, 11/1/29, Callable 11/1/24 @ 102.13 (a) | | | 1,448,000 | | | | 1,594,320 | | |
British Airways Pass Through Trust
3.35%, 12/15/30 (a) | | | 475,813 | | | | 449,710 | | |
3.80%, 3/20/33 (a) | | | 651,119 | | | | 653,671 | | |
Carlisle Cos., Inc., 2.75%, 3/1/30, Callable 12/1/29 @ 100 | | | 1,000,000 | | | | 1,073,140 | | |
Carrier Global Corp., 3.38%, 4/5/40, Callable 10/5/39 @ 100 | | | 1,000,000 | | | | 1,096,520 | | |
Caterpillar, Inc., 2.60%, 4/9/30, Callable 1/9/30 @ 100 | | | 500,000 | | | | 550,655 | | |
CNH Industrial Capital LLC, 1.88%, 1/15/26, Callable 12/15/25 @ 100 | | | 1,000,000 | | | | 1,050,310 | | |
CoStar Group, Inc., 2.80%, 7/15/30, Callable 4/15/30 @ 100 (a) | | | 224,000 | | | | 233,175 | | |
FedEx Corp., 3.90%, 2/1/35 | | | 1,250,000 | | | | 1,494,300 | | |
Georgia-Pacific LLC, 2.10%, 4/30/27, Callable 2/28/27 @ 100 (a) | | | 500,000 | | | | 528,495 | | |
Hawaiian Airlines Pass Through Certificates
4.95%, 7/15/23 | | | 588,767 | | | | 529,890 | | |
3.90%, 7/15/27 | | | 108,031 | | | | 95,278 | | |
Hillenbrand, Inc., 4.50%, 9/15/26, Callable 7/15/26 @ 100 | | | 1,000,000 | | | | 1,121,570 | | |
Hubbell, Inc., 3.50%, 2/15/28, Callable 11/15/27 @ 100 | | | 1,000,000 | | | | 1,095,620 | | |
IDEX Corp., 3.00%, 5/1/30, Callable 2/1/30 @ 100 | | | 500,000 | | | | 551,455 | | |
Ingersoll-Rand Global Holding Co. Ltd., 3.75%, 8/21/28, Callable
5/21/28 @ 100 | | | 500,000 | | | | 582,225 | | |
JetBlue Pass Through Trust, 2.95%, 11/15/29 | | | 235,075 | | | | 219,156 | | |
Kennametal, Inc., 4.63%, 6/15/28, Callable 3/15/28 @ 100 | | | 1,058,000 | | | | 1,175,851 | | |
Northrop Grumman Corp., 3.25%, 1/15/28, Callable 10/15/27 @ 100 | | | 500,000 | | | | 565,795 | | |
Otis Worldwide Corp., 3.11%, 2/15/40, Callable 8/15/39 @ 100 | | | 1,000,000 | | | | 1,090,440 | | |
Penske Truck Leasing Co. LP/PTL Finance Corp.
3.95%, 3/10/25, Callable 1/10/25 @ 100 (a) | | | 500,000 | | | | 560,245 | | |
4.45%, 1/29/26, Callable 11/29/25 @ 100 (a) | | | 1,000,000 | | | | 1,156,760 | | |
Ryder System, Inc., 3.40%, 3/1/23, MTN, Callable 2/1/23 @ 100 | | | 1,000,000 | | | | 1,059,590 | | |
See notes to financial statements.
24
Victory Portfolios II
VictoryShares USAA Core Intermediate-Term Bond ETF | | Schedule of Portfolio Investments — continued
December 31, 2020 | |
(Unaudited)
Security Description | | Principal
Amount | | Value | |
Southwest Airlines Co., 5.13%, 6/15/27, Callable 4/15/27 @ 100 | | $ | 800,000 | | | $ | 949,896 | | |
The Boeing Co.
3.25%, 2/1/28, Callable 12/1/27 @ 100 | | | 1,500,000 | | | | 1,607,939 | | |
5.71%, 5/1/40, Callable 11/1/39 @ 100 | | | 1,000,000 | | | | 1,297,190 | | |
Union Pacific Corp., 4.30%, 3/1/49, Callable 9/1/48 @ 100 | | | 500,000 | | | | 654,775 | | |
United Airlines Pass Through Trust, 3.70%, 9/1/31 | | | 454,122 | | | | 430,985 | | |
| | | | 27,701,821 | | |
Information Technology (1.4%): | |
Amphenol Corp., 4.35%, 6/1/29, Callable 3/1/29 @ 100 | | | 500,000 | | | | 615,415 | | |
Analog Devices, Inc., 2.95%, 4/1/25, Callable 3/1/25 @ 100 | | | 250,000 | | | | 272,840 | | |
Broadcom, Inc., 4.30%, 11/15/32, Callable 8/15/32 @ 100 | | | 750,000 | | | | 888,953 | | |
Hewlett Packard Enterprise Co., 4.65%, 10/1/24, Callable 9/1/24 @ 100 | | | 500,000 | | | | 568,325 | | |
HP, Inc., 3.40%, 6/17/30, Callable 3/17/30 @ 100 | | | 743,000 | | | | 827,487 | | |
Jabil, Inc., 3.00%, 1/15/31, Callable 10/15/30 @ 100 | | | 974,000 | | | | 1,036,180 | | |
Leidos, Inc., 2.30%, 2/15/31, Callable 11/15/30 @ 100 (a) | | | 1,500,000 | | | | 1,535,970 | | |
Micron Technology, Inc., 4.66%, 2/15/30, Callable 11/15/29 @ 100 | | | 1,000,000 | | | | 1,226,830 | | |
Motorola Solutions, Inc., 4.60%, 2/23/28, Callable 11/23/27 @ 100 | | | 750,000 | | | | 905,768 | | |
Qorvo, Inc., 3.38%, 4/1/31, Callable 4/1/26 @ 101.69 (a) | | | 500,000 | | | | 515,905 | | |
Salesforce.com, Inc., 3.70%, 4/11/28, Callable 1/11/28 @ 100 | | | 1,000,000 | | | | 1,179,200 | | |
| | | | 9,572,873 | | |
Materials (1.5%): | |
Avery Dennison Corp., 2.65%, 4/30/30, Callable 2/1/30 @ 100 | | | 800,000 | | | | 859,960 | | |
Colonial Enterprises, Inc., 3.25%, 5/15/30, Callable 2/15/30 @ 100 (a) | | | 375,000 | | | | 424,965 | | |
Crown Americas LLC/Crown Americas Capital Corp., 4.25%, 9/30/26,
Callable 3/31/26 @ 100 | | | 500,000 | | | | 550,310 | | |
DuPont de Nemours, Inc., 4.73%, 11/15/28, Callable 8/15/28 @ 100 | | | 500,000 | | | | 614,480 | | |
LafargeHolcim Finance US LLC, 3.50%, 9/22/26, Callable 6/22/26 @ 100 (a) | | | 1,000,000 | | | | 1,104,080 | | |
LYB International Finance III LLC
3.38%, 5/1/30, Callable 2/1/30 @ 100 | | | 750,000 | | | | 842,235 | | |
2.25%, 10/1/30, Callable 7/1/30 @ 100 | | | 500,000 | | | | 514,465 | | |
Martin Marietta Materials, Inc., 3.50%, 12/15/27, Callable 9/15/27 @ 100 | | | 625,000 | | | | 711,013 | | |
Packaging Corp. of America, 3.40%, 12/15/27, Callable 9/15/27 @ 100 | | | 500,000 | | | | 563,070 | | |
Reliance Steel & Aluminum Co., 4.50%, 4/15/23, Callable 1/15/23 @ 100 | | | 500,000 | | | | 539,590 | | |
The Mosaic Co., 4.05%, 11/15/27, Callable 8/15/27 @ 100 | | | 1,000,000 | | | | 1,133,110 | | |
Vulcan Materials Co. | |
3.90%, 4/1/27, Callable 1/1/27 @ 100 | | | 500,000 | | | | 582,885 | | |
3.50%, 6/1/30, Callable 3/1/30 @ 100 | | | 1,000,000 | | | | 1,144,220 | | |
WRKCo, Inc., 3.00%, 6/15/33, Callable 3/15/33 @ 100 (l) | | | 365,000 | | | | 402,927 | | |
| | | | 9,987,310 | | |
Real Estate (1.0%): | |
AvalonBay Communities, Inc., 3.20%, 1/15/28, MTN, Callable 10/15/27 @ 100 | | | 750,000 | | | | 836,438 | | |
Boston Properties LP, 3.25%, 1/30/31, Callable 10/30/30 @ 100 | | | 437,000 | | | | 482,129 | | |
Essex Portfolio LP, 2.65%, 3/15/32, Callable 12/15/31 @ 100 | | | 1,500,000 | | | | 1,607,534 | | |
GLP Capital LP/GLP Financing II, Inc., 4.00%, 1/15/31, Callable
10/15/30 @ 100 | | | 250,000 | | | | 272,705 | | |
Hospitality Properties Trust, 4.95%, 2/15/27, Callable 8/15/26 @ 100 (f) | | | 500,000 | | | | 504,700 | | |
Host Hotels & Resorts LP, 3.50%, 9/15/30, Callable 6/15/30 @ 100 | | | 311,000 | | | | 327,847 | | |
See notes to financial statements.
25
Victory Portfolios II
VictoryShares USAA Core Intermediate-Term Bond ETF | | Schedule of Portfolio Investments — continued
December 31, 2020 | |
(Unaudited)
Security Description | | Principal
Amount | | Value | |
Hudson Pacific Properties LP
3.95%, 11/1/27, Callable 8/1/27 @ 100 | | $ | 500,000 | | | $ | 549,880 | | |
4.65%, 4/1/29, Callable 1/1/29 @ 100 | | | 500,000 | | | | 582,175 | | |
Office Properties Income Trust, 4.50%, 2/1/25, Callable 11/1/24 @ 100 | | | 1,000,000 | | | | 1,061,210 | | |
Vornado Realty LP, 3.50%, 1/15/25, Callable 11/15/24 @ 100 | | | 500,000 | | | | 527,900 | | |
| | | | 6,752,518 | �� | |
Utilities (2.3%): | |
AEP Texas, Inc., 3.45%, 1/15/50, Callable 7/15/49 @ 100 | | | 1,500,000 | | | | 1,706,339 | | |
Ameren Corp., 3.50%, 1/15/31, Callable 10/15/30 @ 100 | | | 250,000 | | | | 288,160 | | |
American Water Capital Corp., 2.95%, 9/1/27, Callable 6/1/27 @ 100 | | | 1,000,000 | | | | 1,102,450 | | |
Cleco Corporate Holdings LLC, 3.38%, 9/15/29, Callable 6/15/29 @ 100 | | | 1,000,000 | | | | 1,035,750 | | |
Dominion Energy, Inc., 3.07%, 8/15/24 (g) (h) | | | 1,000,000 | | | | 1,080,630 | | |
DTE Electric Co., 2.25%, 3/1/30, Callable 12/1/29 @ 100 | | | 1,000,000 | | | | 1,073,530 | | |
Entergy Louisiana LLC, 4.00%, 3/15/33, Callable 12/15/32 @ 100 | | | 1,000,000 | | | | 1,246,450 | | |
Exelon Generation Co. LLC, 3.25%, 6/1/25, Callable 5/1/25 @ 100 | | | 750,000 | | | | 818,543 | | |
IPALCO Enterprises, Inc., 4.25%, 5/1/30, Callable 2/1/30 @ 100 (a) | | | 525,000 | | | | 608,496 | | |
ITC Holdings Corp., 2.95%, 5/14/30, Callable 2/14/30 @ 100 (a) | | | 750,000 | | | | 821,550 | | |
National Fuel Gas Co., 4.75%, 9/1/28, Callable 6/1/28 @ 100 (f) | | | 1,000,000 | | | | 1,079,870 | | |
Southern Co. Gas Capital Corp., 1.75%, 1/15/31, Callable 10/15/30 @ 100 | | | 1,000,000 | | | | 1,008,440 | | |
The AES Corp., 2.45%, 1/15/31, Callable 10/15/30 @ 100 (a) | | | 1,000,000 | | | | 1,012,720 | | |
The Cleveland Electric Illuminating Co., 4.55%, 11/15/30, Callable
8/15/30 @ 100 (a) | | | 500,000 | | | | 576,765 | | |
The Narragansett Electric Co., 3.40%, 4/9/30, Callable 1/9/30 @ 100 (a) | | | 500,000 | | | | 569,485 | | |
Vistra Operations Co. LLC, 4.30%, 7/15/29, Callable 4/15/29 @ 100 (a) | | | 500,000 | | | | 566,855 | | |
| | | | 14,596,033 | | |
Total Corporate Bonds (Cost $185,788,701) | | | 204,281,087 | | |
Yankee Dollars (8.5%) | |
Communication Services (0.3%): | |
British Telecommunications PLC, 3.25%, 11/8/29, Callable 8/8/29 @ 100 (a) | | | 1,000,000 | | | | 1,100,800 | | |
Vodafone Group PLC, 5.00%, 5/30/38 | | | 500,000 | | | | 653,690 | | |
| | | | 1,754,490 | | |
Consumer Discretionary (0.3%): | |
Ascot Group Ltd., 4.25%, 12/15/30, Callable 12/15/25 @ 100 (a) | | | 357,000 | | | | 366,214 | | |
Nissan Motor Co. Ltd., 4.81%, 9/17/30, Callable 6/17/30 @ 100 (a) | | | 1,000,000 | | | | 1,124,310 | | |
| | | | 1,490,524 | | |
Consumer Staples (0.8%): | |
Alimentation Couche-Tard, Inc., 2.95%, 1/25/30, Callable 10/25/29 @ 100 (a) | | | 667,000 | | | | 728,091 | | |
Bacardi Ltd.
4.45%, 5/15/25, Callable 3/15/25 @ 100 (a) | | | 1,500,000 | | | | 1,690,725 | | |
2.75%, 7/15/26, Callable 4/15/26 @ 100 (a) | | | 500,000 | | | | 529,220 | | |
Becle SAB de CV, 3.75%, 5/13/25 (a) | | | 1,000,000 | | | | 1,088,420 | | |
Imperial Brands Finance PLC, 3.88%, 7/26/29, Callable 4/26/29 @ 100 (a) | | | 1,000,000 | | | | 1,124,130 | | |
| | | | 5,160,586 | | |
See notes to financial statements.
26
Victory Portfolios II
VictoryShares USAA Core Intermediate-Term Bond ETF | | Schedule of Portfolio Investments — continued
December 31, 2020 | |
(Unaudited)
Security Description | | Principal
Amount | | Value | |
Energy (0.6%): | |
Aker BP ASA
5.88%, 3/31/25, Callable 3/31/21 @ 102.94 (a) | | $ | 500,000 | | | $ | 520,725 | | |
4.00%, 1/15/31, Callable 10/15/30 @ 100 (a) | | | 750,000 | | | | 812,573 | | |
Petroleos Mexicanos, 6.50%, 3/13/27 | | | 2,000,000 | | | | 2,108,520 | | |
Petronas Capital Ltd., 3.50%, 4/21/30, Callable 1/21/30 @ 100 (a) | | | 50,000 | | | | 57,611 | | |
Transocean Guardian Ltd., 5.88%, 1/15/24, Callable 7/15/21 @ 102.94 (a) | | | 390,000 | | | | 331,321 | | |
| | | | 3,830,750 | | |
Financials (3.9%): | |
ABN AMRO Bank NV, 4.80%, 4/18/26 (a) | | | 500,000 | | | | 589,830 | | |
Banco Santander Mexico SA Institucion de Banca Multiple Grupo Financiero
Santand, 5.38%, 4/17/25 (a) | | | 357,000 | | | | 410,125 | | |
Banco Santander SA, 4.38%, 4/12/28 | | | 600,000 | | | | 702,876 | | |
Bank of Montreal, 3.80% (USSW5+143bps), 12/15/32, Callable
12/15/27 @ 100 (b) | | | 500,000 | | | | 566,205 | | |
Barclays PLC
4.61% (LIBOR03M+140bps), 2/15/23, Callable 2/15/22 @ 100 (b) | | | 1,000,000 | | | | 1,043,820 | | |
3.93% (LIBOR03M+161bps), 5/7/25, Callable 5/7/24 @ 100 (b) | | | 500,000 | | | | 547,245 | | |
BNP Paribas SA, 4.71% (LIBOR03M+224bps), 1/10/25, Callable
1/10/24 @ 100 (a) (b) | | | 1,000,000 | | | | 1,111,320 | | |
BPCE SA
4.00%, 9/12/23 (a) | | | 500,000 | | | | 544,165 | | |
3.25%, 1/11/28 (a) | | | 1,000,000 | | | | 1,111,330 | | |
Co-operatieve Rabobank UA, 4.00% (USSW5+189bps), 4/10/29, MTN,
Callable 4/10/24 @ 100 (b) | | | 600,000 | | | | 645,876 | | |
Credit Agricole SA, 3.25%, 10/4/24 (a) | | | 1,250,000 | | | | 1,357,949 | | |
Credit Suisse Group Funding Guernsey Ltd., 3.75%, 3/26/25 | | | 500,000 | | | | 555,520 | | |
Diageo Capital PLC, 2.13%, 4/29/32, Callable 1/29/32 @ 100 | | | 500,000 | | | | 526,900 | | |
Fairfax Financial Holdings Ltd., 4.85%, 4/17/28, Callable 1/17/28 @ 100 | | | 500,000 | | | | 561,355 | | |
HSBC Holdings PLC
3.80% (LIBOR03M+121bps), 3/11/25, Callable 3/11/24 @ 100 (b) | | | 500,000 | | | | 545,845 | | |
2.91% (LIBOR03M+135bps), 9/12/26, Callable 9/12/25 @ 100 (b) | | | 500,000 | | | | 570,105 | | |
Lloyds Banking Group PLC
2.91% (LIBOR03M+81bps), 11/7/23, Callable 11/7/22 @ 100 (b) | | | 250,000 | | | | 260,730 | | |
3.57% (LIBOR03M+121bps), 11/7/28, Callable 11/7/27 @ 100 (b) | | | 250,000 | | | | 282,233 | | |
National Australia Bank Ltd., 3.93% (H15T5Y+188bps), 8/2/34,
Callable 8/2/29 @ 100 (a) (b) | | | 1,500,000 | | | | 1,685,355 | | |
Nationwide Building Society
3.62% (LIBOR03M+118bps), 4/26/23, Callable 4/26/22 @ 100 (a) (b) | | | 1,000,000 | | | | 1,038,669 | | |
4.36% (LIBOR03M+139bps), 8/1/24, Callable 8/1/23 @ 100 (a) (b) | | | 750,000 | | | | 815,992 | | |
4.30% (LIBOR03M+145bps), 3/8/29, Callable 3/8/28 @ 100 (a) (b) | | | 250,000 | | | | 291,113 | | |
3.96% (LIBOR03M+186bps), 7/18/30, Callable 7/18/29 @ 100 (a) (b) | | | 500,000 | | | | 582,195 | | |
Royal Bank of Canada, 1.60%, 4/17/23, MTN (f) | | | 1,500,000 | | | | 1,542,645 | | |
Royal Bank of Scotland Group PLC
6.13%, 12/15/22 | | | 500,000 | | | | 549,020 | | |
4.27% (LIBOR03M+176bps), 3/22/25, Callable 3/22/24 @ 100 (b) | | | 1,000,000 | | | | 1,105,540 | | |
5.08% (LIBOR03M+191bps), 1/27/30, Callable 1/27/29 @ 100 (b) | | | 500,000 | | | | 615,070 | | |
4.45% (LIBOR03M+187bps), 5/8/30, Callable 5/8/29 @ 100 (b) | | | 1,000,000 | | | | 1,191,099 | | |
See notes to financial statements.
27
Victory Portfolios II
VictoryShares USAA Core Intermediate-Term Bond ETF | | Schedule of Portfolio Investments — continued
December 31, 2020 | |
(Unaudited)
Security Description | | Principal
Amount | | Value | |
Societe Generale SA
3.88%, 3/28/24 (a) | | $ | 1,000,000 | | | $ | 1,091,840 | | |
1.49% (H15T1Y+1bps), 12/14/26, Callable 12/14/25 @ 100 (a) (b) | | | 500,000 | | | | 504,520 | | |
Standard Chartered PLC, 4.87% (LIBOR03M+197bps), 3/15/33, Callable
3/15/28 @ 100 (a) (b) | | | 500,000 | | | | 564,090 | | |
Westpac Banking Corp.
4.32% (USISDA05+224bps), 11/23/31, Callable 11/23/26 @ 100 (b) | | | 1,000,000 | | | | 1,140,220 | | |
2.67% (H15T5Y+2bps), 11/15/35, Callable 11/15/30 @ 100 (b) | | | 1,000,000 | | | | 1,030,200 | | |
| | | | 25,680,997 | | |
Health Care (0.7%): | |
Mylan NV, 3.95%, 6/15/26, Callable 3/15/26 @ 100 | | | 1,000,000 | | | | 1,144,250 | | |
Royalty Pharma PLC, 2.20%, 9/2/30, Callable 6/2/30 @ 100 (a) | | | 1,500,000 | | | | 1,539,915 | | |
Smith & Nephew PLC, 2.03%, 10/14/30, Callable 7/14/30 @ 100 | | | 1,500,000 | | | | 1,525,980 | | |
Teva Pharmaceutical Finance IV BV, 3.65%, 11/10/21 | | | 500,000 | | | | 505,130 | | |
| | | | 4,715,275 | | |
Industrials (1.1%): | |
Air Canada Pass Through Trust, 5.38%, 11/15/22 (a) | | | 146,756 | | | | 146,437 | | |
Aircastle Ltd., 4.40%, 9/25/23, Callable 8/25/23 @ 100 | | | 500,000 | | | | 533,550 | | |
Avolon Holdings Funding Ltd., 4.25%, 4/15/26, Callable 3/15/26 @ 100 (a) | | | 1,000,000 | | | | 1,081,190 | | |
BAE Systems PLC, 3.40%, 4/15/30, Callable 1/15/30 @ 100 (a) | | | 750,000 | | | | 848,340 | | |
CK Hutchison International Ltd.
3.50%, 4/5/27 (a) | | | 750,000 | | | | 830,707 | | |
2.75%, 9/6/29, Callable 6/6/29 @ 100 (a) | | | 1,500,000 | | | | 1,608,540 | | |
Ferguson Finance PLC, 3.25%, 6/2/30, Callable 3/2/30 @ 100 (a) | | | 450,000 | | | | 500,918 | | |
Heathrow Funding Ltd., 4.88%, 7/15/21 (a) | | | 568,000 | | | | 579,457 | | |
Latam Airlines Pass Through Trust, 4.20%, 8/15/29 | | | 765,170 | | | | 708,119 | | |
Rolls-Royce PLC, 3.63%, 10/14/25, Callable 7/14/25 @ 100 (a) | | | 275,000 | | | | 277,613 | | |
| | | | 7,114,871 | | |
Materials (0.7%): | |
Anglo American Capital PLC, 4.00%, 9/11/27 (a) | | | 1,000,000 | | | | 1,148,230 | | |
Braskem Netherlands Finance BV, 4.50%, 1/31/30 (a) | | | 1,000,000 | | | | 1,029,850 | | |
CCL Industries, Inc., 3.05%, 6/1/30, Callable 3/1/30 @ 100 (a) | | | 750,000 | | | | 816,870 | | |
Nutrien Ltd., 4.20%, 4/1/29, Callable 1/1/29 @ 100 | | | 1,000,000 | | | | 1,195,250 | | |
| | | | 4,190,200 | | |
Utilities (0.1%): | |
Comision Federal de Electricidad, 4.88%, 5/26/21 (a) | | | 750,000 | | | | 762,203 | | |
Total Yankee Dollars (Cost $50,314,980) | | | 54,699,896 | | |
Municipal Bonds (5.5%) | |
Arizona (0.2%): | |
The University of Arizona Revenue, Build America Bond, Series A,
1.82%, 6/1/30 | | | 1,000,000 | | | | 1,003,910 | | |
California (0.1%): | |
San Jose Redevelopment Agency Successor Agency Tax Allocation,
Series A-T, 3.13%, 8/1/28, Continuously Callable @ 100 | | | 500,000 | | | | 548,175 | | |
See notes to financial statements.
28
Victory Portfolios II
VictoryShares USAA Core Intermediate-Term Bond ETF | | Schedule of Portfolio Investments — continued
December 31, 2020 | |
(Unaudited)
Security Description | | Principal
Amount | | Value | |
Colorado (0.4%): | |
City & County of Denver Co. Airport System Revenue, Series C,
2.14%, 11/15/29 | | $ | 1,500,000 | | | $ | 1,509,540 | | |
Colorado Health Facilities Authority Revenue, 3.36%, 12/1/30 | | | 1,000,000 | | | | 1,001,580 | | |
| | | | 2,511,120 | | |
Connecticut (0.1%): | |
State of Connecticut, GO, Series A, 3.43%, 4/15/28 | | | 500,000 | | | | 573,175 | | |
Florida (0.3%): | |
Hillsborough County IDA Revenue, 3.58%, 8/1/35, Continuously
Callable @ 100 | | | 1,500,000 | | | | 1,553,489 | | |
Hillsborough County School Board Certificate of Participation,
Series B, 1.92%, 7/1/25 | | | 750,000 | | | | 777,398 | | |
| | | | 2,330,887 | | |
Georgia (0.2%): | |
City of Atlanta Water & Wastewater Revenue, 2.26%, 11/1/35,
Continuously Callable @ 100 | | | 1,500,000 | | | | 1,571,564 | | |
Hawaii (0.1%): | |
State of Hawaii Airports System Revenue, Series E, 1.81%, 7/1/27 | | | 915,000 | | | | 934,682 | | |
Illinois (0.3%): | |
Illinois Finance Authority Revenue
3.55%, 8/15/29 | | | 500,000 | | | | 563,330 | | |
3.51%, 5/15/41 | | | 750,000 | | | | 767,070 | | |
Metropolitan Pier & Exposition Authority Revenue, 4.30%, 12/15/28 | | | 500,000 | | | | 501,790 | | |
| | | | 1,832,190 | | |
Kentucky (0.1%): | |
Kentucky Economic Development Finance Authority Revenue,
3.82%, 12/1/27 | | | 500,000 | | | | 536,080 | | |
Louisiana (0.2%): | |
Louisiana Local Government Environmental Facilities & Community
Development Authority Revenue, 1.55%, 2/1/27 | | | 700,000 | | | | 708,232 | | |
Louisiana Public Facilities Authority Revenue, 2.28%, 6/1/30 | | | 500,000 | | | | 507,170 | | |
| | | | 1,215,402 | | |
Michigan (0.4%): | |
Michigan Finance Authority Revenue
2.47%, 12/1/25 | | | 1,000,000 | | | | 1,069,780 | | |
3.08%, 12/1/34 | | | 1,000,000 | | | | 1,116,230 | | |
| | | | 2,186,010 | | |
New Jersey (0.7%): | |
New Jersey Economic Development Authority Revenue, Series NNN,
3.47%, 6/15/27 | | | 1,000,000 | | | | 1,077,080 | | |
New Jersey Health Care Facilities Financing Authority Revenue, Series A,
3.36%, 7/1/40 | | | 1,000,000 | | | | 1,010,900 | | |
New Jersey Transportation Trust Fund Authority Revenue, 4.08%, 6/15/39 | | | 385,000 | | | | 408,882 | | |
Rutgers The State University of New Jersey Revenue, Series S, 2.01%, 5/1/32 | | | 750,000 | | | | 743,033 | | |
South Jersey Transportation Authority Revenue, Series B, 2.38%, 11/1/27 | | | 900,000 | | | | 928,701 | | |
| | | | 4,168,596 | | |
See notes to financial statements.
29
Victory Portfolios II
VictoryShares USAA Core Intermediate-Term Bond ETF | | Schedule of Portfolio Investments — continued
December 31, 2020 | |
(Unaudited)
Security Description | | Principal
Amount | | Value | |
New York (0.3%): | |
New York City Industrial Development Agency Revenue, 2.73%, 3/1/34 | | $ | 1,500,000 | | | $ | 1,496,040 | | |
New York State Dormitory Authority Revenue, Series A, 2.46%, 7/1/32 | | | 750,000 | | | | 760,253 | | |
| | | | 2,256,293 | | |
Oklahoma (0.3%): | |
Oklahoma Development Finance Authority Revenue, Series C, 5.45%, 8/15/28 | | | 500,000 | | | | 579,860 | | |
The University of Oklahoma Revenue, Series C, 2.05%, 7/1/29 | | | 1,000,000 | | | | 1,021,810 | | |
| | | | 1,601,670 | | |
Pennsylvania (0.4%): | |
Commonwealth Financing Authority Revenue, Series A, 3.63%, 6/1/29 | | | 500,000 | | | | 567,590 | | |
Public Parking Authority Of Pittsburgh Revenue, 2.33%, 12/1/29 | | | 895,000 | | | | 919,317 | | |
State Public School Building Authority Revenue, 3.15%, 4/1/30 | | | 1,290,000 | | | | 1,335,124 | | |
| | | | 2,822,031 | | |
Texas (1.2%): | |
City of Houston Airport System Revenue, Series C, 2.09%, 7/1/28 | | | 750,000 | | | | 757,493 | | |
City of San Antonio, GO, 1.76%, 2/1/31, Continuously Callable @ 100 | | | 630,000 | | | | 645,611 | | |
Dallas Fort Worth International Airport Revenue, Series C, 1.75%, 11/1/27 | | | 750,000 | | | | 762,758 | | |
Harris County Cultural Education Facilities Finance Corp. Revenue
3.34%, 11/15/37 | | | 2,000,000 | | | | 2,138,859 | | |
Series D, 2.28%, 7/1/34 | | | 370,000 | | | | 361,734 | | |
North Texas Tollway Authority Revenue, 1.02%, 1/1/25 | | | 1,000,000 | | | | 998,900 | | |
Tarrant County Cultural Education Facilities Finance Corp. Revenue
1.63%, 9/1/26 (i) | | | 525,000 | | | | 524,764 | | |
1.82%, 9/1/27 (i) | | | 700,000 | | | | 696,570 | | |
| | | | 6,886,689 | | |
Virginia (0.0%): (d) | |
Virginia Housing Development Authority Revenue
Series J, 1.97%, 11/1/28 | | | 225,000 | | | | 226,539 | | |
Series J, 2.27%, 11/1/31, Continuously Callable @ 100 | | | 225,000 | | | | 227,284 | | |
Series J, 2.42%, 11/1/32, Continuously Callable @ 100 | | | 275,000 | | | | 275,888 | | |
Series J, 2.47%, 11/1/33, Continuously Callable @ 100 | | | 270,000 | | | | 270,556 | | |
Series J, 2.52%, 11/1/34, Continuously Callable @ 100 | | | 250,000 | | | | 253,113 | | |
Series J, 2.57%, 11/1/35, Continuously Callable @ 100 | | | 300,000 | | | | 303,324 | | |
| | | | 1,556,704 | | |
Washington (0.2%): | |
Washington State University Revenue, Series A, 2.24%, 10/1/28 | | | 1,000,000 | | | | 1,040,930 | | |
Total Municipal Bonds (Cost $34,351,034) | | | 35,576,108 | | |
U.S. Government Agency Mortgages (6.8%) | |
Federal Home Loan Mortgage Corp.
Series K028, Class A2, 3.11%, 2/25/23 | | | 1,000,000 | | | | 1,045,074 | | |
Series K059, Class A2, 3.12%, 9/25/26 (c) | | | 1,000,000 | | | | 1,123,450 | | |
Series KIR3, Class A2, 3.28%, 8/25/27 | | | 1,500,000 | | | | 1,723,594 | | |
Series K069, Class A2, 3.19%, 9/25/27 (c) | | | 86,000 | | | | 98,540 | | |
Series K071, Class A2, 3.29%, 11/25/27 | | | 500,000 | | | | 576,845 | | |
Series K075, Class A2, 3.65%, 2/25/28 (c) | | | 500,000 | | | | 589,138 | | |
See notes to financial statements.
30
Victory Portfolios II
VictoryShares USAA Core Intermediate-Term Bond ETF | | Schedule of Portfolio Investments — continued
December 31, 2020 | |
(Unaudited)
Security Description | | Principal
Amount | | Value | |
Series K087, Class A2, 3.77%, 12/25/28 (l) | | $ | 500,000 | | | $ | 597,953 | | |
Series K091, Class A2, 3.51%, 3/25/29 | | | 1,250,000 | | | | 1,478,588 | | |
Series K095, Class A2, 2.79%, 6/25/29 | | | 1,000,000 | | | | 1,130,908 | | |
Series K097, Class A2, 2.51%, 7/25/29 | | | 2,000,000 | | | | 2,221,308 | | |
Series K096, Class A2, 2.52%, 7/25/29 | | | 1,000,000 | | | | 1,111,242 | | |
Series KG02, Class A2, 2.41%, 8/25/29 | | | 909,000 | | | | 1,001,458 | | |
Series K100, Class A2, 2.67%, 9/25/29 | | | 545,000 | | | | 613,085 | | |
Series K159, Class A2, 3.95%, 11/25/30 (c) | | | 500,000 | | | | 613,955 | | |
3.00%, 3/1/31 – 2/1/33 | | | 463,157 | | | | 489,829 | | |
3.50%, 5/1/33 – 11/1/47 | | | 2,825,241 | | | | 2,999,461 | | |
Series K-1510, Class A3, 3.79%, 1/25/34 | | | 1,000,000 | | | | 1,230,009 | | |
Series K-1512, Class A3, 3.06%, 4/25/34 | | | 1,000,000 | | | | 1,152,550 | | |
4.00%, 7/1/42 – 5/1/46 | | | 2,061,498 | | | | 2,257,758 | | |
4.50%, 12/1/45 | | | 139,735 | | | | 156,199 | | |
| | | | 22,210,944 | | |
Federal National Mortgage Association
Series M4, Class A2, 3.05%, 3/25/28 (c) | | | 500,000 | | | | 572,670 | | |
Series 2019-M1, Class A2, 3.55%, 9/25/28 (c) | | | 750,000 | | | | 886,810 | | |
Series 2019-M12, Class A2, 2.89%, 5/25/29 (c) | | | 1,000,000 | | | | 1,135,242 | | |
2.50%, 11/1/34 (l) | | | 637,177 | | | | 665,040 | | |
4.00%, 12/1/41 – 2/1/50 | | | 9,848,960 | | | | 10,534,226 | | |
3.50%, 9/1/45 – 2/1/50 (l) | | | 6,171,777 | | | | 6,548,777 | | |
4.50%, 8/1/47 | | | 27,827 | | | | 30,318 | | |
3.00%, 2/1/50 | | | 1,334,908 | | | | 1,396,147 | | |
| | | | 21,769,230 | | |
Total U.S. Government Agency Mortgages (Cost $41,268,969) | | | 43,980,174 | | |
U.S. Treasury Obligations (34.1%) | |
U.S. Treasury Bonds
4.38%, 2/15/38 | | | 750,000 | | | | 1,114,453 | | |
3.50%, 2/15/39 (l) | | | 2,770,000 | | | | 3,759,409 | | |
4.38%, 11/15/39 | | | 1,000,000 | | | | 1,511,563 | | |
1.13%, 5/15/40 | | | 1,000,000 | | | | 949,375 | | |
1.38%, 11/15/40 | | | 7,000,000 | | | | 6,923,438 | | |
3.13%, 11/15/41 | | | 1,000,000 | | | | 1,307,500 | | |
2.75%, 8/15/47 | | | 500,000 | | | | 627,266 | | |
2.75%, 11/15/47 (l) | | | 500,000 | | | | 627,891 | | |
3.00%, 2/15/48 | | | 3,500,000 | | | | 4,596,484 | | |
3.38%, 11/15/48 (l) | | | 2,012,000 | | | | 2,827,174 | | |
2.88%, 5/15/49 | | | 3,000,000 | | | | 3,876,094 | | |
1.25%, 5/15/50 (l) | | | 2,000,000 | | | | 1,815,313 | | |
1.38%, 8/15/50 | | | 7,000,000 | | | | 6,555,938 | | |
U.S. Treasury Inflation Indexed Bonds, 0.88%, 1/15/29 | | | 515,610 | | | | 606,265 | | |
U.S. Treasury Notes
2.25%, 2/15/21 | | | 195,000 | | | | 195,472 | | |
2.38%, 3/15/21 | | | 2,000,000 | | | | 2,008,672 | | |
2.38%, 4/15/21 (l) | | | 3,850,000 | | | | 3,874,213 | | |
1.63%, 6/30/21 | | | 1,000,000 | | | | 1,007,422 | | |
1.75%, 7/31/21 (l) | | | 10,000,000 | | | | 10,093,750 | | |
See notes to financial statements.
31
Victory Portfolios II
VictoryShares USAA Core Intermediate-Term Bond ETF | | Schedule of Portfolio Investments — continued
December 31, 2020 | |
(Unaudited)
Security Description | | Principal
Amount | | Value | |
2.75%, 8/15/21 | | $ | 1,700,000 | | | $ | 1,727,559 | | |
2.88%, 11/15/21 | | | 3,630,000 | | | | 3,716,213 | | |
2.50%, 1/15/22 | | | 712,000 | | | | 729,466 | | |
1.88%, 1/31/22 | | | 1,000,000 | | | | 1,018,906 | | |
1.50%, 1/31/22 | | | 7,000,000 | | | | 7,103,906 | | |
2.50%, 2/15/22 | | | 2,000,000 | | | | 2,053,125 | | |
1.88%, 2/28/22 | | | 1,700,000 | | | | 1,734,465 | | |
2.25%, 4/15/22 | | | 2,000,000 | | | | 2,054,609 | | |
0.13%, 5/31/22 | | | 5,000,000 | | | | 5,000,586 | | |
0.13%, 6/30/22 (l) | | | 10,000,000 | | | | 10,001,563 | | |
0.13%, 7/31/22 | | | 12,500,000 | | | | 12,501,465 | | |
1.50%, 8/15/22 | | | 1,000,000 | | | | 1,022,266 | | |
0.13%, 9/30/22 (l) | | | 6,000,000 | | | | 6,000,234 | | |
2.00%, 10/31/22 | | | 400,000 | | | | 413,625 | | |
0.13%, 10/31/22 | | | 10,000,000 | | | | 10,000,781 | | |
0.13%, 9/15/23 | | | 6,000,000 | | | | 5,995,313 | | |
0.13%, 10/15/23 | | | 2,500,000 | | | | 2,498,047 | | |
0.25%, 11/15/23 | | | 5,000,000 | | | | 5,013,672 | | |
2.00%, 4/30/24 | | | 24,550,000 | | | | 26,019,163 | | |
2.75%, 2/28/25 | | | 850,000 | | | | 936,926 | | |
0.25%, 9/30/25 | | | 3,500,000 | | | | 3,486,328 | | |
3.00%, 9/30/25 | | | 300,000 | | | | 337,594 | | |
0.38%, 11/30/25 | | | 13,000,000 | | | | 13,018,280 | | |
1.50%, 8/15/26 | | | 2,000,000 | | | | 2,117,344 | | |
2.00%, 11/15/26 | | | 2,700,000 | | | | 2,938,359 | | |
0.50%, 6/30/27 | | | 2,500,000 | | | | 2,489,258 | | |
2.25%, 8/15/27 | | | 1,000,000 | | | | 1,108,750 | | |
2.25%, 11/15/27 | | | 1,700,000 | | | | 1,887,531 | | |
0.63%, 11/30/27 | | | 13,000,000 | | | | 12,995,937 | | |
2.75%, 2/15/28 (l) | | | 2,000,000 | | | | 2,293,125 | | |
2.88%, 8/15/28 | | | 630,000 | | | | 731,784 | | |
3.13%, 11/15/28 (l) | | | 1,000,000 | | | | 1,183,906 | | |
2.63%, 2/15/29 | | | 1,000,000 | | | | 1,147,969 | | |
0.63%, 5/15/30 (l) | | | 2,500,000 | | | | 2,444,531 | | |
0.63%, 8/15/30 | | | 5,000,000 | | | | 4,875,781 | | |
0.88%, 11/15/30 | | | 7,000,000 | | | | 6,975,938 | | |
Total U.S. Treasury Obligations (Cost $211,818,413) | | | 219,851,997 | | |
Commercial Papers (3.1%) | |
Canadian Natural Resources Ltd., 0.15%, 1/7/21 (j) | | | 6,400,000 | | | | 6,399,814 | | |
CenterPoint Energy, Inc., 0.11%, 1/5/21 (a) (j) | | | 3,000,000 | | | | 2,999,953 | | |
Duke Energy Corp., 0.09%, 1/5/21 (a) (j) | | | 2,500,000 | | | | 2,499,968 | | |
Duke Energy Corp., 0.09%, 1/4/21 (a) (j) | | | 1,734,000 | | | | 1,733,983 | | |
Eversource Energy, 0.15%, 1/5/21 (j) | | | 1,700,000 | | | | 1,699,965 | | |
Hannover Funding Co. LLC, 0.33%, 1/4/21 (j) | | | 4,000,000 | | | | 3,999,853 | | |
LMA-Americas LLC, 0.10%, 1/6/21 (a) (j) | | | 700,000 | | | | 699,988 | | |
Total Commercial Papers (Cost $20,033,501) | | | 20,033,524 | | |
See notes to financial statements.
32
Victory Portfolios II
VictoryShares USAA Core Intermediate-Term Bond ETF | | Schedule of Portfolio Investments — continued
December 31, 2020 | |
(Unaudited)
Security Description | | Shares | | Value | |
Collateral for Securities Loaned^ (0.2%) | |
BlackRock Liquidity Funds TempFund Portfolio, Institutional Class, 0.08% (k) | | | 22,680 | | | $ | 22,680 | | |
Fidelity Investments Money Market Government Portfolio I Shares, 0.01% (k) | | | 779,205 | | | | 779,205 | | |
Goldman Sachs Financial Square Prime Obligations Fund, Institutional
Class, 0.04% (k) | | | 11,319 | | | | 11,319 | | |
JPMorgan Prime Money Market Fund, Capital Class, 0.12% (k) | | | 90,251 | | | | 90,251 | | |
Morgan Stanley Institutional Liquidity Prime Portfolio, Institutional
Class, 0.09% (k) | | | 405,788 | | | | 405,788 | | |
Total Collateral for Securities Loaned (Cost $1,309,243) | | | 1,309,243 | | |
Total Investments (Cost $605,893,570) — 99.3% | | | 641,492,173 | | |
Other assets in excess of liabilities — 0.7% | | | 4,273,615 | | |
NET ASSETS — 100.00% | | $ | 645,765,788 | | |
^ Purchased with cash collateral from securities on loan.
(a) Rule 144A security or other security that is restricted as to resale to institutional investors. The Fund's Adviser has deemed this security to be liquid based upon procedures approved by the Board of Trustees. As of December 31, 2020, the fair value of these securities was $127,480,167 and amounted to 19.7% of net assets.
(b) Variable or Floating-Rate Security. Rate disclosed is as of December 31, 2020.
(c) The rate for certain asset-backed and mortgage-backed securities may vary based on factors relating to the pool of assets underlying the security. The rate disclosed is the rate in effect at December 31, 2020.
(d) Amount represents less than 0.05% of net assets.
(e) Non-income producing security.
(f) All or a portion of this security is on loan.
(g) Variable Rate Demand Notes that provide the rights to sell the security at face value on either that day or within the rate-reset period. The interest rate is reset on the put date at a stipulated daily, weekly, monthly, quarterly, or other specified time interval to reflect current market conditions. These securities do not indicate a reference rate and spread in their description.
(h) Stepped-coupon security converts to coupon form on 8/15/24 with a rate of 3.071%.
(i) Security or a portion of the security purchased on a delayed-delivery and/or when-issued basis.
(j) Rate represents the effective yield at December 31, 2020.
(k) Rate disclosed is the daily yield on December 31, 2020.
(l) All or a portion of this security has been segregated as collateral for securities purchased on a when-issued basis.
bps — Basis points
Continuously callable — Investment is continuously callable or will be continuously callable on any date after the first call date until its maturity.
GO — General Obligation
H15T1Y — 1 Year Treasury Constant Maturity Rate, rate disclosed as of December 31, 2020.
H15T5Y — 5 Year Treasury Constant Maturity Rate, rate disclosed as of December 31, 2020.
IDA — Industrial Development Authority
LIBOR — London InterBank Offered Rate
See notes to financial statements.
33
Victory Portfolios II
VictoryShares USAA Core Intermediate-Term Bond ETF | | Schedule of Portfolio Investments — continued
December 31, 2020 | |
(Unaudited)
LIBOR01M — 1 Month US Dollar LIBOR, rate disclosed as of December 31, 2020, based on the last reset date of the security
LIBOR03M — 3 Month US Dollar LIBOR, rate disclosed as of December 31, 2020, based on the last reset date of the security
LLC — Limited Liability Company
LP — Limited Partnership
MTN — Medium Term Note
PLC — Public Limited Company
SOFR — Secured Overnight Financing Rate
USISDA05 — 5 Year USD ICE Swap
USSW5 — USD 5 Year Swap Rate, rate disclosed as of December 31, 2020.
See notes to financial statements.
34
Victory Portfolios II | | Statements of Assets and Liabilities
December 31, 2020 | |
(Unaudited)
| | | VictoryShares
USAA Core
Short-Term
Bond ETF | | VictoryShares
USAA Core
Intermediate-Term
Bond ETF | |
ASSETS: | |
Investments, at value (Cost $245,458,206 and $605,893,570) | | $ | 248,906,472 | (a) | | $ | 641,492,173 | (b) | |
Cash and cash equivalents | | | 4,769,966 | | | | 3,593,982 | | |
Deposit with brokers for futures contracts | | | — | | | | 40,048 | | |
Receivables: | |
Interest and dividends | | | 1,479,000 | | | | 3,354,922 | | |
Prepaid expenses | | | 2,045 | | | | 6,545 | | |
Total Assets | | | 255,157,483 | | | | 648,487,670 | | |
LIABILITIES: | |
Payables: | |
Collateral received on loaned securities | | | 1,873,642 | | | | 1,309,243 | | |
Investments purchased | | | 4,848,071 | | | | 1,225,000 | | |
Accrued expenses and other payables: | |
Investment advisory fees | | | 52,486 | | | | 156,707 | | |
Administration fees | | | 4,590 | | | | 10,742 | | |
Custodian fees | | | 2,349 | | | | 392 | | |
Compliance fees | | | 143 | | | | 301 | | |
Trustees' fees | | | 1,172 | | | | 1,184 | | |
Other accrued expenses | | | 14,793 | | | | 18,313 | | |
Total Liabilities | | | 6,797,246 | | | | 2,721,882 | | |
NET ASSETS: | |
Capital | | | 244,901,587 | | | | 610,308,776 | | |
Total accumulated earnings/(loss) | | | 3,458,650 | | | | 35,457,012 | | |
Net Assets | | $ | 248,360,237 | | | $ | 645,765,788 | | |
Shares Outstanding (unlimited shares authorized, no par value): | | | 4,800,000 | | | | 11,850,000 | | |
Net asset value: | | $ | 51.74 | | | $ | 54.50 | | |
(a) Includes $1,799,999 of securities on loan.
(b) Includes $1,270,166 of securities on loan.
See notes to financial statements.
35
Victory Portfolios II | | Statements of Operations
For the Six Months Ended December 31, 2020 | |
(Unaudited)
| | | VictoryShares
USAA Core
Short-Term
Bond ETF | | VictoryShares
USAA Core
Intermediate-Term
Bond ETF | |
Investment Income: | |
Interest | | $ | 1,859,184 | | | $ | 7,012,840 | | |
Securities lending (net of fees) | | | 5,746 | | | | 853 | | |
Total Income | | | 1,864,930 | | | | 7,013,693 | | |
Expenses: | |
Investment advisory fees | | | 223,421 | | | | 771,118 | | |
Administration fees | | | 53,775 | | | | 155,196 | | |
Sub-Administration fees | | | 9,725 | | | | 9,723 | | |
Custodian fees | | | 3,176 | | | | 10,370 | | |
Servicing fees | | | 5,663 | | | | 6,418 | | |
Trustees' fees | | | 6,000 | | | | 19,266 | | |
Compliance fees | | | 687 | | | | 2,153 | | |
Legal and audit fees | | | 12,104 | | | | 27,447 | | |
Other expenses | | | 18,085 | | | | 34,610 | | |
Total Expenses | | | 332,636 | | | | 1,036,301 | | |
Expenses waived/reimbursed by Adviser | | | (32,764 | ) | | | (94,728 | ) | |
Net Expenses | | | 299,872 | | | | 941,573 | | |
Net Investment Income (Loss) | | | 1,565,058 | | | | 6,072,120 | | |
Realized/Unrealized Gains (Losses) from Investments: | |
Net realized gains (losses) from investment securities | | | 220,603 | | | | 1,065,218 | | |
Net change in unrealized appreciation/depreciation on
investment securities | | | 2,127,651 | | | | 9,821,317 | | |
Net realized/unrealized gains (losses) on investments | | | 2,348,254 | | | | 10,886,535 | | |
Change in net assets resulting from operations | | $ | 3,913,312 | | | $ | 16,958,655 | | |
See notes to financial statements.
36
Victory Portfolios II | | Statements of Changes in Net Assets | |
| | | VictoryShares USAA Core
Short-Term Bond ETF | | VictoryShares USAA Core
Intermediate-Term Bond ETF | |
| | | Six
Months
Ended
December 31,
2020
(Unaudited) | | Ten
Months
Ended
June 30,
2020 | | Year
Ended
August 31,
2019 | | Six
Months
Ended
December 31,
2020
(Unaudited) | | Ten
Months
Ended
June 30,
2020 | | Year
Ended
August 31,
2019 | |
From Investment Activities: | |
Operations: | |
Net investment
income (loss) | | $ | 1,565,058 | | | $ | 2,048,244 | | | $ | 1,951,595 | | | $ | 6,072,120 | | | $ | 9,078,403 | | | $ | 6,981,287 | | |
Net realized gains
(losses) from
investments | | | 220,603 | | | | 931,853 | | | | 10,689 | | | | 1,065,218 | | | | 1,312,722 | | | | (87,470 | ) | |
Net change in
unrealized
appreciation/
depreciation
on investments | | | 2,127,651 | | | | 143,422 | | | | 1,644,842 | | | | 9,821,317 | | | | 8,268,340 | | | | 19,861,921 | | |
Change in net assets
resulting
from operations | | | 3,913,312 | | | | 3,123,519 | | | | 3,607,126 | | | | 16,958,655 | | | | 18,659,465 | | | | 26,755,738 | | |
Change in net assets
resulting from
distributions to
shareholders | | | (2,889,733 | ) | | | (1,884,117 | ) | | | (1,927,032 | ) | | | (9,340,025 | ) | | | (8,484,958 | ) | | | (6,792,738 | ) | |
Change in net
assets resulting
from capital
transactions | | | 142,336,340 | | | | 20,187,621 | | | | 20,020,825 | | | | 187,357,711 | | | | 125,758,776 | | | | 144,189,678 | | |
Change in net assets | | | 143,359,919 | | | | 21,427,023 | | | | 21,700,919 | | | | 194,976,341 | | | | 135,933,283 | | | | 164,152,678 | | |
Net Assets: | |
Beginning of period | | | 105,000,318 | | | | 83,573,295 | | | | 61,872,376 | | | | 450,789,447 | | | | 314,856,164 | | | | 150,703,486 | | |
End of period | | $ | 248,360,237 | | | $ | 105,000,318 | | | $ | 83,573,295 | | | $ | 645,765,788 | | | $ | 450,789,447 | | | $ | 314,856,164 | | |
Capital Transactions: | |
Proceeds from
shares issued | | | 142,336,340 | | | | 20,187,621 | | | | 20,020,825 | | | | 195,541,741 | | | | 133,241,270 | | | | 144,189,678 | | |
Cost of shares
redeemed | | | — | | | | — | | | | — | | | | (8,184,030 | ) | | | (7,482,494 | ) | | | — | | |
Change in net assets
resulting from
capital transactions | | | 142,336,340 | | | | 20,187,621 | | | | 20,020,825 | | | | 187,357,711 | | | | 125,758,776 | | | | 144,189,678 | | |
Share Transactions: | |
Issued | | | 2,750,000 | | | | 400,000 | | | | 400,000 | | | | 3,600,000 | | | | 2,550,000 | | | | 2,900,000 | | |
Redeemed | | | — | | | | — | | | | — | | | | (150,000 | ) | | | (150,000 | ) | | | — | | |
Change in Shares | | | 2,750,000 | | | | 400,000 | | | | 400,000 | | | | 3,450,000 | | | | 2,400,000 | | | | 2,900,000 | | |
See notes to financial statements.
37
Victory Portfolios II | | Financial Highlights | |
For a Share Outstanding Throughout Each Period
| | | | | Investment Activities | | Distributions to
Shareholders From | |
| | | Net Asset
Value,
Beginning of
Period | | Net
Investment
Income
(Loss)(a) | | Net Realized
and Unrealized
Gains (Losses)
on Investments | | Total from
Investment
Activities | | Net
Investment
Income | | Net Realized
Gains from
Investments | |
VictoryShares USAA Core Short-Term Bond ETF | |
Six Months Ended
12/31/20
(unaudited) | | $ | 51.22 | | | | 0.45 | | | | 0.87 | | | | 1.32 | | | | (0.58 | ) | | | (0.22 | ) | |
Ten Months Ended
6/30/20(e) | | $ | 50.65 | | | | 1.10 | | | | 0.48 | | | | 1.58 | | | | (1.01 | ) | | | — | | |
Year Ended
8/31/19 | | $ | 49.50 | | | | 1.37 | | | | 1.13 | | | | 2.50 | | | | (1.35 | ) | | | — | | |
10/24/17(g)
through
8/31/18 | | $ | 50.00 | | | | 0.93 | | | | (0.59 | ) | | | 0.34 | | | | (0.84 | ) | | | — | | |
VictoryShares USAA Core Intermediate-Term Bond ETF | |
Six Months Ended
12/31/20
(unaudited) | | $ | 53.67 | | | | 0.64 | | | | 1.13 | | | | 1.77 | | | | (0.74 | ) | | | (0.20 | ) | |
Ten Months Ended
6/30/20(e) | | $ | 52.48 | | | | 1.21 | | | | 1.12 | | | | 2.33 | | | | (1.14 | ) | | | — | | |
Year Ended
8/31/19 | | $ | 48.61 | | | | 1.62 | | | | 3.81 | | | | 5.43 | | | | (1.56 | ) | | | — | | |
10/24/17(g)
through
8/31/18 | | $ | 49.93 | | | | 1.29 | | | | (1.46 | ) | | | (0.17 | ) | | | (1.15 | ) | | | — | | |
(a) Per share net investment income (loss) has been calculated using the average daily shares method.
(b) Not annualized for periods less than one year.
(c) Annualized for periods less than one year.
(d) Excludes impact of in-kind transactions.
(e) The Fund's fiscal year-end changed from August 31 to June 30, effective September 1, 2019. (See Note 1)
(f) Portfolio turnover increased significantly due to changes in the volume and timing of purchases and sales of portfolio holdings during the period.
(g) Commencement of operations.
(h) Includes impact of voluntary waiver. Without this voluntary waiver, the net expense ratio would have been 0.02% higher.
(i) Portfolio turnover decreased significantly due to changes in the volume and timing of purchases and sales of portfolio holdings during the year.
See notes to financial statements.
38
Victory Portfolios II | | Financial Highlights — continued | |
For a Share Outstanding Throughout Each Period
| | | | | Ratios to Average Net Assets | | Supplemental Data | |
| | | Total
Distributions | | Net Asset
Value,
End of
Period | | Total
Return(b) | | Net
Expenses(c) | | Net
Investment
Income
(Loss)(c) | | Gross
Expenses(c) | | Net Assets,
End of
Period
(000's) | | Portfolio
Turnover(b)(d) | |
VictoryShares USAA Core Short-Term Bond ETF | |
Six Months Ended
12/31/20
(unaudited) | | | (0.80 | ) | | $ | 51.74 | | | | 2.60 | % | | | 0.33 | % | | | 1.74 | % | | | 0.37 | % | | $ | 248,360 | | | | 33 | % | |
Ten Months Ended
6/30/20(e) | | | (1.01 | ) | | $ | 51.22 | | | | 3.17 | % | | | 0.35 | % | | | 2.62 | % | | | 0.44 | % | | $ | 105,000 | | | | 72 | %(f) | |
Year Ended
8/31/19 | | | (1.35 | ) | | $ | 50.65 | | | | 5.11 | % | | | 0.35 | % | | | 2.75 | % | | | 0.40 | % | | $ | 83,573 | | | | 30 | % | |
10/24/17(g)
through
8/31/18 | | | (0.84 | ) | | $ | 49.50 | | | | 0.70 | % | | | 0.35 | % | | | 2.21 | % | | | 0.40 | % | | $ | 61,872 | | | | 22 | % | |
VictoryShares USAA Core Intermediate-Term Bond ETF | |
Six Months Ended
12/31/20
(unaudited) | | | (0.94 | ) | | $ | 54.50 | | | | 3.32 | % | | | 0.36 | % | | | 2.35 | % | | | 0.40 | % | | $ | 645,766 | | | | 8 | % | |
Ten Months Ended
6/30/20(e) | | | (1.14 | ) | | $ | 53.67 | | | | 4.52 | % | | | 0.38 | %(h) | | | 2.80 | % | | | 0.42 | % | | $ | 450,789 | | | | 13 | % | |
Year Ended
8/31/19 | | | (1.56 | ) | | $ | 52.48 | | | | 11.37 | % | | | 0.39 | % | | | 3.27 | % | | | 0.44 | % | | $ | 314,856 | | | | 3 | %(i) | |
10/24/17(g)
through
8/31/18 | | | (1.15 | ) | | $ | 48.61 | | | | (0.33 | )% | | | 0.40 | % | | | 3.10 | % | | | 0.45 | % | | $ | 150,703 | | | | 10 | % | |
See notes to financial statements.
39
Victory Portfolios II | | Notes to Financial Statements
December 31, 2020 | |
(Unaudited)
1. Organization:
Victory Portfolios II (the "Trust") was organized on April 11, 2012 as a Delaware statutory trust as a successor to the "Compass EMP Funds Trust." The Trust is registered under the Investment Company Act of 1940, as amended (the "1940 Act"), as an open-end investment company. The Trust is currently comprised of 27 funds, 25 of which are Exchange-Traded Funds ("ETFs"), and is authorized to issue an unlimited number of shares, which are units of beneficial interest with no par value. Each Fund is classified as diversified under the 1940 Act.
The accompanying financial statements are those of the following two Funds (collectively, the "Funds" and individually, a "Fund").
Funds (Legal Name) | | Funds (Short Name) | |
VictoryShares USAA Core Short-Term
Bond ETF | | USAA Core Short-Term Bond ETF | |
VictoryShares USAA Core
Intermediate-Term Bond ETF | | USAA Core Intermediate-Term
Bond ETF | |
Effective September 1, 2019, the Trust's Board of Trustees (the "Board") approved the fiscal year-end change for the Funds from August 31 to June 30. The accompanying financial statements reflect this change in fiscal year-end.
Under the Trust's organizational documents, its officers and trustees are indemnified against certain liabilities arising out of the performance of their duties to the Funds. In addition, in the normal course of business, the Funds enter into contracts with their vendors and others that provide for general indemnifications. The Funds' maximum exposure under these arrangements is unknown, as this would involve future claims that may be made against the Funds. However, based on experience, the Funds expect that risk of loss to be remote.
2. Significant Accounting Policies:
Shares of the Funds are listed and traded on NYSE Arca, Inc (the "Exchange"). The Funds issue and redeem shares of a Fund ("Shares") at net asset value ("NAV") only in aggregations of 50,000 Shares (each a "Creation Unit"). The Funds issue and redeem Creation Units principally in exchange for a basket of securities included in the respective Fund's Index (the "Deposit Securities"), together with the deposit of a specified cash payment (the "Cash Component"), plus a transaction fee. Shares will trade on the Exchange at market prices that may be below, at, or above NAV. Shares of a Fund may only be purchased or redeemed by certain financial institutions ("Authorized Participants"). An Authorized Participant is either (i) a broker-dealer or other participant in the clearing process through the Continuous Net Settlement System of the National Securities Clearing Corporation or (ii) a DTC participant and, in each case, must have executed a Participant Agreement with the distributor. Only Authorized Participants may purchase or redeem the shares directly from a Fund. In addition, Shares may be issued in advance of receipt of Deposit Securities subject to various conditions, including a requirement to maintain on deposit with the Trust cash equal to up to 105% of fair value of the missing Deposit Securities. In each instance of such cash creations or redemptions, transaction fees may be imposed and may be higher than the transaction fees associated with in-kind creations or redemptions.
Each Fund may issue an unlimited number of Shares of beneficial interest, with no par value. Shares of each Fund have equal rights and privileges. A purchase (i.e., creation) transaction fee is imposed for the transfer and other transactional costs associated with the purchase of Creation Units. In addition, a variable fee may be charged on all cash transactions or substitutes for Creation Units. Variable fees received by each Fund are displayed in the Capital Share Transaction section of the Statements of Changes in Net Assets as an increase to Capital.
40
Victory Portfolios II | | Notes to Financial Statements — continued
December 31, 2020 | |
(Unaudited)
The Transaction Fees for each Fund are listed below:
| | | Fee for In-Kind and
Cash Purchases and
Redemptions | | Maximum
Additional Variable
Charge for Cash
Purchases and
Redemptions* | |
USAA Core Short-Term Bond ETF | | $ | 100 | | | | 2.00 | % | |
USAA Core Intermediate-Term Bond ETF | | | 100 | | | | 2.00 | % | |
* As a percentage of the amount invested.
The following is a summary of significant accounting policies followed by the Trust in the preparation of its financial statements. The policies are in conformity with Generally Accepted Accounting Principles in the United States of America ("GAAP"). The preparation of financial statements in accordance with GAAP requires management to make estimates and assumptions that affect the reported amounts of assets and liabilities and disclosure of contingent assets and liabilities at the date of the financial statements and the reported amounts of income and expenses for the period. Actual results could differ from those estimates. The Funds follow the specialized accounting and reporting requirements under GAAP that are applicable to investment companies.
Investment Valuation:
The Funds record investments at fair value. Fair value is defined as the price that would be received to sell an asset or paid to transfer a liability in an orderly transaction between market participants at the measurement date.
The valuation techniques described below maximize the use of observable inputs and minimize the use of unobservable inputs in determining fair value. The inputs used for valuing the Funds' investments are summarized in the three broad levels listed below:
• Level 1 — quoted prices in active markets for identical securities
• Level 2 — other significant observable inputs (including quoted prices for similar securities or interest rates applicable to those securities, etc.)
• Level 3 — significant unobservable inputs (including the Funds' own assumptions in determining the fair value of investments)
Changes in valuation techniques may result in transfers in or out of an assigned level within the disclosure hierarchy. The inputs or methodologies used for valuation techniques are not necessarily an indication of the risk associated with entering into those investments.
Investments in open-end investment companies are valued at NAV. These valuations are typically categorized as Level 1 in the fair value hierarchy.
Futures contracts are valued at the settlement price established each day by the board of trade or an exchange on which they are traded. These valuations are typically categorized as Level 1 in the fair value hierarchy.
Debt securities of United States ("U.S.") issuers (other than short-term investments maturing in 60 days or less), including corporate and municipal securities, are valued on the basis of bid valuations provided by dealers or an independent pricing service approved by the Board. Short-term investments maturing in 60 days or less may be valued at amortized cost, which approximates market value. Under the amortized cost method, premium or discount, if any, is amortized or accreted, respectively, on a constant basis to the maturity of the security. In each of these situations, valuations are typically categorized as Level 2 in the fair value hierarchy.
Investments for which there are no such quotations, or for which quotations do not appear reliable, are valued at fair value in accordance with procedures established by and under the general supervision and responsibility of the Board. These valuations are typically categorized as Level 2 or Level 3 in the fair value hierarchy, based on the observability of inputs used to determine the fair value.
41
Victory Portfolios II | | Notes to Financial Statements — continued
December 31, 2020 | |
(Unaudited)
A summary of the valuations as of December 31, 2020, based upon the three levels defined above, is included in the table below while the breakdown, by category, of investments is disclosed on the Schedules of Portfolio Investments.
| | | LEVEL 1 | | LEVEL 2 | | LEVEL 3 | | TOTAL | |
USAA Core Short-Term Bond ETF | |
Asset-Backed Securities | | $ | — | | | $ | 23,419,643 | | | $ | — | | | $ | 23,419,643 | | |
Collateralized Mortgage Obligations | | | — | | | | 6,122,596 | | | | — | | | | 6,122,596 | | |
Senior Secured Loans | | | — | | | | 1,984,820 | | | | — | | | | 1,984,820 | | |
Corporate Bonds | | | — | | | | 95,364,930 | | | | — | | | | 95,364,930 | | |
Yankee Dollars | | | — | | | | 27,286,055 | | | | — | | | | 27,286,055 | | |
Municipal Bonds | | | — | | | | 58,000,679 | | | | — | | | | 58,000,679 | | |
U.S. Treasury Obligations | | | — | | | | 472,754 | | | | — | | | | 472,754 | | |
Commercial Papers | | | — | | | | 34,381,353 | | | | — | | | | 34,381,353 | | |
Collateral for Securities Loaned | | | 1,873,642 | | | | — | | | | — | | | | 1,873,642 | | |
Total | | $ | 1,873,642 | | | $ | 247,032,830 | | | $ | — | | | $ | 248,906,472 | | |
USAA Core Intermediate-Term Bond ETF | |
Asset-Backed Securities | | $ | — | | | $ | 42,876,483 | | | $ | — | | | $ | 42,876,483 | | |
Collateralized Mortgage Obligations | | | — | | | | 18,689,111 | | | | — | | | | 18,689,111 | | |
Common Stocks | | | 194,550 | | | | — | | | | — | | | | 194,550 | | |
Corporate Bonds | | | — | | | | 204,281,087 | | | | — | | | | 204,281,087 | | |
Yankee Dollars | | | — | | | | 54,699,896 | | | | — | | | | 54,699,896 | | |
Municipal Bonds | | | — | | | | 35,576,108 | | | | — | | | | 35,576,108 | | |
U.S. Government Agency Mortgages | | | — | | | | 43,980,174 | | | | — | | | | 43,980,174 | | |
U.S. Treasury Obligations | | | — | | | | 219,851,997 | | | | — | | | | 219,851,997 | | |
Commercial Papers | | | — | | | | 20,033,524 | | | | — | | | | 20,033,524 | | |
Collateral for Securities Loaned | | | 1,309,243 | | | | — | | | | — | | | | 1,309,243 | | |
Total | | $ | 1,503,793 | | | $ | 639,988,380 | | | $ | — | | | $ | 641,492,173 | | |
For the six months ended December 31, 2020, there were no transfers in or out of the Level 3 fair value hierarchy.
Securities Purchased on a When-Issued Basis:
The Funds may purchase securities on a when-issued basis. When-issued securities are securities purchased for delivery beyond normal settlement periods at a stated price and/or yield, thereby involving the risk that the price and/or yield obtained may be more or less than those available in the market when delivery takes place. At the time a Fund makes the commitment to purchase a security on a when-issued basis, the Fund records the transaction and reflects the value of the security in determining NAV. No interest accrues to the Fund until the transaction settles and payment takes place. Normally, the settlement date occurs within one month of the purchase. A segregated account is established and the Fund maintains cash and/or marketable securities at least equal in value to commitments for when-issued securities. If a Fund owns when-issued securities, these values are included in Payable for investments purchased on the accompanying Statements of Assets and Liabilities and the segregated assets are identified on the Schedules of Portfolio Investments.
Municipal Obligations:
The values of municipal obligations can fluctuate and may be affected by adverse tax, legislative, or political changes, and by financial developments affecting municipal issuers. Payment of municipal obligations may depend on a relatively limited source of revenue, resulting in greater credit risk. Future changes in federal tax laws or the activity of an issuer may adversely affect the tax-exempt status of municipal obligations.
42
Victory Portfolios II | | Notes to Financial Statements — continued
December 31, 2020 | |
(Unaudited)
Mortgage-Related and Asset-Backed Securities:
The values of some mortgage-related or asset-backed securities may be particularly sensitive to changes in prevailing interest rates. Early repayment of principal on some mortgage-related securities may expose a Fund to a lower rate of return upon reinvestment of principal. The values of mortgage- and asset-backed securities depend in part on the credit quality and adequacy of the underlying assets or collateral and may fluctuate in response to the market's perception of these factors as well as current and future repayment rates. Some mortgage-backed securities are backed by the full faith and credit of the U.S. government (e.g., mortgage-backed securities issued by the Government National Mortgage Association, commonly known as "Ginnie Mae"), while other mortgage-backed securities (e.g., mortgage- backed securities issued by the Federal National Mortgage Association and the Federal Home Loan Mortgage Corporation, commonly known as "Fannie Mae" and "Freddie Mac," respectively), are backed only by the credit of the government entity issuing them. In addition, some mortgage-backed securities are issued by private entities and, as such, are not guaranteed by the U.S. government or any agency or instrumentality of the U.S. government.
Loans:
Floating rate loans in which a Fund invests are primarily "senior" loans. Senior floating rate loans typically hold a senior position in the capital structures of the borrower, are typically secured by specific collateral, and have a claim on the assets and/or stock of the borrower that is senior to that held by subordinated debtholders and stockholders of the borrower. While these protections may reduce risk, these investments still present significant credit risk. A significant portion of a Fund's floating rate investments may be issued in connection with highly leveraged transactions such as leveraged buyouts, leveraged recapitalization loans, and other types of acquisition financing. Obligations in these types of transactions are subject to greater credit risk (including default and bankruptcy) than many other investments and may be, or become, illiquid. See the note below regarding below investment grade securities.
A Fund may purchase second lien loans (secured loans with a claim on collateral subordinate to a senior lender's claim on such collateral), fixed rate loans, unsecured loans, and other debt obligations.
Transactions in loans often settle on a delayed basis, and a Fund may not receive the proceeds from the sale of a loan or pay for a loan purchase for a substantial period of time after entering into the transactions.
Below Investment Grade Securities:
Certain Funds may invest in below investment grade securities (i.e., lower-quality, "junk" debt), which are subject to various risks. Lower-quality debt is considered to be speculative because it is less certain that the issuer will be able to pay interest or repay the principal than in the case of investment grade debt. These securities can involve a substantially greater risk of default than higher-rated securities, and their values can decline significantly over short periods of time. Lower-quality debt securities tend to be more sensitive to adverse news about their issuers, the market and the economy in general, than higher-quality debt securities. The market for these securities can be less liquid, especially during periods of recession or general market decline.
Collateralized Loan Obligations ("CLOs"):
CLOs are securities issued by entities that are collateralized by a pool of loans. CLOs are issued in multiple classes (tranches), and can be equity or debt with specific adjustable or fixed interest rates, and varying maturities. The cash flow from the underlying loans is used to pay off each tranche separately within the debt, or senior tranches. Equity, or subordinated tranches, typically are not paid a cash flow but do offer ownership in the CLO itself in the event of a sale.
43
Victory Portfolios II | | Notes to Financial Statements — continued
December 31, 2020 | |
(Unaudited)
Investment Companies:
Open-End Funds:
The Funds may invest in portfolios of open-end investment companies. These investment traded companies value securities in their portfolios for which market quotations are readily available at their market values (generally the last reported sale price) and all other securities and assets at their fair value by the methods established by the board of directors of the underlying funds.
Derivative Instruments:
Futures Contracts:
The Funds may enter into contracts for the future delivery of securities or foreign currencies and futures contracts based on a specific security, class of securities, foreign currency or an index, and purchase or sell options on any such futures contracts. A futures contract on a securities index is an agreement obligating either party to pay, and entitling the other party to receive, while the contract is outstanding, cash payments based on the level of a specified securities index. No physical delivery of the underlying asset is made. A Fund may enter into futures contracts in an effort to hedge against market risks. The acquisition of put and call options on futures contracts will give the Fund the right (but not the obligation), for a specified price, to sell or to purchase the underlying futures contract, upon exercise of the option, at any time during the option period. Futures transactions involve brokerage costs and require the Fund to segregate assets to cover contracts that would require it to purchase securities or currencies. A good faith margin deposit, known as initial margin, of cash or government securities with a broker or custodian is required to initiate and maintain open positions in futures contracts. Subsequent payments, known as variation margin, are made or received by the Fund based on the change in the market value of the position and are recorded as unrealized appreciation or depreciation until the contract is closed out, at which time the gain or loss is realized. A Fund may lose the expected benefit of futures transactions if interest rates, exchange rates or securities prices change in an unanticipated manner. Such unanticipated changes may also result in lower overall performance than if the Fund had not entered into any futures transactions. In addition, the value of a Fund's futures positions may not prove to be perfectly or even highly correlated with the value of its portfolio securities or foreign currencies, limiting a Fund's ability to hedge effectively against interest rate, exchange rate and/or market risk and giving rise to additional risks. There is no assurance of liquidity in the secondary market for purposes of closing out futures positions. The collateral held by the Funds is presented on the Statements of Assets and Liabilities under Deposit with brokers for futures contracts. As of and during the six months ended December 31, 2020, the Funds held no futures contracts.
Investment Transactions and Related Income:
Changes in holdings of investments are accounted for no later than one business day following the trade date. For financial reporting purposes, however, investment transactions are accounted for on trade date on the last business day of the reporting period. Interest income is determined on the basis of coupon interest accrued using the effective interest method which adjusts, where applicable, the amortization of premiums or accretion of discounts. Dividend income is recorded on the ex-dividend date. Gains or losses realized on sales of securities are recorded on the identified cost basis. Paydown gains or losses on applicable securities, if any, are recorded as components of Interest income on the Statements of Operations.
Certain Funds may receive other income from investment in loan assignments and/or unfunded commitments, including amendment fees, consent fees, and commitment fees. These fees are recorded as income when received by the Fund. These amounts, if received, are included in Interest income on the Statements of Operations.
44
Victory Portfolios II | | Notes to Financial Statements — continued
December 31, 2020 | |
(Unaudited)
Securities Lending:
The Trust has entered into a Master Securities Lending Agreement ("MSLA") with Citibank, N.A. ("Citibank" or the "Agent"). Under the terms of the MSLA, the Funds may lend securities to certain broker-dealers and banks in exchange for collateral in the amount of at least 102% of the value of U.S. securities loaned or at least 105% of the value of non-U.S. securities loaned, marked-to-market daily. Any collateral shortfalls associated with increases in the valuation of the securities loaned are adjusted the next business day. The collateral can be received in the form of cash collateral and/or non-cash collateral. Non-cash collateral can include U.S. Government Securities, letters of credit and certificates of deposit. The cash collateral is invested in short-term instruments or cash equivalents, primarily open-end investment companies, as noted on the Funds' Schedules of Portfolio Investments. The Trust does not have effective control of the non-cash collateral and therefore it is not disclosed on the Funds' Schedules of Portfolio Investments. During the time portfolio securities are on loan, the borrower will pay the Funds any dividends or interest paid on such securities plus any fee negotiated between the parties to the lending agreement. The Funds also earn a return from the collateral. The Funds pay the Agent various fees in connection with the investment of cash collateral and fees based on the investment income received from securities lending activities. Securities lending income (net of these fees) is disclosed on the Statements of Operations. Although risk is mitigated by the collateral, the Funds could experience a delay in recovering their securities and possible loss of income or value if the borrower fails to return them.
Securities lending transactions are entered into by a Fund under the MSLA, which permits the Fund, under certain circumstances such as an event of default, to offset amounts payable by the Fund to the same counterparty against amounts receivable from the counterparty to create a net payment due to or from the Fund.
The following table is a summary of the Funds' securities lending transactions which are subject to offset under the MSLA as of December 31, 2020. These transactions are accounted for as secured borrowings with an overnight and continuous contractual maturity for cash collateral and greater than overnight and continuous contractual maturity for non-cash collateral.
| | | Gross
Amount of
Recognized
Assets
(Value of | | Value of
Cash | | Value of
Non-cash Collateral
Received by Maturity | | | |
| | | Securities
on Loan) | | Collateral
Received* | | <30
Days | | Between
30 & 90 days | | >90
Days | | Net
Amount | |
USAA Core Short-Term Bond ETF | | $ | 1,799,999 | | | $ | 1,799,999 | | | $ | — | | | $ | — | | | $ | — | | | $ | — | | |
USAA Core Intermediate-Term Bond ETF | | | 1,270,166 | | | | 1,270,166 | | | | — | | | | — | | | | — | | | | — | | |
* Collateral received in excess of the market value of securities on loan is not presented in this table. The total cash collateral received by each Fund is disclosed on the Statements of Assets and Liabilities.
Federal Income Taxes:
It is the policy of each Fund to continue to qualify as a regulated investment company by complying with the provisions available to certain investment companies, as defined in applicable sections of the Internal Revenue Code, and to make distributions of net investment income and net realized gains sufficient to relieve it from all, or substantially all, federal income taxes. Accordingly, no provision for federal income taxes is required in the financial statements. The Funds have a tax year end of June 30.
Management of the Funds has reviewed tax positions taken in tax years that remain subject to examination by all major tax jurisdictions, including federal (i.e., the last four tax years, which includes the current fiscal tax year end). Management believes that there is no tax liability resulting from unrecognized tax benefits related to uncertain tax positions taken.
45
Victory Portfolios II | | Notes to Financial Statements — continued
December 31, 2020 | |
(Unaudited)
Allocations:
Expenses directly attributable to a Fund are charged to the Fund, while expenses which are attributable to more than one fund in the Trust, or jointly with an affiliated trust, are allocated among the respective funds in the Trust and/or affiliated trust based upon net assets or another appropriate basis.
3. Purchases and Sales:
Purchases and sales of securities (excluding securities maturing less than one year from acquisition), purchases and sales of U.S. Government Securities, and purchases and sales of in-kind transactions for the six months ended December 31, 2020, were as follows. Any realized gains or losses from in-kind redemptions are reflected on the Statements of Operations as Net realized gains (losses) from in-kind redemptions.
| | Purchases
(excluding U.S.
Government
Securities) | | Sales
(excluding U.S.
Government
Securities) | | Purchases
of U.S.
Government
Securities | | Sales
of U.S.
Government
Securities | |
USAA Core Short-Term
Bond ETF | | $ | 132,885,828 | | | $ | 42,986,841 | | | $ | — | | | $ | — | | |
USAA Core Intermediate-Term
Bond ETF | | | 97,109,975 | | | | 26,502,244 | | | | 120,049,746 | | | | 11,693,508 | | |
4. Fees and Transactions with Affiliates and Related Parties:
Investment advisory services are provided to the Funds by Victory Capital Management Inc. ("VCM" or the "Adviser"), a New York corporation registered as an investment adviser with the Securities and Exchange Commission ("SEC"). The Adviser is a wholly owned indirect subsidiary of Victory Capital Holdings, Inc., a publicly traded Delaware corporation, and a wholly owned direct subsidiary of Victory Capital Operating, LLC. Amounts incurred and paid to VCM for the six months ended December 31, 2020, are reflected on the Statements of Operations as Investment advisory fees.
Under the terms of the Investment Advisory Agreement, the Adviser is entitled to receive fees based on a percentage of the average daily net assets of each Fund. The rates at which the Adviser is paid by each Fund are included in the table below.
| | | Flat Rate | |
USAA Core Short-Term Bond ETF | | | 0.25 | % | |
USAA Core Intermediate-Term Bond ETF | | | 0.30 | % | |
VCM also serves as the Funds' administrator and fund accountant. Under the Administration and Fund Accounting Agreement, VCM is paid for its services an annual fee at a rate of 0.08% of the first $15 billion in average daily net assets of the Trust, USAA Mutual Funds Trust, Victory Variable Insurance Funds and Victory Portfolios (collectively, the "Victory Funds Complex"), 0.05% of the average daily net assets above $15 billion to $30 billion of the Victory Funds Complex and 0.04% of the average daily net assets over $30 billion of the Victory Funds Complex. Amounts incurred for the six months ended December 31, 2020, are reflected on the Statements of Operations as Administration fees.
Citi Fund Services Ohio, Inc. ("Citi"), an affiliate of Citibank, acts as sub-administrator and sub-fund accountant to the Funds pursuant to the Sub-Administration and Sub-Fund Accounting Services Agreement between VCM and Citi. VCM pays Citi a fee for providing these services. The Funds reimburse VCM and Citi for out-of-pocket expenses incurred in providing these services and certain other expenses specifically allocated to the Funds. Amounts incurred for the six months ended December 31, 2020, are reflected on the Statements of Operations as Sub-Administration fees.
Citibank serves as the Funds' custodian. The Funds pay Citibank a fee for providing these services. Amounts incurred for the six months ended December 31, 2020, are reflected on the Statements of Operations as Custodian fees.
46
Victory Portfolios II | | Notes to Financial Statements — continued
December 31, 2020 | |
(Unaudited)
Citibank also serves as the Funds' Transfer Agent. Amounts incurred for the six months ended December 31, 2020, are reflected on the Statements of Operations as Transfer agent fees.
The Chief Compliance Officer ("CCO") is an employee of the Adviser, which pays the compensation of the CCO and his support staff. The Trust has entered into an agreement to provide compliance services with the Adviser, pursuant to which the Adviser furnishes its compliance personnel, including the services of the CCO, and other resources reasonably necessary to provide the Trust with compliance oversight services related to the design, administration and oversight of a compliance program for the Trust in accordance with Rule 38a-1 under the 1940 Act. The Funds in the Victory Funds Complex, in aggregate, compensate the Adviser for these services. Amounts incurred for the six months ended December 31, 2020, are reflected on the Statements of Operations as Compliance fees.
Sidley Austin LLP provides legal services to the Trust.
The Adviser has entered into expense limitation agreements with the Funds. Under the terms of the agreements, the Adviser has agreed to waive fees or reimburse certain expenses to the extent that ordinary operating expenses incurred by certain Funds in any fiscal year exceed the expense limit for such Fund. Such excess amounts will be the liability of the Adviser. Interest, taxes, brokerage commissions, other expenditures which are capitalized in accordance with GAAP, and other extraordinary expenses not incurred in the ordinary course of a Fund's business are excluded from the expense limits. As of December 31, 2020, the expense limits (excluding voluntary waivers) are as follows:
| | | In Effect
July 1, 2019
Until
June 30, 2021 | |
USAA Core Short-Term Bond ETF | | | 0.35 | % | |
USAA Core Intermediate-Term Bond ETF | | | 0.40 | % | |
The Funds have agreed to repay fees and expenses that were waived or reimbursed by the Adviser for a period up to three fiscal years after such waiver or reimbursement was made to the extent such payments or repayments would not cause the expenses of a class to exceed the original expense limitation in place at the time of the waiver or reimbursement or any expense limitation agreement in place at the time of repayment. Amounts repaid to the Adviser during the year, if any, are reflected on the Statements of Operations as Recoupment of prior expenses waived/reimbursed by Adviser.
As of December 31, 2020, the following amounts are available to be repaid to the Adviser. The Funds have not recorded any amounts available to be repaid as a liability due to an assessment that such repayment is not probable at December 31, 2020.
| | | Expires
August 31, 2022 | | Expires
June 30, 2023 | | Expires
June 30, 2024 | | Total | |
USAA Core Short-Term Bond ETF | | $ | 2,875 | | | $ | 39,059 | | | $ | 32,764 | | | $ | 74,698 | | |
USAA Core Intermediate-Term Bond ETF | | | — | | | | — | | | | 94,728 | | | | 94,728 | | |
The Adviser may voluntarily waive or reimburse additional fees to assist the Funds in maintaining competitive expense ratios. Voluntary waivers and reimbursements applicable to the Funds are not available to be recouped at a future time. For the six months ended December 31, 2020, there were no voluntary waivers
Certain officers and/or interested trustees of the Funds are also officers and/or employees of the Adviser, Administrator, Fund Accountant, Sub-Administrator, Sub-Fund Accountant, Custodian, Distributor, and Legal Counsel.
5. Risks:
Each Fund may be subject to other risks in addition to these identified risks.
Debt Securities Risks — The value of a debt security or other income-producing security changes in response to various factors, including, for example, market-related factors (such as changes in interest
47
Victory Portfolios II | | Notes to Financial Statements — continued
December 31, 2020 | |
(Unaudited)
rates, adverse economic or political conditions, tariffs and trade disruptions, inflation, or adverse investor sentiment generally) and changes in the actual or perceived ability of the issuer (or of issuers generally) to meet its (or their) obligations. Changes in value may occur sharply and unpredictably.
Credit Risk — The Funds are subject to credit risk with respect to the amount each expects to receive from counterparties for financial instruments entered into by the Funds. The Funds may be negatively impacted if a counterparty becomes bankrupt or otherwise fails to perform its obligations due to financial difficulties. The Funds may experience significant delays in obtaining any recovery in bankruptcy or other reorganization proceeding and the Funds may obtain only limited recovery or may obtain no recovery in such circumstances. The Funds typically enter into transactions with counterparties whose credit ratings are investment grade, as determined by a nationally recognized statistical rating organization or, if unrated, judged by the Adviser to be of comparable quality. The Funds are subject to credit and interest rate risk with respect to fixed income securities. Credit risk refers to the ability of an issuer to make timely payments of interest and principal. Interest rates may rise or the rate of inflation may increase, impacting the value of investments in fixed income securities. A debt issuers' credit quality may be downgraded or an issuer may default. Interest rates may fluctuate due to changes in governmental fiscal policy initiatives and resulting market reaction to those initiatives.
Geopolitical/Natural Disaster Risk — An outbreak of disease called COVID-19 has spread internationally. The transmission of COVID-19 and efforts to contain its spread have resulted in international, national and local border closings and other significant travel restrictions and disruptions, significant disruptions to business operations, supply chains and consumer activity, significant challenges in healthcare service preparation and delivery, quarantines and general concern and uncertainty. These negative impacts have caused significant volatility and declines in global financial markets, which have caused losses for Fund investors during and subsequent to period end. The impact of the COVID-19 pandemic may last for an extended period of time, and could result in a substantial economic downturn or recession. Public health crises may exacerbate other pre-existing political, social, economic, market and financial risks. The extent of the impact to the financial performance of the Funds' investments will depend on future developments, including (i) the duration and spread of the outbreak, (ii) the restrictions and advisories, (iii) the effects on the financial markets, and (iv) the effects on the economy overall, all of which are highly uncertain and cannot be predicted.
LIBOR Discontinuation Risk — Many debt securities, derivatives and other financial instruments, including some of the Funds' investments, use the London Interbank Offered Rate ("LIBOR") as the reference or benchmark rate for variable interest rate calculations. However, the use of LIBOR started to come under pressure following manipulation allegations in 2012. Despite increased regulation and other corrective actions since that time, concerns have arisen regarding its viability as a benchmark, due largely to reduced activity in the financial markets that it measures. In June 2017, the Alternative Reference Rates Committee, a group of large U.S. banks working with the Federal Reserve, announced its selection of a new Secured Overnight Funding Rate ("SOFR"), which is intended to be a broad measure of secured overnight U.S. Treasury repo rates, as an appropriate replacement for LIBOR. The Federal Reserve Bank of New York began publishing the SOFR in 2018, expecting that it could be used on a voluntary basis in new instruments and transactions. Bank working groups and regulators in other countries have suggested other alternatives for their markets, including the Sterling Overnight Interbank Average Rate ("SONIA") in England. In July 2017, the Financial Conduct Authority (the "FCA"), the United Kingdom financial regulatory body, announced that after 2021 it will cease its active encouragement of UK banks to provide the quotations needed to sustain LIBOR. That announcement suggests that LIBOR may cease to be published after that time. It is expected that there will be enough for market participants to transition to the use of a different benchmark for both new and existing securities and transactions. Various financial industry groups have begun planning for that transition, but there are obstacles to converting certain longer-term securities and transactions to a new benchmark. Transition planning is at an early stage, and neither the effect of the transition process nor its ultimate success can yet be known. Although the foregoing may provide some sense of timing, there is no assurance that LIBOR, or any particular currency and tenor, will continue to be published until any particular date, and it appears highly likely that LIBOR will be discontinued or modified after December 31, 2021, or June 30, 2023, depending on the currency and tenor. The transition process might lead to increased volatility and illiquidity in markets that currently rely on the LIBOR to determine
48
Victory Portfolios II | | Notes to Financial Statements — continued
December 31, 2020 | |
(Unaudited)
interest rates. It could also lead to a reduction in the value of some LIBOR-based investments and reduce the effectiveness of new hedges placed against existing LIBOR-based instruments. Since the usefulness of LIBOR as a benchmark could deteriorate during the transition period, these effects could occur before the end of 2021.
6. Line of Credit:
For the six months ended December 31, 2020, the Victory Funds Complex participated in a short-term demand note "Line of Credit" agreement with Citibank. The Line of Credit agreement with Citibank was renewed on June 29, 2020, with a termination date of June 28, 2021. Under the agreement with Citibank, the Victory Funds Complex and USAA Mutual Funds Complex, combined, may borrow up to $600 million, of which $300 million is committed and $300 million is uncommitted. $40 million of the Line of Credit is reserved for use by the Victory Floating Rate Fund (herein, the "Fund"), another series of the Victory Funds Complex, with that Fund paying the related commitment fees for that amount. The purpose of the agreement is to meet temporary or emergency cash needs. For the six months ended December 31, 2020, Citibank received an annual commitment fee of 0.15% on $300 million for providing the Line of Credit. Each fund in the Victory Funds Complex pays a pro-rata portion of the commitment fees plus any interest (one month LIBOR plus one percent) on amounts borrowed. Effective June 29, 2020, under an amended Line of Credit agreement, Citibank will also receive an annual upfront fee of 0.10% on the $300 million committed line of credit. Each fund in the Victory Funds Complex will pay a pro-rata portion of the upfront fee. Interest charged to each Fund during the period, if applicable, is presented on the Statements of Operations under Line of credit fees.
The Funds did not utilize the Line of Credit during the six months ended December 31, 2020.
7. Federal Income Tax Information:
Each of the Funds intends to declare and distribute any net investment income monthly. Each of the Funds distribute any net realized long or short-term capital gains at least annually.
The amounts of dividends from net investment income and distributions from net realized gains (collectively, distributions to shareholders) are determined in accordance with federal income tax regulations, which may differ from GAAP. To the extent these "book/tax" differences are permanent in nature (e.g., net operating loss and distribution reclassification), such amounts are reclassified within the components of net assets based on their federal tax-basis treatment; temporary differences (e.g., wash sales) do not require reclassification. To the extent dividends and distributions exceed net investment income and net realized gains for tax purposes, they are reported as distributions of capital. Net investment losses incurred by a Fund may be reclassified as an offset to capital on the accompanying Statements of Assets and Liabilities.
The tax character of current year distributions paid and the tax basis of the current components of accumulated earnings (deficit) will be determined at the end of the current tax year ending June 30, 2021.
During the ten months ended June 30, 2020, the USAA Core Short-Term Bond ETF and USAA Core Intermediate-Term Bond ETF utilized $44,188 and $102,077 of short-term capital loss carryforwards, respectively.
49
Victory Portfolios II | | Supplemental Information — continued
December 31, 2020 | |
(Unaudited)
Proxy Voting and Portfolio Holdings Information
Proxy Voting:
Information regarding the policies and procedures each Fund uses to determine how to vote proxies relating to portfolio securities is available without charge, upon request, by calling 800-539-3863. The information is also included in the Funds' Statement of Additional Information, which is available on the SEC's website at www.sec.gov.
Information relating to how the Funds voted proxies relating to portfolio securities held during the most recent twelve months ended June 30 is available on the SEC's website at www.sec.gov.
Availability of Schedules of Portfolio Investments:
The Trust files a complete list of Schedules of Portfolio Investments with the SEC for the first and third quarter of each fiscal year on Form N-PORT. Form N-PORT is available on the SEC's web site at www.sec.gov.
Expense Examples
As a shareholder of the Funds, you may incur two types of costs: (1) transaction costs; and (2) ongoing costs, including management fees, and other Fund expenses. These examples are intended to help you understand your ongoing costs (in dollars) of investing in the Funds and to compare these costs with the ongoing costs of investing in other mutual funds.
These examples are based on an investment of $1,000 invested at the beginning of the period and held for the entire period from July 1, 2020, through December 31, 2020.
The Actual Expense figures in the table below provide information about actual account values and actual expenses. You may use the information below, together with the amount you invested, to estimate the expenses that you paid over the period. Simply divide your account value by $1,000 (for example, an $8,600 account value divided by $1,000 = 8.6), then multiply the result by the number in the table under the heading entitled "Actual Expenses Paid During Period" to estimate the expenses you paid on your account during this period.
The Hypothetical Expense figures in the table below provide information about hypothetical account values and hypothetical expenses based on each Fund's actual expense ratio and an assumed rate of return of 5% per year before expenses, which is not the Fund's actual return. The hypothetical account values and expenses may not be used to estimate the actual ending account balance or expenses you paid for the period. You may use this information to compare this 5% hypothetical example with the 5% hypothetical examples that appear in shareholder reports of other funds.
Please note the expenses shown in the table are meant to highlight your ongoing costs only and do not reflect any transactional costs. Therefore, the table is useful in comparing ongoing costs only, and will not help you determine the relative total costs of owning different funds. In addition, if these transactional costs were included, your costs would have been higher.
| | Beginning
Account
Value
7/1/20 | | Actual
Ending
Account
Value
12/31/20 | | Hypothetical
Ending
Account
Value
12/31/20 | | Actual
Expenses
Paid
During
Period
7/1/20-
12/31/20* | | Hypothetical
Expenses
Paid
During
Period
7/1/20-
12/31/20* | | Annualized
Expense
Ratio
During
Period
7/1/20-
12/31/20 | |
USAA Core Short-Term
Bond ETF | | $ | 1,000.00 | | | $ | 1,026.00 | | | $ | 1,023.54 | | | $ | 1.69 | | | $ | 1.68 | | | | 0.33 | % | |
USAA Core Intermediate-
Term Bond ETF | | | 1,000.00 | | | | 1,033.20 | | | | 1,023.39 | | | | 1.84 | | | | 1.84 | | | | 0.36 | % | |
* Expenses are equal to the average account value multiplied by the Fund's annualized expense ratio multiplied by 184/365 (the number of days in the most recent fiscal half-year divided by the number of days in the fiscal year).
50
Victory Portfolios II | | Supplemental Information — continued
December 31, 2020 | |
(Unaudited)
Considerations of the Board in Continuing the Investment Advisory Agreement (the "Agreement")
The Board approved the Agreement on behalf of each of the Funds at a meeting, which was called for that purpose, on December 2, 2020. The Board also considered information relating to the Funds and the Agreement provided throughout the year and, more specifically, at a meeting on October 27, 2020 called for the purpose of reviewing the Agreement. In considering whether to approve the Agreement, the Board requested, and the Adviser provided, information that the Board believed to be reasonably necessary to reach its conclusions.
The Board, including the Independent Trustees, evaluated this information along with other information obtained throughout the year and was advised by legal counsel to the Funds, which also serves as independent legal counsel to the Independent Trustees.
The Board noted that each Fund assumed the performance of its predecessor fund, that the Adviser became the investment adviser to each Fund on February 26, 2019, and that prior to that date each predecessor fund was managed by a different investment adviser.
The Board took into consideration regular reports from the Adviser throughout the COVID-19 pandemic public health crisis concerning how the ongoing pandemic has affected market volatility, investment risk and the implementation and effectiveness of business continuity plans. These reports also had confirmed that the pandemic had no material impact on the Adviser's operations.
The Board considered each Fund's advisory fee, expense ratio and investment performance as significant factors in determining whether the Agreement should be continued. In considering whether the compensation paid to the Adviser was fair and reasonable, the Board also evaluated, among other things, the following factors:
• The requirements of the Funds for the services provided by the Adviser;
• The nature, quality and extent of the services provided and expected to be provided;
• The performance of the Funds as compared to comparable funds;
• The fees payable for the services and whether the fee arrangements provided for economies of scale that would benefit Fund shareholders as the Funds grow;
• Whether the fee would be sufficient to enable the Adviser to attract and retain experienced personnel and continue to provide quality services to the Funds;
• Fees paid by other clients of the Adviser whose accounts are managed in a similar investment style and any differences in the services provided to the other clients compared to those provided to the Funds;
• Total expenses of each Fund;
• Management's commitment to operating the Funds at competitive expense levels;
• The profitability of the Adviser (as reflected by comparing fees earned against an estimate of the Adviser's costs) with respect to the Adviser's relationship with the Funds;
• The fact that the Funds are actively managed exchange-traded funds ("ETFs");
• Research and other service benefits received by the Adviser obtained through payment of client commissions for securities transactions;
• Other benefits received by the Adviser, and its affiliates, including revenues paid to the Adviser, or its affiliates, by the Funds for administration and fund accounting services, and distribution;
• The capabilities and financial condition of the Adviser;
• Current economic and industry trends; and
• The historical relationship between the Trust and the Adviser.
The Board reviewed each Fund's current management fee in the context of the Adviser's profitability with respect to each Fund. In addition, the Board compared each Fund's gross management fee and total expense ratio on a net and gross basis with the median gross management fee and median expense ratio of a universe of comparable ETFs compiled by an independent consultant and a peer group of funds with similar investment strategies selected by that independent consultant from the universe. The Board reviewed the factors and
51
Victory Portfolios II | | Supplemental Information — continued
December 31, 2020 | |
(Unaudited)
methodology used by the independent consultant in the selection of each Fund's peer group, including the independent consultant's selection of a broad universe of funds, the more specific universe of comparable funds, and peer groups of funds with comparable investment strategies and asset levels, among other factors.
The Board noted that none of the advisory fee arrangements for the Funds included breakpoints, which are generally viewed as a method by which an investment adviser shares any economies of scale with a fund as a fund grows. The Board also considered the Adviser's commitment to limit expenses as discussed in more detail below, and would consider breakpoints at a future time if a Fund's assets were to grow significantly.
The Board also reviewed the compliance and administrative services provided to the Funds by the Adviser and its affiliates, including the Adviser's oversight of the Funds' day-to-day operations and oversight of Fund accounting, assistance in meeting legal and regulatory requirements, and other services necessary for the operation of the Funds and the Trust.
The Board found that the gross annual management fee paid by each Fund was within the range of management fees paid by each Fund's respective peer group. The Board also found that each Fund's net annual expense ratio was reasonable as compared with each Fund's respective peer group. The Board considered the Adviser's contractual agreement with each Fund to waive its fees and reimburse expenses for a specified period of time, as described in the Fund's prospectus.
The Board reviewed each Fund's performance over the one-year period against the performance of the Fund's selected peer group and benchmark index. The Board recognized that the performance of the Funds and the peer group funds are net of expenses, while the performance of the benchmark index is gross returns.
The Board reviewed various other specific factors with respect to each Fund, as described below. In their deliberations, the Trustees did not rank the importance of any particular information or factor considered and each Trustee may have attributed different weights to various factors.
VictoryShares USAA Core Short-Term Bond ETF
Noting that the Fund commenced operations in 2017, the Board compared the Fund's one-year performance for the period ended June 30, 2020, to that of the median performance of the Fund's peer group and benchmark index for the same period and considered the fact that the Fund underperformed the benchmark index and outperformed the peer group median.
Having considered, among other things: (1) the Fund's management fee compared to comparable ETFs; (2) the Fund's total expense ratio compared to comparable ETFs; (3) that the Adviser's willingness to limit the expenses for a period of time would provide stability to the Fund's expenses during that period; and (4) that the Fund's performance in relation to its benchmark index and peer group was within an acceptable range, the Board concluded that the Agreement continued to be in the best interests of the Fund's shareholders.
VictoryShares USAA Core Intermediate-Term Bond ETF
Noting that the Fund commenced operations in 2017, the Board compared the Fund's one-year performance for the period ended June 30, 2020, to that of the median performance of the Fund's peer group and benchmark index for the same period and considered the fact that the Fund underperformed both the benchmark index and the peer group median.
Having considered, among other things: (1) the Fund's management fee compared to comparable ETFs; (2) the Fund's total expense ratio compared to comparable ETFs; (3) that the Adviser's willingness to limit the expenses for a period of time would provide stability to the Fund's expenses during that period; and (4) that the Fund's performance in relation to its benchmark index and peer group was within an acceptable range, the Board concluded that the Agreement continued to be in the best interests of the Fund's shareholders.
52
Privacy Policy
Protecting the Privacy of Information
The Trust respects your right to privacy. We also know that you expect us to conduct and process your business in an accurate and efficient manner. To do so, we must collect and maintain certain personal information about you. This is the information we collect from you on applications or other forms, and from the transactions you make with us or third parties. It may include your name, address, social security number, account transactions and balances, and information about investment goals and risk tolerance.
We do not disclose any information about you or about former customers to anyone except as permitted or required by law. Specifically, we may disclose the information we collect to companies that perform services on our behalf, such as the transfer agent that processes shareholder accounts and printers and mailers that assist us in the distribution of investor materials. We may also disclose this information to companies that perform marketing services on our behalf. This allows us to continue to offer you Victory investment products and services that meet your investing needs, and to effect transactions that you request or authorize. These companies will use this information only in connection with the services for which we hired them. They are not permitted to use or share this information for any other purpose.
To protect your personal information internally, we permit access only by authorized employees and maintain physical, electronic and procedural safeguards to guard your personal information.*
* You may have received communications regarding information about privacy policies from other financial institutions which gave you the opportunity to "opt-out" of certain information sharing with companies which are not affiliated with that financial institution. The Trust does not share information with other companies for purposes of marketing solicitations for products other than the Trust. Therefore, the Trust does not provide opt-out options to their shareholders.
The Victory Funds
P.O. Box 182593
Columbus, Ohio 43218-2593

Visit our website at: | | Call Victory at: | |
www.vcm.com | | 866-376-7890 | |

December 31, 2020
Semi Annual Report
VictoryShares USAA MSCI USA Value Momentum ETF
VictoryShares USAA MSCI USA Small Cap Value Momentum ETF
VictoryShares USAA MSCI International Value Momentum ETF
VictoryShares USAA MSCI Emerging Markets Value Momentum ETF
As permitted by regulations adopted by the Securities and Exchange Commission, paper copies of the VictoryShares' shareholder reports may no longer be sent by mail, unless you specifically request paper copies of the reports from your financial intermediary, such as a broker-dealer or bank. Instead, the reports will be made available on www.VictorySharesLiterature.com, and you will be notified by mail each time a report is posted and provided with a website link to access the report. If you already elected to receive shareholder reports electronically, you will not be affected by this change, and you need not take any action.
You can inform your financial intermediary that you wish to continue receiving paper copies of your reports. Your election to receive reports in paper will apply to all VictoryShares you hold through your financial intermediary.
vcm.com
News, Information And Education 24 Hours A Day, 7 Days A Week
The Victory Funds site gives fund shareholders, prospective shareholders, and investment professionals a convenient way to access fund information, get guidance, and track fund performance anywhere they can access the Internet. The site includes:
• Detailed performance records
• Daily share prices
• The latest fund news
• Investment resources to help you become a better investor
• A section dedicated to investment professionals
Whether you're a potential investor searching for the fund that matches your investment philosophy, a seasoned investor interested in planning tools, or an investment professional, www.vcm.com has what you seek. Visit us anytime. We're always open.
Table of Contents
Financial Statements | |
Victory Portfolios II Exchange-Traded Funds | |
VictoryShares USAA MSCI USA Value Momentum
ETF | |
Investment Objectives & Portfolio Holdings | | | 3 | | |
Schedule of Portfolio Investments | | | 4 | | |
Statement of Assets and Liabilities | | | 46 | | |
Statement of Operations | | | 48 | | |
Statements of Changes in Net Assets | | | 50 | | |
Financial Highlights | | | 52-53 | | |
VictoryShares USAA MSCI USA Small Cap Value
Momentum ETF | |
Investment Objectives & Portfolio Holdings | | | 3 | | |
Schedule of Portfolio Investments | | | 10 | | |
Statement of Assets and Liabilities | | | 46 | | |
Statement of Operations | | | 48 | | |
Statements of Changes in Net Assets | | | 50 | | |
Financial Highlights | | | 52-53 | | |
VictoryShares USAA MSCI International Value
Momentum ETF | |
Investment Objectives & Portfolio Holdings | | | 3 | | |
Schedule of Portfolio Investments | | | 22 | | |
Statement of Assets and Liabilities | | | 47 | | |
Statement of Operations | | | 49 | | |
Statements of Changes in Net Assets | | | 51 | | |
Financial Highlights | | | 54-55 | | |
VictoryShares USAA MSCI Emerging Markets
Value Momentum ETF | |
Investment Objectives & Portfolio Holdings | | | 3 | | |
Schedule of Portfolio Investments | | | 35 | | |
Statement of Assets and Liabilities | | | 47 | | |
Statement of Operations | | | 49 | | |
Statements of Changes in Net Assets | | | 51 | | |
Financial Highlights | | | 54-55 | | |
Notes to Financial Statements | | | 56 | | |
Supplemental Information (unaudited) | |
Proxy Voting and Portfolio Holdings Information | | | 68 | | |
Expense Examples | | | 68 | | |
Advisory Contract Approval | | | 70 | | |
Privacy Policy (inside back cover) | | | |
1
IRA DISTRIBUTION WITHHOLDING DISCLOSURE
We generally must withhold federal income tax at a rate of 10% of the taxable portion of your distribution and, if you live in a state that requires state income tax withholding, at your state's tax rate. However, you may elect not to have withholding apply or to have income tax withheld at a higher rate. Any withholding election that you make will apply to any subsequent distribution unless and until you change or revoke the election. If you wish to make a withholding election, or change or revoke a prior withholding election, call 866-376-7890.
If you do not have a withholding election in place by the date of a distribution, federal income tax will be withheld from the taxable portion of your distribution at a rate of 10%. If you must pay estimated taxes, you may be subject to estimated tax penalties if your estimated tax payments are not sufficient and sufficient tax is not withheld from your distribution.
For more specific information, please consult your tax adviser.
The VictoryShares are distributed by Foreside Fund Services, LLC. Victory Capital Management Inc. is the investment adviser to the Funds and receives fees from the Funds for performing services for the Funds.
This report is not authorized for distribution to prospective investors unless preceded or accompanied by a current prospectus of the VictoryShares.
For additional information about any VictoryShares, including fees, expenses, and risks, view our prospectus online at www.vcm.com or call 866-376-7890. Read it carefully before you invest or send money.
The information in this semi annual report is based on data obtained from recognized services and sources and is believed to be reliable. Any opinions, projections, or recommendations in this report are subject to change without notice and are not intended as individual investment advice. Past investment performance of the ETFs, markets or securities mentioned herein should not be considered to be indicative of future results.
This report is for the information of the shareholders and others who have received a copy of the currently effective prospectus of the Funds, managed by Victory Capital Management Inc. It may be used as sales literature only when preceded or accompanied by a current prospectus, which provides further details about the Funds.
• NOT FDIC INSURED • NO BANK GUARANTEE • MAY LOSE VALUE

Call Victory at:
866-376-7890
Visit our website at:
www.vcm.com
2
Victory Portfolios II | | December 31, 2020 | |
(Unaudited)
Investment Objectives & Portfolio Holdings:
VictoryShares USAA MSCI USA Value
Momentum ETF
Seeks to provide investment results that closely correspond, before fees and expenses, to the performance of the MSCI USA Select Value Momentum Blend Index.
Sector Allocation*:
December 31, 2020
(% of Net Assets)

* Does not include futures, money market instruments, and short-term investments purchased with cash collateral from securities loaned.
Percentages are of the net assets of the Fund and may not equal 100%.
VictoryShares USAA MSCI USA Small Cap
Value Momentum ETF
Seeks to provide investment results that closely correspond, before fees and expenses, to the performance of the MSCI USA Small Cap Select Value Momentum Blend Index.
Sector Allocation*:
December 31, 2020
(% of Net Assets)

* Does not include futures, money market instruments, and short-term investments purchased with cash collateral from securities loaned.
Percentages are of the net assets of the Fund and may not equal 100%.
VictoryShares USAA MSCI International
Value Momentum ETF
Seeks to provide investment results that closely correspond, before fees and expenses, to the performance of the MSCI World ex USA Select Value Momentum Blend Index.
Sector Allocation*:
December 31, 2020
(% of Net Assets)
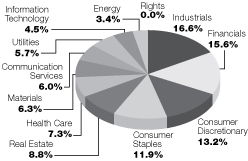
* Does not include futures, money market instruments, and short-term investments purchased with cash collateral from securities loaned.
Percentages are of the net assets of the Fund and may not equal 100%.
VictoryShares USAA MSCI Emerging
Markets Value Momentum ETF
Seeks to provide investment results that closely correspond, before fees and expenses, to the performance of the MSCI Emerging Markets Select Value Momentum Blend Index.
Sector Allocation*:
December 31, 2020
(% of Net Assets)

* Does not include futures, money market instruments, and short-term investments purchased with cash collateral from securities loaned.
Percentages are of the net assets of the Fund and may not equal 100%.
Refer to the Schedule of Portfolio Investments for a complete list of securities.
3
Victory Portfolios II
VictoryShares USAA MSCI USA Value Momentum ETF | | Schedule of Portfolio Investments
December 31, 2020 | |
(Unaudited)
Security Description | | Shares | | Value | |
Common Stocks (99.7%) | |
Communication Services (4.7%): | |
Activision Blizzard, Inc. | | | 19,655 | | | $ | 1,824,967 | | |
AT&T, Inc. | | | 66,136 | | | | 1,902,071 | | |
CenturyLink, Inc. | | | 252,504 | | | | 2,461,914 | | |
Charter Communications, Inc., Class A (a) | | | 2,596 | | | | 1,717,384 | | |
Discovery, Inc., Class A (a) (b) | | | 114,900 | | | | 3,457,341 | | |
Electronic Arts, Inc. | | | 12,599 | | | | 1,809,216 | | |
IAC/InterActiveCorp. (a) | | | 18,022 | | | | 3,412,465 | | |
Liberty Global PLC, Class C (a) | | | 77,051 | | | | 1,822,256 | | |
Pinterest, Inc., Class A (a) | | | 22,863 | | | | 1,506,672 | | |
T-Mobile U.S., Inc. (a) | | | 16,362 | | | | 2,206,416 | | |
ViacomCBS, Inc., Class B | | | 39,384 | | | | 1,467,448 | | |
| | | | 23,588,150 | | |
Consumer Discretionary (11.9%): | |
Amazon.com, Inc. (a) | | | 1,172 | | | | 3,817,122 | | |
Best Buy Co., Inc. | | | 23,983 | | | | 2,393,263 | | |
BorgWarner, Inc. | | | 67,404 | | | | 2,604,491 | | |
D.R. Horton, Inc. | | | 36,767 | | | | 2,533,982 | | |
Dollar General Corp. | | | 21,250 | | | | 4,468,875 | | |
eBay, Inc. | | | 64,016 | | | | 3,216,804 | | |
Etsy, Inc. (a) | | | 6,743 | | | | 1,199,647 | | |
Ford Motor Co. | | | 148,962 | | | | 1,309,376 | | |
Garmin Ltd. | | | 18,510 | | | | 2,214,907 | | |
General Motors Co. | | | 70,044 | | | | 2,916,632 | | |
Lear Corp. | | | 20,094 | | | | 3,195,548 | | |
Lennar Corp., Class A | | | 30,866 | | | | 2,352,915 | | |
LKQ Corp. (a) | | | 34,324 | | | | 1,209,578 | | |
MercadoLibre, Inc. (a) | | | 853 | | | | 1,428,963 | | |
Mohawk Industries, Inc. (a) | | | 17,217 | | | | 2,426,736 | | |
Newell Brands, Inc. | | | 121,066 | | | | 2,570,231 | | |
NVR, Inc. (a) | | | 322 | | | | 1,313,715 | | |
Peloton Interactive, Inc., Class A (a) | | | 30,764 | | | | 4,667,514 | | |
Pool Corp. | | | 5,962 | | | | 2,220,845 | | |
PulteGroup, Inc. | | | 48,291 | | | | 2,082,308 | | |
Target Corp. (c) | | | 20,250 | | | | 3,574,733 | | |
Tesla, Inc. (a) | | | 3,866 | | | | 2,728,120 | | |
Tractor Supply Co. | | | 10,439 | | | | 1,467,515 | | |
Whirlpool Corp. | | | 13,477 | | | | 2,432,464 | | |
| | | | 60,346,284 | | |
Consumer Staples (6.5%): | |
Bunge Ltd. | | | 32,636 | | | | 2,140,269 | | |
Church & Dwight Co., Inc. | | | 26,046 | | | | 2,271,993 | | |
Conagra Brands, Inc. | | | 84,547 | | | | 3,065,674 | | |
General Mills, Inc. | | | 32,619 | | | | 1,917,997 | | |
Molson Coors Beverage Co., Class B | | | 79,279 | | | | 3,582,618 | | |
The Clorox Co. | | | 23,703 | | | | 4,786,109 | | |
The J.M. Smucker Co. | | | 37,691 | | | | 4,357,080 | | |
See notes to financial statements.
4
Victory Portfolios II
VictoryShares USAA MSCI USA Value Momentum ETF | | Schedule of Portfolio Investments — continued
December 31, 2020 | |
(Unaudited)
Security Description | | Shares | | Value | |
The Kraft Heinz Co. | | | 97,070 | | | $ | 3,364,446 | | |
The Kroger Co. | | | 102,519 | | | | 3,256,003 | | |
Walgreens Boots Alliance, Inc. | | | 42,429 | | | | 1,692,069 | | |
Walmart, Inc. | | | 17,521 | | | | 2,525,652 | | |
| | | | 32,959,910 | | |
Energy (2.4%): | |
Baker Hughes Co. | | | 134,348 | | | | 2,801,156 | | |
Cabot Oil & Gas Corp. | | | 166,437 | | | | 2,709,595 | | |
Concho Resources, Inc. | | | 20,947 | | | | 1,222,257 | | |
Marathon Petroleum Corp. | | | 55,415 | | | | 2,291,964 | | |
Pioneer Natural Resources Co. | | | 13,878 | | | | 1,580,565 | | |
The Williams Cos., Inc. | | | 66,495 | | | | 1,333,225 | | |
| | | | 11,938,762 | | |
Financials (13.7%): | |
AGNC Investment Corp. | | | 186,073 | | | | 2,902,739 | | |
Ally Financial, Inc. | | | 78,154 | | | | 2,786,972 | | |
American International Group, Inc. | | | 66,982 | | | | 2,535,939 | | |
Ameriprise Financial, Inc. | | | 7,497 | | | | 1,456,892 | | |
Annaly Capital Management, Inc. | | | 158,223 | | | | 1,336,984 | | |
Arthur J. Gallagher & Co. | | | 18,749 | | | | 2,319,439 | | |
Assurant, Inc. | | | 13,704 | | | | 1,866,759 | | |
Athene Holding Ltd., Class A (a) | | | 45,290 | | | | 1,953,811 | | |
Capital One Financial Corp. | | | 29,207 | | | | 2,887,112 | | |
Citigroup, Inc. | | | 52,137 | | | | 3,214,767 | | |
Citizens Financial Group, Inc. | | | 87,026 | | | | 3,112,050 | | |
Equitable Holdings, Inc. | | | 129,148 | | | | 3,304,898 | | |
Erie Indemnity Co., Class A | | | 9,847 | | | | 2,418,423 | | |
Invesco Ltd. | | | 188,619 | | | | 3,287,629 | | |
KKR & Co., Inc. | | | 79,564 | | | | 3,221,546 | | |
Lincoln National Corp. | | | 40,802 | | | | 2,052,749 | | |
MarketAxess Holdings, Inc. | | | 3,209 | | | | 1,830,927 | | |
MetLife, Inc. | | | 63,048 | | | | 2,960,103 | | |
Morgan Stanley | | | 55,499 | | | | 3,803,346 | | |
MSCI, Inc. | | | 5,029 | | | | 2,245,599 | | |
Nasdaq, Inc. | | | 14,797 | | | | 1,964,154 | | |
Prudential Financial, Inc. | | | 35,523 | | | | 2,773,281 | | |
Regions Financial Corp. | | | 80,623 | | | | 1,299,643 | | |
S&P Global, Inc. | | | 5,505 | | | | 1,809,659 | | |
State Street Corp. | | | 20,006 | | | | 1,456,037 | | |
SVB Financial Group (a) | | | 3,486 | | | | 1,351,975 | | |
The Goldman Sachs Group, Inc. | | | 7,167 | | | | 1,890,010 | | |
The Progressive Corp. | | | 23,497 | | | | 2,323,383 | | |
Voya Financial, Inc. | | | 49,962 | | | | 2,938,265 | | |
| | | | 69,305,091 | | |
Health Care (15.8%): | |
10X Genomics, Inc., Class A (a) | | | 11,561 | | | | 1,637,038 | | |
AbbVie, Inc. | | | 15,986 | | | | 1,712,900 | | |
Alexion Pharmaceuticals, Inc. (a) | | | 25,449 | | | | 3,976,152 | | |
See notes to financial statements.
5
Victory Portfolios II
VictoryShares USAA MSCI USA Value Momentum ETF | | Schedule of Portfolio Investments — continued
December 31, 2020 | |
(Unaudited)
Security Description | | Shares | | Value | |
AmerisourceBergen Corp. | | | 34,213 | | | $ | 3,344,663 | | |
Biogen, Inc. (a) | | | 9,488 | | | | 2,323,232 | | |
Bio-Rad Laboratories, Inc., Class A (a) | | | 6,639 | | | | 3,870,138 | | |
Bristol-Myers Squibb Co. | | | 66,316 | | | | 4,113,582 | | |
Cardinal Health, Inc. | | | 28,264 | | | | 1,513,820 | | |
Centene Corp. (a) | | | 42,729 | | | | 2,565,022 | | |
Cigna Corp. | | | 16,081 | | | | 3,347,743 | | |
CVS Health Corp. | | | 51,078 | | | | 3,488,627 | | |
Danaher Corp. | | | 21,254 | | | | 4,721,363 | | |
DaVita, Inc. (a) | | | 30,176 | | | | 3,542,661 | | |
DexCom, Inc. (a) | | | 2,185 | | | | 807,838 | | |
Gilead Sciences, Inc. (c) | | | 26,815 | | | | 1,562,242 | | |
Horizon Therapeutics PLC (a) | | | 18,284 | | | | 1,337,475 | | |
Humana, Inc. | | | 3,488 | | | | 1,431,022 | | |
Jazz Pharmaceuticals PLC (a) | | | 11,737 | | | | 1,937,192 | | |
Laboratory Corp. of America Holdings (a) | | | 7,456 | | | | 1,517,669 | | |
McKesson Corp. | | | 19,286 | | | | 3,354,221 | | |
Moderna, Inc. (a) | | | 39,783 | | | | 4,156,129 | | |
Molina Healthcare, Inc. (a) | | | 11,545 | | | | 2,455,391 | | |
PerkinElmer, Inc. | | | 16,201 | | | | 2,324,844 | | |
Perrigo Co. PLC | | | 23,649 | | | | 1,057,583 | | |
Quest Diagnostics, Inc. | | | 14,017 | | | | 1,670,406 | | |
Regeneron Pharmaceuticals, Inc. (a) | | | 5,616 | | | | 2,713,146 | | |
Teladoc Health, Inc. (a) (b) | | | 4,437 | | | | 887,223 | | |
Thermo Fisher Scientific, Inc. | | | 10,134 | | | | 4,720,214 | | |
Veeva Systems, Inc., Class A (a) | | | 5,340 | | | | 1,453,815 | | |
Viatris, Inc. (a) | | | 163,576 | | | | 3,065,414 | | |
West Pharmaceutical Services, Inc. | | | 13,444 | | | | 3,808,820 | | |
| | | | 80,417,585 | | |
Industrials (13.5%): | |
AMERCO, Inc. | | | 4,499 | | | | 2,042,366 | | |
C.H. Robinson Worldwide, Inc. | | | 20,765 | | | | 1,949,211 | | |
Carrier Global Corp. | | | 41,566 | | | | 1,567,870 | | |
Cummins, Inc. | | | 16,065 | | | | 3,648,361 | | |
Eaton Corp. PLC | | | 31,517 | | | | 3,786,452 | | |
Enphase Energy, Inc. (a) | | | 5,773 | | | | 1,012,988 | | |
Fastenal Co. | | | 35,521 | | | | 1,734,490 | | |
FedEx Corp. | | | 11,947 | | | | 3,101,680 | | |
Fortune Brands Home & Security, Inc. | | | 27,843 | | | | 2,386,702 | | |
Generac Holdings, Inc. (a) | | | 7,746 | | | | 1,761,518 | | |
IHS Markit Ltd. | | | 22,804 | | | | 2,048,483 | | |
Ingersoll Rand, Inc. (a) (c) | | | 36,521 | | | | 1,663,897 | | |
J.B. Hunt Transport Services, Inc. | | | 12,637 | | | | 1,726,846 | | |
Johnson Controls International PLC | | | 37,314 | | | | 1,738,459 | | |
Kansas City Southern | | | 19,161 | | | | 3,911,335 | | |
Knight-Swift Transportation Holdings, Inc. | | | 71,005 | | | | 2,969,429 | | |
Masco Corp. | | | 25,333 | | | | 1,391,542 | | |
Old Dominion Freight Line, Inc. | | | 17,420 | | | | 3,400,036 | | |
Owens Corning, Inc. | | | 34,467 | | | | 2,611,219 | | |
PACCAR, Inc. | | | 41,876 | | | | 3,613,061 | | |
See notes to financial statements.
6
Victory Portfolios II
VictoryShares USAA MSCI USA Value Momentum ETF | | Schedule of Portfolio Investments — continued
December 31, 2020 | |
(Unaudited)
Security Description | | Shares | | Value | |
Rollins, Inc. | | | 54,937 | | | $ | 2,146,389 | | |
Snap-on, Inc. | | | 9,894 | | | | 1,693,259 | | |
Stanley Black & Decker, Inc. | | | 7,542 | | | | 1,346,700 | | |
Sunrun, Inc. (a) | | | 13,920 | | | | 965,770 | | |
Textron, Inc. | | | 28,900 | | | | 1,396,737 | | |
Trane Technologies PLC | | | 25,416 | | | | 3,689,387 | | |
United Parcel Service, Inc., Class B | | | 20,856 | | | | 3,512,150 | | |
United Rentals, Inc. (a) | | | 11,320 | | | | 2,625,222 | | |
Westinghouse Air Brake Technologies Corp. | | | 35,881 | | | | 2,626,489 | | |
| | | | 68,068,048 | | |
Information Technology (15.7%): | |
Apple, Inc. | | | 30,322 | | | | 4,023,425 | | |
Applied Materials, Inc. | | | 17,681 | | | | 1,525,870 | | |
Arrow Electronics, Inc. (a) | | | 39,181 | | | | 3,812,311 | | |
Cadence Design Systems, Inc. (a) | | | 16,271 | | | | 2,219,853 | | |
Cloudflare, Inc., Class A (a) | | | 23,930 | | | | 1,818,441 | | |
Corning, Inc. | | | 44,188 | | | | 1,590,768 | | |
Crowdstrike Holdings, Inc., Class A (a) | | | 11,207 | | | | 2,373,867 | | |
Datadog, Inc., Class A (a) | | | 35,128 | | | | 3,458,000 | | |
Dell Technologies, Inc., Class C (a) | | | 44,655 | | | | 3,272,765 | | |
DocuSign, Inc. (a) | | | 14,113 | | | | 3,137,320 | | |
Hewlett Packard Enterprise Co. | | | 304,523 | | | | 3,608,598 | | |
HP, Inc. | | | 146,683 | | | | 3,606,935 | | |
Intel Corp. | | | 69,452 | | | | 3,460,099 | | |
Lam Research Corp. | | | 2,942 | | | | 1,389,418 | | |
Micron Technology, Inc. (a) | | | 44,429 | | | | 3,340,172 | | |
Microsoft Corp. (c) | | | 10,940 | | | | 2,433,275 | | |
NVIDIA Corp. | | | 4,904 | | | | 2,560,869 | | |
NXP Semiconductors NV | | | 10,415 | | | | 1,656,089 | | |
PayPal Holdings, Inc. (a) | | | 8,287 | | | | 1,940,815 | | |
Qorvo, Inc. (a) | | | 19,776 | | | | 3,288,156 | | |
QUALCOMM, Inc. | | | 9,366 | | | | 1,426,816 | | |
Seagate Technology PLC | | | 59,262 | | | | 3,683,726 | | |
Skyworks Solutions, Inc. | | | 21,034 | | | | 3,215,678 | | |
SolarEdge Technologies, Inc. (a) | | | 3,718 | | | | 1,186,488 | | |
Synopsys, Inc. (a) | | | 9,358 | | | | 2,425,968 | | |
Teradyne, Inc. | | | 25,200 | | | | 3,021,228 | | |
Western Digital Corp. | | | 52,830 | | | | 2,926,254 | | |
Zoom Video Communications, Inc., Class A (a) | | | 8,980 | | | | 3,029,134 | | |
Zscaler, Inc. (a) | | | 22,620 | | | | 4,517,439 | | |
| | | | 79,949,777 | | |
Materials (5.2%): | |
Air Products & Chemicals, Inc. | | | 7,157 | | | | 1,955,436 | | |
Albemarle Corp. | | | 10,234 | | | | 1,509,720 | | |
Corteva, Inc. | | | 94,713 | | | | 3,667,286 | | |
Eastman Chemical Co. | | | 33,463 | | | | 3,355,670 | | |
Freeport-McMoRan, Inc. | | | 54,966 | | | | 1,430,215 | | |
Linde PLC | | | 7,640 | | | | 2,013,217 | | |
Newmont Corp. | | | 48,834 | | | | 2,924,668 | | |
See notes to financial statements.
7
Victory Portfolios II
VictoryShares USAA MSCI USA Value Momentum ETF | | Schedule of Portfolio Investments — continued
December 31, 2020 | |
(Unaudited)
Security Description | | Shares | | Value | |
Nucor Corp. | | | 33,540 | | | $ | 1,783,993 | | |
Steel Dynamics, Inc. | | | 88,577 | | | | 3,265,834 | | |
The Mosaic Co. | | | 59,579 | | | | 1,370,913 | | |
Westrock Co. | | | 73,814 | | | | 3,213,123 | | |
| | | | 26,490,075 | | |
Real Estate (7.1%): | |
American Tower Corp. | | | 7,820 | | | | 1,755,277 | | |
CBRE Group, Inc., Class A (a) | | | 53,683 | | | | 3,366,998 | | |
Crown Castle International Corp. | | | 11,274 | | | | 1,794,708 | | |
Digital Realty Trust, Inc. | | | 26,708 | | | | 3,726,033 | | |
Duke Realty Corp. | | | 48,105 | | | | 1,922,757 | | |
Equinix, Inc. | | | 5,177 | | | | 3,697,310 | | |
Extra Space Storage, Inc. | | | 17,521 | | | | 2,029,983 | | |
Host Hotels & Resorts, Inc. | | | 239,837 | | | | 3,508,815 | | |
Iron Mountain, Inc. (b) | | | 118,780 | | | | 3,501,634 | | |
Mid-America Apartment Communities, Inc. | | | 25,937 | | | | 3,285,959 | | |
Prologis, Inc. | | | 15,517 | | | | 1,546,424 | | |
Public Storage | | | 9,990 | | | | 2,306,991 | | |
Simon Property Group, Inc. | | | 11,929 | | | | 1,017,305 | | |
VICI Properties, Inc. | | | 119,884 | | | | 3,057,042 | | |
| | | | 36,517,236 | | |
Utilities (3.2%): | |
American Water Works Co., Inc. | | | 12,469 | | | | 1,913,617 | | |
Exelon Corp. | | | 46,462 | | | | 1,961,626 | | |
NextEra Energy, Inc. (c) | | | 28,164 | | | | 2,172,853 | | |
NRG Energy, Inc. | | | 94,548 | | | | 3,550,277 | | |
PG&E Corp. (a) | | | 126,540 | | | | 1,576,688 | | |
The AES Corp. | | | 77,201 | | | | 1,814,224 | | |
Vistra Corp. | | | 168,854 | | | | 3,319,670 | | |
| | | | 16,308,955 | | |
Total Common Stocks (Cost $440,373,147) | | | 505,889,873 | | |
Collateral for Securities Loaned^ (1.3%) | |
BlackRock Liquidity Funds TempFund Portfolio, Institutional Class, 0.08% (d) | | | 118,307 | | | | 118,307 | | |
Fidelity Investments Money Market Government Portfolio I Shares, 0.01% (d) | | | 4,064,523 | | | | 4,064,523 | | |
Goldman Sachs Financial Square Prime Obligations Fund, Institutional
Class, 0.04% (d) | | | 59,041 | | | | 59,041 | | |
JPMorgan Prime Money Market Fund, Capital Class, 0.12% (d) | | | 470,773 | | | | 470,773 | | |
Morgan Stanley Institutional Liquidity Prime Portfolio,
Institutional Class, 0.09% (d) | | | 2,116,688 | | | | 2,116,688 | | |
Total Collateral for Securities Loaned (Cost $6,829,332) | | | 6,829,332 | | |
Total Investments (Cost $447,202,479) — 101.0% | | | 512,719,205 | | |
Liabilities in excess of other assets — (1.0)% | | | (4,874,949 | ) | |
NET ASSETS — 100.00% | | $ | 507,844,256 | | |
See notes to financial statements.
8
Victory Portfolios II
VictoryShares USAA MSCI USA Value Momentum ETF | | Schedule of Portfolio Investments — continued
December 31, 2020 | |
(Unaudited)
^ Purchased with cash collateral from securities on loan.
(a) Non-income producing security.
(b) All or a portion of this security is on loan.
(c) All or a portion of this security has been segregated as collateral for derivative instruments.
(d) Rate disclosed is the daily yield on December 31, 2020.
PLC — Public Limited Company
Futures Contracts Purchased
| | | Number of
Contracts | | Expiration
Date | | Notional
Amount | | Value | | Unrealized
Appreciation
(Depreciation) | |
E-Mini S&P 500 Futures | | | 8 | | | 3/19/21 | | $ | 1,473,795 | | | $ | 1,499,520 | | | $ | 25,725 | | |
| | | Total unrealized appreciation | | | | | | | | $ | 25,725 | | |
| | | Total unrealized depreciation | | | | | | | | | — | | |
| | | Total net unrealized appreciation (depreciation) | | | | | | | | $ | 25,725 | | |
See notes to financial statements.
9
Victory Portfolios II
VictoryShares USAA MSCI USA Small Cap Value
Momentum ETF | | Schedule of Portfolio Investments
December 31, 2020 | |
(Unaudited)
Security Description | | Shares | | Value | |
Common Stocks (99.4%) | |
Communication Services (3.5%): | |
ANGI Homeservices, Inc., Class A (a) | | | 45,622 | | | $ | 601,982 | | |
Bandwidth, Inc., Class A (a) | | | 4,207 | | | | 646,490 | | |
Cardlytics, Inc. (a) (b) | | | 6,382 | | | | 911,158 | | |
Cars.com, Inc. (a) | | | 24,627 | | | | 278,285 | | |
Cincinnati Bell, Inc. (a) | | | 33,618 | | | | 513,683 | | |
Cogent Communications Holdings, Inc. (c) | | | 7,553 | | | | 452,198 | | |
Consolidated Communications Holdings, Inc. (a) | | | 78,357 | | | | 383,166 | | |
EverQuote, Inc., Class A (a) | | | 7,976 | | | | 297,904 | | |
Gogo, Inc. (a) (b) | | | 20,464 | | | | 197,068 | | |
Gray Television, Inc. (a) | | | 34,484 | | | | 616,919 | | |
QuinStreet, Inc. (a) | | | 16,035 | | | | 343,790 | | |
Shenandoah Telecommunications Co. (b) | | | 17,664 | | | | 763,968 | | |
TechTarget, Inc. (a) | | | 16,619 | | | | 982,349 | | |
Telephone & Data Systems, Inc. | | | 40,567 | | | | 753,329 | | |
The New York Times Co., Class A | | | 9,970 | | | | 516,147 | | |
TrueCar, Inc. (a) | | | 62,790 | | | | 263,718 | | |
United States Cellular Corp. (a) | | | 12,865 | | | | 394,827 | | |
Zynga, Inc., Class A (a) | | | 119,932 | | | | 1,183,729 | | |
| | | | 10,100,710 | | |
Consumer Discretionary (10.7%): | |
1-800-Flowers.com, Inc., Class A (a) | | | 10,355 | | | | 269,230 | | |
Abercrombie & Fitch Co. | | | 11,899 | | | | 242,264 | | |
Acushnet Holdings Corp. | | | 14,380 | | | | 582,965 | | |
American Public Education, Inc. (a) | | | 21,124 | | | | 643,860 | | |
Asbury Automotive Group, Inc. (a) | | | 2,591 | | | | 377,612 | | |
At Home Group, Inc. (a) | | | 13,136 | | | | 203,083 | | |
AutoNation, Inc. (a) | | | 11,594 | | | | 809,144 | | |
Bed Bath & Beyond, Inc. (b) | | | 10,693 | | | | 189,908 | | |
Big Lots, Inc. | | | 10,599 | | | | 455,016 | | |
Brunswick Corp. | | | 4,594 | | | | 350,247 | | |
Camping World Holdings, Inc., Class A | | | 12,367 | | | | 322,160 | | |
CarParts.com, Inc. (a) | | | 17,174 | | | | 212,786 | | |
Century Communities, Inc. (a) | | | 10,554 | | | | 462,054 | | |
Chegg, Inc. (a) | | | 8,477 | | | | 765,727 | | |
Collectors Universe, Inc. | | | 4,822 | | | | 363,579 | | |
Cooper Tire & Rubber Co. | | | 18,113 | | | | 733,577 | | |
Dana, Inc. | | | 15,262 | | | | 297,914 | | |
Deckers Outdoor Corp. (a) | | | 1,591 | | | | 456,267 | | |
Dick's Sporting Goods, Inc. | | | 10,849 | | | | 609,822 | | |
Dillard's, Inc., Class A (b) | | | 5,209 | | | | 328,427 | | |
Duluth Holdings, Inc., Class B (a) (b) | | | 17,523 | | | | 185,043 | | |
El Pollo Loco Holdings, Inc. (a) | | | 17,096 | | | | 309,438 | | |
Ethan Allen Interiors, Inc. | | | 23,415 | | | | 473,217 | | |
Genesco, Inc. (a) | | | 17,308 | | | | 520,798 | | |
G-III Apparel Group Ltd. (a) | | | 28,350 | | | | 673,029 | | |
Green Brick Partners, Inc. (a) | | | 13,691 | | | | 314,345 | | |
See notes to financial statements.
10
Victory Portfolios II
VictoryShares USAA MSCI USA Small Cap Value
Momentum ETF | | Schedule of Portfolio Investments — continued
December 31, 2020 | |
(Unaudited)
Security Description | | Shares | | Value | |
Group 1 Automotive, Inc. | | | 4,661 | | | $ | 611,244 | | |
Groupon, Inc. (a) | | | 6,335 | | | | 240,698 | | |
Haverty Furniture Cos., Inc. | | | 13,298 | | | | 367,956 | | |
Helen of Troy Ltd. (a) | | | 1,907 | | | | 423,716 | | |
Hibbett Sports, Inc. (a) | | | 15,491 | | | | 715,374 | | |
Johnson Outdoors, Inc., Class A | | | 4,757 | | | | 535,781 | | |
KB Home | | | 13,992 | | | | 469,012 | | |
L Brands, Inc. | | | 7,139 | | | | 265,499 | | |
Lithia Motors, Inc., Class A | | | 2,182 | | | | 638,606 | | |
Lumber Liquidators Holdings, Inc. (a) | | | 8,039 | | | | 247,119 | | |
M/I Homes, Inc. (a) | | | 10,844 | | | | 480,281 | | |
Malibu Boats, Inc., Class A (a) | | | 4,285 | | | | 267,555 | | |
MarineMax, Inc. (a) | | | 14,790 | | | | 518,094 | | |
MDC Holdings, Inc. | | | 13,629 | | | | 662,369 | | |
Meritage Homes Corp. (a) | | | 5,766 | | | | 477,540 | | |
Murphy USA, Inc. | | | 2,952 | | | | 386,328 | | |
Ollie's Bargain Outlet Holdings, Inc. (a) | | | 3,194 | | | | 261,173 | | |
Papa John's International, Inc. | | | 3,924 | | | | 332,951 | | |
Penn National Gaming, Inc. (a) | | | 3,053 | | | | 263,688 | | |
PetMed Express, Inc. (b) (c) | | | 9,601 | | | | 307,808 | | |
Purple Innovation, Inc. (a) | | | 9,392 | | | | 309,372 | | |
Qurate Retail, Inc., Class A | | | 59,821 | | | | 656,237 | | |
Rent-A-Center, Inc. | | | 17,307 | | | | 662,685 | | |
Shoe Carnival, Inc. | | | 7,615 | | | | 298,356 | | |
Signet Jewelers Ltd. (b) | | | 21,622 | | | | 589,632 | | |
Smith & Wesson Brands, Inc. | | | 30,625 | | | | 543,594 | | |
Sonic Automotive, Inc., Class A | | | 10,780 | | | | 415,785 | | |
Sportsman's Warehouse Holdings, Inc. (a) | | | 20,247 | | | | 355,335 | | |
Stamps.com, Inc. (a) | | | 1,834 | | | | 359,812 | | |
Stride, Inc. (a) | | | 6,973 | | | | 148,037 | | |
Sturm Ruger & Co., Inc. (c) | | | 14,531 | | | | 945,532 | | |
Taylor Morrison Home Corp. (a) | | | 19,150 | | | | 491,198 | | |
The ODP Corp. (a) | | | 21,074 | | | | 617,468 | | |
Thor Industries, Inc. | | | 5,436 | | | | 505,494 | | |
Toll Brothers, Inc. | | | 13,069 | | | | 568,109 | | |
TopBuild Corp. (a) | | | 3,626 | | | | 667,475 | | |
TRI Pointe Group, Inc. (a) | | | 30,563 | | | | 527,212 | | |
Tupperware Brands Corp. (a) | | | 6,052 | | | | 196,024 | | |
Vista Outdoor, Inc. (a) | | | 20,556 | | | | 488,411 | | |
Winnebago Industries, Inc. | | | 4,196 | | | | 251,508 | | |
Zumiez, Inc. (a) | | | 18,720 | | | | 688,522 | | |
| | | | 29,910,102 | | |
Consumer Staples (3.6%): | |
B&G Foods, Inc. (b) | | | 12,089 | | | | 335,228 | | |
BJ's Wholesale Club Holdings, Inc. (a) | | | 8,372 | | | | 312,108 | | |
Celsius Holdings, Inc. (a) | | | 7,353 | | | | 369,929 | | |
Central Garden & Pet Co., Class A (a) | | | 11,735 | | | | 426,333 | | |
Darling Ingredients, Inc. (a) | | | 20,462 | | | | 1,180,248 | | |
See notes to financial statements.
11
Victory Portfolios II
VictoryShares USAA MSCI USA Small Cap Value
Momentum ETF | | Schedule of Portfolio Investments — continued
December 31, 2020 | |
(Unaudited)
Security Description | | Shares | | Value | |
Edgewell Personal Care Co. | | | 12,147 | | | $ | 420,043 | | |
Fresh Del Monte Produce, Inc. | | | 28,583 | | | | 687,993 | | |
Freshpet, Inc. (a) | | | 6,789 | | | | 963,970 | | |
Ingles Markets, Inc., Class A | | | 21,411 | | | | 913,393 | | |
National Beverage Corp. (b) | | | 4,236 | | | | 359,636 | | |
Rite Aid Corp. (a) (b) | | | 13,407 | | | | 212,233 | | |
SpartanNash Co. | | | 26,248 | | | | 456,978 | | |
Sprouts Farmers Market, Inc. (a) | | | 16,678 | | | | 335,228 | | |
The Andersons, Inc. | | | 36,722 | | | | 900,056 | | |
The Boston Beer Co., Inc., Class A (a) | | | 854 | | | | 849,124 | | |
United Natural Foods, Inc. (a) (b) | | | 21,916 | | | | 349,999 | | |
Weis Markets, Inc. (c) | | | 22,168 | | | | 1,059,852 | | |
| | | | 10,132,351 | | |
Energy (2.6%): | |
Antero Resources Corp. (a) (b) | | | 104,893 | | | | 571,667 | | |
Bonanza Creek Energy, Inc. (a) | | | 24,218 | | | | 468,134 | | |
CNX Resources Corp. (a) | | | 48,891 | | | | 528,023 | | |
Dorian LPG Ltd. (a) | | | 82,217 | | | | 1,002,224 | | |
EQT Corp. (a) | | | 31,615 | | | | 401,827 | | |
Green Plains, Inc. (a) (b) | | | 16,257 | | | | 214,105 | | |
Helix Energy Solutions Group, Inc. (a) (b) | | | 106,402 | | | | 446,888 | | |
International Seaways, Inc. | | | 34,599 | | | | 565,002 | | |
Pacific Ethanol, Inc. (a) (b) | | | 36,944 | | | | 200,606 | | |
PDC Energy, Inc. (a) | | | 14,884 | | | | 305,569 | | |
Range Resources Corp. (a) | | | 56,859 | | | | 380,955 | | |
Renewable Energy Group, Inc. (a) | | | 11,618 | | | | 822,786 | | |
Southwestern Energy Co. (a) | | | 160,061 | | | | 476,982 | | |
Talos Energy, Inc. (a) | | | 27,899 | | | | 229,888 | | |
Transocean Ltd. (a) (b) | | | 265,645 | | | | 613,640 | | |
| | | | 7,228,296 | | |
Financials (13.2%): | |
American Equity Investment Life Holding Co. | | | 17,773 | | | | 491,601 | | |
American National Group, Inc. | | | 11,987 | | | | 1,152,191 | | |
Arbor Realty Trust, Inc. | | | 15,719 | | | | 222,895 | | |
Ares Commercial Real Estate Corp. | | | 37,849 | | | | 450,782 | | |
Ares Management Corp., Class A | | | 9,176 | | | | 431,731 | | |
Assured Guaranty Ltd. | | | 23,188 | | | | 730,191 | | |
Brighthouse Financial, Inc. (a) | | | 19,604 | | | | 709,763 | | |
Brightsphere Investment Group, Inc. | | | 38,902 | | | | 750,031 | | |
BRP Group, Inc., Class A (a) | | | 12,284 | | | | 368,151 | | |
Cadence Bancorp | | | 45,195 | | | | 742,102 | | |
Cannae Holdings, Inc. (a) | | | 24,059 | | | | 1,065,092 | | |
Chimera Investment Corp. | | | 71,760 | | | | 735,539 | | |
CIT Group, Inc. | | | 6,870 | | | | 246,633 | | |
CNO Financial Group, Inc. | | | 37,992 | | | | 844,562 | | |
Colony Credit Real Estate, Inc. | | | 51,178 | | | | 383,835 | | |
Cowen, Inc., Class A (b) | | | 29,314 | | | | 761,871 | | |
Customers Bancorp, Inc., Class A (a) | | | 45,804 | | | | 832,717 | | |
See notes to financial statements.
12
Victory Portfolios II
VictoryShares USAA MSCI USA Small Cap Value
Momentum ETF | | Schedule of Portfolio Investments — continued
December 31, 2020 | |
(Unaudited)
Security Description | | Shares | | Value | |
Dynex Capital, Inc. (b) | | | 21,987 | | | $ | 391,369 | | |
Ellington Financial, Inc. | | | 29,234 | | | | 433,833 | | |
Encore Capital Group, Inc. (a) | | | 11,328 | | | | 441,226 | | |
Enstar Group Ltd. (a) | | | 2,715 | | | | 556,276 | | |
Flagstar Bancorp, Inc. | | | 11,193 | | | | 456,227 | | |
Focus Financial Partners, Inc., Class A (a) | | | 19,860 | | | | 863,910 | | |
Freedom Holding Corp. (a) (b) | | | 11,612 | | | | 595,812 | | |
Genworth Financial, Inc. (a) | | | 184,841 | | | | 698,699 | | |
Goosehead Insurance, Inc., Class A | | | 6,778 | | | | 845,623 | | |
Granite Point Mortgage Trust, Inc. (b) | | | 48,929 | | | | 488,801 | | |
Hannon Armstrong Sustainable Infrastructure Capital, Inc. | | | 8,486 | | | | 538,267 | | |
Heritage Insurance Holdings, Inc. | | | 66,451 | | | | 673,149 | | |
Hilltop Holdings, Inc. | | | 35,777 | | | | 984,226 | | |
Independent Bank Group, Inc. | | | 6,235 | | | | 389,812 | | |
Janus Henderson Group PLC | | | 33,497 | | | | 1,088,987 | | |
Jefferies Financial Group, Inc. | | | 38,347 | | | | 943,336 | | |
Kinsale Capital Group, Inc. | | | 3,992 | | | | 798,919 | | |
Live Oak Bancshares, Inc. (b) | | | 6,185 | | | | 293,540 | | |
Meta Financial Group, Inc. | | | 9,828 | | | | 359,312 | | |
MFA Financial, Inc. | | | 57,597 | | | | 224,052 | | |
MGIC Investment Corp. | | | 56,563 | | | | 709,866 | | |
Mr. Cooper Group, Inc. (a) | | | 18,947 | | | | 587,925 | | |
National General Holdings Corp. (b) (d) | | | 18,749 | | | | 640,841 | | |
National Western Life Group, Inc., Class A | | | 3,544 | | | | 731,623 | | |
Navient Corp. | | | 60,187 | | | | 591,036 | | |
New Residential Investment Corp. | | | 29,131 | | | | 289,562 | | |
OFG Bancorp | | | 18,599 | | | | 344,825 | | |
OneMain Holdings, Inc. | | | 6,502 | | | | 313,136 | | |
Palomar Holdings, Inc. (a) | | | 8,795 | | | | 781,348 | | |
Pennymac Financial Services | | | 11,028 | | | | 723,656 | | |
Pennymac Mortgage Investment Trust | | | 14,598 | | | | 256,779 | | |
Popular, Inc. | | | 17,075 | | | | 961,664 | | |
Radian Group, Inc. | | | 35,639 | | | | 721,690 | | |
Ready Capital Corp. | | | 43,682 | | | | 543,841 | | |
Sterling Bancorp | | | 19,235 | | | | 345,845 | | |
StoneX Group, Inc. (a) | | | 14,562 | | | | 843,140 | | |
Third Point Reinsurance Ltd. (a) | | | 44,367 | | | | 422,374 | | |
Trupanion, Inc. (a) | | | 7,635 | | | | 913,986 | | |
Two Harbors Investment Corp. | | | 68,521 | | | | 436,479 | | |
Unum Group | | | 28,959 | | | | 664,319 | | |
Victory Capital Holdings, Inc., Class A(e) | | | 18,919 | | | | 469,380 | | |
Virtu Financial, Inc., Class A | | | 12,934 | | | | 325,549 | | |
Virtus Investment Partners, Inc. | | | 4,100 | | | | 889,699 | | |
Walker & Dunlop, Inc. | | | 3,475 | | | | 319,770 | | |
Watford Holdings Ltd. (a) | | | 11,035 | | | | 381,811 | | |
| | | | 37,195,207 | | |
Health Care (22.7%): | |
Acadia Healthcare Co., Inc. (a) | | | 13,853 | | | | 696,252 | | |
Acceleron Pharma, Inc. (a) | | | 4,972 | | | | 636,118 | | |
See notes to financial statements.
13
Victory Portfolios II
VictoryShares USAA MSCI USA Small Cap Value
Momentum ETF | | Schedule of Portfolio Investments — continued
December 31, 2020 | |
(Unaudited)
Security Description | | Shares | | Value | |
Addus HomeCare Corp. (a) | | | 8,784 | | | $ | 1,028,519 | | |
Allakos, Inc. (a) (b) | | | 5,630 | | | | 788,200 | | |
Allscripts Healthcare Solutions, Inc. (a) (b) | | | 25,586 | | | | 369,462 | | |
Amedisys, Inc. (a) | | | 3,867 | | | | 1,134,307 | | |
AMN Healthcare Services, Inc. (a) | | | 12,730 | | | | 868,823 | | |
Amneal Pharmaceuticals, Inc. (a) | | | 109,905 | | | | 502,266 | | |
Anika Therapeutics, Inc. (a) | | | 7,749 | | | | 350,720 | | |
Arcus Biosciences, Inc. (a) | | | 10,152 | | | | 263,546 | | |
Arena Pharmaceuticals, Inc. (a) | | | 9,424 | | | | 724,046 | | |
Arrowhead Pharmaceuticals, Inc. (a) | | | 7,360 | | | | 564,733 | | |
AtriCure, Inc. (a) | | | 8,919 | | | | 496,521 | | |
Axsome Therapeutics, Inc. (a) | | | 2,407 | | | | 196,098 | | |
BioLife Solutions, Inc. (a) | | | 8,175 | | | | 326,101 | | |
Bio-Techne Corp. | | | 3,891 | | | | 1,235,587 | | |
Bioxcel Therapeutics, Inc. (a) | | | 11,557 | | | | 533,933 | | |
CareDx, Inc. (a) | | | 4,026 | | | | 291,684 | | |
Castle Biosciences, Inc. (a) | | | 5,837 | | | | 391,955 | | |
Catalyst Pharmaceuticals, Inc. (a) | | | 126,537 | | | | 422,634 | | |
Celldex Therapeutics, Inc. (a) | | | 10,456 | | | | 183,189 | | |
Change Healthcare, Inc. (a) | | | 15,996 | | | | 298,325 | | |
Charles River Laboratories International, Inc. (a) | | | 3,802 | | | | 949,968 | | |
Chemed Corp. | | | 2,376 | | | | 1,265,480 | | |
Chemocentryx, Inc. (a) | | | 7,049 | | | | 436,474 | | |
Collegium Pharmaceutical, Inc. (a) | | | 22,960 | | | | 459,889 | | |
Computer Programs & Systems, Inc. | | | 26,430 | | | | 709,381 | | |
Corcept Therapeutics, Inc. (a) | | | 33,540 | | | | 877,406 | | |
Cortexyme, Inc. (a) | | | 5,194 | | | | 144,289 | | |
CorVel Corp. (a) | | | 5,359 | | | | 568,054 | | |
Covetrus, Inc. (a) | | | 22,075 | | | | 634,436 | | |
CRISPR Therapeutics AG (a) | | | 4,338 | | | | 664,191 | | |
CryoPort, Inc. (a) | | | 13,687 | | | | 600,586 | | |
Cymabay Therapeutics, Inc. (a) | | | 26,154 | | | | 150,124 | | |
Denali Therapeutics, Inc. (a) | | | 4,304 | | | | 360,503 | | |
Dicerna Pharmaceuticals, Inc. (a) | | | 11,136 | | | | 245,326 | | |
Eidos Therapeutics, Inc. (a) | | | 3,400 | | | | 447,372 | | |
Emergent BioSolutions, Inc. (a) | | | 6,170 | | | | 552,832 | | |
Encompass Health Corp. | | | 13,537 | | | | 1,119,375 | | |
Endo International PLC (a) | | | 100,574 | | | | 722,121 | | |
Envista Holdings Corp. (a) | | | 9,410 | | | | 317,399 | | |
Exelixis, Inc. (a) | | | 29,993 | | | | 601,960 | | |
Fulgent Genetics, Inc. (a) (b) | | | 4,722 | | | | 246,016 | | |
GenMark Diagnostics, Inc. (a) | | | 12,710 | | | | 185,566 | | |
Globus Medical, Inc. (a) | | | 7,638 | | | | 498,150 | | |
Halozyme Therapeutics, Inc. (a) | | | 24,799 | | | | 1,059,165 | | |
Heska Corp. (a) (b) | | | 2,870 | | | | 418,016 | | |
Hill-Rom Holdings, Inc. | | | 5,352 | | | | 524,335 | | |
Innoviva, Inc. (a) | | | 66,427 | | | | 823,031 | | |
Inovalon Holdings, Inc., Class A (a) | | | 33,526 | | | | 609,167 | | |
Inovio Pharmaceuticals, Inc. (a) (b) | | | 13,129 | | | | 116,192 | | |
See notes to financial statements.
14
Victory Portfolios II
VictoryShares USAA MSCI USA Small Cap Value
Momentum ETF | | Schedule of Portfolio Investments — continued
December 31, 2020 | |
(Unaudited)
Security Description | | Shares | | Value | |
Integer Holdings Corp. (a) | | | 9,188 | | | $ | 745,974 | | |
Invitae Corp. (a) | | | 4,495 | | | | 187,936 | | |
iRhythm Technologies, Inc. (a) | | | 1,195 | | | | 283,466 | | |
Karuna Therapeutics, Inc. (a) | | | 5,859 | | | | 595,216 | | |
Kodiak Sciences, Inc. (a) (b) | | | 7,569 | | | | 1,111,961 | | |
Kura Oncology, Inc. (a) | | | 7,723 | | | | 252,233 | | |
LHC Group, Inc. (a) | | | 4,701 | | | | 1,002,817 | | |
Ligand Pharmaceuticals, Inc. (a) (b) | | | 2,935 | | | | 291,886 | | |
Luminex Corp. | | | 12,336 | | | | 285,208 | | |
Magellan Health, Inc. (a) | | | 8,546 | | | | 707,951 | | |
MEDNAX, Inc. (a) | | | 14,468 | | | | 355,045 | | |
Medpace Holdings, Inc. (a) | | | 5,313 | | | | 739,570 | | |
Meridian Bioscience, Inc. (a) | | | 31,292 | | | | 584,847 | | |
Merit Medical Systems, Inc. (a) | | | 15,441 | | | | 857,129 | | |
Mersana Therapeutics, Inc. (a) | | | 19,334 | | | | 514,478 | | |
Mirati Therapeutics, Inc. (a) | | | 1,058 | | | | 232,379 | | |
NantKwest, Inc. (a) (b) | | | 24,824 | | | | 330,904 | | |
Natera, Inc. (a) | | | 7,445 | | | | 740,926 | | |
National Healthcare Corp. (c) | | | 8,786 | | | | 583,478 | | |
NeoGenomics, Inc. (a) (b) | | | 16,767 | | | | 902,735 | | |
Neoleukin Therapeutics, Inc. (a) | | | 17,016 | | | | 239,926 | | |
Nevro Corp. (a) | | | 3,739 | | | | 647,221 | | |
NextGen Healthcare, Inc. (a) | | | 19,368 | | | | 353,272 | | |
Novavax, Inc. (a) (b) | | | 3,572 | | | | 398,314 | | |
Omnicell, Inc. (a) | | | 5,394 | | | | 647,388 | | |
Ontrak, Inc. (a) (b) | | | 7,731 | | | | 477,698 | | |
OPKO Health, Inc. (a) (b) | | | 91,006 | | | | 359,474 | | |
OraSure Technologies, Inc. (a) (b) | | | 42,931 | | | | 454,425 | | |
Owens & Minor, Inc. | | | 19,979 | | | | 540,432 | | |
Pacific Biosciences of California, Inc. (a) | | | 13,688 | | | | 355,067 | | |
Pacira BioSciences, Inc. (a) | | | 11,097 | | | | 664,044 | | |
Patterson Cos., Inc. (b) (c) | | | 13,048 | | | | 386,612 | | |
Penumbra, Inc. (a) (b) | | | 2,868 | | | | 501,900 | | |
Personalis, Inc. (a) | | | 9,397 | | | | 344,024 | | |
PRA Health Sciences, Inc. (a) | | | 3,795 | | | | 476,045 | | |
Premier, Inc., Class A | | | 25,634 | | | | 899,753 | | |
Prestige Consumer Healthcare, Inc. (a) | | | 23,017 | | | | 802,603 | | |
Quidel Corp. (a) | | | 2,983 | | | | 535,896 | | |
R1 RCM, Inc. (a) | | | 39,030 | | | | 937,501 | | |
Repligen Corp. (a) | | | 4,701 | | | | 900,853 | | |
Replimune Group, Inc. (a) | | | 5,542 | | | | 211,427 | | |
Select Medical Holdings Corp. (a) | | | 25,141 | | | | 695,400 | | |
Seres Therapeutics, Inc. (a) | | | 5,938 | | | | 145,481 | | |
Simulations Plus, Inc. | | | 12,151 | | | | 873,900 | | |
Sorrento Therapeutics, Inc. (a) (b) | | | 47,110 | | | | 321,526 | | |
SpringWorks Therapeutics, Inc. (a) | | | 4,226 | | | | 306,470 | | |
STAAR Surgical Co. (a) | | | 8,787 | | | | 696,106 | | |
Surgery Partners, Inc. (a) (b) | | | 18,406 | | | | 533,958 | | |
Syneos Health, Inc. (a) | | | 9,054 | | | | 616,849 | | |
See notes to financial statements.
15
Victory Portfolios II
VictoryShares USAA MSCI USA Small Cap Value
Momentum ETF | | Schedule of Portfolio Investments — continued
December 31, 2020 | |
(Unaudited)
Security Description | | Shares | | Value | |
Tandem Diabetes Care, Inc. (a) | | | 3,922 | | | $ | 375,257 | | |
Tenet Healthcare Corp. (a) | | | 13,118 | | | | 523,802 | | |
TG Therapeutics, Inc. (a) | | | 6,839 | | | | 355,765 | | |
The Ensign Group, Inc. | | | 11,806 | | | | 860,894 | | |
The Pennant Group, Inc. (a) | | | 5,787 | | | | 335,993 | | |
The Providence Service Corp. (a) | | | 8,492 | | | | 1,177,246 | | |
Triple-S Management Corp., Class B (a) | | | 24,447 | | | | 521,943 | | |
Turning Point Therapeutics, Inc. (a) | | | 2,605 | | | | 317,419 | | |
Twist Bioscience Corp. (a) | | | 6,352 | | | | 897,474 | | |
United Therapeutics Corp. (a) | | | 8,512 | | | | 1,292,035 | | |
Vapotherm, Inc. (a) | | | 8,586 | | | | 230,620 | | |
Vaxart, Inc. (a) (b) | | | 35,972 | | | | 205,400 | | |
VBI Vaccines, Inc. (a) (b) | | | 74,023 | | | | 203,563 | | |
Veracyte, Inc. (a) | | | 12,886 | | | | 630,641 | | |
Vocera Communications, Inc. (a) | | | 22,923 | | | | 951,993 | | |
Zynex, Inc. (a) (b) | | | 15,807 | | | | 212,762 | | |
| | | | 64,332,334 | | |
Industrials (14.2%): | |
ACCO Brands Corp. | | | 81,076 | | | | 685,092 | | |
ADT, Inc. | | | 75,287 | | | | 591,003 | | |
Advanced Drainage Systems, Inc. | | | 11,547 | | | | 965,097 | | |
AECOM (a) | | | 17,666 | | | | 879,413 | | |
Air Lease Corp. | | | 16,847 | | | | 748,344 | | |
Air Transport Services Group, Inc. (a) | | | 30,486 | | | | 955,431 | | |
Altra Industrial Motion Corp. | | | 12,849 | | | | 712,220 | | |
American Woodmark Corp. (a) | | | 2,721 | | | | 255,366 | | |
ArcBest Corp. | | | 18,759 | | | | 800,447 | | |
Arcosa, Inc. | | | 13,833 | | | | 759,847 | | |
Argan, Inc. | | | 9,549 | | | | 424,835 | | |
Astec Industries, Inc. | | | 12,516 | | | | 724,426 | | |
Atlas Air Worldwide Holdings, Inc. (a) | | | 9,194 | | | | 501,441 | | |
Beacon Roofing Supply, Inc. (a) | | | 7,913 | | | | 318,023 | | |
Bloom Energy Corp., Class A (a) | | | 19,151 | | | | 548,868 | | |
BMC Stock Holdings, Inc. (a) | | | 18,600 | | | | 998,447 | | |
Builders FirstSource, Inc. (a) | | | 17,907 | | | | 730,785 | | |
CAI International, Inc. | | | 23,459 | | | | 732,859 | | |
Chart Industries, Inc. (a) | | | 2,340 | | | | 275,629 | | |
Colfax Corp. (a) | | | 8,988 | | | | 343,701 | | |
CSW Industrials, Inc. | | | 5,018 | | | | 561,564 | | |
Echo Global Logistics, Inc. (a) | | | 26,321 | | | | 705,929 | | |
Foundation Building Materials, Inc. (a) | | | 35,018 | | | | 672,696 | | |
FTI Consulting, Inc. (a) | | | 4,496 | | | | 502,293 | | |
Genco Shipping & Trading Ltd. | | | 71,806 | | | | 528,492 | | |
Gibraltar Industries, Inc. (a) | | | 6,038 | | | | 434,374 | | |
GMS, Inc. (a) | | | 19,023 | | | | 579,821 | | |
Great Lakes Dredge & Dock Corp. (a) | | | 70,491 | | | | 928,366 | | |
Heidrick & Struggles International, Inc. | | | 31,138 | | | | 914,835 | | |
Herc Holdings, Inc. (a) | | | 4,335 | | | | 287,887 | | |
See notes to financial statements.
16
Victory Portfolios II
VictoryShares USAA MSCI USA Small Cap Value
Momentum ETF | | Schedule of Portfolio Investments — continued
December 31, 2020 | |
(Unaudited)
Security Description | | Shares | | Value | |
Hub Group, Inc., Class A (a) | | | 16,592 | | | $ | 945,744 | | |
Kelly Services, Inc., Class A | | | 37,316 | | | | 767,590 | | |
Marten Transport Ltd. | | | 47,815 | | | | 823,852 | | |
Masonite International Corp. (a) | | | 3,164 | | | | 311,148 | | |
Matson, Inc. | | | 6,716 | | | | 382,611 | | |
Maxar Technologies, Inc. | | | 25,367 | | | | 978,912 | | |
MYR Group, Inc. (a) | | | 16,058 | | | | 965,086 | | |
Patrick Industries, Inc. | | | 3,258 | | | | 222,684 | | |
Plug Power, Inc. (a) (b) | | | 25,120 | | | | 851,819 | | |
Quanta Services, Inc. | | | 15,350 | | | | 1,105,507 | | |
Regal Beloit Corp. | | | 9,058 | | | | 1,112,413 | | |
Resideo Technologies, Inc. (a) | | | 21,950 | | | | 466,657 | | |
Rush Enterprises, Inc., Class A | | | 22,730 | | | | 941,477 | | |
Ryder System, Inc. | | | 5,776 | | | | 356,726 | | |
Saia, Inc. (a) | | | 5,185 | | | | 937,448 | | |
Schneider National, Inc., Class B | | | 45,550 | | | | 942,885 | | |
Simpson Manufacturing Co., Inc. | | | 3,824 | | | | 357,353 | | |
SiteOne Landscape Supply, Inc. (a) | | | 2,704 | | | | 428,936 | | |
SkyWest, Inc. | | | 14,856 | | | | 598,845 | | |
Sterling Construction Co., Inc. (a) | | | 41,363 | | | | 769,765 | | |
The Greenbrier Cos., Inc. | | | 18,398 | | | | 669,319 | | |
The Shyft Group, Inc. | | | 14,204 | | | | 403,110 | | |
The Timken Co. | | | 5,537 | | | | 428,342 | | |
Trex Co., Inc. (a) | | | 4,191 | | | | 350,871 | | |
Triton International Ltd. | | | 19,428 | | | | 942,452 | | |
Tutor Perini Corp. (a) | | | 35,648 | | | | 461,642 | | |
UFP Industries, Inc. | | | 12,661 | | | | 703,319 | | |
Vectrus, Inc. (a) | | | 7,441 | | | | 369,967 | | |
Vicor Corp. (a) | | | 3,323 | | | | 306,447 | | |
Wabash National Corp. | | | 20,739 | | | | 357,333 | | |
Watsco, Inc. | | | 2,356 | | | | 533,752 | | |
Werner Enterprises, Inc. | | | 11,996 | | | | 470,483 | | |
WESCO International, Inc. (a) | | | 11,344 | | | | 890,504 | | |
| | | | 40,222,530 | | |
Information Technology (15.3%): | |
2U, Inc. (a) | | | 5,209 | | | | 208,412 | | |
ACM Research, Inc., Class A (a) | | | 7,692 | | | | 624,975 | | |
Amkor Technology, Inc. | | | 49,265 | | | | 742,916 | | |
Avaya Holdings Corp. (a) | | | 37,903 | | | | 725,842 | | |
Avnet, Inc. | | | 16,567 | | | | 581,667 | | |
Axcelis Technologies, Inc. (a) | | | 11,505 | | | | 335,026 | | |
Benchmark Electronics, Inc. | | | 37,874 | | | | 1,022,976 | | |
Blackline, Inc. (a) | | | 8,573 | | | | 1,143,467 | | |
Calix, Inc. (a) | | | 23,691 | | | | 705,044 | | |
Cerence, Inc. (a) | | | 4,756 | | | | 477,883 | | |
ChannelAdvisor Corp. (a) | | | 37,321 | | | | 596,390 | | |
Ciena Corp. (a) | | | 6,762 | | | | 357,372 | | |
Cirrus Logic, Inc. (a) | | | 6,384 | | | | 524,765 | | |
See notes to financial statements.
17
Victory Portfolios II
VictoryShares USAA MSCI USA Small Cap Value
Momentum ETF | | Schedule of Portfolio Investments — continued
December 31, 2020 | |
(Unaudited)
Security Description | | Shares | | Value | |
Concentrix Corp. (a) | | | 4,954 | | | $ | 488,960 | | |
Conduent, Inc. (a) | | | 109,639 | | | | 526,267 | | |
CoreLogic, Inc. | | | 9,290 | | | | 718,303 | | |
Digi International, Inc. (a) | | | 21,086 | | | | 398,525 | | |
Digital Turbine, Inc. (a) | | | 13,688 | | | | 774,193 | | |
Diodes, Inc. (a) | | | 14,165 | | | | 998,632 | | |
DXC Technology Co. | | | 26,600 | | | | 684,950 | | |
Ebix, Inc. | | | 8,097 | | | | 307,443 | | |
EchoStar Corp., Class A (a) | | | 18,944 | | | | 401,423 | | |
Endurance International Group Holdings, Inc. (a) | | | 24,399 | | | | 230,571 | | |
Entegris, Inc. | | | 10,257 | | | | 985,698 | | |
Fabrinet (a) | | | 10,565 | | | | 819,738 | | |
Fastly, Inc., Class A (a) | | | 8,158 | | | | 712,764 | | |
First Solar, Inc. (a) | | | 4,526 | | | | 447,712 | | |
Five9, Inc. (a) | | | 5,697 | | | | 993,557 | | |
FormFactor, Inc. (a) | | | 17,959 | | | | 772,596 | | |
Ichor Holdings Ltd. (a) | | | 15,476 | | | | 466,524 | | |
II-VI, Inc. (a) | | | 6,861 | | | | 521,162 | | |
Inphi Corp. (a) | | | 4,917 | | | | 789,031 | | |
Insight Enterprises, Inc. (a) | | | 5,557 | | | | 422,832 | | |
International Money Express, Inc. (a) | | | 21,431 | | | | 332,609 | | |
Jabil, Inc. | | | 19,753 | | | | 840,095 | | |
Kulicke & Soffa Industries, Inc. | | | 30,383 | | | | 966,483 | | |
Lattice Semiconductor Corp. (a) | | | 18,702 | | | | 856,926 | | |
Limelight Networks, Inc. (a) | | | 42,616 | | | | 170,038 | | |
Lumentum Holdings, Inc. (a) | | | 6,934 | | | | 657,343 | | |
Mesa Laboratories, Inc. | | | 1,390 | | | | 398,430 | | |
Methode Electronics, Inc. | | | 25,180 | | | | 963,890 | | |
MKS Instruments, Inc. | | | 2,892 | | | | 435,101 | | |
Model N, Inc. (a) (b) | | | 8,841 | | | | 315,447 | | |
NeoPhotonics Corp. (a) | | | 28,214 | | | | 256,465 | | |
NetScout Systems, Inc. (a) | | | 36,698 | | | | 1,006,260 | | |
Nuance Communications, Inc. (a) | | | 31,013 | | | | 1,367,363 | | |
OneSpan, Inc. (a) | | | 14,182 | | | | 293,284 | | |
Onto Innovation, Inc. (a) | | | 8,641 | | | | 410,880 | | |
PC Connection, Inc. | | | 8,464 | | | | 400,263 | | |
Perspecta, Inc. | | | 15,075 | | | | 363,006 | | |
Photronics, Inc. (a) | | | 59,812 | | | | 667,502 | | |
Plexus Corp. (a) | | | 5,262 | | | | 411,541 | | |
Power Integrations, Inc. | | | 6,968 | | | | 570,400 | | |
Rambus, Inc. (a) | | | 58,782 | | | | 1,026,333 | | |
Sailpoint Technologies Holdings, Inc. (a) | | | 7,826 | | | | 416,656 | | |
Sanmina Corp. (a) | | | 25,418 | | | | 810,580 | | |
ScanSource, Inc. (a) | | | 28,513 | | | | 752,173 | | |
SiTime Corp. (a) | | | 4,160 | | | | 465,629 | | |
SMART Global Holdings, Inc. (a) (b) | | | 18,063 | | | | 679,711 | | |
SPS Commerce, Inc. (a) | | | 4,816 | | | | 522,969 | | |
Super Micro Computer, Inc. (a) | | | 12,289 | | | | 389,070 | | |
Sykes Enterprises, Inc. (a) | | | 24,413 | | | | 919,638 | | |
See notes to financial statements.
18
Victory Portfolios II
VictoryShares USAA MSCI USA Small Cap Value
Momentum ETF | | Schedule of Portfolio Investments — continued
December 31, 2020 | |
(Unaudited)
Security Description | | Shares | | Value | |
Synaptics, Inc. (a) | | | 7,227 | | | $ | 696,683 | | |
SYNNEX Corp. | | | 4,954 | | | | 403,454 | | |
TTEC Holdings, Inc. | | | 6,210 | | | | 452,895 | | |
TTM Technologies, Inc. (a) | | | 61,991 | | | | 855,166 | | |
Ultra Clean Holdings, Inc. (a) | | | 17,453 | | | | 543,661 | | |
VirnetX Holding Corp. (b) | | | 79,230 | | | | 399,319 | | |
Vishay Intertechnology, Inc. | | | 19,970 | | | | 413,579 | | |
Xerox Holdings Corp. | | | 34,018 | | | | 788,877 | | |
Xperi Holding Corp. | | | 38,302 | | | | 800,512 | | |
| | | | 43,527,847 | | |
Materials (3.6%): | |
AdvanSix, Inc. (a) | | | 16,563 | | | | 331,094 | | |
Boise Cascade Co. | | | 15,260 | | | | 729,428 | | |
Clearwater Paper Corp. (a) | | | 13,362 | | | | 504,416 | | |
Cleveland-Cliffs, Inc. (b) | | | 29,244 | | | | 425,793 | | |
Commercial Metals Co. | | | 18,170 | | | | 373,212 | | |
Forterra, Inc. (a) | | | 13,136 | | | | 225,874 | | |
Glatfelter Corp. | | | 21,864 | | | | 358,132 | | |
Hecla Mining Co. | | | 97,159 | | | | 629,590 | | |
Huntsman Corp. | | | 15,829 | | | | 397,941 | | |
Kraton Corp. (a) | | | 23,422 | | | | 650,897 | | |
Reliance Steel & Aluminum Co. | | | 9,092 | | | | 1,088,766 | | |
Schnitzer Steel Industries, Inc. | | | 33,401 | | | | 1,065,826 | | |
Silgan Holdings, Inc. | | | 18,137 | | | | 672,520 | | |
Stepan Co. | | | 4,674 | | | | 557,702 | | |
SunCoke Energy, Inc. | | | 63,899 | | | | 277,961 | | |
The Scotts Miracle-Gro Co. | | | 2,585 | | | | 514,777 | | |
Warrior Met Coal, Inc. | | | 37,208 | | | | 793,275 | | |
Worthington Industries, Inc. | | | 7,685 | | | | 394,548 | | |
| | | | 9,991,752 | | |
Real Estate (8.7%): | |
Agree Realty Corp. | | | 7,219 | | | | 480,641 | | |
American Homes 4 Rent, Class A | | | 34,141 | | | | 1,024,230 | | |
Americold Realty Trust | | | 18,915 | | | | 706,097 | | |
Centerspace | | | 5,557 | | | | 392,546 | | |
Community Healthcare Trust, Inc. | | | 16,960 | | | | 798,986 | | |
CoreSite Realty Corp. | | | 10,408 | | | | 1,303,915 | | |
Cousins Properties, Inc. | | | 13,309 | | | | 445,852 | | |
CubeSmart | | | 15,272 | | | | 513,292 | | |
CyrusOne, Inc. | | | 11,384 | | | | 832,740 | | |
Easterly Government Properties, Inc. | | | 29,430 | | | | 666,590 | | |
EastGroup Properties, Inc. | | | 7,331 | | | | 1,012,118 | | |
Equity Commonwealth | | | 36,148 | | | | 986,117 | | |
eXp World Holdings, Inc. (a) | | | 16,569 | | | | 1,045,835 | | |
First Industrial Realty Trust, Inc. | | | 25,742 | | | | 1,084,510 | | |
Gaming and Leisure Properties, Inc. | | | 16,961 | | | | 719,146 | | |
Global Medical REIT, Inc. | | | 26,825 | | | | 350,335 | | |
Innovative Industrial Properties, Inc. | | | 3,953 | | | | 723,913 | | |
See notes to financial statements.
19
Victory Portfolios II
VictoryShares USAA MSCI USA Small Cap Value
Momentum ETF | | Schedule of Portfolio Investments — continued
December 31, 2020 | |
(Unaudited)
Security Description | | Shares | | Value | |
Lexington Realty Trust | | | 48,162 | | | $ | 511,480 | | |
Life Storage, Inc. | | | 4,467 | | | | 533,315 | | |
National Storage Affiliates Trust | | | 13,516 | | | | 486,981 | | |
Newmark Group, Inc., Class A | | | 136,150 | | | | 992,534 | | |
PotlatchDeltic Corp. | | | 9,112 | | | | 455,782 | | |
QTS Realty Trust, Inc., Class A (b) | | | 14,216 | | | | 879,686 | | |
RE/MAX Holdings, Inc. | | | 17,753 | | | | 644,966 | | |
Realogy Holdings Corp. (a) | | | 37,467 | | | | 491,567 | | |
Redfin Corp. (a) | | | 13,062 | | | | 896,445 | | |
Rexford Industrial Realty, Inc. | | | 20,971 | | | | 1,029,886 | | |
Safehold, Inc. (b) | | | 11,743 | | | | 851,250 | | |
STAG Industrial, Inc. | | | 16,107 | | | | 504,471 | | |
Terreno Realty Corp. | | | 10,026 | | | | 586,621 | | |
The RMR Group, Inc., Class A | | | 21,796 | | | | 841,762 | | |
The St. Joe Co. | | | 40,788 | | | | 1,731,450 | | |
Uniti Group, Inc. | | | 48,224 | | | | 565,668 | | |
| | | | 25,090,727 | | |
Utilities (1.3%): | |
Clearway Energy, Inc., Class C | | | 45,820 | | | | 1,463,033 | | |
MDU Resources Group, Inc. | | | 20,450 | | | | 538,653 | | |
National Fuel Gas Co. | | | 30,388 | | | | 1,249,858 | | |
NorthWestern Corp. | | | 8,255 | | | | 481,349 | | |
| | | | 3,732,893 | | |
Total Common Stocks (Cost $223,266,896) | | | 281,464,749 | | |
Rights (0.0%) (f) | |
Health Care (0.0%): (f) | |
Achillion Pharmaceuticals (a) (d) (g) | | | 17,954 | | | | 4,129 | | |
Total Rights (Cost $—) | | | 4,129 | | |
Collateral for Securities Loaned^ (4.6%) | |
BlackRock Liquidity Funds TempFund Portfolio, Institutional Class, 0.08% (h) | | | 227,355 | | | | 227,355 | | |
Fidelity Investments Money Market Government Portfolio I Shares, 0.01% (h) | | | 7,810,992 | | | | 7,810,992 | | |
Goldman Sachs Financial Square Prime Obligations Fund,
Institutional Class, 0.04% (h) | | | 113,462 | | | | 113,462 | | |
JPMorgan Prime Money Market Fund, Capital Class, 0.12% (h) | | | 904,708 | | | | 904,708 | | |
Morgan Stanley Institutional Liquidity Prime Portfolio, Institutional
Class, 0.09% (h) | | | 4,067,742 | | | | 4,067,742 | | |
Total Collateral for Securities Loaned (Cost $13,124,259) | | | 13,124,259 | | |
Total Investments (Cost $236,391,155) — 104.0% | | | 294,593,137 | | |
Liabilities in excess of other assets — (4.0)% | | | (11,441,439 | ) | |
NET ASSETS — 100.00% | | $ | 283,151,698 | | |
^ Purchased with cash collateral from securities on loan.
(a) Non-income producing security.
See notes to financial statements.
20
Victory Portfolios II
VictoryShares USAA MSCI USA Small Cap Value
Momentum ETF | | Schedule of Portfolio Investments — continued
December 31, 2020 | |
(Unaudited)
(b) All or a portion of this security is on loan.
(c) All or a portion of this security has been segregated as collateral for derivative instruments.
(d) Security was fair valued based upon procedures approved by the Board of Trustees and represents less than 0.05% of the Fund's net assets as of December 31, 2020. This security is classified as Level 3 within the fair value hierarchy. (See Note 2)
(e) Affiliated security (See Note 9).
(f) Amount represents less than 0.05% of net assets.
(g) The Fund's Adviser has deemed this security to be illiquid based upon procedures approved by the Board of Trustees. As of December 31, 2020, illiquid securities were less than 0.05% of the Fund's net assets.
(h) Rate disclosed is the daily yield on December 31, 2020.
PLC — Public Limited Company
REIT — Real Estate Investment Trust
Futures Contracts Purchased
| | | Number of
Contracts | | Expiration
Date | | Notional
Amount | | Value | | Unrealized
Appreciation
(Depreciation) | |
E-Mini Russell 2000 Index Futures | | | 14 | | | 3/19/21 | | $ | 1,369,736 | | | $ | 1,382,360 | | | $ | 12,624 | | |
| | | Total unrealized appreciation | | | | | | | | $ | 12,624 | | |
| | | Total unrealized depreciation | | | | | | | | | — | | |
| | | Total net unrealized appreciation (depreciation) | | | | | | | | $ | 12,624 | | |
See notes to financial statements.
21
Victory Portfolios II
VictoryShares USAA MSCI International Value
Momentum ETF | | Schedule of Portfolio Investments
December 31, 2020 | |
(Unaudited)
Security Description | | Shares | | Value | |
Common Stocks (99.4%) | |
Australia (3.7%): | |
Consumer Staples (1.0%): | |
Coca-Cola Amatil Ltd. | | | 122,582 | | | $ | 1,223,058 | | |
Coles Group Ltd. | | | 89,388 | | | | 1,251,233 | | |
Wesfarmers Ltd. | | | 42,642 | | | | 1,658,403 | | |
| | | | 4,132,694 | | |
Energy (0.6%): | |
Ampol Ltd. | | | 48,536 | | | | 1,064,412 | | |
Washington H Soul Pattinson & Co. Ltd. (a) | | | 53,151 | | | | 1,234,115 | | |
| | | | 2,298,527 | | |
Health Care (0.3%): | |
Sonic Healthcare Ltd. | | | 53,779 | | | | 1,334,183 | | |
Information Technology (0.1%): | |
Afterpay Ltd. (b) | | | 5,996 | | | | 545,966 | | |
Materials (0.9%): | |
BlueScope Steel Ltd. | | | 78,274 | | | | 1,055,798 | | |
Fortescue Metals Group Ltd. | | | 139,523 | | | | 2,522,550 | | |
| | | | 3,578,348 | | |
Real Estate (0.8%): | |
Goodman Group | | | 182,034 | | | | 2,656,231 | | |
Stockland | | | 235,115 | | | | 758,365 | | |
| | | | 3,414,596 | | |
| | | | 15,304,314 | | |
Austria (1.0%): | |
Energy (0.5%): | |
OMV AG | | | 51,750 | | | | 2,089,528 | | |
Financials (0.5%): | |
Raiffeisen Bank International AG (b) | | | 94,662 | | | | 1,931,948 | | |
| | | | 4,021,476 | | |
Belgium (1.6%): | |
Financials (0.8%): | |
Sofina SA | | | 9,195 | | | | 3,116,415 | | |
Health Care (0.5%): | |
UCB SA | | | 20,852 | | | | 2,155,388 | | |
Utilities (0.3%): | |
Elia Group SA | | | 10,826 | | | | 1,291,506 | | |
| | | | 6,563,309 | | |
See notes to financial statements.
22
Victory Portfolios II
VictoryShares USAA MSCI International Value
Momentum ETF | | Schedule of Portfolio Investments — continued
December 31, 2020 | |
(Unaudited)
Security Description | | Shares | | Value | |
Canada (9.3%): | |
Consumer Discretionary (0.8%): | |
Canadian Tire Corp. Ltd., Class A | | | 8,986 | | | $ | 1,180,241 | | |
Magna International, Inc. | | | 29,866 | | | | 2,112,422 | | |
| | | | 3,292,663 | | |
Consumer Staples (2.3%): | |
Alimentation Couche-Tard, Inc., Class B | | | 35,576 | | | | 1,211,371 | | |
Empire Co. Ltd., Class A | | | 42,908 | | | | 1,171,718 | | |
Loblaw Cos. Ltd. | | | 68,556 | | | | 3,379,908 | | |
Metro, Inc. | | | 90,009 | | | | 4,012,960 | | |
| | | | 9,775,957 | | |
Energy (0.5%): | |
Cameco Corp. | | | 78,377 | | | | 1,048,923 | | |
TC Energy Corp. | | | 26,544 | | | | 1,078,220 | | |
| | | | 2,127,143 | | |
Financials (0.7%): | |
Intact Financial Corp. | | | 13,730 | | | | 1,624,322 | | |
TMX Group Ltd. | | | 13,223 | | | | 1,319,601 | | |
| | | | 2,943,923 | | |
Industrials (1.1%): | |
Canadian Pacific Railway Ltd. | | | 4,353 | | | | 1,508,618 | | |
Ritchie Bros. Auctioneers, Inc. | | | 16,655 | | | | 1,156,699 | | |
WSP Global, Inc. | | | 19,162 | | | | 1,813,772 | | |
| | | | 4,479,089 | | |
Information Technology (0.3%): | |
Shopify, Inc., Class A (b) | | | 1,216 | | | | 1,371,885 | | |
Materials (2.1%): | |
B2Gold Corp. | | | 241,038 | | | | 1,348,980 | | |
Barrick Gold Corp. | | | 30,560 | | | | 695,636 | | |
Kinross Gold Corp. | | | 172,677 | | | | 1,265,937 | | |
Pan American Silver Corp. | | | 43,540 | | | | 1,500,319 | | |
Teck Resources Ltd., Class B | | | 104,592 | | | | 1,896,448 | | |
Wheaton Precious Metals Corp. | | | 17,016 | | | | 710,024 | | |
Yamana Gold, Inc. | | | 230,992 | | | | 1,318,141 | | |
| | | | 8,735,485 | | |
Real Estate (0.2%): | |
FirstService Corp. | | | 7,837 | | | | 1,071,713 | | |
Utilities (1.3%): | |
Hydro One Ltd. (c) | | | 168,575 | | | | 3,790,953 | | |
Northland Power, Inc. | | | 45,134 | | | | 1,617,951 | | |
| | | | 5,408,904 | | |
| | | | 39,206,762 | | |
See notes to financial statements.
23
Victory Portfolios II
VictoryShares USAA MSCI International Value
Momentum ETF | | Schedule of Portfolio Investments — continued
December 31, 2020 | |
(Unaudited)
Security Description | | Shares | | Value | |
Denmark (3.7%): | |
Consumer Discretionary (0.4%): | |
Pandora A/S | | | 15,836 | | | $ | 1,772,716 | | |
Financials (0.2%): | |
Danske Bank A/S | | | 58,531 | | | | 968,381 | | |
Health Care (0.3%): | |
GN Store Nord A/S | | | 12,699 | | | | 1,017,006 | | |
Industrials (2.0%): | |
AP Moller — Maersk A/S, Class B | | | 1,100 | | | | 2,363,761 | | |
DSV PANALPINA A/S | | | 15,569 | | | | 2,610,402 | | |
ROCKWOOL International A/S, Class B | | | 2,262 | | | | 847,018 | | |
Vestas Wind Systems A/S | | | 11,266 | | | | 2,665,802 | | |
| | | | 8,486,983 | | |
Utilities (0.8%): | |
Orsted A/S (c) | | | 16,327 | | | | 3,337,326 | | |
| | | | 15,582,412 | | |
Finland (1.1%): | |
Consumer Staples (0.3%): | |
Kesko Oyj, Class B | | | 45,252 | | | | 1,164,950 | | |
Energy (0.5%): | |
Neste Oyj | | | 28,988 | | | | 2,098,313 | | |
Industrials (0.3%): | |
Kone Oyj, Class B | | | 17,809 | | | | 1,448,184 | | |
| | | | 4,711,447 | | |
France (8.4%): | |
Communication Services (0.9%): | |
Iliad SA | | | 8,064 | | | | 1,658,601 | | |
Publicis Groupe SA | | | 43,329 | | | | 2,160,910 | | |
| | | | 3,819,511 | | |
Consumer Discretionary (1.1%): | |
La Francaise des Jeux SAEM (c) | | | 23,973 | | | | 1,097,322 | | |
Peugeot SA (b) | | | 82,221 | | | | 2,250,466 | | |
Renault SA (b) | | | 24,274 | | | | 1,062,093 | | |
| | | | 4,409,881 | | |
Consumer Staples (0.6%): | |
Carrefour SA | | | 139,393 | | | | 2,392,888 | | |
Financials (1.9%): | |
BNP Paribas SA (b) | | | 36,409 | | | | 1,920,261 | | |
CNP Assurances | | | 95,426 | | | | 1,538,884 | | |
Credit Agricole SA | | | 163,434 | | | | 2,063,697 | | |
Natixis SA (b) | | | 174,423 | | | | 595,218 | | |
Societe Generale SA | | | 84,037 | | | | 1,750,270 | | |
| | | | 7,868,330 | | |
See notes to financial statements.
24
Victory Portfolios II
VictoryShares USAA MSCI International Value
Momentum ETF | | Schedule of Portfolio Investments — continued
December 31, 2020 | |
(Unaudited)
Security Description | | Shares | | Value | |
Health Care (1.2%): | |
BioMerieux | | | 13,590 | | | $ | 1,918,886 | | |
Sanofi | | | 13,210 | | | | 1,272,042 | | |
Sartorius Stedim Biotech | | | 5,681 | | | | 2,024,137 | | |
| | | | 5,215,065 | | |
Industrials (2.1%): | |
Alstom SA (b) | | | 22,129 | | | | 1,262,015 | | |
Bouygues SA | | | 48,399 | | | | 1,992,715 | | |
Cie de Saint-Gobain (b) | | | 39,847 | | | | 1,828,314 | | |
Schneider Electric SE | | | 17,129 | | | | 2,479,366 | | |
Teleperformance | | | 3,512 | | | | 1,165,811 | | |
| | | | 8,728,221 | | |
Information Technology (0.4%): | |
Atos SE (b) | | | 20,596 | | | | 1,884,483 | | |
Utilities (0.2%): | |
Electricite de France SA (b) | | | 62,675 | | | | 988,871 | | |
| | | | 35,307,250 | | |
Germany (9.8%): | |
Communication Services (0.4%): | |
United Internet AG, Registered Shares | | | 40,674 | | | | 1,713,475 | | |
Consumer Discretionary (2.6%): | |
Bayerische Motoren Werke AG | | | 26,825 | | | | 2,370,725 | | |
Daimler AG | | | 12,080 | | | | 854,168 | | |
Delivery Hero SE (b) (c) | | | 13,607 | | | | 2,114,414 | | |
HelloFresh SE (a) (b) | | | 16,585 | | | | 1,282,497 | | |
Porsche Automobil Holding SE, Preference Shares | | | 24,736 | | | | 1,706,996 | | |
Volkswagen AG, Preference Shares | | | 9,600 | | | | 1,790,346 | | |
Zalando SE (b) (c) | | | 8,255 | | | | 919,747 | | |
| | | | 11,038,893 | | |
Financials (0.7%): | |
Commerzbank AG (b) | | | 223,608 | | | | 1,440,761 | | |
Deutsche Bank AG, Registered Shares (b) | | | 138,858 | | | | 1,520,440 | | |
| | | | 2,961,201 | | |
Health Care (1.3%): | |
Bayer AG, Registered Shares | | | 30,465 | | | | 1,795,008 | | |
Merck KGaA | | | 10,049 | | | | 1,725,675 | | |
Sartorius AG, Preference Shares | | | 4,399 | | | | 1,849,400 | | |
| | | | 5,370,083 | | |
Industrials (1.9%): | |
Brenntag AG | | | 32,635 | | | | 2,529,214 | | |
Deutsche Post AG, Registered Shares | | | 53,793 | | | | 2,665,659 | | |
GEA Group AG | | | 23,612 | | | | 845,917 | | |
KION Group AG | | | 9,122 | | | | 794,236 | | |
Siemens AG, Registered Shares | | | 8,799 | | | | 1,265,228 | | |
| | | | 8,100,254 | | |
See notes to financial statements.
25
Victory Portfolios II
VictoryShares USAA MSCI International Value
Momentum ETF | | Schedule of Portfolio Investments — continued
December 31, 2020 | |
(Unaudited)
Security Description | | Shares | | Value | |
Materials (0.5%): | |
HeidelbergCement AG | | | 26,503 | | | $ | 1,985,236 | | |
Real Estate (2.2%): | |
Deutsche Wohnen SE | | | 55,886 | | | | 2,987,507 | | |
LEG Immobilien AG | | | 20,223 | | | | 3,143,969 | | |
Vonovia SE | | | 41,473 | | | | 3,032,493 | | |
| | | | 9,163,969 | | |
Utilities (0.2%): | |
RWE AG | | | 23,206 | | | | 981,575 | | |
| | | | 41,314,686 | | |
Hong Kong (4.6%): | |
Consumer Discretionary (0.8%): | |
Techtronic Industries Co. Ltd. | | | 145,922 | | | | 2,081,414 | | |
Xinyi Glass Holdings Ltd. | | | 443,365 | | | | 1,237,947 | | |
| | | | 3,319,361 | | |
Consumer Staples (0.4%): | |
WH Group Ltd. (c) | | | 2,004,515 | | | | 1,680,371 | | |
Financials (0.7%): | |
Hong Kong Exchanges and Clearing Ltd. | | | 50,282 | | | | 2,756,031 | | |
Industrials (0.6%): | |
CK Hutchison Holdings Ltd. | | | 372,097 | | | | 2,596,187 | | |
Real Estate (2.1%): | |
CK Asset Holdings Ltd. | | | 477,848 | | | | 2,452,762 | | |
ESR Cayman Ltd. (b) (c) | | | 400,430 | | | | 1,435,668 | | |
Hang Lung Properties Ltd. | | | 479,215 | | | | 1,263,882 | | |
Sino Land Co. Ltd. | | | 1,975,419 | | | | 2,573,139 | | |
Sun Hung Kai Properties Ltd. | | | 100,162 | | | | 1,291,771 | | |
| | | | 9,017,222 | | |
| | | | 19,369,172 | | |
Ireland (1.0%): | |
Consumer Discretionary (0.5%): | |
Flutter Entertainment PLC | | | 10,162 | | | | 2,102,551 | | |
Industrials (0.5%): | |
Kingspan Group PLC (b) | | | 27,510 | | | | 2,041,481 | | |
| | | | 4,144,032 | | |
Isle of Man (0.2%): | |
Consumer Discretionary (0.2%): | |
Entain PLC (b) | | | 58,080 | | | | 899,908 | | |
See notes to financial statements.
26
Victory Portfolios II
VictoryShares USAA MSCI International Value
Momentum ETF | | Schedule of Portfolio Investments — continued
December 31, 2020 | |
(Unaudited)
Security Description | | Shares | | Value | |
Israel (0.3%): | |
Health Care (0.3%): | |
Teva Pharmaceutical Industries Ltd., ADR (b) | | | 119,086 | | | $ | 1,149,181 | | |
Italy (2.1%): | |
Communication Services (0.4%): | |
Telecom Italia SpA | | | 3,821,248 | | | | 1,764,538 | | |
Financials (0.3%): | |
UniCredit SpA | | | 154,094 | | | | 1,441,974 | | |
Health Care (0.5%): | |
DiaSorin SpA | | | 9,988 | | | | 2,078,771 | | |
Industrials (0.3%): | |
Prysmian SpA | | | 30,867 | | | | 1,098,279 | | |
Utilities (0.6%): | |
Enel SpA | | | 235,851 | | | | 2,388,262 | | |
| | | | 8,771,824 | | |
Japan (27.2%): | |
Communication Services (1.8%): | |
Capcom Co. Ltd. | | | 8,700 | | | | 564,579 | | |
KDDI Corp. | | | 45,800 | | | | 1,360,093 | | |
Koei Tecmo Holdings Co. Ltd. | | | 11,700 | | | | 713,933 | | |
Nexon Co. Ltd. | | | 31,500 | | | | 970,216 | | |
Nippon Telegraph & Telephone Corp. | | | 66,800 | | | | 1,711,651 | | |
SoftBank Group Corp. | | | 11,000 | | | | 858,521 | | |
Square Enix Holdings Co. Ltd. | | | 6,700 | | | | 406,238 | | |
Z Holdings Corp. | | | 141,500 | | | | 855,757 | | |
| | | | 7,440,988 | | |
Consumer Discretionary (4.2%): | |
Casio Computer Co. Ltd. | | | 33,200 | | | | 606,472 | | |
Honda Motor Co. Ltd. | | | 40,000 | | | | 1,114,824 | | |
Iida Group Holdings Co. Ltd. | | | 54,200 | | | | 1,094,027 | | |
Mercari, Inc. (b) | | | 23,100 | | | | 1,023,609 | | |
Nitori Holdings Co. Ltd. | | | 6,500 | | | | 1,361,131 | | |
Pan Pacific International Holdings Corp. | | | 21,800 | | | | 504,222 | | |
Rinnai Corp. | | | 14,000 | | | | 1,624,485 | | |
Sekisui House Ltd. | | | 70,000 | | | | 1,423,798 | | |
Shimamura Co. Ltd. | | | 5,500 | | | | 577,461 | | |
Shimano, Inc. | | | 5,500 | | | | 1,283,040 | | |
Sony Corp. | | | 12,700 | | | | 1,265,141 | | |
Subaru Corp. | | | 22,000 | | | | 439,489 | | |
Sumitomo Electric Industries Ltd. | | | 46,100 | | | | 610,157 | | |
Toyoda Gosei Co. Ltd. | | | 40,600 | | | | 1,177,752 | | |
Toyota Industries Corp. | | | 17,000 | | | | 1,348,540 | | |
Toyota Motor Corp. | | | 20,400 | | | | 1,572,210 | | |
Yamada Holdings Co. Ltd. | | | 122,500 | | | | 650,201 | | |
| | | | 17,676,559 | | |
See notes to financial statements.
27
Victory Portfolios II
VictoryShares USAA MSCI International Value
Momentum ETF | | Schedule of Portfolio Investments — continued
December 31, 2020 | |
(Unaudited)
Security Description | | Shares | | Value | |
Consumer Staples (2.3%): | |
Ajinomoto Co., Inc. | | | 33,600 | | | $ | 760,715 | | |
Cosmos Pharmaceutical Corp. | | | 6,000 | | | | 969,345 | | |
Kobe Bussan Co. Ltd. (a) | | | 28,600 | | | | 880,895 | | |
NH Foods Ltd. | | | 22,400 | | | | 984,997 | | |
Seven & i Holdings Co. Ltd. | | | 43,900 | | | | 1,555,815 | | |
Sundrug Co. Ltd. | | | 34,400 | | | | 1,372,735 | | |
Toyo Suisan Kaisha Ltd. | | | 25,600 | | | | 1,244,728 | | |
Tsuruha Holdings, Inc. | | | 8,300 | | | | 1,180,144 | | |
Welcia Holdings Co. Ltd. | | | 22,500 | | | | 848,830 | | |
| | | | 9,798,204 | | |
Energy (0.6%): | |
ENEOS Holdings, Inc. | | | 266,400 | | | | 955,732 | | |
Idemitsu Kosan Co. Ltd. | | | 43,144 | | | | 948,587 | | |
Inpex Corp. | | | 143,800 | | | | 774,399 | | |
| | | | 2,678,718 | | |
Financials (4.9%): | |
ACOM Co. Ltd. | | | 115,600 | | | | 493,773 | | |
Concordia Financial Group Ltd. | | | 254,200 | | | | 893,744 | | |
Fukuoka Financial Group, Inc. | | | 50,300 | | | | 893,020 | | |
Japan Exchange Group, Inc. | | | 51,100 | | | | 1,305,650 | | |
Japan Post Holdings Co. Ltd. | | | 94,300 | | | | 733,247 | | |
Japan Post Insurance Co. Ltd. | | | 68,600 | | | | 1,403,295 | | |
Mitsubishi UFJ Financial Group, Inc. | | | 275,300 | | | | 1,216,178 | | |
Mitsubishi UFJ Lease & Finance Co. Ltd. | | | 213,200 | | | | 1,022,171 | | |
Mizuho Financial Group, Inc. | | | 53,400 | | | | 676,260 | | |
Nomura Holdings, Inc. | | | 214,800 | | | | 1,133,866 | | |
ORIX Corp. | | | 71,500 | | | | 1,097,310 | | |
Resona Holdings, Inc. | | | 288,100 | | | | 1,005,678 | | |
Shinsei Bank Ltd. | | | 77,500 | | | | 954,066 | | |
Sumitomo Mitsui Financial Group, Inc. | | | 42,200 | | | | 1,303,052 | | |
Sumitomo Mitsui Trust Holdings, Inc. | | | 39,000 | | | | 1,200,087 | | |
T&D Holdings, Inc. | | | 81,200 | | | | 957,145 | | |
The Bank of Kyoto Ltd. | | | 19,900 | | | | 1,035,043 | | |
The Chiba Bank Ltd. | | | 170,600 | | | | 938,552 | | |
The Shizuoka Bank Ltd. | | | 145,700 | | | | 1,066,872 | | |
Tokyo Century Corp. | | | 13,800 | | | | 1,093,360 | | |
| | | | 20,422,369 | | |
Health Care (1.2%): | |
Alfresa Holdings Corp. | | | 23,100 | | | | 422,644 | | |
Chugai Pharmaceutical Co. Ltd. | | | 12,600 | | | | 671,585 | | |
Kyowa Kirin Co. Ltd. | | | 17,700 | | | | 482,423 | | |
M3, Inc. | | | 13,700 | | | | 1,292,839 | | |
Medipal Holdings Corp. | | | 66,500 | | | | 1,248,264 | | |
Ono Pharmaceutical Co. Ltd. | | | 34,800 | | | | 1,047,590 | | |
| | | | 5,165,345 | | |
See notes to financial statements.
28
Victory Portfolios II
VictoryShares USAA MSCI International Value
Momentum ETF | | Schedule of Portfolio Investments — continued
December 31, 2020 | |
(Unaudited)
Security Description | | Shares | | Value | |
Industrials (5.6%): | |
Asahi Glass Co. Ltd. | | | 33,700 | | | $ | 1,175,069 | | |
Dai Nippon Printing Co. Ltd. | | | 52,300 | | | | 939,673 | | |
Daifuku Co. Ltd. | | | 8,000 | | | | 988,716 | | |
Daikin Industries Ltd. | | | 3,200 | | | | 710,388 | | |
ITOCHU Corp. | | | 52,100 | | | | 1,495,708 | | |
Kajima Corp. | | | 84,400 | | | | 1,129,748 | | |
Kubota Corp. | | | 27,600 | | | | 601,749 | | |
Kurita Water Industries Ltd. | | | 14,400 | | | | 550,225 | | |
Lixil Corp. | | | 17,900 | | | | 387,318 | | |
Marubeni Corp. | | | 192,500 | | | | 1,279,231 | | |
Mitsubishi Corp. | | | 59,600 | | | | 1,466,837 | | |
Mitsui & Co. Ltd. | | | 74,800 | | | | 1,368,924 | | |
MonotaRO Co. Ltd. | | | 19,000 | | | | 966,148 | | |
NGK Insulators Ltd. | | | 30,100 | | | | 464,131 | | |
Nihon M&A Center, Inc. | | | 6,900 | | | | 461,136 | | |
Nippon Yusen KK | | | 56,300 | | | | 1,309,822 | | |
Obayashi Corp. | | | 111,000 | | | | 956,850 | | |
SG Holdings Co. Ltd. | | | 42,100 | | | | 1,146,643 | | |
Shimizu Corp. | | | 142,000 | | | | 1,031,527 | | |
SMC Corp. | | | 800 | | | | 487,772 | | |
Sumitomo Corp. | | | 49,900 | | | | 659,969 | | |
Taisei Corp. | | | 31,500 | | | | 1,084,629 | | |
Toppan Printing Co. Ltd. | | | 66,700 | | | | 939,983 | | |
Toyota Tsusho Corp. | | | 26,700 | | | | 1,077,103 | | |
Yamato Holdings Co. Ltd. | | | 37,300 | | | | 950,519 | | |
| | | | 23,629,818 | | |
Information Technology (2.6%): | |
Azbil Corp. | | | 14,700 | | | | 803,022 | | |
Brother Industries Ltd. | | | 56,300 | | | | 1,159,318 | | |
FUJIFILM Holdings Corp. | | | 25,600 | | | | 1,348,373 | | |
Fujitsu Ltd. | | | 8,800 | | | | 1,270,415 | | |
Hitachi Ltd. | | | 26,000 | | | | 1,023,682 | | |
Ibiden Co. Ltd. | | | 10,000 | | | | 466,366 | | |
Kyocera Corp. | | | 9,800 | | | | 600,463 | | |
Lasertec Corp. | | | 3,400 | | | | 398,799 | | |
NEC Corp. | | | 22,700 | | | | 1,218,054 | | |
Ricoh Co. Ltd. | | | 146,200 | | | | 958,665 | | |
SUMCO Corp. (f) | | | 20,000 | | | | 438,375 | | |
TDK Corp. | | | 7,100 | | | | 1,068,662 | | |
| | | | 10,754,194 | | |
Materials (1.4%): | |
JFE Holdings, Inc. (b) | | | 51,200 | | | | 489,957 | | |
Mitsubishi Gas Chemical Co., Inc. | | | 51,200 | | | | 1,174,805 | | |
Mitsui Chemicals, Inc. | | | 17,600 | | | | 515,667 | | |
Oji Holdings Corp. | | | 214,500 | | | | 1,219,541 | | |
Sumitomo Chemical Co. Ltd. | | | 138,400 | | | | 556,308 | | |
See notes to financial statements.
29
Victory Portfolios II
VictoryShares USAA MSCI International Value
Momentum ETF | | Schedule of Portfolio Investments — continued
December 31, 2020 | |
(Unaudited)
Security Description | | Shares | | Value | |
Taiheiyo Cement Corp. | | | 32,800 | | | $ | 819,325 | | |
Tosoh Corp. | | | 64,600 | | | | 1,006,119 | | |
| | | | 5,781,722 | | |
Real Estate (1.6%): | |
Aeon Mall Co. Ltd. | | | 72,300 | | | | 1,191,870 | | |
Daito Trust Construction Co. Ltd. | | | 12,600 | | | | 1,176,464 | | |
Daiwa House REIT Investment Corp. | | | 187 | | | | 462,225 | | |
GLP J-REIT | | | 548 | | | | 863,042 | | |
Hulic Co. Ltd. | | | 123,100 | | | | 1,350,887 | | |
Mitsubishi Estate Co. Ltd. | | | 32,000 | | | | 513,574 | | |
Nippon Prologis REIT, Inc. | | | 398 | | | | 1,241,280 | | |
| | | | 6,799,342 | | |
Utilities (1.0%): | |
Chubu Electric Power Co., Inc. | | | 110,200 | | | | 1,326,734 | | |
Osaka Gas Co. Ltd. | | | 37,600 | | | | 769,153 | | |
The Kansai Electric Power Co., Inc. | | | 61,300 | | | | 578,118 | | |
Tohoku Electric Power Co., Inc. | | | 67,600 | | | | 556,540 | | |
Tokyo Electric Power Co. Holdings (b) | | | 362,400 | | | | 954,747 | | |
| | | | 4,185,292 | | |
| | | | 114,332,551 | | |
Luxembourg (0.5%): | |
Materials (0.5%): | |
ArcelorMittal SA (b) | | | 91,747 | | | | 2,119,423 | | |
Netherlands (3.3%): | |
Consumer Discretionary (0.5%): | |
Fiat Chrysler Automobiles NV (b) | | | 114,962 | | | | 2,062,111 | | |
Consumer Staples (0.7%): | |
Koninklijke Ahold Delhaize NV | | | 97,559 | | | | 2,758,615 | | |
Energy (0.3%): | |
Koninklijke Vopak NV | | | 23,894 | | | | 1,256,841 | | |
Financials (1.2%): | |
Aegon NV | | | 459,604 | | | | 1,819,206 | | |
ING Groep NV (b) | | | 83,564 | | | | 781,256 | | |
NN Group NV | | | 53,056 | | | | 2,306,500 | | |
| | | | 4,906,962 | | |
Information Technology (0.6%): | |
Adyen NV (b) (c) | | | 1,136 | | | | 2,647,873 | | |
| | | | 13,632,402 | | |
New Zealand (0.5%): | |
Health Care (0.5%): | |
Fisher & Paykel Healthcare Corp. Ltd. | | | 89,917 | | | | 2,134,484 | | |
See notes to financial statements.
30
Victory Portfolios II
VictoryShares USAA MSCI International Value
Momentum ETF | | Schedule of Portfolio Investments — continued
December 31, 2020 | |
(Unaudited)
Security Description | | Shares | | Value | |
Norway (1.2%): | |
Communication Services (0.8%): | |
Adevinta ASA (b) | | | 140,801 | | | $ | 2,368,075 | | |
Schibsted ASA, Class A (a) (b) | | | 25,846 | | | | 1,105,752 | | |
| | | | 3,473,827 | | |
Consumer Staples (0.4%): | |
Orkla ASA, Class A | | | 166,621 | | | | 1,693,075 | | |
| | | | 5,166,902 | | |
Portugal (0.4%): | |
Utilities (0.4%): | |
Energias de Portugal SA | | | 243,569 | | | | 1,536,593 | | |
Singapore (1.5%): | |
Consumer Staples (0.7%): | |
Wilmar International Ltd. | | | 798,800 | | | | 2,810,441 | | |
Real Estate (0.8%): | |
Ascendas Real Estate Investment Trust (g) | | | 522,954 | | | | 1,179,134 | | |
Mapletree Logistics Trust | | | 1,553,300 | | | | 2,362,300 | | |
| | | | 3,541,434 | | |
| | | | 6,351,875 | | |
Spain (2.0%): | |
Communication Services (0.2%): | |
Cellnex Telecom SA (c) | | | 16,745 | | | | 1,006,392 | | |
Energy (0.5%): | |
Repsol SA | | | 215,975 | | | | 2,180,124 | | |
Industrials (0.5%): | |
Siemens Gamesa Renewable Energy SA | | | 54,292 | | | | 2,198,146 | | |
Utilities (0.8%): | |
Iberdrola SA | | | 217,778 | | | | 3,117,624 | | |
| | | | 8,502,286 | | |
Sweden (4.2%): | |
Consumer Discretionary (0.7%): | |
Evolution Gaming Group AB (c) | | | 17,181 | | | | 1,746,437 | | |
Husqvarna AB, B Shares | | | 94,059 | | | | 1,219,753 | | |
| | | | 2,966,190 | | |
Consumer Staples (0.5%): | |
Swedish Match AB | | | 27,741 | | | | 2,154,411 | | |
Financials (1.6%): | |
EQT AB | | | 99,413 | | | | 2,546,894 | | |
Kinnevik AB, Class B | | | 48,360 | | | | 2,446,692 | | |
L E Lundbergforetagen AB, Class B (b) | | | 27,836 | | | | 1,493,390 | | |
| | | | 6,486,976 | | |
See notes to financial statements.
31
Victory Portfolios II
VictoryShares USAA MSCI International Value
Momentum ETF | | Schedule of Portfolio Investments — continued
December 31, 2020 | |
(Unaudited)
Security Description | | Shares | | Value | |
Industrials (1.4%): | |
Investment AB Latour, Class B | | | 98,666 | | | $ | 2,399,206 | | |
Nibe Industrier AB, Class B | | | 76,594 | | | | 2,515,346 | | |
Volvo AB, Class B | | | 43,548 | | | | 1,027,647 | | |
| | | | 5,942,199 | | |
| | | | 17,549,776 | | |
Switzerland (1.9%): | |
Financials (0.4%): | |
Banque Cantonale Vaudoise, Registered Shares | | | 16,854 | | | | 1,836,122 | | |
Health Care (0.9%): | |
Lonza Group AG, Registered Shares | | | 3,617 | | | | 2,327,450 | | |
Roche Holding AG | | | 4,294 | | | | 1,501,042 | | |
| | | | 3,828,492 | | |
Information Technology (0.6%): | |
Logitech International SA, Class R | | | 25,085 | | | | 2,438,264 | | |
| | | | 8,102,878 | | |
United Kingdom (9.6%): | |
Communication Services (1.6%): | |
BT Group PLC (b) | | | 1,294,202 | | | | 2,339,633 | | |
Vodafone Group PLC | | | 1,359,955 | | | | 2,248,250 | | |
WPP PLC | | | 184,898 | | | | 2,021,959 | | |
| | | | 6,609,842 | | |
Consumer Discretionary (1.5%): | |
Barratt Developments PLC (b) | | | 195,188 | | | | 1,787,632 | | |
Berkeley Group Holdings PLC | | | 16,574 | | | | 1,074,333 | | |
Kingfisher PLC (b) | | | 486,976 | | | | 1,799,966 | | |
Persimmon PLC | | | 41,348 | | | | 1,563,917 | | |
| | | | 6,225,848 | | |
Consumer Staples (2.8%): | |
British American Tobacco PLC | | | 58,044 | | | | 2,148,602 | | |
Imperial Brands PLC | | | 112,050 | | | | 2,351,862 | | |
J Sainsbury PLC | | | 858,884 | | | | 2,647,470 | | |
Tesco PLC | | | 458,298 | | | | 1,449,644 | | |
Wm Morrison Supermarkets PLC | | | 1,269,248 | | | | 3,077,002 | | |
| | | | 11,674,580 | | |
Financials (1.7%): | |
Admiral Group PLC | | | 44,269 | | | | 1,758,512 | | |
Aviva PLC | | | 227,434 | | | | 1,011,011 | | |
Barclays PLC | | | 1,001,839 | | | | 2,008,718 | | |
London Stock Exchange Group PLC | | | 10,974 | | | | 1,351,274 | | |
Natwest Group PLC | | | 517,983 | | | | 1,187,050 | | |
| | | | 7,316,565 | | |
See notes to financial statements.
32
Victory Portfolios II
VictoryShares USAA MSCI International Value
Momentum ETF | | Schedule of Portfolio Investments — continued
December 31, 2020 | |
(Unaudited)
Security Description | | Shares | | Value | |
Industrials (0.3%): | |
Bunzl PLC | | | 43,868 | | | $ | 1,464,945 | | |
Materials (0.9%): | |
Anglo American PLC | | | 58,801 | | | | 1,948,754 | | |
Evraz PLC (f) | | | 145,208 | | | | 936,083 | | |
Fresnillo PLC | | | 48,531 | | | | 749,299 | | |
| | | | 3,634,136 | | |
Real Estate (0.8%): | |
Segro PLC | | | 261,312 | | | | 3,384,811 | | |
| | | | 40,310,727 | | |
United States (0.3%): | |
Health Care (0.3%): | |
Bausch Health Cos., Inc. (b) | | | 63,339 | | | | 1,313,016 | | |
Total Common Stocks (Cost $368,083,312) | | | 417,398,686 | | |
Rights (0.0%) (d) | |
Spain (0.0%): | |
Energy (0.0%): | |
Repsol SA , Expires 1/11/21 (b) | | | 215,975 | | | | 74,177 | | |
Total Rights (Cost $76,165) | | | 74,177 | | |
Collateral for Securities Loaned^ (0.3%) | |
United States (0.3%): | |
BlackRock Liquidity Funds TempFund Portfolio, Institutional Class, 0.08% (h) | | | 29,399 | | | | 29,399 | | |
Fidelity Investments Money Market Government Portfolio I Shares, 0.01% (h) | | | 1,010,024 | | | | 1,010,024 | | |
Goldman Sachs Financial Square Prime Obligations Fund, Institutional
Class, 0.04% (h) | | | 14,672 | | | | 14,672 | | |
JPMorgan Prime Money Market Fund, Capital Class, 0.12% (h) | | | 116,986 | | | | 116,986 | | |
Morgan Stanley Institutional Liquidity Prime Portfolio, Institutional
Class, 0.09% (h) | | | 525,992 | | | | 525,992 | | |
Total Collateral for Securities Loaned (Cost $1,697,073) | | | 1,697,073 | | |
Total Investments (Cost $369,856,550) — 99.7% | | | 419,169,936 | | |
Other assets in excess of liabilities — 0.3% | | | 1,057,553 | | |
NET ASSETS — 100.00% | | $ | 420,227,489 | | |
^ Purchased with cash collateral from securities on loan.
(a) All or a portion of this security is on loan.
(b) Non-income producing security.
(c) Rule 144A security or other security that is restricted as to resale to institutional investors. The Fund's Adviser has deemed this security to be liquid based upon procedures approved by the Board of Trustees. As of December 31, 2020, the fair value of these securities was $19,776,503 and amounted to 4.7% of net assets.
(d) Amount represents less than 0.05% of net assets.
See notes to financial statements.
33
Victory Portfolios II
VictoryShares USAA MSCI International Value
Momentum ETF | | Schedule of Portfolio Investments — continued
December 31, 2020 | |
(Unaudited)
(f) All or a portion of this security has been segregated as collateral for derivative instruments.
(g) The Fund's Adviser has deemed this security to be illiquid based upon procedures approved by the Board of Trustees. As of December 31, 2020, illiquid securities were 0.3% of the Fund's net assets.
(h) Rate disclosed is the daily yield on December 31, 2020.
ADR — American Depositary Receipt
PLC — Public Limited Company
REIT — Real Estate Investment Trust
Futures Contracts Purchased
| | | Number of
Contracts | | Expiration
Date | | Notional
Amount | | Value | | Unrealized
Appreciation
(Depreciation) | |
E-Mini MSCI EAFE Index Futures | | | 19 | | | 3/19/21 | | $ | 1,997,727 | | | $ | 2,024,260 | | | $ | 26,533 | | |
| | | Total unrealized appreciation | | | | | | | | $ | 26,533 | | |
| | | Total unrealized depreciation | | | | | | | | | — | | |
| | | Total net unrealized appreciation (depreciation) | | | | | | | | $ | 26,533 | | |
See notes to financial statements.
34
Victory Portfolios II
VictoryShares USAA MSCI Emerging Markets Value
Momentum ETF | | Schedule of Portfolio Investments
December 31, 2020 | |
(Unaudited)
Security Description | | Shares | | Value | |
Common Stocks (98.2%) | |
Brazil (5.3%): | |
Consumer Discretionary (0.2%): | |
Magazine Luiza SA | | | 107,536 | | | $ | 516,542 | | |
Consumer Staples (0.7%): | |
JBS SA | | | 284,352 | | | | 1,295,247 | | |
Natura & Co. Holding SA (a) | | | 60,424 | | | | 610,731 | | |
| | | | 1,905,978 | | |
Energy (0.5%): | |
Cosan SA | | | 89,900 | | | | 1,310,717 | | |
Financials (0.6%): | |
B3 SA- Brasil Bolsa Balcao | | | 60,300 | | | | 719,532 | | |
Banco BTG Pactual SA | | | 60,700 | | | | 1,098,495 | | |
| | | | 1,818,027 | | |
Industrials (0.5%): | |
WEG SA | | | 102,100 | | | | 1,488,786 | | |
Materials (1.4%): | |
Bradespar SA, Preference Shares | | | 74,600 | | | | 915,014 | | |
Cia Siderurgica Nacional SA | | | 134,000 | | | | 821,666 | | |
Vale SA | | | 123,285 | | | | 2,075,637 | | |
| | | | 3,812,317 | | |
Utilities (1.4%): | |
Centrais Eletricas Brasileiras SA | | | 132,548 | | | | 935,762 | | |
Cia de Saneamento Basico do Estado de Sao Paulo | | | 51,876 | | | | 443,835 | | |
Cia Paranaense de Energia, Preference Shares | | | 115,300 | | | | 1,663,506 | | |
Equatorial Energia SA | | | 200,000 | | | | 891,764 | | |
| | | | 3,934,867 | | |
| | | | 14,787,234 | | |
Chile (0.5%): | |
Consumer Staples (0.5%): | |
Cencosud SA | | | 741,274 | | | | 1,319,791 | | |
China (28.4%): | |
Communication Services (1.6%): | |
Bilibili, Inc., ADR (a) (b) | | | 12,998 | | | | 1,114,189 | | |
China Literature Ltd. (a) (b) (c) | | | 77,600 | | | | 608,983 | | |
China Telecom Corp. Ltd., Class H | | | 5,543,532 | | | | 1,537,119 | | |
DouYu International Holdings Ltd., ADR (a) | | | 44,835 | | | | 495,875 | | |
JOYY, Inc., ADR | | | 10,882 | | | | 870,342 | | |
| | | | 4,626,508 | | |
See notes to financial statements.
35
Victory Portfolios II
VictoryShares USAA MSCI Emerging Markets Value
Momentum ETF | | Schedule of Portfolio Investments — continued
December 31, 2020 | |
(Unaudited)
Security Description | | Shares | | Value | |
Consumer Discretionary (5.9%): | |
Brilliance China Automotive Holdings Ltd. | | | 1,005,356 | | | $ | 915,392 | | |
BYD Co. Ltd., Class H | | | 21,500 | | | | 563,436 | | |
China Meidong Auto Holdings Ltd. | | | 112,000 | | | | 455,000 | | |
Dongfeng Motor Group Co. Ltd., Class H | | | 1,533,986 | | | | 1,788,432 | | |
Great Wall Motor Co. Ltd., Class H | | | 763,076 | | | | 2,617,773 | | |
GSX Techedu, Inc., ADR (a) (b) | | | 14,076 | | | | 727,870 | | |
Guangzhou Automobile Group Co. Ltd. | | | 1,082,569 | | | | 1,203,498 | | |
JD.com, Inc., ADR (a) | | | 6,941 | | | | 610,114 | | |
Meituan Dianping, Class B (a) | | | 31,828 | | | | 1,209,274 | | |
NIO, Inc., ADR (a) | | | 49,651 | | | | 2,419,990 | | |
Pinduoduo, Inc., ADR (a) | | | 9,632 | | | | 1,711,317 | | |
Vipshop Holdings Ltd., ADR (a) | | | 18,302 | | | | 514,469 | | |
Yadea Group Holdings Ltd. (c) | | | 336,000 | | | | 694,200 | | |
Zhongsheng Group Holdings Ltd. | | | 164,194 | | | | 1,169,963 | | |
| | | | 16,600,728 | | |
Consumer Staples (0.2%): | |
Yihai International Holding Ltd. | | | 29,784 | | | | 441,737 | | |
Energy (0.4%): | |
Yanzhou Coal Mining Co. Ltd., Class H | | | 1,266,832 | | | | 1,012,962 | | |
Financials (9.4%): | |
Agricultural Bank of China Ltd., Class H (d) | | | 5,251,588 | | | | 1,923,497 | | |
Bank of China Ltd., Class H (d) | | | 6,567,396 | | | | 2,244,511 | | |
Bank of Communications Co. Ltd., Class H | | | 4,075,357 | | | | 2,154,925 | | |
China Cinda Asset Management Co. Ltd., Class H | | | 7,189,642 | | | | 1,363,036 | | |
China CITIC Bank Corp. Ltd., Class H | | | 4,285,883 | | | | 1,818,523 | | |
China Construction Bank Corp., Class H (d) | | | 2,579,299 | | | | 1,959,294 | | |
China Everbright Bank Co. Ltd., Class H | | | 4,289,001 | | | | 1,631,777 | | |
China Galaxy Securities Co. Ltd., Class H | | | 1,867,448 | | | | 1,170,489 | | |
China Huarong Asset Management Co. Ltd., Class H (c) | | | 9,864,282 | | | | 1,094,074 | | |
China International Capital Corp. Ltd., Class H (a) (c) | | | 485,984 | | | | 1,316,206 | | |
China Minsheng Banking Corp. Ltd., Class H | | | 3,733,404 | | | | 2,128,187 | | |
Chongqing Rural Commercial Bank Co. Ltd., Class H | | | 3,644,856 | | | | 1,485,423 | | |
CITIC Securities Co. Ltd., Class H | | | 248,200 | | | | 559,533 | | |
GF Securities Co. Ltd., Class H | | | 956,724 | | | | 1,352,321 | | |
Huatai Securities Co. Ltd., Class H (c) | | | 713,348 | | | | 1,122,390 | | |
Industrial & Commercial Bank of China Ltd., Class H | | | 1,635,114 | | | | 1,060,715 | | |
New China Life Insurance Co. Ltd., Class H | | | 144,200 | | | | 562,566 | | |
Postal Savings Bank of China Co. Ltd., Class H (c) | | | 1,707,572 | | | | 964,574 | | |
Zhongan Online P&C Insurance Co. Ltd., Class H (a) (b) (c) | | | 127,552 | | | | 595,495 | | |
| | | | 26,507,536 | | |
Health Care (2.2%): | |
AK Medical Holdings Ltd. (c) | | | 201,488 | | | | 349,766 | | |
China Medical System Holdings Ltd. | | | 875,148 | | | | 977,422 | | |
China Resources Pharmaceutical Group Ltd. (c) | | | 2,367,365 | | | | 1,215,153 | | |
Luye Pharma Group Ltd. (c) | | | 1,920,717 | | | | 894,238 | | |
Shandong Weigao Group Medical Polymer Co. Ltd., Class H | | | 243,528 | | | | 550,257 | | |
See notes to financial statements.
36
Victory Portfolios II
VictoryShares USAA MSCI Emerging Markets Value
Momentum ETF | | Schedule of Portfolio Investments — continued
December 31, 2020 | |
(Unaudited)
Security Description | | Shares | | Value | |
Shanghai Pharmaceuticals Holding Co. Ltd. | | | 930,805 | | | $ | 1,639,804 | | |
Sinopharm Group Co. Ltd., Class H | | | 279,200 | | | | 679,109 | | |
| | | | 6,305,749 | | |
Industrials (4.0%): | |
A-Living Smart City Services Co. Ltd., Class H (c) | | | 118,074 | | | | 523,836 | | |
China Conch Venture Holdings Ltd. | | | 201,917 | | | | 981,741 | | |
China Lesso Group Holdings Ltd. | | | 592,511 | | | | 927,679 | | |
China Railway Group Ltd., Class H | | | 3,144,432 | | | | 1,386,918 | | |
China State Construction International Holdings Ltd. | | | 1,630,204 | | | | 929,281 | | |
COSCO SHIPPING Holdings Co. Ltd., Class H (a) | | | 687,500 | | | | 824,590 | | |
Country Garden Services Holdings Co. Ltd. | | | 211,043 | | | | 1,427,575 | | |
Fosun International Ltd. | | | 1,109,104 | | | | 1,742,217 | | |
Weichai Power Co. Ltd. | | | 275,847 | | | | 553,555 | | |
Zoomlion Heavy Industry Science and Technology Co. Ltd., Class H | | | 1,167,160 | | | | 1,399,897 | | |
ZTO Express Cayman, Inc., ADR | | | 21,959 | | | | 640,324 | | |
| | | | 11,337,613 | | |
Information Technology (1.0%): | |
Kingdee International Software Group Co. Ltd. | | | 168,880 | | | | 688,253 | | |
Xinyi Solar Holdings Ltd. | | | 765,580 | | | | 1,999,393 | | |
| | | | 2,687,646 | | |
Materials (0.6%): | |
China Hongqiao Group Ltd. | | | 1,066,068 | | | | 976,171 | | |
China National Building Material Co. Ltd., Class H | | | 637,061 | | | | 765,737 | | |
| | | | 1,741,908 | | |
Real Estate (1.5%): | |
China Vanke Co. Ltd. | | | 378,549 | | | | 1,305,956 | | |
Kaisa Group Holdings Ltd. | | | 934,446 | | | | 461,568 | | |
Longfor Group Holdings Ltd. (c) | | | 218,118 | | | | 1,277,115 | | |
Seazen Group Ltd. | | | 844,161 | | | | 702,211 | | |
Sunac China Holdings Ltd. | | | 91,076 | | | | 336,520 | | |
| | | | 4,083,370 | | |
Utilities (1.6%): | |
China Longyuan Power Group Corp. Ltd., Class H | | | 1,803,588 | | | | 1,807,344 | | |
China Power International Development Ltd. | | | 8,807,989 | | | | 1,885,678 | | |
Huaneng Power International, Inc., Class H | | | 1,912,000 | | | | 697,842 | | |
| | | | 4,390,864 | | |
| | | | 79,736,621 | | |
Greece (0.0%): (e) | |
Consumer Discretionary (0.0%): | |
FF Group (a) (f) (g) | | | 14,913 | | | | 4,379 | | |
Hong Kong (6.7%): | |
Communication Services (0.4%): | |
China Unicom Hong Kong Ltd. | | | 2,119,687 | | | | 1,216,506 | | |
See notes to financial statements.
37
Victory Portfolios II
VictoryShares USAA MSCI Emerging Markets Value
Momentum ETF | | Schedule of Portfolio Investments — continued
December 31, 2020 | |
(Unaudited)
Security Description | | Shares | | Value | |
Consumer Staples (0.2%): | |
Vinda International Holdings Ltd. | | | 185,452 | | | $ | 505,853 | | |
Financials (0.7%): | |
China Everbright Ltd. | | | 879,139 | | | | 1,176,895 | | |
Far East Horizon Ltd. | | | 797,000 | | | | 821,273 | | |
| | | | 1,998,168 | | |
Health Care (0.4%): | |
China Traditional Chinese Medicine Holdings Co. Ltd. | | | 2,520,234 | | | | 1,248,115 | | |
Industrials (0.8%): | |
CITIC Ltd. | | | 2,295,827 | | | | 1,625,527 | | |
Sinotruk Hong Kong Ltd. | | | 293,197 | | | | 748,699 | | |
| | | | 2,374,226 | | |
Information Technology (0.6%): | |
Kingboard Holdings Ltd. | | | 379,286 | | | | 1,599,548 | | |
Materials (0.7%): | |
China Resources Cement Holdings Ltd. | | | 431,718 | | | | 482,171 | | |
Nine Dragons Paper Holdings Ltd. | | | 965,731 | | | | 1,370,034 | | |
| | | | 1,852,205 | | |
Real Estate (1.7%): | |
China Overseas Property Holdings Ltd. | | | 514,304 | | | | 267,968 | | |
China Resources Land Ltd. | | | 314,750 | | | | 1,298,967 | | |
Shimao Group Holdings Ltd. | | | 252,868 | | | | 805,515 | | |
The Wharf Holdings Ltd. | | | 247,000 | | | | 664,180 | | |
Yuexiu Property Co. Ltd. | | | 8,121,332 | | | | 1,633,934 | | |
| | | | 4,670,564 | | |
Utilities (1.2%): | |
Beijing Enterprises Holdings Ltd. | | | 554,684 | | | | 1,809,876 | | |
China Resources Power Holdings Co. Ltd. | | | 1,465,564 | | | | 1,578,243 | | |
| | | | 3,388,119 | | |
| | | | 18,853,304 | | |
Hungary (0.7%): | |
Health Care (0.7%): | |
Richter Gedeon Nyrt | | | 78,308 | | | | 1,965,492 | | |
India (2.4%): | |
Consumer Staples (0.3%): | |
Tata Consumer Products Ltd. | | | 95,805 | | | | 773,468 | | |
Energy (0.5%): | |
Reliance Industries Ltd. | | | 53,745 | | | | 1,460,293 | | |
Financials (0.7%): | |
Muthoot Finance Ltd. | | | 38,891 | | | | 644,329 | | |
REC Ltd. | | | 780,711 | | | | 1,430,694 | | |
| | | | 2,075,023 | | |
See notes to financial statements.
38
Victory Portfolios II
VictoryShares USAA MSCI Emerging Markets Value
Momentum ETF | | Schedule of Portfolio Investments — continued
December 31, 2020 | |
(Unaudited)
Security Description | | Shares | | Value | |
Health Care (0.3%): | |
Dr. Reddy's Laboratories Ltd. | | | 12,650 | | | $ | 901,146 | | |
Materials (0.3%): | |
Hindalco Industries Ltd. | | | 205,157 | | | | 675,410 | | |
Utilities (0.3%): | |
Adani Green Energy Ltd. (a) | | | 58,147 | | | | 837,657 | | |
| | | | 6,722,997 | | |
Indonesia (1.6%): | |
Consumer Staples (0.8%): | |
PT Gudang Garam Tbk (a) | | | 246,400 | | | | 719,032 | | |
PT Indofood Sukses Makmur Tbk | | | 3,005,025 | | | | 1,465,084 | | |
| | | | 2,184,116 | | |
Energy (0.5%): | |
PT Adaro Energy Tbk | | | 5,559,800 | | | | 565,873 | | |
PT United Tractors Tbk | | | 472,300 | | | | 894,176 | | |
| | | | 1,460,049 | | |
Materials (0.3%): | |
PT Indah Kiat Pulp & Paper Corp. Tbk | | | 1,075,846 | | | | 798,270 | | |
| | | | 4,442,435 | | |
Korea, Republic Of (24.0%): | |
Communication Services (2.5%): | |
Kakao Corp. | | | 3,859 | | | | 1,383,670 | | |
LG Uplus Corp. | | | 144,752 | | | | 1,565,715 | | |
NAVER Corp. | | | 6,120 | | | | 1,647,887 | | |
SK Telecom Co. Ltd. | | | 10,581 | | | | 2,318,216 | | |
| | | | 6,915,488 | | |
Consumer Discretionary (4.1%): | |
Hankook Tire & Technology Co. Ltd. | | | 47,570 | | | | 1,725,359 | | |
Hyundai Mobis Co. Ltd. | | | 6,444 | | | | 1,515,642 | | |
Hyundai Motor Co. | | | 8,092 | | | | 1,430,235 | | |
Kia Motors Corp. | | | 31,930 | | | | 1,834,145 | | |
LG Electronics, Inc. | | | 18,522 | | | | 2,301,823 | | |
Lotte Shopping Co. Ltd. | | | 15,710 | | | | 1,482,348 | | |
Shinsegae, Inc. | | | 6,145 | | | | 1,354,808 | | |
| | | | 11,644,360 | | |
Consumer Staples (2.7%): | |
CJ CheilJedang Corp. | | | 4,240 | | | | 1,487,103 | | |
E-MART, Inc. | | | 11,909 | | | | 1,660,880 | | |
GS Retail Co. Ltd. | | | 46,529 | | | | 1,475,581 | | |
KT&G Corp. | | | 30,379 | | | | 2,323,939 | | |
Orion Corp. | | | 4,797 | | | | 547,572 | | |
| | | | 7,495,075 | | |
See notes to financial statements.
39
Victory Portfolios II
VictoryShares USAA MSCI Emerging Markets Value
Momentum ETF | | Schedule of Portfolio Investments — continued
December 31, 2020 | |
(Unaudited)
Security Description | | Shares | | Value | |
Financials (5.5%): | |
DB Insurance Co. Ltd. | | | 34,345 | | | $ | 1,383,222 | | |
Hana Financial Group, Inc. | | | 47,292 | | | | 1,501,955 | | |
Hyundai Marine & Fire Insurance Co. Ltd. | | | 70,251 | | | | 1,471,242 | | |
Industrial Bank of Korea | | | 207,332 | | | | 1,687,209 | | |
KB Financial Group, Inc. | | | 43,853 | | | | 1,752,021 | | |
Korea Investment Holdings Co. Ltd. | | | 7,929 | | | | 576,628 | | |
Meritz Securities Co. Ltd. | | | 221,879 | | | | 748,584 | | |
Mirae Asset Daewoo Co. Ltd. | | | 146,451 | | | | 1,272,666 | | |
Samsung Life Insurance Co. Ltd. | | | 9,223 | | | | 671,582 | | |
Samsung Securities Co. Ltd. | | | 22,549 | | | | 839,645 | | |
Shinhan Financial Group Co. Ltd. | | | 55,972 | | | | 1,651,388 | | |
Woori Financial Group, Inc. | | | 195,135 | | | | 1,747,826 | | |
| | | | 15,303,968 | | |
Health Care (0.4%): | |
Alteogen, Inc. (a) | | | 2,078 | | | | 343,751 | | |
Seegene, Inc. | | | 3,363 | | | | 597,495 | | |
Shin Poong Pharmaceutical Co. Ltd. (a) | | | 2,854 | | | | 325,781 | | |
| | | | 1,267,027 | | |
Industrials (2.5%): | |
GS Engineering & Construction Corp. | | | 49,075 | | | | 1,707,664 | | |
Hanwha Corp. | | | 55,009 | | | | 1,433,080 | | |
Hyundai Glovis Co. Ltd. | | | 3,509 | | | | 594,362 | | |
Hyundai Heavy Industries Holdings Co. Ltd. | | | 3,216 | | | | 839,304 | | |
LG Corp. | | | 21,935 | | | | 1,766,835 | | |
Lotte Corp. | | | 18,009 | | | | 585,214 | | |
| | | | 6,926,459 | | |
Information Technology (1.8%): | |
LG Innotek Co. Ltd. | | | 4,397 | | | | 738,702 | | |
Samsung Electronics Co. Ltd. | | | 31,157 | | | | 2,323,223 | | |
SK Hynix, Inc. | | | 18,163 | | | | 1,981,327 | | |
| | | | 5,043,252 | | |
Materials (3.1%): | |
Hanwha Chemical Corp. | | | 30,202 | | | | 1,331,746 | | |
Hyundai Steel Co. | | | 41,659 | | | | 1,518,638 | | |
Kumho Petrochemical Co. Ltd. | | | 10,313 | | | | 1,376,586 | | |
Lotte Chemical Corp. | | | 7,103 | | | | 1,804,684 | | |
POSCO | | | 8,024 | | | | 2,009,139 | | |
SK Chemicals Co. Ltd. (a) | | | 1,443 | | | | 521,382 | | |
| | | | 8,562,175 | | |
Utilities (1.4%): | |
Korea Electric Power Corp. | | | 90,930 | | | | 2,293,549 | | |
Korea Gas Corp. | | | 61,287 | | | | 1,743,320 | | |
| | | | 4,036,869 | | |
| | | | 67,194,673 | | |
See notes to financial statements.
40
Victory Portfolios II
VictoryShares USAA MSCI Emerging Markets Value
Momentum ETF | | Schedule of Portfolio Investments — continued
December 31, 2020 | |
(Unaudited)
Security Description | | Shares | | Value | |
Luxembourg (0.6%): | |
Financials (0.6%): | |
Reinet Investments SCA | | | 84,212 | | | $ | 1,580,098 | | |
Malaysia (1.6%): | |
Consumer Staples (0.6%): | |
PPB Group Bhd | | | 378,351 | | | | 1,741,967 | | |
Health Care (1.0%): | |
Hartalega Holdings Bhd | | | 291,700 | | | | 880,357 | | |
Kossan Rubber Industries | | | 614,200 | | | | 687,110 | | |
Supermax Corp. Bhd (a) | | | 303,900 | | | | 454,056 | | |
Top Glove Corp. Bhd | | | 543,600 | | | | 827,056 | | |
| | | | 2,848,579 | | |
| | | | 4,590,546 | | |
Mexico (0.6%): | |
Consumer Staples (0.3%): | |
Gruma SAB de CV, Class B | | | 74,557 | | | | 886,542 | | |
Financials (0.3%): | |
Grupo Financiero Banorte SAB de CV, Class O (a) | | | 126,592 | | | | 698,414 | | |
| | | | 1,584,956 | | |
Philippines (0.2%): | |
Communication Services (0.2%): | |
PLDT, Inc. | | | 24,785 | | | | 691,576 | | |
Poland (2.8%): | |
Communication Services (1.0%): | |
Cyfrowy Polsat SA | | | 217,830 | | | | 1,770,234 | | |
Orange Polska SA (a) | | | 616,145 | | | | 1,089,747 | | |
| | | | 2,859,981 | | |
Consumer Staples (0.5%): | |
Dino Polska SA (a) (c) | | | 18,156 | | | | 1,410,184 | | |
Energy (0.5%): | |
Polskie Gornictwo Naftowe i Gazownictwo SA | | | 875,304 | | | | 1,301,915 | | |
Materials (0.5%): | |
KGHM Polska Miedz SA (a) | | | 32,129 | | | | 1,577,994 | | |
Utilities (0.3%): | |
PGE Polska Grupa Energetyczna SA (a) | | | 482,127 | | | | 841,070 | | |
| | | | 7,991,144 | | |
Russian Federation (3.8%): | |
Communication Services (0.3%): | |
Yandex NV, Class A (a) | | | 11,688 | | | | 814,888 | | |
See notes to financial statements.
41
Victory Portfolios II
VictoryShares USAA MSCI Emerging Markets Value
Momentum ETF | | Schedule of Portfolio Investments — continued
December 31, 2020 | |
(Unaudited)
Security Description | | Shares | | Value | |
Energy (1.1%): | |
Gazprom PJSC | | | 629,690 | | | $ | 1,810,719 | | |
Surgutneftegas PJSC | | | 2,479,668 | | | | 1,211,264 | | |
| | | | 3,021,983 | | |
Financials (0.9%): | |
Moscow Exchange MICEX PJSC | | | 973,044 | | | | 2,099,235 | | |
Sberbank of Russia PJSC | | | 169,114 | | | | 619,849 | | |
| | | | 2,719,084 | | |
Materials (1.0%): | |
MMC Norilsk Nickel PJSC | | | 2,741 | | | | 878,135 | | |
Polymetal International PLC | | | 26,947 | | | | 632,102 | | |
Polyus PJSC | | | 6,072 | | | | 1,249,875 | | |
| | | | 2,760,112 | | |
Utilities (0.5%): | |
Inter RAO UES PJSC | | | 20,671,105 | | | | 1,484,704 | | |
| | | | 10,800,771 | | |
South Africa (2.8%): | |
Communication Services (0.2%): | |
MTN Group Ltd. | | | 112,973 | | | | 462,929 | | |
Energy (0.2%): | |
Exxaro Resources Ltd. | | | 75,179 | | | | 710,909 | | |
Health Care (0.4%): | |
Aspen Pharmacare Holdings Ltd. (a) | | | 125,942 | | | | 1,074,928 | | |
Materials (2.0%): | |
African Rainbow Minerals Ltd. | | | 37,943 | | | | 676,548 | | |
AngloGold Ashanti Ltd. | | | 15,866 | | | | 369,972 | | |
Gold Fields Ltd. | | | 31,664 | | | | 296,555 | | |
Harmony Gold Mining Co. Ltd. (a) | | | 140,243 | | | | 683,611 | | |
Impala Platinum Holdings Ltd. | | | 64,424 | | | | 885,522 | | |
Northam Platinum Ltd. (a) | | | 80,966 | | | | 1,154,952 | | |
Sasol Ltd. (a) | | | 75,908 | | | | 692,119 | | |
Sibanye Stillwater Ltd. | | | 218,883 | | | | 894,084 | | |
| | | | 5,653,363 | | |
| | | | 7,902,129 | | |
Taiwan (10.0%): | |
Financials (2.6%): | |
E.Sun Financial Holding Co. Ltd. | | | 1,282,078 | | | | 1,165,816 | | |
Shin Kong Financial Holding Co. Ltd. | | | 6,147,000 | | | | 1,927,364 | | |
Taiwan Cooperative Financial Holding Co. Ltd. | | | 2,298,199 | | | | 1,664,472 | | |
Yuanta Financial Holding Co. Ltd. | | | 3,499,656 | | | | 2,559,539 | | |
| | | | 7,317,191 | | |
Health Care (0.1%): | |
Oneness Biotech Co. Ltd. (a) | | | 31,000 | | | | 265,891 | | |
See notes to financial statements.
42
Victory Portfolios II
VictoryShares USAA MSCI Emerging Markets Value
Momentum ETF | | Schedule of Portfolio Investments — continued
December 31, 2020 | |
(Unaudited)
Security Description | | Shares | | Value | |
Industrials (0.5%): | |
Evergreen Marine Corp. Ltd. (a) | | | 959,000 | | | $ | 1,389,113 | | |
Information Technology (5.4%): | |
ASMedia Technology, Inc. | | | 7,000 | | | | 391,131 | | |
Asustek Computer, Inc. | | | 122,000 | | | | 1,087,658 | | |
Compal Electronics, Inc. (d) | | | 2,176,000 | | | | 1,603,075 | | |
Foxconn Technology Co. Ltd. | | | 1,200,000 | | | | 2,280,589 | | |
Innolux Corp. | | | 2,082,000 | | | | 1,044,779 | | |
MediaTek, Inc. | | | 62,000 | | | | 1,648,302 | | |
Pegatron Corp. | | | 359,000 | | | | 859,873 | | |
Realtek Semiconductor Corp. | | | 46,000 | | | | 639,298 | | |
Synnex Technology International Corp. | | | 691,000 | | | | 1,155,847 | | |
United Microelectronics Corp. | | | 1,566,142 | | | | 2,628,073 | | |
Wistron Corp. | | | 1,527,000 | | | | 1,684,711 | | |
| | | | 15,023,336 | | |
Materials (0.8%): | |
Asia Cement Corp. | | | 664,500 | | | | 1,021,653 | | |
Taiwan Cement Corp. (d) | | | 765,069 | | | | 1,176,275 | | |
| | | | 2,197,928 | | |
Real Estate (0.6%): | |
Ruentex Development Co. Ltd. | | | 1,230,000 | | | | 1,790,412 | | |
| | | | 27,983,871 | | |
Thailand (1.3%): | |
Consumer Staples (0.8%): | |
Charoen Pokphand Foods PCL | | | 1,736,500 | | | | 1,550,446 | | |
Thai Union Group PCL | | | 1,808,200 | | | | 820,812 | | |
| | | | 2,371,258 | | |
Information Technology (0.5%): | |
Delta Electronics Thailand PCL | | | 82,650 | | | | 1,340,718 | | |
| | | | 3,711,976 | | |
Turkey (4.6%): | |
Communication Services (0.6%): | |
Turkcell Iletisim Hizmetleri A/S | | | 717,800 | | | | 1,554,871 | | |
Consumer Staples (0.3%): | |
BIM Birlesik Magazalar A/S | | | 85,922 | | | | 872,803 | | |
Financials (2.5%): | |
Akbank TAS (a) | | | 741,978 | | | | 691,814 | | |
Haci Omer Sabanci Holding A/S | | | 1,192,155 | | | | 1,838,156 | | |
Turkiye Garanti Bankasi A/S (a) | | | 1,058,627 | | | | 1,477,022 | | |
Turkiye Is Bankasi A/S (a) | | | 1,562,295 | | | | 1,471,384 | | |
Yapi ve Kredi Bankasi A/S (a) | | | 3,657,786 | | | | 1,515,773 | | |
| | | | 6,994,149 | | |
See notes to financial statements.
43
Victory Portfolios II
VictoryShares USAA MSCI Emerging Markets Value
Momentum ETF | | Schedule of Portfolio Investments — continued
December 31, 2020 | |
(Unaudited)
Security Description | | Shares | | Value | |
Industrials (0.9%): | |
Aselsan Elektronik Sanayi Ve Ticaret A/S | | | 498,562 | | | $ | 1,224,185 | | |
Turk Hava Yollari AO (a) | | | 736,017 | | | | 1,278,437 | | |
| | | | 2,502,622 | | |
Materials (0.3%): | |
Eregli Demir ve Celik Fabrikalari TAS | | | 446,708 | | | | 897,323 | | |
| | | | 12,821,768 | | |
United Arab Emirates (0.3%): | |
Real Estate (0.3%): | |
Aldar Properties PJSC | | | 892,051 | | | | 765,000 | | |
Total Common Stocks (Cost $243,620,917) | | | 275,450,761 | | |
Collateral for Securities Loaned^ (0.8%) | |
United States (0.8%): | |
BlackRock Liquidity Funds TempFund Portfolio, Institutional Class, 0.08% (h) | | | 37,260 | | | | 37,260 | | |
Fidelity Investments Money Market Government Portfolio I Shares, 0.01% (h) | | | 1,280,096 | | | | 1,280,096 | | |
Goldman Sachs Financial Square Prime Obligations Fund, Institutional
Class, 0.04% (h) | | | 18,595 | | | | 18,595 | | |
JPMorgan Prime Money Market Fund, Capital Class, 0.12% (h) | | | 148,267 | | | | 148,267 | | |
Morgan Stanley Institutional Liquidity Prime Portfolio,
Institutional Class, 0.09% (h) | | | 666,638 | | | | 666,638 | | |
Total Collateral for Securities Loaned (Cost $2,150,856) | | | 2,150,856 | | |
Total Investments (Cost $245,771,773) — 99.0% | | | 277,601,617 | | |
Other assets in excess of liabilities — 1.0% | | | 2,903,401 | | |
NET ASSETS — 100.00% | | $ | 280,505,018 | | |
^ Purchased with cash collateral from securities on loan.
(a) Non-income producing security.
(b) All or a portion of this security is on loan.
(c) Rule 144A security or other security that is restricted as to resale to institutional investors. The Fund's Adviser has deemed this security to be liquid based upon procedures approved by the Board of Trustees. As of December 31, 2020, the fair value of these securities was $12,066,214 and amounted to 4.3% of net assets.
(d) All or a portion of this security has been segregated as collateral for derivative instruments.
(e) Amount represents less than 0.05% of net assets.
(f) The Fund's Adviser has deemed this security to be illiquid based upon procedures approved by the Board of Trustees. As of December 31, 2020, illiquid securities were less than 0.05% of the Fund's net assets..
(g) Security was fair valued based upon procedures approved by the Board of Trustees and represents less than 0.05% of the Fund's net assets as of December 31, 2020. This security is classified as Level 3 within the fair value hierarchy. (See Note 2)
(h) Rate disclosed is the daily yield on December 31, 2020.
ADR — American Depositary Receipt
See notes to financial statements.
44
Victory Portfolios II
VictoryShares USAA MSCI Emerging Markets Value
Momentum ETF | | Schedule of Portfolio Investments — continued
December 31, 2020 | |
(Unaudited)
PCL — Public Company Limited
PLC — Public Limited Company
Futures Contracts Purchased
| | | Number of
Contracts | | Expiration
Date | | Notional
Amount | | Value | | Unrealized
Appreciation
(Depreciation) | |
E-Mini MSCI Emerging Markets
Index Futures | | | 58 | | | 3/19/21 | | $ | 3,674,689 | | | $ | 3,735,780 | | | $ | 61,091 | | |
| | | Total unrealized appreciation | | | | | | | | $ | 61,091 | | |
| | | Total unrealized depreciation | | | | | | | | | — | | |
| | | Total net unrealized appreciation (depreciation) | | | | | | | | $ | 61,091 | | |
See notes to financial statements.
45
Victory Portfolios II | | Statements of Assets and Liabilities
December 31, 2020 | |
(Unaudited)
| | | VictoryShares
USAA MSCI
USA Value
Momentum
ETF | | VictoryShares
USAA MSCI
USA Small
Cap Value
Momentum
ETF | |
ASSETS: | |
Affiliated investments, at value (Cost $— and $317,512) | | $ | — | | | $ | 469,380 | | |
Unaffiliated investments, at value
(Cost $447,202,479 and $236,073,643) | | | 512,719,205 | (a) | | | 294,123,757 | (b) | |
Cash and cash equivalents | | | 1,146,888 | | | | 1,250,417 | | |
Deposit with brokers for futures contracts | | | 276,086 | | | | 143,891 | | |
Receivables: | |
Interest and dividends | | | 609,948 | | | | 351,596 | | |
Variation margin on open futures contracts | | | 9,846 | | | | — | | |
From Adviser | | | 15,156 | | | | — | | |
Prepaid expenses | | | 7,085 | | | | 3,540 | | |
Total Assets | | | 514,784,214 | | | | 296,342,581 | | |
LIABILITIES: | |
Payables: | |
Collateral received on loaned securities | | | 6,829,332 | | | | 13,124,259 | | |
Variation margin on open futures contracts | | | — | | | | 1,190 | | |
Accrued expenses and other payables: | |
Investment advisory fees | | | 64,662 | | | | 35,753 | | |
Administration fees | | | 8,734 | | | | 4,960 | | |
Custodian fees | | | 2,573 | | | | 412 | | |
Compliance fees | | | 293 | | | | 142 | | |
Trustees' fees | | | 1,049 | | | | 111 | | |
Other accrued expenses | | | 33,315 | | | | 24,056 | | |
Total Liabilities | | | 6,939,958 | | | | 13,190,883 | | |
NET ASSETS: | |
Capital | | | 484,691,211 | | | | 236,765,139 | | |
Total accumulated earnings/(loss) | | | 23,153,045 | | | | 46,386,559 | | |
Net Assets | | $ | 507,844,256 | | | $ | 283,151,698 | | |
Shares Outstanding (unlimited shares authorized, no par value): | | | 9,250,000 | | | | 4,750,000 | | |
Net asset value: | | $ | 54.90 | | | $ | 59.61 | | |
(a) Includes $6,704,638 of securities on loan.
(b) Includes $12,506,058 of securities on loan.
See notes to financial statements.
46
Victory Portfolios II | | Statements of Assets and Liabilities
December 31, 2020 | |
(Unaudited)
| | | VictoryShares
USAA MSCI
International
Value
Momentum
ETF | | VictoryShares
USAA MSCI
Emerging
Markets
Value
Momentum
ETF | |
ASSETS: | |
Investments, at value (Cost $369,856,550
and $245,771,773) | | $ | 419,169,936 | (a) | | $ | 277,601,617 | (b) | |
Foreign currency, at value (Cost $122,458 and $216,872) | | | 122,513 | | | | 216,332 | | |
Cash and cash equivalents | | | 1,425,202 | | | | 1,770,560 | | |
Deposit with brokers for futures contracts | | | 445,148 | | | | 318,711 | | |
Receivables: | |
Interest and dividends | | | 387,927 | | | | 1,535,075 | | |
Investments sold | | | — | | | | 2,695,762 | | |
Reclaims | | | 502,587 | | | | 3,582 | | |
From Adviser | | | 7,796 | | | | 12,433 | | |
Prepaid expenses | | | 5,073 | | | | 2,818 | | |
Total Assets | | | 422,066,182 | | | | 284,156,890 | | |
LIABILITIES: | |
Payables: | |
Collateral received on loaned securities | | | 1,697,073 | | | | 2,150,856 | | |
Investments purchased | | | — | | | | 1,232,828 | | |
Variation margin on open futures contracts | | | 15,218 | | | | 1,193 | | |
Accrued foreign capital gains taxes | | | — | | | | 167,012 | | |
Accrued expenses and other payables: | |
Investment advisory fees | | | 87,008 | | | | 68,918 | | |
Administration fees | | | 7,228 | | | | 4,886 | | |
Custodian fees | | | — | | | | 7,813 | | |
Compliance fees | | | 249 | | | | 163 | | |
Trustees' fees | | | 1,145 | | | | 685 | | |
Other accrued expenses | | | 30,772 | | | | 17,518 | | |
Total Liabilities | | | 1,838,693 | | | | 3,651,872 | | |
NET ASSETS: | |
Capital | | | 444,619,981 | | | | 289,287,415 | | |
Total accumulated earnings/(loss) | | | (24,392,492 | ) | | | (8,782,397 | ) | |
Net Assets | | $ | 420,227,489 | | | $ | 280,505,018 | | |
Shares Outstanding (unlimited shares authorized, no par value): | | | 9,200,000 | | | | 6,150,000 | | |
Net asset value: | | $ | 45.68 | | | $ | 45.61 | | |
(a) Includes $1,611,641 of securities on loan.
(b) Includes $1,986,646 of securities on loan.
See notes to financial statements.
47
Victory Portfolios II | | Statements of Operations
For the Six Months Ended December 31, 2020 | |
(Unaudited)
| | | VictoryShares
USAA MSCI
USA Value
Momentum
ETF | | VictoryShares
USAA MSCI
USA Small
Cap Value
Momentum
ETF | |
Investment Income: | |
Dividends | | $ | 4,682,901 | | | $ | 2,447,559 | | |
Affiliated dividend income | | | — | | | | 2,579 | | |
Interest | | | 134 | | | | — | (a) | |
Securities lending (net of fees) | | | 11,906 | | | | 141,259 | | |
Foreign tax withholding | | | (1,341 | ) | | | (1,674 | ) | |
Total Income | | | 4,693,600 | | | | 2,589,723 | | |
Expenses: | |
Investment advisory fees | | | 365,661 | | | | 195,068 | | |
Administration fees | | | 147,409 | | | | 78,603 | | |
Sub-Administration fees | | | 8,754 | | | | 8,854 | | |
Custodian fees | | | 9,912 | | | | 6,206 | | |
Servicing fees | | | 1,605 | | | | 1,605 | | |
Trustees' fees | | | 19,681 | | | | 10,223 | | |
Compliance fees | | | 2,187 | | | | 1,132 | | |
Legal and audit fees | | | 25,126 | | | | 15,843 | | |
State registration fees | | | 184 | | | | 706 | | |
Other expenses | | | 80,450 | | | | 47,296 | | |
Total Expenses | | | 660,969 | | | | 364,536 | | |
Expenses waived/reimbursed by Adviser | | | (171,866 | ) | | | (48,002 | ) | |
Net Expenses | | | 489,103 | | | | 316,534 | | |
Net Investment Income (Loss) | | | 4,204,497 | | | | 2,273,189 | | |
Realized/Unrealized Gains (Losses) from Investments: | |
Net realized gains (losses) from unaffiliated investment securities | | | (7,229,482 | ) | | | (7,051,267 | ) | |
Net realized gains (losses) from affiliated investment securities | | | — | | | | 9,033 | | |
Net realized gains (losses) from futures contracts | | | 225,049 | | | | 373,855 | | |
Net realized gains (losses) from in-kind redemptions | | | 24,905,197 | | | | 22,038,847 | | |
Net change in unrealized appreciation/depreciation on unaffiliated
investment securities | | | 76,156,997 | | | | 55,027,844 | | |
Net change in unrealized appreciation/depreciation on affiliated
investment securities | | | — | | | | 141,878 | | |
Net change in unrealized appreciation/depreciation on futures
contracts | | | 52,175 | | | | 16,166 | | |
Net realized/unrealized gains (losses) on investments | | | 94,109,936 | | | | 70,556,356 | | |
Change in net assets resulting from operations | | $ | 98,314,433 | | | $ | 72,829,545 | | |
(a) Amount is less than $1.
See notes to financial statements.
48
Victory Portfolios II | | Statements of Operations
For the Six Months Ended December 31, 2020 | |
(Unaudited)
| | | VictoryShares
USAA MSCI
International
Value
Momentum
ETF | | VictoryShares
USAA MSCI
Emerging
Markets
Value
Momentum
ETF | |
Investment Income: | |
Dividends | | $ | 4,960,294 | | | $ | 4,559,664 | | |
Interest | | | — | | | | — | (a) | |
Securities lending (net of fees) | | | 49,008 | | | | 13,910 | | |
Foreign tax withholding | | | (425,874 | ) | | | (738,533 | ) | |
Total Income | | | 4,583,428 | | | | 3,835,041 | | |
Expenses: | |
Investment advisory fees | | | 450,901 | | | | 319,334 | | |
Administration fees | | | 108,946 | | | | 64,204 | | |
Sub-Administration fees | | | 8,754 | | | | 9,723 | | |
Custodian fees | | | 50,608 | | | | 105,869 | | |
Servicing fees | | | 2,140 | | | | 2,140 | | |
Trustees' fees | | | 14,161 | | | | 7,964 | | |
Compliance fees | | | 1,575 | | | | 881 | | |
Legal and audit fees | | | 21,387 | | | | 17,963 | | |
State registration fees | | | 457 | | | | 610 | | |
Line of credit fees | | | 119 | | | | 249 | | |
Other expenses | | | 76,619 | | | | 45,115 | | |
Total Expenses | | | 735,667 | | | | 574,052 | | |
Expenses waived/reimbursed by Adviser | | | (101,526 | ) | | | (92,074 | ) | |
Net Expenses | | | 634,141 | | | | 481,978 | | |
Net Investment Income (Loss) | | | 3,949,287 | | | | 3,353,062 | | |
Realized/Unrealized Gains (Losses) from Investments: | |
Net realized gains (losses) from investment securities and foreign
currency translations | | | (3,668,252 | ) | | | (4,438,516 | ) | |
Foreign taxes on realized gains | | | — | | | | (8,619 | ) | |
Net realized gains (losses) from futures contracts | | | 280,399 | | | | 293,079 | | |
Net realized gains (losses) from in-kind redemptions | | | 953,111 | | | | — | | |
Net change in unrealized appreciation/depreciation on investment
securities and foreign currency translations | | | 66,002,621 | | | | 48,814,434 | | |
Net change in unrealized appreciation/depreciation on futures
contracts | | | 20,315 | | | | 54,695 | | |
Net change in accrued foreign taxes on unrealized gains | | | — | | | | (132,174 | ) | |
Net realized/unrealized gains (losses) on investments | | | 63,588,194 | | | | 44,582,899 | | |
Change in net assets resulting from operations | | $ | 67,537,481 | | | $ | 47,935,961 | | |
(a) Rounds to less than $1.
See notes to financial statements.
49
Victory Portfolios II | | Statements of Changes in Net Assets | |
| | | VictoryShares USAA MSCI
USA Value Momentum ETF | | VictoryShares USAA MSCI
USA Small Cap Value
Momentum ETF | |
| | | Six
Months
Ended
December 31,
2020
(unaudited) | | Ten
Months
Ended
June 30,
2020 | | Six
Months
Ended
December 31,
2020
(unaudited) | | Ten
Months
Ended
June 30,
2020 | |
From Investment Activities: | |
Operations: | |
Net investment income (loss) | | $ | 4,204,497 | | | $ | 7,103,288 | | | $ | 2,273,189 | | | $ | 2,564,386 | | |
Net realized gains (losses)
from investments | | | 17,900,764 | | | | (20,581,789 | ) | | | 15,370,468 | | | | (13,107,994 | ) | |
Net change in unrealized
appreciation/depreciation
on investments | | | 76,209,172 | | | | (20,402,540 | ) | | | 55,185,888 | | | | 1,777,086 | | |
Change in net assets resulting
from operations | | | 98,314,433 | | | | (33,881,041 | ) | | | 72,829,545 | | | | (8,766,522 | ) | |
Change in net assets resulting
from distributions to shareholders | | | (4,810,103 | ) | | | (9,133,011 | ) | | | (2,811,261 | ) | | | (2,906,435 | ) | |
Change in net assets resulting
from capital transactions | | | (50,007,424 | ) | | | 38,916,833 | | | | (26,113,915 | ) | | | 149,356,462 | | |
Change in net assets | | | 43,496,906 | | | | (4,097,219 | ) | | | 43,904,369 | | | | 137,683,505 | | |
Net Assets: | |
Beginning of period | | | 464,347,350 | | | | 468,444,569 | | | | 239,247,329 | | | | 101,563,824 | | |
End of period | | $ | 507,844,256 | | | $ | 464,347,350 | | | $ | 283,151,698 | | | $ | 239,247,329 | | |
Capital Transactions: | |
Proceeds from shares issued | | | 53,383,369 | | | | 71,638,748 | | | | 36,473,058 | | | | 163,170,156 | | |
Cost of shares redeemed | | | (103,390,793 | ) | | | (32,721,915 | ) | | | (62,586,973 | ) | | | (13,813,694 | ) | |
Change in net assets resulting
from capital transactions | | | (50,007,424 | ) | | | 38,916,833 | | | | (26,113,915 | ) | | | 149,356,462 | | |
Share Transactions: | |
Issued | | | 1,000,000 | | | | 1,600,000 | | | | 650,000 | | | | 3,500,000 | | |
Redeemed | | | (2,000,000 | ) | | | (650,000 | ) | | | (1,150,000 | ) | | | (300,000 | ) | |
Change in Shares | | | (1,000,000 | ) | | | 950,000 | | | | (500,000 | ) | | | 3,200,000 | | |
See notes to financial statements.
50
Victory Portfolios II | | Statements of Changes in Net Assets | |
| | | VictoryShares USAA MSCI
International Value
Momentum ETF | | VictoryShares USAA MSCI
Emerging Markets Value
Momentum ETF | |
| | | Six
Months
Ended
December 31,
2020
(unaudited) | | Ten
Months
Ended
June 30,
2020 | | Six
Months
Ended
December 31,
2020
(unaudited) | | Ten
Months
Ended
June 30,
2020 | |
From Investment Activities: | |
Operations: | |
Net investment income (loss) | | $ | 3,949,287 | | | $ | 6,509,609 | | | $ | 3,353,062 | | | $ | 3,096,908 | | |
Net realized gains (losses)
from investments | | | (2,434,742 | ) | | | (23,248,529 | ) | | | (4,154,056 | ) | | | (12,738,828 | ) | |
Net change in unrealized
appreciation/depreciation
on investments | | | 66,022,936 | | | | (7,483,957 | ) | | | 48,736,955 | | | | 542,073 | | |
Change in net assets resulting
from operations | | | 67,537,481 | | | | (24,222,877 | ) | | | 47,935,961 | | | | (9,099,847 | ) | |
Change in net assets resulting
from distributions to shareholders | | | (3,649,684 | ) | | | (9,567,813 | ) | | | (4,493,007 | ) | | | (5,048,334 | ) | |
Change in net assets resulting
from capital transactions | | | 41,335,528 | | | | 25,101,890 | | | | 72,170,056 | | | | 9,988,737 | | |
Change in net assets | | | 105,223,325 | | | | (8,688,800 | ) | | | 115,613,010 | | | | (4,159,444 | ) | |
Net Assets: | |
Beginning of period | | | 315,004,164 | | | | 323,692,964 | | | | 164,892,008 | | | | 169,051,452 | | |
End of period | | $ | 420,227,489 | | | $ | 315,004,164 | | | $ | 280,505,018 | | | $ | 164,892,008 | | |
Capital Transactions: | |
Proceeds from shares issued | | | 45,457,494 | | | | 27,200,006 | | | | 72,170,056 | | | | 13,413,426 | | |
Cost of shares redeemed | | | (4,121,966 | ) | | | (2,098,116 | ) | | | — | | | | (3,424,689 | ) | |
Change in net assets resulting
from capital transactions | | | 41,335,528 | | | | 25,101,890 | | | | 72,170,056 | | | | 9,988,737 | | |
Share Transactions: | |
Issued | | | 1,100,000 | | | | 750,000 | | | | 1,800,000 | | | | 350,000 | | |
Redeemed | | | (100,000 | ) | | | (50,000 | ) | | | — | | | | (100,000 | ) | |
Change in Shares | | | 1,000,000 | | | | 700,000 | | | | 1,800,000 | | | | 250,000 | | |
See notes to financial statements.
51
Victory Portfolios II | | Financial Highlights | |
For a Share Outstanding Throughout Each Period
| | | | Investment Activities | | Distributions to
Shareholders From | | | |
| | | Net Asset
Value,
Beginning of
Period | | Net
Investment
Income (Loss)(a) | | Net Realized
and Unrealized
Gains (Losses)
on Investments | | Total from
Investment
Activities | | Net
Investment
Income | | Total
Distributions | | Net Asset
Value,
End of
Period | | Total
Return(b) | |
VictoryShares USAA MSCI USA Value Momentum ETF | |
Six Months Ended
12/31/20
(unaudited) | | $ | 45.30 | | | | 0.43 | | | | 9.67 | | | | 10.10 | | | | (0.50 | ) | | | (0.50 | ) | | $ | 54.90 | | | | 22.39 | % | |
Ten Months Ended
6/30/20(e) | | $ | 50.37 | | | | 0.72 | | | | (4.85 | )(g) | | | (4.13 | ) | | | (0.94 | ) | | | (0.94 | ) | | $ | 45.30 | | | | (8.31 | )% | |
Year Ended 8/31/19 | | $ | 53.85 | | | | 1.00 | | | | (3.59 | ) | | | (2.59 | ) | | | (0.89 | ) | | | (0.89 | ) | | $ | 50.37 | | | | (4.79 | )% | |
10/24/17(f) through
8/31/18 | | $ | 50.19 | | | | 0.78 | | | | 3.34 | | | | 4.12 | | | | (0.46 | ) | | | (0.46 | ) | | $ | 53.85 | | | | 8.23 | % | |
VictoryShares USAA MSCI USA Small Cap Value Momentum ETF | |
Six Months Ended
12/31/20
(unaudited) | | $ | 45.57 | | | | 0.45 | | | | 14.16 | | | | 14.61 | | | | (0.57 | ) | | | (0.57 | ) | | $ | 59.61 | | | | 32.19 | % | |
Ten Months Ended
6/30/20(e) | | $ | 49.54 | | | | 0.60 | | | | (3.74 | ) | | | (3.14 | ) | | | (0.83 | ) | | | (0.83 | ) | | $ | 45.57 | | | | (6.44 | )% | |
Year Ended 8/31/19 | | $ | 57.21 | | | | 1.00 | | | | (7.86 | ) | | | (6.86 | ) | | | (0.81 | ) | | | (0.81 | ) | | $ | 49.54 | | | | (11.99 | )% | |
10/24/17(f) through
8/31/18 | | $ | 50.13 | | | | 0.57 | | | | 6.81 | | | | 7.38 | | | | (0.30 | ) | | | (0.30 | ) | | $ | 57.21 | | | | 14.80 | % | |
(a) Per share net investment income (loss) has been calculated using the average daily shares method.
(b) Not annualized for periods less than one year.
(c) Annualized for periods less than one year.
(d) Excludes impact of in-kind transactions.
(e) The Fund's fiscal year-end changed from August 31 to June 30, effective September 1, 2019. (See Note 1).
(f) Commencement of operations.
(g) The amount shown for a share outstanding throughout the period does not accord with the change in aggregate gains and losses in the portfolio of securities during the period because of the timing of sales and purchases of fund shares in relation to fluctuating market values during the period.
See notes to financial statements.
52
Victory Portfolios II | | Financial Highlights — continued | |
For a Share Outstanding Throughout Each Period
| | | Ratios to Average Net Assets | | Supplemental Data | |
| | | Net
Expenses(c) | | Net
Investment
Income
(Loss)(c) | | Gross
Expenses(c) | | Net Assets,
End of
Period
(000's) | | Portfolio
Turnover(b)(d) | |
VictoryShares USAA MSCI USA Value Momentum ETF | |
Six Months Ended
12/31/20
(unaudited) | | | 0.20 | % | | | 1.72 | % | | | 0.27 | % | | $ | 507,844 | | | | 45 | % | |
Ten Months Ended
6/30/20(e) | | | 0.20 | % | | | 1.80 | % | | | 0.28 | % | | $ | 464,347 | | | | 66 | % | |
Year Ended 8/31/19 | | | 0.20 | % | | | 2.00 | % | | | 0.25 | % | | $ | 468,445 | | | | 87 | % | |
10/24/17(f) through
8/31/18 | | | 0.20 | % | | | 1.76 | % | | | 0.25 | % | | $ | 398,504 | | | | 84 | % | |
VictoryShares USAA MSCI USA Small Cap Value Momentum ETF | |
Six Months Ended
12/31/20
(unaudited) | | | 0.24 | % | | | 1.74 | % | | | 0.28 | % | | $ | 283,152 | | | | 41 | % | |
Ten Months Ended
6/30/20(e) | | | 0.25 | % | | | 1.53 | % | | | 0.31 | % | | $ | 239,247 | | | | 70 | % | |
Year Ended 8/31/19 | | | 0.25 | % | | | 1.98 | % | | | 0.30 | % | | $ | 101,564 | | | | 88 | % | |
10/24/17(f) through
8/31/18 | | | 0.25 | % | | | 1.25 | % | | | 0.30 | % | | $ | 71,517 | | | | 81 | % | |
(continues on next page)
See notes to financial statements.
53
Victory Portfolios II | | Financial Highlights | |
For a Share Outstanding Throughout Each Period
| | | | Investment Activities | | Distributions to
Shareholders From | | | |
| | | Net Asset
Value,
Beginning of
Period | | Net
Investment
Income (Loss)(a) | | Net Realized
and Unrealized
Gains (Losses)
on Investments | | Total from
Investment
Activities | | Net
Investment
Income | | Total
Distributions | | Net Asset
Value,
End of
Period | | Total
Return(b) | |
VictoryShares USAA MSCI International Value Momentum ETF | |
Six Months Ended
12/31/20
(unaudited) | | $ | 38.42 | | | | 0.46 | | | | 7.22 | | | | 7.68 | | | | (0.42 | ) | | | (0.42 | ) | | $ | 45.68 | | | | 20.13 | % | |
Ten Months Ended
6/30/20(e) | | $ | 43.16 | | | | 0.83 | | | | (4.35 | ) | | | (3.52 | ) | | | (1.22 | ) | | | (1.22 | ) | | $ | 38.42 | | | | (8.39 | )% | |
Year Ended 8/31/19 | | $ | 48.10 | | | | 1.30 | | | | (4.99 | ) | | | (3.69 | ) | | | (1.25 | ) | | | (1.25 | ) | | $ | 43.16 | | | | (7.70 | )% | |
10/24/17(f) through
8/31/18 | | $ | 50.08 | | | | 1.34 | | | | (2.64 | ) | | | (1.30 | ) | | | (0.68 | ) | | | (0.68 | ) | | $ | 48.10 | | | | (2.64 | )% | |
VictoryShares USAA MSCI Emerging Markets Value Momentum ETF | |
Six Months Ended
12/31/20
(unaudited) | | $ | 37.91 | | | | 0.65 | | | | 7.98 | | | | 8.63 | | | | (0.93 | ) | | | (0.93 | ) | | $ | 45.61 | | | | 23.06 | % | |
Ten Months Ended
6/30/20(e) | | $ | 41.23 | | | | 0.73 | | | | (2.85 | ) | | | (2.12 | ) | | | (1.20 | ) | | | (1.20 | ) | | $ | 37.91 | | | | (5.47 | )% | |
Year Ended 8/31/19 | | $ | 45.58 | | | | 1.31 | | | | (4.73 | ) | | | (3.42 | ) | | | (0.93 | ) | | | (0.93 | ) | | $ | 41.23 | | | | (7.62 | )% | |
10/24/17(f) through
8/31/18 | | $ | 49.95 | | | | 1.17 | | | | (5.10 | ) | | | (3.93 | ) | | | (0.44 | ) | | | (0.44 | ) | | $ | 45.58 | | | | (7.95 | )% | |
(a) Per share net investment income (loss) has been calculated using the average daily shares method.
(b) Not annualized for periods less than one year.
(c) Annualized for periods less than one year.
(d) Excludes impact of in-kind transactions.
(e) The Fund's fiscal year-end changed from August 31 to June 30, effective September 1, 2019. (See Note 1).
(f) Commencement of operations.
See notes to financial statements.
54
Victory Portfolios II | | Financial Highlights — continued | |
For a Share Outstanding Throughout Each Period
| | | Ratios to Average Net Assets | | Supplemental Data | |
| | | Net
Expenses(c) | | Net
Investment
Income
(Loss)(c) | | Gross
Expenses(c) | | Net Assets,
End of
Period
(000's) | | Portfolio
Turnover(b)(d) | |
VictoryShares USAA MSCI International Value Momentum ETF | |
Six Months Ended
12/31/20
(unaudited) | | | 0.35 | % | | | 2.18 | % | | | 0.41 | % | | $ | 420,227 | | | | 42 | % | |
Ten Months Ended
6/30/20(e) | | | 0.35 | % | | | 2.41 | % | | | 0.41 | % | | $ | 315,004 | | | | 62 | % | |
Year Ended 8/31/19 | | | 0.35 | % | | | 2.90 | % | | | 0.40 | % | | $ | 323,693 | | | | 87 | % | |
10/24/17(f) through
8/31/18 | | | 0.35 | % | | | 3.12 | % | | | 0.40 | % | | $ | 307,836 | | | | 65 | % | |
VictoryShares USAA MSCI Emerging Markets Value Momentum ETF | |
Six Months Ended
12/31/20
(unaudited) | | | 0.45 | % | | | 3.13 | % | | | 0.54 | % | | $ | 280,505 | | | | 40 | % | |
Ten Months Ended
6/30/20(e) | | | 0.45 | % | | | 2.18 | % | | | 0.57 | % | | $ | 164,892 | | | | 51 | % | |
Year Ended 8/31/19 | | | 0.45 | % | | | 3.00 | % | | | 0.50 | % | | $ | 169,051 | | | | 67 | % | |
10/24/17(f) through
8/31/18 | | | 0.45 | % | | | 2.77 | % | | | 0.50 | % | | $ | 154,974 | | | | 58 | % | |
See notes to financial statements.
55
Victory Portfolios II | | Notes to Financial Statements
December 31, 2020 | |
(Unaudited)
1. Organization:
Victory Portfolios II (the "Trust") was organized on April 11, 2012 as a Delaware statutory trust, as a successor to the "Compass EMP Funds Trust." The Trust is registered under the Investment Company Act of 1940, as amended (the "1940 Act"), as an open-end investment company. The Trust is currently comprised of 27 funds, 25 of which are Exchange-Traded Funds ("ETFs"), and is authorized to issue an unlimited number of shares, which are units of beneficial interest with no par value. Each Fund is classified as diversified under the 1940 Act.
The accompanying financial statements are those of the following four Funds (collectively, the "Funds" and individually, a "Fund").
Funds (Legal Name) | | Funds (Short Name) | |
VictoryShares USAA MSCI USA Value
Momentum ETF | | USAA MSCI USA Value Momentum ETF
| |
VictoryShares USAA MSCI USA Small Cap
Value Momentum ETF | | USAA MSCI USA Small Cap Value
Momentum ETF | |
VictoryShares USAA MSCI International
Value Momentum ETF | | USAA MSCI International Value
Momentum ETF | |
VictoryShares USAA MSCI Emerging Markets
Value Momentum ETF | | USAA MSCI Emerging Markets Value
Momentum ETF | |
Effective September 1, 2019, the Board of Trustees (the "Board") approved the fiscal year-end change for the Funds from August 31 to June 30. The accompanying financial statements reflect this change in fiscal year-end.
Under the Trust's organizational documents, its officers and trustees are indemnified against certain liabilities arising out of the performance of their duties to the Funds. In addition, in the normal course of business, the Funds enter into contracts with their vendors and others that provide for general indemnifications. The Funds' maximum exposure under these arrangements is unknown, as this would involve future claims that may be made against the Funds. However, based on experience, the Funds expect that risk of loss to be remote.
2. Significant Accounting Policies:
Shares of the Funds are listed and traded on NYSE Arca, Inc. (the "Exchange"). The Funds issue and redeem shares of a Fund ("Shares") at net asset value ("NAV") only in aggregations of 50,000 Shares (each a "Creation Unit"). The Funds issue and redeem Creation Units principally in exchange for a basket of securities included in the respective Fund's Index (the "Deposit Securities"), together with the deposit of a specified cash payment (the "Cash Component"), plus a transaction fee. Shares will trade on the Exchange at market prices that may be below, at, or above NAV. Shares of a Fund may only be purchased or redeemed by certain financial institutions ("Authorized Participants"). An Authorized Participant is either (i) a broker-dealer or other participant in the clearing process through the Continuous Net Settlement System of the National Securities Clearing Corporation or (ii) a DTC participant and, in each case, must have executed a Participant Agreement with the distributor. Only Authorized Participants may purchase or redeem the shares directly from a Fund. In addition, Shares may be issued in advance of receipt of Deposit Securities subject to various conditions, including a requirement to maintain on deposit with the Trust cash equal to up to 105% of fair value of the missing Deposit Securities. In each instance of such cash creations or redemptions, transaction fees may be imposed and may be higher than the transaction fees associated with in-kind creations or redemptions.
Each Fund may issue an unlimited number of Shares of beneficial interest, with no par value. Shares of each Fund have equal rights and privileges. A purchase (i.e., creation) transaction fee is imposed for the transfer and other transactional costs associated with the purchase of Creation Units. In addition, a variable fee may be charged on all cash transactions or substitutes for Creation Units. Variable fees received by each Fund are displayed in the Capital Share Transaction section of the Statements of Changes in Net Assets as an increase to Capital.
56
Victory Portfolios II | | Notes to Financial Statements — continued
December 31, 2020 | |
(Unaudited)
The Transaction Fees for each Fund are listed below.
| | | Fee for In-Kind and
Cash Purchases and
Redemptions | | Maximum
Additional Variable
Charge for Cash
Purchases and
Redemptions* | |
USAA MSCI USA Value Momentum ETF | | $ | 500 | | | | 2.00 | % | |
USAA MSCI USA Small Cap Value Momentum ETF | | | 750 | | | | 2.00 | % | |
USAA MSCI International Value Momentum ETF | | | 3,000 | | | | 2.00 | % | |
USAA MSCI Emerging Markets Value Momentum ETF | | | 5,500 | | | | 2.00 | % | |
* As a percentage of the amount invested.
The following is a summary of significant accounting policies followed by the Trust in the preparation of its financial statements. The policies are in conformity with Generally Accepted Accounting Principles in the United States of America ("GAAP"). The preparation of financial statements in accordance with GAAP requires management to make estimates and assumptions that affect the reported amounts of assets and liabilities and disclosure of contingent assets and liabilities at the date of the financial statements and the reported amounts of income and expenses for the period. Actual results could differ from those estimates. The Funds follow the specialized accounting and reporting requirements under GAAP that are applicable to investment companies.
Investment Valuation:
The Funds record investments at fair value. Fair value is defined as the price that would be received to sell an asset or paid to transfer a liability in an orderly transaction between market participants at the measurement date.
The valuation techniques described below maximize the use of observable inputs and minimize the use of unobservable inputs in determining fair value. The inputs used for valuing the Funds' investments are summarized in the three broad levels listed below:
• Level 1 — quoted prices in active markets for identical securities
• Level 2 — other significant observable inputs (including quoted prices for similar securities or interest rates applicable to those securities, etc.)
• Level 3 — significant unobservable inputs (including the Funds' own assumptions in determining the fair value of investments)
Changes in valuation techniques may result in transfers in or out of an assigned level within the disclosure hierarchy. The inputs or methodologies used for valuation techniques are not necessarily an indication of the risk associated with entering into those investments.
Portfolio securities listed or traded on securities exchanges, including American Depositary Receipts ("ADRs") and Rights, are valued at the closing price on the exchange or system where the security is principally traded, if available, or at the Nasdaq Official Closing Price. If there have been no sales for that day on the exchange or system, then a security is valued at the last available bid quotation on the exchange or system where the security is principally traded. In each of these situations, valuations are typically categorized as Level 1 in the fair value hierarchy.
Investments in open-end investment companies are valued at NAV. These valuations are typically categorized as Level 1 in the fair value hierarchy. Futures contracts are valued at the settlement price established each day by the board of trade or an exchange on which they are traded. These valuations are typically categorized as Level 1 in the fair value hierarchy.
Investments for which there are no such quotations, or for which quotations do not appear reliable, are valued at fair value in accordance with procedures established by and under the general supervision and responsibility of the Board. These valuations are typically categorized as Level 2 or Level 3 in the fair value hierarchy, based on the observability of inputs used to determine the fair value.
57
Victory Portfolios II | | Notes to Financial Statements — continued
December 31, 2020 | |
(Unaudited)
A summary of the valuations as of December 31, 2020, based upon the three levels defined above, is included in the table below while the breakdown, by category, of investments is disclosed on the Schedules of Portfolio Investments.
| | | Level 1 | | Level 2 | | Level 3 | | Total | |
USAA MSCI USA Value
Momentum ETF | |
Common Stocks | | $ | 505,889,873 | | | $ | — | | | $ | — | | | $ | 505,889,873 | | |
Collateral for Securities Loaned | | | 6,829,332 | | | | — | | | | — | | | | 6,829,332 | | |
Total | | $ | 512,719,205 | | | $ | — | | | $ | — | | | $ | 512,719,205 | | |
Other Financial Investments^: | |
Assets: | |
Futures | | $ | 25,725 | | | $ | — | | | $ | — | | | $ | 25,725 | | |
Total | | $ | 25,725 | | | $ | — | | | $ | — | | | $ | 25,725 | | |
USAA MSCI USA Small Cap
Value Momentum ETF | |
Common Stocks | | $ | 280,823,908 | | | $ | — | | | $ | 640,841 | | | $ | 281,464,749 | | |
Rights | | | — | | | | — | | | | 4,129 | | | | 4,129 | | |
Collateral for Securities Loaned | | | 13,124,259 | | | | — | | | | — | | | | 13,124,259 | | |
Total | | $ | 293,948,167 | | | $ | — | | | $ | 644,970 | | | $ | 294,593,137 | | |
Other Financial Investments^: | |
Assets: | |
Futures | | $ | 12,624 | | | $ | — | | | $ | — | | | $ | 12,624 | | |
Total | | $ | 12,624 | | | $ | — | | | $ | — | | | $ | 12,624 | | |
USAA MSCI International
Value Momentum ETF | |
Common Stocks | | $ | 417,398,686 | | | $ | — | | | $ | — | | | $ | 417,398,686 | | |
Rights | | | 74,177 | | | | — | | | | — | | | | 74,177 | | |
Collateral for Securities Loaned | | | 1,697,073 | | | | — | | | | — | | | | 1,697,073 | | |
Total | | $ | 419,169,936 | | | $ | — | | | $ | — | | | $ | 419,169,936 | | |
Other Financial Investments^: | |
Assets: | |
Futures | | $ | 26,533 | | | $ | — | | | $ | — | | | $ | 26,533 | | |
Total | | $ | 26,533 | | | $ | — | | | $ | — | | | $ | 26,533 | | |
USAA MSCI Emerging Markets
Value Momentum ETF | |
Common Stocks | | $ | 275,446,382 | | | $ | — | | | $ | 4,379 | | | $ | 275,450,761 | | |
Collateral for Securities Loaned | | | 2,150,856 | | | | — | | | | — | | | | 2,150,856 | | |
Total | | $ | 277,597,238 | | | $ | — | | | $ | 4,379 | | | $ | 277,601,617 | | |
Other Financial Investments^: | |
Assets: | |
Futures | | $ | 61,091 | | | $ | — | | | $ | — | | | $ | 61,091 | | |
Total | | $ | 61,091 | | | $ | — | | | $ | — | | | $ | 61,091 | | |
^ Futures contracts are valued at the unrealized appreciation (depreciation) on the investment.
For the six months ended December 31, 2020, there were no transfers in or out of the Level 3 fair value hierarchy.
58
Victory Portfolios II | | Notes to Financial Statements — continued
December 31, 2020 | |
(Unaudited)
Real Estate Investment Trusts ("REITs"):
The Funds may invest in REITs, which report information on the source of their distributions annually. REITs are pooled investment vehicles that invest primarily in income-producing real estate or real- estate related loans or interests (such as mortgages). Certain distributions received from REITs during the year are recorded as realized gains or return of capital as estimated by the Funds or when such information becomes known.
Investment Companies:
Open-End Funds:
The Funds may invest in portfolios of open-end investment companies. These investment traded companies value securities in their portfolios for which market quotations are readily available at their market values (generally the last reported sale price) and all other securities and assets at their fair value by the methods established by the board of directors of the underlying funds.
Derivative Instruments:
Futures Contracts:
The Funds may enter into contracts for the future delivery of securities or foreign currencies and futures contracts based on a specific security, class of securities, foreign currency or an index, and purchase or sell options on any such futures contracts. A futures contract on a securities index is an agreement obligating either party to pay, and entitling the other party to receive, while the contract is outstanding, cash payments based on the level of a specified securities index. No physical delivery of the underlying asset is made. A Fund may enter into futures contracts in an effort to hedge against market risks. The acquisition of put and call options on futures contracts will give the Fund the right (but not the obligation), for a specified price, to sell or to purchase the underlying futures contract, upon exercise of the option, at any time during the option period. Futures transactions involve brokerage costs and require the Fund to segregate assets to cover contracts that would require it to purchase securities or currencies. A good faith margin deposit, known as initial margin, of cash or government securities with a broker or custodian is required to initiate and maintain open positions in futures contracts. Subsequent payments, known as variation margin, are made or received by the Fund based on the change in the market value of the position and are recorded as unrealized appreciation or depreciation until the contract is closed out, at which time the gain or loss is realized. A Fund may lose the expected benefit of futures transactions if interest rates, exchange rates or securities prices change in an unanticipated manner. Such unanticipated changes may also result in lower overall performance than if the Fund had not entered into any futures transactions. In addition, the value of a Fund's futures positions may not prove to be perfectly or even highly correlated with the value of its portfolio securities or foreign currencies, limiting a Fund's ability to hedge effectively against interest rate, exchange rate and/or market risk and giving rise to additional risks. There is no assurance of liquidity in the secondary market for purposes of closing out futures positions. The collateral held by the Funds is presented on the Statements of Assets and Liabilities under Deposit with brokers for futures contracts.
As of the six months ended December 31, 2020, the Funds entered into futures contracts primarily for the strategy of hedging or other purposes, including but not limited to, providing liquidity and equitizing cash.
Offsetting of Financial Assets and Derivatives Assets:
The Funds are subject to various Master Netting Arrangements, which govern the terms of certain transactions with select counterparties. The Master Netting Arrangements allow the Funds to close out and net total exposure to a counterparty in the event of a default with respect to all the transactions governed under a single agreement with a counterparty. The Master Netting Arrangements also specify collateral posting arrangements at pre-arranged exposure levels. Under the Master Netting Arrangements, collateral is routinely transferred if the total net exposure to certain transactions (net of existing collateral already in place) governed under the relevant Master Netting Arrangement with
59
Victory Portfolios II | | Notes to Financial Statements — continued
December 31, 2020 | |
(Unaudited)
a counterparty in a given account exceeds a specified threshold depending on the counterparty and the type of Master Netting Arrangement.
The table below, as of December 31, 2020, discloses both gross information and net information about instruments and transactions eligible for offset on the Statements of Assets and Liabilities and instruments and transactions that are subject to an agreement similar to a master netting agreement as well as amounts related to collateral held at clearing brokers and counterparties.
| | | | | Gross Amounts not offset in the
Statement of Assets and Liabilities | |
| | | Gross Amounts
of Recognized
Assets | | Gross Amounts
Available for
Offset | | Net Amounts
Presented in the
Statements of
Assets and
Liabilities | | Financial
Instruments
for Offset | | Cash
Collateral
Received | | Net
Amount | |
USAA MSCI USA Value
Momentum ETF | |
Goldman Sachs & Co. | | $ | 276,086 | | | $ | — | | | $ | 276,086 | | | $ | — | | | $ | — | | | $ | 276,086 | | |
USAA MSCI USA Small Cap Value
Momentum ETF | |
Goldman Sachs & Co. | | | 143,891 | | | | — | | | | 143,891 | | | | (1,190 | ) | | | — | | | | 142,701 | | |
USAA MSCI International Value
Momentum ETF | |
Goldman Sachs & Co. | | | 445,148 | | | | — | | | | 445,148 | | | | (15,218 | ) | | | — | | | | 429,930 | | |
USAA MSCI Emerging
Markets Value Momentum ETF | |
Goldman Sachs & Co. | | | 318,711 | | | | — | | | | 318,711 | | | | (1,193 | ) | | | — | | | | 317,518 | | |
| | | | | Gross Amounts not offset in the
Statement of Assets and Liabilities | |
| | | Gross Amounts
of Recognized
Liabilities | | Gross Amounts
Available for
Offset | | Net Amounts
Presented in the
Statements of
Assets and
Liabilities | | Financial
Instruments
for Offset | | Cash
Collateral
Pledged* | | Net
Amount | |
USAA MSCI USA Small Cap Value
Momentum ETF | |
Goldman Sachs & Co. | | $ | 1,190 | | | $ | — | | | $ | 1,190 | | | $ | (1,190 | ) | | $ | — | | | $ | — | | |
USAA MSCI International Value
Momentum ETF | |
Goldman Sachs & Co. | | | 15,218 | | | | — | | | | 15,218 | | | | (15,218 | ) | | | — | | | | — | | |
USAA MSCI Emerging Markets
Value Momentum ETF | |
Goldman Sachs & Co. | | | 1,193 | | | | — | | | | 1,193 | | | | (1,193 | ) | | | — | | | | — | | |
* Cash collateral pledged may be in excess of the amounts shown in the table. The total cash collateral pledged by each Fund is disclosed on the Statements of Assets and Liabilities.
60
Victory Portfolios II | | Notes to Financial Statements — continued
December 31, 2020 | |
(Unaudited)
Summary of Derivative Instruments:
The following table summarizes the fair values of derivative instruments on the Statements of Assets and Liabilities, categorized by risk exposure, as of December 31, 2020:
| | | Assets | | Liabilities | |
| | | Variation Margin
Receivable on Open
Futures Contracts* | | Variation Margin
Payable on Open
Futures Contracts* | |
Equity Risk Exposure: | |
USAA MSCI USA Value Momentum ETF | | $ | 25,725 | | | $ | — | | |
USAA MSCI USA Small Cap Value
Momentum ETF | | | 12,624 | | | | — | | |
| | | Assets | | Liabilities | |
| | | Variation Margin
Receivable on Open
Futures Contracts* | | Variation Margin
Payable on Open
Futures Contracts* | |
USAA MSCI International Value
Momentum ETF | | $ | 26,533 | | | $ | — | | |
USAA MSCI Emerging Markets Value
Momentum ETF | | | 61,091 | | | | — | | |
* Includes cumulative appreciation (depreciation) of futures contracts as reported on the Schedules of Portfolio Investments. Only current day's variation margin for futures contracts is reported within the Statements of Assets and Liabilities.
The following tables present the effect of derivative instruments on the Statements of Operations, categorized by risk exposure, for the six months ended December 31, 2020:
| | | Net Realized Gains (Losses)
on Derivatives
Recognized as a
Result from Operations | | Net Change in Unrealized
Appreciation/Depreciation
on Derivatives Recognized
as a Result of Operations | |
| | | Net Realized Gains (Losses)
from Futures Contracts | | Net Change in Unrealized
Appreciation/Depreciation
on Futures Contracts | |
Equity Risk Exposure: | |
USAA MSCI USA Value Momentum ETF | | $ | 225,049 | | | $ | 52,175 | | |
USAA MSCI USA Small Cap Value
Momentum ETF | | | 373,855 | | | | 16,166 | | |
USAA MSCI International Value
Momentum ETF | | | 280,399 | | | | 20,315 | | |
USAA MSCI Emerging Markets Value
Momentum ETF | | | 293,079 | | | | 54,695 | | |
All open derivative positions at period end are reflected on each respective Fund's Schedule of Portfolio Investments. The underlying face value of open derivative positions relative to each Fund's net assets at year end is generally representative of the notional amount of open positions to net assets throughout the period.
Investment Transactions and Related Income:
Changes in holdings of investments are accounted for no later than one business day following the trade date. For financial reporting purposes, however, investment transactions are accounted for on trade date on the last business day of the reporting period. Interest income is determined on the basis of coupon interest accrued using the effective interest method which adjusts, where applicable, the amortization of premiums or accretion of discounts. Dividend income is recorded on the ex-dividend date. Gains or losses realized on sales of securities are recorded on the identified cost basis.
61
Victory Portfolios II | | Notes to Financial Statements — continued
December 31, 2020 | |
(Unaudited)
Withholding taxes on interest, dividends and gains as a result of certain investments in ADRs by the Funds have been provided for in accordance with each investment's applicable country's tax rules and rates.
Securities Lending:
The Trust has entered into a Master Securities Lending Agreement ("MSLA") with Citibank, N.A. ("Citibank" or the "Agent"). Under the terms of the MSLA, the Funds may lend securities to certain broker-dealers and banks in exchange for collateral in the amount of at least 102% of the value of U.S. securities loaned or at least 105% of the value of non-U.S. securities loaned, marked-to-market daily. Any collateral shortfalls associated with increases in the valuation of the securities loaned are adjusted the next business day. The collateral can be received in the form of cash collateral and/or non-cash collateral. Non-cash collateral can include U.S. Government Securities, letters of credit and certificates of deposit. The cash collateral is invested in short-term instruments or cash equivalents, primarily open-end investment companies, as noted on the Funds' Schedules of Portfolio Investments. The Trust does not have effective control of the non-cash collateral and therefore it is not disclosed on the Funds' Schedules of Portfolio Investments. During the time portfolio securities are on loan, the borrower will pay the Funds any dividends or interest paid on such securities plus any fee negotiated between the parties to the lending agreement. The Funds also earn a return from the collateral. The Funds pay the Agent various fees in connection with the investment of cash collateral and fees based on the investment income received from securities lending activities. Securities lending income (net of these fees) is disclosed on the Statements of Operations. Although risk is mitigated by the collateral, the Funds could experience a delay in recovering their securities and possible loss of income or value if the borrower fails to return them.
Securities lending transactions are entered into by a Fund under the MSLA, which permits the Fund, under certain circumstances such as an event of default, to offset amounts payable by the Fund to the same counterparty against amounts receivable from the counterparty to create a net payment due to or from the Fund.
The following table is a summary of the Funds' securities lending transactions which are subject to offset under the MSLA as of December 31, 2020. These transactions are accounted for as secured borrowings with an overnight and continuous contractual maturity for cash collateral and greater than overnight and continuous contractual maturity for non-cash collateral.
| | | Gross
Amount of
Recognized
Assets | | Value of | | Value of Non-cash
Collateral Received by
Maturity | | | |
| | (Value of
Securities
on Loan) | | Cash
Collateral
Received* | | <30
Days | | Between
30 & 90
Days | | >90
Days | | Net
Amount | |
USAA MSCI USA Value Momentum ETF | | $ | 6,704,638 | | | $ | 6,704,638 | | | $ | — | | | $ | — | | | $ | — | | | $ | — | | |
USAA MSCI USA Small Cap Value
Momentum ETF | | | 12,506,058 | | | | 12,506,058 | | | | — | | | | — | | | | — | | | | — | | |
USAA MSCI International Value
Momentum ETF | | | 1,611,641 | | | | 1,611,641 | | | | — | | | | — | | | | — | | | | — | | |
USAA MSCI Emerging Markets Value
Momentum ETF | | | 1,986,646 | | | | 1,986,646 | | | | — | | | | — | | | | — | | | | — | | |
* Collateral received in excess of the market value of securities on loan is not presented in this table. The total cash collateral received by each Fund is disclosed on the Statements of Assets and Liabilities.
Foreign Currency Translations:
The accounting records of the Funds are maintained in U.S. dollars. Investment securities and other assets and liabilities of a Fund denominated in a foreign currency are translated into U.S. dollars at current exchange rates. Purchases and sales of securities, income receipts and expense payments are translated into U.S. dollars at the exchange rates on the date of the transactions. The Funds do not isolate the portion of the results of operations resulting from changes in foreign exchange rates on investments from fluctuations arising from changes in market prices of securities held. Such fluctuations
62
Victory Portfolios II | | Notes to Financial Statements — continued
December 31, 2020 | |
(Unaudited)
are disclosed as Net change in unrealized appreciation/depreciation on investment securities and foreign currency translations on the Statements of Operations. Any realized gains or losses from these fluctuations are disclosed as Net realized gains (losses) from investment securities and foreign currency translations on the Statements of Operations.
Foreign Taxes:
The Funds may be subject to foreign taxes related to foreign income received (a portion of which may be reclaimable), capital gains on the sale of securities, and certain foreign currency transactions. All foreign taxes are recorded in accordance with the applicable regulations and rates that exist in the foreign jurisdictions in which the Funds invest.
Federal Income Taxes:
It is the policy of each Fund to continue to qualify as a regulated investment company by complying with the provisions available to certain investment companies, as defined in applicable sections of the Internal Revenue Code, and to make distributions of net investment income and net realized gains sufficient to relieve it from all, or substantially all, federal income taxes. Accordingly, no provision for federal income taxes is required in the financial statements. The Funds have a tax year end of June 30.
Management of the Funds has reviewed tax positions taken in tax years that remain subject to examination by all major tax jurisdictions, including federal (i.e., the last four tax years, which includes the current fiscal tax year end). Management believes that there is no tax liability resulting from unrecognized tax benefits related to uncertain tax positions taken.
Allocations:
Expenses directly attributable to a Fund are charged to the Fund, while expenses which are attributable to more than one fund in the Trust, or jointly with an affiliated trust, are allocated among the respective funds in the Trust and/or affiliated trust based upon net assets or another appropriate basis.
3. Purchases and Sales:
Purchases and sales of securities (excluding securities maturing less than one year from acquisition) and purchases and sales of in-kind transactions for the six months ended December 31, 2020, were as follows. Any realized gains or losses from in-kind redemptions are reflected on the Statements of Operations as Net realized gains (losses) from in-kind redemptions.
| | | Excluding
U.S. Government Securities | | Associated
with In-Kind Transactions | |
| | | Purchases | | Sales | | Purchases | | Sales | |
USAA MSCI USA Value
Momentum ETF | | $ | 217,472,465 | | | $ | 217,409,242 | | | $ | 52,961,100 | | | $ | 103,250,264 | | |
USAA MSCI USA Small Cap
Value Momentum ETF | | | 105,708,916 | | | | 106,417,199 | | | | 36,329,181 | | | | 62,378,511 | | |
USAA MSCI International
Value Momentum ETF | | | 150,489,115 | | | | 149,483,166 | | | | 43,717,346 | | | | 4,082,111 | | |
USAA MSCI Emerging Markets
Value Momentum ETF | | | 138,040,875 | | | | 83,461,626 | | | | 13,591,679 | | | | — | | |
There were no purchases and sales of U.S. Government Securities during the six months ended December 31, 2020.
4. Fees and Transactions with Affiliates and Related Parties:
Investment advisory services are provided to the Funds by Victory Capital Management Inc. ("VCM" or the "Adviser"), a New York corporation registered as an investment adviser with the Securities and Exchange Commission ("SEC"). The Adviser is a wholly owned indirect subsidiary of Victory Capital Holdings, Inc., a publicly traded Delaware corporation, and a wholly owned direct subsidiary of Victory
63
Victory Portfolios II | | Notes to Financial Statements — continued
December 31, 2020 | |
(Unaudited)
Capital Operating, LLC. Amounts incurred and paid to VCM for the six months ended December 31, 2020, are reflected on the Statements of Operations as Investment advisory fees.
Under the terms of the Investment Advisory Agreement, the Adviser is entitled to receive fees based on a percentage of the average daily net assets of each Fund. The rates at which the Adviser is paid by each Fund are included in the table below.
| | | Flat Rate | |
USAA MSCI USA Value Momentum ETF | | | 0.15 | % | |
USAA MSCI USA Small Cap Value Momentum ETF | | | 0.15 | % | |
USAA MSCI International Value Momentum ETF | | | 0.25 | % | |
USAA MSCI Emerging Markets Value Momentum ETF | | | 0.30 | % | |
VCM also serves as the Funds' administrator and fund accountant. Under the Administration and Fund Accounting Agreement, VCM is paid for its services an annual fee at a rate of 0.08% of the first $15 billion in average daily net assets of the Trust, Victory Variable Insurance Funds and Victory Portfolios (collectively, the "Victory Funds Complex"), 0.05% of the average daily net assets above $15 billion to $30 billion of the Victory Funds Complex and 0.04% of the average daily net assets over $30 billion of the Victory Funds Complex. Amounts incurred for the six months ended December 31, 2020, are reflected on the Statements of Operations as Administration fees.
Citi Fund Services Ohio, Inc. ("Citi"), an affiliate of Citibank, acts as sub-administrator and sub-fund accountant to the Funds pursuant to the Sub-Administration and Sub-Fund Accounting Services Agreement between VCM and Citi. VCM pays Citi a fee for providing these services. The Funds reimburse VCM and Citi for out-of-pocket expenses incurred in providing these services and certain other expenses specifically allocated to the Funds. Amounts incurred for the six months ended December 31, 2020, are reflected on the Statements of Operations as Sub-Administration fees.
Citibank serves as the Funds' custodian. The Funds pay Citibank a fee for providing these services. Amounts incurred for the six months ended December 31, 2020, are reflected on the Statements of Operations as Custodian fees.
Citibank also serves as the Funds' Transfer Agent. Amounts incurred for the six months ended December 31, 2020, are reflected on the Statements of Operations as Transfer agent fees.
Foreside Fund Services, LLC ("Foreside") serves as the Funds' distributor.
The Chief Compliance Officer ("CCO") is an employee of the Adviser, which pays the compensation of the CCO and his support staff. The Trust has entered into an Agreement to provide compliance services with the Adviser, pursuant to which the Adviser furnishes its compliance personnel, including the services of the CCO, and other resources reasonably necessary to provide the Trust with compliance oversight services related to the design, administration and oversight of a compliance program for the Trust in accordance with Rule 38a-1 under the 1940 Act. The Funds in the Victory Funds Complex, in aggregate, compensate the Adviser for these services. Amounts incurred for the six ended December 31, 2020, are reflected on the Statements of Operations as Compliance fees.
Sidley Austin LLP provides legal services to the Trust.
The Adviser has entered into expense limitation agreements with certain Funds. Under the terms of the agreements, the Adviser has agreed to waive fees or reimburse certain expenses to the extent that ordinary operating expenses incurred by certain Funds in any fiscal year exceed the expense limit for such Fund. Such excess amounts will be the liability of the Adviser. Interest, taxes, brokerage commissions, other expenditures which are capitalized in accordance with GAAP, and other extraordinary expenses not incurred in the ordinary course of a Fund's business are excluded from the expense limits. As of December 31, 2020, the expense limits (excluding voluntary waivers) are as follows:
| | | In effect July 1, 2019
until June 30, 2021 | |
USAA MSCI USA Value Momentum ETF | | | 0.20 | % | |
USAA MSCI USA Small Cap Value Momentum ETF | | | 0.25 | % | |
USAA MSCI International Value Momentum ETF | | | 0.35 | % | |
USAA MSCI Emerging Markets Value Momentum ETF | | | 0.45 | % | |
64
Victory Portfolios II | | Notes to Financial Statements — continued
December 31, 2020 | |
(Unaudited)
The Funds have agreed to repay fees and expenses that were waived or reimbursed by the Adviser for a period up to three fiscal years after such waiver or reimbursement was made to the extent such payments or repayments would not cause the expenses of a class to exceed the original expense limitation in place at the time of the waiver or reimbursement or any expense limitation agreement in place at the time of repayment. Amounts repaid to the Adviser during the year, if any, are reflected on the Statements of Operations as Recoupment of prior expenses waived/reimbursed by Adviser.
As of December 31, 2020, the following amounts are available to be repaid to the Adviser. The Funds have not recorded any amounts available to be repaid as a liability due to an assessment that such repayment is not probable at December 31, 2020.
| | | Expires
August 31,
2022 | | Expires
June 30, 2023 | | Expires
June 30, 2024 | | Total | |
USAA MSCI USA Value Momentum ETF | | $ | 9,240 | | | $ | 188,636 | | | $ | 81,824 | | | $ | 279,700 | | |
USAA MSCI USA Small Cap Value
Momentum ETF | | | 2,724 | | | | 37,764 | | | | — | | | | 40,488 | | |
USAA MSCI International Value
Momentum ETF | | | — | | | | 71,346 | | | | 35,014 | | | | 106,360 | | |
USAA MSCI Emerging Markets Value
Momentum ETF | | | 632 | | | | 114,256 | | | | 52,906 | | | | 167,794 | | |
The Adviser voluntarily waived the following administration fees for the six months ended December 31, 2020, to assist the Funds in maintaining competitive expense ratios. Voluntary waivers and reimbursements applicable to the Funds are not available to be recouped at a future time.
USAA MSCI USA Value Momentum ETF | | $ | 90,042 | | |
USAA MSCI USA Small Cap Value Momentum ETF | | | 48,002 | | |
USAA MSCI International Value Momentum ETF | | | 66,512 | | |
USAA MSCI Emerging Markets Value Momentum ETF | | | 39,168 | | |
Certain officers and/or interested trustees of the Funds are also officers of the Advisor and /or employees of the Adviser, Administrator, Fund Accountant, Sub-Administrator, Sub-Fund Accountant, Custodian, Distributor, and Legal Counsel.
5. Risks:
Each Fund may be subject to other risks in addition to these identified risks.
Equity Risk — An investment in the Funds' Shares represents an indirect investment in the securities owned by the Funds, some of which will be traded on a national securities exchange or in the over-the-counter markets. The value of the securities in which the Funds invest, like other market investments, may move up or down, sometimes rapidly and unpredictably. The value of the securities in which the Funds invest may affect the value of the Funds' Shares. An investment in the Funds' Shares at any point in time may be worth less than the original investment, even after taking into account the reinvestment of the Funds' distributions.
Foreign Securities Risk — The USAA MSCI International Value Momentum ETF and USAA MSCI Emerging Markets Value Momentum ETF invest in securities of foreign issuers in various countries. Investing on an international basis involves certain risks not involved in domestic investments including the risk of nationalization or expropriation of assets, imposition of currency exchange controls or restrictions on the repatriation of foreign currency, confiscatory taxation, political or financial instability and diplomatic developments, which could affect the value of a Fund's investments in certain foreign countries. Governments of many countries have exercised, and continue to exercise, substantial influence over many aspects of the private sector through the ownership or control of many companies, including some of the largest in these countries. As a result, government actions in the future could have a significant effect on economic conditions which may adversely affect prices of certain portfolio securities. There is also generally less government supervision and regulation of stock exchanges, brokers and listed companies than in the U.S. Dividends or interest on, or proceeds from the sale of, foreign securities may be subject to foreign withholding taxes, and special U.S. tax considerations may
65
Victory Portfolios II | | Notes to Financial Statements — continued
December 31, 2020 | |
(Unaudited)
apply. Moreover, foreign economies may differ favorably or unfavorably from the U.S. economy in such respects as growth of gross national product, rate of inflation, capital reinvestment, resource self-sufficiency and balance of payments position. The Schedule of Portfolio Investments includes information on each Fund's holdings, including industry and/or geographic composition, as relevant.
Passive Investment Risk — Each Fund is designed to track its index and is not actively managed. A Fund will not buy or sell shares of an equity security due to current or projected performance of a security, industry or sector, unless that security is added to or removed, respectively, from its index. A Fund does not, therefore, seek returns in excess of its index, and does not attempt to take defensive positions or hedge against potential risks unless such defensive positions are also taken by its index. Different types of investment styles, for example passively managed or actively managed, or growth or value, tend to perform differently and shift into and out of favor with investors depending on changes in market and economic sentiment and conditions. As a result, a Fund's performance may at times be worse than the performance of other mutual funds that invest more broadly or that have different investment styles.
Geopolitical/Natural Disaster Risk — An outbreak of disease called COVID-19 has spread internationally. The transmission of COVID-19 and efforts to contain its spread have resulted in international, national and local border closings and other significant travel restrictions and disruptions, significant disruptions to business operations, supply chains and consumer activity, significant challenges in healthcare service preparation and delivery, quarantines and general concern and uncertainty. These negative impacts have caused significant volatility and declines in global financial markets, which have caused losses for Fund investors during and subsequent to period end. The impact of the COVID-19 pandemic may last for an extended period of time, and could result in a substantial economic downturn or recession. Public health crises may exacerbate other pre-existing political, social, economic, market and financial risks. The extent of the impact to the financial performance of the Fund's investments will depend on future developments, including (i) the duration and spread of the outbreak, (ii) the restrictions and advisories, (iii) the effects on the financial markets, and (iv) the effects on the economy overall, all of which are highly uncertain and cannot be predicted.
6. Line of Credit:
For the six months ended December 31, 2020, the Victory Funds Complex participated in a short-term demand note "Line of Credit" agreement with Citibank. The Line of Credit agreement with Citibank was renewed on June 29, 2020, with a termination date of June 28, 2021. Under the agreement with Citibank, the Victory Funds Complex and USAA Mutual Funds Complex, combined, may borrow up to $600 million, of which $300 million is committed and $300 million is uncommitted. $40 million of the Line of Credit is reserved for use by the Victory Floating Rate Fund (herein, the "Fund"), another series of the Victory Funds Complex, with that Fund paying the related commitment fees for that amount. The purpose of the agreement is to meet temporary or emergency cash needs. For the six months ended December 31, 2020, Citibank received an annual commitment fee of 0.15% on $300 million for providing the Line of Credit. Each fund in the Victory Funds Complex pays a pro-rata portion of the commitment fees plus any interest (one month LIBOR plus one percent) on amounts borrowed. Effective June 29, 2020, under an amended Line of Credit agreement, Citibank will also receive an annual upfront fee of 0.10% on the $300 million committed line of credit. Each fund in the Victory Funds Complex will pay a pro-rata portion of the upfront fee. Interest charged to each Fund during the period, if applicable, is presented on the Statements of Operations under Line of credit fees.
The average loans for the days outstanding and average interest rate for each Fund during the six months ended December 31, 2020, were as follows:
| | | Amount
Outstanding at
December 31, 2020 | | Average
Borrowings | | Days
Borrowing
Outstanding | | Average
Interest
Rate* | | Maximum
Borrowing During
the Period | |
USAA MSCI Emerging Markets
Value Momentum ETF | | $ | — | | | $ | 10,950,000 | | | | 2 | | | | 1.23 | % | | $ | 13,600,000 | | |
* For the six months ended December 31, 2020, based on the number of days borrowings were outstanding.
66
Victory Portfolios II | | Notes to Financial Statements — continued
December 31, 2020 | |
(Unaudited)
7. Federal Income Tax Information:
Distributions of net investment income are monthly for MSCI USA Value Momentum ETF and MSCI USA Small Cap Value Momentum ETF and semi-annually for MSCI International Value Momentum ETF and MSCI Emerging Markets Value Momentum ETF. Each of the Funds distributes any net realized long or short-term capital gains at least annually.
The amounts of dividends from net investment income and distributions from net realized gains (collectively, distributions to shareholders) are determined in accordance with federal income tax regulations, which may differ from GAAP. To the extent these "book/tax" differences are permanent in nature (e.g., net operating loss and distribution reclassification), such amounts are reclassified within the components of net assets based on their federal tax-basis treatment; temporary differences (e.g., wash sales) do not require reclassification. To the extent dividends and distributions exceed net investment income and net realized gains for tax purposes, they are reported as distributions of capital. Net investment losses incurred by a Fund may be reclassified as an offset to capital on the accompanying Statements of Assets and Liabilities.
The tax character of current year distributions paid and the tax basis of the current components of accumulated earnings (deficit) will be determined at the end of the current tax year ending June 30, 2021.
As of the most current tax year ended June 30, 2020, the following Funds had net capital loss carryforwards as summarized in the tables below.
| | | Short-Term
Amount | | Long-Term
Amount | | Total | |
USAA MSCI USA Value
Momentum ETF | | $ | 39,010,262 | | | $ | 20,812,660 | | | $ | 59,822,922 | | |
USAA MSCI USA Small Cap Value
Momentum ETF | | | 22,160,398 | | | | 4,545,372 | | | | 26,705,770 | | |
USAA MSCI International Value
Momentum ETF | | | 47,723,372 | | | | 22,068,129 | | | | 69,791,501 | | |
USAA MSCI Emerging Markets Value
Momentum ETF | | | 23,702,231 | | | | 10,221,073 | | | | 33,923,304 | | |
9. Affiliated Securities:
An affiliated security is a security in which the Fund has ownership of at least 5% of the security's outstanding voting shares an investment company managed by VCM or an issuer under common control with a Fund under VCM. The Fund does not invest in affiliated securities for the purpose of exercising management or control. These securities are noted as affiliated on the Fund's Schedule of Portfolio Investments. Transactions in affiliated securities during the six months ended December 31, 2020, were as follows:
USAA MSCI USA
Small Cap Value
Momentum ETF | | Fair Value
6/30/20 | | Purchases
at Cost | | Proceeds
from
Sales | | Realized
Gains
(Losses) | | Capital
Gain
Distribution | | Net
Change in
Unrealized
Appreciation/
Depreciation | | Fair Value
12/31/20 | | Dividend
Income | |
Victory Capital
Holdings, Inc. | | $ | 365,373 | | | $ | 63,831 | | | $ | (110,735 | ) | | $ | 9,033 | | | $ | — | | | $ | 141,878 | | | $ | 469,380 | | | $ | 2,579 | | |
67
Victory Portfolios II | | Supplemental Information
December 31, 2020 | |
(Unaudited)
Proxy Voting and Portfolio Holdings Information
Proxy Voting:
Information regarding the policies and procedures each Fund uses to determine how to vote proxies relating to portfolio securities is available without charge, upon request, by calling 800-539-3863. The information is also included in the Funds' Statement of Additional Information, which is available on the SEC's website at www.sec.gov.
Information relating to how the Funds voted proxies relating to portfolio securities held during the most recent twelve months ended June 30 is available on the SEC's website at www.sec.gov.
Availability of Schedules of Portfolio Investments:
The Trust files a complete list of Schedules of Portfolio Investments with the SEC for the first and third quarter of each fiscal year on Form N-PORT. Form N-PORT is available on the SEC's web site at www.sec.gov.
Expense Examples
As a shareholder of the Funds, you may incur two types of costs: (1) transaction costs; and (2) ongoing costs, including management fees, and other Fund expenses. These examples are intended to help you understand your ongoing costs (in dollars) of investing in the Funds and to compare these costs with the ongoing costs of investing in other mutual funds.
These examples are based on an investment of $1,000 invested at the beginning of the period and held for the entire period from July 1, 2020, through December 31, 2020.
The Actual Expense figures in the table below provide information about actual account values and actual expenses. You may use the information below, together with the amount you invested, to estimate the expenses that you paid over the period. Simply divide your account value by $1,000 (for example, an $8,600 account value divided by $1,000 = 8.6), then multiply the result by the number in the table under the heading entitled "Actual Expenses Paid During Period" to estimate the expenses you paid on your account during this period.
The Hypothetical Expense figures in the table below provide information about hypothetical account values and hypothetical expenses based on each Fund's actual expense ratio and an assumed rate of return of 5% per year before expenses, which is not the Fund's actual return. The hypothetical account values and expenses may not be used to estimate the actual ending account balance or expenses you paid for the period. You may use this information to compare this 5% hypothetical example with the 5% hypothetical examples that appear in shareholder reports of other funds.
Please note the expenses shown in the table are meant to highlight your ongoing costs only and do not reflect any transactional costs. Therefore, the table is useful in comparing ongoing costs only, and will not help you determine the relative total costs of owning different funds. In addition, if these transactional costs were included, your costs would have been higher.
| | | Beginning
Account
Value
7/1/20 | | Actual
Ending
Account
Value
12/31/20 | | Hypothetical
Ending
Account
Value
12/31/20 | | Actual
Expenses
Paid
During
Period
7/1/20-
12/31/20* | | Hypothetical
Expenses
Paid
During
Period
7/1/20-
12/31/20* | | Annualized
Expense
Ratio
During
Period
7/1/20-
12/31/20 | |
USAA MSCI
USA Value
Momentum ETF | | $ | 1,000.00 | | | $ | 1,223.90 | | | $ | 1,024.20 | | | $ | 1.12 | | | $ | 1.02 | | | | 0.20 | % | |
USAA MSCI USA
Small Cap Value
Momentum ETF | | | 1,000.00 | | | | 1,321.90 | | | | 1,024.00 | | | | 1.40 | | | | 1.22 | | | | 0.24 | % | |
68
Victory Portfolios II | | Supplemental Information — continued
December 31, 2020 | |
(Unaudited)
| | | Beginning
Account
Value
7/1/20 | | Actual
Ending
Account
Value
12/31/20 | | Hypothetical
Ending
Account
Value
12/31/20 | | Actual
Expenses
Paid
During
Period
7/1/20-
12/31/20* | | Hypothetical
Expenses
Paid
During
Period
7/1/20-
12/31/20* | | Annualized
Expense
Ratio
During
Period
7/1/20-
12/31/20 | |
USAA MSCI International
Value Momentum ETF | | $ | 1,000.00 | | | $ | 1,201.30 | | | $ | 1,023.44 | | | $ | 1.94 | | | $ | 1.79 | | | | 0.35 | % | |
USAA MSCI Emerging
Markets Value
Momentum ETF | | | 1,000.00 | | | | 1,230.60 | | | | 1,022.94 | | | | 2.53 | | | | 2.29 | | | | 0.45 | % | |
* Expenses are equal to the average account value multiplied by the Fund's annualized expense ratio multiplied by 184/365 (the number of days in the most recent fiscal half-year divided by the number of days in the fiscal year).
69
Victory Portfolios II | | Supplemental Information — continued
December 31, 2020 | |
(Unaudited)
Considerations of the Board in Continuing the Investment Advisory Agreement (the "Agreement")
The Board approved the Agreement on behalf of each of the Funds at a meeting, which was called for that purpose, on December 2, 2020. The Board also considered information relating to the Funds and the Agreement provided throughout the year and, more specifically, at a meeting on October 27, 2020 called for the purpose of reviewing the Agreement. In considering whether to approve the Agreement, the Board requested, and the Adviser provided, information that the Board believed to be reasonably necessary to reach its conclusions.
The Board, including the Independent Trustees, evaluated this information along with other information obtained throughout the year and was advised by legal counsel to the Funds, which also serves as independent legal counsel to the Independent Trustees.
The Board noted that each Fund assumed the performance of its predecessor fund, that the Adviser became the investment adviser to each Fund on February 26, 2019, and that prior to that date each predecessor fund was managed by a different investment adviser.
The Board took into consideration regular reports from the Adviser throughout the COVID-19 pandemic public health crisis concerning how the ongoing pandemic has affected market volatility, investment risk and the implementation and effectiveness of business continuity plans. These reports also had confirmed that the pandemic had no material impact on the Adviser's operations.
The Board considered each Fund's advisory fee, expense ratio and investment performance as significant factors in determining whether the Agreement should be continued. In considering whether the compensation paid to the Adviser was fair and reasonable, the Board also evaluated, among other things, the following factors:
• The requirements of the Funds for the services provided by the Adviser;
• The nature, quality and extent of the services provided and expected to be provided;
• The performance of the Funds as compared to comparable funds;
• The fees payable for the services and whether the fee arrangements provided for economies of scale that would benefit Fund shareholders as the Funds grow;
• Whether the fee would be sufficient to enable the Adviser to attract and retain experienced personnel and continue to provide quality services to the Funds;
• Fees paid by other clients of the Adviser whose accounts are managed in a similar investment style and any differences in the services provided to the other clients compared to those provided to the Funds;
• The total expenses of each Fund;
• Management's commitment to operating the Funds at competitive expense levels;
• The profitability of the Adviser (as reflected by comparing fees earned against an estimate of the Adviser's costs) with respect to the Adviser's relationship with the Funds;
• Research and other service benefits received by the Adviser obtained through payment of client commissions for securities transactions;
• Other benefits received by the Adviser, and its affiliates, including revenues paid to the Adviser, or its affiliates, by the Funds for administration and fund accounting services, and distribution;
• The capabilities and financial condition of the Adviser;
• Current economic and industry trends; and
• The historical relationship between the Trust and the Adviser.
The Board reviewed each Fund's current management fee in the context of the Adviser's profitability with respect to each Fund. In addition, the Board compared each Fund's gross management fee and total expense ratio on a net and gross basis with the median gross management fee and median expense ratio of a universe of comparable exchange-traded funds ("ETFs") compiled by an independent consultant and a peer group of funds with similar investment strategies selected by that independent consultant from the universe. The Board reviewed the factors and methodology used by the independent consultant in the selection of each Fund's peer
70
Victory Portfolios II | | Supplemental Information — continued
December 31, 2020 | |
(Unaudited)
group, including the independent consultant's selection of a broad universe of funds, the more specific universe of comparable funds, and peer groups of funds with comparable investment strategies and asset levels, among other factors.
The Board noted that none of the advisory fee arrangements for the Funds included breakpoints, which are generally viewed as a method by which an investment adviser shares any economies of scale with a fund as a fund grows. The Board also considered the Adviser's commitment to limit expenses as discussed in more detail below, and would consider breakpoints at a future time if a Fund's assets were to grow significantly.
The Board also reviewed the compliance and administrative services provided to the Funds by the Adviser and its affiliates, including the Adviser's oversight of the Funds' day-to-day operations and oversight of Fund accounting, assistance in meeting legal and regulatory requirements, and other services necessary for the operation of the Funds and the Trust.
The Board found that the gross annual management fee paid by each Fund was within the range of management fees paid by each Fund's respective peer group. The Board also found that each Fund's net annual expense ratio was reasonable as compared with each Fund's respective peer group. The Board considered the Adviser's contractual agreement with each Fund to waive its fees and reimburse expenses for a specified period of time, as described in the Fund's prospectus.
The Board reviewed each Fund's performance over the one-year period against the performance of the Fund's selected peer group and benchmark index, noting that each Fund's investment objective is to track its benchmark index before fees and expenses. The Board recognized that the performance of each Fund is net of expenses, while the performance of each benchmark index reflects gross returns, and as a result, each Fund will generally underperform its benchmark index due to fees and expenses. The Board also considered each Fund's tracking error as a factor in evaluating performance.
The Board reviewed various other specific factors with respect to each Fund, as described below. In their deliberations, the Trustees did not rank the importance of any particular information or factor considered and each Trustee may have attributed different weights to various factors.
VictoryShares USAA MSCI USA Value Momentum ETF
Noting that the Fund commenced operations in 2017, the Board compared the Fund's one-year performance for the period ended June 30, 2020, to that of the median performance of the Fund's peer group and benchmark index for the same period and considered the fact that the Fund underperformed both the benchmark index and the peer group median.
Having considered, among other things: (1) the Fund's management fee compared to comparable ETFs; (2) the Fund's total expense ratio compared to comparable ETFs; (3) that the Adviser's willingness to limit the expenses for a period of time would provide stability to the Fund's expenses during that period; and (4) that the Fund's performance in relation to its benchmark index and peer group was within an acceptable range, the Board concluded that the Agreement continued to be in the best interests of the Fund's shareholders.
VictoryShares USAA MSCI USA Small Cap Value Momentum ETF
Noting that the Fund commenced operations in 2017, the Board compared the Fund's one-year performance for the period ended June 30, 2020, to that of the median performance of the Fund's peer group and benchmark index for the same period and considered the fact that the Fund underperformed the benchmark index and outperformed the peer group median.
Having considered, among other things: (1) the Fund's management fee compared to comparable ETFs; (2) the Fund's total expense ratio compared to comparable ETFs; (3) that the Adviser's willingness to limit the expenses for a period of time would provide stability to the Fund's expenses during that period; and (4) that the Fund's performance in relation to its benchmark index and peer group was within an acceptable range, the Board concluded that the Agreement continued to be in the best interests of the Fund's shareholders.
71
Victory Portfolios II | | Supplemental Information — continued
December 31, 2020 | |
(Unaudited)
VictoryShares USAA MSCI International Value Momentum ETF
Noting that the Fund commenced operations in 2017, the Board compared the Fund's one-year performance for the period ended June 30, 2020, to that of the median performance of the Fund's peer group and benchmark index for the same period and considered the fact that the Fund underperformed both the benchmark index and the peer group median.
Having considered, among other things: (1) the Fund's management fee compared to comparable ETFs; (2) the Fund's total expense ratio compared to comparable ETFs; (3) that the Adviser's willingness to limit the expenses for a period of time would provide stability to the Fund's expenses during that period; and (4) that the Fund's performance in relation to its benchmark index and peer group was within an acceptable range, the Board concluded that the Agreement continued to be in the best interests of the Fund's shareholders.
VictoryShares USAA MSCI Emerging Markets Value Momentum ETF
Noting that the Fund commenced operations in 2017, the Board compared the Fund's one-year performance for the period ended June 30, 2020, to that of the median performance of the Fund's peer group and benchmark index for the same period and considered the fact that the Fund underperformed both the benchmark index and the peer group median.
Having considered, among other things: (1) the Fund's management fee compared to comparable ETFs; (2) the Fund's total expense ratio compared to comparable ETFs; (3) that the Adviser's willingness to limit the expenses for a period of time would provide stability to the Fund's expenses during that period; and (4) that the Fund's performance in relation to its benchmark index and peer group was within an acceptable range, the Board concluded that the Agreement continued to be in the best interests of the Fund's shareholders.
72
Privacy Policy
Protecting the Privacy of Information
The Trust respects your right to privacy. We also know that you expect us to conduct and process your business in an accurate and efficient manner. To do so, we must collect and maintain certain personal information about you. This is the information we collect from you on applications or other forms, and from the transactions you make with us or third parties. It may include your name, address, social security number, account transactions and balances, and information about investment goals and risk tolerance.
We do not disclose any information about you or about former customers to anyone except as permitted or required by law. Specifically, we may disclose the information we collect to companies that perform services on our behalf, such as the transfer agent that processes shareholder accounts and printers and mailers that assist us in the distribution of investor materials. We may also disclose this information to companies that perform marketing services on our behalf. This allows us to continue to offer you Victory investment products and services that meet your investing needs, and to effect transactions that you request or authorize. These companies will use this information only in connection with the services for which we hired them. They are not permitted to use or share this information for any other purpose.
To protect your personal information internally, we permit access only by authorized employees and maintain physical, electronic and procedural safeguards to guard your personal information.*
* You may have received communications regarding information about privacy policies from other financial institutions which gave you the opportunity to "opt-out" of certain information sharing with companies which are not affiliated with that financial institution. The Trust does not share information with other companies for purposes of marketing solicitations for products other than the Trust. Therefore, the Trust does not provide opt-out options to their shareholders.
The Victory Funds
P.O. Box 182593
Columbus, Ohio 43218-2593

Visit our website at: | | Call Victory at: | |
www.vcm.com | | 866-376-7890 | |
Item 2. Code of Ethics.
Not applicable – only for annual reports.
Item 3. Audit Committee Financial Expert.
Not applicable – only for annual reports.
Item 4. Principal Accountant Fees and Services.
Not applicable – only for annual reports.
Item 5. Audit Committee of Listed Registrants.
Not applicable.
Item 6. Investments.
Item 7. Disclosure of Proxy Voting Policies and Procedures for Closed-End Management Investment Companies.
Not applicable.
Item 8. Portfolio Managers of Closed-End Management Investment Companies.
Not applicable.
Item 9. Purchases of Equity Securities by Closed-End Management Investment Company and Affiliated Purchasers.
Not applicable.
Item 10. Submission of Matters to a Vote of Security Holders.
Not applicable.
Item 11. Controls and Procedures.
(a)The registrant’s principal executive officer and principal financial officer have concluded, based on their evaluation of the registrant's disclosure controls and procedures as conducted within 90 days of the filing date of this report, that these disclosure controls and procedures are adequately designed and are operating effectively to ensure that information required to be disclosed by the registrant on Form N-CSR is recorded, processed, summarized and reported within the time periods specified in the Securities and Exchange Commission's rules and forms.
(b)There were no changes in the registrant’s internal control over financial reporting (as defined in Rule 30a-3(d) under the Investment Company Act of 1940 (17 CFR 270.30a-3(d)) that occurred during the period covered by this report that have materially affected or are reasonably likely to materially affect, the registrant’s internal control over financial reporting.
Item 12. Disclosure of Securities Lending Activities for Closed-End Management Investment Companies.
Item 13. Exhibits.
SIGNATURES
Pursuant to the requirements of the Securities Exchange Act of 1934 and the Investment Company Act of 1940, the registrant has duly caused this report to be signed on its behalf by the undersigned, thereunto duly authorized.
| (Registrant) | Victory Portfolios II | |
| By (Signature and Title)* | /s/ Allan Shaer | |
| | Allan Shaer, Principal Financial Officer | |
Pursuant to the requirements of the Securities Exchange Act of 1934 and the Investment Company Act of 1940, this report has been signed below by the following persons on behalf of the registrant and in the capacities and on the dates indicated.
| By (Signature and Title)* | /s/ Christopher K. Dyer | |
| | Christopher K. Dyer, Principal Executive Officer | |
| By (Signature and Title)* | /s/ Allan Shaer | |
| | Allan Shaer, Principal Financial Officer | |