Filed Pursuant to Rule 424(b)(3)
Registration No. 333-185676
TRILINC GLOBAL IMPACT FUND, LLC
SUPPLEMENT NO. 2 DATED JUNE 9, 2016
TO THE PROSPECTUS DATED APRIL 28, 2016
This prospectus supplement (“Supplement”) is part of and should be read in conjunction with the prospectus of TriLinc Global Impact Fund, LLC (the “Company”), dated April 28, 2016, as supplemented by Prospectus Supplement No. 1, dated May 11, 2016 (the “Prospectus”). Unless otherwise defined herein, capitalized terms used in this Supplement shall have the same meanings as in the Prospectus.
The purposes of this Supplement are as follows:
| A. | To provide information regarding our public offering; |
| B. | To provide information regarding distributions declared; |
| C. | To update the section of the Prospectus titled “Business;” |
| D. | To include our Quarterly Report on Form 10-Q for the quarter ended March 31, 2016; and |
| E. | To update the form of our subscription agreement in Appendix B to the Prospectus. |
| A. | Status of Our Public Offering |
As of June 7, 2016, we had raised gross proceeds of approximately $213.3 million from the sale of approximately 21.6 million units of our limited liability company interest, including units issued pursuant to our distribution reinvestment plan.
| B. | Declaration of Distributions |
On May 6, 2016, with the authorization of our board of managers, the Company declared distributions for all classes of units for the period from May 1 through May 31, 2016. These distributions were calculated based on unitholders of record for each day in an amount equal to $0.00197268 per unit per day (less the distribution fee with respect to Class C units). On June 1, 2016, $696,872 of these distributions were paid in cash and on May 31, 2016, $554,319 were reinvested in the Company’s units for those investors participating in the Company’s unit Distribution Reinvestment Plan. Some or all of the Company’s distributions have been and may continue to be paid from sources other than cash flow from operations, such as capital contributions from the Sponsor, cash resulting from a waiver or deferral of fees, and/or proceeds from this offering.
| C. | Update to the Section Titled “Business” |
| 1. | The following information updates and supplements the “Business—Investments—Overview” section of the Prospectus to provide certain information regarding the Company’s investment portfolio as of May 31, 2016: |
Investments
Since the Company commenced operations and through May 31, 2016, the Company has funded $327.5 million in aggregate investments, including $23 million in temporary investments. Of the aggregate investment amount, the Company has received $161 million in full aggregate transaction repayments from existing and exited trade finance, term loan, and temporary investment facilities. Of the aggregate transaction repayment amount, approximately $79 million represents transactions of trade finance, term loan, and temporary investment facilities that are closed and no longer part of the Company’s portfolio.
As of May 31, 2016 the Company had the following investments:
| Investment Portfolio |
| Description | Sector | Country | Investment Type | Maturity1 | Interest Rate2 | Total Loan Commitment3 | Total Amount Outstanding4 | Primary Impact Objective | ||||||||||||||
| Agriculture Distributor | Farm-Product Raw Materials | Argentina | Trade Finance | 9/30/2016 | 9.00 | % | $ | 15,000,000 | $ | 15,000,000 | Job Creation | |||||||||||
| Agricultural Products Exporter II | Farm-Product Raw Materials | Singapore5 | Trade Finance | 6/1/2016 | 11.50 | % | $ | 10,000,000 | $ | 10,000,000 | N/A6 | |||||||||||
| Agricultural Supplies Distributor II | Miscellaneous Non-Durable Goods | South Africa | Trade Finance | 5/30/2016 | 10.38 | % | $ | 10,000,000 | $ | 316,370 | Job Creation | |||||||||||
| Beef Exporter | Meat Products | Argentina | Trade Finance | 4/30/2016 | 11.98 | % | $ | 9,000,000 | $ | 9,000,000 | Job Creation | |||||||||||
| Chia Seed Exporter | Field Crops, Except Cash Grains | Chile | Trade Finance | 12/11/2016 | 11.50 | % | $ | 2,000,000 | $ | 1,900,000 | Agricultural Productivity | |||||||||||
| Consumer Goods Distributor | Groceries and Related Products | Namibia | Trade Finance | 3/3/2016 | 12.00 | % | $ | 2,000,000 | $ | 1,000,000 | Job Creation | |||||||||||
| Dairy Co-Operative | Dairy Products | Argentina | Trade Finance | 7/29/2016 | 10.67 | % | $ | 6,000,000 | $ | 6,000,000 | Job Creation | |||||||||||
| Diaper Manufacturer | Converted Paper and Paperboard Products | Peru | Term Loan | 6/15/2017 | 14.16 | %7 | $ | 3,700,000 | $ | 3,250,000 | Job Creation | |||||||||||
| Electronics Assembler8 | Communications Equipment | South Africa | Trade Finance | 8/23/2016 | 13.00 | % | $ | 11,000,000 | $ | 5,784,581 | Job Creation | |||||||||||
| Farm Supplies Distributor | Miscellaneous Non-Durable Goods | Zambia | Trade Finance | 5/3/2016 | 12.43 | % | $ | 10,000,000 | $ | 5,078,526 | Job Creation | |||||||||||
| Fish Processor & Exporter | Commercial Fishing | Ecuador | Trade Finance | 6/19/2016 | 9.00 | % | $ | 2,000,000 | $ | 896,328 | Job Creation | |||||||||||
| Fruit & Nut Distributor | Groceries and Related Products | South Africa | Trade Finance | 5/22/20159 | 17.50 | % | $ | 1,250,000 | $ | 656,960 | Job Creation | |||||||||||
| Hospitality Service Provider10 | Hotels and Motels | Cape Verde | Term Loan | 8/21/2021 | 13.50 | % | $ | 17,000,000 | $ | 17,000,000 | Job Creation | |||||||||||
| Integrated Steel Producer | Steel Works, Blast Furnaces, and Rolling and Finishing Mills | Zambia | Trade Finance | 8/13/2016 | 13.00 | % | $ | 6,000,000 | $ | 6,000,000 | Job Creation | |||||||||||
| International Development Logistics Provider11 | Lumber and Other Construction Materials | Italy | Trade Finance | 10/12/2016 | 8.50 | % | $ | 5,000,000 | $ | 4,284,308 | Access to New Markets | |||||||||||
| IT Service Provider | Computer Programming and Data Processing | Brazil | Term Loan | 10/31/2019 | 13.50 | % | $ | 14,000,000 | $ | 6,641,897 | Job Creation | |||||||||||
| Marine Logistics Provider | Services Incidental to Water Transportation | Nigeria | Term Loan | 9/16/2020 | 15.59 | %12 | $ | 16,050,000 | $ | 12,719,299 | Capacity- Building | |||||||||||
| Meat Processor II13 | Meat Products | South Africa | Trade Finance | 3/17/2017 | 14.50 | % | $ | 2,800,000 | $ | 1,250,000 | Job Creation | |||||||||||
| Metals Trader | Metals and Minerals, Except Petroleum | United Kingdom | Trade Finance | 9/27/2016 | 9.45 | % | $ | 2,000,000 | $ | 2,000,000 | N/A6 | |||||||||||
| Mine Remediation Company | Metal Mining Services | South Africa | Trade Finance | 8/15/2016 | 17.50 | % | $ | 2,500,000 | $ | 2,500,000 | Job Creation | |||||||||||
| Oilseed Distributor | Fats and Oils | Argentina | Trade Finance | 12/15/2016 | 8.75 | % | $ | 6,000,000 | $ | 6,000,000 | Job Creation | |||||||||||
| Power Producer | Electric Services | Ghana | Trade Finance | 3/10/2017 | 11.50 | % | $ | 11,500,000 | $ | 11,500,000 | Access to Energy | |||||||||||
| Description | Sector | Country | Investment Type | Maturity1 | Interest Rate2 | Total Loan Commitment3 | Total Amount Outstanding4 | Primary Impact Objective | ||||||||||||
| Railway Equipment Provider14 | Rental of Railroad Cars | South Africa | Term Loan | 1/31/2020 | 12.00% | $ | 5,000,000 | $ | 4,570,619 | Productivity and Competitiveness Improvement | ||||||||||
| Sesame Seed Exporter15 | Farm-Product Raw Materials | Guatemala | Trade Finance | 3/31/2016 | 12.00% | $ | 2,000,000 | $ | 1,000,000 | Agricultural Productivity | ||||||||||
| Sugar Producer16 | Field Crops, Except Cash Grains | Brazil | Term Loan | 5/15/2017 | 17.43% | $ | 3,000,000 | $ | 3,000,000 | Capacity- Building | ||||||||||
Investment Portfolio Total | $174,800,000 | $137,348,888 | ||||||||||||||||||
Temporary Investments17 | ||||||||||||||||||||
Description | Sector | Country | Investment Type | Maturity | Interest Rate | Total Loan Commitment | Total Amount Outstanding | Primary Impact Objective | ||||||||||||||||
| Agricultural Products Exporter II | Farm-Product Raw Materials | Singapore | Bridge Loan | 5/21/2016 | 11.67 | % | $ | 5,000,000 | $ | 5,000,000 | N/A | |||||||||||||
| Financial Services Provider II | Miscellaneous Business Credit Institutions | Mauritius | Promissory Note18 | 5/21/2016 | 12.00 | % | $ | 15,000,000 | $ | 15,000,000 | N/A | |||||||||||||
Temporary Investments Total | $ | 20,000,000 | $ | 20,000,000 | ||||||||||||||||||||
Investment Portfolio and Temporary Investments Totals | $ | 194,800,000 | $ | 157,348,888 | ||||||||||||||||||||
| 1 | The Company’s trade finance borrowers may be granted flexibility with respect to repayment relative to the stated maturity date to accommodate specific contracts and/or business cycle characteristics. This flexibility in each case is agreed upon between the Company and the sub-advisor and between the sub-advisor and the borrower. |
| 2 | Interest rates are as of May 31, 2016 and, where applicable, are weighted averages amongst multiple transactions. Interest rates include contractual rates and accrued fees where applicable. |
| 3 | The total loan commitment represents the maximum amount that can be borrowed under the agreement. The actual amount drawn on the loan by the borrower may change over time. Loan commitments are subject to availability of funds and do not represent a contractual obligation to provide funds to a borrower. |
| 4 | The total amount outstanding represents the actual amount borrowed under the loan as of May 31, 2016. In some instances where there is a $0 balance, the borrower may have paid back the original amount borrowed under a trade finance facility and under an agreement, may borrow again. |
| 5 | The transaction is secured by specific collateral held by the borrower’s subsidiaries in Kenya, Tanzania, and Mozambique. |
| 6 | Impact data is not tracked for this investment. The Company does not track impact data for trade finance transactions that meet standard underwriting guidelines, but generally have the maturity of less than one year and involve borrowers with whom, at the time of funding, the Company does not expect to maintain an ongoing lending relationship or otherwise provide an open loan facility. |
| 7 | The interest rate includes 2.50% of deferred interest. |
| 8 | On May 25, 2016, the Company funded $1,500,000 as part of an existing $11,000,000 revolving senior secured trade finance facility with a South African electronics company that assembles affordable cellular phones and televisions. With a fixed interest rate of 13.00%, the transaction is set to mature on August 23, 2016 and is secured by the specific inventory. The borrower anticipates that the Company’s financing will support its continued growth efforts and create more jobs, particularly among the country’s female population, while increasing the supply of affordable devices in the region. |
| 9 | The Company, together with its sub-advisor, have agreed to further extend the principal maturity date to facilitate the strategic sale of the Fruit & Nut Distributor, which is expected to close on or before June 30, 2016. |
| 10 | On May 27, 2016, the Company funded $17,000,000 as part of a new senior secured term loan to a hospitality service provider operating in Cape Verde. With an interest rate of 10.00% plus 3.50% in deferred interest and a maturity date of August 21, 2021, the Company’s financing will enable the borrower to execute its growth plan and develop two new hotel resort properties located throughout Cape Verde’s archipelago. Secured through a combination of first and second lien pledges over key assets and contracts, the transaction also includes the option to exercise certain warrants (1.50% of the common shares of the borrower) at loan maturity. The borrower anticipates that the Company’s timely financing will support both temporary and permanent job creation as well as the transfer of knowledge and skills in hospitality best practices to the local labor force. |
| 11 | On May 10, 2016, the Company funded $184,308 as part of an existing $5,000,000 senior secured pre-export trade finance facility to an Italian international development logistics provider contracted by the United Nations to consolidate and ship prefabricated housing units and materials for UN mission personnel throughout Africa. With an interest rate of 8.50% plus six month Euribor (if positive) and secured by UN purchase orders, the Company’s financing will allow the borrower access to new markets and continue supporting the UN’s operations across Sub-Saharan Africa. This transaction is set to mature on October 12, 2016. For companies located in developed markets, the Company provides trade financing transactions involving exports/imports for enterprises located in developing economies. The borrower’s operating entity is an Italian-headquartered company engaged in the provision of international development logistics services. The United Kingdom was originally disclosed as the borrower’s country location given that a United Kingdom-domiciled holding company was purposely created to provide structural enhancements to the transaction. |
| 12 | The interest rate is a variable rate of one month Libor +10.5% plus 4.68% in deferred fixed interest. |
| 13 | Between May 20 and May 24, 2016, the Company funded two separate transactions totaling $1,250,000 as part of an existing $2,800,000 revolving senior secured trade finance facility to a vertically-integrated South African meat processing company. With a fixed interest rate of 14.50% and maturity date of March 17, 2017, both transactions are secured by livestock feed inventory. The Company’s financing is expected to continue supporting the borrower’s growth objectives, including expansion of its employee base, distribution network, and community engagement initiatives. |
| 14 | On May 25, 2016, the Company funded $4,570,619 as part of a new $5,000,000 senior secured four year term loan to a South African locomotive and railway equipment leasing company. With an interest rate of 12.00%, the transaction is set to mature on January 31, 2020 and is secured by first security interest over leased machinery and cash flows derived from the underlying lease contracts. The Company’s financing will be used by the borrower to purchase refurbished locomotives to fulfill pending lease contracts with various clients operating in Africa. The borrower anticipates that the Company’s financing will facilitate improvements in regional trade, market access, and productivity and competitiveness across the continent’s growth industries and geographies. |
| 15 | The Sesame Seed Exporter has a collateral coverage ratio of³1.05x. |
| 16 | On August 27, 2015, the Company was informed that the borrower had filed for judicial recuperation with the local court in Brazil. On March 31, 2016, the Company placed the Sugar Producer on non-accrual status effective August 27, 2015. Negotiations regarding an alternative repayment plan are ongoing and in line with the judicial process, which calls for the convening of an assembly of creditors on June 15, 2016. |
| 17 | Temporary investments are defined as short-term investments that are not trade finance or term loan transactions that generally expire within one year, are intended to generate a higher yield than would be realized on cash and may be unsecured positions. The temporary investments that are unsecured positions may present a higher level of risk. |
| 18 | The promissory note from the Financial Services Provider is an unsecured position and therefore may present a higher risk profile. |
As of May 31, 2016 the Company had exited the following investments:
| Investment Portfolio | ||||||||||||||||||||||||
| Description | Sector | Country | Investment Type | Transaction Date | Transaction Amount | Payoff Date | Internal Rate of Return (“IRR”)1 | Primary Impact Objective | ||||||||||||||||
| Agricultural Products Exporter I | Farm-Product Raw Materials | Singapore | Trade Finance | 4/23/2015 | $ | 10,000,000 | 2/29/2016 | 11.85 | % | N/A2 | ||||||||||||||
| Agricultural Supplies Distributor I | Miscellaneous Non-Durable Goods | South Africa | Trade Finance | 10/15/2014 | $ | 15,202,091 | 8/14/2015 | 13.11 | % | Job Creation | ||||||||||||||
| Candle Distributor | Miscellaneous Manufacturing Industries | South Africa | Trade Finance | 9/2/2014 | $ | 1,400,000 | 9/16/2015 | 14.27 | % | Job Creation | ||||||||||||||
| Cement Distributor | Cement, Hydraulic | Kenya | Trade Finance | 9/23/2014 | $ | 12,000,000 | 10/15/2015 | 15.29 | % | Job Creation | ||||||||||||||
| Construction Materials Distributor | Hardware, Plumbing, and Heating Equipment | South Africa | Trade Finance | 10/9/2014 | $ | 838,118 | 4/1/2016 | 13.00 | % | Job Creation | ||||||||||||||
| Electronics Retailer | Radio, Television, Consumer Electronics, and Music Stores | Indonesia | Term Loan | 7/26/2013 | $ | 5,000,000 | 6/17/2014 | 19.59 | % | Access to Finance | ||||||||||||||
| Farm Supplies Wholesaler | Miscellaneous Non-Durable Goods | South Africa | Trade Finance | 5/28/2015 | $ | 2,250,000 | 1/19/2016 | 13.14 | % | Agricultural Productivity | ||||||||||||||
| Fertilizer Distributor | Agricultural Chemicals | Zambia | Trade Finance | 7/17/2014 | $ | 3,000,000 | 11/4/2014 | 12.65 | % | Job Creation | ||||||||||||||
| Food Processor | Groceries and Related Products | Peru | Term Loan | 3/25/2014 | $ | 576,000 | 11/28/2014 | 14.01 | % | Job Creation | ||||||||||||||
| Frozen Seafood Exporter | Groceries and Related Products | Ecuador | Trade Finance | 6/17/2013 | $ | 240,484 | 5/14/2014 | 13.49 | % | Job Creation | ||||||||||||||
| Industrial Materials Distributor | Mineral and Ores | South Africa | Trade Finance | 11/20/2014 | $ | 4,030,000 | 12/15/2015 | 13.64 | % | Job Creation | ||||||||||||||
| Insulated Wire Manufacturer | Rolling, Drawing, and Extruding of Nonferrous Metals | Peru | Trade Finance | 5/2/2014 | $ | 1,991,000 | 12/2/2014 | 8.43 | % | Job Creation | ||||||||||||||
| International Tuna Exporter | Groceries and Related Products | Ecuador | Trade Finance | 7/17/2013 | $ | 1,000,000 | 10/9/2013 | 13.58 | % | Job Creation | ||||||||||||||
| Meat Processor I | Meat Products | South Africa | Trade Finance | 7/7/2014 | $ | 2,950,000 | 4/1/2016 | 14.08 | % | Job Creation | ||||||||||||||
| Meat Producer | Meat Products | South Africa | Trade Finance | 11/27/2015 | $ | 1,500,000 | 2/3/2016 | 14.83 | % | N/A2 | ||||||||||||||
| Rice & Bean Importer | Groceries and Related Products | South Africa | Trade Finance | 7/7/2014 | $ | 1,000,000 | 8/5/2015 | 12.97 | % | Job Creation | ||||||||||||||
| Rice Importer | Farm-Product Raw Materials | Kenya | Trade Finance | 11/6/2015 | $ | 399,653 | 5/19/2016 | 11.50 | % | Food Security | ||||||||||||||
| Rice Producer | Cash Grains | Tanzania | Trade Finance | 1/22/2015 | $ | 3,900,000 | 4/1/2016 | 12.04 | % | Job Creation | ||||||||||||||
| Investment Portfolio | ||||||||||||||||||||||||
| Description | Sector | Country | Investment Type | Transaction Date | Transaction Amount | Payoff Date | Internal Rate of Return (“IRR”)1 | Primary Impact Objective | ||||||||||||||||
| Seafood Processing Company | Miscellaneous Food Preparations and Kindred Products | Ecuador | Trade Finance | 6/19/2013 | $ | 496,841 | 7/1/2013 | 13.44 | % | Job Creation | ||||||||||||||
| Textile Distributor | Apparel, Piece Goods, and Notions | South Africa | Trade Finance | 7/25/2014 | $ | 7,026,515 | 5/30/2016 | 15.81 | % | Job Creation | ||||||||||||||
| Timber Exporter | Sawmills and Planing Mills | Chile | Trade Finance | 7/3/2013 | $ | 915,000 | 6/12/2014 | 10.25 | % | Job Creation | ||||||||||||||
| Waste Management Equipment Distributor | Machinery, Equipment, and Supplies | South Africa | Trade Finance | 2/13/2015 | $ | 310,752 | 5/15/2015 | 20.19 | % | Equality & Empowerment | ||||||||||||||
| Investment Portfolio Total | $ | 76,026,454 | ||||||||||||||||||||||
| Investment Portfolio—Weighted Average IRR | 13.89 | % | ||||||||||||||||||||||
| Temporary Investments3 | ||||||||||||||||||||||||
| Description | Sector | Country | Investment Type | Transaction Date | Transaction Amount | Payoff Date | Internal Rate of Return (“IRR”)1 | Primary Impact Objective | ||||||||||||||||
| Financial Services Provider I | Miscellaneous Business Credit Institutions | Mauritius | Promissory Note | 9/23/2014 | $ | 3,000,000 | 11/17/2014 | 15.94 | % | N/A | ||||||||||||||
| Temporary Investments Total | $ | 3,000,000 | ||||||||||||||||||||||
| Temporary Investments – Weighted Average IRR | 15.94 | % | ||||||||||||||||||||||
| Investment Portfolio and Temporary Investments Total | $ | 79,026,454 | ||||||||||||||||||||||
| Investment Portfolio and Temporary Investments – Weighted Average IRR | 13.97 | % | ||||||||||||||||||||||
| 1 | Given that the loan has been paid off, this investment is no longer part of the Company’s portfolio. The internal rate of return is defined as the gross average annual return earned through the life of an investment. The internal rate of return was calculated by our Advisor (unaudited) as the investment (loan advance) was made and cash was received (principal, interest and fees). |
| 2 | Impact data is not tracked for this investment. The Company does not track impact data for trade finance transactions that meet standard underwriting guidelines, but generally have the maturity of less than one year and involve borrowers with whom, at the time of funding, the Company does not expect to maintain an ongoing lending relationship or otherwise provide an open loan facility. |
| 3 | Temporary investments are defined as short-term investments that are not trade finance or term loan transactions that generally expire within one year, are intended to generate a higher yield than would be realized on cash and may be unsecured positions. The temporary investments that are unsecured positions may present a higher level of risk. |
Certain Portfolio Characteristics1
Total Assets (est.) | $ | 184,000,000 | ||
Current Loan Commitments | $ | 174,800,000 | ||
Leverage | 0 | % | ||
Weighted Average Portfolio Loan Size | $ | 6,301,108 | ||
Weighted Average Portfolio Duration | 1.25 years | |||
Weighted Average Position Yield | 12.21 | % | ||
Average Collateral Coverage Ratio | 1.54x | |||
USD Denominated | 100 | % | ||
Senior Secured First-Lien | 100 | % | ||
Countries | 15 | |||
Sectors | 19 |
Top Five Investments by Percentage2
| Company Description | Country | % of Total Assets | ||||
Hospitality Service Provider | Cape Verde | 9.2 | % | |||
Agriculture Distributor | Argentina | 8.2 | % | |||
Marine Logistics Provider | Nigeria | 6.9 | % | |||
Power Producer | Ghana | 6.3 | % | |||
Agricultural Products Exporter II | Singapore | 5.4 | % | |||
| Investment Type3 | Developing Economies3 | Sector Diversification3 | ||
|
|
|
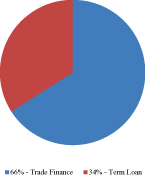
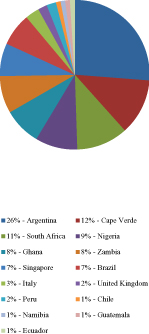

| 1 | All information provided in this section, with the exception of the Total Asset (est.) figure, does not include the Company’s temporary investment commitments such as the promissory note from the Mauritian Financial Services Provider and the bridge loan from the Singaporean Agricultural Products Exporter comprising 9.5% and 3.2%, respectively, of all the investments currently held by the Company. The promissory note from the Mauritian Financial Services Provider is an unsecured position. |
| 2 | This represents all countries/sectors where the Company currently has a loan commitment other than through a temporary investment. Due to the revolving debt nature of trade finance facilities and the timing of funding, it is possible that certain commitments currently have a zero outstanding balance and would therefore not be represented in the country/sector allocation charts, which represents invested capital. |
| 3 | The above charts represent investment type, developing economy, and sector diversification as a percentage of the total amount outstanding of the Company’s investments other than the Company’s temporary investments. The Company’s temporary investments include the promissory note from the Mauritian Financial Services Provider and the bridge loan from the Singaporean Agricultural Products Exporter comprising 9.5% and 3.2%, of all the investments currently held by the Company. |
| D. | Quarterly Report on Form 10-Q for the Quarter Ended March 31, 2016 |
On May 13, 2016, we filed our Quarterly Report on Form 10-Q for the quarter ended March 31, 2016 with the SEC. The report (without exhibits) is attached to this Supplement.
| E. | Updates to the Form of Subscription Agreement in Appendix B of the Prospectus |
The subscription agreement is beginning on page B-1 of the Prospectus is hereby deleted in its entirety and replaced with the following:
UNITED STATES
SECURITIES AND EXCHANGE COMMISSION
Washington, D.C. 20549
FORM 10-Q
x | QUARTERLY REPORT PURSUANT TO SECTION 13 OR 15(d) OF THE SECURITIES EXCHANGE ACT OF 1934 |
For the Quarterly Period Ended March 31, 2016
OR
¨ | TRANSITION REPORT PURSUANT TO SECTION 13 OR 15(d) OF THE SECURITIES EXCHANGE ACT OF 1934 |
For the transition period from to
Commission File Number 000-55432
TriLinc Global Impact Fund, LLC
(Exact name of registrant as specified in its charter)
Delaware | 36-4732802 |
(State or other jurisdiction of incorporation or organization) | (I.R.S. Employer Identification No.) |
1230 Rosecrans Avenue, Suite 605,
Manhattan Beach, CA 90266
(Address of principal executive offices)
(310) 997-0580
(Registrant’s telephone number, including area code)
(Former name, former address and former fiscal year, if changed since last report)
Indicate by check mark whether the registrant (1) has filed all reports required to be filed by Section 13 or 15(d) of the Securities Exchange Act of 1934 during the preceding 12 months (or for such shorter period that the registrant was required to file such reports), and (2) has been subject to such filing requirements for the past 90 days. Yes x No ¨
Indicate by check mark whether the registrant has submitted electronically and posted on its corporate Web site, if any, every Interactive Data File required to be submitted and posted pursuant to Rule 405 of Regulation S-T during the preceding 12 months (or for such shorter period that the registrant was required to submit and post such files). Yes x No ¨
Indicate by check mark whether the registrant is a large accelerated filer, an accelerated filer, a non-accelerated filer, or a smaller reporting company. See definitions of “large accelerated filer,” “accelerated filer” and “smaller reporting company” in Rule 12b-2 of the Exchange Act.
Large accelerated filer | ¨ | Accelerated filer | ¨ |
|
|
|
|
Non-accelerated filer | ¨ (Do not check if a smaller reporting company) | Smaller reporting company | x |
Indicate by check mark whether the registrant is a shell company (as defined in Rule 12b-2 of the Exchange Act). Yes ¨ No x
Item 1. Consolidated Financial Statements.
TriLinc Global Impact Fund, LLC
Consolidated Statements of Assets and Liabilities
|
| As of |
| |||||
|
| March 31, |
|
| December 31, |
| ||
|
| 2016 |
|
| 2015 |
| ||
|
| (Unaudited) |
|
|
|
|
| |
ASSETS |
|
|
|
|
|
|
|
|
Investments owned, at fair value (amortized cost of $126,254,063 and $101,346,528, respectively) |
| $ | 125,876,561 |
|
| $ | 101,028,104 |
|
Cash |
|
| 36,879,526 |
|
|
| 33,246,769 |
|
Interest receivable |
|
| 3,779,476 |
|
|
| 3,580,530 |
|
Due from affiliates (see Note 5) |
|
| 2,144,985 |
|
|
| 1,874,932 |
|
Prepaid expenses |
|
| 45,895 |
|
|
| 53,181 |
|
Total assets |
|
| 168,726,443 |
|
|
| 139,783,516 |
|
|
|
|
|
|
|
|
|
|
LIABILITIES |
|
|
|
|
|
|
|
|
Due to unitholders |
|
| 662,106 |
|
|
| 548,700 |
|
Management fee payable |
|
| 225,975 |
|
|
| 135,863 |
|
Unit repurchases payable |
|
| 4,502,964 |
|
|
| — |
|
Due to affiliates (see Note 5) |
|
| 146,710 |
|
|
| 472,057 |
|
Other payables |
|
| 13,533 |
|
|
| 6,289 |
|
Total liabilities |
|
| 5,551,288 |
|
|
| 1,162,909 |
|
Commitments and Contingencies (see Note 5) |
|
|
|
|
|
|
|
|
NET ASSETS |
| $ | 163,175,155 |
|
| $ | 138,620,607 |
|
|
|
|
|
|
|
|
|
|
ANALYSIS OF NET ASSETS: |
|
|
|
|
|
|
|
|
Net capital paid in on Class A units |
| $ | 96,397,340 |
|
| $ | 87,625,105 |
|
Net capital paid in on Class C units |
|
| 22,492,133 |
|
|
| 9,689,230 |
|
Net capital paid in on Class I units |
|
| 53,753,546 |
|
|
| 49,128,638 |
|
Offering costs |
|
| (9,467,864 | ) |
|
| (7,822,366 | ) |
Net assets (equivalent to $8.530 and $8.543, respectively per unit based on total units outstanding of 19,129,421 and 16,226,368, respectively) |
| $ | 163,175,155 |
|
| $ | 138,620,607 |
|
Net assets, Class A (units outstanding of 10,681,146 and 9,709,153, respectively) |
| $ | 91,110,844 |
|
| $ | 82,944,542 |
|
Net assets, Class C (units outstanding of 2,492,203 and 1,073,599, respectively) |
|
| 21,258,648 |
|
|
| 9,171,672 |
|
Net assets, Class I (units outstanding of 5,956,072 and 5,443,616, respectively) |
|
| 50,805,663 |
|
|
| 46,504,393 |
|
NET ASSETS |
| $ | 163,175,155 |
|
| $ | 138,620,607 |
|
See accompanying notes to the consolidated financial statements.
1
TriLinc Global Impact Fund, LLC
Consolidated Statements of Operations
(Unaudited)
|
|
|
| |||||
|
| March 31, |
|
| March 31, |
| ||
|
| 2016 |
|
| 2015 |
| ||
INVESTMENT INCOME |
|
|
|
|
|
|
|
|
Interest income |
| $ | 3,249,585 |
|
| $ | 1,768,866 |
|
Interest from cash |
|
| 92,269 |
|
|
| 17,616 |
|
Total investment income |
|
| 3,341,854 |
|
|
| 1,786,482 |
|
EXPENSES |
|
|
|
|
|
|
|
|
Management fees |
|
| 816,326 |
|
|
| 361,748 |
|
Incentive fees |
|
| 650,348 |
|
|
| 277,180 |
|
Professional fees |
|
| 289,031 |
|
|
| 289,988 |
|
General and administrative expenses |
|
| 201,876 |
|
|
| 144,057 |
|
Board of managers fees |
|
| 46,875 |
|
|
| 46,875 |
|
Total expenses |
|
| 2,004,456 |
|
|
| 1,119,848 |
|
Expense support payment from Sponsor |
|
| (1,914,344 | ) |
|
| (719,265 | ) |
Net expenses |
|
| 90,112 |
|
|
| 400,583 |
|
NET INVESTMENT INCOME |
|
| 3,251,742 |
|
|
| 1,385,899 |
|
Net change in unrealized depreciation on investments |
|
| (59,077 | ) |
|
| — |
|
NET INCREASE IN NET ASSETS RESULTING FROM OPERATIONS |
| $ | 3,192,665 |
|
| $ | 1,385,899 |
|
|
|
|
|
|
|
|
|
|
NET INVESTMENT INCOME PER UNITS - BASIC AND DILUTED |
| $ | 0.18 |
|
| $ | 0.18 |
|
EARNINGS PER UNITS - BASIC AND DILUTED |
| $ | 0.18 |
|
| $ | 0.18 |
|
WEIGHTED AVERAGE UNITS OUTSTANDING - BASIC AND DILUTED |
|
| 17,816,842 |
|
|
| 7,804,588 |
|
See accompanying notes to the consolidated financial statements.
2
TriLinc Global Impact Fund, LLC
Consolidated Statements of Changes in Net Assets
(Unaudited)
|
|
|
| |||||
|
| March 31, |
|
| March 31, |
| ||
|
| 2016 |
|
| 2015 |
| ||
INCREASE FROM OPERATIONS |
|
|
|
|
|
|
|
|
Net investment income |
| $ | 3,251,742 |
|
| $ | 1,385,899 |
|
Net change in unrealized depreciation on investments |
|
| (59,077 | ) |
|
| — |
|
Net increase from operations |
|
| 3,192,665 |
|
|
| 1,385,899 |
|
DECREASE FROM DISTRIBUTIONS |
|
|
|
|
|
|
|
|
Distributions to Class A unitholders |
|
| (1,872,086 | ) |
|
| (597,038 | ) |
Distributions to Class C unitholders |
|
| (300,798 | ) |
|
| (84,759 | ) |
Distributions to Class I unitholders |
|
| (1,016,190 | ) |
|
| (704,363 | ) |
Net decrease from distributions |
|
| (3,189,074 | ) |
|
| (1,386,160 | ) |
INCREASE FROM CAPITAL TRANSACTIONS |
|
|
|
|
|
|
|
|
Issuance of Class A units |
|
| 13,383,247 |
|
|
| 6,308,401 |
|
Issuance of Class C units |
|
| 12,803,403 |
|
|
| 1,165,174 |
|
Issuance of Class I units |
|
| 4,621,436 |
|
|
| 2,774,805 |
|
Repurchase of units |
|
| (4,611,631 | ) |
|
| — |
|
Offering costs |
|
| (1,645,498 | ) |
|
| (550,229 | ) |
Net increase from capital transactions |
|
| 24,550,957 |
|
|
| 9,698,151 |
|
NET INCREASE IN NET ASSETS |
|
| 24,554,548 |
|
|
| 9,697,890 |
|
Net assets at beginning of period |
|
| 138,620,607 |
|
|
| 62,289,992 |
|
Net assets at end of period |
| $ | 163,175,155 |
|
| $ | 71,987,882 |
|
See accompanying notes to the consolidated financial statements.
3
TriLinc Global Impact Fund, LLC
Consolidated Statements of Cash Flows
(Unaudited)
|
|
|
| |||||
|
| March 31, |
|
| March 31, |
| ||
|
| 2016 |
|
| 2015 |
| ||
Cash flows from operating activities |
|
|
|
|
|
|
|
|
NET INCREASE IN NET ASSETS RESULTING FROM OPERATIONS |
| $ | 3,192,665 |
|
| $ | 1,385,899 |
|
ADJUSTMENT TO RECONCILE NET INCREASE IN NET ASSETS RESULTING FROM OPERATIONS TO NET CASH USED IN OPERATING ACTIVITIES |
|
|
|
|
|
|
|
|
Purchase of investments |
|
| (49,897,194 | ) |
|
| (31,259,529 | ) |
Maturity of investments |
|
| 24,994,660 |
|
|
| 23,282,033 |
|
Net change in unrealized depreciation on investments |
|
| 59,077 |
|
|
| — |
|
Accretion of discounts on investments |
|
| (5,000 | ) |
|
| — |
|
Increase in interest receivable |
|
| (198,946 | ) |
|
| (269,141 | ) |
Increase in due from affiliates |
|
| (270,053 | ) |
|
| (329,548 | ) |
Decrease in prepaid expenses |
|
| 7,286 |
|
|
| 6,089 |
|
Increase in due to unitholders |
|
| 113,406 |
|
|
| 43,751 |
|
Increase in management fee payable |
|
| 90,112 |
|
|
| 48,263 |
|
Increase in other payable |
|
| 7,244 |
|
|
| 819 |
|
NET CASH USED IN OPERATING ACTIVITIES |
|
| (21,906,743 | ) |
|
| (7,091,364 | ) |
Cash flows from financing activities |
|
|
|
|
|
|
|
|
Net proceeds from issuance of units |
|
| 29,476,761 |
|
|
| 9,807,070 |
|
Distributions paid to unitholders |
|
| (1,857,749 | ) |
|
| (944,850 | ) |
Payments of offering costs |
|
| (1,970,845 | ) |
|
| (567,906 | ) |
Repurchase of units |
|
| (108,667 | ) |
|
| — |
|
NET CASH PROVIDED BY FINANCING ACTIVITIES |
|
| 25,539,500 |
|
|
| 8,294,314 |
|
TOTAL INCREASE IN CASH |
|
| 3,632,757 |
|
|
| 1,202,950 |
|
Cash at beginning of period |
|
| 33,246,769 |
|
|
| 7,875,917 |
|
Cash at end of period |
| $ | 36,879,526 |
|
| $ | 9,078,867 |
|
Supplemental non-cash information |
|
|
|
|
|
|
|
|
Issuance of units in connection with distribution reinvestment plan |
| $ | 1,331,325 |
|
| $ | 441,310 |
|
See accompanying notes to the consolidated financial statements.
4
TriLinc Global Impact Fund, LLC
Consolidated Schedule of Investments
As of March 31, 2016
(Unaudited)
Investment Type / Country |
| Portfolio Company |
| Sector |
| Description |
| Interest |
|
| Fees (2) |
|
| Maturity |
| Principal Amount |
|
| Participation % (4) |
|
| Amortized Cost |
|
| Fair Value |
|
| % of Net Assets |
| |||||||
Senior Secured Term Loan (1) |
|
|
|
|
|
|
|
|
|
|
|
|
|
|
|
|
|
|
|
|
|
|
|
|
|
|
|
|
|
|
|
|
|
| ||
Brazil |
| Other Investments (14) |
| Programing and Data Processing |
| IT Service Provider |
|
| 13.50% |
|
|
| 2.0 | % |
| 10/31/2019 |
| $ | 5,296,274 |
|
| N/A |
|
| $ | 5,296,274 |
|
| $ | 5,296,274 |
|
|
| 3.2 | % | |
Total Senior Secured Term Loan (1) |
|
|
|
|
|
|
|
|
|
|
|
|
|
|
|
|
|
|
|
|
|
|
|
| 5,296,274 |
|
|
| 5,296,274 |
|
|
| 3.2 | % | ||
Senior Secured Term Loan Participations (1) |
|
|
|
|
|
|
|
|
|
|
|
|
|
|
|
|
|
|
|
|
|
|
|
|
|
|
|
|
|
|
|
|
|
| ||
Brazil |
| Usivale Industria E Commercio (6) |
| Agricultural Products |
| Sugar Producer |
|
| 17.43% |
|
|
| 0.0 | % |
| 12/15/2016 - 5/15/2017 |
|
| 3,000,000 |
|
|
| 100% |
|
|
| 3,000,000 |
|
|
| 2,681,576 |
|
|
| 1.6 | % |
Nigeria |
| Helios Maritime I Ltd. (8) |
| Water Transportation |
| Marine Logistics Provider |
|
| 15.61% |
|
|
| 0.8 | % |
| 9/16/2020 |
|
| 12,956,833 |
|
|
| 100% |
|
|
| 12,867,666 |
|
|
| 12,867,666 |
|
|
| 7.9 | % |
Peru |
| Corporacion Prodesa S.R.L. (5) |
| Consumer Products |
| Diaper Manufacturer |
| 15.50%-15.60% |
|
|
| 0.0 | % |
| 12/22/2016 - 6/15/2017 |
|
| 3,500,000 |
|
|
| 100% |
|
|
| 3,500,000 |
|
|
| 3,500,000 |
|
|
| 2.1 | % | |
Total Senior Secured Term Loan Participations |
|
|
|
|
|
|
|
|
|
|
|
|
|
|
|
|
|
|
|
|
|
|
|
| 19,367,666 |
|
|
| 19,049,242 |
|
|
| 11.7 | % | ||
Senior Secured Trade Finance Participations (1) |
|
|
|
|
|
|
|
|
|
|
|
|
|
|
|
|
|
|
|
|
|
|
|
|
|
|
|
|
|
|
|
|
|
| ||
Argentina |
| Compania Argentina De Granos (15) |
| Agricultural Products |
| Agriculture Distributor |
|
| 9.00% |
|
|
| 0.0 | % |
| 9/3/2016 - 9/30/2016 |
|
| 15,000,000 |
|
|
| 52% |
|
|
| 15,000,000 |
|
|
| 15,000,000 |
|
|
| 9.2 | % |
Argentina |
| Other Investments (16) |
| Consumer Products |
| Dairy Co-Operative |
|
| 10.90% |
|
|
| 0.0 | % |
| 2/25/2016 - 3/31/2016 (12) |
|
| 6,000,000 |
|
|
| 16% |
|
|
| 6,000,000 |
|
|
| 6,000,000 |
|
|
| 3.7 | % |
Argentina |
| Frigorifico Regional Industrias Alimenticias S.A. (16) |
| Meat, Poultry & Fish |
| Beef Exporter |
|
| 11.98% |
|
|
| 0.0 | % |
| 4/30/2016 |
|
| 9,000,000 |
|
|
| 32% |
|
|
| 9,000,000 |
|
|
| 9,000,000 |
|
|
| 5.5 | % |
Argentina |
| Other Investments (16) |
| Fats and Oils |
| Oilseed Distributor |
|
| 8.89% |
|
|
| 0.0 | % |
| 2/3/2016-3/1/2016 (12) |
|
| 5,100,000 |
|
|
| 85% |
|
|
| 5,100,000 |
|
|
| 5,100,000 |
|
|
| 3.1 | % |
Chile |
| Other Investments (15) |
| Farm Products |
| Chia Seed Exporter |
|
| 11.50% |
|
|
| 0.0 | % |
| 12/11/2016 |
|
| 1,900,000 |
|
|
| 100% |
|
|
| 1,900,000 |
|
|
| 1,900,000 |
|
|
| 1.2 | % |
Ecuador |
| Other Investments (15) |
| Commercial Fishing |
| Fish Processor & Exporter |
|
| 9.00% |
|
|
| 0.0 | % |
| 6/19/2016 |
|
| 1,462,700 |
|
|
| 100% |
|
|
| 1,462,700 |
|
|
| 1,462,700 |
|
|
| 0.9 | % |
Ghana |
| Other Investments (17) |
| Electric Services |
| Power Producer |
|
| 11.50% |
|
|
| 0.0 | % |
| 3/10/2017 |
|
| 6,000,000 |
|
|
| 35% |
|
|
| 6,000,000 |
|
|
| 6,000,000 |
|
|
| 3.7 | % |
Guatemala |
| Other Investments (15) |
| Farm Products |
| Sesame Seed Exporter |
|
| 12.00% |
|
|
| 0.0 | % |
| 3/31/2016 |
|
| 1,000,000 |
|
|
| 25% |
|
|
| 1,000,000 |
|
|
| 1,000,000 |
|
|
| 0.6 | % |
Kenya |
| Other Investments (17) |
| Cash Grains |
| Rice Importer |
|
| 11.33% |
|
|
| 0.0 | % |
| 5/15/2016 |
|
| 24,470 |
|
|
| 48% |
|
|
| 24,470 |
|
|
| 24,470 |
|
|
| 0.0 | % |
Namibia |
| Other Investments (16) |
| Packaged Foods & Meats |
| Consumer Goods Distributor |
|
| 12.00% |
|
|
| 0.0 | % |
| 3/3/2016 (3) |
|
| 1,000,000 |
|
|
| 43% |
|
|
| 1,000,000 |
|
|
| 1,000,000 |
|
|
| 0.6 | % |
Singapore |
| Export Trading Group Pte. Ltd. (7) (17) |
| Agricultural Products |
| Agricultural Products Exporter |
|
| 11.50% |
|
|
| 0.0 | % |
| 4/1/2016 |
|
| 10,000,000 |
|
|
| 16% |
|
|
| 10,000,000 |
|
|
| 10,000,000 |
|
|
| 6.1 | % |
South Africa |
| Other Investments (17) |
| Communications equipment |
| Electronics Assembler |
|
| 13.00% |
|
|
| 0.0 | % |
| 1/29/2016 - 4/15/2016 (3) |
|
| 3,728,340 |
|
|
| 25% |
|
|
| 3,728,340 |
|
|
| 3,728,340 |
|
|
| 2.3 | % |
South Africa |
| Other Investments (17) |
| Meat, Poultry & Fish |
| Meat Processor |
|
| 14.50% |
|
|
| 0.0 | % |
| 12/15/2015 (12) |
|
| 600,000 |
|
|
| 18% |
|
|
| 600,000 |
|
|
| 600,000 |
|
|
| 0.4 | % |
South Africa |
| Other Investments (17) |
| Food Products |
| Fruit & Nut Distributor |
|
| 17.50% |
|
|
| 0.0 | % |
| 5/22/2015 (9) |
|
| 761,684 |
|
|
| 19% |
|
|
| 820,761 |
|
|
| 761,684 |
|
|
| 0.5 | % |
South Africa |
| Other Investments (17) |
| Textiles, Apparel & Luxury Goods |
| Textile Distributor |
|
| 15.00% |
|
|
| 0.0 | % |
| 5/17/2016 - 5/28/2016 |
|
| 280,181 |
|
|
| 18% |
|
|
| 280,181 |
|
|
| 280,181 |
|
|
| 0.2 | % |
South Africa |
| Other Investments (17) |
| Construction Materials |
| Construction Materials Distributor |
|
| 12.75% |
|
|
| 0.0 | % |
| 7/1/2015 (12) |
|
| 167,355 |
|
|
| 14% |
|
|
| 167,355 |
|
|
| 167,355 |
|
|
| 0.1 | % |
South Africa |
| Other Investments (16) |
| Metals & Mining |
| Mine Remediation Company |
|
| 17.50% |
|
|
| 0.0 | % |
| 6/15/2016 - 8/15/2016 |
|
| 2,500,000 |
|
|
| 27% |
|
|
| 2,500,000 |
|
|
| 2,500,000 |
|
|
| 1.5 | % |
South Africa |
| Other Investments (17) |
| Agricultural Products |
| Agricultural Supplies Distributor |
|
| 10.38% |
|
|
| 0.0 | % |
| 4/24/2016 - 5/30/2016 |
|
| 2,027,789 |
|
|
| 44% |
|
|
| 2,027,789 |
|
|
| 2,027,789 |
|
|
| 1.2 | % |
Tanzania |
| Other Investments (17) |
| Cash Grains |
| Rice Producer |
|
| 11.50% |
|
|
| 0.0 | % |
| 10/26/2015 (12) |
|
| 3,900,000 |
|
|
| 74% |
|
|
| 3,900,000 |
|
|
| 3,900,000 |
|
|
| 2.4 | % |
Zambia |
| Other Investments (17) |
| Fertilizer & Agricultural Chemicals |
| Farm Supplies Distributor |
| 12.08%-12.50% |
|
|
| 0.0 | % |
| 10/25/15 - 5/3/2016 (13) |
|
| 5,078,526 |
|
|
| 19% |
|
|
| 5,078,526 |
|
|
| 5,078,526 |
|
|
| 3.1 | % | |
Zambia |
| Other Investments (15) |
| Primary Metal Industries |
| Integrated Steel Producer |
|
| 13.00% |
|
|
| 0.0 | % |
| 8/13/2016 |
|
| 6,000,000 |
|
|
| 86% |
|
|
| 6,000,000 |
|
|
| 6,000,000 |
|
|
| 3.7 | % |
Total Senior Secured Trade Finance Participations |
|
|
|
|
|
|
|
|
|
|
|
|
|
|
|
|
|
|
|
|
|
|
|
| 81,590,122 |
|
|
| 81,531,045 |
|
|
| 50.0 | % | ||
Short Term Notes and Bridge Loan (1) |
|
|
|
|
|
|
|
|
|
|
|
|
|
|
|
|
|
|
|
|
|
|
|
|
|
|
|
|
|
|
|
|
|
| ||
Mauritius |
| Barak Fund Management Ltd.(10), (17) |
| Financial Services |
| Investment Manager |
|
| 12.00% |
|
|
| 0.8 | % |
| 5/22/2016 |
|
| 15,000,000 |
|
| N/A |
|
|
| 15,000,000 |
|
|
| 15,000,000 |
|
|
| 9.2 | % | |
Singapore |
| Export Trading Group Pte. Ltd. (11), (17) |
| Agricultural Products |
| Agricultural Products Exporter |
|
| 12.00% |
|
|
| 0.8 | % |
| 6/20/2016 |
|
| 5,000,000 |
|
|
| 8% |
|
|
| 5,000,000 |
|
|
| 5,000,000 |
|
|
| 3.1 | % |
Total Short Term Notes and Bridge Loan |
|
|
|
|
|
|
|
|
|
|
|
|
|
|
|
|
|
|
|
|
|
|
|
| 20,000,000 |
|
|
| 20,000,000 |
|
|
| 12.3 | % | ||
|
|
|
|
|
|
|
|
|
|
|
|
|
|
|
|
|
|
|
|
|
|
|
|
|
|
|
|
|
|
|
|
|
|
|
|
|
Total Investments |
|
|
|
|
|
|
|
|
|
|
|
|
|
|
|
|
|
|
|
|
|
|
|
|
| $ | 126,254,063 |
|
| $ | 125,876,561 |
|
|
|
|
|
|
See accompanying notes to the consolidated financial statements.
|
5
1 | Refer to Notes 3 and 4 of the consolidated financial statements for additional information on the Company’s investments. |
2 | Fees may include upfront, origination, commitment, facility and/or other fees that the borrower must contractually pay to the Company. Fees, if any, are typically received in connection with term loan transactions and are rarely applicable to trade finance transactions. |
3 | Trade finance borrowers may be granted flexibility with respect to repayment relative to the stated maturity date to accommodate specific contracts and/or business cycle characteristics. This flexibility in each case is agreed upon between the Company and the sub-advisor and between the sub-advisor and the borrower. The Company typically does not consider trade finance investments to be past due until they are over 90 days past the maturity date. |
4 | Percentage of the Company’s participation in total borrowings outstanding under sub-advisor provided financing facility. |
5 | Interest accruing includes 2.5% of deferred interest due at maturity. See discussion about Prodesa in Note 3. |
6 | Interest includes 5.0% of penalty interest due to the borrower missing 11 interest payments. This investment was on non-accrual status as of March 31, 2016. See Note 3. |
7 | The transaction is secured by specific collateral held by the borrower’s subsidiaries in Kenya, Tanzania, and Zambia. |
8 | Interest accrues at a variable rate of one-month Libor + 10.5%, which is paid monthly, and also includes 4.68% of deferred interest due at maturity. Monthly principal payments starting in May 2016 |
9 | The Company, together with its Sub-Advisor, have agreed to extend the principal maturity date to facilitate the strategic sale of this borrower. The borrower has been experiencing some cash flow difficulties, but has made some partial payments of principal. The amortized cost includes $152,923 of interest which has been capitalized as of March 31, 2016. This investment was on non-accrual status as of March 31, 2016. See Note 3. |
10 | Barak Fund Management Ltd. is a sub-advisor to the Company. This unsecured short term note was provided to support a strategic temporary investment. |
11 | Senior secured bridge loan secured by shares in the borrower. |
12 | This investment was repaid in full during April 2016. |
13 | $4.1 million of this investment has a maturity date of 10/25/15. The Zambian government, as the purchaser of fertilizer, is responsible for the repayment of this trade finance transaction. The Company has access to insurance should the Zambian government not pay. In addition, the Company ultimately has recourse to the borrower for repayment. |
14 | Principal and interest paid monthly. |
15 | Monthly interest only payment. Principal due at maturity. |
16 | Quarterly interest only payment. Principal due at maturity. |
17 | Principal and interest paid at maturity. |
6
TriLinc Global Impact Fund, LLC
Consolidated Schedule of Investments
December 31, 2015
Investment Type / Country |
| Portfolio Company |
| Sector |
| Description |
| Interest |
|
| Fees (2) |
|
| Maturity (3) |
| Principal Amount |
|
| Current Commitment (4) |
|
| Amortized Cost |
|
| Fair Value |
|
| % of Net Assets |
| |||||||
Senior Secured Term Loan (1) |
|
|
|
|
|
|
|
|
|
|
|
|
|
|
|
|
|
|
|
|
|
|
|
|
|
|
|
|
|
|
|
|
|
| ||
Brazil |
| Other Investments |
| Programing and Data Processing |
| IT Service Provider |
|
| 13.50% |
|
|
| 0.0 | % |
| 10/31/2019 |
| $ | 5,474,534 |
|
| $ | 14,000,000 |
|
| $ | 5,474,534 |
|
| $ | 5,474,534 |
|
|
| 3.9 | % |
Total Senior Secured Term Loan (1) |
|
|
|
|
|
|
|
|
|
|
|
|
|
|
|
|
|
|
|
|
|
|
|
| 5,474,534 |
|
|
| 5,474,534 |
|
|
| 3.9 | % | ||
Senior Secured Term Loan Participations (1) |
|
|
|
|
|
|
|
|
|
|
|
|
|
|
|
|
|
|
|
|
|
|
|
|
|
|
|
|
|
|
|
|
|
| ||
Brazil |
| Usivale Industria E Commercio (6) |
| Agricultural Products |
| Sugar Producer |
|
| 17.43% |
|
|
| 0.0 | % |
| 12/15/2016-5/15/2017 |
|
| 3,000,000 |
|
|
| 3,000,000 |
|
|
| 3,000,000 |
|
|
| 2,681,576 |
|
|
| 1.9 | % |
Nigeria |
| Helios Maritime I Ltd. (8) |
| Water Transportation |
| Marine Logistics Provider |
|
| 15.42% |
|
|
| 0.8 | % |
| 9/16/2020 |
|
| 12,956,833 |
|
|
| 16,050,000 |
|
|
| 12,862,666 |
|
|
| 12,862,666 |
|
|
| 9.3 | % |
Peru |
| Corporacion Prodesa S.R.L. (5) |
| Consumer Products |
| Diaper Manufacturer |
| 15.50%-15.60% |
|
|
| 0.0 | % |
| 12/22/2016-6/15/2017 |
|
| 2,940,000 |
|
|
| 3,250,000 |
|
|
| 2,940,000 |
|
|
| 2,940,000 |
|
|
| 2.1 | % | |
Total Senior Secured Term Loan Participations |
|
|
|
|
|
|
|
|
|
|
|
|
|
|
|
|
|
|
|
|
|
|
|
| 18,802,666 |
|
|
| 18,484,242 |
|
|
| 13.3 | % | ||
Senior Secured Trade Finance Participations (1) |
|
|
|
|
|
|
|
|
|
|
|
|
|
|
|
|
|
|
|
|
|
|
|
|
|
|
|
|
|
|
|
|
|
| ||
Argentina |
| Compania Argentina De Granos |
| Agricultural Products |
| Agriculture Distributor |
|
| 9.00% |
|
|
| 0.0 | % |
| 12/15/2015 - 9/23/16 |
|
| 9,700,000 |
|
|
| 13,000,000 |
|
|
| 9,700,000 |
|
|
| 9,700,000 |
|
|
| 7.0 | % |
Argentina |
| Other Investments |
| Consumer Products |
| Dairy Co-Operative |
|
| 10.90% |
|
|
| 0.0 | % |
| 2/25/16 - 3/31/16 |
|
| 6,000,000 |
|
|
| 6,000,000 |
|
|
| 6,000,000 |
|
|
| 6,000,000 |
|
|
| 4.3 | % |
Argentina |
| Frigorifico Regional Industrias Alimenticias S.A. |
| Meat, Poultry & Fish |
| Beef Exporter |
|
| 11.98% |
|
|
| 0.0 | % |
| 4/30/2016 |
|
| 9,000,000 |
|
|
| 9,000,000 |
|
|
| 9,000,000 |
|
|
| 9,000,000 |
|
|
| 6.5 | % |
Argentina |
| Other Investments |
| Fats and Oils |
| Oilseed Distributor |
|
| 8.89% |
|
|
| 0.0 | % |
| 2/3/2016 |
|
| 3,100,000 |
|
|
| 3,100,000 |
|
|
| 3,100,000 |
|
|
| 3,100,000 |
|
|
| 2.2 | % |
Chile |
| Other Investments |
| Farm Products |
| Chia Seed Exporter |
|
| 11.50% |
|
|
| 0.0 | % |
| 12/11/2016 |
|
| 1,900,000 |
|
|
| 2,000,000 |
|
|
| 1,900,000 |
|
|
| 1,900,000 |
|
|
| 1.4 | % |
Ecuador |
| Other Investments |
| Commercial Fishing |
| Fish Processor & Exporter |
|
| 9.00% |
|
|
| 0.0 | % |
| 6/19/2016 |
|
| 1,756,243 |
|
|
| 2,000,000 |
|
|
| 1,756,243 |
|
|
| 1,756,243 |
|
|
| 1.3 | % |
Guatemala |
| Other Investments |
| Farm Products |
| Sesame Seed Exporter |
|
| 12.00% |
|
|
| 0.0 | % |
| 3/31/2016 |
|
| 1,000,000 |
|
|
| 2,000,000 |
|
|
| 1,000,000 |
|
|
| 1,000,000 |
|
|
| 0.7 | % |
Kenya |
| Other Investments |
| Cash Grains |
| Rice Importer |
|
| 11.33% |
|
|
| 0.0 | % |
| 2/18/2016 |
|
| 375,182 |
|
|
| 1,000,000 |
|
|
| 375,182 |
|
|
| 375,182 |
|
|
| 0.3 | % |
Namibia |
| Other Investments |
| Packaged Foods & Meats |
| Consumer Goods Distributor |
|
| 12.00% |
|
|
| 0.0 | % |
| 3/03/16 |
|
| 1,000,000 |
|
|
| 2,000,000 |
|
|
| 1,000,000 |
|
|
| 1,000,000 |
|
|
| 0.7 | % |
Singapore |
| Export Trading Group Pte. Ltd. (7) |
| Agricultural Products |
| Agricultural Products Exporter |
|
| 11.50% |
|
|
| 0.0 | % |
| 2/7/2016 |
|
| 10,000,000 |
|
|
| 10,000,000 |
|
|
| 10,000,000 |
|
|
| 10,000,000 |
|
|
| 7.2 | % |
South Africa |
| Other Investments |
| Communications equipment |
| Electronics Assembler |
|
| 13.00% |
|
|
| 0.0 | % |
| 1/29/16 - 4/15/16 |
|
| 5,918,086 |
|
|
| 11,000,000 |
|
|
| 5,918,086 |
|
|
| 5,918,086 |
|
|
| 4.3 | % |
South Africa |
| Other Investments |
| Meat, Poultry & Fish |
| Meat Processor |
|
| 14.50% |
|
|
| 0.0 | % |
| 12/22/15 - 1/31/16 |
|
| 2,524,816 |
|
|
| 4,300,000 |
|
|
| 2,524,816 |
|
|
| 2,524,816 |
|
|
| 1.8 | % |
South Africa |
| Other Investments (9) |
| Food Products |
| Fruit & Nut Distributor |
|
| 17.50% |
|
|
| 0.0 | % |
| 5/22/2015 |
|
| 667,838 |
|
|
| 1,250,000 |
|
|
| 667,838 |
|
|
| 667,838 |
|
|
| 0.5 | % |
South Africa |
| Other Investments |
| Textiles, Apparel & Luxury Goods |
| Textile Distributor |
|
| 15.00% |
|
|
| 0.0 | % |
| 1/13/16 - 2/11/16 |
|
| 724,219 |
|
|
| 2,500,000 |
|
|
| 724,219 |
|
|
| 724,219 |
|
|
| 0.5 | % |
South Africa |
| Other Investments |
| Construction Materials |
| Construction Materials Distributor |
|
| 12.75% |
|
|
| 0.0 | % |
| 7/1/2015 |
|
| 181,943 |
|
|
| 750,000 |
|
|
| 181,943 |
|
|
| 181,943 |
|
|
| 0.1 | % |
South Africa |
| Other Investments |
| Metals & Mining |
| Mine Remediation Company |
|
| 17.50% |
|
|
| 0.0 | % |
| 6/15/16 - 8/15/16 |
|
| 2,500,000 |
|
|
| 2,500,000 |
|
|
| 2,500,000 |
|
|
| 2,500,000 |
|
|
| 1.8 | % |
South Africa |
| Other Investments |
| Agricultural Products |
| Agricultural Supplies Distributor |
|
| 10.38% |
|
|
| 0.0 | % |
| 1/14/2016 |
|
| 5,071,000 |
|
|
| 10,000,000 |
|
|
| 5,071,000 |
|
|
| 5,071,000 |
|
|
| 3.7 | % |
South Africa |
| Other Investments |
| Fertilizer & Agricultural Chemicals |
| Farm Supplies Wholesaler |
|
| 12.50% |
|
|
| 0.0 | % |
| 10/17/15 - 12/03/15 |
|
| 1,250,000 |
|
|
| 1,500,000 |
|
|
| 1,250,000 |
|
|
| 1,250,000 |
|
|
| 0.9 | % |
Tanzania |
| Other Investments |
| Cash Grains |
| Rice Producer |
|
| 11.50% |
|
|
| 0.0 | % |
| 10/26/2015 |
|
| 3,900,000 |
|
|
| 3,900,000 |
|
|
| 3,900,000 |
|
|
| 3,900,000 |
|
|
| 2.8 | % |
Zambia |
| Other Investments |
| Fertilizer & Agricultural Chemicals |
| Farm Supplies Distributor |
| 12.08%-12.50% |
|
|
| 0.0 | % |
| 10/25/2015 |
|
| 4,500,000 |
|
|
| 10,000,000 |
|
|
| 4,500,000 |
|
|
| 4,500,000 |
|
|
| 3.2 | % | |
Zambia |
| Other Investments |
| Primary Metal Industries |
| Integrated Steel Producer |
|
| 13.00% |
|
|
| 0.0 | % |
| 2/14/2016 |
|
| 6,000,000 |
|
|
| 6,000,000 |
|
|
| 6,000,000 |
|
|
| 6,000,000 |
|
|
| 4.3 | % |
Total Senior Secured Trade Finance Participations |
|
|
|
|
|
|
|
|
|
|
|
|
|
|
|
|
|
|
|
|
|
|
|
| 77,069,328 |
|
|
| 77,069,328 |
|
|
| 55.6 | % | ||
Total Investments |
|
|
|
|
|
|
|
|
|
|
|
|
|
|
|
|
|
|
|
|
|
|
|
|
| $ | 101,346,528 |
|
| $ | 101,028,104 |
|
|
|
|
|
See accompanying notes to the consolidated financial statements.
|
1 | Refer to Notes 3 and 4 of the consolidated financial statements for additional information on the Company’s investments. |
2 | Fees may include upfront, origination, commitment, facility and/or other fees that the borrower must contractually pay to the Company. Fees, if any, are typically received in connection with term loan transactions and are rarely applicable to trade finance transactions. |
3 | Trade finance borrowers may be granted flexibility with respect to repayment relative to the stated maturity date to accommodate specific contracts and/or business cycle characteristics. This flexibility in each case is agreed upon between the Company and the sub-advisor and between the sub-advisor and the borrower. |
7
4 | Loan commitments are subject to the availability of funds and do not represent a contractual obligation to provide funding to the borrower. |
5 | Interest accruing includes 2.5% of deferred interest due at maturity. |
6 | Interest includes 5.0% of penalty interest due to the borrower missing 11 interest payments. This investment was on non-accrual status as of March 31, 2016. See Note 3. |
7 | The transaction is secured by specific collateral held by the borrower’s subsidiaries in Kenya, Tanzania, and Zambia. |
8 | Interest accrues at a variable rate of one-month Libor + 10.5%, which is paid currently, and also includes 4.68% of deferred interest due at maturity. |
9 | The Company, together with its Sub-Advisor, have agreed to extend the principal maturity date to facilitate the strategic sale of this borrower. The borrower has been experiencing some cash flow difficulties but has made some partial payments of principal. |
8
TRILINC GLOBAL IMPACT FUND, LLC
Notes to Consolidated Financial Statements
March 31, 2016
(Unaudited)
Note 1. Organization and Operations of the Company
TriLinc Global Impact Fund, LLC (the “Company”) was organized as a Delaware limited liability company on April 30, 2012 and formally commenced operations on June 11, 2013. The Company makes impact investments in Small and Medium Enterprises, known as SMEs, primarily in developing economies that provide the opportunity to achieve both competitive financial returns and positive measurable impact. The Company uses the proceeds raised from the issuance of units to invest in SMEs through local market sub-advisors in a diversified portfolio of financial assets, including direct loans, convertible debt instruments, trade finance, structured credit and preferred and common equity investments. The Company’s investment objectives are to generate current income, capital preservation and modest capital appreciation primarily through investments in SMEs. The Company is externally managed by TriLinc Advisors, LLC (the “Advisor”). The Advisor is an investment advisor registered with the SEC.
TriLinc Global, LLC (the “Sponsor”) owns 85% of the units of the Advisor, and is the sponsor of the Company. Strategic Capital Advisory Services, LLC (“SCAS”) owns 15% of the Advisor, and is considered an affiliate of the Company. The Sponsor employs staff who operate both the Advisor and the Company. The Sponsor, the Advisor and SCAS are Delaware limited liability companies.
In May 2012, the Advisor purchased 22,161 Class A units for aggregate gross proceeds of $200,000. The Company commenced its initial public offering of up to $1.5 billion in units of limited liability company interest (the “Offering”) on February 25, 2013. On June 11, 2013, the Company satisfied its minimum offering requirement of $2,000,000 when the Sponsor purchased 321,330 Class A units for aggregate gross proceeds of $2,900,000 and the Company commenced operations. In February 2015, the Company elected to extend its current offering period for up to an additional one year period, expiring on February 25, 2016. On November 18, 2015, the Company elected to extend its current offering for up to an additional six month period, expiring August 25, 2016. On February 19, 2016, the Company elected to further extend its current offering to December 31, 2016. Our board has the right to further extend or terminate the Offering at any time.
Although the Company was organized and intends to conduct its business in a manner so that it is not required to register as an investment company under the Investment Company Act of 1940, as amended, the consolidated financial statements are prepared using the specialized accounting principles of the Financial Accounting Standards Board Accounting Standards Codification (“ASC”) Topic 946, Financial Services — Investment Companies. Overall, the Company’s management believes the use of investment company accounting makes the Company’s financial statements more useful to investors and other financial statement users since it allows a more appropriate basis of comparison to other entities with similar objectives.
To assist the Company in achieving its investment objective, the Company makes investments via wholly owned subsidiaries, all of which are Cayman Islands exempted companies. As of March 31, 2016, the Company’s subsidiaries are as follows:
| · | TriLinc Global Impact Fund – Asia, Ltd. |
| · | TriLinc Global Impact Fund – Latin America, Ltd. |
| · | TriLinc Global Impact Fund – Trade Finance, Ltd. |
| · | TriLinc Global Impact Fund – African Trade Finance, Ltd. |
| · | TriLinc Global Impact Fund – Africa, Ltd. |
| · | TriLinc Global Impact Fund – Latin America II, Ltd. |
| · | TriLinc Global Impact Fund – African Trade Finance II, Ltd. |
| · | TriLinc Global Impact Fund – Latin America III, Ltd. |
Through March 31, 2016, the Company has made, through its subsidiaries, loans in several countries located in South America, Asia and Africa.
Note 2. Significant Accounting Policies
Basis of Presentation
The Company’s financial information is prepared in accordance with accounting principles generally accepted in the United States of America (“GAAP”). The Company follows the accounting and reporting guidance in the Financial Accounting Standards Board Accounting Standards Codification (“ASC”) Topic 946 — Financial Services, Investment Companies (“ASC 946”). The preparation of financial statements in accordance with GAAP requires management to make estimates and assumptions that affect the
9
reported amounts of assets and liabilities and disclosure of contingent assets and liabilities at the date of the financial statements and the reported amounts of revenues and expenses during the reporting period. Actual results could differ from those estimates. These financial statements are presented in United States dollars, which is the functional and reporting currency of the Company and all its subsidiaries.
The interim consolidated financial statements and notes are presented as permitted by the requirements for Quarterly Reports on Form 10-Q. Certain financial information that is normally included in annual financial statements, including certain financial statement footnotes, prepared in accordance with GAAP is not required for interim reporting purposes and has been omitted herein. These consolidated financial statements should be read in conjunction with the Company’s consolidated financial statements and notes related thereto included in the Company’s Annual Report on Form 10-K for the year ended December 31, 2015, which was filed with the Securities and Exchange Commission (“SEC”) on March 30, 2016.
The results of operations for the three months ended March 31, 2016 are not necessarily indicative of the results that ultimately may be achieved for the full year ending December 31, 2016.
The accompanying consolidated financial statements include the accounts of the Company and its subsidiaries, which were established to hold certain investments of the Company. The Company owns 100% of each subsidiary and, as such, the subsidiaries are consolidated into the Company’s consolidated financial statements. Transactions between subsidiaries, to the extent they occur, are eliminated in consolidation. The consolidated financial statements reflect all adjustments, consisting solely of normal recurring accruals, that, in the opinion of management, are necessary for the fair presentation of the results of the operations and financial condition as of and for the periods presented.
Certain prior year amounts have been reclassified to conform to the current year presentation.
Cash
Cash consists of demand deposits at a financial institution. Such deposits may be in excess of the Federal Deposit Insurance Corporation insurance limits. The Company considers the credit risk of this financial institution to be remote and has not experienced and does not expect to experience any losses in any such accounts.
Prepaid expenses
Prepaid expenses represent prepaid insurance paid by the Company during 2015. Prepaid insurance is being amortized over the term of the insurance policy which is one year. The amortization of prepaid expenses for the three months ended March 31, 2016 and 2015 is reimbursable to the Company by the Sponsor under the Amended and Restated Operating Expense Responsibility Agreement.
Revenue Recognition
The Company records interest income on an accrual basis to the extent that the Company expects to collect such amounts. The Company does not accrue as a receivable interest on loans for accounting purposes if there is reason to doubt the ability to collect such interest. Structuring, upfront and similar fees are recorded as a discount on investments purchased and are accreted into interest income, on a straight line basis, which the Company has determined not to be materially different from the effective yield method.
The Company records prepayment fees for loans and debt securities paid back to the Company prior to the maturity date as income upon receipt.
The Company generally places loans on non-accrual status when principal and interest are past due 90 days or more or when there is a reasonable doubt that principal or interest will be collected. If, however, management believes the principal and interest will be collected, a loan may be left on accrual status during the period the Company is pursuing repayment of the loan, Accrued interest is generally reversed when a loan is placed on non-accrual. Interest payments received on non-accrual loans may be recognized as income or applied to principal depending upon management’s judgment of the financial condition of the borrower. Non-accrual loans are generally restored to accrual status when past due principal and interest is paid and, in the Company’s management’s judgment, is likely to remain current over the remainder of the term. At March 31, 2016, two portfolio companies were on non-accrual status with an aggregate fair value of $3,443,260 or 2.1% of the fair value of the Company’s total investments.
Valuation of Investments
The Company applies fair value accounting to all of its investments in accordance with ASC Topic 820, Fair Value Measurement (“ASC 820”). ASC 820 requires enhanced disclosures about assets and liabilities that are measured and reported at fair
10
value. As defined in ASC 820, fair value is the price that would be received when selling an asset or paid to transfer a liability in an orderly transaction between market participants at the measurement date. In accordance with ASC 820, the Company has categorized its investments into a three-level fair value hierarchy as discussed in Note 4.
ASC 820 establishes a hierarchal disclosure framework that prioritizes and ranks the level of market price observability of inputs used in measuring investments at fair value. Market price observability is affected by a number of factors, including the type of investment and the characteristics specific to the investment. Investments with readily available active quoted prices or for which fair value can be measured from actively quoted prices generally will have a higher degree of market price observability and a lesser degree of judgment used in measuring fair value.
Based on the observability of the inputs used in the valuation techniques, the Company is required to provide disclosures on fair value measurements according to the fair value hierarchy. The fair value hierarchy ranks the observability of the inputs used to determine fair values. Investments carried at fair value are classified and disclosed in one of the following three categories:
| · | Level 1 — Valuations based on unadjusted quoted prices in active markets for identical assets or liabilities that the Company has the ability to access at the measurement date. |
| · | Level 2 — Valuations based on inputs other than quoted prices included in Level 1, which are either directly or indirectly observable. |
| · | Level 3 — Valuations based on inputs that are unobservable and where there is little, if any, market activity at the measurement date. The inputs for the determination of fair value may require significant management judgment or estimation and is based upon management’s assessment of the assumptions that market participants would use in pricing the assets or liabilities. These investments include debt and equity investments in private companies or assets valued using the market or income approach and may involve pricing models whose inputs require significant judgment or estimation because of the absence of any meaningful current market data for identical or similar investments. The inputs in these valuations may include, but are not limited to, capitalization and discount rates and earnings before interest, taxes, depreciation and amortization (“EBITDA”) multiples. The information may also include pricing information or broker quotes which include a disclaimer that the broker would not be held to such a price in an actual transaction. Certain investments may be valued based upon estimated value of underlying collateral and include adjustments deemed necessary for estimates of costs to obtain control and liquidate available collateral. The non-binding nature of consensus pricing and/or quotes accompanied by disclaimer would result in classification as Level 3 information, assuming no additional corroborating evidence. |
The inputs used in the determination of fair value may require significant judgment or estimation.
Investments for which market quotations are readily available are valued at those quotations. Most of the Company’s investments are loans to private companies, which are not actively traded in any market and for which quotations are not available. For those investments for which market quotations are not readily available, or when such market quotations are deemed by the Advisor not to represent fair value, the Company’s board of managers has approved a multi-step valuation process to be followed each fiscal quarter, as described below:
| 1. | Each investment is valued by the Advisor in collaboration with the relevant sub-advisor; |
| 2. | For all investments with a maturity of greater than 12 months, the Company has engaged Duff & Phelps, LLC (“Duff & Phelps”) to conduct a review on the reasonableness of the Company’s internal estimates of fair value on each asset on a quarterly rotating basis, with each of such investments being reviewed at least annually, and provide an opinion that the Advisor’s estimate of fair value for each investment is reasonable; |
| 3. | The audit committee of the Company’s board of managers reviews and discusses the preliminary valuation prepared by the Advisor and any opinion rendered by Duff & Phelps; and |
| 4. | The board of managers discusses the valuations and determines the fair value of each investment in the Company’s portfolio in good faith based on the input of the Advisor, Duff & Phelps and the audit committee. The board of managers is ultimately responsible for the determination, in good faith, of the fair value of each investment. |
Below is a description of factors that the Company’s board of managers may consider when valuing the Company’s investments.
Fixed income investments are typically valued utilizing a market approach, an income approach, or both approaches, as appropriate. The market approach uses prices and other relevant information generated by market transactions involving identical or comparable assets or liabilities (including the sale of a business). The income approach uses valuation techniques to convert future amounts (for example, interest and principal payments) to a single present value amount (discounted) calculated based on an appropriate discount rate. The measurement is based on the net present value indicated by current market expectations about those
11
future amounts. In following these approaches, the types of factors that the Company may take into account in valuing the Company’s investments include, as applicable: available current market data, including relevant and applicable market trading and transaction comparables, applicable market yields and multiples, security covenants, call protection provisions, information rights, the nature and realizable value of any collateral, the borrower’s ability to make payments, its earnings and discounted cash flows, the markets in which the company does business, comparisons of financial ratios of peer companies that are public, the principal market for the borrower’s securities and an estimate of the borrower’s enterprise value, among other factors.
The Company may also look to private merger and acquisition statistics, public trading multiples discounted for illiquidity and other factors, valuations implied by third-party investments in the portfolio companies or industry practices in determining fair value. The Company may also consider the size and scope of a portfolio company and its specific strengths and weaknesses, as well as any other factors the Company deems relevant in measuring the fair values of the Company’s investments.
Net Realized Gains or Losses and Net Change in Unrealized Appreciation or Depreciation on Investments
The Company measures net realized gains or losses by the difference between the net proceeds from the repayment or sale on investments and the amortized cost basis of the investment including unamortized upfront fees and prepayment penalties. Realized gains or losses on the disposition of an investment are calculated using the first in first out (FIFO) method, utilizing the amortized cost basis of the investment, without regard to unrealized appreciation or depreciation previously recognized, but considering unamortized upfront fees and prepayment penalties. Net change in unrealized appreciation or depreciation reflects the change in portfolio investment values during the reporting period, including any reversal of previously recorded unrealized appreciation or depreciation, when gains or losses are realized.
Payment-in-Kind Interest
The Company may have investments that contain a payment-in-kind, or PIK, interest provision. For loans with contractual PIK interest, any interest will be added to the principal balance of such investments and be recorded as income, if the valuation indicates that such interest is collectible.
Income Taxes
The Company, as a limited liability company, allocates all income or loss to its unitholders according to their respective percentage of ownership. Therefore, no provision for federal or state income taxes has been included in these financial statements.
The Company may be subject to withholding taxes on income and capital gains imposed by certain countries in which the Company invests. The withholding tax on income is netted against the income accrued or received. Any reclaimable taxes are recorded as income. The withholding tax on realized or unrealized gain is recorded as a liability.
The Company follows the guidance for uncertainty in income taxes included in the ASC 740, Income Taxes. This guidance requires the Company to determine whether a tax position of the Company is more likely than not to be sustained upon examination by the applicable taxing authority, including the resolution of any related appeals or litigation processes, based on the technical merits of the position.
As of March 31, 2016, no tax liability for uncertain tax provision had been recognized in the accompanying financial statements nor did the Company recognize any interest and penalties related to unrecognized tax benefits. The earliest year that the Company’s income tax returns are subject to examination is the period ending December 31, 2012.
Unitholders are individually responsible for reporting income or loss, to the extent required by the federal and state income tax laws and regulations, based upon their respective share of the Company’s income and expense as reported for income tax purposes.
Calculation of Net Asset Value
The Company’s net asset value is calculated on a quarterly basis and commenced with respect to the first full quarter after the Company commenced operations. The Company calculates its net asset value per unit by subtracting total liabilities from the total value of the Company’s assets on the date of valuation and dividing the result by the total number of outstanding units on the date of valuation. The net asset value per Class A, Class C and Class I units are calculated on a pro-rata basis based on units outstanding.
12
Basic net income (loss) per unit is computed by dividing net income (loss) by the weighted average number of members’ units outstanding during the period. Diluted net income or loss per unit is computed by dividing net income (loss) by the weighted average number of members’ units and members’ unit equivalents outstanding during the period. The Company did not have any potentially dilutive units outstanding at March 31, 2016 and 2015.
Organization and Offering Costs
The Sponsor has incurred organization and offering costs on behalf of the Company. Organization and offering costs are reimbursable to the Sponsor to the extent the aggregate of selling commissions, dealer manager fees and other organization and offering costs do not exceed 15.0% of the gross offering proceeds (the “O&O Reimbursement Limit”) raised from the offering and will be accrued and payable by the Company only to the extent that such costs do not exceed the O&O Reimbursement Limit. Reimbursement of organization and offering costs that exceed the O&O Reimbursement Limit will be expensed in the period they become reimbursable, which is dependent on the gross offering proceeds raised in such period, and are therefore not included on the Statements of Assets and Liabilities as of March 31, 2016 and December 31, 2015. These expense reimbursements are subject to regulatory caps and approval by the Company’s board of managers. If the Company sells the maximum amount of the Offering, it anticipates that such expenses will equal approximately 1.25% of the gross proceeds raised. However, such expenses are likely to exceed this percentage because the Offering is now due to terminate on December 31, 2016. Through March 31, 2016, such expenses equaled to 5% of the gross proceeds. Reimbursements to the Sponsor are included as a reduction to net assets on the Consolidated Statement of Changes in Net Assets.
The Company may reimburse the dealer manager for certain expenses that are deemed underwriting compensation. Assuming an aggregate selling commission and a dealer manager fee of 9.75% of the gross offering proceeds (which assumes all offering proceeds come from Class A units), the Company would reimburse the dealer manager in an amount up to 0.25% of the gross offering proceeds. Because the aggregate selling commission and dealer manager fees will be less than 9.75% of the gross offering proceeds due to a portion of the offering proceeds coming from the sale of Class C and Class I units, the Company may reimburse the dealer manager for expenses in an amount greater than 0.25% of the gross offering proceeds, provided that the Company will not pay or reimburse any of the foregoing costs to the extent such payment would cause total underwriting compensation to exceed 10.0% of the gross proceeds of the primary offering as of the termination of the Offering, as required by the rules of the Financial Industry Regulatory Authority, Inc. (“FINRA”).
Operating Expense Responsibility Agreement
On May 11, 2016, the Company, Advisor and the Sponsor entered into an Amended and Restated Operating Expense Responsibility Agreement (“Responsibility Agreement”) originally effective as of June 11, 2013 and covering expenses through March 31, 2016. Since the inception of the Company through March 31, 2016, pursuant to the terms of the Responsibility Agreement, the Sponsor has paid approximately $6,904,800 of operating expenses, management fees, and incentive fees on behalf of the Company and will pay or reimburse to the Company an additional $2,506,000 of expenses, which have been accrued by the Sponsor as of March 31, 2016. Such expenses will not be reimbursable to the Sponsor until the Company has raised $200 million of gross proceeds in the primary offering, provided any such reimbursement will not cause the Company’s net asset value per unit to fall below the prior quarter’s net asset value per unit (the “Gross Proceeds Hurdle”). To the extent the Company does not meet the Gross Proceeds Hurdle in any quarter, no amount will be payable by the Company for reimbursement to the Sponsor. While the Company has raised almost $200 million of gross proceeds in the primary offering as of March 31, 2016, the Company has not met the Gross Proceeds Hurdle for the quarter ending March 31, 2016 because any reimbursement would cause the Company’s net assets value per unit to fall below the prior quarter. Therefore, expenses of the Company covered by the Responsibility Agreement have not been recorded as expenses of the Company as of March 31, 2016. In accordance with ASC 450, Contingencies, such expenses will be accrued and payable by the Company in the period that they become both probable and estimable.
Recently Issued Accounting Pronouncements
Under the Jumpstart Our Business Startups Act (the “JOBS Act”), emerging growth companies can delay the adoption of new or revised accounting standards until such time as those standards apply to private companies. The Company is choosing to take advantage of the extended transition period for complying with new or revised accounting standards. As a result, the Company’s financial statements may not be comparable to those of companies that comply with public company effective dates. There are no new or revised accounting standards that the Company has not adopted.
In June 2013, the FASB issued ASU 2013-08, Financial Services—Investment Companies: Amendments to the Scope, Measurement, and Disclosure Requirements (“ASU 2013-08”). ASU 2013-08 amends the current criteria for an entity to qualify as an investment company, creates new disclosure requirements and amends the measurement criteria for certain interests in other
13
investment companies. ASU 2013-08 was effective on January 1, 2014, and did not have a material effect on the Company’s consolidated financial statements.
In May 2014, the FASB issued Accounting Standards Update 2014-09, Revenue from Contracts with Customers (Topic 606) (“ASU 2014-09”). The update supersedes the revenue recognition requirements in ASC 605, Revenue Recognition. Under the new guidance, an entity should recognize revenue to depict the transfer of promised goods or services to customers in an amount that reflects the consideration to which the entity expects to be entitled in exchange for those goods or services. In July 2015, the FASB deferred the implementation of this standard by one year. ASU 2014-09 is now effective for annual reporting periods beginning after December 15, 2018, including interim periods within that reporting period. Early adoption is permitted for annual reporting periods beginning after December 15, 2016. The adoption of the amended guidance in ASU 2014-09 is not expected to have a significant effect on the Company’s financial statements.
Risk Factors
The Company has limited operating history and is subject to the business risks and uncertainties associated with any new business. As an externally-managed Company, the Company is largely dependent on the efforts of the Advisor and other service providers and is dependent on the Sponsor for financial support.
The Company is subject to financial market risks, including changes in interest rates. Global economies and capital markets can and have experienced significant volatility, which has increased the risks associated with investments in collateralized private debt instruments. Investment in the Company carries risk and there are no guarantees that the Company’s investment objectives will be achieved. The Company is also exposed to credit risk related to maintaining all of its cash at a major financial institution.
The Company’s investments consist of loans, loan participations and trade finance that are illiquid and non-traded, making purchase or sale of such financial instruments at desired prices or in desired quantities difficult. Furthermore, the sale of any such investments may be possible only at substantial discounts, and it may be extremely difficult to value any such investments accurately.
The value of the Company’s investments in loans may be detrimentally affected to the extent, among other things, that a borrower defaults on its obligations, there is insufficient collateral securing the loan and/or there are extensive legal and other costs incurred in collecting on a defaulted loan, observable secondary or primary market yields for similar instruments issued by comparable companies increase materially or risk premiums required in the market between smaller companies, such as the Company’s borrowers, and those for which market yields are observable increase materially. In addition as of March 31, 2016, all the Company’s investment are denominated in U.S. dollars. If the U.S. dollar rises, it may become more difficult for borrowers to make loan payments if the borrowers are operating in markets where the local currencies are depreciating relative the U.S. dollar.
At March 31, 2016, the Company’s investment portfolio included 26 companies and was comprised of $5,296,274 or 4.2% in a senior secured term loan, $19,049,242 or 15.1% in senior secured term loan participations, $81,531,045 or 64.8% in senior secured trade finance participations, and $20,000,000 or 15.9% in short term note and bridge loan. The Company’s largest loan by value was $20,000,000 or 15.9% of total investments. The Company’s 5 largest loans by value comprised 53.2% of the Company’s portfolio at March 31, 2016. Participation in loans amounted to 83.8% of the Company’s total portfolio at March 31, 2016.
Note 3. Investments
As of March 31, 2016, the Company’s investments consisted of the following:
|
| Amortized |
|
| Fair |
|
| Percentage |
| |||
|
| Cost |
|
| Value |
|
| of Total |
| |||
Senior secured term loan |
| $ | 5,296,274 |
|
| $ | 5,296,274 |
|
|
| 4.2 | % |
Senior secured term loan participations |
|
| 19,367,666 |
|
|
| 19,049,242 |
|
|
| 15.1 | % |
Senior secured trade finance participations |
|
| 81,590,122 |
|
|
| 81,531,045 |
|
|
| 64.8 | % |
Short term note and bridge loan |
|
| 20,000,000 |
|
|
| 20,000,000 |
|
|
| 15.9 | % |
Total investments |
| $ | 126,254,063 |
|
| $ | 125,876,561 |
|
|
| 100.0 | % |
Participations
The majority of the Company’s investments are in the form of Participation Interests (“Participations”). Participations are interests, which may be divided or undivided, in financing facilities. Participations may be interests in one specific loan or trade finance transaction, several loans or trade finance transactions under a facility, or may be interests in an entire facility. The Company’s rights under Participations include, without limitations, all corresponding rights in payments, collaterals, guaranties, and any other security interests obtained in the underlying financing facilities.
14
Interest Receivable
Depending on the specific terms of the Company’s investments, interest earned by the Company is payable either monthly, quarterly, or, in the case of most trade finance investments, at maturity. As such, some of the Company’s trade finance investments have up to 300 days of accrued interest receivable as of March 31, 2016. In addition, certain of the Company’s investment in term loans accrue deferred interest which is not payable until the maturity of the loans. Accrued deferred interest included in the interest receivable balance as of March 31, 2016 and December 31, 2015 amounted to $571,112 and $393,430, respectively. The Company’s interest receivable balances at March 31, 2016 and December 31, 2015 are recorded at the amounts that the Company expects to collect.
Trade Finance
Trade finance encompasses a variety of lending structures that support the export, import or sale of goods between producers and buyers in various countries and across various jurisdictions. The strategy is most prevalent in the financing of commodities. The Company’s trade finance position typically fall into two broad categories: Pre-export financing and receivable/inventory financing. Pre-export financing represent advances to borrower based on proven orders from buyers. For trade finance, the structure and terms vary according to the nature of the transaction being financed. The structure can take the form of a revolver (up to one year) with draw requests with maturity up to one year based on collateral and performance requirements. The structure can also be specific to the individual transaction being financed, which typically have shorter duration of 60 – 180 days. In terms of underwriting, particular consideration is given to the following:
| · | nature of the goods or transaction being financed, |
| · | the terms associated with the sale and repayment of the goods, |
| · | the execution risk associated with producing, storing and shipment of the goods, |
| · | the financial and performance profile of both the borrower and end buyer(s), |
| · | the underlying advance rate and subsequent LTV associated with lending against the goods that serve to secure the facility or transaction, |
| · | collateral and financial controls (collection accounts and inventory possession), |
| · | third party inspections and insurance, and |
| · | the region, country or jurisdiction in which the financing is being completed. |
Collateral varies by transaction, but is typically raw or finished goods inventory, and/or receivables. In the case of pre-export finance, the transaction is secured by purchase orders from buyers or offtake contracts, which are agreements between a buyer and seller to purchase/sell a future product.
Terms depend on the nature of the facility or transaction being financed. As such, they depend on the credit profile of the underlying financing, as well as the speed and detail associated with the request for financing. Interest can be paid as often as monthly or quarterly on revolving facilities (one year in duration) or at maturity when dealing with specific transactions with shorter duration, which is the case for the majority of the Company’s trade finance positions. At times, settlement can be delayed due to documentation, shipment, transportation or port clearing issues, delays associated with the end buyer or off-taker assuming possession, possible changes to contract or offtake terms, and the aggregation of settlement of multiple individual transactions. Conversely, at times payments are made ahead of schedule as transactions either clear faster than expected, borrowers decide to prepay or pay down ahead of schedule, counterparties clear multiple individual transactions in one settlement, or less expensive financing is secured by the borrower.
On occasion, the Company may receive notice that a borrower or counterparty intends to pay ahead of schedule or in one lump sum (settling multiple draw requests all at once). Depending on timing and the ability to redeploy these funds, combined with projected inflows of fund capital, these outsize payments can negatively impact the Company’s performance. In these situations, the credit profile of the borrower, and the transaction in general, is reviewed with the sub-advisor and a request may be made to either stagger payments, where at all possible, or request that payment only be made at the end of that specific financial quarter. These requests or accommodations, which happen very rarely, will only be made where the Company has strong comfort in and around the credit profile of the transaction or borrower.
15
During 2014, the Company restructured two loans with one of its borrowers, Corporacion Prodesa S.R.L. (“Prodesa”). As of March 31, 2016, the Company’s investment in Prodesa is comprised of two senior secured term loan participations with an aggregate balance of $2,750,000 and a $950,000 senior secured purchase order revolving credit facility with a balance of $750,000. Prodesa did not timely make the payments that were due in March and April 2015 under the two loans due to economic difficulties. The Company has been working with Prodesa to remedy the default and bring the loans to a current status. On May 6, 2015, the Company entered into a short term forbearance agreement (the “Forbearance Agreement”) with Prodesa to provide Prodesa with temporary loan payment relief while a longer term plan is negotiated. Under the terms of the Forbearance Agreement, the Company agreed to accept partial interest payments, amounting to 50% of the required interest payments, for the months of March 2015 to December 2015. The unpaid interest will be included as part of the longer term plan. Through October 2015, Prodesa had made all interest payments required under the Forbearance Agreement. Interest payments required under the term loans for the months subsequent to October 2015 have not been made by Prodesa due to Prodesa being placed into bankruptcy in November 2015 as described further below. The Company expects that Prodesa will start making interest payments again once Prodesa exits the bankruptcy process. Accordingly, the Company is still accruing interest, which amounted to approximately $401,700 as of March 31, 2016, on the Prodesa loans. The Company has estimated the fair value of the Prodesa loans as of March 31, 2016 at $3,500,000 based on a collateral valuation approach as further described in Note 4.
During 2015, Prodesa underwent a change in ownership. Through the month of September 2015, the new ownership had injected over $830,000 in Prodesa for working capital purposes. The Company has been working with Prodesa to re-align its operations and, on October 5, 2015, the Company funded a $400,000 senior secured purchase order revolving credit facility to Prodesa. The purchase order facility is secured by specific purchase orders from customers of Prodesa, as well as pledges of additional unencumbered assets and all shares of Prodesa. On November 6, 2015, Prodesa paid back to the Company the entire $400,000 and related interest owed under the purchase order facility. On November 20, 2015, the Company funded a second draw under the purchase order facility in the amount of $190,000 which was repaid in full on February 29, 2016. During the three months ended March 31, 2016, the Company funded three additional draws under the purchase order facility for an aggregate of $750,000.
On November 23, 2015, Prodesa was placed into bankruptcy by the Peruvian bankruptcy authority. At the end of August 2015, a supplier of Prodesa had filed an unpaid payable claim for just over $141,000 with the authority. While Prodesa’s management responded to the filing with a proposal to pay the claim off in full by December 2015, Prodesa’s counsel did not follow the necessary filing protocol. Unknown to management, this failure triggered Prodesa being placed into bankruptcy. Prodesa’s counsel has since been replaced. Since the filing, the Company, together with counsel, has worked in close consort with other key creditors of Prodesa, as well as management, to ensure that this filing would not impair Prodesa’s operations. All key creditors and vendors have agreed to continue to support Prodesa as usual and the initial $141,000 claim has been settled in full. Prodesa exited the bankruptcy process on April 22, 2016 and made a principal payment to the Company of $400,000 on April 29, 2016.
Usivale
In May 2015, one of the Company’s borrowers, Usivale Industria E Commercio (“Usivale”), notified the Company that it would be unable to make its monthly interest payment for May 2015 and requested the deferment of interest payments until October 2015. Usivale is a sugar producer located in Brazil that has been in business since 1958. Usivale’s business is highly cyclical and it generates the majority of its revenues during the first and fourth quarters of any calendar year. In accordance with the terms of the loans, with an aggregate principal balance of $3,000,000 as of March 31, 2016, the Company originally increased the annual interest rate charged Usivale from 12.43% to 17.43%. However, as of March 31, 2016, the Company has placed Usivale on non-accrual status effective August 27, 2015, the date of the judicial recovery filing which is described further below. Interest not recorded relative to the original terms of the Usivale loans amounted to approximately $132,200 for the three months ended March 31, 2016. The Company has estimated the fair value of the Usivale loans as of March 31, 2016 at $2,681,576, based on a discounted cash flow analysis (income approach), which is unchanged from the estimated fair value as of December 31, 2015.
On August 27, 2015, Usivale filed for judicial recuperation or recovery (the “Filing”) with the local court in Brazil. The Filing was led by the ongoing pricing pressure within the sugar market, leading up to the material drop in the month of August, when prices reached a seven year low. The Filing provided for a 180 day “standstill” period relative to any claim for payment by Usivale’s creditors. During this period, Usivale was permitted to operate as usual, but was required to develop and present a recovery plan to its creditors to allow it to emerge from judicial recovery. Usivale submitted an initial plan to the judicial court for review at the end of November 2015, which was published by the court on January 19, 2016. Creditors had 30 days to review and either approve or reject the plan. As the only secured creditor within the greater credit group, the Company’s acceptance of any plan is required. On February 17, 2016, the Company filed a rejection of the plan presented by Usivale. In accordance with the judicial recovery process, a general assembly of Usivale’s creditors will next be convened by the court on June 15, 2016. If an alternative plan cannot be agreed upon, the court can convert a judicial recovery procedure into a formal liquidation. In the event that Usivale is forced into liquidation, a court-
16
appointed trustee would be charged with selling Usivale’s assets and distribute the resulting proceeds to creditors in the order of priority. After employee claims of approximately $955,000, the Company, as the only secured creditor, would be next in line in terms of recovery proceeds.
Since the initial judicial filing in August 2015, the Company has been in active discussions with Usivale’s management. Representatives of the Company met with Usivale’s management at the end of October 2015, in November 2015 and again in February 2016. The purpose of these discussions and meetings has been to engage Usivale directly and attempt to reach a solution on the Company’s loans to Usivale. In conjunction with these efforts, on March 2, 2016, the Company filed legal action against the personal guarantees of the principals of Usivale. While the full value of these guarantees is still being assessed, it is important to emphasize that the Company’s filing against these guarantees is separate to and outside of the judicial recovery process.
Fruit and Nut Distributor
The Company has a trade finance participation with a fruit and nut distributor (“the Distributor”) located in South Africa, with a principal balance outstanding of $820,761 of as March 31, 2016. The Distributor trade finance has a stated maturity date of May 22, 2015, which the Company agreed to extend. The Distributor had made partial payments of principal during 2015 (the original loan from the Company to the Distributor was for $1,250,000), with the most recent payment being made on October 27, 2015. Through the latter part of 2015, the depreciation in the South African Rand has proven to be problematic for the Distributor given that it has to purchase its inventory in U.S. Dollars and then sells in South African Rand. This situation has led the Distributor to experience some cash flow difficulties and operating losses. As of March 31, 2016, the Company, together with its sub-advisor, have agreed to extend further the principal maturity date to facilitate the strategic sale of the Distributor, which is expected to close in May 2016. The Company expects to restructure the loan as follows: Principal balance of $820,761, which includes capitalized accrued interest through January 31, 2016 amounting to $152,923; annual interest rate of 12% starting May 1, 2016; repayment terms of five years. Accordingly, the Company placed this participation on non-accrual status effective February 1, 2016 and interest not recorded relative to the original terms of this participation amounted to approximately $19,479 for the three months ended March 31, 2016. Based on the information available to the Company and according to its valuation policies, the Company has estimated the fair value of its investment in the Distributor to be $761,684 and recorded an unrealized depreciation adjustment of $59,077 for the three months ended March 31, 2016.
As of December 31, 2015, the Company’s investments consisted of the following:
|
| Amortized |
|
| Fair |
|
| Percentage |
| |||
|
| Cost |
|
| Value |
|
| of Total |
| |||
Senior secured term loan |
| $ | 5,474,534 |
|
| $ | 5,474,534 |
|
|
| 5.4 | % |
Senior secured term loan participations |
|
| 18,802,666 |
|
|
| 18,484,242 |
|
|
| 18.3 | % |
Senior secured trade finance participations |
|
| 77,069,328 |
|
|
| 77,069,328 |
|
|
| 76.3 | % |
Total investments |
| $ | 101,346,528 |
|
| $ | 101,028,104 |
|
|
| 100.0 | % |
17
The industry composition of the Company’s portfolio, at fair market value as of March 31, 2016 and December 31, 2015, was as follows:
|
| As of March 31, 2016 |
|
| As of December 31, 2015 |
| ||||||||||
|
| Fair |
|
| Percentage |
|
| Fair |
|
| Percentage |
| ||||
Industry |
| Value |
|
| of Total |
|
| Value |
|
| of Total |
| ||||
Agricultural Products |
| $ | 34,709,365 |
|
|
| 27.6 | % |
| $ | 27,452,576 |
|
|
| 27.2 | % |
Cash Grains |
|
| 3,924,470 |
|
|
| 3.1 | % |
|
| 4,275,182 |
|
|
| 4.2 | % |
Commercial Fishing |
|
| 1,462,700 |
|
|
| 1.2 | % |
|
| 1,756,243 |
|
|
| 1.7 | % |
Communications Equipment |
|
| 3,728,340 |
|
|
| 3.0 | % |
|
| 5,918,086 |
|
|
| 5.9 | % |
Construction Materials |
|
| 167,355 |
|
|
| 0.1 | % |
|
| 181,943 |
|
|
| 0.2 | % |
Consumer Products |
|
| 9,500,000 |
|
|
| 7.5 | % |
|
| 8,940,000 |
|
|
| 8.8 | % |
Electric Services |
|
| 6,000,000 |
|
|
| 4.8 | % |
|
| — |
|
|
| — |
|
Farm Products |
|
| 2,900,000 |
|
|
| 2.3 | % |
|
| 2,900,000 |
|
|
| 2.9 | % |
Fats and Oils | �� |
| 5,100,000 |
|
|
| 4.1 | % |
|
| 3,100,000 |
|
|
| 3.1 | % |
Financial Services |
|
| 15,000,000 |
|
|
| 11.9 | % |
|
| — |
|
|
| — |
|
Fertilizer & Agricultural Chemicals |
|
| 5,078,526 |
|
|
| 4.0 | % |
|
| 5,750,000 |
|
|
| 5.7 | % |
Food Products |
|
| 761,684 |
|
|
| 0.6 | % |
|
| 667,838 |
|
|
| 0.7 | % |
Meat, Poultry & Fish |
|
| 9,600,000 |
|
|
| 7.6 | % |
|
| 11,524,816 |
|
|
| 11.4 | % |
Metals & Mining |
|
| 2,500,000 |
|
|
| 2.0 | % |
|
| 2,500,000 |
|
|
| 2.5 | % |
Packaged Foods & Meats |
|
| 1,000,000 |
|
|
| 0.8 | % |
|
| 1,000,000 |
|
|
| 1.0 | % |
Primary Metal Industries |
|
| 6,000,000 |
|
|
| 4.8 | % |
|
| 6,000,000 |
|
|
| 5.9 | % |
Programing and Data Processing |
|
| 5,296,274 |
|
|
| 4.2 | % |
|
| 5,474,534 |
|
|
| 5.4 | % |
Textiles, Apparel & Luxury Goods |
|
| 280,181 |
|
|
| 0.2 | % |
|
| 724,219 |
|
|
| 0.7 | % |
Water Transportation |
|
| 12,867,666 |
|
|
| 10.2 | % |
|
| 12,862,666 |
|
|
| 12.7 | % |
Total |
| $ | 125,876,561 |
|
|
| 100.0 | % |
| $ | 101,028,104 |
|
|
| 100.0 | % |
The table below shows the portfolio composition by geographic classification at fair value as of March 31, 2016 and December 31, 2015:
|
| As of March 31, 2016 |
|
| As of December 31, 2015 |
| ||||||||||
|
| Fair |
|
| Percentage |
|
| Fair |
|
| Percentage |
| ||||
Country |
| Value |
|
| of Total |
|
| Value |
|
| of Total |
| ||||
Argentina |
| $ | 35,100,000 |
|
|
| 27.9 | % |
| $ | 27,800,000 |
|
|
| 27.5 | % |
Brazil |
|
| 7,977,850 |
|
|
| 6.3 | % |
|
| 8,156,110 |
|
|
| 8.1 | % |
Chile |
|
| 1,900,000 |
|
|
| 1.5 | % |
|
| 1,900,000 |
|
|
| 1.9 | % |
Ecuador |
|
| 1,462,700 |
|
|
| 1.2 | % |
|
| 1,756,243 |
|
|
| 1.7 | % |
Ghana |
|
| 6,000,000 |
|
|
| 4.8 | % |
|
| — |
|
|
| — |
|
Guatemala |
|
| 1,000,000 |
|
|
| 0.8 | % |
|
| 1,000,000 |
|
|
| 1.0 | % |
Kenya |
|
| 24,470 |
|
|
| 0.0 | % |
|
| 375,182 |
|
|
| 0.4 | % |
Mauritius |
|
| 15,000,000 |
|
|
| 11.9 | % |
|
| — |
|
|
| — |
|
Namibia |
|
| 1,000,000 |
|
|
| 0.8 | % |
|
| 1,000,000 |
|
|
| 1.0 | % |
Nigeria |
|
| 12,867,666 |
|
|
| 10.2 | % |
|
| 12,862,666 |
|
|
| 12.7 | % |
Peru |
|
| 3,500,000 |
|
|
| 2.8 | % |
|
| 2,940,000 |
|
|
| 2.9 | % |
Singapore |
|
| 15,000,000 |
|
|
| 11.9 | % |
|
| 10,000,000 |
|
|
| 9.9 | % |
South Africa |
|
| 10,065,348 |
|
|
| 8.0 | % |
|
| 18,837,902 |
|
|
| 18.6 | % |
Tanzania |
|
| 3,900,000 |
|
|
| 3.1 | % |
|
| 3,900,000 |
|
|
| 3.9 | % |
Zambia |
|
| 11,078,526 |
|
|
| 8.8 | % |
|
| 10,500,000 |
|
|
| 10.4 | % |
Total |
| $ | 125,876,561 |
|
|
| 100.0 | % |
| $ | 101,028,104 |
|
|
| 100.0 | % |
18
Note 4. Fair Value Measurements
The following table summarizes the valuation of the Company’s investments by the fair value hierarchy levels required under ASC 820 as of March 31, 2016:
|
| Fair |
|
|
|
|
|
|
|
|
|
|
|
|
| |
|
| Value |
|
| Level 1 |
|
| Level 2 |
|
| Level 3 |
| ||||
Senior secured term loan |
| $ | 5,296,274 |
|
| $ | — |
|
| $ | — |
|
| $ | 5,296,274 |
|
Senior secured term loan participations |
|
| 19,049,242 |
|
|
| — |
|
|
| — |
|
|
| 19,049,242 |
|
Senior secured trade finance participations |
|
| 81,531,045 |
|
|
| — |
|
|
| — |
|
|
| 81,531,045 |
|
Short term note and bridge loan |
|
| 20,000,000 |
|
|
|
|
|
|
|
|
|
|
| 20,000,000 |
|
Total |
| $ | 125,876,561 |
|
| $ | — |
|
| $ | — |
|
| $ | 125,876,561 |
|
The following table summarizes the valuation of the Company’s investments by the fair value hierarchy levels required under ASC 820 as of December 31, 2015:
|
| Fair |
|
|
|
|
|
|
|
|
|
|
|
|
| |
|
| Value |
|
| Level 1 |
|
| Level 2 |
|
| Level 3 |
| ||||
Senior secured term loan |
| $ | 5,474,534 |
|
| $ | — |
|
| $ | — |
|
| $ | 5,474,534 |
|
Senior secured term loan participations |
| $ | 18,484,242 |
|
|
|
|
|
|
|
|
|
|
| 18,484,242 |
|
Senior secured trade finance participations |
|
| 77,069,328 |
|
|
| — |
|
|
| — |
|
|
| 77,069,328 |
|
Total |
| $ | 101,028,104 |
|
| $ | — |
|
| $ | — |
|
| $ | 101,028,104 |
|
The following is a reconciliation of activity for the three months ended March 31, 2016, of investments classified as Level 3:
|
| Fair Value at December 31, 2015 |
|
| Purchases |
|
| Maturities or Prepayments |
|
| Amortization |
|
| Net change in unrealized appreciation (depreciation) |
|
| Fair Value at March 31, 2016 |
| ||||||
Senior secured term loan |
| $ | 5,474,534 |
|
| $ | — |
|
| $ | (178,260 | ) |
| $ | — |
|
| $ | — |
|
| $ | 5,296,274 |
|
Senior secured term loan participations |
|
| 18,484,242 |
|
|
| 750,000 |
|
|
| (190,000 | ) |
|
| 5,000 |
|
|
| — |
|
|
| 19,049,242 |
|
Senior secured trade finance participations |
|
| 77,069,328 |
|
|
| 29,147,194 |
|
|
| (24,626,400 | ) |
|
| — |
|
|
| (59,077 | ) |
|
| 81,531,045 |
|
Short term note and bridge loan |
|
| — |
|
|
| 20,000,000 |
|
|
| — |
|
|
| — |
|
|
| — |
|
|
| 20,000,000 |
|
Total |
| $ | 101,028,104 |
|
| $ | 49,897,194 |
|
| $ | (24,994,660 | ) |
| $ | 5,000 |
|
| $ | (59,077 | ) |
| $ | 125,876,561 |
|
There were no realized gains or losses for any of the Company’s investments classified as Level 3 during the three months ended March 31, 2016 and 2015.
As of March 31, 2016, all of the Company’s portfolio investments utilized Level 3 inputs. The following table presents the quantitative information about Level 3 fair value measurements of the Company’s investments as of March 31, 2016:
|
| Fair value |
|
| Valuation technique |
| Unobservable input |
| Range (weighted average) |
| ||
Senior secured trade finance participations |
| $ | 80,769,361 |
|
| Cost Approach |
| Recent transactions |
| N/A |
| |
Senior secured trade finance participations (1) |
| $ | 761,684 |
|
| Income approach (DCF) |
| Market yield |
|
| 15.75% |
|
Senior secured term loan |
| $ | 5,296,274 |
|
| Income approach (DCF) |
| Market yield |
|
| 13.50% |
|
Senior secured term loan participations |
| $ | 15,549,242 |
|
| Income approach (DCF) |
| Market yield |
| 15.83% - 17.43%(15.85%) |
| |
Senior secured term loan participations (2) |
| $ | 3,500,000 |
|
| Collateral based approach |
| Value of collateral |
| N/A |
| |
Short term note and bridge loan (3) |
| $ | 20,000,000 |
|
| N/A |
| N/A |
| N/A |
| |
| (1) | Income approach used for the Fruit and Nut Distributor based on expected terms as listed in Note 3 above. |
19
| (3) | These temporary investments have maturities of less than 60 days and are carried at cost. |
As of December 31, 2015, all of the Company’s portfolio investments utilized Level 3 inputs. The following table presents the quantitative information about Level 3 fair value measurements of the Company’s investments as of December 31, 2015:
|
| Fair value |
|
| Valuation technique |
| Unobservable input |
| Range (weighted average) |
| ||
Senior secured trade finance participations |
| $ | 77,069,328 |
|
| Income approach |
| Market yield |
| 8.89% – 17.50% (12.04%) |
| |
Senior secured term loan |
| $ | 5,474,534 |
|
| Income approach |
| Market yield |
|
| 13.50% |
|
Senior secured term loan participations |
| $ | 15,544,242 |
|
| Income approach |
| Market yield |
| 15.83% - 17.43%(16.13%) |
| |
Senior secured term loan participations |
| $ | 2,940,000 |
|
| Collateral based approach |
| Value of collateral |
| N/A |
| |
The significant unobservable Level 3 inputs used in the fair value measurement of the Company’s investments are market yields. Significant increases in market yields would result in significantly lower fair value measurements.
For details of the country-specific risk concentrations for the Company’s investments, refer to the Consolidated Schedule of Investments and Note 3.
Note 5. Related Parties
Agreements
Advisory Agreement
On February 19, 2016, the Company’s board of managers determined to extend the Amended and Restated Advisory Agreement, (the “Advisory Agreement”) effective March 24, 2016, for an additional one-year term.
Asset management fees payable to the Advisor are remitted quarterly in arrears and are equal to 0.50% (2.00% per annum) of Gross Asset Value, as defined in the Amended and Restated Advisory Agreement between the Company and the Advisor. Asset management fees are paid to the Advisor in exchange for fund management and administrative services. Although the Advisor manages, on the Company’s behalf, many of the risks associated with global investments in developing economies, management fees do not include the cost of any hedging instruments or insurance policies that may be required to appropriately manage the Company’s risk.
If certain financial goals are reached by the Company, the Company is required to pay the Advisor an incentive fee which is comprised of two parts: (i) a subordinated fee on net investment income and (ii) an incentive fee on capital gains. The subordinated incentive fee on income is calculated and payable quarterly in arrears and is based upon the Company’s pre-incentive fee net investment income for the immediately preceding quarter. No subordinated incentive fee is earned by the Advisor in any calendar quarter in which the Company’s pre-incentive fee net investment income does not exceed the quarterly preferred return rate of 1.50% (6.00% annualized) (the “Preferred Return”). In any quarter, all of the Company’s pre-incentive fee net investment income, if any, that exceeds the quarterly Preferred Return, but is less than or equal to 1.875% (7.50% annualized) at the end of the immediately preceding fiscal quarter, is payable to the Advisor. For any quarter in which the Company’s pre-incentive fee net investment income exceeds 1.875% on its net assets at the end of the immediately preceding fiscal quarter, the subordinated incentive fee on income equals 20% of the amount of the Company’s pre-incentive fee net investment income.
An incentive fee on capital gains will be earned on investments sold and shall be determined and payable to the Advisor in arrears as of the end of each calendar year. The incentive fee on capital gains is equal to 20% of the Company’s realized capital gains on a cumulative basis from inception, computed net of all realized capital losses and unrealized capital depreciation on a cumulative
20
basis, less the aggregate amount of any previously paid incentive fees on capital gains. The Company had no capital gains and therefore did not accrue an incentive fee on capital gains for the three months ended March 31, 2016 and 2015.
Transactions
As discussed in Note 2, for the three months ended March 31, 2016 and 2015, the Sponsor assumed responsibility for $1,914,344 and $719,265, respectively, of the Company’s operating expenses, management fees and incentive fees, which are deferred under the Responsibility Agreement.
For the three months ended March 31, 2016 and 2015, the Advisor earned $816,326 and $361,748, respectively, in management fees and $650,348 and $277,180, respectively, in incentive fees.
Since the inception of the Company through March 31, 2016, pursuant to the terms of the Responsibility Agreement, the Sponsor has paid approximately $6,904,800 of operating expenses, management fees, and incentive fees on behalf of the Company and will pay or reimburse to the Company an additional $2,506,000 of expenses, which have been accrued by the Sponsor as of March 31, 2016. Such expenses, in the aggregate of $9,410,800 since the Company’s inception, will be expensed and payable by the Company to the Sponsor once the Company has raised gross proceeds of $200 million in the primary offering, provided any such reimbursement will not cause the Company’s net asset value per unit to fall below the prior quarter’s net asset value per unit, as further described in Note 2.
As of March 31, 2016 and December 31, 2015, due from affiliates on the Consolidated Statement of Assets and Liabilities in the amounts of $2,144,985 and $1,874,932, respectively, was due from the Sponsor in connection with the Responsibility Agreement for operating expenses which were paid by the Company, but, under the terms of the Responsibility Agreement, are the responsibility of the Sponsor. The Sponsor anticipates paying this receivable in the due course of business.
As March 31, 2016 and December 31, 2015, due to affiliates on the Consolidated Statement of Assets and Liabilities in the amounts of $146,710 and $472,057, respectively, was due to the Sponsor for reimbursements of offering costs.
For the three months ended March 31, 2016 and 2015, the Company paid $477,699 and $187,174, respectively, in dealer manager fees and $1,633,388 and $569,046, respectively, in selling commissions to the Company’s dealer manager, SC Distributors, LLC. These fees and commissions were paid in connection with the sales of the Company’s units to investors and, as such, were recorded against the proceeds from the issuance of units and are not reflected in the Company’s consolidated statement of operations.
Note 6. Organization and Offering Costs
As of March 31, 2016, the Sponsor has paid approximately $10,758,000 of offering costs and $236,000 of organization costs, all of which were paid directly by the Sponsor on behalf of the Company, and will be reimbursed to the Sponsor as disclosed in Note 2 of the consolidated financial statements. Such amounts include approximately $990,000 and $356,000 of offering costs, which were incurred by the Sponsor during the three months ended March 31, 2016 and 2015, respectively. During the three months ended March 31, 2016 and 2015, the Company paid $1,645,498 and $550,229, respectively, in reimbursement of offering costs to the Sponsor. Such offering costs reimbursed by the Company have been recognized against the proceeds from the issuance of units.
Since the Company started operations to March 31, 2016, the Company has reimbursed the Sponsor a total of approximately $9,467,864 of offering costs and there is a remaining balance of approximately $1,525,100 of offering and organization costs to be reimbursed to the Sponsor.
21
The Company has three classes of units: Class A units, Class C units and Class I units. The unit classes have different sales commissions and dealer manager fees, and there is an ongoing distribution fee with respect to Class C units. All units participate in the income and expenses of the Company on a pro-rata basis based on the number of units outstanding and therefore have the same net asset value per unit. The following table is a summary unit activity during the three months ended March 31, 2016:
|
| Units |
|
|
|
|
|
|
|
|
|
| Units |
| ||
|
| Outstanding |
|
|
|
|
|
| Units |
|
| Outstanding |
| |||
|
| as of |
|
| Units Issued |
|
| Repurchased |
|
| as of |
| ||||
|
| December 31, |
|
| During |
|
| During |
|
| March 31, |
| ||||
|
| 2015 |
|
| the Period |
|
| the Period |
|
| 2016 |
| ||||
Class A units |
|
| 9,709,153 |
|
|
| 1,482,977 |
|
|
| (510,984 | ) |
|
| 10,681,146 |
|
Class C units |
|
| 1,073,599 |
|
|
| 1,418,604 |
|
|
| — |
|
|
| 2,492,203 |
|
Class I units |
|
| 5,443,616 |
|
|
| 512,456 |
|
|
| — |
|
|
| 5,956,072 |
|
Total |
|
| 16,226,368 |
|
|
| 3,414,037 |
|
|
| (510,984 | ) |
|
| 19,129,421 |
|
Beginning June 11, 2014, the Company commenced a unit repurchase program pursuant to which the Company may conduct quarterly unit repurchases of up to 5% of the weighted average number of outstanding units in any 12-month period to allow the Company’s unitholders, who have held units for a minimum of one year, to sell their units back to the Company at a price equal to the then current offering price less the sales fees associated with that class of units. The unit repurchase program includes numerous restrictions, including a one-year holding period, that limit the ability of the Company’s unitholders to sell their units. Unless the Company’s board of managers determines otherwise, the Company will limit the number of units to be repurchased during any calendar year to the number of units that can be repurchased with the proceeds the Company receives from the sale of units under the Company’s distribution reinvestment plan. At the sole discretion of the Company’s board of managers, the Company may also use cash on hand, cash available from borrowings and cash from the repayment or liquidation of investments as of the end of the applicable quarter to repurchase units.
During the three months ended March 31, 2016, the Company processed six repurchase requests for a total of 510,984 units at a repurchase price of $9.025 per unit. As of March 31, 2016, four of the repurchase requests for a total of 498,943 units or $4,502,964 were pending. These repurchase requests were completed by the Company on April 8, 2016.
Note 8. Distributions
Starting in July 2013, the Company has paid monthly distributions for all classes of units. The following table summarizes the distributions paid for the three months ended March 31, 2016:
|
|
|
| Daily Rate |
|
| Cash |
|
| Distributions |
|
| Total |
| ||||
Months ended |
| Date Declared |
| Per Unit |
|
| Distributions |
|
| Reinvested |
|
| Declared |
| ||||
January 31, 2016 |
| January 19, 2016 |
| $ | 0.00197268 |
|
| $ | 590,074 |
|
| $ | 421,766 |
|
| $ | 1,011,840 |
|
February 29, 2016 |
| February 19, 2016 |
| $ | 0.00197268 |
|
|
| 592,036 |
|
|
| 427,352 |
|
|
| 1,019,388 |
|
March 31, 2016 |
| March 28, 2016 |
| $ | 0.00197268 |
|
|
| 675,639 |
|
|
| 482,207 |
|
|
| 1,157,846 |
|
Total for 2016 |
|
|
|
|
|
|
| $ | 1,857,749 |
|
| $ | 1,331,325 |
|
| $ | 3,189,074 |
|
22
The following is a schedule of financial highlights of the Company for the three months ended March 31, 2016 and 2015. The Company’s income and expense is allocated pro-rata across the outstanding Class A, Class C and Class I units, as applicable, and, therefore, the financial highlights are equal for each of the outstanding classes.
| Three Months Ended |
| |||||
| March 31, |
|
| March 31, |
| ||
| 2016 |
|
| 2015 |
| ||
Per unit data (1): |
|
|
|
|
|
|
|
Net proceeds before offering costs (2) | $ | 9.025 |
|
| $ | 9.025 |
|
Offering costs |
| (0.495 | ) |
|
| (0.474 | ) |
Net Proceeds after offering costs |
| 8.530 |
|
|
| 8.551 |
|
Net investment income |
| 0.183 |
|
|
| 0.178 |
|
Net change in unrealized depreciation on investments |
| (0.003 | ) |
|
| — |
|
Distributions |
| (0.179 | ) |
|
| (0.178 | ) |
Capital contribution |
| — |
|
|
| — |
|
Net increase/(decrease) in net assets |
| — |
|
|
| — |
|
Net asset value at end of period |
| 8.530 |
|
|
| 8.551 |
|
Total return based on net asset value (3)(4) |
| 2.10 | % |
|
| 2.08 | % |
Net assets at end of period | $ | 163,175,155 |
|
| $ | 71,987,882 |
|
Units Outstanding at end of period |
| 19,129,421 |
|
|
| 8,418,486 |
|
Ratio/Supplemental data (annualized) (4)(5): |
|
|
|
|
|
|
|
Ratio of net investment income to average net assets |
| 8.49 | % |
|
| 8.37 | % |
Ratio of net operating expenses to average net assets |
| 0.24 | % |
|
| 2.42 | % |
1 | The per unit data was derived by using the weighted average units outstanding during the three months ended March 31, 2016 and 2015 which were 17,816,842 and 7,804,588. |
2 | Represents net asset value at the beginning of the period. |
3 | Net asset value would have been lower if the Sponsor had not made capital contributions as of March 31, 2014 and December 31, 2013 of $31,750 and $51,034, respectively or had not absorbed and deferred reimbursement for a substantial portion of the Company’s operating expenses since the Company began operations. |
4 | Total return, ratio of net investment income and ratio of operating expenses to average net assets for the nine months ended September 30, 2015 and 2014, prior to the effect of the Responsibility Agreement were as follows; total return: 0.84% and 1.00%), ratio of net investment income/(loss); 3.40% and 4.03%, and ratio of operating expenses to average net assets: 5.33% and 6.76%. |
5 | The Company’s net investment income has been annualized assuming consistent results over a full fiscal year, however, this may not be indicative of actual results over a full fiscal year. |
Note 10. Subsequent Events
The Company’s management has evaluated subsequent events through the date of issuance of the consolidated financial statements included herein. There have been no subsequent events that occurred during such period that would require disclosure in the Form 10-Q or would be required to be recognized in the consolidated financial statements as of and for the three months ended March 31, 2016, except as discussed below.
Distributions
On April 19, 2016, with the authorization of the Company’s board of managers, the Company declared distributions for all classes of units for the period from April 1 through April 30, 2016. These distributions were calculated based on unitholders of record for each day in an amount equal to $0.00197268 per unit per day (less the distribution fee with respect to Class C units). On May 2, 2016, $638,949 of these distributions were paid in cash and on April 30, 2016, $506,242 were reinvested in units for those unitholders participating in the Distribution Reinvestment Plan.
Status of the Offering
Subsequent to March 31, 2016 through May 10, 2016, the Company sold approximately 1,476,600 units in the Offering (including units issued pursuant to the Distribution Reinvestment Plan) for approximately $14,328,000 in gross proceeds.
23
Pursuant to the net asset value determination by the Company’s board of managers, the value has not increased above nor decreased below the Company’s net proceeds per unit; therefore, the Company will continue to sell units at a price of $10.00 per Class A unit, $9.576 per Class C unit and $9.186 per Class I unit. The Company’s net asset value and the offering prices would have decreased if the Sponsor had not made a capital contribution in the amount of $31,750 and $51,034 in the quarters ended March 31, 2014 and December 31, 2013, respectively, or had not absorbed and deferred reimbursement for a substantial portion of the Company’s operating expenses since the Company began its operations.
Investments
Subsequent to March 31, 2016 through May 10, 2015, the Company funded approximately $28.9 million in new investments and received proceeds from repayment of investments of approximately $19.0 million.
Agreements
On May 11, 2016, the Company entered into an Amended and Restated Operating Expenses Responsibility Agreement with the Company’s Sponsor and Advisor. Pursuant to the terms of this agreement, the Sponsor agreed to be responsible for the Company’s cumulative operating expenses incurred through March 31, 2016, including management and incentive fees earned by the Advisor during the quarter ended March 31, 2016. For additional information refer to Notes 2 and 5.
24
Item 2. Management’s Discussion and Analysis of Financial Condition and Results of Operations
The following discussion and analysis should be read in conjunction with the Company’s financial statements and related notes and other financial information appearing elsewhere in this quarterly report on Form 10-Q.
Except as otherwise specified, references to “we,” “us,” “our,” or the “Company,” refer to TriLinc Global Impact Fund, LLC.
Forward Looking Statements
Some of the statements in this Form 10-Q constitute forward-looking statements, which relate to future events or our future performance or financial condition. The forward-looking statements contained in this quarterly report involve risks and uncertainties, including statements as to:
| · | our future operating results; |
| · | our ability to raise capital in our public offering; |
| · | our ability to purchase or make investments in a timely manner; |
| · | our business prospects and the prospects of our borrowers; |
| · | the economic, social and/or environmental impact of the investments that we expect to make; |
| · | our contractual arrangements and relationships with third parties; |
| · | our ability to make distributions to our unitholders; |
| · | the dependence of our future success on the general economy and its impact on the companies in which we invest; |
| · | the availability of cash flow from operating activities for distributions and payment of operating expenses; |
| · | the performance of our Advisor, our sub-advisors and our Sponsor; |
| · | our dependence on our Advisor and our dependence on and the availabilities of the financial resources of our Sponsor; |
| · | the ability of our borrowers to make required payments; |
| · | our Advisor’s ability to attract and retain sufficient personnel to support our growth and operations; |
| · | the lack of a public trading market for our units; |
| · | our limited operating history; |
| · | our expected financings and investments; |
| · | the adequacy of our cash resources and working capital; |
| · | performance of our investments relative to our expectations and the impact on our actual return on invested equity, as well as the cash provided by these investments; |
| · | any failure in our Advisor’s or sub-advisors’ due diligence to identify all relevant facts in our underwriting process or otherwise; |
| · | the ability of our sub-advisors and borrowers to achieve their objectives; |
| · | the effectiveness of our portfolio management techniques and strategies; |
| · | failure to maintain effective internal controls; and |
| · | the loss of our exemption from the definition of an “investment company” under the Investment Company Act of 1940, as amended. |
We use words such as “anticipates,” “believes,” “expects,” “intends” and similar expressions to identify forward-looking statements. Our actual results could differ materially from those projected in the forward-looking statements for any reason.
We have based the forward-looking statements included in this report on information available to us on the date of this report, and we assume no obligation to update any such forward-looking statements. Although we undertake no obligation to revise or update any forward-looking statements, whether as a result of new information, future events or otherwise, you are advised to consult any additional disclosures that we may make directly to you or through reports that we in the future may file with the SEC.
25
We make impact investments in SMEs that provide the opportunity to achieve both competitive financial returns and positive measurable impact. We were organized as a Delaware limited liability company on April 30, 2012. We have operated and intend to continue to operate our business in a manner that will permit us to maintain our exemption from registration under the Investment Company Act of 1940. We use the proceeds raised from the issuance of units to invest in SME through local market sub-advisors in a diversified portfolio of financial assets, including direct loans, loan participations, convertible debt instruments, trade finance, structured credit and preferred and common equity investments. A substantial portion of our assets consists of collateralized private debt instruments, which we believe offer opportunities for competitive risk-adjusted returns and income generation. We are externally managed and advised by TriLinc Advisors.
Our business strategy is to generate competitive financial returns and positive economic, social and environmental impact by providing financing to SMEs, primarily in developing economies. Our style of investment is referred to as impact investing, which J.P. Morgan Global Research and Rockefeller Foundation in a 2010 report called “an emerging alternative asset class” and defined as investing with the intent to create positive impact beyond financial return. We believe it is possible to generate competitive financial returns while creating positive, measurable impact. We measure the economic, social and environmental impact of our investments using industry-standard metrics, including the Impact Reporting and Investment Standards. Through our investments in SMEs, we intend to enable job creation and stimulate economic growth.
We commenced the Offering on February 25, 2013. Pursuant to the Offering, we are offering on a continuous basis up to $1.5 billion in units of our limited liability company interest, consisting of up to $1.25 billion of units in the primary offering consisting of Class A units at an initial offering price of $10.00 per unit, Class C units at $9.576 per unit and Class I units at $9.186 per unit, and up to $250 million of units pursuant to the Distribution Reinvestment Plan. SC Distributors, LLC is the dealer manager for the Offering. The Company’s offering period is currently scheduled to terminate on December 31, 2016. Our board has the right to further extend or terminate the Offering at any time.
In May 2012, the Advisor purchased 22,161 Class A units for aggregate gross proceeds of $200,000. On June 11, 2013, we satisfied the minimum offering requirement of $2,000,000 when the Sponsor purchased 321,330 Class A units for aggregate gross proceeds of $2,900,000 and we commenced operations. As of March 31, 2016, we had received subscriptions for and issued 19,666,683 of our units, including 548,610 units issued under our Distribution Reinvestment Plan, for gross proceeds of approximately $189,383,000 including approximately $4,951,208 reinvested under our Distribution Reinvestment Plan, (before dealer-manager fees of approximately $2,676,000 and selling commissions of $9,230,000, for net proceeds of $177,477,000). As of March 31, 2016, $1.31 billion in units remained available for sales pursuant to the Offering, including approximately $245.1 million in units available pursuant to our Distribution Reinvestment Plan.
On November 20, 2015, we filed a registration statement on Form S-1 with the SEC in connection with the proposed offering of up to $1.15 billion in units of our limited liability company interest, including $150.0 million in units to be issued pursuant to our distribution reinvestment plan (the “Follow-On Offering”). The Follow-On Offering will only commence, if at all, until after the termination of the Offering. We will not determine until a later date whether we will commence the Follow-On Offering, which will depend on market and other factors.
Investments
Our investment objectives are to provide our unitholders current income, capital preservation, and modest capital appreciation. These objectives are achieved primarily through SME trade finance and term loan financing, while employing rigorous risk-mitigation and due diligence practices, and transparently measuring and reporting the economic, social and environmental impacts of our investments. The majority of our investments are senior and other collateralized loans to SMEs with established, profitable businesses in developing economies. With the eight sub-advisors that we have contracted to assist the Advisor in implementing the Company’s investment program, we expect to provide growth capital financing generally ranging in size from $5-15 million per transaction for direct SME loans and $500,000 to $5 million for trade finance transactions. We seek to protect and grow investor capital by: (1) targeting countries with favorable economic growth and investor protections; (2) partnering with sub-advisors with significant experience in local markets; (3) focusing on creditworthy lending targets who have at least 3-year operating histories and demonstrated cash flows enabling loan repayment; (4) making primarily debt investments, backed by collateral and borrower guarantees; (5) employing best practices in our due diligence and risk mitigation processes; and (6) monitoring our portfolio on an ongoing basis.
Investments will continue to be primarily credit facilities to developing economy SMEs, including trade finance and term loans, through TriLinc Advisor’s team of professional sub-advisors with a local presence in the markets where they invest. As of March 31, 2016, the majority of our investments were in the form of participations and we expect that future investments will continue to be primarily participations. We typically provide financing that is collateralized, has a short to medium-term maturity and is self-
26
liquidating through the repayment of principal. By providing additional liquidity to growing small businesses, we believe we support both economic growth and the expansion of the global middle class.
Revenues
Since we anticipate that the majority of our assets will consist of trade finance instruments and term loans, we expect that the majority of our revenue will continue to be generated in the form of interest. Our senior and subordinated debt investments may bear interest at a fixed or floating rate. Interest on debt securities is generally payable monthly, quarterly or semi-annually. In some cases, some of our investments may provide for deferred interest payments or PIK interest. The principal amount of the debt securities and any accrued but unpaid interest generally is due at the maturity date. In addition, we generate revenue in the form of acquisition and other fees in connection with some transactions. Original issue discounts and market discounts or premiums are capitalized, and we accrete or amortize such amounts as interest income. We record prepayment premiums on loans and debt securities as interest income. Dividend income, if any, will be recognized on an accrual basis to the extent that we expect to collect such amounts.
Expenses
Our primary operating expenses include the payment of asset management fees and expenses reimbursable to our Advisor under the Amended and Restated Advisory Agreement. We bear all other costs and expenses of our operations and transactions.
Since our inception through March 31, 2016, our Sponsor has assumed substantially all our operating expenses under the terms of the Responsibility Agreement. As of March 31, 2016, the Sponsor has agreed to pay a cumulative total of approximately $9.41 million of operating expenses.
Portfolio and Investment Activity
During the three months ended March 31, 2016, we invested $49,744,272 across 11 separate portfolio companies, including 1 new borrower. Our investments consisted of senior secured trade finance participations, senior secured term loan participations, senior secured term loans, an unsecured short term note, and a secured bridge loan. Additionally, we received proceeds from repayments of investment principal of $24,994,660.
At March 31, 2016 and December 31, 2015, the Company’s investment portfolio included 26 and 25 companies, respectively, and the fair value of our portfolio was comprised of the following:
|
| As of March 31, 2016 |
|
| As of December 31, 2015 |
| ||||||||||
|
| Investments |
|
| Percentage of |
|
| Investments |
|
| Percentage of |
| ||||
|
| at Fair Value |
|
| Total Investments |
|
| at Fair Value |
|
| Total Investments |
| ||||
Senior secured term loan |
| $ | 5,296,274 |
|
|
| 4.2 | % |
| $ | 5,474,534 |
|
|
| 5.4 | % |
Senior secured term loan participations |
|
| 19,049,242 |
|
|
| 15.1 | % |
|
| 18,484,242 |
|
|
| 18.3 | % |
Senior secured trade finance participations |
|
| 81,531,045 |
|
|
| 64.8 | % |
|
| 77,069,328 |
|
|
| 76.3 | % |
Short term note and bridge loan |
|
| 20,000,000 |
|
|
| 15.9 | % |
|
| - |
|
|
| - |
|
Total investments (1) |
| $ | 125,876,561 |
|
|
| 100.0 | % |
| $ | 101,028,104 |
|
|
| 100.0 | % |
(1) Total investment data as of March 31, 2016 described in this report includes one bridge loan participation amounting to $5,000,000 and the unsecured short term note receivable amounting to $15,000,000 that the Company classifies as temporary investment for impact data purposes. Temporary investments are defined by the Company as investments that generally meet the standard underwriting guidelines for trade finance and term loan transactions and that also have the following characteristics: (1) maturity of less than one year, (2) loans to borrowers to whom, at the time of funding, the Company does not expect to re-lend. Impact data is not tracked for temporary investments.
As of March 31, 2016, the weighted average yield, based upon the cost of our portfolio, of our total portfolio, senior secured term loan participations and senior secured trade finance participations at their current cost basis were approximately 12.2%, 15.9%, and 11.3%, respectively.
As of December 31, 2015, the weighted average yield, based upon the cost of our portfolio, of our total portfolio, senior secured term loan participations and senior secured trade finance participations at their current cost basis were approximately 12.8%, 16.0%, and 12.0%, respectively.
27
During 2014, the Company restructured two loans with one of its borrowers, Corporacion Prodesa S.R.L. (“Prodesa”). As of December 31, 2015, the Company’s investment in Prodesa is comprised of two senior secured term loan participations with an aggregate balance of $2,750,000 and a $950,000 senior secured purchase order revolving credit facility with a balance of $750,000. Prodesa did not timely make the payments that were due in March and April 2015 under the two loans due to economic difficulties. The Company has been working with Prodesa to remedy the default and bring the loans to a current status. On May 6, 2015, the Company entered into a short term forbearance agreement (the “Forbearance Agreement”) with Prodesa to provide Prodesa with temporary loan payment relief while a longer term plan is negotiated. Under the terms of the Forbearance Agreement, the Company agreed to accept partial interest payments, amounting to 50% of the required interest payments, for the months of March 2015 to December 2015. The unpaid interest will be included as part of the longer term plan. Through October 2015, Prodesa had made all interest payments required under the Forbearance Agreement. Interest payments required under the term loans for the months subsequent to October 2015 have not been made by Prodesa due to Prodesa being placed into bankruptcy in November 2015 as described further below. The Company expects that Prodesa will start making interest payments again once Prodesa exits the bankruptcy process. Accordingly, the Company is still accruing interest, which amounted to approximately $401,700 as of March 31, 2016, on the Prodesa loans. The Company has estimated the fair value of the Prodesa loans as of March 31, 2016 at $3,500,000 based on a collateral valuation approach as further described in Note 4 of the financial statements.
During 2015, Prodesa underwent a change in ownership. Through the month of September 2015, the new ownership had injected over $830,000 in Prodesa for working capital purposes. The Company has been working with Prodesa to re-align its operations and, on October 5, 2015, the Company funded a $400,000 senior secured purchase order revolving credit facility to Prodesa. The purchase order facility is secured by specific purchase orders from customers of Prodesa, as well as pledges of additional unencumbered assets and all shares of Prodesa. On November 6, 2015, Prodesa paid back to the Company the entire $400,000 and related interest owed under the purchase order facility. On November 20, 2015, the Company funded a second draw under the purchase order facility in the amount of $190,000 which was repaid in full on February 29, 2016. During the three months ended March 31, 2016, the Company funded three additional draws under the purchase order facility for an aggregate of $750,000.
On November 23, 2015, Prodesa was placed into bankruptcy by the Peruvian bankruptcy authority. At the end of August 2015, a supplier of Prodesa had filed an unpaid payable claim for just over $141,000 with the authority. While Prodesa’s management responded to the filing with a proposal to pay the claim off in full by December 2015, Prodesa’s counsel did not follow the necessary filing protocol. Unknown to management, this failure triggered Prodesa being placed into bankruptcy. Prodesa’s counsel has since been replaced. Since the filing, the Company, together with counsel, has worked in close consort with other key creditors of Prodesa, as well as management, to ensure that this filing would not impair Prodesa’s operations. All key creditors and vendors have agreed to continue to support Prodesa as usual and the initial $141,000 claim has been settled in full. Prodesa exited the bankruptcy process on April 22, 2016 and made a principal payment to the Company of $400,000 on April 29, 2016.
During the filing Prodesa launched a new adult product line in response to demand from key customers that has generated over $600,000 to date in new orders. Prodesa’s key sales and distribution channels have also attracted the attention of potential buyers and partners. Initial discussions have commenced with these parties and negotiations can now proceed in earnest since Prodesa formally exits the bankruptcy process.
Usivale
In May 2015, one of the Company’s borrowers, Usivale Industria E Commercio (“Usivale”), notified the Company that it would be unable to make its monthly interest payment for May 2015 and requested the deferment of interest payments until October 2015. Usivale is a sugar producer located in Brazil that has been in business since 1958. Usivale’s business is highly cyclical and it generates the majority of its revenues during the first and fourth quarters of any calendar year. In accordance with the terms of the loans, with an aggregate principal balance of $3,000,000 as of March 31, 2016, the Company originally increased the annual interest rate charged Usivale from 12.43% to 17.43%. However, as of March 31, 2016, the Company has placed Usivale on non-accrual status effective August 27, 2015, the date of the judicial recovery filing which is described further below. Interest not recorded relative to the original terms of the Usivale loans amounted to approximately $132,200 for the three month ended March 31, 2016. The Company has estimated the fair value of the Usivale loans as of March 31, 2016 at $2,681,576, which is unchanged from the estimated fair value as of December 31, 2015.
On August 27, 2015, Usivale filed for judicial recuperation or recovery (the “Filing”) with the local court in Brazil. The Filing was led by the ongoing pricing pressure within the sugar market, leading up to the material drop in the month of August, when prices reached a seven year low. The Filing provided for a 180 day “standstill” period relative to any claim for payment by Usivale’s creditors. During this period, Usivale was permitted to operate as usual, but was required to develop and present a recovery plan to its
28
creditors to allow it to emerge from judicial recovery. Usivale submitted an initial plan to the judicial court for review at the end of November 2015, which was published by the court on January 19, 2016. Creditors had 30 days to review and either approve or reject the plan. As the only secured creditor within the greater credit group, the Company’s acceptance of any plan is required. On February 17, 2016, the Company filed a rejection of the plan presented by Usivale. In accordance with the judicial recovery process, a general assembly of Usivale’s creditors will next be convened by the court on June 15, 2016. If an alternative plan cannot be agreed upon, the court can convert a judicial recovery procedure into a formal liquidation. In the event that Usivale is forced into liquidation, a court-appointed trustee would be charged with selling Usivale’s assets and distribute the resulting proceeds to creditors in the order of priority. After employee claims of approximately $955,000, the Company, as the only secured creditor, would be next in line in terms of recovery proceeds. Based on the most recent financial information provided by Usivale, the Company believes that there would be adequate recovery proceeds to pay back the Usivale loans.
Since the initial judicial filing in August 2015, the Company has been in active discussions with Usivale’s management. Representatives of the Company met with Usivale’s management at the end of October 2015, in November 2015 and again in February 2016. The purpose of these discussions and meetings has been to engage Usivale directly and attempt to reach a solution on the Company’s loans to Usivale. In conjunction with these efforts, on March 2, 2016, the Company filed legal action against the personal guarantees of the principals of Usivale. While the full value of these guarantees is still being assessed, it is important to emphasize that the Company’s filing against these guarantees is separate to and outside of the judicial recovery process. Our management believes that we will ultimately collect on the full amount of principal and interest recorded at March 31, 2016 due to the Company being the only senior secured creditor and its claim against the personal guarantees.
Fruit and Nut Distributor
The Company has a trade finance participation with a fruit and nut distributor (“the Distributor”) located in South Africa, with a principal balance outstanding of $820,761 of as March 31, 2016. The Distributor trade finance has a stated maturity date of May 22, 2015, which the Company agreed to extend. The Distributor has made partial payments of principal during 2015 (the original loan from the Company to the Distributor was for $1,250,000), with the most recent payment being made on October 27, 2015. Through the latter part of 2015, the depreciation in the South African Rand has proven to be problematic for the Distributor given that it has to purchase its inventory in U.S. Dollars and then sells in South African Rand. This situation has led the Distributor to experience some cash flow difficulties and operating losses. As of March 31, 2016, the Company, together with its sub-advisor, have agreed to extend further the principal maturity date to facilitate the strategic sale of the Distributor, which is expected to close in May 2016. The Company expects to restructure the loan as follows: Principal balance of $820,761, which includes capitalized accrued interest through January 31, 2016 amounting to $152,923; annual interest rate of 12% starting May 1, 2016; repayment terms of five years. Accordingly, the Company placed this participation on non-accrual status effective February 1, 2016 and interest not recorded relative to the original terms of this participation amounted to approximately $19,479 for the three months ended March 31, 2016. Based on the information available to the Company and according to its valuation policies, the Company has estimated the fair value of its investment in the Distributor to be $761,684 and recorded an unrealized depreciation adjustment of $59,077 for the three months ended March 31, 2016.
Results of Operations
Consolidated operating results for the three months ended March 31, 2016 and 2015 are as follows:
|
|
|
| |||||
|
| March 31, 2016 |
|
| March 31, 2015 |
| ||
Interest income |
| $ | 3,249,585 |
|
| $ | 1,768,866 |
|
Interest from cash |
|
| 92,269 |
|
|
| 17,616 |
|
Total investment income |
|
| 3,341,854 |
|
|
| 1,786,482 |
|
Management fees |
|
| 816,326 |
|
|
| 361,748 |
|
Incentive fees |
|
| 650,348 |
|
|
| 277,180 |
|
Professional fees |
|
| 289,031 |
|
|
| 289,988 |
|
General and administrative expenses |
|
| 201,876 |
|
|
| 144,057 |
|
Board of managers fees |
|
| 46,875 |
|
|
| 46,875 |
|
Total expenses |
|
| 2,004,456 |
|
|
| 1,119,848 |
|
Expense support payment from Sponsor |
|
| (1,914,344 | ) |
|
| (719,265 | ) |
Net expenses |
|
| 90,112 |
|
|
| 400,583 |
|
Net investment income |
| $ | 3,251,742 |
|
| $ | 1,385,899 |
|
Revenues
29
For the three months ended March 31, 2016 and 2015, total investment income amounted to $3,341,854 and $1,786,482, respectively. Interest income increased by $1,480,719 during the three months ended March 31, 2016 from the same period in 2015 primarily as a result of an increase in our weighted average investment portfolio of approximately $49,925,000 offset by a decrease in the weighted average yield of approximately 0.3% from a weighted average yield of 12.9% for the three months ended March 31, 2015 to approximately 12.6% for the three months ended March 31, 2016.
During the three months ended March 31, 2016, $2,946,394 or 90.7% of the interest income earned came from loan participations and $303,191 or 9.3% came from direct loans. In addition, we earned $92,269 in interest income on our cash balances.
For the three months ended March 31, 2015, interest income from loan participations amounted to $1,768,866. In addition, we earned $17,616 in interest income on our cash balances.
Expenses
Total operating expenses, excluding the management and incentive fees, incurred for the three months ended March 31, 2016 increased by $56,862 to $537,782 from $480,920 for the three months ended March 31, 2015. The increase was primarily due to an increase in general and administrative expenses of $57,819, which was attributable to increases in a number of expenses, the largest being a $31,420 increase in fees paid to our transfer agent. Our Sponsor assumed responsibility for our operating expenses in the amount of $537,782 and $442,085 under the Responsibility Agreement for expenses paid or incurred by the Company for the three months ended March 31, 2016 and 2015, respectively.
For the three months ended March 31, 2016 and 2015, the management fees amounted to $816,326 and $361,748, respectively. The incentive fees for the three months ended March 31, 2016 and 2015 amounted to $650,348 and $277,180 respectively. A portion of the management fees, amounting to $726,214 for 2016 was assumed by our Sponsor under the Responsibility Agreement while none of the management fee for the three months ended March 31, 2015 was assumed by our Sponsor. In addition, for the three months ended March 31, 2016 and 2015, the entire amounts of the incentive fees for both periods were assumed by the Sponsor under the Responsibility Agreement.
Net Realized Gains or Losses and Net Change in Unrealized Appreciation or Depreciation on Investments. We measure net realized gains or losses by the difference between the net proceeds from the repayment or sale of an investment and the amortized cost basis of the investment, without regard to unrealized appreciation or depreciation previously recognized, but considering unamortized upfront fees and prepayment penalties. Net change in unrealized appreciation or depreciation reflects the change in portfolio investment values during the reporting period, including any reversal of previously recorded unrealized appreciation or depreciation, when gains or losses are realized. We recorded a $59,077 unrealized loss for the three months ended March 31, 2016 and none for 2015. We had no realized gains or losses for the three months ended March 31, 2016 and 2015.
Changes in Net Assets from Operations. For the three months ended March 31, 2016 and 2015, we recorded a net increase in net assets resulting from operations, which consisted entirely of net investment income, of $3,192,665 and $1,385,899, respectively.
Financial Condition, Liquidity and Capital Resources
As of March 31, 2016, we had approximately $36.9 million in cash. We generate cash primarily from the net proceeds from the sale of units, from cash flows from interest, dividends and fees earned from our investments and principal repayments and proceeds from sales of our investments. We may also generate cash in the future from debt financing. Our primary use of cash will be to make loans, either directly or through participations, payments of our expenses and cash distributions to our unitholders. We expect to maintain cash reserves from time to time for investment opportunities, working capital and distributions. From the beginning of the Company’s operations to date, our Sponsor has absorbed substantially all of our operating expenses under the Responsibility Agreement. During the Offering, the Company will only reimburse the Sponsor for expenses covered under the Responsibility Agreement if we raise $200 million of gross proceeds in the primary offering, provided that any such reimbursement will not cause the Company’s net asset value per unit to fall below the prior’s quarter’s net asset value per unit. While the Company has raised gross proceeds of almost $200 million in the primary offering as of March 31, 2016, any such reimbursement would cause the Company’s net asset value per unit to fall below the prior quarter’s net asset value per unit. Thus, such amounts are not yet payable by the Company to the Sponsor Therefore, the Company does not anticipate that any reimbursement to the Sponsor during the primary offering would affect the Company’s ability to pay distributions. Following the end of the primary offering, the Sponsor could demand the reimbursement of operating expenses covered by the Responsibility Agreement. Such reimbursements to the Sponsor could affect the amount of cash available to the Company to pay distributions and/or make investments.
30
We sell our units on a continuous basis at initial offering prices of $10.00 per Class A unit, $9.576 per Class C unit, and $9.186 per Class I unit; however, to the extent that our net asset value on the most recent valuation date increases above or decreases below our net proceeds per unit as stated in the Company’s prospectus, our board of managers will adjust the offering prices of all classes of units to ensure that no unit is sold at a price, after deduction of selling commissions, dealer manager fees and organization and offering expenses, that is above or below our net asset value per unit as of such valuation date. Based on the valuation with respect to the quarter ended March 31, 2016, the offering price of our units has not changed and we are continuing to sell them at their original prices. However, the valuation and the offering prices would have decreased if the Sponsor had not made a capital contribution in the amount of $31,750 as of March 31, 2014 and $51,034 as of December 31, 2013 and had not absorbed and deferred reimbursement for substantially all of the Company’s operating expenses since it began its operations.
As of March 31, 2016, the Company had sold approximately 19.67 million total units in the Offering (including units pursuant to the Distribution Reinvestment Plan) for total gross offering proceeds of approximately $189 million.
We may borrow funds to make investments, including before we have fully invested the proceeds raised from the issuance of units, to the extent we determine that leveraging our portfolio would be appropriate. We have not decided to what extent, we will finance portfolio investments using debt or the specific form that any such financing would take, but we believe that obtaining financing is necessary for the Company to fully achieve its long term goals. We have been actively seeking financing and are currently talking with development banks and several commercial banks but have not yet received any commitments for financing. Accordingly, we cannot predict with certainty if we will be able to obtain financing and what terms any such financing would have or the costs we would incur in connection with any such arrangement. As of March 31, 2016, we had no debt outstanding and no available sources of debt financing.
Contractual Obligations and Commitments
The Company does not include a contractual obligations table herein as all obligations of the Company are short-term. We have included the following information related to commitments of the Company to further assist investors in understanding the Company’s outstanding commitments.
We have entered into certain contracts under which we have material future commitments. Our Amended and Restated Advisory Agreement between us and the Advisor, dated as of February 25, 2014, has a one-year term and is subject to an unlimited number of renewals upon mutual consent of the Company and the Advisor. On March 24, 2015, the Company renewed the Company’s arrangement with the Advisor for an additional one-year term. On February 19, 2016, our board of managers determined to extend our Advisory Agreement, effective March 24, 2016, for an additional one year term. The Advisor serves as our advisor in accordance with the terms of our Amended and Restated Advisory Agreement. Payments under our Amended and Restated Advisory Agreement in each reporting period consist of (i) an asset management fee equal to a percentage of the value of our gross assets, as defined in the agreement, and (ii) the reimbursement of certain expenses. Certain subordinated fees based on our performance are payable after our subordination is met.
If any of our contractual obligations discussed above are terminated, our costs may increase under any new agreements that we enter into as replacements. We would also likely incur expenses in locating alternative parties to provide the services we expect to receive under our Amended and Restated Advisory Agreement.
Off-Balance Sheet Arrangements
Other than contractual commitments and other legal contingencies incurred in the normal course of our business, we do not expect to have any off-balance sheet financings or liabilities. The Company reimburses organization and offering expenses to the Sponsor to the extent that the aggregate of selling commissions, dealer manager fees and other organization and offering costs do not exceed 15.0 % of the gross offering proceeds raised from the offering. As of March 31, 2016, the total amount that would be due to be reimbursed to the Sponsor is approximately $1.53 million.
Pursuant to the terms of the Responsibility Agreement between the Company, the Advisor and the Sponsor, the Sponsor has paid expenses on behalf of the Company through March 31, 2016 and will pay additional accrued operating expenses of the Company, which will not be reimbursable to the Sponsor until the Company has raised $200 million of gross proceeds in the primary offering, provided any such reimbursement will not cause the Company’s net asset value per unit to fall below the prior quarter’s net asset value per unit. Such expenses will be expensed and payable by the Company in the period they become reimbursable and are estimated to be approximately $9.41 million through March 31, 2016.
31
We have paid distributions commencing with the month beginning July 1, 2013, and we intend to continue to pay distributions on a monthly basis. From time to time, we may also pay interim distributions at the discretion of our board. Distributions are subject to the board of managers’ discretion and applicable legal restrictions and accordingly, there can be no assurance that we will make distributions at a specific rate or at all. Distributions are made on all classes of our units at the same time. The cash distributions received by our unitholders with respect to the Class C units are and will continue to be lower than the cash distributions with respect to Class A and Class I units because of the distribution fee relating to Class C units, which is an expense specific to Class C unitholders. Amounts distributed to each class are allocated among the unitholders in such class in proportion to their units. Distributions are paid in cash or reinvested in units, for those unitholders participating in the Distribution Reinvestment Plan. For the three months ended March 31, 2016, we paid a total of $3,189,074 in distributions, comprised of $1,857,749 paid in cash and $1,331,325 reinvested under our Distribution Reinvestment Plan.
The following table summarizes our distributions declared since we commenced operations on June 11, 2013, including the breakout between the distributions paid in cash and those reinvested pursuant to our Distribution Reinvestment Plan:
|
|
|
|
|
|
|
|
|
|
|
|
|
|
|
|
|
| Sources |
| |||||
Quarters ended |
| Amount per Unit |
|
| Cash Distributions |
|
| Distributions Reinvested |
|
| Total Declared |
|
| Cash Flows from Operating Activities |
|
| Cash Flows from Financing Activities (1) |
| ||||||
March 31, 2016 |
| $ | 0.17570 |
|
| $ | 1,857,749 |
|
| $ | 1,331,325 |
|
| $ | 3,189,074 |
|
| $ | 1,857,749 |
|
| $ | — |
|
Total for 2016 |
|
|
|
|
| $ | 1,857,749 |
|
| $ | 1,331,325 |
|
| $ | 3,189,074 |
|
| $ | 1,857,749 |
|
| $ | — |
|
|
|
|
|
|
|
|
|
|
|
|
|
|
|
|
|
|
|
|
|
|
|
|
|
|
March 31, 2015 |
| $ | 0.17377 |
|
| $ | 944,850 |
|
| $ | 441,310 |
|
| $ | 1,386,160 |
|
| $ | 944,850 |
|
| $ | — |
|
June 30, 2015 |
| $ | 0.17570 |
|
|
| 1,079,836 |
|
|
| 556,073 |
|
|
| 1,635,909 |
|
|
| 1,079,836 |
|
|
| — |
|
September 30, 2015 |
| $ | 0.17764 |
|
|
| 1,263,850 |
|
|
| 744,903 |
|
|
| 2,008,753 |
|
|
| 1,263,850 |
|
|
| — |
|
December 31, 2015 |
| $ | 0.17764 |
|
|
| 1,519,822 |
|
|
| 1,014,666 |
|
|
| 2,534,488 |
|
|
| 1,519,822 |
|
|
| — |
|
Total for 2015 |
|
|
|
|
| $ | 4,808,358 |
|
| $ | 2,756,952 |
|
| $ | 7,565,310 |
|
| $ | 4,808,358 |
|
| $ | — |
|
|
|
|
|
|
|
|
|
|
|
|
|
|
|
|
|
|
|
|
|
|
|
|
|
|
March 31, 2014 |
| $ | 0.15577 |
|
| $ | 251,016 |
|
| $ | 71,482 |
|
| $ | 322,498 |
|
| $ | 219,266 |
|
| $ | 31,750 |
|
June 30, 2014 |
| $ | 0.16970 |
|
|
| 349,070 |
|
|
| 151,603 |
|
|
| 500,673 |
|
|
| 349,070 |
|
|
| — |
|
September 30, 2014 |
| $ | 0.17764 |
|
|
| 544,594 |
|
|
| 242,582 |
|
|
| 787,176 |
|
|
| 544,594 |
|
|
| — |
|
December 31, 2014 |
| $ | 0.17764 |
|
|
| 794,372 |
|
|
| 347,002 |
|
|
| 1,141,374 |
|
|
| 794,372 |
|
|
| — |
|
Total for 2014 |
|
|
|
|
| $ | 1,939,052 |
|
| $ | 812,669 |
|
| $ | 2,751,721 |
|
| $ | 1,907,302 |
|
| $ | 31,750 |
|
|
|
|
|
|
|
|
|
|
|
|
|
|
|
|
|
|
|
|
|
|
|
|
|
|
September 30, 2013 |
| $ | 0.15924 |
|
| $ | 46,681 |
|
| $ | 21,770 |
|
| $ | 68,451 |
|
| $ | 46,681 |
|
| $ | — |
|
December 31, 2013 |
| $ | 0.15924 |
|
|
| 169,699 |
|
|
| 28,492 |
|
|
| 198,191 |
|
|
| 118,665 |
|
|
| 51,034 |
|
Total for 2013 |
|
|
|
|
| $ | 216,380 |
|
| $ | 50,262 |
|
| $ | 266,642 |
|
| $ | 165,346 |
|
| $ | 51,034 |
|
(1) | Capital contribution from our Sponsor |
Related Party Transactions
For the three months ended March 31, 2016 and 2015, the Sponsor assumed responsibility for $1,914,344 and $719,265 of the Company’s operating expenses, management fees and incentive fees, which are deferred under the Responsibility Agreement.
For the three months ended March 31, 2016 and 2015, the Advisor earned $816,326 and $361,748, respectively, in management fees and $650,348 and $277,180, respectively, in incentive fees.
Since the inception of the Company through March 31, 2016, pursuant to the terms of the Responsibility Agreement, the Sponsor has paid approximately $6,904,800 of operating expenses, management fees, and incentive fees on behalf of the Company and will pay or reimburse to the Company an additional $2,506,000 of expenses, which have been accrued by the Sponsor as of March 31, 2016. Such expenses, in the aggregate of $9,410,800 since the Company’s inception, will be expensed and payable by the Company to the Sponsor once the Company has raised gross proceeds of $200 million in the primary offering, provided any such reimbursement will not cause the Company’s net asset value per unit to fall below the prior quarter’s net asset value per unit.
As of March 31, 2016 and December 31, 2015, due from affiliates on the Consolidated Statement of Assets and Liabilities in the amounts of $2,144,985 and $1,874,932, respectively, was due from the Sponsor in connection with the Responsibility Agreement for
32
operating expenses which were paid by the Company, but, under the terms of the Responsibility Agreement, are the responsibility of the Sponsor. The Sponsor anticipated paying this receivable in the due course of business.
As March 31, 2016 and December 31, 2015, due to affiliates on the Consolidated Statement of Assets and Liabilities in the amounts of $146,710 and $472,057, respectively, was due to the Sponsor for reimbursements of offering costs.
For the three months ended March 31, 2016 and 2015, the Company paid $477,699 and $187,174, respectively, in dealer manager fees and $1,633,388 and $569,046, respectively, in selling commissions to the Company’s dealer manager, SC Distributors, LLC. These fees and commissions were paid in connection with the sales of the Company’s units to investors and, as such, were recorded against the proceeds from the issuance of units and are not reflected in the Company’s consolidated statement of operations.
Legal Proceedings
The Company is not party to any material legal proceedings.
Subsequent Events
There have been no subsequent events that occurred during such period that would require disclosure in the Form 10-Q or would be required to be recognized in the consolidated financial statements as of and for the three months ended March 31, 2016, except as discussed below.
Distributions
On April 19, 2016, with the authorization of the Company’s board of managers, the Company declared distributions for all classes of units for the period from April 1 through April 30, 2016. These distributions were calculated based on unitholders of record for each day in an amount equal to $0.00197268 per unit per day (less the distribution fee with respect to Class C units). On May 2, 2016, $638,949 of these distributions were paid in cash and on April 30, 2016, $506,242 were reinvested in units for those unitholders participating in the Distribution Reinvestment Plan.
Status of the Offering
Subsequent to March 31, 2016 through May 10, 2016, the Company sold approximately 1,476,600 units in the Offering (including shares issued pursuant to the Distribution Reinvestment Plan) for approximately $14,238,000 in gross proceeds.
Unit Offering Price
Based on the Company’s net asset value of $163,175,155 as of March 31, 2016, our board of managers has determined that no change to the offering price of our units is required and we are continuing to sell our units at their original price of $10.00 per Class A unit, $9.576 per Class C unit and $9.186 per Class I unit. Our net asset value and the offering prices would have decreased if the Sponsor had not made a capital contribution in the amount of $31,750 and $51,034 in the quarters ended March 31, 2014 and December 31, 2013, respectively or had not absorbed and deferred reimbursement for a substantial portion of our operating expenses since we began our operations.
Investments
Subsequent to March 31, 2016 through May 10, 2016, the Company funded approximately $28.9 million in new trade finance participations and received proceeds from repayment of trade finance participations of approximately $19.0 million.
Agreements
On May 11, 2016 we entered into the Responsibility Agreement with our Sponsor and Advisor. Pursuant to the terms of the Responsibility Agreement, our Sponsor agreed to be responsible for our cumulative operating expenses incurred through March 31, 2016, including incentive fees earned by the Advisor during the quarter ended March 31, 2016. For additional information regarding the Responsibility Agreement refer to Notes 2 and 5 of the financial statements.
Critical Accounting Policies and Use of Estimates
The following discussion addresses the initial accounting policies that we utilize based on our current expectations of our operations. Our most critical accounting policies involve decisions and assessments that could affect our reported assets and liabilities,
33
as well as our reported revenues and expenses. We believe that all of the decisions and assessments upon which our financial statements are based are reasonable at the time made and based upon information available to us at that time. Our critical accounting policies and accounting estimates will be expanded over time as we continue to implement our business and operating strategy. In addition to the discussion below, we also describe our critical accounting policies in the notes to our financial statements.
Basis of Presentation
Our financial statements are prepared in accordance with accounting principles generally accepted in the United States of America, which requires the use of estimates, assumptions and the exercise of subjective judgment as to future uncertainties.
Although we were organized and intend to conduct our business in a manner so that we are not required to register as an investment company under the Investment Company Act of 1940, our financial statements are prepared using the specialized accounting principles of the Financial Accounting Standards Board Accounting Standards Codification (“ASC”) Topic 946, Financial Services — Investment Companies. Overall, we believe that the use of investment company accounting makes our financial statements more useful to investors and other financial statement users since it allows a more appropriate basis of comparison to other entities with similar objectives.
Valuation of Investments
Our board of managers has established procedures for the valuation of our investment portfolio in accordance with ASC Topic 820, Fair Value Measurement (“ASC 820”). ASC 820 requires enhanced disclosures about assets and liabilities that are measured and reported at fair value. As defined in ASC 820, fair value is the price that would be received when selling an asset or paid to transfer a liability in an orderly transaction between market participants at the measurement date.
ASC 820 establishes a hierarchal disclosure framework that prioritizes and ranks the level of market price observability of inputs used in measuring investments at fair value. Market price observability is affected by a number of factors, including the type of investment and the characteristics specific to the investment. Investments with readily available active quoted prices or for which fair value can be measured from actively quoted prices generally have a higher degree of market price observability and a lesser degree of judgment used in measuring fair value.
Based on the observability of the inputs used in the valuation techniques, the Company is required to provide disclosures on fair value measurements according to the fair value hierarchy. The fair value hierarchy ranks the observability of the inputs used to determine fair values. Investments carried at fair value are classified and disclosed in one of the following three categories:
| · | Level 1 — Valuations based on unadjusted quoted prices in active markets for identical assets or liabilities that the Company has the ability to access at the measurement date. |
| · | Level 2 — Valuations based on inputs other than quoted prices included in Level 1, which are either directly or indirectly observable. |
| · | Level 3 — Valuations based on inputs that are unobservable and where there is little, if any, market activity at the measurement date. The inputs for the determination of fair value may require significant management judgment or estimation and is based upon management’s assessment of the assumptions that market participants would use in pricing the assets or liabilities. These investments include debt and equity investments in private companies or assets valued using the market or income approach and may involve pricing models whose inputs require significant judgment or estimation because of the absence of any meaningful current market data for identical or similar investments. The inputs in these valuations may include, but are not limited to, capitalization and discount rates and earnings before interest, taxes, depreciation and amortization (“EBITDA”) multiples. The information may also include pricing information or broker quotes that include a disclaimer that the broker would not be held to such a price in an actual transaction. The non-binding nature of consensus pricing and/or quotes accompanied by disclaimer would result in classification as Level 3 information, assuming no additional corroborating evidence. |
The inputs used in the determination of fair value may require significant judgment or estimation.
34
Investments for which market quotations are readily available are valued at those quotations. Most of our investments are loans to private companies, which are not actively traded in any market and for which quotations are not available. For those investments for which market quotations are not readily available, or when such market quotations are deemed by the Advisor not to represent fair value, our board of managers has approved a multi-step valuation process to be followed each fiscal quarter, as described below:
| 1. | Each investment is valued by the Advisor in collaboration with the relevant sub-advisor; |
| 2. | For all investments with a maturity of greater than 12 months, we have engaged Duff & Phelps, LLC (“Duff & Phelps”) to conduct a review on the reasonableness of our internal estimates of fair value on each asset on a quarterly rotating basis, with each of such investments being reviewed at least annually, and provide an opinion that the Advisor’s estimate of fair value for each investment is reasonable; |
| 3. | The audit committee of our board of managers reviews and discusses the preliminary valuation prepared by the Advisor and any opinion rendered by Duff & Phelps; and |
| 4. | Our board of managers discusses the valuations and determines the fair value of each investment in our portfolio in good faith based on the input of the Advisor, Duff & Phelps and the audit committee. Our board of managers is ultimately responsible for the determination, in good faith, of the fair value of each investment. |
Below is a description of factors that our board of managers may consider when valuing our investments.
Fixed income investments are typically valued utilizing a market approach, an income approach, or both approaches, as appropriate. The market approach uses prices and other relevant information generated by market transactions involving identical or comparable assets or liabilities (including the sale of a business). The income approach uses valuation techniques to convert future amounts (for example, interest and principal payments) to a single present value amount (discounted) calculated based on an appropriate discount rate. The measurement is based on the net present value indicated by current market expectations about those future amounts. In following these approaches, the types of factors that we may take into account in valuing our investments include, as applicable: available current market data, including relevant and applicable market trading and transaction comparables, applicable market yields and multiples, security covenants, call protection provisions, information rights, the nature and realizable value of any collateral, the borrower’s ability to make payments, its earnings and discounted cash flows, the markets in which the company does business, comparisons of financial ratios of peer companies that are public, the principal market for the borrower’s securities and an estimate of the borrower’s enterprise value, among other factors.
We may also look to private merger and acquisition statistics, public trading multiples discounted for illiquidity and other factors, valuations implied by third-party investments in the portfolio companies or industry practices in determining fair value. We may also consider the size and scope of a portfolio company and its specific strengths and weaknesses, as well as any other factors we deem relevant in measuring the fair values of our investments.
Revenue Recognition
We record interest income on an accrual basis to the extent that we expect to collect such amounts. We do not accrue as a receivable interest on loans for accounting purposes if we have reason to doubt our ability to collect such interest. We record prepayment premiums on loans and debt securities as interest income on a straight line basis, which we have determined not to be materially different from the effective yield method.
We generally place loans on non-accrual status when principal and interest are past due 90 days or more or when there is a reasonable doubt that we will collect principal or interest. If, however, management believes the principal and interest will be collected, a loan may be left on accrual status during the period the Company is pursuing repayment of the loan. Accrued interest is generally reversed when a loan is placed on non-accrual. Interest payments received on non-accrual loans may be recognized as income or applied to principal depending upon management’s judgment of the financial condition of the borrower. Non-accrual loans are generally restored to accrual status when past due principal and interest is paid and, in the Advisor’s judgment, is likely to remain current over the remainder of the term. At March 31, 2016, two portfolio companies were on non-accrual status with an aggregate fair value of $3,443,260 or 2.1% of the fair value of the Company’s total investments.
Structuring and similar fees are recorded as a discount on investments purchased and are accreted into income, on a straight line basis, which we have determined not to be materially different from the effective yield method. Structuring and similar fees are included in interest income.
35
Net Realized Gains or Losses and Net Change in Unrealized Appreciation or Depreciation on Investments
We measure net realized gains or losses by the difference between the net proceeds from the repayment or sale and the amortized cost basis of the investment, including unamortized upfront fees and prepayment penalties. Realized gains or losses on the disposition of an investment are calculated using the first in first out (FIFO) method, utilizing the amortized cost basis of the investment, without regard to unrealized appreciation or depreciation previously recognized, but considering unamortized upfront fees and prepayment penalties. Net change in unrealized appreciation or depreciation reflects the change in portfolio investment values during the reporting period, including any reversal of previously recorded unrealized appreciation or depreciation, when gains or losses are realized.
Payment-in-Kind Interest
We may have investments that contain a payment-in-kind, or PIK, interest provision. For loans with contractual PIK interest, any interest will be added to the principal balance of such investments and be recorded as income, if the valuation indicates that such interest is collectible.
Organization and Offering Expenses
The Sponsor has incurred organization and offering costs on behalf of the Company. Organization and offering costs are reimbursable to the Sponsor to the extent the aggregate of selling commissions, dealer manager fees and other organization and offering costs do not exceed 15.0% of the gross offering proceeds (the “O&O Reimbursement Limit”) raised from the offering and will be accrued and payable by the Company only to the extent that such costs do not exceed the O&O Reimbursement Limit. Reimbursement of organization and offering costs that exceed the O&O Reimbursement Limit will be expensed in the period they become reimbursable, which is dependent on the gross offering proceeds raised in such period, and are therefore not included on the Statements of Assets and Liabilities as of March 31, 2016 and December 31, 2015. These expense reimbursements are subject to regulatory caps and approval by the Company’s board of managers. If the Company sells the maximum amount of the Offering, it anticipates that such expenses will equal approximately 1.25% of the gross proceeds raised. However, such expenses are likely to exceed this percentage because the Offering is now due to terminate on December 31, 2016. Through March 31, 2016, such expenses equaled to 5% of the gross proceeds. Reimbursements to the Sponsor are included as a reduction to net assets on the Consolidated Statement of Changes in Net Assets.
We may reimburse our dealer manager for certain expenses that are deemed underwriting compensation. Assuming an aggregate selling commission and a dealer manager fee of 9.75% of the gross offering proceeds (which assumes all offering proceeds come from Class A units), we would reimburse the dealer manager in an amount up to 0.25% of the gross offering proceeds. Because the aggregate selling commission and dealer manager fees will be less than 9.75% of the gross offering proceeds (due to a portion of the offering proceeds coming from the sale of Class C and Class I units), we may reimburse the dealer manager for expenses in an amount greater than 0.25% of the gross offering proceeds, provided that we will not pay or reimburse any of the foregoing costs to the extent such payment would cause total underwriting compensation to exceed 10.0% of the gross proceeds of the primary offering as of the termination of the offering, as required by the rules of FINRA.
Expense Responsibility Agreement
Pursuant to the terms of the Responsibility Agreement, the Sponsor has paid expenses on behalf of the Company through March 31, 2016 and will additionally pay the accrued operating expenses of the Company as of on behalf of the Company. Since the inception of the Company through March 31, 2016, pursuant to the terms of the Responsibility Agreement, the Sponsor has paid approximately $6,904,800 of operating expenses, management fees, and incentive fees on behalf of the Company and will pay or reimburse to the Company an additional $2,506,000 of expenses, which have been accrued by the Sponsor as of March 31, 2016. Such expenses will not be reimbursable to the Sponsor until the Company has raised $200 million of gross proceeds in the primary offering, provided any such reimbursement will not cause the Company’s net asset value per unit to fall below the prior quarter’s net asset value per unit (the “Gross Proceeds Hurdle”). To the extent the Company does not meet the Gross Proceeds Hurdle in any quarter, no amount will be payable by the Company for reimbursement to the Sponsor. While the Company has raised almost $200 million of gross proceeds in the primary offering as of March 31, 2016, the Company has not met the Gross Proceeds Hurdle for the quarter ending March 31, 2016 because any reimbursement would cause the Company’s Net Assets Value per unit to fall below the prior quarter. Therefore, expenses of the Company covered by the Responsibility Agreement have not been recorded as expenses of the Company as of March 31, 2016. In accordance with ASC 450, Contingencies, such expenses will be accrued and payable by the Company in the period that they become both probable and estimable.
Income Taxes
We are characterized as a partnership for U.S. federal income tax purposes.
36
Calculation of Net Asset Value
The Company’s net asset value is calculated on a quarterly basis and commenced with respect to the first full quarter after the Company commenced operations. The Company calculates its net asset value per unit by subtracting total liabilities from the total value of our assets on the date of valuation and dividing the result by the total number of outstanding units on the date of valuation. The net asset value per Class A, Class C and Class I units are calculated on a pro-rata basis based on units outstanding.
Recently Issued Accounting Pronouncements
Under the Jumpstart Our Business Startups Act (the “JOBS Act”), emerging growth companies can delay the adoption of new or revised accounting standards until such time as those standards apply to private companies. We are choosing to take advantage of the extended transition period for complying with new or revised accounting standards. As a result, our financial statements may not be comparable to those of companies that comply with public company effective dates. There are no new or revised accounting standards that we have not adopted.
In June 2013, the FASB issued ASU 2013-08, Financial Services—Investment Companies: Amendments to the Scope, Measurement, and Disclosure Requirements (“ASU 2013-08”). ASU 2013-08 amends the current criteria for an entity to qualify as an investment company, creates new disclosure requirements and amends the measurement criteria for certain interests in other investment companies. ASU 2013-08 was effective on January 1, 2014, and did not have a material effect on the Company’s consolidated financial statements.
In May 2014, the FASB issued Accounting Standards Update 2014-09, Revenue from Contracts with Customers (Topic 606) (“ASU 2014-09”). The update supersedes the revenue recognition requirements in ASC 605, Revenue Recognition. Under the new guidance, an entity should recognize revenue to depict the transfer of promised goods or services to customers in an amount that reflects the consideration to which the entity expects to be entitled in exchange for those goods or services. In July 2015, the FASB deferred the implementation of this standard by one year. ASU 2014-09 is now effective for annual reporting periods beginning after December 15, 2018, including interim periods within that reporting period. Early adoption is permitted for annual reporting periods beginning after December 15, 2016. The adoption of the amended guidance in ASU 2014-09 is not expected to have a significant effect on the Company’s financial statements.
Item 3. Quantitative and Qualitative Disclosures About Market Risk
We are subject to financial market risks, including changes in interest rates. Our investments are currently structured with both fixed and floating interest rates. Those structured with floating rates are referenced to LIBOR and incorporate fixed interest rate floors. If rates go down further, interest income will not decrease from current levels. To the extent that interest rates go up substantially, these investments will accrue higher amounts of income than currently being realized. Returns on investments that carry fixed rates are not subject to fluctuations in interest rates, and will not adjust should rates move up or down.
To the extent that we borrow money to make investments, our net investment income will be dependent upon the difference between the rate at which we borrow funds and the rate at which we invest these funds. In periods of rising interest rates, our cost of funds would increase, which may reduce our net investment income. As a result, there can be no assurance that a significant change in market interest rates will not have a material adverse effect on our net investment income.
Although we operate in a number of foreign markets, all investments are currently denominated in U.S. Dollars. Therefore, the current portfolio does not present currency risk to U.S. unitholders. In the future, we may hedge against interest rate and currency exchange rate fluctuations by using standard hedging instruments such as futures, options and forward contracts. While hedging activities may insulate us against adverse changes in interest rates, they may also limit our ability to participate in benefits of lower interest rates with respect to our portfolio of investments with fixed interest rates.
Item 4. Controls and Procedures
In accordance with Rules 13a-15(b) and 15d-15(b) of the Securities Exchange Act of 1934, as amended (the “Exchange Act”), we, under the supervision and with the participation of our Chief Executive Officer and Chief Financial Officer, carried out an evaluation of the effectiveness of our disclosure controls and procedures (as defined in Rule 13a-15(e) and Rule 15d-15(e) of the Exchange Act) as of the end of the period covered by this Quarterly Report on Form 10-Q and determined that the disclosure controls and procedures are effective.
There have been no changes in our internal control over financial reporting that occurred during our most recently completed fiscal quarter that have materially affected, or are reasonably likely to materially affect, our internal control over financial reporting.
37
There are no pending material legal proceedings to which the Company or any of our subsidiaries or any of our property is subject.
In addition to the other information set forth in this report, you should carefully consider the risk factors discussed in Part I, Item 1A, “Risk Factors” of the Company’s Annual Report on Form 10-K for the year ended December 31, 2015, filed with the SEC on March 30, 2016 (“2015 Form 10-K”), which could materially affect our business, financial condition, and/or future results. The risks described in our 2015 Form 10-K are not the only risks facing us. Additional risks and uncertainties not currently known to us or that we currently deem to be immaterial also may materially adversely affect our business, financial condition, and/or operating results.
There have been no material changes to the risk factors disclosed in our 2015 Form 10-K.
Item 2. Unregistered Sales of Equity Securities and Use of Proceeds.
During the three months ended March 31, 2016, we did not sell or issue any equity securities that were not registered under the Securities Act.
Use of Proceeds from Registered Securities
On February 25, 2013, the Registration Statement on Form S-1, File No. 333-185676 covering the Offering, of up to $1.5 billion in units of our limited liability company interest, was declared effective under the Securities Act of 1933 by the SEC. The Offering commenced on February 25, 2013, and is currently expected to terminate on or before December 31, 2016, unless extended by our board of managers.
Through SC Distributors, LLC, the dealer manager for the Offering, we are offering to the public on a best efforts basis up to $1.25 billion of units, consisting of Class A units at $10.00 per unit, Class C units at $9.576 per unit and Class I units at $9.186 per unit.
We are also offering up to $250 million of units to be issued pursuant to our Distribution Reinvestment Plan. Units issued under the Distribution Reinvestment Plan are offered at a price equal to the then current offering price per unit less the sales fees associated with that class of units in the Primary Offering. The units being offered can be reallocated among the different classes and between the Primary Offering and the Distribution Reinvestment Plan.
As of March 31, 2016, we had received subscriptions for and issued 19,666,682 of our units, including 548,610 units issued under our Distribution Reinvestment Plan, for gross proceeds of approximately $189,383,000 including approximately $4,951,208 reinvested under our Distribution Reinvestment Plan, (before dealer-manager fees of approximately $2,676,000 and selling commissions of $9,230,000, for net proceeds of $177,477,000). From the net offering proceeds, we paid and accrued a total of $9,467,864 towards reimbursement to our Sponsor for our organization and offering costs and we have financed a total of approximately $126,100,000 in senior secured trade finance and senior secured term loan transactions.
As of March 31, 2016, approximately $1.53 million remained payable to our Sponsor for costs related to our organization and offering.
Unit Repurchase Program
Beginning June 11, 2014, we commenced a unit repurchase program pursuant to which we may conduct quarterly unit repurchases of up to 5% of our weighted average number of outstanding units in any 12-month period to allow our unitholders, who have held our units for a minimum of one year, to sell their units back to us at a price equal to the then current offering price less the sales fees associated with that class of units. Our unit repurchase program includes numerous restrictions, including a one-year holding period, that limit the ability of our unitholders to sell their units. Unless our board of managers determines otherwise, we will limit the number of units to be repurchased during any calendar year to the number of units we can repurchase with the proceeds we receive from the sale of units under our distribution reinvestment plan. At the sole discretion of our board of managers, we may also use cash on hand, cash available from borrowings and cash from liquidation of investments as of the end of the applicable quarter to repurchase units.
38
On November 11, 2014, our board of managers amended our unit repurchase program to provide for the repurchases to be made on the last calendar day of the quarter rather than the last business day of the quarter.
Our board of managers has the right to amend, suspend or terminate the unit repurchase program to the extent that it determines that it is in our best interest to do so. We will promptly notify our unitholders of any changes to the unit repurchase program, including any amendment, suspension or termination of it in our periodic or current reports or by means of other notice. Moreover, the unit repurchase program will terminate on the date that our units are listed on a national securities exchange, are included for quotation in a national securities market or, in the sole determination of our board of managers, a secondary trading market for the units otherwise develops.
The above description of the unit repurchase program is a summary of certain of the terms of the unit repurchase program. Please see the full text of the unit repurchase program, which is included as Exhibit 4.3 to this Quarterly Report on Form 10-Q, for all the terms and conditions.
During the three months ended March 31, 2016, we fulfilled the following request pursuant to our unit repurchase program:
Period |
| Total Number of Units Purchased |
|
| Average Price Paid Per Unit |
|
| Total Number of Units Purchased as Part of Publicly Announced Plans or Programs |
|
| Maximum Number of Units that May Yet be Purchased Under the Program |
| ||||
01/01/2016 - 01/31/2016 |
|
| 12,041 |
|
| $ | 9.025 |
|
|
| 12,041 |
|
|
| 506,566 |
|
02/01/2016 - 02/29/2016 |
|
| — |
|
|
| — |
|
|
| — |
|
|
| 506,566 |
|
03/01/2016 - 03/31/2016 |
|
| — |
|
|
| — |
|
|
| — |
|
|
| 506,566 |
|
Total |
|
| 12,041 |
|
| $ | 9.025 |
|
|
| 12,041 |
|
|
|
|
|
During the three months March 31, 2016, we repurchased 12,041 units for a total of $108,667. In addition, as of March 31, 2016, there were 4 repurchase requests for a total of 498,943 units that were pending which were processed by the Company on April 8, 2016 at a price of $9.025 per unit.
Item 3. Defaults Upon Senior Securities.
Not applicable.
Item 4. Mine Safety Disclosures.
Not applicable.
None.
Number |
| Description |
|
|
|
3.1 |
| Certificate of Formation of TriLinc Global Impact Fund, LLC. Incorporated by reference to Exhibit 3.1 to the Draft Registration Statement on Form S-1 (File No. 377-00015) filed with the Securities and Exchange Commission (the “SEC”) on November 1, 2012. |
|
|
|
3.2 |
| Second Amended and Restated Limited Liability Company Operating Agreement. Incorporated by reference to Appendix A to the Prospectus filed pursuant to Rule 424(b)(3) with the SEC on April 28, 2016. |
|
|
|
4.1 |
| Amended and Restated Distribution Reinvestment Plan. Incorporated by reference to Appendix C to the Prospectus filed pursuant to Rule 424(b)(3) with the SEC on April 28, 2016. |
|
|
|
4.2 |
| Amended and Restated Unit Repurchase Program. Incorporated by reference to Appendix D to the Prospectus filed pursuant to Rule 424(b)(3) with the SEC on April 28, 2016. |
|
|
|
10.1* |
| Amended and Restated Operating Expense Responsibility Agreement among TriLinc Global Impact Fund, LLC, TriLinc Global, LLC and TriLinc Advisors, LLC dated May 11, 2016. |
|
|
|
31.1* |
| Certification of Chief Executive Officer pursuant to Rule 13a-14 of the Securities Exchange Act of 1934, as amended. |
39
Number |
| Description |
|
|
|
31.2* |
| Certification of Chief Financial Officer pursuant to Rule 13a-14 of the Securities Exchange Act of 1934, as amended. |
|
|
|
32.1* |
| Certification of CEO and CFO Pursuant to 18 U.S.C. Section 1350, as Adopted Pursuant to Section 906 of the Sarbanes-Oxley Act of 2002. |
|
|
|
101 |
| The following materials from TriLinc Global Impact Fund LLC’s Quarterly Report on Form 10-Q for the quarter ended March 31, 2016, filed on May 13, 2016, formatted in XBRL (eXtensible Business Reporting Language): (i) Consolidated Statements of Assets and Liabilities, (ii) Consolidated Statement of Operations, (iii) Consolidated Statement of Changes in Net Assets, (iv) Consolidated Statements of Cash Flows, and (v) Notes to the Consolidated Financial Statements. |
|
* | Filed herewith |
40
Pursuant to the requirements of the Securities Exchange Act of 1934, the registrant has duly caused this report to be signed on its behalf by the undersigned thereunto duly authorized.
|
| TRILINC GLOBAL IMPACT FUND, LLC. | ||
|
|
|
|
|
May 13, 2016 |
| By: |
| /s/ Gloria S. Nelund |
|
|
|
| Gloria S. Nelund |
|
|
|
| Chief Executive Officer |
|
|
|
|
|
May 13, 2016 |
| By: |
| /s/ Brent L. VanNorman |
|
|
|
| Brent L. VanNorman |
|
|
|
| Chief Financial Officer |
41
TRILINC GLOBAL IMPACT FUND
Subscription Agreement
AN INVESTMENT IN THE OFFERING OR “INVESTMENT PROGRAM” DESCRIBED HEREIN CANNOT BE COMPLETED UNTIL AT LEAST FIVE (5) BUSINESS DAYS AFTER THE DATE THE INVESTOR RECEIVED THE FINAL PROSPECTUS FOR THIS OFFERING. SUBSCRIPTIONS WILL BE EFFECTIVE ONLY UPON OUR ACCEPTANCE, AND WE RESERVE THE RIGHT TO REJECT ANY SUBSCRIPTION IN WHOLE OR IN PART. IF REJECTED, ALL FUNDS SHALL BE RETURNED TO SUBSCRIBERS WITHOUT INTEREST AND WITHOUT DEDUCTION FOR ANY EXPENSES WITHIN TEN (10) BUSINESS DAYS FROM THE DATE THE SUBSCRIPTION IS REJECTED. INVESTORS WILL RECEIVE A CONFIRMATION OF THEIR PURCHASE. IF YOU HAVE ANY QUESTIONS, PLEASE CALL YOUR REGISTERED REPRESENTATIVE, SC DISTRIBUTORS, LLC (MEMBER FINRA/SIPC) AT 1-877-907-1148.
1. Investment
Amount of Subscription State of Sale
Minimum Initial Investment is $2,000
Money Orders, Traveler’s Checks, Starter Checks, Foreign Checks, Counter Checks, Third Party Checks or Cash cannot be accepted.
Payment will be made with: Enclosed Check Funds Wired Funds to Follow - Name of Institution
Volume Discount*: Check this box ONLY after discussion with your Broker-Dealer. Please provide a separate request in writing that sets forth the basis for receiving a volume discount as set forth in the appropriate prospectus.
*Any combination request will be subject to our verification that the subscriptions to be combined are made by a single qualifying purchaser. Please see “Volume Discounts” section of the prospectus for further information on volume discount qualifications
1a. Unit Class
Please consult with your Financial Advisor and check one of the following options pertaining to the class of units you intend to purchase. The Prospectus contains additional information regarding these unit classes, including the different fees which are payable with respect to each unit class.
SHARE CLASS REQUIRED Class A Units Class C Units Class I Units
2. Account Type - Check One Box Only
Account Type Additional Required Documentation
If TOD, Transfer on Death form
Individual TOD* *Please see Section 2 of Investor Instructions for details
Joint Tenants TOD* Tenants in Common* If JTWROS TOD,Transfer on Death form
Community Property* *All parties must sign / Please see Section 2 of Investor Instructions for details
Trust Trustee Certification form or trust documents
Estate Documents evidencing individuals authorized to act on behalf of estate
Custodial UGMA: State of: UTMA: State of: None
Corporation C Corp S Corp Articles of Incorporation or Corporate Resolution
LLC LLC Operating Agreement or LLC Resolution
Enter the tax classification (C= C Corporation, S= S Corporation, P= Partnership)
Partnership Partnership Certification of Powers or Certificate of Limited Partnership
Non-Profit Organization Formation document or other document evidencing authorized signers
Profit Sharing Plan* Defined Benefit Plan* Pages of plan document that list plan name, date, trustee name(s) and signatures
KEOGH Plan* *Please see Section 2 of Investor Instructions for details
Traditional IRA SEP IRA ROTH IRA For Inherited IRA indicate Decedent’s name:
Simple IRA Inherited/Beneficial IRA
Other (Specify)
> For Non-Qualified Custodial Accounts and All Qualified Accounts, please complete Section 5
CURRENT FORM AS OF 5/18/16 VERSION R
3. Investment Title
Please print names in which units of common stock are to be registered. For trusts, include trust name and name of trustee. If IRA or qualified plan, include both custodian and investor names and applicable Tax ID Numbers. If “same as below”, write “same.” (This is the name that will appear on your statement.)
Title Line 1
Title Line 2 SSN
4. Investor Information
Primary Investor is: Individual, Trust/Qualified Plan, Entity, Minor (UGMA/UTMA)
Secondary Investor is: Additional Accountholder, Trustee, Officer/Authorized Signer, Custodian (UGMA/UTMA)
Primary Investor Name SSN/TIN DOB Secondary Investor Name SSN/TIN DOB Street Address City State ZIP Mailing Address City State ZIP Phone (day) Phone (evening) Email
Check here for eletronic delivery and complete Section 5c
Citizenship: Please indicate Citizenship Status (Required)
US Citizen US Citizen residing outside the US Resident Alien
Non-Resident Alien* Country: Check here if you are subject to backup withholding
Please attach a separate sheet with the above information for each additional investor.
NOTE: Any and all U.S. taxpayers are required to complete Section 8. (If a foreign national is, in fact, a U.S. taxpayer, complete Section 8.)
* If non-resident alien, investor must submit the appropriate IRS Form W-8 (e.g., Form W-8BEN, W-8ECI, W-8EXP or W-8IMY) in order to make an investment. The applicable IRS Form can be obtained from the IRS by visiting www.irs.gov or by calling 1-800-TAX-FORM (1-800-829-3676).
5. Third Party Custodian/Trustee Information
> Applies to ALL retirement accounts. Also applies to non-retirement accounts that have elected to use a third party custodian.
> Make checks payable to the custodian and send ALL paperwork directly to the custodian. The custodian is responsible for sending payments pursuant to the instructions as set forth below.
Custodian/Trustee Name Custodian/Trustee Address
City State ZIP
Custodian/Trustee Telephone Number Custodian/Trustee Tax Identification Number
Investor Account Number with Custodian/Trustee
5a. Distribution Information (Choose one or more of the following options)
If you select more than one option you must indicate the percentage of your distribution to be applied to each option and the sum of the allocations must equal 100%. If you do not complete this section, distributions will be paid to the registered owner at the address in Section 4 above. IRA accounts may not direct distributions without the custodian’s approval.
Distributions may be funded from borrowings, offering proceeds, or proceeds from the sale of assets, which may constitute a return of capital and significantly reduce the amount of capital available for investment by TGIF. Any capital returned to investors through distributions will be returned after certain fees and expenses are paid to the sponsor of this offering or its affiliates.
If you elect to participate in the Distribution Reinvestment Plan, you agree that, if at any time you fail to meet the applicable suitability standards set forth in the then current Prospectus, you will promptly provide written notification to: TGIF, c/o DST Systems, Inc, 430 W. 7th Street, Kansas City, MO 64105. % of Distribution
I prefer to participate in the Distribution Reinvestment Plan, as described in the Prospectus.
Send distributions via check to investor’s home address (or for retirement accounts to the custodian listed in Section 6)
Send distributions via check to the alternate payee listed here (not available for retirement accounts without the custodian’s approval)
CURRENT FORM AS OF 5/18/16 VERSION R
5a. Distribution Information, continued (Choose one or more of the following options)
Name Address
City State ZIP Account Number
Direct Deposit: (Attach Voided Check) I/we authorize TGIF, or its agent, DST Systems, Inc. by or through a third party provider, (as applicable, the “Issuer”) to deposit my distribution/dividend to my checking or savings account. This authority will remain in force until I notify the Issuer in writing to cancel it. If the Issuer deposits funds erroneously into my account, they are authorized to debit my account for an amount not to exceed the amount of the erroneous deposit. The above services cannot be established without a pre-printed voided check. For electronic funds transfers, signatures of bank account owners are required exactly as they appear on the bank records. If the registration at the bank differs from that on this Subscription Agreement, all parties must sign below. (not available for custodial held accounts without the custodian’s approval)
Financial Institution Name % of Distribution Checking ABA/ Routing Number Account Number Savings
5b. Broker-Dealer, Registered Investment Advisor and Financial Representative Information
Broker-Dealer Name
Representative Name Rep Number
Represenative’s Firm Name Branch ID
Represenative’s Address
Represenative’s City State ZIP
Represenative’s Phone Number Representative’s Fax Number Represenative’s Email Address
This Subscription was made as follows:
Through a participating Broker-Dealer Units are being purchased net of commissions (Class A and Class C Units only)
Through a participating RIA* unaffiliated with a participating Broker-Dealer
*RIAs must first execute a firm level RIA Placement Agreement with SC Distributors (the Dealer Manager for TriLinc Global Impact Fund) before conducting business. To obtain an RIA Placement Agreement or for additional questions please contact SC Distributors at: 877-706-1148.
Based on the information I obtained from the investor regarding the investor’s financial situation and investment objectives, I hereby certify to TGIF, that I have reasonable grounds to believe that the purchase of the units by the investor is suitable for this investor and such investor has sufficient net worth and is in a position to realize the benefits of an investment in the units, and further that I have (a) informed the investor of all aspects of liquidity and marketability of this investment, including the restrictions on transfers of the units, (b) delivered the Prospectus to the investor the requisite number of days prior to the date that the investor will deliver this Subscription Agreement to the issuer as specified under the laws of the investor’s principal state of residence or principal state of business, as applicable, (c) verified the identity of the investor through appropriate methods and will retain proof of such verification process as required by applicable law, and (d) verified that the investor and the registered owner do not appear on the Office of Foreign Assets Control list of foreign nations, organizations and individuals subject to economic and trade sanctions.
If a Registered Associate of a FINRA member firm or a Registered Investment Advisor, I hereby certify that I am properly licensed and I am registered in the state of sale. State of sale is defined as the investor’s principal place of residence or principal place of business, as applicable.
Signature of Financial Advisor Date
Branch Manager Signature (if required by Broker-Dealer) Date
5c. Electronic Delivery (Optional)
Electronic Delivery of unitholder communication is available and if you would prefer to receive such communications and statements electronically for TGIF, please affirmatively elect to do so by signing below where indicated.
We encourage you to reduce printing and mailing costs and to conserve natural resources by electing to receive electronic delivery of unitholder communications and statement notifications. By consenting below to electronically receive unitholder communications, including your account-specific information, you authorize TGIF to either (i) e-mail unitholder communications to you directly or (ii) make them available on the TGIF website and notify you by e-mail when such documents are available and how to access the documents.
You will not receive paper copies of these electronic materials unless specifically requested, the delivery of electronic materials is prohibited or we, in our sole discretion, elect to send paper copies of the materials.
Sign below if you consent to the electronic delivery of documents for TGIF, including annual reports, proxy materials, and any other documents that may be required to be delivered under federal or state securities laws as well as account-specific information such as quarterly account statements or tax information. Your consent will be effective until you revoke it. In addition, by consenting to electronic access, you will be responsible for your customary Internet Service Provider charges in connection with access to these materials. E-mail address in the section below is required. Please carefully read the following representations before consenting to receive documents electronically. By signing this box and consenting to receive documents electronically, you represent the following:
CURRENT FORM AS OF 5/18/16 VERSION R
5c. Electronic Delivery, continued (Optional)
(a) I acknowledge that access to both Internet e-mail and the World Wide Web is required in order to access documents electronically. I may receive by e-mail notification of the availability of a document in electronic format. The notification e-mail will contain a web address (or hyperlink) where the document can be found. By entering this address into my web browser, I can view, download and print the document from my computer. I acknowledge that there may be costs associated with the electronic access, such as usage charges from my Internet provider and telephone provider, and that these costs are my responsibility. (b) I acknowledge that documents distributed electronically may be provided in Adobe’s
Portable Document Format (PDF). The Adobe Reader® software is required to view documents in PDF format. The Reader software is available free of charge from Adobe’s web site at www.adobe.com. The Reader software must be correctly installed on my system before I will be able to view documents in PDF format. Electronic delivery also involves risks related to system or network outage that could impair my timely receipt of or access to stockholder communications. (c) I acknowledge that I may receive at no cost from TGIF a paper copy of any documents delivered electronically by calling SC Distributors at 877-907-1148 from 9:00 am to 5:00 pm EST Monday-Friday. (d) I acknowledge that if the e-mail notification is returned to TGIF as “undeliverable”, a letter will be mailed to me with instructions on how to update my e-mail address to begin receiving communication via electronic delivery. I further understand that if TGIF is unable to obtain a valid e-mail address for me, TGIF will resume sending a paper copy of its filings by U.S. mail to my address of record. (e) I acknowledge that my consent may be updated or cancelled, including any updates in e-mail address to which documents are delivered, at any time by calling SC Distributors at 877-907-1148 from 9:00 am to 5:00 pm EST Monday-Friday.
Signature of Investor Date
Electronic Delivery >
Acknowledgement Signature of Joint Investor Date
Only E-mail (If blank - email from Section 4 will be used)
Joint Accounts: If your Social Security number is the primary number on a joint account and you opt-in to electronic delivery, each consenting unitholder must have access to the e-mail account provided.
Your e-mail address will be held in confidence and used only for matters relating to your investment.
6. Limited Liability Company Agreement
By executing the Subscription Agreement, the undersigned hereby agrees to be bound by the terms of the limited liability operating agreement and any amendments or supplements thereto or cancellations thereof and authorizes TriLinc Global Impact Fund to make all filings of any and all certificates, instruments, agreements or other documents, whether related to the limited liability agreement or otherwise, as may be required or advisable under the laws of the State of Delaware.
7. Subscriber Signatures
Please separately initial each of the representations below. Except in the case of fiduciary accounts, you may not grant any person or power of attorney to make such representations on your behalf. I hereby acknowledge and/or represent the following:
Owner
Co-Owner
A copy of the prospectus of TriLinc Global Impact Fund, LLC has been delivered or made available to me. In addition, I acknowledge that from time to time following the escrow period, the purchase price per unit may change and I can access this information through TriLinc Global Impact Fund’s website.
Owner
Co-Owner
I have (i) a minimum net worth (exclusive of home, home furnishings and personal automobiles) of at least $250,000 or (ii) a minimum net worth (as previously described) of at least $70,000 and a minimum annual gross income of at least $70,000, and, if applicable, I meet the higher net worth and gross income requirements imposed by my state of primary residence as set forth in the Prospectus under “Suitability Standards.”
Owner
Co-Owner
I acknowledge that there is no public market for the units and, thus, my investment in units is not liquid.
Owner
Co-Owner
I am purchasing the units for the account referenced above.
Owner
Co-Owner
I acknowledge that I will not be admitted as a unitholder until my investment has been accepted. The acceptance process includes, but is not limited to, reviewing the Subscription Agreement for completeness and signatures, conducting an Anti-Money Laundering check as required by the USA Patriot Act and payment of the full purchase price of the units.
Owner
Co-Owner
California: In addition to the minimum suitability standards described above, a California investor must have either: (i) a minimum net worth of $350,000 (exclusive of home, auto and furnishings); or (ii) a minimum annual gross income of $85,000 and a net worth of $150,000 (exclusive of home, auto and furnishings). In addition, a California investor’s maximum investment in the issuer may not exceed 10% of such investor’s net worth.
Owner
Co-Owner
Iowa: In addition to the minimum suitability standards described above, the state of Iowa requires that each Iowa investor limit his or her investment in the issuer to a maximum of 10% of his or her liquid net worth, which is defined as cash and/or cash equivalents.
Owner
Co-Owner
Kansas: In addition to the minimum suitability standards described above, it is recommended by the Office of the Kansas Securities Commissioner that Kansas investors not invest, in the aggregate, more than 10% of their liquid net worth in the issuer and other non-traded business development companies. Liquid net worth is defined as that portion of total net worth (total assets minus total liabilities) that is comprised of cash, cash equivalents and readily marketable securities, as determined in conformity with GAAP.
Owner
Co-Owner
Kentucky: In addition to the minimum suitability standards described above, all Kentucky residents who invest in the issuer must have a minimum gross annual income of $85,000 and a minimum net worth of $85,000 or a minimum net worth of $300,000. In addition, Kentucky investors must limit his or her investment in the issuer to 10% of his or her liquid net worth.
Owner
Co-Owner
Maine: In addition to the minimum suitability requirements, it is recommended that Maine investors limit their investment in the issuer and in the securities of similar programs to not more than 10% of their liquid net worth. For this purpose, “liquid net worth” is defined as that portion of net worth that consists of cash, cash equivalents and readily marketable securities.
Owner
Co-Owner
Massachusetts: In addition to the suitability described above, Massachusetts investors may not invest more than 10% of their liquid net worth in the issuer and other non-traded direct participation programs. For Massachusetts residents, “liquid net worth” is that portion of an investor’s net worth (assets minus liabilities) that is comprised of cash, cash equivalents and readily marketable securities.
CURRENT FORM AS OF 5/18/16 VERSION R
7. Subscriber Signatures, continued
Owner
Co-Owner
Nebraska: In addition to the suitability standards described above, a Nebraska investor must have either (i) an annual gross income of at least $100,000 and a net worth (not including home, furnishings and personal automobiles) of at least $350,000, or (ii) a net worth (not including home, furnishings and personal automobiles) of at least $500,000. In addition, a Nebraska investor’s maximum investment in the issuer may not exceed 10% of such investor’s net worth.
Owner
Co-Owner
New Jersey: In addition to the suitability standards described above, New Jersey investors must limit their investment in the issuer, the issuer’s affiliates, and in other non-traded business development companies to not more than 10% of their liquid net worth. Liquid net worth is defined as that portion of total net worth (total assets minus total liabilities) that is comprised of cash, cash equivalents and readily marketable securities.
Owner
Co-Owner
New Mexico: In addition to the minimum suitability standards described above, a New Mexico investor’s maximum investment in the issuer may not exceed 10% of such investor’s liquid net worth.
Owner
Co-Owner
North Dakota: In addition to the minimum suitability standards described above, North Dakota investors must represent that, in addition to the standards listed above, they have a net worth of at least ten times their investment in the issuer.
Owner
Co-Owner
Ohio: In addition to the minimum suitability standards described above, an Ohio investor must have a liquid net worth of at least ten times such Ohio resident’s investment in the issuer, the issuer’s affiliates and in other non-traded business development companies. Liquid net worth is defined as that portion of net worth (total assets exclusive of home, home furnishings, and automobiles minus total liabilities) that is comprised of cash, cash equivalents, and readily marketable securities.
Owner
Co-Owner
Oklahoma: In addition to the minimum suitability standards described above, an Oklahoma resident’s investment in the issuer must not exceed ten percent (10%) of their liquid net worth.
Owner
Co-Owner
Oregon: In addition to the minimum suitability standards described above, Oregon investors must have a net worth of at least ten times their investment in the issuer.
Owner
Co-Owner
Tennessee: In addition to the suitability standards above, Tennessee residents must have a minimum annual gross income of $100,000 and a minimum net worth of $100,000, or a minimum net worth of $500,000 exclusive of home, home furnishings and automobile. In addition, Tennessee residents’ investment in the issuer must not exceed ten percent (10%) of their liquid net worth.
Owner
Co-Owner
Texas: Texas residents purchasing units (i) must have either (a) an annual gross income of at least $100,000 and a net worth of at least $100,000, or (b) a net worth of at least $250,000; and (ii) may not invest more than 10% of their net worth in the issuer, the issuer’s affiliates and in other non-traded business development companies. For Texas residents, “net worth” does not include the value of one’s home, home furnishings or automobiles.
7a. Subscriber Acknowledgements & Signatures
WE INTEND TO ASSERT THE FOREGOING REPRESENTATION AS A DEFENSE IN ANY SUBSEQUENT LITIGATION WHERE SUCH ASSERTION WOULD BE RELEVANT. AS USED ABOVE, THE SINGULAR INCLUDES THE PLURAL IN ALL RESPECTS IF UNITS ARE BEING ACQUIRED BY MORE THAN ONE PERSON. THIS SUBSCRIPTION AGREEMENT AND ALL RIGHTS THEREUNDER SHALL BE GOVERNED BY,AND INTERPRETED IN ACCORDANCE WITH,THE LAWS OF THE STATE OF FLORIDA WITHOUT GIVING EFFECT TO THE PRINCIPLES OF CONFLICT OF LAWS. BY EXECUTING THIS SUBSCRIPTION AGREEMENT,THE SUBSCRIBER HEREBY DECLARES THE INFORMATION SUPPLIED ABOVE IS TRUE AND CORRECT AND MAY BE RELIED UPON BY TGIF IN CONNECTION WITH THE SUBSCRIBER’S INVESTMENT IN TGIF.
THE SUBSCRIBER DOES NOT WAIVE ANY RIGHTS IT MAY HAVE UNDER THE SECURITIES ACT OF 1933, THE SECURITIES EXCHANGE ACT OF 1934 OR ANY STATE SECURITIES LAW BY EXECUTING THIS SUBSCRIPTION AGREEMENT. A SALE OF UNITS MAY NOT BE COMPLETED UNTIL THE SUBSCRIBER HAS BEEN IN RECEIPT OF THE FINAL PROSPECTUS FOR TGIF FOR AT LEAST FIVE (5) BUSINESS DAYS.
THE SUBSCRIBER WILL NOT BE ADMITTED AS A UNITHOLDER OF TGIF UNTIL THIS SUBSCRIPTION AGREEMENT HAS BEEN ACCEPTED BY TGIF.TGIF MAY REJECT ANY SUBSCRIPTION,
IN WHOLE OR IN PART, SO LONG AS SUCH PARTIAL ACCEPTANCE OR REJECTION DOES NOT RESULT IN AN INVESTMENT OF LESS THAN THE MINIMUM AMOUNT SPECIFIED IN THE
PROSPECTUS. SUBSCRIPTIONS WILL BE ACCEPTED OR REJECTED WITHIN 30 DAYS OF THEIR RECEIPT.TGIF WILL ACCEPT SUBSCRIPTIONS IN GOOD ORDER NO LESS FREQUENTLY THAN MONTHLY, SUBJECT TO THE TERMS OF THE CURRENT PROSPECTUS. IF TGIF REJECTS THE SUBSCRIBER’S SUBSCRIPTION, THE PURCHASE PRICE WILL BE RETURNED TO THE SUBSCRIBER WITHIN TEN (10) BUSINESS DAYS AFTER THE REJECTION OF THE SUBSCRIPTION. IF THE SUBSCRIBER’S SUBSCRIPTION IS ACCEPTED, THE SUBSCRIBER WILL BE SENT A CONFIRMATION OF ITS PURCHASE AFTER THE SUBSCRIBER HAS BEEN ADMITTED AS A UNITHOLDER.
IMPORTANT: The investor must go to Section 8 and complete it in its entirety and sign the certifications in Section 8 in order for the Subscription Agreement to be considered valid for review.
IN ORDER TO HAVE THIS AGREEMENT EXECUTED, THE INVESTOR(S) MUST SIGN THIS SECTION
For TGIF, if the investor signing below is acquiring the units through an IRA or will otherwise beneficially hold the units through a Custodian or Trustee, the investor also authorizes
TGIF to receive (on behalf of the investor) authorization for the investor to act as proxy for the Custodian or Trustee. This authorization coupled with the Custodian or Trustee authorization below is intended to permit the investor to vote his or her units even though the investor is not the record holder of the units. Signing Section 7a will not constitute an execution of this Subscription Agreement.
Owner Signature Date Co-Owner Signature (If applicable) Date
AUTHORIZATION: FOR AUTHORIZED REPRESENTATIVE OF CUSTODIAN USE ONLY
Signature of Custodian(s) or Trustee(s): By signing this Subscription Agreement, the Custodian authorizes the investor to vote the number of units of TGIF that are beneficially owned by the investor as reflected on the records of TGIF as of the applicable record date at any meeting of the unitholders of TGIF. This authorization shall remain in place until revoked in writing by the Custodian. TGIF is hereby authorized to notify the investor of his or her right to vote consistent with this authorization.
Authorized Signature (Custodian or Trustee) Date
CURRENT FORM AS OF 5/18/16 VERSION R

8. U.S. Taxpayer Certifications
See Guidelines for U.S. Taxpayer Certifications (the “guidelines”) in Section 8 of the attached Investor Instructions to this Subscription Agreement for the guidelines on how to complete Section 8.
INFORMATION REQUIRED BELOW
Certification
Exempt payee code (If any) Exemption from FATCA reporting code (If any)
(Applies to accounts maintained outside the U.S.)
Enter your TIN in the appropriate box below. (For most individuals, this is your social security number. If you do not have a TIN, write “Applied For” in the appropriate space below and see Obtaining a Number in the Guidelines). Certify by signing and dating below.
OR
Social Security Number Employer Identification Number
SELECTION REQUIRED BELOW
You must check the box in item 2 above next to the statement that applies to you.
Under penalties of perjury, I certify that:
1. The number shown above and in this Subscription Agreement is my correct taxpayer identification number, and
2. I am not subject to backup withholding because: (a) I am exempt from backup withholding, or (b) I have not been notified by the IRS that I am subject to backup withholding as a result of a failure to report all interest or dividends, or (c) the IRS has notified me that I am no longer subject to backup withholding, or I am subject to backup withholding because I have been notified by the IRS that I am subject to backup withholding as a result of a failure to report all interest or dividends, and 3. I am a U.S. citizen or other U.S. person (as defined in the Guidelines), and
4. The FATCA code(s) entered on this form (if any) indicating I am exempt from FATCA reporting is correct.
SIGNATURE REQUIRED BELOW
Signature of Investor Print Name Date
9. Check Instructions
For Non-Custodial Accounts: Please mail a completed original Subscription Agreement along with a check and the appropriate documents outlined in Sections 1 and 2 of this Subscription Agreement, to the appropriate address as outlined in Section 9a.
For Custodial Accounts: Please mail a completed original Subscription Agreement directly to the custodian, along with your check and the appropriate documents outlined in
Sections 1 and 2 of this Subscription Agreement.
PLEASE NOTE: Only original, completed copies of the Subscription Agreement can be accepted. We cannot accept photocopied or otherwise duplicated Subscription Agreements. TriLinc Global Impact Fund Investors: The Subscription Agreement, together with a check made payable to “TriLinc Global Impact Fund” for the full purchase price, should be delivered to the address in Section 8a.
9a. Mailing Address
Regular Mail Overnight Mail Subscription Agreements may be faxed to: Payment may be wired to:
Investment Processing Department Investment Processing Department 855.223.2474 UMB Bank, N.A.
c/o DST Systems, Inc. c/o DST Systems, Inc. 1010 Grand Boulevard, 4th Floor
PO BOX 219731 430 W. 7th Street Kansas City, MO 64106
Kansas City, MO 64121-9731 Kansas City, MO 64105-1407 ABA #: 101000695
Account #: 9871916944
FAO: (Include Account Title)
Should you have any questions or concerns and require customer service to handle your request or inquiry, please contact our transfer agent at:
Investment Processing Department c/o DST Systems, 430 W. 7th St., Kansas City, MO 64105 Investors: 888.292.3178 Financial Advisors: 877.907.1148
CURRENT FORM AS OF 5/18/16 VERSION R

Investor Instructions
(not required to be returned with Subscription Agreement)
1. Investment
PLEASE NOTE: We do not accept money orders, traveler’s checks, starter checks, foreign checks, counter checks, third party checks or cash.
You must initially invest at least $2,000 in our units to be eligible to participate in this offering. In order to satisfy this minimum purchase requirement, unless otherwise prohibited by state law, a husband and wife may jointly contribute funds from their separate IRAs, provided that each such contribution is made in increments of $100. You should note that an investment in our units will not, in itself, create a retirement plan and that, in order to create a retirement plan, you must comply with all applicable provisions of the IRS Code. If you have satisfied the applicable minimum purchase requirement, any additional purchase must be at least $500. The investment minimum for subsequent purchases does not apply to units purchased pursuant to our distribution reinvestment plan.
1a. Unit Class
Please consult with your financial representative and check the appropriate box to indicate the class of units you intend to purchase. Please note that Class C units are not available for residents of KY.
2. Account Type - Check One Box Only
Please check the appropriate box to indicate the account type of the subscription.
* Transfer on Death (TOD): Investors who qualify may elect Transfer on Death (TOD) registration for such investment account. TOD registration is designed to give an owner/investor of securities the option of a nonprobate transfer at death of the assets held in the account by designating proposed beneficiary(ies) to receive the account assets upon the owner/investor’s death. TOD registration is available only for owner(s)/investor(s) who are (i) a natural person or (ii) two natural persons holding the account as Tenants by the Entirety or (iii) two or more natural persons holding the account as Joint Tenants with Right of Survivorship or (iv) a married couple holding the account as community property with right of survivorship. The following forms of ownership are ineligible for TOD registration: Tenants in Common, community property without survivorship, non-natural account owners (i.e., entities such as corporations, trusts or partnerships), and investors who are not residents of a state that has adopted the Uniform Transfer on Death Security Registration Act.
Investors who are plan participants under a registered IRA, Keogh, Qualified Pension Plan or Qualified Profit Sharing Plan program may be eligible to purchase such investment through such accounts. No representations are made, and the offeror disclaims any responsibility or liability to the plan custodian, plan administrators, plan participants, investors, or beneficiaries thereof as to the tax ramifications of such investment, the suitability or eligibility of such investment under the respective plan, or that such Investment comports with ERISA, Internal Revenue Service or other governmental rules and regulations pertaining to such plan investments and rights thereunder. A separate private investment form or similar documentation from the Plan Custodian/
Administrator and plan participants/investors is required for investment through these types of accounts.
3. Select Investment Title
All investors must complete the space provided for taxpayer identification number or social security number. By signing in Section 6a, you are certifying that this number is correct. Please print the exact name(s) in which units are to be registered. Include the trust/entity name, if applicable. If the account is Qualified, include the names and taxpayer identification numbers of the investor and the custodian or trustee.
4. Enter Investor Information
To help the government fight the funding of terrorism and money laundering activities, federal law requires all financial institutions, including TriLinc Global Impact Fund, to obtain, verify and record information that identifies each person who opens an account or person(s) authorized to effect transactions in an account. When you open an account, we will ask for your name, address, date of birth and other information that will allow us to identify you. Some or all of this information will be used to verify the identity of all persons opening an account.
Enter the name(s), mailing address and telephone numbers of the registered owner of the investment.
You must include a permanent street address even if your mailing address is a P.O. Box. If the investment is to be held by joint owners you must provide the requested investor information for each joint owner.
All investors must provide a taxpayer identification number or social security number. By signing in Section 6a, you are certifying that this number is correct. Primary Investor is: Individual, Trust/Qualified Plan, Entity, Minor (UGMA/UTMA) Secondary Investor is: Additional Accountholder, Trustee, Officer/Authorized Signer, Custodian (UGMA/UTMA)
5. Enter Third Party Custodian/Trustee Information
Make checks payable to the custodian and send ALL paperwork directly to the custodian.
If you would like to purchase units through an IRA account, First Trust Retirement has agreed to act as IRA custodians for such purpose; however, we do not require that you use our IRA custodian.
If you wish to purchase units through an IRA, and would like to establish an IRA account for this purpose, First Trust Retirement has agreed to serve as IRA custodian for such purpose.
TriLinc Global Impact Fund will pay the first-year annual IRA maintenance fees of such accounts with First Trust Retirement. Thereafter, investors will be responsible for the annual IRA maintenance fees which are currently $25 per account per year. A separate IRA application from First Trust Retirement must be completed and can be found in the TriLinc Global Impact Fund Combined/Traditional Roth Package. Further information about custodial services is also available through your financial representative or our dealer-manager.
Complete this section if the registered owner of the investment will be a Custodian Plan or Trust.
5a. Enter Distribution Information
CURRENT FORM AS OF 5/18/16 VERSION R
5b. Enter Broker-Dealer, Registered Investment Advisor and Financial Representative Information
PLEASE NOTE: The Broker-Dealer or Financial Advisor must complete and sign this section of the Subscription Agreement. All fields are mandatory.
Required Representations: By signing Section 5b, the Financial Advisor confirms on behalf of the Broker-Dealer that he or she:
• has discussed the investor’s prospective purchase of units with such investor;
• has advised such investor of all fundamental risks related to the investment in the units, and the risk that the investor could lose his or her entire investment in the units; • has reasonable grounds to believe the investor is purchasing these units for the account referenced in Section 5, and The Broker-Dealer is duly licensed and may lawfully offer and sell the units in the state of sale designated as the investor’s principal place of residence or principal place of business, as applicable; and agrees to maintain records of the information used to determine that an investment in units is suitable and appropriate for the investor for a period of six years. Net of Commission Purchase (“NOCP”): NOCPs are available to registered associates and other employees of soliciting Broker-Dealer, TGIF and their affiliates, participants in a wrap account or commission replacement account with approval for a discount by the Broker-Dealer, RIA, bank trust account, etc. Representatives will not receive selling commission.
Refer to prospectus for details.
RIA Submission: Check this box to indicate whether submission is made through a Registered Investment Advisor (RIA) in its capacity as the RIA and not in its capacity as a Financial
Advisor, if applicable, whose agreement with the subscriber includes a fixed or “wrap” fee feature for advisory and related brokerage services. If an owner or principal or any member of the RIA firm is a FINRA licensed Financial Advisor affiliated with a Broker-Dealer, the transaction should be completed through that Broker-Dealer, not through the RIA.
5c. Select Electronic Delivery (Optional)
6. Limited Liability Company Agreement
By signing the Subscription Agreement, you agree to be bound by the terms of our operating agreement and any of its amendments or supplements and authorize TriLinc Global Impact Fund to make all filings of certificates, instruments, agreements or other documents as may be required or advisable under Delaware law.
7. Subscriber Acknowledgements & Signatures
You must initial ALL appropriate representations for TGIF.
IMPORTANT: Please carefully read and separately initial each of the representations. Except in the case of fiduciary accounts, you may not grant any person a power of attorney to make such representations on your behalf.
7a. Subscriber Acknowledgements & Signatures
By signing this Subscription Agreement, you agree to provide the information in Section 7 of such Agreement and confirm the information is true and correct. If we are unable to verify your identity or that of another person authorized to act on your behalf or if we believe we have identified potential criminal activity, we reserve the right to take action as we deem appropriate, including, but not limited to, closing your account or refusing to establish your account.
8. Guidelines for U.S. Taxpayer Certifications
Definition of a U.S. Person - For U.S. federal tax purposes, you are considered a U.S. person if you are:
• An individual who is a U.S. citizen or U.S. resident alien,
• A partnership, corporation, company or association created or organized in the United States or under the laws of the United States,
• An estate (other than a foreign estate), or
• A domestic trust (as defined in Treasury Regulations section 301.7701-7).
What Number to Give the Requester - Social Security numbers (‘SSN’) have nine digits separated by two hyphens: i.e., 000-00-0000. Employer identification numbers (“EIN’) have nine digits separated by only one hyphen: i.e., 00-0000000. The table below will help determine the number to give the payer. All ‘Section’ references are to the Internal Revenue Code of 1986, as amended.
For this type of account:
1. An individual’s account
2. Two or more individuals (Joint account)
3. Custodian account of a minor (Uniform Gift to Minors Act)
4. (a) The usual revocable savings trust account (grantor also is trustee) (b) So-called trust account that is not a legal or valid trust under State law
5. Sole proprietorship or disregarded entity owned by an individual
6. Grantor trust filing under Optional Form 1099 Filing Method 1 (see,Regulations section 1.671-4(b)(2)(i)(A))
Give the SSN of:
The individual
The actual owner of the account or, if combined funds, the first individual on the account (1)
The minor (2)
The grantor-trustee (1) The actual owner (1) The owner (3)
The grantor (4)
CURRENT FORM AS OF 5/18/16 VERSION R

8. Guidelines for U.S. Taxpayer Certifications, continued
For this type of account:
7. Disregarded entity not owned by an individual
8. A valid trust, estate, or pension trust
9. Corporate or LLC electing corporate status on Form 8832 or Form 2553
10. Association, club, religious, charitable, educational, or other tax-exempt organization
11. Partnership or multi-member LLC
12. Account with the Department of Agriculture in the name of a public entity (such as a State or local government, school district or prison) that receives agricultural program payments
13. A broker or registered nominee
14. Grantor trust filing under the Form 1041 Filing Method or the Optional Form 1099 Filing Method 2 (see, Regulations section 1.671-4(b)(2)(i)(B))
Give the SSN of:
The owner (3)
The legal entity (5)
The corporation
The organization
The partnership or LLC
The public entity
The broker or nominee
The trust
(1) List first and circle the name of the person whose number you furnish. If only one person on a joint account has an SSN, that person’s number must be furnished.
(2) Circle the minor’s name and furnish the minor’s SSN.
(3) You must show your individual name and you also may enter your business or ‘DBA’ name on the second name line. You may use either your SSN or EIN (if you have one). If you are a sole proprietor, the IRS encourages you to use your SSN.
(4) Note: Grantor also must provide a Form W-9 to trustee of trust.
(5) List first and circle the name of the legal trust, estate, or pension trust. (Do not furnish the TIN of the personal representative or trustee unless the legal entity itself is not designated in the account title.)
Note: If no name is circled when there is more than one name, the number will be considered to be that of the first name listed.
Obtaining a Number
If you do not have a TIN, apply for one immediately. To apply for an SSN, get Form SS-5, Application for a Social Security Card, from your local Social Security Administration office or get this form online at www.socialsecurity.gov/forms/ss-5.pdf. You also may get this form by calling 1-800-772-1213. Use Form W-7, Application for IRS Individual Taxpayer Identification Number, to apply for an ITIN, or Form SS-4, Application for Employer Identification Number, to apply for an EIN. You can apply for an EIN online by accessing the IRS website at www. irs.gov/businesses and clicking on Employer ID Numbers under Related Topics. You can get Forms W-7 and SS-4 from the IRS by visiting www.irs.gov or by calling 1-800-TAX-FORM
(1-800-829-3676).
Payees Exempt from Backup Withholding and/or FATCA Reporting
If you are exempt from backup withholding and/or FATCA reporting, enter in Section 8, any code(s) that may apply to you.
Exempt Payee Code
Generally, individuals (including sole proprietors) are not exempt from backup withholding. Corporations are exempt from backup withholding for certain payments, such as interest and dividends. Corporations are not exempt from backup withholding for payments made in settlement of payment card or third party network transactions.
The following codes identify payees that are exempt from backup withholding:
1. An organization exempt from tax under section 501(a), any IRA, or a custodial account under section 403(b)(7) if the account satisfies the requirements of section 401 (f )(2)
2. The United States or any of its agencies or instrumentalities
3. A state, the District of Columbia, a U.S. commonwealth or possession, or any of their political subdivisions, agencies or instrumentalities
4. A foreign government or any of its political subdivisions, agencies, or instrumentalities 5. A corporation
6. A dealer in securities or commodities required to register in the United States, the District of Columbia, or a U.S. commonwealth or possession 7. A futures commission merchant registered with the Commodity Futures Trading Commission 8. A real estate investment trust
9. An entity registered at all times during the tax year under the Investment Company Act of 1940
10. A common trust fund operated by a bank under section 584(a)
11. A financial institution
12. A middleman known in the investment community as a nominee or custodian
13. A trust exempt from tax under section 664 or described in section 4947
For interest and dividends, all listed payees are exempt except payees listed in category 7. For broker transactions, payees listed in categories 1 through 4 and 6 through 11 and all C corporations are exempt. For broker transactions, S corporations must not enter an exempt payee code because they are exempt only for sales of noncovered securities acquired prior to 2012.
Exempt payees described above should complete Section 8 to avoid possible erroneous backup withholding. ENTER YOUR TAXPAYER IDENTIFICATION NUMBER AND ANY APPLICABLE EXEMPT PAYEE CODE, SIGN AND DATE THE FORM AND RETURN IT TO THE PAYER.
Exemption from FATCA Reporting Code. The following codes identify payees that are exempt from reporting under FATCA. These codes apply to persons submitting this form for accounts maintained outside of the United States by certain foreign financial institutions. Therefore, if you are only submitting this form for an account you hold in the United States, you may leave this field blank. Consult with the person requesting this form if you are uncertain if the financial institution is subject to these requirements.
A – An organization exempt from tax under section 501(a) or any individual retirement plan as defined in section 7701(a)(37) B – The United States or any of its agencies or instrumentalities
C – A state, the District of Columbia, a U.S. commonwealth or possession, or any of their political subdivisions, agencies, or instrumentalities
D – A corporation the stock of which is regularly traded on one or more established securities markets, as described in Reg. section 1.1472-1(c)(1)(i) E – A corporation that is a member of the same expanded affiliated group as a corporation described in Reg. section 1.1472-1(c)(1)(i) F – A dealer in securities, commodities, or derivative financial instruments (including notional principal contracts, futures, forwards, and options) that is registered as such under the laws of the United States or any state G – A real estate investment trust
H – A regulated investment company as defined in section 851 or an entity registered at all times during the tax year under the Investment Company Act of 1940
CURRENT FORM AS OF 5/18/16 VERSION R
8. Guidelines for U.S. Taxpayer Certifications, continued
I – A common trust fund as defined in section 584(a) J – A bank as defined in section 581
K – A broker
L – A trust exempt from tax under section 664 or described in section 4947 M – A tax exempt trust under a section 403(b) plan or section 457(g) plan
Privacy Act Notice
Section 6109 requires you to provide your correct TIN to persons who must file information returns with the IRS to report interest, dividends, and certain other income paid to you, mortgage interest paid to you, mortgage interest you paid, the acquisition or abandonment of secured property, cancellation of debt, or contributions you made to an IRA, or Archer MSA or HSA. The IRS uses the numbers for identification purposes and to help verify the accuracy of your tax return. The IRS also may provide this information to the Department of Justice for civil and criminal litigation, and to cities, states, the District of Columbia and U.S. possessions to carry out their tax laws. The IRS also may disclose this information to other countries under a tax treaty, to federal and state agencies to enforce federal nontax criminal laws, or to federal law enforcement and intelligence agencies to combat terrorism. You must provide your TIN whether or not you are required to file a tax return. Payers must generally withhold 28% of taxable interest, dividend, and certain other payments to a payee who does not give a TIN to a payer. Certain penalties also may apply.
Penalties
• Failure to Furnish TIN. If you fail to furnish your correct TIN to a requester, you are subject to a penalty of $50 for each such failure unless your failure is due to reasonable cause and not to willful neglect.
• Civil Penalty for False Information With Respect to Withholding. If you make a false statement with no reasonable basis which results in no backup withholding, you are subject to a $500 penalty.
• Criminal Penalty for Falsifying Information. Willfully falsifying certifications or affirmations may subject you to criminal penalties including fines and/or imprisonment.
• Misuse of TINs. If the requester discloses or uses taxpayer identification numbers in violation of Federal law, the payer may be subject to civil and criminal penalties.
5/16 TL0007-R