UNITED STATES
SECURITIES AND EXCHANGE COMMISSION
Washington, D.C. 20549
FORM N-CSR
CERTIFIED SHAREHOLDER REPORT OF REGISTERED MANAGEMENT INVESTMENT COMPANIES
Investment Company Act file number 811-22715
Guggenheim Credit Allocation Fund
(Exact name of registrant as specified in charter)
227 West Monroe Street, Chicago, IL 60606
(Address of principal executive offices) (Zip code)
Amy J. Lee
227 West Monroe Street, Chicago, IL 60606
(Name and address of agent for service)
Registrant's telephone number, including area code: (312) 827-0100
Date of fiscal year end: May 31
Date of reporting period: June 1, 2016 – May 31, 2017
Item 1. Reports to Stockholders.
The registrant's annual report transmitted to shareholders pursuant to Rule 30e-1 under the Investment Company Act of 1940, as amended (the "Investment Company Act"), is as follows:
GUGGENHEIMINVESTMENTS.COM/GGM
... YOUR LINK TO THE LATEST, MOST UP-TO-DATE INFORMATION ABOUT GUGGENHEIM CREDIT ALLOCATION FUND
The shareholder report you are reading right now is just the beginning of the story.
Online at guggenheiminvestments.com/ggm, you will find:
| · | Daily, weekly and monthly data on share prices, distributions and more |
| · | Portfolio overviews and performance analyses |
| · | Announcements, press releases and special notices |
| · | Fund and adviser contact information |
Guggenheim Partners Investment Management, LLC and Guggenheim Funds Investment Advisors, LLC are constantly updating and expanding shareholder information services on the Fund’s website in an ongoing effort to provide you with the most current information about how your Fund’s assets are managed and the results of our efforts. It is just one more small way we are working to keep you better informed about your investment in the Fund.
DEAR SHAREHOLDER
We thank you for your investment in the Guggenheim Credit Allocation Fund (the “Fund”). This report covers the Fund’s performance for the 12-month period ended May 31, 2017.
The Fund’s investment objective is to seek total return through a combination of current income and capital appreciation.
Under normal market conditions, the Fund invests at least 80% of its net assets, plus the amount of any borrowings for investment purposes, in fixed income securities, debt securities, loans and investments with economic characteristics similar to fixed-income securities, debt securities and loans (collectively, “credit securities”). The Fund seeks to achieve its investment objective by investing in a portfolio of credit securities selected from a variety of sectors and credit qualities. The Fund may invest in credit securities of any duration or maturity. Credit securities in which the Fund may invest may pay fixed or variable rates of interest. The Fund may invest without limitation in securities of non-U.S. issuers, including issuers in emerging markets.
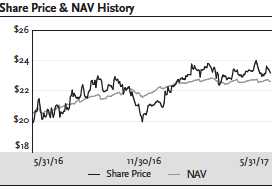
All Fund returns cited—whether based on net asset value (“NAV”) or market price—assume the reinvestment of all distributions. For the 12-month period ended May 31, 2017, the Fund provided a total return based on market price of 28.83% and a total return based on NAV of 21.55%. NAV return includes the deduction of management fees, operating expenses, and all other Fund expenses.
As of May 31, 2017, the Fund’s market price of $23.18 represented a premium of 2.48% to its NAV of $22.62. The market value of the Fund’s shares fluctuates from time to time and may be higher or lower than the Fund’s NAV. Past performance is not a guarantee of future results.
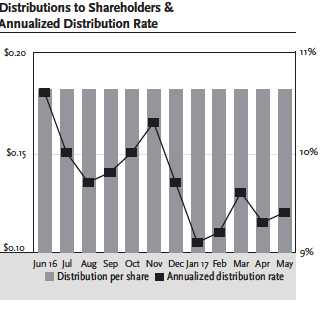
From June 2016 through May 2017, the Fund paid a monthly distribution of $0.1813. The May distribution represents an annualized distribution rate of 9.39% based on the Fund’s closing market price of $23.18 on May 31, 2017. The Fund’s distribution rate is not constant, and the amount of distributions, when declared by the Fund’s Board of Trustees, is subject to change based on the performance of the Fund. Please see Note 2(e) on page 38 for more information on distributions for the period.
Guggenheim Funds Investment Advisors, LLC (the “Adviser”) serves as the investment adviser to the Fund. Guggenheim Partners Investment Management, LLC (“GPIM” or the “Sub-Adviser”) serves as the Fund’s investment sub-adviser and is responsible for the management of the Fund’s portfolio of investments. Each of the Adviser and the Sub-Adviser is an affiliate of Guggenheim Partners, LLC (“Guggenheim”), a global diversified financial services firm.
We encourage shareholders to consider the opportunity to reinvest their distributions from the Fund through the Dividend Reinvestment Plan (“DRIP”), which is described in detail on page 64 of this report. When shares trade at a discount to NAV, the DRIP takes advantage of the discount by reinvesting the monthly distribution in common shares of the Fund purchased in the market at a price less than NAV. Conversely, when the market price of the Fund’s common shares is at a premium above NAV, the DRIP reinvests participants’ distributions in newly-issued common shares at the greater of NAV per share or
GGM l GUGGENHEIM CREDIT ALLOCATION FUND ANNUAL REPORT l 3| | |
DEAR SHAREHOLDER (Unaudited) continued | May 31, 2017 |
95% of the market price per share. The DRIP provides a cost-effective means to accumulate additional shares and enjoy the benefits of compounding returns over time. Since the Fund endeavors to maintain a stable monthly distribution, the DRIP effectively provides an income averaging technique, which causes shareholders to accumulate a larger number of Fund shares when the market price is depressed than when the price is higher.
To learn more about the Fund’s performance and investment strategy, we encourage you to read the Questions & Answers section of this report, which begins on page 5. You’ll find information on GPIM’s investment philosophy, views on the economy and market environment, and detailed information about the factors that impacted the Fund’s performance.
We appreciate your investment and look forward to serving your investment needs in the future. For the most up-to-date information on your investment, please visit the Fund’s website at guggenheiminvestments.com/ggm.
Sincerely,
Donald C. Cacciapaglia
President and Chief Executive Officer
Guggenheim Credit Allocation Fund
June 30, 2017
4 l GGM l GUGGENHEIM CREDIT ALLOCATION FUND ANNUAL REPORT| | |
QUESTIONS & ANSWERS (Unaudited) | May 31, 2017 |
Guggenheim Credit Allocation Fund (the “Fund”) is managed by a team of seasoned professionals at Guggenheim Partners Investment Management, LLC (“GPIM”). This team includes B. Scott Minerd, Chairman of Guggenheim Investments and Global Chief Investment Officer; Anne B. Walsh, CFA, JD, Senior Managing Director and Assistant Chief Investment Officer; Kevin H. Gundersen, Senior Managing Director and Portfolio Manager; James W. Michal, Senior Managing Director and Portfolio Manager; Thomas J. Hauser, Senior Managing Director and Portfolio Manager; and Richard de Wet, Director and Portfolio Manager. In the following interview, the investment team discusses the market environment and the Fund’s performance for the 12-month period ended May 31, 2017.
What is the Fund’s investment objective and how is it pursued?
The Fund’s investment objective is to seek total return through a combination of current income and capital appreciation.
Under normal market conditions, the Fund invests at least 80% of its net assets, plus the amount of any borrowings for investment purposes, in fixed income securities, debt securities, loans and investments with economic characteristics similar to fixed-income securities (collectively, “credit securities”). Credit securities in which the Fund may invest consist of corporate bonds, loans and loan participations, asset-backed securities (all or a portion of which may consist of collateralized loan obligations), mortgage-backed securities (both residential mortgage-backed securities and commercial mortgage-backed securities), U.S. Government and agency securities, mezzanine and preferred securities, convertible securities, commercial paper, municipal securities and sovereign government and supranational debt securities. The Fund will seek to achieve its investment objective by investing in a portfolio of credit securities selected from a variety of sectors and credit qualities. The Fund may invest in credit securities that are rated below investment grade, or, if unrated, determined to be of comparable quality (also known as “high yield securities” or “junk bonds”). The Fund may invest in credit securities of any duration or maturity. Credit securities in which the Fund may invest may pay fixed or variable rates of interest. The Fund may invest without limitation in securities of non-U.S. issuers, including issuers in emerging markets.
The Fund may, but is not required to, use various derivatives transactions for hedging and risk management purposes, to facilitate portfolio management and to earn income or enhance total return. The Fund may use such transactions as a means to synthetically implement the Fund’s investment strategies. In addition, as an alternative to holding investments directly, the Fund may also obtain investment exposure by investing in other investment companies. To the extent that the Fund invests in synthetic investments with economic characteristics similar to credit securities, the value of such investments will be counted as credit securities for purposes of the Fund’s policy of investing at least 80% of its net assets, plus the amount of any borrowings for investment purposes, in credit securities (the “80% Policy”).
GGM l GUGGENHEIM CREDIT ALLOCATION FUND ANNUAL REPORT l 5| | |
QUESTIONS & ANSWERS (Unaudited) continued | May 31, 2017 |
The Fund may invest in open-end funds, closed-end funds and exchange-traded funds. For purposes of the Fund’s 80% Policy, the Fund will include its investments in other investment companies that have a policy of investing at least 80% of their net assets, plus the amount of any borrowings for investment purposes, in one or more types of credit securities.
The Fund uses financial leverage (borrowing and reverse repurchase agreements) to finance the purchase of additional securities. Although financial leverage may create an opportunity for increased return for shareholders, it also results in additional risks and can magnify the effect of any losses. There is no assurance that the strategy will be successful. If income and gains on securities purchased with the financial leverage proceeds are greater than the cost of the financial leverage, common shareholders’ return will be greater than if financial leverage had not been used. Conversely, if the income or gains from the securities purchased with the proceeds of financial leverage are less than the cost of financial leverage, common shareholders’ return will be less than if financial leverage had not been used.
What were the significant events affecting the economy and market environment over the past 12 months?
Much of the 12 months ended May 31, 2017, was marked by significant events in the political sphere, both in the U.S. and globally. Last June Britain voted to leave the European Union and this was later followed by the U.S. presidential election in November. These results led to higher market volatility initially, which later subsided. Optimism surrounding future growth has helped equity markets in the U.S. reach record highs in 2017. Fixed Income markets have seen strength for the same reasons, combined with improvement in corporate performance.
The global macroeconomic backdrop for the foreseeable future is positive. Chinese growth has stabilized in the last few months, Europe is gradually improving, U.S. corporate earnings are rising, and confidence measures remain strong. Despite strong gains in consumer and business sentiment following the U.S. election, tracking estimates for first-quarter real Gross Domestic Product (“GDP”) growth slowly fell throughout the first quarter of 2017. In late June, after the period ended, the final reading of first quarter GDP came in at 1.4%. A large portion of the apparent weakness can be attributed to seasonal factors that have depressed as-reported first-quarter GDP growth over the past few years. More importantly, the prospects for quarterly U.S. GDP growth are better going forward, and GPIM expects a strong bounce back in the second quarter.
GPIM’s medium-term growth outlook has dimmed marginally as a result of the lack of progress on U.S. fiscal policy initiatives. The ongoing struggle to create a healthcare bill has taken away early legislative momentum, and tax reform shows that work still needs to be done to put the agenda into effect in a timely manner. Nevertheless, financial conditions since the election remain positive despite U.S. Federal Reserve (the “Fed”) rate hikes, and we continue to expect the economy to grow modestly. This should push the unemployment rate to under 4.1% by the end of 2018, well below its natural rate of 4.7%, and support a continued gradual rise in underlying inflation, which is nearing the Fed’s 2% goal.
Coming off the lows in early 2016, the Fed is set to continue raising interest rates and at a faster pace than the market is pricing in. In addition to another rate hike this year, the Fed may raise rates three to four more times in 2018 according to GPIM estimates. The Fed’s strategy to begin reducing its balance
6 l GGM l GUGGENHEIM CREDIT ALLOCATION FUND ANNUAL REPORT| | |
QUESTIONS & ANSWERS (Unaudited) continued | May 31, 2017 |
sheet later this year could pressure yields higher in the short end of the curve. In sum, solid but unspectacular economic growth, a cautious Fed, and improving fundamentals underpin our positive outlook for the U.S. economy, which should continue to support a historically low default environment for credit.
How did the Fund perform for the 12 months ended May 31, 2017?
All Fund returns cited—whether based on net asset value (“NAV”) or market price—assume the reinvestment of all distributions. For the 12-month period ended May 31, 2017, the Fund provided a total return based on market price of 28.83% and a total return based on NAV of 21.55%. NAV return includes the deduction of management fees, operating expenses, and all other Fund expenses.
As of May 31, 2017, the Fund’s market price of $23.18 represented a premium of 2.48% to its NAV of $22.62. As of May 31, 2016, the Fund’s market price of $19.86 represented a discount of 3.26% to its NAV of $20.53. The market value of the Fund’s shares fluctuates from time to time and may be higher or lower than the Fund’s NAV. Past performance is not a guarantee of future results.
What were the distributions over the period?
From June 2016 through May 2017, the Fund paid a monthly distribution of $0.1813. The May distribution represents an annualized distribution rate of 9.39% based on the Fund’s closing market price of $23.18 on May 31, 2017. The Fund’s distribution rate is not constant, and the amount of distributions, when declared by the Fund’s Board of Trustees, is subject to change based on the performance of the Fund. Please see Note 2(e) on page 38 for more information on distributions for the period.
Why did the Fund accrue excise tax during the period?
As a registered investment company, the Fund is subject to a 4% excise tax that is imposed if the Fund does not distribute by the end of any calendar year at least the sum of (i) 98% of its ordinary income (not taking into account any capital gain or loss) for the calendar year and (ii) 98.2% of its capital gain in excess of its capital loss (adjusted for certain ordinary losses) for a one-year period generally ending on October 31 of the calendar year (unless an election is made to use the fund’s fiscal year). The Fund generally intends to distribute income and capital gains in the manner necessary to minimize (but not necessarily eliminate) the imposition of such excise tax. While the Fund’s income and capital gains can vary significantly from year to year, the Fund seeks to maintain more stable monthly distributions over time. The Fund may retain income or capital gains and pay excise tax when it is determined that doing so is in the best interest of shareholders. Management, in consultation with the Board of Trustees, evaluates the costs of the excise tax relative to the benefits of retaining income and capital gains, including that such undistributed amounts (net of the excise tax paid) remain available for investment by the Fund and are available to supplement future distributions, which may facilitate the payment of more stable monthly distributions year over year.
What influenced the Fund’s performance?
During the period, the Fund saw positive performance primarily attributable to the tightening of credit spreads, particularly among the portfolio’s investments in high yield corporate bonds and senior bank loans, which together comprise most of the Fund. The mix varies according to the relative valuation of
GGM l GUGGENHEIM CREDIT ALLOCATION FUND ANNUAL REPORT l 7| | |
QUESTIONS & ANSWERS (Unaudited) continued | May 31, 2017 |
the two asset classes and availability of attractively priced assets. As proxies for the two markets, the Bloomberg Barclays U.S. Corporate High Yield Index returned 13.58% for the 12-month period, while the Credit Suisse Leveraged Loan Index returned 7.56%. In the high yield market, the biggest gains in the period came from lower quality, with CCC bonds (+23.13%) outperforming BB bonds (+10.08%) and B bonds (+13.48%) by a sizeable margin, continuing a trend from last year. Similarly, CCC loans (+24.16%) outperformed BB loans (+4.55%) and B loans (+7.22%).
An important driver of positive performance over the period was the rebound in commodity markets. The high yield market rallied, marked by the bottoming of oil prices and the beginning of a slew of downgrades by the credit ratings agencies, primarily of commodity-related issuers. The market was pricing in a high level of defaults just prior to this period in early 2016; but with the easing of concerns over global growth, especially in China, and the beginning of a recovery in oil and metals pricing, the market rapidly snapped back. The Fund took advantage of market weakness to find attractive entry points in high yield energy bonds as well as other assets that had sold off in tandem with commodities for no fundamental reason. Outperformance was also driven by portfolio exposure to asset-backed securities (ABS) and the technology sector.
The high-yield default rate reached a recent high in mid-2016, as a result of defaults in commodity-sensitive sectors. But with the recovery in the price of oil over the past year, the default rate has fallen below the long-term average default rate, reflecting the sound financial situation for most issuers, driven by improving fundamentals and a solid macroeconomic backdrop. Moody’s expects the default rate to drop to 3.1% by the end of 2017 and, excluding commodity sectors, the default rate for high yield bonds is near post-crisis lows. This is evident in the yield to worst on the Bloomberg Barclays U.S. Corporate High Yield Index which started the period at 7.31% and ended at 5.48%.
How is the Fund positioned for the coming months?
The Fund is positioned well across its three primary asset class exposures, with the heaviest allocation to high yield bonds, followed by bank loans and ABS. GPIM has incrementally added ABS that have shown strong yield and potential for price appreciation.
Spreads on high yield corporate bonds and bank loans were driven to near-2014 lows during the period. GPIM remains vigilant to ensure that we are being adequately compensated for the level of risk taken. The Fund continues to avoid highly levered industries and companies with heavy capital expenditure needs that can impair cash flow generation. Companies with strong cash flows, recurring revenue streams, and high-quality margins should remain the focus in the later stages of the credit cycle.
GPIM’s conscious that the securities in the Fund will need to survive another downturn. Therefore, despite seeing strong tailwinds that we expect will drive positive returns over the next two years, we maintain a more conservative outlook and continue to focus on more defensive credits with consistent cash flow and sustainable debt profiles. The Fund is overweight in technology issuers and has favored B-rated bonds, which offer attractive risk-adjusted returns relative to other rating tranches.
8 l GGM l GUGGENHEIM CREDIT ALLOCATION FUND ANNUAL REPORT| | |
QUESTIONS & ANSWERS (Unaudited) continued | May 31, 2017 |
Any other comments about the Fund?
GPIM expects the economy to remain on solid footing driven by growing consumer sentiment coupled with improving corporate fundamentals and low default rates. However, it appears the majority of this has already been priced into spreads. As a result, GPIM believes this will likely be a year of clipping coupons in high-yield, with moderate price upside coming primarily from single B-rated and a few highly selective CCC-rated credits. Amid this positive backdrop for risk assets, GPIM remains focused on credit selection.
With a sizeable portion of the Fund exposed to floating rate assets in the form of bank loans and ABS, the prospect of higher interest rates makes this basket of assets more attractive. Specifically, bank loans stand to benefit from higher interest rates, as their coupons reset at a higher rate.
What is the Fund’s duration?
The Fund has consistently been positioned conservatively in terms of duration, with higher exposure to short-dated bonds and overweight to floating rate securities (bank loans), the Fund is positioned for volatility with diversified sources of return from different assets classes in various parts of the capital structure.
The effective duration for the Fund as of May 31, 2017, was below three years. GPIM’s view is that we are unlikely to see rates move in a sudden and aggressive upward trajectory, as the Fed is providing ample guidance about the future path of interest rates. The Fund may invest in credit securities of any duration or maturity and is not required to maintain any particular maturity or duration for its portfolio as a whole. It typically maintains a leverage-adjusted average portfolio duration of one to four years. However, average portfolio duration is adjusted based on market conditions.
Discuss the Fund’s use of leverage.
The Fund utilizes leverage as part of its investment strategy, to finance the purchase of additional securities that provide increased income and potentially greater appreciation potential to common shareholders than could be achieved from a portfolio that is not leveraged.
With the low cost of borrowing and stability in the fundamentals of American companies, the amount of leverage used by the Fund is highly accretive to income generation.
The Fund currently employs leverage through borrowing and reverse repurchase agreements, under which the Fund temporarily transfers possession of portfolio securities and receives cash that can be used for additional investments.
As of May 31, 2017, the amount of leverage was approximately 29% of managed assets (including the proceeds of leverage). While leverage increases the income of the Fund in yield terms, it also amplifies the effects of changing market prices in the portfolio and can cause the Fund’s NAV to change to a greater degree than the market as a whole. This can create volatility in Fund pricing but should not affect the Fund’s ability to pay dividends under normal circumstances.
GGM l GUGGENHEIM CREDIT ALLOCATION FUND ANNUAL REPORT l 9
| | |
QUESTIONS & ANSWERS (Unaudited) continued | May 31, 2017 |
Index Definitions
Indices are unmanaged and reflect no expenses. It is not possible to invest directly in an index.
The Bloomberg Barclays U.S. Aggregate Bond Index is a broad-based flagship benchmark that measures the investment grade, U.S. dollar-denominated, fixed-rate taxable bond market, including U.S. Treasuries, government-related and corporate securities, mortgage-backed securities or “MBS” (agency fixed-rate and hybrid adjustable-rate mortgage, or “ARM”, pass-throughs), asset-backed securities (“ABS”), and commercial mortgage-backed securities (“CMBS”) (agency and non-agency).
The Bloomberg Barclays U.S. Corporate High Yield Index measures the U.S. dollar-denominated, high yield, fixed-rate corporate bond market. Securities are classified as high yield if the middle rating of Moody’s, Fitch, and S&P is Ba1/BB +/BB + or below.
The Credit Suisse Leveraged Loan Index is an index designed to mirror the investable universe of the $US-denominated leveraged loan market.
The Standard & Poor’s 500 Index is a capitalization-weighted index of 500 stocks. The index is designed to measure the performance of the economy, representing all major industries and is considered a representation of U.S. stock market.
Risks and Other Considerations
Investing involves risk, including the possible loss of principal and fluctuation of value.
The views expressed in this report reflect those of the portfolio managers only through the report period as stated on the cover. These views are expressed for informational purposes only and are subject to change at any time, based on market and other conditions, and may not come to pass. These views may differ from views of other investment professionals at Guggenheim and should not be construed as research, investment advice or a recommendation of any kind regarding the fund or any issuer or security, do not constitute a solicitation to buy or sell any security and should not be considered specific legal, investment or tax advice. The information provided does not take into account the specific objectives, financial situation or particular needs of any specific investor.
The views expressed in this report may also include forward looking statements that involve risk and uncertainty, and there is no guarantee that any predictions will come to pass. Actual results or events may differ materially from those projected, estimated, assumed or anticipated in any such forward looking statements. Important factors that could result in such differences, in addition to the other factors noted with such forward-looking statements, include general economic conditions such as inflation, recession and interest rates.
There can be no assurance that the Fund will achieve its investment objectives or that any investment strategies or techniques discussed herein will be effective. The value of the Fund will fluctuate with the value of the underlying securities. Historically, closed-end funds often trade at a discount to their net asset value.
10 l GGM l GUGGENHEIM CREDIT ALLOCATION FUND ANNUAL REPORT| | |
QUESTIONS & ANSWERS (Unaudited) continued | May 31, 2017 |
Performance data quoted represents past performance, which is no guarantee of future results and current performance may be lower or higher than the figures shown.
Please see guggenheiminvestments.com/ggm for a detailed discussion of the Fund’s risks and considerations.
This material is not intended as a recommendation or as investment advice of any kind, including in connection with rollovers, transfers, and distributions. Such material is not provided in a fiduciary capacity, may not be relied upon for or in connection with the making of investment decisions, and does not constitute a solicitation of an offer to buy or sell securities. All content has been provided for informational or educational purposes only and is not intended to be and should not be construed as legal or tax advice and/or a legal opinion. Always consult a financial, tax and/or legal professional regarding your specific situation.
GGM l GUGGENHEIM CREDIT ALLOCATION FUND ANNUAL REPORT l 11
| | |
FUND SUMMARY (Unaudited) | May 31, 2017 |
| | |
Fund Statistics | |
| Share Price | $23.18 |
| Net Asset Value | $22.62 |
| Premium to NAV | 2.48% |
| Net Assets ($000) | $158,663 |
| | | | |
AVERAGE ANNUAL TOTAL RETURNS | | | |
FOR THE PERIOD ENDED MAY 31, 2017 | | | |
| | | | Since |
| | One | Three | Inception |
| | Year | Year | (06/26/13) |
| Guggenheim Credit Allocation Fund | | | |
| NAV | 21.55% | 7.09% | 7.99% |
| Market | 28.83% | 8.24% | 7.58% |
Performance data quoted represents past performance, which is no guarantee of future results and current performance may be lower or higher than the figures shown. All NAV returns include the deduction of management fees, operating expenses and all other Fund expenses. The deduction of taxes that a shareholder would pay on Fund distributions or the redemption of Fund shares is not reflected in the total returns. For the most recent month-end performance figures, please visit guggenheiminvestments.com/ggm. The investment return and principal value of an investment will fluctuate with changes in market conditions and other factors so that an investor’s shares, when redeemed, may be worth more or less than their original cost.
| | |
Portfolio Breakdown | % of Net Assets |
| Corporate Bonds | 78.3% |
| Senior Floating Rate Interests | 44.2% |
| Asset Backed Securities | 11.9% |
| Preferred Stocks | 2.9% |
| Exchange-Traded Funds | 2.8% |
| Common Stocks | 1.9% |
| Short Term Investments | 0.5% |
| Warrants | 0.0%* |
Total Investments | 142.5% |
Other Assets & Liabilities, net | -42.5% |
Net Assets | 100.0% |
| * Less than 0.1% | |
12 l GGM l GUGGENHEIM CREDIT ALLOCATION FUND ANNUAL REPORT| | |
FUND SUMMARY (Unaudited) continued | May 31, 2017 |
GGM l GUGGENHEIM CREDIT ALLOCATION FUND ANNUAL REPORT l 13| | |
FUND SUMMARY (Unaudited) continued | May 31, 2017 |
| | |
Ten Largest Holdings | |
(% of Total Net Assets) | |
| American Midstream Partners Limited Partnership / | |
| American Midstream Finance Corp., 8.50%, 12/15/21 | 2.6% |
| Terraform Global Operating LLC, 9.75%, 08/15/22 | 2.5% |
| MDC Partners, Inc., 6.50%, 05/01/24 | 2.4% |
| Reddy Ice Holdings, Inc., 10.75%, 10/01/19 | 2.4% |
| HRG Group, Inc., 7.88%, 07/15/19 | 1.9% |
| Vector Group Ltd., 6.13%, 02/01/25 | 1.9% |
| Epicor Software, 9.40%, 06/21/23 | 1.8% |
| CTI Foods Holding Co. LLC, 8.40%, 06/28/21 | 1.8% |
| Moss Creek Resources LLC, 9.50%, 04/07/22 | 1.8% |
| SFR Group S.A., 7.38%, 05/01/26 | 1.8% |
| Top Ten Total | 20.9% |
“Ten Largest Holdings” excludes any temporary cash or derivative investments.
Portfolio breakdown and holdings are subject to change daily. For more information, please visit guggenheiminvestments.com/ggm. The above summaries are provided for informational purposes only and should not be viewed as recommendations. Past performance does not guarantee future results.
| | |
Portfolio Composition by Quality Rating* | |
| |
| | % of Total |
Rating | Investments |
| |
Fixed Income Instruments | |
| A | 1.4% |
| BBB | 3.3% |
| BB | 24.8% |
| B | 41.0% |
| CCC | 16.5% |
| CC | 0.5% |
| NR** | 9.5% |
Other Instruments | |
| Short Term Investments | 2.9% |
| Common Stocks | 0.1% |
| Total Investments | 100.0% |
| * | Source: BlackRock Solutions. Credit quality ratings are measured on a scale that generally ranges from AAA (highest) to D (lowest). All securities except for “NR”, or not rated, have been rated by Moody’s, Standard & Poor’s (“S&P”), or Fitch, which are all a Nationally Recognized Statistical Rating Organization (“NRSRO”). For purposes of this presentation, when ratings are available from more than one agency, the highest rating is used. Guggenheim Investments has converted Moody’s and Fitch ratings to the equivalent S&P rating. Security ratings are determined at the time of purchase and may change thereafter. |
| ** | NR securities do not necessarily indicate low credit quality. |
14 l GGM l GUGGENHEIM CREDIT ALLOCATION FUND ANNUAL REPORT| | |
SCHEDULE OF INVESTMENTS | May 31, 2017 |
| | | |
| | Shares | Value |
| |
COMMON STOCKS† – 1.9% | | |
Energy – 1.0% | | |
SandRidge Energy, Inc.*,1 | 58,927 | $ 1,166,165 |
| Titan Energy LLC* | 27,133 | 256,407 |
| Approach Resources, Inc.* | 95,220 | 241,860 |
Total Energy | | 1,664,432 |
| |
Technology – 0.6% | | |
Aspect Software Parent, Inc.*,†††,2,12 | 57,610 | 862,445 |
Qlik Technologies, Inc. A*,†††,2 | 56 | 55,839 |
Qlik Technologies, Inc. B*,†††,2 | 13,812 | 564 |
Qlik Technologies, Inc.*,†† | 3,600 | – |
Total Technology | | 918,848 |
| |
Industrial – 0.3% | | |
Sparta Holdings Corp., Class A*,†††,1,2 | 228 | 289,922 |
Sparta Holdings Corp., Class B*,†††,1,2 | 94,522 | 127,843 |
Ursa Insulation B.V.*,†††,2 | 5,282 | – |
Total Industrial | | 417,765 |
| |
Consumer, Non-cyclical – 0.0%** | | |
Targus Group International Equity, Inc.*,†††,2,12 | 33,098 | 49,647 |
| |
Basic Materials – 0.0%** | | |
Mirabela Nickel Ltd.*,†††,2 | 4,839,202 | 360 |
Total Common Stocks | | |
| (Cost $7,073,426) | | 3,051,052 |
| |
PREFERRED STOCKS† – 2.9% | | |
Financial – 2.2% | | |
Bank of America Corp., Series X 6.25%*,3,4 | 1,150,000 | 1,235,100 |
Citigroup, Inc., Series M 6.30%*,1,3,4 | 1,100,000 | 1,159,125 |
PNC Financial Services Group, Inc. 5.00%*,3,4 | 550,000 | 561,000 |
M&T Bank Corp. 5.13%*,3,4 | 450,000 | 461,250 |
Total Financial | | 3,416,475 |
| |
Industrial – 0.7% | | |
| Seaspan Corp. | | |
6.38%1,4 | 46,990 | 1,179,449 |
Total Preferred Stocks | | |
| (Cost $4,407,049) | | 4,595,924 |
| |
WARRANTS†† – 0.0%** | | |
| Comstock Resources, Inc. | | |
| 09/06/18 | 6,119 | 40,079 |
Total Warrants | | |
| (Cost $49,782) | | 40,079 |
See notes to financial statements.
GGM l GUGGENHEIM CREDIT ALLOCATION FUND ANNUAL REPORT l 15| | |
SCHEDULE OF INVESTMENTS continued | May 31, 2017 |
| | | |
| | Shares | Value |
| |
EXCHANGE-TRADED FUNDS† – 2.8% | | |
| SPDR Bloomberg Barclays High Yield Bond ETF | 65,000 | $ 2,430,350 |
| iShares iBoxx $ High Yield Corporate Bond ETF | 22,750 | 2,016,788 |
Total Exchange-Traded Funds | | |
| (Cost $4,348,877) | | 4,447,138 |
| |
SHORT TERM INVESTMENTS† – 0.5% | | |
| Dreyfus Treasury Prime Cash Management Institutional Shares | | |
0.65%5 | 747,391 | 747,391 |
Total Short Term Investments | | |
| (Cost $747,391) | | 747,391 |
| | Face | |
| | Amount~ | Value |
| |
CORPORATE BONDS†† – 78.3% | | |
Communications – 14.9% | | |
| MDC Partners, Inc. | | |
6.50% due 05/01/241,6 | 3,750,000 | $ 3,778,125 |
| DISH DBS Corp. | | |
5.88% due 11/15/241 | 2,300,000 | 2,449,499 |
7.75% due 07/01/261 | 850,000 | 998,750 |
| SFR Group S.A. | | |
7.38% due 05/01/261,6 | 2,600,000 | 2,812,861 |
| Sprint Communications, Inc. | | |
9.00% due 11/15/181,6 | 2,200,000 | 2,414,500 |
| EIG Investors Corp. | | |
10.88% due 02/01/241 | 2,000,000 | 2,180,000 |
| Cengage Learning, Inc. | | |
9.50% due 06/15/241,6 | 2,475,000 | 2,140,875 |
| McGraw-Hill Global Education Holdings LLC / McGraw-Hill Global Education Finance | | |
7.88% due 05/15/241,6 | 1,890,000 | 1,842,750 |
| CSC Holdings LLC | | |
5.25% due 06/01/241 | 1,350,000 | 1,378,688 |
| 6.75% due 11/15/21 | 400,000 | 442,500 |
| Virgin Media Secured Finance plc | | |
| 5.00% due 04/15/27 | 1,000,000 GBP | 1,351,948 |
| CCO Holdings LLC / CCO Holdings Capital Corp. | | |
5.13% due 05/01/271,6 | 900,000 | 921,938 |
| Comcast Corp. | | |
3.20% due 07/15/361 | 700,000 | 646,960 |
| EW Scripps Co. | | |
5.13% due 05/15/256 | 275,000 | 281,531 |
Total Communications | | 23,640,925 |
See notes to financial statements.
16 l GGM l GUGGENHEIM CREDIT ALLOCATION FUND ANNUAL REPORT| | |
SCHEDULE OF INVESTMENTS continued | May 31, 2017 |
| | | |
| | Face | |
| | Amount~ | Value |
| |
CORPORATE BONDS†† – 78.3% (continued) | | |
Energy – 14.1% | | |
| American Midstream Partners Limited Partnership / American Midstream Finance Corp. | | |
8.50% due 12/15/211,6 | 4,000,000 | $ 4,079,999 |
| CONSOL Energy, Inc. | | |
8.00% due 04/01/231 | 2,500,000 | 2,634,375 |
| Comstock Resources, Inc. | | |
10.00% due 03/15/201,7 | 2,225,000 | 2,258,374 |
| Unit Corp. | | |
| 6.63% due 05/15/21 | 2,300,000 | 2,254,000 |
| Exterran Energy Solutions Limited Partnership / EES Finance Corp. | | |
8.13% due 05/01/251,6 | 1,500,000 | 1,556,250 |
| EP Energy LLC / Everest Acquisition Finance, Inc. | | |
8.00% due 02/15/251,6 | 1,200,000 | 1,026,000 |
6.38% due 06/15/231 | 400,000 | 286,500 |
| 9.38% due 05/01/20 | 120,000 | 109,800 |
| Alta Mesa Holdings, LP / Alta Mesa Finance Services Corp. | | |
7.88% due 12/15/246 | 1,175,000 | 1,230,813 |
| Gibson Energy, Inc. | | |
5.25% due 07/15/246 | 1,200,000 CAD | 890,636 |
6.75% due 07/15/216 | 215,000 | 223,063 |
| FTS International, Inc. | | |
8.63% due 06/15/201,3,6 | 950,000 | 966,625 |
| Covey Park Energy LLC / Covey Park Finance Corp. | | |
7.50% due 05/15/256 | 750,000 | 768,750 |
| QEP Resources, Inc. | | |
6.88% due 03/01/211 | 700,000 | 735,000 |
| BreitBurn Energy Partners Limited Partnership / BreitBurn Finance Corp. | | |
7.88% due 04/15/221,8 | 2,200,000 | 621,500 |
| Legacy Reserves Limited Partnership / Legacy Reserves Finance Corp. | | |
6.63% due 12/01/211 | 750,000 | 562,500 |
| Whiting Petroleum Corp. | | |
5.75% due 03/15/211 | 550,000 | 539,550 |
| Pattern Energy Group, Inc. | | |
5.88% due 02/01/241,6 | 500,000 | 522,500 |
| Crestwood Midstream Partners Limited Partnership / Crestwood Midstream Finance Corp. | |
5.75% due 04/01/256 | 400,000 | 409,000 |
6.25% due 04/01/231 | 50,000 | 51,844 |
| TerraForm Power Operating LLC | | |
6.63% due 06/15/251,6,9 | 250,000 | 263,750 |
| Trinidad Drilling Ltd. | | |
6.63% due 02/15/256 | 200,000 | 199,000 |
| Schahin II Finance Co. SPV Ltd. | | |
5.88% due 09/25/221,8,11 | 825,233 | 107,280 |
Total Energy | | 22,297,109 |
See notes to financial statements.
GGM l GUGGENHEIM CREDIT ALLOCATION FUND ANNUAL REPORT l 17| | |
SCHEDULE OF INVESTMENTS continued | May 31, 2017 |
| | | |
| | Face | |
| | Amount~ | Value |
| |
CORPORATE BONDS†† – 78.3% (continued) | | |
Consumer, Non-cyclical – 11.6% | | |
| Vector Group Ltd. | | |
6.13% due 02/01/251,6 | 2,850,000 | $ 2,963,999 |
| Midas Intermediate Holdco II LLC / Midas Intermediate Holdco II Finance, Inc. | | |
7.88% due 10/01/221,6 | 2,651,000 | 2,730,530 |
| Great Lakes Dredge & Dock Corp. | | |
8.00% due 05/15/226 | 2,500,000 | 2,537,500 |
| Valeant Pharmaceuticals International, Inc. | | |
7.00% due 03/15/241,6 | 1,325,000 | 1,401,201 |
6.50% due 03/15/221,6 | 650,000 | 682,370 |
| Bumble Bee Holdings, Inc. | | |
9.00% due 12/15/171,6 | 1,950,000 | 1,950,000 |
| KeHE Distributors LLC / KeHE Finance Corp. | | |
7.63% due 08/15/216 | 1,400,000 | 1,407,000 |
| Bumble Bee Holdco SCA | | |
9.63% due 03/15/186,7 | 1,105,000 | 1,082,900 |
| Halyard Health, Inc. | | |
6.25% due 10/15/221 | 925,000 | 959,688 |
| Post Holdings, Inc. | | |
5.75% due 03/01/276 | 900,000 | 941,895 |
| Tenet Healthcare Corp. | | |
7.50% due 01/01/221,6 | 600,000 | 653,175 |
| Nielsen Company Luxembourg SARL | | |
5.00% due 02/01/251,6 | 575,000 | 586,500 |
| Albertsons Cos. LLC / Safeway Inc. / New Albertson’s Inc. / Albertson’s LLC | | |
6.63% due 06/15/246 | 500,000 | 517,500 |
Total Consumer, Non-cyclical | | 18,414,258 |
| |
Financial – 11.5% | | |
| Jefferies Finance LLC / JFIN Company-Issuer Corp. | | |
7.50% due 04/15/211,6 | 1,500,000 | 1,560,000 |
6.88% due 04/15/226 | 650,000 | 653,250 |
| Lincoln Finance Ltd. | | |
| 6.88% due 04/15/21 | 1,750,000 EUR | 2,116,779 |
| NFP Corp. | | |
9.00% due 07/15/211,6 | 2,000,000 | 2,100,000 |
| Jefferies Finance LLC / JFIN Co.-Issuer Corp. | | |
7.38% due 04/01/201,6 | 1,900,000 | 1,964,125 |
| FBM Finance, Inc. | | |
8.25% due 08/15/211,6 | 1,600,000 | 1,720,000 |
| Garfunkelux Holding Co. 3 S.A. | | |
| 8.50% due 11/01/22 | 1,200,000 GBP | 1,677,334 |
See notes to financial statements.
18 l GGM l GUGGENHEIM CREDIT ALLOCATION FUND ANNUAL REPORT| | |
SCHEDULE OF INVESTMENTS continued | May 31, 2017 |
| | | |
| | Face | |
| | Amount~ | Value |
| |
CORPORATE BONDS†† – 78.3% (continued) | | |
Financial – 11.5% (continued) | | |
| Majid AL Futtaim Holding | | |
7.13%4 | 1,500,000 | $ 1,577,418 |
| GEO Group, Inc. | | |
| 6.00% due 04/15/26 | 775,000 | 802,125 |
| 5.88% due 10/15/24 | 350,000 | 360,500 |
| 5.88% due 01/15/22 | 250,000 | 260,000 |
| NewStar Financial, Inc. | | |
7.25% due 05/01/201 | 1,125,000 | 1,153,125 |
| Prosight Global Inc. | | |
7.50% due 11/26/20†††,1 | 650,000 | 684,957 |
| Cabot Financial Luxembourg S.A. | | |
| 7.50% due 10/01/23 | 350,000 GBP | 494,129 |
| Greystar Real Estate Partners LLC | | |
8.25% due 12/01/221,6 | 450,000 | 484,875 |
| USIS Merger Sub, Inc. | | |
6.88% due 05/01/256 | 400,000 | 405,000 |
| Fidelity & Guaranty Life Holdings, Inc. | | |
6.38% due 04/01/216 | 200,000 | 205,500 |
| Lock AS | | |
| 7.00% due 08/15/21 | 50,000 EUR | 58,736 |
Total Financial | | 18,277,853 |
| |
Consumer, Cyclical – 7.3% | | |
| Ferrellgas Limited Partnership / Ferrellgas Finance Corp. | | |
6.50% due 05/01/211 | 1,750,000 | 1,697,499 |
6.75% due 06/15/231 | 950,000 | 916,750 |
| Nathan’s Famous, Inc. | | |
10.00% due 03/15/206 | 1,800,000 | 1,921,500 |
| WMG Acquisition Corp. | | |
6.75% due 04/15/221,6 | 1,550,000 | 1,632,538 |
| Ferrellgas, LP / Ferrellgas Finance Corp. | | |
| 6.75% due 01/15/22 | 1,365,000 | 1,317,225 |
| L Brands, Inc. | | |
6.75% due 07/01/361 | 650,000 | 625,755 |
| 7.60% due 07/15/37 | 250,000 | 250,625 |
6.88% due 11/01/351 | 175,000 | 170,188 |
| AMC Entertainment Holdings, Inc. | | |
6.13% due 05/15/276 | 750,000 | 775,313 |
| Suburban Propane Partners Limited Partnership/Suburban Energy Finance Corp. | | |
| 5.88% due 03/01/27 | 650,000 | 645,125 |
| TVL Finance PLC | | |
| 8.50% due 05/15/23 | 450,000 GBP | 640,028 |
| PetSmart, Inc. | | |
5.88% due 06/01/256 | 575,000 | 577,156 |
See notes to financial statements.
GGM l GUGGENHEIM CREDIT ALLOCATION FUND ANNUAL REPORT l 19| | |
SCHEDULE OF INVESTMENTS continued | May 31, 2017 |
| | | |
| | Face | |
| | Amount~ | Value |
| |
CORPORATE BONDS†† – 78.3% (continued) | | |
Consumer, Cyclical – 7.3% (continued) | | |
| Carrols Restaurant Group, Inc. | | |
8.00% due 05/01/221 | 400,000 | $ 427,500 |
Total Consumer, Cyclical | | 11,597,202 |
| |
Industrial – 5.4% | | |
| LMI Aerospace, Inc. | | |
7.38% due 07/15/191 | 2,628,000 | 2,733,120 |
| StandardAero Aviation Holdings, Inc. | | |
10.00% due 07/15/231,6 | 1,885,000 | 2,078,213 |
| Summit Materials LLC / Summit Materials Finance Corp. | | |
8.50% due 04/15/221 | 1,000,000 | 1,122,500 |
| Grinding Media Inc. / MC Grinding Media Canada Inc. | | |
7.38% due 12/15/236 | 850,000 | 916,938 |
| Ardagh Packaging Finance PLC | | |
| 6.75% due 05/15/24 | 600,000 EUR | 753,193 |
| Princess Juliana International Airport Operating Company N.V. | | |
5.50% due 12/20/27†††,1,2,6 | 397,045 | 392,699 |
| Tutor Perini Corp. | | |
6.88% due 05/01/251,6 | 350,000 | 366,188 |
| Ardagh Packaging Finance plc / Ardagh Holdings USA, Inc. | | |
7.25% due 05/15/241,6 | 225,000 | 245,531 |
Total Industrial | | 8,608,382 |
| |
Technology – 4.6% | | |
| Epicor Software | | |
9.40% due 06/21/23†††,1,2 | 3,000,000 | 2,931,000 |
| Micron Technology, Inc. | | |
7.50% due 09/15/231 | 1,375,000 | 1,536,012 |
5.25% due 08/01/231,6 | 925,000 | 950,438 |
| Infor US, Inc. | | |
6.50% due 05/15/221 | 1,800,000 | 1,874,250 |
Total Technology | | 7,291,700 |
| |
Utilities – 3.8% | | |
| Terraform Global Operating LLC | | |
9.75% due 08/15/226 | 3,545,000 | 3,952,675 |
| LBC Tank Terminals Holding Netherlands BV | | |
6.88% due 05/15/231,6 | 1,300,000 | 1,358,500 |
| AmeriGas Partners, LP / AmeriGas Finance Corp. | | |
5.75% due 05/20/271 | 750,000 | 757,500 |
Total Utilities | | 6,068,675 |
See notes to financial statements.
20 l GGM l GUGGENHEIM CREDIT ALLOCATION FUND ANNUAL REPORT| | |
SCHEDULE OF INVESTMENTS continued | May 31, 2017 |
| | | |
| | Face | |
| | Amount~ | Value |
| |
CORPORATE BONDS†† – 78.3% (continued) | | |
Basic Materials – 3.1% | | |
| Eldorado Gold Corp. | | |
6.13% due 12/15/201,6 | 1,900,000 | $ 1,947,500 |
| Alcoa Nederland Holding B.V. | | |
7.00% due 09/30/261,6 | 1,000,000 | 1,095,000 |
| GCP Applied Technologies, Inc. | | |
9.50% due 02/01/236 | 875,000 | 997,500 |
| Constellium N.V. | | |
7.88% due 04/01/216 | 750,000 | 807,188 |
| Mirabela Nickel Ltd. | | |
9.50% due 06/24/197,8 | 1,279,819 | 89,587 |
1.00% due 09/10/44†††,1,2,8 | 25,570 | – |
| New Day Aluminum | | |
10.00% due 10/28/20†††,2,7 | 5,403 | 4,976 |
Total Basic Materials | | 4,941,751 |
| |
Diversified – 2.0% | | |
| HRG Group, Inc. | | |
7.88% due 07/15/191 | 3,000,000 | 3,097,500 |
Total Corporate Bonds | | |
| (Cost $122,004,758) | | 124,235,355 |
| |
SENIOR FLOATING RATE INTERESTS††,3 – 44.2% | | |
Technology – 8.7% | | |
| Advanced Computer Software | | |
| 10.67% due 01/31/23 | 2,250,000 | 2,053,125 |
| 6.56% due 03/18/22 | 879,750 | 855,557 |
| TIBCO Software, Inc. | | |
| 5.55% due 12/04/20 | 2,639,368 | 2,664,125 |
| Planview, Inc. (PHNTM Holdings, Inc.) | | |
10.79% due 07/27/23†††,2 | 2,000,000 | 1,971,676 |
| Sparta Holding Corp. | | |
6.65% due 07/28/20†††,2 | 1,719,102 | 1,710,052 |
| Aspect Software, Inc. | | |
11.02% due 05/25/2012 | 1,287,955 | 1,284,735 |
4.84% due 05/25/18†††,2,12 | 385,000 | 385,000 |
| Qlik Technologies, Inc. | | |
| 4.67% due 04/26/24 | 1,000,000 | 995,420 |
| Cologix Holdings, Inc. | | |
| 8.01% due 03/20/25 | 750,000 | 751,875 |
| Seattle Spnco | | |
| 2.75% due 04/19/24 | 696,817 | 696,385 |
| MA Financeco | | |
| 3.67% due 11/19/21 | 300,000 | 299,688 |
| 2.75% due 04/19/24 | 103,183 | 103,119 |
Total Technology | | 13,770,757 |
See notes to financial statements.
GGM l GUGGENHEIM CREDIT ALLOCATION FUND ANNUAL REPORT l 21| | | |
SCHEDULE OF INVESTMENTS continued | | May 31, 2017 |
| |
| |
| |
| | Face | |
| | Amount~ | Value |
| |
SENIOR FLOATING RATE INTERESTS††,3 – 44.2% (continued) | | |
Industrial – 7.9% | | |
| Ursa Insulation B.V. | | |
25.00% due 04/26/21†††,2,7 | 1,231,327 EUR | $ 1,659,270 |
7.75% due 04/26/20†††,2 | 1,511,071 EUR | 1,697,452 |
| Doncasters Group Ltd. | | |
| 9.50% due 10/09/20 | 1,351,724 | 1,299,912 |
| Advanced Integration Technology LP | | |
| 6.54% due 04/03/23 | 1,106,750 | 1,117,818 |
| Diversitech Holdings, Inc. | | |
| 8.50% due 05/18/25 | 1,000,000 | 1,011,250 |
| Bioplan USA, Inc. | | |
| 5.75% due 09/23/21 | 894,903 | 878,499 |
| HBC Hardware Holdings | | |
7.65% due 03/30/20††† | 862,500 | 845,250 |
| Resource Label Group LLC | | |
| 11.50% due 11/26/23 | 850,000 | 837,250 |
| SRS Distribution, Inc. | | |
| 9.75% due 02/24/23 | 810,000 | 832,275 |
| National Technical | | |
7.25% due 06/12/21†††,2 | 732,407 | 714,097 |
| Ranpak | | |
| 8.25% due 10/03/22 | 560,000 | 557,200 |
| NaNa Development Corp. | | |
| 8.00% due 03/15/18 | 443,510 | 434,640 |
| ProAmpac PG Borrower LLC | | |
| 9.67% due 11/18/24 | 250,000 | 253,750 |
| Pro Mach Group, Inc. | | |
1.38% due 10/22/19†††,2 | 216,667 | 204,174 |
| Omnitracs, Inc. | | |
| 8.75% due 05/25/21 | 150,000 | 150,470 |
| Wencor Group | | |
0.89% due 06/19/19†††,2 | 76,923 | 73,228 |
Total Industrial | | 12,566,535 |
| |
Consumer, Cyclical – 7.2% | | |
| Accuride Corp. | | |
| 8.15% due 11/17/23 | 2,615,000 | 2,634,613 |
| ABRA Auto Body | | |
| 8.33% due 09/19/22 | 1,600,000 | 1,600,000 |
| 8.25% due 09/02/22 | 750,000 | 750,000 |
| Sky Bet Cyan Blue HoldCo | | |
| 4.59% due 02/25/22 | 1,500,000 GBP | 1,952,999 |
| BC Equity Ventures LLC | | |
| 7.50% due 08/31/22 | 1,939,270 | 1,919,878 |
| Sears Holdings Corp. | | |
| 5.54% due 06/30/18 | 1,468,129 | 1,439,500 |
See notes to financial statements.
22 l GGM l GUGGENHEIM CREDIT ALLOCATION FUND ANNUAL REPORT| | | |
SCHEDULE OF INVESTMENTS continued | | May 31, 2017 |
| |
| |
| |
| | Face | |
| | Amount~ | Value |
| |
SENIOR FLOATING RATE INTERESTS††,3 – 44.2% (continued) | | |
Consumer, Cyclical – 7.2% (continued) | | |
| Acosta, Inc. | | |
3.65% due 09/26/19†††,2 | 577,778 | $ 542,075 |
| Blue Nile, Inc. | | |
| 7.66% due 02/17/23 | 475,000 | 470,250 |
| CH Holding Corp. | | |
| 8.29% due 02/03/25 | 200,000 | 204,750 |
Total Consumer, Cyclical | | 11,514,065 |
| |
Consumer, Non-cyclical – 5.8% | | |
| Reddy Ice Holdings, Inc. | | |
| 10.75% due 10/01/19 | 4,000,000 | 3,760,000 |
| 6.76% due 05/01/19 | 298,446 | 294,157 |
| CTI Foods Holding Co. LLC | | |
| 8.40% due 06/28/21 | 3,430,000 | 2,881,200 |
| IHC Holding Corp. | | |
7.02% due 04/30/21†††,2 | 1,228,125 | 1,216,102 |
| Hanger, Inc. | | |
| 11.50% due 08/01/19 | 925,000 | 938,875 |
| Targus Group International, Inc. | | |
15.00% due 12/31/19†††,2,7,12 | 158,467 | 158,467 |
| Targus Group International, Inc. | | |
14.00% due 06/07/16†††,2,7,8,12 | 383,461 | – |
| American Seafoods Group LLC / American Seafoods Finance, Inc. | | |
0.88% due 08/19/21†††,2 | 22,500 | 20,143 |
Total Consumer, Non-cyclical | | 9,268,944 |
| |
Energy – 4.6% | | |
| Invenergy Thermal | | |
| 6.50% due 10/19/22 | 2,409,937 | 2,313,540 |
| Cactus Wellhead | | |
| 7.15% due 07/31/20 | 1,722,019 | 1,635,918 |
| Gavilan Resources LLC | | |
| 7.08% due 03/01/24 | 1,500,000 | 1,483,125 |
| MRP Generation Holding | | |
| 8.15% due 10/18/22 | 746,250 | 731,325 |
| Exgen Texas Power LLC | | |
5.90% due 09/18/217 | 1,044,603 | 592,812 |
| Summit Midstream Partners, LP | | |
| 7.02% due 05/13/22 | 500,000 | 508,750 |
Total Energy | | 7,265,470 |
| |
Communications – 4.0% | | |
| Anaren, Inc. | | |
| 9.40% due 08/18/21 | 2,200,000 | 2,166,999 |
| Cengage Learning Acquisitions, Inc. | | |
| 5.25% due 06/07/23 | 2,288,078 | 2,153,379 |
| |
| | |
See notes to financial statements.
GGM l GUGGENHEIM CREDIT ALLOCATION FUND ANNUAL REPORT l 23| | | |
SCHEDULE OF INVESTMENTS continued | | May 31, 2017 |
| |
| |
| |
| | Face | |
| | Amount~ | Value |
| |
SENIOR FLOATING RATE INTERESTS††,3 – 44.2% (continued) | | |
Communications – 4.0% (continued) | | |
| CSC Holdings, LLC | | |
| 3.25% due 07/17/25 | 1,350,000 | $ 1,346,963 |
| Proquest LLC | | |
| 10.01% due 12/15/22 | 656,200 | 635,694 |
Total Communications | | 6,303,035 |
| |
Utilities – 3.7% | | |
| Moss Creek Resources LLC | | |
9.50% due 04/07/22†††,2 | 2,916,667 | 2,851,042 |
| Panda Temple II Power | | |
| 7.25% due 04/03/19 | 2,962,500 | 2,592,187 |
| Stonewall | | |
| 6.65% due 11/15/21 | 450,000 | 409,500 |
Total Utilities | | 5,852,729 |
| |
Financial – 1.8% | | |
| Misys Ltd. | | |
| 4.50% due 04/26/24 | 1,600,000 | 1,603,072 |
| 4.25% due 04/26/24 | 650,000 EUR | 739,694 |
| Integro Parent, Inc. | | |
| 6.75% due 10/28/22 | 543,282 | 543,282 |
Total Financial | | 2,886,048 |
| |
Electric – 0.3% | | |
| Viva Alamo LLC | | |
| 5.30% due 02/22/21 | 496,159 | 416,773 |
| |
Transportation – 0.2% | | |
| Ceva Group PLC (UK) | | |
| 3.15% due 03/19/19 | 310,000 EUR | 313,792 |
Total Senior Floating Rate Interests | | |
| (Cost $72,214,378) | | 70,158,148 |
| |
ASSET BACKED SECURITIES†† – 11.9% | | |
Collateralized Loan Obligations – 9.4% | | |
| CIFC Funding Ltd. | | |
2014-1A, 5.66% due 04/18/253,6 | 1,340,000 | 1,273,728 |
| Anchorage Credit Funding 1 Ltd | | |
2015-1A, 6.30% due 07/28/306 | 1,000,000 | 1,001,023 |
| Monroe Capital CLO 2014-1 Ltd. | | |
2014-1A, 5.88% due 10/22/261,3,6 | 1,000,000 | 975,878 |
| Eaton Vance CLO Ltd. | | |
2014-1A, 6.19% due 07/15/263,6 | 1,000,000 | 933,562 |
| Denali Capital CLO X Ltd. | | |
2013-1A, 6.92% due 04/28/251,3,6 | 1,000,000 | 931,540 |
See notes to financial statements.
24 l GGM l GUGGENHEIM CREDIT ALLOCATION FUND ANNUAL REPORT| | | |
SCHEDULE OF INVESTMENTS continued | | May 31, 2017 |
| |
| |
| |
| | Face | |
| | Amount~ | Value |
| |
ASSET BACKED SECURITIES†† – 11.9% (continued) | | |
Collateralized Loan Obligations – 9.4% (continued) | | |
| OZLM XI Ltd. | | |
2015-11A, 7.32% due 01/30/273,6 | 1,000,000 | $ 894,121 |
| Ares Enhanced Loan Investment Strategy IR Ltd. | | |
2013-IRAR, 6.15% due 07/23/251,3,6 | 830,000 | 813,889 |
| NewStar Arlington Senior Loan Program LLC | | |
2014-1A, 5.41% due 07/25/251,3,6 | 750,000 | 718,670 |
| Saranac CLO III Ltd. | | |
2014-3A, 6.31% due 06/22/253,6 | 750,000 | 693,750 |
| Babson CLO Ltd. | | |
2012-2A, 0.00% due 05/15/231,6,10 | 1,000,000 | 582,935 |
| Fortress Credit Opportunities V CLO Ltd. | | |
2017-5A, 5.70% due 10/15/263,6 | 500,000 | 501,388 |
| FDF I Ltd. | | |
2015-1A, 6.88% due 11/12/301,6 | 500,000 | 500,435 |
| Cerberus Onshore II CLO-2 LLC | | |
2014-1A, 5.17% due 10/15/231,3,6 | 500,000 | 495,909 |
| Fortress Credit Opportunities VI CLO Ltd. | | |
2015-6A, 6.11% due 10/10/261,3,6 | 500,000 | 493,337 |
| Jamestown CLO VI Ltd. | | |
2015-6A, 5.92% due 02/20/273,6 | 500,000 | 474,225 |
| Saranac CLO II Ltd. | | |
2014-2A, 6.32% due 02/20/253,6 | 500,000 | 469,083 |
| MP CLO V Ltd. | | |
2014-1A, 7.06% due 07/18/263,6 | 500,000 | 465,861 |
| WhiteHorse VII Ltd. | | |
2013-1A, 5.99% due 11/24/253,6 | 500,000 | 464,588 |
| Adams Mill CLO Ltd. | | |
2014-1A, 6.16% due 07/15/263,6 | 500,000 | 462,586 |
| Treman Park CLO Ltd. | | |
2015-1A, 0.00% due 04/20/271,6,10 | 500,000 | 440,433 |
| Dryden 41 Senior Loan Fund | | |
2015-41A, 0.00% due 01/15/281,6,10 | 600,000 | 434,503 |
| KVK CLO Ltd. | | |
2014-2A, 5.91% due 07/15/263,6 | 500,000 | 434,189 |
| Shackleton CLO | | |
2014-6A, 6.91% due 07/17/263,6 | 250,000 | 230,954 |
| Voya CLO Ltd. | | |
2015-3A, 7.66% due 10/20/273,6 | 250,000 | 230,000 |
Total Collateralized Loan Obligations | | 14,916,587 |
| |
Transportation – 2.2% | | |
| Apollo Aviation Securitization Equity Trust | | |
2014-1, 7.38% due 12/15/293 | 722,680 | 722,680 |
| 2016-2, 7.87% due 11/15/41 | 450,000 | 450,546 |
2016-1A, 9.20% due 03/17/361,6,7 | 383,350 | 385,267 |
See notes to financial statements.
GGM l GUGGENHEIM CREDIT ALLOCATION FUND ANNUAL REPORT l 25| | | |
SCHEDULE OF INVESTMENTS continued | | May 31, 2017 |
| |
| |
| | Face | |
| | Amount~ | Value |
| |
ASSET BACKED SECURITIES†† – 11.9% (continued) | | |
Transportation – 2.2% (continued) | | |
| Turbine Engines Securitization Ltd. | | |
2013-1A, 6.38% due 12/13/481,11 | 286,776 | $ 266,701 |
| Emerald Aviation Finance Ltd. | | |
2013-1, 6.35% due 10/15/381,6,7 | 1,091,719 | 1,124,179 |
| Rise Ltd. | | |
2014-1AB, 6.50% due 02/12/39††† | 353,296 | 354,048 |
| AASET | | |
| 2014-1 C, 10.00% due 12/15/29 | 138,934 | 138,935 |
Total Transportation | | 3,442,356 |
| |
Financial – 0.3% | | |
| NCBJ 2015-1 A | | |
5.88% due 07/08/22†††,1,2 | 500,000 | 500,964 |
Total Asset Backed Securities | | |
| (Cost $17,659,968) | | 18,859,907 |
Total Investments – 142.5% | | |
| (Cost $228,505,629) | | $ 226,134,994 |
Other Assets & Liabilities, net – (42.5)% | | (67,472,431) |
Total Net Assets – 100.0% | | $ 158,662,563 |
~ | The face amount is denominated in U.S. Dollars, unless otherwise noted. |
* | Non-income producing security. |
** | Less than 0.1% |
† | Value determined based on Level 1 inputs, unless otherwise noted — See Note 4. |
†† | Value determined based on Level 2 inputs, unless otherwise noted — See Note 4. |
††† | Value determined based on Level 3 inputs — See Note 4. |
1 | All or a portion of these securities have been physically segregated in connection with borrowings, reverse repurchase agreements and unfunded loan commitments. As of May 31, 2017, the total value of securities segregated was $102,798,953. |
2 | Security was fair valued by the Valuation Committee at May 31, 2017. The total market value of fair valued securities amounts to $18,419,037, (cost $21,125,279) or 11.6% of total net assets. |
3 | Variable rate security. Rate indicated is rate effective at May 31, 2017. |
4 | Perpetual maturity. |
5 | Rate indicated is the 7-day yield as of May 31, 2017. |
6 | Security is a 144A or Section 4(a)(2) security. These securities have been determined to be liquid under guidelines established by the Board of Trustees. The total market value of 144A or Section 4(a)(2) liquid securities is $89,317,196 (cost ($85,179,925), or 56.3% of total net assets. |
7 | Payment-in-kind security. |
| 8 | Security is in default of interest and/or principal obligations. |
| 9 | Security is a step up/step down bond. The coupon increases or decreases at regular intervals until the bond reaches full maturity. |
See notes to financial statements.
26 l GGM l GUGGENHEIM CREDIT ALLOCATION FUND ANNUAL REPORT| | |
SCHEDULE OF INVESTMENTS continued | May 31, 2017 |
| 10 | Security has no stated coupon. However, it is expected to receive residual cash flow payments on defined deal dates. |
| 11 | Security is a 144A or Section 4(a)(2) security. These securities are considered illiquid and restricted under guidelines established by the Board of Trustees. The total market value of 144A or Section 4(a)(2) securities is $373,981 (cost $1,066,121), or 0.2% of total net assets — See Note 12. |
| 12 | Investment in an affiliated issuer. See Note 13. |
| | |
| B.V. | Limited Liability Company |
| CLO | Collateralized Loan Obligation |
| EUR | Euro |
| GBP | Great Britain Pound |
| LLC | Limited Liability Company |
| N.V. | Publicly Traded Company |
| plc | Public Limited Company |
| S.A. | Corporation |
See Sector Classification in Supplemental Information section.
The following table summarizes the inputs used to value the Fund’s investments at May 31, 2017 (see Note 4 in the Notes to Financial Statements):
| | | | | | | | | | | | | |
| | | | | | Level 2 | | | Level 3 | | | | |
| | | | | | Significant | | | Significant | | | | |
| | | Level 1 | | | Observable | | | Unobservable | | | | |
Description | | Quoted Prices | | | Inputs | | | Inputs | | | Total | |
Assets: | | | | | | | | | | | | |
| Common Stocks | | $ | 1,664,432 | | | $ | – | | | $ | 1,386,620 | | | $ | 3,051,052 | |
| Preferred Stocks | | | 4,595,924 | | | | – | | | | – | | | | 4,595,924 | |
| Warrants | | | – | | | | 40,079 | | | | | | | | 40,079 | |
| Exchange-Traded Funds | | | 4,447,138 | | | | – | | | | – | | | | 4,447,138 | |
| Short Term Investments | | | 747,391 | | | | – | | | | – | | | | 747,391 | |
| Corporate Bonds | | | – | | | | 120,221,723 | | | | 4,013,632 | | | | 124,235,355 | |
| Senior Floating Rate Interests | | | – | | | | 56,110,120 | | | | 14,048,028 | | | | 70,158,148 | |
| Asset Backed Securities | | | – | | | | 18,004,895 | | | | 855,012 | | | | 18,859,907 | |
| Forward Foreign Currency Exchange Contracts* | | | – | | | | 29,864 | | | | – | | | | 29,864 | |
| Total Assets | | $ | 11,454,885 | | | $ | 194,406,681 | | | $ | 20,303,292 | | | $ | 226,164,858 | |
| | |
Liabilities: | | | | | | | | | | | | | | | | |
| Forward Foreign Currency Exchange Contracts* | | $ | – | | | $ | 198,613 | | | $ | – | | | $ | 198,613 | |
| Unfunded Loan Commitments | | | – | | | | – | | | | 671,334 | | | | 671,334 | |
| Total Liabilities | | $ | – | | | $ | 198,613 | | | $ | 671,334 | | | $ | 869,947 | |
* Represents the unrealized gain/loss at the end of the period.
Please refer to the Schedule of Investments for a breakdown of investment type by industry category.
See notes to financial statements.
GGM l GUGGENHEIM CREDIT ALLOCATION FUND ANNUAL REPORT l 27| | |
SCHEDULE OF INVESTMENTS continued | May 31, 2017 |
The following is a summary of the significant unobservable input used in the fair valuation of assets and liabilities categorized within the Level 3 of the fair value hierarchy:
| | | | | |
| | Ending Balance | Valuation | Unobservable | Input |
Category | at 5/31/2017 | Technique | Inputs | Range |
Assets: | | | | |
| Asset Backed Securities | $ 354,048 | Option adjusted spread | Indicative Quote | – |
| | | off the month end broker | | |
| | | quote over the | | |
| | | 3 month LIBOR | | |
| Asset Backed Securities | 500,964 | Option adjusted spread | Indicative Quote | – |
| | | | for Comparable Security | |
| Corporate Bonds | 684,957 | Option adjusted spread | Indicative Quote | – |
| | | off the month end broker | | |
| | | quote over the | | |
| | | 3 month LIBOR | | |
| Corporate Bonds | 3,328,675 | Model Price | Market Comparable Yields | 5.7% - 10.4% |
| Common Stocks | 1,386,260 | Enterprise Value | Valuation Multiple | 6.3x -13.0x |
| Common Stocks | 360 | Model Price | Liquidation Value | – |
| Senior Floating Rate Interests | 845,250 | Option adjusted spread | Indicative Quote | – |
| | | off the month end broker | | |
| | | quote over the | | |
| | | 3 month LIBOR | | |
| Senior Floating Rate Interests | 5,451,774 | Enterprise Value | Valuation Multiple | 6.7x - 13.0x |
| Senior Floating Rate Interests | 5,662,338 | Model Price | Purchase Price | – |
| Senior Floating Rate Interests | 1,930,199 | Model Price | Market Comparable Yields | 5.3% - 5.7% |
| Senior Floating Rate Interests | 158,467 | Model Price | Liquidation Value | – |
Total Assets | $20,303,292 | | | |
Liabilities: | | | | |
| Unfunded Loan Commitments | $671,334 | Model Price | Purchase Price | – |
Significant changes in indicative quote or valuation multiple would generally result in significant changes in the fair value of the security.
Transfers between investment levels may occur as the markets fluctuate and/or the availability of data used in an investment’s valuation changes. Transfers between valuation levels, if any, are in comparison to the valuation levels at the end of the previous fiscal year, and are effective using the fair value as of the end of the current period.
As of May 31, 2017, the Fund had a security with a total value of $73,228 transfer from Level 2 to Level 3 due to lack of availability of market price information at the year end. The Fund had a security with a total value of $228,522 transfer from Level 3 to Level 2 due to availability of market price information at year end.
See notes to financial statements.
28 l GGM l GUGGENHEIM CREDIT ALLOCATION FUND ANNUAL REPORT| | |
SCHEDULE OF INVESTMENTS continued | May 31, 2017 |
Summary of Fair Value of Level 3 Activity
Following is a reconciliation of Level 3 assets and liabilities for which significant unobservable inputs were used to determine fair value for the year ended May 31, 2017:
| | | | | | | | | | | | | | | | | | | |
| | | | | | Assets | | | | | | | | | Liabilities | |
| | | Senior | | | | | | | | | | | | | | | Unfunded | |
| | | Floating | | | Asset-Backed | | | Corporate | | | Common | | | Total | | | Loan | |
Rate Interests | | | Securities | | | Bonds | | | Stocks | | | Assets | | | Commitments | |
| Beginning Balance | | $ | 11,180,172 | | | $ | 1,351,858 | | | $ | 5,956,415 | | | $ | 1,484,363 | | | $ | 19,972,808 | | | $ | (1,024,204 | ) |
| Purchases/(Receipts) | | | 8,440,258 | | | | – | | | | – | | | | 86,291 | | | | 8,526,549 | | | | (978,408 | ) |
| Corporate Actions | | | – | | | | – | | | | (380,626 | ) | | | 380,626 | | | | – | | | | – | |
| Paydowns Received | | | (1,969,759 | ) | | | (367,022 | ) | | | (1,566,417 | ) | | | – | | | | (3,903,198 | ) | | | – | |
| Payment-in-kind Distributions | | | | | | | | | | | | | | | | | | | | | | | | |
| Received | | | 44,862 | | | | – | | | | 16,290 | | | | – | | | | 61,152 | | | | – | |
| Realized Gain/(Loss) | | | (651,565 | ) | | | – | | | | – | | | | (26 | ) | | | (651,591 | ) | | | 503,838 | |
| Total change in unrealized gains | | | | | | | | | | | | | | | | | | | | | | | | |
| or (losses) included in earnings | | | 874,032 | | | | 9,901 | | | | 29,967 | | | | (564,634 | ) | | | 349,266 | | | | 23,146 | |
| Accrued discounts/(premiums) | | | (23,307 | ) | | | (790 | ) | | | 47,590 | | | | – | | | | 23,493 | | | | – | |
| (Sales)/Fundings | | | (3,919,893 | ) | | | – | | | | – | | | | – | | | | (3,919,893 | ) | | | 804,294 | |
| Transfers into Level 3 | | | 73,228 | | | | – | | | | – | | | | – | | | | 73,228 | | | | – | |
| Transfers out of Level 3 | | | – | | | | (138,935 | ) | | | (89,587 | ) | | | – | | | | (228,522 | ) | | | – | |
| Ending Balance | | $ | 14,048,028 | | | $ | 855,012 | | | $ | 4,013,632 | | | $ | 1,386,620 | | | $ | 20,303,292 | | | $ | (671,334 | ) |
| Net change in unrealized | | | | | | | | | | | | | | | | | | | | | | | | |
| appreciation (depreciation) | | | | | | | | | | | | | | | | | | | | | | | | |
| for investments in securities | | | | | | | | | | | | | | | | | | | | | | | | |
| still held at May 31, 2017 | | $ | 249,964 | | | $ | 7,529 | | | $ | 69,369 | | | $ | (564,634 | ) | | $ | (237,772 | ) | | $ | 254,621 | |
GGM l GUGGENHEIM CREDIT ALLOCATION FUND ANNUAL REPORT l 29| | | | |
STATEMENTS OF ASSETS AND LIABILITIES | | May 31, 2017 | |
| | |
| | |
ASSETS: | | | |
| Investments in unaffiliated issuers, at value (cost $224,770,288) | | $ | 223,394,700 | |
| Investments in affiliated issuers, at value (cost $3,735,341) | | | 2,740,294 | |
| Foreign currency, at value (cost $269,603) | | | 269,603 | |
| Cash | | | 247,100 | |
| Unrealized appreciation on forward foreign currency exchange contracts | | | 29,864 | |
| Receivables: | | | | |
| Interest | | | 2,866,397 | |
| Investments sold | | | 1,756,931 | |
| Fund shares sold | | | 269,847 | |
| Tax reclaims | | | 10,414 | |
| Other assets | | | 4,357 | |
Total assets | | | 231,589,507 | |
LIABILITIES: | | | | |
| Reverse repurchase agreements | | | 61,258,540 | |
| Borrowings | | | 4,500,000 | |
| Unfunded loan commitments, at value (Note 10) (commitment fees | | | | |
| received $1,349,303) | | | 671,334 | |
| Segregated Cash from broker | | | 524,000 | |
| Interest payable on borrowings | | | 77,462 | |
| Unrealized depreciation on forward foreign currency exchange contracts | | | 198,613 | |
| Payable for: | | | | |
| Investments purchased | | | 5,339,493 | |
| Investment advisory fees | | | 193,594 | |
| Offering costs | | | 27,752 | |
| Trustee’s fees and expenses* | | | 6,284 | |
| Accrued expenses and other liabilities | | | 129,872 | |
Total liabilities | | | 72,926,944 | |
NET ASSETS | | $ | 158,662,563 | |
NET ASSETS CONSIST OF: | | | | |
| Common stock, $.01 par value per share; unlimited number of shares authorized, | | | | |
| 7,013,806 shares issued and outstanding | | $ | 70,138 | |
| Additional paid-in capital | | | 166,182,709 | |
| Undistributed net investment income | | | 1,247,091 | |
| Accumulated net realized loss on investments | | | (6,962,393 | ) |
| Net unrealized depreciation on investments | | | (1,874,982 | ) |
NET ASSETS | | $ | 158,662,563 | |
| Net Asset Value | | $ | 22.62 | |
* Relates to Trustees not deemed “interested persons” within the meaning of Section 2(a)(19) of the 1940 Act.
See notes to financial statements.
30 l GGM l GUGGENHEIM CREDIT ALLOCATION FUND ANNUAL REPORT| | | | |
STATEMENTS OF OPERATIONS | | May 31, 2017 | |
| For the Year Ended May 31, 2017 | | | |
| | | | |
INVESTMENT INCOME | | | |
| Interest from securities of unaffiliated issuers | | $ | 16,011,650 | |
| Interest from securities of affiliated issuers | | | 262,974 | |
| Dividends | | | 274,176 | |
| Total investment income | | | 16,548,800 | |
EXPENSES | | | | |
| Investment advisory fees | | | 2,122,221 | |
| Interest expense | | | 945,212 | |
| Professional fees | | | 210,050 | |
| Excise tax expense | | | 122,457 | |
| Trustees’ fees and expenses* | | | 81,270 | |
| Fund accounting fees | | | 73,729 | |
| Administration fees | | | 57,403 | |
| Printing fees | | | 36,756 | |
| Custodian fees | | | 28,994 | |
| Registration and filings | | | 24,725 | |
| Transfer agent fees | | | 20,269 | |
| Insurance | | | 7,975 | |
| Other Expenses | | | 1,900 | |
| Total expenses | | | 3,732,961 | |
| Net investment income | | | 12,815,839 | |
NET REALIZED AND UNREALIZED GAIN (LOSS) | | | | |
| Net realized gain (loss) on: | | | | |
| Investments in unaffiliated issuers | | | (2,622,919 | ) |
| Foreign currency transactions | | | 1,187,610 | |
| Net realized (loss) | | | (1,435,309 | ) |
| Net change in unrealized appreciation (depreciation) on: | | | | |
| Investments in unaffiliated issuers | | | 18,158,128 | |
| Investments in affiliated issuers | | | (672,364 | ) |
| Foreign currency translations | | | (419,665 | ) |
| Net change in unrealized appreciation (depreciation) on: | | | 17,066,099 | |
| Net realized and unrealized gain | | | 15,630,790 | |
Net increase in net assets resulting from operations | | $ | 28,446,629 | |
* Relates to Trustees not deemed “interested persons” within the meaning of Section 2(a)(19) of the 1940 Act.
See notes to financial statements.
GGM l GUGGENHEIM CREDIT ALLOCATION FUND ANNUAL REPORT l 31| | | | | | | |
STATEMENTS OF CHANGES IN NET ASSETS | | | | | May 31, 2017 | |
| | |
| | | Year Ended | | | Year Ended | |
| | | May 31, 2017 | | | May 31, 2016 | |
INCREASE (DECREASE) IN NET ASSETS FROM OPERATIONS: | | | | | | |
| Net investment income | | $ | 12,815,839 | | | $ | 13,366,634 | |
| Net realized (loss) on investments | | | (1,435,309 | ) | | | (3,042,312 | ) |
| Net change in unrealized appreciation (depreciation) on investments | | | 17,066,099 | | | | (14,515,990 | ) |
| Net increase (decrease) in net assets resulting from operations | | | 28,446,629 | | | | (4,191,668 | ) |
DISTRIBUTIONS TO SHAREHOLDERS: | | | | | | | | |
| From net investment income | | | (14,635,933 | ) | | | (14,423,713 | ) |
SHAREHOLDER TRANSACTIONS | | | | | | | | |
| Net proceeds from shares issued through at-the-market offering | | | 8,558,824 | | | | – | |
| Reinvestments | | | 202,920 | | | | 4,542 | |
| Common share offering costs charged to paid-in capital | | | (51,978 | ) | | | – | |
| Net increase from capital share transactions | | | 8,709,766 | | | | 4,542 | |
| Total increase (decrease) in net assets | | | 22,520,462 | | | | (18,610,839 | ) |
NET ASSETS: | | | | | | | | |
| Beginning of year | | | 136,142,101 | | | | 154,752,940 | |
| End of year | | $ | 158,662,563 | | | $ | 136,142,101 | |
| Undistributed net investment income at end of year | | $ | 1,247,091 | | | $ | 2,415,765 | |
See notes to financial statements.
32 l GGM l GUGGENHEIM CREDIT ALLOCATION FUND ANNUAL REPORT| | | | |
STATEMENT OF CASH FLOWS | | May 31, 2017 | |
| For the Year Ended May 31, 2017 | | | |
| | |
Cash Flows from Operating Activities: | | | |
| Net Increase in net assets resulting from operations | | $ | 28,446,629 | |
| | | | | |
Adjustments to Reconcile Net Increase in Net Assets Resulting from Operations to | | | | |
Net Cash Used In Operating and Investing Activities: | | | | |
| Net change in unrealized (appreciation) depreciation on investments | | | (17,485,764 | ) |
| Net change in unrealized (appreciation) depreciation on forward foreign | | | | |
| currency exchange contracts | | | 419,665 | |
| Net realized loss on investments | | | 2,622,919 | |
| Net accretion of discount and amortization of premium | | | (1,001,901 | ) |
| Purchase of long-term investments | | | (143,933,610 | ) |
| Paydowns received on mortgage and asset backed securities | | | 30,817,760 | |
| Proceeds from sales of long-term investments | | | 98,147,377 | |
| Net purchases of short-term investments | | | (500,070 | ) |
| Other payments | | | 253,608 | |
| Commitment fees received and repayments of unfunded commitments | | | 978,408 | |
| Loan commitment fundings | | | (804,294 | ) |
| Increase in segregated cash from broker | | | 274,000 | |
| Decrease in interest receivable | | | 54,376 | |
| Decrease in investments sold receivable | | | 298,689 | |
| Decrease in tax reclaims receivables | | | 11,527 | |
| Decrease in other assets | | | 9,912 | |
| Increase in payable for investments purchased | | | 987,570 | |
| Increase in investment advisory fees payable | | | 30,661 | |
| Increase in interest payable on borrowings | | | 17,750 | |
| Increase in trustees fees and expenses payable | | | 2,847 | |
| Decrease in accrued expenses and other liabilities | | | (12,678 | ) |
| Net Cash Used in Operating and Investing Activities | | | (364,619 | ) |
Cash Flows From Financing Activities: | | | | |
| Net proceeds from the issuance of common shares | | | 8,288,977 | |
| Distributions to common shareholders | | | (14,433,013 | ) |
| Proceeds from reverse repurchase agreements | | | 667,812,408 | |
| Payments made on reverse repurchase agreements | | | (666,221,002 | ) |
| Proceeds from borrowings | | | 9,000,000 | |
| Payments made on borrowings | | | (4,500,000 | ) |
| Offering costs in connection with the issuance of common shares | | | (24,226 | ) |
| Net Cash Used in Financing Activities | | | (76,856 | ) |
| Net decrease in cash | | | (441,475 | ) |
Cash at Beginning of Year (including foreign currency) | | | 958,178 | |
Cash at End of Year (including foreign currency) | | $ | 516,703 | |
Supplemental Disclosure of Cash Flow Information: Cash paid during | | | | |
the year for interest | | $ | 927,462 | |
Supplemental Disclosure of Non Cash Financing Activity: Dividend reinvestment | | $ | 202,920 | |
Supplemental Disclosure of Non Cash Financing Activity: Additional principal | | | | |
received on payment-in-kind bonds | | $ | 71,605 | |
See notes to financial statements.
GGM l GUGGENHEIM CREDIT ALLOCATION FUND ANNUAL REPORT l 33| | | | | | | | | | | | | |
FINANCIAL HIGHLIGHTS | | | | | | | | | | | May 31, 2017 | |
| | |
| | |
| | | For the | | | For the | | | For the | | | | |
| | | year ended | | | year ended | | | year ended | | | Period Ended | |
| | | May 31, 2017 | | | May 31, 2016 | | | May 31, 2015 | | | May 31, 2014(a) | |
Per Share Data: | | | | | | | | | | | | |
| Net asset value, beginning of period | | $ | 20.53 | | | $ | 23.34 | | | $ | 24.71 | | | $ | 23.82 | |
| Income from investment operations: | | | | | | | | | | | | | | | | |
Net investment income(b) | | | 1.91 | | | | 2.02 | | | | 1.95 | | | | 1.64 | |
| Net gain (loss) on investments (realized and unrealized) | | | 2.36 | | | | (2.65 | ) | | | (1.16 | ) | | | 0.71 | |
| Total from investment operations | | | 4.27 | | | | (0.63 | ) | | | 0.79 | | | | 2.35 | |
| Less distributions from: | | | | | | | | | | | | | | | | |
| Net investment income | | | (2.18 | ) | | | (2.18 | ) | | | (1.57 | ) | | | (1.46 | ) |
| Capital gains | | | — | | | | — | | | | (0.59 | ) | | | — | |
| Total distributions to shareholders | | | (2.18 | ) | | | (2.18 | ) | | | (2.16 | ) | | | (1.46 | ) |
| Net asset value, end of period | | $ | 22.62 | | | $ | 20.53 | | | $ | 23.34 | | | $ | 24.71 | |
| Market value, end of period | | $ | 23.18 | | | $ | 19.86 | | | $ | 23.07 | | | $ | 24.68 | |
Total Return(c) | | | | | | | | | | | | | | | | |
| Net asset value | | | 21.55 | % | | | -2.31 | % | | | 3.45 | % | | | 10.12 | % |
| Market value | | | 28.83 | % | | | -4.00 | % | | | 2.54 | % | | | 5.08 | % |
Ratios/Supplemental Data: | | | | | | | | | | | | | | | | |
| Net assets, end of period (in thousands) | | $ | 158,663 | | | $ | 136,142 | | | $ | 154,753 | | | $ | 163,815 | |
| Ratio to average net assets of: | | | | | | | | | | | | | | | | |
Total expenses, including interest expense(d) | | | 2.52 | % | | | 2.27 | % | | | 2.04 | % | | | 1.73 | % |
| Net investment income, including interest expense | | | 8.67 | % | | | 9.68 | % | | | 8.23 | % | | | 7.28 | % |
Portfolio turnover rate(e) | | | 47 | % | | | 63 | % | | | 55 | % | | | 54 | % |
See notes to financial statements.
34 l GGM l GUGGENHEIM CREDIT ALLOCATION FUND ANNUAL REPORT| | | | | | | | | | | | | |
FINANCIAL HIGHLIGHTS continued | | | | | | | | | | | May 31, 2017 | |
| | |
| | |
| | | For the | | | For the | | | For the | | | | |
| | | year ended | | | year ended | | | year ended | | | Period Ended | |
| | | May 31, 2017 | | | May 31, 2016 | | | May 31, 2015 | | | May 31, 2014(a) | |
Per Share Data: | | | | | | | | | | | | |
| Senior Indebtedness: | | | | | | | | | | | | |
| Borrowings–committed facility agreement (in thousands) | | $ | 4,500 | | | | N/A | | | | N/A | | | | N/A | |
Asset coverage per $1,000 of borrowings(g) | | $ | 49,871 | | | | N/A | | | | N/A | | | | N/A | |
Reverse repurchase agreements (in thousands)(h) | | $ | 61,259 | | | $ | 59,667 | | | $ | 65,943 | | | $ | 53,344 | |
| Total borrowings and reverse repurchase agreements outstanding (in thousands) | | $ | 65,759 | | | $ | 59,667 | | | $ | 65,943 | | | $ | 53,344 | |
Asset coverage per $1,000 of total indebtedness(f) | | $ | 3,413 | | | $ | 3,282 | | | $ | 3,360 | | | $ | 4,071 | |
| (a) | Since commencement of operations: June 26, 2013. Percentage amounts for the period, except total return and portfolio turnover rate, have been annualized. |
| (b) | Based on average shares outstanding. |
| (c) | Total return is calculated assuming a purchase of a common share at the beginning of the period and a sale on the last day of the period reported either at net asset value (“NAV”) or market price per share. Dividends and distribution are assumed to be reinvested at NAV for NAV returns or the prices obtained under the Fund’s Dividend Reinvestment Plan for market value returns. Total investment return does not reflect brokerage commissions. A return calculated for a period of less than one year is not annualized. |
| (d) | Excluding interest expense, the annualized operation expense ratio would be 1.88%, 1.82%, 1.76% and 1.55% for the years ended May 31, 2017, May 31, 2016, May 31, 2015 and May 31, 2014, respectively. |
| (e) | Portfolio turnover is not annualized for periods of less than one year. |
| (f) | Calculated by subtracting the Fund’s total liabilities (not including borrowings or reverse repurchase agreements) from the Fund’s total assets and dividing by the total borrowings and reverse repurchase agreements. |
| (g) | Calculated by subtracting the Fund’s total liabilities (not including the borrowings or reverse repurchase agreements) from the Fund’s total assets and dividing by the borrowings. |
| (h) | As a result of the Fund having earmarked or segregated cash or liquid securities to collateralize the transactions or otherwise having covered the transactions, in accordance with releases and interpretive letters issued by the Securities and Exchange Commission (the “SEC”), the Fund doesn’t treat its obligations under such transactions as senior securi- ties representing indebtedness for purposes of the 1940 Act. |
See notes to financial statements.
GGM l GUGGENHEIM CREDIT ALLOCATION FUND ANNUAL REPORT l 35| | |
NOTES TO FINANCIAL STATEMENTS | May 31, 2017 |
Note 1 – Organization:
Guggenheim Credit Allocation Fund (the “Fund”) was organized as a Delaware statutory trust on June 7, 2012, and commenced investment operations on June 26, 2013. The Fund is registered as a diversified, closed-end management investment company under the Investment Company Act of 1940, as amended (the “1940 Act”).
The Fund’s investment objective is to seek total return through a combination of current income and capital appreciation.
Note 2 – Accounting Policies:
The Fund operates as an investment company and accordingly follows the investment company accounting and reporting guidance of the Financial Accounting Standards Board (“FASB”) Accounting Standards Codification Topic 946 Financial Services – Investment Companies.
The following significant accounting policies are in conformity with U.S. generally accepted accounting principles (“GAAP”) and are consistently followed by the Fund. This requires management to make estimates and assumptions that affect the reported amount of assets and liabilities and disclosure of contingent assets and liabilities at the date of the financial statements and the reported amounts of revenues and expenses during the reporting period. Actual results could differ from these estimates. All time references are based on Eastern Time.
(a) Valuation of Investments
The Board of Trustees of the Fund (the “Board”) has adopted policies and procedures for the valuation of the Fund’s investments (the “Valuation Procedures”). Pursuant to the Valuation Procedures, the Board has delegated to a valuation committee, consisting of representatives from Guggenheim’s investment management, fund administration, legal and compliance departments (the “Valuation Committee”), the day-to-day responsibility for implementing the Valuation Procedures, including, under most circumstances, the responsibility for determining the fair value of the Fund’s securities or other assets.
Valuations of the Fund’s securities are supplied primarily by pricing services appointed pursuant to the processes set forth in the Valuation Procedures. The Valuation Committee convenes monthly, or more frequently as needed and will review the valuation of all assets which have been fair valued for reasonableness. The Fund’s officers, through the Valuation Committee and consistent with the monitoring and review responsibilities set forth in the Valuation Procedures, regularly review procedures used by, and valuations provided by, the pricing services.
If the pricing service cannot or does not provide a valuation for a particular investment or such valuation is deemed unreliable, such investment is fair valued by the Valuation Committee.
Equity securities listed on an exchange (New York Stock Exchange (“NYSE”) or American Stock Exchange) are valued at the last quoted sale price as of the close of business on the NYSE, usually 4:00 p.m. on the valuation date. Equity securities listed on the NASDAQ market system are valued at the NASDAQ Official Closing Price on the valuation date, which may not necessarily represent the last sale price. If there has been no sale on such exchange or NASDAQ on such day, the security is valued at the mean of the most recent bid and asked prices on such day.
36 l GGM l GUGGENHEIM CREDIT ALLOCATION FUND ANNUAL REPORT| | |
NOTES TO FINANCIAL STATEMENTS continued | May 31, 2017 |
Open-end investment companies (“Mutual Funds”) are valued at their NAV as of the close of business on the valuation date. Exchange Traded Funds (“ETFs”) and closed-end investment companies are valued at the last quoted sale price.
Debt securities with a maturity of greater than 60 days at acquisition are valued at prices that reflect broker/dealer supplied valuations or are obtained from independent pricing services, which may consider the trade activity, treasury spreads, yields or price of bonds of comparable quality, coupon, maturity, and type, as well as prices quoted by dealers who make markets in such securities. Short-term debt securities with a maturity of 60 days or less at acquisition and repurchase agreements are valued at amortized cost, provided such amount approximates market value.
Typically loans are valued using information provided by an independent third party pricing service which uses broker quotes in a non-active market.
Generally, trading in foreign securities markets is substantially completed each day at various times prior to the close of the NYSE. The values of foreign securities are determined as of the close of such foreign markets or the close of the NYSE, if earlier. All investments quoted in foreign currency are valued in U.S. dollars on the basis of the foreign currency exchange rates prevailing at the close of U.S. business at 4:00 p.m. Investments in foreign securities may involve risks not present in domestic investments. The Valuation Committee will determine the current value of such foreign securities by taking into consideration certain factors which may include those discussed above, as well as the following factors, among others: the value of the securities traded on other foreign markets, ADR trading, closed-end fund trading, foreign currency exchange activity, and the trading prices of financial products that are tied to foreign securities such as World Equity Benchmark Securities. In addition, under the Valuation Procedures, the Valuation Committee and the Guggenheim Funds Investment Advisors, LLC (“GFIA or the “Adviser”) are authorized to use prices and other information supplied by a third party pricing vendor in valuing foreign securities.
Investments for which market quotations are not readily available are fair valued as determined in good faith by the Adviser, subject to review by the Valuation Committee, pursuant to methods established or ratified by the Board. Valuations in accordance with these methods are intended to reflect each security’s (or asset’s) “fair value.” Each such determination is based on a consideration of all relevant factors, which are likely to vary from one pricing context to another. Examples of such factors may include, but are not limited to: market prices; sale prices; broker quotes; and models which derive prices based on inputs such as prices of securities with comparable maturities and characteristics, or based on inputs such as anticipated cash flows or collateral, spread over Treasuries, and other information analysis.
(b) Investment Transactions and Investment Income
Investment transactions are accounted for on the trade date. Realized gains and losses on investments are determined on the identified cost basis. Paydown gains and losses on mortgage and asset-backed securities are treated as an adjustment to interest income. Dividend income is recorded net of applicable withholding taxes on the ex-dividend date and interest income is recorded on an accrual basis. Discounts or premiums on debt securities purchased are accreted or amortized to interest income over the lives of the respective securities using the effective interest method.
GGM l GUGGENHEIM CREDIT ALLOCATION FUND ANNUAL REPORT l 37| | |
NOTES TO FINANCIAL STATEMENTS continued | May 31, 2017 |
(c) Currency Translation
Assets and liabilities denominated in foreign currencies are translated into U.S. dollars at the mean of the bid and asked price of respective exchange rates on the last day of the period. Purchases and sales of investments denominated in foreign currencies are translated at the exchange rate on the bid and asked price of respective exchange rates on the date of the transaction.
The Fund does not isolate that portion of the results of operations resulting from changes in foreign exchange rates on investments from the fluctuations arising from changes in market prices of securities held. Such fluctuations are included with the net realized and unrealized gain or loss from investments.
Foreign exchange realized gain or loss resulting from holding of a foreign currency, expiration of a currency exchange contract, difference in exchange rates between the trade date and settlement date of an investment purchased or sold, and the difference between dividends or interest actually received compared to the amount shown in the Fund’s accounting records on the date of receipt is shown as net realized gains or losses on foreign currency transactions on the Fund’s Statement of Operations.
Foreign exchange unrealized gain or loss on assets and liabilities, other than investments, is shown as unrealized appreciation (depreciation) on foreign currency translation on the Fund’s Statement of Operations.
(d) Forward Exchange Currency Contracts
Forward foreign currency exchange contracts are agreements between two parties to buy and sell currencies at a set price on a future date. Fluctuations in the value of open forward foreign currency exchange contracts are recorded for financial reporting purposes as unrealized appreciation and depreciation by the Fund until the contracts are closed. When the contracts are closed, realized gains and losses are recorded, and included on the Statement of Operations in foreign currency transactions.
(e) Distributions to Shareholders
The Fund declares and pays monthly distributions to common shareholders. These distributions consist of investment company taxable income, which generally includes qualified dividend income, ordinary income and short-term capital gains. Any net realized long-term capital gains are distributed annually to common shareholders. To the extent distributions exceed taxable income, the excess will be deemed a return of capital.
Distributions to shareholders are recorded on the ex-dividend date. The amount and timing of distributions are determined in accordance with federal income tax regulations, which may differ from GAAP.
(f) Indemnifications
Under the Fund’s organizational documents, its Trustees and Officers are indemnified against certain liabilities arising out of the performance of their duties to the Fund. In addition, throughout the normal course of business, the Fund enters into contracts that contain a variety of representations and warranties which provide general indemnifications. The Fund’s maximum exposure under these arrangements is unknown, as this would involve future claims that may be
38 l GGM l GUGGENHEIM CREDIT ALLOCATION FUND ANNUAL REPORT| | |
NOTES TO FINANCIAL STATEMENTS continued | May 31, 2017 |
made against the Fund and/or its affiliates that have not yet occurred. However, based on experience, the Fund expects the risk of loss to be remote.
Note 3 – Investment Advisory Agreement, Sub-Advisory Agreement and Other Agreements:
Pursuant to an Investment Advisory Agreement (the “Agreement”) between the Fund and Guggenheim Funds Investment Advisors, LLC, the Adviser furnishes offices, necessary facilities and equipment, provides administrative services, oversees the activities of Guggenheim Partners Investment Management, LLC (“GPIM” or the “Sub-Adviser”), provides personnel including certain officers required for the Fund’s administrative management and compensates the officers or trustees of the Fund who are affiliates of the Adviser. As compensation for these services, the Fund pays the Adviser a fee, payable monthly, in an amount equal to 1.00% of the Fund’s average daily managed assets.
Pursuant to a Sub-Advisory Agreement (the “Sub-Advisory Agreement”) among the Fund, the Adviser and the Sub-Adviser, GPIM, under the supervision of the Fund’s Board of Trustees and the Adviser, provides a continuous investment program for the Fund’s portfolio; provides investment research, makes and executes recommendations for the purchase and sale of securities; and provides certain facilities and personnel, including certain officers required for its administrative management and pays the compensation of all officers and trustees of the Fund who are GPIM’s affiliates. As compensation for its services, the Adviser pays GPIM a fee, payable monthly, in an annual amount equal to 0.50% of the Fund’s average daily managed assets.
For purposes of calculating the fees payable under the foregoing agreements, “average daily managed assets” means the average daily value of the Fund’s total assets minus the sum of its accrued liabilities. “Total assets” means all of the Fund’s assets and is not limited to its investment securities. “Accrued liabilities” means all of the Fund’s liabilities other than borrowings for investment purposes.
Certain officers and trustees of the Fund may also be officers, directors and/or employees of the Adviser or GPIM. The Fund does not compensate its officers or trustees who are officers, directors and/or employees of the aforementioned firms.
Rydex Fund Services, LLC (“RFS”), provided fund administration services to the Fund. On October 4, 2016, RFS was purchased by MUFG Investor Services and as of that date RFS ceased to be an affiliate of the Investment Adviser. In connection with its acquisition, RFS changed its name to MUFG Investor Services (US), LLC (“MUIS”). This change has no impact on the financial statements of the Fund.
MUIS acts as the Fund’s administrator and accounting agent. As administrator and accounting agent, MUIS is responsible for maintaining the books and records of the Fund’s securities and cash. The Bank of New York (“BNY”) acts as the Fund’s custodian. As custodian, BNY is responsible for the custody of the Fund’s assets. For providing the aforementioned services, MUIS and BNY are entitled to receive a monthly fee equal to an annual percentage of the Fund’s average daily managed assets subject to certain minimum monthly fees and out of pocket expenses.
Note 4 – Fair Value Measurement:
In accordance with GAAP, fair value is defined as the price that the Fund would receive to sell an investment or pay to transfer a liability in an orderly transaction with an independent buyer in the
GGM l GUGGENHEIM CREDIT ALLOCATION FUND ANNUAL REPORT l 39| | |
NOTES TO FINANCIAL STATEMENTS continued | May 31, 2017 |
principal market, or in the absence of a principal market, the most advantageous market for the investment or liability. GAAP establishes a three-tier fair value hierarchy based on the types of inputs used to value assets and liabilities and requires corresponding disclosure. The hierarchy and the corresponding inputs are summarized below:
Level 1 — quoted prices in active markets for identical assets or liabilities.
Level 2 — significant other observable inputs (for example quoted prices for securities that are similar based on characteristics such as interest rates, prepayment speeds, credit risk, etc.).
Level 3 — significant unobservable inputs based on the best information available under the circumstances, to the extent observable inputs are not available, which may include assumptions.
The types of inputs available depend on a variety of factors, such as the type of security and the characteristics of the markets in which it trades, if any. Fair valuation determinations that rely on fewer or no observable inputs require greater judgment. Accordingly, fair value determinations for Level 3 securities require the greatest amount of judgment.
Independent pricing services are used to value a majority of the Fund’s investments. When values are not available from a pricing service, they will be determined under the valuation policies that have been reviewed and approved by the Board. In any event, values are determined using a variety of sources and techniques, including: market prices; broker quotes; and models which derive prices based on inputs such as prices of securities with comparable maturities and characteristics or based on inputs such as anticipated cash flows or collateral, spread over Treasuries, and other information and analysis. A significant portion of the Funds’ assets and liabilities are categorized as Level 2 or Level 3, as indicated in this report.
Indicative quotes from broker-dealers, adjusted for fluctuations in criteria such as credit spreads and interest rates, may be also used to value the Fund’s assets and liabilities, i.e. prices provided by a broker-dealer or other market participant who has not committed to trade at that price. Although indicative quotes are typically received from established market participants, the Fund may not have the transparency to view the underlying inputs which support the market quotations.
Certain fixed income securities are valued by obtaining a monthly indicative quote from a broker dealer, adjusted for fluctuations in criteria such as credit spreads and interest rates.
The inputs or methodologies used for valuing securities are not necessarily an indication of the risk associated with investing in those securities. The suitability of the techniques and sources employed to determine fair valuation are regularly monitored and subject to change.
Note 5 – Federal Income Taxes:
The Fund intends to continue to comply with the requirements of Subchapter M of the Internal Revenue Code of 1986, as amended (the “Internal Revenue Code”), applicable to regulated investment companies.
The Fund may be subject to an excise tax of 4% of the amount by which 98% of the Fund’s annual taxable income and 98.2% of net realized gains exceed the distributions from such taxable income and realized gains for the calendar year. The Fund paid excise tax of $122,457 or $0.02 per share, attributable to calendar year 2016.
40 l GGM l GUGGENHEIM CREDIT ALLOCATION FUND ANNUAL REPORT| | |
NOTES TO FINANCIAL STATEMENTS continued | May 31, 2017 |
Due to inherent differences in the recognition of income, expenses, and realized gains/losses under GAAP and federal income tax purposes, permanent differences between book and tax basis reporting have been identified and appropriately reclassified on the Statement of Assets and Liabilities. At May 31, 2017, the following reclassification was made to the capital accounts of the Fund to reflect permanent book and tax differences relating to foreign currency reclasses, bond bifurcation, paydown losses, equity to debt adjustments and excise tax paid. Net investment income, net realized gains and net assets were not affected by these changes.
| | | |
Undistributed | Accumulated | Additional |
Net Investment | Net Realized | Paid-In |
Income | Gain (Loss) | Capital |
| $ 651,420 | $ (528,963) | $ (122,457) |
As of May 31, 2017 the cost of investments and accumulated unrealized appreciation (depreciation) on investments for federal income tax purposes were as follows:
| | | | |
Cost of | | | Net Tax |
Investments | Gross Tax | Gross Tax | Unrealized |
for Tax | Unrealized | Unrealized | Depreciation on |
Purposes | Appreciation | Depreciation | Investments |
| $ 228,984,457 | $ 8,861,681 | $ (11,711,144) | $ (2,849,463) |
The differences between book basis and tax basis unrealized appreciation (depreciation) is primarily attributable to the tax deferral of losses on wash sales, adjustments for collateralized loan obligations and the marking to market of 1256 contracts.
As of May 31, 2017, the components of accumulated earnings/(losses) (excluding paid-in capital) on a tax basis were as follows:
| | | |
| Accumulated | |
| | Long-Term Gains/ | Net Unrealized |
Undistributed | (Accumulated | Appreciation/ |
Ordinary Income | Capital Losses) | (Depreciation) |
| $ 1,429,158 | $ (6,834,381) | $ (2,185,061) |
For the year ended May 31, 2017, the tax character of distributions paid to shareholders as reflected in the Statements of Changes in Net Assets was as follows:
| | | |
Distributions paid from | 2017 | 2016 |
| Ordinary Income | $ 14,635,933 | $ 14,423,713 |
Note: For federal income tax purposes, short-term capital gain distributions are treated as ordinary income distributions.
For Federal income tax purposes, capital loss carryforwards represent realized losses of the Fund that may be carried forward and applied against future capital gains. Under the RIC Modernization Act of 2010, the Fund is permitted to carry forward capital losses incurred in taxable years beginning after December 22, 2010 for an unlimited period and such capital loss carryforwards will retain their character as either short-term or long-term capital losses. As of May 31, 2017, the Fund had a long-term capital loss carryforwards of $6,834,381.
GGM l GUGGENHEIM CREDIT ALLOCATION FUND ANNUAL REPORT l 41| | |
NOTES TO FINANCIAL STATEMENTS continued | May 31, 2017 |
For all open tax years and all major jurisdictions, management of the Fund has concluded that there are no significant uncertain tax positions that would require recognition in the financial statements. Uncertain tax positions are tax positions taken or expected to be taken in the course of preparing the Fund’s tax returns that would not meet a more-likely-than not threshold of being sustained by the applicable tax authority and would be recorded as a tax expense in the current year. Open tax years are those that are open for examination by taxing authorities (i.e. generally the last four tax year ends and the interim tax period since then).
Note 6 – Investments in Securities:
During the year ended May 31, 2017, the cost of purchases and proceeds from sales of investments, excluding short-term investments were $143,933,610 and $98,147,377, respectively.
The Fund is permitted to purchase or sell securities from or to certain affiliated funds under specified conditions outlined in procedures adopted by the Board. The procedures have been designed to ensure that any purchase or sale of securities by a Fund from or to another fund or portfolio that is or could be considered an affiliate by virtue of having a common investment adviser (or affiliated investment advisers), common Trustees and/or common officers complies with Rule 17a-7 of the 1940 Act. Further, as defined under these procedures, each transaction is effected at the current market price to save costs, where permissible. For the year ended May 31, 2017, the Fund engaged in purchases and sales of securities, pursuant to Rule 17a-7 of the 1940 Act, as follows:
| | | |
| | | Realized |
Purchases | Sales | Gain (Loss) |
| $ 1,244,063 | $ 12,172,219 | $ 355,913 |
Note 7 – Derivatives:
Derivatives are instruments whose values depend on, or are derived from, in whole or in part, the value of one or more other assets, such as securities, currencies, commodities or indices. Derivative instruments may be used to increase investment flexibility (including to maintain cash reserves while maintaining exposure to certain other assets), for risk management (hedging) purposes, to facilitate trading, to reduce transaction costs and to pursue higher investment returns. Derivative instruments may also be used to mitigate certain investment risks, such as foreign currency exchange rate risk, interest rate risk and credit risk. GAAP requires disclosures to enable investors to better understand how and why a Fund uses derivative instruments, how these derivative instruments are accounted for and their effects on the Fund’s financial position and results of operations.
The Fund may utilize derivatives for the following purposes:
Hedge – an investment made in order to reduce the risk of adverse price movements in a security, by taking an offsetting position to protect against broad market moves.
(a) Forward Foreign Currency Exchange Contracts
The Fund enters into forward foreign currency exchange contracts in order to hedge its exposure to changes in foreign currency exchange rates on its foreign portfolio holdings, to hedge certain firm purchases and sales commitments denominated in foreign currencies and for investment purposes.
42 l GGM l GUGGENHEIM CREDIT ALLOCATION FUND ANNUAL REPORT| | |
NOTES TO FINANCIAL STATEMENTS continued | May 31, 2017 |
A forward foreign currency exchange contract is a commitment to purchase or sell a foreign currency on a future date at a negotiated forward rate. Risk may arise from the potential inability of a counterparty to meet the terms of a contract and from unanticipated movements in the value of a foreign currency relative to the U.S. dollar. The face or contract amount, in U.S. dollars, reflects the total exposure the Fund has in that particular currency contract.
As of May 31, 2017, the following forward foreign currency exchange contracts were outstanding:
| | | | | | | | |
| | | | | | | | Net Unrealized |
| | | | | Settlement | Settlement | Value as of | Appreciation |
Contracts to Sell | | Counterparty | Date | Value | 5/31/17 | (Depreciation) |
| CAD | 1,211,000 | | | | | | |
| for USD | 884,034 | | Morgan Stanley | 6/12/2017 | 884,034 | 896,830 | $ (12,796) |
| EUR | 6,192,000 | | | | | | |
| for USD | 6,775,014 | | Bank of America | 6/12/2017 | 6,775,014 | 6,960,156 | $ (185,142) |
| EUR | 130,000 | | | | | | |
| for USD | 145,452 | | Bank of America | 6/12/2017 | 145,452 | 146,127 | $ (675) |
| GBP | 4,778,000 | | | | | | |
| for USD | 6,187,950 | | JP Morgan | 6/12/2017 | 6,187,950 | 6,158,086 | $ 29,864 |
| Total unrealized depreciation for forward foreign currency exchange contracts | | $ (168,749) |
(b) Summary of Derivatives Information
The following table presents the types of derivatives in the Fund by location as presented on the Statement of Assets and Liabilities as of May 31, 2017.
| | | | | | |
| Statement of Asset and Liabilities |
| Presentation of Fair Values of Derivative Instruments ($000s): |
| |
| | Asset Derivatives | | | Liability Derivatives | |
| | Statement of Assets and | | | Statement of Assets and | |
Primary Risk Exposure | Liabilities Location | Fair Value | | Liabilities Location | Fair Value |
| | Unrealized appreciation on | | | Unrealized depreciation on | |
| | forward foreign currency | | | forward foreign currency | |
| Foreign exchange risk | exchange contracts | $30 | | exchange contracts | $199 |
The following table presents the effect of derivatives instruments on the Statement of Operations for the year ended May 31, 2017.
| | |
| | Effect of Derivative Instruments on the Statement of Operations: |
| | Amount of Realized Gain (Loss) on Derivatives (value in $000s) |
Primary Risk Exposure | Foreign Currency Transactions |
| Foreign exchange risk | $1,188 |
| | Change in Unrealized Depreciation on Derivatives (value in $000s) |
Primary Risk Exposure | Foreign Currency Translations |
| Foreign exchange risk | $(406)* |
| * | The Statement of Operations includes change in unrealized appreciation (depreciation) on foreign currency and payables or receivables in foreign currency. |
GGM l GUGGENHEIM CREDIT ALLOCATION FUND ANNUAL REPORT l 43| | |
NOTES TO FINANCIAL STATEMENTS continued | May 31, 2017 |
Derivative Volume
Forward Foreign Currency Exchange Contracts:
The Fund had the following activity in forward foreign currency exchange contracts during the year ended May 31, 2017:
| | |
| Quarterly Average Settlement Value Purchased | $ 570,009 |
| Quarterly Average Settlement Value Sold | 14,676,637 |
Note 8 – Offsetting:
In the normal course of business, the Fund enters into transactions subject to enforceable master netting arrangements or other similar arrangements. Generally, the right to offset in those agreements allows the Fund to counteract the exposure to a specific counterparty with collateral received or delivered to that counterparty based on the terms of the arrangements. These arrangements provide for the right to liquidate upon the occurrence of an event of default, credit event upon merger or additional termination event.
In order to better define their contractual rights and to secure rights that will help the Fund mitigate their counterparty risk, the Fund may enter into an International Swaps and Derivatives Association, Inc. Master Agreement (“ISDA Master Agreement”) or similar agreement with their derivative contract counterparties. An ISDA Master Agreement is a bilateral agreement between a Fund and a counterparty that governs OTC derivatives, including foreign exchange contracts, and typically contains, among other things, collateral posting terms and netting provisions in the event of a default and/or termination event. The provisions of the ISDA Master Agreement typically permit a single net payment in the event of a default (close-out netting) or similar event, including the bankruptcy or insolvency of the counterparty.
For derivatives traded under an ISDA Master Agreement, the collateral requirements are typically calculated by netting the mark to market amount for each transaction under such agreement and comparing that amount to the value of any collateral currently pledged by the Fund and the counterparty. For financial reporting purposes, cash collateral that has been pledged to cover obligations of the Fund and cash collateral received from the counterparty, if any, is reported separately on the Statement of Assets and Liabilities as segregated cash with broker/ receivable for variation margin, or payable for swap settlement/variation margin. Generally, the amount of collateral due from or to a counter party must exceed a minimum transfer amount threshold (e.g., $300,000) before a transfer is required to be made. To the extent amounts due to the Fund from their counterparties are not fully collateralized, contractually or otherwise, the Fund bears the risk of loss from counterparty nonperformance. The Fund attempts to mitigate counterparty risk by only entering into agreements with counterparties that it believes to be of good standing and by monitoring the financial stability of those counterparties.
For financial reporting purposes, the Fund does not offset derivative assets and derivative liabilities that are subject to netting arrangements in the Statement of Assets and Liabilities.
44 l GGM l GUGGENHEIM CREDIT ALLOCATION FUND ANNUAL REPORT| | |
NOTES TO FINANCIAL STATEMENTS continued | May 31, 2017 |
The following tables present derivative financial instruments and secured financing transactions that are subject to enforceable netting arrangements and offset in the Statement of Assets and Liabilities in conformity with GAAP.
| | | | | | | |
| | | Gross | Net Amounts | | | |
| | | Amounts | of Assets | | Gross Amounts Not | |
| | Gross | Offset in the | Presented in the | | Offset in the Statement | |
| | Amounts | Statement of | Statement of | | of Assets & Liabilities | |
| | of Recognized | Assets and | Assets and | | Financial | Net |
Description | Assets | Liabilities | Liabilities | | Instruments | Amount |
| |
| Forward Foreign | | | | | | |
| Currency Exchange | | | | | | |
| Contracts | $29,864 | $ – | $29,864 | | $ – | $29,864 |
| |
| |
| | | Gross | Net Amounts | | | |
| | | Amounts | of Liabilities | | Gross Amounts Not | |
| | Gross | Offset in the | Presented in the | | Offset in the Statement | |
| | Amounts | Statement of | Statement of | | of Assets & Liabilities | |
| | of Recognized | Assets and | Assets and | | Financial | Net |
Description | Liabilities | Liabilities | Liabilities | | Instruments | Amount |
| |
| Reverse Repurchase | | | | | | |
| Agreements | $61,258,540 | $ – | $61,258,540 | | $61,258,540 | $ – |
| Forward Foreign | | | | | | |
| Currency Exchange | | | | | | |
| Contracts | 198,613 | – | 198,613 | | – | 198,613 |
Note 9 – Leverage:
Reverse Repurchase Agreements
The Fund may enter into reverse repurchase agreements as part of its financial leverage strategy. Under a reverse repurchase agreement, the Fund temporarily transfers possession of a portfolio instrument to another party, such as a bank or broker-dealer, in return for cash. At the same time, the Fund agrees to repurchase the instrument at an agreed upon time and price, which reflects an interest payment. Such agreements have the economic effect of borrowings. The Fund may enter into such agreements when it is able to invest the cash acquired at a rate higher than the cost of the agreement, which would increase earned income. When the Fund enters into a reverse repurchase agreement, any fluctuations in the market value of either the instruments transferred to another party or the instruments in which the proceeds may be invested would affect the market value of the Fund’s assets. As a result, such transactions may increase fluctuations in the market value of the Fund’s assets. For the year ended May 31, 2017, the average daily balance for which reverse repurchase agreements were outstanding amounted to $61,394,190. The weighted average interest rate was 1.41%. As of May 31, 2017, there was $61,258,540 in reverse repurchase agreements outstanding.
GGM l GUGGENHEIM CREDIT ALLOCATION FUND ANNUAL REPORT l 45| | |
NOTES TO FINANCIAL STATEMENTS continued | May 31, 2017 |
The following is a summary of the remaining contractual maturities of the reverse repurchase agreements outstanding as of May 31, 2017, aggregated by asset class of the related collateral pledged by the Fund:
| | | | | | |
| | Overnight and | | | Greater than | |
| | Continuous | Up to 30 days | 31 – 90 days | 90 days | Total |
| |
| Preferred Stocks | $ – | $ 1,006,000 | $ – | $ – | $ 1,006,000 |
| Corporate Bonds | 2,325,500 | 47,329,375 | – | 10,597,665 | 60,252,540 |
| Gross amount of | | | | | |
| recognized | | | | | |
| liabilities for | | | | | |
| reverse repurchase | | | | | |
| agreements | $ 2,325,500 | $ 48,335,375 | $ – | $ 10,597,665 | $ 61,258,540 |
As of May 31, 2017, the Fund had outstanding reverse repurchase agreements with various counterparties. Details of the reverse repurchase agreements by counterparty are as follows:
| | | | |
Counterparty | Interest Rates | Maturity Dates | Face Value |
| Citigroup | (0.25%) – 0.75% | Open Maturity | $ 2,325,500 |
| Credit Suisse First Boston | 1.80% – 2.00% | 06/16/2017 – 06/21/2017 | 4,032,938 |
| JPMorgan Chase Bank | 2.04% | 06/02/2017 | 2,662,000 |
| Nomura Securities | 1.39% – 1.59% | 06/12/2017 | 20,486,000 |
| BNP Paribas Bank | 1.54% – 1.89% | 06/06/2017 – 06/26/2017 | 14,057,000 |
| Royal Bank of Canada | 1.64% – 1.95% | 06/07/2017 – 06/22/2017 | 6,402,188 |
| Societe Generale | 2.25% | 06/07/2017 – 04/12/2018 | 11,292,914 |
| | | | $61,258,540 |
Borrowings
On September 16, 2016, the Fund entered into a $10,000,000 credit facility agreement with an approved lender whereby the lender has agreed to provide secured financing to the Fund and the Fund will provide pledged collateral to the lender. Interest on the amount borrowed is based on the 1 month LIBOR plus 1%. An unused fee of 10 basis points was charged on the difference between 60% of the amount available to borrow under the credit agreement and the actual amount borrowed. As of May 31, 2017 there was $4,500,000 outstanding in connection with the Fund’s credit facility. The average daily amount of borrowings on the credit facility during the year ended May 31, 2017, was $5,329,457 with a related average interest rate of 1.27%. The maximum amount outstanding during the year ended May 31, 2017 was $7,000,000. As of May 31, 2017 the total value of securities segregated and pledged as collateral in connection with borrowings was $9,461,092.
The credit facility agreement governing the loan facility includes usual and customary covenants. These covenants impose on the Fund asset coverage requirements, collateral requirements, investment strategy requirements, and certain financial obligations. These covenants place limits or restrictions on the Fund’s ability to (i) enter into additional indebtedness with a party other than the counterparty, (ii) change its fundamental investment policy, or (iii) pledge to any other party, other than to the counterparty, securities owned or held by the Fund over which the counterparty has a lien. In addition, the Fund is required to deliver financial information to the counterparty within established deadlines, maintain an asset coverage ratio (as defined in Section 18(g) of the 1940 Act) greater than 300%, comply with the rules of the stock exchange on which its shares are listed, and
46 l GGM l GUGGENHEIM CREDIT ALLOCATION FUND ANNUAL REPORT| | |
NOTES TO FINANCIAL STATEMENTS continued | May 31, 2017 |
maintain its classification as a “closed-end management investment company” as defined in the 1940 Act.
There is no guarantee that the Fund’s leverage strategy will be successful. The Fund’s use of leverage may cause the Fund’s NAV and market price of common shares to be more volatile and can magnify the effect of any losses.
Note 10 – Loan Commitments:
Pursuant to the terms of certain Term Loan agreements, the Fund held unfunded loan commitments as of May 31, 2017. The Fund is obligated to fund these loan commitments at the borrower’s discretion. The Fund reserves against such contingent obligations by designating cash, liquid securities, and liquid term loans as a reserve. As of May 31, 2017, the total amount segregated in connection with reverse repurchase agreements and unfunded commitments was $93,337,861.
As of May 31, 2017, the Fund had the following unfunded loan commitments which could be extended at the option of the borrower:
| | | | |
Borrower | Maturity Date | Face Amount | Value |
| Acosta, Inc. | 09/26/2019 | $ 1,422,222 | $ 87,885 |
| Advantage Sales and Marketing | 07/21/2019 | 900,000 | 49,770 |
| American Seafood | 08/04/2021 | 427,500 | 44,642 |
| American Stock Transfer | 06/11/2018 | 400,000 | 11,173 |
| Aspect Software | 05/25/2018 | 165,000 | – |
| BBB Industries, LLC | 10/17/2019 | 1,100,000 | 73,733 |
| Cypress INT III | 04/27/2022 | 450,000 | 54,889 |
| Ceva Group PLC | 03/19/2019 | 162,117 | 11,894 |
| Eyemart Express | 12/16/2019 | 1,000,000 | 61,815 |
| Hillman Group, Inc. | 06/13/2019 | 900,000 | 40,662 |
| IntraWest Holdings, S.A.R | 12/10/2018 | 1,100,000 | 13,409 |
| Learning Care Group | 05/05/2021 | 500,000 | 34,289 |
| National Technical | 06/11/2021 | 160,588 | 1,150 |
| Petsmart | 01/24/2018 | 3,850,000 | – |
| PowerSchool, Inc. | 07/29/2021 | 750,003 | 73,820 |
| ProMach Group, Inc. | 10/22/2019 | 433,333 | 24,985 |
| Signode Industrial Group | 05/01/2019 | 1,400,000 | 66,894 |
| Surgery Center | 11/16/2017 | 1,750,000 | – |
| URSA Insulation B.V. | 04/26/2021 | 60,096 | – |
| Wencor Group | 06/19/2019 | 423,077 | 20,324 |
| | | $17,353,936 | $671,334 |
Note 11 – Capital:
In connection with its organization process, the Fund sold 4,189 shares of beneficial interest to Guggenheim Funds Distributors, LLC, an affiliate of the Adviser, for consideration of $100,012 at a price of $23.88 per share. The Fund issued 6,000,000 shares of common stock in its initial public offering. These shares were issued at $23.88 per share after deducting the sales load but before underwriters’ expense reimbursement.
GGM l GUGGENHEIM CREDIT ALLOCATION FUND ANNUAL REPORT l 47| | |
NOTES TO FINANCIAL STATEMENTS continued | May 31, 2017 |
In connection with the initial public offering of the Fund’s common shares, the underwriters were granted an option to purchase additional common shares. The underwriters purchased, at a price of $23.88 per common share (after deducting the sales load but before offering expenses incurred by the Fund), 625,000 common shares of the Fund and 125,000 common shares on July 19, 2013 and August 13, 2013, respectively, pursuant to the over-allotment option.
Offering costs, estimated at $331,250 or $0.05 per share, in connection with the issuance of common shares have been borne by the Fund and were charged to paid-in capital. The Adviser and GPIM have agreed to pay offering expenses (other than sales load, but including reimbursement of expenses to the underwriters) in excess of $0.05 per common share.
Common Shares
The Fund has an unlimited amount of common shares, $0.01 par value, authorized and 7,013,806 issued and outstanding.
| | | |
| Transactions in common shares were as follows: | | |
| | Year Ended | Year Ended |
| | May 31, 2017 | May 31, 2016 |
| Beginning Shares | 6,629,959 | 6,629,724 |
| Common shares issued through at-the-market offering | 374,788 | – |
| Common shares issued through dividend reinvestment | 9,059 | 235 |
| Ending Shares | 7,013,806 | 6,629,959 |
On September 7, 2016, the Fund’s shelf registration allowing for delayed or continuous offering of additional shares became effective. The shelf registration statement allowed for the issuance of up to $100,000,000 of common shares. The Fund entered into an agreement with Cantor Fitzgerald & Co. for the sale of up to an additional 2,632,734 shares.
The Adviser has paid the costs associated with the at-the-market offering of shares and will be reimbursed by the Fund up to 0.60% of the offering price of common shares sold pursuant to the shelf registration statement, not to exceed the amount of actual offering costs incurred. For the year ended May 31, 2017, the Fund incurred $51,978 of expenses associated with the at-the market offerings.
Note 12 – Restricted Securities:
The securities below are considered illiquid and restricted under guidelines established by the Board of Trustees:
| | | | |
Restricted Securities | Acquisition Date | Cost | Value |
| Schahin II Finance Company SPV Ltd., 5.88% | | | |
| due 09/25/22 | 01/18/14 | $ 783,911 | $ 107,280 |
| Turbine Engines Securitization Ltd., | | | |
| 2013-1A, 6.38% due 12/15/48 | 11/27/13 | 282,210 | 266,701 |
| | | $ 1,066,121 | $ 373,981 |
48 l GGM l GUGGENHEIM CREDIT ALLOCATION FUND ANNUAL REPORT| | |
NOTES TO FINANCIAL STATEMENTS continued | May 31, 2017 |
Note 13 – Affiliated Transactions:
The Fund had the following transactions with affiliated securities during the year ended May 31, 2017:
| | | | | | | | | |
| | | | Share/Principal | | | | |
| | | | Activity | | | | |
| |
| | | | | | | | | Interest and |
| | | | | | | | | Amortization |
| | Balance | | | Corporate | Balance | | | Included |
Security Name | 5/31/2016 | Purchases | Sales | Actions | 5/31/2017 | | Value | in Income |
| |
| Aspect Software Parent, Inc. | 38,349 | 3,737 | 1 | 15,525 | 57,610 | | $862,445 | $ – |
| Aspect Software Parent, Inc., | | | | | | | | |
| 11.02% due 05/25/20 | 1,378,247 | – | 90,292 | – | 1,287,955 | | 1,284,735 | 167,223 |
| Aspect Software Parent, Inc., | | | | | | | | |
| 4.84% due 05/25/18 | – | 1,012,917 | 627,917 | – | 385,000 | | 385,000 | 77,837 |
| Aspect Software Parent, Inc., | | | | | | | | |
| 3.00% due 05/25/23 | 380,626 | – | – | (380,626) | – | | – | – |
| Targus Group International | | | | | | | | |
| Equity, Inc. | 33,098 | – | – | – | 33,098 | | 49,647 | – |
| Targus Group International Equity, | | | | | | | | |
| Inc., 15.00% due 12/31/19 | 136,613 | 21,854 | – | – | 158,467 | | 158,467 | 17,914 |
| Targus Group International Equity, | | | | | | | | |
| Inc., 14.00% due 05/24/16 | 383,461 | – | – | – | 383,461 | | – | – |
| | 2,350,394 | 1,038,508 | 718,210 | (365,101) | 2,305,591 | | $2,740,294 | $262,974 |
Affiliated securities accounted for $(672,364) change in net unrealized appreciation/(depreciation) on investments during the year.
Note 14 – Subsequent Event:
The Fund evaluated subsequent events through the date the financial statements were available for issue and determined there were no additional material events that would require adjustment to or disclosure in the Fund’s financial statements.
GGM l GUGGENHEIM CREDIT ALLOCATION FUND ANNUAL REPORT l 49| | |
REPORT OF INDEPENDENT REGISTERED PUBLIC ACCOUNTING FIRM | May 31, 2017 |
The Board of Trustees and Shareholders of
Guggenheim Credit Allocation Fund
We have audited the accompanying statement of assets and liabilities of the Guggenheim Credit Allocation Fund (the Fund), including the schedule of investments, as of May 31, 2017, and the related statements of operations and cash flows for the year then ended, and the statements of changes in net assets for each of the two years in the period then ended, and the financial highlights for each of the three years in the period then ended and for the period June 26, 2013 (commencement of operations) through May 31, 2014. These financial statements and financial highlights are the responsibility of the Fund’s management. Our responsibility is to express an opinion on these financial statements and financial highlights based on our audits.
We conducted our audits in accordance with the standards of the Public Company Accounting Oversight Board (United States). Those standards require that we plan and perform the audit to obtain reasonable assurance about whether the financial statements and financial highlights are free of material misstatement. We were not engaged to perform an audit of the Fund’s internal control over financial reporting. Our audits included consideration of internal control over financial reporting as a basis for designing audit procedures that are appropriate in the circumstances, but not for the purpose of expressing an opinion on the effectiveness of the Fund’s internal control over financial reporting. Accordingly, we express no such opinion. An audit also includes examining, on a test basis, evidence supporting the amounts and disclosures in the financial statements and financial highlights, assessing the accounting principles used and significant estimates made by management, and evaluating the overall financial statement presentation. Our procedures included confirmation of securities owned as of May 31, 2017, by correspondence with the custodian, brokers, and paying agents or by other appropriate auditing procedures where replies from brokers or paying agents were not received. We believe that our audits provide a reasonable basis for our opinion.
In our opinion, the financial statements and financial highlights referred to above present fairly, in all material respects, the financial position of the Guggenheim Credit Allocation Fund at May 31, 2017, the results of its operations and its cash flows for the year then ended, and the changes in its net assets and its financial highlights for each of the two years in the period then ended, and the financial highlights for each of the three years in the period then ended and for the period June 26, 2013 (commencement of operations) through May 31, 2014, in conformity with U.S. generally accepted accounting principles.
Tysons, Virginia
July 31, 2017
50 l GGM l GUGGENHEIM CREDIT ALLOCATION FUND ANNUAL REPORT| | |
SUPPLEMENTAL INFORMATION (Unaudited) | May 31, 2017 |
Federal Income Tax Information
The Fund intends to designate the maximum amount of dividends that qualify for the reduced tax rate pursuant to the Jobs and Growth Relief and Reconciliation Act of 2003. See qualified dividend income column in the table below.
In January 2018, you will be advised on IRS Form 1099 DIV or substitute 1099 DIV as to the federal tax status of the distributions received by you in the calendar year 2017.
| | |
Qualified Dividend | Dividend Received |
Income | Deduction |
| 1.06% | 1.06% |
Additionally, of the taxable ordinary income distributions paid during the fiscal year ending May 31, 2017, the Fund had the corresponding percentages qualify as interest related dividends and qualified short-term capital gains as permitted by IRC Section 871(k)(1) and IRC Section 871(k)(2), respectively.
| | |
| | % Qualifying |
% Qualifying Interest | Short-Term Capital Gain |
| 52.24% | |
Results of Shareholder Votes
The Annual Meeting of Shareholders of the Fund was held on May 4, 2017. Shareholders voted on the election of Trustees. With regards to the election of the following Trustees by shareholders of the Fund:
| | | | |
| | # of Shares in Favor | # of Shares Against | # of Shares Abstain |
| Randall C. Barnes | 6,012,997 | 64,080 | 101,962 |
| Donald C. Cacciapaglia | 5,994,280 | 83,069 | 101,690 |
| Donald A. Chubb, Jr. | 5,990,125 | 87,224 | 101,690 |
The other Trustees of the Fund not up for election in 2017 were Jerry B. Farley, Roman Friedrich III, Robert B. Karn III, Ronald A. Nyberg, Maynard F. Oliverius and Ronald E. Toupin, Jr.
Sector Classification
Information in the “Schedule of Investments” is categorized by sectors using sector-level classifications used by Bloomberg Industry Classification System, a widely recognized industry classifica -tion system provider. In the Fund’s registration statement, the Fund has investment policies relating to concentration in specific industries. For purposes of these investment policies, the Fund usually classifies industries based on industry-level classifications used by widely recognized industry classification system providers such as Bloomberg Industry Classification System, Global Industry Classification Standards and Barclays Global Classification Scheme.
GGM l GUGGENHEIM CREDIT ALLOCATION FUND ANNUAL REPORT l 51| | |
SUPPLEMENTAL INFORMATION (Unaudited) continued | May 31, 2017 |
Trustees
The Trustees of the Guggenheim Credit Allocation Fund and their principal occupations during the past five years:
| | | | | | |
| | Position(s) | Term of Office | | Number of | |
| | Held | and Length | | Portfolios in | |
Name, Address* | with | of Time | Principal Occupation(s) | Fund Complex | Other Directorships |
and Year of Birth | Trust | Served** | During Past Five Years | Overseen | Held by Trustees |
Independent Trustees: | | | | |
| |
Randall C. Barnes | Trustee | Since 2013 | Current: Private Investor (2001-present). | 98 | Current: Trustee, Purpose Investments |
| (1951) | | | | | Funds (2014-present). |
| | | | Former: Senior Vice President and Treasurer, PepsiCo, Inc. (1993-1997); | | |
| | | | President, Pizza Hut International (1991-1993); Senior Vice President, | | |
| | | | Strategic Planning and New Business Development, PepsiCo, Inc. (1987-1990). | | |
Donald A. | Trustee and | Since 2014 | Current: Business broker and manager of commercial real estate, Griffith & | 95 | Current: Midland Care, Inc. |
Chubb, Jr. | Chairman of | | Blair, Inc. (1997-present). | | (2011-present). |
| (1946) | the Valuation | | | | |
| | Oversight | | | | |
| | Committee | | | | |
Jerry B. Farley | Trustee and | Since 2014 | Current: President, Washburn University (1997-present). | 95 | Current: Westar Energy, Inc. |
| (1946) | Chairman of | | | | (2004-present); CoreFirst Bank & Trust |
| | the Audit | | (2000-present). | | |
| | Committee | | | | |
Roman Friedrich III | Trustee and | Since 2013 | Current: Founder and Managing Partner, Roman Friedrich & Company | 95 | Current: Zincore Metals, Inc. |
| (1946) | Chairman of | | (1998-present). | | (2009-present). |
| | the Contracts | | | | |
| | Review | | Former: Senior Managing Director, MLV & Co. LLC (2010-2011). | | Former: Axiom Gold and Silver Corp. |
| | Committee | | | | (2011-2012). |
Robert B. Karn III | Trustee | Since 2013 | Current: Consultant (1998-present). | 95 | Current: GP Natural Resource Partners, |
| (1942) | | | | | LLC (2002-present). |
| |
| | | | Former: Arthur Andersen (1965-1997) and Managing Partner, Financial and | | Former: Peabody Energy Company |
| | | | Economic Consulting, St. Louis office (1987-1997). | | (2003 – April 2017). |
52 l GGM l GUGGENHEIM CREDIT ALLOCATION FUND ANNUAL REPORT| | | | | | |
SUPPLEMENTAL INFORMATION (Unaudited) continued | | May 31, 2017 |
| |
| |
| | Position(s) | Term of Office | | Number of | |
| | Held | and Length | | Portfolios in | |
Name, Address* | with | of Time | Principal Occupation(s) | Fund Complex | Other Directorships |
and Year of Birth | Trust | Served** | During Past Five Years | Overseen | Held by Trustees |
Independent Trustees continued: | | | | |
| |
Ronald A. Nyberg | Trustee and | Since 2013 | Current: Partner, Momkus McCluskey Roberts, LLC (2016-present). | 100 | Current: Edward-Elmhurst Healthcare |
| (1953) | Chairman of | | | | System (2012-present). |
| | the Nominating | | Former: Partner, Nyberg & Cassioppi, LLC (2000-2016); Executive Vice | | |
| | and Governance | | President, General Counsel, and Corporate Secretary, Van Kampen | | |
| | Committee | | Investments (1982-1999). | | |
Maynard F. | Trustee | Since 2014 | Current: Retired. | 95 | Current: Robert J. Dole Institute of |
Oliverius | | | | | Politics (2016-present); Stormont-Vail |
| (1943) | | | Former: President and CEO, Stormont-Vail HealthCare (1996-2012). | | Foundation (2013-present); University of |
| | | | | | Minnesota MHA Alumni Philanthropy |
| | | | | | Committee (2009-present); Fort Hays |
| | | | | | State University Foundation (1999- |
| | | | | | present). |
| |
| | | | | | Former: Topeka Community Foundation |
| | | | | | (2009-2014). |
Ronald E. Toupin, Jr. | Trustee and | Since 2013 | Current: Portfolio Consultant (2010-present). | 97 | Former: Bennett Group of Funds |
| (1958) | Chairman of | | | | (2011-2013). |
| | the Board | | Former: Vice President, Manager and Portfolio Manager, Nuveen Asset | | |
| | | | Management (1998-1999); Vice President, Nuveen Investment Advisory | | |
| | | | Corp. (1992-1999); Vice President and Manager, Nuveen Unit Investment | | |
| | | | Trusts (1991-1999); and Assistant Vice President and Portfolio Manager, | | |
| | | | Nuveen Unit Investment Trusts (1988-1999), each of John Nuveen & Co., Inc. | | |
| | | | (1982-1999). | | |
GGM l GUGGENHEIM CREDIT ALLOCATION FUND ANNUAL REPORT l 53| | | | | | |
SUPPLEMENTAL INFORMATION (Unaudited) continued | | May 31, 2017 |
| |
| |
| | Position(s) | Term of Office | | Number of | |
| | Held | and Length | | Portfolios in | |
Name, Address* | with | of Time | Principal Occupation(s) | Fund Complex | Other Directorships |
and Year of Birth | Trust | Served** | During Past Five Years | Overseen | Held by Trustees |
Interested Trustee: | | | | | |
| |
Donald C. | President, | Since 2013 | Current: President and CEO, certain other funds in the Fund Complex | 230 | Current: Clear Spring Life Insurance |
Cacciapaglia*** | Chief Executive | | (2012-present); Vice Chairman, Guggenheim Investments (2010-present). | | Company (2015-present); Guggenheim |
| (1951) | Officer and | | | | Partners Japan, Ltd. (2014-present); |
| | Trustee | | Former: Chairman and CEO, Channel Capital Group, Inc. (2002-2010). | | Guggenheim Partners Investment |
| | | | | | Management Holdings, LLC (2014- |
| | | | | | present); Delaware Life (2013-present); |
| | | | | | Guggenheim Life and Annuity Company |
| | | | | | (2011-present); Paragon Life Insurance |
| | | | | | Company of Indiana (2011-present). |
| * | The business address of each Trustee is c/o Guggenheim Investments, 227 West Monroe Street, Chicago, IL 60606. |
| ** | This is the period for which the Trustee began serving the Fund. After a Trustee’s initial term, each Trustee is expected to serve a three year term concurrent |
| | with the class of Trustees for which he serves: |
| | —Messrs. Farley, Friedrich and Nyberg are Class II Trustees. Class II Trustees are expected to stand for re-election at the Fund’s annual meeting of shareholders |
| | for the fiscal year ended May 31, 2018. |
| | —Messrs. Karn, Oliverius and Toupin are Class III Trustees. Class III Trustees are expected to stand for re-election at the Fund’s annual meeting of shareholders |
| | for the fiscal year ended May 31, 2019. |
| | —Messrs. Barnes, Cacciapaglia and Chubb are Class I Trustees. Class I Trustees are expected to stand for re-election at the Fund’s annual meeting of share- |
| | holders for the fiscal year ended May 31, 2020. |
| *** | This Trustee is deemed to be an “interested person” of the Funds under the 1940 Act by reason of his position with the Funds’ Investment Manager and/or |
| | the parent of the Investment Manager. |
54 l GGM l GUGGENHEIM CREDIT ALLOCATION FUND ANNUAL REPORT| | |
SUPPLEMENTAL INFORMATION (Unaudited) continued | May 31, 2017 |
Principal Executive Officers
The Principal Executive Officers, of the Guggenheim Credit Allocation Fund, who are not trustees, and their principal occupations during the past five years:
| | | | |
| | Position(s) | | |
| | held | Term of Office | |
Name, Address* | with the | and Length of | |
and Year of Birth | Trust | Time Served** | Principal Occupations During Past Five Years |
Officers: | | | |
| |
Joanna M. | Chief | Since 2013 | Current: Chief Compliance Officer, certain funds in the Fund Complex (2012-present); Senior Managing Director, Guggenheim Investments |
Catalucci | Compliance | | (2012-present); AML Officer, certain funds in the Fund Complex (2016-present). |
| (1966) | Officer | | |
| | | | Former: Chief Compliance Officer and Secretary, certain other funds in the Fund Complex (2008-2012); Senior Vice President & Chief Compliance |
| | | | Officer, Security Investors, LLC and certain affiliates (2010-2012); Chief Compliance Officer and Senior Vice President, Rydex Advisors, LLC and |
| | | | certain affiliates (2010-2011). |
James M. Howley | Assistant | Since 2013 | Current: Managing Director, Guggenheim Investments (2004-present); Assistant Treasurer, certain other funds in the Fund Complex |
| (1972) | Treasurer | | (2006-present). |
| |
| | | | Former: Manager of Mutual Fund Administration, Van Kampen Investments, Inc. (1996-2004). |
Keith Kemp | Assistant | Since 2016 | Current: Treasurer and Assistant Treasurer, certain other funds in the Fund Complex (2010-present); Managing Director of Guggenheim Partners |
| (1960) | Treasurer | | Investment Management, LLC (2015-present); Chief Financial Officer, Guggenheim Specialized Products, LLC (2016-present). |
| |
| | | | Former: Managing Director and Director, Transparent Value, LLC (2010-2016); Director, Guggenheim Partners Investment Management, LLC |
| | | | (2010-2015); Chief Operating Officer, Macquarie Capital Investment Management (2007-2009). |
Amy J. Lee | Chief Legal | Since 2013 | Current: Chief Legal Officer, certain other funds in the Fund Complex (2013-present); Senior Managing Director, Guggenheim Investments |
| (1961) | Officer | | (2012-present). |
| |
| | | | Former: Vice President, Associate General Counsel and Assistant Secretary, Security Benefit Life Insurance Company and Security Benefit |
| | | | Corporation (2004-2012). |
Mark E. Mathiasen | Secretary | Since 2013 | Current: Secretary, certain other funds in the Fund Complex (2007-present); Managing Director, Guggenheim Investments (2007-present). |
| (1978) | | | |
GGM l GUGGENHEIM CREDIT ALLOCATION FUND ANNUAL REPORT l 55| | | | | |
SUPPLEMENTAL INFORMATION (Unaudited) continued | May 31, 2017 |
| |
| |
| | Position(s) | | | |
| | held | Term of Office | | |
Name, Address* | with the | and Length of | | |
and Year of Birth | Trust | Time Served** | Principal Occupations During Past Five Years | |
Officers continued: | | | | |
| |
Glenn McWhinnie | Assistant | Since 2016 | Current: Vice President, Guggenheim Investments (2009-present). | |
| (1969) | Treasurer | | | |
| | | | Former: Tax Compliance Manager, Ernst & Young LLP (1996-2009). | |
Michael P. Megaris | Assistant | Since 2014 | Current: Assistant Secretary, certain other funds in the Fund Complex (2014-present); Vice President, Guggenheim Investments (2012-present). |
| (1984) | Secretary | | | |
| | | | Former: J.D., University of Kansas School of Law (2009-2012). | |
Adam J. Nelson | Assistant | Since 2015 | Current: Vice President, Guggenheim Investments (2015-present); Assistant Treasurer, certain other funds in the Fund Complex (2015-present). |
| (1979) | Treasurer | | | |
| | | | Former: Assistant Vice President and Fund Administration Director, State Street Corporation (2013-2015); Fund Administration Assistant |
| | | | Director, State Street (2011-2013); Fund Administration Manager, State Street (2009-2011). | |
Kimberly J. Scott | Assistant | Since 2013 | Current: Director, Guggenheim Investments (2012-present); Assistant Treasurer, certain other funds in the Fund Complex (2012-present). |
| (1974) | Treasurer | | | |
| | | | Former: Financial Reporting Manager, Invesco, Ltd. (2010-2011); Vice President/Assistant Treasurer of Mutual Fund Administration, Van Kampen |
| | | | Investments, Inc./Morgan Stanley Investment Management (2009-2010); Manager of Mutual Fund Administration, Van Kampen Investments, |
| | | | Inc./Morgan Stanley Investment Management (2005-2009). | |
Bryan Stone | Vice | Since 2014 | Current: Vice President, certain other funds in the Fund Complex (2014-present); Managing Director, Guggenheim Investments (2013-present). |
| (1979) | President | | | |
| | | | Former: Senior Vice President, Neuberger Berman Group LLC (2009-2013); Vice President, Morgan Stanley (2002-2009). | |
John L. Sullivan | Chief | Since 2013 | Current: CFO, Chief Accounting Officer and Treasurer, certain other funds in the Fund Complex (2010-present); Senior Managing Director, |
| (1955) | Financial | | Guggenheim Investments (2010-present). | |
| | Officer, | | | |
| | Chief | | Former: Managing Director and CCO, each of the funds in the Van Kampen Investments fund complex (2004-2010); Managing Director and |
| | Accounting | | Head of Fund Accounting and Administration, Morgan Stanley Investment Management (2002-2004); CFO and Treasurer, Van Kampen Funds |
| | Officer and | | (1996-2004). | |
| | Treasurer | | | |
| * | The business address of each officer is c/o Guggenheim Investments, 227 West Monroe Street, Chicago, IL 60606. |
| ** | Each officer serves an indefinite term, until his or her successor is duly elected and qualified. The data reflects the commencement date upon which the officer held any officer position with the Fund. |
56 l GGM l GUGGENHEIM CREDIT ALLOCATION FUND ANNUAL REPORT| | |
APPROVAL OF ADVISORY AGREEMENTS – GUGGENHEIM CREDIT | |
ALLOCATION FUND (GGM) | May 31, 2017 |
Guggenheim Credit Allocation Fund (the “Fund”) is a Delaware statutory trust that is registered as a diversified, closed-end management investment company under the Investment Company Act of 1940, as amended (the “1940 Act”). Guggenheim Funds Investment Advisors, LLC (“GFIA” or the “Adviser”), an indirect subsidiary of Guggenheim Partners, LLC, a global, diversified financial services firm (“Guggenheim Partners”), serves as the Fund’s investment adviser and provides certain administrative and other services pursuant to an investment advisory agreement between the Fund and GFIA (the “Investment Advisory Agreement”). (Guggenheim Partners, GFIA, Guggenheim Partners Investment Management, LLC (“GPIM” or the “Sub-Adviser”) and their affiliates may be referred to herein collectively as “Guggenheim.” “Guggenheim Investments” refers to the global asset management and investment advisory division of Guggenheim Partners and includes GFIA, GPIM, Security Investors, LLC and other affiliated investment management businesses of Guggenheim Partners.)
Under the terms of the Investment Advisory Agreement, GFIA is responsible for overseeing the activities of GPIM, which performs portfolio management and related services for the Fund pursuant to an investment sub-advisory agreement by and among the Fund, the Adviser and GPIM (the “Sub-Advisory Agreement” and together with the Investment Advisory Agreement, the “Advisory Agreements”). Under the supervision and oversight of GFIA and the Board of Trustees of the Fund (the “Board,” with the members of the Board referred to individually as the “Trustees”), GPIM provides a continuous investment program for the Fund’s portfolio, provides investment research, makes and executes recommendations for the purchase and sale of securities and provides certain facilities and personnel for the Fund.
Following an initial two-year term, each of the Advisory Agreements continues in effect from year to year provided that such continuance is specifically approved at least annually by (i) the Board or a majority of the outstanding voting securities (as defined in the 1940 Act) of the Fund, and, in either event, (ii) the vote of a majority of the Trustees who are not “interested person[s],” as defined by the 1940 Act, of the Fund (the “Independent Trustees”) casting votes in person at a meeting called for such purpose. At meetings held in person on April 25, 2017 (the “April Meeting”) and on May 23-24, 2017 (the “May Meeting”), the Contracts Review Committee of the Board (the “Committee”), consisting solely of the Independent Trustees, met separately from Guggenheim to consider the proposed renewal of the Advisory Agreements in connection with the Committee’s annual contract review schedule.
As part of its review process, the Committee was represented by independent legal counsel to the Independent Trustees (“Independent Legal Counsel”). Independent Legal Counsel reviewed and discussed with the Committee various key aspects of the Trustees’ legal responsibilities relating to the proposed renewal of the Advisory Agreements and other principal contracts. The Committee took into account various materials received from Guggenheim and Independent Legal Counsel. Recognizing that the evaluation process with respect to the services provided by each of GFIA and GPIM is an ongoing one, the Committee also considered the variety of written materials, reports and oral presentations the Board receives throughout the year regarding performance and operating results of the Fund.
In connection with the contract review process, FUSE Research Network LLC (“FUSE”), an independent, third-party research provider, was engaged to prepare advisory contract renewal
GGM l GUGGENHEIM CREDIT ALLOCATION FUND ANNUAL REPORT l 57| | |
APPROVAL OF ADVISORY AGREEMENTS – GUGGENHEIM CREDIT | |
ALLOCATION FUND (GGM) continued | May 31, 2017 |
reports designed specifically to help the Board fulfill its advisory contract renewal responsibilities. The objective of the reports is to present the subject funds’ relative position regarding fees, expenses and total return performance, with comparisons to a peer group of funds identified by Guggenheim, based on a methodology reviewed by the Board. In addition, Guggenheim provided materials and data in response to formal requests for information sent by Independent Legal Counsel on behalf of the Independent Trustees. Guggenheim also made a presentation at the April Meeting. Throughout the process, the Committee asked questions of management and requested certain additional information, which Guggenheim provided following the April Meeting (collectively with the foregoing reports and materials, the “Contract Review Materials”).
The Committee considered the Contract Review Materials in the context of its accumulated experience in governing the Fund and weighed the factors and standards discussed with Independent Legal Counsel. Following an analysis and discussion of the factors identified below and in the exercise of its business judgment, the Committee concluded that it was in the best interest of the Fund to recommend that the Board approve the renewal of each of the Advisory Agreements for an additional annual term.
Investment Advisory Agreement
Nature, Extent and Quality of Services Provided by the Adviser: With respect to the nature, extent and quality of services currently provided by the Adviser, the Committee noted that although the Adviser delegated responsibility for the investment and reinvestment of the Fund’s assets to the Sub-Adviser, as affiliated companies, both the Adviser and Sub-Adviser are part of the Guggenheim organization. Further, the Committee took into account that investment advisory-related services are provided by many Guggenheim employees under different related legal entities and thus, the services provided by the Adviser on the one hand and the Sub-Adviser on the other, as well as the risks assumed by each party, are not provided by distinct legal entities. The Committee considered the Adviser’s responsibility to oversee the Sub-Adviser and took into account information provided by Guggenheim describing the Adviser’s processes and activities for providing oversight of sub-advisers, including information regarding the Adviser’s Sub-Advisory Oversight Committee.
The Committee also considered the secondary market support services provided by Guggenheim to the Fund and, in this regard, noted the materials describing the activities of Guggenheim’s dedicated Closed-End Fund Team, including with respect to communication with financial advisors, data dissemination and relationship management. In addition, the Committee considered the qualifications, experience and skills of key personnel performing services for the Fund, including those personnel providing compliance oversight, as well as the supervisors and reporting lines for such personnel. In this connection, the Committee considered Guggenheim’s resources and related efforts to retain, attract and motivate capable personnel to serve the Fund and noted Guggenheim’s report on recent additions, departures and transitions in personnel who work on matters relating to the Fund or are significant to the operations of the Adviser.
The Committee also considered Guggenheim’s attention to relevant developments in the mutual fund industry, and issues germane to closed-end funds in particular, and its observance of compliance and regulatory requirements and noted that on a regular basis the Board receives and reviews information from the Fund’s Chief Compliance Officer regarding compliance policies and
58 l GGM l GUGGENHEIM CREDIT ALLOCATION FUND ANNUAL REPORT| | |
APPROVAL OF ADVISORY AGREEMENTS – GUGGENHEIM CREDIT | |
ALLOCATION FUND (GGM) continued | May 31, 2017 |
procedures established pursuant to Rule 38a-1 under the 1940 Act, as well as from Guggenheim’s Chief Risk Officer. In addition, the Committee noted Guggenheim’s implementation of additional controls and oversight processes relating to risk management, including the establishment of an Enterprise Risk Management Committee comprised of a multi-disciplinary team of senior personnel, as well as enhancements to the organization’s information security program.
In connection with the Committee’s evaluation of the overall package of services provided by the Adviser, the Committee considered Guggenheim’s role in monitoring and coordinating compliance responsibilities with the administrator, custodian and other service providers to the Fund. In this respect, the Committee took into account the initiatives undertaken by Guggenheim in connection with the outsourcing of its fund administration and fund accounting services business resulting from Guggenheim’s sale of Rydex Fund Services, LLC (“RFS”), formerly a Guggenheim affiliate and now known as MUFG Investor Services (US), LLC (“MUFG IS”), to Mitsubishi UFJ Trust and Banking Corporation, the trust banking arm of Mitsubishi UFJ Financial Group, a Japanese financial services organization (the “RFS Transaction”). In particular, the Committee considered Guggenheim’s establishment of the Office of Chief Financial Officer (“OCFO”), its structure and responsibilities, including its role in overseeing the services provided by MUFG IS. The Committee also considered the resources allocated by Guggenheim to support the OCFO and the detailed plans presented by management for functions for the OCFO both during and upon completion of the transition period with MUFG IS.
With respect to Guggenheim’s resources and the Adviser’s ability to carry out its responsibilities under the Investment Advisory Agreement, the Chief Financial Officer of Guggenheim Investments reviewed with the Committee certain unaudited financial information concerning the holding company for Guggenheim Investments, Guggenheim Partners Investment Management Holdings, LLC (“GPIMH”). The Committee received the audited consolidated financial statements of GPIMH as supplemental information. (Thereafter, the Committee received the audited consolidated financial statements of GPIM.)
The Committee also considered the acceptability of the terms of the Investment Advisory Agreement, including the scope of services required to be performed by the Adviser.
Based on the foregoing, and based on other information received (both oral and written) at the April Meeting and the May Meeting, as well as other considerations, including the Committee’s knowledge of how the Adviser performs its duties obtained through Board meetings, discussions and reports during the year, the Committee concluded that the Adviser and its personnel were qualified to serve the Fund in such capacity and may reasonably be expected to continue to provide a high quality of services under the Investment Advisory Agreement with respect to the Fund.
Investment Performance: The Fund commenced investment operations on June 26, 2013. The Committee considered the Fund’s investment performance by reviewing the Fund’s total return on a net asset value (“NAV”) and market price basis for the three-year and one-year periods ended December 31, 2016. The Committee compared the Fund’s performance to a peer group of closed-end funds identified by Guggenheim (the “peer group of funds”) and the Fund’s benchmark for the same time periods. The Committee noted that the Adviser’s peer group selection methodology for the Fund starts with the entire U.S.-listed taxable closed-end fund universe, and excludes funds that: (i) invest more than 80% in one asset class; (ii) invest less than 20% in each of corporate bonds and
GGM l GUGGENHEIM CREDIT ALLOCATION FUND ANNUAL REPORT l 59| | |
APPROVAL OF ADVISORY AGREEMENTS – GUGGENHEIM CREDIT | |
ALLOCATION FUND (GGM) continued | May 31, 2017 |
banks loans; (iii) invest more than 50% outside the U.S.; (iv) invest more than 30% in investment grade securities; and (v) invest more than 30% in asset-backed securities (ABS) or mortgage-backed securities (MBS). The Committee considered that the peer group of funds is consistent with the peer group used for purposes of the Fund’s quarterly performance reporting.
The Committee noted that the Fund’s investment results were consistent with its investment objective to seek total return through a combination of current income and capital appreciation. The Committee also considered that the Adviser does not directly manage the investment portfolio but delegated such duties to the Sub-Adviser.
In addition, the Committee considered the Fund’s structure and form of leverage, and among other information related to leverage, the cost of the leverage and the aggregate leverage outstanding as of December 31, 2016, as well as net yield on leverage assets and net impact on common assets due to leverage for the one-year period ended December 31, 2016 and annualized for the three-year and since-inception periods ended December 31, 2016. Based on the information provided, including with respect to the Adviser’s sub-advisory oversight processes, the Committee concluded that the Adviser had appropriately reviewed and monitored the Sub-Adviser’s investment performance.
Comparative Fees, Costs of Services Provided and the Profits Realized by the Adviser from its Relationship with the Fund: The Committee compared the Fund’s contractual advisory fee (which includes the sub-advisory fee paid to the Sub-Adviser) and total net expense ratio, in each case as a percentage of average net assets for the latest fiscal year, to the peer group of funds and noted the Fund’s percentile rankings in this regard. The Committee also reviewed the average and median advisory fees and expense ratios, including expense ratio components (e.g., transfer agency fees, administration fees and other operating expenses) of the peer group of funds. The Committee considered that the Fund’s total net expense ratio was equal to the peer group median and the Fund’s contractual advisory fee was below the peer group median (ranking in the 40th percentile).
As part of its evaluation of the Fund’s advisory fee, the Committee considered how such fee compared to the advisory fee charged by Guggenheim to one or more other clients that it manages pursuant to similar investment strategies, noting that, in certain instances, Guggenheim charges a lower advisory fee to such other clients. In this connection, the Committee considered, among other things, Guggenheim’s representations about the significant differences between managing registered funds as compared to other types of accounts. The Committee also considered Guggenheim’s explanation that lower fees are charged in certain instances due to various other factors, including the scope of contract, type of investors, differences in fee structure, applicable legal, governance and capital structures, tax status and historical pricing reasons. The Committee concluded that the information it received demonstrated that the aggregate services provided to the Fund were sufficiently different from those provided to other clients with similar investment strategies and/or the risks borne by Guggenheim were sufficiently greater than those associated with managing other clients with similar investment strategies to support the difference in fees.
With respect to the costs of services provided and profits realized by Guggenheim Investments from its relationship with the Fund, the Committee reviewed a profitability analysis and data from management setting forth the average assets under management for the twelve months ended December 31, 2016, ending assets under management as of December 31, 2016, gross revenues received by Guggenheim Investments, expenses allocated to the Fund, earnings and the operating
60 l GGM l GUGGENHEIM CREDIT ALLOCATION FUND ANNUAL REPORT| | |
APPROVAL OF ADVISORY AGREEMENTS – GUGGENHEIM CREDIT | |
ALLOCATION FUND (GGM) continued | May 31, 2017 |
margin/profitability rate, including variance information relative to the foregoing amounts as of December 31, 2015. In addition, the Chief Financial Officer of Guggenheim Investments reviewed with, and addressed questions from, the Committee concerning the expense allocation methodology employed in producing the profitability analysis.
In the course of its review of Guggenheim Investments’ profitability, the Committee took into account the methods used by Guggenheim Investments to determine expenses and profit. The Committee also noted steps taken by management to refine its methodology in preparation for contract review, including, among other things, revisions to the process for allocating expenses for shared service functions, as previously reported to and discussed with the Board. The Committee considered all of the foregoing in evaluating the costs of services provided, the profitability to Guggenheim Investments and the profitability rates presented, and concluded that the profits were not unreasonable.
The Committee considered other benefits available to the Adviser because of its relationship with the Fund and noted Guggenheim’s statement that until the completion of the RFS Transaction on October 4, 2016, the Adviser may have benefited from arrangements whereby an affiliate received fees from the Fund for providing certain administrative and fund accounting services. In addition, the Committee noted the Adviser’s statement that it may benefit from marketing synergies arising from offering a broad spectrum of products, including the Fund.
Economies of Scale: The Committee received and considered information regarding whether there have been economies of scale with respect to the management of the Fund as the Fund’s assets grow (primarily through the appreciation of the Fund’s investment portfolio), whether the Fund has appropriately benefited from any economies of scale, and whether there is potential for realization of any further economies of scale. The Committee considered whether economies of scale in the provision of services to the Fund were being passed along to the shareholders. In this respect, the Committee considered that advisory fee breakpoints generally are not relevant given the structural nature of closed-end funds, which, though able to conduct additional share offerings periodically, do not continuously offer new shares and thus, do not experience daily inflows and outflows of capital. In addition, the Committee took into account that given the relative size of the Fund, Guggenheim does not believe breakpoints are appropriate at this time. The Committee also noted that to the extent the Fund’s assets increase over time (whether through periodic offerings or internal growth from asset appreciation), the Fund and its shareholders should realize economies of scale as certain expenses, such as fixed fund fees, become a smaller percentage of overall assets.
The Committee determined that, taking into account all relevant factors, the Fund’s advisory fee was reasonable.
Sub-Advisory Agreement
Nature, Extent and Quality of Services Provided by the Sub-Adviser: With respect to the nature, extent and quality of services provided by the Sub-Adviser, the Committee considered the qualifications, experience and skills of the Sub-Adviser’s portfolio management and other key personnel and information from the Sub-Adviser describing the scope of its services to the Fund. With respect to Guggenheim’s resources and the Sub-Adviser’s ability to carry out its responsibilities under the Sub-Advisory Agreement, as noted above, the Committee considered the financial
GGM l GUGGENHEIM CREDIT ALLOCATION FUND ANNUAL REPORT l 61| | |
APPROVAL OF ADVISORY AGREEMENTS – GUGGENHEIM CREDIT | |
ALLOCATION FUND (GGM) continued | May 31, 2017 |
condition of GPIMH. (Thereafter, the Committee received the audited consolidated financial statements of GPIM.)
The Committee also considered the acceptability of the terms of the Sub-Advisory Agreement, including the scope of services required to be performed by the Sub-Adviser. In addition, the Committee considered the Sub-Adviser’s efforts in pursuing the Fund’s investment objective of seeking to provide a high level of current income and gains, with a secondary objective of long-term capital appreciation.
Based on the foregoing, and based on other information received (both oral and written) at the April Meeting and the May Meeting, as well as other considerations, including the Committee’s knowledge of how the SubAdviser performs its duties obtained through Board meetings, discussions and reports during the year, the Committee concluded that the Sub-Adviser and its personnel were qualified to serve the Fund in such capacity and may reasonably be expected to continue to provide a high quality of services under the Sub-Advisory Agreement.
Investment Performance: The Committee reviewed the performance of the Fund and the peer group of funds over recent periods of time, noting that the Fund had a limited performance history, having commenced investment operations on June 26, 2013. The Committee noted that the Fund’s return on an NAV basis exceeded the median return of its peer group for the three-year and one-year periods ended December 31, 2016 (ranking in the 1st and 10th percentiles, respectively).
In addition, the Committee noted Guggenheim’s belief that there is no single optimal performance metric, nor is there a single optimal time period over which to evaluate performance and that a thorough understanding of performance comes from analyzing measures of returns, risk and risk-adjusted returns, as well as evaluating strategies both relative to their market benchmarks and to peer groups of competing strategies. Thus, the Committee also reviewed and considered the additional performance and risk metrics provided by Guggenheim, including the Fund’s standard deviation, tracking error, beta, Sharpe ratio, information ratio and alpha compared to the benchmark, with the Fund’s risk metrics ranked against its peer group. In assessing the foregoing, the Committee considered Guggenheim’s statements that the Fund’s risk metrics have consistently ranked in the middle of the peer group and its risk-adjusted returns have consistently been in the top quartile.
After reviewing the foregoing and related factors, the Committee concluded that the Fund’s performance was acceptable.
Comparative Fees, Costs of Services Provided and the Profits Realized by the SubAdviser from its Relationship with the Fund: The Committee considered that the Sub-Advisory Agreement is with an affiliate of the Adviser, that the Adviser compensates the Sub-Adviser from its own fees so that the sub-advisory fee rate with respect to the Fund does not impact the fees paid by the Fund and that the Sub-Adviser’s revenues were included in the calculation of Guggenheim Investments’ profitability. Given its determination of the reasonableness of the advisory fee, the Committee concluded that the sub-advisory fee rate with respect to the Fund was reasonable.
Economies of Scale: The Committee recognized that, because the Sub-Adviser’s fees are paid by the Adviser and not the Fund, the analysis of economies of scale was more appropriate in the context of
62 l GGM l GUGGENHEIM CREDIT ALLOCATION FUND ANNUAL REPORT| | |
APPROVAL OF ADVISORY AGREEMENTS – GUGGENHEIM CREDIT | |
ALLOCATION FUND (GGM) continued | May 31, 2017 |
the Committee’s consideration of the Investment Advisory Agreement, which was separately considered. (See “Investment Advisory Agreement—Economies of Scale” above.)
Overall Conclusions
Based on the foregoing, the Committee determined that the investment advisory fees are fair and reasonable in light of the extent and quality of the services provided and other benefits received and that the continuation of each Advisory Agreement is in the best interest of the Fund. In reaching this conclusion, no single factor was determinative or conclusive and each Committee member, in the exercise of his business judgment, may attribute different weights to different factors. At the May Meeting, the Committee, constituting all of the Independent Trustees, recommended the renewal of each Advisory Agreement for an additional annual term.
Thereafter, on May 24, 2017, the Board, including all of the Independent Trustees, approved the renewal of each of the Advisory Agreements for an additional annual term.
GGM l GUGGENHEIM CREDIT ALLOCATION FUND ANNUAL REPORT l 63| | |
DIVIDEND REINVESTMENT PLAN (Unaudited) | May 31, 2017 |
Unless the registered owner of common shares elects to receive cash by contacting the Computershare Trust Company, N.A. (the “Plan Administrator”), all dividends declared on common shares of the Fund will be automatically reinvested by the Plan Administrator, Administrator for shareholders in the Fund’s Dividend Reinvestment Plan (the “Plan”), in additional common shares of the Fund. Participation in the Plan is completely voluntary and may be terminated or resumed at any time without penalty by notice if received and processed by the Plan Administrator prior to the dividend record date; otherwise such termination or resumption will be effective with respect to any subsequently declared dividend or other distribution. Some brokers may automatically elect to receive cash on your behalf and may re-invest that cash in additional common shares of the Fund for you. If you wish for all dividends declared on your common shares of the Fund to be automatically reinvested pursuant to the Plan, please contact your broker.
The Plan Administrator will open an account for each common shareholder under the Plan in the same name in which such common shareholder’s common shares are registered. Whenever the Fund declares a dividend or other distribution (together, a “Dividend”) payable in cash, nonparticipants in the Plan will receive cash and participants in the Plan will receive the equivalent in common shares. The common shares will be acquired by the Plan Administrator for the participants’ accounts, depending upon the circumstances described below, either (i) through receipt of additional unissued but authorized common shares from the Fund (“Newly Issued Common Shares”) or (ii) by purchase of outstanding common shares on the open market (“Open-Market Purchases”) on the New York Stock Exchange or elsewhere. If, on the payment date for any Dividend, the closing market price plus estimated brokerage commission per common share is equal to or greater than the net asset value per common share, the Plan Administrator will invest the Dividend amount in Newly Issued Common Shares on behalf of the participants. The number of Newly Issued Common Shares to be credited to each participant’s account will be determined by dividing the dollar amount of the Dividend by the net asset value per common share on the payment date; provided that, if the net asset value is less than or equal to 95% of the closing market value on the payment date, the dollar amount of the Dividend will be divided by 95% of the closing market price per common share on the payment date. If, on the payment date for any Dividend, the net asset value per common share is greater than the closing market value plus estimated brokerage commission, the Plan Administrator will invest the Dividend amount in common shares acquired on behalf of the participants in Open-Market Purchases.
If, before the Plan Administrator has completed its Open-Market Purchases, the market price per common share exceeds the net asset value per common share, the average per common share purchase price paid by the Plan Administrator may exceed the net asset value of the common shares, resulting in the acquisition of fewer common shares than if the Dividend had been paid in Newly Issued Common Shares on the Dividend payment date. Because of the foregoing difficulty with respect to Open-Market Purchases, the Plan provides that if the Plan Administrator is unable to invest the full Dividend amount in Open-Market Purchases during the purchase period or if the market discount shifts to a market premium during the purchase period, the Plan Administrator may cease making Open-Market Purchases and may invest the uninvested portion of the Dividend amount in Newly Issued Common Shares at net asset value per common share at the close of business on the Last Purchase Date provided that, if the net asset value is less than or equal to 95% of the then current market price per common share; the dollar amount of the Dividend will be divided by 95% of the market price on the payment date.
64 l GGM l GUGGENHEIM CREDIT ALLOCATION FUND ANNUAL REPORT| | |
DIVIDEND REINVESTMENT PLAN (Unaudited) continued | May 31, 2017 |
The Plan Administrator maintains all shareholders’ accounts in the Plan and furnishes written confirmation of all transactions in the accounts, including information needed by shareholders for tax records. Common shares in the account of each Plan participant will be held by the Plan Administrator on behalf of the Plan participant, and each shareholder proxy will include those shares purchased or received pursuant to the Plan. The Plan Administrator will forward all proxy solicitation materials to participants and vote proxies for shares held under the Plan in accordance with the instruction of the participants.
There will be no brokerage charges with respect to common shares issued directly by the Fund. However, each participant will pay a pro rata share of brokerage commission incurred in connection with Open-Market Purchases. The automatic reinvestment of Dividends will not relieve participants of any Federal, state or local income tax that may be payable (or required to be withheld) on such Dividends.
The Fund reserves the right to amend or terminate the Plan. There is no direct service charge to participants with regard to purchases in the Plan; however, the Fund reserves the right to amend the Plan to include a service charge payable by the participants.
All correspondence or questions concerning the Plan should be directed to the Plan Administrator, Computershare Trust Company, N.A., P.O. Box 30170 College Station, TX 77842-3170; Attention: Shareholder Services Department, Phone Number: (866) 488-3559 or online at www.computershare.com/investor.
GGM l GUGGENHEIM CREDIT ALLOCATION FUND ANNUAL REPORT l 65| | |
FUND INFORMATION | May 31, 2017 |
Board of Trustees Randall C. Barnes
Donald C. Cacciapaglia*
Donald A. Chubb
Jerry B. Farley
Roman Friedrich III
Robert B. Karn III
Ronald A. Nyberg
Maynard F. Oliverius
Ronald E. Toupin, Jr.,
Chairperson * Trustee is an “interested person” (as defined
in section 2(a)(19) of the 1940 Act)
(“Interested Trustee”) of the Trust because of
his position as the President and CEO of the
Investment Adviser and Distributor. Principal Executive Officers Donald C. Cacciapaglia
President and Chief Executive Officer Joanna M. Catalucci
Chief Compliance Officer Amy J. Lee
Chief Legal Officer
Mark E. Mathiasen
Secretary John L. Sullivan
Chief Financial Officer,
Chief Accounting Officer and Treasurer | Investment Adviser
Guggenheim Funds Investment
Advisors, LLC
Chicago, IL Investment Sub-Adviser
Guggenheim Partners Investment
Management, LLC
Santa Monica, CA Administrator and Accounting Agent
MUFG Investor Services (US), LLC
Rockville, MD Custodian
The Bank of New York Mellon Corp
New York, NY Legal Counsel
Skadden, Arps, Slate,
Meagher & Flom LLP
New York, NY Independent Registered Public
Accounting Firm
Ernst & Young LLP
Tysons, VA |
66 l GGM l GUGGENHEIM CREDIT ALLOCATION FUND ANNUAL REPORT| | |
FUND INFORMATION continued | May 31, 2017 |
Privacy Principles of the Fund
The Fund is committed to maintaining the privacy of its shareholders and to safeguarding their non-public personal information. The following information is provided to help you understand what personal information the Fund collects, how the Fund protects that information and why, in certain cases, the Fund may share information with select other parties.
Generally, the Fund does not receive any non-public personal information relating to its shareholders, although certain non-public personal information of its shareholders may become available to the Fund. The Fund does not disclose any non-public personal information about its shareholders or former shareholders to anyone, except as permitted by law or as is necessary in order to service shareholder accounts (for example, to a transfer agent or third party administrator).
The Fund restricts access to non-public personal information about its shareholders to employees of the Fund’s investment advisor and its affiliates with a legitimate business need for the information. The Fund maintains physical, electronic and procedural safeguards designed to protect the non-public personal information of its shareholders.
Questions concerning your shares of Guggenheim Credit Allocation Fund?
| · | If your shares are held in a Brokerage Account, contact your Broker. |
| · | If you have physical possession of your shares in certificate form, contact the Fund’s Transfer Agent:
Computershare Trust Company N.A., P.O. Box 30170 College Station, TX 77842-3170; (866) 488-3559 or online at www.computershare.com/investor. |
This report is sent to shareholders of Guggenheim Credit Allocation Fund for their information. It is not a Prospectus, circular or representation intended for use in the purchase or sale of shares of the Fund or of any securities mentioned in this report.
A description of the Fund’s proxy voting policies and procedures related to portfolio securities is available without charge, upon request, by calling the Fund at (800) 345-7999.
Information regarding how the Fund voted proxies for portfolio securities, if applicable, during the most recent 12-month period ended June 30, is also available, without charge and upon request by calling (800) 345-7999, by visiting the Fund’s website at guggenheiminvestments.com/ggm or by accessing the Fund’s Form N-PX on the U.S. Securities and Exchange Commission’s (SEC) website at www.sec.gov.
The Fund files its complete schedule of portfolio holdings with the SEC for the first and third quarters of each fiscal year on Form N-Q. The Fund’s Form N-Q is available on the SEC website at www.sec.gov or by visiting the Fund’s website at guggenheiminvestments.com/ggm. The Fund’s Form N-Q may also be viewed and copied at the SEC’s Public Reference Room in Washington, DC; information on the operation of the Public Reference Room may be obtained by calling (800) SEC-0330 or at www.sec.gov.
Notice to Shareholders
Notice is hereby given in accordance with Section 23(c) of the Investment Company Act of 1940, as amended, that the Fund from time to time may purchase shares of its common stock in the open market.
GGM l GUGGENHEIM CREDIT ALLOCATION FUND ANNUAL REPORT l 67
Guggenheim Partners Investment Management, LLC
Guggenheim Partners Investment Management, LLC (“GPIM”) is an indirect subsidiary of Guggenheim Partners, LLC, a diversified financial services firm. The firm provides capital markets services, portfolio and risk management expertise, wealth management, and investment advisory services. Clients of Guggenheim Partners, LLC subsidiaries are an elite mix of individuals, family offices, endowments, foundations, insurance companies and other institutions.
Investment Philosophy
GPIM’s investment philosophy is predicated upon the belief that thorough research and independent thought are rewarded with performance that has the potential to outperform benchmark indexes with both lower volatility and lower correlation of returns over time as compared to such benchmark indexes.
Investment Process
GPIM’s investment process is a collaborative effort between various groups including the Portfolio Construction Group, which utilize proprietary portfolio construction and risk modeling tools to determine allocation of assets among a variety of sectors, and its Sector Specialists, who are responsible for security selection within these sectors and for implementing securities transactions, including the structuring of certain securities directly with the issuers or with investment banks and dealers involved in the origination of such securities.
| |
Guggenheim Funds Distributors, LLC |
| 227 West Monroe Street |
| Chicago, IL 60606 |
| Member FINRA/SIPC |
| (07/17) |
NOT FDIC-INSURED l NOT BANK-GUARANTEED l MAY LOSE VALUE |
| CEF-GGM-AR-0517 |
Item 2. Code of Ethics.
(2) Not applicable.
(3) Not applicable.
Item 3. Audit Committee Financial Expert.
The registrant's Board of Trustees has determined that it has at least one audit committee financial expert serving on its audit committee, Dr. Jerry B. Farley. Dr. Farley qualifies as an audit committee financial expert by virtue of his experience at educational institutions, where his business responsibilities have included all aspects of financial management and reporting.
(Under applicable securities laws, a person who is determined to be an audit committee financial expert will not be deemed an "expert" for any purpose, including without limitation for the purposes of Section 11 of the Securities Act of 1933, as amended, as a result of being designated or identified as an audit committee financial expert. The designation or identification of a person as an audit committee financial expert does not impose on such person any duties, obligations, or liabilities that are greater than the duties, obligations, and liabilities imposed on such person as a member of the Audit Committee and Board of Trustees in the absence of such designation or identification. The designation or identification of a person as an audit committee financial expert does not affect the duties, obligations or liability of any other member of the Audit Committee or Board of Trustees.)
Item 4. Principal Accountant Fees and Services.
The registrant's principal accountant did not bill for non-audit services that required approval by the audit committee pursuant to paragraph (c)(7)(ii) of Rule 2-01 of Regulation S-X during the registrant's last two fiscal years.
The registrant's principal accountant did not bill for non-audit services that required approval by the audit committee pursuant to paragraph (c)(7)(ii) of Rule 2-01 of Regulation S-X during the registrant's last two fiscal years.
The registrant's principal accountant did not bill for non-audit services that required approval by the audit committee pursuant to paragraph (c)(7)(ii) of Rule 2-01 of Regulation S-X during the registrant's last two fiscal years.
(1) The registrant's audit committee reviews, and in its sole discretion, pre-approves, pursuant to written pre-approval procedures (A) all engagements for audit and non-audit services to be provided by the principal accountant to the registrant and (B) all engagements for non-audit services to be provided by the principal accountant (1) to the registrant's investment adviser (not including a sub-adviser whose role is primarily portfolio management and is sub-contracted or overseen by another investment adviser) and (2) to any entity controlling, controlled by or under common control with the registrant's investment adviser that provides ongoing services to the registrant; but in the case of the services described in subsection (B)(1) or (2), only if the engagement relates directly to the operations and financial reporting of the registrant; provided that such pre-approval need not be obtained in circumstances in which the pre-approval requirement is waived under rules promulgated by the Securities and Exchange Commission or New York Stock Exchange listing standards. Sections V.B.2 and V.B.3 of the registrant's audit
V.B.2.Pre-approve any engagement of the independent auditors to provide any non-prohibited services, other than "prohibited non-audit services," to the Fund, including the fees and other compensation to be paid to the independent auditors (unless an exception is available under Rule 2-01 of Regulation S-X).
V.B.3. Pre-approve any engagement of the independent auditors, including the fees and other compensation to be paid to the independent auditors, to provide any non-audit services to the Adviser (or any "control affiliate" of the Adviser providing ongoing services to the Fund), if the engagement relates directly to the operations and financial reporting of the Fund (unless an exception is available under Rule 2-01 of Regulation S-X).
(2) None of the services described in each of Items 4(b) through (d) were approved by the Audit Committee pursuant to paragraph (c)(7)(i)(C) of Rule 2-01 of Regulation S-X.
(f) Not applicable.
(h) Not applicable.
Item 5. Audit Committee of Listed Registrants.
(a) The registrant has a separately designated standing Audit Committee established in accordance with Section 3(a)(58)(A) of the Securities Exchange Act of 1934, as amended. The audit committee of the registrant is composed of: Randall C. Barnes; Ronald A. Nyberg; Ronald E. Toupin, Jr; Robert B. Karn III; Donald A. Chubb; Jerry B. Farley; Maynard F. Oliverius; and Roman Friedrich III.
(b) Not applicable.
Item 6. Schedule of Investments.
The Schedule of Investments is included as part of Item 1.
Item 7. Disclosure of Proxy Voting Policies and Procedures for Closed-End Management Investment Companies.
The registrant has delegated the voting of proxies relating to its voting securities to the registrant's investment sub-adviser, Guggenheim Partners Investment Management, LLC ("GPIM"). GPIM's proxy voting policies and procedures are included as an exhibit hereto.
Item 8. Portfolio Managers of Closed-End Management Investment Companies.
(a)(1) GPIM serves as sub-adviser for the registrant and is responsible for the day-to-day management of the registrant's portfolio. GPIM uses a team approach to manage client portfolios. Day to day management of a client portfolio is conducted under the auspices of GPIM's Portfolio Construction Group ("PCG"). PCG's members include the Chief Investment Officer ("CIO") and other key investment personnel. The PCG, in consultation with the CIO, provides direction for overall investment strategy. The PCG performs several duties as it relates to client portfolios including: determining both tactical and strategic asset allocations; and monitoring portfolio adherence to asset allocation targets; providing sector specialists with direction for overall investment strategy, which may include portfolio design and the rebalancing of portfolios; performing risk management oversight; assisting sector managers and research staff in determining the relative valuation of market sectors; and providing a forum for the regular discussion of the economy and the financial markets to enhance the robustness of GPIM's strategic and tactical policy directives.
The following individuals at GPIM share primary responsibility for the management of the registrant's portfolio and is provided as of May 31, 2017:
The following tables summarize information regarding each of the other accounts managed by the Guggenheim portfolio managers as of May 31, 2017:
Actual or apparent conflicts of interest may arise when a portfolio manager has day-to-day management responsibilities with respect to more than one fund or other account. More specifically, portfolio managers who manage multiple funds and/or other accounts may be presented with one or more of the following potential conflicts.
The management of multiple funds and/or other accounts may result in a portfolio manager devoting unequal time and attention to the management of each fund and/or other account. GPIM seeks to manage such competing interests for the time and attention of a portfolio manager by having the portfolio manager focus on a particular investment discipline. Specifically, the ultimate decision maker for security selection for each client portfolio is the Sector Specialist Portfolio Manager. They are responsible for analyzing and selecting specific securities that they believe best reflect the risk and return level as provided in each client's investment guidelines.
GPIM may have clients with similar investment strategies. As a result, if an investment opportunity would be appropriate for more than one client, GPIM may be required to choose among those clients in allocating such opportunity, or to allocate less of such opportunity to a client than it would ideally allocate if it did not have to allocate to multiple clients. In addition, GPIM may determine that an investment opportunity is appropriate for a particular account, but not for another.
Allocation decisions are made in accordance with the investment objectives, guidelines, and restrictions governing the respective clients and in a manner that will not unfairly favor one client over another. GPIM's allocation policy provides that investment decisions must never be based upon account performance or fee structure. Accordingly, GPIM's allocation procedures are designed to ensure that investment opportunities are allocated equitably among different client accounts over time. The procedures also seek to ensure reasonable efficiency in client transactions and to provide portfolio managers with flexibility to use allocation methodologies appropriate to GPIM's investment disciplines and the specific goals and objectives of each client account.
In order to minimize execution costs and obtain best execution for clients, trades in the same security transacted on behalf of more than one client may be aggregated. In the event trades are aggregated, GPIM's policy and procedures provide as follows: (i) treat all participating client accounts fairly; (ii) continue to seek best execution; (iii) ensure that clients who participate in an aggregated order will participate at the average share price with all transaction costs shared on a pro-rata basis based on each client's participation in the transaction; (iv) disclose its aggregation policy to clients.
GPIM, as a fiduciary to its clients, considers numerous factors in arranging for the purchase and sale of clients' portfolio securities in order to achieve best execution for its clients. When
In the event that multiple broker/dealers make a market in a particular security, GPIM's Portfolio Managers are responsible for selecting the broker-dealer to use with respect to executing the transaction. The broker-dealer will be selected on the basis of how the transaction can be executed to achieve the most favorable execution for the client under the circumstances. In many instances, there may only be one counter-party active in a particular security at a given time. In such situations the Employee executing the trade will use his/her best effort to obtain the best execution from the counter-party.
GPIM and the registrant have adopted certain compliance procedures which are designed to address these types of conflicts. However, there is no guarantee that such procedures will detect each and every situation in which a conflict arises.
GPIM compensates Mr. Minerd, Ms. Walsh, Mr. Abrams, Mr. Gundersen and Mr. Michal for their management of the registrant's portfolio. Compensation is evaluated based on their contribution to investment performance relative to pertinent benchmarks and qualitatively based on factors such as teamwork and client service efforts. GPIM's staff incentives may include: a competitive base salary, bonus determined by individual and firm wide performance, equity participation, and participation opportunities in various GPIM investments. All GPIM employees are also eligible to participate in a 401(k) plan to which GPIM may make a discretionary match after the completion of each plan year.
The following table discloses the dollar range of equity securities of the registrant beneficially owned by each Guggenheim portfolio manager as of May 31, 2017:
Item 9. Purchases of Equity Securities by Closed-End Management Investment Company and Affiliated Purchasers.
None.
Item 10. Submission of Matters to a Vote of Security Holders.
The registrant has not made any material changes to the procedures by which shareholders may recommend nominees to the registrant's Board of Trustees.
Item 11. Controls and Procedures.
(a) The registrant's principal executive officer and principal financial officer have evaluated the registrant's disclosure controls and procedures (as defined in Rule 30a-3(c) under the Investment Company Act) as of a date within 90 days of this filing and have concluded based on such evaluation, as required by Rule 30a-3(b) under the Investment Company Act, that the registrant's disclosure controls and procedures were effective, as of that date, in ensuring that information required to be disclosed by the registrant in this Form N-CSR was recorded, processed, summarized, and reported within the time periods specified in the Securities and Exchange Commission's rules and forms.
(b) There were no changes in the registrant's internal control over financial reporting (as defined in Rule 30a-3(d) under the Investment Company Act) that occurred during the registrant's second fiscal quarter of the period covered by this report that have materially affected, or are reasonably likely to materially affect, the registrant's internal control over financial reporting.
Item 12. Exhibits.
(a)(1) Code of Ethics for Chief Executive and Senior Financial Officers.
(a)(2) Certifications of principal executive officer and principal financial officer pursuant to Rule 30a-2(a) under the Investment Company Act.
(a)(3) Not applicable.
Pursuant to the requirements of the Securities Exchange Act of 1934 and the Investment Company Act of 1940, the registrant has duly caused this report to be signed on its behalf by the undersigned, thereunto duly authorized.
Name: Donald C. Cacciapaglia
Pursuant to the requirements of the Securities Exchange Act of 1934 and the Investment Company Act of 1940, this report has been signed by the following persons on behalf of the registrant and in the capacities and on the dates indicated.
Name: Donald C. Cacciapaglia
Name: John L. Sullivan