UNITED STATES
SECURITIES AND EXCHANGE COMMISSION
Washington, D.C. 20549
FORM N-CSR
CERTIFIED SHAREHOLDER REPORT OF REGISTERED MANAGEMENT INVESTMENT COMPANIES
Investment Company Act file number 811-22715
Guggenheim Credit Allocation Fund
(Exact name of registrant as specified in charter)
227 West Monroe Street, Chicago, IL 60606
(Address of principal executive offices) (Zip code)
Amy J. Lee
227 West Monroe Street, Chicago, IL 60606
(Name and address of agent for service)
Registrant’s telephone number, including area code: (312) 827-0100
Date of fiscal year end: May 31
Date of reporting period: June 1, 2018 – May 31, 2019
Item 1. Reports to Stockholders.
The registrant’s annual report transmitted to shareholders pursuant to Rule 30e-1 under the Investment Company Act of 1940, as amended (the “Investment Company Act”), is as follows:
GUGGENHEIMINVESTMENTS.COM/GGM
... YOUR LINK TO THE LATEST, MOST UP-TO-DATE INFORMATION ABOUT GUGGENHEIM CREDIT ALLOCATION FUND
The shareholder report you are reading right now is just the beginning of the story.
Online at guggenheiminvestments.com/ggm, you will find:
| · | Daily, weekly and monthly data on share prices, distributions and more |
| · | Portfolio overviews and performance analyses |
| · | Announcements, press releases and special notices |
| · | Fund and adviser contact information |
Guggenheim Partners Investment Management, LLC and Guggenheim Funds Investment Advisors, LLC are constantly updating and expanding shareholder information services on the Fund’s website in an ongoing effort to provide you with the most current information about how your Fund’s assets are managed and the results of our efforts. It is just one more small way we are working to keep you better informed about your investment in the Fund.
DEAR SHAREHOLDER
We thank you for your investment in the Guggenheim Credit Allocation Fund (the “Fund”). This report covers the Fund’s performance for the 12-month period ended May 31, 2019.
The Fund’s investment objective is to seek total return through a combination of current income and capital appreciation.
Under normal market conditions, the Fund invests at least 80% of its net assets, plus the amount of any borrowings for investment purposes, in fixed income securities, debt securities, loans and investments with economic characteristics similar to fixed-income securities, debt securities and loans (collectively, “credit securities”). The Fund seeks to achieve its investment objective by investing in a portfolio of credit securities selected from a variety of sectors and credit qualities. The Fund may invest in credit securities of any duration or maturity. Credit securities in which the Fund may invest may pay fixed or variable rates of interest. The Fund may invest without limitation in securities of non-U.S. issuers, including issuers in emerging markets.
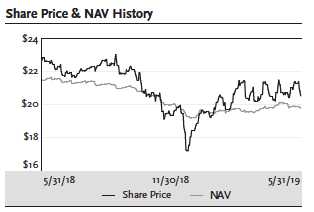
All Fund returns cited—whether based on net asset value (“NAV”) or market price—assume the reinvestment of all distributions. For the 12-month period ended May 31, 2019, the Fund provided a total return based on market price of 0.62% and a total return based on NAV of 2.47%. As of May 31, 2019, the Fund’s market price of $20.52 represented a premium of 3.85% to its NAV of $19.76.
Past performance is not a guarantee of future results. All NAV returns include the deduction of management fees, operating expenses, and all other Fund expenses. The market price of the Fund’s shares fluctuates from time to time, and may be higher or lower than the Fund’s NAV.
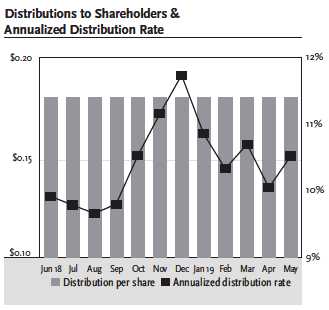
From June 2018 through May 2019, the Fund paid a monthly distribution of $0.1813 per share. The May distribution represents an annualized distribution rate of 10.60% based on the Fund’s closing market price of $20.52 on May 31, 2019. There is no guarantee of any future distribution or that the current returns and distribution rate will be maintained. The Fund’s distribution rate is not constant and the amount of distributions, when declared by the Fund’s Board of Trustees, is subject to change based on the performance of the Fund. Please see Note 2(f) on page 37 for more information on distributions for the period.
Guggenheim Funds Investment Advisors, LLC (the “Adviser”) serves as the investment adviser to the Fund. Guggenheim Partners Investment Management, LLC (“GPIM” or the “Sub-Adviser”) serves as the Fund’s investment sub-adviser and is responsible for the management of the Fund’s portfolio of investments. Each of the Adviser and the Sub-Adviser is an affiliate of Guggenheim Partners, LLC (“Guggenheim”), a global diversified financial services firm.
We encourage shareholders to consider the opportunity to reinvest their distributions from the Fund through the Dividend Reinvestment Plan (“DRIP”), which is described in detail on page 63 of this report. When shares trade at a discount to NAV, the DRIP takes advantage of the discount by reinvesting the monthly distribution in common shares of the Fund purchased in the market at a price less than NAV. Conversely, when the market price of the Fund’s common shares is at a premium above NAV, the DRIP
GGM l GUGGENHEIM CREDIT ALLOCATION FUND ANNUAL REPORT l 3| | |
DEAR SHAREHOLDER (Unaudited) continued | May 31, 2019 |
reinvests participants’ distributions in newly-issued common shares at the greater of NAV per share or 95% of the market price per share. The DRIP provides a cost-effective means to accumulate additional shares and enjoy the benefits of compounding returns over time. Since the Fund endeavors to maintain a stable monthly distribution, the DRIP effectively provides an income averaging technique, which causes shareholders to accumulate a larger number of Fund shares when the market price is depressed than when the price is higher.
To learn more about the Fund’s performance and investment strategy, we encourage you to read the Questions & Answers section of this report, which begins on page 5. You’ll find information on Guggenheim’s investment philosophy, views on the economy and market environment, and detailed information about the factors that impacted the Fund’s performance.
We appreciate your investment and look forward to serving your investment needs in the future. For the most up-to-date information on your investment, please visit the Fund’s website at guggenheiminvestments.com/ggm.
Sincerely,
Guggenheim Funds Investment Advisors, LLC
Guggenheim Credit Allocation Fund
June 30, 2019
4 l GGM l GUGGENHEIM CREDIT ALLOCATION FUND ANNUAL REPORT| | |
QUESTIONS & ANSWERS (Unaudited) | May 31, 2019 |
Guggenheim Credit Allocation Fund (the “Fund”) is managed by a team of seasoned professionals at Guggenheim Partners Investment Management, LLC (“GPIM”). This team includes B. Scott Minerd, Chairman of Guggenheim Investments and Global Chief Investment Officer; Anne B. Walsh, CFA, JD, Senior Managing Director and Chief Investment Officer, Fixed Income; Kevin H. Gundersen, Senior Managing Director and Portfolio Manager; Thomas J. Hauser, Senior Managing Director and Portfolio Manager; and Richard de Wet, Director and Portfolio Manager. In the following interview, the investment team discusses the market environment and the Fund’s performance for the 12-month period ended May 31, 2019.
What is the Fund’s investment objective and how is it pursued?
The Fund’s investment objective is to seek total return through a combination of current income and capital appreciation.
Under normal market conditions, the Fund invests at least 80% of its net assets, plus the amount of any borrowings for investment purposes, in fixed income securities, debt securities, loans and investments with economic characteristics similar to fixed-income securities (collectively, “credit securities”). Credit securities in which the Fund may invest consist of corporate bonds, loans and loan participations, asset-backed securities (all or a portion of which may consist of collateralized loan obligations), mortgage-backed securities (both residential mortgage-backed securities and commercial mortgage-backed securities), U.S. Government and agency securities, mezzanine and preferred securities, convertible securities, commercial paper, municipal securities and sovereign government and supranational debt securities. The Fund will seek to achieve its investment objective by investing in a portfolio of credit securities selected from a variety of sectors and credit qualities. The Fund may invest in credit securities that are rated below investment grade, or, if unrated, determined to be of comparable quality (also known as “high yield securities” or “junk bonds”). The Fund may invest in credit securities of any duration or maturity. Credit securities in which the Fund may invest may pay fixed or variable rates of interest. The Fund may invest without limitation in securities of non-U.S. issuers, including issuers in emerging markets.
The Fund may, but is not required to, use various derivatives transactions for hedging and risk management purposes, to facilitate portfolio management and to earn income or enhance total return. The Fund may use such transactions as a means to synthetically implement the Fund’s investment strategies. In addition, as an alternative to holding investments directly, the Fund may also obtain investment exposure by investing in other investment companies. To the extent that the Fund invests in synthetic investments with economic characteristics similar to credit securities, the value of such investments will be counted as credit securities for purposes of the Fund’s policy of investing at least 80% of its net assets, plus the amount of any borrowings for investment purposes, in credit securities (the “80% Policy”).
GGM l GUGGENHEIM CREDIT ALLOCATION FUND ANNUAL REPORT l 5| | |
QUESTIONS & ANSWERS (Unaudited) continued | May 31, 2019 |
The Fund may invest in open-end funds, closed-end funds and exchange-traded funds. For purposes of the Fund’s 80% Policy, the Fund will include its investments in other investment companies that have a policy of investing at least 80% of their net assets, plus the amount of any borrowings for investment purposes, in one or more types of credit securities.
The Fund uses financial leverage (borrowing and reverse repurchase agreements) to finance the purchase of additional securities. Although financial leverage may create an opportunity for increased return for shareholders, it also results in additional risks and can magnify the effect of any losses. There is no assurance that the strategy will be successful. If income and gains on securities purchased with the financial leverage proceeds are greater than the cost of the financial leverage, common shareholders’ return will be greater than if financial leverage had not been used. Conversely, if the income or gains from the securities purchased with the proceeds of financial leverage are less than the cost of financial leverage, common shareholders’ return will be less than if financial leverage had not been used.
What were the significant events over the 12-month period ended May 31, 2019 affecting Guggenheim’s view of the economy and market environment?
The U.S. Federal Reserve (“Fed”) was on a preset path to continue tightening monetary policy into 2019 until a confluence of factors drove market weakness in the fourth quarter of 2018, including a bear market in oil, risks of higher import tariffs, regulator warnings about the excesses in corporate credit, and concerns about tighter monetary policy. Adding to the pile was a government shutdown that showed no sign of resolution heading into 2019. As these events exposed the dying tailwinds to growth, the market awoke to the fact that there may be too much leverage in the system to handle an unfavorable economic environment. Risk assets were punished, with equity indexes almost entering a bear market and credit spreads moving sharply wider. The Fed initially failed to reassure markets that it would stem a collapse in asset prices, but the market seems to have forced the Fed’s hand.
A dovish pivot by both the Fed and the European Central Bank to start 2019 alleviated the perceived risk that the central banks were headed for irreversible policy mistakes and may even support a rebound in economic growth in both regions later this year. In the 12 months ended May 31, 2019, the yield on the two-year Treasury fell 50 basis points, from 2.4% to 1.9% and the yield on the 10-year Treasury fell from 2.9% to 2.1%.
Growing uncertainty around import tariffs has weighed on consumers’ outlook for income, business, and labor market conditions and has caused growth projections to slow. Consequently, by May 2019 markets had priced in multiple rate cuts by the Fed in 2019 and through 2020, as the Fed has made extending the business cycle a priority. Investors may be tempted to go down in quality in anticipation of a Fed-induced rally in credit. However, history suggests that credit spreads tend to widen when the Fed is lowering interest rates. Our posture remains defensive in the face of likely rate cuts starting in July.
How did the Fund perform for the twelve months ended May 31, 2019?
All Fund returns cited—whether based on net asset value (“NAV”) or market price—assume the reinvestment of all distributions. For the 12-month period ended May 31, 2019, the Fund provided a total
6 l GGM l GUGGENHEIM CREDIT ALLOCATION FUND ANNUAL REPORT| | |
QUESTIONS & ANSWERS (Unaudited) continued | May 31, 2019 |
return based on market price of 0.62% and a total return based on NAV of 2.47%. As of May 31, 2019, the Fund’s market price of $20.52 represented a premium of 3.85% to its NAV of $19.76. As of May 31, 2018, the Fund’s market price of $22.70 represented a premium of 5.73% to its NAV of $21.47.
Past performance is not a guarantee of future results. All NAV returns include the deduction of management fees, operating expenses, and all other Fund expenses. The market price of the Fund’s shares fluctuates from time to time, and may be higher or lower than the Fund’s NAV.
How did other markets perform in this environment for the 12-month period ended May 31, 2019?
| | |
Index | Total Return |
| Bloomberg Barclays U.S. Aggregate Bond Index | 6.40% |
| Bloomberg Barclays U.S. Aggregate Bond 1-3 Year Index | 3.72% |
| Bloomberg Barclays U.S. Corporate High Yield Index | 5.51% |
| Credit Suisse Leveraged Loan Index | 4.02% |
| ICE Bank of America Merrill Lynch Asset Backed Security Master BBB-AA Index | 5.60% |
| S&P 500 Index | 3.78% |
What were the distributions over the period?
From June 2018 through May 2019, the Fund paid a monthly distribution of $0.1813 per share. The May distribution represents an annualized distribution rate of 10.60% based on the Fund’s closing market price of $20.52 on May 31, 2019.
There is no guarantee of any future distribution or that the current returns and distribution rate will be maintained. The Fund’s distribution rate is not constant and the amount of distributions, when declared by the Fund’s Board of Trustees, is subject to change based on the performance of the Fund. Please see Note 2(f) on page 37 for more information on distributions for the period.
For the year ended May 31, 2019, approximately 90.5% of the distributions were characterized as ordinary income and 9.5% were characterized as a return of capital. The Fund will provide a Form 1099-DIV each calendar year that will explain the character of these distributions for U.S. federal income tax purposes.
What influenced the Fund’s performance?
The start of the period saw positive performance primarily attributable to the tightening of credit spreads through the end of the third quarter of 2018. This was evident among the portfolio’s investments in high yield corporate bonds and senior bank loans, which together comprise most of the Fund. However, the start of the fourth quarter saw an increase in volatility. This was driven in part by concerns around U.S.-China trade relations, slowing global growth, a sharp decline in equity markets, a more hawkish Fed, and an abundant oil supply.
The beginning of 2019 saw a reversal of the losses from the fourth quarter. High yield corporate bonds produced their best quarterly returns since the third quarter of 2009. Macroeconomic factors aided performance on the back of optimism of a trade deal with China and a more dovish Fed. The high yield
GGM l GUGGENHEIM CREDIT ALLOCATION FUND ANNUAL REPORT l 7| | |
QUESTIONS & ANSWERS (Unaudited) continued | May 31, 2019 |
market experienced inflows into the asset class of roughly $10 billion through May driven predominantly by exchange-traded funds. This increased demand for larger, more liquid capital structures, which has contributed to better performance in these assets relative to the 7.49% return for 2019 through the end of May. The Fund has a lower exposure to these assets than are represented in the broad high yield market.
High yield bond yields began 2019 at 7.95% and tightened through May to 6.57%–as compared to the slightly lower 6.41% at the start of June 2018. Over the 12-month period, the 10-year Treasury note yield declined more than 70 basis points. In consideration of these market moves, security pricing was dominated by technical factors rather than the fundamentals of the underlying issuers or those of the U.S. economy, which have both remained on a firm footing.
Credit selection in the Consumer Non-Cyclical and Energy sectors detracted from performance. In addition, the Energy sector performed poorly overall and so exposure to that sector detracted from total returns. The Energy sector came under pressure as oil prices, as measured by West Texas Intermediate crude (“WTI”), fell from $75 per barrel in early October to $54 per barrel by the end of May. Strong security selection in the Communications and Technology sectors added positively to returns.
The Bloomberg Barclays U.S. Corporate High Yield Index returned 5.51% for the 12-month period, while the Credit Suisse Leveraged Loan Index returned 4.02%. In the high yield market, CCC bonds (+0.33%) underperformed BB bonds (+7.02%) and B bonds (+5.75%), reversing the trend from the last few quarters. Similarly, in the bank loan market, CCC loans (+3.17%) underperformed BB loans (+3.93%) and B loans (+4.41%).
How is the Fund positioned for the coming months?
The Fund is well-positioned across its three primary asset class exposures, with the largest allocation to high yield bonds, followed by bank loans and a small allocation to asset-backed securities (“ABS”). The mix between bonds and loans varies according to the relative valuation of the two asset classes and availability of attractively priced assets. We continue to focus on more defensive credits with consistent cash flow and sustainable debt profiles. Among the high yield allocation, the Fund’s exposure to B credits is its largest, and the Fund has incrementally added to B-rated exposure while moderately reducing the CCC-rated exposure.
The Fund invests in non-U.S. dollar-denominated assets when the risk-return profile is favorable. Non-U.S. dollar-denominated assets comprise less than 2% of the Fund. The Fund entered currency forward contracts to hedge exchange rate risk. Over the last year, the U.S. dollar appreciated versus foreign currencies, which resulted in a positive impact on the forward contracts and added to performance. This was offset by depreciation of the foreign currency assets in U.S. dollar terms.
Any other comments about the Fund?
Overall, Guggenheim expects factors that have contributed to strong earnings growth and fiscal stimulus from tax cuts to fade in 2019 and may turn into headwinds by 2020. The Fund continues to
8 l GGM l GUGGENHEIM CREDIT ALLOCATION FUND ANNUAL REPORT| | |
QUESTIONS & ANSWERS (Unaudited) continued | May 31, 2019 |
avoid companies with heavy capital expenditure needs that can impair cash flow generation towards the latter part of the economic cycle. Overall, we remain focused on credit selection, which we believe will become increasingly important to returns.
What is the Fund’s duration?
The portfolio has consistently maintained a defensive stance to interest rate volatility with an underweight to duration. The effective duration for the Fund as of May 31, 2019, was below three years. A sizable allocation to bank loans that are senior in the capital structure relative to most high yield bonds reduced volatility in returns for that portion of the portfolio.
Discuss the impact of leverage for the period.
The Fund utilizes leverage as part of its investment strategy, to finance the purchase of additional securities that provide increased income and potentially greater appreciation to common shareholders than could be achieved from a portfolio that is not leveraged.
With the low cost of borrowing and stability in the fundamentals of American companies, the amount of leverage used by the Fund is highly accretive to income generation. The Fund currently employs leverage through borrowing/reverse repurchase agreements, under which the Fund temporarily transfers possession of portfolio securities and receives cash that can be used for additional investments.
As of May 31, 2019, the amount of leverage was approximately 27% of total managed assets (including the proceeds of leverage). While leverage increases the income of the Fund in yield terms, it also amplifies the effects of changing market prices in the portfolio and can cause the Fund’s NAV to change to a greater degree than the overall market. This can create volatility in Fund pricing, for example, as it moved downward in fourth quarter of 2018 and subsequently moved upward in early 2019. This factor should not affect the Fund’s ability to pay dividends under normal circumstances.
Index Definitions
Indices are unmanaged and reflect no expenses. It is not possible to invest directly in an index.
The Bloomberg Barclays U.S. Aggregate Bond Index is a broad-based flagship benchmark that measures the investment grade, U.S. dollar-denominated, fixed-rate taxable bond market, including U.S. Treasuries, government-related and corporate securities, mortgage-backed securities or “MBS” (agency fixed-rate and hybrid adjustable-rate mortgage, or “ARM”, pass-throughs), ABS, and commercial mortgage-backed securities (“CMBS”) (agency and non-agency).
The Bloomberg Barclays U.S. Aggregate Bond 1-3 Year Index measures the performance of publicly issued investment grade corporate, U.S. Treasury and government agency securities with remaining maturities of one to three years.
The Bloomberg Barclays U.S. Corporate High Yield Index measures the U.S. dollar-denominated, high yield, fixed-rate corporate bond market. Securities are classified as high yield if the middle rating of Moody’s, Fitch, and S&P is Ba1/BB +/BB + or below.
GGM l GUGGENHEIM CREDIT ALLOCATION FUND ANNUAL REPORT l 9| | |
QUESTIONS & ANSWERS (Unaudited) continued | May 31, 2019 |
The Credit Suisse Leveraged Loan Index is an index designed to mirror the investable universe of the U.S.-$-denominated leveraged loan market.
The ICE BofA/ML ABS Master BBB-AA Index is a subset of The BofA/ML U.S. Fixed Rate Asset Backed Securities Index including all securities rated AA1 through BBB3, inclusive.
The Standard & Poor’s 500 (“S&P 500”) Index is a capitalization-weighted index of 500 stocks designed to measure the performance of the broad economy, representing all major industries and is considered a representation of U.S. stock market.
Risks and Other Considerations
Investing involves risk, including the possible loss of principal and fluctuation of value.
Investments in fixed-income instruments are subject to the possibility that interest rates could rise, causing the value of the Fund’s holdings and share price to decline. High yield and unrated debt securities are at a greater risk of default than investment grade bonds and may be less liquid, which may increase volatility. Investors in asset-backed securities, including collateralized loan obligations (“CLOs”), generally receive payments that are part interest and part return of principal. These payments may vary based on the rate loans are repaid. Some asset-backed securities may have structures that make their reaction to interest rates and other factors difficult to predict, making their prices volatile and they are subject to liquidity and valuation risk. CLOs bear similar risks to investing in loans directly. Investments in loans involve special types of risks, including credit, interest rate, counterparty, prepayment, liquidity, and valuation risks. Loans are often below investment grade, may be unrated, and typically offer a fixed or floating interest rate.
The views expressed in this report reflect those of the portfolio managers only through the report period as stated on the cover. These views are expressed for informational purposes only and are subject to change at any time, based on market and other conditions, and may not come to pass. These views may differ from views of other investment professionals at Guggenheim and should not be construed as research, investment advice or a recommendation of any kind regarding the Fund or any issuer or security, do not constitute a solicitation to buy or sell any security and should not be considered specific legal, investment or tax advice. The information provided does not take into account the specific objectives, financial situation or particular needs of any specific investor.
The views expressed in this report may also include forward looking statements that involve risk and uncertainty, and there is no guarantee that any predictions will come to pass. Actual results or events may differ materially from those projected, estimated, assumed or anticipated in any such forward looking statements. Important factors that could result in such differences, in addition to the other factors noted with such forward-looking statements, include general economic conditions such as inflation, recession and interest rates.
10 l GGM l GUGGENHEIM CREDIT ALLOCATION FUND ANNUAL REPORT| | |
QUESTIONS & ANSWERS (Unaudited) continued | May 31, 2019 |
There can be no assurance that the Fund will achieve its investment objectives or that any investment strategies or techniques discussed herein will be effective. The value of the Fund will fluctuate with the value of the underlying securities. Historically, closed-end funds often trade at a discount to their net asset value.
Performance data quoted represents past performance, which is no guarantee of future results and current performance may be lower or higher than the figures shown.
Please see guggenheiminvestments.com/ggm for a detailed discussion of the Fund’s risks and considerations.
This material is not intended as a recommendation or as investment advice of any kind, including in connection with rollovers, transfers, and distributions. Such material is not provided in a fiduciary capacity, may not be relied upon for or in connection with the making of investment decisions, and does not constitute a solicitation of an offer to buy or sell securities. All content has been provided for informational or educational purposes only and is not intended to be and should not be construed as legal or tax advice and/or a legal opinion. Always consult a financial, tax and/or legal professional regarding your specific situation.
GGM l GUGGENHEIM CREDIT ALLOCATION FUND ANNUAL REPORT l 11| | |
FUND SUMMARY (Unaudited) | May 31, 2019 |
| | |
Fund Statistics | |
| Share Price | $20.52 |
| Net Asset Value | $19.76 |
| Premium to NAV | 3.85% |
| Net Assets ($000) | $146,430 |
AVERAGE ANNUAL TOTAL RETURNS
FOR THE PERIOD ENDED May 31, 2019
| | | | | |
| | | | | Since |
| | One | Three | Five | Inception |
| | Year | Year | Year | (06/26/13) |
| Guggenheim Credit Allocation Fund | | | | |
| NAV | 2.47% | 9.23% | 5.66% | 6.47% |
| Market | 0.62% | 11.87% | 6.62% | 6.44% |
Performance data quoted represents past performance, which is no guarantee of future results and current performance may be lower or higher than the figures shown. All NAV returns include the deduction of management fees, operating expenses and all other Fund expenses. The deduction of taxes that a shareholder would pay on Fund distributions or the sale of Fund shares is not reflected in the total returns. For the most recent month-end performance figures, please visit guggenheiminvestments.com/ggm. The investment return and principal value of an investment will fluctuate with changes in market conditions and other factors so that an investor’s shares, when sold, may be worth more or less than their original cost.
| | |
Portfolio Breakdown | % of Net Assets |
| Corporate Bonds | 83.7% |
| Senior Floating Rate Interests | 49.5% |
| Asset-Backed Securities | 2.8% |
| Common Stocks | 2.4% |
Total Investments | 138.4% |
Other Assets & Liabilities, net | (38.4%) |
Net Assets | 100.0% |
Holdings diversification and holdings are subject to change daily. For more information, please visit guggenheiminvestments.com/ggm. The above summaries are provided for informational purposes only and should not be viewed as recommendations. Past performance does not guarantee future results.
12 l GGM l GUGGENHEIM CREDIT ALLOCATION FUND ANNUAL REPORT| | |
FUND SUMMARY (Unaudited) continued | May 31, 2019 |
Portfolio breakdown is subject to change daily. For more information, please visit guggenheiminvestments.com/ggm. The above summaries are provided for informational purposes only and should not be viewed as recommendations. Past performance does not guarantee future results. All or a portion of the above distributions may be characterized as a return of capital. For the year ended May 31, 2019, 90.5% of the distributions were characterized as ordinary income and 9.5% of the distributions were characterized as return of capital.
GGM l GUGGENHEIM CREDIT ALLOCATION FUND ANNUAL REPORT l 13| | |
FUND SUMMARY (Unaudited) continued | May 31, 2019 |
| | |
| | (% of |
Ten Largest Holdings | Total Net Assets) |
| Vector Group Ltd., 6.13% | 3.1% |
| NES Global Talent, 8.08% (3 Month USD LIBOR + 5.50%, Rate Floor: 6.50%) | 2.7% |
| EIG Investors Corp., 10.88% | 2.7% |
| Midas Intermediate Holdco II LLC / Midas Intermediate Holdco II Finance, Inc., 7.88% | 2.6% |
| Jefferies Finance LLC / JFIN Company-Issuer Corp., 7.25% | 2.6% |
| McGraw-Hill Global Education Holdings LLC / McGraw-Hill Global Education Finance, 7.88% | 2.6% |
| Altice France S.A., 7.38% | 2.6% |
| Great Lakes Dredge & Dock Corp., 8.00% | 2.5% |
| Cengage Learning, Inc., 9.50% | 2.4% |
| Hunt Companies, Inc., 6.25% | 2.4% |
| Top Ten Total | 26.2% |
| | |
| “Ten Largest Holdings” excludes any temporary cash or derivative investments. | |
Portfolio Composition by Quality Rating*
| | |
| | % of Total |
Rating | Investments |
Investments | |
| BBB | 0.6% |
| BB | 12.6% |
| B | 41.9% |
| CCC | 16.3% |
| NR** | 26.8% |
Other Instruments | |
| Common Stocks | 1.8% |
| Total Investments | 100.0% |
| | |
| * | Source: BlackRock Solutions. Credit quality ratings are measured on a scale that generally ranges from AAA (highest) to D (lowest). All rated securities have been rated by Moody’s, Standard & Poor’s (“S&P”), or Fitch, each of which is a Nationally Recognized Statistical Rating Organization (“NRSRO”). For purposes of this presentation, when ratings are available from more than one agency, the highest rating is used. Guggenheim Investments has converted Moody’s and Fitch ratings to the equivalent S&P rating. Security ratings are determined at the time of purchase and may change thereafter. |
| ** | NR securities do not necessarily indicate low credit quality. |
14 l GGM l GUGGENHEIM CREDIT ALLOCATION FUND ANNUAL REPORT| | |
SCHEDULE OF INVESTMENTS | May 31, 2019 |
| |
| | Shares | Value |
| |
COMMON STOCKS† – 2.4% | | |
Utilities – 1.3% | | |
TexGen Power LLC†† | 46,457 | $ 1,819,581 |
| |
Consumer, Cyclical – 0.5% | | |
ATD New Holdings, Inc.*,†† | 24,428 | 781,696 |
| |
Consumer, Non-cyclical – 0.3% | | |
Chef Holdings, Inc.*,†††,1 | 3,007 | 378,401 |
Targus Group International Equity, Inc.†††,1,2 | 32,060 | 70,382 |
Total Consumer, Non-cyclical | | 448,783 |
| |
Energy – 0.3% | | |
SandRidge Energy, Inc.*,3 | 57,766 | 398,008 |
| Approach Resources, Inc.* | 12,593 | 2,692 |
Total Energy | | 400,700 |
| |
Technology – 0.0% | | |
Qlik Technologies, Inc. – Class A*,†††,1 | 56 | 62,173 |
Qlik Technologies, Inc.*,†††,1 | 3,600 | – |
Qlik Technologies, Inc. – Class B*,†††,1 | 13,812 | – |
Total Technology | | 62,173 |
| |
Industrial – 0.0% | | |
BP Holdco LLC*,†††,1,2 | 65,965 | 23,292 |
Vector Phoenix Holdings, LP*,†††,1 | 65,965 | 5,520 |
Ursa Insulation B.V.*,†††,1 | 135,131,158 | – |
Total Industrial | | 28,812 |
| |
Financials – 0.0% | | |
Project Silverback Holdings B Escrow*,†††,1 | 1,922 | – |
Total Common Stocks | | |
| (Cost $6,074,603) | | 3,541,745 |
| | Face | |
| | Amount~ | |
| |
CORPORATE BONDS†† – 83.7% | | |
Financial – 19.2% | | |
| Jefferies Finance LLC / JFIN Company-Issuer Corp. | | |
7.25% due 08/15/243,4 | 3,930,000 | 3,851,400 |
6.25% due 06/03/264 | 2,000,000 | 2,000,000 |
7.38% due 04/01/204 | 1,150,000 | 1,150,000 |
| Hunt Companies, Inc. | | |
6.25% due 02/15/263,4 | 3,725,000 | 3,459,594 |
| AmWINS Group, Inc. | | |
7.75% due 07/01/263,4 | 3,250,000 | 3,274,375 |
| Barclays plc | | |
7.75%3,6,7 | 3,000,000 | 3,007,500 |
| |
See notes to financial statements. | |
| | GGM l GUGGENHEIM CREDIT ALLOCATION FUND ANNUAL REPORT l 15 |
| | |
SCHEDULE OF INVESTMENTS continued | May 31, 2019 |
| |
| | Face | |
| | Amount~ | Value |
| |
CORPORATE BONDS†† – 83.7% (continued) | | |
Financial – 19.2% (continued) | | |
| HUB International Ltd. | | |
7.00% due 05/01/263,4 | 2,750,000 | $ 2,704,350 |
| NFP Corp. | | |
6.88% due 07/15/254 | 1,940,000 | 1,857,550 |
| CoreCivic, Inc. | | |
4.75% due 10/15/273 | 1,750,000 | 1,548,750 |
| GEO Group, Inc. | | |
| 6.00% due 04/15/26 | 1,075,000 | 986,312 |
| 5.88% due 10/15/24 | 350,000 | 324,625 |
| 5.13% due 04/01/23 | 200,000 | 188,000 |
| Springleaf Finance Corp. | | |
| 7.13% due 03/15/26 | 1,100,000 | 1,153,295 |
| 6.63% due 01/15/28 | 200,000 | 202,504 |
| Quicken Loans, Inc. | | |
5.25% due 01/15/283,4 | 1,375,000 | 1,278,338 |
| Prosight Global Inc. | | |
7.50% due 11/26/20†††,3 | 650,000 | 674,779 |
| Assurant, Inc. | | |
7.00% due 03/27/487 | 400,000 | 414,060 |
Total Financial | | 28,075,432 |
| |
Consumer, Non-cyclical – 17.2% | | |
| Vector Group Ltd. | | |
6.13% due 02/01/253,4 | 4,950,000 | 4,537,566 |
| Midas Intermediate Holdco II LLC / Midas Intermediate Holdco II Finance, Inc. | | |
7.88% due 10/01/223,4 | 4,201,000 | 3,864,920 |
| Beverages & More, Inc. | | |
11.50% due 06/15/228 | 4,695,000 | 3,403,875 |
| FAGE International S.A. / FAGE USA Dairy Industry, Inc. | | |
5.63% due 08/15/263,4 | 3,800,000 | 3,135,000 |
| Par Pharmaceutical, Inc. | | |
7.50% due 04/01/274 | 2,650,000 | 2,563,875 |
| Nathan’s Famous, Inc. | | |
6.63% due 11/01/253,4 | 2,450,000 | 2,376,500 |
| Flexi-Van Leasing, Inc. | | |
10.00% due 02/15/233,4 | 2,024,000 | 1,862,080 |
| Prime Security Services Borrower LLC / Prime Finance, Inc. | | |
5.25% due 04/15/244 | 1,850,000 | 1,815,368 |
| KeHE Distributors LLC / KeHE Finance Corp. | | |
7.63% due 08/15/213,4 | 1,075,000 | 1,066,938 |
| Endo Dac / Endo Finance LLC / Endo Finco, Inc. | | |
6.00% due 07/15/234 | 775,000 | 556,062 |
Total Consumer, Non-cyclical | | 25,182,184 |
| |
See notes to financial statements. |
16 l GGM l GUGGENHEIM CREDIT ALLOCATION FUND ANNUAL REPORT |
| | |
SCHEDULE OF INVESTMENTS continued | May 31, 2019 |
| |
| |
| | Face | |
| | Amount~ | Value |
| |
CORPORATE BONDS†† – 83.7% (continued) | | |
Communications – 15.0% | | |
| Altice France S.A. | | |
7.38% due 05/01/263,4 | 3,850,000 | $ 3,760,969 |
8.13% due 02/01/273,4 | 1,300,000 | 1,298,375 |
| EIG Investors Corp. | | |
10.88% due 02/01/243 | 3,830,000 | 4,011,925 |
| McGraw-Hill Global Education Holdings LLC / McGraw-Hill Global Education Finance | | |
7.88% due 05/15/243,4 | 4,237,000 | 3,839,781 |
| Cengage Learning, Inc. | | |
9.50% due 06/15/243,4 | 3,776,000 | 3,492,800 |
| DISH DBS Corp. | | |
7.75% due 07/01/263 | 1,450,000 | 1,330,375 |
| 5.88% due 11/15/24 | 950,000 | 854,098 |
| MDC Partners, Inc. | | |
6.50% due 05/01/243,4 | 1,946,000 | 1,780,590 |
| Telenet Finance Lux Note | | |
| 5.50% due 03/01/28 | 1,000,000 | 985,500 |
| CCO Holdings LLC / CCO Holdings Capital Corp. | | |
5.00% due 02/01/284 | 550,000 | 544,500 |
Total Communications | | 21,898,913 |
| |
Energy – 12.2% | | |
| American Midstream Partners LP / American Midstream Finance Corp. | | |
9.50% due 12/15/213,4 | 3,565,000 | 3,458,050 |
| Unit Corp. | | |
6.63% due 05/15/213 | 3,571,000 | 3,356,740 |
| Indigo Natural Resources LLC | | |
6.88% due 02/15/263,4 | 3,625,000 | 3,253,437 |
| Moss Creek Resources Holdings, Inc. | | |
7.50% due 01/15/263,4 | 2,580,000 | 2,141,400 |
| Bruin E&P Partners LLC | | |
8.88% due 08/01/233,4 | 2,008,000 | 1,802,180 |
| Exterran Energy Solutions LP / EES Finance Corp. | | |
8.13% due 05/01/253 | 1,750,000 | 1,771,875 |
| Covey Park Energy LLC / Covey Park Finance Corp. | | |
7.50% due 05/15/253,4 | 970,000 | 863,300 |
| CNX Resources Corp. | | |
| 5.88% due 04/15/22 | 800,000 | 767,104 |
| Basic Energy Services, Inc. | | |
10.75% due 10/15/233,4 | 575,000 | 454,250 |
| Legacy Reserves LP / Legacy Reserves Finance Corp. | | |
| 8.00% due 09/20/23 | 695,000 | 74,713 |
Total Energy | | 17,943,049 |
| |
See notes to financial statements. |
| GGM l GUGGENHEIM CREDIT ALLOCATION FUND ANNUAL REPORT l 17 |
| | |
SCHEDULE OF INVESTMENTS continued | May 31, 2019 |
| |
| | Face | |
| | Amount~ | Value |
| |
CORPORATE BONDS†† – 83.7% (continued) | | |
Consumer, Cyclical – 8.1% | | |
| AMC Entertainment Holdings, Inc. | | |
6.13% due 05/15/273 | 2,500,000 | $ 2,197,125 |
| Panther BF Aggregator 2 LP / Panther Finance Company, Inc. | | |
8.50% due 05/15/274 | 2,075,000 | 2,069,812 |
| Williams Scotsman International, Inc. | | |
6.88% due 08/15/234 | 1,650,000 | 1,650,000 |
7.88% due 12/15/224 | 225,000 | 232,875 |
| Titan International, Inc. | | |
| 6.50% due 11/30/23 | 1,875,000 | 1,606,641 |
| JB Poindexter & Company, Inc. | | |
7.13% due 04/15/263,4 | 1,175,000 | 1,198,500 |
| Wabash National Corp. | | |
5.50% due 10/01/254 | 1,025,000 | 966,062 |
| Suburban Propane Partners LP /Suburban Energy Finance Corp. | | |
| 5.88% due 03/01/27 | 650,000 | 628,875 |
| Party City Holdings, Inc. | | |
6.63% due 08/01/263,4 | 575,000 | 572,125 |
| American Airlines Group, Inc. | | |
5.00% due 06/01/224 | 475,000 | 480,344 |
| Delphi Technologies plc | | |
5.00% due 10/01/253,4 | 355,000 | 301,750 |
Total Consumer, Cyclical | | 11,904,109 |
| |
Industrial – 6.4% | | |
| Great Lakes Dredge & Dock Corp. | | |
8.00% due 05/15/223 | 3,450,000 | 3,631,125 |
| Grinding Media Inc. / MC Grinding Media Canada Inc. | | |
7.38% due 12/15/233,4 | 2,500,000 | 2,325,000 |
| Cleaver-Brooks, Inc. | | |
7.88% due 03/01/233,4 | 2,053,000 | 1,970,880 |
| New Enterprise Stone & Lime Company, Inc. | | |
6.25% due 03/15/264 | 950,000 | 942,875 |
| Princess Juliana International Airport Operating Company N.V. | | |
5.50% due 12/20/273,8 | 339,678 | 316,539 |
| Ardagh Packaging Finance plc / Ardagh Holdings USA, Inc. | | |
7.25% due 05/15/244 | 225,000 | 234,281 |
Total Industrial | | 9,420,700 |
| |
Basic Materials – 3.3% | | |
| Eldorado Gold Corp. | | |
6.13% due 12/15/203,4 | 2,755,000 | 2,756,377 |
| Neon Holdings, Inc. | | |
10.13% due 04/01/264 | 750,000 | 750,000 |
| Big River Steel LLC / BRS Finance Corp. | | |
7.25% due 09/01/253,4 | 600,000 | 624,000 |
| |
See notes to financial statements. |
18 l GGM l GUGGENHEIM CREDIT ALLOCATION FUND ANNUAL REPORT |
| | |
SCHEDULE OF INVESTMENTS continued | May 31, 2019 |
| |
| | Face | |
| | Amount~ | Value |
| |
CORPORATE BONDS†† – 83.7% (continued) | | |
Basic Materials – 3.3% (continued) | | |
| United States Steel Corp. | | |
| 6.88% due 08/15/25 | 600,000 | $ 519,300 |
| Mirabela Nickel Ltd. | | |
9.50% due 06/24/198,9 | 1,279,819 | 127,982 |
Total Basic Materials | | 4,777,659 |
| |
Utilities – 2.3% | | |
| LBC Tank Terminals Holding Netherlands BV | | |
6.88% due 05/15/233,4 | 3,450,000 | 3,385,313 |
Total Corporate Bonds | | |
| (Cost $128,967,657) | | 122,587,359 |
| |
SENIOR FLOATING RATE INTERESTS††,5 – 49.5% | | |
Consumer, Cyclical – 13.3% | | |
| NES Global Talent | | |
| 8.08% (3 Month USD LIBOR + 5.50%, Rate Floor: 6.50%) due 05/11/23 | 4,044,035 | 4,023,815 |
| Accuride Corp. | | |
| 7.85% (3 Month USD LIBOR + 5.25%, Rate Floor: 6.25%) due 11/17/23 | 3,773,552 | 3,386,763 |
| Alexander Mann | | |
| 6.23% (1 Month GBP LIBOR + 5.50%, Rate Floor: 5.50%) due 06/16/25 | GBP 1,150,000 | 1,399,566 |
| 7.93% (1 Month USD LIBOR + 5.50%, Rate Floor: 5.50%) due 08/11/25 | 1,300,000 | 1,248,000 |
| Comet Bidco Ltd. | | |
| 7.52% (3 Month USD LIBOR + 5.00%, Rate Floor: 6.00%) due 09/30/24 | 2,029,551 | 1,999,108 |
| BBB Industries, LLC | | |
| 6.97% (1 Month USD LIBOR + 4.50%, Rate Floor: 4.50%) due 08/01/25 | 1,795,489 | 1,788,756 |
| SMG US Midco 2, Inc. | | |
| 9.44% (1 Month USD LIBOR + 7.00%, Rate Floor: 7.00%) due 01/23/26 | 1,425,000 | 1,439,250 |
| EnTrans International, LLC | | |
| 8.44% (1 Month USD LIBOR + 6.00%, Rate Floor: 6.00%) due 11/01/24 | 1,373,750 | 1,353,144 |
| SHO Holding I Corp. | | |
| 7.58% (3 Month USD LIBOR + 5.00%, Rate Floor: 6.00%) due 10/27/22 | 595,385 | 562,639 |
| Drive Chassis (DCLI) | | |
| 10.83% (3 Month USD LIBOR + 8.25%, Rate Floor: 8.25%) due 04/10/26 | 500,000 | 480,000 |
| Nellson Nutraceutical | | |
| 6.85% (3 Month USD LIBOR + 4.25% and Commercial Prime Lending | | |
| Rate + 3.25%, Rate Floor: 5.25%) due 12/23/21 | 438,863 | 408,142 |
| Blue Nile, Inc. | | |
| 9.02% (3 Month USD LIBOR + 6.50%, Rate Floor: 7.50%) due 02/17/23 | 433,438 | 381,425 |
| American Tire Distributors, Inc. | | |
| 8.52% (3 Month USD LIBOR + 6.00%, Rate Floor: 7.00%) due 09/01/23 | 225,417 | 223,163 |
| 9.98% (1 Month USD LIBOR + 7.50%, Rate Floor: 8.50%) due 09/02/24 | 149,904 | 141,016 |
| Checkers Drive-In Restaurants, Inc. | | |
| 6.78% (1 Month USD LIBOR + 4.25% and 3 Month USD LIBOR + 4.25%, | | |
| Rate Floor: 5.25%) due 04/25/24 | 491,250 | 363,525 |
| |
See notes to financial statements. |
| GGM l GUGGENHEIM CREDIT ALLOCATION FUND ANNUAL REPORT l 19 |
| | |
SCHEDULE OF INVESTMENTS continued | May 31, 2019 |
| |
| | Face | |
| | Amount~ | Value |
| |
SENIOR FLOATING RATE INTERESTS††,5 – 49.5% (continued) | | |
Consumer, Cyclical – 13.3% (continued) | | |
| Bojangles, Inc. | | |
| 7.19% (1 Month USD LIBOR + 4.75%, Rate Floor: 4.75%) due 01/28/26 | 250,000 | $ 250,000 |
Total Consumer, Cyclical | | 19,448,312 |
| |
Technology – 11.5% | | |
| Lytx, Inc. | | |
9.19% (1 Month USD LIBOR + 6.75%, Rate Floor: 7.75%) due 08/31/23†††,1 | 3,427,128 | 3,367,074 |
| Bullhorn, Inc. | | |
9.27% (3 Month USD LIBOR + 6.75%, Rate Floor: 7.75%) due 11/21/22†††,1 | 1,952,931 | 1,944,491 |
9.28% (3 Month USD LIBOR + 6.75%, Rate Floor: 7.75%) due 11/21/22†††,1 | 467,752 | 465,730 |
| Advanced Computer Software | | |
| 7.22% (1 Month USD LIBOR + 4.75%, Rate Floor: 4.75%) due 05/31/24 | 2,334,425 | 2,329,570 |
| 24-7 Intouch, Inc. | | |
| 6.69% (1 Month USD LIBOR + 4.25%, Rate Floor: 4.25%) due 08/25/25 | 2,437,750 | 2,315,862 |
| Planview, Inc. | | |
12.19% (1 Month USD LIBOR + 9.75%, Rate Floor: 10.75%) due 07/27/23†††,1 | 2,000,000 | 2,019,121 |
| Dun & Bradstreet | | |
| 7.43% (1 Month USD LIBOR + 5.00%, Rate Floor: 5.00%) due 02/06/26 | 1,400,000 | 1,396,500 |
| Aspect Software, Inc. | | |
| 7.47% (1 Month USD LIBOR + 5.00%, Rate Floor: 6.00%) due 01/15/24 | 1,224,853 | 1,006,829 |
| Cologix Holdings, Inc. | | |
| 11.50% (Commercial Prime Lending Rate + 6.00%, Rate Floor: 7.00%) | | |
| due 03/20/25 | 750,000 | 719,535 |
| Park Place Technologies LLC | | |
| 10.44% (1 Month USD LIBOR + 8.00%, Rate Floor: 9.00%) due 03/29/26 | 680,723 | 668,810 |
| Refinitiv (Financial & Risk US Holdings, Inc.) | | |
| 6.19% (1 Month USD LIBOR + 3.75%, Rate Floor: 3.75%) due 10/01/25 | 623,438 | 607,365 |
| Targus Group International, Inc. | | |
due 05/24/16†††,1,2,9 | 383,723 | – |
Total Technology | | 16,840,887 |
| |
Industrial – 6.6% | | |
| Bhi Investments LLC | | |
11.63% (3 Month USD LIBOR + 8.75%, Rate Floor: 9.75%) due 02/28/25†††,1 | 3,000,000 | 2,962,500 |
| YAK MAT (YAK ACCESS LLC) | | |
| 12.44% (1 Month USD LIBOR + 10.00%, Rate Floor: 10.00%) due 07/10/26 | 2,425,000 | 2,091,562 |
| Berry Global, Inc. | | |
| 2.50% due 05/16/26 | 1,100,000 | 1,093,818 |
| Diversitech Holdings, Inc. | | |
| 10.10% (3 Month USD LIBOR + 7.50%, Rate Floor: 8.50%) due 06/02/25 | 1,000,000 | 977,500 |
| Bioplan USA, Inc. | | |
| 7.19% (1 Month USD LIBOR + 4.75%, Rate Floor: 5.75%) due 09/23/21 | 850,654 | 790,045 |
| National Technical | | |
8.74% (1 Month USD LIBOR + 6.25%, Rate Floor: 7.25%) due 06/12/21†††,1 | 724,869 | 701,311 |
| |
See notes to financial statements. |
20 l GGM l GUGGENHEIM CREDIT ALLOCATION FUND ANNUAL REPORT |
| | |
SCHEDULE OF INVESTMENTS continued | May 31, 2019 |
| |
| | Face | |
| | Amount~ | Value |
| |
SENIOR FLOATING RATE INTERESTS††,5 – 49.5% (continued) | | |
Industrial – 6.6% (continued) | | |
| PT Intermediate Holdings III LLC | | |
| 10.50% (1 Month USD LIBOR + 8.00%, Rate Floor: 9.00%) due 12/08/25 | 450,000 | $ 432,000 |
| Avison Young (Canada), Inc. | | |
| 7.54% (1 Month USD LIBOR + 5.00% and 2 Month USD | | |
| LIBOR + 5.00%, Rate Floor: 5.00%) due 01/31/26 | 299,250 | 293,265 |
| ProAmpac PG Borrower LLC | | |
| 11.02% (3 Month USD LIBOR + 8.50%, Rate Floor: 9.50%) due 11/18/24 | 250,000 | 235,625 |
| Wencor Group | | |
| 5.85% (1 Month USD LIBOR + 3.50% and Commercial Prime | | |
| Lending Rate + 2.50%, Rate Floor: 3.50%) due 06/19/19 | 100,000 | 99,625 |
Total Industrial | | 9,677,251 |
| |
Communications – 5.7% | | |
| Houghton Mifflin Co. | | |
| 5.44% (1 Month USD LIBOR + 3.00%, Rate Floor: 4.00%) due 05/28/21 | 3,375,404 | 3,229,147 |
| Flight Bidco, Inc. | | |
| 9.94% (1 Month USD LIBOR + 7.50%, Rate Floor: 7.50%) due 07/23/26 | 2,415,000 | 2,372,737 |
| Cengage Learning Acquisitions, Inc. | | |
| 6.68% (1 Month USD LIBOR + 4.25%, Rate Floor: 5.25%) due 06/07/23 | 1,533,906 | 1,458,576 |
| Resource Label Group LLC | | |
| 11.09% (3 Month USD LIBOR + 8.50%, Rate Floor: 9.50%) due 11/26/23 | 850,000 | 790,500 |
| Mcgraw-Hill Global Education Holdings LLC | | |
| 6.44% (1 Month USD LIBOR + 4.00%, Rate Floor: 5.00%) due 05/04/22 | 289,294 | 274,332 |
| Imagine Print Solutions LLC | | |
| 7.19% (1 Month USD LIBOR + 4.75%, Rate Floor: 5.75%) due 06/21/22 | 269,500 | 230,422 |
Total Communications | | 8,355,714 |
| |
Energy – 5.5% | | |
| SeaPort Financing LLC | | |
| 7.94% (1 Month USD LIBOR + 5.50%, Rate Floor: 5.50%) due 10/31/25 | 2,574,250 | 2,548,508 |
| Gavilan Resources LLC | | |
| 8.43% (1 Month USD LIBOR + 6.00%, Rate Floor: 7.00%) due 03/01/24 | 3,280,000 | 2,431,300 |
| Permian Production Partners LLC | | |
| 8.43% (1 Month USD LIBOR + 6.00%, Rate Floor: 7.00%) due 05/20/24 | 2,021,250 | 1,859,550 |
| Summit Midstream Partners, LP | | |
| 8.44% (1 Month USD LIBOR + 6.00%, Rate Floor: 7.00%) due 05/13/22 | 1,248,877 | 1,236,388 |
Total Energy | | 8,075,746 |
| |
Consumer, Non-cyclical – 4.5% | | |
| Springs Window Fashions | | |
| 10.93% (1 Month USD LIBOR + 8.50%, Rate Floor: 8.50%) due 06/15/26 | 2,900,000 | 2,762,250 |
| Immucor, Inc. | | |
| 7.60% (3 Month USD LIBOR + 5.00%, Rate Floor: 6.00%) due 06/15/21 | 1,179,000 | 1,173,105 |
| Moran Foods LLC | | |
| 8.60% (3 Month USD LIBOR + 6.00%, Rate Floor: 7.00%) due 12/05/23 | 1,904,067 | 987,735 |
| |
See notes to financial statements. |
| GGM l GUGGENHEIM CREDIT ALLOCATION FUND ANNUAL REPORT l 21 |
| | |
SCHEDULE OF INVESTMENTS continued | May 31, 2019 |
| |
| | Face | |
| | Amount~ | Value |
| |
SENIOR FLOATING RATE INTERESTS††,5 – 49.5% (continued) | | |
Consumer, Non-cyclical – 4.5% (continued) | | |
| CTI Foods Holding Co. LLC | | |
| 9.58% (3 Month USD LIBOR + 7.00%, Rate Floor: 8.00%) due 05/03/24 | 628,197 | $ 628,197 |
| 10.58% (3 Month USD LIBOR + 8.00%, Rate Floor: 9.00%) due 05/03/24 | 90,768 | 86,230 |
| ScribeAmerica Intermediate Holdco LLC (Healthchannels) | | |
| 6.97% (1 Month USD LIBOR + 4.50%, Rate Floor: 4.50%) due 04/03/25 | 643,997 | 636,752 |
| Acosta, Inc. | | |
| 5.41% (1 Month USD LIBOR + 3.25% and Commercial Prime Lending | | |
| Rate + 2.25%, Rate Floor: 3.25%) due 09/26/19 | 763,590 | 315,462 |
Total Consumer, Non-cyclical | | 6,589,731 |
| |
Basic Materials – 1.4% | | |
| US Salt LLC | | |
| 7.19% (1 Month USD LIBOR + 4.75%, Rate Floor: 4.75%) due 01/16/26 | 1,000,000 | 997,500 |
| Big River Steel LLC | | |
| 7.60% (3 Month USD LIBOR + 5.00%, Rate Floor: 6.00%) due 08/23/23 | 543,740 | 544,419 |
| Ranpak | | |
| 9.69% (1 Month USD LIBOR + 7.25%, Rate Floor: 8.25%) due 10/03/22 | 536,667 | 532,642 |
Total Basic Materials | | 2,074,561 |
| |
Utilities – 0.7% | | |
| MRP Generation Holding | | |
| 9.60% (3 Month USD LIBOR + 7.00%, Rate Floor: 8.00%) due 10/18/22 | 731,250 | 723,938 |
| Stonewall | | |
| 8.10% (3 Month USD LIBOR + 5.50%, Rate Floor: 6.50%) due 11/13/21 | 324,754 | 315,011 |
Total Utilities | | 1,038,949 |
| |
Financial – 0.3% | | |
| Aretec Group, Inc. | | |
| 6.69% (1 Month USD LIBOR + 4.25%, Rate Floor: 4.25%) due 10/01/25 | 249,375 | 245,011 |
| JZ Capital Partners Ltd. | | |
8.35% (3 Month USD LIBOR + 5.75%, Rate Floor: 6.75%) due 06/14/21†††,1 | 100,000 | 99,661 |
Total Financial | | 344,672 |
Total Senior Floating Rate Interests | | |
| (Cost $74,844,933) | | 72,445,823 |
| |
See notes to financial statements. |
22 l GGM l GUGGENHEIM CREDIT ALLOCATION FUND ANNUAL REPORT |
| | |
SCHEDULE OF INVESTMENTS continued | May 31, 2019 |
| |
| | Face | |
| | Amount~ | Value |
| |
ASSET-BACKED SECURITIES†† – 2.8% | | |
Collateralized Loan Obligations – 1.6% | | |
| Monroe Capital CLO Ltd. | | |
| 2017-1A, 6.19% (3 Month USD LIBOR + 3.60%, | | |
Rate Floor: 0.00%) due 10/22/264,5 | 1,000,000 | $ 976,755 |
| FDF I Ltd. | | |
2015-1A, 6.88% due 11/12/303,4 | 500,000 | 499,370 |
| Treman Park CLO Ltd. | | |
2015-1A, due 10/20/283,4,10 | 500,000 | 434,608 |
| Dryden 41 Senior Loan Fund | | |
2015-41A, due 04/15/314,10 | 600,000 | 393,000 |
| Babson CLO Ltd. | | |
2012-2A, due 05/15/233,4,10 | 1,000,000 | 12,200 |
Total Collateralized Loan Obligations | | 2,315,933 |
| |
Collateralized Debt Obligations – 0.7% | | |
| Anchorage Credit Funding 1 Ltd. | | |
2015-1A, 6.30% due 07/28/304 | 1,000,000 | 990,275 |
| |
Transport-Aircraft – 0.3% | | |
| Apollo Aviation Securitization Equity Trust | | |
| 2016-2, 7.87% due 11/15/41 | 206,415 | 206,550 |
| Turbine Engines Securitization Ltd. | | |
2013-1A, 6.38% due 12/13/483,8 | 209,196 | 180,888 |
Total Transport-Aircraft | | 387,438 |
| |
Financial – 0.2% | | |
| NCBJ | | |
2015-1A, 5.88% due 07/08/22†††,1,3 | 341,318 | 343,748 |
Total Asset-Backed Securities | | |
| (Cost $4,075,230) | | 4,037,394 |
Total Investments – 138.4% | | |
| (Cost $213,962,423) | | $ 202,612,321 |
Other Assets & Liabilities, net – (38.4)% | | (56,182,454) |
Total Net Assets – 100.0% | | $ 146,429,867 |
FORWARD FOREIGN CURRENCY EXCHANGE CONTRACTS
| | | | | | | | | | | | | | | |
| | | | | | | | | | | Value at | | | Net | |
| | | | | | Settlement | | Settlement | | | May 31, | | | Unrealized | |
Counterparty | | Contracts to Sell | | Currency | Date | | Value | | | 2019 | | | Appreciation | |
| Bank of America, N.A. | | | 1,124,000 | | GBP | 06/14/19 | | $ | 1,466,722 | | | $ | 1,421,988 | | | $ | 44,734 | |
| | |
See notes to financial statements. | |
| | GGM l GUGGENHEIM CREDIT ALLOCATION FUND ANNUAL REPORT l 23 |
| | |
SCHEDULE OF INVESTMENTS continued | May 31, 2019 |
| | |
| ~ | The face amount is denominated in U.S. dollars unless otherwise indicated. |
| * | Non-income producing security. |
| † | Value determined based on Level 1 inputs, unless otherwise noted — See Note 6. |
| †† | Value determined based on Level 2 inputs, unless otherwise noted — See Note 6. |
| ††† | Value determined based on Level 3 inputs — See Note 6. |
| 1 | Security was fair valued by the Valuation Committee at May 31, 2019. The total market value of fair valued securities amounts to $12,443,404, (cost $12,998,177) or 8.5% of total net assets. |
| 2 | Affiliated issuer. |
| 3 | All or a portion of these securities have been physically segregated in connection with borrowings, reverse repurchase agreements and unfunded loan commitments. As of May 31, 2019, the total value of securities segregated was $70,304,529. |
| 4 | Security is a 144A or Section 4(a)(2) security. These securities have been determined to be liquid under guidelines established by the Board of Trustees. The total market value of 144A or Section 4(a)(2) securities is $91,809,950 (cost $95,255,271), or 62.7% of total net assets. |
| 5 | Variable rate security. Rate indicated is the rate effective at May 31, 2019. In some instances, the effective rate is limited by a minimum rate floor or a maximum rate cap established by the issuer. The settlement status of a position may also impact the effective rate indicated. In some cases, a position may be unsettled at period end and may not have a stated effective rate. In instances where multiple underlying reference rates and spread amounts are shown, the effective rate is based on a weighted average. |
| 6 | Perpetual maturity. |
| 7 | Security has a fixed rate coupon which will convert to a floating or variable rate coupon on a future date. |
| 8 | Security is a 144A or Section 4(a)(2) security. These securities have been determined to be illiquid and restricted under guidelines established by the Board of Trustees. The total market value of 144A or Section 4(a)(2) illiquid and restricted securities is $4,029,284 (cost $6,004,570), or 2.8% of total net assets — See Note 12. |
| 9 | Security is in default of interest and/or principal obligations. |
| 10 | Security has no stated coupon. However, it is expected to receive residual cash flow payments on defined deal dates. |
| | |
| GBP | British Pound |
| LIBOR | London Interbank Offered Rate |
| plc | Public Limited Company |
See Sector Classification in Other Information section.
| |
See notes to financial statements. |
24 l GGM l GUGGENHEIM CREDIT ALLOCATION FUND ANNUAL REPORT |
| | |
SCHEDULE OF INVESTMENTS continued | May 31, 2019 |
The following table summarizes the inputs used to value the Fund’s investments at May 31, 2019 (See Note 6 in the Notes to Financial Statements):
| | | | | | | | | | | | | |
| | | | | | Level 2 | | | Level 3 | | | | |
| | | | | | Significant | | | Significant | | | | |
| | | Level 1 | | | Observable | | | Unobservable | | | | |
Investments in Securities (Assets) | | Quoted Prices | | | Inputs | | | Inputs | | | Total | |
| Common Stocks | | $ | 400,700 | | | $ | 2,601,277 | | | $ | 539,768 | | | $ | 3,541,745 | |
| Corporate Bonds | | | — | | | | 121,912,580 | | | | 674,779 | | | | 122,587,359 | |
| Senior Floating Rate Interests | | | — | | | | 60,885,935 | | | | 11,559,888 | | | | 72,445,823 | |
| Asset-Backed Securities | | | — | | | | 3,693,646 | | | | 343,748 | | | | 4,037,394 | |
| Forward Foreign Currency Exchange Contracts* | | | — | | | | 44,734 | | | | — | | | | 44,734 | |
| Total Assets | | $ | 400,700 | | | $ | 189,138,172 | | | $ | 13,118,183 | | | $ | 202,657,055 | |
| | |
| | | | | | Level 2 | | | Level 3 | | | | |
| | | | | | Significant | | | Significant | | | | |
| | | Level 1 | | | Observable | | | Unobservable | | | | |
Investments in Securities (Liabilities) | | Quoted Prices | | | Inputs | | | Inputs | | | Total | |
| Unfunded Loan Commitments (Note 11) | | $ | — | | | $ | 849,116 | | | $ | 280,602 | | | $ | 1,129,718 | |
| | |
* This derivative is reported as unrealized appreciation/depreciation at period end. |
Please refer to Schedule of Investments for a breakdown of investment type by industry category.
The Fund may hold assets and/or liabilities in which the fair value approximates the carrying amount for financial statement purposes. As of the period end, reverse repurchase agreements of $54,982,491 are categorized as Level 2 within the disclosure hierarchy. See Note 7.
The following is a summary of the significant unobservable input used in the fair valuation of assets and liabilities categorized within the Level 3 of the fair value hierarchy.
| | | | | | |
Ending Balance at | Valuation | Unobservable | Input | Weighted |
Category | May 31, 2019 | Technique | Inputs | Range | Average* |
Assets: | | | | | |
| Asset-Backed Securities | $ 343,748 | Yield Analysis | Yield | 5.8% | — |
| Common Stocks | 539,768 | Enterprise Value | Valuation Multiple | 1.8x-8.2x | 7.0x |
| Corporate Bonds | 674,779 | Option Adjusted | Indicative Quote | — | — |
| | | Spread off | | | |
| | | prior month | | | |
| | | broker quote | | | |
| Senior Floating Rate Interests | 5,876,956 | Yield Analysis | Yield | 8.6%-9.8% | 9.6% |
| Senior Floating Rate Interests | 3,663,811 | Model Price | Market Comparable Yields | 6.5%-10.5% | 9.7% |
| Senior Floating Rate Interests | 2,019,121 | Model Price | Liquidation Value | — | — |
Total | $13,118,183 | | | | |
Liabilities: | | | | | |
| Unfunded Loan Commitments | $ 280,602 | Model Price | Purchase Price | — | — |
| |
| * Inputs are weighted by the fair value of the instruments. |
| | |
See notes to financial statements. | |
| | GGM l GUGGENHEIM CREDIT ALLOCATION FUND ANNUAL REPORT l 25 |
| | |
SCHEDULE OF INVESTMENTS continued | May 31, 2019 |
Significant changes in an indicative quote, yield, market comparable yields, liquidation value or valuation multiple would generally result in significant changes in the fair value of the security.
Transfers between Level 2 and Level 3 may occur as markets fluctuate and/or the availability of data used in an investment’s valuation changes. For the year ended May 31, 2019, the Fund had securities with a total value of $2,962,500 transfer into Level 3 from Level 2 due to lack of observable inputs and had securities with a total market value of $99,625 transfer out of Level 3 to Level 2 due to the availability of current and reliable market-based data provided by a third-party pricing service which utilizes significant observable inputs. For the year ended May 31, 2019, the Fund had liabilities with a total value of $123,504 transfer from Level 3 to Level 2 due to availability of market price information at year end.
Summary of Fair Value Level 3 Activity
Following is a reconciliation of Level 3 assets and liabilities for which significant unobservable inputs were used to determine fair value for the year ended May 31, 2019:
| | | | | | | | | | | | | | | | | | | |
| | | Assets | | | | | | Liabilities | |
| | | | | | | | | Senior | | | | | | | | | | |
| | | Asset- | | | | | | Floating | | | | | | | | | Unfunded | |
| | | Backed | | | Corporate | | | Rate | | | Common | | | Total | | | Loan | |
| | | Securities | | | Bonds | | | Interests | | | Stocks | | | Assets | | | Commitments | |
| Assets: | | | | | | | | | | | | | | | | | | |
| Beginning Balance | | $ | 1,430,016 | | | $ | 687,359 | | | $ | 11,750,092 | | | $ | 283,937 | | | $ | 14,151,404 | | | $ | (175,354 | ) |
| Purchases/(Receipts) | | | – | | | | 87 | | | | 1,372,602 | | | | 407,213 | | | | 1,779,902 | | | | (648,083 | ) |
| (Sales, maturities and | | | | | | | | | | | | | | | | | | | | | | | | |
| paydowns)/Fundings | | | (1,102,654 | ) | | | (5,825 | ) | | | (4,272,755 | ) | | | (11,827 | ) | | | (5,393,061 | ) | | | 179,675 | |
| Amortization of | | | | | | | | | | | | | | | | | | | | | | | | |
| premiums/discount | | | – | | | | – | | | | 82,211 | | | | – | | | | 82,211 | | | | (13,750 | ) |
| Total realized gains (losses) | | | | | | | | | | | | | | | | | | | | | | | | |
| included in earnings | | | 10,000 | | | | 5,262 | | | | (234,542 | ) | | | (1,503,423 | ) | | | (1,722,703 | ) | | | 510,010 | |
| Total change in unrealized | | | | | | | | | | | | | | | | | | | | | | | | |
| appreciation (depreciation) | | | | | | | | | | | | | | | | | | | | | | | | |
| included in earnings | | | 6,386 | | | | (12,104 | ) | | | (595 | ) | | | 1,363,868 | | | | 1,357,555 | | | | (256,604 | ) |
| Transfers into Level 3 | | | – | | | | – | | | | 2,962,500 | | | | – | | | | 2,962,500 | | | | – | |
| Transfers out of Level 3 | | | – | | | | – | | | | (99,625 | ) | | | – | | | | (99,625 | ) | | | 123,504 | |
| Ending Balance | | $ | 343,748 | | | $ | 674,779 | | | $ | 11,559,888 | | | $ | 539,768 | | | $ | 13,118,183 | | | $ | (280,602 | ) |
| Net change in unrealized | | | | | | | | | | | | | | | | | | | | | | | | |
| appreciation (depreciation) | | | | | | | | | | | | | | | | | | | | | | | | |
| for investments in Level 3 | | | | | | | | | | | | | | | | | | | | | | | | |
| securities still held | | | | | | | | | | | | | | | | | | | | | | | | |
| at May 31, 2019 | | $ | 3,136 | | | $ | (6,842 | ) | | $ | 19,053 | | | $ | 2,164 | | | $ | 17,511 | | | $ | 70,801 | |
Affiliated Transactions
Investments representing 5% or more of the outstanding voting shares of a company, or control of or by, or common control under Guggenheim Investments (“GI”), result in that company being considered an affiliated issuer, as defined in the 1940 Act.
| |
See notes to financial statements. |
26 l GGM l GUGGENHEIM CREDIT ALLOCATION FUND ANNUAL REPORT |
| | |
SCHEDULE OF INVESTMENTS continued | May 31, 2019 |
Transactions during the year ended May 31, 2019, in which the company is an affiliated issuer, were as follows:
| | | | | | | | | | | | | | | | | | | | | | | | | |
| | | | | | | | | | | | | | | Change in | | | | | | Shares/ | | | | |
| | | | | | | | | | | | Realized | | | Unrealized | | | | | | Face | | | | |
| | | Value | | | | | | | | | Gain | | | Appreciation | | | Value | | | Amount | | | Investment | |
Security Name | | 05/31/18 | | | Additions | | | Reductions | | | (Loss) | | | (Depreciation) | | | 05/31/19 | | | 05/31/19 | | | Income | |
Common Stock | | | | | | | | | | | | | | | | | | | | | | | | |
| Aspect Software | | | | | | | | | | | | | | | | | | | | | | | | |
| Parent, Inc.* | | $ | 141,720 | | | $ | – | | | $ | – | | | $ | (1,503,424 | ) | | $ | 1,361,704 | | | $ | – | | | | – | | | $ | – | |
| Targus Group | | | | | | | | | | | | | | | | | | | | | | | | | | | | | | | | |
| International | | | | | | | | | | | | | | | | | | | | | | | | | | | | | | | | |
Equity, Inc.1 | | | 83,725 | | | | – | | | | (11,827 | ) | | | – | | | | (1,516 | ) | | | 70,382 | | | | 32,060 | | | | 2,862 | |
BP Holdco LLC*,†††,1 | | | – | | | | 23,292 | | | | – | | | | – | | | | – | | | | 23,292 | | | | 66,965 | | | | – | |
Senior Floating | | | | | | | | | | | | | | | | | | | | | | | | | | | | | | | | |
Rate Interests | | | | | | | | | | | | | | | | | | | | | | | | | | | | | | | | |
| Aspect Software, Inc. | | | | | | | | | | | | | | | | | | | | | | | | | | | | | | | | |
| 12.98% (1 Month USD | | | | | | | | | | | | | | | | | | | | | | | | | | | | | | | | |
| LIBOR + 10.50%) | | | | | | | | | | | | | | | | | | | | | | | | | | | | | | | | |
due 06/29/183 | | | 536,250 | | | | 182,750 | | | | (540,405 | ) | | | (178,595 | ) | | | – | | | | – | | | | – | | | | 2,610 | |
| Aspect Software, Inc. | | | | | | | | | | | | | | | | | | | | | | | | | | | | | | | | |
| 13.05% (2 Month USD | | | | | | | | | | | | | | | | | | | | | | | | | | | | | | | | |
| LIBOR + 10.50%) | | | | | | | | | | | | | | | | | | | | | | | | | | | | | | | | |
due 05/25/203 | | | 1,199,287 | | | | 24,939 | | | | (897,978 | ) | | | (382,102 | ) | | | 55,854 | | | | – | | | | – | | | | 137,961 | |
| Targus Group | | | | | | | | | | | | | | | | | | | | | | | | | | | | | | | | |
| International, Inc. | | | | | | | | | | | | | | | | | | | | | | | | | | | | | | | | |
due 05/24/161,2,3 | | | – | ** | | | – | | | | – | | | | – | | | | – | | | | – | ** | | | 383,723 | | | | – | |
| | | $ | 1,960,982 | | | $ | 230,981 | | | $ | (1,450,210 | ) | | $ | (2,064,121 | ) | | $ | 1,416,042 | | | $ | 93,674 | | | | | | | $ | 143,433 | |
| | |
| * | Non-income producing security. |
| ** | Market value is less than $1. |
1 | Security was fair valued by the Valuation Committee at May 31, 2019. The total market value of fair valued and affiliated securities amounts to $93,674, (cost $401,435) or less than 0.1% of total net assets. |
2 | Security is in default of interest and/or principal obligations. |
3 | Variable rate security. Rate indicated is the rate effective at May 31, 2019. In some instances, the effective rate is limited by a minimum rate floor or a maximum rate cap established by the issuer. The settlement status of a position may also impact the effective rate indicated. In some cases, a position may be unsettled at period end and may not have a stated effective rate. In instances where multiple underlying reference rates and spread amounts are shown, the effective rate is based on a weighted average. |
| | |
See notes to financial statements. | |
| | GGM l GUGGENHEIM CREDIT ALLOCATION FUND ANNUAL REPORT l 27 |
| | |
STATEMENT OF ASSETS AND LIABILITIES | May 31, 2019 |
| |
ASSETS: | | | |
| Investments in unaffiliated issuers, at value (cost $213,560,989) | | $ | 202,518,647 | |
| Investments in affiliated issuers, at value (cost $401,434) | | | 93,674 | |
| Cash | | | 914,515 | |
| Unrealized appreciation on forward foreign currency exchange contracts | | | 44,734 | |
| Prepaid expenses | | | 4,269 | |
| Receivables: | | | | |
| Interest | | | 2,887,710 | |
| Investments sold | | | 1,150,762 | |
| Fund shares sold | | | 120,397 | |
| Tax reclaims | | | 11,281 | |
Total assets | | | 207,745,989 | |
LIABILITIES: | | | | |
| Reverse repurchase agreements (Note 7) | | | 54,982,491 | |
| Unfunded loan commitments, at value (Note 11) (commitment fees received $688,242) | | | 1,129,718 | |
| Payable for: | | | | |
| Investments purchased | | | 4,854,077 | |
| Investment advisory fees | | | 175,223 | |
| Professional fees | | | 100,647 | |
| Printing fees | | | 21,643 | |
| Trustees’ fees and expenses* | | | 19,568 | |
| Offering costs | | | 4,471 | |
| Accrued expenses and other liabilities | | | 28,284 | |
Total liabilities | | | 61,316,122 | |
NET ASSETS | | $ | 146,429,867 | |
NET ASSETS CONSIST OF: | | | | |
| Common stock, $0.01 par value per share; unlimited number of shares authorized, | | | | |
| 7,411,671 shares issued and outstanding | | $ | 74,117 | |
| Additional paid-in capital | | | 173,542,830 | |
| Total distributable earnings (loss) | | | (27,187,080 | ) |
NET ASSETS | | $ | 146,429,867 | |
| Shares outstanding ($0.01 par value with unlimited amount authorized) | | | 7,411,671 | |
| Net asset value | | $ | 19.76 | |
* Relates to Trustees not deemed “interested persons” within the meaning of Section 2(a)(19) of the 1940 Act.
| |
See notes to financial statements. |
28 l GGM l GUGGENHEIM CREDIT ALLOCATION FUND ANNUAL REPORT |
| | |
STATEMENT OF OPERATIONS | May 31, 2019 |
| For the Year Ended May 31, 2019 | |
INVESTMENT INCOME: | | | |
| Interest from securities of unaffiliated issuers | | $ | 18,211,571 | |
| Interest from securities of affiliated issuers | | | 140,571 | |
| Dividends from securities of unaffiliated issuers | | | 178,020 | |
| Dividends from securities of affiliated issuers | | | 2,862 | |
| Total investment income | | | 18,533,024 | |
EXPENSES: | | | | |
| Investment advisory fees | | | 2,183,676 | |
| Interest expense | | | 1,835,428 | |
| Professional fees | | | 144,745 | |
| Fund accounting fees | | | 68,904 | |
| Trustees’ fees and expenses* | | | 66,065 | |
| Administration fees | | | 58,674 | |
| Printing fees | | | 40,134 | |
| Custodian fees | | | 33,305 | |
| Registration and filing fees | | | 25,915 | |
| Transfer agent fees | | | 18,212 | |
| Insurance | | | 8,071 | |
| Miscellaneous | | | 8,369 | |
| Total expenses | | | 4,491,498 | |
| Net investment income | | | 14,041,526 | |
NET REALIZED AND UNREALIZED GAIN (LOSS): | | | | |
| Net realized gain (loss) on: | | | | |
| Investments in unaffiliated issuers | | | (5,328,485 | ) |
| Investments in affiliated issuers | | | (2,064,121 | ) |
| Foreign currency transactions | | | (65,830 | ) |
| Forward foreign currency exchange contracts | | | 516,545 | |
| Net realized loss | | | (6,941,891 | ) |
| Net change in unrealized appreciation (depreciation) on: | | | | |
| Investments in unaffiliated issuers | | | (5,008,538 | ) |
| Investments in affiliated issuers | | | 1,416,042 | |
| Foreign currency translations | | | (45,544 | ) |
| Forward foreign currency exchange contracts | | | (73,407 | ) |
| Net change in unrealized appreciation (depreciation) | | | (3,711,447 | ) |
| Net realized and unrealized loss | | | (10,653,338 | ) |
Net increase in net assets resulting from operations | | $ | 3,388,188 | |
* Relates to Trustees not deemed “interested persons” within the meaning of Section 2(a)(19) of the 1940 Act.
| | |
See notes to financial statements. | |
| | GGM l GUGGENHEIM CREDIT ALLOCATION FUND ANNUAL REPORT l 29 |
| | |
STATEMENTS OF CHANGES IN NET ASSETS | May 31, 2019 |
| |
| | | Year Ended | | | Year Ended | |
| | | May 31, 2019 | | | May 31, 2018 | |
INCREASE (DECREASE) IN NET ASSETS FROM OPERATIONS: | | | | | | |
| Net investment income | | $ | 14,041,526 | | | $ | 15,004,221 | |
| Net realized loss on investments | | | (6,941,891 | ) | | | (1,459,536 | ) |
| Net change in unrealized appreciation (depreciation) on investments | | | (3,711,447 | ) | | | (6,160,635 | ) |
| Net increase in net assets resulting from operations | | | 3,388,188 | | | | 7,384,050 | |
DISTRIBUTIONS: | | | | | | | | |
| Distributions to shareholders | | | (14,522,749 | ) | | | (15,894,021 | )1 |
| Return of capital | | | (1,526,197 | ) | | | — | |
| Total Distributions | | | (16,048,946 | ) | | | (15,894,021 | ) |
SHAREHOLDER TRANSACTIONS: | | | | | | | | |
| Net proceeds from shares issued through at-the-market offering | | | 550,344 | | | | 7,861,417 | |
| Reinvestments of distributions | | | 310,093 | | | | 270,101 | |
| Common share offering costs charged to paid-in-capital | | | (3,353 | ) | | | (50,569 | ) |
| Net increase in net assets resulting from shareholder transactions | | | 857,084 | | | | 8,080,949 | |
| Net decrease in net assets | | | (11,803,674 | ) | | | (429,022 | ) |
NET ASSETS: | | | | | | | | |
| Beginning of period | | | 158,233,541 | | | | 158,662,563 | |
| End of period | | $ | 146,429,867 | | | $ | 158,233,541 | |
| | |
| 1 | For the year ended May 31, 2018, the total distributions to shareholders were all from net investment income (see Note 15). |
| |
See notes to financial statements. |
30 l GGM l GUGGENHEIM CREDIT ALLOCATION FUND ANNUAL REPORT |
| | |
STATEMENT OF CASH FLOWS | May 31, 2019 |
| For the Year Ended May 31, 2019 | |
| |
Cash Flows from Operating Activities: | | | |
| Net Increase in net assets resulting from operations | | $ | 3,388,188 | |
Adjustments to Reconcile Net Increase in Net Assets Resulting from Operations to | | | | |
Net Cash Provided by Operating and Investing Activities: | | | | |
| Net change in unrealized (appreciation) depreciation on investments | | | 3,592,496 | |
| Net change in unrealized (appreciation) depreciation on forward | | | | |
| foreign currency exchange contracts | | | 73,407 | |
| Net realized loss on investments | | | 7,392,606 | |
| Net accretion of bond discount and amortization of bond premium | | | (1,231,973 | ) |
| Purchase of long-term investments | | | (111,952,009 | ) |
| Proceeds from sale of long-term investments | | | 133,221,175 | |
| Net sales of short-term investments | | | 1,647,954 | |
| Corporate actions in other payments | | | 59,521 | |
| Decrease in interest receivable | | | 211,355 | |
| Decrease in investments sold receivable | | | 896,022 | |
| Increase in tax reclaims receivable | | | (8,735 | ) |
| Decrease in prepaid expenses | | | 2,373 | |
| Decrease in investments purchased payable | | | (5,011,501 | ) |
| Decrease in segregated cash due to broker | | | (240,000 | ) |
| Commitment fees received and repayments of unfunded commitments | | | 815,301 | |
| Loan commitment fundings | | | (381,608 | ) |
| Increase in printing fees payable | | | 21,643 | |
| Increase in trustees’ fees and expenses payable* | | | 8,130 | |
| Decrease in investment advisory fees payable | | | (23,914 | ) |
| Increase in professional fees payable | | | 30,238 | |
| Increase in accrued expenses and other liabilities | | | 5,710 | |
| Net Cash Provided by Operating and Investing Activities | | $ | 32,516,379 | |
Cash Flows From Financing Activities: | | | | |
| Net proceeds from the issuance of common shares | | | 429,947 | |
| Distributions to common shareholders | | | (15,738,853 | ) |
| Proceeds from reverse repurchase agreements | | | 810,221,476 | |
| Payments made on reverse repurchase agreements | | | (827,157,842 | ) |
| Offering costs in connection with the issuance of common shares | | | (24,001 | ) |
| Net Cash Used in Financing Activities | | | (32,269,273 | ) |
| Net increase in cash | | | 247,106 | |
Cash at Beginning of Year (including restricted cash) | | | 667,409 | |
Cash at End of Year | | $ | 914,515 | |
Supplemental Disclosure of Cash Flow Information: Cash paid during the year for interest | | $ | 1,849,255 | |
Supplemental Disclosure of Non Cash Financing Activity: Dividend reinvestment | | $ | 310,093 | |
* Relates to Trustees not deemed “interested persons” within the meaning of Section 2(a)(19) of the 1940 Act.
| | |
See notes to financial statements. | |
| | GGM l GUGGENHEIM CREDIT ALLOCATION FUND ANNUAL REPORT l 31 |
| | |
FINANCIAL HIGHLIGHTS | May 31, 2019 |
| | | | | | | | | | | | | | | | |
| | | Year Ended | | | Year Ended | | | Year Ended | | | Year Ended | | | Year Ended | |
| | | May 31, 2019 | | | May 31, 2018 | | | May 31, 2017 | | | May 31, 2016 | | | May 31, 2015 | |
Per Share Data: | | | | | | | | | | | | | | | |
| Net asset value, beginning of period | | $ | 21.47 | | | $ | 22.62 | | | $ | 20.53 | | | $ | 23.34 | | | $ | 24.71 | |
| Income from investment operations: | | | | | | | | | | | | | | | | | | | | |
Net investment income(a) | | | 1.90 | | | | 2.05 | | | | 1.91 | | | | 2.02 | | | | 1.95 | |
| Net gain (loss) on investments (realized and unrealized) | | | (1.43 | ) | | | (1.02 | ) | | | 2.36 | | | | (2.65 | ) | | | (1.16 | ) |
| Total from investment operations | | | 0.47 | | | | 1.03 | | | | 4.27 | | | | (0.63 | ) | | | 0.79 | |
| Less distributions from: | | | | | | | | | | | | | | | | | | | | |
| Net investment income | | | (1.97 | ) | | | (2.18 | ) | | | (2.18 | ) | | | (2.18 | ) | | | (1.57 | ) |
| Capital gains | | | — | | | | — | | | | — | | | | — | | | | (0.59 | ) |
| Return of capital | | | (0.21 | ) | | | — | | | | — | | | | — | | | | — | |
| Total distributions to shareholders | | | (2.18 | ) | | | (2.18 | ) | | | (2.18 | ) | | | (2.18 | ) | | | (2.16 | ) |
| Net asset value, end of period | | $ | 19.76 | | | $ | 21.47 | | | $ | 22.62 | | | $ | 20.53 | | | $ | 23.34 | |
| Market value, end of period | | $ | 20.52 | | | $ | 22.70 | | | $ | 23.18 | | | $ | 19.86 | | | $ | 23.07 | |
| | |
Total Return(b) | | | | | | | | | | | | | | | | | | | | |
| Net asset value | | | 2.47 | % | | | 4.68 | % | | | 21.55 | % | | | (2.31 | )% | | | 3.45 | % |
| Market value | | | 0.62 | % | | | 7.99 | % | | | 28.83 | % | | | (4.00 | )% | | | 2.54 | % |
Ratios/Supplemental Data: | | | | | | | | | | | | | | | | | | | | |
| Net assets, end of period (in thousands) | | $ | 146,430 | | | $ | 158,234 | | | $ | 158,663 | | | $ | 136,142 | | | $ | 154,753 | |
| Ratio to average net assets of: | | | | | | | | | | | | | | | | | | | | |
| Net investment income including interest expense | | | 9.34 | % | | | 9.24 | % | | | 8.67 | % | | | 9.68 | % | | | 8.23 | % |
Total expenses, including interest expense(c) | | | 2.99 | % | | | 2.61 | % | | | 2.52 | % | | | 2.27 | % | | | 2.04 | % |
| Portfolio turnover rate | | | 52 | % | | | 46 | % | | | 47 | % | | | 63 | % | | | 55 | % |
See notes to financial statements.
32 l GGM l GUGGENHEIM CREDIT ALLOCATION FUND ANNUAL REPORT| | |
FINANCIAL HIGHLIGHTS continued | May 31, 2019 |
| | | | | | | | | | | | | | | | |
| | | Year Ended | | | Year Ended | | | Year Ended | | | Year Ended | | | Year Ended | |
| | | May 31, 2019 | | | May 31, 2018 | | | May 31, 2017 | | | May 31, 2016 | | | May 31, 2015 | |
Senior Indebtedness: | | | | | | | | | | | | | | | |
| Borrowings – committed facility agreement (in thousands) | | | N/A | | | | N/A | | | $ | 4,500 | | | | N/A | | | | N/A | |
Asset Coverage per $1,000 of borrowings(d) | | | N/A | | | | N/A | | | $ | 36,258 | | | | N/A | | | | N/A | |
Supplemental asset coverage per $1,000 of borrowings(e) | | | N/A | | | | N/A | | | $ | 49,871 | | | | N/A | | | | N/A | |
| | |
| (a) | Based on average shares outstanding. |
| (b) | Total return is calculated assuming a purchase of a common share at the beginning of the period and a sale on the last day of the period reported either at net asset value (“NAV”) or market price per share. Dividends and distribution are assumed to be reinvested at NAV for NAV returns or the prices obtained under the Fund’s Dividend Reinvestment Plan for market value returns. Total investment return does not reflect brokerage commissions. |
| (c) | Excluding interest expense, the annualized operation expense ratios would be 1.77%, 1.75%, 1.88%, 1.82% and 1.76% for the years ended May 31, 2019, May 31, 2018, May 31, 2017, May 31, 2016 and May 31, 2015, respectively. |
| (d) | Calculated by subtracting the Fund’s total liabilities (not including borrowings) from the Fund’s total assets and dividing by the borrowings. |
| (e) | Calculated by subtracting the Fund’s total liabilities (not including the borrowings or reverse repurchase agreements) from the Fund’s total assets and dividing by the borrowings. |
See notes to financial statements.
GGM l GUGGENHEIM CREDIT ALLOCATION FUND ANNUAL REPORT l 33| | |
NOTES TO FINANCIAL STATEMENTS | May 31, 2019 |
Note 1 – Organization
Guggenheim Credit Allocation Fund (the “Fund”) was organized as a Delaware statutory trust on June 7, 2012, and commenced investment operations on June 26, 2013. The Fund is registered as a diversified, closed-end management investment company under the Investment Company Act of 1940, as amended (the “1940 Act”).
The Fund’s investment objective is to seek total return through a combination of current income and capital appreciation.
Note 2 – Significant Accounting Policies
The Fund operates as an investment company and, accordingly, follows the investment company accounting and reporting guidance of the Financial Accounting Standards Board (“FASB”) Accounting Standards Codification Topic 946 Financial Services – Investment Companies.
The following significant accounting policies are in conformity with U.S. generally accepted accounting principles (“U.S. GAAP”) and are consistently followed by the Fund. This requires management to make estimates and assumptions that affect the reported amount of assets and liabilities, contingent assets and liabilities at the date of the financial statements, and the reported amounts of revenues and expenses during the reporting period. Actual results could differ from these estimates. All time references are based on Eastern Time.
(a) Valuation of Investments
The Board of Trustees of the Fund (the “Board”) has adopted policies and procedures for the valuation of the Fund’s investments (the “Valuation Procedures”). Pursuant to the Valuation Procedures, the Board has delegated to a valuation committee, consisting of representatives from Guggenheim’s investment management, fund administration, legal and compliance departments (the “Valuation Committee”), the day-to-day responsibility for implementing the Valuation Procedures, including, under most circumstances, the responsibility for determining the fair value of the Fund’s securities and/or other assets.
Valuations of the Fund’s securities are supplied primarily by pricing services appointed pursuant to the processes set forth in the Valuation Procedures. The Valuation Committee convenes monthly, or more frequently as needed, to review the valuation of all assets which have been fair valued for reasonableness. The Fund’s officers, through the Valuation Committee and consistent with the monitoring and review responsibilities set forth in the Valuation Procedures, regularly review procedures used and valuations provided by the pricing services.
If the pricing service cannot or does not provide a valuation for a particular investment or such valuation is deemed unreliable, such investment is fair valued by the Valuation Committee.
Equity securities listed on an exchange (New York Stock Exchange (“NYSE”) or American Stock Exchange) are valued at the last quoted sale price as of the close of business on the NYSE, usually at 4:00 p.m. on the valuation date. Equity securities listed on the NASDAQ market system are valued at the NASDAQ Official Closing Price on the valuation date, which may not necessarily represent the last sale price. If there has been no sale on such exchange or NASDAQ on a given day, the security is valued at the closing bid price on that day.
34 l GGM l GUGGENHEIM CREDIT ALLOCATION FUND ANNUAL REPORT| | |
NOTES TO FINANCIAL STATEMENTS continued | May 31, 2019 |
Open-end investment companies are valued at their net asset value (“NAV”) as of the close of business, on the valuation date. Exchange-traded funds and closed-end investment companies are valued at the last quoted sale price.
Generally, trading in foreign securities markets is substantially completed each day at various times prior to the close of the NYSE. The values of foreign securities are determined as of the close of such foreign markets or the close of the NYSE, if earlier. Any investments quoted in foreign currencies are valued in U.S. dollars on the basis of the foreign currency exchange rates prevailing at the close of U.S. business at 4:00 p.m. Investments in foreign securities may involve risks not present in domestic investments. The Valuation Committee will determine the current value of such foreign securities by taking into consideration certain factors which may include those discussed above, as well as the following factors, among others: the value of the securities traded on other foreign markets, ADR trading, closed-end fund trading, foreign currency exchange activity, and the trading prices of financial products that are tied to foreign securities. In addition, under the Valuation Procedures, the Valuation Committee and Guggenheim Funds Investment Advisors, LLC (“GFIA”, or the “Adviser”) are authorized to use prices and other information supplied by a third party pricing vendor in valuing foreign securities.
Debt securities with a maturity of greater than 60 days at acquisition are valued at prices that reflect broker-dealer supplied valuations or are obtained from independent pricing services, which may consider the trade activity, treasury spreads, yields or price of bonds of comparable quality, coupon, maturity, and type, as well as prices quoted by dealers who make markets in such securities. Short-term debt securities with a maturity of 60 days or less at acquisition are valued at amortized cost, provided such amount approximates market value. Money market funds are valued at their NAV.
Typically, loans are valued using information provided by an independent third party pricing service which uses broker quotes. If the pricing service cannot or does not provide a valuation for a particular loan or such valuation is deemed unreliable, such investment is fair valued by the Valuation Committee.
Forward foreign currency exchange contracts are valued daily based on the applicable exchange rate of the underlying currency.
Investments for which market quotations are not readily available are fair-valued as determined in good faith by GFIA, subject to review and approval by the Valuation Committee, pursuant to methods established or ratified by the Board. Valuations in accordance with these methods are intended to reflect each security’s (or asset’s or liability’s) “fair value”. Each such determination is based on a consideration of all relevant factors, which are likely to vary from one pricing context to another. Examples of such factors may include, but are not limited to market prices; sale prices; broker quotes; and models which derive prices based on inputs such as prices of securities with comparable maturities and characteristics, or based on inputs such as anticipated cash flows or collateral, spread over U.S. Treasury securities, and other information analysis.
(b) Investment Transactions and Investment Income
Investment transactions are accounted for on the trade date. Realized gains and losses on investments are determined on the identified cost basis. Paydown gains and losses on mortgage and asset-backed securities are treated as an adjustment to interest income. Dividend income is
GGM l GUGGENHEIM CREDIT ALLOCATION FUND ANNUAL REPORT l 35| | |
NOTES TO FINANCIAL STATEMENTS continued | May 31, 2019 |
recorded net of applicable withholding taxes on the ex-dividend date and interest income is recorded on an accrual basis. Discounts or premiums on debt securities purchased are accreted or amortized to interest income over the lives of the respective securities using the effective interest method.
Income from residual collateralized loan obligations is recognized using the effective interest method. At the time of purchase, management estimates the future expected cash flows and determines the effective yield and estimated maturity date based on the estimated cash flows. Subsequent to the purchase, the estimated cash flows are updated periodically and a revised yield is calculated prospectively.
(c) Senior Floating Rate Interests
Senior floating rate interests in which the Fund invests generally pay interest rates which are periodically adjusted by reference to a base short-term floating rate, plus a premium. These base lending rates are generally (i) the lending rate offered by one or more major European banks, such as the one-month or three-month London Inter-Bank Offered Rate (LIBOR), (ii) the prime rate offered by one or more major United States banks, or (iii) the bank’s certificate of deposit rate. Senior floating rate interests often require prepayments from excess cash flows or permit the borrower to repay at its election. The rate at which the borrower repays cannot be predicted with accuracy. As a result, the actual remaining maturity may be substantially less than the stated maturities shown on the Schedule of Investments.
(d) Currency Translation
The accounting records of the Fund are maintained in U.S. dollars. All assets and liabilities initially expressed in foreign currencies are converted into U.S. dollars at prevailing exchange rates. Purchases and sales of investment securities, dividend and interest income, and certain expenses are translated at the rates of exchange prevailing on the respective dates of such transactions.
The Fund does not isolate that portion of the results of operations resulting from changes in the foreign exchange rates on investments from the fluctuations arising from changes in the market prices of securities held. Any such fluctuations are included with the net realized gain or loss and unrealized appreciation or depreciation on investments.
Foreign exchange realized gain or loss resulting from holding of a foreign currency, expiration of a currency exchange contract, difference in exchange rates between the trade date and settlement date of an investment purchased or sold, and the difference between dividends or interest actually received compared to the amount shown in the Fund’s accounting records on the date of receipt, if any, is shown on as net realized gains or losses on foreign currency transactions on the Fund’s Statement of Operations.
Foreign exchange unrealized appreciation or depreciation on assets and liabilities, other than investments, if any, is shown as unrealized appreciation (depreciation) on foreign currency translation on the Fund’s Statement of Operations.
(e) Forward Foreign Currency Exchange Contracts
Forward foreign currency exchange contracts are agreements between two parties to buy and sell currencies at a set price on a future date. Fluctuations in the value of open forward foreign currency exchange contracts are recorded for financial reporting purposes as unrealized appreciation and
36 l GGM l GUGGENHEIM CREDIT ALLOCATION FUND ANNUAL REPORT| | |
NOTES TO FINANCIAL STATEMENTS continued | May 31, 2019 |
depreciation by the Fund until the contracts are closed. When the contracts are closed, realized gains and losses are recorded, and included on the Statement of Operations in forward foreign currency exchange contracts.
(f) Distributions to Shareholders
The Fund declares and pays monthly distributions to common shareholders. These distributions consist of investment company taxable income, which generally includes qualified dividend income, ordinary income and short-term capital gains. Any net realized long-term capital gains are distributed annually to common shareholders. To the extent distributions exceed taxable income, the excess will be deemed a return of capital.
Distributions to shareholders are recorded on the ex-dividend date. The amount and timing of distributions are determined in accordance with U.S. federal income tax regulations, which may differ from U.S. GAAP.
(g) Indemnifications
Under the Fund’s organizational documents, its Trustees and Officers are indemnified against certain liabilities arising out of the performance of their duties to the Fund. In addition, throughout the normal course of business, the Fund enters into contracts that contain a variety of representations and warranties which provide general indemnifications. The Fund’s maximum exposure under these arrangements is unknown, as this would involve future claims that may be made against the Fund and/or its affiliates that have not yet occurred. However, based on experience, the Fund expects the risk of loss to be remote.
Note 3 – Derivatives
As part of its investment strategy, the Fund utilizes derivative instruments. These investments involve, to varying degrees, elements of market risk and risks in excess of amounts recognized in the Statement of Assets and Liabilities. Valuation and accounting treatment of these instruments can be found under Significant Accounting Policies in Note 2 of these Notes to Financial Statements.
Derivatives are instruments whose values depend on, or are derived from, in whole or in part, the value of one or more other assets, such as securities, currencies, commodities or indices. Derivative instruments may be used to increase investment flexibility (including to maintain cash reserves while maintaining exposure to certain other assets), for risk management (hedging) purposes, to facilitate trading, to reduce transaction costs and to pursue higher investment returns. Derivative instruments may also be used to mitigate certain investment risks, such as foreign currency exchange rate risk, interest rate risk and credit risk. U.S. GAAP requires disclosures to enable investors to better understand how and why a Fund uses derivative instruments, how these derivative instruments are accounted for and their effects on the Fund’s financial position and results of operations.
The Fund utilized derivatives for the following purpose:
Hedge: an investment made in order to reduce the risk of adverse price movements in a security, by taking an offsetting position to protect against broad market moves.
GGM l GUGGENHEIM CREDIT ALLOCATION FUND ANNUAL REPORT l 37| | |
NOTES TO FINANCIAL STATEMENTS continued | May 31, 2019 |
Forward Foreign Currency Exchange Contracts
A forward foreign currency exchange contract is an agreement between two parties to exchange two designated currencies at a specific time in the future. Certain types of contracts may be cash settled, in an amount equal to the change in exchange rates during the term of the contract. The contracts can be used to hedge or manage exposure to foreign currency risks with portfolio investments or to gain exposure to foreign currencies.
The market value of a forward foreign currency exchange contract changes with fluctuations in foreign currency exchange rates. Furthermore, the Fund may be exposed to risk if the counterparties cannot meet the contract terms or if the currency value changes unfavorably as compared to the U.S. dollar.
The following table represents the Fund’s use and volume of forward foreign currency exchange contracts on a quarterly basis:
| | | | | | | |
| | | Average Settlement | |
Use | | Purchased | | | Sold | |
| Hedge | | $ | 711,210 | | | $ | 6,359,556 | |
Derivative Investment Holdings Categorized by Risk Exposure
The following is a summary of the location of derivative investments on the Fund’s Statement of Assets and Liabilities as of May 31, 2019:
| | | |
Derivative Investment Type | Asset Derivatives | Liability Derivatives |
| Currency contracts | Unrealized appreciation | – |
| | on forward foreign | |
| | currency exchange contracts | |
The following table sets forth the fair value of the Fund’s derivative investments categorized by primary risk exposure as of May 31, 2019:
| | | |
| | | Forward Foreign Currency |
| | Primary Risk Exposure | Exchange Risk |
Asset Derivative Investments Value | Foreign Currency Exchange Risk | $44,734 |
The following is a summary of the location of derivative investments on the Fund’s Statement of Operations for the year ended May 31, 2019:
| | |
Derivative Investment Type | Location of Gain (Loss) on Derivatives |
| Currency contracts | Net realized gain (loss) on forward foreign |
| | currency exchange contracts |
| | Net change in unrealized appreciation |
| | (depreciation) on forward foreign currency |
| | exchange contracts |
The following is a summary of the Fund’s realized gain (loss) and change in unrealized appreciation (depreciation) on derivative investments recognized on the Statement of Operations categorized by primary risk exposure for the year ended May 31, 2019:
| | |
Realized Gain (Loss) on Derivative Investments Recognized on the Statement of Operations | |
| | Forward Foreign |
| | Currency Exchange Risk |
| | $ 516,545 |
38 l GGM l GUGGENHEIM CREDIT ALLOCATION FUND ANNUAL REPORT| | |
NOTES TO FINANCIAL STATEMENTS continued | May 31, 2019 |
| |
Change in Unrealized Appreciation (Depreciation) on Derivative Investments Recognized on the Statement of Operations |
Forward Foreign |
Currency Exchange Risk |
| $ (73,407) |
In conjunction with the use of derivative instruments, the Fund is required to maintain collateral in various forms. Depending on the financial instrument utilized and the broker involved, the Fund uses margin deposits at the broker, cash and/or securities segregated at the custodian bank, discount notes or repurchase agreements allocated to the Fund.
The Fund has established counterparty credit guidelines and enters into transactions only with financial institutions of investment grade or better. The Fund monitors the counterparty credit risk.
Note 4 – Offsetting
In the normal course of business, the Fund enters into transactions subject to enforceable master netting arrangements or other similar arrangements. Generally, the right to offset in those agreements allows the Fund to counteract the exposure to a specific counterparty with collateral received from or delivered to that counterparty based on the terms of the arrangements. These arrangements provide for the right to liquidate upon the occurrence of an event of default, credit event upon merger or additional termination event.
In order to better define their contractual rights and to secure rights that will help the Fund mitigate its counterparty risk, the Fund may enter into an International Swaps and Derivatives Association, Inc. Master Agreement (“ISDA Master Agreement”) or similar agreement with its derivative contract counterparties. An ISDA Master Agreement is a bilateral agreement between a fund and a counterparty that governs OTC derivatives, including foreign exchange contracts, and typically contains, among other things, collateral posting terms and netting provisions in the event of a default and/or termination event. The provisions of the ISDA Master Agreement typically permit a single net payment in the event of a default (close-out netting) or similar event, including the bankruptcy or insolvency of the counterparty.
For derivatives traded under an ISDA Master Agreement, the collateral requirements are typically calculated by netting the mark-to-market amount for each transaction under such agreement and comparing that amount to the value of any collateral currently pledged by the Fund and the counterparty. For financial reporting purposes, cash collateral that has been pledged to cover obligations of the Fund and cash collateral received from the counterparty, if any, are reported separately on the Statement of Assets and Liabilities as segregated cash with broker/receivable for variation margin, or payable for swap settlement/variation margin. Cash and/or securities pledged or received as collateral by the Fund in connection with an OTC derivative subject to an ISDA Master Agreement generally may not be invested, sold or rehypothecated by the counterparty or the Fund, as applicable, absent an event of default under such agreement, in which case such collateral generally may be applied towards obligations due to and payable by such counterparty or the Fund, as applicable. Generally, the amount of collateral due from or to a counterparty must exceed a minimum transfer amount threshold (e.g., $300,000) before a transfer is required to be made. To the extent amounts due to the Fund from its counterparties are not fully collateralized, contractually or otherwise, the Fund bears the risk of loss from counterparty nonperformance. The Fund attempts to
GGM l GUGGENHEIM CREDIT ALLOCATION FUND ANNUAL REPORT l 39| | |
NOTES TO FINANCIAL STATEMENTS continued | May 31, 2019 |
mitigate counterparty risk by only entering into agreements with counterparties that it believes to be of good standing and by monitoring the financial stability of those counterparties.
For financial reporting purposes, the Fund does not offset derivative assets and derivative liabilities that are subject to netting arrangements in the Statement of Assets and Liabilities.
The following tables present derivative financial instruments and secured financing transactions that are subject to enforceable netting arrangements:
| | | | | | | |
| | | | Net Amount | | | |
| | | Gross Amounts | of Assets | Gross Amounts Not Offset | |
| | Gross | Offset in the | Presented on the | in the Statement of | |
| | Amounts of | Statement of | Statement of | Assets and Liabilities | |
Investment | Recognized | Assets and | Assets and | Financial | Cash Collateral | |
Type | Assets | Liabilities | Liabilities | Instruments | Received | Net Amount |
| Forward | | | | | | |
| foreign | | | | | | |
| currency | | | | | | |
| exchange | | | | | | |
| contracts | $ 44,734 | $ – | $ 44,734 | $ – | $ – | $ 44,734 |
| |
| | | | Net Amount | | | |
| | | Gross Amounts | of Liabilities | Gross Amounts Not Offset | |
| | Gross | Offset in the | Presented in the | in the Statement of | |
| | Amounts of | Statement of | Statement of | Assets and Liabilities | |
Investment | Recognized | Assets and | Assets and | Financial | Cash Collateral | |
Type | Liabilities | Liabilities | Liabilities | Instruments | Pledged | Net Amount |
| Reverse | | | | | | |
| repurchase | | | | | | |
| agreements | $ 54,982,491 | $ – | $ 54,982,491 | $ (54,982,491) | $ – | $ – |
Note 5 – Fees and Other Transactions with Affiliates
Pursuant to an Investment Advisory Agreement between the Fund and the Adviser, the Adviser furnishes offices, necessary facilities and equipment, provides administrative services, oversees the activities of Guggenheim Partners Investment Management, LLC (“GPIM” or “Sub-Adviser”), provides personnel including certain officers required for the Fund’s administrative management and compensates the officers and trustees of the Fund who are affiliates of the Adviser. As compensation for these services, the Fund pays the Adviser a fee, payable monthly, in an amount equal to 1.00% of the Fund’s average daily managed assets.
Pursuant to a Sub-Advisory Agreement among the Fund, the Adviser and GPIM, GPIM under the supervision of the Fund’s Board and the Adviser, provides a continuous investment program for the Fund’s portfolio; provides investment research; makes and executes recommendations for the purchase and sale of securities; and provides certain facilities and personnel, including certain officers required for its administrative management and pays the compensation of all officers and trustees of the Fund who are GPIM’s affiliates. As compensation for its services, the Adviser pays GPIM a fee, payable monthly, in an annual amount equal to 0.50% of the Fund’s average daily managed assets.
40 l GGM l GUGGENHEIM CREDIT ALLOCATION FUND ANNUAL REPORT| | |
NOTES TO FINANCIAL STATEMENTS continued | May 31, 2019 |
For purposes of calculating the fees payable under the foregoing agreements, average daily managed assets means the average daily value of the Fund’s total assets minus the sum of its accrued liabilities. Total assets means all of the Fund’s assets and is not limited to its investment securities. Accrued liabilities means all of the Fund’s liabilities other than borrowings for investment purposes.
Certain officers and trustees of the Fund may also be officers, directors and/or employees of the Adviser or GPIM. The Fund does not compensate its officers who are officers, directors and/or employees of the aforementioned firms.
The Adviser engages external service providers to perform other necessary services for the Fund, such as audit and accounting related services, legal services, custody, printing and mailing, among others, on a pass-through basis.
MUFG Investor Services (US) LLC (“MUIS”) acts as the Fund’s administrator and accounting agent. As administrator and accounting agent, MUIS is responsible for maintaining the books and records of the Fund’s securities and cash. The Bank of New York (“BNY”) acts as the Fund’s custodian. As custodian, BNY is responsible for the custody of the Fund’s assets. For providing the aforementioned services, MUIS and BNY are entitled to receive a monthly fee equal to an annual percentage of the Fund’s average daily managed assets subject to certain minimum monthly fees and out of pocket expenses.
Note 6 – Fair Value Measurement
In accordance with U.S. GAAP, fair value is defined as the price that the Fund would receive to sell an investment or pay to transfer a liability in an orderly transaction with an independent buyer in the principal market, or in the absence of a principal market, the most advantageous market for the investment or liability. U.S. GAAP establishes a three-tier fair value hierarchy based on the types of inputs used to value assets and liabilities and requires corresponding disclosure. The hierarchy and the corresponding inputs are summarized below:
Level 1 — quoted prices in active markets for identical assets or liabilities.
Level 2 — significant other observable inputs (for example quoted prices for securities that are similar based on characteristics such as interest rates, prepayment speeds, credit risk, etc.).
Level 3 — significant unobservable inputs based on the best information available under the circumstances, to the extent observable inputs are not available, which may include assumptions.
The types of inputs available depend on a variety of factors, such as the type of security and the characteristics of the markets in which it trades, if any. Fair valuation determinations that rely on fewer or no observable inputs require greater judgment. Accordingly, fair value determinations for Level 3 securities require the greatest amount of judgment.
Independent pricing services are used to value a majority of the Fund’s investments. When values are not available from a pricing service, they will be determined using a variety of sources and techniques, including: market prices; broker quotes; and models which derive prices based on inputs such as prices of securities with comparable maturities and characteristics or based on inputs such as anticipated cash flows or collateral, spread over U.S. Treasury securities, and other information and analysis. A significant portion of the Fund’s assets and liabilities are categorized as Level 2, as indicated in this report.
GGM l GUGGENHEIM CREDIT ALLOCATION FUND ANNUAL REPORT l 41| | |
NOTES TO FINANCIAL STATEMENTS continued | May 31, 2019 |
Indicative quotes from broker-dealers, adjusted for fluctuations in criteria such as credit spreads and interest rates, may be also used to value the Fund’s assets and liabilities, i.e. prices provided by a broker-dealer or other market participant who has not committed to trade at that price. Although indicative quotes are typically received from established market participants, the Fund may not have the transparency to view the underlying inputs which support the market quotations. Significant changes in an indicative quote would generally result in significant changes in the fair value of the security.
Certain fixed income securities are valued by obtaining a monthly indicative quote from a broker-dealer, adjusted for fluctuations in criteria such as credit spreads and interest rates.
The inputs or methodologies used for valuing securities are not necessarily an indication of the risk associated with investing in those securities. The suitability of the techniques and sources employed to determine fair valuation are regularly monitored and subject to change.
Note 7 – Reverse Repurchase Agreements
The Fund may enter into reverse repurchase agreements as part of its financial leverage strategy. Under a reverse repurchase agreement, the Fund temporarily transfers possession of a portfolio instrument to another party, such as a bank or broker-dealer, in return for cash. At the same time, the Fund agrees to repurchase the instrument at an agreed upon time and price, which reflects an interest payment. Such agreements have the economic effect of borrowings. The Fund may enter into such agreements when it is able to invest the cash acquired at a rate higher than the cost of the agreement, which would increase earned income. When the Fund enters into a reverse repurchase agreement, any fluctuations in the market value of either the instruments transferred to another party or the instruments in which the proceeds may be invested would affect the market value of the Fund’s assets. As a result, such transactions may increase fluctuations in the market value of the Fund’s assets. For the year ended May 31, 2019, the average daily balance for which reverse repurchase agreements were outstanding amounted to $66,831,930. The weighted average interest rate was 2.75%. As of May 31, 2019, there was $54,982,491 in reverse repurchase agreements outstanding.
The following is a summary of the remaining contractual maturities of the reverse repurchase agreements outstanding as of May 31, 2019, aggregated by asset class of the related collateral pledged by the Fund:
| | | | | | | | | | | | | | | | |
| | | Overnight and | | | | | | | | | Greater than | | | | |
| | | Continuous | | | Up to 30 days | | | 31-90 days | | | 90 days | | | Total | |
| Corporate Bonds | | $ | 5,254,344 | | | $ | 36,725,202 | | | $ | 13,002,945 | | | $ | – | | | $ | 54,982,491 | |
| Gross amount of | | | | | | | | | | | | | | | | | | | | |
| recognized liabilities | | | | | | | | | | | | | | | | | | | | |
| for reverse | | | | | | | | | | | | | | | | | | | | |
| repurchase | | | | | | | | | | | | | | | | | | | | |
| agreements | | $ | 5,254,344 | | | $ | 36,725,202 | | | $ | 13,002,945 | | | $ | – | | | $ | 54,982,491 | |
42 l GGM l GUGGENHEIM CREDIT ALLOCATION FUND ANNUAL REPORT| | |
NOTES TO FINANCIAL STATEMENTS continued | May 31, 2019 |
As of May 31, 2019, the Fund had outstanding reverse repurchase agreements with various counterparties. Details of the reverse repurchase agreements by counterparty are as follows:
| | | | |
Counterparty | Interest Rate(s) | Maturity Date(s) | Face Value |
| Barclays | 2.40% | Open Maturity | $ 504,673 |
| BNP Paribas Securities corp. | 2.87% - 2.90% | 06/13/19 - 07/08/19 | 14,210,400 |
| Bank of America | 2.92% | 06/07/19 - 07/01/19 | 4,677,244 |
| Canadian Imperial Bank of Commerce | 2.95% | 06/07/19 - 07/02/19 | 7,081,715 |
| Credit Suisse Securities (USA) LLC | 1.75%* | Open Maturity | 2,806,550 |
| Credit Suisse Securities (USA) LLC | 2.85% | 06/12/19 | 5,672,595 |
| J.P.Morgan Chase & Co. | 2.60% - 2.90% | 06/11/19 - 06/12/19 | 1,995,759 |
| J.P.Morgan Chase & Co. | 2.60%* | Open Maturity | 1,437,120 |
| RBC Capital Markets | 2.88% - 2.93% | 06/03/19 - 07/05/19 | 10,470,437 |
| Nomura Securities Co. | 0.00%* | Open Maturity | 506,000 |
| Nomura Securities Co. | 2.84% | 06/20/19 | 5,619,998 |
| | | | $54,982,491 |
| | |
| * | The rate is adjusted periodically by the counterparty, subject to approval by the Adviser, and is not based upon a set reference rate and spread. Rate indicated is the rate effective as of May 31, 2019. |
Note 8 – Borrowings
On September 16, 2016, the Fund entered into a $70,000,000 credit facility agreement with an approved lender whereby the lender has agreed to provide secured financing to the Fund and the Fund will provide pledged collateral to the lender. Interest on the amount borrowed is based on the 1 month LIBOR plus 1%. As of and for the year ended May 31, 2019, there was no outstanding borrowings in connection with the Fund’s credit facility.
The credit facility agreement governing the loan facility includes usual and customary covenants. These covenants impose on the Fund asset coverage requirements, collateral requirements, investment strategy requirements, and certain financial obligations. These covenants place limits or restrictions on the Fund’s ability to (i) enter into additional indebtedness with a party other than the counterparty, (ii) change its fundamental investment policy, or (iii) pledge to any other party, other than to the counterparty, securities owned or held by the Fund over which the counterparty has a lien. In addition, the Fund is required to deliver financial information to the counterparty within established deadlines, maintain an asset coverage ratio (as defined in Section 18(g) of the 1940 Act) greater than 300%, comply with the rules of the stock exchange on which its shares are listed, and maintain its classification as a “closed-end management investment company” as defined in the 1940 Act.
There is no guarantee that the Fund’s leverage strategy will be successful. The Fund’s use of leverage may cause the Fund’s NAV and market price of common shares to be more volatile and can magnify the effect of any losses.
GGM l GUGGENHEIM CREDIT ALLOCATION FUND ANNUAL REPORT l 43| | |
NOTES TO FINANCIAL STATEMENTS continued | May 31, 2019 |
Note 9 – Federal Income Tax Information
The Fund intends to comply with the provisions of Subchapter M of the Internal Revenue Code applicable to regulated investment companies and will distribute substantially all taxable net investment income and capital gains sufficient to relieve the Fund from all, or substantially all, federal income, excise and state income taxes. Therefore, no provision for federal or state income tax or federal excise tax is required.
Tax positions taken or expected to be taken in the course of preparing the Fund’s tax returns are evaluated to determine whether the tax positions are “more-likely-than-not” of being sustained by the applicable tax authority. Tax positions not deemed to meet the more-likely-than-not threshold would be recorded as a tax benefit or expense in the current year. Management has analyzed the Fund’s tax positions taken, or to be taken, on U.S. federal income tax returns for all open tax years, and has concluded that no provision for income tax is required in the Fund’s financial statements. The Fund’s U.S. federal income tax returns are subject to examination by the Internal Revenue Service for a period of three years after they are filed.
The tax character of distributions paid during the year ended May 31, 2019 was as follows:
| | | | |
Ordinary | Long-Term | Return | Total |
Income | Capital Gain | of Capital | Distributions |
| $14,522,749 | $ – | $1,526,197 | $16,048,946 |
The tax character of distributions paid during the year ended May 31, 2018 was as follows:
| | | | |
Ordinary | Long-Term | Return | Total |
Income | Capital Gain | of Capital | Distributions |
| $15,894,021 | $ – | $ – | $15,894,021 |
Note: For U.S. federal income tax purposes, short-term capital gain distributions are treated as ordinary income distributions.
The tax components of distributable earnings/(loss) as of May 31, 2019 were as follows:
| | | | | |
Undistributed | Undistributed | Net Unrealized | Accumulated | |
Ordinary | Long-Term | Appreciation | Capital and | |
Income | Capital Gain | (Depreciation) | Other Losses | Total |
| $ – | $ – | $(12,818,565) | $(14,368,515) | $(27,187,080) |
For U.S. federal income tax purposes, capital loss carryforwards represent realized losses of the Fund that may be carried forward and applied against future capital gains. Under the RIC Modernization Act of 2010, the Fund is permitted to carry forward capital losses incurred in taxable years beginning after December 22, 2010 for an unlimited period and such capital loss carryforwards will retain their character as either short-term or long-term capital losses. As of May 31, 2019, capital loss carryforwards for the Fund were as follows:
| | | | |
| | Unlimited | |
| | | | Total |
| | | | Capital Loss |
| | Short-Term | Long-Term | Carryforward |
| | $ – | $(14,368,515) | $(14,368,515) |
44 l GGM l GUGGENHEIM CREDIT ALLOCATION FUND ANNUAL REPORT| | |
NOTES TO FINANCIAL STATEMENTS continued | May 31, 2019 |
Net investment income and net realized gains (losses) may differ for financial statement and tax purposes because of temporary or permanent book/tax differences. These differences are primarily due to investments in collateralized loan obligations, paydown losses, foreign currency gains and losses, losses deferred due to wash sales, the “mark-to-market” of certain derivatives, and equity to debt adjustments. To the extent these differences are permanent and would require a reclassification between Paid in Capital and Total Distributable Earnings (Loss), such reclassifications are made in the period that the differences arise. These reclassifications have no effect on net assets or NAV per share.
There were no adjustments made on the Statement of Assets and Liabilities as of May 31, 2019 for permanent book/tax differences.
At May 31, 2019, the cost of investments for U.S. federal income tax purposes, the aggregate gross unrealized appreciation for all investments for which there was an excess of value over tax cost and the aggregate gross unrealized depreciation for all investments for which there was an excess of tax cost over value, were as follows:
| | | | |
| | | | Net |
| | Tax | Tax | Unrealized |
Tax | Unrealized | Unrealized | Appreciation/ |
Cost | Appreciation | Depreciation | (Depreciation) |
| $214,989,190 | $1,923,288 | $(14,300,157) | $(12,376,869) |
Note 10 – Securities Transactions
For the year ended May 31, 2019, the cost of purchases and proceeds from sales of investment securities, excluding short-term investments, were as follows:
| | | |
| | Purchases | Sales |
| | $111,952,009 | $133,221,175 |
The Fund is permitted to purchase or sell securities from or to certain affiliated funds under specified conditions outlined in procedures adopted by the Board. The procedures have been designed to ensure that any purchase or sale of securities by the Fund from or to another fund or portfolio that is or could be considered an affiliate by virtue of having a common investment adviser (or affiliated investment advisers), common Trustees and/or common officers complies with Rule 17a-7 of the 1940 Act. Further, as defined under these procedures, each transaction is effected at the current market price to save costs, where permissible. For the year May 31, 2019, the Fund engaged in purchases and sales of securities, pursuant to Rule 17a-7 of the 1940 Act, as follows:
| | | |
Purchases | Sales | Realized Gain |
| $16,924,629 | $17,747,615 | $224,396 |
Note 11 – Unfunded Loan Commitments
Pursuant to the terms of certain loan agreements, the Fund held unfunded loan commitments as of May 31, 2019. The Fund is obligated to fund these loan commitments at the borrower’s discretion. The Fund reserves against such contingent obligations by designating cash, liquid securities, and liquid term loans as a reserve. As of May 31, 2019, the total amount segregated in connection with reverse repurchase agreements and unfunded commitments was $70,304,529.
GGM l GUGGENHEIM CREDIT ALLOCATION FUND ANNUAL REPORT l 45| | |
NOTES TO FINANCIAL STATEMENTS continued | May 31, 2019 |
The unfunded loan commitments as of May 31, 2019, were as follows:
| | | | |
Borrower | Maturity Date | Face Amount* | Value |
| Acosta, Inc. | 09/26/19 | 1,236,410 | $ 725,612 |
| Advantage Sales & Marketing, Inc. | 07/25/19 | 900,000 | 122,004 |
| Alexander Mann | 12/16/24 | GBP 1,250,000 | 192,985 |
| Aspect Software, Inc. | 07/15/23 | 253,514 | 3,535 |
| Bullhorn, Inc. | 11/21/22 | 92,606 | 8,064 |
| Cypress Intermediate Holdings III, Inc. | 04/27/22 | 450,000 | 32,307 |
| Examworks Group, Inc. | 01/27/23 | 500,000 | 30,870 |
| Lytx, Inc. | 08/31/22 | 157,895 | 12,841 |
| Wencor Group | 06/19/19 | 400,000 | 1,500 |
| | | | $ 1,129,718 |
| | |
| * | The face amount is denominated in U.S. dollars unless otherwise indicated. |
| GBP – British Pound |
Note 12 – Restricted Securities
The securities below are considered illiquid and restricted under guidelines established by the Board:
| | | | | | | | |
Restricted Securities | Acquisition Date | | Cost | | | Value | |
| Beverages & More, Inc. | | | | | | | |
| 11.50% due 06/15/22 | 06/16/17 | | $ | 4,301,081 | | | $ | 3,403,875 | |
| Mirabela Nickel Ltd. | | | | | | | | | |
9.50% due 06/24/192 | 12/31/13 | | | 1,160,919 | | | | 127,982 | |
| Princess Juliana International Airport | | | | | | | | | |
| Operating Company N.V. | | | | | | | | | |
5.50% due 12/20/271 | 02/05/14 | | | 336,084 | | | | 316,539 | |
| Turbine Engines Securitization Ltd. | | | | | | | | | |
2013-1A, 6.38% due 12/13/481 | 11/27/13 | | | 206,486 | | | | 180,888 | |
| | | | $ | 6,004,570 | | | $ | 4,029,284 | |
| | |
| 1 | All or a portion of these securities have been physically segregated in connection with borrowings, reverse repurchase agreements and unfunded loan commitments. As of May 31, 2019, the total value of securities segregated was $70,304,529. |
| 2 | Security is in default of interest and/or principal obligations. |
Note 13 – Capital
Common Shares
The Fund has an unlimited amount of common shares, $0.01 par value, authorized and 7,411,671 issued and outstanding.
Transactions in common shares were as follows:
| | | |
| | Year ended | Year ended |
| | May 31, 2019 | May 31, 2018 |
| Beginning Shares | 7,370,148 | 7,013,806 |
| Common shares issued through at-the-market offering | 26,349 | 344,230 |
| Shares issued through dividend reinvestment | 15,174 | 12,112 |
| Ending Shares | 7,411,671 | 7,370,148 |
46 l GGM l GUGGENHEIM CREDIT ALLOCATION FUND ANNUAL REPORT| | |
NOTES TO FINANCIAL STATEMENTS continued | May 31, 2019 |
In connection with its organization process, the Fund sold 4,189 shares of beneficial interest to Guggenheim Funds Distributors, LLC, an affiliate of the Adviser, for consideration of $100,012 at a price of $23.88 per share. The Fund issued 6,000,000 shares of common stock in its initial public offering. These shares were issued at $23.88 per share after deducting the sales load but before underwriters’ expense reimbursement.
In connection with the initial public offering of the Fund’s common shares, the underwriters were granted an option to purchase additional common shares. The underwriters purchased, at a price of $23.88 per common share (after deducting the sales load but before offering expenses incurred by the Fund), 625,000 common shares of the Fund and 125,000 common shares on July 19, 2013 and August 13, 2013, respectively, pursuant to the over-allotment option.
Offering costs, estimated at $331,250 or $0.05 per share, in connection with the issuance of common shares have been borne by the Fund and were charged to paid-in capital. The Adviser and GPIM have agreed to pay offering expenses (other than sales load, but including reimbursement of expenses to the underwriters) in excess of $0.05 per common share.
On September 7, 2016, the Fund’s shelf registration allowing for delayed or continuous offering of additional shares became effective. The shelf registration statement allowed for the issuance of up to $100,000,000 of common shares. On September 15, 2016, the Fund entered into an agreement with Cantor Fitzgerald & Co. for the sale of up to an additional 2,632,734 shares.
The Adviser has paid the costs associated with the at-the-market offering of shares and will be reimbursed by the Fund up to 0.60% of the offering price of common shares sold pursuant to the shelf registration statement, not to exceed the amount of actual offering costs incurred. For the year ended May 31, 2019, the Fund reimbursed the Adviser $24,001 for offering costs associated with these offerings, and will be responsible for additional offering costs in the future up to the 0.60% cap.
Note 14 – Recent Regulatory Reporting Updates
In August 2018, the U.S. Securities and Exchange Commission adopted amendments to certain disclosure requirements under Regulation S-X to conform to U.S. GAAP, including: (i) an amendment to require presentation of the total, rather than the components, of distributable earnings on the Statement of Assets and Liabilities; and (ii) an amendment to require presentation of the total, rather than the components, of distributions to shareholders, except for tax return of capital distributions, on the Statements of Changes in Net Assets. As of May 31, 2019, management has implemented the amendments to Regulation S-X, which did not have a material impact on the Fund’s financial statements and related disclosures nor did it impact the Fund’s net assets or results of operations.
In August 2018, the Financial Accounting Standards Board issued an Accounting Standards Update, ASU 2018-13, Fair Value Measurement (Topic 820), Disclosure Framework - Changes to the Disclosure Requirements for Fair Value Measurement (the “2018 ASU”) which adds, modifies and removes disclosure requirements related to certain aspects of fair value measurement. The 2018 ASU is effective for fiscal years, and interim periods within those fiscal years, beginning after December 15, 2019. Early adoption is permitted. As of May 31, 2019, the Fund has fully adopted the provisions of the 2018 ASU, which did not have material impact on the Fund’s financial statements and related disclosures nor did it impact the Fund’s net assets or results of operations.
GGM l GUGGENHEIM CREDIT ALLOCATION FUND ANNUAL REPORT l 47| | |
NOTES TO FINANCIAL STATEMENTS continued | May 31, 2019 |
Note 15 – Recent Accounting Pronouncements
In March 2017, the Financial Accounting Standards Board issued an Accounting Standards Update, ASU 2017-08, Receivables – Nonrefundable Fees and Other Costs (Subtopic 310-20), Premium Amortization on Purchased Callable Debt Securities (the “2017 ASU”) which amends the amortization period for certain purchased callable debt securities held at a premium, shortening such period to the earliest call date. The 2017 ASU does not require any accounting change for debt securities held at a discount; the discount continues to be amortized to maturity. The 2017 ASU is effective for fiscal years, and interim periods within those fiscal years, beginning after December 15, 2018. At this time, management is evaluating the implications of these changes on the financial statements.
Note 16 – Subsequent Events
The Fund evaluated subsequent events through the date the financial statements were available for issue and determined there were no material events that would require adjustment to or disclosure in the Fund’s financial statements.
48 l GGM l GUGGENHEIM CREDIT ALLOCATION FUND ANNUAL REPORT| | |
REPORT OF INDEPENDENT REGISTERED PUBLIC ACCOUNTING FIRM | May 31, 2019 |
To the Shareholders and Board of Trustees of Guggenheim Credit Allocation Fund
Opinion on the Financial Statements
We have audited the accompanying statement of assets and liabilities of Guggenheim Credit Allocation Fund (the “Fund”), including the schedule of investments, as of May 31, 2019, and the related statements of operations and cash flows for the year then ended, the statements of changes in net assets for each of the two years in the period then ended, the financial highlights for each of the five years in the period then ended and the related notes (collectively referred to as the “financial statements”). In our opinion, the financial statements present fairly, in all material respects, the financial position of Guggenheim Credit Allocation Fund at May 31, 2019, the results of its operations and its cash flows for the year then ended, the changes in its net assets for each of the two years in the period then ended and its financial highlights for each of the five years in the period then ended, in conformity with U.S. generally accepted accounting principles.
Basis for Opinion
These financial statements are the responsibility of the Fund’s management. Our responsibility is to express an opinion on the Fund’s financial statements based on our audits. We are a public accounting firm registered with the Public Company Accounting Oversight Board (United States) (“PCAOB”) and are required to be independent with respect to the Fund in accordance with the U.S. federal securities laws and the applicable rules and regulations of the Securities and Exchange Commission and the PCAOB.
We conducted our audits in accordance with the standards of the PCAOB. Those standards require that we plan and perform the audit to obtain reasonable assurance about whether the financial statements are free of material misstatement, whether due to error or fraud. The Fund is not required to have, nor were we engaged to perform, an audit of the Fund’s internal control over financial reporting. As part of our audits, we are required to obtain an understanding of internal control over financial reporting but not for the purpose of expressing an opinion on the effectiveness of the Fund’s internal control over financial reporting. Accordingly, we express no such opinion.
Our audits included performing procedures to assess the risks of material misstatement of the financial statements, whether due to error or fraud, and performing procedures that respond to those risks. Such procedures included examining, on a test basis, evidence regarding the amounts and disclosures in the financial statements. Our procedures included confirmation of securities owned as of May 31, 2019, by correspondence with the custodian, brokers, and paying agents or by other appropriate auditing procedures where replies from brokers or paying agents were not received. Our audits also included evaluating the accounting principles used and significant estimates made by management, as well as evaluating the overall presentation of the financial statements. We believe that our audits provide a reasonable basis for our opinion.
We have served as the auditor of one or more Guggenheim investment companies since 1979.
Tysons, Virginia
July 29, 2019
GGM l GUGGENHEIM CREDIT ALLOCATION FUND ANNUAL REPORT l 49| | |
OTHER INFORMATION (Unaudited) | May 31, 2019 |
Federal Income Tax Information
This information is being provided as required by the Internal Revenue Code. Amounts shown may differ from those elsewhere in the report because of differences in tax and financial reporting practice.
In January 2020, shareholders will be advised on IRS Form 1099 DIV or substitute 1099 DIV as to the federal tax status of the distributions received by shareholders in the calendar year 2019.
The Fund’s investment income (dividend income plus short-term gains, if any) qualifies as follows:
Of the taxable ordinary income distributions paid during the fiscal year ending May 31, 2019, the Fund had the corresponding percentages qualify for the reduced tax rate pursuant to the Jobs and Growth Tax Relief and Reconciliation Act of 2003 or for the dividends received deduction for corporations. See the qualified dividend income and dividend received deduction columns, respectively, in the table below.
Additionally, of the taxable ordinary income distributions paid during the fiscal year ended May 31, 2019, the Fund had the corresponding percentages qualify as interest related dividends and qualified short-term capital gains as permitted by IRC Section 871(k)(1) and IRC Section 871(k)(2), respectively. See qualified interest income and qualified short-term capital gain columns, respectively, in the table below.
| | | | |
Qualified | Dividend | Qualified | Qualified |
Dividend | Received | Interest | Short-Term |
Income | Deduction | Income | Capital Gain |
| 1.02% | 1.02% | 94.88% | 0.00% |
Results of Shareholder Votes
The Annual Meeting of Shareholders of the Fund was held on April 4, 2019. Common shareholders voted on the election of Trustees. With regards to the election of the following Trustees by common shareholders of the Fund:
| | | | |
| | # of Shares in Favor | # of Shares Against | # of Shares Abstain |
| Amy J. Lee | 6,312,079 | 259,841 | 106,598 |
| Ronald E. Toupin, Jr. | 6,269,622 | 276,944 | 131,952 |
The other Trustees of the Fund not up for elections in 2019 are Jerry B. Farley, Roman Friedrich III, Ronald A. Nyberg, Randall C. Barnes, and Donald A. Chubb.
Sector Classification
Information in the “Schedule of Investments” is categorized by sectors using sector-level classifications used by Bloomberg Industry Classification System, a widely recognized industry classifica -tion system provider. In the Fund’s registration statement, the Fund has investment policies relating to concentration in specific industries. For purposes of these investment policies, the Fund usually classifies industries based on industry-level classifications used by widely recognized industry classification system providers such as Bloomberg Industry Classification System, Global Industry Classification Standards and Barclays Global Classification Scheme.
50 l GGM l GUGGENHEIM CREDIT ALLOCATION FUND ANNUAL REPORT| | |
OTHER INFORMATION (Unaudited) continued | May 31, 2019 |
Trustees
The Trustees of the Guggenheim Credit Allocation Fund and their principal business occupations during the past five years:
| | | | | | |
| | Position(s) | Term of Office | | Number of | |
| | Held | and Length | | Portfolios in | |
Name, Address* | with | of Time | Principal Occupation(s) | Fund Complex | Other Directorships |
and Year of Birth | Trust | Served** | During Past Five Years | Overseen | Held by Trustees |
Independent Trustees: |
Randall C. Barnes (1951) | Trustee | Since 2013 | Current: Private Investor (2001-present). Former: Senior Vice President and Treasurer, PepsiCo, Inc. (1993-1997); President, Pizza Hut International (1991-1993); Senior Vice President, Strategic Planning and New Business Development, PepsiCo, Inc. (1987-1990). | 49 | Current: Trustee, Purpose Investments Funds (2013-present). Former: Managed Duration Investment Grade Municipal Fund (2003-2016). |
Donald A. Chubb, Jr. (1946) | Trustee and Chairman of the Valuation Oversight Committee | Since 2014 | Current: Retired. Former: Business broker and manager of commercial real estate, Griffith & Blair, Inc. (1997-2017). | 48 | Former: Midland Care, Inc. (2011-2016). |
Jerry B. Farley (1946) | Trustee and Chairman of the Audit Committee | Since 2014 | Current: President, Washburn University (1997-present). | 48 | Current: CoreFirst Bank & Trust (2000-present). Former: Westar Energy, Inc. (2004-2018). |
GGM l GUGGENHEIM CREDIT ALLOCATION FUND ANNUAL REPORT l 51| | |
OTHER INFORMATION (Unaudited) continued | May 31, 2019 |
| | | | | | |
| | Position(s) | Term of Office | | Number of | |
| | Held | and Length | | Portfolios in | |
Name, Address* | with | of Time | Principal Occupation(s) | Fund Complex | Other Directorships |
and Year of Birth | Trust | Served** | During Past Five Years | Overseen | Held by Trustees |
Independent Trustees continued: |
Roman Friedrich III (1946) | Trustee and Chairman of the Contracts Review Committee | Since 2013 | Current: Founder and Managing Partner, Roman Friedrich & Company (1998-present). | 48 | Former: Zincore Metals, Inc. (2009- January 2019) |
Ronald A. Nyberg (1953) | Trustee and Chairman of the Nominating and Governance Committee | Since 2013 | Current: Partner, Momkus LLC (2016-present). Former: Partner, Nyberg & Cassioppi, LLC (2000-2016); Executive Vice President, General Counsel, and Corporate Secretary, Van Kampen Investments (1982-1999). | 49 | Current: PPM Funds (2018-present); Edward-Elmhurst Healthcare System (2012-present); Western Asset Inflation-Linked Opportunities & Income Fund (2004-present); Western Asset Inflation-Linked Income Fund (2003-present). Former: Managed Duration Investment Grade Municipal Fund (2003-2016). |
Ronald E. Toupin, Jr. (1958) | Trustee and Chairman of the Board | Since 2014 | Current: Portfolio Consultant (2010-present); Member, Governing Council, Independent Directors Council (2013-present); Governor, Board of Governors, Investment Company Institute (2018-present). Former: Member, Executive Committee, Independent Directors Council (2016-2018); Vice President, Manager and Portfolio Manager, Nuveen Asset Management (1998-1999); Vice President, Nuveen Investment Advisory Corp. (1992-1999); Vice President and Manager, Nuveen Unit Investment Trusts (1991-1999); and Assistant Vice President and Portfolio Manager, Nuveen Unit Investment Trusts (1988-1999), each of John Nuveen & Co., Inc. (1982-1999). | 48 | Current: Western Asset Inflation-Linked Opportunities & Income Fund (2004-present); Western Asset Inflation-Linked Income Fund (2003-present). Former: Managed Duration Investment Grade Municipal Fund (2003-2016); Bennett Group of Funds (2011-2013). |
52 l GGM l GUGGENHEIM CREDIT ALLOCATION FUND ANNUAL REPORT| | |
OTHER INFORMATION (Unaudited) continued | May 31, 2019 |
| | | | | | |
| | Position(s) | Term of Office | | Number of | |
| | Held | and Length | | Portfolios in | |
Name, Address* | with | of Time | Principal Occupation(s) | Fund Complex | Other Directorships |
and Year of Birth | Trust | Served** | During Past Five Years | Overseen | Held by Trustees |
INTERESTED TRUSTEE: |
Amy J. Lee*** (1961) | Trustee, Vice President and Chief Legal Officer | Since 2018 (Trustee) Since 2014 (Chief Legal Officer) Since 2013 (Vice President) | Current: Interested Trustee, certain other funds in the Fund Complex (2018-present); President, certain other funds in the Fund Complex (2017-present); Chief Legal Officer, certain other funds in the Fund Complex (2014-present); Vice President, certain other funds in the Fund Complex (2007-present); Senior Managing Director, Guggenheim Investments (2012-present). Former: President and Chief Executive Officer (2017- 2018); Vice President, Associate General Counsel and Assistant Secretary, Security Benefit Life Insurance Company and Security Benefit Corporation (2004-2012). | 48 | None. |
| | |
| * | The business address of each Trustee is c/o Guggenheim Investments, 227 West Monroe Street, Chicago, IL 60606. |
| ** | This is the period for which the Trustee began serving the Fund. After a Trustee’s initial term, each Trustee is expected to serve a two-year concurrent with the |
| | class of Trustees for which he or she serves. |
| | — Messrs. Barnes and Chubb are Class I Trustees. Class I Trustees are expected to stand for re-election at the Fund’s annual meeting of shareholders for the |
| | fiscal year ended May 31, 2020. |
| | — Messrs. Farley, Friedrich and Nyberg are Class II Trustees. Class II Trustees are expected to stand for re-election at the Fund’s annual meeting of shareholders |
| | for the fiscal year ended May 31, 2021. |
| | — Mr. Toupin and Ms. Lee are Class III Trustees. Class III Trustees are expected to stand for re-election at the Fund’s annual meeting of shareholders for the |
| | fiscal year ended May 31, 2022. |
| *** | This Trustee is deemed to be an “interested person” of the Fund under the 1940 Act by reason of her position with the Fund’s Adviser and/or the parent of |
| | the Adviser. |
GGM l GUGGENHEIM CREDIT ALLOCATION FUND ANNUAL REPORT l 53| | |
OTHER INFORMATION (Unaudited) continued | May 31, 2019 |
OFFICERS
The Officers of the Guggenheim Credit Allocation Fund, who are not Trustees, and their principal occupations during the past five years:
| | | | |
| | Position(s) | | |
| | held | Term of Office | |
Name, Address* | with the | and Length of | |
and Year of Birth | Trust | Time Served** | Principal Occupations During Past Five Years |
Officers: |
Brian E. Binder (1972) | President and Chief Executive Officer | Since 2018 | Current: President and Chief Executive Officer, certain other funds in the Fund Complex (2018-present); President and Chief Executive Officer, Guggenheim Funds Investment Advisors, LLC and Security Investors, LLC (2018-present); Senior Managing Director and Chief Administrative Officer, Guggenheim Investments (2018-present). Former: Managing Director and President, Deutsche Funds, and Head of US Product, Trading and Fund Administration, Deutsche Asset Management (2013-2018); Managing Director, Head of Business Management and Consulting, Invesco Ltd. (2010-2012). |
Joanna M. Catalucci (1966) | Chief Compliance Officer | Since 2013 | Current: Chief Compliance Officer, certain funds in the Fund Complex (2012-present); Senior Managing Director, Guggenheim Investments (2012-present). Former: AML Officer, certain funds in the Fund Complex (2016-2017); Chief Compliance Officer and Secretary, certain other funds in the Fund Complex (2008-2012); Senior Vice President & Chief Compliance Officer, Security Investors, LLC and certain affiliates (2010-2012); Chief Compliance Officer and Senior Vice President, Rydex Advisors, LLC and certain affiliates (2010-2011). |
James M. Howley (1972) | Assistant Treasurer | Since 2013 | Current: Managing Director, Guggenheim Investments (2004-present); Assistant Treasurer, certain other funds in the Fund Complex (2006-present). Former: Manager, Mutual Fund Administration of Van Kampen Investments, Inc. (1996-2004). |
Mark E. Mathiasen (1978) | Secretary | Since 2013 | Current: Secretary, certain other funds in the Fund Complex (2007-present); Managing Director, Guggenheim Investments (2007-present). |
Glenn McWhinnie (1969) | Assistant Treasurer | Since 2016 | Current: Vice President, Guggenheim Investments (2009-present); Assistant Treasurer, certain other funds in the Fund Complex (2016-present). |
54 l GGM l GUGGENHEIM CREDIT ALLOCATION FUND ANNUAL REPORT| | |
OTHER INFORMATION (Unaudited) continued | May 31, 2019 |
| | | | |
| | Position(s) | | |
| | held | Term of Office | |
Name, Address* | with the | and Length of | |
and Year of Birth | Trust | Time Served** | Principal Occupations During Past Five Years |
Officers continued: |
Michael P. Megaris (1984) | Assistant Secretary | Since 2014 | Current: Assistant Secretary, certain other funds in the Fund Complex (2014-present); Director, Guggenheim Investments (2012-present). |
Adam J. Nelson (1979) | Assistant Treasurer | Since 2015 | Current: Vice President, Guggenheim Investments (2015-present); Assistant Treasurer, certain other funds in the Fund Complex (2015-present). Former: Assistant Vice President and Fund Administration Director, State Street Corporation (2013-2015); Fund Administration Assistant Director, State Street (2011-2013); Fund Administration Manager, State Street (2009-2011). |
Kimberly J. Scott (1974) | Assistant Treasurer | Since 2013 | Current: Director, Guggenheim Investments (2012-present); Assistant Treasurer, certain other funds in the Fund Complex (2012-present). Former: Financial Reporting Manager, Invesco, Ltd. (2010-2011); Vice President/Assistant Treasurer, Mutual Fund Administration for Van Kampen Investments, Inc./Morgan Stanley Investment Management (2009-2010); Manager of Mutual Fund Administration, Van Kampen Investments, Inc./Morgan Stanley Investment Management (2005-2009). |
Bryan Stone (1979) | Vice President | Since 2014 | Current: Vice President, certain other funds in the Fund Complex (2014-present); Managing Director, Guggenheim Investments (2013-present). Former: Senior Vice President, Neuberger Berman Group LLC (2009-2013); Vice President, Morgan Stanley (2002-2009). |
John L. Sullivan (1955) | Chief Financial Officer, Chief Accounting Officer and Treasurer | Since 2013 | Current: Chief Financial Officer, Chief Accounting Officer and Treasurer, certain other funds in the Fund Complex (2010-present); Senior Managing Director, Guggenheim Investments (2010-present). Former: Managing Director and Chief Compliance Officer, each of the funds in the Van Kampen Investments fund complex (2004-2010); Managing Director and Head of Fund Accounting and Administration, Morgan Stanley Investment Management (2002-2004); Chief Financial Officer and Treasurer, Van Kampen Funds (1996-2004). |
GGM l GUGGENHEIM CREDIT ALLOCATION FUND ANNUAL REPORT l 55| | |
OTHER INFORMATION (Unaudited) continued | May 31, 2019 |
| | | | |
| | Position(s) | | |
| | held | Term of Office | |
Name, Address* | with the | and Length of | |
and Year of Birth | Trust | Time Served** | Principal Occupations During Past Five Years |
Officers continued: |
Jon Szafran (1989) | Assistant Treasurer | Since 2017 | Current: Vice President, Guggenheim Investments (2017-present); Assistant Treasurer, certain other funds in the Fund Complex (2017-present). Former: Assistant Treasurer of Henderson Global Funds and Manager of US Fund Administration, Henderson Global Investors (North America) Inc. (“HGINA”), (2017); Senior Analyst of US Fund Administration, HGINA (2014-2017); Senior Associate of Fund Administration, Cortland Capital Market Services, LLC (2013-2014); Experienced Associate, PricewaterhouseCoopers LLP (2012-2013). |
| | |
| * | The business address of each officer is c/o Guggenheim Investments, 227 West Monroe Street, Chicago, IL 60606. |
| ** | Each officer serves an indefinite term, until his or her successor is duly elected and qualified. The date reflects the commencement date upon which the officer held any officer position with the Fund. |
56 l GGM l GUGGENHEIM CREDIT ALLOCATION FUND ANNUAL REPORT| | |
APPROVAL OF ADVISORY AGREEMENTS – GUGGENHEIM CREDIT | |
ALLOCATION FUND (GGM) | May 31, 2019 |
Guggenheim Credit Allocation Fund (the “Fund”) is a Delaware statutory trust that is registered as a diversified, closed-end management investment company under the Investment Company Act of 1940, as amended (the “1940 Act”). Guggenheim Funds Investment Advisors, LLC (“GFIA” or the “Adviser”), an indirect subsidiary of Guggenheim Partners, LLC, a privately-held, global investment and advisory firm (“Guggenheim Partners”), serves as the Fund’s investment adviser and provides certain administrative and other services pursuant to an investment advisory agreement between the Fund and GFIA (the “Investment Advisory Agreement”). (Guggenheim Partners, GFIA, Guggenheim Partners Investment Management, LLC (“GPIM” or the “Sub-Adviser”) and their affiliates may be referred to herein collectively as “Guggenheim.” “Guggenheim Investments” refers to the global asset management and investment advisory division of Guggenheim Partners and includes GFIA, GPIM, Security Investors, LLC and other affiliated investment management businesses of Guggenheim Partners.)
Under the terms of the Investment Advisory Agreement, GFIA is responsible for overseeing the activities of GPIM, which performs portfolio management and related services for the Fund pursuant to an investment sub-advisory agreement by and among the Fund, the Adviser and GPIM (the “Sub-Advisory Agreement” and together with the Investment Advisory Agreement, the “Advisory Agreements”). Under the supervision and oversight of GFIA and the Board of Trustees of the Fund (the “Board,” with the members of the Board referred to individually as the “Trustees”), GPIM provides a continuous investment program for the Fund’s portfolio, provides investment research, and makes and executes recommendations for the purchase and sale of securities for the Fund.
Each of the Advisory Agreements continues in effect from year to year provided that such continuance is specifically approved at least annually by (i) the Board or a majority of the outstanding voting securities (as defined in the 1940 Act) of the Fund, and, in either event, (ii) the vote of a majority of the Trustees who are not “interested person[s],” as defined by the 1940 Act, of the Fund (the “Independent Trustees”) casting votes in person at a meeting called for such purpose. At meetings held in person on April 25, 2019 (the “April Meeting”) and on May 21, 2019 (the “May Meeting”), the Contracts Review Committee of the Board (the “Committee”), consisting solely of the Independent Trustees, met separately from Guggenheim to consider the proposed renewal of the Advisory Agreements in connection with the Committee’s annual contract review schedule.
As part of its review process, the Committee was represented by independent legal counsel to the Independent Trustees (“Independent Legal Counsel”), from whom the Independent Trustees received separate legal advice and with whom they met separately. Independent Legal Counsel reviewed and discussed with the Committee various key aspects of the Trustees’ legal responsibilities relating to the proposed renewal of the Advisory Agreements and other principal contracts. The Committee took into account various materials received from Guggenheim and Independent Legal Counsel. Recognizing that the evaluation process with respect to the services provided by Guggenheim is an ongoing one, the Committee also considered the variety of written materials, reports and oral presentations the Board receives throughout the year regarding performance and operating results of the Fund and other information relevant to its evaluation of the Advisory Agreements.
GGM l GUGGENHEIM CREDIT ALLOCATION FUND ANNUAL REPORT l 57| | |
APPROVAL OF ADVISORY AGREEMENTS – GUGGENHEIM CREDIT | |
ALLOCATION FUND (GGM) continued | May 31, 2019 |
In connection with the contract review process, FUSE Research Network LLC (“FUSE”), an independent, third-party research provider, was engaged to prepare advisory contract renewal reports designed specifically to help the Board fulfill its advisory contract renewal responsibilities. The objective of the reports is to present the subject funds’ relative position regarding fees, expenses and total return performance, with comparisons to a peer group of funds identified by Guggenheim, based on a methodology reviewed by the Board. In addition, Guggenheim provided materials and data in response to formal requests for information sent by Independent Legal Counsel on behalf of the Independent Trustees. Guggenheim also made a presentation at the May Meeting. Throughout the process, the Committee asked questions of management and requested certain additional information, which Guggenheim provided (collectively with the foregoing reports and materials, the “Contract Review Materials”). The Committee considered the Contract Review Materials in the context of its accumulated experience in governing the Fund and weighed the factors and standards discussed with Independent Legal Counsel.
Following an analysis and discussion of relevant factors, including those identified below, and in the exercise of its business judgment, the Committee concluded that it was in the best interest of the Fund to recommend that the Board approve the renewal of each of the Advisory Agreements for an additional annual term.
Investment Advisory Agreement
Nature, Extent and Quality of Services Provided by the Adviser: With respect to the nature, extent and quality of services currently provided by the Adviser, the Committee noted that, although the Adviser delegated portfolio management responsibility to the Sub-Adviser, as affiliated companies, both the Adviser and Sub-Adviser are part of the Guggenheim organization. Further, the Committee took into account Guggenheim’s explanation that investment advisory-related services are provided by many Guggenheim employees under different related legal entities and thus, the services provided by the Adviser on the one hand and the Sub-Adviser on the other, as well as the risks assumed by each party, cannot be ascribed to distinct legal entities.1 As a result, the Committee did not evaluate the services provided to the Fund under the Investment Advisory Agreement and Sub-Advisory Agreement separately.
The Committee also considered the secondary market support services provided by Guggenheim to the Fund and noted the materials describing the activities of Guggenheim’s dedicated Closed-End Fund Team, including with respect to communication with financial advisors, data dissemination and relationship management. In addition, the Committee considered the qualifications, experience and skills of key personnel performing services for the Fund, including those personnel providing compliance and risk oversight, as well as the supervisors and reporting lines for such personnel. The Committee considered Guggenheim’s resources and related efforts to retain, attract and motivate capable personnel to serve the Fund. In evaluating Guggenheim’s resources and capabilities, the Committee considered Guggenheim’s commitment to focusing on, and investing resources in support of, funds in the Guggenheim fund complex, including the Fund.
The Committee’s review of the services provided by Guggenheim to the Fund included consideration of Guggenheim’s investment processes and resulting performance, portfolio oversight and risk
1 | Consequently, except where the context indicates otherwise, references to “Adviser” or “Sub-Adviser” should be understood as referring to Guggenheim Investments generally and the services it provides under both Advisory Agreements. |
58 l GGM l GUGGENHEIM CREDIT ALLOCATION FUND ANNUAL REPORT| | |
APPROVAL OF ADVISORY AGREEMENTS – GUGGENHEIM CREDIT | |
ALLOCATION FUND (GGM) continued | May 31, 2019 |
management, and the related regular quarterly reports and presentations received by the Board. The Committee took into account the risks borne by Guggenheim in sponsoring and providing services to the Fund, including entrepreneurial, legal and regulatory risks. The Committee considered the resources dedicated by Guggenheim to compliance functions and the reporting made to the Board by Guggenheim compliance personnel regarding Guggenheim’s adherence to regulatory requirements. The Committee also considered the regular reports the Board receives from the Fund’s Chief Compliance Officer regarding compliance policies and procedures established pursuant to Rule 38a-1 under the 1940 Act.
In connection with the Committee’s evaluation of the overall package of services provided by Guggenheim, the Committee considered Guggenheim’s administrative services, including its role in supervising, monitoring, coordinating and evaluating the various services provided by the fund administrator, custodian and other service providers to the Fund. The Committee evaluated the Office of Chief Financial Officer (the “OCFO”), established to oversee the fund administration, accounting and transfer agency services provided to funds in the Guggenheim fund complex, including the OCFO’s resources, personnel and services provided.
With respect to Guggenheim’s resources and the Adviser’s ability to carry out its responsibilities under the Investment Advisory Agreement, the Chief Financial Officer of Guggenheim Investments reviewed with the Committee financial information concerning the holding company for Guggenheim Investments, Guggenheim Partners Investment Management Holdings, LLC (“GPIMH”), and the various entities comprising Guggenheim Investments, and provided the audited consolidated financial statements of GPIMH. (Thereafter, the Committee received the audited consolidated financial statements of GPIM.)
The Committee also considered the acceptability of the terms of the Investment Advisory Agreement, including the scope of services required to be performed by the Adviser.
Based on the foregoing, and based on other information received (both oral and written) at the April Meeting and the May Meeting, as well as other considerations, including the Committee’s knowledge of how the Adviser performs its duties obtained through Board meetings, discussions and reports throughout the year, the Committee concluded that the Adviser and its personnel were qualified to serve the Fund in such capacity and may reasonably be expected to continue to provide a high quality of services under the Investment Advisory Agreement with respect to the Fund.
Investment Performance: The Fund commenced investment operations on June 26, 2013 and its investment objective is to seek total return through a combination of current income and capital appreciation. The Committee received data showing the Fund’s total return on a net asset value (“NAV”) and market price basis for the five-year, three-year, one-year and three-month periods ended December 31, 2018, as well as total return based on NAV since inception.
The Committee compared the Fund’s performance to a peer group of closed-end funds identified by Guggenheim (the “peer group of funds”) and, for NAV returns, performance versus the Fund’s benchmark for the same time periods. The Committee noted that the Adviser’s peer group selection methodology for the Fund starts with the entire U.S.-listed taxable closed-end fund universe, and excludes funds that: (i) invest more than 80% in one asset class; (ii) invest less than 20% in each of corporate bonds and banks loans; (iii) invest more than 50% outside the U.S.; (iv) invest more than
GGM l GUGGENHEIM CREDIT ALLOCATION FUND ANNUAL REPORT l 59| | |
APPROVAL OF ADVISORY AGREEMENTS – GUGGENHEIM CREDIT | |
ALLOCATION FUND (GGM) continued | May 31, 2019 |
30% in investment grade securities; and (v) invest more than 30% in asset-backed securities (ABS) or mortgage-backed securities (MBS). The Committee considered that the peer group of funds—consisting of eight other high yield bond funds—is consistent with the peer group used for purposes of the Fund’s quarterly performance reporting.
The Committee observed that the returns of the Fund ranked in the 13th, 25th and 88th percentiles of its peer group of funds on an NAV basis for the five-year, three-year and one-year periods ended December 31, 2018, respectively. The Committee considered Guggenheim’s statement that the Fund’s underperformance for the one-year period was primarily a result of its overweight to corporate bonds relative to the peer group median, which underperformed, and underweight to bank loans relative to the peer group median, which outperformed.
In addition, the Committee took into account Guggenheim’s belief that there is no single optimal performance metric, nor is there a single optimal time period over which to evaluate performance and that a thorough understanding of performance comes from analyzing measures of returns, risk and risk-adjusted returns, as well as evaluating strategies both relative to their market benchmarks and to peer groups of competing strategies. Thus, the Committee also reviewed and considered the additional performance and risk metrics provided by Guggenheim, including the Fund’s standard deviation, tracking error, beta, Sharpe ratio, information ratio and alpha compared to the benchmark, with the Fund’s risk metrics ranked against its peer group. In assessing the foregoing, the Committee considered Guggenheim’s statement that the Fund’s risk metrics, as measured by standard deviation, beta and down-capture ratios, have consistently ranked in the middle of the peer group, resulting in superior long-term risk adjusted returns.
The Committee also considered the Fund’s structure and form of leverage, and, among other information related to leverage, the cost of the leverage and the aggregate leverage outstanding as of December 31, 2018, as well as net yield on leverage assets and net impact on common assets due to leverage for the one-year period ended December 31, 2018 and annualized for the three-year and since-inception periods ended December 31, 2018.
After reviewing the foregoing and related factors, the Committee concluded that the Fund’s performance was acceptable.
Comparative Fees, Costs of Services Provided and the Profits Realized by the Adviser from Its Relationship with the Fund: The Committee compared the Fund’s contractual advisory fee (which includes the sub-advisory fee paid to the Sub-Adviser) calculated at average managed assets for the latest fiscal year,2 and the Fund’s net effective management fee and total net expense ratio, in each case as a percentage of average net assets for the latest fiscal year, to the peer group of funds and noted the Fund’s percentile rankings in this regard. The Committee also reviewed the average and median advisory fees (based on average net assets) and expense ratios, including expense ratio components (e.g., transfer agency fees, administration fees and other operating expenses) of the peer group of funds.
The Committee observed that the Fund’s contractual advisory fee based on average managed assets and net effective management fee (representing the combined effective advisory fee and
2 | Contractual advisory fee represents the percentile ranking of the Fund’s contractual advisory fee relative to peers assuming that the contractual advisory fee for each fund in the peer group is calculated on the basis of the Fund’s average managed assets. |
60 l GGM l GUGGENHEIM CREDIT ALLOCATION FUND ANNUAL REPORT| | |
APPROVAL OF ADVISORY AGREEMENTS – GUGGENHEIM CREDIT | |
ALLOCATION FUND (GGM) continued | May 31, 2019 |
administration fee) on average net assets each rank in the first quartile (each 25th percentile) of its peer group; and the Fund’s total net expense ratio (excluding interest expense) on average net assets ranks in the second quartile (38th percentile) of its peer group.
The Committee also noted that the Adviser did not identify any other clients or accounts considered to have similar investment strategies and policies as the Fund.
With respect to the costs of services provided and profits realized by Guggenheim Investments from its relationship with the Fund, the Committee reviewed a profitability analysis and data from management setting forth the average assets under management for the twelve months ended December 31, 2018, gross revenues received by Guggenheim Investments, expenses allocated to the Fund, earnings and the operating margin/profitability rate, including variance information relative to the foregoing amounts as of December 31, 2017. In addition, the Chief Financial Officer of Guggenheim Investments reviewed with, and addressed questions from, the Committee concerning the expense allocation methodology employed in producing the profitability analysis.
In the course of its review of Guggenheim Investments’ profitability, the Committee took into account the methods used by Guggenheim Investments to determine expenses and profit. The Committee considered all of the foregoing in evaluating the costs of services provided, the profitability to Guggenheim Investments and the profitability rates presented, and concluded that the profits were not unreasonable.
The Committee considered other benefits available to the Adviser because of its relationship with the Fund and noted Guggenheim’s statement that it does not believe the Adviser derives any such “fallout” benefits. In this regard, the Committee noted Guggenheim’s statement that, although it does not consider such benefits to be fall-out benefits, the Adviser may benefit from marketing synergies arising from offering a broad spectrum of products, including the Fund.
Economies of Scale: The Committee received and considered information regarding whether there have been economies of scale with respect to the management of the Fund as the Fund’s assets grow, whether the Fund has appropriately benefited from any economies of scale, and whether there is potential for realization of any further economies of scale. The Committee considered whether economies of scale in the provision of services to the Fund were being passed along to the shareholders. The Committee considered that advisory fee breakpoints generally are not relevant given the structural nature of closed-end funds, which, though able to conduct additional share offerings periodically, do not continuously offer new shares and thus, do not experience daily inflows and outflows of capital. In addition, the Committee took into account that given the relative size of the Fund, Guggenheim does not believe breakpoints are appropriate at this time. The Committee also noted the additional shares offered by the Fund through secondary offerings in the past and considered that to the extent the Fund’s assets increase over time (whether through additional periodic offerings or internal growth from asset appreciation), the Fund and its shareholders should realize economies of scale as certain expenses, such as fixed fund fees, become a smaller percentage of overall assets. The Committee also took into account the competitiveness of the Fund’s contractual advisory fee (based on average managed assets), which ranks in the first quartile of its peer group.
GGM l GUGGENHEIM CREDIT ALLOCATION FUND ANNUAL REPORT l 61| | |
APPROVAL OF ADVISORY AGREEMENTS – GUGGENHEIM CREDIT | |
ALLOCATION FUND (GGM) continued | May 31, 2019 |
Based on the foregoing, Committee determined that the Fund’s advisory fee was reasonable.
Sub-Advisory Agreement
Nature, Extent and Quality of Services Provided by the Sub-Adviser: As noted above, because both the Adviser and Sub-Adviser for the Fund—GFIA and GPIM, respectively—are part of Guggenheim Investments and the services provided by the Adviser on the one hand and the Sub-Adviser on the other cannot be ascribed to distinct legal entities, the Committee did not evaluate the services provided under the Investment Advisory Agreement and Sub-Advisory Agreement separately. Therefore, the Committee considered the qualifications, experience and skills of the Fund’s portfolio management team in connection with the Committee’s evaluation of Guggenheim’s investment professionals under the Investment Advisory Agreement.
With respect to Guggenheim’s resources and the Sub-Adviser’s ability to carry out its responsibilities under the Sub-Advisory Agreement, as noted above, the Committee considered the financial condition of GPIMH and the various entities comprising Guggenheim Investments. (Thereafter, the Committee received the audited consolidated financial statements of GPIM.)
The Committee also considered the acceptability of the terms of the Sub-Advisory Agreement, including the scope of services required to be performed by the Sub-Adviser.
Investment Performance: The Committee considered the returns of the Fund under its evaluation of the Investment Advisory Agreement.
Comparative Fees, Costs of Services Provided and the Profits Realized by the Sub-Adviser from Its Relationship with the Fund: The Committee considered that the Sub-Advisory Agreement is with an affiliate of the Adviser, that the Adviser compensates the Sub-Adviser from its own fees so that the sub-advisory fee rate with respect to the Fund does not impact the fees paid by the Fund and that the Sub-Adviser’s revenues were included in the calculation of Guggenheim Investments’ profitability. Given its determination of the reasonableness of the advisory fee, the Committee concluded that the sub-advisory fee rate for the Fund was not unreasonable.
Economies of Scale: The Committee recognized that, because the Sub-Adviser’s fees are paid by the Adviser and not the Fund, the analysis of economies of scale was more appropriate in the context of the Committee’s consideration of the Investment Advisory Agreement, which was separately considered. (See “Investment Advisory Agreement – Economies of Scale” above.)
Overall Conclusions
Based on the foregoing, the Committee determined that the investment advisory fees are fair and reasonable in light of the extent and quality of the services provided and other benefits received and that the continuation of each Advisory Agreement is in the best interest of the Fund. In reaching this conclusion, no single factor was determinative or conclusive and each Committee member, in the exercise of his business judgment, may afford different weights to different factors. At the May Meeting, the Committee, constituting all of the Independent Trustees, recommended the renewal of each Advisory Agreement for an additional annual term.
62 l GGM l GUGGENHEIM CREDIT ALLOCATION FUND ANNUAL REPORT| | |
DIVIDEND REINVESTMENT PLAN (Unaudited) | May 31, 2019 |
Unless the registered owner of common shares elects to receive cash by contacting Computershare Trust Company, N.A. (the “Plan Administrator”), all dividends declared on common shares of the Fund will be automatically reinvested by the Plan Administrator for shareholders in the Fund’s Dividend Reinvestment Plan (the “Plan”), in additional common shares of the Fund. Participation in the Plan is completely voluntary and may be terminated or resumed at any time without penalty by notice if received and processed by the Plan Administrator prior to the dividend record date; otherwise such termination or resumption will be effective with respect to any subsequently declared dividend or other distribution. Some brokers may automatically elect to receive cash on your behalf and may re-invest that cash in additional common shares of the Fund for you. If you wish for all dividends declared on your common shares of the Fund to be automatically reinvested pursuant to the Plan, please contact your broker.
The Plan Administrator will open an account for each common shareholder under the Plan in the same name in which such common shareholder’s common shares are registered. Whenever the Fund declares a dividend or other distribution (together, a “Dividend”) payable in cash, nonparticipants in the Plan will receive cash and participants in the Plan will receive the equivalent in common shares. The common shares will be acquired by the Plan Administrator for the participants’ accounts, depending upon the circumstances described below, either (i) through receipt of additional unissued but authorized common shares from the Fund (“Newly Issued Common Shares”) or (ii) by purchase of outstanding common shares on the open market (“Open-Market Purchases”) on the New York Stock Exchange or elsewhere. If, on the payment date for any Dividend, the closing market price plus estimated brokerage commission per common share is equal to or greater than the net asset value per common share, the Plan Administrator will invest the Dividend amount in Newly Issued Common Shares on behalf of the participants. The number of Newly Issued Common Shares to be credited to each participant’s account will be determined by dividing the dollar amount of the Dividend by the net asset value per common share on the payment date; provided that, if the net asset value is less than or equal to 95% of the closing market value on the payment date, the dollar amount of the Dividend will be divided by 95% of the closing market price per common share on the payment date. If, on the payment date for any Dividend, the net asset value per common share is greater than the closing market value plus estimated brokerage commission, the Plan Administrator will invest the Dividend amount in common shares acquired on behalf of the participants in Open-Market Purchases.
If, before the Plan Administrator has completed its Open-Market Purchases, the market price per common share exceeds the net asset value per common share, the average per common share purchase price paid by the Plan Administrator may exceed the net asset value of the common shares, resulting in the acquisition of fewer common shares than if the Dividend had been paid in Newly Issued Common Shares on the Dividend payment date. Because of the foregoing difficulty with respect to Open-Market Purchases, the Plan provides that if the Plan Administrator is unable to invest the full Dividend amount in Open-Market Purchases during the purchase period or if the market discount shifts to a market premium during the purchase period, the Plan Administrator may cease making Open-Market Purchases and may invest the uninvested portion of the Dividend amount in Newly Issued Common Shares at net asset value per common share at the close of business on the Last Purchase Date provided that, if the net asset value is less than or equal to 95% of the then current market price per common share; the dollar amount of the Dividend will be divided by 95% of the market price on the payment date.
GGM l GUGGENHEIM CREDIT ALLOCATION FUND ANNUAL REPORT l 63| | |
DIVIDEND REINVESTMENT PLAN (Unaudited) continued | May 31, 2019 |
The Plan Administrator maintains all shareholders’ accounts in the Plan and furnishes written confirmation of all transactions in the accounts, including information needed by shareholders for tax records. Common shares in the account of each Plan participant will be held by the Plan Administrator on behalf of the Plan participant, and each shareholder proxy will include those shares purchased or received pursuant to the Plan. The Plan Administrator will forward all proxy solicitation materials to participants and vote proxies for shares held under the Plan in accordance with the instruction of the participants.
There will be no brokerage charges with respect to common shares issued directly by the Fund. However, each participant will pay a pro rata share of brokerage commission incurred in connection with Open-Market Purchases. The automatic reinvestment of Dividends will not relieve participants of any Federal, state or local income tax that may be payable (or required to be withheld) on such Dividends.
The Fund reserves the right to amend or terminate the Plan. There is no direct service charge to participants with regard to purchases in the Plan; however, the Fund reserves the right to amend the Plan to include a service charge payable by the participants.
All correspondence or questions concerning the Plan should be directed to the Plan Administrator, Computershare Trust Company, N.A., P.O. Box 30170 College Station, TX 77842-3170: Attention: Shareholder Services Department, Phone Number: (866) 488-3559 or online at www.computershare.com/investor.
64 l GGM l GUGGENHEIM CREDIT ALLOCATION FUND ANNUAL REPORT| | |
FUND INFORMATION | May 31, 2019 |
| Board of Trustees Randall C. Barnes Donald A. Chubb, Jr. Jerry B. Farley Roman Friedrich III Amy J. Lee* Ronald A. Nyberg Ronald E. Toupin, Jr., Chairman * Trustee is an “interested person” (as de- fined in Section 2(a)(19) of the 1940 Act) (“Interested Trustee”) of the Fund because of her position as President of the Invest- ment Adviser and Sub-Adviser. Principal Executive Officers Brian E. Binder President and Chief Executive Officer Joanna M. Catalucci Chief Compliance Officer Amy J. Lee Vice President and Chief Legal Officer Mark E. Mathiasen Secretary John L. Sullivan Chief Financial Officer, Chief Accounting Officer and Treasurer | Investment Adviser Guggenheim Funds Investment Advisors, LLC Chicago, IL Investment Sub-Adviser Guggenheim Partners Investment Management, LLC Santa Monica, CA Administrator and Accounting Agent MUFG Investor Services (US), LLC Rockville, MD Custodian The Bank of New York Mellon Corp. New York, NY Legal Counsel Skadden, Arps, Slate, Meagher & Flom LLP New York, NY Independent Registered Public Accounting Firm Ernst & Young LLP Tysons, VA |
GGM l GUGGENHEIM CREDIT ALLOCATION FUND ANNUAL REPORT l 65| | |
FUND INFORMATION continued | May 31, 2019 |
Privacy Principles of Guggenheim Credit Allocation Fund for Shareholders
The Fund is committed to maintaining the privacy of its shareholders and to safeguarding its non-public personal information. The following information is provided to help you understand what personal information the Fund collects, how we protect that information and why, in certain cases, we may share information with select other parties.
Generally, the Fund does not receive any non-public personal information relating to its shareholders, although certain non-public personal information of its shareholders may become available to the Fund. The Fund does not disclose any non-public personal information about its shareholders or former shareholders to anyone except as permitted by law or as is necessary in order to service shareholder accounts (for example, to a transfer agent or third party administrator).
The Fund restricts access to non-public personal information about the shareholders to Guggenheim Funds Investment Advisors, LLC employees with a legitimate business need for the information. The Fund maintains physical, electronic and procedural safeguards designed to protect the non-public personal information of its shareholders.
Questions concerning your shares of Guggenheim Credit Allocation Fund?
| · | If your shares are held in a Brokerage Account, contact your Broker. |
| · | If you have physical possession of your shares in certificate form, contact the Fund’s Transfer Agent:
Computershare Trust Company, N.A., P.O. Box 30170 College Station, TX 77842-3170; (866) 488-3559 or online at www.computershare.com/investor |
This report is sent to shareholders of Guggenheim Credit Allocation Fund for their information. It is not a Prospectus, circular or representation intended for use in the purchase or sale of shares of the Fund or of any securities mentioned in this report.
A description of the Fund’s proxy voting policies and procedures related to portfolio securities is available without charge, upon request, by calling the Fund at (888) 991-0091.
Information regarding how the Fund voted proxies for portfolio securities, if applicable, during the most recent 12-month period ended June 30, is also available, without charge and upon request by calling (888) 991-0091, by visiting the Fund’s website at guggenheiminvestments.com/ggm or by accessing the Fund’s Form N-PX on the U.S. Securities and Exchange Commission’s (SEC) website at www.sec.gov.
The Fund files its complete schedule of portfolio holdings with the SEC for the first and third quarters of each fiscal year on Form N-Q. The Fund’s Form N-Q is available on the SEC website at www.sec.gov or at guggenheiminvestments.com/ggm. The Fund’s Form N-Q may also be viewed and copied at the SEC’s Public Reference Room in Washington, DC; information on the operation of the Public Reference Room may be obtained by calling (800) SEC-0330.
Notice to Shareholders
Notice is hereby given in accordance with Section 23(c) of the Investment Company Act of 1940, as amended, that the Fund from time to time may purchase shares of its common stock in the open market or in private transactions.
66 l GGM l GUGGENHEIM CREDIT ALLOCATION FUND ANNUAL REPORT
This Page Intentionally Left Blank
GGM l GUGGENHEIM CREDIT ALLOCATION FUND ANNUAL REPORT l 67
This Page Intentionally Left Blank
68 l GGM l GUGGENHEIM CREDIT ALLOCATION FUND ANNUAL REPORT
This Page Intentionally Left Blank
GGM l GUGGENHEIM CREDIT ALLOCATION FUND ANNUAL REPORT l 69
This Page Intentionally Left Blank
70 l GGM l GUGGENHEIM CREDIT ALLOCATION FUND ANNUAL REPORT
This Page Intentionally Left Blank
GGM l GUGGENHEIM CREDIT ALLOCATION FUND ANNUAL REPORT l 71| | |
ABOUT THE FUND MANAGERS | May 31, 2019 |
Guggenheim Partners Investment Management, LLC
Guggenheim Partners Investment Management, LLC (“GPIM”) is an indirect subsidiary of Guggenheim Partners, LLC, a diversified financial services firm. The firm provides capital markets services, portfolio and risk management expertise, wealth management, and investment advisory services. Clients of Guggenheim Partners, LLC subsidiaries are an elite mix of individuals, family offices, endowments, foundations, insurance companies and other institutions.
Investment Philosophy
GPIM’s investment philosophy is predicated upon the belief that thorough research and independent thought are rewarded with performance that has the potential to outperform benchmark indices with both lower volatility and lower correlation of returns over time as compared to such benchmark indices.
Investment Process
GPIM’s investment process is a collaborative effort between various groups including the Portfolio Construction Group, which utilize proprietary portfolio construction and risk modeling tools to determine allocation of assets among a variety of sectors, and its Sector Specialists, who are responsible for security selection within these sectors and for implementing securities transactions, including the structuring of certain securities directly with the issuers or with investment banks and dealers involved in the origination of such securities.
Guggenheim Funds Distributors, LLC
227 West Monroe Street
Chicago, IL 60606
Member FINRA/SIPC
(07/19)
NOT FDIC-INSURED l NOT BANK-GUARANTEED l MAY LOSE VALUE
CEF-GGM-AR-0519