UNITED STATES
SECURITIES AND EXCHANGE COMMISSION
Washington, D.C. 20549
FORM N-CSR
CERTIFIED SHAREHOLDER REPORT OF REGISTERED MANAGEMENT INVESTMENT COMPANIES
Investment Company Act file number 811-22717
First Trust Exchange-Traded Fund VI
(Exact name of registrant as specified in charter)
120 East Liberty Drive, Suite 400
Wheaton, IL 60187
(Address of principal executive offices) (Zip code)
W. Scott Jardine, Esq.
First Trust Portfolios L.P.
120 East Liberty Drive, Suite 400
Wheaton, IL 60187
(Name and address of agent for service)
Registrant’s telephone number, including area code: (630) 765-8000
Date of fiscal year end: March 31
Date of reporting period: September 30, 2022
Form N-CSR is to be used by management investment companies to file reports with the Commission not later than 10 days after the transmission to stockholders of any report that is required to be transmitted to stockholders under Rule 30e-1 under the Investment Company Act of 1940 (17 CFR 270.30e-1). The Commission may use the information provided on Form N-CSR in its regulatory, disclosure review, inspection, and policymaking roles.
A registrant is required to disclose the information specified by Form N-CSR, and the Commission will make this information public. A registrant is not required to respond to the collection of information contained in Form N-CSR unless the Form displays a currently valid Office of Management and Budget (“OMB”) control number. Please direct comments concerning the accuracy of the information collection burden estimate and any suggestions for reducing the burden to Secretary, Securities and Exchange Commission, 100 F Street, NE, Washington, DC 20549p. The OMB has reviewed this collection of information under the clearance requirements of 44 U.S.C. § 3507.
Item 1. Report to Stockholders.
(a) The registrant’s semi-annual report transmitted to shareholders pursuant to Rule 30e-1 under the Investment Company Act of 1940 is as follows:
First Trust Exchange-Traded Fund VI
First Trust Nasdaq Bank ETF (FTXO)
First Trust Nasdaq Food & Beverage ETF (FTXG)
First Trust Nasdaq Oil & Gas ETF (FTXN)
First Trust Nasdaq Pharmaceuticals ETF (FTXH)
First Trust S-Network E-Commerce ETF (ISHP)
(formerly known as First Trust Nasdaq Retail ETF)
First Trust Nasdaq Semiconductor ETF (FTXL)
First Trust Nasdaq Transportation ETF (FTXR)
First Trust S-Network Streaming & Gaming ETF (BNGE)
Semi-Annual Report
For the Period Ended
September 30, 2022
First Trust Exchange-Traded Fund VI
Semi-Annual Report
September 30, 2022
Caution Regarding Forward-Looking Statements
This report contains certain forward-looking statements within the meaning of the Securities Act of 1933, as amended, and the Securities Exchange Act of 1934, as amended. Forward-looking statements include statements regarding the goals, beliefs, plans or current expectations of First Trust Advisors L.P. (“First Trust” or the “Advisor”) and its representatives, taking into account the information currently available to them. Forward-looking statements include all statements that do not relate solely to current or historical fact. For example, forward-looking statements include the use of words such as “anticipate,” “estimate,” “intend,” “expect,” “believe,” “plan,” “may,” “should,” “would” or other words that convey uncertainty of future events or outcomes.
Forward-looking statements involve known and unknown risks, uncertainties and other factors that may cause the actual results, performance or achievements of any series of First Trust Exchange-Traded Fund VI (the “Trust”) described in this report (each such series is referred to as a “Fund” and collectively, the “Funds”) to be materially different from any future results, performance or achievements expressed or implied by the forward-looking statements. When evaluating the information included in this report, you are cautioned not to place undue reliance on these forward-looking statements, which reflect the judgment of the Advisor and its representatives only as of the date hereof. We undertake no obligation to publicly revise or update these forward-looking statements to reflect events and circumstances that arise after the date hereof.
Performance and Risk Disclosure
There is no assurance that any Fund described in this report will achieve its investment objective. Each Fund is subject to market risk, which is the possibility that the market values of securities owned by the Fund will decline and that the value of the Fund’s shares may therefore be less than what you paid for them. Accordingly, you can lose money by investing in a Fund. See “Risk Considerations” in the Additional Information section of this report for a discussion of certain other risks of investing in the Funds.
Performance data quoted represents past performance, which is no guarantee of future results, and current performance may be lower or higher than the figures shown. For the most recent month-end performance figures, please visit www.ftportfolios.com or speak with your financial advisor. Investment returns, net asset value and share price will fluctuate and Fund shares, when sold, may be worth more or less than their original cost.
The Advisor may also periodically provide additional information on Fund performance on each Fund’s web page at www.ftportfolios.com.
How to Read This Report
This report contains information that may help you evaluate your investment. It includes details about each Fund and presents data and analysis that provide insight into each Fund’s performance and investment approach.
By reading the market overview by Robert F. Carey, Chief Market Strategist of the Advisor, you may obtain an understanding of how the market environment affected the performance of each Fund. The statistical information that follows may help you understand each Fund’s performance compared to that of relevant market benchmarks.
It is important to keep in mind that the opinions expressed by personnel of the Advisor are just that: informed opinions. They should not be considered to be promises or advice. The opinions, like the statistics, cover the period through the date on the cover of this report. The material risks of investing in each Fund are spelled out in the prospectus, the statement of additional information, and other Fund regulatory filings.
First Trust Exchange-Traded Fund VI
Semi-Annual Letter from the Chairman and CEO
September 30, 2022
Dear Shareholders,
First Trust is pleased to provide you with the semi-annual report for certain series of the First Trust Exchange-Traded Fund VI (the “Funds”), which contains detailed information about the Funds for the six months ended September 30, 2022.
It is times like these that really test the mettle of investors. Are you someone that is implementing an investment plan with a long time horizon, a trader by nature, or do you fall somewhere in between? Frankly, the current climate is challenging for just about any strategy. While most investors are accustomed to dealing with high levels of volatility in the stock market, some of the daily swings we have witnessed lately have not only been uncharacteristically sharp but have occasionally seemed nearly inexplicable, in my opinion.
In case you have not noticed, volatility is also elevated in the fixed-income market. Bond valuations are down big in 2022. Year-to-date through October 31, 2022, the ICE BofA 15+ Year U.S. Treasury Index experienced a price decline of 33.51%, according to Bloomberg. It was down 31.87% on a total return basis, which includes reinvested interest. To put this into perspective, over the past 40 years, the worst annual showing by the U.S. Long-Term Government Bond Index (20-Year) tracked by Morningstar was the -14.90% total return posted in 2009 (think 2008-2009 global financial crisis). For those who may be unaware, investors benefitted from a trend of declining bond yields from September 1981 through August 2020. While that is an incredible run, nothing lasts forever. Suffice it to say, a lot of pain has been endured by investors in the markets this year and we believe there could be more to come in the near-term. The aggressive interest rate hikes by the Federal Reserve (the “Fed”) are a signal to the markets that it is behind the inflation curve. Moving forward, the Fed will be looking to lower inflation while simultaneously engineering a soft landing in the economy. That will be easier said than done, in my opinion.
There are far more headwinds challenging the securities markets than tailwinds. Here are just a few of those headwinds: stubbornly high inflation; additional rate hikes expected from the Fed from their November and December 2022 meetings, which could potentially push bond yields higher; the ongoing war between Russia and Ukraine, which is impacting the supply and prices of crude oil and natural gas; China enforcing a zero-tolerance policy to combat the spread of the coronavirus by locking down entire cities to its own economic detriment; and the potential for food and energy shortages this coming winter. With the housing market looking like it is finally cooling off, due largely to a huge spike in mortgage rates this year, which were up more than double the rate at the start of the year, the last big tailwind standing may just be the strong U.S. labor market. If the job market can hang in there, the Fed’s goal of a soft landing for the economy may be attainable. I think we will have a clearer picture of things at the start of 2023.
Year-to-date through October 31, 2022, the S&P 500® Index (the “Index”) posted a total return of -17.70%, according to Bloomberg, which puts the Index in bear market territory. A bear market is defined as a 20% or greater decline in the price of a security or index from its most recent peak. While the 17.70% decline in the Index would technically qualify as a stock market correction, investors should continue to view the current downturn as a bear market, in my opinion. Keep in mind, since World War II, there have been 12 bear markets in the Index, excluding the current bear market, according to Yardeni Research. The average price decline of those 12 bear markets was 33.6%. The average price gain over the 12-months following the trough reached during those bear markets was 40.8%, according to Bloomberg. Bear markets come and go. You can’t catch the turn if you are not in the market when the turn comes.
Thank you for giving First Trust the opportunity to play a role in your financial future. We value our relationship with you and will report on the Funds again in six months.
Sincerely,
James A. Bowen
Chairman of the Board of Trustees
Chief Executive Officer of First Trust Advisors L.P.
First Trust Exchange-Traded Fund VI
Semi-Annual Report
September 30, 2022
Robert F. Carey, CFA
Senior Vice President and Chief Market Strategist
First Trust Advisors L.P.
Mr. Carey is responsible for the overall management of research and analysis of the First Trust product line. Mr. Carey has more than 30 years of experience as an Equity and Fixed-Income Analyst and is a recipient of the Chartered Financial Analyst (“CFA”) designation. He is a graduate of the University of Illinois at Champaign-Urbana with a B.S. in Physics. He is also a member of the Investment Analysts Society of Chicago and the CFA Institute. Mr. Carey has appeared as a guest on such programs as Bloomberg TV, CNBC, and WBBM Radio, and has been quoted by several publications, including The Wall Street Journal, The Wall Street Reporter, Bloomberg News Service, and Registered Rep.
State of the Global Economy
The International Monetary Fund (“IMF”) reported in its October release that global gross domestic product (“GDP”) growth is expected to come in at 3.2% in 2022 and 2.7% in 2023, down from 6.0% in 2021. The IMF sees the U.S. economy growing 1.6% in 2022 and 1.0% in 2023, down from 5.7% in 2021. With respect to all Advanced Economies, the IMF is projecting GDP growth of 2.4% in 2022 and 1.1% in 2023, down from 5.2% in 2021. Lastly, it sees Emerging Markets and Developing Economies growing 3.7% in 2022 and 3.7% again in 2023, down from 6.6% in 2021. From 1970 to 2021, the average global GDP growth rate was 3.6%, according to the IMF. Looking ahead, the IMF notes that the global economy must navigate three key pressures: the war in Ukraine, world-wide inflation and continued economic headwinds in the U.S., Europe and China.
Russia’s war with Ukraine continues to destabilize the global economy, increasing the cost of living and impeding economic growth. European natural gas prices have spiked four-fold since 2021, according to the IMF. Russia has decreased natural gas deliveries to Europe by over 80% of their 2021 total, greatly increasing the likelihood of an energy shortage. Worldwide inflationary pressures continue to fester, with global inflation forecast to surge to 8.8% in 2022, up from 4.7% in 2021. Central banks have rapidly tightened monetary policy in response, and will likely have to continue to do so, in our opinion. These tighter financial conditions have produced significant headwinds to growth among most major economies and are likely to have at least some impact in 2023.
Performance of Global Stocks and Bonds
U.S. equities have turned negative over the past six-month period. The S&P 500® (the “Index”), S&P MidCap 400® and S&P SmallCap 600® Indices posted total returns of -20.20%, -17.50% and -18.58%, respectively, for the six-month period ended September 30, 2022, according to Bloomberg. Value stocks outperformed growth stocks over the period. The S&P 500® Value Index posted a total return of -16.43% versus -23.87% for the S&P 500® Growth Index; an indication that investors may be anticipating slower growth over the near-term and are opting for companies that are trading at more attractive valuations. All eleven sectors that comprise the Index were down on a total return basis. Energy was down least for the period, losing 2.94%, while the worst showing came from Communication Services, down 30.79%.
A Bloomberg survey of 23 equity strategists found that the average 2022 year-end price target for the Index was 4,346 as of September 15, 2022, down from 4,376 on August 16, 2022, according to its own release. Heading into 2022 (December 16, 2021), strategists had an average target of 4,950. The highest and lowest estimates on September 15, 2022, were 5,100 and 3,400, respectively. On September 15, 2022, the Index closed at 3,901.35, which was 18.66% below its all-time closing high of 4,796.56 on January 3, 2022. As of September 30, 2022, Bloomberg’s 2022, 2023 and 2024 consensus earnings growth rate estimates for the Index stood at 9.61%, 6.14% and 8.44%, respectively.
The performance of foreign equities continues to lag that of major U.S. stock indices. Over the past six months, the MSCI World ex USA and MSCI Emerging Markets equity indices posted total returns of -22.50% (USD) and -21.70% (USD), respectively, according to Bloomberg. Major foreign bond indices were also in negative territory. The Bloomberg Global Aggregate Index of higher quality debt posted a total return of -14.63% (USD), while the EM Hard Currency Aggregate Index of emerging markets debt fell by 13.90% (USD), according to Bloomberg. Over that same period, the U.S. dollar surged by 14.04% against a basket of major currencies, as measured by the U.S. Dollar Index (DXY), pressuring the returns on unhedged foreign securities held by U.S. investors.
U.S. bond indices have not been immune to the aggressive tightening of monetary policy by central banks, particularly the U.S. Federal Reserve. Over the past six months, the best performing index we track was the U.S. Treasury: Intermediate Index, which posted a total return of -4.69%. The worst performer was the Municipal Long Bond: Long Bond (22+), which posted a total return of -12.15%. The yield on the benchmark 10-Year Treasury Note (“T-Note”) rose by 149 basis points (a 63.70% increase over the period) to close at 3.83%, according to Bloomberg. For comparative purposes, the average yield on the 10-Year T-Note was 2.10% for the 10-year period ended September 30, 2022.
Fund Performance Overview (Unaudited)
First Trust Nasdaq Bank ETF (FTXO)
The First Trust Nasdaq Bank ETF (the “Fund”) seeks investment results that correspond generally to the price and yield (before the Fund’s fees and expenses) of an equity index called the Nasdaq US Smart Banks IndexTM (the “Index”). The shares of the Fund are listed and trade on The Nasdaq Stock Market LLC under the ticker symbol “FTXO.” The Fund will normally invest at least 90% of its net assets (including investment borrowings) in the common stocks and depositary receipts that comprise the Index. The Index is owned and is developed, maintained and sponsored by Nasdaq, Inc. (the “Index Provider”).
The Index is designed to provide exposure to U.S. companies comprising the banking sector that have been selected based upon their liquidity and weighted based upon their cumulative score on three investing factors: volatility, value and growth. The Index’s initial selection universe consists of the component securities of the Nasdaq US Benchmark Index that have been classified as comprising the banking sector according to the Industry Classification Benchmark. The Nasdaq US Benchmark Index is an index seeking to track the performance of small, mid and large capitalization U.S. companies. This classification includes companies providing a broad range of financial services, including retail banking, loans and money transmissions.
| Performance | | | | | | |
| | | | Average Annual Total Returns | | Cumulative Total Returns |
| | 6 Months
Ended
9/30/22 | 1 Year
Ended
9/30/22 | 5 Years
Ended
9/30/22 | Inception
(9/20/16)
to 9/30/22 | | 5 Years
Ended
9/30/22 | Inception
(9/20/16)
to 9/30/22 |
| Fund Performance | | | | | | | |
| NAV | -17.16% | -18.52% | 1.40% | 6.89% | | 7.22% | 49.44% |
| Market Price | -17.18% | -18.54% | 1.41% | 6.90% | | 7.26% | 49.50% |
| Index Performance | | | | | | | |
| Nasdaq US Smart Banks IndexTM | -16.98% | -18.10% | 2.06% | 7.60% | | 10.76% | 55.50% |
| Nasdaq US Benchmark Banks Index | -19.12% | -23.82% | 2.31% | 8.02% | | 12.11% | 59.17% |
| Nasdaq US Benchmark Index | -20.68% | -18.01% | 8.68% | 10.51% | | 51.60% | 82.63% |
(See Notes to Fund Performance Overview on page 20.)
Nasdaq® and Nasdaq US Smart Banks IndexTM are registered trademarks and service marks of Nasdaq, Inc. (together with its affiliates hereinafter referred to as the “Corporations”) and are licensed for use by First Trust. The Fund has not been passed on by the Corporations as to its legality or suitability. The Fund is not issued, endorsed, sold or promoted by the Corporations. THE CORPORATIONS MAKE NO WARRANTIES AND BEAR NO LIABILITY WITH RESPECT TO THE FUND.
Fund Performance Overview (Unaudited) (Continued)
First Trust Nasdaq Bank ETF (FTXO) (Continued)
| Sector Allocation | % of Total
Investments |
| Financials | 100.0% |
| Total | 100.0% |
| Top Ten Holdings | % of Total
Investments |
| M&T Bank Corp. | 8.1% |
| Popular, Inc. | 8.1 |
| Regions Financial Corp. | 8.0 |
| Wells Fargo & Co. | 8.0 |
| New York Community Bancorp, Inc. | 7.5 |
| Cullen/Frost Bankers, Inc. | 4.4 |
| Old National Bancorp | 4.3 |
| First Citizens BancShares, Inc., Class A | 4.2 |
| PNC Financial Services Group (The), Inc. | 4.1 |
| Synovus Financial Corp. | 4.0 |
| Total | 60.7% |

Performance figures assume reinvestment of all distributions and do not reflect the deduction of taxes that a shareholder would pay on Fund distributions or the redemption or sale of Fund shares. An index is a statistical composite that tracks a specified financial market or sector. Unlike the Fund, the indices do not actually hold a portfolio of securities and therefore do not incur the expenses incurred by the Fund. These expenses negatively impact the performance of the Fund. The Fund’s past performance does not predict future performance.
Frequency Distribution of Discounts and Premiums
Information showing the number of days the market price of the Fund’s shares was greater (at a premium) and less (at a discount) than the Fund’s net asset value for the most recently completed year, and the most recently completed calendar quarters since that year (or life of the Fund, if shorter), is available at https://www.ftportfolios.com/Retail/etf/home.aspx.
Fund Performance Overview (Unaudited) (Continued)
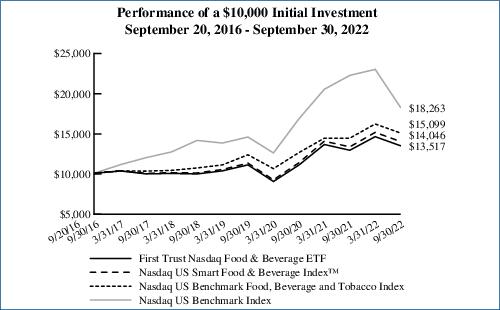
First Trust Nasdaq Food & Beverage ETF (FTXG)
The First Trust Nasdaq Food & Beverage ETF (the “Fund”) seeks investment results that correspond generally to the price and yield (before the Fund’s fees and expenses) of an equity index called the Nasdaq US Smart Food & Beverage IndexTM (the “Index”). The shares of the Fund are listed and trade on The Nasdaq Stock Market LLC under the ticker symbol “FTXG.” The Fund will normally invest at least 90% of its net assets (including investment borrowings) in the common stocks and depositary receipts that comprise the Index. The Index is owned and is developed, maintained and sponsored by Nasdaq, Inc. (the “Index Provider”).
The Index is designed to provide exposure to U.S. companies comprising the food and beverage sector that have been selected based upon their liquidity and weighted based upon their cumulative score on three investing factors: volatility, value and growth. The Index’s initial selection universe consists of the component securities of the Nasdaq US Benchmark Index that have been classified as comprising either the beverages sector or food producers sector according to the Industry Classification Benchmark (“ICB”). The Nasdaq US Benchmark Index is an index seeking to track the performance of small, mid and large capitalization U.S. companies. These classifications include: (i) manufacturers and shippers of cider or malt products; (ii) producers, distillers, vintners, blenders and shippers of wine and spirits; (iii) manufacturers, bottlers and distributors of non-alcoholic beverages; (iv) companies that grow crops or raise livestock, operate fisheries or own non-tobacco plantations; (v) food producers, including meatpacking, snacks, fruits, vegetables, dairy products and frozen seafood; (vi) producers of pet food; and (vii) manufacturers of dietary supplements, vitamins and related items.
| Performance | | | | | | |
| | | | Average Annual Total Returns | | Cumulative Total Returns |
| | 6 Months
Ended
9/30/22 | 1 Year
Ended
9/30/22 | 5 Years
Ended
9/30/22 | Inception
(9/20/16)
to 9/30/22 | | 5 Years
Ended
9/30/22 | Inception
(9/20/16)
to 9/30/22 |
| Fund Performance | | | | | | | |
| NAV | -7.76% | 4.27% | 6.16% | 5.13% | | 34.82% | 35.17% |
| Market Price | -7.82% | 4.35% | 6.15% | 5.14% | | 34.78% | 35.27% |
| Index Performance | | | | | | | |
| Nasdaq US Smart Food & Beverage IndexTM | -7.51% | 4.92% | 6.84% | 5.80% | | 39.18% | 40.46% |
| Nasdaq US Benchmark Food, Beverage and Tobacco Index | -6.99% | 4.35% | 7.80% | 7.07% | | 45.60% | 50.99% |
| Nasdaq US Benchmark Index | -20.68% | -18.01% | 8.68% | 10.51% | | 51.60% | 82.63% |
(See Notes to Fund Performance Overview on page 20.)
Nasdaq® and Nasdaq US Smart Food & Beverage IndexTM are registered trademarks and service marks of Nasdaq, Inc. (together with its affiliates hereinafter referred to as the “Corporations”) and are licensed for use by First Trust. The Fund has not been passed on by the Corporations as to its legality or suitability. The Fund is not issued, endorsed, sold or promoted by the Corporations. THE CORPORATIONS MAKE NO WARRANTIES AND BEAR NO LIABILITY WITH RESPECT TO THE FUND.
Fund Performance Overview (Unaudited) (Continued)
First Trust Nasdaq Food & Beverage ETF (FTXG) (Continued)
| Sector Allocation | % of Total
Investments |
| Consumer Staples | 96.0% |
| Materials | 4.0 |
| Total | 100.0% |
| Top Ten Holdings | % of Total
Investments |
| Kellogg Co. | 8.3% |
| General Mills, Inc. | 8.1 |
| Molson Coors Beverage Co., Class B | 7.8 |
| Campbell Soup Co. | 7.6 |
| Bunge Ltd. | 7.2 |
| Hostess Brands, Inc. | 4.3 |
| J.M. Smucker (The) Co. | 4.2 |
| Hershey (The) Co. | 4.2 |
| Conagra Brands, Inc. | 4.1 |
| PepsiCo, Inc. | 4.1 |
| Total | 59.9% |
Performance figures assume reinvestment of all distributions and do not reflect the deduction of taxes that a shareholder would pay on Fund distributions or the redemption or sale of Fund shares. An index is a statistical composite that tracks a specified financial market or sector. Unlike the Fund, the indices do not actually hold a portfolio of securities and therefore do not incur the expenses incurred by the Fund. These expenses negatively impact the performance of the Fund. The Fund’s past performance does not predict future performance.
Frequency Distribution of Discounts and Premiums
Information showing the number of days the market price of the Fund’s shares was greater (at a premium) and less (at a discount) than the Fund’s net asset value for the most recently completed year, and the most recently completed calendar quarters since that year (or life of the Fund, if shorter), is available at https://www.ftportfolios.com/Retail/etf/home.aspx.
Fund Performance Overview (Unaudited) (Continued)
First Trust Nasdaq Oil & Gas ETF (FTXN)
The First Trust Nasdaq Oil & Gas ETF (the “Fund”) seeks investment results that correspond generally to the price and yield (before the Fund’s fees and expenses) of an equity index called the Nasdaq US Smart Oil & Gas IndexTM (the “Index”). The shares of the Fund are listed and trade on The Nasdaq Stock Market LLC under the ticker symbol “FTXN.” The Fund will normally invest at least 90% of its net assets (including investment borrowings) in the common stocks and depositary receipts that comprise the Index. The Index is owned and is developed, maintained and sponsored by Nasdaq, Inc. (the “Index Provider”).
The Index is designed to provide exposure to U.S. companies comprising the oil and gas sector that have been selected based upon their liquidity and weighted based upon their cumulative score on three investing factors: volatility, value and growth. The Index’s initial selection universe consists of the component securities of the Nasdaq US Benchmark Index that have been classified as comprising either the oil & gas producers sector or the oil equipment, services & distribution sector according to the Industry Classification Benchmark (“ICB”). The Nasdaq US Benchmark Index is an index seeking to track the performance of small, mid and large capitalization U.S. companies. These classifications include: (i) companies engaged in the exploration for and drilling, production, refining and supply of oil and gas products; (ii) integrated oil and gas companies engaged in the exploration for, and drilling, production, refining, distribution and retail sales of, oil and gas products; (iii) suppliers of equipment and services to oil fields and offshore platforms, such as drilling, exploration, seismic-information services and platform construction; and (iv) operators of pipelines carrying oil, gas or other forms of fuel.
| Performance | | | | | | |
| | | | Average Annual Total Returns | | Cumulative Total Returns |
| | 6 Months
Ended
9/30/22 | 1 Year
Ended
9/30/22 | 5 Years
Ended
9/30/22 | Inception
(9/20/16)
to 9/30/22 | | 5 Years
Ended
9/30/22 | Inception
(9/20/16)
to 9/30/22 |
| Fund Performance | | | | | | | |
| NAV | -6.13% | 31.67% | 7.40% | 5.56% | | 42.89% | 38.54% |
| Market Price | -6.13% | 31.60% | 7.40% | 5.56% | | 42.89% | 38.55% |
| Index Performance | | | | | | | |
| Nasdaq US Smart Oil & Gas IndexTM | -6.01% | 32.32% | 8.09% | 6.22% | | 47.52% | 43.90% |
| Nasdaq US Benchmark Energy Index | -2.28% | 42.75% | 6.19% | 6.02% | | 35.06% | 42.23% |
| Nasdaq US Benchmark Index | -20.68% | -18.01% | 8.68% | 10.51% | | 51.60% | 82.63% |
(See Notes to Fund Performance Overview on page 20.)
Nasdaq® and Nasdaq US Smart Oil & Gas IndexTM are registered trademarks and service marks of Nasdaq, Inc. (together with its affiliates hereinafter referred to as the “Corporations”) and are licensed for use by First Trust. The Fund has not been passed on by the Corporations as to its legality or suitability. The Fund is not issued, endorsed, sold or promoted by the Corporations. THE CORPORATIONS MAKE NO WARRANTIES AND BEAR NO LIABILITY WITH RESPECT TO THE FUND.
Fund Performance Overview (Unaudited) (Continued)
First Trust Nasdaq Oil & Gas ETF (FTXN) (Continued)
| Sector Allocation | % of Total
Investments |
| Energy | 100.0% |
| Total | 100.0% |
| Top Ten Holdings | % of Total
Investments |
| PBF Energy, Inc., Class A | 9.3% |
| Occidental Petroleum Corp. | 7.8 |
| Chevron Corp. | 6.8 |
| Exxon Mobil Corp. | 6.8 |
| Williams (The) Cos., Inc. | 6.2 |
| Marathon Petroleum Corp. | 4.4 |
| ConocoPhillips | 4.2 |
| Kinder Morgan, Inc. | 4.1 |
| Marathon Oil Corp. | 4.0 |
| Valero Energy Corp. | 4.0 |
| Total | 57.6% |

Performance figures assume reinvestment of all distributions and do not reflect the deduction of taxes that a shareholder would pay on Fund distributions or the redemption or sale of Fund shares. An index is a statistical composite that tracks a specified financial market or sector. Unlike the Fund, the indices do not actually hold a portfolio of securities and therefore do not incur the expenses incurred by the Fund. These expenses negatively impact the performance of the Fund. The Fund’s past performance does not predict future performance.
Frequency Distribution of Discounts and Premiums
Information showing the number of days the market price of the Fund’s shares was greater (at a premium) and less (at a discount) than the Fund’s net asset value for the most recently completed year, and the most recently completed calendar quarters since that year (or life of the Fund, if shorter), is available at https://www.ftportfolios.com/Retail/etf/home.aspx.
Fund Performance Overview (Unaudited) (Continued)
First Trust Nasdaq Pharmaceuticals ETF (FTXH)
The First Trust Nasdaq Pharmaceuticals ETF (the “Fund”) seeks investment results that correspond generally to the price and yield (before the Fund’s fees and expenses) of an equity index called the Nasdaq US Smart Pharmaceuticals IndexTM (the “Index”). The shares of the Fund are listed and trade on The Nasdaq Stock Market LLC under the ticker symbol “FTXH.” The Fund will normally invest at least 90% of its net assets (including investment borrowings) in the common stocks and depositary receipts that comprise the Index. The Index is owned and is developed, maintained and sponsored by Nasdaq, Inc. (the “Index Provider”).
The Index is designed to provide exposure to U.S. companies comprising the pharmaceutical sector that have been selected based upon their liquidity and weighted based upon their cumulative score on three investing factors: volatility, value and growth. The Index’s initial selection universe consists of the component securities of the Nasdaq US Benchmark Index that have been classified as comprising the pharmaceuticals sub-sector according to the Industry Classification Benchmark. The Nasdaq US Benchmark Index is an index seeking to track the performance of small, mid and large capitalization U.S. companies. This classification includes vaccine producers and manufacturers of prescription or over-the-counter drugs.
| Performance | | | | | | |
| | | | Average Annual Total Returns | | Cumulative Total Returns |
| | 6 Months
Ended
9/30/22 | 1 Year
Ended
9/30/22 | 5 Years
Ended
9/30/22 | Inception
(9/20/16)
to 9/30/22 | | 5 Years
Ended
9/30/22 | Inception
(9/20/16)
to 9/30/22 |
| Fund Performance | | | | | | | |
| NAV | -9.33% | -4.71% | 4.63% | 4.14% | | 25.40% | 27.73% |
| Market Price | -9.08% | -4.71% | 4.65% | 4.16% | | 25.50% | 27.84% |
| Index Performance | | | | | | | |
| Nasdaq US Smart Pharmaceuticals IndexTM | -9.00% | -4.03% | 5.31% | 4.83% | | 29.53% | 32.91% |
| Nasdaq US Benchmark Pharmaceuticals Index | -5.48% | 10.20% | 10.94% | 11.18% | | 68.05% | 89.45% |
| Nasdaq US Benchmark Index | -20.68% | -18.01% | 8.68% | 10.51% | | 51.60% | 82.63% |
(See Notes to Fund Performance Overview on page 20.)
Nasdaq® and Nasdaq US Smart Pharmaceuticals IndexTM are registered trademarks and service marks of Nasdaq, Inc. (together with its affiliates hereinafter referred to as the “Corporations”) and are licensed for use by First Trust. The Fund has not been passed on by the Corporations as to its legality or suitability. The Fund is not issued, endorsed, sold or promoted by the Corporations. THE CORPORATIONS MAKE NO WARRANTIES AND BEAR NO LIABILITY WITH RESPECT TO THE FUND.
Fund Performance Overview (Unaudited) (Continued)
First Trust Nasdaq Pharmaceuticals ETF (FTXH) (Continued)
| Sector Allocation | % of Total
Investments |
| Health Care | 100.0% |
| Total | 100.0% |
| Top Ten Holdings | % of Total
Investments |
| Bristol-Myers Squibb Co. | 8.7% |
| Johnson & Johnson | 8.4 |
| Gilead Sciences, Inc. | 8.0 |
| Ironwood Pharmaceuticals, Inc. | 8.0 |
| Amgen, Inc. | 7.8 |
| Eli Lilly & Co. | 4.4 |
| Vertex Pharmaceuticals, Inc. | 4.3 |
| Merck & Co., Inc. | 4.2 |
| AbbVie, Inc. | 4.1 |
| Prestige Consumer Healthcare, Inc. | 4.1 |
| Total | 62.0% |

Performance figures assume reinvestment of all distributions and do not reflect the deduction of taxes that a shareholder would pay on Fund distributions or the redemption or sale of Fund shares. An index is a statistical composite that tracks a specified financial market or sector. Unlike the Fund, the indices do not actually hold a portfolio of securities and therefore do not incur the expenses incurred by the Fund. These expenses negatively impact the performance of the Fund. The Fund’s past performance does not predict future performance.
Frequency Distribution of Discounts and Premiums
Information showing the number of days the market price of the Fund’s shares was greater (at a premium) and less (at a discount) than the Fund’s net asset value for the most recently completed year, and the most recently completed calendar quarters since that year (or life of the Fund, if shorter), is available at https://www.ftportfolios.com/Retail/etf/home.aspx.
Fund Performance Overview (Unaudited) (Continued)
First Trust S-Network E-Commerce ETF (ISHP)
The First Trust S-Network E-Commerce ETF (the “Fund”), formerly the First Trust Nasdaq Retail ETF, seeks investment results that correspond generally to the price and yield (before the Fund’s fees and expenses) of an equity index called the S-Network Global E-Commerce IndexTM (the “Index”). The Fund lists and principally trades its shares on The Nasdaq Stock Market LLC under the symbol “ISHP.” The Fund will normally invest at least 90% of its net assets (plus any borrowings for investment purposes) in the common stocks and depository receipts that comprise the Index.
The Index seeks to provide exposure to companies with securities listed on recognized global securities exchanges that are principally engaged in the global e-commerce industry. According to VettaFi LLC, to be eligible for inclusion in the Index, a security must be issued by a company engaged in at least one of the four following business segments comprising the global e-commerce industry: (1) content navigation; (2) online retail; (3) online marketplace; and (4) e-commerce infrastructure. The Index is owned and is developed, maintained and sponsored by VettaFi LLC.
| Performance | | | | | | |
| | | | Average Annual Total Returns | | Cumulative Total Returns |
| | 6 Months
Ended
9/30/22 | 1 Year
Ended
9/30/22 | 5 Years
Ended
9/30/22 | Inception
(9/20/16)
to 9/30/22 | | 5 Years
Ended
9/30/22 | Inception
(9/20/16)
to 9/30/22 |
| Fund Performance | | | | | | | |
| NAV | -30.21% | -36.36% | 2.65% | 2.36% | | 13.94% | 15.07% |
| Market Price | -30.48% | -36.70% | 2.55% | 2.27% | | 13.42% | 14.48% |
| Index Performance | | | | | | | |
| S-Network Global E-Commerce IndexTM(1)(2) | -30.51% | -48.55% | N/A | N/A | | N/A | N/A |
| MSCI ACWI Index(3) | -21.41% | -20.66% | 4.44% | 6.89% | | 24.27% | 49.40% |
| Nasdaq US Smart Retail Index | -18.65% | -18.63% | 8.39% | 7.19% | | 49.61% | 52.00% |
| Nasdaq US Benchmark Retail Index | -21.41% | -21.95% | 12.90% | 12.58% | | 83.46% | 104.28% |
| Nasdaq US Benchmark Index | -20.68% | -18.01% | 8.68% | 10.51% | | 51.60% | 82.63% |
(See Notes to Fund Performance Overview on page 20.)
| (1) | On January 26, 2022, the Fund’s underlying index changed from the Nasdaq US Smart Retail Index to the S-Network Global E-Commerce IndexTM. Therefore, performance and historical returns shown for the periods prior to January 26, 2022, are not necessarily indicative of the performance of the Fund, based on its current Index, would have generated. |
| (2) | Because the Fund’s new underlying Index had an inception date of April 30, 2021, performance data is not available for all the periods shown in the table for the Index because performance data does not exist for some of the entire periods. |
| (3) | The MSCI ACWI Index serves as the Fund’s new primary benchmark index. The Fund’s investment advisor determined that the MSCI ACWI Index provides a more appropriate comparison to Fund returns. |
S-Network and S-Network Global E-Commerce IndexTM are service marks of VettaFi LLC and have been licensed for use by First Trust Advisors L.P. The Fund is not issued, sponsored, endorsed, sold or promoted by VettaFi LLC or its affiliates (collectively, “VettaFi”). VettaFi makes no representation or warranty, express or implied, to the purchasers or owners of the Fund or any member of the public regarding the advisability of investing in securities generally or in the Fund particularly or the ability of the Index to track general market performance.
Fund Performance Overview (Unaudited) (Continued)
First Trust S-Network E-Commerce ETF (ISHP) (Continued)
| Sector Allocation | % of Total
Investments |
| Consumer Discretionary | 37.2% |
| Communication Services | 22.0 |
| Industrials | 17.7 |
| Information Technology | 13.9 |
| Real Estate | 5.2 |
| Consumer Staples | 2.0 |
| Financials | 2.0 |
| Total | 100.0% |
| Top Ten Holdings | % of Total
Investments |
| Uber Technologies, Inc. | 2.3% |
| Pinterest, Inc., Class A | 2.2 |
| MercadoLibre, Inc. | 2.2 |
| PayPal Holdings, Inc. | 2.2 |
| Twitter, Inc. | 2.2 |
| CoStar Group, Inc. | 2.2 |
| Airbnb, Inc., Class A | 2.1 |
| KE Holdings, Inc., ADR | 2.0 |
| Walmart, Inc. | 2.0 |
| Coupang, Inc. | 2.0 |
| Total | 21.4% |

Performance figures assume reinvestment of all distributions and do not reflect the deduction of taxes that a shareholder would pay on Fund distributions or the redemption or sale of Fund shares. An index is a statistical composite that tracks a specified financial market or sector. Unlike the Fund, the indices do not actually hold a portfolio of securities and therefore do not incur the expenses incurred by the Fund. These expenses negatively impact the performance of the Fund. The Fund’s past performance does not predict future performance.
Frequency Distribution of Discounts and Premiums
Information showing the number of days the market price of the Fund’s shares was greater (at a premium) and less (at a discount) than the Fund’s net asset value for the most recently completed year, and the most recently completed calendar quarters since that year (or life of the Fund, if shorter), is available at https://www.ftportfolios.com/Retail/etf/home.aspx.
Fund Performance Overview (Unaudited) (Continued)
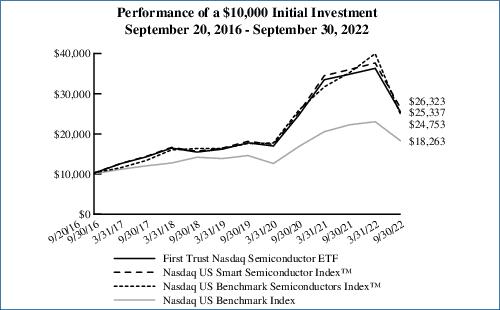
First Trust Nasdaq Semiconductor ETF (FTXL)
The First Trust Nasdaq Semiconductor ETF (the “Fund”) seeks investment results that correspond generally to the price and yield (before the Fund’s fees and expenses) of an equity index called the Nasdaq US Smart Semiconductor IndexTM (the “Index”). The shares of the Fund are listed and trade on The Nasdaq Stock Market LLC under the ticker symbol “FTXL.” The Fund will normally invest at least 90% of its net assets (including investment borrowings) in the common stocks and depositary receipts that comprise the Index. The Index is owned and is developed, maintained and sponsored by Nasdaq, Inc. (the “Index Provider”).
The Index is designed to provide exposure to U.S. companies comprising the semiconductor sector that have been selected based upon their liquidity and weighted based upon their cumulative score on three investing factors: volatility, value and growth. The Index’s initial selection universe consists of the component securities of the Nasdaq US Benchmark Index that have been classified as comprising the semiconductors sub-sector according to the Industry Classification Benchmark. The Nasdaq US Benchmark Index is an index seeking to track the performance of small, mid and large capitalization U.S. companies. This classification includes producers and distributors of semiconductors and other integrated chips, including other products related to the semiconductor industry, such as semiconductor capital equipment and motherboards.
| Performance | | | | | | |
| | | | Average Annual Total Returns | | Cumulative Total Returns |
| | 6 Months
Ended
9/30/22 | 1 Year
Ended
9/30/22 | 5 Years
Ended
9/30/22 | Inception
(9/20/16)
to 9/30/22 | | 5 Years
Ended
9/30/22 | Inception
(9/20/16)
to 9/30/22 |
| Fund Performance | | | | | | | |
| NAV | -30.21% | -27.30% | 12.15% | 16.68% | | 77.40% | 153.37% |
| Market Price | -30.30% | -27.41% | 12.14% | 16.68% | | 77.34% | 153.37% |
| Index Performance | | | | | | | |
| Nasdaq US Smart Semiconductor IndexTM | -30.05% | -26.90% | 12.84% | 17.42% | | 82.95% | 163.23% |
| Nasdaq US Benchmark Semiconductors IndexTM | -38.06% | -29.82% | 13.09% | 16.23% | | 84.99% | 147.53% |
| Nasdaq US Benchmark Index | -20.68% | -18.01% | 8.68% | 10.51% | | 51.60% | 82.63% |
(See Notes to Fund Performance Overview on page 20.)
Nasdaq® and Nasdaq US Smart Semiconductor IndexTM are registered trademarks and service marks of Nasdaq, Inc. (together with its affiliates hereinafter referred to as the “Corporations”) and are licensed for use by First Trust. The Fund has not been passed on by the Corporations as to its legality or suitability. The Fund is not issued, endorsed, sold or promoted by the Corporations. THE CORPORATIONS MAKE NO WARRANTIES AND BEAR NO LIABILITY WITH RESPECT TO THE FUND.
Fund Performance Overview (Unaudited) (Continued)
First Trust Nasdaq Semiconductor ETF (FTXL) (Continued)
| Sector Allocation | % of Total
Investments |
| Information Technology | 98.6% |
| Health Care | 1.4 |
| Total | 100.0% |
| Top Ten Holdings | % of Total
Investments |
| Texas Instruments, Inc. | 8.6% |
| ON Semiconductor Corp. | 8.3 |
| Broadcom, Inc. | 8.2 |
| Skyworks Solutions, Inc. | 7.9 |
| Intel Corp. | 7.4 |
| Microchip Technology, Inc. | 4.3 |
| Analog Devices, Inc. | 4.2 |
| NXP Semiconductors N.V. | 4.1 |
| Micron Technology, Inc. | 4.1 |
| Qorvo, Inc. | 4.1 |
| Total | 61.2% |
Performance figures assume reinvestment of all distributions and do not reflect the deduction of taxes that a shareholder would pay on Fund distributions or the redemption or sale of Fund shares. An index is a statistical composite that tracks a specified financial market or sector. Unlike the Fund, the indices do not actually hold a portfolio of securities and therefore do not incur the expenses incurred by the Fund. These expenses negatively impact the performance of the Fund. The Fund’s past performance does not predict future performance.
Frequency Distribution of Discounts and Premiums
Information showing the number of days the market price of the Fund’s shares was greater (at a premium) and less (at a discount) than the Fund’s net asset value for the most recently completed year, and the most recently completed calendar quarters since that year (or life of the Fund, if shorter), is available at https://www.ftportfolios.com/Retail/etf/home.aspx.
Fund Performance Overview (Unaudited) (Continued)
First Trust Nasdaq Transportation ETF (FTXR)
The First Trust Nasdaq Transportation ETF (the “Fund”) seeks investment results that correspond generally to the price and yield (before the Fund’s fees and expenses) of an equity index called the Nasdaq US Smart Transportation IndexTM (the “Index”). The shares of the Fund are listed and trade on The Nasdaq Stock Market LLC under the ticker symbol “FTXR.” The Fund will normally invest at least 90% of its net assets (including investment borrowings) in the common stocks and depositary receipts that comprise the Index. The Index is owned and is developed, maintained and sponsored by Nasdaq, Inc. (the “Index Provider”).
The Index is designed to provide exposure to U.S. companies comprising the transportation sector that have been selected based upon their liquidity and weighted based upon their cumulative score on three investing factors: volatility, value and growth. The Index’s initial selection universe consists of the component securities of the Nasdaq US Benchmark Index that have been classified as comprising the industrial transportation sector, the automobiles & parts sector or the airlines sub-sector according to the Industry Classification Benchmark. The Nasdaq US Benchmark Index is an index seeking to track the performance of small, mid and large capitalization U.S. companies. These classifications include: (i) operators of mail and package delivery services; (ii) providers of on-water transportation for commercial markets; (iii) providers of industrial railway transportation and railway lines; (iv) companies that manage airports, train depots, roads, bridges, tunnels, ports, and providers of logistic services to shippers of goods; (v) companies that provide commercial trucking services; (vi) makers of motorcycles and passenger vehicles; (vii) manufacturers and distributors of new and replacement parts for motorcycles and automobiles; (viii) manufacturers, distributors and retreaders of automobile, truck and motorcycle tires; and (ix) companies providing primarily passenger air transport.
| Performance | | | | | | |
| | | | Average Annual Total Returns | | Cumulative Total Returns |
| | 6 Months
Ended
9/30/22 | 1 Year
Ended
9/30/22 | 5 Years
Ended
9/30/22 | Inception
(9/20/16)
to 9/30/22 | | 5 Years
Ended
9/30/22 | Inception
(9/20/16)
to 9/30/22 |
| Fund Performance | | | | | | | |
| NAV | -26.84% | -22.74% | 0.54% | 3.92% | | 2.72% | 26.06% |
| Market Price | -26.86% | -22.72% | 0.55% | 3.92% | | 2.76% | 26.06% |
| Index Performance | | | | | | | |
| Nasdaq US Smart Transportation IndexTM | -26.81% | -22.59% | 0.96% | 4.40% | | 4.90% | 29.65% |
| Nasdaq US Benchmark Industrial Transportation IndexTM | -24.02% | -10.78% | 8.89% | 12.52% | | 53.10% | 103.57% |
| Nasdaq US Benchmark Index | -20.68% | -18.01% | 8.68% | 10.51% | | 51.60% | 82.63% |
(See Notes to Fund Performance Overview on page 20.)
Nasdaq® and Nasdaq US Smart Transportation IndexTM are registered trademarks and service marks of Nasdaq, Inc. (together with its affiliates hereinafter referred to as the “Corporations”) and are licensed for use by First Trust. The Fund has not been passed on by the Corporations as to its legality or suitability. The Fund is not issued, endorsed, sold or promoted by the Corporations. THE CORPORATIONS MAKE NO WARRANTIES AND BEAR NO LIABILITY WITH RESPECT TO THE FUND.
Fund Performance Overview (Unaudited) (Continued)
First Trust Nasdaq Transportation ETF (FTXR) (Continued)
| Sector Allocation | % of Total
Long-Term
Investments |
| Industrials | 72.9% |
| Consumer Discretionary | 27.1 |
| Total | 100.0% |
| Top Ten Holdings | % of Total
Long-Term
Investments |
| PACCAR, Inc. | 9.0% |
| Union Pacific Corp. | 8.2 |
| CH Robinson Worldwide, Inc. | 8.0 |
| CSX Corp. | 7.9 |
| Ford Motor Co. | 6.9 |
| United Rentals, Inc. | 4.4 |
| JB Hunt Transport Services, Inc. | 4.2 |
| Alaska Air Group, Inc. | 4.2 |
| LKQ Corp. | 4.2 |
| Lear Corp. | 4.1 |
| Total | 61.1% |

Performance figures assume reinvestment of all distributions and do not reflect the deduction of taxes that a shareholder would pay on Fund distributions or the redemption or sale of Fund shares. An index is a statistical composite that tracks a specified financial market or sector. Unlike the Fund, the indices do not actually hold a portfolio of securities and therefore do not incur the expenses incurred by the Fund. These expenses negatively impact the performance of the Fund. The Fund’s past performance does not predict future performance.
Frequency Distribution of Discounts and Premiums
Information showing the number of days the market price of the Fund’s shares was greater (at a premium) and less (at a discount) than the Fund’s net asset value for the most recently completed year, and the most recently completed calendar quarters since that year (or life of the Fund, if shorter), is available at https://www.ftportfolios.com/Retail/etf/home.aspx.
Fund Performance Overview (Unaudited) (Continued)
First Trust S-Network Streaming & Gaming ETF (BNGE)
The First Trust S-Network Streaming & Gaming ETF (the “Fund”) seeks investment results that correspond generally to the price and yield (before the Fund’s fees and expenses) of an index called the S-Network Streaming & Gaming Index (the “Index”). The Fund lists and principally trades its shares on The NYSE Arca, Inc. under the ticker symbol “BNGE.” The Fund will normally invest at least 80% of its net assets (including investment borrowings) in the common stocks and depositary receipts that comprise the Index. The Fund, using an indexing investment approach, attempts to replicate, before fees and expenses, the performance of the Index.
According to VettaFi LLC (the “Index Provider”), the Index is composed of common stock and depositary receipts issued by U.S. and non-U.S. companies that enable remote users to access online content; publish online content; participate in prospective wagering; spectate or participate in competitive video gaming; and that provide the products, services and technology that are necessary for the streaming and gaming industries. The Index is owned and is developed, maintained and sponsored by VettaFi LLC. The Index Provider retains the right at any time, upon prior written notice, to modify the Index methodology.
| Performance | | |
| | | Cumulative
Total Returns |
| | 6 Months Ended
9/30/22 | Inception (1/25/22)
to 9/30/22 |
| Fund Performance | | |
| NAV | -31.24% | -34.55% |
| Market Price | -31.54% | -34.47% |
| Index Performance | | |
| S-Network Streaming & Gaming Index | -31.07% | -33.92% |
| MSCI ACWI Index | -21.41% | -19.86% |
(See Notes to Fund Performance Overview on page 20.)
S-Network and S-Network Streaming & Gaming Index are service marks of VettaFi LLC and have been licensed for use by First Trust Advisors L.P. The Fund is not issued, sponsored, endorsed, sold or promoted by VettaFi LLC or its affiliates (collectively, “VettaFi”). VettaFi makes no representation or warranty, express or implied, to the purchasers or owners of the Fund or any member of the public regarding the advisability of investing in securities generally or in the Fund particularly or the ability of the Index to track general market performance.
Fund Performance Overview (Unaudited) (Continued)
First Trust S-Network Streaming & Gaming ETF (BNGE) (Continued)
| Sector Allocation | % of Total
Long-Term
Investments |
| Communication Services | 57.0% |
| Consumer Discretionary | 28.9 |
| Information Technology | 14.1 |
| Total | 100.0% |
| Top Ten Holdings | % of Total
Long-Term
Investments |
| Netflix, Inc. | 6.5% |
| Walt Disney (The) Co. | 5.1 |
| Activision Blizzard, Inc. | 5.0 |
| Nintendo Co., Ltd. | 4.9 |
| Electronic Arts, Inc. | 4.8 |
| Flutter Entertainment PLC | 4.6 |
| NetEase, Inc., ADR | 4.5 |
| Advanced Micro Devices, Inc. | 4.2 |
| Sony Group Corp. | 4.1 |
| NVIDIA Corp. | 4.0 |
| Total | 47.7% |

Performance figures assume reinvestment of all distributions and do not reflect the deduction of taxes that a shareholder would pay on Fund distributions or the redemption or sale of Fund shares. An index is a statistical composite that tracks a specified financial market or sector. Unlike the Fund, the indices do not actually hold a portfolio of securities and therefore do not incur the expenses incurred by the Fund. These expenses negatively impact the performance of the Fund. The Fund’s past performance does not predict future performance.
Frequency Distribution of Discounts and Premiums
Information showing the number of days the market price of the Fund’s shares was greater (at a premium) and less (at a discount) than the Fund’s net asset value for the most recently completed year, and the most recently completed calendar quarters since that year (or life of the Fund, if shorter), is available at https://www.ftportfolios.com/Retail/etf/home.aspx.
Notes to Fund Performance Overview (Unaudited)
Total returns for the periods since inception are calculated from the inception date of each Fund. “Average Annual Total Returns” represent the average annual change in value of an investment over the periods indicated. “Cumulative Total Returns” represent the total change in value of an investment over the periods indicated.
Each Fund’s per share net asset value (“NAV”) is the value of one share of the Fund and is computed by dividing the value of all assets of the Fund (including accrued interest and dividends), less all liabilities (including accrued expenses and dividends declared but unpaid), by the total number of outstanding shares. The price used to calculate market return (“Market Price”) is determined by using the midpoint of the national best bid and offer price (“NBBO”) as of the time that the Fund’s NAV is calculated. Under SEC rules, the NBBO consists of the highest displayed buy and lowest sell prices among the various exchanges trading the Fund at the time the Fund’s NAV is calculated. Prior to January 1, 2019, the price used was the midpoint between the highest bid and the lowest offer on the stock exchange on which shares of the Fund were listed for trading as of the time that the Fund’s NAV was calculated. Since shares of each Fund did not trade in the secondary market until after the Fund’s inception, for the period from inception to the first day of secondary market trading in shares of the Fund, the NAV of each Fund is used as a proxy for the secondary market trading price to calculate market returns. NAV and market returns assume that all distributions have been reinvested in each Fund at NAV and Market Price, respectively.
An index is a statistical composite that tracks a specified financial market or sector. Unlike each Fund, the indices do not actually hold a portfolio of securities and therefore do not incur the expenses incurred by each Fund. These expenses negatively impact the performance of each Fund. Also, market returns do not include brokerage commissions that may be payable on secondary market transactions. If brokerage commissions were included, market returns would be lower. The total returns presented reflect the reinvestment of dividends on securities in the indices. The returns presented do not reflect the deduction of taxes that a shareholder would pay on Fund distributions or the redemption or sale of Fund shares. The investment return and principal value of shares of each Fund will vary with changes in market conditions. Shares of each Fund may be worth more or less than their original cost when they are redeemed or sold in the market. Each Fund’s past performance is no guarantee of future performance.
First Trust Exchange-Traded Fund VI
Understanding Your Fund Expenses
September 30, 2022 (Unaudited)
As a shareholder of First Trust Nasdaq Bank ETF, First Trust Nasdaq Food & Beverage ETF, First Trust Nasdaq Oil & Gas ETF, First Trust Nasdaq Pharmaceuticals ETF, First Trust S-Network E-Commerce ETF, First Trust Nasdaq Semiconductor ETF, First Trust Nasdaq Transportation ETF or First Trust S-Network Streaming & Gaming ETF (each a “Fund” and collectively, the “Funds”), you incur two types of costs: (1) transaction costs; and (2) ongoing costs, including management fees, distribution and/or service (12b-1) fees, if any, and other Fund expenses. This Example is intended to help you understand your ongoing costs of investing in the Funds and to compare these costs with the ongoing costs of investing in other funds.
The Example is based on an investment of $1,000 invested at the beginning of the period and held through the six-month period ended September 30, 2022.
Actual Expenses
The first line in the following table provides information about actual account values and actual expenses. You may use the information in this line, together with the amount you invested, to estimate the expenses that you paid over the period. Simply divide your account value by $1,000 (for example, an $8,600 account value divided by $1,000 = 8.6), then multiply the result by the number in the first line under the heading entitled “Expenses Paid During the Six-Month Period” to estimate the expenses you paid on your account during this six-month period.
Hypothetical Example for Comparison Purposes
The second line in the following table provides information about hypothetical account values and hypothetical expenses based on each Fund’s actual expense ratio and an assumed rate of return of 5% per year before expenses, which is not each Fund’s actual return. The hypothetical account values and expenses may not be used to estimate the actual ending account balance or expenses you paid for the period. You may use this information to compare the ongoing costs of investing in the Funds and other funds. To do so, compare this 5% hypothetical example with the 5% hypothetical examples that appear in the shareholder reports of the other funds.
Please note that the expenses shown in the table are meant to highlight your ongoing costs only and do not reflect any transactional costs such as brokerage commissions. Therefore, the second line in the table is useful in comparing ongoing costs only, and will not help you determine the relative total costs of owning different funds. In addition, if these transactional costs were included, your costs would have been higher.
| | Beginning
Account Value
April 1, 2022 | Ending
Account Value
September 30, 2022 | Annualized
Expense Ratio
Based on the
Six-Month
Period | Expenses Paid
During the
Six-Month
Period (a) |
| First Trust Nasdaq Bank ETF (FTXO) |
| Actual | $1,000.00 | $828.40 | 0.60% | $2.75 |
| Hypothetical (5% return before expenses) | $1,000.00 | $1,022.06 | 0.60% | $3.04 |
| First Trust Nasdaq Food & Beverage ETF (FTXG) |
| Actual | $1,000.00 | $922.40 | 0.60% | $2.89 |
| Hypothetical (5% return before expenses) | $1,000.00 | $1,022.06 | 0.60% | $3.04 |
| First Trust Nasdaq Oil & Gas ETF (FTXN) |
| Actual | $1,000.00 | $938.70 | 0.60% | $2.92 |
| Hypothetical (5% return before expenses) | $1,000.00 | $1,022.06 | 0.60% | $3.04 |
| First Trust Nasdaq Pharmaceuticals ETF (FTXH) |
| Actual | $1,000.00 | $906.70 | 0.60% | $2.87 |
| Hypothetical (5% return before expenses) | $1,000.00 | $1,022.06 | 0.60% | $3.04 |
| First Trust S-Network E-Commerce ETF (ISHP) |
| Actual | $1,000.00 | $697.90 | 0.60% | $2.55 |
| Hypothetical (5% return before expenses) | $1,000.00 | $1,022.06 | 0.60% | $3.04 |
| First Trust Nasdaq Semiconductor ETF (FTXL) |
| Actual | $1,000.00 | $697.90 | 0.60% | $2.55 |
| Hypothetical (5% return before expenses) | $1,000.00 | $1,022.06 | 0.60% | $3.04 |
First Trust Exchange-Traded Fund VI
Understanding Your Fund Expenses (Continued)
September 30, 2022 (Unaudited)
| | Beginning
Account Value
April 1, 2022 | Ending
Account Value
September 30, 2022 | Annualized
Expense Ratio
Based on the
Six-Month
Period | Expenses Paid
During the
Six-Month
Period (a) |
| First Trust Nasdaq Transportation ETF (FTXR) |
| Actual | $1,000.00 | $731.60 | 0.60% | $2.60 |
| Hypothetical (5% return before expenses) | $1,000.00 | $1,022.06 | 0.60% | $3.04 |
| First Trust S-Network Streaming & Gaming ETF (BNGE) |
| Actual | $1,000.00 | $687.60 | 0.70% | $2.96 |
| Hypothetical (5% return before expenses) | $1,000.00 | $1,021.56 | 0.70% | $3.55 |
| (a) | Expenses are equal to the annualized expense ratios as indicated in the table multiplied by the average account value over the period (April 1, 2022 through September 30, 2022), multiplied by 183/365 (to reflect the six-month period). |
First Trust Nasdaq Bank ETF (FTXO)
Portfolio of Investments
September 30, 2022 (Unaudited)
| Shares | | Description | | Value |
| COMMON STOCKS – 99.7% |
| | | Banks – 88.3% | | |
| 259,239 | | Bank of America Corp. | | $7,829,018 |
| 178,509 | | Citigroup, Inc. | | 7,438,470 |
| 93,173 | | Citizens Financial Group, Inc. | | 3,201,424 |
| 108,506 | | Comerica, Inc. | | 7,714,777 |
| 67,043 | | Cullen/Frost Bankers, Inc. | | 8,864,425 |
| 8,238 | | East West Bancorp, Inc. | | 553,099 |
| 17,409 | | Fifth Third Bancorp | | 556,392 |
| 10,731 | | First Citizens BancShares, Inc., Class A | | 8,557,221 |
| 3,916 | | First Republic Bank | | 511,234 |
| 44,368 | | Huntington Bancshares, Inc. | | 584,770 |
| 76,611 | | JPMorgan Chase & Co. | | 8,005,849 |
| 492,539 | | KeyCorp | | 7,890,475 |
| 92,288 | | M&T Bank Corp. | | 16,272,220 |
| 522,050 | | Old National Bancorp | | 8,598,163 |
| 7,367 | | Pinnacle Financial Partners, Inc. | | 597,464 |
| 55,146 | | PNC Financial Services Group (The), Inc. | | 8,239,915 |
| 225,668 | | Popular, Inc. | | 16,261,636 |
| 804,154 | | Regions Financial Corp. | | 16,139,371 |
| 3,410 | | Signature Bank | | 514,910 |
| 6,525 | | Silvergate Capital Corp., Class A (a) | | 491,659 |
| 1,463 | | SVB Financial Group (a) | | 491,246 |
| 216,958 | | Synovus Financial Corp. | | 8,138,095 |
| 186,016 | | Truist Financial Corp. | | 8,099,137 |
| 191,033 | | US Bancorp | | 7,702,451 |
| 12,636 | | Webster Financial Corp. | | 571,147 |
| 398,674 | | Wells Fargo & Co. | | 16,034,668 |
| 7,749 | | Western Alliance Bancorp | | 509,419 |
| 158,332 | | Zions Bancorp N.A. | | 8,052,766 |
| | | | | 178,421,421 |
| | | Consumer Finance – 3.9% | | |
| 86,705 | | Discover Financial Services | | 7,883,219 |
| | | Thrifts & Mortgage Finance – 7.5% | | |
| 1,779,983 | | New York Community Bancorp, Inc. | | 15,183,255 |
| | | Total Investments – 99.7% | | 201,487,895 |
| | | (Cost $241,538,179) | | |
| | �� | Net Other Assets and Liabilities – 0.3% | | 550,560 |
| | | Net Assets – 100.0% | | $202,038,455 |
| (a) | Non-income producing security. |
Valuation Inputs
A summary of the inputs used to value the Fund’s investments as of September 30, 2022 is as follows (see Note 2A - Portfolio Valuation in the Notes to Financial Statements):
| | Total
Value at
9/30/2022 | Level 1
Quoted
Prices | Level 2
Significant
Observable
Inputs | Level 3
Significant
Unobservable
Inputs |
| Common Stocks* | $ 201,487,895 | $ 201,487,895 | $ — | $ — |
| * | See Portfolio of Investments for industry breakout. |
See Notes to Financial Statements
Page 23
First Trust Nasdaq Food & Beverage ETF (FTXG)
Portfolio of Investments
September 30, 2022 (Unaudited)
| Shares | | Description | | Value |
| COMMON STOCKS – 99.9% |
| | | Beverages – 26.9% | | |
| 20,201 | | Boston Beer (The) Co., Inc., Class A (a) | | $6,538,054 |
| 93,664 | | Brown-Forman Corp., Class B | | 6,235,212 |
| 65,794 | | Celsius Holdings, Inc. (a) | | 5,966,200 |
| 580,349 | | Coca-Cola (The) Co. | | 32,511,151 |
| 145,551 | | Constellation Brands, Inc., Class A | | 33,430,154 |
| 939,493 | | Keurig Dr. Pepper, Inc. | | 33,652,639 |
| 1,347,304 | | Molson Coors Beverage Co., Class B | | 64,657,119 |
| 76,654 | | Monster Beverage Corp. (a) | | 6,665,832 |
| 207,894 | | PepsiCo, Inc. | | 33,940,774 |
| | | | | 223,597,135 |
| | | Chemicals – 4.0% | | |
| 582,994 | | Corteva, Inc. | | 33,318,107 |
| | | Food & Staples Retailing – 0.7% | | |
| 222,374 | | US Foods Holding Corp. (a) | | 5,879,569 |
| | | Food Products – 67.7% | | |
| 407,483 | | Archer-Daniels-Midland Co. | | 32,782,007 |
| 279,065 | | Beyond Meat, Inc. (a) | | 3,954,351 |
| 722,263 | | Bunge Ltd. | | 59,637,256 |
| 1,346,630 | | Campbell Soup Co. | | 63,453,206 |
| 1,041,696 | | Conagra Brands, Inc. | | 33,990,540 |
| 89,524 | | Darling Ingredients, Inc. (a) | | 5,922,013 |
| 156,422 | | Freshpet, Inc. (a) | | 7,835,178 |
| 876,819 | | General Mills, Inc. | | 67,173,104 |
| 159,407 | | Hershey (The) Co. | | 35,144,461 |
| 712,280 | | Hormel Foods Corp. | | 32,366,003 |
| 1,545,017 | | Hostess Brands, Inc. (a) | | 35,906,195 |
| 255,826 | | J.M. Smucker (The) Co. | | 35,153,051 |
| 984,700 | | Kellogg Co. | | 68,594,202 |
| 182,061 | | Kraft Heinz (The) Co. | | 6,071,734 |
| 85,620 | | Lamb Weston Holdings, Inc. | | 6,625,276 |
| 80,991 | | McCormick & Co., Inc. | | 5,772,228 |
| 578,941 | | Mondelez International, Inc., Class A | | 31,743,335 |
| 475,106 | | Tyson Foods, Inc., Class A | | 31,323,739 |
| | | | | 563,447,879 |
| | | Personal Products – 0.6% | | |
| 260,989 | | Herbalife Nutrition Ltd. (a) | | 5,191,071 |
| | | Total Investments – 99.9% | | 831,433,761 |
| | | (Cost $910,254,789) | | |
| | | Net Other Assets and Liabilities – 0.1% | | 548,435 |
| | | Net Assets – 100.0% | | $831,982,196 |
| (a) | Non-income producing security. |
Valuation Inputs
A summary of the inputs used to value the Fund’s investments as of September 30, 2022 is as follows (see Note 2A - Portfolio Valuation in the Notes to Financial Statements):
| | Total
Value at
9/30/2022 | Level 1
Quoted
Prices | Level 2
Significant
Observable
Inputs | Level 3
Significant
Unobservable
Inputs |
| Common Stocks* | $ 831,433,761 | $ 831,433,761 | $ — | $ — |
| * | See Portfolio of Investments for industry breakout. |
Page 24
See Notes to Financial Statements
First Trust Nasdaq Oil & Gas ETF (FTXN)
Portfolio of Investments
September 30, 2022 (Unaudited)
| Shares | | Description | | Value |
| COMMON STOCKS – 99.9% |
| | | Energy Equipment &
Services – 1.7% | | |
| 114,200 | | Baker Hughes Co. | | $2,393,632 |
| 132,261 | | ChampionX Corp. | | 2,588,348 |
| 95,742 | | Halliburton Co. | | 2,357,168 |
| 67,474 | | Helmerich & Payne, Inc. | | 2,494,514 |
| 163,249 | | NOV, Inc. | | 2,641,369 |
| 75,615 | | Schlumberger N.V. | | 2,714,578 |
| 796,854 | | Transocean Ltd. (a) | | 1,968,229 |
| | | | | 17,157,838 |
| | | Oil, Gas & Consumable Fuels – 98.2% | | |
| 300,343 | | Antero Midstream Corp. | | 2,757,149 |
| 1,024,880 | | Antero Resources Corp. (a) | | 31,289,586 |
| 1,178,694 | | APA Corp. | | 40,299,548 |
| 67,777 | | Callon Petroleum Co. (a) | | 2,372,873 |
| 18,005 | | Cheniere Energy, Inc. | | 2,987,210 |
| 138,175 | | Chesapeake Energy Corp. | | 13,017,467 |
| 487,485 | | Chevron Corp. | | 70,036,970 |
| 42,934 | | Civitas Resources, Inc. | | 2,463,982 |
| 163,249 | | CNX Resources Corp. (a) | | 2,535,257 |
| 421,187 | | ConocoPhillips | | 43,104,278 |
| 910,685 | | Coterra Energy, Inc. | | 23,787,092 |
| 32,435 | | Denbury, Inc. (a) | | 2,797,843 |
| 618,482 | | Devon Energy Corp. | | 37,189,323 |
| 54,324 | | Diamondback Energy, Inc. | | 6,543,869 |
| 81,310 | | EOG Resources, Inc. | | 9,084,766 |
| 60,348 | | EQT Corp. | | 2,459,181 |
| 311,176 | | Equitrans Midstream Corp. | | 2,327,596 |
| 796,434 | | Exxon Mobil Corp. | | 69,536,653 |
| 23,880 | | Hess Corp. | | 2,602,681 |
| 705,014 | | HF Sinclair Corp. | | 37,957,954 |
| 2,516,307 | | Kinder Morgan, Inc. | | 41,871,348 |
| 6,520,327 | | Kosmos Energy Ltd. (a) | | 33,710,091 |
| 37,171 | | Laredo Petroleum, Inc. (a) | | 2,336,197 |
| 1,801,435 | | Marathon Oil Corp. | | 40,676,402 |
| 457,553 | | Marathon Petroleum Corp. | | 45,448,739 |
| 551,520 | | Matador Resources, Co. | | 26,980,358 |
| 365,582 | | Murphy Oil Corp. | | 12,857,519 |
| 1,298,557 | | Occidental Petroleum Corp. | | 79,796,328 |
| 164,949 | | ONEOK, Inc. | | 8,451,987 |
| 207,040 | | Ovintiv, Inc. | | 9,523,840 |
| 2,698,986 | | PBF Energy, Inc., Class A (a) | | 94,896,348 |
| 42,475 | | PDC Energy, Inc. | | 2,454,630 |
| 1,817,631 | | Permian Resources Corp. (a) | | 12,359,891 |
| 32,241 | | Phillips 66 | | 2,602,494 |
| 168,984 | | Pioneer Natural Resources Co. | | 36,590,106 |
| 87,784 | | Range Resources Corp. | | 2,217,424 |
| 1,046,033 | | SM Energy Co. | | 39,341,301 |
| 385,129 | | Southwestern Energy Co. (a) | | 2,356,989 |
| 42,274 | | Targa Resources Corp. | | 2,550,813 |
| 721,150 | | Tellurian, Inc. (a) | | 1,723,548 |
| 379,785 | | Valero Energy Corp. | | 40,580,027 |
| Shares | | Description | | Value |
|
| | | Oil, Gas & Consumable
Fuels (Continued) | | |
| 2,222,849 | | Williams (The) Cos., Inc. | | $63,640,167 |
| | | | | 1,008,117,825 |
| | | Total Investments – 99.9% | | 1,025,275,663 |
| | | (Cost $1,044,155,289) | | |
| | | Net Other Assets and Liabilities – 0.1% | | 771,111 |
| | | Net Assets – 100.0% | | $1,026,046,774 |
| (a) | Non-income producing security. |
Valuation Inputs
A summary of the inputs used to value the Fund’s investments as of September 30, 2022 is as follows (see Note 2A - Portfolio Valuation in the Notes to Financial Statements):
| | Total
Value at
9/30/2022 | Level 1
Quoted
Prices | Level 2
Significant
Observable
Inputs | Level 3
Significant
Unobservable
Inputs |
| Common Stocks* | $ 1,025,275,663 | $ 1,025,275,663 | $ — | $ — |
| * | See Portfolio of Investments for industry breakout. |
See Notes to Financial Statements
Page 25
First Trust Nasdaq Pharmaceuticals ETF (FTXH)
Portfolio of Investments
September 30, 2022 (Unaudited)
| Shares | | Description | | Value |
| COMMON STOCKS – 99.9% |
| | | Biotechnology – 45.7% | | |
| 11,076 | | AbbVie, Inc. | | $1,486,510 |
| 22,471 | | Alkermes PLC (a) | | 501,777 |
| 12,395 | | Amgen, Inc. | | 2,793,833 |
| 5,963 | | BioMarin Pharmaceutical, Inc. (a) | | 505,484 |
| 7,264 | | Blueprint Medicines Corp. (a) | | 478,625 |
| 22,143 | | Emergent BioSolutions, Inc. (a) | | 464,782 |
| 46,928 | | Gilead Sciences, Inc. | | 2,894,988 |
| 8,983 | | Horizon Therapeutics PLC (a) | | 555,958 |
| 12,509 | | Ionis Pharmaceuticals, Inc. (a) | | 553,273 |
| 276,814 | | Ironwood Pharmaceuticals, Inc. (a) | | 2,867,793 |
| 3,447 | | Seagen, Inc. (a) | | 471,653 |
| 6,572 | | United Therapeutics Corp. (a) | | 1,376,045 |
| 5,286 | | Vertex Pharmaceuticals, Inc. (a) | | 1,530,508 |
| | | | | 16,481,229 |
| | | Health Care Providers &
Services – 3.9% | | |
| 21,059 | | Cardinal Health, Inc. | | 1,404,214 |
| | | Pharmaceuticals – 50.3% | | |
| 44,185 | | Bristol-Myers Squibb Co. | | 3,141,112 |
| 6,044 | | Catalent, Inc. (a) | | 437,344 |
| 20,599 | | Corcept Therapeutics, Inc. (a) | | 528,158 |
| 35,154 | | Elanco Animal Health, Inc. (a) | | 436,261 |
| 4,944 | | Eli Lilly & Co. | | 1,598,642 |
| 3,427 | | Jazz Pharmaceuticals PLC (a) | | 456,785 |
| 18,461 | | Johnson & Johnson | | 3,015,789 |
| 17,447 | | Merck & Co., Inc. | | 1,502,536 |
| 52,200 | | Organon & Co. | | 1,221,480 |
| 10,135 | | Pacira BioSciences, Inc. (a) | | 539,081 |
| 14,214 | | Perrigo Co. PLC | | 506,871 |
| 32,926 | | Pfizer, Inc. | | 1,440,842 |
| 29,444 | | Prestige Consumer Healthcare, Inc. (a) | | 1,467,195 |
| 155,943 | | Viatris, Inc. | | 1,328,634 |
| 3,398 | | Zoetis, Inc. | | 503,889 |
| | | | | 18,124,619 |
| | | Total Investments – 99.9% | | 36,010,062 |
| | | (Cost $39,883,862) | | |
| | | Net Other Assets and Liabilities – 0.1% | | 25,513 |
| | | Net Assets – 100.0% | | $36,035,575 |
| (a) | Non-income producing security. |
Valuation Inputs
A summary of the inputs used to value the Fund’s investments as of September 30, 2022 is as follows (see Note 2A - Portfolio Valuation in the Notes to Financial Statements):
| | Total
Value at
9/30/2022 | Level 1
Quoted
Prices | Level 2
Significant
Observable
Inputs | Level 3
Significant
Unobservable
Inputs |
| Common Stocks* | $ 36,010,062 | $ 36,010,062 | $ — | $ — |
| * | See Portfolio of Investments for industry breakout. |
Page 26
See Notes to Financial Statements
First Trust S-Network E-Commerce ETF (ISHP)
Portfolio of Investments
September 30, 2022 (Unaudited)
| Shares | | Description | | Value |
| COMMON STOCKS – 98.2% |
| | | Air Freight & Logistics – 4.5% | | |
| 2,264 | | Deutsche Post AG (a) | | $68,236 |
| 361 | | FedEx Corp. | | 53,598 |
| 449 | | United Parcel Service, Inc., Class B | | 72,531 |
| | | | | 194,365 |
| | | Banks – 1.1% | | |
| 3,421 | | KakoaBank Corp. (a) (b) | | 47,390 |
| | | Commercial Services &
Supplies – 1.8% | | |
| 726 | | Copart, Inc. (b) | | 77,246 |
| | | Consumer Finance – 0.9% | | |
| 14,518 | | Lufax Holding Ltd., ADR | | 36,876 |
| | | Entertainment – 1.4% | | |
| 1,093 | | Sea Ltd., ADR (b) | | 61,263 |
| | | Food & Staples Retailing – 2.0% | | |
| 667 | | Walmart, Inc. | | 86,510 |
| | | Hotels, Restaurants &
Leisure – 7.8% | | |
| 858 | | Airbnb, Inc., Class A (b) | | 90,124 |
| 47 | | Booking Holdings, Inc. (b) | | 77,231 |
| 865 | | Expedia Group, Inc. (b) | | 81,042 |
| 3,140 | | Trip.com Group Ltd., ADR (b) | | 85,753 |
| | | | | 334,150 |
| | | Interactive Media & Services – 20.6% | | |
| 704 | | Alphabet, Inc., Class A (b) | | 67,338 |
| 11,930 | | Auto Trader Group PLC (a) (c) (d) | | 67,656 |
| 541 | | Baidu, Inc., ADR (b) | | 63,562 |
| 1,045 | | IAC, Inc. (b) | | 57,872 |
| 3,079 | | Kanzhun Ltd., ADR (b) | | 51,974 |
| 486 | | Meta Platforms, Inc., Class A (b) | | 65,940 |
| 443 | | NAVER Corp. (a) | | 59,015 |
| 4,126 | | Pinterest, Inc., Class A (b) | | 96,136 |
| 999 | | REA Group Ltd. (a) | | 72,714 |
| 11,670 | | Rightmove PLC (a) | | 62,258 |
| 5,538 | | Snap, Inc., Class A (b) | | 54,383 |
| 2,156 | | Twitter, Inc. (b) | | 94,519 |
| 6,796 | | Yandex N.V., Class A (a) (b) (e) (f) | | 3,222 |
| 26,200 | | Z Holdings Corp. (a) | | 69,447 |
| | | | | 886,036 |
| | | Internet & Direct Marketing
Retail – 21.2% | | |
| 683 | | Alibaba Group Holding Ltd., ADR (b) | | 54,633 |
| 117,334 | | Alibaba Health Information Technology Ltd. (a) (b) | | 53,448 |
| Shares | | Description | | Value |
|
| | | Internet & Direct Marketing
Retail (Continued) | | |
| 719 | | Amazon.com, Inc. (b) | | $81,247 |
| 5,162 | | Coupang, Inc. (b) | | 86,051 |
| 2,118 | | Delivery Hero SE (a) (b) (c) (d) | | 77,365 |
| 1,100 | | DoorDash, Inc., Class A (b) | | 54,395 |
| 1,908 | | eBay, Inc. | | 70,233 |
| 10,206 | | JD Health International, Inc. (a) (b) (c) (d) | | 58,137 |
| 2,651 | | JD.com, Inc, Class A (a) | | 66,880 |
| 3,407 | | Meituan, Class B (a) (b) (c) (d) | | 71,603 |
| 116 | | MercadoLibre, Inc. (b) | | 96,022 |
| 1,344 | | Pinduoduo, Inc., ADR (b) | | 84,107 |
| 1,149 | | Prosus N.V. (a) | | 59,779 |
| | | | | 913,900 |
| | | IT Services – 13.8% | | |
| 57 | | Adyen N.V. (a) (b) (c) (d) | | 71,088 |
| 1,218 | | Block, Inc. (b) | | 66,978 |
| 891 | | Fidelity National Information Services, Inc. | | 67,333 |
| 896 | | Fiserv, Inc. (b) | | 83,839 |
| 384 | | FleetCor Technologies, Inc. (b) | | 67,649 |
| 736 | | Global Payments, Inc. | | 79,525 |
| 1,114 | | PayPal Holdings, Inc. (b) | | 95,882 |
| 2,367 | | Shopify, Inc., Class A (b) | | 63,767 |
| | | | | 596,061 |
| | | Marine – 1.5% | | |
| 35 | | AP Moller - Maersk A.S., Class B (a) | | 63,603 |
| | | Multiline Retail – 1.4% | | |
| 1,129 | | Next PLC (a) | | 59,923 |
| | | Professional Services – 2.2% | | |
| 1,356 | | CoStar Group, Inc. (b) | | 94,445 |
| | | Real Estate Management &
Development – 3.6% | | |
| 4,957 | | KE Holdings, Inc., ADR (b) | | 86,847 |
| 2,348 | | Zillow Group, Inc., Class C (b) | | 67,176 |
| | | | | 154,023 |
| | | Road & Rail – 5.9% | | |
| 738 | | Canadian National Railway Co. | | 79,701 |
| 3,677 | | Uber Technologies, Inc. (b) | | 97,441 |
| 393 | | Union Pacific Corp. | | 76,564 |
| | | | | 253,706 |
| | | Specialty Retail – 4.9% | | |
| 1,180 | | Best Buy Co., Inc. | | 74,741 |
| 881 | | CarMax, Inc. (b) | | 58,164 |
| 654 | | Williams-Sonoma, Inc. | | 77,074 |
| | | | | 209,979 |
See Notes to Financial Statements
Page 27
First Trust S-Network E-Commerce ETF (ISHP)
Portfolio of Investments (Continued)
September 30, 2022 (Unaudited)
| Shares | | Description | | Value |
| COMMON STOCKS (Continued) |
| | | Textiles, Apparel & Luxury
Goods – 1.9% | | |
| 288 | | Lululemon Athletica, Inc. (b) | | $80,513 |
| | | Trading Companies &
Distributors – 1.7% | | |
| 4,900 | | MonotaRO Co., Ltd. (a) | | 75,190 |
| | | Total Common Stocks | | 4,225,179 |
| | | (Cost $6,497,155) | | |
| REAL ESTATE INVESTMENT TRUSTS – 1.6% |
| | | Equity Real Estate Investment
Trusts – 1.6% | | |
| 682 | | Prologis, Inc. | | 69,291 |
| | | (Cost $105,008) | | |
| | | Total Investments – 99.8% | | 4,294,470 |
| | | (Cost $6,602,163) | | |
| | | Net Other Assets and Liabilities – 0.2% | | 9,763 |
| | | Net Assets – 100.0% | | $4,304,233 |
| (a) | This security is fair valued by the Advisor’s Pricing Committee in accordance with procedures approved by the Trust’s Board of Trustees and in accordance with provisions of the Investment Company Act of 1940 and rules thereunder, as amended. At September 30, 2022, securities noted as such are valued at $1,106,954 or 25.7% of net assets. Certain of these securities are fair valued using a factor provided by a third-party pricing service due to the change in value between the foreign markets’ close and the New York Stock Exchange close exceeding a certain threshold. On days when this threshold is not exceeded, these securities are typically valued at the last sale price on the exchange on which they are principally traded. |
| (b) | Non-income producing security. |
| (c) | This security may be resold to qualified foreign investors and foreign institutional buyers under Regulation S of the Securities Act of 1933, as amended (the “1933 Act”). |
| (d) | This security is exempt from registration upon resale under Rule 144A of the 1933 Act and may be resold in transactions exempt from registration, normally to qualified institutional buyers. This security is not restricted on the foreign exchange where it trades freely without any additional registration. As such, it does not require the additional disclosure required of restricted securities. |
| (e) | Pursuant to procedures adopted by the Trust’s Board of Trustees, this security has been determined to be illiquid by the Advisor. |
| (f) | This security’s value was determined using significant unobservable inputs (see Note 2A – Portfolio Valuation in the Notes to Financial Statements). |
| ADR | American Depositary Receipt |
Currency Exposure
Diversification | % of Total
Investments |
| United States Dollar | 72.4% |
| Euro | 6.4 |
| Hong Kong Dollar | 5.8 |
| British Pound Sterling | 4.4 |
| Japanese Yen | 3.4 |
| South Korean Won | 2.5 |
| Canadian Dollar | 1.9 |
| Australian Dollar | 1.7 |
| Danish Krone | 1.5 |
| Total | 100.0% |
Valuation Inputs
A summary of the inputs used to value the Fund’s investments as of September 30, 2022 is as follows (see Note 2A - Portfolio Valuation in the Notes to Financial Statements):
| | Total
Value at
9/30/2022 | Level 1
Quoted
Prices | Level 2
Significant
Observable
Inputs | Level 3
Significant
Unobservable
Inputs |
| Common Stocks: | | | | |
| Air Freight & Logistics | $ 194,365 | $ 126,129 | $ 68,236 | $ — |
| Banks | 47,390 | — | 47,390 | — |
| Interactive Media & Services | 886,036 | 551,724 | 331,090 | 3,222 |
| Internet & Direct Marketing Retail | 913,900 | 526,688 | 387,212 | — |
| IT Services | 596,061 | 524,973 | 71,088 | — |
| Marine | 63,603 | — | 63,603 | — |
| Multiline Retail | 59,923 | — | 59,923 | — |
| Trading Companies & Distributors | 75,190 | — | 75,190 | — |
| Other Industry Categories* | 1,388,711 | 1,388,711 | — | — |
| Real Estate Investment Trusts* | 69,291 | 69,291 | — | — |
| Total Investments | $ 4,294,470 | $ 3,187,516 | $ 1,103,732 | $ 3,222 |
| * | See Portfolio of Investments for industry breakout. |
Level 3 Common Stocks are fair valued by the Advisor’s Pricing Committee and are footnoted in the Portfolio of Investments. The Level 3 Common Stocks values are based on unobservable and non-quantitative inputs.
Page 28
See Notes to Financial Statements
First Trust Nasdaq Semiconductor ETF (FTXL)
Portfolio of Investments
September 30, 2022 (Unaudited)
| Shares | | Description | | Value |
| COMMON STOCKS – 99.9% |
| | | Electronic Equipment,
Instruments & Components – 5.0% | | |
| 63,631 | | Coherent Corp. (a) | | $2,217,540 |
| 12,635 | | IPG Photonics Corp. (a) | | 1,065,762 |
| | | | | 3,283,302 |
| | | Life Sciences Tools &
Services – 1.4% | | |
| 21,715 | | Azenta, Inc. | | 930,705 |
| | | Semiconductors &
Semiconductor Equipment – 93.5% | | |
| 13,487 | | Advanced Micro Devices, Inc. (a) | | 854,536 |
| 16,862 | | Ambarella, Inc. (a) | | 947,307 |
| 19,833 | | Analog Devices, Inc. | | 2,763,530 |
| 28,243 | | Applied Materials, Inc. | | 2,313,949 |
| 12,043 | | Broadcom, Inc. | | 5,347,212 |
| 12,064 | | Entegris, Inc. | | 1,001,553 |
| 188,301 | | Intel Corp. | | 4,852,517 |
| 8,733 | | KLA Corp. | | 2,642,868 |
| 2,766 | | Lam Research Corp. | | 1,012,356 |
| 21,236 | | Lattice Semiconductor Corp. (a) | | 1,045,024 |
| 24,447 | | Marvell Technology, Inc. | | 1,049,021 |
| 46,058 | | Microchip Technology, Inc. | | 2,810,920 |
| 53,163 | | Micron Technology, Inc. | | 2,663,466 |
| 2,526 | | Monolithic Power Systems, Inc. | | 917,948 |
| 7,583 | | NVIDIA Corp. | | 920,500 |
| 18,260 | | NXP Semiconductors N.V. | | 2,693,533 |
| 87,401 | | ON Semiconductor Corp. (a) | | 5,447,704 |
| 16,002 | | Power Integrations, Inc. | | 1,029,249 |
| 33,474 | | Qorvo, Inc. (a) | | 2,658,170 |
| 22,721 | | QUALCOMM, Inc. | | 2,567,019 |
| 9,133 | | Silicon Laboratories, Inc. (a) | | 1,127,378 |
| 10,757 | | SiTime Corp. (a) | | 846,899 |
| 60,990 | | Skyworks Solutions, Inc. | | 5,200,617 |
| 9,901 | | Synaptics, Inc. (a) | | 980,298 |
| 13,523 | | Teradyne, Inc. | | 1,016,254 |
| 36,381 | | Texas Instruments, Inc. | | 5,631,051 |
| 10,087 | | Wolfspeed, Inc. (a) | | 1,042,592 |
| | | | | 61,383,471 |
| | | Total Investments – 99.9% | | 65,597,478 |
| | | (Cost $88,661,939) | | |
| | | Net Other Assets and Liabilities – 0.1% | | 46,310 |
| | | Net Assets – 100.0% | | $65,643,788 |
| (a) | Non-income producing security. |
Valuation Inputs
A summary of the inputs used to value the Fund’s investments as of September 30, 2022 is as follows (see Note 2A - Portfolio Valuation in the Notes to Financial Statements):
| | Total
Value at
9/30/2022 | Level 1
Quoted
Prices | Level 2
Significant
Observable
Inputs | Level 3
Significant
Unobservable
Inputs |
| Common Stocks* | $ 65,597,478 | $ 65,597,478 | $ — | $ — |
| * | See Portfolio of Investments for industry breakout. |
See Notes to Financial Statements
Page 29
First Trust Nasdaq Transportation ETF (FTXR)
Portfolio of Investments
September 30, 2022 (Unaudited)
| Shares | | Description | | Value |
| COMMON STOCKS – 99.9% |
| | | Air Freight & Logistics – 19.2% | | |
| 56,927 | | CH Robinson Worldwide, Inc. | | $5,482,639 |
| 31,579 | | Expeditors International of Washington, Inc. | | 2,788,742 |
| 15,413 | | FedEx Corp. | | 2,288,368 |
| 16,704 | | United Parcel Service, Inc., Class B | | 2,698,364 |
| | | | | 13,258,113 |
| | | Airlines – 9.1% | | |
| 74,590 | | Alaska Air Group, Inc. (a) | | 2,920,199 |
| 57,723 | | American Airlines Group, Inc. (a) | | 694,985 |
| 24,133 | | Delta Air Lines, Inc. (a) | | 677,172 |
| 96,254 | | JetBlue Airways Corp. (a) | | 638,164 |
| 20,431 | | Southwest Airlines Co. (a) | | 630,092 |
| 21,417 | | United Airlines Holdings, Inc. (a) | | 696,695 |
| | | | | 6,257,307 |
| | | Auto Components – 10.1% | | |
| 8,025 | | Aptiv PLC (a) | | 627,635 |
| 231,584 | | Goodyear Tire & Rubber (The) Co. (a) | | 2,336,682 |
| 23,436 | | Lear Corp. | | 2,805,055 |
| 86,986 | | Luminar Technologies, Inc. (a) (b) | | 633,693 |
| 67,980 | | QuantumScape Corp. (a) (b) | | 571,712 |
| | | | | 6,974,777 |
| | | Automobiles – 12.8% | | |
| 83,037 | | Fisker, Inc. (a) (b) | | 626,929 |
| 426,394 | | Ford Motor Co. | | 4,775,613 |
| 85,033 | | General Motors Co. | | 2,728,709 |
| 2,721 | | Tesla, Inc. (a) | | 721,745 |
| | | | | 8,852,996 |
| | | Distributors – 4.2% | | |
| 61,051 | | LKQ Corp. | | 2,878,555 |
| | | Machinery – 9.7% | | |
| 139,892 | | Nikola Corp. (a) (b) | | 492,420 |
| 74,257 | | PACCAR, Inc. | | 6,214,568 |
| | | | | 6,706,988 |
| | | Road & Rail – 30.4% | | |
| 205,306 | | CSX Corp. | | 5,469,352 |
| 18,671 | | JB Hunt Transport Services, Inc. | | 2,920,518 |
| 13,364 | | Norfolk Southern Corp. | | 2,801,763 |
| 2,763 | | Old Dominion Freight Line, Inc. | | 687,351 |
| 3,625 | | Saia, Inc. (a) | | 688,750 |
| 28,944 | | Union Pacific Corp. | | 5,638,870 |
| 61,983 | | XPO Logistics, Inc. (a) | | 2,759,483 |
| | | | | 20,966,087 |
| Shares | | Description | | Value |
|
| | | Trading Companies &
Distributors – 4.4% | | |
| 11,126 | | United Rentals, Inc. (a) | | $3,005,355 |
| | | Total Common Stocks | | 68,900,178 |
| | | (Cost $93,675,535) | | |
| MONEY MARKET FUNDS – 2.6% |
| 1,798,468 | | Goldman Sachs Financial Square Treasury Obligations Fund - Institutional Class - 2.77% (c) (d) | | 1,798,468 |
| | | (Cost $1,798,468) | | |
| | | Total Investments – 102.5% | | 70,698,646 |
| | | (Cost $95,474,003) | | |
| | | Net Other Assets and Liabilities – (2.5)% | | (1,711,979) |
| | | Net Assets – 100.0% | | $68,986,667 |
| (a) | Non-income producing security. |
| (b) | All or a portion of this security is on loan (see Note 2E - Securities Lending in the Notes to Financial Statements). The remaining contractual maturity of all of the securities lending transactions is overnight and continuous. The aggregate value of such securities is $1,747,894 and the total value of the collateral held by the Fund is $1,798,468. |
| (c) | Rate shown reflects yield as of September 30, 2022. |
| (d) | This security serves as collateral for securities on loan. |
Offsetting Assets and Liabilities
Offsetting assets and liabilities requires entities to disclose both gross and net information about instruments and transactions eligible for offset, and to disclose instruments and transactions subject to master netting or similar agreements (see Note 2D – Offsetting on the Statements of Assets and Liabilities in the Notes to Financial Statements).
The Fund’s loaned securities were all subject to an enforceable Securities Lending Agency Agreement. Securities lent in accordance with the Securities Lending Agency Agreement on a gross basis were as follows:
| Securities Lending Agency Agreement | |
| Total gross amount presented on the Statements of Assets and Liabilities (1) | $1,747,894 |
| Non-cash Collateral (2) | (1,747,894) |
| Net Amount | $— |
| (1) | The amount presented on the Statements of Assets and Liabilities, which is included in “Investments, at value,” is not offset and is shown on a gross basis. |
| (2) | At September 30, 2022, the value of the collateral received from each borrower exceeded the value of the related securities loaned. This amount is disclosed on the Portfolio of Investments. |
Page 30
See Notes to Financial Statements
First Trust Nasdaq Transportation ETF (FTXR)
Portfolio of Investments (Continued)
September 30, 2022 (Unaudited)
Valuation Inputs
A summary of the inputs used to value the Fund’s investments as of September 30, 2022 is as follows (see Note 2A - Portfolio Valuation in the Notes to Financial Statements):
| | Total
Value at
9/30/2022 | Level 1
Quoted
Prices | Level 2
Significant
Observable
Inputs | Level 3
Significant
Unobservable
Inputs |
| Common Stocks* | $ 68,900,178 | $ 68,900,178 | $ — | $ — |
| Money Market Funds | 1,798,468 | 1,798,468 | — | — |
| Total Investments | $ 70,698,646 | $ 70,698,646 | $— | $— |
| * | See Portfolio of Investments for industry breakout. |
See Notes to Financial Statements
Page 31
First Trust S-Network Streaming & Gaming ETF (BNGE)
Portfolio of Investments
September 30, 2022 (Unaudited)
| Shares | | Description | | Value |
| COMMON STOCKS – 99.7% |
| | | Australia – 3.7% | | |
| 4,781 | | Aristocrat Leisure Ltd. (a) | | $100,815 |
| 25,623 | | Tabcorp Holdings Ltd. (a) | | 15,366 |
| | | | | 116,181 |
| | | Cayman Islands – 15.1% | | |
| 2,829 | | Agora, Inc., ADR (b) | | 10,269 |
| 2,183 | | Bilibili, Inc., ADR (b) | | 33,444 |
| 3,618 | | Hello Group, Inc., ADR | | 16,715 |
| 4,267 | | iQIYI, Inc., ADR (b) | | 11,564 |
| 647 | | JOYY, Inc., ADR | | 16,822 |
| 15,275 | | Kuaishou Technology (a) (b) (c) (d) | | 97,976 |
| 1,885 | | NetEase, Inc., ADR | | 142,506 |
| 3,771 | | Tencent Holdings Ltd. (a) | | 127,370 |
| 5,896 | | Tencent Music Entertainment Group, ADR (b) | | 23,938 |
| | | | | 480,604 |
| | | Gibraltar – 0.3% | | |
| 9,608 | | 888 Holdings PLC (a) (b) | | 9,935 |
| | | Greece – 0.5% | | |
| 1,450 | | OPAP S.A. (a) | | 17,389 |
| | | Ireland – 4.6% | | |
| 1,346 | | Flutter Entertainment PLC (a) (b) | | 147,694 |
| | | Isle Of Man (U.K.) – 1.7% | | |
| 4,602 | | Entain PLC (a) | | 55,024 |
| | | Japan – 11.0% | | |
| 3,561 | | Nexon Co., Ltd. (a) | | 62,915 |
| 3,890 | | Nintendo Co., Ltd. (a) | | 156,900 |
| 2,023 | | Sony Group Corp. (a) | | 130,311 |
| | | | | 350,126 |
| | | Luxembourg – 3.0% | | |
| 1,104 | | Spotify Technology S.A. (b) | | 95,275 |
| | | Malta – 0.6% | | |
| 2,348 | | Kindred Group PLC, SDR (a) | | 17,595 |
| | | South Korea – 0.4% | | |
| 295 | | AfreecaTV Co., Ltd. (a) | | 12,893 |
| | | Sweden – 4.1% | | |
| 1,439 | | Evolution AB (a) (c) (d) | | 113,749 |
| 830 | | Viaplay Group AB (a) | | 16,124 |
| | | | | 129,873 |
| | | Switzerland – 0.6% | | |
| 2,236 | | Sportradar Holding AG, Class A (b) | | 19,677 |
| | | United States – 54.1% | | |
| 2,125 | | Activision Blizzard, Inc. | | 157,972 |
| 2,107 | | Advanced Micro Devices, Inc. (b) | | 133,500 |
| Shares | | Description | | Value |
|
| | | United States (Continued) | | |
| 3,063 | | Draftkings, Inc., Class A (b) | | $46,374 |
| 1,330 | | Electronic Arts, Inc. | | 153,894 |
| 6,513 | | fuboTV, Inc. (b) | | 23,121 |
| 2,037 | | GameStop Corp., Class A (b) (e) | | 51,190 |
| 2,522 | | iHeartMedia, Inc., Class A (b) | | 18,486 |
| 4,380 | | Intel Corp. | | 112,873 |
| 763 | | Light & Wonder, Inc. (b) | | 32,717 |
| 3,698 | | MGM Resorts International | | 109,905 |
| 883 | | Netflix, Inc. (b) | | 207,893 |
| 1,053 | | NVIDIA Corp. | | 127,824 |
| 1,317 | | Penn Entertainment, Inc. (b) | | 36,231 |
| 2,620 | | ROBLOX Corp., Class A (b) | | 93,901 |
| 966 | | Roku, Inc. (b) | | 54,482 |
| 3,320 | | Rush Street Interactive, Inc. (b) | | 12,218 |
| 1,149 | | Take-Two Interactive Software, Inc. (b) | | 125,241 |
| 1,479 | | Unity Software, Inc. (b) | | 47,121 |
| 1,715 | | Walt Disney (The) Co. (b) | | 161,776 |
| 1,246 | | Xperi Holding Corp. | | 17,618 |
| | | | | 1,724,337 |
| | | Total Common Stocks | | 3,176,603 |
| | | (Cost $4,452,331) | | |
| WARRANTS – 0.0% |
| | | Australia – 0.0% | | |
| 339 | | PointsBet Holdings Ltd. (a) (b) (f) | | 0 |
| | | (Cost $0) | | |
| MONEY MARKET FUNDS – 1.6% |
| 50,310 | | Goldman Sachs Financial Square Treasury Obligations Fund - Institutional Class - 2.77% (g) (h) | | 50,310 |
| | | (Cost $50,310) | | |
| | | Total Investments – 101.3% | | 3,226,913 |
| | | (Cost $4,502,641) | | |
| | | Net Other Assets and Liabilities – (1.3)% | | (41,885) |
| | | Net Assets – 100.0% | | $3,185,028 |
| (a) | This security is fair valued by the Advisor’s Pricing Committee in accordance with procedures approved by the Trust’s Board of Trustees and in accordance with provisions of the Investment Company Act of 1940 and rules thereunder, as amended. At September 30, 2022, securities noted as such are valued at $1,082,056 or 34.0% of net assets. Certain of these securities are fair valued using a factor provided by a third-party pricing service due to the change in value between the foreign markets’ close and the New York Stock Exchange close exceeding a certain threshold. On days when this threshold is not exceeded, these securities are typically valued at the last sale price on the exchange on which they are principally traded. |
| (b) | Non-income producing security. |
Page 32
See Notes to Financial Statements
First Trust S-Network Streaming & Gaming ETF (BNGE)
Portfolio of Investments (Continued)
September 30, 2022 (Unaudited)
| (c) | This security may be resold to qualified foreign investors and foreign institutional buyers under Regulation S of the Securities Act of 1933, as amended (the “1933 Act”). |
| (d) | This security is exempt from registration upon resale under Rule 144A of the 1933 Act and may be resold in transactions exempt from registration, normally to qualified institutional buyers. This security is not restricted on the foreign exchange where it trades freely without any additional registration. As such, it does not require the additional disclosure required of restricted securities. |
| (e) | All or a portion of this security is on loan (See Note 2E - Securities Lending in the Notes to Financial Statements). The remaining contractual maturity of all of the securities lending transactions is overnight and continuous. The aggregate value of such securities is $48,627 and the total value of the collateral held by the Fund is $50,310. |
| (f) | Pursuant to procedures adopted by the Trust’s Board of Trustees, this security has been determined to be illiquid by the Advisor. |
| (g) | Rate shown reflects yield as of September 30, 2022. |
| (h) | This security serves as collateral for securities on loan. |
| ADR | American Depositary Receipt |
| SDR | Swedish Depositary Receipt |
Offsetting Assets and Liabilities
Offsetting assets and liabilities requires entities to disclose both gross and net information about instruments and transactions eligible for offset, and to disclose instruments and transactions subject to master netting or similar agreements (see Note 2D – Offsetting on the Statements of Assets and Liabilities in the Notes to Financial Statements).
The Fund’s loaned securities were all subject to an enforceable Securities Lending Agency Agreement. Securities lent in accordance with the Securities Lending Agency Agreement on a gross basis were as follows:
| Securities Lending Agency Agreement | |
| Total gross amount presented on the Statements of Assets and Liabilities (1) | $48,627 |
| Non-cash Collateral (2) | (48,627) |
| Net Amount | $— |
| (1) | The amount presented on the Statements of Assets and Liabilities, which is included in “Investments, at value,” is not offset and is shown on a gross basis. |
| (2) | At September 30, 2022, the value of the collateral received from each borrower exceeded the value of the related securities loaned. This amount is disclosed on the Portfolio of Investments. |
Currency Exposure
Diversification | % of Total
Investments |
| United States Dollar | 66.5% |
| Japanese Yen | 10.8 |
| Hong Kong Dollar | 7.0 |
| British Pound Sterling | 6.6 |
| Swedish Krona | 4.6 |
| Australian Dollar | 3.6 |
| Euro | 0.5 |
| South Korean Won | 0.4 |
| Total | 100.0% |
Valuation Inputs
A summary of the inputs used to value the Fund’s investments as of September 30, 2022 is as follows (see Note 2A - Portfolio Valuation in the Notes to Financial Statements):
| | Total
Value at
9/30/2022 | Level 1
Quoted
Prices | Level 2
Significant
Observable
Inputs | Level 3
Significant
Unobservable
Inputs |
| Common Stocks: | | | | |
| Cayman Islands | $ 480,604 | $ 255,258 | $ 225,346 | $ — |
| Luxembourg | 95,275 | 95,275 | — | — |
| Switzerland | 19,677 | 19,677 | — | — |
| United States | 1,724,337 | 1,724,337 | — | — |
| Other Country Categories* | 856,710 | — | 856,710 | — |
| Warrants* | —** | — | —** | — |
| Money Market Funds | 50,310 | 50,310 | — | — |
| Total Investments | $ 3,226,913 | $ 2,144,857 | $ 1,082,056 | $— |
| * | See Portfolio of Investments for country breakout. |
| ** | Investment is valued at $0. |
See Notes to Financial Statements
Page 33
First Trust Exchange-Traded Fund VI
Statements of Assets and Liabilities
September 30, 2022 (Unaudited)
| | First Trust
Nasdaq
Bank
ETF
(FTXO) | | First Trust
Nasdaq
Food &
Beverage
ETF
(FTXG) | | First Trust
Nasdaq
Oil & Gas
ETF
(FTXN) |
| ASSETS: | | | | | |
Investments, at value
| $ 201,487,895 | | $ 831,433,761 | | $ 1,025,275,663 |
Cash
| 106,659 | | 289,254 | | 524,538 |
Foreign currency
| — | | — | | — |
| Receivables: | | | | | |
Dividends
| 555,123 | | 692,738 | | 799,722 |
Dividend reclaims
| — | | — | | — |
Securities lending income
| — | | — | | — |
Investment securities sold
| — | | — | | 6,125,509 |
Total Assets
| 202,149,677 | | 832,415,753 | | 1,032,725,432 |
| LIABILITIES: | | | | | |
| Payables: | | | | | |
Investment advisory fees
| 111,222 | | 433,557 | | 549,373 |
Collateral for securities on loan
| — | | — | | — |
Fund shares redeemed
| — | | — | | 6,129,285 |
Total Liabilities
| 111,222 | | 433,557 | | 6,678,658 |
NET ASSETS
| $202,038,455 | | $831,982,196 | | $1,026,046,774 |
| NET ASSETS consist of: | | | | | |
Paid-in capital
| $ 347,814,682 | | $ 944,804,174 | | $ 1,007,971,652 |
Par value
| 78,000 | | 336,000 | | 418,500 |
Accumulated distributable earnings (loss)
| (145,854,227) | | (113,157,978) | | 17,656,622 |
NET ASSETS
| $202,038,455 | | $831,982,196 | | $1,026,046,774 |
NET ASSET VALUE, per share
| $25.90 | | $24.76 | | $24.52 |
Number of shares outstanding (unlimited number of shares authorized, par value $0.01 per share)
| 7,800,002 | | 33,600,002 | | 41,850,002 |
Investments, at cost
| $241,538,179 | | $910,254,789 | | $1,044,155,289 |
Foreign currency, at cost (proceeds)
| $— | | $— | | $— |
Securities on loan, at value
| $— | | $— | | $— |
Page 34
See Notes to Financial Statements
First Trust
Nasdaq
Pharmaceuticals
ETF
(FTXH) | | First Trust
S-Network
E-Commerce
ETF
(ISHP) | | First Trust
Nasdaq
Semiconductor
ETF
(FTXL) | | First Trust
Nasdaq
Transportation
ETF
(FTXR) | | First Trust
S-Network
Streaming
& Gaming ETF
(BNGE) |
| | | | | | | | | |
| $ 36,010,062 | | $ 4,294,470 | | $ 65,597,478 | | $ 70,698,646 | | $ 3,226,913 |
| 21,066 | | 4,603 | | 56,583 | | 45,100 | | 6,314 |
| — | | 479 | | — | | — | | — |
| | | | | | | | | |
| 22,611 | | 1,886 | | 26,275 | | 64,225 | | 3,856 |
| 287 | | 5,165 | | — | | 80 | | 203 |
| — | | — | | — | | 15,789 | | 71 |
| — | | — | | — | | — | | — |
| 36,054,026 | | 4,306,603 | | 65,680,336 | | 70,823,840 | | 3,237,357 |
| | | | | | | | | |
| | | | | | | | | |
| 18,451 | | 2,370 | | 36,548 | | 38,705 | | 2,019 |
| — | | — | | — | | 1,798,468 | | 50,310 |
| — | | — | | — | | — | | — |
| 18,451 | | 2,370 | | 36,548 | | 1,837,173 | | 52,329 |
| $ 36,035,575 | | $ 4,304,233 | | $ 65,643,788 | | $ 68,986,667 | | $ 3,185,028 |
| | | | | | | | | |
| $ 40,480,925 | | $ 13,575,748 | | $ 102,719,744 | | $ 168,269,038 | | $ 4,617,862 |
| 15,000 | | 2,000 | | 13,500 | | 29,500 | | 2,000 |
| (4,460,350) | | (9,273,515) | | (37,089,456) | | (99,311,871) | | (1,434,834) |
| $ 36,035,575 | | $ 4,304,233 | | $ 65,643,788 | | $ 68,986,667 | | $ 3,185,028 |
| $24.02 | | $21.52 | | $48.62 | | $23.39 | | $15.92 |
| 1,500,002 | | 200,002 | | 1,350,002 | | 2,950,002 | | 200,002 |
| $39,883,862 | | $6,602,163 | | $88,661,939 | | $95,474,003 | | $4,502,641 |
| $— | | $480 | | $— | | $— | | $— |
| $— | | $— | | $— | | $1,747,894 | | $48,627 |
See Notes to Financial Statements
Page 35
First Trust Exchange-Traded Fund VI
Statements of Operations
For the Six Months Ended September 30, 2022 (Unaudited)
| | First Trust
Nasdaq
Bank
ETF
(FTXO) | | First Trust
Nasdaq
Food &
Beverage
ETF
(FTXG) | | First Trust
Nasdaq
Oil & Gas
ETF
(FTXN) |
| INVESTMENT INCOME: | | | | | |
Dividends
| $ 4,021,295 | | $ 8,292,886 | | $ 19,920,967 |
Interest
| 2,162 | | 6,766 | | 9,185 |
Securities lending income (net of fees)
| — | | — | | — |
Foreign withholding tax
| (28,122) | | — | | — |
Other
| — | | — | | — |
Total investment income
| 3,995,335 | | 8,299,652 | | 19,930,152 |
| EXPENSES: | | | | | |
Investment advisory fees
| 777,342 | | 2,183,936 | | 3,402,131 |
Total expenses
| 777,342 | | 2,183,936 | | 3,402,131 |
NET INVESTMENT INCOME (LOSS)
| 3,217,993 | | 6,115,716 | | 16,528,021 |
| NET REALIZED AND UNREALIZED GAIN (LOSS): | | | | | |
| Net realized gain (loss) on: | | | | | |
Investments
| (22,204,557) | | (36,797,876) | | (45,285,052) |
In-kind redemptions
| 499,117 | | 3,233,102 | | 99,041,027 |
Foreign currency transactions
| — | | — | | — |
Net realized gain (loss)
| (21,705,440) | | (33,564,774) | | 53,755,975 |
| Net change in unrealized appreciation (depreciation) on: | | | | | |
Investments
| (34,857,978) | | (79,615,598) | | (184,268,695) |
Foreign currency translation
| — | | — | | — |
Net change in unrealized appreciation (depreciation)
| (34,857,978) | | (79,615,598) | | (184,268,695) |
NET REALIZED AND UNREALIZED GAIN (LOSS)
| (56,563,418) | | (113,180,372) | | (130,512,720) |
NET INCREASE (DECREASE) IN NET ASSETS RESULTING FROM OPERATIONS
| $(53,345,425) | | $(107,064,656) | | $(113,984,699) |
Page 36
See Notes to Financial Statements
| | First Trust
Nasdaq
Pharmaceuticals
ETF
(FTXH) | | First Trust
S-Network
E-Commerce
ETF
(ISHP) | | First Trust
Nasdaq
Semiconductor
ETF
(FTXL) | | First Trust
Nasdaq
Transportation
ETF
(FTXR) | | First Trust
S-Network
Streaming
& Gaming ETF
(BNGE) |
| | | | | | | | | | |
| | $298,413 | | $38,227 | | $577,144 | | $812,246 | | $17,412 |
| | 228 | | 109 | | 604 | | 712 | | — |
| | — | | — | | — | | 181,134 | | 71 |
| | — | | (1,927) | | (3,974) | | — | | (517) |
| | — | | 154 | | — | | — | | — |
| | 298,641 | | 36,563 | | 573,774 | | 994,092 | | 16,966 |
| | | | | | | | | | |
| | 90,887 | | 28,417 | | 255,521 | | 379,564 | | 11,353 |
| | 90,887 | | 28,417 | | 255,521 | | 379,564 | | 11,353 |
| | 207,754 | | 8,146 | | 318,253 | | 614,528 | | 5,613 |
| | | | | | | | | | |
| | | | | | | | | | |
| | (1,279,665) | | (1,483,786) | | (7,715,276) | | (14,188,925) | | (151,751) |
| | 2,912,478 | | (2,222,516) | | 856,811 | | (22,983,487) | | — |
| | — | | (751) | | — | | — | | (216) |
| | 1,632,813 | | (3,707,053) | | (6,858,465) | | (37,172,412) | | (151,967) |
| | | | | | | | | | |
| | (5,457,861) | | (459,666) | | (24,088,684) | | (12,005,980) | | (1,105,003) |
| | — | | (586) | | — | | — | | (47) |
| | (5,457,861) | | (460,252) | | (24,088,684) | | (12,005,980) | | (1,105,050) |
| | (3,825,048) | | (4,167,305) | | (30,947,149) | | (49,178,392) | | (1,257,017) |
| | $(3,617,294) | | $(4,159,159) | | $(30,628,896) | | $(48,563,864) | | $(1,251,404) |
See Notes to Financial Statements
Page 37
First Trust Exchange-Traded Fund VI
Statements of Changes in Net Assets
| | First Trust Nasdaq
Bank ETF (FTXO) | | First Trust Nasdaq
Food & Beverage ETF (FTXG) |
| | Six Months
Ended
9/30/2022
(Unaudited) | | Year
Ended
3/31/2022 | | Six Months
Ended
9/30/2022
(Unaudited) | | Year
Ended
3/31/2022 |
| OPERATIONS: | | | | | | | |
Net investment income (loss)
| $ 3,217,993 | | $ 5,262,818 | | $ 6,115,716 | | $ 109,767 |
Net realized gain (loss)
| (21,705,440) | | (1,019,467) | | (33,564,774) | | (349,011) |
Net change in unrealized appreciation (depreciation)
| (34,857,978) | | (11,467,228) | | (79,615,598) | | 692,861 |
Net increase (decrease) in net assets resulting from operations
| (53,345,425) | | (7,223,877) | | (107,064,656) | | 453,617 |
| DISTRIBUTIONS TO SHAREHOLDERS FROM: | | | | | | | |
Investment operations
| (3,324,766) | | (5,155,141) | | (5,705,230) | | (116,496) |
| SHAREHOLDER TRANSACTIONS: | | | | | | | |
Proceeds from shares sold
| 14,715,844 | | 231,246,175 | | 1,170,331,517 | | 9,224,482 |
Cost of shares redeemed
| (117,943,787) | | (84,224,058) | | (236,389,918) | | (3,884,145) |
Net increase (decrease) in net assets resulting from shareholder transactions
| (103,227,943) | | 147,022,117 | | 933,941,599 | | 5,340,337 |
Total increase (decrease) in net assets
| (159,898,134) | | 134,643,099 | | 821,171,713 | | 5,677,458 |
| NET ASSETS: | | | | | | | |
Beginning of period
| 361,936,589 | | 227,293,490 | | 10,810,483 | | 5,133,025 |
End of period
| $202,038,455 | | $361,936,589 | | $831,982,196 | | $10,810,483 |
| CHANGES IN SHARES OUTSTANDING: | | | | | | | |
Shares outstanding, beginning of period
| 11,400,002 | | 7,300,002 | | 400,002 | | 200,002 |
Shares sold
| 500,000 | | 6,750,000 | | 41,850,000 | | 350,000 |
Shares redeemed
| (4,100,000) | | (2,650,000) | | (8,650,000) | | (150,000) |
Shares outstanding, end of period
| 7,800,002 | | 11,400,002 | | 33,600,002 | | 400,002 |
Page 38
See Notes to Financial Statements
First Trust Nasdaq
Oil & Gas ETF (FTXN) | | First Trust Nasdaq
Pharmaceuticals ETF (FTXH) | | First Trust S-Network
E-Commerce ETF (ISHP) |
Six Months
Ended
9/30/2022
(Unaudited) | | Year
Ended
3/31/2022 | | Six Months
Ended
9/30/2022
(Unaudited) | | Year
Ended
3/31/2022 | | Six Months
Ended
9/30/2022
(Unaudited) | | Year
Ended
3/31/2022 |
| | | | | | | | | | | |
| $ 16,528,021 | | $ 6,902,387 | | $ 207,754 | | $ 185,875 | | $ 8,146 | | $ 174,149 |
| 53,755,975 | | 170,957,349 | | 1,632,813 | | 387,327 | | (3,707,053) | | 359,766 |
| (184,268,695) | | 162,037,630 | | (5,457,861) | | 444,270 | | (460,252) | | (2,624,610) |
| (113,984,699) | | 339,897,366 | | (3,617,294) | | 1,017,472 | | (4,159,159) | | (2,090,695) |
| | | | | | | | | | | |
| (13,617,766) | | (6,320,716) | | (180,810) | | (176,100) | | (33,180) | | (143,821) |
| | | | | | | | | | | |
| 753,517,525 | | 1,655,064,859 | | 42,534,102 | | 2,582,284 | | — | | 36,521,440 |
| (747,499,258) | | (877,458,299) | | (20,011,753) | | (5,245,253) | | (10,089,830) | | (25,144,637) |
| 6,018,267 | | 777,606,560 | | 22,522,349 | | (2,662,969) | | (10,089,830) | | 11,376,803 |
| (121,584,198) | | 1,111,183,210 | | 18,724,245 | | (1,821,597) | | (14,282,169) | | 9,142,287 |
| | | | | | | | | | | |
| 1,147,630,972 | | 36,447,762 | | 17,311,330 | | 19,132,927 | | 18,586,402 | | 9,444,115 |
| $1,026,046,774 | | $1,147,630,972 | | $36,035,575 | | $17,311,330 | | $4,304,233 | | $18,586,402 |
| | | | | | | | | | | |
| 43,350,002 | | 2,350,002 | | 650,002 | | 750,002 | | 600,002 | | 300,002 |
| 28,150,000 | | 76,750,000 | | 1,600,000 | | 100,000 | | — | | 1,050,000 |
| (29,650,000) | | (35,750,000) | | (750,000) | | (200,000) | | (400,000) | | (750,000) |
| 41,850,002 | | 43,350,002 | | 1,500,002 | | 650,002 | | 200,002 | | 600,002 |
See Notes to Financial Statements
Page 39
First Trust Exchange-Traded Fund VI
Statements of Changes in Net Assets (Continued)
| | First Trust Nasdaq
Semiconductor ETF (FTXL) | | First Trust Nasdaq
Transportation ETF (FTXR) |
| | Six Months
Ended
9/30/2022
(Unaudited) | | Year
Ended
3/31/2022 | | Six Months
Ended
9/30/2022
(Unaudited) | | Year
Ended
3/31/2022 |
| OPERATIONS: | | | | | | | |
Net investment income (loss)
| $ 318,253 | | $ 361,146 | | $ 614,528 | | $ 10,254,406 |
Net realized gain (loss)
| (6,858,465) | | 14,839,706 | | (37,172,412) | | 18,134,255 |
Net change in unrealized appreciation (depreciation)
| (24,088,684) | | (11,810,521) | | (12,005,980) | | (109,717,327) |
Net increase (decrease) in net assets resulting from operations
| (30,628,896) | | 3,390,331 | | (48,563,864) | | (81,328,666) |
| DISTRIBUTIONS TO SHAREHOLDERS FROM: | | | | | | | |
Investment operations
| (309,240) | | (338,211) | | (840,745) | | (10,039,966) |
| SHAREHOLDER TRANSACTIONS: | | | | | | | |
Proceeds from shares sold
| 5,826,965 | | 93,443,236 | | — | | 720,128,082 |
Cost of shares redeemed
| (17,695,744) | | (72,200,805) | | (162,450,450) | | (1,419,772,038) |
Net increase (decrease) in net assets resulting from shareholder transactions
| (11,868,779) | | 21,242,431 | | (162,450,450) | | (699,643,956) |
Total increase (decrease) in net assets
| (42,806,915) | | 24,294,551 | | (211,855,059) | | (791,012,588) |
| NET ASSETS: | | | | | | | |
Beginning of period
| 108,450,703 | | 84,156,152 | | 280,841,726 | | 1,071,854,314 |
End of period
| $65,643,788 | | $108,450,703 | | $68,986,667 | | $280,841,726 |
| CHANGES IN SHARES OUTSTANDING: | | | | | | | |
Shares outstanding, beginning of period
| 1,550,002 | | 1,300,002 | | 8,700,002 | | 32,600,002 |
Shares sold
| 100,000 | | 1,300,000 | | — | | 22,150,000 |
Shares redeemed
| (300,000) | | (1,050,000) | | (5,750,000) | | (46,050,000) |
Shares outstanding, end of period
| 1,350,002 | | 1,550,002 | | 2,950,002 | | 8,700,002 |
| (a) | Inception date is January 25, 2022, which is consistent with the commencement of investment operations and is the date the initial creation units were established. |
Page 40
See Notes to Financial Statements
First Trust
S-Network Streaming
& Gaming ETF (BNGE) |
Six Months
Ended
9/30/2022
(Unaudited) | | Period
Ended
3/31/2022 (a) |
| | | |
| $ 5,613 | | $ 2,572 |
| (151,967) | | 91 |
| (1,105,050) | | (170,718) |
| (1,251,404) | | (168,055) |
| | | |
| (14,970) | | (405) |
| | | |
| 959,545 | | 3,660,317 |
| — | | — |
| 959,545 | | 3,660,317 |
| (306,829) | | 3,491,857 |
| | | |
| 3,491,857 | | — |
| $ 3,185,028 | | $ 3,491,857 |
| | | |
| 150,002 | | — |
| 50,000 | | 150,002 |
| — | | — |
| 200,002 | | 150,002 |
See Notes to Financial Statements
Page 41
First Trust Exchange-Traded Fund VI
Financial Highlights
For a share outstanding throughout each period
First Trust Nasdaq Bank ETF (FTXO)
| | Six Months
Ended
9/30/2022
(Unaudited) | | Year Ended March 31, |
| | 2022 | | 2021 | | 2020 | | 2019 | | 2018 | |
Net asset value, beginning of period
| $ 31.75 | | $ 31.14 | | $ 15.64 | | $ 24.41 | | $ 29.50 | | $ 25.94 |
| Income from investment operations: | | | | | | | | | | | |
Net investment income (loss)
| 0.40 | | 0.61 | | 0.59 (a) | | 0.73 | | 0.84 | | 0.40 |
Net realized and unrealized gain (loss)
| (5.85) | | 0.61 (b) | | 15.50 | | (8.77) | | (5.14) | | 3.56 |
Total from investment operations
| (5.45) | | 1.22 | | 16.09 | | (8.04) | | (4.30) | | 3.96 |
| Distributions paid to shareholders from: | | | | | | | | | | | |
Net investment income
| (0.40) | | (0.61) | | (0.59) | | (0.73) | | (0.79) | | (0.40) |
Net asset value, end of period
| $25.90 | | $31.75 | | $31.14 | | $15.64 | | $24.41 | | $29.50 |
Total return (c)
| (17.16)% | | 3.89% | | 105.13% | | (33.93)% | | (14.49)% | | 15.35% |
| Ratios to average net assets/supplemental data: | | | | | | | | | | | |
Net assets, end of period (in 000’s)
| $ 202,038 | | $ 361,937 | | $ 227,293 | | $ 58,658 | | $ 168,447 | | $ 1,314,444 |
Ratio of total expenses to average net assets
| 0.60% (d) | | 0.60% | | 0.60% | | 0.60% | | 0.60% | | 0.60% |
Ratio of net investment income (loss) to average net assets
| 2.48% (d) | | 1.91% | | 2.65% | | 2.69% | | 1.83% | | 1.47% |
Portfolio turnover rate (e)
| 27% | | 78% | | 176% | | 59% | | 87% | | 39% |
| (a) | Based on average shares outstanding. |
| (b) | The per share amount does not correlate with the aggregate realized and unrealized gain (loss) due to the timing of the Fund share sales and repurchases in relation to market value fluctuation of the underlying investments. |
| (c) | Total return is calculated assuming an initial investment made at the net asset value at the beginning of the period, reinvestment of all distributions at net asset value during the period, and redemption at net asset value on the last day of the period. The returns presented do not reflect the deduction of taxes that a shareholder would pay on Fund distributions or the redemption or sale of Fund shares. Total return is calculated for the time period presented and is not annualized for periods of less than a year. |
| (d) | Annualized. |
| (e) | Portfolio turnover is calculated for the time period presented and is not annualized for periods of less than a year and does not include securities received or delivered from processing creations or redemptions and in-kind transactions. |
Page 42
See Notes to Financial Statements
First Trust Exchange-Traded Fund VI
Financial Highlights (Continued)
For a share outstanding throughout each period
First Trust Nasdaq Food & Beverage ETF (FTXG)
| | Six Months
Ended
9/30/2022
(Unaudited) | | Year Ended March 31, |
| | 2022 | | 2021 | | 2020 | | 2019 | | 2018 | |
Net asset value, beginning of period
| $ 27.03 | | $ 25.66 | | $ 17.28 | | $ 20.06 | | $ 19.71 | | $ 20.63 |
| Income from investment operations: | | | | | | | | | | | |
Net investment income (loss)
| 0.19 | | 0.41 | | 0.32 | | 0.27 | | 0.27 | | 0.35 |
Net realized and unrealized gain (loss)
| (2.28) | | 1.39 | | 8.38 | | (2.77) | | 0.33 | | (0.95) |
Total from investment operations
| (2.09) | | 1.80 | | 8.70 | | (2.50) | | 0.60 | | (0.60) |
| Distributions paid to shareholders from: | | | | | | | | | | | |
Net investment income
| (0.18) | | (0.43) | | (0.32) | | (0.28) | | (0.25) | | (0.32) |
Net asset value, end of period
| $24.76 | | $27.03 | | $25.66 | | $17.28 | | $20.06 | | $19.71 |
Total return (a)
| (7.76)% | | 7.13% | | 50.65% | | (12.69)% | | 3.13% | | (2.96)% |
| Ratios to average net assets/supplemental data: | | | | | | | | | | | |
Net assets, end of period (in 000’s)
| $ 831,982 | | $ 10,810 | | $ 5,133 | | $ 2,592 | | $ 2,006 | | $ 985 |
Ratio of total expenses to average net assets
| 0.60% (b) | | 0.60% | | 0.60% | | 0.60% | | 0.60% | | 0.60% |
Ratio of net investment income (loss) to average net assets
| 1.68% (b) | | 1.61% | | 1.44% | | 1.58% | | 1.55% | | 1.53% |
Portfolio turnover rate (c)
| 32% | | 77% | | 131% | | 59% | | 108% | | 76% |
| (a) | Total return is calculated assuming an initial investment made at the net asset value at the beginning of the period, reinvestment of all distributions at net asset value during the period, and redemption at net asset value on the last day of the period. The returns presented do not reflect the deduction of taxes that a shareholder would pay on Fund distributions or the redemption or sale of Fund shares. Total return is calculated for the time period presented and is not annualized for periods of less than a year. |
| (b) | Annualized. |
| (c) | Portfolio turnover is calculated for the time period presented and is not annualized for periods of less than a year and does not include securities received or delivered from processing creations or redemptions and in-kind transactions. |
See Notes to Financial Statements
Page 43
First Trust Exchange-Traded Fund VI
Financial Highlights (Continued)
For a share outstanding throughout each period
First Trust Nasdaq Oil & Gas ETF (FTXN)
| | Six Months
Ended
9/30/2022
(Unaudited) | | Year Ended March 31, |
| | 2022 | | 2021 | | 2020 | | 2019 | | 2018 | |
Net asset value, beginning of period
| $ 26.47 | | $ 15.51 | | $ 8.10 | | $ 18.91 | | $ 19.95 | | $ 20.63 |
| Income from investment operations: | | | | | | | | | | | |
Net investment income (loss)
| 0.39 | | 0.31 | | 0.22 | | 0.31 | | 0.41 | | 0.36 |
Net realized and unrealized gain (loss)
| (2.02) | | 10.96 | | 7.39 | | (10.79) | | (1.06) | | (0.67) |
Total from investment operations
| (1.63) | | 11.27 | | 7.61 | | (10.48) | | (0.65) | | (0.31) |
| Distributions paid to shareholders from: | | | | | | | | | | | |
Net investment income
| (0.32) | | (0.31) | | (0.20) | | (0.32) | | (0.39) | | (0.33) |
Return of capital
| — | | — | | — | | (0.01) | | — | | (0.04) |
Total distributions
| (0.32) | | (0.31) | | (0.20) | | (0.33) | | (0.39) | | (0.37) |
Net asset value, end of period
| $24.52 | | $26.47 | | $15.51 | | $8.10 | | $18.91 | | $19.95 |
Total return (a)
| (6.13)% | | 73.19% | | 95.16% | | (56.26)% | | (3.27)% | | (1.47)% |
| Ratios to average net assets/supplemental data: | | | | | | | | | | | |
Net assets, end of period (in 000’s)
| $ 1,026,047 | | $ 1,147,631 | | $ 36,448 | | $ 6,885 | | $ 12,294 | | $ 3,991 |
Ratio of total expenses to average net assets
| 0.60% (b) | | 0.60% | | 0.60% | | 0.60% | | 0.60% | | 0.60% |
Ratio of net investment income (loss) to average net assets
| 2.92% (b) | | 1.87% | | 2.01% | | 2.14% | | 1.69% | | 1.96% |
Portfolio turnover rate (c)
| 37% | | 139% | | 136% | | 76% | | 126% | | 92% |
| (a) | Total return is calculated assuming an initial investment made at the net asset value at the beginning of the period, reinvestment of all distributions at net asset value during the period, and redemption at net asset value on the last day of the period. The returns presented do not reflect the deduction of taxes that a shareholder would pay on Fund distributions or the redemption or sale of Fund shares. Total return is calculated for the time period presented and is not annualized for periods of less than a year. |
| (b) | Annualized. |
| (c) | Portfolio turnover is calculated for the time period presented and is not annualized for periods of less than a year and does not include securities received or delivered from processing creations or redemptions and in-kind transactions. |
Page 44
See Notes to Financial Statements
First Trust Exchange-Traded Fund VI
Financial Highlights (Continued)
For a share outstanding throughout each period
First Trust Nasdaq Pharmaceuticals ETF (FTXH)
| | Six Months
Ended
9/30/2022
(Unaudited) | | Year Ended March 31, |
| | 2022 | | 2021 | | 2020 | | 2019 | | 2018 | |
Net asset value, beginning of period
| $ 26.63 | | $ 25.51 | | $ 19.36 | | $ 21.50 | | $ 21.14 | | $ 19.83 |
| Income from investment operations: | | | | | | | | | | | |
Net investment income (loss)
| 0.13 | | 0.27 | | 0.24 | | 0.18 | | 0.13 | | 0.17 |
Net realized and unrealized gain (loss)
| (2.61) | | 1.10 | | 6.14 | | (2.13) | | 0.35 | | 1.65 |
Total from investment operations
| (2.48) | | 1.37 | | 6.38 | | (1.95) | | 0.48 | | 1.82 |
| Distributions paid to shareholders from: | | | | | | | | | | | |
Net investment income
| (0.13) | | (0.25) | | (0.23) | | (0.19) | | (0.12) | | (0.17) |
Net realized gain
| — | | — | | — | | — | | — | | (0.34) |
Total distributions
| (0.13) | | (0.25) | | (0.23) | | (0.19) | | (0.12) | | (0.51) |
Net asset value, end of period
| $24.02 | | $26.63 | | $25.51 | | $19.36 | | $21.50 | | $21.14 |
Total return (a)
| (9.33)% | | 5.39% | | 33.00% | | (9.13)% | | 2.30% | | 9.32% |
| Ratios to average net assets/supplemental data: | | | | | | | | | | | |
Net assets, end of period (in 000’s)
| $ 36,036 | | $ 17,311 | | $ 19,133 | | $ 5,810 | | $ 5,376 | | $ 2,114 |
Ratio of total expenses to average net assets
| 0.60% (b) | | 0.60% | | 0.60% | | 0.60% | | 0.60% | | 0.60% |
Ratio of net investment income (loss) to average net assets
| 1.37% (b) | | 0.97% | | 1.07% | | 0.85% | | 0.69% | | 0.80% |
Portfolio turnover rate (c)
| 27% | | 77% | | 83% | | 42% | | 107% | | 70% |
| (a) | Total return is calculated assuming an initial investment made at the net asset value at the beginning of the period, reinvestment of all distributions at net asset value during the period, and redemption at net asset value on the last day of the period. The returns presented do not reflect the deduction of taxes that a shareholder would pay on Fund distributions or the redemption or sale of Fund shares. Total return is calculated for the time period presented and is not annualized for periods of less than a year. |
| (b) | Annualized. |
| (c) | Portfolio turnover is calculated for the time period presented and is not annualized for periods of less than a year and does not include securities received or delivered from processing creations or redemptions and in-kind transactions. |
See Notes to Financial Statements
Page 45
First Trust Exchange-Traded Fund VI
Financial Highlights (Continued)
For a share outstanding throughout each period
First Trust S-Network E-Commerce ETF (ISHP)
| | Six Months
Ended
9/30/2022
(Unaudited) | | Year Ended March 31, |
| | 2022 | | 2021 | | 2020 | | 2019 | | 2018 | |
Net asset value, beginning of period
| $ 30.98 | | $ 31.48 | | $ 18.10 | | $ 22.34 | | $ 20.86 | | $ 19.68 |
| Income from investment operations: | | | | | | | | | | | |
Net investment income (loss)
| 0.07 | | 0.26 | | 0.19 | | 0.27 | | 0.21 | | 0.31 |
Net realized and unrealized gain (loss)
| (9.42) | | (0.54) | | 13.39 | | (4.22) | | 1.45 | | 1.18 |
Total from investment operations
| (9.35) | | (0.28) | | 13.58 | | (3.95) | | 1.66 | | 1.49 |
| Distributions paid to shareholders from: | | | | | | | | | | | |
Net investment income
| (0.11) | | (0.22) | | (0.20) | | (0.29) | | (0.18) | | (0.31) |
Net asset value, end of period
| $21.52 | | $30.98 | | $31.48 | | $18.10 | | $22.34 | | $20.86 |
Total return (a)
| (30.21)% | | (0.94)% | | 75.23% | | (17.90)% | | 7.98% | | 7.63% |
| Ratios to average net assets/supplemental data: | | | | | | | | | | | |
Net assets, end of period (in 000’s)
| $ 4,304 | | $ 18,586 | | $ 9,444 | | $ 3,619 | | $ 8,934 | | $ 1,043 |
Ratio of total expenses to average net assets
| 0.60% (b) | | 0.60% | | 0.60% | | 0.60% | | 0.60% | | 0.60% |
Ratio of net investment income (loss) to average net assets
| 0.17% (b) | | 0.91% | | 0.70% | | 1.11% | | 1.41% | | 1.54% |
Portfolio turnover rate (c)
| 53% | | 213% | | 114% | | 65% | | 127% | | 126% |
| (a) | Total return is calculated assuming an initial investment made at the net asset value at the beginning of the period, reinvestment of all distributions at net asset value during the period, and redemption at net asset value on the last day of the period. The returns presented do not reflect the deduction of taxes that a shareholder would pay on Fund distributions or the redemption or sale of Fund shares. Total return is calculated for the time period presented and is not annualized for periods of less than a year. |
| (b) | Annualized. |
| (c) | Portfolio turnover is calculated for the time period presented and is not annualized for periods of less than a year and does not include securities received or delivered from processing creations or redemptions and in-kind transactions. |
Page 46
See Notes to Financial Statements
First Trust Exchange-Traded Fund VI
Financial Highlights (Continued)
For a share outstanding throughout each period
First Trust Nasdaq Semiconductor ETF (FTXL)
| | Six Months
Ended
9/30/2022
(Unaudited) | | Year Ended March 31, |
| | 2022 | | 2021 | | 2020 | | 2019 | | 2018 | |
Net asset value, beginning of period
| $ 69.97 | | $ 64.74 | | $ 33.00 | | $ 31.83 | | $ 32.58 | | $ 25.04 |
| Income from investment operations: | | | | | | | | | | | |
Net investment income (loss)
| 0.23 | | 0.27 | | 0.23 | | 0.38 | | 0.25 | | 0.14 |
Net realized and unrealized gain (loss)
| (21.36) | | 5.22 | | 31.75 | | 1.18 | | (0.79) | | 7.54 |
Total from investment operations
| (21.13) | | 5.49 | | 31.98 | | 1.56 | | (0.54) | | 7.68 |
| Distributions paid to shareholders from: | | | | | | | | | | | |
Net investment income
| (0.22) | | (0.26) | | (0.24) | | (0.39) | | (0.21) | | (0.14) |
Net asset value, end of period
| $48.62 | | $69.97 | | $64.74 | | $33.00 | | $31.83 | | $32.58 |
Total return (a)
| (30.21)% | | 8.46% | | 97.11% | | 4.82% | | (1.62)% | | 30.77% |
| Ratios to average net assets/supplemental data: | | | | | | | | | | | |
Net assets, end of period (in 000’s)
| $ 65,644 | | $ 108,451 | | $ 84,156 | | $ 31,353 | | $ 30,242 | | $ 47,247 |
Ratio of total expenses to average net assets
| 0.60% (b) | | 0.60% | | 0.60% | | 0.60% | | 0.60% | | 0.60% |
Ratio of net investment income (loss) to average net assets
| 0.75% (b) | | 0.40% | | 0.45% | | 1.00% | | 0.78% | | 0.55% |
Portfolio turnover rate (c)
| 25% | | 58% | | 113% | | 64% | | 94% | | 59% |
| (a) | Total return is calculated assuming an initial investment made at the net asset value at the beginning of the period, reinvestment of all distributions at net asset value during the period, and redemption at net asset value on the last day of the period. The returns presented do not reflect the deduction of taxes that a shareholder would pay on Fund distributions or the redemption or sale of Fund shares. Total return is calculated for the time period presented and is not annualized for periods of less than a year. |
| (b) | Annualized. |
| (c) | Portfolio turnover is calculated for the time period presented and is not annualized for periods of less than a year and does not include securities received or delivered from processing creations or redemptions and in-kind transactions. |
See Notes to Financial Statements
Page 47
First Trust Exchange-Traded Fund VI
Financial Highlights (Continued)
For a share outstanding throughout each period
First Trust Nasdaq Transportation ETF (FTXR)
| | Six Months
Ended
9/30/2022
(Unaudited) | | Year Ended March 31, |
| | 2022 | | 2021 | | 2020 | | 2019 | | 2018 | |
Net asset value, beginning of period
| $ 32.28 | | $ 32.88 | | $ 15.11 | | $ 23.33 | | $ 24.93 | | $ 22.78 |
| Income from investment operations: | | | | | | | | | | | |
Net investment income (loss)
| 0.21 | | 0.45 | | 0.04 | | 0.30 | | 0.35 | | 0.32 |
Net realized and unrealized gain (loss)
| (8.86) | | (0.62) | | 17.79 | | (8.22) | | (1.62) | | 2.16 |
Total from investment operations
| (8.65) | | (0.17) | | 17.83 | | (7.92) | | (1.27) | | 2.48 |
| Distributions paid to shareholders from: | | | | | | | | | | | |
Net investment income
| (0.24) | | (0.43) | | (0.06) | | (0.30) | | (0.33) | | (0.33) |
Net asset value, end of period
| $23.39 | | $32.28 | | $32.88 | | $15.11 | | $23.33 | | $24.93 |
Total return (a)
| (26.84)% | | (0.53)% | | 118.10% | | (34.35)% | | (5.11)% | | 10.89% |
| Ratios to average net assets/supplemental data: | | | | | | | | | | | |
Net assets, end of period (in 000’s)
| $ 68,987 | | $ 280,842 | | $ 1,071,854 | | $ 1,511 | | $ 2,333 | | $ 3,740 |
Ratio of total expenses to average net assets
| 0.60% (b) | | 0.60% | | 0.60% | | 0.60% | | 0.60% | | 0.60% |
Ratio of net investment income (loss) to average net assets
| 0.97% (b) | | 0.92% | | 0.10% | | 1.04% | | 1.38% | | 1.27% |
Portfolio turnover rate (c)
| 25% | | 43% | | 129% | | 89% | | 108% | | 78% |
| (a) | Total return is calculated assuming an initial investment made at the net asset value at the beginning of the period, reinvestment of all distributions at net asset value during the period, and redemption at net asset value on the last day of the period. The returns presented do not reflect the deduction of taxes that a shareholder would pay on Fund distributions or the redemption or sale of Fund shares. Total return is calculated for the time period presented and is not annualized for periods of less than a year. |
| (b) | Annualized. |
| (c) | Portfolio turnover is calculated for the time period presented and is not annualized for periods of less than a year and does not include securities received or delivered from processing creations or redemptions and in-kind transactions. |
Page 48
See Notes to Financial Statements
First Trust Exchange-Traded Fund VI
Financial Highlights (Continued)
For a share outstanding throughout each period
First Trust S-Network Streaming & Gaming ETF (BNGE)
| | Six Months
Ended
9/30/2022
(Unaudited) | | Period
Ended
3/31/2022 (a) |
Net asset value, beginning of period
| $ 23.28 | | $ 24.46 |
| Income from investment operations: | | | |
Net investment income (loss)
| 0.05 | | 0.02 |
Net realized and unrealized gain (loss)
| (7.31) | | (1.20) |
Total from investment operations
| (7.26) | | (1.18) |
| Distributions paid to shareholders from: | | | |
Net investment income
| (0.10) | | (0.00) (b) |
Net asset value, end of period
| $15.92 | | $23.28 |
Total return (c)
| (31.24)% | | (4.81)% |
| Ratios to average net assets/supplemental data: | | | |
Net assets, end of period (in 000’s)
| $ 3,185 | | $ 3,492 |
Ratio of total expenses to average net assets
| 0.70% (d) | | 0.70% (d) |
Ratio of net investment income (loss) to average net assets
| 0.35% (d) | | 0.47% (d) |
Portfolio turnover rate (e)
| 23% | | 0% |
| (a) | Inception date is January 25, 2022, which is consistent with the commencement of investment operations and is the date the initial creation units were established. |
| (b) | Amount is less than $0.01. |
| (c) | Total return is calculated assuming an initial investment made at the net asset value at the beginning of the period, reinvestment of all distributions at net asset value during the period, and redemption at net asset value on the last day of the period. The return presented does not reflect the deduction of taxes that a shareholder would pay on Fund distributions or the redemption or sale of Fund shares. Total return is calculated for the time period presented and is not annualized for periods of less than a year. |
| (d) | Annualized. |
| (e) | Portfolio turnover is calculated for the time period presented and is not annualized for periods of less than a year and does not include securities received or delivered from processing creations or redemptions and in-kind transactions. |
See Notes to Financial Statements
Page 49
Notes to Financial Statements
First Trust Exchange-Traded Fund VI
September 30, 2022 (Unaudited)
1. Organization
First Trust Exchange-Traded Fund VI (the “Trust”) is an open-end management investment company organized as a Massachusetts business trust on June 4, 2012, and is registered with the Securities and Exchange Commission (“SEC”) under the Investment Company Act of 1940, as amended (the “1940 Act”).
The Trust currently consists of thirty-three exchange-traded funds that are offering shares. This report covers the eight funds (each a “Fund” and collectively, the “Funds”) listed below, each a non-diversified series of the Trust and listed and traded on The Nasdaq Stock Market LLC (“Nasdaq”) with the exception of BNGE which is listed and traded on The NYSE Arca, Inc.
First Trust Nasdaq Bank ETF - (ticker “FTXO”)
First Trust Nasdaq Food & Beverage ETF - (ticker “FTXG”)
First Trust Nasdaq Oil & Gas ETF - (ticker “FTXN”)
First Trust Nasdaq Pharmaceuticals ETF - (ticker “FTXH”)
First Trust S-Network E-Commerce ETF - (ticker “ISHP”)
First Trust Nasdaq Semiconductor ETF - (ticker “FTXL”)
First Trust Nasdaq Transportation ETF - (ticker “FTXR”)
First Trust S-Network Streaming & Gaming ETF - (ticker “BNGE”)
Each Fund represents a separate series of shares of beneficial interest in the Trust. Unlike conventional mutual funds, each Fund issues and redeems shares on a continuous basis, at net asset value (“NAV”), only in large blocks of shares known as “Creation Units.” The investment objective of each Fund is to seek investment results that correspond generally to the price and yield (before the Fund’s fees and expenses) of the following indices:
| Fund | Index |
| First Trust Nasdaq Bank ETF | Nasdaq US Smart Banks IndexTM |
| First Trust Nasdaq Food & Beverage ETF | Nasdaq US Smart Food & Beverage IndexTM |
| First Trust Nasdaq Oil & Gas ETF | Nasdaq US Smart Oil & Gas IndexTM |
| First Trust Nasdaq Pharmaceuticals ETF | Nasdaq US Smart Pharmaceuticals IndexTM |
| First Trust S-Network E-Commerce ETF | S-Network Global E-Commerce IndexTM |
| First Trust Nasdaq Semiconductor ETF | Nasdaq US Smart Semiconductor IndexTM |
| First Trust Nasdaq Transportation ETF | Nasdaq US Smart Transportation IndexTM |
| First Trust S-Network Streaming & Gaming ETF | S-Network Streaming & Gaming Index |
2. Significant Accounting Policies
The Funds are each considered an investment company and follow accounting and reporting guidance under Financial Accounting Standards Board Accounting Standards Codification Topic 946, “Financial Services-Investment Companies.” The following is a summary of significant accounting policies consistently followed by the Funds in the preparation of the financial statements. The preparation of the financial statements in accordance with accounting principles generally accepted in the United States of America (“U.S. GAAP”) requires management to make estimates and assumptions that affect the reported amounts and disclosures in the financial statements. Actual results could differ from those estimates.
A. Portfolio Valuation
Each Fund’s NAV is determined daily as of the close of regular trading on the New York Stock Exchange (“NYSE”), normally 4:00 p.m. Eastern time, on each day the NYSE is open for trading. If the NYSE closes early on a valuation day, the NAV is determined as of that time. Foreign securities are priced using data reflecting the earlier closing of the principal markets for those securities. Each Fund’s NAV is calculated by dividing the value of all assets of each Fund (including accrued interest and dividends), less all liabilities (including accrued expenses and dividends declared but unpaid), by the total number of shares outstanding.
Each Fund’s investments are valued daily at market value or, in the absence of market value with respect to any portfolio securities, at fair value. Market value prices represent readily available market quotations such as last sale or official closing prices from a national or foreign exchange (i.e., a regulated market) and are primarily obtained from third-party pricing services. Fair value prices represent any prices not considered market value prices and are either obtained from a third-party pricing service or are determined by the Pricing Committee of the Funds’ investment advisor, First Trust Advisors L.P. (“First Trust” or the “Advisor”), in accordance with valuation procedures approved by the Trust’s Board of Trustees, and in accordance with provisions of the 1940 Act and rules thereunder. Investments valued by the Advisor’s Pricing Committee, if any, are footnoted as such in the footnotes to the Portfolio of Investments. Each Fund’s investments are valued as follows:
Notes to Financial Statements (Continued)
First Trust Exchange-Traded Fund VI
September 30, 2022 (Unaudited)
Common stocks and other equity securities listed on any national or foreign exchange (excluding Nasdaq and the London Stock Exchange Alternative Investment Market (“AIM”)) are valued at the last sale price on the exchange on which they are principally traded or, for Nasdaq and AIM securities, the official closing price. Securities traded on more than one securities exchange are valued at the last sale price or official closing price, as applicable, at the close of the securities exchange representing the primary exchange for such securities.
Securities trading on foreign exchanges or over-the-counter markets that close prior to the NYSE close may be valued using a systematic fair valuation model provided by a third-party pricing service. If these foreign securities meet certain criteria in relation to the valuation model, their valuation is systematically adjusted to reflect the impact of movement in the U.S. market after the close of the foreign markets.
Shares of open-end funds are valued based on NAV per share.
Securities traded in an over-the-counter market are valued at the mean of their most recent bid and asked price, if available, and otherwise at their last trade price.
Overnight repurchase agreements are valued at amortized cost when it represents the most appropriate reflection of fair market value.
Certain securities may not be able to be priced by pre-established pricing methods. Such securities may be valued by the Advisor’s Pricing Committee at fair value. These securities generally include, but are not limited to, restricted securities (securities which may not be publicly sold without registration under the Securities Act of 1933, as amended) for which a third-party pricing service is unable to provide a market price; securities whose trading has been formally suspended; a security whose market or fair value price is not available from a pre-established pricing source; a security with respect to which an event has occurred that is likely to materially affect the value of the security after the market has closed but before the calculation of a Fund’s NAV or make it difficult or impossible to obtain a reliable market quotation; and a security whose price, as provided by the third-party pricing service, does not reflect the security’s fair value. As a general principle, the current fair value of a security would appear to be the amount which the owner might reasonably expect to receive for the security upon its current sale. When fair value prices are used, generally they will differ from market quotations or official closing prices on the applicable exchanges. A variety of factors may be considered in determining the fair value of such securities, including, but not limited to, the following:
| 1) | the last sale price on the exchange on which they are principally traded or, for Nasdaq and AIM securities, the official closing price; |
| 2) | the type of security; |
| 3) | the size of the holding; |
| 4) | the initial cost of the security; |
| 5) | transactions in comparable securities; |
| 6) | price quotes from dealers and/or third-party pricing services; |
| 7) | relationships among various securities; |
| 8) | information obtained by contacting the issuer, analysts, or the appropriate stock exchange; |
| 9) | an analysis of the issuer’s financial statements; |
| 10) | the existence of merger proposals or tender offers that might affect the value of the security; and |
| 11) | other relevant factors. |
If the securities in question are foreign securities, the following additional information may be considered:
| 1) | the value of similar foreign securities traded on other foreign markets; |
| 2) | ADR trading of similar securities; |
| 3) | closed-end fund or exchange-traded fund trading of similar securities; |
| 4) | foreign currency exchange activity; |
| 5) | the trading prices of financial products that are tied to baskets of foreign securities; |
| 6) | factors relating to the event that precipitated the pricing problem; |
| 7) | whether the event is likely to recur; |
| 8) | whether the effects of the event are isolated or whether they affect entire markets, countries or regions; and |
| 9) | other relevant factors. |
In addition, differences between the prices used to calculate a Fund’s NAV and the prices used by such Fund’s corresponding index could result in a difference between a Fund’s performance and the performance of its underlying index.
Notes to Financial Statements (Continued)
First Trust Exchange-Traded Fund VI
September 30, 2022 (Unaudited)
Because foreign markets may be open on different days than the days during which investors may transact in the shares of a Fund, the value of the Fund’s securities may change on the days when investors are not able to transact in the shares of the Fund. The value of securities denominated in foreign currencies is converted into U.S. dollars using exchange rates determined daily as of the close of regular trading on the NYSE. Any use of a different rate from the rates used by a relevant index may adversely affect the Fund’s ability to track the index.
The Funds are subject to fair value accounting standards that define fair value, establish the framework for measuring fair value and provide a three-level hierarchy for fair valuation based upon the inputs to the valuation as of the measurement date. The three levels of the fair value hierarchy are as follows:
| • | Level 1 – Level 1 inputs are quoted prices in active markets for identical investments. An active market is a market in which transactions for the investment occur with sufficient frequency and volume to provide pricing information on an ongoing basis. |
| • | Level 2 – Level 2 inputs are observable inputs, either directly or indirectly, and include the following: |
| o | Quoted prices for similar investments in active markets. |
| o | Quoted prices for identical or similar investments in markets that are non-active. A non-active market is a market where there are few transactions for the investment, the prices are not current, or price quotations vary substantially either over time or among market makers, or in which little information is released publicly. |
| o | Inputs other than quoted prices that are observable for the investment (for example, interest rates and yield curves observable at commonly quoted intervals, volatilities, prepayment speeds, loss severities, credit risks, and default rates). |
| o | Inputs that are derived principally from or corroborated by observable market data by correlation or other means. |
| • | Level 3 – Level 3 inputs are unobservable inputs. Unobservable inputs may reflect the reporting entity’s own assumptions about the assumptions that market participants would use in pricing the investment. |
The inputs or methodologies used for valuing investments are not necessarily an indication of the risk associated with investing in those investments. A summary of the inputs used to value each Fund’s investments as of September 30, 2022, is included with each Fund’s Portfolio of Investments.
In December 2020, the SEC adopted Rule 2a-5 under the 1940 Act, establishing requirements to determine fair value in good faith for purposes of the 1940 Act. The rule permits fund boards to designate a fund’s investment adviser to perform fair value determinations, subject to board oversight and certain other conditions. The rule also defines when market quotations are “readily available” for purposes of the 1940 Act and requires a fund to fair value a portfolio investment when a market quotation is not readily available. The SEC also adopted new Rule 31a-4 under the 1940 Act, which sets forth recordkeeping requirements associated with fair value determinations. The compliance date for Rule 2a-5 and Rule 31a-4 was September 8, 2022.
Effective September 8, 2022 and pursuant to the requirements of Rule 2a-5, the Trust’s Board of Trustees designated the Advisor as its valuation designee to perform fair value determinations and approved new Advisor Valuation Procedures for the Trust.
B. Securities Transactions and Investment Income
Securities transactions are recorded as of the trade date. Realized gains and losses from securities transactions are recorded on the identified cost basis. Dividend income is recorded on the ex-dividend date except that certain dividends from foreign securities are recorded as soon as the information becomes available after the ex-dividend date. Interest income, if any, is recorded on the accrual basis.
Withholding taxes and tax reclaims on foreign dividends have been provided for in accordance with each Fund’s understanding of the applicable country’s tax rules and rates.
C. Foreign Currency
The books and records of the Funds are maintained in U.S. dollars. Foreign currencies, investments and other assets and liabilities are translated into U.S. dollars at the exchange rates prevailing at the end of the period. Purchases and sales of investments and items of income and expense are translated on the respective dates of such transactions. Unrealized gains and losses on assets and liabilities, other than investments in securities, which result from changes in foreign currency exchange rates have been included in “Net change in unrealized appreciation (depreciation) on foreign currency translation” on the Statements of Operations. Unrealized gains and losses on investments in securities which result from changes in foreign exchange rates are included with fluctuations arising from changes in market price and are included in “Net change in unrealized appreciation (depreciation) on investments” on the Statements of Operations. Net realized foreign currency gains and losses include the effect of changes in exchange rates between trade date and
Notes to Financial Statements (Continued)
First Trust Exchange-Traded Fund VI
September 30, 2022 (Unaudited)
settlement date on investment security transactions, foreign currency transactions and interest and dividends received and are included in “Net realized gain (loss) on foreign currency transactions” on the Statements of Operations. The portion of foreign currency gains and losses related to fluctuations in exchange rates between the initial purchase settlement date and subsequent sale trade date is included in “Net realized gain (loss) on investments” on the Statements of Operations.
D. Offsetting on the Statements of Assets and Liabilities
Offsetting assets and liabilities requires entities to disclose both gross and net information about instruments and transactions eligible for offset on the Statements of Assets and Liabilities and disclose instruments and transactions subject to master netting or similar agreements. These disclosure requirements are intended to help investors and other financial statement users better assess the effect or potential effect of offsetting arrangements on a Fund’s financial position. The transactions subject to offsetting disclosures are derivative instruments, repurchase agreements and reverse repurchase agreements, and securities borrowing and securities lending transactions.
This disclosure, if applicable, is included within each Fund’s Portfolio of Investments under the heading “Offsetting Assets and Liabilities.” For financial reporting purposes, the Funds do not offset financial assets and financial liabilities that are subject to master netting arrangements (“MNAs”) or similar agreements on the Statements of Assets and Liabilities. MNAs provide the right, in the event of default (including bankruptcy and insolvency), for the non-defaulting counterparty to liquidate the collateral and calculate the net exposure to the defaulting party or request additional collateral.
E. Securities Lending
The Funds may lend securities representing up to 33 1/3% of the value of their total assets to broker-dealers, banks and other institutions to generate additional income. When a Fund loans its portfolio securities, it will receive, at the inception of each loan, collateral equal to at least 102% (for domestic securities) or 105% (for international securities) of the market value of the loaned securities. The collateral amount is valued at the beginning of each business day and is compared to the market value of the loaned securities from the prior business day to determine if additional collateral is required. If additional collateral is required, a request is sent to the borrower. Securities lending involves the risk that the Fund may lose money because the borrower of the Fund’s loaned securities fails to return the securities in a timely manner or at all. The Fund could also lose money in the event of (i) a decline in the value of the collateral provided for the loaned securities, (ii) a decline in the value of any investments made with cash collateral or (iii) an increase in the value of the loaned securities if the borrower does not increase the collateral accordingly and the borrower fails to return the securities. These events could also trigger adverse tax consequences for the Funds.
Under the Funds’ Securities Lending Agency Agreement, the securities lending agent will generally bear the risk that a borrower may default on its obligation to return loaned securities. Brown Brothers Harriman & Co. (“BBH”) acts as the Funds’ securities lending agent and is responsible for executing the lending of the portfolio securities to creditworthy borrowers. The Funds, however, will be responsible for the risks associated with the investment of cash collateral. A Fund may lose money on its investment of cash collateral, which may affect its ability to repay the collateral to the borrower without the use of other Fund assets. Each Fund that engages in securities lending receives compensation (net of any rebate and securities lending agent fees) for lending its securities. Compensation can be in the form of fees received from the securities lending agent or dividends or interest earned from the investment of cash collateral. The fees received from the securities lending agent are accrued daily. The dividend and interest earned on the securities loaned is accounted for in the same manner as other dividend and interest income. At September 30, 2022, FTXR and BNGE had securities in the securities lending program. During the six months ended September 30, 2022, only FTXR and BNGE participated in the securities lending program.
In the event of a default by a borrower with respect to any loan, BBH will exercise any and all remedies provided under the applicable borrower agreement to make the Funds whole. These remedies include purchasing replacement securities by applying the collateral held from the defaulting broker against the purchase cost of the replacement securities. If, despite such efforts by BBH to exercise these remedies, a Fund sustains losses as a result of a borrower’s default, BBH will indemnify the Fund by purchasing replacement securities at its own expense, or paying the Funds an amount equal to the market value of the replacement securities, subject to certain limitations which are set forth in detail in the Securities Lending Agency Agreement between the Trust on behalf of the Funds and BBH.
F. Repurchase Agreements
Repurchase agreements involve the purchase of securities subject to the seller’s agreement to repurchase the securities at a mutually agreed upon date and price, under the terms of a Master Repurchase Agreement (“MRA”). During the term of a repurchase agreement, the value of the underlying securities held as collateral on behalf of a Fund, including accrued interest, is required to exceed the value of the repurchase agreement, including accrued interest. The underlying securities for all repurchase agreements are held at the Funds’ custodian or designated sub-custodians under tri-party repurchase agreements.
Notes to Financial Statements (Continued)
First Trust Exchange-Traded Fund VI
September 30, 2022 (Unaudited)
MRAs govern transactions between a Fund and select counterparties. The MRAs maintain provisions for, among other things, initiation, income payments, events of default, and maintenance of collateral for repurchase agreements.
Repurchase agreements received for lending securities are collateralized by U.S. Treasury securities. The U.S. Treasury securities are held in a joint custody account at BBH on behalf of the Funds participating in the securities lending program. In the event the counterparty defaults on the repurchase agreement, the U.S. Treasury securities can either be maintained as part of a Fund’s portfolio or sold for cash. A Fund could suffer a loss to the extent that the proceeds from the sale of the underlying collateral held by the Fund are less than the repurchase price and the Fund’s costs associated with the delay and enforcement of the MRA.
While the Funds may invest in repurchase agreements, any repurchase agreements held by the Funds during the six months ended September 30, 2022, were received as collateral for lending securities. There were no repurchase agreements held by the Funds as of September 30, 2022.
G. Dividends and Distributions to Shareholders
Dividends from net investment income, if any, are declared and paid quarterly by each Fund, or as the Board of Trustees may determine from time to time. Distributions of net realized capital gains earned by each Fund, if any, are distributed at least annually.
Distributions from net investment income and realized capital gains are determined in accordance with federal income tax regulations, which may differ from U.S. GAAP. Certain capital accounts in the financial statements are periodically adjusted for permanent differences in order to reflect their tax character. These permanent differences are primarily due to the varying treatment of income and gain/loss on portfolio securities held by the Funds and have no impact on net assets or NAV per share. Temporary differences, which arise from recognizing certain items of income, expense and gain/loss in different periods for financial statement and tax purposes, will reverse at some time in the future.
The tax character of distributions paid by each Fund during the period ended March 31, 2022, was as follows:
| | Distributions
paid from
Ordinary
Income | | Distributions
paid from
Capital
Gains | | Distributions
paid from
Return of
Capital |
First Trust Nasdaq Bank ETF
| $ 5,155,141 | | $ — | | $ — |
First Trust Nasdaq Food & Beverage ETF
| 116,496 | | — | | — |
First Trust Nasdaq Oil & Gas ETF
| 6,320,716 | | — | | — |
First Trust Nasdaq Pharmaceuticals ETF
| 176,100 | | — | | — |
First Trust S-Network E-Commerce ETF
| 143,821 | | — | | — |
First Trust Nasdaq Semiconductor ETF
| 338,211 | | — | | — |
First Trust Nasdaq Transportation ETF
| 10,039,966 | | — | | — |
First Trust S-Network Streaming & Gaming ETF
| 405 | | — | | — |
As of March 31, 2022, the components of distributable earnings on a tax basis for each Fund were as follows:
| | Undistributed
Ordinary
Income | | Accumulated
Capital and
Other
Gain (Loss) | | Net
Unrealized
Appreciation
(Depreciation) |
First Trust Nasdaq Bank ETF
| $ 329,822 | | $ (80,781,438) | | $ (8,732,420) |
First Trust Nasdaq Food & Beverage ETF
| — | | (1,052,735) | | 664,643 |
First Trust Nasdaq Oil & Gas ETF
| 624,468 | | (12,848,893) | | 157,483,512 |
First Trust Nasdaq Pharmaceuticals ETF
| 21,285 | | (2,169,600) | | 1,486,069 |
First Trust S-Network E-Commerce ETF
| 24,184 | | (3,151,002) | | (1,954,358) |
First Trust Nasdaq Semiconductor ETF
| 45,521 | | (6,130,872) | | (65,969) |
First Trust Nasdaq Transportation ETF
| 214,440 | | (36,427,903) | | (13,693,799) |
First Trust S-Network Streaming & Gaming ETF
| 10,975 | | — | | (179,435) |
Notes to Financial Statements (Continued)
First Trust Exchange-Traded Fund VI
September 30, 2022 (Unaudited)
H. Income Taxes
Each Fund intends to qualify or continue to qualify as a regulated investment company by complying with the requirements under Subchapter M of the Internal Revenue Code of 1986, as amended, which includes distributing substantially all of its net investment income and net realized gains to shareholders. Accordingly, no provision has been made for federal and state income taxes. However, due to the timing and amount of distributions, each Fund may be subject to an excise tax of 4% of the amount by which approximately 98% of each Fund’s taxable income exceeds the distributions from such taxable income for the calendar year.
The Funds are subject to accounting standards that establish a minimum threshold for recognizing, and a system for measuring, the benefits of a tax position taken or expected to be taken in a tax return. For all the Funds, with the exception of BNGE, the taxable years ended 2019, 2020, 2021, and 2022 remain open to federal and state audit. The taxable period ended 2022 remains open to federal and state audit for BNGE. As of September 30, 2022, management has evaluated the application of these standards to the Funds and has determined that no provision for income tax is required in the Funds’ financial statements for uncertain tax positions.
The Funds intend to utilize provisions of the federal income tax laws, which allow them to carry a realized capital loss forward indefinitely following the year of the loss and offset such loss against any future realized capital gains. The Funds are subject to certain limitations under U.S. tax rules on the use of capital loss carryforwards and net unrealized built-in losses. These limitations apply when there has been a 50% change in ownership. At March 31, 2022, for federal income tax purposes, each applicable Fund had a capital loss carryforward available that is shown in the table below, to the extent provided by regulations, to offset future capital gains.
| | Non-Expiring
Capital Loss
Carryforward |
First Trust Nasdaq Bank ETF
| $ 80,781,438 |
First Trust Nasdaq Food & Beverage ETF
| 1,052,735 |
First Trust Nasdaq Oil & Gas ETF
| 12,848,893 |
First Trust Nasdaq Pharmaceuticals ETF
| 2,169,600 |
First Trust S-Network E-Commerce ETF
| 3,151,002 |
First Trust Nasdaq Semiconductor ETF
| 6,130,872 |
First Trust Nasdaq Transportation ETF
| 36,427,903 |
First Trust S-Network Streaming & Gaming ETF
| — |
As of September 30, 2022, the aggregate cost, gross unrealized appreciation, gross unrealized depreciation, and net unrealized appreciation/(depreciation) on investments (including short positions and derivatives, if any) for federal income tax purposes were as follows:
| | Tax Cost | | Gross
Unrealized
Appreciation | | Gross
Unrealized
(Depreciation) | | Net Unrealized
Appreciation
(Depreciation) |
First Trust Nasdaq Bank ETF
| $ 241,538,179 | | $ 534,318 | | $ (40,584,602) | | $ (40,050,284) |
First Trust Nasdaq Food & Beverage ETF
| 910,254,789 | | 6,112,649 | | (84,933,677) | | (78,821,028) |
First Trust Nasdaq Oil & Gas ETF
| 1,044,155,289 | | 29,904,089 | | (48,783,715) | | (18,879,626) |
First Trust Nasdaq Pharmaceuticals ETF
| 39,883,862 | | 568,546 | | (4,442,346) | | (3,873,800) |
First Trust S-Network E-Commerce ETF
| 6,602,163 | | 41,286 | | (2,348,979) | | (2,307,693) |
First Trust Nasdaq Semiconductor ETF
| 88,661,939 | | 1,335,097 | | (24,399,558) | | (23,064,461) |
First Trust Nasdaq Transportation ETF
| 95,474,003 | | 23,810 | | (24,799,167) | | (24,775,357) |
First Trust S-Network Streaming & Gaming ETF
| 4,502,641 | | 1,380 | | (1,277,108) | | (1,275,728) |
I. Expenses
Expenses, other than the investment advisory fee and other excluded expenses, are paid by the Advisor (See Note 3).
First Trust has entered into licensing agreements with Nasdaq, Inc. or VettaFi LLC (each, a “Licensor”), as applicable, for the Funds. The respective license agreement allows for the use by First Trust of each Fund’s respective index and of certain trademarks and trade names of the Licensor. The Funds are sub-licensees to the applicable license agreements.
Notes to Financial Statements (Continued)
First Trust Exchange-Traded Fund VI
September 30, 2022 (Unaudited)
3. Investment Advisory Fee, Affiliated Transactions and Other Fee Arrangements
First Trust, the investment advisor to the Funds, is a limited partnership with one limited partner, Grace Partners of DuPage L.P., and one general partner, The Charger Corporation. The Charger Corporation is an Illinois corporation controlled by James A. Bowen, Chief Executive Officer of First Trust. First Trust is responsible for the selection and ongoing monitoring of the securities in each Fund’s portfolio, managing the Funds’ business affairs and providing certain administrative services necessary for the management of the Funds.
First Trust is paid an annual unitary management fee of 0.60% of each Fund’s average daily net assets, except for BNGE. BNGE has agreed to pay First Trust an annual unitary management fee equal to 0.70% of its average daily net assets. First Trust is responsible for the expenses of each Fund including the cost of transfer agency, custody, fund administration, licensing fees, legal, audit, and other services, but excluding fee payments under the Investment Management Agreement, interest, taxes, brokerage commissions and other expenses associated with the execution of portfolio transactions, distribution and service fees pursuant to a Rule 12b-1 plan, if any, acquired fund fees and expenses, and extraordinary expenses, which are paid by each respective Fund. First Trust also provides fund reporting services to the Funds for a flat annual fee in the amount of $9,250 per Fund, which is covered under the annual unitary management fee.
The Trust has multiple service agreements with Brown Brothers Harriman & Co. (“BBH”). Under the service agreements, BBH performs custodial, fund accounting, certain administrative services, and transfer agency services for the Funds. As custodian, BBH is responsible for custody of each Fund’s assets. As fund accountant and administrator, BBH is responsible for maintaining the books and records of each Fund’s securities and cash. As transfer agent, BBH is responsible for maintaining shareholder records for each Fund.
Each Trustee who is not an officer or employee of First Trust, any sub-advisor or any of their affiliates (“Independent Trustees”) is paid a fixed annual retainer that is allocated equally among each fund in the First Trust Fund Complex. Each Independent Trustee is also paid an annual per fund fee that varies based on whether the fund is a closed-end or other actively managed fund, a target outcome fund or an index fund.
Additionally, the Lead Independent Trustee and the Chairs of the Audit Committee, Nominating and Governance Committee and Valuation Committee are paid annual fees to serve in such capacities, with such compensation allocated pro rata among each fund in the First Trust Fund Complex based on net assets. Independent Trustees are reimbursed for travel and out-of-pocket expenses in connection with all meetings. The Lead Independent Trustee and Committee Chairs rotate every three years. The officers and “Interested” Trustee receive no compensation from the Trust for acting in such capacities.
4. Purchases and Sales of Securities
For the six months ended September 30, 2022, the cost of purchases and proceeds from sales of investment securities for each Fund, excluding short-term investments and in-kind transactions, were as follows:
| | Purchases | | Sales |
| First Trust Nasdaq Bank ETF | $ 69,225,906 | | $ 69,342,204 |
| First Trust Nasdaq Food & Beverage ETF | 233,229,663 | | 232,123,588 |
| First Trust Nasdaq Oil & Gas ETF | 410,982,938 | | 407,745,663 |
| First Trust Nasdaq Pharmaceuticals ETF | 8,061,959 | | 7,977,871 |
| First Trust S-Network E-Commerce ETF | 5,006,317 | | 5,347,303 |
| First Trust Nasdaq Semiconductor ETF | 20,795,583 | | 20,653,102 |
| First Trust Nasdaq Transportation ETF | 34,048,333 | | 33,714,636 |
| First Trust S-Network Streaming & Gaming ETF | 813,358 | | 733,382 |
| | | | |
Notes to Financial Statements (Continued)
First Trust Exchange-Traded Fund VI
September 30, 2022 (Unaudited)
For the six months ended September 30, 2022, the cost of in-kind purchases and proceeds from in-kind sales for each Fund were as follows:
| | Purchases | | Sales |
| First Trust Nasdaq Bank ETF | $ 14,679,598 | | $ 117,646,317 |
| First Trust Nasdaq Food & Beverage ETF | 1,168,755,727 | | 236,049,965 |
| First Trust Nasdaq Oil & Gas ETF | 750,337,054 | | 743,304,768 |
| First Trust Nasdaq Pharmaceuticals ETF | 42,441,619 | | 19,980,452 |
| First Trust S-Network E-Commerce ETF | — | | 9,745,589 |
| First Trust Nasdaq Semiconductor ETF | 5,819,414 | | 17,668,260 |
| First Trust Nasdaq Transportation ETF | — | | 162,108,477 |
| First Trust S-Network Streaming & Gaming ETF | 878,675 | | — |
5. Creations, Redemptions and Transaction Fees
Each Fund generally issues and redeems its shares in primary market transactions through a creation and redemption mechanism and does not sell or redeem individual shares. Instead, financial entities known as “Authorized Participants” have contractual arrangements with a Fund or one of the Fund’s service providers to purchase and redeem Fund shares directly with the Fund in large blocks of shares known as “Creation Units.” Prior to the start of trading on every business day, a Fund publishes through the National Securities Clearing Corporation (“NSCC”) the “basket” of securities, cash or other assets that it will accept in exchange for a Creation Unit of the Fund’s shares. An Authorized Participant that wishes to effectuate a creation of a Fund’s shares deposits with the Fund the “basket” of securities, cash or other assets identified by the Fund that day, and then receives the Creation Unit of the Fund’s shares in return for those assets. After purchasing a Creation Unit, the Authorized Participant may continue to hold the Fund’s shares or sell them in the secondary market. The redemption process is the reverse of the purchase process: the Authorized Participant redeems a Creation Unit of a Fund’s shares for a basket of securities, cash or other assets. The combination of the creation and redemption process with secondary market trading in a Fund’s shares and underlying securities provides arbitrage opportunities that are designed to help keep the market price of a Fund’s shares at or close to the NAV per share of the Fund.
Each Fund imposes fees in connection with the purchase of Creation Units. These fees may vary based upon various fact-based circumstances, including, but not limited to, the composition of the securities included in the Creation Unit or the countries in which the transactions are settled. The price for each Creation Unit will equal the daily NAV per share of a Fund times the number of shares in a Creation Unit, plus the fees described above and, if applicable, any operational processing and brokerage costs, transfer fees, stamp taxes and part or all of the spread between the expected bid and offer side of the market related to the securities comprising the creation basket.
Each Fund also imposes fees in connection with the redemption of Creation Units. These fees may vary based upon various fact-based circumstances, including, but not limited to, the composition of the securities included in the Creation Unit or the countries in which the transactions are settled. The price received for each Creation Unit will equal the daily NAV per share of a Fund times the number of shares in a Creation Unit, minus the fees described above and, if applicable, any operational processing and brokerage costs, transfer fees, stamp taxes and part or all of the spread between the expected bid and offer side of the market related to the securities comprising the redemption basket. Investors who use the services of a broker or other such intermediary in addition to an Authorized Participant to effect a redemption of a Creation Unit may also be assessed an amount to cover the cost of such services. The redemption fee charged by a Fund will comply with Rule 22c-2 of the 1940 Act which limits redemption fees to no more than 2% of the value of the shares redeemed.
6. Distribution Plan
The Board of Trustees adopted a Distribution and Service Plan pursuant to Rule 12b-1 under the 1940 Act. In accordance with the Rule 12b-1 plan, each Fund is authorized to pay an amount up to 0.25% of its average daily net assets each year to reimburse First Trust Portfolios L.P. (“FTP”), the distributor of the Funds, for amounts expended to finance activities primarily intended to result in the sale of Creation Units or to provide investor services. FTP may also use this amount to compensate securities dealers or other persons that are Authorized Participants for providing distribution assistance, including broker-dealer and shareholder support and educational and promotional services.
No 12b-1 fees are currently paid by the Funds, and pursuant to a contractual arrangement, no 12b-1 fees will be paid any time before July 31, 2023 for FTXO, FTXG, FTXN, FTXH, ISHP, FTXL, and FTXR, and May 24, 2023 for BNGE.
Notes to Financial Statements (Continued)
First Trust Exchange-Traded Fund VI
September 30, 2022 (Unaudited)
7. Indemnification
The Trust, on behalf of the Funds, has a variety of indemnification obligations under contracts with its service providers. The Trust’s maximum exposure under these arrangements is unknown. However, the Trust has not had prior claims or losses pursuant to these contracts and expects the risk of loss to be remote.
8. Subsequent Events
Management has evaluated the impact of all subsequent events to the Funds through the date the financial statements were issued, and has determined that there was the following subsequent event:
At a meeting on October 24, 2022, the Board of Trustees approved a breakpoint pricing arrangement for each of the series of the Trust, including the Funds. Pursuant to this arrangement, which is effective as of November 1, 2022, the management fee each Fund pays to First Trust, as investment manager, will be discounted as the Fund’s net assets reach certain predefined levels.
Additional Information
First Trust Exchange-Traded Fund VI
September 30, 2022 (Unaudited)
Proxy Voting Policies and Procedures
A description of the policies and procedures that the Trust uses to determine how to vote proxies and information on how each Fund voted proxies relating to portfolio securities during the most recent 12-month period ended June 30 is available (1) without charge, upon request, by calling (800) 988-5891; (2) on each Fund’s website at www.ftportfolios.com; and (3) on the Securities and Exchange Commission’s (“SEC”) website at www.sec.gov.
Portfolio Holdings
Each Fund files portfolio holdings information for each month in a fiscal quarter within 60 days after the end of the relevant fiscal quarter on Form N-PORT. Portfolio holdings information for the third month of each fiscal quarter will be publicly available on the SEC’s website at www.sec.gov. Each Fund’s complete schedule of portfolio holdings for the second and fourth quarters of each fiscal year is included in the semi-annual and annual reports to shareholders, respectively, and is filed with the SEC on Form N-CSR. The semi-annual and annual report for each Fund is available to investors within 60 days after the period to which it relates. Each Fund’s Forms N-PORT and Forms N-CSR are available on the SEC’s website listed above.
Risk Considerations
Risks are inherent in all investing. Certain general risks that may be applicable to a Fund are identified below, but not all of the material risks relevant to each Fund are included in this report and not all of the risks below apply to each Fund. The material risks of investing in each Fund are spelled out in its prospectus, statement of additional information and other regulatory filings. Before investing, you should consider each Fund’s investment objective, risks, charges and expenses, and read each Fund’s prospectus and statement of additional information carefully. You can download each Fund’s prospectus at www.ftportfolios.com or contact First Trust Portfolios L.P. at (800) 621-1675 to request a prospectus, which contains this and other information about each Fund.
Concentration Risk. To the extent that a fund is able to invest a significant percentage of its assets in a single asset class or the securities of issuers within the same country, state, region, industry or sector, an adverse economic, business or political development may affect the value of the fund’s investments more than if the fund were more broadly diversified. A fund that tracks an index will be concentrated to the extent the fund’s corresponding index is concentrated. A concentration makes a fund more susceptible to any single occurrence and may subject the fund to greater market risk than a fund that is more broadly diversified.
Credit Risk. Credit risk is the risk that an issuer of a security will be unable or unwilling to make dividend, interest and/or principal payments when due and the related risk that the value of a security may decline because of concerns about the issuer’s ability to make such payments.
Cyber Security Risk. The funds are susceptible to potential operational risks through breaches in cyber security. A breach in cyber security refers to both intentional and unintentional events that may cause a fund to lose proprietary information, suffer data corruption or lose operational capacity. Such events could cause a fund to incur regulatory penalties, reputational damage, additional compliance costs associated with corrective measures and/or financial loss. In addition, cyber security breaches of a fund’s third-party service providers, such as its administrator, transfer agent, custodian, or sub-advisor, as applicable, or issuers in which the fund invests, can also subject a fund to many of the same risks associated with direct cyber security breaches.
Defined Outcome Funds Risk. To the extent a fund’s investment strategy is designed to deliver returns tied to the price performance of an underlying ETF, an investor may not realize the returns the fund seeks to achieve if that investor does not hold shares for the entire target outcome period. In the event an investor purchases shares after the first day of the target outcome period or sells shares prior to the end of the target outcome period, the buffer that the fund seeks to provide against a decline in the value of the underlying ETF may not be available, the enhanced returns that the fund seeks to provide (if any) may not be available and the investor may not participate in a gain in the value of the underlying ETF up to the cap for the investor’s investment period. Additionally, the fund will not participate in gains of the underlying ETF above the cap and a shareholder may lose their entire investment. If the fund seeks enhanced returns, there are certain time periods when the value of the fund may fall faster than the value of the underlying ETF, and it is very unlikely that, on any given day during which the underlying ETF share price increases in value, the fund’s share price will increase at the same rate as the enhanced returns sought by the fund, which is designed for an entire target outcome period. Trading flexible exchange options involves risks different from, or possibly greater than, the risks associated with investing directly in securities, such as less liquidity and correlation and valuation risks. A fund may experience substantial downside from specific flexible exchange option positions and certain positions may expire worthless.
Derivatives Risk. To the extent a fund uses derivative instruments such as futures contracts, options contracts and swaps, the fund may experience losses because of adverse movements in the price or value of the underlying asset, index or rate, which may be magnified
Additional Information (Continued)
First Trust Exchange-Traded Fund VI
September 30, 2022 (Unaudited)
by certain features of the derivative. These risks are heightened when a fund’s portfolio managers use derivatives to enhance the fund’s return or as a substitute for a position or security, rather than solely to hedge (or offset) the risk of a position or security held by the fund.
Equity Securities Risk. To the extent a fund invests in equity securities, the value of the fund’s shares will fluctuate with changes in the value of the equity securities. Equity securities prices fluctuate for several reasons, including changes in investors’ perceptions of the financial condition of an issuer or the general condition of the relevant stock market, such as market volatility, or when political or economic events affecting the issuers occur. In addition, common stock prices may be particularly sensitive to rising interest rates, as the cost of capital rises and borrowing costs increase. Equity securities may decline significantly in price over short or extended periods of time, and such declines may occur in the equity market as a whole, or they may occur in only a particular country, company, industry or sector of the market.
ETF Risk. The shares of an ETF trade like common stock and represent an interest in a portfolio of securities. The risks of owning an ETF generally reflect the risks of owning the underlying securities, although lack of liquidity in an ETF could result in it being more volatile and ETFs have management fees that increase their costs. Shares of an ETF trade on an exchange at market prices rather than net asset value, which may cause the shares to trade at a price greater than net asset value (premium) or less than net asset value (discount). In times of market stress, decisions by market makers to reduce or step away from their role of providing a market for an ETF’s shares, or decisions by an ETF’s authorized participants that they are unable or unwilling to proceed with creation and/or redemption orders of an ETF’s shares, could result in shares of the ETF trading at a discount to net asset value and in greater than normal intraday bid-ask spreads.
Fixed Income Securities Risk. To the extent a fund invests in fixed income securities, the fund will be subject to credit risk, income risk, interest rate risk, liquidity risk and prepayment risk. Income risk is the risk that income from a fund’s fixed income investments could decline during periods of falling interest rates. Interest rate risk is the risk that the value of a fund’s fixed income securities will decline because of rising interest rates. Liquidity risk is the risk that a security cannot be purchased or sold at the time desired, or cannot be purchased or sold without adversely affecting the price. Prepayment risk is the risk that the securities will be redeemed or prepaid by the issuer, resulting in lower interest payments received by the fund. In addition to these risks, high yield securities, or “junk” bonds, are subject to greater market fluctuations and risk of loss than securities with higher ratings, and the market for high yield securities is generally smaller and less liquid than that for investment grade securities.
Index or Model Constituent Risk. Certain funds may be a constituent of one or more indices or ETF models. As a result, such a fund may be included in one or more index-tracking exchange-traded funds or mutual funds. Being a component security of such a vehicle could greatly affect the trading activity involving a fund, the size of the fund and the market volatility of the fund. Inclusion in an index could increase demand for the fund and removal from an index could result in outsized selling activity in a relatively short period of time. As a result, a fund’s net asset value could be negatively impacted and the fund’s market price may be significantly below its net asset value during certain periods. In addition, index rebalances may potentially result in increased trading activity in a fund’s shares.
Index Provider Risk. To the extent a fund seeks to track an index, it is subject to Index Provider Risk. There is no assurance that the Index Provider will compile the Index accurately, or that the Index will be determined, maintained, constructed, reconstituted, rebalanced, composed, calculated or disseminated accurately. To correct any such error, the Index Provider may carry out an unscheduled rebalance or other modification of the Index constituents or weightings, which may increase the fund’s costs. The Index Provider does not provide any representation or warranty in relation to the quality, accuracy or completeness of data in the Index, and it does not guarantee that the Index will be calculated in accordance with its stated methodology. Losses or costs associated with any Index Provider errors generally will be borne by the fund and its shareholders.
Investment Companies Risk. To the extent a fund invests in the securities of other investment vehicles, the fund will incur additional fees and expenses that would not be present in a direct investment in those investment vehicles. Furthermore, the fund’s investment performance and risks are directly related to the investment performance and risks of the investment vehicles in which the fund invests.
LIBOR Risk. To the extent a fund invests in floating or variable rate obligations that use the London Interbank Offered Rate (“LIBOR”) as a reference interest rate, it is subject to LIBOR Risk. The United Kingdom’s Financial Conduct Authority, which regulates LIBOR has ceased making LIBOR available as a reference rate over a phase-out period that began December 31, 2021. There is no assurance that any alternative reference rate, including the Secured Overnight Financing Rate (“SOFR”) will be similar to or produce the same value or economic equivalence as LIBOR or that instruments using an alternative rate will have the same volume or liquidity. The unavailability or replacement of LIBOR may affect the value, liquidity or return on certain fund investments and may result in costs incurred in connection with closing out positions and entering into new trades. Any potential effects of the transition away from LIBOR on the fund or on certain instruments in which the fund invests can be difficult to ascertain, and they may vary depending on a variety of factors, and they could result in losses to the fund.
Additional Information (Continued)
First Trust Exchange-Traded Fund VI
September 30, 2022 (Unaudited)
Management Risk. To the extent that a fund is actively managed, it is subject to management risk. In managing an actively-managed fund’s investment portfolio, the fund’s portfolio managers will apply investment techniques and risk analyses that may not have the desired result. There can be no guarantee that a fund will meet its investment objective.
Market Risk. Market risk is the risk that a particular security, or shares of a fund in general, may fall in value. Securities held by a fund, as well as shares of a fund itself, are subject to market fluctuations caused by factors such as general economic conditions, political events, regulatory or market developments, changes in interest rates and perceived trends in securities prices. Shares of a fund could decline in value or underperform other investments as a result of the risk of loss associated with these market fluctuations. In addition, local, regional or global events such as war, acts of terrorism, spread of infectious diseases or other public health issues, recessions, or other events could have a significant negative impact on a fund and its investments. Such events may affect certain geographic regions, countries, sectors and industries more significantly than others. In February 2022, Russia invaded Ukraine which has caused and could continue to cause significant market disruptions and volatility within the markets in Russia, Europe, and the United States. The hostilities and sanctions resulting from those hostilities could have a significant impact on certain fund investments as well as fund performance. The COVID-19 global pandemic and the ensuing policies enacted by governments and central banks have caused and may continue to cause significant volatility and uncertainty in global financial markets. While the U.S. has resumed “reasonably” normal business activity, many countries continue to impose lockdown measures. Additionally, there is no guarantee that vaccines will be effective against emerging variants of the disease. These events also adversely affect the prices and liquidity of a fund’s portfolio securities or other instruments and could result in disruptions in the trading markets. Any of such circumstances could have a materially negative impact on the value of a fund’s shares and result in increased market volatility. During any such events, a fund’s shares may trade at increased premiums or discounts to their net asset value and the bid/ask spread on a fund’s shares may widen.
Non-U.S. Securities Risk. To the extent a fund invests in non-U.S. securities, it is subject to additional risks not associated with securities of domestic issuers. Non-U.S. securities are subject to higher volatility than securities of domestic issuers due to: possible adverse political, social or economic developments; restrictions on foreign investment or exchange of securities; capital controls; lack of liquidity; currency exchange rates; excessive taxation; government seizure of assets; the imposition of sanctions by foreign governments; different legal or accounting standards; and less government supervision and regulation of exchanges in foreign countries. Investments in non-U.S. securities may involve higher costs than investments in U.S. securities, including higher transaction and custody costs, as well as additional taxes imposed by non-U.S. governments. These risks may be heightened for securities of companies located, or with significant operations, in emerging market countries.
Operational Risk. Each fund is subject to risks arising from various operational factors, including, but not limited to, human error, processing and communication errors, errors of a fund’s service providers, counterparties or other third-parties, failed or inadequate processes and technology or systems failures. Each fund relies on third-parties for a range of services, including custody. Any delay or failure relating to engaging or maintaining such service providers may affect a fund’s ability to meet its investment objective. Although the funds and the funds’ investment advisor seek to reduce these operational risks through controls and procedures, there is no way to completely protect against such risks.
Passive Investment Risk. To the extent a fund seeks to track an index, the fund will invest in the securities included in, or representative of, the index regardless of their investment merit. A fund generally will not attempt to take defensive positions in declining markets.
Valuation Risk. The valuation of certain securities may carry more risk than that of common stock. Uncertainties in the conditions of the financial markets, unreliable reference data, lack of transparency and inconsistency of valuation models and processes may lead to inaccurate asset pricing. A fund may hold investments in sizes smaller than institutionally sized round lot positions (sometimes referred to as odd lots). However, third-party pricing services generally provide evaluations on the basis of institutionally-sized round lots. If a fund sells certain of its investments in an odd lot transaction, the sale price may be less than the value at which such securities have been held by the fund. Odd lots often trade at lower prices than institutional round lots. There is no assurance that the fund will be able to sell a portfolio security at the price established by the pricing service, which could result in a loss to the fund.
| NOT FDIC INSURED | NOT BANK GUARANTEED | MAY LOSE VALUE |
Additional Information (Continued)
First Trust Exchange-Traded Fund VI
September 30, 2022 (Unaudited)
Advisory Agreement
Board Considerations Regarding Approval of Continuation of Investment Management Agreement
The Board of Trustees of First Trust Exchange-Traded Fund VI (the “Trust”), including the Independent Trustees, unanimously approved the continuation of the Investment Management Agreement (the “Agreement”) with First Trust Advisors L.P. (the “Advisor”) on behalf of the following seven series of the Trust (each a “Fund” and collectively, the “Funds”):
First Trust Nasdaq Bank ETF (FTXO)
First Trust Nasdaq Food & Beverage ETF (FTXG)
First Trust Nasdaq Oil & Gas ETF (FTXN)
First Trust Nasdaq Pharmaceuticals ETF (FTXH)
First Trust S-Network E-Commerce ETF (ISHP)
First Trust Nasdaq Semiconductor ETF (FTXL)
First Trust Nasdaq Transportation ETF (FTXR)
The Board approved the continuation of the Agreement for each Fund for a one-year period ending June 30, 2023 at a meeting held on June 12–13, 2022. The Board determined for each Fund that the continuation of the Agreement is in the best interests of the Fund in light of the nature, extent and quality of the services provided and such other matters as the Board considered to be relevant in the exercise of its business judgment.
To reach this determination for each Fund, the Board considered its duties under the Investment Company Act of 1940, as amended (the “1940 Act”), as well as under the general principles of state law, in reviewing and approving advisory contracts; the requirements of the 1940 Act in such matters; the fiduciary duty of investment advisors with respect to advisory agreements and compensation; the standards used by courts in determining whether investment company boards have fulfilled their duties; and the factors to be considered by the Board in voting on such agreements. At meetings held on April 18, 2022 and June 12–13, 2022, the Board, including the Independent Trustees, reviewed materials provided by the Advisor responding to requests for information from counsel to the Independent Trustees, submitted on behalf of the Independent Trustees, that, among other things, outlined: the services provided by the Advisor to each Fund (including the relevant personnel responsible for these services and their experience); the unitary fee rate payable by each Fund as compared to fees charged to a peer group of funds (the “Expense Group”) and a broad peer universe of funds (the “Expense Universe”), each assembled by Broadridge Financial Solutions, Inc. (“Broadridge”), an independent source, and as compared to fees charged to other clients of the Advisor, including other exchange-traded funds (“ETFs”) managed by the Advisor; the expense ratio of each Fund as compared to expense ratios of the funds in the Fund’s Expense Group and Expense Universe; performance information for each Fund, including comparisons of each Fund’s performance to that of one or more relevant benchmark indexes and to that of a performance group of funds and a broad performance universe of funds (the “Performance Universe”), each assembled by Broadridge; the nature of expenses incurred in providing services to each Fund and the potential for the Advisor to realize economies of scale, if any; profitability and other financial data for the Advisor; any indirect benefits to the Advisor and its affiliate, First Trust Portfolios L.P. (“FTP”); and information on the Advisor’s compliance program. The Board reviewed initial materials with the Advisor at the meeting held on April 18, 2022, prior to which the Independent Trustees and their counsel met separately to discuss the information provided by the Advisor. Following the April meeting, counsel to the Independent Trustees, on behalf of the Independent Trustees, requested certain clarifications and supplements to the materials provided, and the information provided in response to those requests was considered at an executive session of the Independent Trustees and their counsel held prior to the June 12–13, 2022 meeting, as well as at the June meeting. The Board applied its business judgment to determine whether the arrangement between the Trust and the Advisor continues to be a reasonable business arrangement from each Fund’s perspective. The Board determined that, given the totality of the information provided with respect to the Agreement, the Board had received sufficient information to renew the Agreement. The Board considered that shareholders chose to invest or remain invested in a Fund knowing that the Advisor manages the Fund and knowing the Fund’s unitary fee.
In reviewing the Agreement for each Fund, the Board considered the nature, extent and quality of the services provided by the Advisor under the Agreement. The Board considered that the Advisor is responsible for the overall management and administration of the Trust and each Fund and reviewed all of the services provided by the Advisor to the Funds, as well as the background and experience of the persons responsible for such services. In reviewing the services provided, the Board noted the compliance program that had been developed by the Advisor and considered that it includes a robust program for monitoring the Advisor’s and each Fund’s compliance with the 1940 Act, as well as each Fund’s compliance with its investment objective, policies and restrictions. The Board also considered a report from the Advisor with respect to its risk management functions related to the operation of the Funds. Finally, as part of the Board’s consideration of the Advisor’s services, the Advisor, in its written materials and at the April 18, 2022 meeting, described to the Board the scope of its ongoing investment in additional personnel and infrastructure to maintain and improve the quality of services provided to the Funds and the other funds in the First Trust Fund Complex. In light of the information presented and the considerations made, the Board concluded that the nature, extent and quality of the services provided to the Trust and each
Additional Information (Continued)
First Trust Exchange-Traded Fund VI
September 30, 2022 (Unaudited)
Fund by the Advisor under the Agreement have been and are expected to remain satisfactory and that the Advisor has managed each Fund consistent with its investment objective, policies and restrictions.
The Board considered the unitary fee rate payable by each Fund under the Agreement for the services provided. The Board considered that as part of the unitary fee the Advisor is responsible for each Fund’s expenses, including the cost of transfer agency, custody, fund administration, legal, audit and other services and license fees, if any, but excluding the fee payment under the Agreement and interest, taxes, brokerage commissions and other expenses connected with the execution of portfolio transactions, distribution and service fees pursuant to a Rule 12b-1 plan, if any, and extraordinary expenses, if any. The Board received and reviewed information showing the fee rates and expense ratios of the peer funds in the Expense Groups, as well as advisory and unitary fee rates charged by the Advisor to other fund (including ETFs) and non-fund clients, as applicable. Because each Fund pays a unitary fee, the Board determined that expense ratios were the most relevant comparative data point. Based on the information provided, the Board noted that the unitary fee rate for each Fund was above the median total (net) expense ratio of the peer funds in its respective Expense Group. With respect to the Expense Groups, the Board, at the April 18, 2022 meeting, discussed with Broadridge its methodology for assembling peer groups and discussed with the Advisor limitations in creating peer groups for index ETFs, including differences in underlying indexes and index-tracking methodologies that can result in greater management complexities across seemingly comparable ETFs and different business models that may affect the pricing of services among ETF sponsors. The Board took these limitations and differences into account in considering the peer data. With respect to fees charged to other non-ETF clients, the Board considered differences between the Funds and other non-ETF clients that limited their comparability. In considering the unitary fee rates overall, the Board also considered the Advisor’s statement that it seeks to meet investor needs through innovative and value-added investment solutions and the Advisor’s demonstrated long-term commitment to each Fund and the other funds in the First Trust Fund Complex.
The Board considered performance information for each Fund. The Board noted the process it has established for monitoring each Fund’s performance and portfolio risk on an ongoing basis, which includes quarterly performance reporting from the Advisor for the Funds. The Board determined that this process continues to be effective for reviewing each Fund’s performance. The Board received and reviewed information for periods ended December 31, 2021 regarding the performance of each Fund’s underlying index, the correlation between each Fund’s performance and that of its underlying index, each Fund’s tracking difference and each Fund’s excess return as compared to its benchmark index. With respect to ISHP, the Board noted that during 2021, it approved changes to the Fund’s investment objective and, effective January 26, 2022, the Fund changed its name and began tracking the S-Network Global E-Commerce Index and that the performance information reflected the Fund’s old index. Based on the information provided and its ongoing review of performance, the Board concluded that each Fund was correlated to its underlying index and that the tracking difference for each Fund was within a reasonable range. In addition, the Board reviewed data prepared by Broadridge comparing each Fund’s performance to that of its respective Performance Universe and to that of a broad-based benchmark index, but given each Fund’s objective of seeking investment results that correspond generally to the performance of its underlying index, the Board placed more emphasis on its review of correlation and tracking difference.
On the basis of all the information provided on the unitary fee and performance of each Fund and the ongoing oversight by the Board, the Board concluded that the unitary fee for each Fund continues to be reasonable and appropriate in light of the nature, extent and quality of the services provided by the Advisor to each Fund under the Agreement.
The Board considered information and discussed with the Advisor whether there were any economies of scale in connection with providing advisory services to the Funds and noted the Advisor’s statement that it believes that its expenses relating to providing advisory services to the Funds will likely increase during the next twelve months as the Advisor continues to build infrastructure and add new staff. The Board noted that any reduction in fixed costs associated with the management of the Funds would benefit the Advisor, but that the unitary fee structure provides a level of certainty in expenses for the Funds. The Board considered the revenues and allocated costs (including the allocation methodology) of the Advisor in serving as investment advisor to each Fund for the twelve months ended December 31, 2021 and the estimated profitability level for each Fund calculated by the Advisor based on such data, as well as complex-wide and product-line profitability data, for the same period. The Board noted the inherent limitations in the profitability analysis and concluded that, based on the information provided, the Advisor’s profitability level for each Fund was not unreasonable. In addition, the Board considered indirect benefits described by the Advisor that may be realized from its relationship with the Funds. The Board considered that the Advisor had identified as an indirect benefit to the Advisor and FTP their exposure to investors and brokers who, absent their exposure to the Funds, may have had no dealings with the Advisor or FTP, and noted that the Advisor does not utilize soft dollars in connection with the Funds. The Board also considered the Advisor’s compensation for fund reporting services provided to each Fund pursuant to a separate Fund Reporting Services Agreement, which is paid from the unitary fee. The Board concluded that the character and amount of potential indirect benefits to the Advisor were not unreasonable.
Based on all of the information considered and the conclusions reached, the Board, including the Independent Trustees, unanimously determined that the terms of the Agreement continue to be fair and reasonable and that the continuation of the Agreement is in the best interests of each Fund. No single factor was determinative in the Board’s analysis.
Additional Information (Continued)
First Trust Exchange-Traded Fund VI
September 30, 2022 (Unaudited)
Liquidity Risk Management Program
In accordance with Rule 22e-4 under the Investment Company Act of 1940, as amended (the “1940 Act”), the Funds and each other fund in the First Trust Fund Complex, other than the closed-end funds, have adopted and implemented a liquidity risk management program (the “Program”) reasonably designed to assess and manage the funds’ liquidity risk, i.e., the risk that a fund could not meet requests to redeem shares issued by the fund without significant dilution of remaining investors’ interests in the fund. The Board of Trustees of the First Trust Funds has appointed First Trust Advisors L.P. (the “Advisor”) as the person designated to administer the Program, and in this capacity the Advisor performs its duties primarily through the activities and efforts of the First Trust Liquidity Committee (the “Liquidity Committee”).
Pursuant to the Program, the Liquidity Committee classifies the liquidity of each fund’s portfolio investments into one of the four liquidity categories specified by Rule 22e-4: highly liquid investments, moderately liquid investments, less liquid investments and illiquid investments. The Liquidity Committee determines certain of the inputs for this classification process, including reasonably anticipated trade sizes and significant investor dilution thresholds. The Liquidity Committee also determines and periodically reviews a highly liquid investment minimum for certain funds, monitors the funds’ holdings of assets classified as illiquid investments to seek to ensure they do not exceed 15% of a fund’s net assets and establishes policies and procedures regarding redemptions in kind.
At the April 18, 2022 meeting of the Board of Trustees, as required by Rule 22e-4 and the Program, the Advisor provided the Board with a written report prepared by the Advisor that addressed the operation of the Program during the period from March 16, 2021 through the Liquidity Committee’s annual meeting held on March 17, 2022 and assessed the Program’s adequacy and effectiveness of implementation during this period, including the operation of the highly liquid investment minimum for each fund that is required under the Program to have one, and any material changes to the Program. Note that because the Funds primarily hold assets that are highly liquid investments, the Funds have not adopted any highly liquid investment minimums.
As stated in the written report, during the review period, no fund breached the 15% limitation on illiquid investments, no fund with a highly liquid investment minimum breached that minimum and no fund filed a Form N-LIQUID. The Advisor concluded that each fund’s investment strategy is appropriate for an open-end fund; that the Program operated effectively in all material respects during the review period; and that the Program is reasonably designed to assess and manage the liquidity risk of each fund and to maintain compliance with Rule 22e-4.
First Trust Exchange-Traded Fund VI
INVESTMENT ADVISOR
First Trust Advisors L.P.
120 East Liberty Drive, Suite 400
Wheaton, IL 60187
ADMINISTRATOR, CUSTODIAN,
FUND ACCOUNTANT &
TRANSFER AGENT
Brown Brothers Harriman & Co.
50 Post Office Square
Boston, MA 02110
INDEPENDENT REGISTERED
PUBLIC ACCOUNTING FIRM
Deloitte & Touche LLP
111 S. Wacker Drive
Chicago, IL 60606
LEGAL COUNSEL
Chapman and Cutler LLP
320 South Canal Street
Chicago, IL 60606
First Trust Exchange-Traded Fund VI
Developed International Equity Select ETF (RNDM)
Emerging Markets Equity Select ETF (RNEM)
Large Cap US Equity Select ETF (RNLC)
Mid Cap US Equity Select ETF (RNMC)
Small Cap US Equity Select ETF (RNSC)
US Equity Dividend Select ETF (RNDV)
Semi-Annual Report
For the Period Ended
September 30, 2022
First Trust Exchange-Traded Fund VI
Semi-Annual Report
September 30, 2022
Caution Regarding Forward-Looking Statements
This report contains certain forward-looking statements within the meaning of the Securities Act of 1933, as amended, and the Securities Exchange Act of 1934, as amended. Forward-looking statements include statements regarding the goals, beliefs, plans or current expectations of First Trust Advisors L.P. (“First Trust” or the “Advisor”) and its representatives, taking into account the information currently available to them. Forward-looking statements include all statements that do not relate solely to current or historical fact. For example, forward-looking statements include the use of words such as “anticipate,” “estimate,” “intend,” “expect,” “believe,” “plan,” “may,” “should,” “would” or other words that convey uncertainty of future events or outcomes.
Forward-looking statements involve known and unknown risks, uncertainties and other factors that may cause the actual results, performance or achievements of any series of First Trust Exchange-Traded Fund VI (the “Trust”) described in this report (each such series is referred to as a “Fund” and collectively, the “Funds”) to be materially different from any future results, performance or achievements expressed or implied by the forward-looking statements. When evaluating the information included in this report, you are cautioned not to place undue reliance on these forward-looking statements, which reflect the judgment of the Advisor and its representatives only as of the date hereof. We undertake no obligation to publicly revise or update these forward-looking statements to reflect events and circumstances that arise after the date hereof.
Performance and Risk Disclosure
There is no assurance that any Fund described in this report will achieve its investment objective. Each Fund is subject to market risk, which is the possibility that the market values of securities owned by the Fund will decline and that the value of the Fund’s shares may therefore be less than what you paid for them. Accordingly, you can lose money by investing in a Fund. See “Risk Considerations” in the Additional Information section of this report for a discussion of certain other risks of investing in the Funds.
Performance data quoted represents past performance, which is no guarantee of future results, and current performance may be lower or higher than the figures shown. For the most recent month-end performance figures, please visit www.ftportfolios.com or speak with your financial advisor. Investment returns, net asset value and share price will fluctuate and Fund shares, when sold, may be worth more or less than their original cost.
The Advisor may also periodically provide additional information on Fund performance on each Fund’s web page at www.ftportfolios.com.
How to Read This Report
This report contains information that may help you evaluate your investment. It includes details about each Fund and presents data and analysis that provide insight into each Fund’s performance and investment approach.
By reading the market overview by Robert F. Carey, Chief Market Strategist of the Advisor, you may obtain an understanding of how the market environment affected the performance of each Fund. The statistical information that follows may help you understand each Fund’s performance compared to that of relevant market benchmarks.
It is important to keep in mind that the opinions expressed by personnel of the Advisor are just that: informed opinions. They should not be considered to be promises or advice. The opinions, like the statistics, cover the period through the date on the cover of this report. The material risks of investing in each Fund are spelled out in the prospectus, the statement of additional information, and other Fund regulatory filings.
First Trust Exchange-Traded Fund VI
Semi-Annual Letter from the Chairman and CEO
September 30, 2022
Dear Shareholders,
First Trust is pleased to provide you with the semi-annual report for certain series of the First Trust Exchange-Traded Fund VI (the “Funds”), which contains detailed information about the Funds for the six months ended September 30, 2022.
It is times like these that really test the mettle of investors. Are you someone that is implementing an investment plan with a long time horizon, a trader by nature, or do you fall somewhere in between? Frankly, the current climate is challenging for just about any strategy. While most investors are accustomed to dealing with high levels of volatility in the stock market, some of the daily swings we have witnessed lately have not only been uncharacteristically sharp but have occasionally seemed nearly inexplicable, in my opinion.
In case you have not noticed, volatility is also elevated in the fixed-income market. Bond valuations are down big in 2022. Year-to-date through October 31, 2022, the ICE BofA 15+ Year U.S. Treasury Index experienced a price decline of 33.51%, according to Bloomberg. It was down 31.87% on a total return basis, which includes reinvested interest. To put this into perspective, over the past 40 years, the worst annual showing by the U.S. Long-Term Government Bond Index (20-Year) tracked by Morningstar was the -14.90% total return posted in 2009 (think 2008-2009 global financial crisis). For those who may be unaware, investors benefitted from a trend of declining bond yields from September 1981 through August 2020. While that is an incredible run, nothing lasts forever. Suffice it to say, a lot of pain has been endured by investors in the markets this year and we believe there could be more to come in the near-term. The aggressive interest rate hikes by the Federal Reserve (the “Fed”) are a signal to the markets that it is behind the inflation curve. Moving forward, the Fed will be looking to lower inflation while simultaneously engineering a soft landing in the economy. That will be easier said than done, in my opinion.
There are far more headwinds challenging the securities markets than tailwinds. Here are just a few of those headwinds: stubbornly high inflation; additional rate hikes expected from the Fed from their November and December 2022 meetings, which could potentially push bond yields higher; the ongoing war between Russia and Ukraine, which is impacting the supply and prices of crude oil and natural gas; China enforcing a zero-tolerance policy to combat the spread of the coronavirus by locking down entire cities to its own economic detriment; and the potential for food and energy shortages this coming winter. With the housing market looking like it is finally cooling off, due largely to a huge spike in mortgage rates this year, which were up more than double the rate at the start of the year, the last big tailwind standing may just be the strong U.S. labor market. If the job market can hang in there, the Fed’s goal of a soft landing for the economy may be attainable. I think we will have a clearer picture of things at the start of 2023.
Year-to-date through October 31, 2022, the S&P 500® Index (the “Index”) posted a total return of -17.70%, according to Bloomberg, which puts the Index in bear market territory. A bear market is defined as a 20% or greater decline in the price of a security or index from its most recent peak. While the 17.70% decline in the Index would technically qualify as a stock market correction, investors should continue to view the current downturn as a bear market, in my opinion. Keep in mind, since World War II, there have been 12 bear markets in the Index, excluding the current bear market, according to Yardeni Research. The average price decline of those 12 bear markets was 33.6%. The average price gain over the 12-months following the trough reached during those bear markets was 40.8%, according to Bloomberg. Bear markets come and go. You can’t catch the turn if you are not in the market when the turn comes.
Thank you for giving First Trust the opportunity to play a role in your financial future. We value our relationship with you and will report on the Funds again in six months.
Sincerely,
James A. Bowen
Chairman of the Board of Trustees
Chief Executive Officer of First Trust Advisors L.P.
First Trust Exchange-Traded Fund VI
Semi-Annual Report (Unaudited)
September 30, 2022
Robert F. Carey, CFA
Senior Vice President and Chief Market Strategist
First Trust Advisors L.P.
Mr. Carey is responsible for the overall management of research and analysis of the First Trust product line. Mr. Carey has more than 30 years of experience as an Equity and Fixed-Income Analyst and is a recipient of the Chartered Financial Analyst (“CFA”) designation. He is a graduate of the University of Illinois at Champaign-Urbana with a B.S. in Physics. He is also a member of the Investment Analysts Society of Chicago and the CFA Institute. Mr. Carey has appeared as a guest on such programs as Bloomberg TV, CNBC, and WBBM Radio, and has been quoted by several publications, including The Wall Street Journal, The Wall Street Reporter, Bloomberg News Service, and Registered Rep.
State of the Global Economy
The International Monetary Fund (“IMF”) reported in its October release that global gross domestic product (“GDP”) growth is expected to come in at 3.2% in 2022 and 2.7% in 2023, down from 6.0% in 2021. The IMF sees the U.S. economy growing 1.6% in 2022 and 1.0% in 2023, down from 5.7% in 2021. With respect to all Advanced Economies, the IMF is projecting GDP growth of 2.4% in 2022 and 1.1% in 2023, down from 5.2% in 2021. Lastly, it sees Emerging Markets and Developing Economies growing 3.7% in 2022 and 3.7% again in 2023, down from 6.6% in 2021. From 1970 to 2021, the average global GDP growth rate was 3.6%, according to the IMF. Looking ahead, the IMF notes that the global economy must navigate three key pressures: the war in Ukraine, world-wide inflation and continued economic headwinds in the U.S., Europe and China.
Russia’s war with Ukraine continues to destabilize the global economy, increasing the cost of living and impeding economic growth. European natural gas prices have spiked four-fold since 2021, according to the IMF. Russia has decreased natural gas deliveries to Europe by over 80% of their 2021 total, greatly increasing the likelihood of an energy shortage. Worldwide inflationary pressures continue to fester, with global inflation forecast to surge to 8.8% in 2022, up from 4.7% in 2021. Central banks have rapidly tightened monetary policy in response, and will likely have to continue to do so, in our opinion. These tighter financial conditions have produced significant headwinds to growth among most major economies and are likely to have at least some impact in 2023.
Performance of Global Stocks and Bonds
U.S. equities have turned negative over the past six-month period. The S&P 500® (the “Index”), S&P MidCap 400® and S&P SmallCap 600® Indices posted total returns of -20.20%, -17.50% and -18.58%, respectively, for the six-month period ended September 30, 2022, according to Bloomberg. Value stocks outperformed growth stocks over the period. The S&P 500® Value Index posted a total return of -16.43% versus -23.87% for the S&P 500® Growth Index; an indication that investors may be anticipating slower growth over the near-term and are opting for companies that are trading at more attractive valuations. All eleven sectors that comprise the Index were down on a total return basis. Energy was down least for the period, losing 2.94%, while the worst showing came from Communication Services, down 30.79%.
A Bloomberg survey of 23 equity strategists found that the average 2022 year-end price target for the Index was 4,346 as of September 15, 2022, down from 4,376 on August 16, 2022, according to its own release. Heading into 2022 (December 16, 2021), strategists had an average target of 4,950. The highest and lowest estimates on September 15, 2022, were 5,100 and 3,400, respectively. On September 15, 2022, the Index closed at 3,901.35, which was 18.66% below its all-time closing high of 4,796.56 on January 3, 2022. As of September 30, 2022, Bloomberg’s 2022, 2023 and 2024 consensus earnings growth rate estimates for the Index stood at 9.61%, 6.14% and 8.44%, respectively.
The performance of foreign equities continues to lag that of major U.S. stock indices. Over the past six months, the MSCI World ex USA and MSCI Emerging Markets equity indices posted total returns of -22.50% (USD) and -21.70% (USD), respectively, according to Bloomberg. Major foreign bond indices were also in negative territory. The Bloomberg Global Aggregate Index of higher quality debt posted a total return of -14.63% (USD), while the EM Hard Currency Aggregate Index of emerging markets debt fell by 13.90% (USD), according to Bloomberg. Over that same period, the U.S. dollar surged by 14.04% against a basket of major currencies, as measured by the U.S. Dollar Index (DXY), pressuring the returns on unhedged foreign securities held by U.S. investors.
U.S. bond indices have not been immune to the aggressive tightening of monetary policy by central banks, particularly the U.S. Federal Reserve. Over the past six months, the best performing index we track was the U.S. Treasury: Intermediate Index, which posted a total return of -4.69%. The worst performer was the Municipal Long Bond: Long Bond (22+), which posted a total return of -12.15%. The yield on the benchmark 10-Year Treasury Note (“T-Note”) rose by 149 basis points (a 63.70% increase over the period) to close at 3.83%, according to Bloomberg. For comparative purposes, the average yield on the 10-Year T-Note was 2.10% for the 10-year period ended September 30, 2022.
Fund Performance Overview (Unaudited)
Developed International Equity Select ETF (RNDM)
The Developed International Equity Select ETF (the “Fund”) seeks investment results that correspond generally to the price and yield (before the Fund’s fees and expenses) of an equity index called the Nasdaq Riskalyze Developed Markets IndexTM (the “Index”). The shares of the Fund are listed and trade on The Nasdaq Stock Market LLC under the ticker symbol “RNDM.” The Fund normally invests at least 90% of its net assets (plus any borrowings for investment purposes) in the common stocks, depositary receipts, preferred shares and real estate investment trusts that comprise the Index.
The Index is owned and was developed and sponsored by Riskalyze, Inc. (the “Index Provider”). According to the Index Provider, the Index is designed to select low volatility developed markets (excluding the United States) securities that are included in the Nasdaq Developed Markets Ex-US Large Mid Cap IndexTM (the “Base Index”) and have a minimum three-month average daily dollar trading volume of $5 million. The Base Index is a comprehensive, rules-based index designed to measure stock market performance of companies in developed markets (excluding the United States), as determined by Nasdaq, Inc. A country is classified as “developed” based on a number of criteria, including national income per capita, national market capitalization and national trading volume. Companies are classified as operating in a country primarily by their country of incorporation, domicile and primary exchange listing.
| Performance | | | | | | |
| | | | Average Annual Total Returns | | Cumulative Total Returns |
| | 6 Months
Ended
9/30/22 | 1 Year
Ended
9/30/22 | 5 Years
Ended
9/30/22 | Inception
(6/20/17)
to 9/30/22 | | 5 Years
Ended
9/30/22 | Inception
(6/20/17)
to 9/30/22 |
| Fund Performance | | | | | | | |
| NAV | -21.91% | -24.19% | -2.14% | -1.80% | | -10.26% | -9.16% |
| Market Price | -21.79% | -24.37% | -2.23% | -1.79% | | -10.68% | -9.11% |
| Index Performance | | | | | | | |
| Nasdaq Riskalyze Developed Markets IndexTM | -21.66% | -23.16% | -0.84% | -0.51% | | -4.11% | -2.66% |
| Nasdaq Developed Markets Ex-US Large Mid Cap IndexTM | -22.71% | -24.27% | 0.04% | 1.06% | | 0.22% | 5.75% |
| MSCI World ex USA Index | -22.50% | -23.91% | -0.39% | 0.67% | | -1.96% | 3.61% |
(See Notes to Fund Performance Overview on page 16.)
Riskalyze and Nasdaq Riskalyze Developed Markets IndexTM are trademarks or service marks of Riskalyze, Inc. (“Riskalyze”) and have been licensed for use for certain purposes by First Trust. The Fund is not sponsored, endorsed, sold or promoted by Riskalyze, and Riskalyze makes no representation regarding the advisability of trading in the Fund. The Nasdaq Riskalyze Developed Markets IndexTM (“Riskalyze Index”) is a product of Riskalyze, Inc. (“Riskalyze”). RISKALYZE® and NASDAQ RISKALYZE DEVELOPED MARKETS INDEXTM are trademarks of Riskalyze. Nasdaq® is a trademark of Nasdaq, Inc.
Fund Performance Overview (Unaudited) (Continued)
Developed International Equity Select ETF (RNDM) (Continued)
| Sector Allocation | % of Total
Investments |
| Financials | 23.4% |
| Industrials | 14.4 |
| Health Care | 12.5 |
| Consumer Staples | 12.5 |
| Consumer Discretionary | 11.5 |
| Communication Services | 5.7 |
| Materials | 5.2 |
| Information Technology | 4.8 |
| Utilities | 4.0 |
| Real Estate | 3.1 |
| Energy | 2.9 |
| Total | 100.0% |
| Top Ten Holdings | % of Total
Investments |
| USS Co., Ltd. | 3.6% |
| Sekisui House Ltd. | 3.3 |
| Secom Co., Ltd. | 3.0 |
| Takeda Pharmaceutical Co., Ltd. | 2.4 |
| Novartis AG | 2.2 |
| Roche Holding AG | 2.1 |
| Henkel AG & Co., KGaA (Preference Shares) | 1.8 |
| GSK PLC | 1.7 |
| Japan Post Holdings Co., Ltd. | 1.4 |
| Hitachi Metals Ltd. | 1.4 |
| Total | 22.9% |
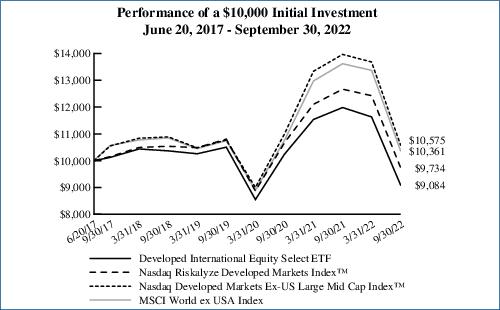
Performance figures assume reinvestment of all distributions and do not reflect the deduction of taxes that a shareholder would pay on Fund distributions or the redemption or sale of Fund shares. An index is a statistical composite that tracks a specified financial market or sector. Unlike the Fund, the indices do not actually hold a portfolio of securities and therefore do not incur the expenses incurred by the Fund. These expenses negatively impact the performance of the Fund. The Fund’s past performance does not predict future performance.
Frequency Distribution of Discounts and Premiums
Information showing the number of days the market price of the Fund’s shares was greater (at a premium) and less (at a discount) than the Fund’s net asset value for the most recently completed year, and the most recently completed calendar quarters since that year (or life of the Fund, if shorter), is available at https://www.ftportfolios.com/Retail/etf/home.aspx.
Fund Performance Overview (Unaudited) (Continued)
Emerging Markets Equity Select ETF (RNEM)
The Emerging Markets Equity Select ETF (the “Fund”) seeks investment results that correspond generally to the price and yield (before the Fund’s fees and expenses) of an equity index called the Nasdaq Riskalyze Emerging Markets IndexTM (the “Index”). The shares of the Fund are listed and trade on The Nasdaq Stock Market LLC under the ticker symbol “RNEM.” The Fund normally invests at least 90% of its net assets (plus any borrowings for investment purposes) in the common stocks, depositary receipts, preferred shares and real estate investment trusts that comprise the Index.
The Index is owned and was developed and sponsored by Riskalyze, Inc. (the “Index Provider”). According to the Index Provider, the Index is designed to select low volatility emerging markets securities that are included in the Nasdaq Emerging Markets Large Mid Cap IndexTM (the “Base Index”) and have a minimum three-month average daily dollar trading volume of $5 million. The Base Index is a comprehensive, rules-based index designed to measure stock market performance of companies in emerging markets, as determined by Nasdaq, Inc. A country is classified as “emerging” based on a number of criteria, including national income per capita, national market capitalization and national trading volume. Emerging markets are generally characterized by lower market efficiency and less strict standards in accounting and securities regulation than developed markets. Companies are classified as operating in a country primarily by their country of incorporation, domicile and primary exchange listing.
| Performance | | | | | | |
| | | | Average Annual Total Returns | | Cumulative Total Returns |
| | 6 Months
Ended
9/30/22 | 1 Year
Ended
9/30/22 | 5 Years
Ended
9/30/22 | Inception
(6/20/17)
to 9/30/22 | | 5 Years
Ended
9/30/22 | Inception
(6/20/17)
to 9/30/22 |
| Fund Performance | | | | | | | |
| NAV | -16.02% | -15.04% | -2.19% | -0.98% | | -10.46% | -5.08% |
| Market Price | -16.77% | -15.82% | -2.49% | -1.14% | | -11.84% | -5.87% |
| Index Performance | | | | | | | |
| Nasdaq Riskalyze Emerging Markets IndexTM | -15.29% | -13.90% | -0.28% | 0.98% | | -1.38% | 5.27% |
| Nasdaq Emerging Markets Large Mid Cap IndexTM | -20.17% | -24.37% | -0.76% | 0.81% | | -3.76% | 4.32% |
| MSCI Emerging Markets Index | -21.70% | -28.11% | -1.81% | -0.19% | | -8.71% | -1.02% |
(See Notes to Fund Performance Overview on page 16.)
Riskalyze and Nasdaq Riskalyze Emerging Markets IndexTM are trademarks or service marks of Riskalyze, Inc. (“Riskalyze”) and have been licensed for use for certain purposes by First Trust. The Fund is not sponsored, endorsed, sold or promoted by Riskalyze, and Riskalyze makes no representation regarding the advisability of trading in the Fund. The Nasdaq Riskalyze Emerging Markets IndexTM (“Riskalyze Index”) is a product of Riskalyze, Inc. (“Riskalyze”). RISKALYZE® and NASDAQ RISKALYZE EMERGING MARKETS INDEXTM are trademarks of Riskalyze. Nasdaq® is a trademark of Nasdaq, Inc.
Fund Performance Overview (Unaudited) (Continued)
Emerging Markets Equity Select ETF (RNEM) (Continued)
| Sector Allocation | % of Total
Investments |
| Financials | 28.4% |
| Information Technology | 19.2 |
| Materials | 12.2 |
| Consumer Staples | 9.8 |
| Energy | 8.0 |
| Industrials | 4.8 |
| Consumer Discretionary | 4.7 |
| Communication Services | 4.2 |
| Health Care | 3.2 |
| Real Estate | 3.1 |
| Utilities | 2.4 |
| Total | 100.0% |
| Top Ten Holdings | % of Total
Investments |
| HDFC Bank Ltd. | 3.3% |
| Inventec Corp. | 3.1 |
| Wistron Corp. | 3.0 |
| Quanta Computer, Inc. | 2.9 |
| Compal Electronics, Inc. | 2.7 |
| Pegatron Corp. | 2.7 |
| ESR Group Ltd. | 2.1 |
| Petronet LNG Ltd. | 1.9 |
| Klabin S.A. | 1.9 |
| China Petroleum & Chemical Corp., Class H | 1.8 |
| Total | 25.4% |

Performance figures assume reinvestment of all distributions and do not reflect the deduction of taxes that a shareholder would pay on Fund distributions or the redemption or sale of Fund shares. An index is a statistical composite that tracks a specified financial market or sector. Unlike the Fund, the indices do not actually hold a portfolio of securities and therefore do not incur the expenses incurred by the Fund. These expenses negatively impact the performance of the Fund. The Fund’s past performance does not predict future performance.
Frequency Distribution of Discounts and Premiums
Information showing the number of days the market price of the Fund’s shares was greater (at a premium) and less (at a discount) than the Fund’s net asset value for the most recently completed year, and the most recently completed calendar quarters since that year (or life of the Fund, if shorter), is available at https://www.ftportfolios.com/Retail/etf/home.aspx.
Fund Performance Overview (Unaudited) (Continued)
Large Cap US Equity Select ETF (RNLC)
The Large Cap US Equity Select ETF (the “Fund”) seeks investment results that correspond generally to the price and yield (before the Fund’s fees and expenses) of an equity index called the Nasdaq Riskalyze US Large Cap IndexTM (the “Index”). The shares of the Fund are listed and trade on The Nasdaq Stock Market LLC under the ticker symbol “RNLC.” The Fund normally invests at least 90% of its net assets (plus any borrowings for investment purposes) in the common stocks and real estate investment trusts that comprise the Index.
The Index is owned and was developed and sponsored by Riskalyze, Inc. (the “Index Provider”). According to the Index Provider, the Index is designed to select dividend-paying US large cap securities that are included in the Nasdaq US 500 Large Cap IndexTM (the “Base Index”) and have paid a dividend in the trailing twelve months (based on ex-date). The Base Index is a comprehensive, rules-based index designed to measure stock market performance of large cap US companies, as determined by Nasdaq, Inc.
| Performance | | | | | | |
| | | | Average Annual Total Returns | | Cumulative Total Returns |
| | 6 Months
Ended
9/30/22 | 1 Year
Ended
9/30/22 | 5 Years
Ended
9/30/22 | Inception
(6/20/17)
to 9/30/22 | | 5 Years
Ended
9/30/22 | Inception
(6/20/17)
to 9/30/22 |
| Fund Performance | | | | | | | |
| NAV | -19.08% | -14.83% | 7.20% | 7.47% | | 41.58% | 46.27% |
| Market Price | -19.19% | -14.92% | 7.16% | 7.45% | | 41.33% | 46.15% |
| Index Performance | | | | | | | |
| Nasdaq Riskalyze US Large Cap IndexTM | -18.89% | -14.37% | 7.86% | 8.13% | | 45.95% | 51.05% |
| Nasdaq US 500 Large Cap IndexTM | -20.46% | -17.04% | 9.20% | 9.48% | | 55.31% | 61.32% |
| S&P 500® Index | -20.20% | -15.47% | 9.24% | 9.53% | | 55.55% | 61.67% |
(See Notes to Fund Performance Overview on page 16.)
Riskalyze and Nasdaq Riskalyze US Large Cap IndexTM are trademarks or service marks of Riskalyze, Inc. (“Riskalyze”) and have been licensed for use for certain purposes by First Trust. The Fund is not sponsored, endorsed, sold or promoted by Riskalyze, and Riskalyze makes no representation regarding the advisability of trading in the Fund. The Nasdaq Riskalyze US Large Cap IndexTM (“Riskalyze Index”) is a product of Riskalyze, Inc. (“Riskalyze”). RISKALYZE® and NASDAQ RISKALYZE US LARGE CAP INDEXTM are trademarks of Riskalyze. Nasdaq® is a trademark of Nasdaq, Inc.
Fund Performance Overview (Unaudited) (Continued)
Large Cap US Equity Select ETF (RNLC) (Continued)
| Sector Allocation | % of Total
Investments |
| Information Technology | 29.0% |
| Health Care | 15.4 |
| Financials | 11.1 |
| Consumer Discretionary | 11.0 |
| Industrials | 9.7 |
| Consumer Staples | 6.6 |
| Energy | 4.8 |
| Communication Services | 3.6 |
| Materials | 3.0 |
| Utilities | 2.9 |
| Real Estate | 2.9 |
| Total | 100.0% |
| Top Ten Holdings | % of Total
Investments |
| Microchip Technology, Inc. | 0.9% |
| Amphenol Corp., Class A | 0.9 |
| Apple, Inc. | 0.8 |
| Texas Instruments, Inc. | 0.8 |
| Intuit, Inc. | 0.8 |
| NXP Semiconductors N.V. | 0.8 |
| CDW Corp. | 0.8 |
| Marvell Technology, Inc. | 0.8 |
| TE Connectivity Ltd. | 0.8 |
| Analog Devices, Inc. | 0.8 |
| Total | 8.2% |

Performance figures assume reinvestment of all distributions and do not reflect the deduction of taxes that a shareholder would pay on Fund distributions or the redemption or sale of Fund shares. An index is a statistical composite that tracks a specified financial market or sector. Unlike the Fund, the indices do not actually hold a portfolio of securities and therefore do not incur the expenses incurred by the Fund. These expenses negatively impact the performance of the Fund. The Fund’s past performance does not predict future performance.
Frequency Distribution of Discounts and Premiums
Information showing the number of days the market price of the Fund’s shares was greater (at a premium) and less (at a discount) than the Fund’s net asset value for the most recently completed year, and the most recently completed calendar quarters since that year (or life of the Fund, if shorter), is available at https://www.ftportfolios.com/Retail/etf/home.aspx.
Fund Performance Overview (Unaudited) (Continued)
Mid Cap US Equity Select ETF (RNMC)
The Mid Cap US Equity Select ETF (the “Fund”) seeks investment results that correspond generally to the price and yield (before the Fund’s fees and expenses) of an equity index called the Nasdaq Riskalyze US Mid Cap IndexTM (the “Index”). The shares of the Fund are listed and trade on The Nasdaq Stock Market LLC under the ticker symbol “RNMC.” The Fund normally invests at least 90% of its net assets (plus any borrowings for investment purposes) in the common stocks and real estate investment trusts that comprise the Index.
The Index is owned and was developed and sponsored by Riskalyze, Inc. (the “Index Provider”). According to the Index Provider, the Index is designed to select dividend-paying US mid cap securities that are included in the Nasdaq US 600 Mid Cap IndexTM (the “Base Index”) and have paid a dividend in the trailing twelve months (based on ex-date). The Base Index is a comprehensive, rules-based index designed to measure stock market performance of mid cap US companies, as determined by Nasdaq, Inc.
| Performance | | | | | | |
| | | | Average Annual Total Returns | | Cumulative Total Returns |
| | 6 Months
Ended
9/30/22 | 1 Year
Ended
9/30/22 | 5 Years
Ended
9/30/22 | Inception
(6/20/17)
to 9/30/22 | | 5 Years
Ended
9/30/22 | Inception
(6/20/17)
to 9/30/22 |
| Fund Performance | | | | | | | |
| NAV | -17.58% | -14.38% | 4.80% | 5.30% | | 26.45% | 31.31% |
| Market Price | -17.58% | -14.72% | 4.78% | 5.29% | | 26.33% | 31.25% |
| Index Performance | | | | | | | |
| Nasdaq Riskalyze US Mid Cap IndexTM | -17.38% | -13.85% | 5.45% | 5.94% | | 30.39% | 35.59% |
| Nasdaq US 600 Mid Cap IndexTM | -20.44% | -22.04% | 5.28% | 5.99% | | 29.35% | 35.95% |
| S&P MidCap 400® Index | -17.50% | -15.25% | 5.82% | 6.16% | | 32.68% | 37.13% |
(See Notes to Fund Performance Overview on page 16.)
Riskalyze and Nasdaq Riskalyze US Mid Cap IndexTM are trademarks or service marks of Riskalyze, Inc. (“Riskalyze”) and have been licensed for use for certain purposes by First Trust. The Fund is not sponsored, endorsed, sold or promoted by Riskalyze, and Riskalyze makes no representation regarding the advisability of trading in the Fund. The Nasdaq Riskalyze US Mid Cap IndexTM (“Riskalyze Index”) is a product of Riskalyze, Inc. (“Riskalyze”). RISKALYZE® and NASDAQ RISKALYZE US MID CAP INDEXTM are trademarks of Riskalyze. Nasdaq® is a trademark of Nasdaq, Inc.
Fund Performance Overview (Unaudited) (Continued)
Mid Cap US Equity Select ETF (RNMC) (Continued)
| Sector Allocation | % of Total
Investments |
| Industrials | 19.1% |
| Financials | 15.7 |
| Consumer Discretionary | 14.4 |
| Health Care | 10.9 |
| Information Technology | 10.4 |
| Real Estate | 8.2 |
| Energy | 5.9 |
| Materials | 5.9 |
| Utilities | 4.0 |
| Consumer Staples | 3.4 |
| Communication Services | 2.1 |
| Total | 100.0% |
| Top Ten Holdings | % of Total
Investments |
| Ensign Group (The), Inc. | 1.3% |
| Premier, Inc., Class A | 1.1 |
| Chemed Corp. | 1.1 |
| Perrigo Co. PLC | 1.1 |
| Universal Health Services, Inc., Class B | 1.1 |
| Bruker Corp. | 1.0 |
| CONMED Corp. | 1.0 |
| Encompass Health Corp. | 1.0 |
| DENTSPLY SIRONA, Inc. | 1.0 |
| National Instruments Corp. | 0.9 |
| Total | 10.6% |

Performance figures assume reinvestment of all distributions and do not reflect the deduction of taxes that a shareholder would pay on Fund distributions or the redemption or sale of Fund shares. An index is a statistical composite that tracks a specified financial market or sector. Unlike the Fund, the indices do not actually hold a portfolio of securities and therefore do not incur the expenses incurred by the Fund. These expenses negatively impact the performance of the Fund. The Fund’s past performance does not predict future performance.
Frequency Distribution of Discounts and Premiums
Information showing the number of days the market price of the Fund’s shares was greater (at a premium) and less (at a discount) than the Fund’s net asset value for the most recently completed year, and the most recently completed calendar quarters since that year (or life of the Fund, if shorter), is available at https://www.ftportfolios.com/Retail/etf/home.aspx.
Fund Performance Overview (Unaudited) (Continued)
Small Cap US Equity Select ETF (RNSC)
The Small Cap US Equity Select ETF (the “Fund”) seeks investment results that correspond generally to the price and yield (before the Fund’s fees and expenses) of an equity index called the Nasdaq Riskalyze US Small Cap IndexTM (the “Index”). The shares of the Fund are listed and trade on The Nasdaq Stock Market LLC under the ticker symbol “RNSC.” The Fund normally invests at least 90% of its net assets (plus any borrowings for investment purposes) in the common stocks and real estate investment trusts that comprise the Index.
The Index is owned and was developed and sponsored by Riskalyze, Inc. (the “Index Provider”). According to the Index Provider, the Index is designed to select dividend-paying US small cap securities that are included in the Nasdaq US 700 Small Cap IndexTM (the “Base Index”) and have paid a dividend in the trailing twelve months (based on ex-date). The Base Index is a comprehensive, rules-based index designed to measure stock market performance of small cap US companies, as determined by Nasdaq, Inc.
| Performance | | | | | | |
| | | | Average Annual Total Returns | | Cumulative Total Returns |
| | 6 Months
Ended
9/30/22 | 1 Year
Ended
9/30/22 | 5 Years
Ended
9/30/22 | Inception
(6/20/17)
to 9/30/22 | | 5 Years
Ended
9/30/22 | Inception
(6/20/17)
to 9/30/22 |
| Fund Performance | | | | | | | |
| NAV | -19.62% | -16.32% | 3.75% | 4.76% | | 20.23% | 27.83% |
| Market Price | -19.63% | -16.40% | 3.76% | 4.78% | | 20.26% | 27.93% |
| Index Performance | | | | | | | |
| Nasdaq Riskalyze US Small Cap IndexTM | -19.45% | -15.87% | 4.42% | 5.44% | | 24.17% | 32.28% |
| Nasdaq US 700 Small Cap IndexTM | -20.96% | -23.88% | 4.59% | 5.84% | | 25.17% | 34.94% |
| S&P SmallCap 600® Index | -18.58% | -18.83% | 4.84% | 5.96% | | 26.68% | 35.77% |
(See Notes to Fund Performance Overview on page 16.)
Riskalyze and Nasdaq Riskalyze US Small Cap IndexTM are trademarks or service marks of Riskalyze, Inc. (“Riskalyze”) and have been licensed for use for certain purposes by First Trust. The Fund is not sponsored, endorsed, sold or promoted by Riskalyze, and Riskalyze makes no representation regarding the advisability of trading in the Fund. The Nasdaq Riskalyze US Small Cap IndexTM (“Riskalyze Index”) is a product of Riskalyze, Inc. (“Riskalyze”). RISKALYZE® and NASDAQ RISKALYZE US SMALL CAP INDEXTM are trademarks of Riskalyze. Nasdaq® is a trademark of Nasdaq, Inc.
Fund Performance Overview (Unaudited) (Continued)
Small Cap US Equity Select ETF (RNSC) (Continued)
| Sector Allocation | % of Total
Investments |
| Financials | 18.3% |
| Industrials | 15.5 |
| Information Technology | 12.9 |
| Health Care | 12.4 |
| Consumer Discretionary | 11.6 |
| Real Estate | 8.2 |
| Energy | 6.2 |
| Consumer Staples | 4.3 |
| Materials | 4.1 |
| Communication Services | 3.8 |
| Utilities | 2.7 |
| Total | 100.0% |
| Top Ten Holdings | % of Total
Investments |
| Select Medical Holdings Corp. | 4.6% |
| Patterson Cos., Inc. | 3.9 |
| Owens & Minor, Inc. | 3.7 |
| Advanced Energy Industries, Inc. | 1.8 |
| Methode Electronics, Inc. | 1.7 |
| Vishay Intertechnology, Inc. | 1.7 |
| Xperi Holding Corp. | 1.6 |
| Progress Software Corp. | 1.6 |
| CSG Systems International, Inc. | 1.5 |
| Xerox Holdings Corp. | 1.5 |
| Total | 23.6% |

Performance figures assume reinvestment of all distributions and do not reflect the deduction of taxes that a shareholder would pay on Fund distributions or the redemption or sale of Fund shares. An index is a statistical composite that tracks a specified financial market or sector. Unlike the Fund, the indices do not actually hold a portfolio of securities and therefore do not incur the expenses incurred by the Fund. These expenses negatively impact the performance of the Fund. The Fund’s past performance does not predict future performance.
Frequency Distribution of Discounts and Premiums
Information showing the number of days the market price of the Fund’s shares was greater (at a premium) and less (at a discount) than the Fund’s net asset value for the most recently completed year, and the most recently completed calendar quarters since that year (or life of the Fund, if shorter), is available at https://www.ftportfolios.com/Retail/etf/home.aspx.
Fund Performance Overview (Unaudited) (Continued)
US Equity Dividend Select ETF (RNDV)
The US Equity Dividend Select ETF (the “Fund”) seeks investment results that correspond generally to the price and yield (before the Fund’s fees and expenses) of an equity index called the Nasdaq Riskalyze US Large Cap Select Dividend IndexTM (the “Index”). The shares of the Fund are listed and trade on The Nasdaq Stock Market LLC under the ticker symbol “RNDV.” The Fund normally invests at least 90% of its net assets (plus any borrowings for investment purposes) in the common stocks and real estate investment trusts that comprise the Index.
The Index is owned and was developed and sponsored by Riskalyze, Inc. (the “Index Provider”). According to the Index Provider, the Index is designed to select dividend-paying US securities that (i) are included in the Nasdaq US 500 Large Cap IndexTM (the “Base Index”); (ii) have paid a dividend in the trailing twelve months (based on the ex-date); and (iii) have a trailing twelve-month dividend yield higher than the index yield of the Base Index. The Base Index is a comprehensive, rules-based index designed to measure stock market performance of large cap US companies, as determined by Nasdaq, Inc.
| Performance | | | | | | |
| | | | Average Annual Total Returns | | Cumulative Total Returns |
| | 6 Months
Ended
9/30/22 | 1 Year
Ended
9/30/22 | 5 Years
Ended
9/30/22 | Inception
(6/20/17)
to 9/30/22 | | 5 Years
Ended
9/30/22 | Inception
(6/20/17)
to 9/30/22 |
| Fund Performance | | | | | | | |
| NAV | -17.16% | -10.98% | 7.09% | 7.29% | | 40.86% | 45.02% |
| Market Price | -17.30% | -10.98% | 7.08% | 7.30% | | 40.80% | 45.03% |
| Index Performance | | | | | | | |
| Nasdaq Riskalyze US Large Cap Select Dividend IndexTM | -17.06% | -10.60% | 7.67% | 7.87% | | 44.69% | 49.17% |
| Nasdaq US 500 Large Cap IndexTM | -20.46% | -17.04% | 9.20% | 9.48% | | 55.31% | 61.32% |
| S&P 500® Index | -20.20% | -15.47% | 9.24% | 9.53% | | 55.55% | 61.67% |
(See Notes to Fund Performance Overview on page 16.)
Riskalyze and Nasdaq Riskalyze US Large Cap Select Dividend IndexTM are trademarks or service marks of Riskalyze, Inc. (“Riskalyze”) and have been licensed for use for certain purposes by First Trust. The Fund is not sponsored, endorsed, sold or promoted by Riskalyze, and Riskalyze makes no representation regarding the advisability of trading in the Fund. The Nasdaq Riskalyze US Large Cap Select Dividend IndexTM (“Riskalyze Index”) is a product of Riskalyze, Inc. (“Riskalyze”). RISKALYZE® and NASDAQ RISKALYZE US LARGE CAP SELECT DIVIDEND INDEXTM are trademarks of Riskalyze. Nasdaq® is a trademark of Nasdaq, Inc.
Fund Performance Overview (Unaudited) (Continued)
US Equity Dividend Select ETF (RNDV) (Continued)
| Sector Allocation | % of Total
Investments |
| Information Technology | 27.8% |
| Health Care | 15.2 |
| Financials | 11.9 |
| Consumer Discretionary | 11.6 |
| Industrials | 8.8 |
| Consumer Staples | 6.7 |
| Energy | 4.8 |
| Communication Services | 4.7 |
| Utilities | 3.2 |
| Real Estate | 2.9 |
| Materials | 2.4 |
| Total | 100.0% |
| Top Ten Holdings | % of Total
Investments |
| International Business Machines Corp. | 2.4% |
| Hewlett Packard Enterprise Co. | 2.0 |
| Cardinal Health, Inc. | 1.9 |
| Gilead Sciences, Inc. | 1.9 |
| Broadcom, Inc. | 1.9 |
| Corning, Inc. | 1.8 |
| Texas Instruments, Inc. | 1.8 |
| NetApp, Inc. | 1.8 |
| Seagate Technology Holdings PLC | 1.8 |
| Intel Corp. | 1.6 |
| Total | 18.9% |
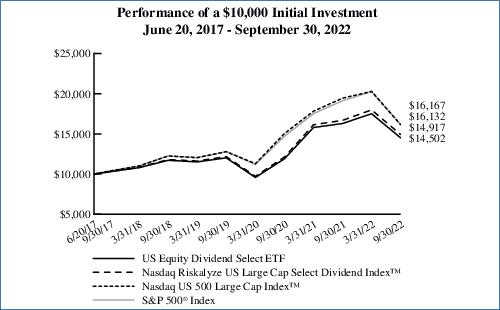
Performance figures assume reinvestment of all distributions and do not reflect the deduction of taxes that a shareholder would pay on Fund distributions or the redemption or sale of Fund shares. An index is a statistical composite that tracks a specified financial market or sector. Unlike the Fund, the indices do not actually hold a portfolio of securities and therefore do not incur the expenses incurred by the Fund. These expenses negatively impact the performance of the Fund. The Fund’s past performance does not predict future performance.
Frequency Distribution of Discounts and Premiums
Information showing the number of days the market price of the Fund’s shares was greater (at a premium) and less (at a discount) than the Fund’s net asset value for the most recently completed year, and the most recently completed calendar quarters since that year (or life of the Fund, if shorter), is available at https://www.ftportfolios.com/Retail/etf/home.aspx.
Notes to Fund Performance Overview (Unaudited)
Total returns for the period since inception are calculated from the inception date of each Fund. “Average Annual Total Returns” represent the average annual change in value of an investment over the periods indicated. “Cumulative Total Returns” represent the total change in value of an investment over the periods indicated.
Each Fund’s per share net asset value (“NAV”) is the value of one share of the Fund and is computed by dividing the value of all assets of the Fund (including accrued interest and dividends), less all liabilities (including accrued expenses and dividends declared but unpaid), by the total number of outstanding shares. The price used to calculate market return (“Market Price”) is determined by using the midpoint of the national best bid and offer price (“NBBO”) as of the time that the Fund’s NAV is calculated. Under SEC rules, the NBBO consists of the highest displayed buy and lowest sell prices among the various exchanges trading the Fund at the time the Fund’s NAV is calculated. Prior to January 1, 2019, the price used was the midpoint between the highest bid and the lowest offer on the stock exchange on which shares of the Fund were listed for trading as of the time that the Fund’s NAV was calculated. Since shares of each Fund did not trade in the secondary market until after the Fund’s inception, for the period from inception to the first day of secondary market trading in shares of the Fund, the NAV of each Fund is used as a proxy for the secondary market trading price to calculate market returns. NAV and market returns assume that all distributions have been reinvested in each Fund at NAV and Market Price, respectively.
An index is a statistical composite that tracks a specified financial market or sector. Unlike each Fund, the indices do not actually hold a portfolio of securities and therefore do not incur the expenses incurred by each Fund. These expenses negatively impact the performance of each Fund. Also, market returns do not include brokerage commissions that may be payable on secondary market transactions. If brokerage commissions were included, market returns would be lower. The total returns presented reflect the reinvestment of dividends on securities in the indices. The returns presented do not reflect the deduction of taxes that a shareholder would pay on Fund distributions or the redemption or sale of Fund shares. The investment return and principal value of shares of each Fund will vary with changes in market conditions. Shares of each Fund may be worth more or less than their original cost when they are redeemed or sold in the market. Each Fund’s past performance is no guarantee of future performance.
First Trust Exchange-Traded Fund VI
Understanding Your Fund Expenses
September 30, 2022 (Unaudited)
As a shareholder of Developed International Equity Select ETF, Emerging Markets Equity Select ETF, Large Cap US Equity Select ETF, Mid Cap US Equity Select ETF, Small Cap US Equity Select ETF or US Equity Dividend Select ETF (each a “Fund” and collectively, the “Funds”), you incur two types of costs: (1) transaction costs; and (2) ongoing costs, including management fees, distribution and/or service (12b-1) fees, if any, and other Fund expenses. This Example is intended to help you understand your ongoing costs of investing in the Funds and to compare these costs with the ongoing costs (in U.S. dollars) of investing in other funds.
The Example is based on an investment of $1,000 invested at the beginning of the period and held through the six-month period ended September 30, 2022.
Actual Expenses
The first line in the following table provides information about actual account values and actual expenses. You may use the information in this line, together with the amount you invested, to estimate the expenses that you paid over the period. Simply divide your account value by $1,000 (for example, an $8,600 account value divided by $1,000 = 8.6), then multiply the result by the number in the first line under the heading entitled “Expenses Paid During the Six-Month Period” to estimate the expenses you paid on your account during this six-month period.
Hypothetical Example for Comparison Purposes
The second line in the following table provides information about hypothetical account values and hypothetical expenses based on each Fund’s actual expense ratio and an assumed rate of return of 5% per year before expenses, which is not each Fund’s actual return. The hypothetical account values and expenses may not be used to estimate the actual ending account balance or expenses you paid for the period. You may use this information to compare the ongoing costs of investing in the Funds and other funds. To do so, compare this 5% hypothetical example with the 5% hypothetical examples that appear in the shareholder reports of the other funds.
Please note that the expenses shown in the table are meant to highlight your ongoing costs only and do not reflect any transactional costs such as brokerage commissions. Therefore, the second line in the table is useful in comparing ongoing costs only, and will not help you determine the relative total costs of owning different funds. In addition, if these transactional costs were included, your costs would have been higher.
| | Beginning
Account Value
April 1, 2022 | Ending
Account Value
September 30, 2022 | Annualized
Expense Ratio
Based on the
Six-Month
Period | Expenses Paid
During the
Six-Month
Period (a) |
| Developed International Equity Select ETF (RNDM) |
| Actual | $1,000.00 | $780.90 | 0.65% | $2.90 |
| Hypothetical (5% return before expenses) | $1,000.00 | $1,021.81 | 0.65% | $3.29 |
| Emerging Markets Equity Select ETF (RNEM) |
| Actual | $1,000.00 | $839.80 | 0.75% | $3.46 |
| Hypothetical (5% return before expenses) | $1,000.00 | $1,021.31 | 0.75% | $3.80 |
| Large Cap US Equity Select ETF (RNLC) |
| Actual | $1,000.00 | $809.20 | 0.60% | $2.72 |
| Hypothetical (5% return before expenses) | $1,000.00 | $1,022.06 | 0.60% | $3.04 |
| Mid Cap US Equity Select ETF (RNMC) |
| Actual | $1,000.00 | $824.20 | 0.60% | $2.74 |
| Hypothetical (5% return before expenses) | $1,000.00 | $1,022.06 | 0.60% | $3.04 |
| Small Cap US Equity Select ETF (RNSC) |
| Actual | $1,000.00 | $803.80 | 0.60% | $2.71 |
| Hypothetical (5% return before expenses) | $1,000.00 | $1,022.06 | 0.60% | $3.04 |
| US Equity Dividend Select ETF (RNDV) |
| Actual | $1,000.00 | $828.40 | 0.50% | $2.29 |
| Hypothetical (5% return before expenses) | $1,000.00 | $1,022.56 | 0.50% | $2.54 |
| (a) | Expenses are equal to the annualized expense ratios as indicated in the table multiplied by the average account value over the period (April 1, 2022 through September 30, 2022), multiplied by 183/365 (to reflect the six-month period). |
Developed International Equity Select ETF (RNDM)
Portfolio of Investments
September 30, 2022 (Unaudited)
| Shares | | Description | | Value |
| COMMON STOCKS (a) – 97.3% |
| | | Australia – 5.5% | | |
| 9,618 | | APA Group (b) | | $59,179 |
| 1,168 | | ASX Ltd. (b) | | 53,755 |
| 3,463 | | Australia & New Zealand Banking Group Ltd. (b) | | 50,694 |
| 3,352 | | Brambles Ltd. (b) | | 24,521 |
| 3,031 | | Coles Group Ltd. (b) | | 31,954 |
| 904 | | Commonwealth Bank of Australia (b) | | 52,590 |
| 272 | | CSL Ltd. (b) | | 49,468 |
| 2,966 | | Lendlease Corp., Ltd. (b) | | 16,957 |
| 470 | | Macquarie Group Ltd. (b) | | 45,853 |
| 31,032 | | Medibank Pvt Ltd. (b) | | 69,362 |
| 2,954 | | National Australia Bank Ltd. (b) | | 54,695 |
| 1,121 | | Ramsay Health Care Ltd. (b) | | 41,149 |
| 2,059 | | Sonic Healthcare Ltd. (b) | | 40,161 |
| 8,595 | | Suncorp Group Ltd. (b) | | 55,463 |
| 86,097 | | Tabcorp Holdings Ltd. (b) | | 51,631 |
| 15,015 | | Telstra Corp., Ltd. (b) | | 37,076 |
| 2,451 | | Transurban Group (b) | | 19,357 |
| 1,496 | | Wesfarmers Ltd. (b) | | 40,898 |
| 3,943 | | Westpac Banking Corp. (b) | | 52,166 |
| 1,457 | | Woolworths Group Ltd. (b) | | 31,662 |
| | | | | 878,591 |
| | | Austria – 0.3% | | |
| 94 | | ANDRITZ AG (b) | | 3,978 |
| 162 | | BAWAG Group AG (b) (c) (d) | | 6,964 |
| 225 | | Erste Group Bank AG (b) | | 4,932 |
| 184 | | OMV AG (b) | | 6,660 |
| 576 | | Raiffeisen Bank International AG (b) | | 6,815 |
| 152 | | Verbund AG (b) | | 12,977 |
| 158 | | voestalpine AG (b) | | 2,677 |
| | | | | 45,003 |
| | | Belgium – 0.7% | | |
| 59 | | Ackermans & van Haaren N.V. (b) | | 7,486 |
| 219 | | Ageas S.A./N.V. (b) | | 7,987 |
| 626 | | Anheuser-Busch InBev S.A./N.V. (b) | | 28,356 |
| 27 | | D’ieteren Group (b) | | 3,804 |
| 43 | | Elia Group S.A./N.V. (b) | | 5,060 |
| 906 | | Etablissements Franz Colruyt N.V. (b) | | 19,915 |
| 107 | | Groupe Bruxelles Lambert S.A. (b) | | 7,483 |
| 166 | | KBC Group N.V. (b) | | 7,877 |
| 171 | | Proximus S.A.D.P. (b) | | 1,773 |
| 30 | | Sofina S.A. (b) | | 5,178 |
| 98 | | Solvay S.A. (b) | | 7,587 |
| 152 | | UCB S.A. (b) | | 10,549 |
| 223 | | Umicore S.A. (b) | | 6,547 |
| | | | | 119,602 |
| Shares | | Description | | Value |
|
| | | Bermuda – 0.2% | | |
| 1,800 | | Hongkong Land Holdings Ltd. (b) | | $7,909 |
| 6,942 | | Hopson Development Holdings Ltd. (b) | | 7,228 |
| 200 | | Jardine Matheson Holdings Ltd. (b) | | 10,112 |
| 18,489 | | Man Wah Holdings Ltd. (b) | | 11,708 |
| | | | | 36,957 |
| | | Canada – 8.9% | | |
| 1,630 | | Algonquin Power & Utilities Corp. | | 17,806 |
| 1,129 | | AltaGas Ltd. | | 21,618 |
| 803 | | Bank of Montreal | | 70,380 |
| 1,319 | | Bank of Nova Scotia (The) | | 62,734 |
| 818 | | BCE, Inc. | | 34,299 |
| 1,555 | | Canadian Imperial Bank of Commerce | | 68,060 |
| 825 | | Canadian Utilities Ltd., Class A | | 21,459 |
| 510 | | Emera, Inc. | | 20,635 |
| 4,759 | | Enbridge, Inc. | | 176,462 |
| 511 | | Fortis, Inc. | | 19,414 |
| 3,207 | | Great-West Lifeco, Inc. | | 69,231 |
| 938 | | Hydro One Ltd. (c) (d) | | 22,938 |
| 640 | | Intact Financial Corp. | | 90,573 |
| 1,049 | | Metro, Inc. | | 52,528 |
| 1,233 | | National Bank of Canada | | 77,282 |
| 3,051 | | Power Corp. of Canada | | 68,757 |
| 801 | | Rogers Communications, Inc., Class B | | 30,855 |
| 858 | | Royal Bank of Canada | | 77,250 |
| 1,691 | | Sun Life Financial, Inc. | | 67,243 |
| 3,886 | | TC Energy Corp. | | 156,526 |
| 1,735 | | TELUS Corp. | | 34,453 |
| 919 | | TMX Group Ltd. | | 84,532 |
| 1,191 | | Toronto-Dominion Bank (The) | | 73,046 |
| | | | | 1,418,081 |
| | | Cayman Islands – 0.3% | | |
| 1,623 | | CK Asset Holdings Ltd. (b) | | 9,744 |
| 1,593 | | CK Hutchison Holdings Ltd. (b) | | 8,771 |
| 7,200 | | Shimao Group Holdings Ltd. (e) (f) | | 2,027 |
| 12,446 | | Sino Biopharmaceutical Ltd. (b) | | 5,833 |
| 2,667 | | SITC International Holdings Co., Ltd. (b) | | 4,891 |
| 9,731 | | WH Group Ltd. (b) (c) (d) | | 6,120 |
| 2,400 | | Wharf Real Estate Investment Co., Ltd. (b) | | 10,880 |
| 4,446 | | Xinyi Glass Holdings Ltd. (b) | | 6,430 |
| | | | | 54,696 |
| | | Denmark – 2.2% | | |
| 14 | | AP Moller - Maersk A.S., Class B (b) | | 25,441 |
| 86 | | Carlsberg A.S., Class B (b) | | 10,057 |
Page 18
See Notes to Financial Statements
Developed International Equity Select ETF (RNDM)
Portfolio of Investments (Continued)
September 30, 2022 (Unaudited)
| Shares | | Description | | Value |
| COMMON STOCKS (a) (Continued) |
| | | Denmark (Continued) | | |
| 539 | | Chr Hansen Holding A.S. (b) | | $26,551 |
| 262 | | Coloplast A.S., Class B (b) | | 26,626 |
| 575 | | Danske Bank A.S. (b) | | 7,157 |
| 879 | | Demant A.S. (b) (f) | | 21,730 |
| 217 | | DSV A.S. (b) | | 25,421 |
| 107 | | Genmab A.S. (b) (f) | | 34,422 |
| 808 | | GN Store Nord A.S. (b) | | 14,153 |
| 6,911 | | H Lundbeck A.S. (b) | | 22,089 |
| 1,728 | | H Lundbeck A.S., Class A (f) | | 5,158 |
| 359 | | Novo Nordisk A.S., Class B (b) | | 35,763 |
| 579 | | Novozymes A.S., Class B (b) | | 29,096 |
| 242 | | Orsted A.S. (b) (c) (d) | | 19,288 |
| 107 | | Pandora A.S. (b) | | 5,004 |
| 111 | | Royal Unibrew A.S. (b) | | 7,192 |
| 174 | | Topdanmark A.S. | | 8,151 |
| 395 | | Tryg A.S. (b) | | 8,154 |
| 1,226 | | Vestas Wind Systems A/S (b) | | 22,574 |
| | | | | 354,027 |
| | | Finland – 1.3% | | |
| 414 | | Elisa Oyj (b) | | 18,758 |
| 558 | | Fortum Oyj (b) | | 7,498 |
| 347 | | Kesko Oyj, Class B (b) | | 6,474 |
| 190 | | Kojamo Oyj (b) | | 2,447 |
| 216 | | Kone Oyj, Class B (b) | | 8,322 |
| 1,337 | | Metso Outotec Oyj (b) | | 8,867 |
| 499 | | Neste Oyj (b) | | 21,751 |
| 4,512 | | Nokia Oyj (b) | | 19,370 |
| 3,522 | | Nordea Bank Abp (b) | | 30,142 |
| 778 | | Sampo Oyj, Class A (b) | | 33,214 |
| 1,009 | | Stora Enso Oyj, Class R (b) | | 12,818 |
| 606 | | UPM-Kymmene Oyj (b) | | 19,231 |
| 366 | | Valmet Oyj (b) | | 7,399 |
| 1,235 | | Wartsila OYJ Abp (b) | | 7,889 |
| | | | | 204,180 |
| | | France – 8.9% | | |
| 718 | | Air Liquide S.A. (b) | | 82,067 |
| 1,939 | | AXA S.A. (b) | | 42,334 |
| 11,267 | | Bollore SE (b) | | 51,694 |
| 1,691 | | Bouygues S.A. (b) | | 44,234 |
| 2,065 | | Bureau Veritas S.A. (b) | | 46,210 |
| 1,415 | | Carrefour S.A. (b) | | 19,625 |
| 558 | | Danone S.A. (b) | | 26,385 |
| 2,827 | | Dassault Systemes SE (b) | | 97,602 |
| 1,192 | | Edenred (b) | | 54,916 |
| 574 | | Eiffage S.A. (b) | | 46,031 |
| 687 | | Eurazeo SE (b) | | 35,849 |
| 3,275 | | Getlink SE (b) | | 50,787 |
| 5,031 | | La Francaise des Jeux SAEM (b) (c) (d) | | 149,239 |
| 622 | | Legrand S.A. (b) | | 40,218 |
| 497 | | L’Oreal S.A. (b) | | 158,912 |
| 2,414 | | Orange S.A. (b) | | 21,834 |
| 139 | | Pernod Ricard S.A. (b) | | 25,500 |
| Shares | | Description | | Value |
|
| | | France (Continued) | | |
| 147 | | Remy Cointreau S.A. (b) | | $24,394 |
| 2,467 | | Sanofi (b) | | 187,853 |
| 1,427 | | SEB S.A. (b) | | 89,759 |
| 155 | | Teleperformance (b) | | 39,321 |
| 576 | | Vinci S.A. (b) | | 46,576 |
| 555 | | Wendel SE (b) | | 39,724 |
| | | | | 1,421,064 |
| | | Germany – 7.6% | | |
| 218 | | Allianz SE (b) | | 34,343 |
| 450 | | BASF SE (b) | | 17,270 |
| 862 | | Bayer AG (b) | | 39,716 |
| 243 | | Beiersdorf AG (b) | | 23,878 |
| 315 | | Brenntag SE (b) | | 19,042 |
| 290 | | Deutsche Boerse AG (b) | | 47,539 |
| 2,703 | | Deutsche Telekom AG (b) | | 46,010 |
| 5,974 | | E.ON SE (b) | | 45,897 |
| 926 | | Evonik Industries AG (b) | | 15,508 |
| 879 | | Fresenius Medical Care AG & Co., KGaA (b) | | 24,764 |
| 1,602 | | Fresenius SE & Co., KGaA (b) | | 34,147 |
| 710 | | FUCHS PETROLUB SE (Preference Shares) (b) | | 17,979 |
| 3,147 | | GEA Group AG (b) | | 101,846 |
| 307 | | Hannover Rueck SE (b) | | 46,021 |
| 2,273 | | HeidelbergCement AG (b) | | 89,793 |
| 4,718 | | Henkel AG & Co., KGaA (Preference Shares) (b) | | 280,188 |
| 275 | | LEG Immobilien SE (b) | | 16,415 |
| 195 | | Muenchener Rueckversicherungs-Gesellschaft AG in Muenchen (b) | | 46,941 |
| 635 | | SAP SE (b) | | 51,749 |
| 1,227 | | Scout24 AG (b) (c) (d) | | 61,486 |
| 214 | | Symrise AG (b) | | 20,868 |
| 1,182 | | Talanx AG (b) | | 41,855 |
| 18,535 | | Telefonica Deutschland Holding AG (b) | | 37,474 |
| 2,050 | | United Internet AG (b) | | 38,322 |
| 675 | | Vonovia SE (b) | | 14,568 |
| | | | | 1,213,619 |
| | | Greece – 0.0% | | |
| 281 | | Hellenic Telecommunications Organization S.A. (b) | | 4,080 |
| 23 | | OPAP S.A. (b) | | 276 |
| | | | | 4,356 |
| | | Hong Kong – 2.0% | | |
| 7,851 | | AIA Group Ltd. (b) | | 65,367 |
| 1,870 | | CLP Holdings, Ltd. (b) | | 14,133 |
| 3,111 | | Galaxy Entertainment Group Ltd. (b) | | 18,286 |
| 5,838 | | Hang Lung Properties Ltd. (b) | | 9,587 |
| 4,224 | | Hang Seng Bank Ltd. (b) | | 64,173 |
See Notes to Financial Statements
Page 19
Developed International Equity Select ETF (RNDM)
Portfolio of Investments (Continued)
September 30, 2022 (Unaudited)
| Shares | | Description | | Value |
| COMMON STOCKS (a) (Continued) |
| | | Hong Kong (Continued) | | |
| 2,782 | | Henderson Land Development Co., Ltd. (b) | | $7,790 |
| 14,417 | | Hong Kong & China Gas Co., Ltd. (b) | | 12,699 |
| 1,715 | | Hong Kong Exchanges & Clearing Ltd. (b) | | 58,623 |
| 1,902 | | MTR Corp., Ltd. (b) | | 8,724 |
| 3,393 | | New World Development Co., Ltd. (b) | | 9,637 |
| 2,419 | | Power Assets Holdings Ltd. (b) | | 12,126 |
| 8,905 | | Sino Land Co., Ltd. (b) | | 11,713 |
| 966 | | Sun Hung Kai Properties Ltd. (b) | | 10,661 |
| 1,640 | | Swire Pacific Ltd., Class A (b) | | 12,258 |
| 1,158 | | Techtronic Industries Co., Ltd. (b) | | 11,050 |
| | | | | 326,827 |
| | | Ireland – 0.8% | | |
| 2,142 | | AIB Group PLC (b) | | 5,213 |
| 739 | | Bank of Ireland Group PLC (b) | | 4,740 |
| 694 | | CRH PLC (b) | | 22,313 |
| 1,043 | | DCC PLC (b) | | 54,166 |
| 190 | | Kerry Group PLC, Class A (b) | | 16,935 |
| 282 | | Kingspan Group PLC (b) | | 12,705 |
| 255 | | Ryanair Holdings PLC, ADR (f) | | 14,897 |
| | | | | 130,969 |
| | | Israel – 0.5% | | |
| 46 | | Azrieli Group Ltd. (b) | | 3,139 |
| 1,072 | | Bank Hapoalim BM (b) | | 9,049 |
| 986 | | Bank Leumi Le-Israel BM (b) | | 8,421 |
| 27 | | Elbit Systems Ltd. (b) | | 5,112 |
| 786 | | ICL Group Ltd. (b) | | 6,299 |
| 1,706 | | Israel Discount Bank Ltd., Class A (b) | | 8,590 |
| 272 | | Mizrahi Tefahot Bank Ltd. (b) | | 9,523 |
| 78 | | Nice, Ltd. (b) (f) | | 14,678 |
| 1,395 | | Teva Pharmaceutical Industries Ltd. (b) (f) | | 11,132 |
| | | | | 75,943 |
| | | Italy – 1.6% | | |
| 9,639 | | A2A S.p.A. (b) | | 9,364 |
| 126 | | Amplifon S.p.A. (b) | | 3,283 |
| 958 | | Assicurazioni Generali S.p.A. (b) | | 13,081 |
| 472 | | Atlantia S.p.A. (b) | | 10,415 |
| 2,566 | | Banca Mediolanum S.p.A. (b) | | 16,069 |
| 232 | | De’ Longhi S.p.A. (b) | | 3,391 |
| 2,467 | | Enel S.p.A. (b) | | 10,118 |
| 2,458 | | Eni S.p.A. (b) | | 26,125 |
| 1,440 | | FinecoBank Banca Fineco S.p.A. (b) | | 17,785 |
| 4,478 | | Hera S.p.A. (b) | | 9,515 |
| 1,144 | | Infrastrutture Wireless Italiane S.p.A. (b) (c) (d) | | 9,981 |
| Shares | | Description | | Value |
|
| | | Italy (Continued) | | |
| 195 | | Interpump Group S.p.A. (b) | | $6,307 |
| 9,553 | | Intesa Sanpaolo S.p.A. (b) | | 15,791 |
| 2,571 | | Italgas S.p.A. (b) | | 11,939 |
| 2,159 | | Mediobanca Banca di Credito Finanziario S.p.A. (b) | | 16,893 |
| 113 | | Moncler S.p.A. (b) | | 4,613 |
| 849 | | Nexi S.P.A (b) (c) (d) (f) | | 6,858 |
| 1,163 | | Pirelli & C S.p.A. (b) (c) (d) | | 3,788 |
| 1,929 | | Poste Italiane S.p.A. (b) (c) (d) | | 14,574 |
| 288 | | Prysmian S.p.A. (b) | | 8,249 |
| 110 | | Recordati Industria Chimica e Farmaceutica S.p.A. (b) | | 4,026 |
| 6,243 | | Snam S.p.A. (b) | | 25,234 |
| 1,926 | | Terna-Rete Elettrica Nazionale S.p.A. (b) | | 11,730 |
| | | | | 259,129 |
| | | Japan – 19.5% | | |
| 900 | | Chubu Electric Power Co., Inc. (b) | | 8,094 |
| 14,300 | | Hitachi Metals Ltd. (b) (f) | | 215,140 |
| 33,900 | | Japan Post Holdings Co., Ltd. (b) | | 224,595 |
| 2,600 | | Japan Tobacco, Inc. (b) | | 42,725 |
| 1,000 | | Kansai Electric Power (The) Co., Inc. (b) | | 8,366 |
| 1,100 | | Kao Corp. (b) | | 44,759 |
| 3,000 | | KDDI Corp. (b) | | 87,709 |
| 3,000 | | Kirin Holdings Co., Ltd. (b) | | 46,217 |
| 800 | | MEIJI Holdings Co., Ltd. (b) (g) | | 35,512 |
| 1,700 | | Mitsubishi Estate Co., Ltd. (b) | | 22,400 |
| 19,800 | | Mizuho Financial Group, Inc. (b) | | 214,328 |
| 3,300 | | Nippon Telegraph & Telephone Corp. (b) | | 89,009 |
| 600 | | Nissin Foods Holdings Co., Ltd. (b) | | 41,706 |
| 600 | | Osaka Gas Co., Ltd. (b) | | 9,046 |
| 8,300 | | Secom Co., Ltd. (b) | | 473,259 |
| 31,500 | | Sekisui House Ltd. (b) | | 521,712 |
| 8,300 | | Softbank Corp. (b) | | 82,883 |
| 14,400 | | Takeda Pharmaceutical Co., Ltd. (b) | | 373,936 |
| 300 | | Tokyo Gas Co., Ltd. (b) | | 5,064 |
| 36,600 | | USS Co., Ltd. (b) | | 565,255 |
| | | | | 3,111,715 |
| | | Jersey – 0.4% | | |
| 598 | | Ferguson PLC (b) | | 62,030 |
| | | Luxembourg – 0.1% | | |
| 417 | | ArcelorMittal S.A. (b) | | 8,298 |
| | | Netherlands – 4.1% | | |
| 443 | | Aalberts N.V. (b) | | 14,448 |
| 1,510 | | ABN AMRO Bank N.V. (b) (c) (d) | | 13,530 |
Page 20
See Notes to Financial Statements
Developed International Equity Select ETF (RNDM)
Portfolio of Investments (Continued)
September 30, 2022 (Unaudited)
| Shares | | Description | | Value |
| COMMON STOCKS (a) (Continued) |
| | | Netherlands (Continued) | | |
| 11 | | Adyen N.V. (b) (c) (d) (f) | | $13,719 |
| 3,657 | | Aegon N.V. (b) | | 14,536 |
| 158 | | Akzo Nobel N.V. (b) | | 8,954 |
| 58 | | Argenx SE (b) (f) | | 20,641 |
| 240 | | ASM International N.V. (b) | | 53,738 |
| 131 | | ASML Holding N.V. (b) | | 54,270 |
| 416 | | ASR Nederland N.V. (b) | | 15,992 |
| 1,025 | | BE Semiconductor Industries N.V. (b) | | 43,881 |
| 683 | | Davide Campari-Milano N.V. (b) | | 6,043 |
| 624 | | Euronext N.V. (b) (c) (d) | | 39,491 |
| 371 | | Heineken Holding N.V. (b) | | 25,398 |
| 305 | | Heineken N.V. (b) | | 26,636 |
| 79 | | IMCD N.V. (b) | | 9,366 |
| 1,897 | | ING Groep N.V. (b) | | 16,254 |
| 907 | | Koninklijke Ahold Delhaize N.V. (b) | | 23,103 |
| 163 | | Koninklijke DSM N.V. (b) | | 18,548 |
| 3,378 | | Koninklijke KPN N.V. (b) | | 9,142 |
| 1,073 | | Koninklijke Philips N.V. (b) | | 16,520 |
| 383 | | NN Group N.V. (b) | | 14,896 |
| 379 | | OCI N.V. (b) | | 13,876 |
| 1,643 | | Prosus N.V. (b) | | 85,480 |
| 377 | | Randstad N.V. (b) | | 16,272 |
| 486 | | Signify N.V. (b) (c) (d) | | 12,508 |
| 635 | | Wolters Kluwer N.V. (b) | | 61,832 |
| | | | | 649,074 |
| | | New Zealand – 0.2% | | |
| 2,714 | | Auckland International Airport Ltd. (b) (f) | | 10,879 |
| 305 | | EBOS Group Ltd. (b) | | 6,420 |
| 519 | | Fisher & Paykel Healthcare Corp., Ltd. (b) | | 5,379 |
| 2,387 | | Spark New Zealand Ltd. (b) | | 6,678 |
| 155 | | Xero Ltd. (b) (f) | | 7,173 |
| | | | | 36,529 |
| | | Norway – 0.8% | | |
| 283 | | Adevinta ASA (b) (f) | | 1,686 |
| 90 | | Aker ASA, Class A (b) | | 5,816 |
| 769 | | Aker BP ASA (b) | | 22,074 |
| 366 | | DNB Bank ASA (b) | | 5,808 |
| 774 | | Equinor ASA (b) | | 25,526 |
| 335 | | Gjensidige Forsikring ASA (b) | | 5,748 |
| 139 | | Kongsberg Gruppen ASA (b) | | 4,218 |
| 803 | | Leroy Seafood Group ASA (b) | | 3,167 |
| 274 | | Mowi ASA (b) | | 3,485 |
| 167 | | Nordic Semiconductor ASA (b) (f) | | 2,206 |
| 1,291 | | Norsk Hydro ASA (b) | | 6,927 |
| 831 | | Orkla ASA (b) | | 6,041 |
| 91 | | Salmar ASA (b) | | 3,067 |
| 174 | | Schibsted ASA, Class A (b) | | 2,348 |
| 827 | | Storebrand ASA (b) | | 5,725 |
| Shares | | Description | | Value |
|
| | | Norway (Continued) | | |
| 823 | | Telenor ASA (b) | | $7,532 |
| 214 | | TOMRA Systems ASA (b) | | 3,776 |
| 243 | | Yara International ASA (b) | | 8,528 |
| | | | | 123,678 |
| | | Portugal – 0.2% | | |
| 3,345 | | EDP - Energias de Portugal S.A. (b) | | 14,517 |
| 594 | | Galp Energia SGPS S.A. (b) | | 5,715 |
| 314 | | Jeronimo Martins SGPS S.A. (b) | | 5,848 |
| | | | | 26,080 |
| | | Singapore – 1.2% | | |
| 1,500 | | DBS Group Holdings Ltd. (b) | | 34,700 |
| 7,500 | | Genting Singapore Ltd. (b) | | 4,076 |
| 200 | | Jardine Cycle & Carriage Ltd. (b) | | 4,678 |
| 1,800 | | Keppel Corp., Ltd. (b) | | 8,661 |
| 4,600 | | Oversea-Chinese Banking Corp., Ltd. (b) | | 37,692 |
| 1,100 | | Singapore Airlines Ltd. (b) (f) | | 3,888 |
| 5,500 | | Singapore Exchange Ltd. (b) | | 36,082 |
| 3,800 | | Singapore Technologies Engineering Ltd. (b) | | 9,441 |
| 9,900 | | Singapore Telecommunications Ltd. (b) | | 18,268 |
| 1,700 | | United Overseas Bank Ltd. (b) | | 30,791 |
| 3,500 | | Wilmar International Ltd. (b) | | 9,311 |
| | | | | 197,588 |
| | | South Korea – 4.3% | | |
| 318 | | Hana Financial Group, Inc. (b) | | 7,809 |
| 134 | | Hyundai Glovis Co., Ltd. (b) | | 15,082 |
| 163 | | Hyundai Mobis Co., Ltd. (b) | | 21,517 |
| 198 | | Hyundai Motor Co. (b) | | 24,164 |
| 1,426 | | Industrial Bank of Korea (b) | | 9,430 |
| 254 | | KB Financial Group, Inc. (b) | | 7,670 |
| 479 | | Kia Corp. (b) | | 23,841 |
| 353 | | Korea Electric Power Corp. (b) (f) | | 4,918 |
| 135 | | Korea Zinc Co., Ltd. (b) | | 55,818 |
| 1,174 | | Korean Air Lines Co., Ltd. (b) (f) | | 17,914 |
| 702 | | KT Corp., ADR | | 8,578 |
| 151 | | KT&G Corp. (b) | | 9,117 |
| 14 | | LG H&H Co. Ltd. (b) | | 6,136 |
| 1,808 | | Mirae Asset Securities Co., Ltd. (b) | | 7,485 |
| 442 | | NAVER Corp. (b) | | 58,882 |
| 227 | | Samsung C&T Corp. (b) | | 16,266 |
| 2,162 | | Samsung Electronics Co., Ltd. (b) | | 79,387 |
| 71 | | Samsung Fire & Marine Insurance Co., Ltd. (b) | | 9,081 |
| 235 | | Samsung Life Insurance Co., Ltd. (b) | | 10,179 |
See Notes to Financial Statements
Page 21
Developed International Equity Select ETF (RNDM)
Portfolio of Investments (Continued)
September 30, 2022 (Unaudited)
| Shares | | Description | | Value |
| COMMON STOCKS (a) (Continued) |
| | | South Korea (Continued) | | |
| 251 | | Samsung SDI Co., Ltd. (b) | | $94,412 |
| 1,087 | | Samsung SDS Co., Ltd. (b) | | 86,567 |
| 371 | | Shinhan Financial Group Co., Ltd. (b) | | 8,618 |
| 222 | | SK Telecom Co., Ltd. (b) | | 7,837 |
| 622 | | SK, Inc. (b) | | 82,584 |
| 1,008 | | Woori Financial Group, Inc. (b) | | 7,481 |
| | | | | 680,773 |
| | | Spain – 2.4% | | |
| 51 | | Acciona S.A. (b) | | 8,964 |
| 374 | | ACS Actividades de Construccion y Servicios S.A. (b) | | 8,404 |
| 59 | | Aena SME S.A. (b) (c) (d) (f) | | 6,123 |
| 547 | | Amadeus IT Group S.A. (b) (f) | | 25,360 |
| 5,030 | | Banco Bilbao Vizcaya Argentaria S.A. (b) | | 22,564 |
| 8,454 | | Banco Santander S.A. (b) | | 19,672 |
| 4,923 | | Bankinter S.A. (b) | | 27,642 |
| 8,518 | | CaixaBank S.A. (b) | | 27,435 |
| 714 | | Cellnex Telecom S.A. (b) (c) (d) | | 22,024 |
| 542 | | Enagas S.A. (b) | | 8,390 |
| 1,283 | | Endesa S.A. (b) | | 19,270 |
| 382 | | Ferrovial S.A. (b) | | 8,671 |
| 347 | | Fluidra S.A. (b) | | 5,203 |
| 570 | | Grifols S.A. (b) (f) | | 4,924 |
| 2,562 | | Iberdrola S.A. (b) | | 23,889 |
| 1,434 | | Industria de Diseno Textil S.A. (b) | | 29,593 |
| 13,794 | | Mapfre S.A. (b) | | 21,363 |
| 936 | | Naturgy Energy Group S.A. (b) | | 21,653 |
| 1,366 | | Red Electrica Corp. S.A. (b) | | 20,962 |
| 918 | | Repsol S.A. (b) | | 10,548 |
| 686 | | Siemens Gamesa Renewable Energy S.A. (b) (f) | | 11,960 |
| 7,107 | | Telefonica S.A. (b) | | 23,495 |
| | | | | 378,109 |
| | | Sweden – 3.0% | | |
| 538 | | AAK AB (b) | | 7,113 |
| 1,263 | | Alfa Laval AB (b) | | 31,319 |
| 1,614 | | Assa Abloy AB, Class B (b) | | 30,240 |
| 3,403 | | Atlas Copco AB, Class A (b) | | 31,629 |
| 307 | | Axfood AB (b) | | 7,034 |
| 713 | | Castellum AB (b) | | 7,989 |
| 1,698 | | Electrolux AB, Class B (b) | | 17,648 |
| 2,032 | | Epiroc AB, Class A (b) | | 29,069 |
| 424 | | Essity AB, Class B (b) | | 8,377 |
| 1,192 | | Fabege AB (b) | | 8,097 |
| 2,958 | | Hexagon AB, Class B (b) | | 27,625 |
| 459 | | Holmen AB, Class B (b) | | 17,418 |
| 985 | | Industrivarden AB, Class C (b) | | 19,645 |
| 1,259 | | Investor AB, Class B (b) | | 18,370 |
| Shares | | Description | | Value |
|
| | | Sweden (Continued) | | |
| 539 | | L E Lundbergforetagen AB, Class B (b) | | $19,458 |
| 2,537 | | Skandinaviska Enskilda Banken AB, Class A (b) | | 24,179 |
| 1,944 | | Skanska AB, Class B (b) | | 24,195 |
| 1,326 | | Svenska Cellulosa AB SCA, Class B (b) | | 16,825 |
| 2,991 | | Svenska Handelsbanken AB, Class A (b) | | 24,553 |
| 1,843 | | Swedbank AB, Class A (b) | | 24,191 |
| 1,328 | | Swedish Match AB (b) | | 13,136 |
| 2,115 | | Tele2 AB, Class B (b) | | 18,251 |
| 7,291 | | Telia Co., AB (b) | | 20,999 |
| 2,327 | | Volvo AB, Class B (b) | | 32,929 |
| | | | | 480,289 |
| | | Switzerland – 10.3% | | |
| 1,395 | | ABB Ltd. (b) | | 36,018 |
| 314 | | Baloise Holding AG (b) | | 40,121 |
| 647 | | Banque Cantonale Vaudoise (b) | | 61,211 |
| 54 | | Barry Callebaut AG (b) | | 101,791 |
| 25 | | BKW AG (b) | | 2,979 |
| 10 | | Chocoladefabriken Lindt & Spruengli AG (b) | | 96,643 |
| 542 | | DKSH Holding AG (b) | | 39,326 |
| 112 | | Emmi AG (b) | | 87,014 |
| 27 | | EMS-Chemie Holding AG (b) | | 17,044 |
| 74 | | Geberit AG (b) | | 31,730 |
| 6 | | Givaudan S.A. (b) | | 18,126 |
| 430 | | Helvetia Holding AG (b) | | 40,293 |
| 931 | | Holcim AG (b) | | 38,153 |
| 943 | | Nestle S.A. (b) | | 101,992 |
| 4,562 | | Novartis AG (b) | | 347,793 |
| 65 | | PSP Swiss Property AG (b) | | 6,498 |
| 1,011 | | Roche Holding AG (b) | | 329,114 |
| 214 | | Schindler Holding AG (b) | | 33,213 |
| 327 | | SFS Group AG (b) | | 28,111 |
| 16 | | SGS S.A. (b) | | 34,236 |
| 87 | | Swiss Life Holding AG (b) | | 38,438 |
| 86 | | Swiss Prime Site AG (b) | | 6,850 |
| 587 | | Swiss Re AG (b) | | 43,294 |
| 32 | | Swisscom AG (b) | | 14,984 |
| 114 | | Zurich Insurance Group AG (b) | | 45,446 |
| | | | | 1,640,418 |
| | | United Kingdom – 9.9% | | |
| 30,627 | | Aviva PLC (b) | | 131,354 |
| 8,618 | | BAE Systems PLC (b) | | 75,721 |
| 3,360 | | Berkeley Group Holdings PLC (b) | | 122,759 |
| 2,089 | | British American Tobacco PLC (b) | | 74,906 |
| 2,083 | | Bunzl PLC (b) | | 63,642 |
| 1,727 | | Diageo PLC (b) | | 72,696 |
Page 22
See Notes to Financial Statements
Developed International Equity Select ETF (RNDM)
Portfolio of Investments (Continued)
September 30, 2022 (Unaudited)
| Shares | | Description | | Value |
| COMMON STOCKS (a) (Continued) |
| | | United Kingdom (Continued) | | |
| 49,729 | | Direct Line Insurance Group PLC (b) | | $102,599 |
| 18,343 | | GSK PLC (b) | | 264,923 |
| 4,144 | | Imperial Brands PLC (b) | | 85,213 |
| 2,003 | | National Grid PLC (b) | | 20,619 |
| 22,281 | | Phoenix Group Holdings PLC (b) | | 129,761 |
| 1,144 | | Reckitt Benckiser Group PLC (b) | | 75,826 |
| 5,273 | | RELX PLC (b) | | 128,850 |
| 2,666 | | Sage Group (The) PLC (b) | | 20,546 |
| 766 | | Severn Trent PLC (b) | | 20,024 |
| 1,344 | | SSE PLC (b) | | 22,695 |
| 24,182 | | Tesco PLC (b) | | 55,499 |
| 1,934 | | Unilever PLC (b) | | 84,980 |
| 2,090 | | United Utilities Group PLC (b) | | 20,637 |
| | | | | 1,573,250 |
| | | United States – 0.1% | | |
| 337 | | Autoliv, Inc., SDR (b) | | 22,744 |
| | | Total Common Stocks | | 15,533,619 |
| | | (Cost $19,439,816) | | |
| REAL ESTATE INVESTMENT TRUSTS (a) – 1.7% |
| | | Australia – 0.4% | | |
| 2,415 | | Dexus (b) | | 12,013 |
| 1,155 | | Goodman Group (b) | | 11,673 |
| 5,106 | | GPT (The) Group (b) | | 12,567 |
| 10,622 | | Mirvac Group (b) | | 13,232 |
| 6,194 | | Stockland (b) | | 12,963 |
| | | | | 62,448 |
| | | Belgium – 0.0% | | |
| 179 | | Warehouses De Pauw CVA (b) | | 4,396 |
| | | Canada – 0.1% | | |
| 222 | | Granite Real Estate Investment Trust | | 10,715 |
| 848 | | RioCan Real Estate Investment Trust | | 11,430 |
| | | | | 22,145 |
| | | France – 0.1% | | |
| 171 | | Gecina S.A. (b) | | 13,393 |
| | | Hong Kong – 0.1% | | |
| 1,408 | | Link REIT (b) | | 9,829 |
| | | Japan – 0.6% | | |
| 9 | | Daiwa House REIT Investment Corp. (b) | | 18,796 |
| 16 | | GLP J-REIT (b) | | 17,745 |
| 3 | | Japan Real Estate Investment Corp. (b) | | 12,376 |
| 6 | | Nippon Building Fund, Inc. (b) | | 26,403 |
| Shares | | Description | | Value |
|
| | | Japan (Continued) | | |
| 19 | | Nomura Real Estate Master Fund, Inc. (b) | | $21,000 |
| | | | | 96,320 |
| | | Multinational – 0.0% | | |
| 129 | | Unibail-Rodamco-Westfield (b) (f) | | 5,338 |
| | | Singapore – 0.2% | | |
| 4,200 | | CapitaLand Ascendas REIT (b) | | 7,835 |
| 5,401 | | CapitaLand Integrated Commercial Trust (b) | | 7,184 |
| 4,600 | | Mapletree Industrial Trust (b) | | 7,612 |
| 6,600 | | Mapletree Logistics Trust (b) | | 7,131 |
| | | | | 29,762 |
| | | Spain – 0.0% | | |
| 414 | | Merlin Properties Socimi S.A. (b) | | 3,195 |
| | | United Kingdom – 0.2% | | |
| 343 | | Derwent London PLC (b) | | 7,738 |
| 817 | | Segro PLC (b) | | 6,817 |
| 4,547 | | Tritax Big Box REIT PLC (b) | | 6,862 |
| 950 | | UNITE Group (The) PLC (b) | | 9,019 |
| | | | | 30,436 |
| | | Total Real Estate Investment Trusts | | 277,262 |
| | | (Cost $377,060) | | |
| MONEY MARKET FUNDS – 0.2% |
| 33,624 | | Goldman Sachs Financial Square Treasury Obligations Fund - Institutional Class - 2.77% (h) (i) | | 33,624 |
| | | (Cost $33,624) | | |
| | | Total Investments – 99.2% | | 15,844,505 |
| | | (Cost $19,850,500) | | |
| | | Net Other Assets and Liabilities – 0.8% | | 120,821 |
| | | Net Assets – 100.0% | | $15,965,326 |
| (a) | Portfolio securities are categorized based upon their country of incorporation, which can be different from the country categorization of the Fund’s underlying index. For a breakdown of the portfolio securities by sector, please see the Fund Performance Overview. |
See Notes to Financial Statements
Page 23
Developed International Equity Select ETF (RNDM)
Portfolio of Investments (Continued)
September 30, 2022 (Unaudited)
| (b) | This security is fair valued by the Advisor’s Pricing Committee in accordance with procedures approved by the Trust’s Board of Trustees and in accordance with provisions of the Investment Company Act of 1940 and rules thereunder, as amended. At September 30, 2022, securities noted as such are valued at $14,333,871 or 89.8% of net assets. Certain of these securities are fair valued using a factor provided by a third-party pricing service due to the change in value between the foreign markets’ close and the New York Stock Exchange close exceeding a certain threshold. On days when this threshold is not exceeded, these securities are typically valued at the last sale price on the exchange on which they are principally traded. |
| (c) | This security may be resold to qualified foreign investors and foreign institutional buyers under Regulation S of the Securities Act of 1933, as amended (the “1933 Act”). |
| (d) | This security is exempt from registration upon resale under Rule 144A of the 1933 Act and may be resold in transactions exempt from registration, normally to qualified institutional buyers. This security is not restricted on the foreign exchange where it trades freely without any additional registration. As such, it does not require the additional disclosure required of restricted securities. |
| (e) | Pursuant to procedures adopted by the Trust’s Board of Trustees, this security has been determined to be illiquid by First Trust Advisors L.P., the Fund’s advisor. |
| (f) | Non-income producing security. |
| (g) | All or a portion of this security is on loan (see Note 2E - Securities Lending in the Notes to Financial Statements). The remaining contractual maturity of all of the securities lending transactions is overnight and continuous. The aggregate value of such securities is $31,961 and the total value of the collateral held by the Fund is $33,624. |
| (h) | Rate shown reflects yield as of September 30, 2022. |
| (i) | This security serves as collateral for securities on loan. |
| ADR | American Depositary Receipt |
| SDR | Swedish Depositary Receipt |
Offsetting Assets and Liabilities
Offsetting assets and liabilities requires entities to disclose both gross and net information about instruments and transactions eligible for offset, and to disclose instruments and transactions subject to master netting or similar agreements (see Note 2D – Offsetting on the Statements of Assets and Liabilities in the Notes to Financial Statements).
The Fund’s loaned securities were all subject to an enforceable Securities Lending Agency Agreement. Securities lent in accordance with the Securities Lending Agency Agreement on a gross basis were as follows:
| Securities Lending Agency Agreement | |
| Total gross amount presented on the Statements of Assets and Liabilities (1) | $31,961 |
| Non-cash Collateral (2) | (31,961) |
| Net Amount | $— |
| (1) | The amount presented on the Statements of Assets and Liabilities, which is included in “Investments, at value,” is not offset and is shown on a gross basis. |
| (2) | At September 30, 2022, the value of the collateral received from each borrower exceeded the value of the related securities loaned. This amount is disclosed on the Portfolio of Investments. |
Currency Exposure
Diversification | % of Total
Investments |
| Euro | 27.7% |
| Japanese Yen | 20.3 |
| British Pound Sterling | 10.9 |
| Swiss Franc | 10.4 |
| Canadian Dollar | 9.1 |
| Australian Dollar | 6.0 |
| South Korean Won | 4.2 |
| Swedish Krona | 3.4 |
| Hong Kong Dollar | 2.6 |
| Danish Krone | 2.2 |
| Singapore Dollar | 1.4 |
| Norwegian Krone | 0.8 |
| Israeli Shekel | 0.5 |
| United States Dollar | 0.3 |
| New Zealand Dollar | 0.2 |
| Total | 100.0% |
Page 24
See Notes to Financial Statements
Developed International Equity Select ETF (RNDM)
Portfolio of Investments (Continued)
September 30, 2022 (Unaudited)
Valuation Inputs
A summary of the inputs used to value the Fund’s investments as of September 30, 2022 is as follows (see Note 2A - Portfolio Valuation in the Notes to Financial Statements):
| | Total
Value at
9/30/2022 | Level 1
Quoted
Prices | Level 2
Significant
Observable
Inputs | Level 3
Significant
Unobservable
Inputs |
| Common Stocks: | | | | |
| Canada | $ 1,418,081 | $ 1,418,081 | $ — | $ — |
| Cayman Islands | 54,696 | — | 52,669 | 2,027 |
| Denmark | 354,027 | 13,309 | 340,718 | — |
| Ireland | 130,969 | 14,897 | 116,072 | — |
| South Korea | 680,773 | 8,578 | 672,195 | — |
| Other Country Categories* | 12,895,073 | — | 12,895,073 | — |
| Real Estate Investment Trusts: | | | | |
| Canada | 22,145 | 22,145 | — | — |
| Other Country Categories* | 255,117 | — | 255,117 | — |
| Money Market Funds | 33,624 | 33,624 | — | — |
| Total Investments | $ 15,844,505 | $ 1,510,634 | $ 14,331,844 | $ 2,027 |
| * | See Portfolio of Investments for country breakout. |
Level 3 investments are fair valued by the Advisor’s Pricing Committee and are footnoted in the Portfolio of Investments. The Level 3 investments values are based on unobservable and non-quantitative inputs.
See Notes to Financial Statements
Page 25
Emerging Markets Equity Select ETF (RNEM)
Portfolio of Investments
September 30, 2022 (Unaudited)
| Shares | | Description | | Value |
| COMMON STOCKS (a) – 99.6% |
| | | Bermuda – 0.3% | | |
| 164 | | Credicorp Ltd. | | $20,139 |
| | | Brazil – 10.2% | | |
| 7,471 | | Ambev S.A. | | 21,522 |
| 5,109 | | Atacadao S.A. | | 18,308 |
| 13,276 | | Banco Bradesco S.A. (Preference Shares) | | 48,828 |
| 7,729 | | Banco do Brasil S.A. | | 55,191 |
| 7,272 | | Banco Santander Brasil S.A. | | 40,901 |
| 10,492 | | BB Seguridade Participacoes S.A. | | 51,679 |
| 949 | | Cia de Saneamento Basico do Estado de Sao Paulo | | 8,726 |
| 2,223 | | Cia de Saneamento do Parana | | 7,068 |
| 3,870 | | Cia Energetica de Minas Gerais (Preference Shares) | | 7,719 |
| 5,990 | | Cia Paranaense de Energia, Class B (Preference Shares) | | 7,307 |
| 35,317 | | Cosan S.A. | | 113,787 |
| 1,925 | | EDP - Energias do Brasil S.A. | | 7,790 |
| 928 | | Energisa S.A. | | 7,206 |
| 1,047 | | Engie Brasil Energia S.A. | | 7,475 |
| 1,664 | | Equatorial Energia S.A. | | 8,298 |
| 5,969 | | Hypera S.A. | | 48,964 |
| 9,759 | | Itau Unibanco Holding S.A. (Preference Shares) | | 50,764 |
| 24,947 | | Itausa S.A. (Preference Shares) | | 44,998 |
| 3,090 | | JBS S.A. | | 14,389 |
| 44,412 | | Klabin S.A. | | 149,430 |
| 12,704 | | Porto Seguro S.A. | | 49,762 |
| 4,806 | | Raia Drogasil S.A. | | 20,251 |
| 694 | | Telefonica Brasil S.A. | | 5,209 |
| 2,702 | | TIM S.A. | | 6,051 |
| 1,026 | | Transmissora Alianca de Energia Eletrica S.A. | | 7,408 |
| | | | | 809,031 |
| | | Cayman Islands – 4.4% | | |
| 10,333 | | China Mengniu Dairy Co., Ltd. (b) | | 40,847 |
| 64,866 | | ESR Group Ltd. (b) (c) (d) | | 163,162 |
| 11,833 | | Hengan International Group Co., Ltd. (b) | | 52,903 |
| 32,000 | | Tingyi Cayman Islands Holding Corp. (b) | | 55,108 |
| 60,666 | | Want Want China Holdings Ltd. (b) | | 39,619 |
| | | | | 351,639 |
| | | Chile – 1.0% | | |
| 120,959 | | Banco de Chile (b) | | 10,647 |
| 229,962 | | Banco Santander Chile | | 8,034 |
| 4,405 | | Cencosud S.A. (b) | | 5,572 |
| 49,356 | | Cia Sud Americana de Vapores S.A. (b) | | 3,401 |
| Shares | | Description | | Value |
|
| | | Chile (Continued) | | |
| 998 | | Empresas Copec S.A. | | $6,393 |
| 2,921 | | Falabella S.A. (b) | | 5,825 |
| 415 | | Sociedad Quimica y Minera de Chile S.A., Class B (Preference Shares) (b) | | 38,623 |
| | | | | 78,495 |
| | | China – 11.3% | | |
| 125,761 | | Agricultural Bank of China Ltd., Class H (b) | | 37,640 |
| 120,194 | | Bank of China Ltd., Class H (b) | | 39,255 |
| 66,897 | | Bank of Communications Co., Ltd., Class H (b) | | 35,267 |
| 95,534 | | China CITIC Bank Corp., Ltd., Class H (b) | | 37,912 |
| 64,598 | | China Construction Bank Corp., Class H (b) | | 37,286 |
| 127,000 | | China Everbright Bank Co., Ltd., Class H (b) | | 34,870 |
| 31,000 | | China Life Insurance Co., Ltd., Class H (b) | | 39,662 |
| 128,098 | | China Minsheng Banking Corp., Ltd., Class H (b) | | 36,629 |
| 341,999 | | China Petroleum & Chemical Corp., Class H (b) | | 146,043 |
| 223,999 | | China Railway Group Ltd., Class H (b) | | 110,008 |
| 733,331 | | China Tower Corp., Ltd., Class H (b) (c) (d) | | 78,350 |
| 63,466 | | Haitong Securities Co., Ltd., Class H (b) | | 33,562 |
| 31,467 | | Huatai Securities Co., Ltd., Class H (b) (c) (d) | | 34,510 |
| 78,398 | | Industrial & Commercial Bank of China Ltd., Class H (b) | | 36,777 |
| 17,233 | | New China Life Insurance Co., Ltd., Class H (b) | | 32,820 |
| 147,000 | | People’s Insurance Co. Group of China (The) Ltd., Class H (b) | | 42,589 |
| 48,000 | | PICC Property & Casualty Co., Ltd., Class H (b) | | 49,636 |
| 60,000 | | Postal Savings Bank of China Co., Ltd., Class H (b) (c) (d) | | 35,266 |
| | | | | 898,082 |
| | | Colombia – 0.1% | | |
| 1,822 | | Bancolombia S.A. (Preference Shares) | | 11,074 |
| | | Czech Republic – 0.2% | | |
| 400 | | CEZ A.S. | | 13,707 |
| 188 | | Komercni Banka A.S. (b) | | 4,702 |
| | | | | 18,409 |
Page 26
See Notes to Financial Statements
Emerging Markets Equity Select ETF (RNEM)
Portfolio of Investments (Continued)
September 30, 2022 (Unaudited)
| Shares | | Description | | Value |
| COMMON STOCKS (a) (Continued) |
| | | Egypt – 0.1% | | |
| 6,404 | | Commercial International Bank Egypt SAE (b) | | $8,222 |
| | | Hong Kong – 1.2% | | |
| 12,600 | | BOC Hong Kong Holdings Ltd. (b) | | 41,904 |
| 68,400 | | Guangdong Investment Ltd. (b) | | 54,639 |
| | | | | 96,543 |
| | | Hungary – 0.3% | | |
| 1,217 | | MOL Hungarian Oil & Gas PLC (b) | | 6,759 |
| 548 | | OTP Bank Nyrt (b) | | 9,997 |
| 323 | | Richter Gedeon Nyrt (b) | | 5,532 |
| | | | | 22,288 |
| | | India – 25.3% | | |
| 2,940 | | ACC Ltd. (b) | | 86,907 |
| 1,789 | | Bajaj Auto Ltd. (b) | | 77,190 |
| 9,038 | | Berger Paints India Ltd. (b) | | 68,209 |
| 605 | | Britannia Industries Ltd. (b) | | 28,469 |
| 3,787 | | Cipla Ltd. (b) | | 51,630 |
| 1,257 | | Colgate-Palmolive India Ltd. (b) | | 25,115 |
| 3,616 | | Dabur India Ltd. (b) | | 25,340 |
| 898 | | Dr. Reddy’s Laboratories Ltd. (b) | | 47,534 |
| 11,417 | | HCL Technologies Ltd. (b) | | 129,664 |
| 15,080 | | HDFC Bank Ltd. (b) | | 261,269 |
| 2,848 | | Hero MotoCorp Ltd. (b) | | 88,644 |
| 946 | | Hindustan Unilever Ltd. (b) | | 31,198 |
| 6,968 | | Infosys Ltd. (b) | | 119,448 |
| 7,736 | | ITC Ltd. (b) | | 31,441 |
| 3,578 | | Larsen & Toubro Ltd. (b) | | 80,774 |
| 3,849 | | Marico Ltd. (b) | | 25,338 |
| 100 | | MRF Ltd. (b) | | 99,878 |
| 112 | | Nestle India Ltd. (b) | | 26,269 |
| 61,136 | | Petronet LNG Ltd. (b) | | 149,482 |
| 4,304 | | Pidilite Industries Ltd. (b) | | 141,441 |
| 4,496 | | Reliance Industries Ltd. (b) | | 130,483 |
| 4,215 | | Sun Pharmaceutical Industries Ltd. (b) | | 48,952 |
| 3,553 | | Tata Consultancy Services Ltd. (b) | | 130,214 |
| 2,494 | | Tata Consumer Products Ltd. (b) | | 24,519 |
| 958 | | UltraTech Cement Ltd. (b) | | 73,280 |
| | | | | 2,002,688 |
| | | Indonesia – 3.7% | | |
| 25,742 | | Adaro Energy Indonesia Tbk PT (b) | | 6,638 |
| 37,511 | | Aneka Tambang Tbk (b) | | 4,753 |
| 50,142 | | Astra International Tbk PT (b) | | 21,699 |
| 74,905 | | Bank Central Asia Tbk PT (b) | | 41,815 |
| 75,616 | | Bank Mandiri Persero Tbk PT (b) | | 46,431 |
| Shares | | Description | | Value |
|
| | | Indonesia (Continued) | | |
| 72,408 | | Bank Negara Indonesia Persero Tbk PT (b) | | $42,351 |
| 128,190 | | Bank Rakyat Indonesia Persero Tbk PT (b) | | 37,518 |
| 25,435 | | Berkah Beton Sadaya Tbk PT | | 6,765 |
| 21,048 | | Bukit Asam Tbk PT (b) | | 5,732 |
| 20,205 | | Merdeka Copper Gold Tbk PT (b) (e) | | 5,201 |
| 25,821 | | Perusahaan Gas Negara Tbk PT (b) | | 2,957 |
| 16,064 | | Semen Indonesia Persero Tbk PT (b) | | 7,856 |
| 75,681 | | Telkom Indonesia Persero Tbk PT (b) | | 22,057 |
| 120,773 | | Tower Bersama Infrastructure Tbk PT (b) | | 22,378 |
| 4,181 | | United Tractors Tbk PT (b) | | 8,977 |
| 13,661 | | Vale Indonesia Tbk PT (b) (e) | | 5,695 |
| | | | | 288,823 |
| | | Luxembourg – 0.1% | | |
| 829 | | Allegro.eu S.A. (b) (c) (d) (e) | | 3,566 |
| | | Malaysia – 1.7% | | |
| 14,100 | | CIMB Group Holdings Bhd (b) | | 15,547 |
| 6,900 | | Genting Bhd (b) | | 6,640 |
| 10,900 | | Genting Malaysia Bhd (b) | | 6,532 |
| 5,400 | | Hartalega Holdings Bhd (b) | | 1,925 |
| 3,700 | | Hong Leong Bank Bhd (b) | | 16,331 |
| 4,300 | | IHH Healthcare Bhd (b) | | 5,451 |
| 5,300 | | Inari Amertron Bhd (b) | | 2,842 |
| 7,700 | | IOI Corp. Bhd (b) | | 6,240 |
| 1,300 | | Kuala Lumpur Kepong Bhd (b) | | 5,791 |
| 8,400 | | Malayan Banking Bhd (b) | | 15,514 |
| 11,600 | | Press Metal Aluminium Holdings Bhd (b) | | 10,046 |
| 16,100 | | Public Bank Bhd (b) | | 14,653 |
| 12,600 | | RHB Bank Bhd (b) | | 15,055 |
| 6,400 | | Sime Darby Plantation Bhd (b) | | 5,627 |
| 4,700 | | Tenaga Nasional Bhd (b) | | 8,148 |
| 13,700 | | Top Glove Corp. Bhd (b) | | 1,837 |
| | | | | 138,179 |
| | | Mexico – 4.1% | | |
| 22,157 | | Alfa S.A.B. de C.V., Class A | | 14,082 |
| 28,066 | | America Movil S.A.B. de C.V., Series L | | 23,120 |
| 2,510 | | Arca Continental S.A.B. de C.V. | | 18,073 |
| 10,073 | | Banco del Bajio S.A. (c) (d) | | 25,503 |
| 31,318 | | Cemex S.A.B. de C.V., Series CPO (e) | | 10,823 |
| 2,053 | | Fomento Economico Mexicano S.A.B. de C.V., Series UBD | | 12,877 |
| 1,357 | | Gruma S.A.B. de C.V., Class B | | 12,922 |
| 2,249 | | Grupo Aeroportuario del Centro Norte S.A.B. de C.V. | | 14,148 |
See Notes to Financial Statements
Page 27
Emerging Markets Equity Select ETF (RNEM)
Portfolio of Investments (Continued)
September 30, 2022 (Unaudited)
| Shares | | Description | | Value |
| COMMON STOCKS (a) (Continued) |
| | | Mexico (Continued) | | |
| 1,038 | | Grupo Aeroportuario del Pacifico S.A.B. de C.V., Class B | | $13,143 |
| 764 | | Grupo Aeroportuario del Sureste S.A.B. de C.V., Class B | | 15,022 |
| 5,652 | | Grupo Bimbo S.A.B. de C.V., Series A | | 19,861 |
| 3,678 | | Grupo Financiero Banorte S.A.B. de C.V., Class O | | 23,561 |
| 13,201 | | Grupo Financiero Inbursa S.A.B. de C.V., Class O (e) | | 20,956 |
| 8,358 | | Grupo Mexico S.A.B. de C.V., Series B | | 28,229 |
| 14,552 | | Grupo Televisa S.A.B., Series CPO | | 15,701 |
| 12,132 | | Kimberly-Clark de Mexico S.A.B. de C.V., Class A | | 16,120 |
| 6,376 | | Orbia Advance Corp. S.A.B. de C.V. | | 10,732 |
| 1,403 | | Sitios Latinoamerica S.A.B. de C.V. (e) | | 626 |
| 8,306 | | Wal-Mart de Mexico S.A.B. de C.V. | | 29,171 |
| | | | | 324,670 |
| | | Netherlands – 0.1% | | |
| 989 | | NEPI Rockcastle N.V. (b) | | 4,404 |
| 247 | | X5 Retail Group N.V., GDR (b) (c) (f) (g) | | 14 |
| | | | | 4,418 |
| | | Philippines – 1.4% | | |
| 39,710 | | Ayala Land, Inc. (b) | | 15,417 |
| 11,500 | | BDO Unibank, Inc. (b) | | 21,788 |
| 27,400 | | Converge Information and Communications Technology Solutions Inc. (b) (e) | | 6,091 |
| 9,710 | | International Container Terminal Services, Inc. (b) | | 25,896 |
| 2,080 | | SM Investments Corp. (b) | | 25,618 |
| 36,800 | | SM Prime Holdings, Inc. (b) | | 18,858 |
| | | | | 113,668 |
| | | Poland – 0.7% | | |
| 417 | | Bank Polska Kasa Opieki S.A. (b) | | 5,064 |
| 170 | | CD Projekt S.A. (b) | | 3,404 |
| 119 | | Dino Polska S.A. (b) (c) (d) (e) | | 7,208 |
| 287 | | KGHM Polska Miedz S.A. (b) | | 5,012 |
| 3 | | LPP S.A. (b) | | 4,680 |
| 1,992 | | PGE Polska Grupa Energetyczna S.A. (b) (e) | | 2,506 |
| 899 | | Polski Koncern Naftowy ORLEN S.A. (b) | | 9,651 |
| 1,182 | | Powszechna Kasa Oszczednosci Bank Polski S.A. (b) | | 5,164 |
| Shares | | Description | | Value |
|
| | | Poland (Continued) | | |
| 1,392 | | Powszechny Zaklad Ubezpieczen S.A. (b) | | $6,458 |
| 154 | | Santander Bank Polska S.A. (b) | | 6,073 |
| | | | | 55,220 |
| | | Russia – 0.0% | | |
| 7,696 | | Alrosa PJSC (b) (f) (g) | | 275 |
| 40,399 | | Credit Bank of Moscow PJSC (b) (e) (f) (g) | | 87 |
| 172,018 | | Inter RAO UES PJSC (b) (f) (g) | | 204 |
| 96 | | Magnit PJSC (b) (f) (g) | | 124 |
| 15,021 | | Magnitogorsk Iron & Steel Works PJSC (b) (f) (g) | | 302 |
| 47 | | MMC Norilsk Nickel PJSC (b) (f) (g) | | 391 |
| 2,140 | | Mobile TeleSystems PJSC (b) (f) (g) | | 209 |
| 1,668 | | Moscow Exchange MICEX-RTS PJSC (b) (e) (f) (g) | | 69 |
| 4,741 | | Novolipetsk Steel PJSC (b) (f) (g) | | 370 |
| 85 | | Polyus PJSC (b) (f) (g) | | 393 |
| 676 | | Severstal PAO (b) (f) (g) | | 396 |
| 10,776 | | Sistema PJSFC (b) (e) (f) (g) | | 56 |
| 3,253 | | Tatneft PJSC (b) (f) (g) | | 507 |
| | | | | 3,383 |
| | | South Africa – 2.9% | | |
| 1,708 | | Absa Group Ltd. (b) | | 16,591 |
| 814 | | Aspen Pharmacare Holdings Ltd. (b) | | 6,016 |
| 564 | | Bid Corp., Ltd. | | 8,688 |
| 615 | | Bidvest Group (The) Ltd. (b) | | 6,662 |
| 140 | | Capitec Bank Holdings Ltd. (b) | | 11,994 |
| 580 | | Clicks Group Ltd. | | 9,147 |
| 1,785 | | Discovery Ltd. (b) (e) | | 10,305 |
| 398 | | Exxaro Resources Ltd. (b) | | 4,420 |
| 4,198 | | FirstRand Ltd. (b) | | 14,014 |
| 596 | | Foschini Group (The) Ltd. (b) | | 3,874 |
| 406 | | Mr Price Group Ltd. (b) | | 3,868 |
| 1,531 | | MTN Group Ltd. (b) | | 10,102 |
| 2,209 | | MultiChoice Group | | 14,113 |
| 1,395 | | Nedbank Group Ltd. (b) | | 15,348 |
| 23,619 | | Old Mutual Ltd. (b) | | 12,692 |
| 3,786 | | Pepkor Holdings Ltd. (c) (d) | | 4,344 |
| 2,171 | | Remgro Ltd. (b) | | 15,927 |
| 4,505 | | Sanlam Ltd. (b) | | 12,743 |
| 757 | | Shoprite Holdings Ltd. (b) | | 9,038 |
| 1,786 | | Standard Bank Group Ltd. (b) | | 14,109 |
| 1,107 | | Tiger Brands Ltd. (b) | | 10,312 |
| 1,819 | | Vodacom Group Ltd. (b) | | 12,222 |
| 1,520 | | Woolworths Holdings Ltd. (b) | | 5,108 |
| | | | | 231,637 |
| | | Taiwan – 24.4% | | |
| 70,866 | | Asia Cement Corp. (b) | | 87,741 |
Page 28
See Notes to Financial Statements
Emerging Markets Equity Select ETF (RNEM)
Portfolio of Investments (Continued)
September 30, 2022 (Unaudited)
| Shares | | Description | | Value |
| COMMON STOCKS (a) (Continued) |
| | | Taiwan (Continued) | | |
| 73,886 | | Chang Hwa Commercial Bank Ltd. (b) | | $39,802 |
| 6,695 | | Chunghwa Telecom Co., Ltd. (b) | | 23,962 |
| 312,823 | | Compal Electronics, Inc. (b) | | 213,309 |
| 47,650 | | CTBC Financial Holding Co., Ltd. (b) | | 29,643 |
| 45,244 | | E.Sun Financial Holding Co., Ltd. (b) | | 36,608 |
| 11,569 | | Far EasTone Telecommunications Co., Ltd. (b) | | 26,323 |
| 50,226 | | First Financial Holding Co., Ltd. (b) | | 41,002 |
| 28,804 | | Formosa Chemicals & Fibre Corp. (b) | | 62,477 |
| 10,069 | | Highwealth Construction Corp. (b) | | 12,346 |
| 59,488 | | Hua Nan Financial Holdings Co., Ltd. (b) | | 41,502 |
| 339,420 | | Inventec Corp. (b) | | 244,001 |
| 33,471 | | Mega Financial Holding Co., Ltd. (b) | | 32,748 |
| 24,415 | | Nan Ya Plastics Corp. (b) | | 51,233 |
| 115,797 | | Pegatron Corp. (b) | | 212,535 |
| 2,721 | | President Chain Store Corp. (b) | | 24,143 |
| 94,945 | | Quanta Computer, Inc. (b) | | 229,831 |
| 76,897 | | SinoPac Financial Holdings Co., Ltd. (b) | | 41,724 |
| 71,719 | | Taishin Financial Holding Co., Ltd. (b) | | 30,832 |
| 113,053 | | Taiwan Business Bank (b) | | 44,668 |
| 75,917 | | Taiwan Cement Corp. (b) | | 80,853 |
| 48,830 | | Taiwan Cooperative Financial Holding Co., Ltd. (b) | | 40,203 |
| 8,098 | | Taiwan Mobile Co., Ltd. (b) | | 24,373 |
| 10,908 | | Uni-President Enterprises Corp. (b) | | 23,068 |
| 281,804 | | Wistron Corp. (b) | | 235,101 |
| | | | | 1,930,028 |
| | | Thailand – 5.3% | | |
| 2,800 | | Advanced Info Service PCL | | 14,475 |
| 7,600 | | Airports of Thailand PCL (e) | | 14,608 |
| 8,100 | | Bangkok Bank PCL (b) | | 29,283 |
| 17,900 | | Bangkok Dusit Medical Services PCL, Class F | | 13,999 |
| 58,000 | | Bangkok Expressway & Metro PCL | | 14,146 |
| 14,000 | | Berli Jucker PCL | | 12,155 |
| 78,100 | | BTS Group Holdings PCL | | 17,185 |
| 2,900 | | Bumrungrad Hospital PCL | | 17,452 |
| 23,300 | | Charoen Pokphand Foods PCL | | 15,443 |
| 8,600 | | CP ALL PCL (b) | | 12,716 |
| 4,800 | | Electricity Generating PCL | | 20,997 |
| 11,400 | | Global Power Synergy PCL, Class F | | 19,267 |
| Shares | | Description | | Value |
|
| | | Thailand (Continued) | | |
| 45,200 | | Home Product Center PCL | | $16,177 |
| 8,400 | | Intouch Holdings PCL, Class F | | 16,201 |
| 149,000 | | IRPC PCL | | 12,325 |
| 80,500 | | Krung Thai Bank PCL | | 35,640 |
| 82,400 | | Land & Houses PCL | | 19,442 |
| 15,000 | | Osotspa PCL | | 10,837 |
| 3,700 | | PTT Exploration & Production PCL | | 15,744 |
| 12,500 | | PTT Global Chemical PCL | | 13,753 |
| 21,200 | | PTT Oil & Retail Business PCL (b) | | 14,148 |
| 13,800 | | PTT PCL (b) | | 12,384 |
| 1,300 | | Siam Cement (The) PCL | | 11,235 |
| 32,000 | | Thai Beverage PCL (b) | | 13,322 |
| 11,100 | | Tisco Financial Group PCL | | 27,294 |
| | | | | 420,228 |
| | | Turkey – 0.8% | | |
| 6,558 | | Akbank T.A.S. (b) | | 3,989 |
| 701 | | Arcelik A.S. (b) | | 2,533 |
| 3,148 | | Aselsan Elektronik Sanayi Ve Ticaret A.S. (b) | | 4,966 |
| 1,113 | | BIM Birlesik Magazalar A.S. (b) | | 6,934 |
| 3,381 | | Eregli Demir ve Celik Fabrikalari T.A.S. (b) | | 5,272 |
| 142 | | Ford Otomotiv Sanayi A.S. (b) | | 2,501 |
| 2,713 | | Haci Omer Sabanci Holding A.S. (b) | | 3,764 |
| 2,172 | | KOC Holding A.S. (b) | | 5,287 |
| 545 | | Tofas Turk Otomobil Fabrikasi A.S. (b) | | 2,689 |
| 1,315 | | Turk Hava Yollari AO (b) (e) | | 4,993 |
| 2,943 | | Turkcell Iletisim Hizmetleri A.S. (b) | | 3,127 |
| 11,983 | | Turkiye Is Bankasi A.S., Class C (b) | | 4,826 |
| 402 | | Turkiye Petrol Rafinerileri A.S. (b) (e) | | 6,256 |
| 4,996 | | Turkiye Sise ve Cam Fabrikalari A.S. (b) | | 6,808 |
| | | | | 63,945 |
| | | Total Common Stocks | | 7,894,375 |
| | | (Cost $9,223,672) | | |
| REAL ESTATE INVESTMENT TRUSTS (a) – 0.2% |
| | | Mexico – 0.1% | | |
| 7,316 | | Fibra Uno Administracion S.A. de C.V. | | 7,527 |
See Notes to Financial Statements
Page 29
Emerging Markets Equity Select ETF (RNEM)
Portfolio of Investments (Continued)
September 30, 2022 (Unaudited)
| Shares | | Description | | Value |
| REAL ESTATE INVESTMENT TRUSTS (a) (Continued) |
| | | South Africa – 0.1% | | |
| 6,519 | | Growthpoint Properties Ltd. | | $4,246 |
| | | Total Real Estate Investment Trusts | | 11,773 |
| | | (Cost $15,680) | | |
| | | Total Investments – 99.8% | | 7,906,148 |
| | | (Cost $9,239,352) | | |
| | | Net Other Assets and Liabilities – 0.2% | | 18,547 |
| | | Net Assets – 100.0% | | $7,924,695 |
| (a) | Portfolio securities are categorized based upon their country of incorporation, which can be different from the country categorization of the Fund’s underlying index. For a breakdown of the portfolio securities by sector, please see the Fund Performance Overview. |
| (b) | This security is fair valued by the Advisor’s Pricing Committee in accordance with procedures approved by the Trust’s Board of Trustees and in accordance with provisions of the Investment Company Act of 1940 and rules thereunder, as amended. At September 30, 2022, securities noted as such are valued at $6,319,895 or 79.7% of net assets. Certain of these securities are fair valued using a factor provided by a third-party pricing service due to the change in value between the foreign markets’ close and the New York Stock Exchange close exceeding a certain threshold. On days when this threshold is not exceeded, these securities are typically valued at the last sale price on the exchange on which they are principally traded. |
| (c) | This security may be resold to qualified foreign investors and foreign institutional buyers under Regulation S of the Securities Act of 1933, as amended (the “1933 Act”). |
| (d) | This security is exempt from registration upon resale under Rule 144A of the 1933 Act and may be resold in transactions exempt from registration, normally to qualified institutional buyers. This security is not restricted on the foreign exchange where it trades freely without any additional registration. As such, it does not require the additional disclosure required of restricted securities. |
| (e) | Non-income producing security. |
| (f) | Pursuant to procedures adopted by the Trust’s Board of Trustees, this security has been determined to be illiquid by First Trust Advisors L.P., the Fund’s advisor. |
| (g) | This security’s value was determined using significant unobservable inputs (see Note 2A – Portfolio Valuation in the Notes to Financial Statements). |
| GDR | Global Depositary Receipt |
Currency Exposure
Diversification | % of Total
Investments |
| Indian Rupee | 25.3% |
| New Taiwan Dollar | 24.4 |
| Hong Kong Dollar | 17.0 |
| Brazilian Real | 10.2 |
| Thai Baht | 5.2 |
| Mexican Peso | 4.2 |
| Indonesian Rupiah | 3.7 |
| South African Rand | 3.0 |
| Malaysian Ringgit | 1.8 |
| Philippine Peso | 1.4 |
| Chilean Peso | 1.0 |
| Turkish Lira | 0.8 |
| Polish Zloty | 0.8 |
| Hungarian Forint | 0.3 |
| United States Dollar | 0.3 |
| Czech Republic Koruna | 0.2 |
| Singapore Dollar | 0.2 |
| Colombian Peso | 0.1 |
| Egyptian Pound | 0.1 |
| Russian Ruble | 0.0* |
| Total | 100.0% |
| * | Amount is less than 0.1%. |
Page 30
See Notes to Financial Statements
Emerging Markets Equity Select ETF (RNEM)
Portfolio of Investments (Continued)
September 30, 2022 (Unaudited)
Valuation Inputs
A summary of the inputs used to value the Fund’s investments as of September 30, 2022 is as follows (see Note 2A - Portfolio Valuation in the Notes to Financial Statements):
| | Total
Value at
9/30/2022 | Level 1
Quoted
Prices | Level 2
Significant
Observable
Inputs | Level 3
Significant
Unobservable
Inputs |
| Common Stocks: | | | | |
| Bermuda | $ 20,139 | $ 20,139 | $ — | $ — |
| Brazil | 809,031 | 809,031 | — | — |
| Chile | 78,495 | 14,427 | 64,068 | — |
| Colombia | 11,074 | 11,074 | — | — |
| Czech Republic | 18,409 | 13,707 | 4,702 | — |
| Indonesia | 288,823 | 6,765 | 282,058 | — |
| Mexico | 324,670 | 324,670 | — | — |
| Netherlands | 4,418 | — | 4,404 | 14 |
| Russia | 3,383 | — | — | 3,383 |
| South Africa | 231,637 | 36,292 | 195,345 | — |
| Other Country Categories* | 6,104,296 | — | 6,104,296 | — |
| Real Estate Investment Trusts* | 11,773 | 11,773 | — | — |
| Total Investments | $ 7,906,148 | $ 1,247,878 | $ 6,654,873 | $ 3,397 |
| * | See Portfolio of Investments for country breakout. |
Level 3 investments are fair valued by the Advisor’s Pricing Committee and are footnoted in the Portfolio of Investments. All level 3 investments values are based on unobservable and non-quantitative inputs.
See Notes to Financial Statements
Page 31
Large Cap US Equity Select ETF (RNLC)
Portfolio of Investments
September 30, 2022 (Unaudited)
| Shares | | Description | | Value |
| COMMON STOCKS – 96.9% |
| | | Aerospace & Defense – 1.3% | | |
| 156 | | General Dynamics Corp. | | $33,098 |
| 263 | | HEICO Corp. | | 37,867 |
| 143 | | L3Harris Technologies, Inc. | | 29,720 |
| 80 | | Lockheed Martin Corp. | | 30,903 |
| 72 | | Northrop Grumman Corp. | | 33,863 |
| 359 | | Raytheon Technologies Corp. | | 29,388 |
| 565 | | Textron, Inc. | | 32,917 |
| | | | | 227,756 |
| | | Air Freight & Logistics – 0.5% | | |
| 354 | | Expeditors International of Washington, Inc. | | 31,262 |
| 152 | | FedEx Corp. | | 22,567 |
| 189 | | United Parcel Service, Inc., Class B | | 30,531 |
| | | | | 84,360 |
| | | Automobiles – 0.4% | | |
| 6,167 | | Ford Motor Co. | | 69,070 |
| | | Banks – 2.7% | | |
| 1,055 | | Bank of America Corp. | | 31,861 |
| 714 | | Citigroup, Inc. | | 29,752 |
| 920 | | Citizens Financial Group, Inc. | | 31,611 |
| 977 | | Fifth Third Bancorp | | 31,225 |
| 228 | | First Republic Bank | | 29,765 |
| 2,729 | | Huntington Bancshares, Inc. | | 35,968 |
| 292 | | JPMorgan Chase & Co. | | 30,514 |
| 1,905 | | KeyCorp | | 30,518 |
| 206 | | M&T Bank Corp. | | 36,322 |
| 208 | | PNC Financial Services Group (The), Inc. | | 31,079 |
| 1,750 | | Regions Financial Corp. | | 35,123 |
| 183 | | Signature Bank | | 27,633 |
| 692 | | Truist Financial Corp. | | 30,130 |
| 713 | | US Bancorp | | 28,748 |
| 839 | | Wells Fargo & Co. | | 33,745 |
| | | | | 473,994 |
| | | Beverages – 1.1% | | |
| 548 | | Brown-Forman Corp., Class B | | 36,480 |
| 611 | | Coca-Cola (The) Co. | | 34,228 |
| 164 | | Constellation Brands, Inc., Class A | | 37,668 |
| 1,086 | | Keurig Dr. Pepper, Inc. | | 38,900 |
| 230 | | PepsiCo, Inc. | | 37,550 |
| | | | | 184,826 |
| | | Biotechnology – 1.3% | | |
| 525 | | AbbVie, Inc. | | 70,460 |
| 331 | | Amgen, Inc. | | 74,608 |
| 1,299 | | Gilead Sciences, Inc. | | 80,135 |
| | | | | 225,203 |
| Shares | | Description | | Value |
|
| | | Building Products – 0.8% | | |
| 968 | | Carrier Global Corp. | | $34,422 |
| 721 | | Johnson Controls International PLC | | 35,488 |
| 682 | | Masco Corp. | | 31,843 |
| 266 | | Trane Technologies PLC | | 38,519 |
| | | | | 140,272 |
| | | Capital Markets – 4.1% | | |
| 138 | | Ameriprise Financial, Inc. | | 34,769 |
| 787 | | Bank of New York Mellon (The) Corp. | | 30,315 |
| 54 | | BlackRock, Inc. | | 29,715 |
| 360 | | Blackstone, Inc. | | 30,132 |
| 1,037 | | Carlyle Group (The), Inc. | | 26,796 |
| 520 | | Charles Schwab (The) Corp. | | 37,373 |
| 161 | | CME Group, Inc. | | 28,518 |
| 85 | | FactSet Research Systems, Inc. | | 34,009 |
| 1,409 | | Franklin Resources, Inc. | | 30,322 |
| 111 | | Goldman Sachs Group (The), Inc. | | 32,529 |
| 349 | | Intercontinental Exchange, Inc. | | 31,532 |
| 709 | | KKR & Co., Inc. | | 30,487 |
| 178 | | LPL Financial Holdings, Inc. | | 38,890 |
| 121 | | Moody’s Corp. | | 29,416 |
| 432 | | Morgan Stanley | | 34,132 |
| 80 | | MSCI, Inc. | | 33,743 |
| 645 | | Nasdaq, Inc. | | 36,559 |
| 340 | | Northern Trust Corp. | | 29,090 |
| 367 | | Raymond James Financial, Inc. | | 36,267 |
| 98 | | S&P Global, Inc. | | 29,924 |
| 532 | | State Street Corp. | | 32,351 |
| 289 | | T Rowe Price Group, Inc. | | 30,348 |
| | | | | 707,217 |
| | | Chemicals – 1.7% | | |
| 62 | | Air Products and Chemicals, Inc. | | 14,429 |
| 72 | | Albemarle Corp. | | 19,040 |
| 127 | | Celanese Corp. | | 11,473 |
| 175 | | CF Industries Holdings, Inc. | | 16,844 |
| 709 | | Corteva, Inc. | | 40,519 |
| 290 | | Dow, Inc. | | 12,740 |
| 620 | | DuPont de Nemours, Inc. | | 31,248 |
| 166 | | Eastman Chemical Co. | | 11,794 |
| 98 | | Ecolab, Inc. | | 14,153 |
| 140 | | FMC Corp. | | 14,798 |
| 125 | | International Flavors & Fragrances, Inc. | | 11,354 |
| 171 | | LyondellBasell Industries N.V., Class A | | 12,873 |
| 317 | | Mosaic (The) Co. | | 15,321 |
| 302 | | PPG Industries, Inc. | | 33,428 |
| 154 | | Sherwin-Williams (The) Co. | | 31,532 |
| | | | | 291,546 |
Page 32
See Notes to Financial Statements
Large Cap US Equity Select ETF (RNLC)
Portfolio of Investments (Continued)
September 30, 2022 (Unaudited)
| Shares | | Description | | Value |
| COMMON STOCKS (Continued) |
| | | Commercial Services &
Supplies – 0.9% | | |
| 92 | | Cintas Corp. | | $35,714 |
| 169 | | Republic Services, Inc. | | 22,991 |
| 1,966 | | Rollins, Inc. | | 68,181 |
| 145 | | Waste Management, Inc. | | 23,230 |
| | | | | 150,116 |
| | | Communications Equipment – 1.3% | | |
| 2,628 | | Cisco Systems, Inc. | | 105,120 |
| 535 | | Motorola Solutions, Inc. | | 119,824 |
| | | | | 224,944 |
| | | Construction & Engineering – 0.2% | | |
| 275 | | Quanta Services, Inc. | | 35,032 |
| | | Construction Materials – 0.4% | | |
| 115 | | Martin Marietta Materials, Inc. | | 37,040 |
| 242 | | Vulcan Materials Co. | | 38,166 |
| | | | | 75,206 |
| | | Consumer Finance – 0.9% | | |
| 980 | | Ally Financial, Inc. | | 27,273 |
| 249 | | American Express Co. | | 33,593 |
| 332 | | Capital One Financial Corp. | | 30,601 |
| 347 | | Discover Financial Services | | 31,549 |
| 1,249 | | Synchrony Financial | | 35,209 |
| | | | | 158,225 |
| | | Containers & Packaging – 0.6% | | |
| 92 | | Avery Dennison Corp. | | 14,968 |
| 501 | | Ball Corp. | | 24,208 |
| 374 | | Crown Holdings, Inc. | | 30,305 |
| 358 | | International Paper Co. | | 11,349 |
| 251 | | Packaging Corp. of America | | 28,185 |
| | | | | 109,015 |
| | | Distributors – 1.2% | | |
| 516 | | Genuine Parts Co. | | 77,049 |
| 1,398 | | LKQ Corp. | | 65,916 |
| 195 | | Pool Corp. | | 62,051 |
| | | | | 205,016 |
| | | Diversified Financial Services – 0.2% | | |
| 677 | | Apollo Global Management, Inc. | | 31,481 |
| | | Diversified Telecommunication
Services – 1.0% | | |
| 5,347 | | AT&T, Inc. | | 82,023 |
| 2,208 | | Verizon Communications, Inc. | | 83,838 |
| | | | | 165,861 |
| Shares | | Description | | Value |
|
| | | Electric Utilities – 1.5% | | |
| 377 | | Alliant Energy Corp. | | $19,977 |
| 230 | | American Electric Power Co., Inc. | | 19,884 |
| 206 | | Duke Energy Corp. | | 19,162 |
| 350 | | Edison International | | 19,803 |
| 196 | | Entergy Corp. | | 19,723 |
| 339 | | Evergy, Inc. | | 20,137 |
| 262 | | Eversource Energy | | 20,426 |
| 488 | | Exelon Corp. | | 18,280 |
| 576 | | FirstEnergy Corp. | | 21,312 |
| 285 | | NextEra Energy, Inc. | | 22,347 |
| 815 | | PPL Corp. | | 20,660 |
| 310 | | Southern (The) Co. | | 21,080 |
| 313 | | Xcel Energy, Inc. | | 20,032 |
| | | | | 262,823 |
| | | Electrical Equipment – 0.8% | | |
| 314 | | AMETEK, Inc. | | 35,611 |
| 274 | | Eaton Corp. PLC | | 36,541 |
| 434 | | Emerson Electric Co. | | 31,777 |
| 173 | | Rockwell Automation, Inc. | | 37,214 |
| | | | | 141,143 |
| | | Electronic Equipment,
Instruments & Components – 3.2% | | |
| 2,229 | | Amphenol Corp., Class A | | 149,254 |
| 911 | | CDW Corp. | | 142,189 |
| 4,553 | | Corning, Inc. | | 132,128 |
| 1,268 | | TE Connectivity Ltd. | | 139,936 |
| | | | | 563,507 |
| | | Energy Equipment &
Services – 0.6% | | |
| 1,365 | | Baker Hughes Co. | | 28,610 |
| 1,256 | | Halliburton Co. | | 30,923 |
| 1,102 | | Schlumberger N.V. | | 39,562 |
| | | | | 99,095 |
| | | Entertainment – 0.4% | | |
| 565 | | Electronic Arts, Inc. | | 65,376 |
| | | Food & Staples Retailing – 1.4% | | |
| 143 | | Costco Wholesale Corp. | | 67,535 |
| 812 | | Kroger (The) Co. | | 35,525 |
| 453 | | Sysco Corp. | | 32,032 |
| 1,013 | | Walgreens Boots Alliance, Inc. | | 31,808 |
| 565 | | Walmart, Inc. | | 73,280 |
| | | | | 240,180 |
| | | Food Products – 2.5% | | |
| 495 | | Archer-Daniels-Midland Co. | | 39,823 |
| 423 | | Bunge Ltd. | | 34,927 |
| 1,122 | | Conagra Brands, Inc. | | 36,611 |
| 509 | | General Mills, Inc. | | 38,994 |
See Notes to Financial Statements
Page 33
Large Cap US Equity Select ETF (RNLC)
Portfolio of Investments (Continued)
September 30, 2022 (Unaudited)
| Shares | | Description | | Value |
| COMMON STOCKS (Continued) |
| | | Food Products (Continued) | | |
| 178 | | Hershey (The) Co. | | $39,243 |
| 811 | | Hormel Foods Corp. | | 36,852 |
| 300 | | J.M. Smucker (The) Co. | | 41,223 |
| 539 | | Kellogg Co. | | 37,547 |
| 1,008 | | Kraft Heinz (The) Co. | | 33,617 |
| 462 | | McCormick & Co., Inc. | | 32,927 |
| 618 | | Mondelez International, Inc., Class A | | 33,885 |
| 447 | | Tyson Foods, Inc., Class A | | 29,471 |
| | | | | 435,120 |
| | | Gas Utilities – 0.1% | | |
| 197 | | Atmos Energy Corp. | | 20,064 |
| | | Health Care Equipment &
Supplies – 4.2% | | |
| 739 | | Abbott Laboratories | | 71,506 |
| 1,251 | | Baxter International, Inc. | | 67,379 |
| 326 | | Becton Dickinson and Co. | | 72,643 |
| 256 | | Cooper (The) Cos., Inc. | | 67,558 |
| 895 | | Medtronic PLC | | 72,271 |
| 384 | | ResMed, Inc. | | 83,827 |
| 390 | | STERIS PLC | | 64,849 |
| 404 | | Stryker Corp. | | 81,826 |
| 327 | | Teleflex, Inc. | | 65,878 |
| 764 | | Zimmer Biomet Holdings, Inc. | | 79,876 |
| | | | | 727,613 |
| | | Health Care Providers &
Services – 4.4% | | |
| 271 | | AmerisourceBergen Corp. | | 36,674 |
| 1,537 | | Cardinal Health, Inc. | | 102,487 |
| 305 | | Cigna Corp. | | 84,628 |
| 414 | | CVS Health Corp. | | 39,483 |
| 166 | | Elevance Health, Inc. | | 75,404 |
| 478 | | HCA Healthcare, Inc. | | 87,852 |
| 172 | | Humana, Inc. | | 83,453 |
| 343 | | Laboratory Corp of America Holdings | | 70,250 |
| 118 | | McKesson Corp. | | 40,105 |
| 604 | | Quest Diagnostics, Inc. | | 74,105 |
| 156 | | UnitedHealth Group, Inc. | | 78,786 |
| | | | | 773,227 |
| | | Hotels, Restaurants &
Leisure – 3.2% | | |
| 606 | | Darden Restaurants, Inc. | | 76,550 |
| 176 | | Domino’s Pizza, Inc. | | 54,595 |
| 616 | | Hilton Worldwide Holdings, Inc. | | 74,302 |
| 504 | | Marriott International, Inc., Class A | | 70,630 |
| 278 | | McDonald’s Corp. | | 64,146 |
| 2,371 | | MGM Resorts International | | 70,466 |
| 899 | | Starbucks Corp. | | 75,750 |
| Shares | | Description | | Value |
|
| | | Hotels, Restaurants &
Leisure (Continued) | | |
| 605 | | Yum! Brands, Inc. | | $64,336 |
| | | | | 550,775 |
| | | Household Durables – 1.1% | | |
| 1,037 | | DR Horton, Inc. | | 69,842 |
| 698 | | Garmin Ltd. | | 56,056 |
| 972 | | Lennar Corp., Class A | | 72,463 |
| | | | | 198,361 |
| | | Household Products – 0.9% | | |
| 414 | | Church & Dwight Co., Inc. | | 29,576 |
| 272 | | Clorox (The) Co. | | 34,922 |
| 479 | | Colgate-Palmolive Co. | | 33,650 |
| 284 | | Kimberly-Clark Corp. | | 31,961 |
| 267 | | Procter & Gamble (The) Co. | | 33,709 |
| | | | | 163,818 |
| | | Independent Power &
Renewable Electricity Producers – 0.1% | | |
| 1,052 | | AES (The) Corp. | | 23,775 |
| | | Industrial Conglomerates – 0.6% | | |
| 267 | | 3M Co. | | 29,504 |
| 542 | | General Electric Co. | | 33,555 |
| 199 | | Honeywell International, Inc. | | 33,227 |
| | | | | 96,286 |
| | | Insurance – 3.2% | | |
| 593 | | Aflac, Inc. | | 33,327 |
| 259 | | Allstate (The) Corp. | | 32,253 |
| 642 | | American International Group, Inc. | | 30,482 |
| 122 | | Aon PLC, Class A | | 32,680 |
| 202 | | Arthur J. Gallagher & Co. | | 34,586 |
| 563 | | Brown & Brown, Inc. | | 34,050 |
| 167 | | Chubb Ltd. | | 30,374 |
| 276 | | Cincinnati Financial Corp. | | 24,721 |
| 889 | | Fidelity National Financial, Inc. | | 32,182 |
| 501 | | Hartford Financial Services Group (The), Inc. | | 31,032 |
| 554 | | Loews Corp. | | 27,611 |
| 212 | | Marsh & McLennan Cos., Inc. | | 31,650 |
| 523 | | MetLife, Inc. | | 31,788 |
| 491 | | Principal Financial Group, Inc. | | 35,426 |
| 282 | | Progressive (The) Corp. | | 32,771 |
| 343 | | Prudential Financial, Inc. | | 29,423 |
| 194 | | Travelers (The) Cos., Inc. | | 29,721 |
| 481 | | W.R. Berkley Corp. | | 31,063 |
| | | | | 565,140 |
| | | Internet & Direct Marketing
Retail – 0.4% | | |
| 1,647 | | eBay, Inc. | | 60,626 |
Page 34
See Notes to Financial Statements
Large Cap US Equity Select ETF (RNLC)
Portfolio of Investments (Continued)
September 30, 2022 (Unaudited)
| Shares | | Description | | Value |
| COMMON STOCKS (Continued) |
| | | IT Services – 3.6% | | |
| 124 | | Accenture PLC, Class A | | $31,905 |
| 164 | | Automatic Data Processing, Inc. | | 37,095 |
| 230 | | Broadridge Financial Solutions, Inc. | | 33,194 |
| 2,126 | | Cognizant Technology Solutions Corp., Class A | | 122,117 |
| 376 | | Fidelity National Information Services, Inc. | | 28,414 |
| 312 | | Global Payments, Inc. | | 33,712 |
| 1,016 | | International Business Machines Corp. | | 120,711 |
| 110 | | Mastercard, Inc., Class A | | 31,277 |
| 303 | | Paychex, Inc. | | 34,000 |
| 2,470 | | SS&C Technologies Holdings, Inc. | | 117,943 |
| 176 | | Visa, Inc., Class A | | 31,266 |
| | | | | 621,634 |
| | | Life Sciences Tools &
Services – 2.5% | | |
| 676 | | Agilent Technologies, Inc. | | 82,168 |
| 232 | | Bio-Techne Corp. | | 65,888 |
| 317 | | Danaher Corp. | | 81,878 |
| 565 | | PerkinElmer, Inc. | | 67,987 |
| 148 | | Thermo Fisher Scientific, Inc. | | 75,064 |
| 266 | | West Pharmaceutical Services, Inc. | | 65,457 |
| | | | | 438,442 |
| | | Machinery – 2.8% | | |
| 193 | | Caterpillar, Inc. | | 31,668 |
| 178 | | Cummins, Inc. | | 36,225 |
| 115 | | Deere & Co. | | 38,397 |
| 284 | | Dover Corp. | | 33,109 |
| 634 | | Fortive Corp. | | 36,962 |
| 190 | | IDEX Corp. | | 37,972 |
| 189 | | Illinois Tool Works, Inc. | | 34,143 |
| 820 | | Ingersoll Rand, Inc. | | 35,473 |
| 488 | | Otis Worldwide Corp. | | 31,134 |
| 419 | | PACCAR, Inc. | | 35,066 |
| 140 | | Parker-Hannifin Corp. | | 33,923 |
| 329 | | Stanley Black & Decker, Inc. | | 24,744 |
| 421 | | Westinghouse Air Brake Technologies Corp. | | 34,248 |
| 441 | | Xylem, Inc. | | 38,526 |
| | | | | 481,590 |
| | | Media – 2.3% | | |
| 2,855 | | Comcast Corp., Class A | | 83,737 |
| 2,134 | | Fox Corp., Class A | | 65,471 |
| 2,493 | | Interpublic Group of (The) Cos., Inc. | | 63,821 |
| 1,079 | | Omnicom Group, Inc. | | 68,074 |
| 2,781 | | Paramount Global, Class B | | 52,950 |
| Shares | | Description | | Value |
|
| | | Media (Continued) | | |
| 11,197 | | Sirius XM Holdings, Inc. | | $63,935 |
| | | | | 397,988 |
| | | Metals & Mining – 0.2% | | |
| 511 | | Freeport-McMoRan, Inc. | | 13,966 |
| 251 | | Newmont Corp. | | 10,549 |
| 143 | | Nucor Corp. | | 15,300 |
| | | | | 39,815 |
| | | Multiline Retail – 0.8% | | |
| 280 | | Dollar General Corp. | | 67,161 |
| 486 | | Target Corp. | | 72,117 |
| | | | | 139,278 |
| | | Multi-Utilities – 1.0% | | |
| 245 | | Ameren Corp. | | 19,735 |
| 748 | | CenterPoint Energy, Inc. | | 21,079 |
| 328 | | CMS Energy Corp. | | 19,103 |
| 232 | | Consolidated Edison, Inc. | | 19,896 |
| 277 | | Dominion Energy, Inc. | | 19,143 |
| 175 | | DTE Energy Co. | | 20,134 |
| 349 | | Public Service Enterprise Group, Inc. | | 19,624 |
| 147 | | Sempra Energy | | 22,041 |
| 220 | | WEC Energy Group, Inc. | | 19,675 |
| | | | | 180,430 |
| | | Oil, Gas & Consumable Fuels – 4.2% | | |
| 296 | | Cheniere Energy, Inc. | | 49,110 |
| 272 | | Chevron Corp. | | 39,078 |
| 439 | | ConocoPhillips | | 44,927 |
| 1,528 | | Coterra Energy, Inc. | | 39,911 |
| 715 | | Devon Energy Corp. | | 42,993 |
| 331 | | Diamondback Energy, Inc. | | 39,872 |
| 358 | | EOG Resources, Inc. | | 39,999 |
| 461 | | Exxon Mobil Corp. | | 40,250 |
| 372 | | Hess Corp. | | 40,544 |
| 2,351 | | Kinder Morgan, Inc. | | 39,121 |
| 1,753 | | Marathon Oil Corp. | | 39,583 |
| 479 | | Marathon Petroleum Corp. | | 47,579 |
| 670 | | Occidental Petroleum Corp. | | 41,172 |
| 710 | | ONEOK, Inc. | | 36,381 |
| 481 | | Phillips 66 | | 38,826 |
| 176 | | Pioneer Natural Resources Co. | | 38,109 |
| 371 | | Valero Energy Corp. | | 39,641 |
| 1,263 | | Williams (The) Cos., Inc. | | 36,160 |
| | | | | 733,256 |
| | | Personal Products – 0.3% | | |
| 269 | | Estee Lauder (The) Cos., Inc., Class A | | 58,077 |
| | | Pharmaceuticals – 2.9% | | |
| 1,043 | | Bristol-Myers Squibb Co. | | 74,147 |
| 248 | | Eli Lilly & Co. | | 80,191 |
See Notes to Financial Statements
Page 35
Large Cap US Equity Select ETF (RNLC)
Portfolio of Investments (Continued)
September 30, 2022 (Unaudited)
| Shares | | Description | | Value |
| COMMON STOCKS (Continued) |
| | | Pharmaceuticals (Continued) | | |
| 452 | | Johnson & Johnson | | $73,839 |
| 881 | | Merck & Co., Inc. | | 75,872 |
| 1,532 | | Pfizer, Inc. | | 67,040 |
| 7,671 | | Viatris, Inc. | | 65,357 |
| 467 | | Zoetis, Inc. | | 69,251 |
| | | | | 505,697 |
| | | Professional Services – 0.7% | | |
| 189 | | Equifax, Inc. | | 32,400 |
| 271 | | Jacobs Solutions, Inc. | | 29,401 |
| 431 | | TransUnion | | 25,640 |
| 200 | | Verisk Analytics, Inc. | | 34,106 |
| | | | | 121,547 |
| | | Road & Rail – 0.9% | | |
| 1,187 | | CSX Corp. | | 31,622 |
| 219 | | JB Hunt Transport Services, Inc. | | 34,256 |
| 151 | | Norfolk Southern Corp. | | 31,657 |
| 135 | | Old Dominion Freight Line, Inc. | | 33,584 |
| 162 | | Union Pacific Corp. | | 31,561 |
| | | | | 162,680 |
| | | Semiconductors &
Semiconductor Equipment – 12.8% | | |
| 982 | | Analog Devices, Inc. | | 136,832 |
| 1,577 | | Applied Materials, Inc. | | 129,204 |
| 295 | | Broadcom, Inc. | | 130,983 |
| 1,557 | | Entegris, Inc. | | 129,262 |
| 3,835 | | Intel Corp. | | 98,828 |
| 449 | | KLA Corp. | | 135,881 |
| 337 | | Lam Research Corp. | | 123,342 |
| 3,296 | | Marvell Technology, Inc. | | 141,431 |
| 2,470 | | Microchip Technology, Inc. | | 150,744 |
| 2,595 | | Micron Technology, Inc. | | 130,009 |
| 373 | | Monolithic Power Systems, Inc. | | 135,548 |
| 946 | | NVIDIA Corp. | | 114,835 |
| 969 | | NXP Semiconductors N.V. | | 142,937 |
| 1,123 | | QUALCOMM, Inc. | | 126,877 |
| 1,549 | | Skyworks Solutions, Inc. | | 132,083 |
| 1,602 | | Teradyne, Inc. | | 120,390 |
| 933 | | Texas Instruments, Inc. | | 144,410 |
| | | | | 2,223,596 |
| | | Software – 3.8% | | |
| 372 | | Intuit, Inc. | | 144,083 |
| 559 | | Microsoft Corp. | | 130,191 |
| 6,533 | | NortonLifeLock, Inc. | | 131,575 |
| 2,053 | | Oracle Corp. | | 125,377 |
| 363 | | Roper Technologies, Inc. | | 130,549 |
| | | | | 661,775 |
| | | Specialty Retail – 3.3% | | |
| 397 | | Advance Auto Parts, Inc. | | 62,067 |
| 2,550 | | Bath & Body Works, Inc. | | 83,130 |
| Shares | | Description | | Value |
|
| | | Specialty Retail (Continued) | | |
| 1,053 | | Best Buy Co., Inc. | | $66,697 |
| 251 | | Home Depot (The), Inc. | | 69,261 |
| 393 | | Lowe’s Cos., Inc. | | 73,809 |
| 978 | | Ross Stores, Inc. | | 82,416 |
| 1,229 | | TJX (The) Cos., Inc. | | 76,345 |
| 354 | | Tractor Supply Co. | | 65,802 |
| | | | | 579,527 |
| | | Technology Hardware,
Storage & Peripherals – 4.2% | | |
| 1,049 | | Apple, Inc. | | 144,972 |
| 3,104 | | Dell Technologies, Inc., Class C | | 106,064 |
| 10,819 | | Hewlett Packard Enterprise Co. | | 129,611 |
| 4,376 | | HP, Inc. | | 109,050 |
| 2,199 | | NetApp, Inc. | | 136,008 |
| 2,009 | | Seagate Technology Holdings PLC | | 106,939 |
| | | | | 732,644 |
| | | Textiles, Apparel & Luxury
Goods – 0.6% | | |
| 671 | | NIKE, Inc., Class B | | 55,774 |
| 1,554 | | VF Corp. | | 46,480 |
| | | | | 102,254 |
| | | Tobacco – 0.4% | | |
| 919 | | Altria Group, Inc. | | 37,109 |
| 389 | | Philip Morris International, Inc. | | 32,291 |
| | | | | 69,400 |
| | | Trading Companies &
Distributors – 0.3% | | |
| 300 | | Fastenal Co. | | 13,812 |
| 76 | | WW Grainger, Inc. | | 37,178 |
| | | | | 50,990 |
| | | Water Utilities – 0.1% | | |
| 149 | | American Water Works Co., Inc. | | 19,394 |
| | | Total Common Stocks | | 16,866,083 |
| | | (Cost $19,113,251) | | |
| REAL ESTATE INVESTMENT TRUSTS – 2.9% |
| | | Equity Real Estate Investment
Trusts – 2.9% | | |
| 138 | | Alexandria Real Estate Equities, Inc. | | 19,346 |
| 78 | | American Tower Corp. | | 16,747 |
| 103 | | AvalonBay Communities, Inc. | | 18,972 |
| 225 | | Boston Properties, Inc. | | 16,868 |
| 149 | | Camden Property Trust | | 17,798 |
| 119 | | Crown Castle, Inc. | | 17,201 |
| 154 | | Digital Realty Trust, Inc. | | 15,274 |
| 31 | | Equinix, Inc. | | 17,634 |
| 284 | | Equity LifeStyle Properties, Inc. | | 17,847 |
| 278 | | Equity Residential | | 18,687 |
| 76 | | Essex Property Trust, Inc. | | 18,409 |
Page 36
See Notes to Financial Statements
Large Cap US Equity Select ETF (RNLC)
Portfolio of Investments (Continued)
September 30, 2022 (Unaudited)
| Shares | | Description | | Value |
| REAL ESTATE INVESTMENT TRUSTS (Continued) |
| | | Equity Real Estate Investment
Trusts (Continued) | | |
| 118 | | Extra Space Storage, Inc. | | $20,380 |
| 773 | | Healthpeak Properties, Inc. | | 17,717 |
| 563 | | Invitation Homes, Inc. | | 19,013 |
| 1,013 | | Kimco Realty Corp. | | 18,649 |
| 114 | | Mid-America Apartment Communities, Inc. | | 17,678 |
| 170 | | Prologis, Inc. | | 17,272 |
| 67 | | Public Storage | | 19,618 |
| 293 | | Realty Income Corp. | | 17,053 |
| 62 | | SBA Communications Corp. | | 17,648 |
| 211 | | Simon Property Group, Inc. | | 18,937 |
| 125 | | Sun Communities, Inc. | | 16,916 |
| 435 | | UDR, Inc. | | 18,144 |
| 389 | | Ventas, Inc. | | 15,626 |
| 672 | | VICI Properties, Inc. | | 20,059 |
| 243 | | Welltower, Inc. | | 15,630 |
| 605 | | Weyerhaeuser Co. | | 17,279 |
| 241 | | WP Carey, Inc. | | 16,822 |
| | | Total Real Estate Investment Trusts | | 499,224 |
| | | (Cost $551,744) | | |
| | | Total Investments – 99.8% | | 17,365,307 |
| | | (Cost $19,664,995) | | |
| | | Net Other Assets and Liabilities – 0.2% | | 34,927 |
| | | Net Assets – 100.0% | | $17,400,234 |
Valuation Inputs
A summary of the inputs used to value the Fund’s investments as of September 30, 2022 is as follows (see Note 2A - Portfolio Valuation in the Notes to Financial Statements):
| | Total
Value at
9/30/2022 | Level 1
Quoted
Prices | Level 2
Significant
Observable
Inputs | Level 3
Significant
Unobservable
Inputs |
| Common Stocks* | $ 16,866,083 | $ 16,866,083 | $ — | $ — |
| Real Estate Investment Trusts* | 499,224 | 499,224 | — | — |
| Total Investments | $ 17,365,307 | $ 17,365,307 | $— | $— |
| * | See Portfolio of Investments for industry breakout. |
See Notes to Financial Statements
Page 37
Mid Cap US Equity Select ETF (RNMC)
Portfolio of Investments
September 30, 2022 (Unaudited)
| Shares | | Description | | Value |
| COMMON STOCKS – 91.2% |
| | | Aerospace & Defense – 1.8% | | |
| 794 | | BWX Technologies, Inc. | | $39,994 |
| 331 | | Curtiss-Wright Corp. | | 46,062 |
| 674 | | Hexcel Corp. | | 34,859 |
| 1,390 | | Howmet Aerospace, Inc. | | 42,993 |
| 201 | | Huntington Ingalls Industries, Inc. | | 44,521 |
| 1,492 | | Spirit AeroSystems Holdings, Inc., Class A | | 32,705 |
| 473 | | Woodward, Inc. | | 37,963 |
| | | | | 279,097 |
| | | Air Freight & Logistics – 0.3% | | |
| 431 | | CH Robinson Worldwide, Inc. | | 41,510 |
| | | Auto Components – 0.9% | | |
| 1,464 | | BorgWarner, Inc. | | 45,969 |
| 1,746 | | Gentex Corp. | | 41,625 |
| 388 | | Lear Corp. | | 46,440 |
| | | | | 134,034 |
| | | Automobiles – 0.6% | | |
| 1,543 | | Harley-Davidson, Inc. | | 53,820 |
| 654 | | Thor Industries, Inc. | | 45,767 |
| | | | | 99,587 |
| | | Banks – 6.4% | | |
| 860 | | Bank OZK | | 34,022 |
| 427 | | BOK Financial Corp. | | 37,943 |
| 1,375 | | Cadence Bank | | 34,939 |
| 440 | | Comerica, Inc. | | 31,284 |
| 492 | | Commerce Bancshares, Inc. | | 32,551 |
| 510 | | Community Bank System, Inc. | | 30,641 |
| 277 | | Cullen/Frost Bankers, Inc. | | 36,625 |
| 498 | | East West Bancorp, Inc. | | 33,436 |
| 1,749 | | Eastern Bankshares, Inc. | | 34,350 |
| 49 | | First Citizens BancShares, Inc., Class A | | 39,074 |
| 822 | | First Financial Bankshares, Inc. | | 34,384 |
| 2,973 | | FNB Corp. | | 34,487 |
| 681 | | Glacier Bancorp, Inc. | | 33,457 |
| 728 | | Hancock Whitney Corp. | | 33,350 |
| 1,554 | | Home BancShares, Inc. | | 34,980 |
| 406 | | Independent Bank Corp. | | 30,259 |
| 1,211 | | PacWest Bancorp | | 27,369 |
| 446 | | Pinnacle Financial Partners, Inc. | | 36,170 |
| 420 | | Popular, Inc. | | 30,265 |
| 473 | | Prosperity Bancshares, Inc. | | 31,540 |
| 409 | | ServisFirst Bancshares, Inc. | | 32,720 |
| 418 | | SouthState Corp. | | 33,072 |
| 896 | | Synovus Financial Corp. | | 33,609 |
| 375 | | UMB Financial Corp. | | 31,609 |
| 921 | | United Bankshares, Inc. | | 32,926 |
| 3,101 | | Valley National Bancorp | | 33,491 |
| 766 | | Webster Financial Corp. | | 34,623 |
| 457 | | Western Alliance Bancorp | | 30,043 |
| Shares | | Description | | Value |
|
| | | Banks (Continued) | | |
| 403 | | Wintrust Financial Corp. | | $32,865 |
| 634 | | Zions Bancorp N.A. | | 32,245 |
| | | | | 998,329 |
| | | Beverages – 0.5% | | |
| 88 | | Coca-Cola Consolidated, Inc. | | 36,232 |
| 912 | | Molson Coors Beverage Co., Class B | | 43,767 |
| | | | | 79,999 |
| | | Building Products – 2.8% | | |
| 800 | | A.O. Smith Corp. | | 38,864 |
| 485 | | Advanced Drainage Systems, Inc. | | 60,319 |
| 447 | | Allegion PLC | | 40,087 |
| 583 | | Armstrong World Industries, Inc. | | 46,191 |
| 183 | | Carlisle Cos., Inc. | | 51,315 |
| 730 | | Fortune Brands Home & Security, Inc. | | 39,194 |
| 212 | | Lennox International, Inc. | | 47,206 |
| 588 | | Owens Corning | | 46,223 |
| 435 | | Simpson Manufacturing Co., Inc. | | 34,104 |
| 517 | | UFP Industries, Inc. | | 37,307 |
| | | | | 440,810 |
| | | Capital Markets – 3.0% | | |
| 277 | | Affiliated Managers Group, Inc. | | 30,982 |
| 568 | | Ares Management Corp., Class A | | 35,188 |
| 285 | | Cboe Global Markets, Inc. | | 33,450 |
| 508 | | Cohen & Steers, Inc. | | 31,816 |
| 345 | | Evercore, Inc., Class A | | 28,376 |
| 409 | | Houlihan Lokey, Inc. | | 30,830 |
| 587 | | Interactive Brokers Group, Inc., Class A | | 37,515 |
| 2,002 | | Invesco, Ltd. | | 27,427 |
| 1,169 | | Jefferies Financial Group, Inc. | | 34,486 |
| 996 | | Lazard Ltd., Class A | | 31,703 |
| 126 | | MarketAxess Holdings, Inc. | | 28,034 |
| 133 | | Morningstar, Inc. | | 28,239 |
| 598 | | SEI Investments Co. | | 29,332 |
| 576 | | Stifel Financial Corp. | | 29,900 |
| 473 | | Tradeweb Markets, Inc., Class A | | 26,687 |
| | | | | 463,965 |
| | | Chemicals – 2.5% | | |
| 342 | | Ashland Global Holdings, Inc. | | 32,480 |
| 879 | | Avient Corp. | | 26,634 |
| 272 | | Balchem Corp. | | 33,070 |
| 1,101 | | Chemours (The) Co. | | 27,140 |
| 1,980 | | Element Solutions, Inc. | | 32,215 |
| 726 | | HB Fuller Co. | | 43,632 |
| 1,243 | | Huntsman Corp. | | 30,503 |
| 761 | | Olin Corp. | | 32,632 |
| 555 | | RPM International, Inc. | | 46,237 |
| 446 | | Scotts Miracle-Gro (The) Co. | | 19,066 |
| 1,222 | | Valvoline, Inc. | | 30,965 |
Page 38
See Notes to Financial Statements
Mid Cap US Equity Select ETF (RNMC)
Portfolio of Investments (Continued)
September 30, 2022 (Unaudited)
| Shares | | Description | | Value |
| COMMON STOCKS (Continued) |
| | | Chemicals (Continued) | | |
| 360 | | Westlake Corp. | | $31,277 |
| | | | | 385,851 |
| | | Commercial Services &
Supplies – 0.5% | | |
| 361 | | MSA Safety, Inc. | | 39,450 |
| 320 | | Tetra Tech, Inc. | | 41,130 |
| | | | | 80,580 |
| | | Communications Equipment – 0.6% | | |
| 3,635 | | Juniper Networks, Inc. | | 94,946 |
| | | Construction & Engineering – 1.2% | | |
| 670 | | AECOM | | 45,808 |
| 425 | | EMCOR Group, Inc. | | 49,079 |
| 1,620 | | MDU Resources Group, Inc. | | 44,307 |
| 195 | | Valmont Industries, Inc. | | 52,381 |
| | | | | 191,575 |
| | | Construction Materials – 0.3% | | |
| 398 | | Eagle Materials, Inc. | | 42,658 |
| | | Consumer Finance – 0.3% | | |
| 864 | | OneMain Holdings, Inc. | | 25,505 |
| 2,025 | | SLM Corp. | | 28,330 |
| | | | | 53,835 |
| | | Containers & Packaging – 1.5% | | |
| 424 | | AptarGroup, Inc. | | 40,293 |
| 2,133 | | Graphic Packaging Holding Co. | | 42,105 |
| 758 | | Sealed Air Corp. | | 33,739 |
| 1,057 | | Silgan Holdings, Inc. | | 44,436 |
| 767 | | Sonoco Products Co. | | 43,512 |
| 1,098 | | WestRock Co. | | 33,917 |
| | | | | 238,002 |
| | | Diversified Consumer
Services – 1.0% | | |
| 7,110 | | ADT, Inc. | | 53,254 |
| 1,383 | | H&R Block, Inc. | | 58,833 |
| 707 | | Service Corp. International | | 40,822 |
| | | | | 152,909 |
| | | Diversified Financial Services – 0.4% | | |
| 1,238 | | Equitable Holdings, Inc. | | 32,621 |
| 542 | | Voya Financial, Inc. | | 32,791 |
| | | | | 65,412 |
| | | Diversified Telecommunication
Services – 0.4% | | |
| 9,495 | | Lumen Technologies, Inc. | | 69,124 |
| Shares | | Description | | Value |
|
| | | Electric Utilities – 1.4% | | |
| 991 | | Hawaiian Electric Industries, Inc. | | $34,348 |
| 383 | | IDACORP, Inc. | | 37,921 |
| 1,062 | | NRG Energy, Inc. | | 40,643 |
| 1,051 | | OGE Energy Corp. | | 38,319 |
| 554 | | Pinnacle West Capital Corp. | | 35,739 |
| 839 | | Portland General Electric Co. | | 36,463 |
| | | | | 223,433 |
| | | Electrical Equipment – 1.9% | | |
| 284 | | Acuity Brands, Inc. | | 44,721 |
| 245 | | Hubbell, Inc. | | 54,635 |
| 385 | | Regal Rexnord Corp. | | 54,039 |
| 14,592 | | Vertiv Holdings Co. | | 141,834 |
| | | | | 295,229 |
| | | Electronic Equipment,
Instruments & Components – 3.8% | | |
| 2,797 | | Avnet, Inc. | | 101,028 |
| 1,028 | | Cognex Corp. | | 42,611 |
| 2,342 | | Jabil, Inc. | | 135,157 |
| 172 | | Littelfuse, Inc. | | 34,175 |
| 3,841 | | National Instruments Corp. | | 144,959 |
| 1,317 | | TD SYNNEX Corp. | | 106,927 |
| 1,902 | | Vontier Corp. | | 31,782 |
| | | | | 596,639 |
| | | Energy Equipment &
Services – 0.6% | | |
| 2,437 | | ChampionX Corp. | | 47,692 |
| 2,861 | | NOV, Inc. | | 46,291 |
| | | | | 93,983 |
| | | Entertainment – 0.3% | | |
| 2,005 | | Warner Music Group Corp., Class A | | 46,536 |
| | | Food & Staples Retailing – 0.6% | | |
| 1,860 | | Albertsons Cos., Inc., Class A | | 46,239 |
| 269 | | Casey’s General Stores, Inc. | | 54,478 |
| | | | | 100,717 |
| | | Food Products – 1.9% | | |
| 1,034 | | Campbell Soup Co. | | 48,722 |
| 1,888 | | Flowers Foods, Inc. | | 46,615 |
| 564 | | Ingredion, Inc. | | 45,413 |
| 696 | | Lamb Weston Holdings, Inc. | | 53,856 |
| 386 | | Lancaster Colony Corp. | | 58,008 |
| 13 | | Seaboard Corp. | | 44,235 |
| | | | | 296,849 |
| | | Gas Utilities – 1.1% | | |
| 614 | | National Fuel Gas Co. | | 37,792 |
| 910 | | New Jersey Resources Corp. | | 35,217 |
| 499 | | ONE Gas, Inc. | | 35,125 |
See Notes to Financial Statements
Page 39
Mid Cap US Equity Select ETF (RNMC)
Portfolio of Investments (Continued)
September 30, 2022 (Unaudited)
| Shares | | Description | | Value |
| COMMON STOCKS (Continued) |
| | | Gas Utilities (Continued) | | |
| 466 | | Southwest Gas Holdings, Inc. | | $32,503 |
| 1,050 | | UGI Corp. | | 33,946 |
| | | | | 174,583 |
| | | Health Care Equipment &
Supplies – 2.0% | | |
| 1,963 | | CONMED Corp. | | 157,374 |
| 5,262 | | DENTSPLY SIRONA, Inc. | | 149,177 |
| | | | | 306,551 |
| | | Health Care Providers &
Services – 5.6% | | |
| 401 | | Chemed Corp. | | 175,061 |
| 3,354 | | Encompass Health Corp. | | 151,701 |
| 2,559 | | Ensign Group (The), Inc. | | 203,440 |
| 5,269 | | Premier, Inc., Class A | | 178,830 |
| 1,867 | | Universal Health Services, Inc., Class B | | 164,632 |
| | | | | 873,664 |
| | | Hotels, Restaurants &
Leisure – 3.9% | | |
| 1,594 | | Aramark | | 49,733 |
| 982 | | Boyd Gaming Corp. | | 46,792 |
| 437 | | Choice Hotels International, Inc. | | 47,860 |
| 255 | | Churchill Downs, Inc. | | 46,958 |
| 420 | | Marriott Vacations Worldwide Corp. | | 51,181 |
| 585 | | Papa John’s International, Inc. | | 40,956 |
| 667 | | Texas Roadhouse, Inc. | | 58,203 |
| 1,258 | | Travel + Leisure Co. | | 42,923 |
| 224 | | Vail Resorts, Inc. | | 48,304 |
| 2,587 | | Wendy’s (The) Co. | | 48,351 |
| 653 | | Wingstop, Inc. | | 81,899 |
| 743 | | Wyndham Hotels & Resorts, Inc. | | 45,583 |
| | | | | 608,743 |
| | | Household Durables – 1.7% | | |
| 1,412 | | Leggett & Platt, Inc. | | 46,907 |
| 2,565 | | Newell Brands, Inc. | | 35,628 |
| 1,232 | | PulteGroup, Inc. | | 46,200 |
| 2,285 | | Tempur Sealy International, Inc. | | 55,160 |
| 1,095 | | Toll Brothers, Inc. | | 45,990 |
| 315 | | Whirlpool Corp. | | 42,465 |
| | | | | 272,350 |
| | | Household Products – 0.3% | | |
| 1,823 | | Reynolds Consumer Products, Inc. | | 47,416 |
| | | Independent Power &
Renewable Electricity Producers – 0.8% | | |
| 1,164 | | Clearway Energy, Inc., Class C | | 37,073 |
| 517 | | Ormat Technologies, Inc. | | 44,566 |
| Shares | | Description | | Value |
|
| | | Independent Power &
Renewable Electricity Producers (Continued) | | |
| 1,774 | | Vistra Corp. | | $37,254 |
| | | | | 118,893 |
| | | Insurance – 3.8% | | |
| 883 | | American Equity Investment Life Holding Co. | | 32,927 |
| 233 | | American Financial Group, Inc. | | 28,643 |
| 187 | | Assurant, Inc. | | 27,165 |
| 565 | | Axis Capital Holdings Ltd. | | 27,770 |
| 168 | | Erie Indemnity Co., Class A | | 37,348 |
| 115 | | Everest Re Group Ltd. | | 30,181 |
| 610 | | First American Financial Corp. | | 28,121 |
| 331 | | Globe Life, Inc. | | 33,001 |
| 221 | | Hanover Insurance Group (The), Inc. | | 28,319 |
| 674 | | Kemper Corp. | | 27,809 |
| 141 | | Kinsale Capital Group, Inc. | | 36,014 |
| 690 | | Lincoln National Corp. | | 30,298 |
| 1,444 | | Old Republic International Corp. | | 30,223 |
| 270 | | Primerica, Inc. | | 33,332 |
| 275 | | Reinsurance Group of America, Inc. | | 34,598 |
| 206 | | RenaissanceRe Holdings Ltd. | | 28,920 |
| 277 | | RLI Corp. | | 28,359 |
| 371 | | Selective Insurance Group, Inc. | | 30,199 |
| 949 | | Unum Group | | 36,821 |
| | | | | 590,048 |
| | | IT Services – 1.7% | | |
| 884 | | Concentrix Corp. | | 98,681 |
| 1,032 | | Genpact Ltd. | | 45,171 |
| 243 | | Jack Henry & Associates, Inc. | | 44,292 |
| 700 | | Maximus, Inc. | | 40,509 |
| 2,655 | | Western Union (The) Co. | | 35,842 |
| | | | | 264,495 |
| | | Leisure Products – 0.8% | | |
| 669 | | Brunswick Corp. | | 43,786 |
| 596 | | Hasbro, Inc. | | 40,182 |
| 492 | | Polaris, Inc. | | 47,060 |
| | | | | 131,028 |
| | | Life Sciences Tools &
Services – 1.5% | | |
| 1,664 | | Azenta, Inc. | | 71,319 |
| 2,996 | | Bruker Corp. | | 158,968 |
| | | | | 230,287 |
| | | Machinery – 4.6% | | |
| 443 | | AGCO Corp. | | 42,603 |
| 1,137 | | Allison Transmission Holdings, Inc. | | 38,385 |
| 499 | | Crane Holdings Co. | | 43,682 |
| 908 | | Donaldson Co., Inc. | | 44,501 |
Page 40
See Notes to Financial Statements
Mid Cap US Equity Select ETF (RNMC)
Portfolio of Investments (Continued)
September 30, 2022 (Unaudited)
| Shares | | Description | | Value |
| COMMON STOCKS (Continued) |
| | | Machinery (Continued) | | |
| 999 | | Esab Corp. | | $33,327 |
| 1,527 | | Flowserve Corp. | | 37,106 |
| 597 | | Franklin Electric Co., Inc. | | 48,781 |
| 736 | | Graco, Inc. | | 44,123 |
| 650 | | ITT, Inc. | | 42,471 |
| 396 | | John Bean Technologies Corp. | | 34,056 |
| 354 | | Lincoln Electric Holdings, Inc. | | 44,505 |
| 216 | | Nordson Corp. | | 45,850 |
| 532 | | Oshkosh Corp. | | 37,394 |
| 222 | | Snap-on, Inc. | | 44,700 |
| 664 | | Timken (The) Co. | | 39,203 |
| 577 | | Toro (The) Co. | | 49,899 |
| 356 | | Watts Water Technologies, Inc., Class A | | 44,760 |
| | | | | 715,346 |
| | | Marine – 0.2% | | |
| 600 | | Matson, Inc. | | 36,912 |
| | | Media – 1.4% | | |
| 80 | | Cable One, Inc. | | 68,244 |
| 1,750 | | New York Times (The) Co., Class A | | 50,312 |
| 3,135 | | News Corp., Class A | | 47,370 |
| 300 | | Nexstar Media Group, Inc. | | 50,055 |
| | | | | 215,981 |
| | | Metals & Mining – 1.3% | | |
| 773 | | Alcoa Corp. | | 26,019 |
| 1,065 | | Commercial Metals Co. | | 37,786 |
| 207 | | Reliance Steel & Aluminum Co. | | 36,103 |
| 330 | | Royal Gold, Inc. | | 30,961 |
| 533 | | Steel Dynamics, Inc. | | 37,816 |
| 1,968 | | United States Steel Corp. | | 35,660 |
| | | | | 204,345 |
| | | Multiline Retail – 0.9% | | |
| 221 | | Dillard’s, Inc., Class A | | 60,280 |
| 1,368 | | Kohl’s Corp. | | 34,405 |
| 2,666 | | Macy’s, Inc. | | 41,776 |
| | | | | 136,461 |
| | | Multi-Utilities – 0.5% | | |
| 557 | | Black Hills Corp. | | 37,726 |
| 1,375 | | NiSource, Inc. | | 34,636 |
| | | | | 72,362 |
| | | Oil, Gas & Consumable Fuels – 5.3% | | |
| 5,346 | | Antero Midstream Corp. | | 49,076 |
| 1,386 | | APA Corp. | | 47,387 |
| 597 | | Chesapeake Energy Corp. | | 56,243 |
| 925 | | Civitas Resources, Inc. | | 53,086 |
| 987 | | DT Midstream, Inc. | | 51,215 |
| 845 | | Enviva Inc. | | 50,751 |
| Shares | | Description | | Value |
|
| | | Oil, Gas & Consumable
Fuels (Continued) | | |
| 1,406 | | EQT Corp. | | $57,295 |
| 1,071 | | HF Sinclair Corp. | | 57,663 |
| 2,305 | | Magnolia Oil & Gas Corp., Class A | | 45,662 |
| 1,038 | | Matador Resources, Co. | | 50,779 |
| 1,602 | | Murphy Oil Corp. | | 56,342 |
| 1,095 | | Ovintiv, Inc. | | 50,370 |
| 785 | | PDC Energy, Inc. | | 45,365 |
| 1,415 | | SM Energy Co. | | 53,218 |
| 811 | | Targa Resources Corp. | | 48,936 |
| 33 | | Texas Pacific Land Corp. | | 58,649 |
| | | | | 832,037 |
| | | Paper & Forest Products – 0.3% | | |
| 834 | | Louisiana-Pacific Corp. | | 42,692 |
| | | Pharmaceuticals – 1.9% | | |
| 5,571 | | Organon & Co. | | 130,361 |
| 4,634 | | Perrigo Co. PLC | | 165,249 |
| | | | | 295,610 |
| | | Professional Services – 3.4% | | |
| 484 | | Booz Allen Hamilton Holding Corp. | | 44,697 |
| 478 | | Exponent, Inc. | | 41,906 |
| 438 | | Insperity, Inc. | | 44,716 |
| 2,479 | | KBR, Inc. | | 107,142 |
| 1,191 | | Leidos Holdings, Inc. | | 104,177 |
| 572 | | ManpowerGroup, Inc. | | 37,003 |
| 584 | | Robert Half International, Inc. | | 44,676 |
| 1,288 | | Science Applications International Corp. | | 113,898 |
| | | | | 538,215 |
| | | Real Estate Management &
Development – 0.2% | | |
| 3,162 | | eXp World Holdings, Inc. | | 35,446 |
| | | Road & Rail – 0.9% | | |
| 945 | | Knight-Swift Transportation Holdings, Inc. | | 46,239 |
| 301 | | Landstar System, Inc. | | 43,456 |
| 615 | | Ryder System, Inc. | | 46,426 |
| | | | | 136,121 |
| | | Semiconductors &
Semiconductor Equipment – 2.4% | | |
| 7,077 | | Amkor Technology, Inc. | | 120,663 |
| 426 | | MKS Instruments, Inc. | | 35,204 |
| 1,599 | | Power Integrations, Inc. | | 102,848 |
| 1,186 | | Universal Display Corp. | | 111,899 |
| | | | | 370,614 |
See Notes to Financial Statements
Page 41
Mid Cap US Equity Select ETF (RNMC)
Portfolio of Investments (Continued)
September 30, 2022 (Unaudited)
| Shares | | Description | | Value |
| COMMON STOCKS (Continued) |
| | | Software – 1.9% | | |
| 3,602 | | Bentley Systems, Inc., Class B | | $110,185 |
| 1,676 | | Dolby Laboratories, Inc., Class A | | 109,192 |
| 2,507 | | Pegasystems, Inc. | | 80,575 |
| | | | | 299,952 |
| | | Specialty Retail – 3.0% | | |
| 4,368 | | American Eagle Outfitters, Inc. | | 42,500 |
| 648 | | Dick’s Sporting Goods, Inc. | | 67,807 |
| 1,934 | | Foot Locker, Inc. | | 60,205 |
| 5,927 | | Gap (The), Inc. | | 48,661 |
| 178 | | Lithia Motors, Inc. | | 38,190 |
| 210 | | Murphy USA, Inc. | | 57,731 |
| 466 | | Penske Automotive Group, Inc. | | 45,868 |
| 914 | | Signet Jewelers Ltd. | | 52,272 |
| 440 | | Williams-Sonoma, Inc. | | 51,854 |
| | | | | 465,088 |
| | | Textiles, Apparel & Luxury
Goods – 1.6% | | |
| 693 | | Carter’s, Inc. | | 45,412 |
| 682 | | Columbia Sportswear Co. | | 45,899 |
| 4,746 | | Hanesbrands, Inc. | | 33,032 |
| 858 | | PVH Corp. | | 38,438 |
| 545 | | Ralph Lauren Corp. | | 46,287 |
| 1,600 | | Tapestry, Inc. | | 45,488 |
| | | | | 254,556 |
| | | Thrifts & Mortgage Finance – 1.0% | | |
| 830 | | Essent Group Ltd. | | 28,942 |
| 2,562 | | MGIC Investment Corp. | | 32,845 |
| 3,536 | | New York Community Bancorp, Inc. | | 30,162 |
| 1,643 | | Radian Group, Inc. | | 31,693 |
| 335 | | Walker & Dunlop, Inc. | | 28,050 |
| | | | | 151,692 |
| | | Trading Companies &
Distributors – 1.5% | | |
| 1,308 | | Air Lease Corp. | | 40,561 |
| 485 | | Herc Holdings, Inc. | | 50,382 |
| 582 | | MSC Industrial Direct Co., Inc., Class A | | 42,375 |
| 831 | | Triton International Ltd. | | 45,481 |
| 183 | | Watsco, Inc. | | 47,115 |
| | | | | 225,914 |
| | | Water Utilities – 0.2% | | |
| 884 | | Essential Utilities, Inc. | | 36,580 |
| | | Total Common Stocks | | 14,249,591 |
| | | (Cost $16,603,774) | | |
| Shares | | Description | | Value |
| REAL ESTATE INVESTMENT TRUSTS – 8.7% |
| | | Equity Real Estate Investment
Trusts – 7.9% | | |
| 516 | | Agree Realty Corp. | | $34,871 |
| 1,050 | | American Homes 4 Rent, Class A | | 34,451 |
| 1,239 | | Americold Realty Trust | | 30,479 |
| 895 | | Apartment Income REIT Corp. | | 34,565 |
| 1,841 | | Brixmor Property Group, Inc. | | 34,003 |
| 1,273 | | Cousins Properties, Inc. | | 29,725 |
| 871 | | CubeSmart | | 34,892 |
| 1,663 | | Douglas Emmett, Inc. | | 29,818 |
| 241 | | EastGroup Properties, Inc. | | 34,786 |
| 389 | | Federal Realty Investment Trust | | 35,057 |
| 784 | | First Industrial Realty Trust, Inc. | | 35,131 |
| 811 | | Gaming and Leisure Properties, Inc. | | 35,879 |
| 1,368 | | Healthcare Realty Trust, Inc. | | 28,523 |
| 1,088 | | Highwoods Properties, Inc. | | 29,333 |
| 2,373 | | Host Hotels & Resorts, Inc. | | 37,683 |
| 339 | | Innovative Industrial Properties, Inc. | | 30,002 |
| 764 | | Iron Mountain, Inc. | | 33,593 |
| 711 | | Kilroy Realty Corp. | | 29,940 |
| 2,152 | | Kite Realty Group Trust | | 37,057 |
| 423 | | Lamar Advertising Co., Class A | | 34,893 |
| 333 | | Life Storage, Inc. | | 36,883 |
| 3,465 | | LXP Industrial Trust | | 31,739 |
| 2,437 | | Medical Properties Trust, Inc. | | 28,903 |
| 865 | | National Retail Properties, Inc. | | 34,479 |
| 743 | | National Storage Affiliates Trust | | 30,894 |
| 1,320 | | Omega Healthcare Investors, Inc. | | 38,927 |
| 2,742 | | Park Hotels & Resorts, Inc. | | 30,875 |
| 2,133 | | Physicians Realty Trust | | 32,080 |
| 996 | | Rayonier, Inc. | | 29,850 |
| 627 | | Regency Centers Corp. | | 33,764 |
| 646 | | Rexford Industrial Realty, Inc. | | 33,592 |
| 806 | | SL Green Realty Corp. | | 32,369 |
| 985 | | Spirit Realty Capital, Inc. | | 35,618 |
| 1,205 | | STAG Industrial, Inc. | | 34,258 |
| 1,427 | | STORE Capital Corp. | | 44,708 |
| 668 | | Terreno Realty Corp. | | 35,397 |
| 1,302 | | Vornado Realty Trust | | 30,154 |
| | | | | 1,239,171 |
| | | Mortgage Real Estate
Investment Trusts – 0.8% | | |
| 2,916 | | AGNC Investment Corp. | | 24,553 |
| 1,365 | | Annaly Capital Management, Inc. | | 23,423 |
| 1,167 | | Blackstone Mortgage Trust, Inc., Class A | | 27,238 |
| 3,464 | | Rithm Capital Corp. | | 25,356 |
Page 42
See Notes to Financial Statements
Mid Cap US Equity Select ETF (RNMC)
Portfolio of Investments (Continued)
September 30, 2022 (Unaudited)
| Shares | | Description | | Value |
| REAL ESTATE INVESTMENT TRUSTS (Continued) |
| | | Mortgage Real Estate
Investment Trusts (Continued) | | |
| 1,545 | | Starwood Property Trust, Inc. | | $28,150 |
| | | | | 128,720 |
| | | Total Real Estate Investment Trusts | | 1,367,891 |
| | | (Cost $1,717,013) | | |
| | | Total Investments – 99.9% | | 15,617,482 |
| | | (Cost $18,320,787) | | |
| | | Net Other Assets and Liabilities – 0.1% | | 11,406 |
| | | Net Assets – 100.0% | | $15,628,888 |
Valuation Inputs
A summary of the inputs used to value the Fund’s investments as of September 30, 2022 is as follows (see Note 2A - Portfolio Valuation in the Notes to Financial Statements):
| | Total
Value at
9/30/2022 | Level 1
Quoted
Prices | Level 2
Significant
Observable
Inputs | Level 3
Significant
Unobservable
Inputs |
| Common Stocks* | $ 14,249,591 | $ 14,249,591 | $ — | $ — |
| Real Estate Investment Trusts* | 1,367,891 | 1,367,891 | — | — |
| Total Investments | $ 15,617,482 | $ 15,617,482 | $— | $— |
| * | See Portfolio of Investments for industry breakout. |
See Notes to Financial Statements
Page 43
Small Cap US Equity Select ETF (RNSC)
Portfolio of Investments
September 30, 2022 (Unaudited)
| Shares | | Description | | Value |
| COMMON STOCKS – 90.6% |
| | | Aerospace & Defense – 0.5% | | |
| 2,601 | | Maxar Technologies, Inc. | | $48,691 |
| 855 | | Moog, Inc., Class A | | 60,149 |
| | | | | 108,840 |
| | | Air Freight & Logistics – 0.3% | | |
| 738 | | Forward Air Corp. | | 66,612 |
| | | Auto Components – 0.9% | | |
| 5,677 | | Dana, Inc. | | 64,888 |
| 714 | | LCI Industries | | 72,442 |
| 1,309 | | Patrick Industries, Inc. | | 57,387 |
| | | | | 194,717 |
| | | Automobiles – 0.4% | | |
| 1,645 | | Winnebago Industries, Inc. | | 87,530 |
| | | Banks – 10.7% | | |
| 1,115 | | Ameris Bancorp | | 49,852 |
| 2,452 | | Associated Banc-Corp. | | 49,236 |
| 1,320 | | Atlantic Union Bankshares Corp. | | 40,102 |
| 468 | | BancFirst Corp. | | 41,872 |
| 602 | | Bank of Hawaii Corp. | | 45,824 |
| 1,259 | | BankUnited, Inc. | | 43,020 |
| 797 | | Banner Corp. | | 47,087 |
| 1,808 | | Berkshire Hills Bancorp, Inc. | | 49,358 |
| 1,144 | | Cathay General Bancorp | | 43,998 |
| 1,563 | | Columbia Banking System, Inc. | | 45,155 |
| 1,805 | | CVB Financial Corp. | | 45,703 |
| 1,510 | | Dime Community Bancshares, Inc. | | 44,213 |
| 945 | | Eagle Bancorp, Inc. | | 42,355 |
| 1,079 | | Enterprise Financial Services Corp. | | 47,519 |
| 1,142 | | FB Financial Corp. | | 43,636 |
| 1,283 | | First Bancorp | | 46,932 |
| 3,469 | | First BanCorp | | 47,456 |
| 1,960 | | First Busey Corp. | | 43,081 |
| 3,337 | | First Commonwealth Financial Corp. | | 42,847 |
| 2,308 | | First Financial Bancorp | | 48,653 |
| 2,187 | | First Foundation, Inc. | | 39,672 |
| 1,972 | | First Hawaiian, Inc. | | 48,570 |
| 1,175 | | First Interstate BancSystem, Inc., Class A | | 47,411 |
| 1,257 | | First Merchants Corp. | | 48,621 |
| 3,099 | | Fulton Financial Corp. | | 48,964 |
| 1,078 | | Heartland Financial USA, Inc. | | 46,742 |
| 1,680 | | Hilltop Holdings, Inc. | | 41,748 |
| 3,236 | | Hope Bancorp, Inc. | | 40,903 |
| 659 | | Independent Bank Group, Inc. | | 40,456 |
| 1,117 | | International Bancshares Corp. | | 47,473 |
| 674 | | Lakeland Financial Corp. | | 49,074 |
| 1,321 | | Live Oak Bancshares, Inc. | | 40,423 |
| 1,158 | | Meta Financial Group, Inc. | | 38,168 |
| 1,170 | | National Bank Holdings Corp., Class A | | 43,278 |
| Shares | | Description | | Value |
|
| | | Banks (Continued) | | |
| 1,191 | | NBT Bancorp, Inc. | | $45,198 |
| 3,499 | | Northwest Bancshares, Inc. | | 47,271 |
| 1,763 | | OFG Bancorp | | 44,304 |
| 3,028 | | Old National Bancorp | | 49,871 |
| 1,532 | | Pacific Premier Bancorp, Inc. | | 47,431 |
| 369 | | Park National Corp. | | 45,933 |
| 1,554 | | Renasant Corp. | | 48,609 |
| 1,146 | | Sandy Spring Bancorp, Inc. | | 40,408 |
| 1,355 | | Seacoast Banking Corp. of Florida | | 40,962 |
| 2,106 | | Simmons First National Corp., Class A | | 45,890 |
| 749 | | Stock Yards Bancorp, Inc. | | 50,940 |
| 1,649 | | Towne Bank | | 44,243 |
| 1,534 | | Trustmark Corp. | | 46,986 |
| 1,483 | | United Community Banks, Inc. | | 49,087 |
| 1,530 | | Veritex Holdings, Inc. | | 40,683 |
| 1,492 | | Washington Federal, Inc. | | 44,730 |
| 1,412 | | WesBanco, Inc. | | 47,118 |
| 805 | | Westamerica BanCorp | | 42,093 |
| | | | | 2,351,159 |
| | | Beverages – 0.4% | | |
| 762 | | MGP Ingredients, Inc. | | 80,894 |
| | | Building Products – 1.0% | | |
| 1,239 | | AAON, Inc. | | 66,757 |
| 659 | | CSW Industrials, Inc. | | 78,948 |
| 2,491 | | Zurn Water Solutions Corp. | | 61,030 |
| | | | | 206,735 |
| | | Capital Markets – 2.5% | | |
| 1,259 | | Artisan Partners Asset Management, Inc., Class A | | 33,905 |
| 1,060 | | B. Riley Financial, Inc. | | 47,191 |
| 13,289 | | BGC Partners, Inc., Class A | | 41,728 |
| 2,487 | | Brightsphere Investment Group, Inc. | | 37,081 |
| 1,409 | | Federated Hermes, Inc. | | 46,666 |
| 667 | | Hamilton Lane, Inc., Class A | | 39,760 |
| 1,138 | | Moelis & Co., Class A | | 38,476 |
| 395 | | Piper Sandler Cos. | | 41,372 |
| 637 | | PJT Partners, Inc., Class A | | 42,565 |
| 1,720 | | StepStone Group, Inc., Class A | | 42,157 |
| 1,858 | | Victory Capital Holdings, Inc., Class A | | 43,310 |
| 1,913 | | Virtu Financial, Inc., Class A | | 39,733 |
| 262 | | Virtus Investment Partners, Inc. | | 41,794 |
| | | | | 535,738 |
| | | Chemicals – 1.8% | | |
| 868 | | Cabot Corp. | | 55,456 |
| 578 | | Innospec, Inc. | | 49,517 |
| 902 | | Minerals Technologies, Inc. | | 44,568 |
| 184 | | NewMarket Corp. | | 55,353 |
| 370 | | Quaker Chemical Corp. | | 53,421 |
Page 44
See Notes to Financial Statements
Small Cap US Equity Select ETF (RNSC)
Portfolio of Investments (Continued)
September 30, 2022 (Unaudited)
| Shares | | Description | | Value |
| COMMON STOCKS (Continued) |
| | | Chemicals (Continued) | | |
| 687 | | Sensient Technologies Corp. | | $47,637 |
| 546 | | Stepan Co. | | 51,144 |
| 1,764 | | Trinseo PLC | | 32,316 |
| | | | | 389,412 |
| | | Commercial Services &
Supplies – 1.6% | | |
| 1,563 | | ABM Industries, Inc. | | 59,753 |
| 1,436 | | Brady Corp., Class A | | 59,924 |
| 1,118 | | Brink’s (The) Co. | | 54,156 |
| 2,303 | | HNI Corp. | | 61,052 |
| 3,041 | | MillerKnoll, Inc. | | 47,440 |
| 394 | | UniFirst Corp. | | 66,283 |
| | | | | 348,608 |
| | | Construction & Engineering – 1.6% | | |
| 2,963 | | Arcosa, Inc. | | 169,424 |
| 816 | | Comfort Systems USA, Inc. | | 79,421 |
| 2,329 | | Granite Construction, Inc. | | 59,133 |
| 3,118 | | Primoris Services Corp. | | 50,668 |
| | | | | 358,646 |
| | | Consumer Finance – 0.9% | | |
| 1,831 | | Bread Financial Holdings, Inc. | | 57,585 |
| 644 | | FirstCash Holdings, Inc. | | 47,237 |
| 3,201 | | Navient Corp. | | 47,023 |
| 525 | | Nelnet, Inc., Class A | | 41,575 |
| | | | | 193,420 |
| | | Containers & Packaging – 0.9% | | |
| 1,088 | | Greif, Inc., Class A | | 64,812 |
| 6,812 | | Pactiv Evergreen, Inc. | | 59,469 |
| 2,450 | | TriMas Corp. | | 61,421 |
| | | | | 185,702 |
| | | Diversified Consumer
Services – 0.7% | | |
| 141 | | Graham Holdings Co., Class B | | 75,855 |
| 1,132 | | Strategic Education, Inc. | | 69,516 |
| | | | | 145,371 |
| | | Diversified Financial Services – 0.4% | | |
| 2,091 | | Compass Diversified Holdings | | 37,763 |
| 1,674 | | Jackson Financial, Inc., Class A | | 46,454 |
| | | | | 84,217 |
| | | Diversified Telecommunication
Services – 0.5% | | |
| 2,158 | | Cogent Communications Holdings, Inc. | | 112,561 |
| | | Electric Utilities – 0.7% | | |
| 951 | | ALLETE, Inc. | | 47,598 |
| Shares | | Description | | Value |
|
| | | Electric Utilities (Continued) | | |
| 718 | | MGE Energy, Inc. | | $47,122 |
| 1,011 | | Otter Tail Corp. | | 62,197 |
| | | | | 156,917 |
| | | Electrical Equipment – 0.8% | | |
| 653 | | Encore Wire Corp. | | 75,448 |
| 1,151 | | EnerSys | | 66,954 |
| 7,830 | | GrafTech International Ltd. | | 33,747 |
| | | | | 176,149 |
| | | Electronic Equipment,
Instruments & Components – 5.8% | | |
| 5,003 | | Advanced Energy Industries, Inc. | | 387,282 |
| 839 | | Badger Meter, Inc. | | 77,515 |
| 1,274 | | Belden, Inc. | | 76,466 |
| 9,858 | | Methode Electronics, Inc. | | 366,225 |
| 20,490 | | Vishay Intertechnology, Inc. | | 364,517 |
| | | | | 1,272,005 |
| | | Energy Equipment &
Services – 1.6% | | |
| 3,416 | | Cactus, Inc., Class A | | 131,277 |
| 3,194 | | Helmerich & Payne, Inc. | | 118,082 |
| 8,728 | | Patterson-UTI Energy, Inc. | | 101,943 |
| | | | | 351,302 |
| | | Entertainment – 0.4% | | |
| 1,278 | | World Wrestling Entertainment, Inc., Class A | | 89,677 |
| | | Food & Staples Retailing – 0.6% | | |
| 1,115 | | PriceSmart, Inc. | | 64,213 |
| 1,023 | | Weis Markets, Inc. | | 72,878 |
| | | | | 137,091 |
| | | Food Products – 1.0% | | |
| 3,206 | | B&G Foods, Inc. (a) | | 52,867 |
| 1,543 | | Cal-Maine Foods, Inc. | | 85,775 |
| 546 | | J&J Snack Foods Corp. | | 70,691 |
| | | | | 209,333 |
| | | Gas Utilities – 0.7% | | |
| 431 | | Chesapeake Utilities Corp. | | 49,733 |
| 1,052 | | Northwest Natural Holding Co. | | 45,636 |
| 751 | | Spire, Inc. | | 46,810 |
| | | | | 142,179 |
| | | Health Care Equipment &
Supplies – 0.2% | | |
| 333 | | Mesa Laboratories, Inc. | | 46,896 |
| | | Health Care Providers &
Services – 12.2% | | |
| 33,939 | | Owens & Minor, Inc. | | 817,930 |
| 35,227 | | Patterson Cos., Inc. | | 846,152 |
See Notes to Financial Statements
Page 45
Small Cap US Equity Select ETF (RNSC)
Portfolio of Investments (Continued)
September 30, 2022 (Unaudited)
| Shares | | Description | | Value |
| COMMON STOCKS (Continued) |
| | | Health Care Providers &
Services (Continued) | | |
| 45,190 | | Select Medical Holdings Corp. | | $998,699 |
| | | | | 2,662,781 |
| | | Hotels, Restaurants &
Leisure – 2.4% | | |
| 4,806 | | Bloomin’ Brands, Inc. | | 88,094 |
| 3,023 | | Cheesecake Factory (The), Inc. | | 88,513 |
| 957 | | Cracker Barrel Old Country Store, Inc. | | 88,599 |
| 1,425 | | Jack in the Box, Inc. | | 105,550 |
| 5,873 | | Krispy Kreme, Inc. | | 67,716 |
| 2,394 | | Red Rock Resorts, Inc., Class A | | 82,018 |
| | | | | 520,490 |
| | | Household Durables – 1.6% | | |
| 1,776 | | Century Communities, Inc. | | 75,977 |
| 816 | | Installed Building Products, Inc. | | 66,088 |
| 2,807 | | KB Home | | 72,758 |
| 3,369 | | La-Z-Boy, Inc. | | 76,038 |
| 2,472 | | MDC Holdings, Inc. | | 67,782 |
| | | | | 358,643 |
| | | Household Products – 0.8% | | |
| 2,689 | | Energizer Holdings, Inc. | | 67,602 |
| 929 | | Spectrum Brands Holdings, Inc. | | 36,259 |
| 379 | | WD-40 Co. | | 66,605 |
| | | | | 170,466 |
| | | Insurance – 1.2% | | |
| 1,215 | | Argo Group International Holdings Ltd. | | 23,401 |
| 803 | | Assured Guaranty Ltd. | | 38,905 |
| 2,476 | | CNO Financial Group, Inc. | | 44,494 |
| 1,167 | | Horace Mann Educators Corp. | | 41,183 |
| 1,011 | | Mercury General Corp. | | 28,733 |
| 900 | | Stewart Information Services Corp. | | 39,276 |
| 36 | | White Mountains Insurance Group Ltd. | | 46,909 |
| | | | | 262,901 |
| | | Interactive Media & Services – 1.5% | | |
| 6,371 | | Shutterstock, Inc. | | 319,633 |
| | | IT Services – 1.9% | | |
| 6,118 | | CSG Systems International, Inc. | | 323,520 |
| 1,840 | | EVERTEC, Inc. | | 57,684 |
| 999 | | TTEC Holdings, Inc. | | 44,266 |
| | | | | 425,470 |
| | | Leisure Products – 0.4% | | |
| 1,916 | | Acushnet Holdings Corp. | | 83,327 |
| Shares | | Description | | Value |
|
| | | Machinery – 5.6% | | |
| 583 | | Alamo Group, Inc. | | $71,283 |
| 861 | | Albany International Corp., Class A | | 67,873 |
| 1,925 | | Altra Industrial Motion Corp. | | 64,719 |
| 1,664 | | Astec Industries, Inc. | | 51,900 |
| 2,179 | | Barnes Group, Inc. | | 62,930 |
| 828 | | EnPro Industries, Inc. | | 70,363 |
| 992 | | ESCO Technologies, Inc. | | 72,853 |
| 1,906 | | Federal Signal Corp. | | 71,132 |
| 1,024 | | Helios Technologies, Inc. | | 51,814 |
| 1,657 | | Hillenbrand, Inc. | | 60,845 |
| 372 | | Kadant, Inc. | | 62,053 |
| 2,921 | | Kennametal, Inc. | | 60,114 |
| 511 | | Lindsay Corp. | | 73,216 |
| 1,039 | | Mueller Industries, Inc. | | 61,758 |
| 5,785 | | Mueller Water Products, Inc., Class A | | 59,412 |
| 3,650 | | Shyft Group (The), Inc. | | 74,570 |
| 1,145 | | Tennant Co. | | 64,761 |
| 2,479 | | Terex Corp. | | 73,726 |
| 2,801 | | Trinity Industries, Inc. | | 59,801 |
| | | | | 1,235,123 |
| | | Media – 0.9% | | |
| 4,729 | | Gray Television, Inc. | | 67,719 |
| 1,672 | | John Wiley & Sons, Inc., Class A | | 62,800 |
| 3,915 | | Sinclair Broadcast Group, Inc., Class A | | 70,823 |
| | | | | 201,342 |
| | | Metals & Mining – 1.5% | | |
| 1,983 | | Carpenter Technology Corp. | | 61,750 |
| 1,564 | | Compass Minerals International, Inc. | | 60,261 |
| 14,121 | | Hecla Mining Co. | | 55,637 |
| 700 | | Kaiser Aluminum Corp. | | 42,945 |
| 751 | | Materion Corp. | | 60,080 |
| 1,255 | | Worthington Industries, Inc. | | 47,866 |
| | | | | 328,539 |
| | | Multiline Retail – 0.5% | | |
| 2,278 | | Franchise Group, Inc. | | 55,355 |
| 3,780 | | Nordstrom, Inc. | | 63,240 |
| | | | | 118,595 |
| | | Multi-Utilities – 0.4% | | |
| 1,284 | | Avista Corp. | | 47,572 |
| 948 | | NorthWestern Corp. | | 46,718 |
| | | | | 94,290 |
| | | Oil, Gas & Consumable Fuels – 4.6% | | |
| 961 | | Arch Resources, Inc. | | 113,975 |
| 3,573 | | California Resources Corp. | | 137,310 |
| 1,131 | | Chord Energy Corp. | | 154,687 |
Page 46
See Notes to Financial Statements
Small Cap US Equity Select ETF (RNSC)
Portfolio of Investments (Continued)
September 30, 2022 (Unaudited)
| Shares | | Description | | Value |
| COMMON STOCKS (Continued) |
| | | Oil, Gas & Consumable
Fuels (Continued) | | |
| 4,451 | | CVR Energy, Inc. | | $128,990 |
| 21,628 | | Equitrans Midstream Corp. | | 161,777 |
| 5,445 | | Northern Oil and Gas, Inc. | | 149,248 |
| 6,723 | | World Fuel Services Corp. | | 157,587 |
| | | | | 1,003,574 |
| | | Personal Products – 1.2% | | |
| 2,208 | | Edgewell Personal Care Co. | | 82,579 |
| 1,093 | | Inter Parfums, Inc. | | 82,478 |
| 422 | | Medifast, Inc. | | 45,728 |
| 1,761 | | Nu Skin Enterprises, Inc., Class A | | 58,765 |
| | | | | 269,550 |
| | | Professional Services – 0.9% | | |
| 714 | | ICF International, Inc. | | 77,840 |
| 1,106 | | Kforce, Inc. | | 64,867 |
| 1,169 | | Korn Ferry | | 54,885 |
| | | | | 197,592 |
| | | Real Estate Management &
Development – 0.7% | | |
| 2,499 | | Kennedy-Wilson Holdings, Inc. | | 38,635 |
| 1,280 | | Marcus & Millichap, Inc. | | 41,958 |
| 4,895 | | Newmark Group, Inc., Class A | | 39,454 |
| 1,196 | | St. Joe (The) Co. | | 38,308 |
| | | | | 158,355 |
| | | Road & Rail – 1.3% | | |
| 964 | | ArcBest Corp. | | 70,112 |
| 4,034 | | Marten Transport Ltd. | | 77,291 |
| 3,032 | | Schneider National, Inc., Class B | | 61,550 |
| 1,761 | | Werner Enterprises, Inc. | | 66,213 |
| | | | | 275,166 |
| | | Software – 3.6% | | |
| 2,156 | | InterDigital, Inc. | | 87,145 |
| 8,060 | | Progress Software Corp. | | 342,953 |
| 25,304 | | Xperi Holding Corp. | | 357,799 |
| | | | | 787,897 |
| | | Specialty Retail – 3.0% | | |
| 2,247 | | Academy Sports & Outdoors, Inc. | | 94,778 |
| 2,885 | | Buckle (The), Inc. | | 91,339 |
| 3,700 | | Camping World Holdings, Inc., Class A | | 93,684 |
| 470 | | Group 1 Automotive, Inc. | | 67,149 |
| 4,685 | | Guess?, Inc. | | 68,729 |
| 1,863 | | Monro, Inc. | | 80,966 |
| 4,107 | | Rent-A-Center, Inc. | | 71,914 |
| 2,181 | | Sonic Automotive, Inc., Class A | | 94,437 |
| | | | | 662,996 |
| Shares | | Description | | Value |
|
| | | Technology Hardware,
Storage & Peripherals – 1.5% | | |
| 24,588 | | Xerox Holdings Corp. | | $321,611 |
| | | Textiles, Apparel & Luxury
Goods – 1.6% | | |
| 2,394 | | Kontoor Brands, Inc. | | 80,462 |
| 4,894 | | Levi Strauss & Co., Class A | | 70,816 |
| 900 | | Oxford Industries, Inc. | | 80,802 |
| 2,480 | | Steven Madden Ltd. | | 66,142 |
| 3,962 | | Wolverine World Wide, Inc. | | 60,975 |
| | | | | 359,197 |
| | | Thrifts & Mortgage Finance – 0.8% | | |
| 4,878 | | Capitol Federal Financial, Inc. | | 40,487 |
| 1,025 | | PennyMac Financial Services, Inc. | | 43,973 |
| 2,012 | | Provident Financial Services, Inc. | | 39,234 |
| 1,117 | | WSFS Financial Corp. | | 51,896 |
| | | | | 175,590 |
| | | Tobacco – 0.3% | | |
| 7,261 | | Vector Group Ltd. | | 63,969 |
| | | Trading Companies &
Distributors – 1.8% | | |
| 706 | | Applied Industrial Technologies, Inc. | | 72,563 |
| 931 | | Boise Cascade Co. | | 55,357 |
| 721 | | GATX Corp. | | 61,393 |
| 2,342 | | H&E Equipment Services, Inc. | | 66,372 |
| 893 | | McGrath RentCorp | | 74,887 |
| 1,657 | | Rush Enterprises, Inc., Class A | | 72,676 |
| | | | | 403,248 |
| | | Water Utilities – 1.0% | | |
| 686 | | American States Water Co. | | 53,474 |
| 1,006 | | California Water Service Group | | 53,006 |
| 637 | | Middlesex Water Co. | | 49,176 |
| 895 | | SJW Group | | 51,552 |
| | | | | 207,208 |
| | | Wireless Telecommunication
Services – 0.5% | | |
| 8,302 | | Telephone & Data Systems, Inc. | | 115,398 |
| | | Total Common Stocks | | 19,814,662 |
| | | (Cost $23,798,884) | | |
| REAL ESTATE INVESTMENT TRUSTS – 9.0% |
| | | Equity Real Estate Investment
Trusts – 7.4% | | |
| 3,030 | | Acadia Realty Trust | | 38,239 |
| 2,637 | | Alexander & Baldwin, Inc. | | 43,721 |
| 1,594 | | American Assets Trust, Inc. | | 40,998 |
| 3,227 | | Apple Hospitality REIT, Inc. | | 45,372 |
| 4,910 | | Brandywine Realty Trust | | 33,142 |
See Notes to Financial Statements
Page 47
Small Cap US Equity Select ETF (RNSC)
Portfolio of Investments (Continued)
September 30, 2022 (Unaudited)
| Shares | | Description | | Value |
| REAL ESTATE INVESTMENT TRUSTS (Continued) |
| | | Equity Real Estate Investment
Trusts (Continued) | | |
| 2,308 | | Broadstone Net Lease, Inc. | | $35,843 |
| 2,567 | | CareTrust REIT, Inc. | | 46,488 |
| 580 | | Centerspace | | 39,046 |
| 1,807 | | Corporate Office Properties Trust | | 41,977 |
| 2,486 | | Easterly Government Properties, Inc. | | 39,204 |
| 6,733 | | Empire State Realty Trust, Inc., Class A | | 44,168 |
| 1,009 | | EPR Properties | | 36,183 |
| 2,203 | | Essential Properties Realty Trust, Inc. | | 42,848 |
| 1,780 | | Four Corners Property Trust, Inc. | | 43,058 |
| 3,343 | | Global Net Lease, Inc. | | 35,603 |
| 3,190 | | Hudson Pacific Properties, Inc. | | 34,930 |
| 2,283 | | Independence Realty Trust, Inc. | | 38,195 |
| 3,362 | | Industrial Logistics Properties Trust | | 18,491 |
| 1,835 | | InvenTrust Properties Corp. | | 39,141 |
| 3,266 | | iStar, Inc. | | 30,243 |
| 2,002 | | JBG SMITH Properties | | 37,197 |
| 1,233 | | LTC Properties, Inc. | | 46,176 |
| 5,434 | | Macerich (The) Co. | | 43,146 |
| 781 | | National Health Investors, Inc. | | 44,150 |
| 757 | | NexPoint Residential Trust, Inc. | | 34,981 |
| 2,793 | | Outfront Media, Inc. | | 42,426 |
| 6,547 | | Paramount Group, Inc. | | 40,788 |
| 2,857 | | Pebblebrook Hotel Trust | | 41,455 |
| 1,417 | | Phillips Edison & Co Inc | | 39,747 |
| 3,608 | | Piedmont Office Realty Trust, Inc., Class A | | 38,100 |
| 1,071 | | PotlatchDeltic Corp. | | 43,954 |
| 3,000 | | Retail Opportunity Investments Corp. | | 41,280 |
| 4,291 | | RLJ Lodging Trust | | 43,425 |
| 3,388 | | Sabra Health Care REIT, Inc. | | 44,451 |
| 1,338 | | Safehold, Inc. | | 35,403 |
| 9,050 | | Service Properties Trust | | 46,969 |
| 3,514 | | SITE Centers Corp. | | 37,635 |
| 3,329 | | Tanger Factory Outlet Centers, Inc. | | 45,541 |
| 5,025 | | Uniti Group, Inc. | | 34,924 |
| 3,112 | | Urban Edge Properties | | 41,514 |
| 2,221 | | Washington Real Estate Investment Trust | | 39,001 |
| | | | | 1,629,153 |
| | | Mortgage Real Estate
Investment Trusts – 1.6% | | |
| 4,290 | | Apollo Commercial Real Estate Finance, Inc. | | 35,607 |
| 3,416 | | Arbor Realty Trust, Inc. | | 39,284 |
| 5,077 | | Chimera Investment Corp. | | 26,502 |
| 1,250 | | Hannon Armstrong Sustainable Infrastructure Capital, Inc. | | 37,412 |
| Shares | | Description | | Value |
|
| | | Mortgage Real Estate
Investment Trusts (Continued) | | |
| 4,249 | | Ladder Capital Corp. | | $38,071 |
| 4,166 | | MFA Financial, Inc. | | 32,411 |
| 16,226 | | New York Mortgage Trust, Inc. | | 37,969 |
| 3,238 | | PennyMac Mortgage Investment Trust | | 38,144 |
| 5,808 | | Redwood Trust, Inc. | | 33,338 |
| 8,993 | | Two Harbors Investment Corp. | | 29,857 |
| | | | | 348,595 |
| | | Total Real Estate Investment Trusts | | 1,977,748 |
| | | (Cost $2,829,800) | | |
COMMON STOCKS – BUSINESS DEVELOPMENT
COMPANIES - 0.2% |
| | | Capital Markets – 0.2% | | |
| 3,455 | | Golub Capital BDC, Inc. | | 42,807 |
| | | (Cost $52,576) | | |
| MONEY MARKET FUNDS – 0.2% |
| 51,789 | | Goldman Sachs Financial Square Treasury Obligations Fund - Institutional Class - 2.77% (b) (c) | | 51,789 |
| | | (Cost $51,789) | | |
| | | Total Investments – 100.0% | | 21,887,006 |
| | | (Cost $26,733,049) | | |
| | | Net Other Assets and Liabilities – (0.0)% | | (1,852) |
| | | Net Assets – 100.0% | | $21,885,154 |
| (a) | All or a portion of this security is on loan (see Note 2E - Securities Lending in the Notes to Financial Statements). The remaining contractual maturity of all of the securities lending transactions is overnight and continuous. The aggregate value of such securities is $49,651 and the total value of the collateral held by the Fund is $51,789. |
| (b) | Rate shown reflects yield as of September 30, 2022. |
| (c) | This security serves as collateral for securities on loan. |
Offsetting Assets and Liabilities
Offsetting assets and liabilities requires entities to disclose both gross and net information about instruments and transactions eligible for offset, and to disclose instruments and transactions subject to master netting or similar agreements (see Note 2D – Offsetting on the Statements of Assets and Liabilities in the Notes to Financial Statements).
The Fund’s loaned securities were all subject to an enforceable Securities Lending Agency Agreement. Securities lent in accordance with the Securities Lending Agency Agreement on a gross basis were as follows:
Page 48
See Notes to Financial Statements
Small Cap US Equity Select ETF (RNSC)
Portfolio of Investments (Continued)
September 30, 2022 (Unaudited)
| Securities Lending Agency Agreement | |
| Total gross amount presented on the Statements of Assets and Liabilities (1) | $49,651 |
| Non-cash Collateral (2) | (49,651) |
| Net Amount | $— |
| (1) | The amount presented on the Statements of Assets and Liabilities, which is included in “Investments, at value,” is not offset and is shown on a gross basis. |
| (2) | At September 30, 2022, the value of the collateral received from each borrower exceeded the value of the related securities loaned. This amount is disclosed on the Portfolio of Investments. |
Valuation Inputs
A summary of the inputs used to value the Fund’s investments as of September 30, 2022 is as follows (see Note 2A - Portfolio Valuation in the Notes to Financial Statements):
| | Total
Value at
9/30/2022 | Level 1
Quoted
Prices | Level 2
Significant
Observable
Inputs | Level 3
Significant
Unobservable
Inputs |
| Common Stocks* | $ 19,814,662 | $ 19,814,662 | $ — | $ — |
| Real Estate Investment Trusts* | 1,977,748 | 1,977,748 | — | — |
| Common Stocks - Business Development Companies* | 42,807 | 42,807 | — | — |
| Money Market Funds | 51,789 | 51,789 | — | — |
| Total Investments | $ 21,887,006 | $ 21,887,006 | $— | $— |
| * | See Portfolio of Investments for industry breakout. |
See Notes to Financial Statements
Page 49
US Equity Dividend Select ETF (RNDV)
Portfolio of Investments
September 30, 2022 (Unaudited)
| Shares | | Description | | Value |
| COMMON STOCKS – 96.7% |
| | | Aerospace & Defense – 1.5% | | |
| 371 | | General Dynamics Corp. | | $78,715 |
| 218 | | L3Harris Technologies, Inc. | | 45,307 |
| 177 | | Lockheed Martin Corp. | | 68,373 |
| 671 | | Raytheon Technologies Corp. | | 54,928 |
| | | | | 247,323 |
| | | Air Freight & Logistics – 0.4% | | |
| 454 | | United Parcel Service, Inc., Class B | | 73,339 |
| | | Automobiles – 0.7% | | |
| 9,621 | | Ford Motor Co. | | 107,755 |
| | | Banks – 4.1% | | |
| 1,211 | | Bank of America Corp. | | 36,572 |
| 1,348 | | Citigroup, Inc. | | 56,171 |
| 1,711 | | Citizens Financial Group, Inc. | | 58,790 |
| 1,485 | | Fifth Third Bancorp | | 47,461 |
| 5,937 | | Huntington Bancshares, Inc. | | 78,250 |
| 430 | | JPMorgan Chase & Co. | | 44,935 |
| 3,624 | | KeyCorp | | 58,056 |
| 258 | | M&T Bank Corp. | | 45,491 |
| 295 | | PNC Financial Services Group (The), Inc. | | 44,079 |
| 2,702 | | Regions Financial Corp. | | 54,229 |
| 1,192 | | Truist Financial Corp. | | 51,900 |
| 1,214 | | US Bancorp | | 48,948 |
| 820 | | Wells Fargo & Co. | | 32,980 |
| | | | | 657,862 |
| | | Beverages – 0.7% | | |
| 645 | | Coca-Cola (The) Co. | | 36,133 |
| 889 | | Keurig Dr. Pepper, Inc. | | 31,844 |
| 234 | | PepsiCo, Inc. | | 38,203 |
| | | | | 106,180 |
| | | Biotechnology – 4.3% | | |
| 1,508 | | AbbVie, Inc. | | 202,389 |
| 816 | | Amgen, Inc. | | 183,926 |
| 4,921 | | Gilead Sciences, Inc. | | 303,577 |
| | | | | 689,892 |
| | | Building Products – 1.3% | | |
| 1,702 | | Johnson Controls International PLC | | 83,772 |
| 1,198 | | Masco Corp. | | 55,935 |
| 445 | | Trane Technologies PLC | | 64,441 |
| | | | | 204,148 |
| | | Capital Markets – 3.3% | | |
| 115 | | Ameriprise Financial, Inc. | | 28,974 |
| 1,092 | | Bank of New York Mellon (The) Corp. | | 42,064 |
| 68 | | BlackRock, Inc. | | 37,419 |
| 766 | | Blackstone, Inc. | | 64,114 |
| 1,498 | | Carlyle Group (The), Inc. | | 38,708 |
| Shares | | Description | | Value |
|
| | | Capital Markets (Continued) | | |
| 127 | | CME Group, Inc. | | $22,496 |
| 2,957 | | Franklin Resources, Inc. | | 63,635 |
| 127 | | Goldman Sachs Group (The), Inc. | | 37,217 |
| 676 | | Morgan Stanley | | 53,411 |
| 420 | | Northern Trust Corp. | | 35,935 |
| 838 | | State Street Corp. | | 50,959 |
| 494 | | T Rowe Price Group, Inc. | | 51,875 |
| | | | | 526,807 |
| | | Chemicals – 1.5% | | |
| 69 | | Air Products and Chemicals, Inc. | | 16,058 |
| 125 | | Celanese Corp. | | 11,293 |
| 671 | | Dow, Inc. | | 29,477 |
| 1,215 | | DuPont de Nemours, Inc. | | 61,236 |
| 235 | | Eastman Chemical Co. | | 16,697 |
| 115 | | FMC Corp. | | 12,155 |
| 142 | | International Flavors & Fragrances, Inc. | | 12,898 |
| 382 | | LyondellBasell Industries N.V., Class A | | 28,757 |
| 538 | | PPG Industries, Inc. | | 59,551 |
| | | | | 248,122 |
| | | Communications Equipment – 0.6% | | |
| 2,396 | | Cisco Systems, Inc. | | 95,840 |
| | | Consumer Finance – 1.7% | | |
| 1,369 | | Ally Financial, Inc. | | 38,099 |
| 361 | | American Express Co. | | 48,703 |
| 659 | | Capital One Financial Corp. | | 60,740 |
| 328 | | Discover Financial Services | | 29,822 |
| 3,436 | | Synchrony Financial | | 96,861 |
| | | | | 274,225 |
| | | Containers & Packaging – 0.7% | | |
| 68 | | Avery Dennison Corp. | | 11,064 |
| 683 | | International Paper Co. | | 21,651 |
| 670 | | Packaging Corp. of America | | 75,234 |
| | | | | 107,949 |
| | | Distributors – 0.7% | | |
| 768 | | Genuine Parts Co. | | 114,678 |
| | | Diversified Financial Services – 0.3% | �� | |
| 1,070 | | Apollo Global Management, Inc. | | 49,755 |
| | | Diversified Telecommunication
Services – 1.6% | | |
| 9,682 | | AT&T, Inc. | | 148,522 |
| 2,892 | | Verizon Communications, Inc. | | 109,809 |
| | | | | 258,331 |
Page 50
See Notes to Financial Statements
US Equity Dividend Select ETF (RNDV)
Portfolio of Investments (Continued)
September 30, 2022 (Unaudited)
| Shares | | Description | | Value |
| COMMON STOCKS (Continued) |
| | | Electric Utilities – 1.9% | | |
| 363 | | Alliant Energy Corp. | | $19,235 |
| 251 | | American Electric Power Co., Inc. | | 21,699 |
| 257 | | Duke Energy Corp. | | 23,906 |
| 511 | | Edison International | | 28,913 |
| 235 | | Entergy Corp. | | 23,648 |
| 397 | | Evergy, Inc. | | 23,582 |
| 261 | | Eversource Energy | | 20,348 |
| 446 | | Exelon Corp. | | 16,707 |
| 794 | | FirstEnergy Corp. | | 29,378 |
| 203 | | NextEra Energy, Inc. | | 15,917 |
| 1,280 | | PPL Corp. | | 32,448 |
| 393 | | Southern (The) Co. | | 26,724 |
| 283 | | Xcel Energy, Inc. | | 18,112 |
| | | | | 300,617 |
| | | Electrical Equipment – 1.4% | | |
| 589 | | Eaton Corp. PLC | | 78,549 |
| 965 | | Emerson Electric Co. | | 70,657 |
| 332 | | Rockwell Automation, Inc. | | 71,417 |
| | | | | 220,623 |
| | | Electronic Equipment,
Instruments & Components – 2.9% | | |
| 10,257 | | Corning, Inc. | | 297,658 |
| 1,606 | | TE Connectivity Ltd. | | 177,238 |
| | | | | 474,896 |
| | | Energy Equipment &
Services – 0.1% | | |
| 1,069 | | Baker Hughes Co. | | 22,406 |
| | | Food & Staples Retailing – 1.2% | | |
| 557 | | Kroger (The) Co. | | 24,369 |
| 490 | | Sysco Corp. | | 34,648 |
| 1,975 | | Walgreens Boots Alliance, Inc. | | 62,015 |
| 597 | | Walmart, Inc. | | 77,431 |
| | | | | 198,463 |
| | | Food Products – 2.7% | | |
| 380 | | Archer-Daniels-Midland Co. | | 30,571 |
| 379 | | Bunge Ltd. | | 31,294 |
| 1,583 | | Conagra Brands, Inc. | | 51,653 |
| 532 | | General Mills, Inc. | | 40,757 |
| 116 | | Hershey (The) Co. | | 25,575 |
| 669 | | Hormel Foods Corp. | | 30,399 |
| 359 | | J.M. Smucker (The) Co. | | 49,330 |
| 677 | | Kellogg Co. | | 47,160 |
| 1,633 | | Kraft Heinz (The) Co. | | 54,461 |
| 304 | | McCormick & Co., Inc. | | 21,666 |
| 539 | | Mondelez International, Inc., Class A | | 29,553 |
| Shares | | Description | | Value |
|
| | | Food Products (Continued) | | |
| 366 | | Tyson Foods, Inc., Class A | | $24,130 |
| | | | | 436,549 |
| | | Gas Utilities – 0.1% | | |
| 159 | | Atmos Energy Corp. | | 16,194 |
| | | Health Care Equipment &
Supplies – 2.2% | | |
| 1,017 | | Abbott Laboratories | | 98,405 |
| 1,788 | | Baxter International, Inc. | | 96,302 |
| 2,083 | | Medtronic PLC | | 168,202 |
| | | | | 362,909 |
| | | Health Care Providers &
Services – 2.9% | | |
| 4,702 | | Cardinal Health, Inc. | | 313,529 |
| 363 | | CVS Health Corp. | | 34,619 |
| 930 | | Quest Diagnostics, Inc. | | 114,102 |
| | | | | 462,250 |
| | | Hotels, Restaurants &
Leisure – 2.7% | | |
| 1,366 | | Darden Restaurants, Inc. | | 172,553 |
| 354 | | McDonald’s Corp. | | 81,682 |
| 1,307 | | Starbucks Corp. | | 110,128 |
| 660 | | Yum! Brands, Inc. | | 70,184 |
| | | | | 434,547 |
| | | Household Durables – 1.0% | | |
| 1,128 | | Garmin Ltd. | | 90,590 |
| 997 | | Lennar Corp., Class A | | 74,326 |
| | | | | 164,916 |
| | | Household Products – 0.9% | | |
| 347 | | Clorox (The) Co. | | 44,552 |
| 421 | | Colgate-Palmolive Co. | | 29,575 |
| 374 | | Kimberly-Clark Corp. | | 42,090 |
| 253 | | Procter & Gamble (The) Co. | | 31,941 |
| | | | | 148,158 |
| | | Independent Power &
Renewable Electricity Producers – 0.1% | | |
| 1,049 | | AES (The) Corp. | | 23,707 |
| | | Industrial Conglomerates – 1.1% | | |
| 1,057 | | 3M Co. | | 116,798 |
| 382 | | Honeywell International, Inc. | | 63,783 |
| | | | | 180,581 |
| | | Insurance – 2.5% | | |
| 666 | | Aflac, Inc. | | 37,429 |
| 289 | | Allstate (The) Corp. | | 35,989 |
| 684 | | American International Group, Inc. | | 32,476 |
| 261 | | Cincinnati Financial Corp. | | 23,378 |
See Notes to Financial Statements
Page 51
US Equity Dividend Select ETF (RNDV)
Portfolio of Investments (Continued)
September 30, 2022 (Unaudited)
| Shares | | Description | | Value |
| COMMON STOCKS (Continued) |
| | | Insurance (Continued) | | |
| 1,759 | | Fidelity National Financial, Inc. | | $63,676 |
| 491 | | Hartford Financial Services Group (The), Inc. | | 30,412 |
| 688 | | MetLife, Inc. | | 41,817 |
| 799 | | Principal Financial Group, Inc. | | 57,648 |
| 717 | | Prudential Financial, Inc. | | 61,504 |
| 174 | | Travelers (The) Cos., Inc. | | 26,657 |
| | | | | 410,986 |
| | | Internet & Direct Marketing
Retail – 0.4% | | |
| 1,830 | | eBay, Inc. | | 67,362 |
| | | IT Services – 3.6% | | |
| 273 | | Automatic Data Processing, Inc. | | 61,750 |
| 176 | | Broadridge Financial Solutions, Inc. | | 25,400 |
| 610 | | Fidelity National Information Services, Inc. | | 46,098 |
| 3,254 | | International Business Machines Corp. | | 386,608 |
| 636 | | Paychex, Inc. | | 71,365 |
| | | | | 591,221 |
| | | Machinery – 2.2% | | |
| 414 | | Caterpillar, Inc. | | 67,929 |
| 461 | | Cummins, Inc. | | 93,818 |
| 438 | | Illinois Tool Works, Inc. | | 79,125 |
| 217 | | Parker-Hannifin Corp. | | 52,581 |
| 856 | | Stanley Black & Decker, Inc. | | 64,380 |
| | | | | 357,833 |
| | | Media – 3.1% | | |
| 1,937 | | Comcast Corp., Class A | | 56,812 |
| 5,871 | | Interpublic Group of (The) Cos., Inc. | | 150,298 |
| 2,749 | | Omnicom Group, Inc. | | 173,434 |
| 6,261 | | Paramount Global, Class B | | 119,210 |
| | | | | 499,754 |
| | | Metals & Mining – 0.2% | | |
| 394 | | Newmont Corp. | | 16,560 |
| 111 | | Nucor Corp. | | 11,876 |
| | | | | 28,436 |
| | | Multiline Retail – 0.7% | | |
| 717 | | Target Corp. | | 106,396 |
| | | Multi-Utilities – 1.1% | | |
| 210 | | Ameren Corp. | | 16,915 |
| 575 | | CenterPoint Energy, Inc. | | 16,203 |
| 295 | | CMS Energy Corp. | | 17,181 |
| 260 | | Consolidated Edison, Inc. | | 22,298 |
| 306 | | Dominion Energy, Inc. | | 21,148 |
| 163 | | DTE Energy Co. | | 18,753 |
| Shares | | Description | | Value |
|
| | | Multi-Utilities (Continued) | | |
| 394 | | Public Service Enterprise Group, Inc. | | $22,155 |
| 148 | | Sempra Energy | | 22,191 |
| 208 | | WEC Energy Group, Inc. | | 18,601 |
| | | | | 175,445 |
| | | Oil, Gas & Consumable Fuels – 4.7% | | |
| 326 | | Chevron Corp. | | 46,836 |
| 278 | | ConocoPhillips | | 28,451 |
| 1,759 | | Coterra Energy, Inc. | | 45,945 |
| 1,312 | | Devon Energy Corp. | | 78,891 |
| 395 | | Diamondback Energy, Inc. | | 47,582 |
| 239 | | EOG Resources, Inc. | | 26,703 |
| 592 | | Exxon Mobil Corp. | | 51,688 |
| 4,793 | | Kinder Morgan, Inc. | | 79,755 |
| 425 | | Marathon Petroleum Corp. | | 42,215 |
| 1,503 | | ONEOK, Inc. | | 77,014 |
| 683 | | Phillips 66 | | 55,132 |
| 307 | | Pioneer Natural Resources Co. | | 66,475 |
| 430 | | Valero Energy Corp. | | 45,945 |
| 2,122 | | Williams (The) Cos., Inc. | | 60,753 |
| | | | | 753,385 |
| | | Pharmaceuticals – 5.7% | | |
| 2,862 | | Bristol-Myers Squibb Co. | | 203,460 |
| 893 | | Johnson & Johnson | | 145,880 |
| 2,136 | | Merck & Co., Inc. | | 183,952 |
| 3,752 | | Pfizer, Inc. | | 164,188 |
| 27,391 | | Viatris, Inc. | | 233,371 |
| | | | | 930,851 |
| | | Road & Rail – 0.7% | | |
| 269 | | Norfolk Southern Corp. | | 56,396 |
| 310 | | Union Pacific Corp. | | 60,394 |
| | | | | 116,790 |
| | | Semiconductors &
Semiconductor Equipment – 11.3% | | |
| 1,357 | | Analog Devices, Inc. | | 189,084 |
| 673 | | Broadcom, Inc. | | 298,819 |
| 10,166 | | Intel Corp. | | 261,978 |
| 2,899 | | Microchip Technology, Inc. | | 176,926 |
| 1,283 | | NXP Semiconductors N.V. | | 189,255 |
| 1,707 | | QUALCOMM, Inc. | | 192,857 |
| 2,606 | | Skyworks Solutions, Inc. | | 222,214 |
| 1,890 | | Texas Instruments, Inc. | | 292,534 |
| | | | | 1,823,667 |
| | | Software – 2.3% | | |
| 10,352 | | NortonLifeLock, Inc. | | 208,490 |
| 2,618 | | Oracle Corp. | | 159,881 |
| | | | | 368,371 |
Page 52
See Notes to Financial Statements
US Equity Dividend Select ETF (RNDV)
Portfolio of Investments (Continued)
September 30, 2022 (Unaudited)
| Shares | | Description | | Value |
| COMMON STOCKS (Continued) |
| | | Specialty Retail – 4.7% | | |
| 663 | | Advance Auto Parts, Inc. | | $103,653 |
| 3,837 | | Bath & Body Works, Inc. | | 125,086 |
| 2,954 | | Best Buy Co., Inc. | | 187,106 |
| 375 | | Home Depot (The), Inc. | | 103,478 |
| 417 | | Lowe’s Cos., Inc. | | 78,317 |
| 958 | | Ross Stores, Inc. | | 80,731 |
| 1,369 | | TJX (The) Cos., Inc. | | 85,042 |
| | | | | 763,413 |
| | | Technology Hardware,
Storage & Peripherals – 6.9% | | |
| 27,255 | | Hewlett Packard Enterprise Co. | | 326,515 |
| 8,769 | | HP, Inc. | | 218,524 |
| 4,691 | | NetApp, Inc. | | 290,138 |
| 5,419 | | Seagate Technology Holdings PLC | | 288,453 |
| | | | | 1,123,630 |
| | | Textiles, Apparel & Luxury
Goods – 0.7% | | |
| 4,052 | | VF Corp. | | 121,195 |
| | | Tobacco – 1.2% | | |
| 3,064 | | Altria Group, Inc. | | 123,724 |
| 762 | | Philip Morris International, Inc. | | 63,254 |
| | | | | 186,978 |
| | | Trading Companies &
Distributors – 0.1% | | |
| 302 | | Fastenal Co. | | 13,904 |
| | | Total Common Stocks | | 15,648,639 |
| | | (Cost $18,598,979) | | |
| REAL ESTATE INVESTMENT TRUSTS – 2.9% |
| | | Equity Real Estate Investment
Trusts – 2.9% | | |
| 127 | | Alexandria Real Estate Equities, Inc. | | 17,804 |
| 49 | | American Tower Corp. | | 10,520 |
| 98 | | AvalonBay Communities, Inc. | | 18,051 |
| 287 | | Boston Properties, Inc. | | 21,516 |
| 114 | | Camden Property Trust | | 13,617 |
| 118 | | Crown Castle, Inc. | | 17,057 |
| 164 | | Digital Realty Trust, Inc. | | 16,265 |
| 16 | | Equinix, Inc. | | 9,101 |
| 181 | | Equity LifeStyle Properties, Inc. | | 11,374 |
| 273 | | Equity Residential | | 18,351 |
| 73 | | Essex Property Trust, Inc. | | 17,683 |
| 110 | | Extra Space Storage, Inc. | | 18,998 |
| 1,038 | | Healthpeak Properties, Inc. | | 23,791 |
| 358 | | Invitation Homes, Inc. | | 12,090 |
| 1,085 | | Kimco Realty Corp. | | 19,975 |
| 80 | | Mid-America Apartment Communities, Inc. | | 12,406 |
| 119 | | Prologis, Inc. | | 12,090 |
| Shares | | Description | | Value |
|
| | | Equity Real Estate Investment
Trusts (Continued) | | |
| 49 | | Public Storage | | $14,348 |
| 360 | | Realty Income Corp. | | 20,952 |
| 509 | | Simon Property Group, Inc. | | 45,683 |
| 78 | | Sun Communities, Inc. | | 10,556 |
| 402 | | UDR, Inc. | | 16,767 |
| 395 | | Ventas, Inc. | | 15,867 |
| 942 | | VICI Properties, Inc. | | 28,119 |
| 209 | | Welltower, Inc. | | 13,443 |
| 371 | | Weyerhaeuser Co. | | 10,596 |
| 357 | | WP Carey, Inc. | | 24,919 |
| | | Total Real Estate Investment Trusts | | 471,939 |
| | | (Cost $566,588) | | |
| | | Total Investments – 99.6% | | 16,120,578 |
| | | (Cost $19,165,567) | | |
| | | Net Other Assets and Liabilities – 0.4% | | 56,649 |
| | | Net Assets – 100.0% | | $16,177,227 |
Valuation Inputs
A summary of the inputs used to value the Fund’s investments as of September 30, 2022 is as follows (see Note 2A - Portfolio Valuation in the Notes to Financial Statements):
| | Total
Value at
9/30/2022 | Level 1
Quoted
Prices | Level 2
Significant
Observable
Inputs | Level 3
Significant
Unobservable
Inputs |
| Common Stocks* | $ 15,648,639 | $ 15,648,639 | $ — | $ — |
| Real Estate Investment Trusts* | 471,939 | 471,939 | — | — |
| Total Investments | $ 16,120,578 | $ 16,120,578 | $— | $— |
| * | See Portfolio of Investments for industry breakout. |
See Notes to Financial Statements
Page 53
First Trust Exchange-Traded Fund VI
Statements of Assets and Liabilities
September 30, 2022 (Unaudited)
| | Developed
International
Equity Select
ETF
(RNDM) | | Emerging
Markets
Equity Select
ETF
(RNEM) | | Large Cap US
Equity Select
ETF
(RNLC) |
| ASSETS: | | | | | |
Investments, at value
| $ 15,844,505 | | $ 7,906,148 | | $ 17,365,307 |
Cash
| 51,962 | | 4,905 | | 17,123 |
Foreign currency
| 14,846 | | 10,036 | | — |
| Receivables: | | | | | |
Dividends
| 51,244 | | 14,679 | | 25,075 |
Dividend reclaims
| 43,990 | | 558 | | 2,755 |
Securities lending income
| 10 | | — | | — |
Total Assets
| 16,006,557 | | 7,936,326 | | 17,410,260 |
| LIABILITIES: | | | | | |
Due to custodian
| — | | — | | — |
| Payables: | | | | | |
Investment advisory fees
| 7,607 | | 5,274 | | 10,026 |
Collateral for securities on loan
| 33,624 | | — | | — |
Deferred foreign capital gains tax
| — | | 6,357 | | — |
Total Liabilities
| 41,231 | | 11,631 | | 10,026 |
NET ASSETS
| $15,965,326 | | $7,924,695 | | $17,400,234 |
| NET ASSETS consist of: | | | | | |
Paid-in capital
| $ 22,564,108 | | $ 10,563,616 | | $ 20,926,391 |
Par value
| 4,000 | | 2,000 | | 6,500 |
Accumulated distributable earnings (loss)
| (6,602,782) | | (2,640,921) | | (3,532,657) |
NET ASSETS
| $15,965,326 | | $7,924,695 | | $17,400,234 |
NET ASSET VALUE, per share
| $39.91 | | $39.62 | | $26.77 |
Number of shares outstanding (unlimited number of shares authorized, par value $0.01 per share)
| 400,002 | | 200,002 | | 650,002 |
Investments, at cost
| $19,850,500 | | $9,239,352 | | $19,664,995 |
Foreign currency, at cost (proceeds)
| $14,888 | | $10,034 | | $— |
Securities on loan, at value
| $31,961 | | $— | | $— |
Page 54
See Notes to Financial Statements
Mid Cap US
Equity Select
ETF
(RNMC) | | Small Cap US
Equity Select
ETF
(RNSC) | | US Equity
Dividend Select
ETF
(RNDV) |
| | | | | |
| $ 15,617,482 | | $ 21,887,006 | | $ 16,120,578 |
| — | | 21,943 | | 23,652 |
| — | | — | | — |
| | | | | |
| 23,514 | | 39,576 | | 37,955 |
| 452 | | — | | 2,301 |
| — | | 247 | | — |
| 15,641,448 | | 21,948,772 | | 16,184,486 |
| | | | | |
| 4,180 | | — | | — |
| | | | | |
| 8,380 | | 11,829 | | 7,259 |
| — | | 51,789 | | — |
| — | | — | | — |
| 12,560 | | 63,618 | | 7,259 |
| $ 15,628,888 | | $ 21,885,154 | | $ 16,177,227 |
| | | | | |
| $ 19,936,860 | | $ 27,898,434 | | $ 20,464,113 |
| 6,500 | | 9,500 | | 6,500 |
| (4,314,472) | | (6,022,780) | | (4,293,386) |
| $ 15,628,888 | | $ 21,885,154 | | $ 16,177,227 |
| $24.04 | | $23.04 | | $24.89 |
| 650,002 | | 950,002 | | 650,002 |
| $18,320,787 | | $26,733,049 | | $19,165,567 |
| $— | | $— | | $— |
| $— | | $49,651 | | $— |
See Notes to Financial Statements
Page 55
First Trust Exchange-Traded Fund VI
Statements of Operations
For the Six Months Ended September 30, 2022 (Unaudited)
| | Developed
International
Equity Select
ETF
(RNDM) | | Emerging
Markets
Equity Select
ETF
(RNEM) | | Large Cap US
Equity Select
ETF
(RNLC) |
| INVESTMENT INCOME: | | | | | |
Dividends
| $ 457,864 | | $ 332,989 | | $ 231,421 |
Interest
| 301 | | 231 | | 132 |
Securities lending income (net of fees)
| 96 | | — | | — |
Foreign withholding tax
| (43,715) | | (49,616) | | (338) |
Other
| 84 | | 4 | | 1 |
Total investment income
| 414,630 | | 283,608 | | 231,216 |
| EXPENSES: | | | | | |
Investment advisory fees
| 61,597 | | 31,654 | | 62,879 |
Total expenses
| 61,597 | | 31,654 | | 62,879 |
NET INVESTMENT INCOME (LOSS)
| 353,033 | | 251,954 | | 168,337 |
| NET REALIZED AND UNREALIZED GAIN (LOSS): | | | | | |
| Net realized gain (loss) on: | | | | | |
Investments
| (307,278) | | (146,206) | | (124,715) |
In-kind redemptions
| 128,841 | | — | | 540,905 |
Foreign currency transactions
| (16,092) | | 4,127 | | — |
Foreign capital gains tax
| — | | (5,295) | | — |
Net realized gain (loss)
| (194,529) | | (147,374) | | 416,190 |
| Net change in unrealized appreciation (depreciation) on: | | | | | |
Investments
| (4,506,355) | | (1,548,052) | | (4,876,661) |
Foreign currency translation
| (5,740) | | (737) | | — |
Deferred foreign capital gains tax
| — | | 15,204 | | — |
Net change in unrealized appreciation (depreciation)
| (4,512,095) | | (1,533,585) | | (4,876,661) |
NET REALIZED AND UNREALIZED GAIN (LOSS)
| (4,706,624) | | (1,680,959) | | (4,460,471) |
NET INCREASE (DECREASE) IN NET ASSETS RESULTING FROM OPERATIONS
| $(4,353,591) | | $(1,429,005) | | $(4,292,134) |
Page 56
See Notes to Financial Statements
| | Mid Cap US
Equity Select
ETF
(RNMC) | | Small Cap US
Equity Select
ETF
(RNSC) | | US Equity
Dividend Select
ETF
(RNDV) |
| | | | | | |
| | $201,041 | | $372,522 | | $305,732 |
| | 124 | | 241 | | 145 |
| | — | | 3,590 | | — |
| | (47) | | (158) | | (308) |
| | 42 | | 15 | | 9 |
| | 201,160 | | 376,210 | | 305,578 |
| | | | | | |
| | 51,670 | | 70,234 | | 46,219 |
| | 51,670 | | 70,234 | | 46,219 |
| | 149,490 | | 305,976 | | 259,359 |
| | | | | | |
| | | | | | |
| | (457,151) | | (834,389) | | (78,388) |
| | 833,647 | | 913,871 | | — |
| | — | | — | | — |
| | — | | — | | — |
| | 376,496 | | 79,482 | | (78,388) |
| | | | | | |
| | (3,725,875) | | (5,616,269) | | (3,561,143) |
| | — | | — | | — |
| | — | | — | | — |
| | (3,725,875) | | (5,616,269) | | (3,561,143) |
| | (3,349,379) | | (5,536,787) | | (3,639,531) |
| | $(3,199,889) | | $(5,230,811) | | $(3,380,172) |
See Notes to Financial Statements
Page 57
First Trust Exchange-Traded Fund VI
Statements of Changes in Net Assets
| | Developed
International
Equity Select
ETF (RNDM) | | Emerging Markets
Equity Select
ETF (RNEM) | | Large Cap US
Equity Select
ETF (RNLC) |
| | Six Months
Ended
9/30/2022
(Unaudited) | | Year
Ended
3/31/2022 | | Six Months
Ended
9/30/2022
(Unaudited) | | Year
Ended
3/31/2022 | | Six Months
Ended
9/30/2022
(Unaudited) | | Year
Ended
3/31/2022 |
| OPERATIONS: | | | | | | | | | | | |
Net investment income (loss)
| $ 353,033 | | $ 612,626 | | $ 251,954 | | $ 242,593 | | $ 168,337 | | $ 322,827 |
Net realized gain (loss)
| (194,529) | | 2,370,496 | | (147,374) | | 364,099 | | 416,190 | | 6,041,882 |
Net change in unrealized appreciation (depreciation)
| (4,512,095) | | (2,937,328) | | (1,533,585) | | (464,909) | | (4,876,661) | | (3,315,959) |
Net increase (decrease) in net assets resulting from operations
| (4,353,591) | | 45,794 | | (1,429,005) | | 141,783 | | (4,292,134) | | 3,048,750 |
| DISTRIBUTIONS TO SHAREHOLDERS FROM: | | | | | | | | | | | |
Investment operations
| (391,202) | | (703,193) | | (243,903) | | (180,487) | | (156,030) | | (328,071) |
Return of capital
| — | | — | | — | | (49,961) | | — | | — |
Total distributions to shareholders
| (391,202) | | (703,193) | | (243,903) | | (230,448) | | (156,030) | | (328,071) |
| SHAREHOLDER TRANSACTIONS: | | | | | | | | | | | |
Proceeds from shares sold
| 4,346,583 | | 5,595,303 | | 2,305,295 | | — | | 3,125,444 | | 11,195,391 |
Cost of shares redeemed
| (7,143,304) | | (5,356,575) | | — | | — | | (2,954,881) | | (17,927,661) |
Net increase (decrease) in net assets resulting from shareholder transactions
| (2,796,721) | | 238,728 | | 2,305,295 | | — | | 170,563 | | (6,732,270) |
Total increase (decrease) in net assets
| (7,541,514) | | (418,671) | | 632,387 | | (88,665) | | (4,277,601) | | (4,011,591) |
| NET ASSETS: | | | | | | | | | | | |
Beginning of period
| 23,506,840 | | 23,925,511 | | 7,292,308 | | 7,380,973 | | 21,677,835 | | 25,689,426 |
End of period
| $15,965,326 | | $23,506,840 | | $7,924,695 | | $7,292,308 | | $17,400,234 | | $21,677,835 |
| CHANGES IN SHARES OUTSTANDING: | | | | | | | | | | | |
Shares outstanding, beginning of period
| 450,002 | | 450,002 | | 150,002 | | 150,002 | | 650,002 | | 850,002 |
Shares sold
| 100,000 | | 100,000 | | 50,000 | | — | | 100,000 | | 350,000 |
Shares redeemed
| (150,000) | | (100,000) | | — | | — | | (100,000) | | (550,000) |
Shares outstanding, end of period
| 400,002 | | 450,002 | | 200,002 | | 150,002 | | 650,002 | | 650,002 |
Page 58
See Notes to Financial Statements
Mid Cap US
Equity Select
ETF (RNMC) | | Small Cap US
Equity Select
ETF (RNSC) | | US Equity
Dividend Select
ETF (RNDV) |
Six Months
Ended
9/30/2022
(Unaudited) | | Year
Ended
3/31/2022 | | Six Months
Ended
9/30/2022
(Unaudited) | | Year
Ended
3/31/2022 | | Six Months
Ended
9/30/2022
(Unaudited) | | Year
Ended
3/31/2022 |
| | | | | | | | | | | |
| $ 149,490 | | $ 241,500 | | $ 305,976 | | $ 274,780 | | $ 259,359 | | $ 374,454 |
| 376,496 | | 3,693,023 | | 79,482 | | 2,198,102 | | (78,388) | | 1,755,695 |
| (3,725,875) | | (2,661,207) | | (5,616,269) | | (1,832,012) | | (3,561,143) | | (644,056) |
| (3,199,889) | | 1,273,316 | | (5,230,811) | | 640,870 | | (3,380,172) | | 1,486,093 |
| | | | | | | | | | | |
| (127,790) | | (244,191) | | (236,185) | | (261,631) | | (241,541) | | (359,126) |
| — | | — | | — | | — | | — | | — |
| (127,790) | | (244,191) | | (236,185) | | (261,631) | | (241,541) | | (359,126) |
| | | | | | | | | | | |
| 5,684,607 | | 13,029,289 | | 9,895,658 | | 18,629,899 | | 1,508,047 | | 19,135,641 |
| (2,898,643) | | (14,535,290) | | (4,268,854) | | (7,148,164) | | — | | (10,393,637) |
| 2,785,964 | | (1,506,001) | | 5,626,804 | | 11,481,735 | | 1,508,047 | | 8,742,004 |
| (541,715) | | (476,876) | | 159,808 | | 11,860,974 | | (2,113,666) | | 9,868,971 |
| | | | | | | | | | | |
| 16,170,603 | | 16,647,479 | | 21,725,346 | | 9,864,372 | | 18,290,893 | | 8,421,922 |
| $15,628,888 | | $16,170,603 | | $21,885,154 | | $21,725,346 | | $16,177,227 | | $18,290,893 |
| | | | | | | | | | | |
| 550,002 | | 600,002 | | 750,002 | | 350,002 | | 600,002 | | 300,002 |
| 200,000 | | 450,000 | | 350,000 | | 650,000 | | 50,000 | | 650,000 |
| (100,000) | | (500,000) | | (150,000) | | (250,000) | | — | | (350,000) |
| 650,002 | | 550,002 | | 950,002 | | 750,002 | | 650,002 | | 600,002 |
See Notes to Financial Statements
Page 59
First Trust Exchange-Traded Fund VI
Financial Highlights
For a share outstanding throughout each period
Developed International Equity Select ETF (RNDM)
| | Six Months
Ended
9/30/2022
(Unaudited) | | Year Ended | | Period
Ended
3/31/2018 (a) |
| | 3/31/2022 | | 3/31/2021 | | 3/31/2020 | | 3/31/2019 | |
Net asset value, beginning of period
| $ 52.24 | | $ 53.17 | | $ 39.88 | | $ 49.45 | | $ 51.38 | | $ 49.73 |
| Income from investment operations: | | | | | | | | | | | |
Net investment income (loss)
| 0.90 | | 1.24 | | 0.90 | | 1.11 | | 1.07 | | 0.62 |
Net realized and unrealized gain (loss)
| (12.25) | | (0.73) | | 13.01 | | (9.02) | | (1.90) | | 1.48 |
Total from investment operations
| (11.35) | | 0.51 | | 13.91 | | (7.91) | | (0.83) | | 2.10 |
| Distributions paid to shareholders from: | | | | | | | | | | | |
Net investment income
| (0.98) | | (1.44) | | (0.62) | | (1.66) | | (1.10) | | (0.45) |
Net asset value, end of period
| $39.91 | | $52.24 | | $53.17 | | $39.88 | | $49.45 | | $51.38 |
Total return (b)
| (21.91)% | | 0.82% | | 34.93% | | (16.64)% | | (1.71)% | | 4.23% |
| Ratios to average net assets/supplemental data: | | | | | | | | | | | |
Net assets, end of period (in 000’s)
| $ 15,965 | | $ 23,507 | | $ 23,926 | | $ 23,929 | | $ 24,727 | | $ 12,846 |
Ratio of total expenses to average net assets
| 0.65% (c) | | 0.65% | | 0.65% | | 0.65% | | 0.65% | | 0.66% (c) (d) |
Ratio of net investment income (loss) to average net assets
| 3.73% (c) | | 2.26% | | 1.86% | | 2.24% | | 2.32% | | 1.74% (c) |
Portfolio turnover rate (e)
| 46% | | 69% | | 89% | | 62% | | 52% | | 21% |
| (a) | Inception date is June 20, 2017, which is consistent with the commencement of investment operations and is the date the initial creation units were established. |
| (b) | Total return is calculated assuming an initial investment made at the net asset value at the beginning of the period, reinvestment of all distributions at net asset value during the period, and redemption at net asset value on the last day of the period. The returns presented do not reflect the deduction of taxes that a shareholder would pay on Fund distributions or the redemption or sale of Fund shares. Total return is calculated for the time period presented and is not annualized for periods of less than a year. |
| (c) | Annualized. |
| (d) | Includes excise tax. If this excise tax was not included, the expense ratio would have been 0.65%. |
| (e) | Portfolio turnover is calculated for the time period presented and is not annualized for periods of less than a year and does not include securities received or delivered from processing creations or redemptions and in-kind transactions. |
Page 60
See Notes to Financial Statements
First Trust Exchange-Traded Fund VI
Financial Highlights (Continued)
For a share outstanding throughout each period
Emerging Markets Equity Select ETF (RNEM)
| | Six Months
Ended
9/30/2022
(Unaudited) | | Year Ended | | Period
Ended
3/31/2018 (a) |
| | 3/31/2022 | | 3/31/2021 | | 3/31/2020 | | 3/31/2019 | |
Net asset value, beginning of period
| $ 48.61 | | $ 49.21 | | $ 37.80 | | $ 50.89 | | $ 54.94 | | $ 49.71 |
| Income from investment operations: | | | | | | | | | | | |
Net investment income (loss)
| 1.30 | | 1.61 | | 1.15 | | 1.50 | | 1.10 | | 0.70 |
Net realized and unrealized gain (loss)
| (9.07) | | (0.67) | | 11.64 | | (13.22) | | (3.62) | | 5.78 |
Total from investment operations
| (7.77) | | 0.94 | | 12.79 | | (11.72) | | (2.52) | | 6.48 |
| Distributions paid to shareholders from: | | | | | | | | | | | |
Net investment income
| (1.22) | | (1.20) | | (1.38) | | (1.37) | | (1.19) | | (0.67) |
Net realized gain
| — | | — | | — | | — | | (0.34) | | (0.58) |
Return of capital
| — | | (0.34) | | — | | — | | — | | — |
Total distributions
| (1.22) | | (1.54) | | (1.38) | | (1.37) | | (1.53) | | (1.25) |
Net asset value, end of period
| $39.62 | | $48.61 | | $49.21 | | $37.80 | | $50.89 | | $54.94 |
Total return (b)
| (16.02)% | | 1.91% | | 34.44% | | (23.66)% | | (4.48)% | | 13.15% |
| Ratios to average net assets/supplemental data: | | | | | | | | | | | |
Net assets, end of period (in 000’s)
| $ 7,925 | | $ 7,292 | | $ 7,381 | | $ 7,561 | | $ 12,723 | | $ 5,494 |
Ratio of total expenses to average net assets
| 0.75% (c) | | 0.75% | | 0.75% | | 0.75% | | 0.75% | | 0.75% (c) |
Ratio of net investment income (loss) to average net assets
| 5.97% (c) | | 3.30% | | 2.94% | | 2.83% | | 2.04% | | 1.75% (c) |
Portfolio turnover rate (d)
| 35% | | 72% | | 75% | | 82% | | 69% | | 111% |
| (a) | Inception date is June 20, 2017, which is consistent with the commencement of investment operations and is the date the initial creation units were established. |
| (b) | Total return is calculated assuming an initial investment made at the net asset value at the beginning of the period, reinvestment of all distributions at net asset value during the period, and redemption at net asset value on the last day of the period. The returns presented do not reflect the deduction of taxes that a shareholder would pay on Fund distributions or the redemption or sale of Fund shares. Total return is calculated for the time period presented and is not annualized for periods of less than a year. |
| (c) | Annualized. |
| (d) | Portfolio turnover is calculated for the time period presented and is not annualized for periods of less than a year and does not include securities received or delivered from processing creations or redemptions and in-kind transactions. |
See Notes to Financial Statements
Page 61
First Trust Exchange-Traded Fund VI
Financial Highlights (Continued)
For a share outstanding throughout each period
Large Cap US Equity Select ETF (RNLC)
| | Six Months
Ended
9/30/2022
(Unaudited) | | Year Ended | | Period
Ended
3/31/2018 (a) |
| | 3/31/2022 | | 3/31/2021 | | 3/31/2020 | | 3/31/2019 | |
Net asset value, beginning of period
| $ 33.35 | | $ 30.22 | | $ 18.85 | | $ 22.12 | | $ 21.54 | | $ 19.83 |
| Income from investment operations: | | | | | | | | | | | |
Net investment income (loss)
| 0.24 | | 0.38 | | 0.34 | | 0.46 | | 0.38 | | 0.21 |
Net realized and unrealized gain (loss)
| (6.60) | | 3.13 | | 11.39 | | (3.27) | | 0.56 | | 1.68 |
Total from investment operations
| (6.36) | | 3.51 | | 11.73 | | (2.81) | | 0.94 | | 1.89 |
| Distributions paid to shareholders from: | | | | | | | | | | | |
Net investment income
| (0.22) | | (0.38) | | (0.36) | | (0.46) | | (0.36) | | (0.18) |
Net asset value, end of period
| $26.77 | | $33.35 | | $30.22 | | $18.85 | | $22.12 | | $21.54 |
Total return (b)
| (19.08)% | | 11.62% | | 62.65% | | (12.98)% | | 4.45% | | 9.54% |
| Ratios to average net assets/supplemental data: | | | | | | | | | | | |
Net assets, end of period (in 000’s)
| $ 17,400 | | $ 21,678 | | $ 25,689 | | $ 15,081 | | $ 18,800 | | $ 21,536 |
Ratio of total expenses to average net assets
| 0.60% (c) | | 0.60% | | 0.60% | | 0.60% | | 0.60% | | 0.60% (c) |
Ratio of net investment income (loss) to average net assets
| 1.61% (c) | | 1.13% | | 1.41% | | 2.03% | | 1.72% | | 1.71% (c) |
Portfolio turnover rate (d)
| 16% | | 21% | | 34% | | 24% | | 28% | | 11% |
| (a) | Inception date is June 20, 2017, which is consistent with the commencement of investment operations and is the date the initial creation units were established. |
| (b) | Total return is calculated assuming an initial investment made at the net asset value at the beginning of the period, reinvestment of all distributions at net asset value during the period, and redemption at net asset value on the last day of the period. The returns presented do not reflect the deduction of taxes that a shareholder would pay on Fund distributions or the redemption or sale of Fund shares. Total return is calculated for the time period presented and is not annualized for periods of less than a year. |
| (c) | Annualized. |
| (d) | Portfolio turnover is calculated for the time period presented and is not annualized for periods of less than a year and does not include securities received or delivered from processing creations or redemptions and in-kind transactions. |
Page 62
See Notes to Financial Statements
First Trust Exchange-Traded Fund VI
Financial Highlights (Continued)
For a share outstanding throughout each period
Mid Cap US Equity Select ETF (RNMC)
| | Six Months
Ended
9/30/2022
(Unaudited) | | Year Ended | | Period
Ended
3/31/2018 (a) |
| | 3/31/2022 | | 3/31/2021 | | 3/31/2020 | | 3/31/2019 | |
Net asset value, beginning of period
| $ 29.40 | | $ 27.75 | | $ 15.85 | | $ 21.31 | | $ 21.18 | | $ 19.78 |
| Income from investment operations: | | | | | | | | | | | |
Net investment income (loss)
| 0.23 | | 0.35 | | 0.33 | | 0.39 | | 0.32 | | 0.23 |
Net realized and unrealized gain (loss)
| (5.39) | | 1.65 | | 11.90 | | (5.45) | | 0.12 | | 1.36 |
Total from investment operations
| (5.16) | | 2.00 | | 12.23 | | (5.06) | | 0.44 | | 1.59 |
| Distributions paid to shareholders from: | | | | | | | | | | | |
Net investment income
| (0.20) | | (0.35) | | (0.33) | | (0.40) | | (0.31) | | (0.19) |
Net asset value, end of period
| $24.04 | | $29.40 | | $27.75 | | $15.85 | | $21.31 | | $21.18 |
Total return (b)
| (17.58)% | | 7.26% | | 77.60% | | (24.23)% | | 2.16% | | 8.03% |
| Ratios to average net assets/supplemental data: | | | | | | | | | | | |
Net assets, end of period (in 000’s)
| $ 15,629 | | $ 16,171 | | $ 16,647 | | $ 11,096 | | $ 13,853 | | $ 6,355 |
Ratio of total expenses to average net assets
| 0.60% (c) | | 0.60% | | 0.60% | | 0.60% | | 0.60% | | 0.60% (c) |
Ratio of net investment income (loss) to average net assets
| 1.74% (c) | | 1.22% | | 1.46% | | 1.76% | | 1.70% | | 1.71% (c) |
Portfolio turnover rate (d)
| 24% | | 43% | | 60% | | 43% | | 42% | | 40% |
| (a) | Inception date is June 20, 2017, which is consistent with the commencement of investment operations and is the date the initial creation units were established. |
| (b) | Total return is calculated assuming an initial investment made at the net asset value at the beginning of the period, reinvestment of all distributions at net asset value during the period, and redemption at net asset value on the last day of the period. The returns presented do not reflect the deduction of taxes that a shareholder would pay on Fund distributions or the redemption or sale of Fund shares. Total return is calculated for the time period presented and is not annualized for periods of less than a year. |
| (c) | Annualized. |
| (d) | Portfolio turnover is calculated for the time period presented and is not annualized for periods of less than a year and does not include securities received or delivered from processing creations or redemptions and in-kind transactions. |
See Notes to Financial Statements
Page 63
First Trust Exchange-Traded Fund VI
Financial Highlights (Continued)
For a share outstanding throughout each period
Small Cap US Equity Select ETF (RNSC)
| | Six Months
Ended
9/30/2022
(Unaudited) | | Year Ended | | Period
Ended
3/31/2018 (a) |
| | 3/31/2022 | | 3/31/2021 | | 3/31/2020 | | 3/31/2019 | |
Net asset value, beginning of period
| $ 28.97 | | $ 28.18 | | $ 14.87 | | $ 20.84 | | $ 20.88 | | $ 19.73 |
| Income from investment operations: | | | | | | | | | | | |
Net investment income (loss)
| 0.32 | | 0.46 | | 0.28 | | 0.36 | | 0.46 | | 0.34 |
Net realized and unrealized gain (loss)
| (6.00) | | 0.78 | | 13.34 | | (5.98) | | (0.09) | | 1.10 |
Total from investment operations
| (5.68) | | 1.24 | | 13.62 | | (5.62) | | 0.37 | | 1.44 |
| Distributions paid to shareholders from: | | | | | | | | | | | |
Net investment income
| (0.25) | | (0.45) | | (0.31) | | (0.35) | | (0.41) | | (0.29) |
Net asset value, end of period
| $23.04 | | $28.97 | | $28.18 | | $14.87 | | $20.84 | | $20.88 |
Total return (b)
| (19.62)% | | 4.39% | | 92.49% | | (27.51)% | | 1.78% | | 7.26% |
| Ratios to average net assets/supplemental data: | | | | | | | | | | | |
Net assets, end of period (in 000’s)
| $ 21,885 | | $ 21,725 | | $ 9,864 | | $ 5,946 | | $ 5,210 | | $ 4,175 |
Ratio of total expenses to average net assets
| 0.60% (c) | | 0.60% | | 0.60% | | 0.60% | | 0.60% | | 0.60% (c) |
Ratio of net investment income (loss) to average net assets
| 2.61% (c) | | 1.79% | | 1.37% | | 1.97% | | 2.25% | | 2.22% (c) |
Portfolio turnover rate (d)
| 33% | | 49% | | 71% | | 52% | | 52% | | 49% |
| (a) | Inception date is June 20, 2017, which is consistent with the commencement of investment operations and is the date the initial creation units were established. |
| (b) | Total return is calculated assuming an initial investment made at the net asset value at the beginning of the period, reinvestment of all distributions at net asset value during the period, and redemption at net asset value on the last day of the period. The returns presented do not reflect the deduction of taxes that a shareholder would pay on Fund distributions or the redemption or sale of Fund shares. Total return is calculated for the time period presented and is not annualized for periods of less than a year. |
| (c) | Annualized. |
| (d) | Portfolio turnover is calculated for the time period presented and is not annualized for periods of less than a year and does not include securities received or delivered from processing creations or redemptions and in-kind transactions. |
Page 64
See Notes to Financial Statements
First Trust Exchange-Traded Fund VI
Financial Highlights (Continued)
For a share outstanding throughout each period
US Equity Dividend Select ETF (RNDV)
| | Six Months
Ended
9/30/2022
(Unaudited) | | Year Ended | | Period
Ended
3/31/2018 (a) |
| | 3/31/2022 | | 3/31/2021 | | 3/31/2020 | | 3/31/2019 | |
Net asset value, beginning of period
| $ 30.48 | | $ 28.07 | | $ 17.50 | | $ 21.73 | | $ 21.09 | | $ 19.85 |
| Income from investment operations: | | | | | | | | | | | |
Net investment income (loss)
| 0.39 | | 0.64 | | 0.58 | | 0.73 | | 0.78 | | 0.41 |
Net realized and unrealized gain (loss)
| (5.61) | | 2.40 | | 10.61 | | (4.24) | | 0.58 | | 1.18 |
Total from investment operations
| (5.22) | | 3.04 | | 11.19 | | (3.51) | | 1.36 | | 1.59 |
| Distributions paid to shareholders from: | | | | | | | | | | | |
Net investment income
| (0.37) | | (0.63) | | (0.62) | | (0.72) | | (0.72) | | (0.35) |
Net asset value, end of period
| $24.89 | | $30.48 | | $28.07 | | $17.50 | | $21.73 | | $21.09 |
Total return (b)
| (17.16)% | | 10.86% | | 64.82% | | (16.81)% | | 6.64% | | 8.00% |
| Ratios to average net assets/supplemental data: | | | | | | | | | | | |
Net assets, end of period (in 000’s)
| $ 16,177 | | $ 18,291 | | $ 8,422 | | $ 4,375 | | $ 5,434 | | $ 12,654 |
Ratio of total expenses to average net assets
| 0.50% (c) | | 0.50% | | 0.50% | | 0.50% | | 0.50% | | 0.50% (c) (d) |
Ratio of net investment income (loss) to average net assets
| 2.81% (c) | | 2.33% | | 2.65% | | 3.23% | | 2.98% | | 3.32% (c) |
Portfolio turnover rate (e)
| 28% | | 41% | | 89% | | 78% | | 98% | | 37% |
| (a) | Inception date is June 20, 2017, which is consistent with the commencement of investment operations and is the date the initial creation units were established. |
| (b) | Total return is calculated assuming an initial investment made at the net asset value at the beginning of the period, reinvestment of all distributions at net asset value during the period, and redemption at net asset value on the last day of the period. The returns presented do not reflect the deduction of taxes that a shareholder would pay on Fund distributions or the redemption or sale of Fund shares. Total return is calculated for the time period presented and is not annualized for periods of less than a year. |
| (c) | Annualized. |
| (d) | Includes excise tax. |
| (e) | Portfolio turnover is calculated for the time period presented and is not annualized for periods of less than a year and does not include securities received or delivered from processing creations or redemptions and in-kind transactions. |
See Notes to Financial Statements
Page 65
Notes to Financial Statements
First Trust Exchange-Traded Fund VI
September 30, 2022 (Unaudited)
1. Organization
First Trust Exchange-Traded Fund VI (the “Trust”) is an open-end management investment company organized as a Massachusetts business trust on June 4, 2012, and is registered with the Securities and Exchange Commission (“SEC”) under the Investment Company Act of 1940, as amended (the “1940 Act”).
The Trust currently consists of thirty-three exchange-traded funds that are offering shares. This report covers the six funds (each a “Fund” and collectively, the “Funds”) listed below, each a diversified series of the Trust and listed and traded on The Nasdaq Stock Market LLC (“Nasdaq”).
Developed International Equity Select ETF - (ticker “RNDM”)
Emerging Markets Equity Select ETF - (ticker “RNEM”)
Large Cap US Equity Select ETF - (ticker “RNLC”)
Mid Cap US Equity Select ETF - (ticker “RNMC”)
Small Cap US Equity Select ETF - (ticker “RNSC”)
US Equity Dividend Select ETF - (ticker “RNDV”)
Each Fund represents a separate series of beneficial interest in the Trust. Unlike conventional mutual funds, each Fund issues and redeems shares on a continuous basis, at net asset value (“NAV”), only in large blocks of shares known as “Creation Units.” The investment objective of each Fund is to seek investment results that correspond generally to the price and yield (before the Fund’s fees and expenses) of the following indices:
| Fund | Index |
| Developed International Equity Select ETF | Nasdaq Riskalyze Developed Markets IndexTM |
| Emerging Markets Equity Select ETF | Nasdaq Riskalyze Emerging Markets IndexTM |
| Large Cap US Equity Select ETF | Nasdaq Riskalyze US Large Cap IndexTM |
| Mid Cap US Equity Select ETF | Nasdaq Riskalyze US Mid Cap IndexTM |
| Small Cap US Equity Select ETF | Nasdaq Riskalyze US Small Cap IndexTM |
| US Equity Dividend Select ETF | Nasdaq Riskalyze US Large Cap Select Dividend IndexTM |
2. Significant Accounting Policies
The Funds are each considered an investment company and follow accounting and reporting guidance under Financial Accounting Standards Board Accounting Standards Codification Topic 946, “Financial Services-Investment Companies.” The following is a summary of significant accounting policies consistently followed by the Funds in the preparation of the financial statements. The preparation of the financial statements in accordance with accounting principles generally accepted in the United States of America (“U.S. GAAP”) requires management to make estimates and assumptions that affect the reported amounts and disclosures in the financial statements. Actual results could differ from those estimates.
A. Portfolio Valuation
Each Fund’s NAV is determined daily as of the close of regular trading on the New York Stock Exchange (“NYSE”), normally 4:00 p.m. Eastern time, on each day the NYSE is open for trading. If the NYSE closes early on a valuation day, the NAV is determined as of that time. Foreign securities are priced using data reflecting the earlier closing of the principal markets for those securities. Each Fund’s NAV is calculated by dividing the value of all assets of each Fund (including accrued interest and dividends), less all liabilities (including accrued expenses and dividends declared but unpaid), by the total number of shares outstanding.
Each Fund’s investments are valued daily at market value or, in the absence of market value with respect to any portfolio securities, at fair value. Market value prices represent readily available market quotations such as last sale or official closing prices from a national or foreign exchange (i.e., a regulated market) and are primarily obtained from third-party pricing services. Fair value prices represent any prices not considered market value prices and are either obtained from a third-party pricing service or are determined by the Pricing Committee of the Funds’ investment advisor, First Trust Advisors L.P. (“First Trust” or the “Advisor”), in accordance with valuation procedures approved by the Trust’s Board of Trustees, and in accordance with provisions of the 1940 Act and rules thereunder. Investments valued by the Advisor’s Pricing Committee, if any, are footnoted as such in the footnotes to the Portfolio of Investments. Each Fund’s investments are valued as follows:
Common stocks, real estate investment trusts (“REITs”), and other equity securities listed on any national or foreign exchange (excluding Nasdaq and the London Stock Exchange Alternative Investment Market (“AIM”)) are valued at the last sale price on the exchange on which they are principally traded or, for Nasdaq and AIM securities, the official closing price. Securities traded
Notes to Financial Statements (Continued)
First Trust Exchange-Traded Fund VI
September 30, 2022 (Unaudited)
on more than one securities exchange are valued at the last sale price or official closing price, as applicable, at the close of the securities exchange representing the primary exchange for such securities.
Securities trading on foreign exchanges or over-the-counter markets that close prior to the NYSE close may be valued using a systematic fair valuation model provided by a third-party pricing service. If these foreign securities meet certain criteria in relation to the valuation model, their valuation is systematically adjusted to reflect the impact of movement in the U.S. market after the close of the foreign markets.
Shares of open-end funds are valued based on NAV per share.
Securities traded in an over-the-counter market are valued at the mean of their most recent bid and asked price, if available, and otherwise at their last trade price.
Overnight repurchase agreements are valued at amortized cost when it represents the most appropriate reflection of fair market value.
Certain securities may not be able to be priced by pre-established pricing methods. Such securities may be valued by the Advisor’s Pricing Committee at fair value. These securities generally include, but are not limited to, restricted securities (securities which may not be publicly sold without registration under the Securities Act of 1933, as amended) for which a third-party pricing service is unable to provide a market price; securities whose trading has been formally suspended; a security whose market or fair value price is not available from a pre-established pricing source; a security with respect to which an event has occurred that is likely to materially affect the value of the security after the market has closed but before the calculation of a Fund’s NAV or make it difficult or impossible to obtain a reliable market quotation; and a security whose price, as provided by the third-party pricing service, does not reflect the security’s fair value. As a general principle, the current fair value of a security would appear to be the amount which the owner might reasonably expect to receive for the security upon its current sale. When fair value prices are used, generally they will differ from market quotations or official closing prices on the applicable exchanges. A variety of factors may be considered in determining the fair value of such securities, including, but not limited to, the following:
| 1) | the last sale price on the exchange on which they are principally traded or, for Nasdaq and AIM securities, the official closing price; |
| 2) | the type of security; |
| 3) | the size of the holding; |
| 4) | the initial cost of the security; |
| 5) | transactions in comparable securities; |
| 6) | price quotes from dealers and/or third-party pricing services; |
| 7) | relationships among various securities; |
| 8) | information obtained by contacting the issuer, analysts, or the appropriate stock exchange; |
| 9) | an analysis of the issuer’s financial statements; |
| 10) | the existence of merger proposals or tender offers that might affect the value of the security; and |
| 11) | other relevant factors. |
If the securities in question are foreign securities, the following additional information may be considered:
| 1) | the value of similar foreign securities traded on other foreign markets; |
| 2) | ADR trading of similar securities; |
| 3) | closed-end fund or exchange-traded fund trading of similar securities; |
| 4) | foreign currency exchange activity; |
| 5) | the trading prices of financial products that are tied to baskets of foreign securities; |
| 6) | factors relating to the event that precipitated the pricing problem; |
| 7) | whether the event is likely to recur; |
| 8) | whether the effects of the event are isolated or whether they affect entire markets, countries or regions; and |
| 9) | other relevant factors. |
In addition, differences between the prices used to calculate a Fund’s NAV and the prices used by such Fund’s corresponding index could result in a difference between a Fund’s performance and the performance of its underlying index.
Because foreign markets may be open on different days than the days during which investors may transact in the shares of a Fund, the value of the Fund’s securities may change on the days when investors are not able to transact in the shares of the Fund. The value of
Notes to Financial Statements (Continued)
First Trust Exchange-Traded Fund VI
September 30, 2022 (Unaudited)
securities denominated in foreign currencies is converted into U.S. dollars using exchange rates determined daily as of the close of regular trading on the NYSE. Any use of a different rate from the rates used by a relevant index may adversely affect the Fund’s ability to track the index.
The Funds are subject to fair value accounting standards that define fair value, establish the framework for measuring fair value and provide a three-level hierarchy for fair valuation based upon the inputs to the valuation as of the measurement date. The three levels of the fair value hierarchy are as follows:
| • | Level 1 – Level 1 inputs are quoted prices in active markets for identical investments. An active market is a market in which transactions for the investment occur with sufficient frequency and volume to provide pricing information on an ongoing basis. |
| • | Level 2 – Level 2 inputs are observable inputs, either directly or indirectly, and include the following: |
| o | Quoted prices for similar investments in active markets. |
| o | Quoted prices for identical or similar investments in markets that are non-active. A non-active market is a market where there are few transactions for the investment, the prices are not current, or price quotations vary substantially either over time or among market makers, or in which little information is released publicly. |
| o | Inputs other than quoted prices that are observable for the investment (for example, interest rates and yield curves observable at commonly quoted intervals, volatilities, prepayment speeds, loss severities, credit risks, and default rates). |
| o | Inputs that are derived principally from or corroborated by observable market data by correlation or other means. |
| • | Level 3 – Level 3 inputs are unobservable inputs. Unobservable inputs may reflect the reporting entity’s own assumptions about the assumptions that market participants would use in pricing the investment. |
The inputs or methodologies used for valuing investments are not necessarily an indication of the risk associated with investing in those investments. A summary of the inputs used to value each Fund’s investments as of September 30, 2022, is included with each Fund’s Portfolio of Investments.
In December 2020, the SEC adopted Rule 2a-5 under the 1940 Act, establishing requirements to determine fair value in good faith for purposes of the 1940 Act. The rule permits fund boards to designate a fund’s investment adviser to perform fair value determinations, subject to board oversight and certain other conditions. The rule also defines when market quotations are “readily available” for purposes of the 1940 Act and requires a fund to fair value a portfolio investment when a market quotation is not readily available. The SEC also adopted new Rule 31a-4 under the 1940 Act, which sets forth recordkeeping requirements associated with fair value determinations. The compliance date for Rule 2a-5 and Rule 31a-4 was September 8, 2022.
Effective September 8, 2022 and pursuant to the requirements of Rule 2a-5, the Trust’s Board of Trustees designated the Advisor as its valuation designee to perform fair value determinations and approved new Advisor Valuation Procedures for the Trust.
B. Securities Transactions and Investment Income
Securities transactions are recorded as of the trade date. Realized gains and losses from securities transactions are recorded on the identified cost basis. Dividend income is recorded on the ex-dividend date except that certain dividends from foreign securities are recorded as soon as the information becomes available after the ex-dividend date. Interest income, if any, is recorded on the accrual basis.
Withholding taxes and tax reclaims on foreign dividends have been provided for in accordance with each Fund’s understanding of the applicable country’s tax rules and rates.
Distributions received from a Fund’s investments in REITs may be comprised of return of capital, capital gains, and income. The actual character of the amounts received during the year are not known until after the REITs’ fiscal year end. A Fund records the character of distributions received from the REITs during the year based on estimates available. The characterization of distributions received by a Fund may be subsequently revised based on information received from the REITs after their tax reporting periods conclude.
C. Foreign Currency
The books and records of the Funds are maintained in U.S. dollars. Foreign currencies, investments and other assets and liabilities are translated into U.S. dollars at the exchange rates prevailing at the end of the period. Purchases and sales of investments and items of income and expense are translated on the respective dates of such transactions. Unrealized gains and losses on assets and liabilities, other than investments in securities, which result from changes in foreign currency exchange rates have been included in “Net change
Notes to Financial Statements (Continued)
First Trust Exchange-Traded Fund VI
September 30, 2022 (Unaudited)
in unrealized appreciation (depreciation) on foreign currency translation” on the Statements of Operations. Unrealized gains and losses on investments in securities which result from changes in foreign exchange rates are included with fluctuations arising from changes in market price and are shown in “Net change in unrealized appreciation (depreciation) on investments” on the Statements of Operations. Net realized foreign currency gains and losses include the effect of changes in exchange rates between trade date and settlement date on investment security transactions, foreign currency transactions and interest and dividends received and are shown in “Net realized gain (loss) on foreign currency transactions” on the Statements of Operations. The portion of foreign currency gains and losses related to fluctuation in exchange rates between the initial purchase settlement date and subsequent sale trade date is included in “Net realized gain (loss) on investments” on the Statements of Operations.
D. Offsetting on the Statements of Assets and Liabilities
Offsetting assets and liabilities requires entities to disclose both gross and net information about instruments and transactions eligible for offset on the Statements of Assets and Liabilities and disclose instruments and transactions subject to master netting or similar agreements. These disclosure requirements are intended to help investors and other financial statement users better assess the effect or potential effect of offsetting arrangements on a Fund’s financial position. The transactions subject to offsetting disclosures are derivative instruments, repurchase agreements and reverse repurchase agreements, and securities borrowing and securities lending transactions.
This disclosure, if applicable, is included within each Fund’s Portfolio of Investments under the heading “Offsetting Assets and Liabilities.” For financial reporting purposes, the Funds do not offset financial assets and financial liabilities that are subject to master netting arrangements (“MNAs”) or similar agreements on the Statements of Assets and Liabilities. MNAs provide the right, in the event of default (including bankruptcy and insolvency), for the non-defaulting counterparty to liquidate the collateral and calculate the net exposure to the defaulting party or request additional collateral.
E. Securities Lending
The Funds may lend securities representing up to 33 1/3% of the value of their total assets to broker-dealers, banks and other institutions to generate additional income. When a Fund loans its portfolio securities, it will receive, at the inception of each loan, collateral equal to at least 102% (for domestic securities) or 105% (for international securities) of the market value of the loaned securities. The collateral amount is valued at the beginning of each business day and is compared to the market value of the loaned securities from the prior business day to determine if additional collateral is required. If additional collateral is required, a request is sent to the borrower. Securities lending involves the risk that the Fund may lose money because the borrower of the Fund’s loaned securities fails to return the securities in a timely manner or at all. The Fund could also lose money in the event of (i) a decline in the value of the collateral provided for the loaned securities, (ii) a decline in the value of any investments made with cash collateral or (iii) an increase in the value of the loaned securities if the borrower does not increase the collateral accordingly and the borrower fails to return the securities. These events could also trigger adverse tax consequences for the Funds.
Under the Funds’ Securities Lending Agency Agreement, the securities lending agent will generally bear the risk that a borrower may default on its obligation to return loaned securities. Brown Brothers Harriman & Co. (“BBH”) acts as the Funds’ securities lending agent and is responsible for executing the lending of the portfolio securities to creditworthy borrowers. The Funds, however, will be responsible for the risks associated with the investment of cash collateral. A Fund may lose money on its investment of cash collateral, which may affect its ability to repay the collateral to the borrower without the use of other Fund assets. Each Fund that engages in securities lending receives compensation (net of any rebate and securities lending agent fees) for lending its securities. Compensation can be in the form of fees received from the securities lending agent or dividends or interest earned from the investment of cash collateral. The fees received from the securities lending agent are accrued daily. The dividend and interest earned on the securities loaned is accounted for in the same manner as other dividend and interest income. At September 30, 2022, RNDM and RNSC had securities in the securities lending program. During the six months ended September 30, 2022, only RNDM and RNSC participated in the securities lending program.
In the event of a default by a borrower with respect to any loan, BBH will exercise any and all remedies provided under the applicable borrower agreement to make the Funds whole. These remedies include purchasing replacement securities by applying the collateral held from the defaulting broker against the purchase cost of the replacement securities. If, despite such efforts by BBH to exercise these remedies, a Fund sustains losses as a result of a borrower’s default, BBH will indemnify the Fund by purchasing replacement securities at its own expense, or paying the Funds an amount equal to the market value of the replacement securities, subject to certain limitations which are set forth in detail in the Securities Lending Agency Agreement between the Trust on behalf of the Funds and BBH.
Notes to Financial Statements (Continued)
First Trust Exchange-Traded Fund VI
September 30, 2022 (Unaudited)
F. Repurchase Agreements
Repurchase agreements involve the purchase of securities subject to the seller’s agreement to repurchase the securities at a mutually agreed upon date and price, under the terms of a Master Repurchase Agreement (“MRA”). During the term of a repurchase agreement, the value of the underlying securities held as collateral on behalf of a Fund, including accrued interest, is required to exceed the value of the repurchase agreement, including accrued interest. The underlying securities for all repurchase agreements are held at the Funds’ custodian or designated sub-custodians under tri-party repurchase agreements.
MRAs govern transactions between a Fund and select counterparties. The MRAs maintain provisions for, among other things, initiation, income payments, events of default, and maintenance of collateral for repurchase agreements.
Repurchase agreements received for lending securities are collateralized by U.S. Treasury securities. The U.S. Treasury securities are held in a joint custody account at BBH on behalf of the Funds participating in the securities lending program. In the event the counterparty defaults on the repurchase agreement, the U.S. Treasury securities can either be maintained as part of a Fund’s portfolio or sold for cash. A Fund could suffer a loss to the extent that the proceeds from the sale of the underlying collateral held by the Fund are less than the repurchase price and the Fund’s costs associated with the delay and enforcement of the MRA.
While the Funds may invest in repurchase agreements, any repurchase agreements held by the Funds during the six months ended September 30, 2022, were received as collateral for lending securities. There were no repurchase agreements held by the Funds as of September 30, 2022.
G. Dividends and Distributions to Shareholders
Dividends from net investment income, if any, are declared and paid quarterly by each Fund, or as the Board of Trustees may determine from time to time. Distributions of net realized capital gains earned by each Fund, if any, are distributed at least annually.
Distributions from net investment income and realized capital gains are determined in accordance with federal income tax regulations, which may differ from U.S. GAAP. Certain capital accounts in the financial statements are periodically adjusted for permanent differences in order to reflect their tax character. These permanent differences are primarily due to the varying treatment of income and gain/loss on portfolio securities held by the Funds and have no impact on net assets or NAV per share. Temporary differences, which arise from recognizing certain items of income, expense and gain/loss in different periods for financial statement and tax purposes, will reverse at some point in the future.
The tax character of distributions paid by each Fund during the fiscal year ended March 31, 2022, was as follows:
| | Distributions
paid from
Ordinary
Income | | Distributions
paid from
Capital
Gains | | Distributions
paid from
Return of
Capital |
Developed International Equity Select ETF
| $ 703,193 | | $ — | | $ — |
Emerging Markets Equity Select ETF
| 180,487 | | — | | 49,961 |
Large Cap US Equity Select ETF
| 328,071 | | — | | — |
Mid Cap US Equity Select ETF
| 244,191 | | — | | — |
Small Cap US Equity Select ETF
| 261,631 | | — | | — |
US Equity Dividend Select ETF
| 359,126 | | — | | — |
As of March 31, 2022, the components of distributable earnings on a tax basis for each Fund were as follows:
| | Undistributed
Ordinary
Income | | Accumulated
Capital and
Other
Gain (Loss) | | Net
Unrealized
Appreciation
(Depreciation) |
Developed International Equity Select ETF
| $ 76,952 | | $ (2,360,196) | | $ 425,255 |
Emerging Markets Equity Select ETF
| — | | (1,097,564) | | 129,551 |
Large Cap US Equity Select ETF
| 12,444 | | (1,515,163) | | 2,418,226 |
Mid Cap US Equity Select ETF
| 12,795 | | (1,848,227) | | 848,639 |
Small Cap US Equity Select ETF
| 16,538 | | (1,170,060) | | 597,738 |
US Equity Dividend Select ETF
| 24,112 | | (1,095,016) | | 399,231 |
Notes to Financial Statements (Continued)
First Trust Exchange-Traded Fund VI
September 30, 2022 (Unaudited)
H. Income and Other Taxes
Each Fund intends to continue to qualify as a regulated investment company by complying with the requirements under Subchapter M of the Internal Revenue Code of 1986, as amended, which includes distributing substantially all of its net investment income and net realized gains to shareholders. Accordingly, no provision has been made for federal and state income taxes. However, due to the timing and amount of distributions, each Fund may be subject to an excise tax of 4% of the amount by which approximately 98% of each Fund’s taxable income exceeds the distributions from such taxable income for the calendar year.
Certain countries assess a capital gains tax on securities sold in their local markets. This tax is accrued as the securities in these foreign markets appreciate in value and is paid at the time of sale to the extent a capital gain is realized. Taxes accrued on securities in an unrealized appreciation position are included in “Net change in unrealized appreciation (depreciation) on deferred foreign capital gains tax” on the Statements of Operations. The capital gains tax paid on securities sold, if any, is included in “Net realized gain (loss) on foreign capital gains tax” on the Statements of Operations.
India’s Finance Bill, 2018 (“Finance Bill, 2018”) was enacted into law on March 29, 2018 and amongst other provisions, it introduced a long-term capital gains tax beginning April 1, 2018. Long-term capital gains on the sale of listed shares in excess of INR 0.1 million are taxed at the rate of 10% (plus applicable surcharge and cess (which is a type of tax)) subject to satisfaction of certain conditions. Long-term capital gains accruing as of January 31, 2018 are considered exempt due to a grandfather clause in the provision. The aforesaid exemption from long-term capital gains tax is available with respect to shares acquired between October 1, 2004 and March 31, 2018 only if on such acquisitions Securities Transaction Tax (“STT”) was chargeable. Certain exceptions in this regard, such as acquisition of shares in a public offer, bonus, rights issued, etc. for which the condition of chargeability of STT on acquisition is not applicable, have been notified.
In the case of the sale of listed shares held by a Fund for one year or less, the income is classified as short-term capital gains and is taxable at 15% (plus applicable surcharge and cess) provided the shares are sold on the stock exchange and subjected to STT. For above purposes, the applicable rate of surcharge is 2% or 5% (depending on the level of income of the Fund). The Finance Bill, 2018 increases the cess imposed on the sum of tax and surcharge from 3% to 4%. The cess 4% rate is applied to the capital gains tax, resulting in a higher effective rate of capital gains tax.
Where the sale of shares is outside the stock exchange and not subject to STT, the long-term capital gains are taxed at 10% (plus applicable surcharge and cess) and short-term capital gains are taxed at 30% (plus applicable surcharge and cess). The Finance Bill, 2018, approves the carry forward of long-term capital losses to be offset against long-term capital gains. Short-term losses can be netted against both short-term gains and long-term gains.
Until March 31, 2020, dividends received by a Fund from Indian companies were exempt from tax in India because Indian companies were required to pay dividend distribution tax. The Indian Finance Act, 2020 has amended the dividend taxation framework effective April 1, 2020 and accordingly dividends would now be taxable in the hands of the shareholders at 20%, plus applicable surcharge and cess. Subsequent to the Indian Finance Act, 2020, “The Taxation and Other Laws (Relaxation and Amendment of Certain Provisions) Bill, 2020” (the “Bill”) was enacted into law and is effective retroactively to April 1, 2020. The Bill caps the maximum surcharge at 15% of the tax on dividend income earned by the Fund. The highest effective tax rate proposed for non-corporate entities on dividends will be 23.92%. Note, the Fund will not obtain relief under the US-India tax treaty as the treaty rate of 25% is higher than the domestic rate. Any excess taxes withheld can be off-set against capital gains tax liability during the year or claimed as a refund in the annual tax return.
Please note that the above description is based on current provisions of Indian law, and any change or modification made by subsequent legislation, regulation, or administrative or judicial decision could increase the Indian tax liability of a Fund and thus reduce the return to a Fund’s shareholders. There can be no assurance that the Indian tax authorities and/or regulators will not take a position contrary to the views expressed herein. If the Indian tax authorities and/or regulators take a position contrary to the views expressed herein, adverse unpredictable consequences may follow.
The Funds are subject to accounting standards that establish a minimum threshold for recognizing, and a system for measuring, the benefits of a tax position taken or expected to be taken in a tax return. Taxable years ended 2019, 2020, 2021, and 2022 remain open to federal and state audit. As of September 30, 2022, management has evaluated the application of these standards to the Funds and has determined that no provision for income tax is required in the Funds’ financial statements for uncertain tax positions.
The Funds intend to utilize provisions of the federal income tax laws, which allow them to carry a realized capital loss forward indefinitely following the year of the loss and offset such loss against any future realized capital gains. The Funds are subject to certain limitations under U.S. tax rules on the use of capital loss carryforwards and net unrealized built-in losses. These limitations apply
Notes to Financial Statements (Continued)
First Trust Exchange-Traded Fund VI
September 30, 2022 (Unaudited)
when there has been a 50% change in ownership. At March 31, 2022, for federal income tax purposes, each applicable Fund had a capital loss carryforward available that is shown in the following table, to the extent provided by regulations, to offset future capital gains.
| | Non-Expiring
Capital Loss
Carryforward |
Developed International Equity Select ETF
| $ 2,360,196 |
Emerging Markets Equity Select ETF
| 1,095,270 |
Large Cap US Equity Select ETF
| 1,515,163 |
Mid Cap US Equity Select ETF
| 1,848,227 |
Small Cap US Equity Select ETF
| 1,170,060 |
US Equity Dividend Select ETF
| 1,095,016 |
Certain losses realized during the current fiscal year may be deferred and treated as occurring on the first day of the following fiscal year for federal income tax purposes. For the fiscal year ended March 31, 2022, the Funds incurred and elected to defer net ordinary losses as follows:
| | Ordinary Losses |
Developed International Equity Select ETF
| $ — |
Emerging Markets Equity Select ETF
| 2,294 |
Large Cap US Equity Select ETF
| — |
Mid Cap US Equity Select ETF
| — |
Small Cap US Equity Select ETF
| — |
US Equity Dividend Select ETF
| — |
As of September 30, 2022, the aggregate cost, gross unrealized appreciation, gross unrealized depreciation, and net unrealized appreciation/(depreciation) on investments (including short positions and derivatives, if any) for federal income tax purposes were as follows:
| | Tax Cost | | Gross
Unrealized
Appreciation | | Gross
Unrealized
(Depreciation) | | Net Unrealized
Appreciation
(Depreciation) |
Developed International Equity Select ETF
| $ 19,850,500 | | $ 130,489 | | $ (4,136,484) | | $ (4,005,995) |
Emerging Markets Equity Select ETF
| 9,239,352 | | 315,864 | | (1,649,068) | | (1,333,204) |
Large Cap US Equity Select ETF
| 19,664,995 | | 763,727 | | (3,063,415) | | (2,299,688) |
Mid Cap US Equity Select ETF
| 18,320,787 | | 473,640 | | (3,176,945) | | (2,703,305) |
Small Cap US Equity Select ETF
| 26,733,049 | | 291,751 | | (5,137,794) | | (4,846,043) |
US Equity Dividend Select ETF
| 19,165,567 | | 373,375 | | (3,418,364) | | (3,044,989) |
I. Expenses
Expenses, other than the investment advisory fee and other excluded expenses, are paid by the Advisor (See Note 3).
First Trust has entered into licensing agreements with Riskalyze, Inc. (“Licensor”) for the Funds. The respective license agreements allow for the use by First Trust of each Fund’s respective index and of certain trademarks and trade names of the Licensor. The Funds are sub-licensees to the applicable license agreements.
3. Investment Advisory Fee, Affiliated Transactions and Other Fee Arrangements
First Trust, the investment advisor to the Funds, is a limited partnership with one limited partner, Grace Partners of DuPage L.P., and one general partner, The Charger Corporation. The Charger Corporation is an Illinois corporation controlled by James A. Bowen, Chief Executive Officer of First Trust. First Trust is responsible for the selection and ongoing monitoring of the securities in each Fund’s portfolio, managing the Funds’ business affairs and providing certain administrative services necessary for the management of the Funds.
Notes to Financial Statements (Continued)
First Trust Exchange-Traded Fund VI
September 30, 2022 (Unaudited)
First Trust is paid an annual unitary management fee based on each Fund’s average daily net assets at a rate set forth below:
| | Rate |
| Developed International Equity Select ETF | 0.65% |
| Emerging Markets Equity Select ETF | 0.75% |
| Large Cap US Equity Select ETF | 0.60% |
| Mid Cap US Equity Select ETF | 0.60% |
| Small Cap US Equity Select ETF | 0.60% |
| US Equity Dividend Select ETF | 0.50% |
First Trust is responsible for the expenses of each Fund including the cost of transfer agency, custody, fund administration, licensing fees, legal, audit and other services, but excluding fee payments under the Investment Management Agreement, interest, taxes, brokerage commissions and other expenses associated with the execution of portfolio transactions, acquired fund fees and expenses, distribution and service fees pursuant to a Rule 12b-1 plan, if any, and extraordinary expenses, which are paid by each respective Fund. First Trust also provides fund reporting services to the Funds for a flat annual fee in the amount of $9,250 per Fund, which is covered under the annual unitary management fee.
The Trust has multiple service agreements with BBH. Under the service agreements, BBH performs custodial, fund accounting, certain administrative services, and transfer agency services for the Funds. As custodian, BBH is responsible for custody of each Fund’s assets. As fund accountant and administrator, BBH is responsible for maintaining the books and records of each Fund’s securities and cash. As transfer agent, BBH is responsible for maintaining shareholder records for each Fund.
Each Trustee who is not an officer or employee of First Trust, any sub-advisor or any of their affiliates (“Independent Trustees”) is paid a fixed annual retainer that is allocated equally among each fund in the First Trust Fund Complex. Each Independent Trustee is also paid an annual per fund fee that varies based on whether the fund is a closed-end or other actively managed fund, a target outcome fund or an index fund.
Additionally, the Lead Independent Trustee and the Chairs of the Audit Committee, Nominating and Governance Committee and Valuation Committee are paid annual fees to serve in such capacities, with such compensation allocated pro rata among each fund in the First Trust Fund Complex based on net assets. Independent Trustees are reimbursed for travel and out-of-pocket expenses in connection with all meetings. The Lead Independent Trustee and Committee Chairs rotate every three years. The officers and “Interested” Trustee receive no compensation from the Trust for acting in such capacities.
4. Purchases and Sales of Securities
For the six months ended September 30, 2022, the cost of purchases and proceeds from sales of investment securities for each Fund, excluding short-term investments and in-kind transactions, were as follows:
| | Purchases | | Sales |
| Developed International Equity Select ETF | $ 8,632,235 | | $ 8,674,260 |
| Emerging Markets Equity Select ETF | 4,741,584 | | 2,851,421 |
| Large Cap US Equity Select ETF | 3,303,201 | | 3,304,511 |
| Mid Cap US Equity Select ETF | 4,091,411 | | 4,034,669 |
| Small Cap US Equity Select ETF | 7,506,021 | | 7,403,890 |
| US Equity Dividend Select ETF | 5,161,985 | | 5,151,722 |
| | | | |
Notes to Financial Statements (Continued)
First Trust Exchange-Traded Fund VI
September 30, 2022 (Unaudited)
For the six months ended September 30, 2022, the cost of in-kind purchases and proceeds from in-kind sales for each Fund were as follows:
| | Purchases | | Sales |
| Developed International Equity Select ETF | $ 3,977,903 | | $ 6,742,374 |
| Emerging Markets Equity Select ETF | 462,996 | | — |
| Large Cap US Equity Select ETF | 3,120,346 | | 2,947,553 |
| Mid Cap US Equity Select ETF | 5,678,930 | | 2,907,493 |
| Small Cap US Equity Select ETF | 9,864,377 | | 4,271,299 |
| US Equity Dividend Select ETF | 1,499,875 | | — |
5. Creations, Redemptions and Transaction Fees
Each Fund generally issues and redeems its shares in primary market transactions through a creation and redemption mechanism and does not sell or redeem individual shares. Instead, financial entities known as “Authorized Participants” have contractual arrangements with a Fund or one of the Fund’s service providers to purchase and redeem Fund shares directly with the Fund in large blocks of shares known as “Creation Units.” Prior to the start of trading on every business day, a Fund publishes through the National Securities Clearing Corporation (“NSCC”) the “basket” of securities, cash or other assets that it will accept in exchange for a Creation Unit of the Fund’s shares. An Authorized Participant that wishes to effectuate a creation of a Fund’s shares deposits with the Fund the “basket” of securities, cash or other assets identified by the Fund that day, and then receives the Creation Unit of the Fund’s shares in return for those assets. After purchasing a Creation Unit, the Authorized Participant may continue to hold the Fund’s shares or sell them in the secondary market. The redemption process is the reverse of the purchase process: the Authorized Participant redeems a Creation Unit of a Fund’s shares for a basket of securities, cash or other assets. The combination of the creation and redemption process with secondary market trading in a Fund’s shares and underlying securities provides arbitrage opportunities that are designed to help keep the market price of a Fund’s shares at or close to the NAV per share of the Fund.
Each Fund imposes fees in connection with the purchase of Creation Units. These fees may vary based upon various fact-based circumstances, including, but not limited to, the composition of the securities included in the Creation Unit or the countries in which the transactions are settled. The price for each Creation Unit will equal the daily NAV per share of a Fund times the number of shares in a Creation Unit, plus the fees described above and, if applicable, any operational processing and brokerage costs, transfer fees, stamp taxes and part or all of the spread between the expected bid and offer side of the market related to the securities comprising the creation basket.
Each Fund also imposes fees in connection with the redemption of Creation Units. These fees may vary based upon various fact-based circumstances, including, but not limited to, the composition of the securities included in the Creation Unit or the countries in which the transactions are settled. The price received for each Creation Unit will equal the daily NAV per share of a Fund times the number of shares in a Creation Unit, minus the fees described above and, if applicable, any operational processing and brokerage costs, transfer fees, stamp taxes and part or all of the spread between the expected bid and offer side of the market related to the securities comprising the redemption basket. Investors who use the services of a broker or other such intermediary in addition to an Authorized Participant to effect a redemption of a Creation Unit may also be assessed an amount to cover the cost of such services. The redemption fee charged by a Fund will comply with Rule 22c-2 of the 1940 Act which limits redemption fees to no more than 2% of the value of the shares redeemed.
6. Distribution Plan
The Board of Trustees adopted a Distribution and Service Plan pursuant to Rule 12b-1 under the 1940 Act. In accordance with the Rule 12b-1 plan, each Fund is authorized to pay an amount up to 0.25% of its average daily net assets each year to reimburse First Trust Portfolios L.P. (“FTP”), the distributor of the Funds, for amounts expended to finance activities primarily intended to result in the sale of Creation Units or to provide investor services. FTP may also use this amount to compensate securities dealers or other persons that are Authorized Participants for providing distribution assistance, including broker-dealer and shareholder support and educational and promotional services.
No 12b-1 fees are currently paid by the Funds, and pursuant to a contractual arrangement, no 12b-1 fees will be paid any time before July 31, 2023.
Notes to Financial Statements (Continued)
First Trust Exchange-Traded Fund VI
September 30, 2022 (Unaudited)
7. Indemnification
The Trust, on behalf of the Funds, has a variety of indemnification obligations under contracts with its service providers. The Trust’s maximum exposure under these arrangements is unknown. However, the Trust has not had prior claims or losses pursuant to these contracts and expects the risk of loss to be remote.
8. Subsequent Events
Management has evaluated the impact of all subsequent events to the Funds through the date the financial statements were issued, and has determined that there was the following subsequent event:
At a meeting on October 24, 2022, the Board of Trustees approved a breakpoint pricing arrangement for each of the series of the Trust, including the Funds. Pursuant to this arrangement, which is effective as of November 1, 2022, the management fee each Fund pays to First Trust, as investment manager, will be discounted as the Fund’s net assets reach certain predefined levels.
Additional Information
First Trust Exchange-Traded Fund VI
September 30, 2022 (Unaudited)
Proxy Voting Policies and Procedures
A description of the policies and procedures that the Trust uses to determine how to vote proxies and information on how each Fund voted proxies relating to portfolio securities during the most recent 12-month period ended June 30 is available (1) without charge, upon request, by calling (800) 988-5891; (2) on each Fund’s website at www.ftportfolios.com; and (3) on the Securities and Exchange Commission’s (“SEC”) website at www.sec.gov.
Portfolio Holdings
Each Fund files portfolio holdings information for each month in a fiscal quarter within 60 days after the end of the relevant fiscal quarter on Form N-PORT. Portfolio holdings information for the third month of each fiscal quarter will be publicly available on the SEC’s website at www.sec.gov. Each Fund’s complete schedule of portfolio holdings for the second and fourth quarters of each fiscal year is included in the semi-annual and annual reports to shareholders, respectively, and is filed with the SEC on Form N-CSR. The semi-annual and annual report for each Fund is available to investors within 60 days after the period to which it relates. Each Fund’s Forms N-PORT and Forms N-CSR are available on the SEC’s website listed above.
Risk Considerations
Risks are inherent in all investing. Certain general risks that may be applicable to a Fund are identified below, but not all of the material risks relevant to each Fund are included in this report and not all of the risks below apply to each Fund. The material risks of investing in each Fund are spelled out in its prospectus, statement of additional information and other regulatory filings. Before investing, you should consider each Fund’s investment objective, risks, charges and expenses, and read each Fund’s prospectus and statement of additional information carefully. You can download each Fund’s prospectus at www.ftportfolios.com or contact First Trust Portfolios L.P. at (800) 621-1675 to request a prospectus, which contains this and other information about each Fund.
Concentration Risk. To the extent that a fund is able to invest a significant percentage of its assets in a single asset class or the securities of issuers within the same country, state, region, industry or sector, an adverse economic, business or political development may affect the value of the fund’s investments more than if the fund were more broadly diversified. A fund that tracks an index will be concentrated to the extent the fund’s corresponding index is concentrated. A concentration makes a fund more susceptible to any single occurrence and may subject the fund to greater market risk than a fund that is more broadly diversified.
Credit Risk. Credit risk is the risk that an issuer of a security will be unable or unwilling to make dividend, interest and/or principal payments when due and the related risk that the value of a security may decline because of concerns about the issuer’s ability to make such payments.
Cyber Security Risk. The funds are susceptible to potential operational risks through breaches in cyber security. A breach in cyber security refers to both intentional and unintentional events that may cause a fund to lose proprietary information, suffer data corruption or lose operational capacity. Such events could cause a fund to incur regulatory penalties, reputational damage, additional compliance costs associated with corrective measures and/or financial loss. In addition, cyber security breaches of a fund’s third-party service providers, such as its administrator, transfer agent, custodian, or sub-advisor, as applicable, or issuers in which the fund invests, can also subject a fund to many of the same risks associated with direct cyber security breaches.
Defined Outcome Funds Risk. To the extent a fund’s investment strategy is designed to deliver returns tied to the price performance of an underlying ETF, an investor may not realize the returns the fund seeks to achieve if that investor does not hold shares for the entire target outcome period. In the event an investor purchases shares after the first day of the target outcome period or sells shares prior to the end of the target outcome period, the buffer that the fund seeks to provide against a decline in the value of the underlying ETF may not be available, the enhanced returns that the fund seeks to provide (if any) may not be available and the investor may not participate in a gain in the value of the underlying ETF up to the cap for the investor’s investment period. Additionally, the fund will not participate in gains of the underlying ETF above the cap and a shareholder may lose their entire investment. If the fund seeks enhanced returns, there are certain time periods when the value of the fund may fall faster than the value of the underlying ETF, and it is very unlikely that, on any given day during which the underlying ETF share price increases in value, the fund’s share price will increase at the same rate as the enhanced returns sought by the fund, which is designed for an entire target outcome period. Trading flexible exchange options involves risks different from, or possibly greater than, the risks associated with investing directly in securities, such as less liquidity and correlation and valuation risks. A fund may experience substantial downside from specific flexible exchange option positions and certain positions may expire worthless.
Derivatives Risk. To the extent a fund uses derivative instruments such as futures contracts, options contracts and swaps, the fund may experience losses because of adverse movements in the price or value of the underlying asset, index or rate, which may be magnified
Additional Information (Continued)
First Trust Exchange-Traded Fund VI
September 30, 2022 (Unaudited)
by certain features of the derivative. These risks are heightened when a fund’s portfolio managers use derivatives to enhance the fund’s return or as a substitute for a position or security, rather than solely to hedge (or offset) the risk of a position or security held by the fund.
Equity Securities Risk. To the extent a fund invests in equity securities, the value of the fund’s shares will fluctuate with changes in the value of the equity securities. Equity securities prices fluctuate for several reasons, including changes in investors’ perceptions of the financial condition of an issuer or the general condition of the relevant stock market, such as market volatility, or when political or economic events affecting the issuers occur. In addition, common stock prices may be particularly sensitive to rising interest rates, as the cost of capital rises and borrowing costs increase. Equity securities may decline significantly in price over short or extended periods of time, and such declines may occur in the equity market as a whole, or they may occur in only a particular country, company, industry or sector of the market.
ETF Risk. The shares of an ETF trade like common stock and represent an interest in a portfolio of securities. The risks of owning an ETF generally reflect the risks of owning the underlying securities, although lack of liquidity in an ETF could result in it being more volatile and ETFs have management fees that increase their costs. Shares of an ETF trade on an exchange at market prices rather than net asset value, which may cause the shares to trade at a price greater than net asset value (premium) or less than net asset value (discount). In times of market stress, decisions by market makers to reduce or step away from their role of providing a market for an ETF’s shares, or decisions by an ETF’s authorized participants that they are unable or unwilling to proceed with creation and/or redemption orders of an ETF’s shares, could result in shares of the ETF trading at a discount to net asset value and in greater than normal intraday bid-ask spreads.
Fixed Income Securities Risk. To the extent a fund invests in fixed income securities, the fund will be subject to credit risk, income risk, interest rate risk, liquidity risk and prepayment risk. Income risk is the risk that income from a fund’s fixed income investments could decline during periods of falling interest rates. Interest rate risk is the risk that the value of a fund’s fixed income securities will decline because of rising interest rates. Liquidity risk is the risk that a security cannot be purchased or sold at the time desired, or cannot be purchased or sold without adversely affecting the price. Prepayment risk is the risk that the securities will be redeemed or prepaid by the issuer, resulting in lower interest payments received by the fund. In addition to these risks, high yield securities, or “junk” bonds, are subject to greater market fluctuations and risk of loss than securities with higher ratings, and the market for high yield securities is generally smaller and less liquid than that for investment grade securities.
Index or Model Constituent Risk. Certain funds may be a constituent of one or more indices or ETF models. As a result, such a fund may be included in one or more index-tracking exchange-traded funds or mutual funds. Being a component security of such a vehicle could greatly affect the trading activity involving a fund, the size of the fund and the market volatility of the fund. Inclusion in an index could increase demand for the fund and removal from an index could result in outsized selling activity in a relatively short period of time. As a result, a fund’s net asset value could be negatively impacted and the fund’s market price may be significantly below its net asset value during certain periods. In addition, index rebalances may potentially result in increased trading activity in a fund’s shares.
Index Provider Risk. To the extent a fund seeks to track an index, it is subject to Index Provider Risk. There is no assurance that the Index Provider will compile the Index accurately, or that the Index will be determined, maintained, constructed, reconstituted, rebalanced, composed, calculated or disseminated accurately. To correct any such error, the Index Provider may carry out an unscheduled rebalance or other modification of the Index constituents or weightings, which may increase the fund’s costs. The Index Provider does not provide any representation or warranty in relation to the quality, accuracy or completeness of data in the Index, and it does not guarantee that the Index will be calculated in accordance with its stated methodology. Losses or costs associated with any Index Provider errors generally will be borne by the fund and its shareholders.
Investment Companies Risk. To the extent a fund invests in the securities of other investment vehicles, the fund will incur additional fees and expenses that would not be present in a direct investment in those investment vehicles. Furthermore, the fund’s investment performance and risks are directly related to the investment performance and risks of the investment vehicles in which the fund invests.
LIBOR Risk. To the extent a fund invests in floating or variable rate obligations that use the London Interbank Offered Rate (“LIBOR”) as a reference interest rate, it is subject to LIBOR Risk. The United Kingdom’s Financial Conduct Authority, which regulates LIBOR has ceased making LIBOR available as a reference rate over a phase-out period that began December 31, 2021. There is no assurance that any alternative reference rate, including the Secured Overnight Financing Rate (“SOFR”) will be similar to or produce the same value or economic equivalence as LIBOR or that instruments using an alternative rate will have the same volume or liquidity. The unavailability or replacement of LIBOR may affect the value, liquidity or return on certain fund investments and may result in costs incurred in connection with closing out positions and entering into new trades. Any potential effects of the transition away from LIBOR on the fund or on certain instruments in which the fund invests can be difficult to ascertain, and they may vary depending on a variety of factors, and they could result in losses to the fund.
Additional Information (Continued)
First Trust Exchange-Traded Fund VI
September 30, 2022 (Unaudited)
Management Risk. To the extent that a fund is actively managed, it is subject to management risk. In managing an actively-managed fund’s investment portfolio, the fund’s portfolio managers will apply investment techniques and risk analyses that may not have the desired result. There can be no guarantee that a fund will meet its investment objective.
Market Risk. Market risk is the risk that a particular security, or shares of a fund in general, may fall in value. Securities held by a fund, as well as shares of a fund itself, are subject to market fluctuations caused by factors such as general economic conditions, political events, regulatory or market developments, changes in interest rates and perceived trends in securities prices. Shares of a fund could decline in value or underperform other investments as a result of the risk of loss associated with these market fluctuations. In addition, local, regional or global events such as war, acts of terrorism, spread of infectious diseases or other public health issues, recessions, or other events could have a significant negative impact on a fund and its investments. Such events may affect certain geographic regions, countries, sectors and industries more significantly than others. In February 2022, Russia invaded Ukraine which has caused and could continue to cause significant market disruptions and volatility within the markets in Russia, Europe, and the United States. The hostilities and sanctions resulting from those hostilities could have a significant impact on certain fund investments as well as fund performance. The COVID-19 global pandemic and the ensuing policies enacted by governments and central banks have caused and may continue to cause significant volatility and uncertainty in global financial markets. While the U.S. has resumed “reasonably” normal business activity, many countries continue to impose lockdown measures. Additionally, there is no guarantee that vaccines will be effective against emerging variants of the disease. These events also adversely affect the prices and liquidity of a fund’s portfolio securities or other instruments and could result in disruptions in the trading markets. Any of such circumstances could have a materially negative impact on the value of a fund’s shares and result in increased market volatility. During any such events, a fund’s shares may trade at increased premiums or discounts to their net asset value and the bid/ask spread on a fund’s shares may widen.
Non-U.S. Securities Risk. To the extent a fund invests in non-U.S. securities, it is subject to additional risks not associated with securities of domestic issuers. Non-U.S. securities are subject to higher volatility than securities of domestic issuers due to: possible adverse political, social or economic developments; restrictions on foreign investment or exchange of securities; capital controls; lack of liquidity; currency exchange rates; excessive taxation; government seizure of assets; the imposition of sanctions by foreign governments; different legal or accounting standards; and less government supervision and regulation of exchanges in foreign countries. Investments in non-U.S. securities may involve higher costs than investments in U.S. securities, including higher transaction and custody costs, as well as additional taxes imposed by non-U.S. governments. These risks may be heightened for securities of companies located, or with significant operations, in emerging market countries.
Operational Risk. Each fund is subject to risks arising from various operational factors, including, but not limited to, human error, processing and communication errors, errors of a fund’s service providers, counterparties or other third-parties, failed or inadequate processes and technology or systems failures. Each fund relies on third-parties for a range of services, including custody. Any delay or failure relating to engaging or maintaining such service providers may affect a fund’s ability to meet its investment objective. Although the funds and the funds’ investment advisor seek to reduce these operational risks through controls and procedures, there is no way to completely protect against such risks.
Passive Investment Risk. To the extent a fund seeks to track an index, the fund will invest in the securities included in, or representative of, the index regardless of their investment merit. A fund generally will not attempt to take defensive positions in declining markets.
Valuation Risk. The valuation of certain securities may carry more risk than that of common stock. Uncertainties in the conditions of the financial markets, unreliable reference data, lack of transparency and inconsistency of valuation models and processes may lead to inaccurate asset pricing. A fund may hold investments in sizes smaller than institutionally sized round lot positions (sometimes referred to as odd lots). However, third-party pricing services generally provide evaluations on the basis of institutionally-sized round lots. If a fund sells certain of its investments in an odd lot transaction, the sale price may be less than the value at which such securities have been held by the fund. Odd lots often trade at lower prices than institutional round lots. There is no assurance that the fund will be able to sell a portfolio security at the price established by the pricing service, which could result in a loss to the fund.
Variable Interest Entities Risk. In order to gain exposure to certain Chinese companies that are included in a Fund’s Index but are unavailable to direct investment by foreign investors, certain Funds invest significantly in non-Chinese shell companies that have created structures known as variable interest entities (“VIEs”) in order to gain exposure to such Chinese companies. In China, direct ownership of companies in certain sectors by foreign individuals and entities is prohibited. In order to allow for foreign investment in these businesses, many Chinese companies have created VIE structures to enable indirect foreign ownership. In such an arrangement, a Chinese operating company typically establishes an offshore shell company in another jurisdiction, such as the Cayman Islands. That shell company enters into service and other contracts with the Chinese issuer or operating company to obtain economic exposure to the Chinese company, then issues shares on an exchange outside of mainland China, and U.S. investors hold stock in the non-Chinese shell company rather than directly in the Chinese issuer or operating company. This arrangement allows U.S. investors, such as the Fund, to
Additional Information (Continued)
First Trust Exchange-Traded Fund VI
September 30, 2022 (Unaudited)
obtain economic exposure to the Chinese issuer or operating company through contractual means rather than through formal equity ownership. Because neither the shell company nor the Fund owns actual equity interests in the Chinese operating company, they do not have the voting rights or other types of control that an equity holder would expect to benefit from. Although VIEs are a longstanding industry practice and well known to officials and regulators in China, VIEs are not formally recognized under Chinese law. Intervention by the Chinese government with respect to VIEs could significantly affect the Chinese company’s performance and the enforceability of the VIE’s contractual arrangements that establish the links between the Chinese company and the shell company in which the Fund invests. This could considerably impact the financial condition of the shell company in which the Fund invests by limiting its ability to consolidate the financial results of the Chinese operating company into its own financial statements, as well as make the value of the shares held by the Fund effectively worthless. Further, if Chinese officials prohibit the existence of VIEs, the market value of the Fund’s associated holdings would likely suffer significant, and possibly permanent effects, which could negatively impact the Fund’s net asset value and could result in substantial losses. Further, it is uncertain whether any new laws, rules or regulations relating to VIE structures will be adopted or, if adopted, what impact they would have on the value of the Fund’s shares.
VIEs are also subject to the investment risks associated with the underlying Chinese issuer or operating company. Chinese companies are not subject to the same degree of regulatory requirements or accounting standards and oversight as companies in more developed countries. As a result, information about the Chinese securities and VIEs in which the Fund invests may be less reliable and incomplete. There also may be significant obstacles to obtaining information necessary for investigations into or litigation against Chinese companies and VIEs, and shareholders may have limited legal remedies, which could negatively impact the Fund. Additionally, U.S.-listed VIEs may be delisted if they do not meet U.S. accounting standards and auditor oversight requirements. Delisting would significantly decrease the liquidity and value of the securities, decrease the ability of the Fund to invest in such securities and may increase the cost of the Fund if required to seek alternative markets in which to invest in such securities.
| NOT FDIC INSURED | NOT BANK GUARANTEED | MAY LOSE VALUE |
Advisory Agreement
Board Considerations Regarding Approval of Continuation of Investment Management Agreement
The Board of Trustees of First Trust Exchange-Traded Fund VI (the “Trust”), including the Independent Trustees, unanimously approved the continuation of the Investment Management Agreement (the “Agreement”) with First Trust Advisors L.P. (the “Advisor”) on behalf of the following six series of the Trust (each a “Fund” and collectively, the “Funds”):
Developed International Equity Select ETF (RNDM)
Emerging Markets Equity Select ETF (RNEM)
Large Cap US Equity Select ETF (RNLC)
Mid Cap US Equity Select ETF (RNMC)
Small Cap US Equity Select ETF (RNSC)
US Equity Dividend Select ETF (RNDV)
The Board approved the continuation of the Agreement for each Fund for a one-year period ending June 30, 2023 at a meeting held on June 12–13, 2022. The Board determined for each Fund that the continuation of the Agreement is in the best interests of the Fund in light of the nature, extent and quality of the services provided and such other matters as the Board considered to be relevant in the exercise of its business judgment.
To reach this determination for each Fund, the Board considered its duties under the Investment Company Act of 1940, as amended (the “1940 Act”), as well as under the general principles of state law, in reviewing and approving advisory contracts; the requirements of the 1940 Act in such matters; the fiduciary duty of investment advisors with respect to advisory agreements and compensation; the standards used by courts in determining whether investment company boards have fulfilled their duties; and the factors to be considered by the Board in voting on such agreements. At meetings held on April 18, 2022 and June 12–13, 2022, the Board, including the Independent Trustees, reviewed materials provided by the Advisor responding to requests for information from counsel to the Independent Trustees, submitted on behalf of the Independent Trustees, that, among other things, outlined: the services provided by the Advisor to each Fund (including the relevant personnel responsible for these services and their experience); the unitary fee rate payable by each Fund as compared to fees charged to a peer group of funds (the “Expense Group”) and a broad peer universe of funds (the “Expense Universe”), each assembled by Broadridge Financial Solutions, Inc. (“Broadridge”), an independent source, and as compared to fees charged to other clients of the Advisor, including other exchange-traded funds (“ETFs”) managed by the Advisor; the expense ratio of each Fund as compared to expense ratios of the funds in the Fund’s Expense Group and Expense Universe; performance information for each Fund, including comparisons of each Fund’s performance to that of one or more relevant benchmark indexes and to that of a performance group of funds and a broad performance universe of funds (the “Performance Universe”), each assembled by Broadridge; the nature of expenses incurred in providing services to each Fund and the potential for the Advisor to
Additional Information (Continued)
First Trust Exchange-Traded Fund VI
September 30, 2022 (Unaudited)
realize economies of scale, if any; profitability and other financial data for the Advisor; any indirect benefits to the Advisor and its affiliate, First Trust Portfolios L.P. (“FTP”); and information on the Advisor’s compliance program. The Board reviewed initial materials with the Advisor at the meeting held on April 18, 2022, prior to which the Independent Trustees and their counsel met separately to discuss the information provided by the Advisor. Following the April meeting, counsel to the Independent Trustees, on behalf of the Independent Trustees, requested certain clarifications and supplements to the materials provided, and the information provided in response to those requests was considered at an executive session of the Independent Trustees and their counsel held prior to the June 12–13, 2022 meeting, as well as at the June meeting. The Board applied its business judgment to determine whether the arrangement between the Trust and the Advisor continues to be a reasonable business arrangement from each Fund’s perspective. The Board determined that, given the totality of the information provided with respect to the Agreement, the Board had received sufficient information to renew the Agreement. The Board considered that shareholders chose to invest or remain invested in a Fund knowing that the Advisor manages the Fund and knowing the Fund’s unitary fee.
In reviewing the Agreement for each Fund, the Board considered the nature, extent and quality of the services provided by the Advisor under the Agreement. The Board considered that the Advisor is responsible for the overall management and administration of the Trust and each Fund and reviewed all of the services provided by the Advisor to the Funds, as well as the background and experience of the persons responsible for such services. In reviewing the services provided, the Board noted the compliance program that had been developed by the Advisor and considered that it includes a robust program for monitoring the Advisor’s and each Fund’s compliance with the 1940 Act, as well as each Fund’s compliance with its investment objective, policies and restrictions. The Board also considered a report from the Advisor with respect to its risk management functions related to the operation of the Funds. Finally, as part of the Board’s consideration of the Advisor’s services, the Advisor, in its written materials and at the April 18, 2022 meeting, described to the Board the scope of its ongoing investment in additional personnel and infrastructure to maintain and improve the quality of services provided to the Funds and the other funds in the First Trust Fund Complex. In light of the information presented and the considerations made, the Board concluded that the nature, extent and quality of the services provided to the Trust and each Fund by the Advisor under the Agreement have been and are expected to remain satisfactory and that the Advisor has managed each Fund consistent with its investment objective, policies and restrictions.
The Board considered the unitary fee rate payable by each Fund under the Agreement for the services provided. The Board considered that as part of the unitary fee the Advisor is responsible for each Fund’s expenses, including the cost of transfer agency, custody, fund administration, legal, audit and other services and license fees, if any, but excluding the fee payment under the Agreement and interest, taxes, brokerage commissions and other expenses connected with the execution of portfolio transactions, distribution and service fees pursuant to a Rule 12b-1 plan, if any, and extraordinary expenses, if any. The Board received and reviewed information showing the fee rates and expense ratios of the peer funds in the Expense Groups, as well as advisory and unitary fee rates charged by the Advisor to other fund (including ETFs) and non-fund clients, as applicable. Because each Fund pays a unitary fee, the Board determined that expense ratios were the most relevant comparative data point. Based on the information provided, the Board noted that the unitary fee rate for each Fund was above the median total (net) expense ratio of the peer funds in its respective Expense Group. With respect to the Expense Groups, the Board, at the April 18, 2022 meeting, discussed with Broadridge its methodology for assembling peer groups and discussed with the Advisor limitations in creating peer groups for index ETFs, including differences in underlying indexes and index-tracking methodologies that can result in greater management complexities across seemingly comparable ETFs and different business models that may affect the pricing of services among ETF sponsors. The Board took these limitations and differences into account in considering the peer data. With respect to fees charged to other non-ETF clients, the Board considered differences between the Funds and other non-ETF clients that limited their comparability. In considering the unitary fee rates overall, the Board also considered the Advisor’s statement that it seeks to meet investor needs through innovative and value-added investment solutions and the Advisor’s demonstrated long-term commitment to each Fund and the other funds in the First Trust Fund Complex.
The Board considered performance information for each Fund. The Board noted the process it has established for monitoring each Fund’s performance and portfolio risk on an ongoing basis, which includes quarterly performance reporting from the Advisor for the Funds. The Board determined that this process continues to be effective for reviewing each Fund’s performance. The Board received and reviewed information for periods ended December 31, 2021 regarding the performance of each Fund’s underlying index, the correlation between each Fund’s performance and that of its underlying index, each Fund’s tracking difference and each Fund’s excess return as compared to its benchmark index. Based on the information provided and its ongoing review of performance, the Board concluded that each Fund was correlated to its underlying index and that the tracking difference for each Fund was within a reasonable range. In addition, the Board reviewed data prepared by Broadridge comparing each Fund’s performance to that of its respective Performance Universe and to that of a broad-based benchmark index, but given each Fund’s objective of seeking investment results that correspond generally to the performance of its underlying index, the Board placed more emphasis on its review of correlation and tracking difference.
Additional Information (Continued)
First Trust Exchange-Traded Fund VI
September 30, 2022 (Unaudited)
On the basis of all the information provided on the unitary fee and performance of each Fund and the ongoing oversight by the Board, the Board concluded that the unitary fee for each Fund continues to be reasonable and appropriate in light of the nature, extent and quality of the services provided by the Advisor to each Fund under the Agreement.
The Board considered information and discussed with the Advisor whether there were any economies of scale in connection with providing advisory services to the Funds and noted the Advisor’s statement that it believes that its expenses relating to providing advisory services to the Funds will likely increase during the next twelve months as the Advisor continues to build infrastructure and add new staff. The Board noted that any reduction in fixed costs associated with the management of the Funds would benefit the Advisor, but that the unitary fee structure provides a level of certainty in expenses for the Funds. The Board considered the revenues and allocated costs (including the allocation methodology) of the Advisor in serving as investment advisor to each Fund for the twelve months ended December 31, 2021 and the estimated profitability level for each Fund calculated by the Advisor based on such data, as well as complex-wide and product-line profitability data, for the same period. The Board noted the inherent limitations in the profitability analysis and concluded that, based on the information provided, the Advisor’s profitability level for each Fund was not unreasonable. In addition, the Board considered indirect benefits described by the Advisor that may be realized from its relationship with the Funds. The Board considered that the Advisor had identified as an indirect benefit to the Advisor and FTP their exposure to investors and brokers who, absent their exposure to the Funds, may have had no dealings with the Advisor or FTP, and noted that the Advisor does not utilize soft dollars in connection with the Funds. The Board also considered the Advisor’s compensation for fund reporting services provided to each Fund pursuant to a separate Fund Reporting Services Agreement, which is paid from the unitary fee. The Board concluded that the character and amount of potential indirect benefits to the Advisor were not unreasonable.
Based on all of the information considered and the conclusions reached, the Board, including the Independent Trustees, unanimously determined that the terms of the Agreement continue to be fair and reasonable and that the continuation of the Agreement is in the best interests of each Fund. No single factor was determinative in the Board’s analysis.
Liquidity Risk Management Program
In accordance with Rule 22e-4 under the Investment Company Act of 1940, as amended (the “1940 Act”), the Funds and each other fund in the First Trust Fund Complex, other than the closed-end funds, have adopted and implemented a liquidity risk management program (the “Program”) reasonably designed to assess and manage the funds’ liquidity risk, i.e., the risk that a fund could not meet requests to redeem shares issued by the fund without significant dilution of remaining investors’ interests in the fund. The Board of Trustees of the First Trust Funds has appointed First Trust Advisors L.P. (the “Advisor”) as the person designated to administer the Program, and in this capacity the Advisor performs its duties primarily through the activities and efforts of the First Trust Liquidity Committee (the “Liquidity Committee”).
Pursuant to the Program, the Liquidity Committee classifies the liquidity of each fund’s portfolio investments into one of the four liquidity categories specified by Rule 22e-4: highly liquid investments, moderately liquid investments, less liquid investments and illiquid investments. The Liquidity Committee determines certain of the inputs for this classification process, including reasonably anticipated trade sizes and significant investor dilution thresholds. The Liquidity Committee also determines and periodically reviews a highly liquid investment minimum for certain funds, monitors the funds’ holdings of assets classified as illiquid investments to seek to ensure they do not exceed 15% of a fund’s net assets and establishes policies and procedures regarding redemptions in kind.
At the April 18, 2022 meeting of the Board of Trustees, as required by Rule 22e-4 and the Program, the Advisor provided the Board with a written report prepared by the Advisor that addressed the operation of the Program during the period from March 16, 2021 through the Liquidity Committee’s annual meeting held on March 17, 2022 and assessed the Program’s adequacy and effectiveness of implementation during this period, including the operation of the highly liquid investment minimum for each fund that is required under the Program to have one, and any material changes to the Program. Note that because the Funds primarily hold assets that are highly liquid investments, the Funds have not adopted any highly liquid investment minimums.
As stated in the written report, during the review period, no fund breached the 15% limitation on illiquid investments, no fund with a highly liquid investment minimum breached that minimum and no fund filed a Form N-LIQUID. The Advisor concluded that each fund’s investment strategy is appropriate for an open-end fund; that the Program operated effectively in all material respects during the review period; and that the Program is reasonably designed to assess and manage the liquidity risk of each fund and to maintain compliance with Rule 22e-4.
This page intentionally left blank
This page intentionally left blank
This page intentionally left blank
First Trust Exchange-Traded Fund VI
INVESTMENT ADVISOR
First Trust Advisors L.P.
120 East Liberty Drive, Suite 400
Wheaton, IL 60187
ADMINISTRATOR, CUSTODIAN,
FUND ACCOUNTANT &
TRANSFER AGENT
Brown Brothers Harriman & Co.
50 Post Office Square
Boston, MA 02110
INDEPENDENT REGISTERED
PUBLIC ACCOUNTING FIRM
Deloitte & Touche LLP
111 S. Wacker Drive
Chicago, IL 60606
LEGAL COUNSEL
Chapman and Cutler LLP
320 South Canal Street
Chicago, IL 60606
First Trust Exchange-Traded Fund VI
First Trust Indxx Medical Devices ETF (MDEV)
Semi-Annual Report
For the Period Ended
September 30, 2022
First Trust Indxx Medical Devices ETF (MDEV)
Semi-Annual Report
September 30, 2022
Caution Regarding Forward-Looking Statements
This report contains certain forward-looking statements within the meaning of the Securities Act of 1933, as amended, and the Securities Exchange Act of 1934, as amended. Forward-looking statements include statements regarding the goals, beliefs, plans or current expectations of First Trust Advisors L.P. (“First Trust” or the “Advisor”) and its representatives, taking into account the information currently available to them. Forward-looking statements include all statements that do not relate solely to current or historical fact. For example, forward-looking statements include the use of words such as “anticipate,” “estimate,” “intend,” “expect,” “believe,” “plan,” “may,” “should,” “would” or other words that convey uncertainty of future events or outcomes.
Forward-looking statements involve known and unknown risks, uncertainties and other factors that may cause the actual results, performance or achievements of the series of First Trust Exchange-Traded Fund VI (the “Trust”) described in this report (First Trust Indxx Medical Devices ETF; hereinafter referred to as the “Fund”) to be materially different from any future results, performance or achievements expressed or implied by the forward-looking statements. When evaluating the information included in this report, you are cautioned not to place undue reliance on these forward-looking statements, which reflect the judgment of the Advisor and its representatives only as of the date hereof. We undertake no obligation to publicly revise or update these forward-looking statements to reflect events and circumstances that arise after the date hereof.
Performance and Risk Disclosure
There is no assurance that the Fund will achieve its investment objective. The Fund is subject to market risk, which is the possibility that the market values of securities owned by the Fund will decline and that the value of the Fund’s shares may therefore be less than what you paid for them. Accordingly, you can lose money by investing in the Fund. See “Risk Considerations” in the Additional Information section of this report for a discussion of certain other risks of investing in the Fund.
Performance data quoted represents past performance, which is no guarantee of future results, and current performance may be lower or higher than the figures shown. For the most recent month-end performance figures, please visit www.ftportfolios.com or speak with your financial advisor. Investment returns, net asset value and share price will fluctuate and Fund shares, when sold, may be worth more or less than their original cost.
The Advisor may also periodically provide additional information on Fund performance on the Fund’s web page at www.ftportfolios.com.
How to Read This Report
This report contains information that may help you evaluate your investment in the Fund. It includes details about the Fund and presents data and analysis that provide insight into the Fund’s performance and investment approach.
By reading the market overview by Robert F. Carey, Chief Market Strategist of the Advisor, you may obtain an understanding of how the market environment affected the Fund’s performance. The statistical information that follows may help you understand the Fund’s performance compared to that of relevant market benchmarks.
It is important to keep in mind that the opinions expressed by personnel of the Advisor are just that: informed opinions. They should not be considered to be promises or advice. The opinions, like the statistics, cover the period through the date on the cover of this report. The material risks of investing in the Fund are spelled out in the prospectus, the statement of additional information, and other Fund regulatory filings.
First Trust Indxx Medical Devices ETF (MDEV)
Semi-Annual Letter from the Chairman and CEO
September 30, 2022
Dear Shareholders,
First Trust is pleased to provide you with the semi-annual report for the First Trust Indxx Medical Devices ETF (the “Fund”), which contains detailed information about the Fund for the six months ended September 30, 2022.
It is times like these that really test the mettle of investors. Are you someone that is implementing an investment plan with a long time horizon, a trader by nature, or do you fall somewhere in between? Frankly, the current climate is challenging for just about any strategy. While most investors are accustomed to dealing with high levels of volatility in the stock market, some of the daily swings we have witnessed lately have not only been uncharacteristically sharp but have occasionally seemed nearly inexplicable, in my opinion.
In case you have not noticed, volatility is also elevated in the fixed-income market. Bond valuations are down big in 2022. Year-to-date through October 31, 2022, the ICE BofA 15+ Year U.S. Treasury Index experienced a price decline of 33.51%, according to Bloomberg. It was down 31.87% on a total return basis, which includes reinvested interest. To put this into perspective, over the past 40 years, the worst annual showing by the U.S. Long-Term Government Bond Index (20-Year) tracked by Morningstar was the -14.90% total return posted in 2009 (think 2008-2009 global financial crisis). For those who may be unaware, investors benefitted from a trend of declining bond yields from September 1981 through August 2020. While that is an incredible run, nothing lasts forever. Suffice it to say, a lot of pain has been endured by investors in the markets this year and we believe there could be more to come in the near-term. The aggressive interest rate hikes by the Federal Reserve (the “Fed”) are a signal to the markets that it is behind the inflation curve. Moving forward, the Fed will be looking to lower inflation while simultaneously engineering a soft landing in the economy. That will be easier said than done, in my opinion.
There are far more headwinds challenging the securities markets than tailwinds. Here are just a few of those headwinds: stubbornly high inflation; additional rate hikes expected from the Fed from their November and December 2022 meetings, which could potentially push bond yields higher; the ongoing war between Russia and Ukraine, which is impacting the supply and prices of crude oil and natural gas; China enforcing a zero-tolerance policy to combat the spread of the coronavirus by locking down entire cities to its own economic detriment; and the potential for food and energy shortages this coming winter. With the housing market looking like it is finally cooling off, due largely to a huge spike in mortgage rates this year, which were up more than double the rate at the start of the year, the last big tailwind standing may just be the strong U.S. labor market. If the job market can hang in there, the Fed’s goal of a soft landing for the economy may be attainable. I think we will have a clearer picture of things at the start of 2023.
Year-to-date through October 31, 2022, the S&P 500® Index (the “Index”) posted a total return of -17.70%, according to Bloomberg, which puts the Index in bear market territory. A bear market is defined as a 20% or greater decline in the price of a security or index from its most recent peak. While the 17.70% decline in the Index would technically qualify as a stock market correction, investors should continue to view the current downturn as a bear market, in my opinion. Keep in mind, since World War II, there have been 12 bear markets in the Index, excluding the current bear market, according to Yardeni Research. The average price decline of those 12 bear markets was 33.6%. The average price gain over the 12-months following the trough reached during those bear markets was 40.8%, according to Bloomberg. Bear markets come and go. You can’t catch the turn if you are not in the market when the turn comes.
Thank you for giving First Trust the opportunity to play a role in your financial future. We value our relationship with you and will report on the Fund again in six months.
Sincerely,
James A. Bowen
Chairman of the Board of Trustees
Chief Executive Officer of First Trust Advisors L.P.
First Trust Indxx Medical Devices ETF
Semi-Annual Report (Unaudited)
September 30, 2022
Robert F. Carey, CFA
Senior Vice President and Chief Market Strategist
First Trust Advisors L.P.
Mr. Carey is responsible for the overall management of research and analysis of the First Trust product line. Mr. Carey has more than 30 years of experience as an Equity and Fixed-Income Analyst and is a recipient of the Chartered Financial Analyst (“CFA”) designation. He is a graduate of the University of Illinois at Champaign-Urbana with a B.S. in Physics. He is also a member of the Investment Analysts Society of Chicago and the CFA Institute. Mr. Carey has appeared as a guest on such programs as Bloomberg TV, CNBC, and WBBM Radio, and has been quoted by several publications, including The Wall Street Journal, The Wall Street Reporter, Bloomberg News Service, and Registered Rep.
State of the Global Economy
The International Monetary Fund (“IMF”) reported in its October release that global gross domestic product (“GDP”) growth is expected to come in at 3.2% in 2022 and 2.7% in 2023, down from 6.0% in 2021. The IMF sees the U.S. economy growing 1.6% in 2022 and 1.0% in 2023, down from 5.7% in 2021. With respect to all Advanced Economies, the IMF is projecting GDP growth of 2.4% in 2022 and 1.1% in 2023, down from 5.2% in 2021. Lastly, it sees Emerging Markets and Developing Economies growing 3.7% in 2022 and 3.7% again in 2023, down from 6.6% in 2021. From 1970 to 2021, the average global GDP growth rate was 3.6%, according to the IMF. Looking ahead, the IMF notes that the global economy must navigate three key pressures: the war in Ukraine, world-wide inflation and continued economic headwinds in the U.S., Europe and China.
Russia’s war with Ukraine continues to destabilize the global economy, increasing the cost of living and impeding economic growth. European natural gas prices have spiked four-fold since 2021, according to the IMF. Russia has decreased natural gas deliveries to Europe by over 80% of their 2021 total, greatly increasing the likelihood of an energy shortage. Worldwide inflationary pressures continue to fester, with global inflation forecast to surge to 8.8% in 2022, up from 4.7% in 2021. Central banks have rapidly tightened monetary policy in response, and will likely have to continue to do so, in our opinion. These tighter financial conditions have produced significant headwinds to growth among most major economies and are likely to have at least some impact in 2023.
Performance of Global Stocks and Bonds
U.S. equities have turned negative over the past six-month period. The S&P 500® (the “Index”), S&P MidCap 400® and S&P SmallCap 600® Indices posted total returns of -20.20%, -17.50% and -18.58%, respectively, for the six-month period ended September 30, 2022, according to Bloomberg. Value stocks outperformed growth stocks over the period. The S&P 500® Value Index posted a total return of -16.43% versus -23.87% for the S&P 500® Growth Index; an indication that investors may be anticipating slower growth over the near-term and are opting for companies that are trading at more attractive valuations. All eleven sectors that comprise the Index were down on a total return basis. Energy was down least for the period, losing 2.94%, while the worst showing came from Communication Services, down 30.79%.
A Bloomberg survey of 23 equity strategists found that the average 2022 year-end price target for the Index was 4,346 as of September 15, 2022, down from 4,376 on August 16, 2022, according to its own release. Heading into 2022 (December 16, 2021), strategists had an average target of 4,950. The highest and lowest estimates on September 15, 2022, were 5,100 and 3,400, respectively. On September 15, 2022, the Index closed at 3,901.35, which was 18.66% below its all-time closing high of 4,796.56 on January 3, 2022. As of September 30, 2022, Bloomberg’s 2022, 2023 and 2024 consensus earnings growth rate estimates for the Index stood at 9.61%, 6.14% and 8.44%, respectively.
The performance of foreign equities continues to lag that of major U.S. stock indices. Over the past six months, the MSCI World ex USA and MSCI Emerging Markets equity indices posted total returns of -22.50% (USD) and -21.70% (USD), respectively, according to Bloomberg. Major foreign bond indices were also in negative territory. The Bloomberg Global Aggregate Index of higher quality debt posted a total return of -14.63% (USD), while the EM Hard Currency Aggregate Index of emerging markets debt fell by 13.90% (USD), according to Bloomberg. Over that same period, the U.S. dollar surged by 14.04% against a basket of major currencies, as measured by the U.S. Dollar Index (DXY), pressuring the returns on unhedged foreign securities held by U.S. investors.
U.S. bond indices have not been immune to the aggressive tightening of monetary policy by central banks, particularly the U.S. Federal Reserve. Over the past six months, the best performing index we track was the U.S. Treasury: Intermediate Index, which posted a total return of -4.69%. The worst performer was the Municipal Long Bond: Long Bond (22+), which posted a total return of -12.15%. The yield on the benchmark 10-Year Treasury Note (“T-Note”) rose by 149 basis points (a 63.70% increase over the period) to close at 3.83%, according to Bloomberg. For comparative purposes, the average yield on the 10-Year T-Note was 2.10% for the 10-year period ended September 30, 2022.
Fund Performance Overview (Unaudited)
First Trust Indxx Medical Devices ETF (MDEV)
The First Trust Indxx Medical Devices ETF (the “Fund”) seeks investment results that correspond generally to the price and yield (before the Fund’s fees and expenses) of an index called the Indxx Global Medical Equipment Index (the “Index”). The shares of the Fund are listed and traded on Cboe BZX Exchange, Inc. under the ticker symbol “MDEV.”
Under normal market conditions, the Fund will invest at least 80% of its net assets (plus any borrowings for investment purposes) in the common stocks and depositary receipts that comprise the Index. The Index is developed, maintained and sponsored by Indxx, Inc. (the “Index Provider”). The Index is composed of common stock and depositary receipts issued by U.S. and non-U.S. companies that comprise the medical devices industry, as determined by the Index Provider. Companies comprising the medical devices industry are those companies that focus on developing equipment, instruments, and machines to diagnose, monitor, and treat diseases.
| Performance | | | | |
| | | | Average Annual
Total Returns | Cumulative
Total Returns |
| | 6 Months Ended
9/30/22 | 1 Year Ended
9/30/22 | Inception (6/22/21)
to 9/30/22 | Inception (6/22/21)
to 9/30/22 |
| Fund Performance | | | | |
| NAV | -27.34% | -36.98% | -28.93% | -35.28% |
| Market Price | -27.53% | -37.21% | -29.00% | -35.36% |
| Index Performance | | | | |
| Indxx Global Medical Equipment Index | -27.26% | -36.58% | -28.36% | -34.62% |
| MSCI World Health Care Index | -13.49% | -9.79% | -6.67% | -8.42% |
Total returns for the period since inception are calculated from the inception date of the Fund. “Average Annual Total Returns” represent the average annual change in value of an investment over the period indicated. “Cumulative Total Returns” represent the total change in value of an investment over the period indicated.
The Fund’s per share net asset value (“NAV”) is the value of one share of the Fund and is computed by dividing the value of all assets of the Fund (including accrued interest and dividends), less all liabilities (including accrued expenses and dividends declared but unpaid), by the total number of outstanding shares. The price used to calculate market return (“Market Price”) is determined by using the midpoint of the national best bid and offer price (“NBBO”) as of the time that the Fund’s NAV is calculated. Under SEC rules, the NBBO consists of the highest displayed buy and lowest sell prices among the various exchanges trading the Fund at the time the Fund’s NAV is calculated. Since shares of the Fund did not trade in the secondary market until after its inception, for the period from inception to the first day of secondary market trading in shares of the Fund, the NAV of the Fund is used as a proxy for the secondary market trading price to calculate market returns. NAV and market returns assume that all distributions have been reinvested in the Fund at NAV and Market Price, respectively.
An index is a statistical composite that tracks a specified financial market or sector. Unlike the Fund, the indices do not actually hold a portfolio of securities and therefore do not incur the expenses incurred by the Fund. These expenses negatively impact the performance of the Fund. Also, market returns do not include brokerage commissions that may be payable on secondary market transactions. If brokerage commissions were included, market returns would be lower. The total returns presented reflect the reinvestment of dividends on securities in the indices. The returns presented do not reflect the deduction of taxes that a shareholder would pay on Fund distributions or the redemption or sale of Fund shares. The investment return and principal value of shares of the Fund will vary with changes in market conditions. Shares of the Fund may be worth more or less than their original cost when they are redeemed or sold in the market. The Fund’s past performance is no guarantee of future performance.
Indxx and the Index are trademarks of Indxx, Inc. (“Indxx”) and have been licensed for use for certain purposes by First Trust. The Fund is not sponsored, endorsed, sold or promoted by Indxx, and Indxx makes no representation regarding the advisability of trading in such product. The Index is determined, composed and calculated by Indxx without regard to First Trust or the Fund.
Fund Performance Overview (Unaudited) (Continued)
First Trust Indxx Medical Devices ETF (MDEV) (Continued)
| Sector Allocation | % of Total
Investments |
| Health Care | 100.0% |
| Total | 100.0% |
| Top Ten Holdings | % of Total
Investments |
| Olympus Corp. | 2.8% |
| Masimo Corp. | 2.7 |
| Agilent Technologies, Inc. | 2.5 |
| Terumo Corp. | 2.5 |
| Novocure Ltd. | 2.5 |
| ResMed, Inc. | 2.4 |
| Danaher Corp. | 2.4 |
| Boston Scientific Corp. | 2.4 |
| Waters Corp. | 2.4 |
| Insulet Corp. | 2.4 |
| Total | 25.0% |

Performance figures assume reinvestment of all distributions and do not reflect the deduction of taxes that a shareholder would pay on Fund distributions or the redemption or sale of Fund shares. An index is a statistical composite that tracks a specified financial market or sector. Unlike the Fund, the indices do not actually hold a portfolio of securities and therefore do not incur the expenses incurred by the Fund. These expenses negatively impact the performance of the Fund. The Fund’s past performance does not predict future performance.
Frequency Distribution of Discounts and Premiums
Information showing the number of days the market price of the Fund’s shares was greater (at a premium) and less (at a discount) than the Fund’s net asset value for the most recently completed year, and the most recently completed calendar quarters since that year (or life of the Fund, if shorter), is available at https://www.ftportfolios.com/Retail/etf/home.aspx.
First Trust Indxx Medical Devices ETF (MDEV)
Understanding Your Fund Expenses
September 30, 2022 (Unaudited)
As a shareholder of the First Trust Indxx Medical Devices ETF (the “Fund”), you incur two types of costs: (1) transaction costs; and (2) ongoing costs, including management fees, distribution and/or service (12b-1) fees, if any, and other Fund expenses. This Example is intended to help you understand your ongoing costs of investing in the Fund and to compare these costs with the ongoing costs of investing in other funds.
The Example is based on an investment of $1,000 invested at the beginning of the period and held through the six-month period ended September 30, 2022.
Actual Expenses
The first line in the following table provides information about actual account values and actual expenses. You may use the information in this line, together with the amount you invested, to estimate the expenses that you paid over the period. Simply divide your account value by $1,000 (for example, an $8,600 account value divided by $1,000 = 8.6), then multiply the result by the number in the first line under the heading entitled “Expenses Paid During the Six-Month Period” to estimate the expenses you paid on your account during this six-month period.
Hypothetical Example for Comparison Purposes
The second line in the following table provides information about hypothetical account values and hypothetical expenses based on the Fund’s actual expense ratio and an assumed rate of return of 5% per year before expenses, which is not the Fund’s actual return. The hypothetical account values and expenses may not be used to estimate the actual ending account balance or expenses you paid for the period. You may use this information to compare the ongoing costs of investing in the Fund and other funds. To do so, compare this 5% hypothetical example with the 5% hypothetical examples that appear in the shareholder reports of the other funds.
Please note that the expenses shown in the table are meant to highlight your ongoing costs only and do not reflect any transactional costs such as brokerage commissions. Therefore, the second line in the table is useful in comparing ongoing costs only, and will not help you determine the relative total costs of owning different funds. In addition, if these transactional costs were included, your costs would have been higher.
| | Beginning
Account Value
April 1, 2022 | Ending
Account Value
September 30, 2022 | Annualized
Expense Ratio
Based on the
Six-Month
Period | Expenses Paid
During the
Six-Month
Period (a) |
| First Trust Indxx Medical Devices ETF (MDEV) |
| Actual | $1,000.00 | $726.60 | 0.70% | $3.03 |
| Hypothetical (5% return before expenses) | $1,000.00 | $1,021.56 | 0.70% | $3.55 |
| (a) | Expenses are equal to the annualized expense ratios as indicated in the table multiplied by the average account value over the period (April 1, 2022 through September 30, 2022), multiplied by 183/365 (to reflect the six-month period). |
First Trust Indxx Medical Devices ETF (MDEV)
Portfolio of Investments
September 30, 2022 (Unaudited)
| Shares | | Description | | Value |
| COMMON STOCKS – 99.6% |
| | | Biotechnology – 1.3% | | |
| 658 | | Exact Sciences Corp. (a) | | $21,378 |
| | | Health Care Equipment &
Supplies – 76.0% | | |
| 366 | | Abbott Laboratories | | 35,414 |
| 142 | | ABIOMED, Inc. (a) | | 34,884 |
| 560 | | Alcon, Inc. (b) | | 32,528 |
| 107 | | Align Technology, Inc. (a) | | 22,161 |
| 579 | | Baxter International, Inc. | | 31,185 |
| 165 | | Becton Dickinson and Co. | | 36,767 |
| 413 | | BioMerieux (b) | | 32,668 |
| 1,004 | | Boston Scientific Corp. (a) | | 38,885 |
| 287 | | Carl Zeiss Meditec AG (b) | | 29,812 |
| 269 | | Cochlear Ltd. (b) | | 33,414 |
| 283 | | Coloplast A.S., Class B (b) | | 28,760 |
| 109 | | Cooper (The) Cos., Inc. | | 28,765 |
| 1,002 | | Demant A.S. (a) (b) | | 24,771 |
| 939 | | DENTSPLY SIRONA, Inc. | | 26,621 |
| 352 | | DexCom, Inc. (a) | | 28,350 |
| 365 | | Edwards Lifesciences Corp. (a) | | 30,160 |
| 2,724 | | Fisher & Paykel Healthcare Corp., Ltd. (b) | | 28,234 |
| 594 | | Globus Medical, Inc., Class A (a) | | 35,385 |
| 568 | | Hologic, Inc. (a) | | 36,647 |
| 394 | | Hoya Corp. (b) | | 37,965 |
| 169 | | Insulet Corp. (a) | | 38,769 |
| 155 | | Intuitive Surgical, Inc. (a) | | 29,053 |
| 1,478 | | Koninklijke Philips N.V. (b) | | 22,756 |
| 306 | | Masimo Corp. (a) | | 43,195 |
| 402 | | Medtronic PLC | | 32,461 |
| 525 | | Novocure Ltd. (a) | | 39,889 |
| 2,340 | | Olympus Corp. (b) | | 45,016 |
| 179 | | ResMed, Inc. | | 39,076 |
| 732 | | Siemens Healthineers AG (b) (c) (d) | | 31,399 |
| 2,815 | | Smith & Nephew PLC (b) | | 32,493 |
| 111 | | Sonova Holding AG (b) | | 24,427 |
| 182 | | STERIS PLC | | 30,263 |
| 310 | | Straumann Holding AG (b) | | 28,353 |
| 167 | | Stryker Corp. | | 33,824 |
| 578 | | Sysmex Corp. (b) | | 30,886 |
| 132 | | Teleflex, Inc. | | 26,593 |
| 1,430 | | Terumo Corp. (b) | | 40,198 |
| 347 | | Zimmer Biomet Holdings, Inc. | | 36,279 |
| | | | | 1,238,306 |
| | | Health Care Providers &
Services – 1.6% | | |
| 977 | | Amplifon S.p.A. (b) | | 25,455 |
| | | Life Sciences Tools &
Services – 20.7% | | |
| 332 | | Agilent Technologies, Inc. | | 40,355 |
| 76 | | Bio-Rad Laboratories, Inc., Class A (a) | | 31,703 |
| 151 | | Danaher Corp. | | 39,002 |
| Shares | | Description | | Value |
|
| | | Life Sciences Tools &
Services (Continued) | | |
| 33 | | Mettler-Toledo International, Inc. (a) | | $35,776 |
| 262 | | PerkinElmer, Inc. | | 31,526 |
| 105 | | Sartorius Stedim Biotech (b) | | 32,207 |
| 74 | | Thermo Fisher Scientific, Inc. | | 37,532 |
| 144 | | Waters Corp. (a) | | 38,812 |
| 107 | | West Pharmaceutical Services, Inc. | | 26,331 |
| 2,952 | | WuXi AppTec Co., Ltd., Class H (b) (c) (d) | | 23,577 |
| | | | | 336,821 |
| | | Total Investments – 99.6% | | 1,621,960 |
| | | (Cost $2,688,259) | | |
| | | Net Other Assets and Liabilities – 0.4% | | 7,198 |
| | | Net Assets – 100.0% | | $1,629,158 |
| (a) | Non-income producing security. |
| (b) | This security is fair valued by the Advisor’s Pricing Committee in accordance with procedures approved by the Trust’s Board of Trustees and in accordance with provisions of the Investment Company Act of 1940 and rules thereunder, as amended. At September 30, 2022, securities noted as such are valued at $584,919 or 35.9% of net assets. Certain of these securities are fair valued using a factor provided by a third-party pricing service due to the change in value between the foreign markets’ close and the New York Stock Exchange close exceeding a certain threshold. On days when this threshold is not exceeded, these securities are typically valued at the last sale price on the exchange on which they are principally traded. |
| (c) | This security may be resold to qualified foreign investors and foreign institutional buyers under Regulation S of the Securities Act of 1933, as amended (the “1933 Act”). |
| (d) | This security is exempt from registration upon resale under Rule 144A of the 1933 Act and may be resold in transactions exempt from registration, normally to qualified institutional buyers. This security is not restricted on the foreign exchange where it trades freely without any additional registration. As such, it does not require the additional disclosure required of restricted securities. |
Page 6
See Notes to Financial Statements
First Trust Indxx Medical Devices ETF (MDEV)
Portfolio of Investments (Continued)
September 30, 2022 (Unaudited)
Currency Exposure
Diversification | % of Total
Investments |
| United States Dollar | 63.9% |
| Euro | 10.7 |
| Japanese Yen | 9.5 |
| Swiss Franc | 5.3 |
| Danish Krone | 3.3 |
| Australian Dollar | 2.1 |
| British Pound Sterling | 2.0 |
| New Zealand Dollar | 1.7 |
| Hong Kong Dollar | 1.5 |
| Total | 100.0% |
Valuation Inputs
A summary of the inputs used to value the Fund’s investments as of September 30, 2022 is as follows (see Note 2A - Portfolio Valuation in the Notes to Financial Statements):
| | Total
Value at
9/30/2022 | Level 1
Quoted
Prices | Level 2
Significant
Observable
Inputs | Level 3
Significant
Unobservable
Inputs |
| Common Stocks: | | | | |
| Biotechnology | $ 21,378 | $ 21,378 | $ — | $ — |
| Health Care Equipment & Supplies | 1,238,306 | 734,626 | 503,680 | — |
| Health Care Providers & Services | 25,455 | — | 25,455 | — |
| Life Sciences Tools & Services | 336,821 | 281,037 | 55,784 | — |
| Total Investments | $ 1,621,960 | $ 1,037,041 | $ 584,919 | $— |
See Notes to Financial Statements
Page 7
First Trust Indxx Medical Devices ETF (MDEV)
Statement of Assets and Liabilities
September 30, 2022 (Unaudited)
| ASSETS: | |
Investments, at value
(Cost $2,688,259)
| $ 1,621,960 |
Cash
| 5,657 |
| Receivables: | |
Dividends
| 1,796 |
Dividend reclaims
| 762 |
Total Assets
| 1,630,175 |
| LIABILITIES: | |
Investment advisory fees payable
| 1,017 |
Total Liabilities
| 1,017 |
NET ASSETS
| $1,629,158 |
| NET ASSETS consist of: | |
Paid-in capital
| $ 2,841,138 |
Par value
| 1,000 |
Accumulated distributable earnings (loss)
| (1,212,980) |
NET ASSETS
| $1,629,158 |
NET ASSET VALUE, per share
| $16.29 |
Number of shares outstanding (unlimited number of shares authorized, par value $0.01 per share)
| 100,002 |
Page 8
See Notes to Financial Statements
First Trust Indxx Medical Devices ETF (MDEV)
Statement of Operations
For the Six Months Ended September 30, 2022 (Unaudited)
| INVESTMENT INCOME: | |
Dividends
| $ 7,836 |
Foreign withholding tax
| (615) |
Other
| 10 |
Total investment income
| 7,231 |
| EXPENSES: | |
Investment advisory fees
| 6,749 |
Total expenses
| 6,749 |
NET INVESTMENT INCOME (LOSS)
| 482 |
| NET REALIZED AND UNREALIZED GAIN (LOSS): | |
| Net realized gain (loss) on: | |
Investments
| (122,999) |
Foreign currency transactions
| (487) |
Net realized gain (loss)
| (123,486) |
| Net change in unrealized appreciation (depreciation) on: | |
Investments
| (490,130) |
Foreign currency translation
| (86) |
Net change in unrealized appreciation (depreciation)
| (490,216) |
NET REALIZED AND UNREALIZED GAIN (LOSS)
| (613,702) |
NET INCREASE (DECREASE) IN NET ASSETS RESULTING FROM OPERATIONS
| $(613,220) |
See Notes to Financial Statements
Page 9
First Trust Indxx Medical Devices ETF (MDEV)
Statements of Changes in Net Assets
| | Six Months
Ended
9/30/2022
(Unaudited) | | Period
Ended
3/31/2022 (a) |
| OPERATIONS: | | | |
Net investment income (loss)
| $ 482 | | $ (46,130) |
Net realized gain (loss)
| (123,486) | | 131,318 |
Net change in unrealized appreciation (depreciation)
| (490,216) | | (576,197) |
Net increase (decrease) in net assets resulting from operations
| (613,220) | | (491,009) |
| SHAREHOLDER TRANSACTIONS: | | | |
Proceeds from shares sold
| — | | 40,832,103 |
Net increase (decrease) in net assets resulting from shareholder transactions
| — | | 2,733,387 |
Total increase (decrease) in net assets
| (613,220) | | 2,242,378 |
| NET ASSETS: | | | |
Beginning of period
| 2,242,378 | | — |
End of period
| $1,629,158 | | $2,242,378 |
| CHANGES IN SHARES OUTSTANDING: | | | |
Shares outstanding, beginning of period
| 100,002 | | — |
Shares sold
| — | | 1,600,002 |
Shares redeemed
| — | | (1,500,000) |
Shares outstanding, end of period
| 100,002 | | 100,002 |
| (a) | Inception date is June 22, 2021, which is consistent with the commencement of investment operations and is the date the initial creation units were established. |
Page 10
See Notes to Financial Statements
First Trust Indxx Medical Devices ETF (MDEV)
Financial Highlights
For a share outstanding throughout each period
| | Six Months
Ended
9/30/2022
(Unaudited) | | Period
Ended
3/31/2022 (a) |
Net asset value, beginning of period
| $ 22.42 | | $ 25.17 |
| Income from investment operations: | | | |
Net investment income (loss)
| (0.00) (b) | | (0.46) |
Net realized and unrealized gain (loss)
| (6.13) | | (2.29) |
Total from investment operations
| (6.13) | | (2.75) |
Net asset value, end of period
| $16.29 | | $22.42 |
Total return (c)
| (27.34)% | | (10.93)% |
| Ratios to average net assets/supplemental data: | | | |
Net assets, end of period (in 000’s)
| $ 1,629 | | $ 2,242 |
Ratio of total expenses to average net assets
| 0.70% (d) | | 0.70% (d) |
Ratio of net investment income (loss) to average net assets
| 0.05% (d) | | (0.36)% (d) |
Portfolio turnover rate (e)
| 13% | | 13% |
| (a) | Inception date is June 22, 2021, which is consistent with the commencement of investment operations and is the date the initial creation units were established. |
| (b) | Amount is less than $0.01. |
| (c) | Total return is calculated assuming an initial investment made at the net asset value at the beginning of the period, reinvestment of all distributions at net asset value during the period, and redemption at net asset value on the last day of the period. The return presented does not reflect the deduction of taxes that a shareholder would pay on Fund distributions or the redemption or sale of Fund shares. Total return is calculated for the time period presented and is not annualized for periods of less than a year. |
| (d) | Annualized. |
| (e) | Portfolio turnover is calculated for the time period presented and is not annualized for periods of less than a year and does not include securities received or delivered from processing creations or redemptions and in-kind transactions. |
See Notes to Financial Statements
Page 11
Notes to Financial Statements
First Trust Indxx Medical Devices ETF (MDEV)
September 30, 2022 (Unaudited)
1. Organization
First Trust Exchange-Traded Fund VI (the “Trust”) is an open-end management investment company organized as a Massachusetts business trust on June 4, 2012, and is registered with the Securities and Exchange Commission (“SEC”) under the Investment Company Act of 1940, as amended (the “1940 Act”).
The Trust currently consists of thirty-three funds that are offering shares. This report covers the First Trust Indxx Medical Devices ETF (the “Fund”), a non-diversified series of the Trust, which trades under the ticker “MDEV” on the CBOE BZX Exchange, Inc. Unlike conventional mutual funds, the Fund issues and redeems shares on a continuous basis, at net asset value (“NAV”), only in large blocks of shares known as “Creation Units.”
The investment objective of the Fund seeks investment results that correspond generally to the price and yield (before the Fund’s fees and expenses) of an index called the Indxx Global Medical Equipment Index. Under normal market conditions, the Fund seeks to achieve its investment objective by investing at least 80% of its net assets (plus any borrowings for investment purposes) in the common stocks and depositary receipts that comprise the Index. There can be no assurances that the Fund will achieve its investment objective. The Fund may not be appropriate for all investors.
2. Significant Accounting Policies
The Fund is considered an investment company and follows accounting and reporting guidance under Financial Accounting Standards Board Accounting Standards Codification Topic 946, “Financial Services-Investment Companies.” The following is a summary of significant accounting policies consistently followed by the Fund in the preparation of the financial statements. The preparation of the financial statements in accordance with accounting principles generally accepted in the United States of America (“U.S. GAAP”) requires management to make estimates and assumptions that affect the reported amounts and disclosures in the financial statements. Actual results could differ from those estimates.
A. Portfolio Valuation
The Fund’s NAV is determined daily as of the close of regular trading on the New York Stock Exchange (“NYSE”), normally 4:00 p.m. Eastern time, on each day the NYSE is open for trading. If the NYSE closes early on a valuation day, the NAV is determined as of that time. Foreign securities are priced using data reflecting the earlier closing of the principal markets for those securities. The Fund’s NAV is calculated by dividing the value of all assets of the Fund (including accrued interest and dividends), less all liabilities (including accrued expenses and dividends declared but unpaid), by the total number of shares outstanding.
The Fund’s investments are valued daily at market value or, in the absence of market value with respect to any portfolio securities, at fair value. Market value prices represent readily available market quotations such as last sale or official closing prices from a national or foreign exchange (i.e., a regulated market) and are primarily obtained from third-party pricing services. Fair value prices represent any prices not considered market value prices and are either obtained from a third-party pricing service or are determined by the Pricing Committee of the Fund’s investment advisor, First Trust Advisors L.P. (“First Trust” or the “Advisor”), in accordance with valuation procedures approved by the Trust’s Board of Trustees, and in accordance with provisions of the 1940 Act and rules thereunder. Investments valued by the Advisor’s Pricing Committee, if any, are footnoted as such in the footnotes to the Portfolio of Investments. The Fund’s investments are valued as follows:
Common stocks and other equity securities listed on any national or foreign exchange (excluding Nasdaq and the London Stock Exchange Alternative Investment Market (“AIM”)) are valued at the last sale price on the exchange on which they are principally traded or, for Nasdaq and AIM securities, the official closing price. Securities traded on more than one securities exchange are valued at the last sale price or official closing price, as applicable, at the close of the securities exchange representing the primary exchange for such securities.
Securities trading on foreign exchanges or over-the-counter markets that close prior to the NYSE close may be valued using a systematic fair valuation model provided by a third-party pricing service. If these foreign securities meet certain criteria in relation to the valuation model, their valuation is systematically adjusted to reflect the impact of movement in the U.S. market after the close of the foreign markets.
Securities traded in an over-the-counter market are valued at the mean of their most recent bid and asked price, if available, and otherwise at their last trade price.
Certain securities may not be able to be priced by pre-established pricing methods. Such securities may be valued by the Advisor’s Pricing Committee at fair value. These securities generally include, but are not limited to, restricted securities (securities which may not be publicly sold without registration under the Securities Act of 1933, as amended) for which a third-party pricing service is unable to provide a market price; securities whose trading has been formally suspended; a security whose market or fair value price is not
Notes to Financial Statements (Continued)
First Trust Indxx Medical Devices ETF (MDEV)
September 30, 2022 (Unaudited)
available from a pre-established pricing source; a security with respect to which an event has occurred that is likely to materially affect the value of the security after the market has closed but before the calculation of the Fund’s NAV or make it difficult or impossible to obtain a reliable market quotation; and a security whose price, as provided by the third-party pricing service, does not reflect the security’s fair value. As a general principle, the current fair value of a security would appear to be the amount which the owner might reasonably expect to receive for the security upon its current sale. When fair value prices are used, generally they will differ from market quotations or official closing prices on the applicable exchanges. A variety of factors may be considered in determining the fair value of such securities, including, but not limited to, the following:
| 1) | the last sale price on the exchange on which they are principally traded or, for Nasdaq and AIM securities, the official closing price; |
| 2) | the type of security; |
| 3) | the size of the holding; |
| 4) | the initial cost of the security; |
| 5) | transactions in comparable securities; |
| 6) | price quotes from dealers and/or third-party pricing services; |
| 7) | relationships among various securities; |
| 8) | information obtained by contacting the issuer, analysts, or the appropriate stock exchange; |
| 9) | an analysis of the issuer’s financial statements; |
| 10) | the existence of merger proposals or tender offers that might affect the value of the security; and |
| 11) | other relevant factors. |
If the securities in question are foreign securities, the following additional information may be considered:
| 1) | the value of similar foreign securities traded on other foreign markets; |
| 2) | ADR trading of similar securities; |
| 3) | closed-end fund or exchange-traded fund trading of similar securities; |
| 4) | foreign currency exchange activity; |
| 5) | the trading prices of financial products that are tied to baskets of foreign securities; |
| 6) | factors relating to the event that precipitated the pricing problem; |
| 7) | whether the event is likely to recur; |
| 8) | whether the effects of the event are isolated or whether they affect entire markets, countries or regions; and |
| 9) | other relevant factors. |
In addition, differences between the prices used to calculate a Fund’s NAV and the prices used by such Fund’s corresponding index could result in a difference between a Fund’s performance and the performance of its underlying index.
Because foreign markets may be open on different days than the days during which investors may transact in the shares of the Fund, the value of the Fund’s securities may change on the days when investors are not able to transact in the shares of the Fund. The value of securities denominated in foreign currencies is converted into U.S. dollars using exchange rates determined daily as of the close of regular trading on the NYSE. Any use of a different rate from the rates used by a relevant index may adversely affect the Fund’s ability to track the index.
The Fund is subject to fair value accounting standards that define fair value, establish the framework for measuring fair value and provide a three-level hierarchy for fair valuation based upon the inputs to the valuation as of the measurement date. The three levels of the fair value hierarchy are as follows:
| • | Level 1 – Level 1 inputs are quoted prices in active markets for identical investments. An active market is a market in which transactions for the investment occur with sufficient frequency and volume to provide pricing information on an ongoing basis. |
| • | Level 2 – Level 2 inputs are observable inputs, either directly or indirectly, and include the following: |
| o | Quoted prices for similar investments in active markets. |
| o | Quoted prices for identical or similar investments in markets that are non-active. A non-active market is a market where there are few transactions for the investment, the prices are not current, or price quotations vary substantially either over time or among market makers, or in which little information is released publicly. |
| o | Inputs other than quoted prices that are observable for the investment (for example, interest rates and yield curves observable at commonly quoted intervals, volatilities, prepayment speeds, loss severities, credit risks, and default rates). |
Notes to Financial Statements (Continued)
First Trust Indxx Medical Devices ETF (MDEV)
September 30, 2022 (Unaudited)
| o | Inputs that are derived principally from or corroborated by observable market data by correlation or other means. |
| • | Level 3 – Level 3 inputs are unobservable inputs. Unobservable inputs may reflect the reporting entity’s own assumptions about the assumptions that market participants would use in pricing the investment. |
The inputs or methodologies used for valuing investments are not necessarily an indication of the risk associated with investing in those investments. A summary of the inputs used to value the Fund’s investments as of September 30, 2022, is included with the Fund’s Portfolio of Investments.
In December 2020, the SEC adopted Rule 2a-5 under the 1940 Act, establishing requirements to determine fair value in good faith for purposes of the 1940 Act. The rule permits fund boards to designate a fund’s investment adviser to perform fair value determinations, subject to board oversight and certain other conditions. The rule also defines when market quotations are “readily available” for purposes of the 1940 Act and requires a fund to fair value a portfolio investment when a market quotation is not readily available. The SEC also adopted new Rule 31a-4 under the 1940 Act, which sets forth recordkeeping requirements associated with fair value determinations. The compliance date for Rule 2a-5 and Rule 31a-4 was September 8, 2022.
Effective September 8, 2022 and pursuant to the requirements of Rule 2a-5, the Trust’s Board of Trustees designated the Advisor as its valuation designee to perform fair value determinations and approved new Advisor Valuation Procedures for the Trust.
B. Securities Transactions and Investment Income
Securities transactions are recorded as of the trade date. Realized gains and losses from securities transactions are recorded on the identified cost basis. Dividend income is recorded on the ex-dividend date. Interest income, if any, is recorded on the accrual basis.
Withholding taxes and tax reclaims on foreign dividends have been provided for in accordance with the Fund’s understanding of the applicable country’s tax rules and rates.
C. Foreign Currency
The books and records of the Fund are maintained in U.S. dollars. Foreign currencies, investments and other assets and liabilities are translated into U.S. dollars at the exchange rates prevailing at the end of the period. Purchases and sales of investments and items of income and expense are translated on the respective dates of such transactions. Unrealized gains and losses on assets and liabilities, other than investments in securities, which result from changes in foreign currency exchange rates have been included in “Net change in unrealized appreciation (depreciation) on foreign currency translation” on the Statement of Operations. Unrealized gains and losses on investments in securities which result from changes in foreign exchange rates are included with fluctuations arising from changes in market price and are shown in “Net change in unrealized appreciation (depreciation) on investments” on the Statement of Operations. Net realized foreign currency gains and losses include the effect of changes in exchange rates between trade date and settlement date on investment security transactions, foreign currency transactions and interest and dividends received and are shown in “Net realized gain (loss) on foreign currency transactions” on the Statement of Operations. The portion of foreign currency gains and losses related to fluctuation in exchange rates between the initial purchase settlement date and subsequent sale trade date is included in “Net realized gain (loss) on investments” on the Statement of Operations.
D. Dividends and Distributions to Shareholders
Dividends from net investment income, if any, are declared and paid quarterly by the Fund, or as the Board of Trustees may determine from time to time. Distributions of net realized capital gains earned by the Fund, if any, are distributed at least annually.
Distributions from net investment income and realized capital gains are determined in accordance with federal income tax regulations, which may differ from U.S. GAAP. Certain capital accounts in the financial statements are periodically adjusted for permanent differences in order to reflect their tax character. These permanent differences are primarily due to the varying treatment of income and gain/loss on portfolio securities held by the Fund and have no impact on net assets or NAV per share. Temporary differences, which arise from recognizing certain items of income, expense and gain/loss in different periods for financial statement and tax purposes, will reverse at some time in the future.
During the fiscal period ended March 31, 2022, no distributions were paid by the Fund.
As of March 31, 2022, the components of distributable earnings on a tax basis for the Fund were as follows:
Undistributed ordinary income
| $— |
Accumulated capital and other gain (loss)
| (17,983) |
Net unrealized appreciation (depreciation)
| (581,777) |
Notes to Financial Statements (Continued)
First Trust Indxx Medical Devices ETF (MDEV)
September 30, 2022 (Unaudited)
E. Income Taxes
The Fund intends to continue to qualify as a regulated investment company by complying with the requirements under Subchapter M of the Internal Revenue Code of 1986, as amended, which includes distributing substantially all of its net investment income and net realized gains to shareholders. Accordingly, no provision has been made for federal and state income taxes. However, due to the timing and amount of distributions, the Fund may be subject to an excise tax of 4% of the amount by which approximately 98% of the Fund’s taxable income exceeds the distributions from such taxable income for the calendar year.
The Fund is subject to accounting standards that establish a minimum threshold for recognizing, and a system for measuring, the benefits of a tax position taken or expected to be taken in a tax return. The taxable period ended 2022 remains open to federal and state audit. As of September 30, 2022, management has evaluated the application of these standards to the Fund and has determined that no provision for income tax is required in the Fund’s financial statements for uncertain tax positions.
The Fund intends to utilize provisions of the federal income tax laws, which allow it to carry a realized capital loss forward indefinitely following the year of the loss and offset such loss against any future realized capital gains. The Fund is subject to certain limitations under U.S. tax rules on the use of capital loss carryforwards and net unrealized built-in losses. These limitations apply when there has been a 50% change in ownership. At March 31, 2022, for federal income tax purposes, the Fund had $13,097 of non-expiring capital loss carryforwards available, to the extent provided by regulations, to offset future capital gains.
Certain losses realized during the current fiscal year may be deferred and treated as occurring on the first day of the following fiscal year for federal income tax purposes. For the fiscal period ended March 31, 2022, the Fund incurred and elected to defer net ordinary losses of $4,886.
As of September 30, 2022, the aggregate cost, gross unrealized appreciation, gross unrealized depreciation, and net unrealized appreciation/(depreciation) on investments (including short positions and derivatives, if any) for federal income tax purposes were as follows:
| Tax Cost | | Gross
Unrealized
Appreciation | | Gross
Unrealized
(Depreciation) | | Net Unrealized
Appreciation
(Depreciation) |
| $2,688,259 | | $— | | $(1,066,299) | | $(1,066,299) |
F. Expenses
Expenses, other than the investment advisory fee and other excluded expenses, are paid by the Advisor (See Note 3).
First Trust has entered into a license agreement with Indxx, Inc. (the “Licensor”), for the Fund. The license agreement allows for the use by First Trust of the Fund’s index and of certain trademarks and trade names of the Licensor. The Fund is a sub-licensee to the applicable agreement.
3. Investment Advisory Fee, Affiliated Transactions and Other Fee Arrangements
First Trust, the investment advisor to the Fund, is a limited partnership with one limited partner, Grace Partners of DuPage L.P., and one general partner, The Charger Corporation. The Charger Corporation is an Illinois corporation controlled by James A. Bowen, Chief Executive Officer of First Trust. First Trust is responsible for the selection and ongoing monitoring of the securities in the Fund’s portfolio, managing the Fund’s business affairs and providing certain administrative services necessary for the management of the Fund.
First Trust is paid an annual unitary management fee of 0.70% of the Fund’s average daily net assets. First Trust is responsible for the expenses of the Fund including the cost of transfer agency, custody, fund administration, licensing fees, legal, audit, and other services, but excluding fee payments under the Investment Management Agreement, interest, taxes, brokerage commissions and other expenses associated with the execution of portfolio transactions, distribution and service fees pursuant to a Rule 12b-1 plan, if any, acquired fund fees and expenses, and extraordinary expenses. First Trust also provides fund reporting services to the Funds for a flat annual fee in the amount of $9,250 per Fund, which is covered under the annual unitary management fee.
The Trust has multiple service agreements with Brown Brothers Harriman & Co. (“BBH”). Under the service agreements, BBH performs custodial, fund accounting, certain administrative services, and transfer agency services for the Fund. As custodian, BBH is responsible for custody of the Fund’s assets. As fund accountant and administrator, BBH is responsible for maintaining the books and records of the Fund’s securities and cash. As transfer agent, BBH is responsible for maintaining shareholder records for the Fund.
Notes to Financial Statements (Continued)
First Trust Indxx Medical Devices ETF (MDEV)
September 30, 2022 (Unaudited)
Each Trustee who is not an officer or employee of First Trust, any sub-advisor or any of their affiliates (“Independent Trustees”) is paid a fixed annual retainer that is allocated equally among each fund in the First Trust Fund Complex. Each Independent Trustee is also paid an annual per fund fee that varies based on whether the fund is a closed-end or other actively managed fund, a target outcome fund or an index fund.
Additionally, the Lead Independent Trustee and the Chairs of the Audit Committee, Nominating and Governance Committee and Valuation Committee are paid annual fees to serve in such capacities, with such compensation allocated pro rata among each fund in the First Trust Fund Complex based on net assets. Independent Trustees are reimbursed for travel and out-of-pocket expenses in connection with all meetings. The Lead Independent Trustee and Committee Chairs rotate every three years. The officers and “Interested” Trustee receive no compensation from the Trust for acting in such capacities.
4. Purchases and Sales of Securities
For the six months ended September 30, 2022, the cost of purchases and proceeds from sales of investments, excluding short term investments and in-kind transactions, were $249,115 and $248,068, respectively.
For the six months ended September 30, 2022, the Fund had no in-kind transactions.
5. Creations, Redemptions and Transaction Fees
The Fund generally issues and redeems its shares in primary market transactions through a creation and redemption mechanism and does not sell or redeem individual shares. Instead, financial entities known as “Authorized Participants” have contractual arrangements with the Fund or one of the Fund’s service providers to purchase and redeem Fund shares directly with the Fund in large blocks of shares known as “Creation Units.” Prior to the start of trading on every business day, the Fund publishes through the National Securities Clearing Corporation (“NSCC”) the “basket” of securities, cash or other assets that it will accept in exchange for a Creation Unit of the Fund’s shares. An Authorized Participant that wishes to effectuate a creation of the Fund’s shares deposits with the Fund the “basket” of securities, cash or other assets identified by the Fund that day, and then receives the Creation Unit of the Fund’s shares in return for those assets. After purchasing a Creation Unit, the Authorized Participant may continue to hold the Fund’s shares or sell them in the secondary market. The redemption process is the reverse of the purchase process: the Authorized Participant redeems a Creation Unit of the Fund’s shares for a basket of securities, cash or other assets. The combination of the creation and redemption process with secondary market trading in the Fund’s shares and underlying securities provides arbitrage opportunities that are designed to help keep the market price of the Fund’s shares at or close to the NAV per share of the Fund.
The Fund imposes fees in connection with the purchase of Creation Units. These fees may vary based upon various fact-based circumstances, including, but not limited to, the composition of the securities included in the Creation Unit or the countries in which the transactions are settled. The price for each Creation Unit will equal the daily NAV per share of the Fund times the number of shares in a Creation Unit, plus the fees described above and, if applicable, any operational processing and brokerage costs, transfer fees, stamp taxes and part or all of the spread between the expected bid and offer side of the market related to the securities comprising the creation basket.
The Fund also imposes fees in connection with the redemption of Creation Units. These fees may vary based upon various fact-based circumstances, including, but not limited to, the composition of the securities included in the Creation Unit or the countries in which the transactions are settled. The price received for each Creation Unit will equal the daily NAV per share of the Fund times the number of shares in a Creation Unit, minus the fees described above and, if applicable, any operational processing and brokerage costs, transfer fees, stamp taxes and part or all of the spread between the expected bid and offer side of the market related to the securities comprising the redemption basket. Investors who use the services of a broker or other such intermediary in addition to an Authorized Participant to effect a redemption of a Creation Unit may also be assessed an amount to cover the cost of such services. The redemption fee charged by the Fund will comply with Rule 22c-2 of the 1940 Act which limits redemption fees to no more than 2% of the value of the shares redeemed.
6. Distribution Plan
The Board of Trustees adopted a Distribution and Service Plan pursuant to Rule 12b-1 under the 1940 Act. In accordance with the Rule 12b-1 plan, the Fund is authorized to pay an amount up to 0.25% of its average daily net assets each year to reimburse First Trust Portfolios L.P. (“FTP”), the distributor of the Fund, for amounts expended to finance activities primarily intended to result in the sale of Creation Units or to provide investor services. FTP may also use this amount to compensate securities dealers or other persons that are Authorized Participants for providing distribution assistance, including broker-dealer and shareholder support and educational and promotional services.
Notes to Financial Statements (Continued)
First Trust Indxx Medical Devices ETF (MDEV)
September 30, 2022 (Unaudited)
No 12b-1 fees are currently paid by the Fund, and pursuant to a contractual arrangement, no 12b-1 fees will be paid any time before June 21, 2023.
7. Indemnification
The Trust, on behalf of the Fund, has a variety of indemnification obligations under contracts with its service providers. The Trust’s maximum exposure under these arrangements is unknown. However, the Trust has not had prior claims or losses pursuant to these contracts and expects the risk of loss to be remote.
8. Subsequent Events
Management has evaluated the impact of all subsequent events to the Fund through the date the financial statements were issued, and has determined that there was the following subsequent event:
At a meeting on October 24, 2022, the Board of Trustees approved a breakpoint pricing arrangement for each of the series of the Trust, including the Fund. Pursuant to this arrangement, which was effective as of November 1, 2022, the management fee the Fund pays to First Trust, as investment manager, will be discounted as the Fund’s net assets reach certain predefined levels.
Additional Information
First Trust Indxx Medical Devices ETF (MDEV)
September 30, 2022 (Unaudited)
Proxy Voting Policies and Procedures
A description of the policies and procedures that the Trust uses to determine how to vote proxies and information on how the Fund voted proxies relating to portfolio securities during the most recent 12-month period ended June 30 is available (1) without charge, upon request, by calling (800) 988-5891; (2) on the Fund’s website at www.ftportfolios.com; and (3) on the Securities and Exchange Commission’s (“SEC”) website at www.sec.gov.
Portfolio Holdings
The Fund files portfolio holdings information for each month in a fiscal quarter within 60 days after the end of the relevant fiscal quarter on Form N-PORT. Portfolio holdings information for the third month of each fiscal quarter will be publicly available on the SEC’s website at www.sec.gov. The Fund’s complete schedule of portfolio holdings for the second and fourth quarters of each fiscal year is included in the semi-annual and annual reports to shareholders, respectively, and is filed with the SEC on Form N-CSR. The semi-annual and annual report for the Fund is available to investors within 60 days after the period to which it relates. The Fund’s Forms N-PORT and Forms N-CSR are available on the SEC’s website listed above.
Risk Considerations
Risks are inherent in all investing. Certain general risks that may be applicable to a Fund are identified below, but not all of the material risks relevant to each Fund are included in this report and not all of the risks below apply to each Fund. The material risks of investing in each Fund are spelled out in its prospectus, statement of additional information and other regulatory filings. Before investing, you should consider each Fund’s investment objective, risks, charges and expenses, and read each Fund’s prospectus and statement of additional information carefully. You can download each Fund’s prospectus at www.ftportfolios.com or contact First Trust Portfolios L.P. at (800) 621-1675 to request a prospectus, which contains this and other information about each Fund.
Concentration Risk. To the extent that a fund is able to invest a significant percentage of its assets in a single asset class or the securities of issuers within the same country, state, region, industry or sector, an adverse economic, business or political development may affect the value of the fund’s investments more than if the fund were more broadly diversified. A fund that tracks an index will be concentrated to the extent the fund’s corresponding index is concentrated. A concentration makes a fund more susceptible to any single occurrence and may subject the fund to greater market risk than a fund that is more broadly diversified.
Credit Risk. Credit risk is the risk that an issuer of a security will be unable or unwilling to make dividend, interest and/or principal payments when due and the related risk that the value of a security may decline because of concerns about the issuer’s ability to make such payments.
Cyber Security Risk. The funds are susceptible to potential operational risks through breaches in cyber security. A breach in cyber security refers to both intentional and unintentional events that may cause a fund to lose proprietary information, suffer data corruption or lose operational capacity. Such events could cause a fund to incur regulatory penalties, reputational damage, additional compliance costs associated with corrective measures and/or financial loss. In addition, cyber security breaches of a fund’s third-party service providers, such as its administrator, transfer agent, custodian, or sub-advisor, as applicable, or issuers in which the fund invests, can also subject a fund to many of the same risks associated with direct cyber security breaches.
Defined Outcome Funds Risk. To the extent a fund’s investment strategy is designed to deliver returns tied to the price performance of an underlying ETF, an investor may not realize the returns the fund seeks to achieve if that investor does not hold shares for the entire target outcome period. In the event an investor purchases shares after the first day of the target outcome period or sells shares prior to the end of the target outcome period, the buffer that the fund seeks to provide against a decline in the value of the underlying ETF may not be available, the enhanced returns that the fund seeks to provide (if any) may not be available and the investor may not participate in a gain in the value of the underlying ETF up to the cap for the investor’s investment period. Additionally, the fund will not participate in gains of the underlying ETF above the cap and a shareholder may lose their entire investment. If the fund seeks enhanced returns, there are certain time periods when the value of the fund may fall faster than the value of the underlying ETF, and it is very unlikely that, on any given day during which the underlying ETF share price increases in value, the fund’s share price will increase at the same rate as the enhanced returns sought by the fund, which is designed for an entire target outcome period. Trading flexible exchange options involves risks different from, or possibly greater than, the risks associated with investing directly in securities, such as less liquidity and correlation and valuation risks. A fund may experience substantial downside from specific flexible exchange option positions and certain positions may expire worthless.
Derivatives Risk. To the extent a fund uses derivative instruments such as futures contracts, options contracts and swaps, the fund may experience losses because of adverse movements in the price or value of the underlying asset, index or rate, which may be magnified
Additional Information (Continued)
First Trust Indxx Medical Devices ETF (MDEV)
September 30, 2022 (Unaudited)
by certain features of the derivative. These risks are heightened when a fund’s portfolio managers use derivatives to enhance the fund’s return or as a substitute for a position or security, rather than solely to hedge (or offset) the risk of a position or security held by the fund.
Equity Securities Risk. To the extent a fund invests in equity securities, the value of the fund’s shares will fluctuate with changes in the value of the equity securities. Equity securities prices fluctuate for several reasons, including changes in investors’ perceptions of the financial condition of an issuer or the general condition of the relevant stock market, such as market volatility, or when political or economic events affecting the issuers occur. In addition, common stock prices may be particularly sensitive to rising interest rates, as the cost of capital rises and borrowing costs increase. Equity securities may decline significantly in price over short or extended periods of time, and such declines may occur in the equity market as a whole, or they may occur in only a particular country, company, industry or sector of the market.
ETF Risk. The shares of an ETF trade like common stock and represent an interest in a portfolio of securities. The risks of owning an ETF generally reflect the risks of owning the underlying securities, although lack of liquidity in an ETF could result in it being more volatile and ETFs have management fees that increase their costs. Shares of an ETF trade on an exchange at market prices rather than net asset value, which may cause the shares to trade at a price greater than net asset value (premium) or less than net asset value (discount). In times of market stress, decisions by market makers to reduce or step away from their role of providing a market for an ETF’s shares, or decisions by an ETF’s authorized participants that they are unable or unwilling to proceed with creation and/or redemption orders of an ETF’s shares, could result in shares of the ETF trading at a discount to net asset value and in greater than normal intraday bid-ask spreads.
Fixed Income Securities Risk. To the extent a fund invests in fixed income securities, the fund will be subject to credit risk, income risk, interest rate risk, liquidity risk and prepayment risk. Income risk is the risk that income from a fund’s fixed income investments could decline during periods of falling interest rates. Interest rate risk is the risk that the value of a fund’s fixed income securities will decline because of rising interest rates. Liquidity risk is the risk that a security cannot be purchased or sold at the time desired, or cannot be purchased or sold without adversely affecting the price. Prepayment risk is the risk that the securities will be redeemed or prepaid by the issuer, resulting in lower interest payments received by the fund. In addition to these risks, high yield securities, or “junk” bonds, are subject to greater market fluctuations and risk of loss than securities with higher ratings, and the market for high yield securities is generally smaller and less liquid than that for investment grade securities.
Index or Model Constituent Risk. Certain funds may be a constituent of one or more indices or ETF models. As a result, such a fund may be included in one or more index-tracking exchange-traded funds or mutual funds. Being a component security of such a vehicle could greatly affect the trading activity involving a fund, the size of the fund and the market volatility of the fund. Inclusion in an index could increase demand for the fund and removal from an index could result in outsized selling activity in a relatively short period of time. As a result, a fund’s net asset value could be negatively impacted and the fund’s market price may be significantly below its net asset value during certain periods. In addition, index rebalances may potentially result in increased trading activity in a fund’s shares.
Index Provider Risk. To the extent a fund seeks to track an index, it is subject to Index Provider Risk. There is no assurance that the Index Provider will compile the Index accurately, or that the Index will be determined, maintained, constructed, reconstituted, rebalanced, composed, calculated or disseminated accurately. To correct any such error, the Index Provider may carry out an unscheduled rebalance or other modification of the Index constituents or weightings, which may increase the fund’s costs. The Index Provider does not provide any representation or warranty in relation to the quality, accuracy or completeness of data in the Index, and it does not guarantee that the Index will be calculated in accordance with its stated methodology. Losses or costs associated with any Index Provider errors generally will be borne by the fund and its shareholders.
Investment Companies Risk. To the extent a fund invests in the securities of other investment vehicles, the fund will incur additional fees and expenses that would not be present in a direct investment in those investment vehicles. Furthermore, the fund’s investment performance and risks are directly related to the investment performance and risks of the investment vehicles in which the fund invests.
LIBOR Risk. To the extent a fund invests in floating or variable rate obligations that use the London Interbank Offered Rate (“LIBOR”) as a reference interest rate, it is subject to LIBOR Risk. The United Kingdom’s Financial Conduct Authority, which regulates LIBOR has ceased making LIBOR available as a reference rate over a phase-out period that began December 31, 2021. There is no assurance that any alternative reference rate, including the Secured Overnight Financing Rate (“SOFR”) will be similar to or produce the same value or economic equivalence as LIBOR or that instruments using an alternative rate will have the same volume or liquidity. The unavailability or replacement of LIBOR may affect the value, liquidity or return on certain fund investments and may result in costs incurred in connection with closing out positions and entering into new trades. Any potential effects of the transition away from LIBOR on the fund or on certain instruments in which the fund invests can be difficult to ascertain, and they may vary depending on a variety of factors, and they could result in losses to the fund.
Additional Information (Continued)
First Trust Indxx Medical Devices ETF (MDEV)
September 30, 2022 (Unaudited)
Management Risk. To the extent that a fund is actively managed, it is subject to management risk. In managing an actively-managed fund’s investment portfolio, the fund’s portfolio managers will apply investment techniques and risk analyses that may not have the desired result. There can be no guarantee that a fund will meet its investment objective.
Market Risk. Market risk is the risk that a particular security, or shares of a fund in general, may fall in value. Securities held by a fund, as well as shares of a fund itself, are subject to market fluctuations caused by factors such as general economic conditions, political events, regulatory or market developments, changes in interest rates and perceived trends in securities prices. Shares of a fund could decline in value or underperform other investments as a result of the risk of loss associated with these market fluctuations. In addition, local, regional or global events such as war, acts of terrorism, spread of infectious diseases or other public health issues, recessions, or other events could have a significant negative impact on a fund and its investments. Such events may affect certain geographic regions, countries, sectors and industries more significantly than others. In February 2022, Russia invaded Ukraine which has caused and could continue to cause significant market disruptions and volatility within the markets in Russia, Europe, and the United States. The hostilities and sanctions resulting from those hostilities could have a significant impact on certain fund investments as well as fund performance. The COVID-19 global pandemic and the ensuing policies enacted by governments and central banks have caused and may continue to cause significant volatility and uncertainty in global financial markets. While the U.S. has resumed “reasonably” normal business activity, many countries continue to impose lockdown measures. Additionally, there is no guarantee that vaccines will be effective against emerging variants of the disease. These events also adversely affect the prices and liquidity of a fund’s portfolio securities or other instruments and could result in disruptions in the trading markets. Any of such circumstances could have a materially negative impact on the value of a fund’s shares and result in increased market volatility. During any such events, a fund’s shares may trade at increased premiums or discounts to their net asset value and the bid/ask spread on a fund’s shares may widen.
Non-U.S. Securities Risk. To the extent a fund invests in non-U.S. securities, it is subject to additional risks not associated with securities of domestic issuers. Non-U.S. securities are subject to higher volatility than securities of domestic issuers due to: possible adverse political, social or economic developments; restrictions on foreign investment or exchange of securities; capital controls; lack of liquidity; currency exchange rates; excessive taxation; government seizure of assets; the imposition of sanctions by foreign governments; different legal or accounting standards; and less government supervision and regulation of exchanges in foreign countries. Investments in non-U.S. securities may involve higher costs than investments in U.S. securities, including higher transaction and custody costs, as well as additional taxes imposed by non-U.S. governments. These risks may be heightened for securities of companies located, or with significant operations, in emerging market countries.
Operational Risk. Each fund is subject to risks arising from various operational factors, including, but not limited to, human error, processing and communication errors, errors of a fund’s service providers, counterparties or other third-parties, failed or inadequate processes and technology or systems failures. Each fund relies on third-parties for a range of services, including custody. Any delay or failure relating to engaging or maintaining such service providers may affect a fund’s ability to meet its investment objective. Although the funds and the funds’ investment advisor seek to reduce these operational risks through controls and procedures, there is no way to completely protect against such risks.
Passive Investment Risk. To the extent a fund seeks to track an index, the fund will invest in the securities included in, or representative of, the index regardless of their investment merit. A fund generally will not attempt to take defensive positions in declining markets.
Valuation Risk. The valuation of certain securities may carry more risk than that of common stock. Uncertainties in the conditions of the financial markets, unreliable reference data, lack of transparency and inconsistency of valuation models and processes may lead to inaccurate asset pricing. A fund may hold investments in sizes smaller than institutionally sized round lot positions (sometimes referred to as odd lots). However, third-party pricing services generally provide evaluations on the basis of institutionally-sized round lots. If a fund sells certain of its investments in an odd lot transaction, the sale price may be less than the value at which such securities have been held by the fund. Odd lots often trade at lower prices than institutional round lots. There is no assurance that the fund will be able to sell a portfolio security at the price established by the pricing service, which could result in a loss to the fund.
| NOT FDIC INSURED | NOT BANK GUARANTEED | MAY LOSE VALUE |
Advisory Agreement
Board Considerations Regarding Approval of Continuation of Investment Management Agreement
The Board of Trustees of First Trust Exchange-Traded Fund VI (the “Trust”), including the Independent Trustees, unanimously approved the continuation of the Investment Management Agreement (the “Agreement”) with First Trust Advisors L.P. (the “Advisor”) on behalf of the First Trust Indxx Medical Devices ETF (the “Fund”). The Board approved the continuation of the Agreement for a
Additional Information (Continued)
First Trust Indxx Medical Devices ETF (MDEV)
September 30, 2022 (Unaudited)
one-year period ending June 30, 2023 at a meeting held on June 12–13, 2022. The Board determined that the continuation of the Agreement is in the best interests of the Fund in light of the nature, extent and quality of the services provided and such other matters as the Board considered to be relevant in the exercise of its business judgment.
To reach this determination, the Board considered its duties under the Investment Company Act of 1940, as amended (the “1940 Act”), as well as under the general principles of state law, in reviewing and approving advisory contracts; the requirements of the 1940 Act in such matters; the fiduciary duty of investment advisors with respect to advisory agreements and compensation; the standards used by courts in determining whether investment company boards have fulfilled their duties; and the factors to be considered by the Board in voting on such agreements. At meetings held on April 18, 2022 and June 12–13, 2022, the Board, including the Independent Trustees, reviewed materials provided by the Advisor responding to requests for information from counsel to the Independent Trustees, submitted on behalf of the Independent Trustees, that, among other things, outlined: the services provided by the Advisor to the Fund (including the relevant personnel responsible for these services and their experience); the unitary fee rate payable by the Fund as compared to fees charged to a peer group of funds (the “Expense Group”) and a broad peer universe of funds (the “Expense Universe”), each assembled by Broadridge Financial Solutions, Inc. (“Broadridge”), an independent source, and as compared to fees charged to other clients of the Advisor, including other exchange-traded funds (“ETFs”) managed by the Advisor; the expense ratio of the Fund as compared to expense ratios of the funds in the Fund’s Expense Group and Expense Universe; performance information for the Fund; the nature of expenses incurred in providing services to the Fund and the potential for the Advisor to realize economies of scale, if any; profitability and other financial data for the Advisor; any indirect benefits to the Advisor and its affiliate, First Trust Portfolios L.P. (“FTP”); and information on the Advisor’s compliance program. The Board reviewed initial materials with the Advisor at the meeting held on April 18, 2022, prior to which the Independent Trustees and their counsel met separately to discuss the information provided by the Advisor. Following the April meeting, counsel to the Independent Trustees, on behalf of the Independent Trustees, requested certain clarifications and supplements to the materials provided, and the information provided in response to those requests was considered at an executive session of the Independent Trustees and their counsel held prior to the June 12–13, 2022 meeting, as well as at the June meeting. The Board applied its business judgment to determine whether the arrangement between the Trust and the Advisor continues to be a reasonable business arrangement from the Fund’s perspective. The Board determined that, given the totality of the information provided with respect to the Agreement, the Board had received sufficient information to renew the Agreement. The Board considered that shareholders chose to invest or remain invested in the Fund knowing that the Advisor manages the Fund and knowing the Fund’s unitary fee.
In reviewing the Agreement, the Board considered the nature, extent and quality of the services provided by the Advisor under the Agreement. The Board considered that the Advisor is responsible for the overall management and administration of the Trust and the Fund and reviewed all of the services provided by the Advisor to the Fund, as well as the background and experience of the persons responsible for such services. In reviewing the services provided, the Board noted the compliance program that had been developed by the Advisor and considered that it includes a robust program for monitoring the Advisor’s and the Fund’s compliance with the 1940 Act, as well as the Fund’s compliance with its investment objective, policies and restrictions. The Board also considered a report from the Advisor with respect to its risk management functions related to the operation of the Fund. Finally, as part of the Board’s consideration of the Advisor’s services, the Advisor, in its written materials and at the April 18, 2022 meeting, described to the Board the scope of its ongoing investment in additional personnel and infrastructure to maintain and improve the quality of services provided to the Fund and the other funds in the First Trust Fund Complex. In light of the information presented and the considerations made, the Board concluded that the nature, extent and quality of the services provided to the Trust and the Fund by the Advisor under the Agreement have been and are expected to remain satisfactory and that the Advisor has managed the Fund consistent with its investment objective, policies and restrictions.
The Board considered the unitary fee rate payable by the Fund under the Agreement for the services provided. The Board considered that as part of the unitary fee the Advisor is responsible for the Fund’s expenses, including the cost of transfer agency, custody, fund administration, legal, audit and other services and license fees, if any, but excluding the fee payment under the Agreement and interest, taxes, brokerage commissions and other expenses connected with the execution of portfolio transactions, distribution and service fees pursuant to a Rule 12b-1 plan, if any, and extraordinary expenses, if any. The Board received and reviewed information showing the fee rates and expense ratios of the peer funds in the Expense Group, as well as advisory and unitary fee rates charged by the Advisor to other fund (including ETFs) and non-fund clients, as applicable. Because the Fund pays a unitary fee, the Board determined that expense ratios were the most relevant comparative data point. Based on the information provided, the Board noted that the unitary fee rate for the Fund was above the median total (net) expense ratio of the peer funds in the Expense Group. With respect to the Expense Group, the Board, at the April 18, 2022 meeting, discussed with Broadridge its methodology for assembling peer groups and discussed with the Advisor limitations in creating peer groups for index ETFs, including differences in underlying indexes and index-tracking methodologies that can result in greater management complexities across seemingly comparable ETFs and different business models that may affect the pricing of services among ETF sponsors. The Board took these limitations and differences into account in considering the peer data. With respect to fees charged to other non-ETF clients, the Board considered differences between the Fund and other non-ETF clients that limited their comparability. In considering the unitary fee rate overall, the Board also considered the
Additional Information (Continued)
First Trust Indxx Medical Devices ETF (MDEV)
September 30, 2022 (Unaudited)
Advisor’s statement that it seeks to meet investor needs through innovative and value-added investment solutions and the Advisor’s demonstrated long-term commitment to the Fund and the other funds in the First Trust Fund Complex.
The Board considered performance information for the Fund. The Board noted the process it has established for monitoring the Fund’s performance and portfolio risk on an ongoing basis, which includes quarterly performance reporting from the Advisor for the Fund. The Board determined that this process continues to be effective for reviewing the Fund’s performance. Because the Fund commenced operations on June 22, 2021 and therefore has a limited performance history, comparative performance information for the Fund was not considered.
On the basis of all the information provided on the unitary fee for the Fund and the ongoing oversight by the Board, the Board concluded that the unitary fee for the Fund continues to be reasonable and appropriate in light of the nature, extent and quality of the services provided by the Advisor to the Fund under the Agreement.
The Board considered information and discussed with the Advisor whether there were any economies of scale in connection with providing advisory services to the Fund and noted the Advisor’s statement that it believes that its expenses relating to providing advisory services to the Fund will likely increase during the next twelve months as the Advisor continues to build infrastructure and add new staff. The Board noted that any reduction in fixed costs associated with the management of the Fund would benefit the Advisor, but that the unitary fee structure provides a level of certainty in expenses for the Fund. The Board considered the revenues and allocated costs (including the allocation methodology) of the Advisor in serving as investment advisor to the Fund for the period from inception through December 31, 2021 and the estimated profitability level for the Fund calculated by the Advisor based on such data, as well as complex-wide and product-line profitability data, for the twelve months ended December 31, 2021. The Board noted the inherent limitations in the profitability analysis and concluded that, based on the information provided, the Advisor’s profitability level for the Fund was not unreasonable. In addition, the Board considered indirect benefits described by the Advisor that may be realized from its relationship with the Fund. The Board considered that the Advisor had identified as an indirect benefit to the Advisor and FTP their exposure to investors and brokers who, absent their exposure to the Fund, may have had no dealings with the Advisor or FTP, and noted that the Advisor does not utilize soft dollars in connection with the Fund. The Board also considered the Advisor’s compensation for fund reporting services provided to the Fund pursuant to a separate Fund Reporting Services Agreement, which is paid from the unitary fee. The Board concluded that the character and amount of potential indirect benefits to the Advisor were not unreasonable.
Based on all of the information considered and the conclusions reached, the Board, including the Independent Trustees, unanimously determined that the terms of the Agreement continue to be fair and reasonable and that the continuation of the Agreement is in the best interests of the Fund. No single factor was determinative in the Board’s analysis.
Liquidity Risk Management Program
In accordance with Rule 22e-4 under the Investment Company Act of 1940, as amended (the “1940 Act”), the Fund and each other fund in the First Trust Fund Complex, other than the closed-end funds, have adopted and implemented a liquidity risk management program (the “Program”) reasonably designed to assess and manage the funds’ liquidity risk, i.e., the risk that a fund could not meet requests to redeem shares issued by the fund without significant dilution of remaining investors’ interests in the fund. The Board of Trustees of the First Trust Funds has appointed First Trust Advisors L.P. (the “Advisor”) as the person designated to administer the Program, and in this capacity the Advisor performs its duties primarily through the activities and efforts of the First Trust Liquidity Committee (the “Liquidity Committee”).
Pursuant to the Program, the Liquidity Committee classifies the liquidity of each fund’s portfolio investments into one of the four liquidity categories specified by Rule 22e-4: highly liquid investments, moderately liquid investments, less liquid investments and illiquid investments. The Liquidity Committee determines certain of the inputs for this classification process, including reasonably anticipated trade sizes and significant investor dilution thresholds. The Liquidity Committee also determines and periodically reviews a highly liquid investment minimum for certain funds, monitors the funds’ holdings of assets classified as illiquid investments to seek to ensure they do not exceed 15% of a fund’s net assets and establishes policies and procedures regarding redemptions in kind.
At the April 18, 2022 meeting of the Board of Trustees, as required by Rule 22e-4 and the Program, the Advisor provided the Board with a written report prepared by the Advisor that addressed the operation of the Program during the period from March 16, 2021 through the Liquidity Committee’s annual meeting held on March 17, 2022 and assessed the Program’s adequacy and effectiveness of implementation during this period, including the operation of the highly liquid investment minimum for each fund that is required under the Program to have one, and any material changes to the Program. Note that because the Fund primarily holds assets that are highly liquid investments, the Fund has not adopted any highly liquid investment minimum.
Additional Information (Continued)
First Trust Indxx Medical Devices ETF (MDEV)
September 30, 2022 (Unaudited)
As stated in the written report, during the review period, no fund breached the 15% limitation on illiquid investments, no fund with a highly liquid investment minimum breached that minimum and no fund filed a Form N-LIQUID. The Advisor concluded that each fund’s investment strategy is appropriate for an open-end fund; that the Program operated effectively in all material respects during the review period; and that the Program is reasonably designed to assess and manage the liquidity risk of each fund and to maintain compliance with Rule 22e-4.
This page intentionally left blank
First Trust Exchange-Traded Fund VI
INVESTMENT ADVISOR
First Trust Advisors L.P.
120 East Liberty Drive, Suite 400
Wheaton, IL 60187
ADMINISTRATOR, CUSTODIAN,
FUND ACCOUNTANT &
TRANSFER AGENT
Brown Brothers Harriman & Co.
50 Post Office Square
Boston, MA 02110
INDEPENDENT REGISTERED
PUBLIC ACCOUNTING FIRM
Deloitte & Touche LLP
111 S. Wacker Drive
Chicago, IL 60606
LEGAL COUNSEL
Chapman and Cutler LLP
320 South Canal Street
Chicago, IL 60606
First Trust Exchange Traded Fund VI
S-Network Healthcare Technology ETF
Statement of Assets and Liabilities
September 30, 2022 (Unaudited)
| ASSETS: | | |
| Cash | $ | 50.00 |
| Total Assets | $ | 50.00 |
| | | |
| NET ASSETS consist of: | | |
| Paid in Capital | $ | 50.00 |
| NET ASSETS | $ | 50.00 |
| | | |
| Number of shares outstanding (unlimited number of shares authorized, par value $0.01 per share) | | 2 |
| | | |
| NET ASSET VALUE, per share | $ | 25.00 |
The accompanying notes are an integral part of the Statement of Assets and Liabilities.
Note 1: Organization
First Trust S-Network Healthcare Technology ETF (the “Fund”), which is registered under the Investment Company Act of 1940, as amended (the “1940 Act”), is a series of the First Trust Exchange-Traded Fund VI (the “Trust”), a registered open-end investment company that was organized as a Massachusetts business trust on June 4, 2012. The Fund has had no operations through September 30, 2022 other than matters relating to organization and registration and the sale of its shares to First Trust Portfolios L.P., the sole shareholder of the Fund.
The investment objective of the Fund is to seek investment results that correspond generally to the price and yield (before the Fund’s fees and expenses) of an index called the S-Network Healthcare Technology Index (the “Index”). Once the Fund commences investment operations, the Fund will normally invest at least 80% of its net assets (including investment borrowings) in the common stocks and depositary receipts that comprise the Index.
Note 2: Significant Accounting Policies
The Fund is considered an investment company and follows accounting and reporting guidance under Financial Accounting Standards Board Accounting Standards Codification Topic 946, “Financial Services – Investment Companies.” The following is a summary of significant accounting policies consistently followed by the Fund in the preparation of the financial statement. The preparation of the financial statement in accordance with accounting principles generally accepted in the United States of America (“U.S. GAAP”) requires management to make estimates and assumptions that affect the reported amounts and disclosures in the Statement of Assets and Liabilities. Actual results could differ from these estimates.
The Fund intends to qualify as a regulated investment company by complying with the requirements of Subchapter M of the Internal Revenue Code of 1986, as amended, which includes distributing substantially all of its net investment income and net realized gains to shareholders. Accordingly, no provision has been made for federal and state income taxes. However, due to the timing and amount of distributions, the Fund may be subject to an excise tax of 4% of the amount by which 98% of the Fund’s taxable income exceeds the distributions from such taxable income for the calendar year.
Note 3: Investment Advisory Fee, Affiliated Transactions and Other Fee Arrangements
First Trust Advisors L.P. (“First Trust”), the Fund’s Advisor, is a limited partnership with one limited partner, Grace Partners of DuPage L.P., and one general partner, The Charger Corporation. The Charger Corporation is an Illinois corporation controlled by James A. Bowen, Chief Executive Officer of First Trust. First Trust is responsible for the selection and ongoing monitoring of the securities in the Fund’s portfolio, managing the Fund’s business affairs and providing certain administrative services necessary for the management of the Fund.
Once the Fund commences investment operations, First Trust will be paid an annual unitary management fee of 0.65% of the Fund’s average daily net assets. First Trust is responsible for the expenses of the Fund including the cost of transfer agency, custody, fund administration, licensing fees, legal, audit, and other services, but excluding fee payments under the Investment Management Agreement, interest, taxes, brokerage commissions and other expenses associated with the execution of portfolio transactions, distribution and service fees pursuant to a Rule 12b-1 plan, if any, acquired fund fees and expenses, and extraordinary expenses, which are paid by the Fund. Once the Fund commences investment operations, First Trust will also provide fund reporting services to the Fund for a flat annual fee in the amount of $9,250, which is covered under the annual unitary management fee.
The Trust has multiple service agreements with Brown Brothers Harriman & Co. (“BBH”). Under the service agreements, BBH performs custodial, fund accounting, certain administrative services, and transfer agency services for the Fund. As custodian, BBH is responsible for custody of the Fund’s assets. As fund accountant and administrator, BBH is responsible for maintaining the books and records of the Fund’s securities and cash. As transfer agent, BBH is responsible for maintaining shareholder records for the Fund.
Each Trustee who is not an officer or employee of First Trust, any sub-advisor or any of their affiliates (“Independent Trustees”) is paid a fixed annual retainer that is allocated equally among each fund in the First Trust Fund Complex. Each Independent Trustee is also paid an annual per fund fee that varies based on whether the fund is a closed-end or other actively managed fund, a target outcome fund or an index fund.
Additionally, the Lead Independent Trustee and the Chairs of the Audit Committee, Nominating and Governance Committee and Valuation Committee are paid annual fees to serve in such capacities, with such compensation allocated pro rata among each fund in the First Trust Fund Complex based on net assets. Independent Trustees are reimbursed for travel and out-of-pocket expenses in connection with all meetings. The Lead Independent Trustee and Committee Chairs rotate every three years. The officers and “Interested” Trustee receive no compensation from the Trust for acting in such capacities.
Note 4: Capital
Subsequent to the Fund’s commencement of investment operations, the Fund will issue and redeem shares in primary market transactions through a creation and redemption mechanism. The Fund will not sell or redeem individual shares. Instead, financial entities known as “Authorized Participants” have contractual arrangements with the Fund or one of the Fund’s service providers to purchase and redeem Fund shares directly with the Fund in large blocks of shares known as “Creation Units.” Prior to the start of trading on every business day, the Fund publishes through the National Securities Clearing Corporation (“NSCC”) the “basket” of securities, cash or other assets that it will accept in exchange for a Creation Unit of the Fund’s shares. An Authorized Participant that wishes to effectuate a creation of the Fund’s shares deposits with the Fund the “basket” of securities, cash or other assets identified by the Fund that day, and then receives the Creation Unit of the Fund’s shares in return for those assets. After purchasing a Creation Unit, the Authorized Participant may continue to hold the Fund’s shares or sell them in the secondary market. The redemption process is the reverse of the purchase process: the Authorized Participant redeems a Creation Unit of the Fund’s shares for a basket of securities, cash or other assets. The combination of the creation and redemption process with secondary market trading in the Fund’s shares and underlying securities provides arbitrage opportunities that are designed to help keep the market price of the Fund’s shares at or close to the NAV per share of the Fund.
The Fund will impose fees in connection with the purchase of Creation Units. These fees may vary based upon various fact-based circumstances, including, but not limited to, the composition of the securities included in the Creation Unit or the countries in which the transactions are settled. The price for each Creation Unit will equal the daily NAV per share of the Fund times the number of shares in a Creation Unit, plus the fees described above and, if applicable, any operational processing and brokerage costs, transfer fees, stamp taxes and part or all of the spread between the expected bid and offer side of the market related to the securities comprising the creation basket.
The Fund also will impose fees in connection with the redemption of Creation Units. These fees may vary based upon various fact-based circumstances, including, but not limited to, the composition of the securities included in the Creation Unit or the countries in which the transactions are settled. The price received for each Creation Unit will equal the daily NAV per share of a Fund times the number of shares in a Creation Unit, minus the fees described above and, if applicable, any operational processing and brokerage costs, transfer fees, stamp taxes and part or all of the spread between the expected bid and offer side of the market related to the securities comprising the redemption basket. Investors who use the services of a broker or other such intermediary in addition to an Authorized Participant to effect a redemption of a Creation Unit may also be assessed an amount to cover the cost of such services. The redemption fee charged by the Fund will comply with Rule 22c-2 of the 1940 Act which limits redemption fees to no more than 2% of the value of the shares redeemed.
Note 5: Subsequent Events
Management has evaluated the impact of all subsequent events to the Fund through the date the financial statement was issued and has determined that there was the following subsequent event:
Effective October 24, 2022, the Board of Trustees of the Trust approved the liquidation and termination of the Fund as soon as practicable as determed by First Trust. The liquidation was completed on November 16, 2022 and the termination was completed on November 16, 2022.
(b) Not applicable.
Item 2. Code of Ethics.
Not applicable.
Item 3. Audit Committee Financial Expert.
Not applicable.
Item 4. Principal Accountant Fees and Services.
Not applicable.
Item 5. Audit Committee of Listed Registrants.
Not applicable.
Items 6. Schedule of Investments.
| a) | Schedules of Investments in securities of unaffiliated issuers as of the close of the reporting period are included as part of the report to shareholders filed under Item 1 of this form. |
Item 7. Disclosure of Proxy Voting Policies and Procedures for Closed-End Management Investment Companies.
Not applicable.
Item 8. Portfolio Managers of Closed-End Management Investment Companies.
Not applicable.
Item 9. Purchases of Equity Securities by Closed-End Management Investment Company and Affiliated Purchasers.
Not applicable.
Item 10. Submission of Matters to a Vote of Security Holders.
There have been no material changes to the procedures by which the shareholders may recommend nominees to the registrant’s board of directors, where those changes were implemented after the registrant last provided disclosure in response to the requirements of Item 407(c)(2)(iv) of Regulation S-K (17 CFR 229.407) (as required by Item 22(b)(15) of Schedule 14A (17 CFR 240.14a-101)), or this Item.
Item 11. Controls and Procedures.
| a) | The registrant’s principal executive and principal financial officers, or persons performing similar functions, have concluded that the registrant’s disclosure controls and procedures (as defined in Rule 30a-3(c) under the Investment Company Act of 1940, as amended (the “1940 Act”) (17 CFR 270.30a-3 (c))) are effective, as of a date within 90 days of the filing date of the report that includes the disclosure required by this paragraph, based on their evaluation of these controls and procedures required by Rule 30a-3(b) under the 1940 Act (17 CFR 270.30a-3(b)) and Rules 13a-15(b) or 15d-15(b) under the Securities Exchange Act of 1934, as amended (17 CFR 240.13a-15(b) or 240.15d-15 (b)). |
| b) | There were no changes in the registrant’s internal control over financial reporting (as defined in Rule 30a-3(d) under the 1940 Act (17 CFR 270.30a-3(d)) that occurred during the period covered by this report that has materially affected, or are reasonably likely to materially affect, the registrant’s internal control over financial reporting. |
Item 12. Disclosure of Securities Lending Activities for Closed-End Management Investment Companies.
(a) Not applicable.
(b) Not applicable.
Item 13. Exhibits.
SIGNATURES
Pursuant to the requirements of the Securities Exchange Act of 1934 and the Investment Company Act of 1940, the registrant has duly caused this report to be signed on its behalf by the undersigned, thereunto duly authorized.
| (registrant) | | First Trust Exchange-Traded Fund VI |
| By (Signature and Title)* | | /s/ James M. Dykas |
| | | James M. Dykas, President and Chief Executive Officer
(principal executive officer) |
Pursuant to the requirements of the Securities Exchange Act of 1934 and the Investment Company Act of 1940, this report has been signed below by the following persons on behalf of the registrant and in the capacities and on the dates indicated.
| By (Signature and Title)* | | /s/ James M. Dykas |
| | | James M. Dykas, President and Chief Executive Officer
(principal executive officer) |
| By (Signature and Title)* | | /s/ Donald P. Swade |
| | | Donald P. Swade, Treasurer, Chief Financial Officer
and Chief Accounting Officer
(principal financial officer) |
* Print the name and title of each signing officer under his or her signature.