UNITED STATES
SECURITIES AND EXCHANGE COMMISSION
Washington, D.C. 20549
FORM N-CSR
CERTIFIED SHAREHOLDER REPORT OF REGISTERED MANAGEMENT INVESTMENT COMPANIES
Investment Company Act file number 811-22717
First Trust Exchange-Traded Fund VI
(Exact name of registrant as specified in charter)
120 East Liberty Drive, Suite 400
Wheaton, IL 60187
(Address of principal executive offices) (Zip code)
W. Scott Jardine, Esq.
First Trust Portfolios L.P.
120 East Liberty Drive, Suite 400
Wheaton, IL 60187
(Name and address of agent for service)
Registrant’s telephone number, including area code: (630) 765-8000
Date of fiscal year end: September 30
Date of reporting period: March 31, 2023
Form N-CSR is to be used by management investment companies to file reports with the Commission not later than 10 days after the transmission to stockholders of any report that is required to be transmitted to stockholders under Rule 30e-1 under the Investment Company Act of 1940 (17 CFR 270.30e-1). The Commission may use the information provided on Form N-CSR in its regulatory, disclosure review, inspection, and policymaking roles.
A registrant is required to disclose the information specified by Form N-CSR, and the Commission will make this information public. A registrant is not required to respond to the collection of information contained in Form N-CSR unless the Form displays a currently valid Office of Management and Budget (“OMB”) control number. Please direct comments concerning the accuracy of the information collection burden estimate and any suggestions for reducing the burden to Secretary, Securities and Exchange Commission, 100 F Street, NE, Washington, DC 20549p. The OMB has reviewed this collection of information under the clearance requirements of 44 U.S.C. § 3507.
Item 1. Report to Stockholders.
| (a) | The registrant’s semi-annual report transmitted to shareholders pursuant to Rule 30e-1 under the Investment Company Act of 1940 is as follows: |

Book 1
First Trust NASDAQ Technology Dividend Index Fund (TDIV)
Multi-Asset Diversified Income Index Fund (MDIV)
First Trust S&P International Dividend Aristocrats ETF (FID)
First Trust BuyWrite Income ETF (FTHI)
First Trust Nasdaq BuyWrite Income ETF (FTQI)
First Trust Rising Dividend Achievers ETF (RDVY)
First Trust Dorsey Wright Focus 5 ETF (FV)
First Trust RBA American Industrial Renaissance® ETF (AIRR)
First Trust Dorsey Wright Momentum & Dividend ETF (DDIV)
First Trust Dorsey Wright International Focus 5 ETF (IFV)
First Trust Dorsey Wright Dynamic Focus 5 ETF (FVC)
First Trust Indxx Innovative Transaction & Process ETF (LEGR)
First Trust Nasdaq Artificial Intelligence and Robotics ETF (ROBT)
First Trust International Developed Capital Strength ETF (FICS)
For the Six Months Ended
March 31, 2023
| 2 | |
| 3 | |
| Fund Performance Overview | |
| 4 | |
| 6 | |
| 8 | |
| 11 | |
| 13 | |
| 15 | |
| 17 | |
| 19 | |
| 21 | |
| 23 | |
| 25 | |
| 27 | |
| 29 | |
| 31 | |
| 33 | |
| 34 | |
| Portfolio of Investments | |
| 36 | |
| 38 | |
| 43 | |
| 46 | |
| 54 | |
| 60 | |
| 62 | |
| 63 | |
| 65 | |
| 67 | |
| 68 | |
| 69 | |
| 74 | |
| 78 | |
| 80 | |
| 84 | |
| 88 | |
| 94 | |
| 108 | |
| 124 |


| Performance | |||||||||
| Average Annual Total Returns | Cumulative Total Returns | ||||||||
| 6 Months Ended 3/31/23 | 1 Year Ended 3/31/23 | 5 Years Ended 3/31/23 | 10 Years Ended 3/31/23 | Inception (8/13/12) to 3/31/23 | 5 Years Ended 3/31/23 | 10 Years Ended 3/31/23 | Inception (8/13/12) to 3/31/23 | ||
| Fund Performance | |||||||||
| NAV | 25.53% | -5.86% | 11.20% | 12.45% | 12.60% | 70.02% | 223.38% | 252.97% | |
| Market Price | 25.48% | -5.97% | 11.16% | 12.44% | 12.59% | 69.75% | 223.13% | 252.87% | |
| Index Performance | |||||||||
| Nasdaq Technology DividendTM Index | 25.99% | -5.33% | 11.91% | 13.17% | 13.32% | 75.52% | 244.71% | 277.81% | |
| S&P 500® Index | 15.62% | -7.73% | 11.19% | 12.24% | 12.80% | 69.94% | 217.36% | 259.84% | |
| S&P 500® Information Technology Index | 27.59% | -4.55% | 19.64% | 20.14% | 18.96% | 145.10% | 526.59% | 533.14% | |
| Sector Allocation | % of Total Investments |
| Information Technology | 87.1% |
| Communication Services | 11.9 |
| Industrials | 1.0 |
| Health Care | 0.0* |
| Total | 100.0% |
| * | Amount is less than 0.1%. |
| Top Ten Holdings | % of Total Investments |
| Intel Corp. | 9.7% |
| Microsoft Corp. | 8.6 |
| Apple, Inc. | 8.3 |
| Broadcom, Inc. | 8.0 |
| International Business Machines Corp. | 7.5 |
| Texas Instruments, Inc. | 4.0 |
| Oracle Corp. | 4.0 |
| QUALCOMM, Inc. | 3.8 |
| Analog Devices, Inc. | 2.5 |
| Motorola Solutions, Inc. | 2.0 |
| Total | 58.4% |

Performance figures assume reinvestment of all distributions and do not reflect the deduction of taxes that a shareholder would pay on Fund distributions or the redemption or sale of Fund shares. An index is a statistical composite that tracks a specified financial market or sector. Unlike the Fund, the indices do not actually hold a portfolio of securities and therefore do not incur the expenses incurred by the Fund. These expenses negatively impact the performance of the Fund. The Fund’s past performance does not predict future performance.
| Performance | |||||||||
| Average Annual Total Returns | Cumulative Total Returns | ||||||||
| 6 Months Ended 3/31/23 | 1 Year Ended 3/31/23 | 5 Years Ended 3/31/23 | 10 Years Ended 3/31/23 | Inception (8/13/12) to 3/31/23 | 5 Years Ended 3/31/23 | 10 Years Ended 3/31/23 | Inception (8/13/12) to 3/31/23 | ||
| Fund Performance | |||||||||
| NAV | 5.13% | -6.93% | 2.05% | 2.14% | 3.14% | 10.70% | 23.63% | 38.92% | |
| Market Price | 5.41% | -6.62% | 2.11% | 2.17% | 3.17% | 11.02% | 23.94% | 39.39% | |
| Index Performance | |||||||||
| Nasdaq US Multi-Asset Diversified IncomeTM Index | 5.47% | -6.41% | 2.61% | 2.76% | 3.78% | 13.77% | 31.34% | 48.40% | |
| S&P 500® Index | 15.62% | -7.73% | 11.19% | 12.24% | 12.80% | 69.94% | 217.36% | 259.84% | |
| Dow Jones U.S. Select DividendTM Index* | 11.69% | -4.58% | 8.54% | 10.48% | 11.16% | 50.62% | 170.80% | 207.92% | |
| * | The Dow Jones U.S. Select DividendTM Index represents 100 of the United States’ leading stocks by dividend yield. |
| Sector Allocation | % of Total Investments |
| Financials | 23.0% |
| Energy | 21.9 |
| Other* | 21.1 |
| Real Estate | 17.0 |
| Utilities | 3.9 |
| Consumer Staples | 3.3 |
| Industrials | 3.0 |
| Communication Services | 2.4 |
| Consumer Discretionary | 2.1 |
| Materials | 1.6 |
| Information Technology | 0.4 |
| Health Care | 0.3 |
| Total | 100.0% |
| * | Exchange-traded fund with holdings representing multiple sectors. |
| Top Ten Holdings | % of Total Investments |
| First Trust Tactical High Yield ETF | 21.1% |
| Ready Capital Corp. | 1.5 |
| Icahn Enterprises, L.P. | 1.5 |
| Dorchester Minerals, L.P. | 1.3 |
| Starwood Property Trust, Inc. | 1.2 |
| Kimbell Royalty Partners, L.P. | 1.2 |
| Arbor Realty Trust, Inc. | 1.1 |
| Black Stone Minerals, L.P. | 1.1 |
| Sturm Ruger & Co., Inc. | 1.1 |
| WESCO International, Inc., Series A | 1.1 |
| Total | 32.2% |

Performance figures assume reinvestment of all distributions and do not reflect the deduction of taxes that a shareholder would pay on Fund distributions or the redemption or sale of Fund shares. An index is a statistical composite that tracks a specified financial market or sector. Unlike the Fund, the indices do not actually hold a portfolio of securities and therefore do not incur the expenses incurred by the Fund. These expenses negatively impact the performance of the Fund. The Fund’s past performance does not predict future performance.
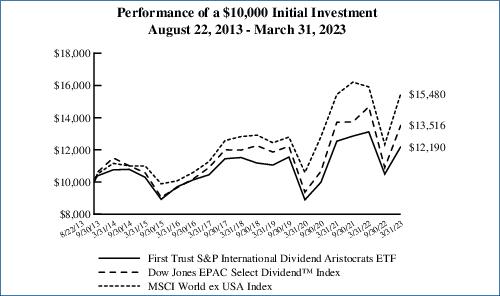
| Performance | |||||||
| Average Annual Total Returns | Cumulative Total Returns | ||||||
| 6 Months Ended 3/31/23 | 1 Year Ended 3/31/23 | 5 Years Ended 3/31/23 | Inception (8/22/13) to 3/31/23 | 5 Years Ended 3/31/23 | Inception (8/22/13) to 3/31/23 | ||
| Fund Performance | |||||||
| NAV | 16.18% | -7.08% | 1.13% | 2.08% | 5.79% | 21.90% | |
| Market Price | 16.25% | -7.17% | 1.07% | 2.10% | 5.45% | 22.05% | |
| Index Performance | |||||||
| S&P International Dividend Aristocrats Index(1) | 16.56% | -6.46% | N/A | N/A | N/A | N/A | |
| Dow Jones EPAC Select DividendTM Index(2) | 24.05% | -7.90% | 2.44% | 3.19% | 12.79% | 35.16% | |
| MSCI World ex USA Index | 25.50% | -2.74% | 3.83% | 4.65% | 20.70% | 54.80% | |
| (1) | On August 30, 2018, the Fund’s underlying index changed from the Nasdaq International Multi-Asset Diversified IncomeTM Index to the S&P International Dividend Aristocrats Index (the “Index”). Therefore, the Fund’s performance and historical returns shown for the periods prior to August 30, 2018, are not necessarily indicative of the performance that the Fund, based on its current index, would have generated. Since the Index had an inception date of April 30, 2018, it was not in existence for all of the periods disclosed. The old index was terminated on November 23, 2018, so performance data does not exist for these time periods. |
| (2) | The Dow Jones EPAC Select DividendTM Index measures the performance of a selected group of companies, from non-U.S. developed markets (Europe, Pacific Asia, and Canada), that have provided relatively high dividend yields on a consistent basis over time. |
| Sector Allocation | % of Total Investments |
| Financials | 25.3% |
| Real Estate | 16.1 |
| Utilities | 15.5 |
| Industrials | 12.4 |
| Consumer Discretionary | 6.9 |
| Materials | 6.7 |
| Energy | 5.2 |
| Communication Services | 3.7 |
| Consumer Staples | 3.6 |
| Information Technology | 3.5 |
| Health Care | 1.1 |
| Total | 100.0% |
| Country Allocation | % of Total Investments |
| Canada | 25.5% |
| Japan | 19.0 |
| Hong Kong | 13.5 |
| Switzerland | 9.2 |
| United Kingdom | 7.7 |
| Bermuda | 4.6 |
| Germany | 4.2 |
| Italy | 3.1 |
| Australia | 2.7 |
| France | 1.7 |
| Cayman Islands | 1.6 |
| Taiwan | 1.5 |
| Singapore | 1.4 |
| Ireland | 1.1 |
| South Korea | 1.1 |
| China | 1.1 |
| Norway | 1.0 |
| Total | 100.0% |
| Top Ten Holdings | % of Total Investments |
| New World Development Co., Ltd. | 2.0% |
| Adecco Group AG | 2.0 |
| Lenovo Group Ltd. | 2.0 |
| A2A S.p.A. | 2.0 |
| Guangdong Investment Ltd. | 1.7 |
| BASF SE | 1.7 |
| Bouygues S.A. | 1.7 |
| Legal & General Group PLC | 1.6 |
| Longfor Group Holdings Ltd. | 1.6 |
| JB Hi-Fi Ltd. | 1.6 |
| Total | 17.9% |
Performance figures assume reinvestment of all distributions and do not reflect the deduction of taxes that a shareholder would pay on Fund distributions or the redemption or sale of Fund shares. An index is a statistical composite that tracks a specified financial market or sector. Unlike the Fund, the indices do not actually hold a portfolio of securities and therefore do not incur the expenses incurred by the Fund. These expenses negatively impact the performance of the Fund. The Fund’s past performance does not predict future performance.
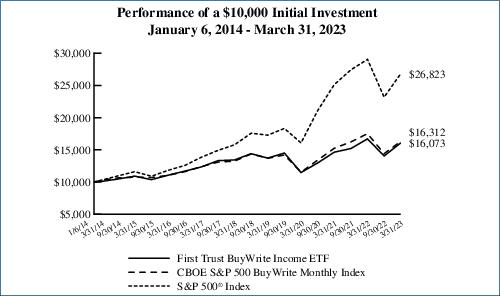
| Performance | |||||||
| Average Annual Total Returns | Cumulative Total Returns | ||||||
| 6 Months Ended 3/31/23 | 1 Year Ended 3/31/23 | 5 Years Ended 3/31/23 | Inception (1/6/14) to 3/31/23 | 5 Years Ended 3/31/23 | Inception (1/6/14) to 3/31/23 | ||
| Fund Performance | |||||||
| NAV | 14.38% | -3.77% | 3.66% | 5.28% | 19.68% | 60.73% | |
| Market Price | 14.12% | -3.82% | 3.56% | 5.28% | 19.13% | 60.80% | |
| Index Performance | |||||||
| CBOE S&P 500 BuyWrite Monthly Index(1) | 13.15% | -6.86% | 4.25% | 5.44% | 23.13% | 63.12% | |
| S&P 500® Index | 15.62% | -7.73% | 11.19% | 11.28% | 69.94% | 168.23% | |
| (1) | The CBOE S&P 500 BuyWrite Monthly Index is a benchmark index designed to track the performance of a hypothetical buy-write strategy on the S&P 500® Index. |
| Sector Allocation | % of Total Investments |
| Information Technology | 25.0% |
| Financials | 16.7 |
| Health Care | 13.7 |
| Consumer Discretionary | 9.5 |
| Consumer Staples | 9.0 |
| Communication Services | 7.6 |
| Industrials | 6.2 |
| Energy | 4.9 |
| Materials | 3.9 |
| Utilities | 1.9 |
| Real Estate | 1.6 |
| Total | 100.0% |
| Fund Allocation | % of Net Assets |
| Common Stocks | 96.4% |
| Real Estate Investment Trusts | 3.8 |
| Master Limited Partnerships | 0.8 |
| Call Options Written | (2.8) |
| Net Other Assets and Liabilities | 1.8 |
| Total | 100.0% |
| Top Ten Holdings | % of Total Investments |
| Apple, Inc. | 7.1% |
| Microsoft Corp. | 6.3 |
| Amazon.com, Inc. | 2.7 |
| NVIDIA Corp. | 2.0 |
| Alphabet, Inc., Class A | 1.8 |
| Tesla, Inc. | 1.7 |
| Berkshire Hathaway, Inc., Class B | 1.6 |
| Alphabet, Inc., Class C | 1.6 |
| AGNC Investment Corp. | 1.4 |
| UnitedHealth Group, Inc. | 1.4 |
| Total | 27.6% |
Performance figures assume reinvestment of all distributions and do not reflect the deduction of taxes that a shareholder would pay on Fund distributions or the redemption or sale of Fund shares. An index is a statistical composite that tracks a specified financial market or sector. Unlike the Fund, the indices do not actually hold a portfolio of securities and therefore do not incur the expenses incurred by the Fund. These expenses negatively impact the performance of the Fund. The Fund’s past performance does not predict future performance.
| Performance | |||||||
| Average Annual Total Returns | Cumulative Total Returns | ||||||
| 6 Months Ended 3/31/23 | 1 Year Ended 3/31/23 | 5 Years Ended 3/31/23 | Inception (1/6/14) to 3/31/23 | 5 Years Ended 3/31/23 | Inception (1/6/14) to 3/31/23 | ||
| Fund Performance | |||||||
| NAV | 14.14% | -4.42% | 2.27% | 3.79% | 11.89% | 41.00% | |
| Market Price | 13.60% | -4.79% | 2.18% | 3.76% | 11.39% | 40.60% | |
| Index Performance | |||||||
| CBOE Nasdaq-100 BuyWriteTM Index(1) | 17.19% | -6.12% | 4.92% | 6.46% | 27.12% | 78.16% | |
| S&P 500® Index | 15.62% | -7.73% | 11.19% | 11.28% | 69.94% | 168.23% | |
| Nasdaq-100 Index®(2) | 20.72% | -10.35% | 15.96% | 16.57% | 109.65% | 311.68% | |
| (1) | The Cboe Nasdaq-100 BuyWriteTM Index is a benchmark index designed to track the performance of a hypothetical buy-write strategy on the Nasdaq-100 Index®. The index is a passive total return index based on (1) buying the Nasdaq-100 Index® stock index portfolio, and (2) “writing” (or selling) the near-term Nasdaq-100 Index® “covered” call option. |
| (2) | On May 11, 2022, the Fund’s primary benchmark changed from the S&P 500® Index to the Nasdaq-100 Index® because the Advisor believes that the Nasdaq-100 Index® better reflects the investment strategies of the Fund. |
| Sector Allocation | % of Total Investments |
| Information Technology | 51.4% |
| Communication Services | 11.7 |
| Consumer Discretionary | 10.6 |
| Health Care | 8.1 |
| Consumer Staples | 7.1 |
| Financials | 4.2 |
| Real Estate | 2.3 |
| Industrials | 2.1 |
| Utilities | 2.0 |
| Materials | 0.5 |
| Total | 100.0% |
| Fund Allocation | % of Net Assets |
| Common Stocks | 101.9% |
| Real Estate Investment Trusts | 2.1 |
| Call Options Written | (5.3) |
| Net Other Assets and Liabilities | 1.3 |
| Total | 100.0% |
| Top Ten Holdings | % of Total Investments |
| Apple, Inc. | 12.9% |
| Microsoft Corp. | 10.6 |
| NVIDIA Corp. | 4.2 |
| PepsiCo, Inc. | 3.1 |
| Amazon.com, Inc. | 3.1 |
| Tesla, Inc. | 2.6 |
| Meta Platforms, Inc., Class A | 2.4 |
| Broadcom, Inc. | 2.2 |
| Alphabet, Inc., Class A | 2.0 |
| Alphabet, Inc., Class C | 2.0 |
| Total | 45.1% |

Performance figures assume reinvestment of all distributions and do not reflect the deduction of taxes that a shareholder would pay on Fund distributions or the redemption or sale of Fund shares. An index is a statistical composite that tracks a specified financial market or sector. Unlike the Fund, the indices do not actually hold a portfolio of securities and therefore do not incur the expenses incurred by the Fund. These expenses negatively impact the performance of the Fund. The Fund’s past performance does not predict future performance.
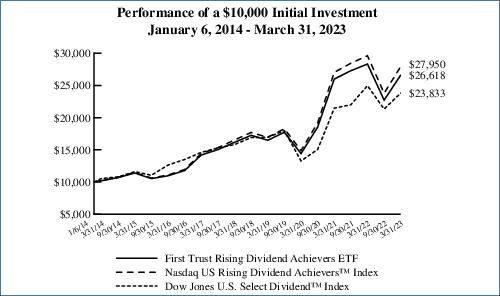
| Performance | |||||||
| Average Annual Total Returns | Cumulative Total Returns | ||||||
| 6 Months Ended 3/31/23 | 1 Year Ended 3/31/23 | 5 Years Ended 3/31/23 | Inception (1/6/14) to 3/31/23 | 5 Years Ended 3/31/23 | Inception (1/6/14) to 3/31/23 | ||
| Fund Performance | |||||||
| NAV | 17.12% | -6.07% | 10.49% | 11.19% | 64.68% | 166.18% | |
| Market Price | 17.04% | -6.15% | 10.48% | 11.18% | 64.60% | 166.05% | |
| Index Performance | |||||||
| Nasdaq US Rising Dividend AchieversTM Index | 17.44% | -5.66% | 11.07% | 11.78% | 69.07% | 179.50% | |
| Dow Jones U.S. Select DividendTM Index* | 11.69% | -4.58% | 8.54% | 9.87% | 50.62% | 138.33% | |
| * | The Dow Jones U.S. Select DividendTM Index represents 100 of the United States’ leading stocks by dividend yield. |
| Sector Allocation | % of Total Investments |
| Financials | 39.8% |
| Information Technology | 16.0 |
| Energy | 12.4 |
| Materials | 12.1 |
| Health Care | 7.6 |
| Communication Services | 4.2 |
| Industrials | 4.0 |
| Consumer Staples | 2.0 |
| Consumer Discretionary | 1.9 |
| Total | 100.0% |
| Top Ten Holdings | % of Total Investments |
| Accenture PLC, Class A | 2.2% |
| Freeport-McMoRan, Inc. | 2.1 |
| Popular, Inc. | 2.1 |
| Magnolia Oil & Gas Corp., Class A | 2.1 |
| Civitas Resources, Inc. | 2.1 |
| Chord Energy Corp. | 2.1 |
| Interpublic Group of (The) Cos., Inc. | 2.1 |
| Exxon Mobil Corp. | 2.1 |
| Omnicom Group, Inc. | 2.1 |
| Steel Dynamics, Inc. | 2.1 |
| Total | 21.1% |
Performance figures assume reinvestment of all distributions and do not reflect the deduction of taxes that a shareholder would pay on Fund distributions or the redemption or sale of Fund shares. An index is a statistical composite that tracks a specified financial market or sector. Unlike the Fund, the indices do not actually hold a portfolio of securities and therefore do not incur the expenses incurred by the Fund. These expenses negatively impact the performance of the Fund. The Fund’s past performance does not predict future performance.
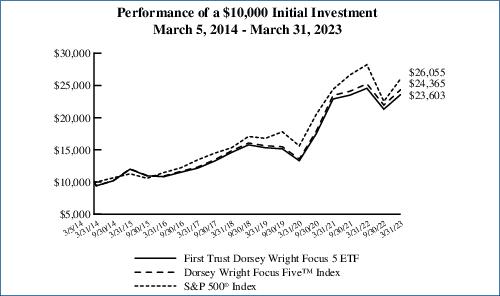
| Performance | |||||||
| Average Annual Total Returns | Cumulative Total Returns | ||||||
| 6 Months Ended 3/31/23 | 1 Year Ended 3/31/23 | 5 Years Ended 3/31/23 | Inception (3/5/14) to 3/31/23 | 5 Years Ended 3/31/23 | Inception (3/5/14) to 3/31/23 | ||
| Fund Performance | |||||||
| NAV | 10.71% | -3.94% | 10.08% | 9.93% | 61.67% | 136.03% | |
| Market Price | 10.84% | -3.84% | 10.09% | 9.94% | 61.68% | 136.14% | |
| Index Performance | |||||||
| Dorsey Wright Focus FiveTM Index | 10.97% | -3.57% | 10.42% | 10.32% | 64.13% | 143.65% | |
| S&P 500® Index | 15.62% | -7.73% | 11.19% | 11.13% | 69.94% | 160.55% | |
Performance figures assume reinvestment of all distributions and do not reflect the deduction of taxes that a shareholder would pay on Fund distributions or the redemption or sale of Fund shares. An index is a statistical composite that tracks a specified financial market or sector. Unlike the Fund, the indices do not actually hold a portfolio of securities and therefore do not incur the expenses incurred by the Fund. These expenses negatively impact the performance of the Fund. The Fund’s past performance does not predict future performance.
| Performance | |||||||
| Average Annual Total Returns | Cumulative Total Returns | ||||||
| 6 Months Ended 3/31/23 | 1 Year Ended 3/31/23 | 5 Years Ended 3/31/23 | Inception (3/10/14) to 3/31/23 | 5 Years Ended 3/31/23 | Inception (3/10/14) to 3/31/23 | ||
| Fund Performance | |||||||
| NAV | 25.90% | 13.79% | 13.27% | 10.43% | 86.44% | 145.62% | |
| Market Price | 25.71% | 13.80% | 13.30% | 10.43% | 86.69% | 145.58% | |
| Index Performance | |||||||
| Richard Bernstein Advisors American Industrial Renaissance® Index | 26.38% | 14.63% | 14.08% | 11.27% | 93.25% | 163.02% | |
| S&P 500® Index | 15.62% | -7.73% | 11.19% | 11.13% | 69.94% | 160.00% | |
| S&P 500® Industrials Index | 23.36% | 0.17% | 8.43% | 9.41% | 49.91% | 125.91% | |
| Russell 2500® Index | 11.07% | -10.39% | 6.65% | 7.33% | 37.95% | 89.85% | |
| Sector Allocation | % of Total Investments |
| Industrials | 91.8% |
| Financials | 8.2 |
| Total | 100.0% |
| Top Ten Holdings | % of Total Investments |
| Encore Wire Corp. | 4.0% |
| Comfort Systems USA, Inc. | 3.9 |
| Proto Labs, Inc. | 3.8 |
| Mueller Water Products, Inc., Class A | 3.6 |
| Clean Harbors, Inc. | 3.6 |
| Atkore, Inc. | 3.6 |
| Greenbrier (The) Cos., Inc. | 3.6 |
| Quanta Services, Inc. | 3.5 |
| APi Group Corp. | 3.5 |
| Arcosa, Inc. | 3.5 |
| Total | 36.6% |

Performance figures assume reinvestment of all distributions and do not reflect the deduction of taxes that a shareholder would pay on Fund distributions or the redemption or sale of Fund shares. An index is a statistical composite that tracks a specified financial market or sector. Unlike the Fund, the indices do not actually hold a portfolio of securities and therefore do not incur the expenses incurred by the Fund. These expenses negatively impact the performance of the Fund. The Fund’s past performance does not predict future performance.
| Performance | |||||||
| Average Annual Total Returns | Cumulative Total Returns | ||||||
| 6 Months Ended 3/31/23 | 1 Year Ended 3/31/23 | 5 Years Ended 3/31/23 | Inception (3/10/14) to 3/31/23 | 5 Years Ended 3/31/23 | Inception (3/10/14) to 3/31/23 | ||
| Fund Performance | |||||||
| NAV | 5.92% | -13.80% | 5.78% | 6.66% | 32.44% | 79.33% | |
| Market Price | 5.85% | -13.85% | 5.75% | 6.66% | 32.23% | 79.29% | |
| Index Performance | |||||||
| Dorsey Wright Momentum Plus Dividend YieldTM Index(1) | 6.36% | -13.29% | N/A | N/A | N/A | N/A | |
| Dow Jones U.S. Select DividendTM Index(2) | 11.69% | -4.58% | 8.54% | 9.74% | 50.62% | 131.98% | |
| S&P 500® Index | 15.62% | -7.73% | 11.19% | 11.13% | 69.94% | 160.00% | |
| (1) | On September 6, 2018, the Fund’s underlying index changed from the Richard Bernstein Advisors Quality Income Index to the Dorsey Wright Momentum Plus Dividend YieldTM Index (the “Index”). Therefore, the Fund’s performance and historical returns shown for the periods prior to September 6, 2018, are not necessarily indicative of the performance that the Fund, based on its current index, would have generated. Since the Index had an inception date of July 2, 2018, it was not in existence for all of the periods disclosed. |
| (2) | The Dow Jones U.S. Select DividendTM Index represents 100 of the United States’ leading stocks by dividend yield. |
| Sector Allocation | % of Total Investments |
| Financials | 30.8% |
| Real Estate | 26.5 |
| Energy | 17.5 |
| Health Care | 6.4 |
| Consumer Staples | 5.7 |
| Information Technology | 3.4 |
| Utilities | 2.8 |
| Industrials | 2.2 |
| Consumer Discretionary | 2.1 |
| Communication Services | 1.5 |
| Materials | 1.1 |
| Total | 100.0% |
| Top Ten Holdings | % of Total Investments |
| OneMain Holdings, Inc. | 5.3% |
| Starwood Property Trust, Inc. | 4.9 |
| Antero Midstream Corp. | 4.2 |
| Spirit Realty Capital, Inc. | 3.6 |
| Simon Property Group, Inc. | 3.3 |
| Gaming and Leisure Properties, Inc. | 3.2 |
| Kinder Morgan, Inc. | 3.1 |
| Iron Mountain, Inc. | 3.0 |
| Lamar Advertising Co., Class A | 2.9 |
| ONEOK, Inc. | 2.8 |
| Total | 36.3% |

Performance figures assume reinvestment of all distributions and do not reflect the deduction of taxes that a shareholder would pay on Fund distributions or the redemption or sale of Fund shares. An index is a statistical composite that tracks a specified financial market or sector. Unlike the Fund, the indices do not actually hold a portfolio of securities and therefore do not incur the expenses incurred by the Fund. These expenses negatively impact the performance of the Fund. The Fund’s past performance does not predict future performance.
| Performance | |||||||
| Average Annual Total Returns | Cumulative Total Returns | ||||||
| 6 Months Ended 3/31/23 | 1 Year Ended 3/31/23 | 5 Years Ended 3/31/23 | Inception (7/22/14) to 3/31/23 | 5 Years Ended 3/31/23 | Inception (7/22/14) to 3/31/23 | ||
| Fund Performance | |||||||
| NAV | 7.85% | -15.44% | -2.85% | -0.01% | -13.48% | -0.11% | |
| Market Price | 7.97% | -15.49% | -2.78% | 0.01% | -13.17% | 0.08% | |
| Index Performance | |||||||
| Dorsey Wright International Focus FiveTM Index | 8.15% | -15.09% | -2.35% | 0.41% | -11.20% | 3.65% | |
| MSCI ACWI ex USA Index | 22.13% | -5.07% | 2.51% | 2.80% | 13.17% | 27.14% | |
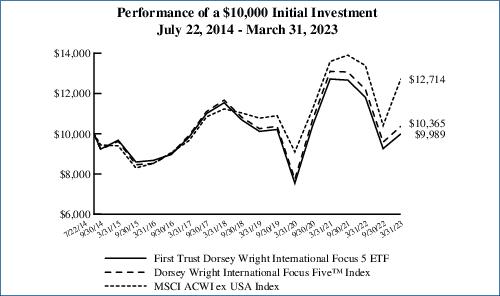
Performance figures assume reinvestment of all distributions and do not reflect the deduction of taxes that a shareholder would pay on Fund distributions or the redemption or sale of Fund shares. An index is a statistical composite that tracks a specified financial market or sector. Unlike the Fund, the indices do not actually hold a portfolio of securities and therefore do not incur the expenses incurred by the Fund. These expenses negatively impact the performance of the Fund. The Fund’s past performance does not predict future performance.
| Performance | |||||||
| Average Annual Total Returns | Cumulative Total Returns | ||||||
| 6 Months Ended 3/31/23 | 1 Year Ended 3/31/23 | 5 Years Ended 3/31/23 | Inception (3/17/16) to 3/31/23 | 5 Years Ended 3/31/23 | Inception (3/17/16) to 3/31/23 | ||
| Fund Performance | |||||||
| NAV | -0.18% | -8.49% | 5.04% | 8.08% | 27.86% | 72.84% | |
| Market Price | -0.33% | -8.47% | 5.04% | 8.08% | 27.86% | 72.83% | |
| Index Performance | |||||||
| Dorsey Wright Dynamic Focus FiveTM Index | 0.17% | -7.97% | 5.40% | 8.46% | 30.10% | 77.13% | |
| S&P 500® Index | 15.62% | -7.73% | 11.19% | 12.51% | 69.94% | 129.22% | |

Performance figures assume reinvestment of all distributions and do not reflect the deduction of taxes that a shareholder would pay on Fund distributions or the redemption or sale of Fund shares. An index is a statistical composite that tracks a specified financial market or sector. Unlike the Fund, the indices do not actually hold a portfolio of securities and therefore do not incur the expenses incurred by the Fund. These expenses negatively impact the performance of the Fund. The Fund’s past performance does not predict future performance.
| Performance | |||||||
| Average Annual Total Returns | Cumulative Total Returns | ||||||
| 6 Months Ended 3/31/23 | 1 Year Ended 3/31/23 | 5 Years Ended 3/31/23 | Inception (1/24/18) to 3/31/23 | 5 Years Ended 3/31/23 | Inception (1/24/18) to 3/31/23 | ||
| Fund Performance | |||||||
| NAV | 23.94% | -4.31% | 7.23% | 6.24% | 41.79% | 36.85% | |
| Market Price | 24.31% | -4.38% | 7.19% | 6.24% | 41.51% | 36.86% | |
| Index Performance | |||||||
| Indxx Blockchain Index | 24.16% | -3.95% | 8.22% | 7.19% | 48.40% | 43.27% | |
| S&P 500® Index | 15.62% | -7.73% | 11.19% | 9.33% | 69.94% | 58.77% | |
| Sector Allocation | % of Total Long-Term Investments |
| Financials | 37.1% |
| Information Technology | 30.2 |
| Communication Services | 9.5 |
| Consumer Discretionary | 9.3 |
| Industrials | 5.5 |
| Utilities | 3.0 |
| Consumer Staples | 1.7 |
| Materials | 1.6 |
| Health Care | 1.3 |
| Energy | 0.8 |
| Total | 100.0% |
| Top Ten Holdings | % of Total Long-Term Investments |
| Intel Corp. | 1.5% |
| Alibaba Group Holding Ltd., ADR | 1.5 |
| NVIDIA Corp. | 1.5 |
| Advanced Micro Devices, Inc. | 1.5 |
| Baidu, Inc., ADR | 1.4 |
| Microsoft Corp. | 1.4 |
| Amazon.com, Inc. | 1.4 |
| Salesforce, Inc. | 1.4 |
| Accenture PLC, Class A | 1.4 |
| Samsung Electronics Co., Ltd. | 1.4 |
| Total | 14.4% |

Performance figures assume reinvestment of all distributions and do not reflect the deduction of taxes that a shareholder would pay on Fund distributions or the redemption or sale of Fund shares. An index is a statistical composite that tracks a specified financial market or sector. Unlike the Fund, the indices do not actually hold a portfolio of securities and therefore do not incur the expenses incurred by the Fund. These expenses negatively impact the performance of the Fund. The Fund’s past performance does not predict future performance.
| Performance | |||||||
| Average Annual Total Returns | Cumulative Total Returns | ||||||
| 6 Months Ended 3/31/23 | 1 Year Ended 3/31/23 | 5 Years Ended 3/31/23 | Inception (2/21/18) to 3/31/23 | 5 Years Ended 3/31/23 | Inception (2/21/18) to 3/31/23 | ||
| Fund Performance | |||||||
| NAV | 26.86% | -9.42% | 8.00% | 7.48% | 46.91% | 44.53% | |
| Market Price | 27.08% | -9.36% | 8.00% | 7.51% | 46.93% | 44.70% | |
| Index Performance | |||||||
| Nasdaq CTA Artificial Intelligence and RoboticsTM Index | 26.73% | -9.68% | 8.75% | 8.12% | 52.12% | 48.99% | |
| S&P 500® Index | 15.62% | -7.73% | 11.19% | 10.50% | 69.64% | 66.47% | |
| Sector Allocation | % of Total Long-Term Investments |
| Information Technology | 59.7% |
| Industrials | 21.1 |
| Consumer Discretionary | 10.8 |
| Health Care | 5.4 |
| Communication Services | 2.3 |
| Real Estate | 0.4 |
| Consumer Staples | 0.3 |
| Total | 100.0% |
| Top Ten Holdings | % of Total Long-Term Investments |
| C3.ai, Inc., Class A | 2.8% |
| UiPath, Inc., Class A | 2.2 |
| BlackBerry Ltd. | 2.2 |
| Illumina, Inc. | 2.2 |
| Nice Ltd., ADR | 2.0 |
| ANSYS, Inc. | 2.0 |
| Mobileye Global, Inc., Class A | 2.0 |
| Ciena Corp. | 2.0 |
| Cadence Design Systems, Inc. | 2.0 |
| ServiceNow, Inc. | 2.0 |
| Total | 21.4% |

Performance figures assume reinvestment of all distributions and do not reflect the deduction of taxes that a shareholder would pay on Fund distributions or the redemption or sale of Fund shares. An index is a statistical composite that tracks a specified financial market or sector. Unlike the Fund, the indices do not actually hold a portfolio of securities and therefore do not incur the expenses incurred by the Fund. These expenses negatively impact the performance of the Fund. The Fund’s past performance does not predict future performance.
| Performance | ||||
| Average Annual Total Returns | Cumulative Total Returns | |||
| 6 Months Ended 3/31/23 | 1 Year Ended 3/31/23 | Inception (12/15/20) to 3/31/23 | Inception (12/15/20) to 3/31/23 | |
| Fund Performance | ||||
| NAV | 22.00% | -2.58% | 3.43% | 8.03% |
| Market Price | 21.63% | -2.78% | 3.48% | 8.16% |
| Index Performance | ||||
| The International Developed Capital StrengthTM Index | 21.26% | -3.11% | 4.18% | 9.82% |
| MSCI World ex USA Index | 25.50% | -2.74% | 2.69% | 6.27% |
| Sector Allocation | % of Total Investments |
| Industrials | 22.0% |
| Consumer Staples | 16.6 |
| Financials | 15.3 |
| Information Technology | 14.2 |
| Consumer Discretionary | 12.8 |
| Health Care | 11.1 |
| Materials | 4.6 |
| Real Estate | 1.8 |
| Communication Services | 1.6 |
| Total | 100.0% |
| Top Ten Holdings | % of Total Investments |
| Shin-Etsu Chemical Co., Ltd. | 2.8% |
| LVMH Moet Hennessy Louis Vuitton SE | 2.5 |
| L’Oreal S.A. | 2.5 |
| Kering S.A. | 2.5 |
| Schindler Holding AG | 2.3 |
| Constellation Software, Inc. | 2.3 |
| Hong Kong Exchanges & Clearing Ltd. | 2.3 |
| Carlsberg A.S., Class B | 2.2 |
| Kia Corp. | 2.2 |
| Brenntag SE | 2.2 |
| Total | 23.8% |

Performance figures assume reinvestment of all distributions and do not reflect the deduction of taxes that a shareholder would pay on Fund distributions or the redemption or sale of Fund shares. An index is a statistical composite that tracks a specified financial market or sector. Unlike the Fund, the indices do not actually hold a portfolio of securities and therefore do not incur the expenses incurred by the Fund. These expenses negatively impact the performance of the Fund. The Fund’s past performance does not predict future performance.
| Beginning Account Value October 1, 2022 | Ending Account Value March 31, 2023 | Annualized Expense Ratio Based on the Six-Month Period | Expenses Paid During the Six-Month Period (a) | |
| First Trust NASDAQ Technology Dividend Index Fund (TDIV) | ||||
| Actual | $1,000.00 | $1,255.30 | 0.50% | $2.81 |
| Hypothetical (5% return before expenses) | $1,000.00 | $1,022.44 | 0.50% | $2.52 |
| Multi-Asset Diversified Income Index Fund (MDIV) (b) (c) | ||||
| Actual | $1,000.00 | $1,051.30 | 0.48% | $2.45 |
| Hypothetical (5% return before expenses) | $1,000.00 | $1,022.54 | 0.48% | $2.42 |
| First Trust S&P International Dividend Aristocrats ETF (FID) | ||||
| Actual | $1,000.00 | $1,161.80 | 0.60% | $3.23 |
| Hypothetical (5% return before expenses) | $1,000.00 | $1,021.94 | 0.60% | $3.02 |
| First Trust BuyWrite Income ETF (FTHI) | ||||
| Actual | $1,000.00 | $1,143.80 | 0.85% | $4.54 |
| Hypothetical (5% return before expenses) | $1,000.00 | $1,020.69 | 0.85% | $4.28 |
| First Trust Nasdaq BuyWrite Income ETF (FTQI) | ||||
| Actual | $1,000.00 | $1,141.40 | 0.85% | $4.54 |
| Hypothetical (5% return before expenses) | $1,000.00 | $1,020.69 | 0.85% | $4.28 |
| Beginning Account Value October 1, 2022 | Ending Account Value March 31, 2023 | Annualized Expense Ratio Based on the Six-Month Period | Expenses Paid During the Six-Month Period (a) | |
| First Trust Rising Dividend Achievers ETF (RDVY) | ||||
| Actual | $1,000.00 | $1,171.20 | 0.49% | $2.65 |
| Hypothetical (5% return before expenses) | $1,000.00 | $1,022.49 | 0.49% | $2.47 |
| First Trust Dorsey Wright Focus 5 ETF (FV) (b) | ||||
| Actual | $1,000.00 | $1,107.10 | 0.30% | $1.58 |
| Hypothetical (5% return before expenses) | $1,000.00 | $1,023.44 | 0.30% | $1.51 |
| First Trust RBA American Industrial Renaissance® ETF (AIRR) | ||||
| Actual | $1,000.00 | $1,259.00 | 0.70% | $3.94 |
| Hypothetical (5% return before expenses) | $1,000.00 | $1,021.44 | 0.70% | $3.53 |
| First Trust Dorsey Wright Momentum & Dividend ETF (DDIV) | ||||
| Actual | $1,000.00 | $1,059.20 | 0.60% | $3.08 |
| Hypothetical (5% return before expenses) | $1,000.00 | $1,021.94 | 0.60% | $3.02 |
| First Trust Dorsey Wright International Focus 5 ETF (IFV) (b) | ||||
| Actual | $1,000.00 | $1,078.50 | 0.30% | $1.55 |
| Hypothetical (5% return before expenses) | $1,000.00 | $1,023.44 | 0.30% | $1.51 |
| First Trust Dorsey Wright Dynamic Focus 5 ETF (FVC) (b) | ||||
| Actual | $1,000.00 | $998.20 | 0.30% | $1.49 |
| Hypothetical (5% return before expenses) | $1,000.00 | $1,023.44 | 0.30% | $1.51 |
| First Trust Indxx Innovative Transaction & Process ETF (LEGR) | ||||
| Actual | $1,000.00 | $1,239.40 | 0.65% | $3.63 |
| Hypothetical (5% return before expenses) | $1,000.00 | $1,021.69 | 0.65% | $3.28 |
| First Trust Nasdaq Artificial Intelligence and Robotics ETF (ROBT) | ||||
| Actual | $1,000.00 | $1,268.60 | 0.65% | $3.68 |
| Hypothetical (5% return before expenses) | $1,000.00 | $1,021.69 | 0.65% | $3.28 |
| First Trust International Developed Capital Strength ETF (FICS) | ||||
| Actual | $1,000.00 | $1,220.00 | 0.70% | $3.87 |
| Hypothetical (5% return before expenses) | $1,000.00 | $1,021.44 | 0.70% | $3.53 |
| (a) | Expenses are equal to the annualized expense ratios as indicated in the table multiplied by the average account value over the period (October 1, 2022 through March 31, 2023), multiplied by 182/365 (to reflect the six-month period). |
| (b) | Annualized expense ratio and expenses paid during the six-month period do not include fees and expenses of the underlying funds in which the Fund invests. |
| (c) | MDIV expense ratios reflect an expense waiver. See Note 3 in the Notes to Financial Statements. |
| Shares | Description | Value | ||
| COMMON STOCKS – 99.8% | ||||
| Communications Equipment – 7.2% | ||||
| 137,073 | ADTRAN Holdings, Inc. | $2,173,978 | ||
| 60,268 | AudioCodes Ltd. | 908,841 | ||
| 664,197 | Cisco Systems, Inc. | 34,720,898 | ||
| 752,263 | Juniper Networks, Inc. | 25,892,893 | ||
| 122,373 | Motorola Solutions, Inc. | 35,014,587 | ||
| 1,318,875 | Nokia Oyj, ADR | 6,475,676 | ||
| 1,202,539 | Telefonaktiebolaget LM Ericsson, ADR | 7,034,853 | ||
| 46,006 | Ubiquiti, Inc. | 12,499,370 | ||
| 124,721,096 | ||||
| Diversified Telecommunication Services – 6.8% | ||||
| 22,968 | ATN International, Inc. | 939,851 | ||
| 726,793 | BCE, Inc. | 32,553,058 | ||
| 225,671 | Cogent Communications Holdings, Inc. | 14,379,756 | ||
| 471,215 | Telefonica S.A., ADR | 2,016,800 | ||
| 128,647 | Telkom Indonesia Persero Tbk PT, ADR | 3,508,204 | ||
| 1,617,726 | TELUS Corp. | 32,128,038 | ||
| 828,668 | Verizon Communications, Inc. | 32,226,899 | ||
| 117,752,606 | ||||
| Electronic Equipment, Instruments & Components – 4.3% | ||||
| 159,540 | Amphenol Corp., Class A | 13,037,609 | ||
| 57,730 | Avnet, Inc. | 2,609,396 | ||
| 25,069 | Benchmark Electronics, Inc. | 593,885 | ||
| 35,949 | CDW Corp. | 7,006,101 | ||
| 691,533 | Corning, Inc. | 24,397,284 | ||
| 10,654 | Methode Electronics, Inc. | 467,497 | ||
| 74,868 | National Instruments Corp. | 3,923,832 | ||
| 31,710 | TD SYNNEX Corp. | 3,069,211 | ||
| 139,136 | TE Connectivity Ltd. | 18,247,686 | ||
| 62,105 | Vishay Intertechnology, Inc. | 1,404,815 | ||
| 74,757,316 | ||||
| Health Care Technology – 0.0% | ||||
| 3,292 | Simulations Plus, Inc. | 144,650 | ||
| Interactive Media & Services – 0.2% | ||||
| 96,746 | JOYY, Inc., ADR | 3,016,540 | ||
| 11,743 | Shutterstock, Inc. | 852,542 | ||
| 3,869,082 | ||||
| IT Services – 9.0% | ||||
| 53,514 | Amdocs Ltd. | 5,138,949 | ||
| 225,519 | Cognizant Technology Solutions Corp., Class A | 13,740,873 | ||
| 16,272 | Hackett Group (The), Inc. | 300,707 | ||
| Shares | Description | Value | ||
| IT Services (Continued) | ||||
| 309,986 | Infosys Ltd., ADR | $5,406,156 | ||
| 994,912 | International Business Machines Corp. | 130,423,014 | ||
| 55,353 | Wipro Ltd., ADR | 248,535 | ||
| 155,258,234 | ||||
| Media – 2.2% | ||||
| 7,902 | Cable One, Inc. | 5,547,204 | ||
| 865,230 | Comcast Corp., Class A | 32,800,869 | ||
| 38,348,073 | ||||
| Professional Services – 1.0% | ||||
| 10,259 | Concentrix Corp. | 1,246,981 | ||
| 15,146 | CSG Systems International, Inc. | 813,340 | ||
| 93,160 | Dun & Bradstreet Holdings, Inc. | 1,093,698 | ||
| 30,549 | KBR, Inc. | 1,681,723 | ||
| 52,160 | Leidos Holdings, Inc. | 4,801,850 | ||
| 19,465 | Science Applications International Corp. | 2,091,709 | ||
| 87,744 | SS&C Technologies Holdings, Inc. | 4,954,904 | ||
| 16,684,205 | ||||
| Semiconductors & Semiconductor Equipment – 37.8% | ||||
| 55,016 | Amkor Technology, Inc. | 1,431,516 | ||
| 215,231 | Analog Devices, Inc. | 42,447,858 | ||
| 190,572 | Applied Materials, Inc. | 23,407,959 | ||
| 262,972 | ASE Technology Holding Co., Ltd., ADR | 2,095,887 | ||
| 24,231 | ASML Holding N.V. | 16,494,284 | ||
| 216,467 | Broadcom, Inc. | 138,872,239 | ||
| 22,502 | Entegris, Inc. | 1,845,389 | ||
| 458,501 | Himax Technologies, Inc., ADR | 3,727,613 | ||
| 5,160,124 | Intel Corp. | 168,581,251 | ||
| 44,056 | KLA Corp. | 17,585,834 | ||
| 19,119 | Kulicke & Soffa Industries, Inc. | 1,007,380 | ||
| 45,987 | Lam Research Corp. | 24,378,628 | ||
| 116,462 | Marvell Technology, Inc. | 5,042,805 | ||
| 201,029 | Microchip Technology, Inc. | 16,842,210 | ||
| 215,645 | Micron Technology, Inc. | 13,012,019 | ||
| 7,527 | Monolithic Power Systems, Inc. | 3,767,565 | ||
| 126,019 | NXP Semiconductors N.V. | 23,499,393 | ||
| 12,810 | Power Integrations, Inc. | 1,084,238 | ||
| 520,690 | QUALCOMM, Inc. | 66,429,630 | ||
| 86,352 | Skyworks Solutions, Inc. | 10,187,809 | ||
| 8,892 | STMicroelectronics N.V. | 475,633 | ||
| 375,157 | Texas Instruments, Inc. | 69,782,954 | ||
| 212,932 | United Microelectronics Corp., ADR | 1,865,284 | ||
| 10,721 | Universal Display Corp. | 1,663,149 | ||
| 655,528,527 | ||||
| Software – 15.6% | ||||
| 26,250 | A10 Networks, Inc. | 406,613 | ||
| Shares | Description | Value | ||
| COMMON STOCKS (Continued) | ||||
| Software (Continued) | ||||
| 39,025 | Absolute Software Corp. | $305,566 | ||
| 54,717 | Adeia, Inc. | 484,793 | ||
| 19,019 | Dolby Laboratories, Inc., Class A | 1,624,603 | ||
| 13,694 | Ebix, Inc. | 180,624 | ||
| 420,599 | Gen Digital, Inc. | 7,217,479 | ||
| 48,425 | InterDigital, Inc. | 3,530,182 | ||
| 51,666 | Intuit, Inc. | 23,034,253 | ||
| 515,760 | Microsoft Corp. | 148,693,608 | ||
| 187,416 | Open Text Corp. | 7,224,887 | ||
| 735,938 | Oracle Corp. | 68,383,359 | ||
| 13,563 | Progress Software Corp. | 779,194 | ||
| 16,122 | Roper Technologies, Inc. | 7,104,804 | ||
| 50,095 | Sapiens International Corp., N.V. | 1,088,063 | ||
| 270,058,028 | ||||
| Technology Hardware, Storage & Peripherals – 13.1% | ||||
| 872,679 | Apple, Inc. | 143,904,767 | ||
| 202,084 | Dell Technologies, Inc., Class C | 8,125,798 | ||
| 1,023,959 | Hewlett Packard Enterprise Co. | 16,311,667 | ||
| 867,818 | HP, Inc. | 25,470,458 | ||
| 73,257 | Logitech International S.A. | 4,253,301 | ||
| 171,517 | NetApp, Inc. | 10,951,361 | ||
| 229,961 | Seagate Technology Holdings PLC | 15,205,021 | ||
| 243,601 | Xerox Holdings Corp. | 3,751,455 | ||
| 227,973,828 | ||||
| Wireless Telecommunication Services – 2.6% | ||||
| 422,505 | America Movil S.A.B. de C.V., ADR (a) | 8,893,730 | ||
| 1,324,111 | Mobile TeleSystems PJSC, ADR (b) (c) (d) | 0 | ||
| 673,095 | Rogers Communications, Inc., Class B | 31,204,684 | ||
| 507,151 | Telephone and Data Systems, Inc. | 5,330,157 | ||
| 45,428,571 | ||||
| Total Investments – 99.8% | 1,730,524,216 | |||
| (Cost $1,551,683,672) | ||||
| Net Other Assets and Liabilities – 0.2% | 3,264,281 | |||
| Net Assets – 100.0% | $1,733,788,497 | |||
| (a) | Non-income producing security. |
| (b) | This security is fair valued by the Advisor’s Pricing Committee in accordance with procedures approved by the Trust’s Board of Trustees, and in accordance with the provisions of the Investment Company Act of 1940 and rules thereunder, as amended. At March 31, 2023, securities noted as such are valued at $0 or 0.0% of net assets. |
| (c) | Pursuant to procedures adopted by the Trust’s Board of Trustees, this security has been determined to be illiquid by First Trust Advisors, L.P., the Fund’s Advisor. |
| (d) | This security’s value was determined using significant unobservable inputs (see Note 2A – Portfolio Valuation in the Notes to Financial Statements). |
| ADR | American Depositary Receipt |
| Total Value at 3/31/2023 | Level 1 Quoted Prices | Level 2 Significant Observable Inputs | Level 3 Significant Unobservable Inputs | |
| Common Stocks: | ||||
| Wireless Telecommunication Services | $ 45,428,571 | $ 45,428,571 | $ — | $— * |
| Other Industry Categories ** | 1,685,095,645 | 1,685,095,645 | — | — |
| Total Investments | $ 1,730,524,216 | $ 1,730,524,216 | $— | $ —* |
| * | Investment is valued at $0. |
| ** | See Portfolio of Investments for industry breakout. |
| Shares/ Units | Description | Value | ||
| EXCHANGE-TRADED FUNDS – 21.0% | ||||
| Capital Markets – 21.0% | ||||
| 2,284,925 | First Trust Tactical High Yield ETF (a) | $90,848,618 | ||
| (Cost $108,928,601) | ||||
| MASTER LIMITED PARTNERSHIPS – 20.4% | ||||
| Energy Equipment & Services – 1.0% | ||||
| 211,557 | USA Compression Partners, L.P. | 4,470,200 | ||
| Industrial Conglomerates – 1.4% | ||||
| 120,703 | Icahn Enterprises, L.P. | 6,241,552 | ||
| Marine Transportation – 0.1% | ||||
| 11,952 | Navios Maritime Partners, L.P. | 288,282 | ||
| Oil, Gas & Consumable Fuels – 17.9% | ||||
| 178,880 | Alliance Resource Partners, L.P. | 3,608,009 | ||
| 300,857 | Black Stone Minerals, L.P. | 4,720,446 | ||
| 68,755 | Cheniere Energy Partners, L.P. | 3,253,487 | ||
| 171,899 | Crestwood Equity Partners, L.P. | 4,285,442 | ||
| 189,323 | CrossAmerica Partners, L.P. | 4,068,551 | ||
| 68,018 | Delek Logistics Partners, L.P. | 3,225,413 | ||
| 181,620 | Dorchester Minerals, L.P. | 5,501,270 | ||
| 259,610 | Energy Transfer, L.P. | 3,237,337 | ||
| 140,941 | EnLink Midstream, LLC (b) | 1,527,800 | ||
| 127,220 | Enterprise Products Partners, L.P. | 3,294,998 | ||
| 114,539 | Global Partners, L.P. | 3,553,000 | ||
| 179,201 | Holly Energy Partners, L.P. | 3,112,721 | ||
| 326,452 | Kimbell Royalty Partners, L.P. (b) | 4,971,864 | ||
| 64,114 | Magellan Midstream Partners, L.P. | 3,478,826 | ||
| 106,834 | MPLX, L.P. | 3,680,431 | ||
| 42,683 | Natural Resource Partners, L.P. | 2,228,053 | ||
| 267,087 | NuStar Energy, L.P. | 4,177,241 | ||
| 243,223 | Plains All American Pipeline, L.P. | 3,032,991 | ||
| 220,533 | Plains GP Holdings, L.P., Class A (b) | 2,893,393 | ||
| 66,392 | Sunoco, L.P. | 2,913,945 | ||
| 117,159 | Viper Energy Partners, L.P. (b) | 3,280,452 | ||
| 124,210 | Western Midstream Partners, L.P. | 3,275,418 | ||
| 77,321,088 | ||||
Total Master Limited Partnerships | 88,321,122 | |||
| (Cost $64,370,906) | ||||
| REAL ESTATE INVESTMENT TRUSTS – 19.3% | ||||
| Diversified REITs – 1.3% | ||||
| 102,708 | Essential Properties Realty Trust, Inc. | 2,552,294 | ||
| 38,324 | WP Carey, Inc. | 2,968,194 | ||
| 5,520,488 | ||||
| Health Care REITs – 1.4% | ||||
| 113,819 | Healthpeak Properties, Inc. | 2,500,604 | ||
| 104,633 | LTC Properties, Inc. | 3,675,757 | ||
| 6,176,361 | ||||
| Hotel & Resort REITs – 0.7% | ||||
| 186,386 | Apple Hospitality REIT, Inc. | 2,892,711 | ||
| Mortgage REITs – 4.8% | ||||
| 428,953 | Arbor Realty Trust, Inc. | 4,928,670 | ||
| Shares/ Units | Description | Value | ||
| REAL ESTATE INVESTMENT TRUSTS (Continued) | ||||
| Mortgage REITs (Continued) | ||||
| 436,050 | Ladder Capital Corp. | $4,120,672 | ||
| 642,053 | Ready Capital Corp. | 6,529,679 | ||
| 300,826 | Starwood Property Trust, Inc. | 5,321,612 | ||
| 20,900,633 | ||||
| Office REITs – 2.2% | ||||
| 50,366 | Boston Properties, Inc. | 2,725,808 | ||
| 89,936 | Kilroy Realty Corp. | 2,913,926 | ||
| 543,126 | Piedmont Office Realty Trust, Inc., Class A | 3,964,820 | ||
| 9,604,554 | ||||
| Retail REITs – 3.3% | ||||
| 115,366 | Brixmor Property Group, Inc. | 2,482,676 | ||
| 83,240 | Getty Realty Corp. | 2,999,137 | ||
| 63,709 | National Retail Properties, Inc. | 2,812,752 | ||
| 27,591 | Simon Property Group, Inc. | 3,089,364 | ||
| 145,926 | Tanger Factory Outlet Centers, Inc. | 2,864,528 | ||
| 14,248,457 | ||||
| Specialized REITs – 5.6% | ||||
| 19,350 | Crown Castle, Inc. | 2,589,804 | ||
| 119,285 | EPR Properties | 4,544,759 | ||
| 107,418 | Four Corners Property Trust, Inc. | 2,885,247 | ||
| 60,956 | Gaming and Leisure Properties, Inc. | 3,173,369 | ||
| 53,888 | Iron Mountain, Inc. | 2,851,214 | ||
| 28,149 | Lamar Advertising Co., Class A | 2,811,804 | ||
| 20,997 | Life Storage, Inc. | 2,752,497 | ||
| 82,081 | VICI Properties, Inc. | 2,677,482 | ||
| 24,286,176 | ||||
Total Real Estate Investment Trusts | 83,629,380 | |||
| (Cost $89,348,045) | ||||
| COMMON STOCKS – 19.2% | ||||
| Banks – 5.3% | ||||
| 113,212 | Brookline Bancorp, Inc. | 1,188,726 | ||
| 422,821 | Capitol Federal Financial, Inc. | 2,845,585 | ||
| 27,906 | Citigroup, Inc. | 1,308,512 | ||
| 33,027 | Citizens Financial Group, Inc. | 1,003,030 | ||
| 47,285 | Columbia Banking System, Inc. | 1,012,845 | ||
| 50,180 | First Hawaiian, Inc. | 1,035,213 | ||
| 49,976 | First Interstate BancSystem, Inc., Class A | 1,492,283 | ||
| 122,804 | Hope Bancorp, Inc. | 1,205,935 | ||
| 96,600 | Huntington Bancshares, Inc. | 1,081,920 | ||
| 82,533 | KeyCorp | 1,033,313 | ||
| 277,564 | New York Community Bancorp, Inc. | 2,509,179 | ||
| 148,238 | Northwest Bancshares, Inc. | 1,783,303 | ||
| 45,588 | Pacific Premier Bancorp, Inc. | 1,095,024 | ||
| 63,458 | Provident Financial Services, Inc. | 1,217,125 | ||
| 44,219 | Sandy Spring Bancorp, Inc. | 1,148,810 | ||
| 31,856 | Truist Financial Corp. | 1,086,290 | ||
| 28,639 | US Bancorp | 1,032,436 | ||
| 23,079,529 | ||||
| Biotechnology – 0.3% | ||||
| 9,092 | AbbVie, Inc. | 1,448,992 | ||
| Shares/ Units | Description | Value | ||
| COMMON STOCKS (Continued) | ||||
| Capital Markets – 0.8% | ||||
| 47,638 | Lazard Ltd., Class A | $1,577,294 | ||
| 97,942 | Virtu Financial, Inc., Class A | 1,851,104 | ||
| 3,428,398 | ||||
| Chemicals – 1.2% | ||||
| 29,864 | Dow, Inc. | 1,637,145 | ||
| 38,623 | LyondellBasell Industries N.V., Class A | 3,626,313 | ||
| 5,263,458 | ||||
| Consumer Staples Distribution & Retail – 0.4% | ||||
| 53,018 | Walgreens Boots Alliance, Inc. | 1,833,362 | ||
| Containers & Packaging – 0.4% | ||||
| 44,018 | International Paper Co. | 1,587,289 | ||
| Diversified Telecommunication Services – 1.0% | ||||
| 104,344 | AT&T, Inc. | 2,008,622 | ||
| 58,019 | Verizon Communications, Inc. | 2,256,359 | ||
| 4,264,981 | ||||
| Electric Utilities – 2.5% | ||||
| 25,134 | ALLETE, Inc. | 1,617,876 | ||
| 14,998 | Duke Energy Corp. | 1,446,857 | ||
| 22,523 | Edison International | 1,589,898 | ||
| 13,524 | Entergy Corp. | 1,457,076 | ||
| 42,494 | OGE Energy Corp. | 1,600,324 | ||
| 28,459 | Portland General Electric Co. | 1,391,360 | ||
| 23,077 | Southern (The) Co. | 1,605,698 | ||
| 10,709,089 | ||||
| Financial Services – 0.5% | ||||
| 185,346 | Western Union (The) Co. | 2,066,608 | ||
| Food Products – 0.3% | ||||
| 36,709 | Kraft Heinz (The) Co. | 1,419,537 | ||
| Gas Utilities – 0.3% | ||||
| 19,762 | Spire, Inc. | 1,386,107 | ||
| Household Durables – 0.4% | ||||
| 49,966 | Leggett & Platt, Inc. | 1,592,916 | ||
| Industrial Conglomerates – 0.4% | ||||
| 17,434 | 3M Co. | 1,832,488 | ||
| Insurance – 0.9% | ||||
| 36,520 | Fidelity National Financial, Inc. | 1,275,644 | ||
| 16,734 | Prudential Financial, Inc. | 1,384,571 | ||
| 19,143 | Safety Insurance Group, Inc. | 1,426,536 | ||
| 4,086,751 | ||||
| IT Services – 0.4% | ||||
| 13,718 | International Business Machines Corp. | 1,798,293 | ||
| Leisure Products – 1.5% | ||||
| 31,150 | Hasbro, Inc. | 1,672,443 | ||
| 81,036 | Sturm Ruger & Co., Inc. | 4,654,708 | ||
| 6,327,151 | ||||
| Shares/ Units | Description | Value | ||
| COMMON STOCKS (Continued) | ||||
| Multi-Utilities – 0.4% | ||||
| 27,313 | Dominion Energy, Inc. | $1,527,070 | ||
| Oil, Gas & Consumable Fuels – 0.3% | ||||
| 13,945 | Phillips 66 | 1,413,744 | ||
| Specialty Retail – 0.3% | ||||
| 9,843 | Advance Auto Parts, Inc. | 1,197,007 | ||
| Tobacco – 1.6% | ||||
| 63,722 | Altria Group, Inc. | 2,843,276 | ||
| 41,468 | Universal Corp. | 2,193,242 | ||
| 168,571 | Vector Group Ltd. | 2,024,538 | ||
| 7,061,056 | ||||
Total Common Stocks | 83,323,826 | |||
| (Cost $89,165,883) | ||||
| Shares | Description | Stated Rate | Stated Maturity | Value | ||||
| $25 PAR PREFERRED SECURITIES – 19.4% | ||||||||
| Banks – 2.2% | ||||||||
| 133,271 | Citigroup, Inc., Series J (c) | 7.13% | (d) | 3,335,773 | ||||
| 129,771 | Citigroup, Inc., Series K (c) | 6.88% | (d) | 3,217,023 | ||||
| 125,245 | Wells Fargo & Co., Series R (c) | 6.63% | (d) | 3,043,454 | ||||
| 9,596,250 | ||||||||
| Capital Markets – 1.5% | ||||||||
| 132,852 | Morgan Stanley, Series E (c) | 7.13% | (d) | 3,334,585 | ||||
| 130,229 | Morgan Stanley, Series F (c) | 6.88% | (d) | 3,216,657 | ||||
| 6,551,242 | ||||||||
| Diversified Telecommunication Services – 1.3% | ||||||||
| 202,744 | Qwest Corp. | 6.50% | 09/01/56 | 2,891,129 | ||||
| 200,135 | Qwest Corp. | 6.75% | 06/15/57 | 2,972,005 | ||||
| 5,863,134 | ||||||||
| Financial Services – 2.1% | ||||||||
| 123,289 | Apollo Asset Management, Inc., Class A | 6.38% | (d) | 2,601,398 | ||||
| 125,641 | Apollo Asset Management, Inc., Series B | 6.38% | (d) | 2,814,358 | ||||
| 129,491 | Citigroup Capital XIII, 3 Mo. LIBOR + 6.37% (e) | 11.17% | 10/30/40 | 3,695,673 | ||||
| 9,111,429 | ||||||||
| Food Products – 0.9% | ||||||||
| 142,223 | CHS, Inc., Series 1 | 7.88% | (d) | 3,795,932 | ||||
| Insurance – 0.6% | ||||||||
| 131,221 | Axis Capital Holdings Ltd., Series E | 5.50% | (d) | 2,780,573 | ||||
| Mortgage Real Estate Investment Trusts – 4.0% | ||||||||
| 142,125 | AGNC Investment Corp., Series C, 3 Mo. LIBOR + 5.11% (e) | 9.90% | (d) | 3,342,780 | ||||
| 156,332 | AGNC Investment Corp., Series E (c) | 6.50% | (d) | 3,159,470 | ||||
| 158,701 | AGNC Investment Corp., Series F (c) | 6.13% | (d) | 3,096,256 | ||||
| 193,873 | Chimera Investment Corp., Series B (c) | 8.00% | (d) | 3,714,607 | ||||
| 204,054 | Two Harbors Investment Corp., Series B (c) | 7.63% | (d) | 4,158,620 | ||||
| 17,471,733 | ||||||||
| Shares | Description | Stated Rate | Stated Maturity | Value | ||||
| $25 PAR PREFERRED SECURITIES (Continued) | ||||||||
| Multi-Utilities – 0.7% | ||||||||
| 122,743 | NiSource, Inc., Series B (c) | 6.50% | (d) | $2,945,832 | ||||
| Oil, Gas & Consumable Fuels – 2.6% | ||||||||
| 123,120 | Enbridge, Inc., Series B (c) | 6.38% | 04/15/78 | 3,126,017 | ||||
| 157,559 | Energy Transfer L.P., Series E (c) | 7.60% | (d) | 3,809,776 | ||||
| 164,613 | NuStar Logistics L.P., 3 Mo. LIBOR + 6.73% (e) | 11.53% | 01/15/43 | 4,164,709 | ||||
| 11,100,502 | ||||||||
| Real Estate Management & Development – 2.4% | ||||||||
| 179,872 | DigitalBridge Group, Inc., Class H | 7.13% | (d) | 3,381,594 | ||||
| 178,845 | DigitalBridge Group, Inc., Series I | 7.15% | (d) | 3,430,247 | ||||
| 180,471 | DigitalBridge Group, Inc., Series J | 7.13% | (d) | 3,389,245 | ||||
| 10,201,086 | ||||||||
| Trading Companies & Distributors – 1.1% | ||||||||
| 170,899 | WESCO International, Inc., Series A (c) | 10.63% | (d) | 4,633,072 | ||||
Total $25 Par Preferred Securities | 84,050,785 | |||||||
| (Cost $93,689,482) | ||||||||
Total Investments – 99.3% | 430,173,731 | ||
| (Cost $445,502,917) | |||
Net Other Assets and Liabilities – 0.7% | 2,820,181 | ||
Net Assets – 100.0% | $432,993,912 |
| (a) | Investment in an affiliated fund. |
| (b) | This security is taxed as a “C” corporation for federal income tax purposes. |
| (c) | Fixed-to-floating or fixed-to-variable rate security. The interest rate shown reflects the fixed rate in effect at March 31, 2023. At a predetermined date, the fixed rate will change to a floating rate or a variable rate. |
| (d) | Perpetual maturity. |
| (e) | Floating rate security. |
| LIBOR | London Interbank Offered Rate |
| Total Value at 3/31/2023 | Level 1 Quoted Prices | Level 2 Significant Observable Inputs | Level 3 Significant Unobservable Inputs | |
Exchange-Traded Funds* | $ 90,848,618 | $ 90,848,618 | $ — | $ — |
Master Limited Partnerships* | 88,321,122 | 88,321,122 | — | — |
Real Estate Investment Trusts* | 83,629,380 | 83,629,380 | — | — |
Common Stocks* | 83,323,826 | 83,323,826 | — | — |
$25 Par Preferred Securities* | 84,050,785 | 84,050,785 | — | — |
Total Investments | $ 430,173,731 | $ 430,173,731 | $— | $— |
| * | See Portfolio of Investments for industry breakout. |
| Shares | Description | Value | ||
| COMMON STOCKS – 91.6% | ||||
| Aerospace & Defense – 1.3% | ||||
| 379,000 | Singapore Technologies Engineering Ltd. (a) | $1,043,333 | ||
| Air Freight & Logistics – 1.3% | ||||
| 22,253 | Deutsche Post AG (a) | 1,042,234 | ||
| Automobile Components – 1.3% | ||||
| 87,800 | Toyo Tire Corp. (a) | 1,027,696 | ||
| Banks – 5.5% | ||||
| 7,896 | Bank of Montreal | 703,308 | ||
| 20,105 | Bank of Nova Scotia (The) | 1,012,614 | ||
| 23,875 | Canadian Imperial Bank of Commerce | 1,012,413 | ||
| 44,183 | Canadian Western Bank | 809,449 | ||
| 21,300 | Sumitomo Mitsui Trust Holdings, Inc. (a) | 731,782 | ||
| 4,269,566 | ||||
| Broadline Retail – 1.3% | ||||
| 7,501 | Canadian Tire Corp., Ltd., Class A | 978,876 | ||
| Building Products – 1.1% | ||||
| 53,000 | Lixil Corp. (a) | 874,811 | ||
| Capital Markets – 5.9% | ||||
| 102,333 | IG Group Holdings PLC (a) | 883,080 | ||
| 32,321 | IGM Financial, Inc. | 965,923 | ||
| 64,900 | JAFCO Group Co., Ltd. (a) | 929,594 | ||
| 50,900 | SBI Holdings, Inc. (a) | 1,010,866 | ||
| 143,813 | Schroders PLC (a) | 820,088 | ||
| 4,609,551 | ||||
| Chemicals – 2.8% | ||||
| 24,187 | BASF SE (a) | 1,269,786 | ||
| 59,100 | Mitsubishi Gas Chemical Co., Inc. (a) | 879,398 | ||
| 2,149,184 | ||||
| Construction & Engineering – 3.8% | ||||
| 37,294 | Bouygues S.A. (a) | 1,257,781 | ||
| 44,400 | COMSYS Holdings Corp. (a) | 820,032 | ||
| 48,700 | EXEO Group, Inc. (a) | 881,509 | ||
| 2,959,322 | ||||
| Construction Materials – 1.3% | ||||
| 15,199 | Holcim AG (a) | 980,204 | ||
| Containers & Packaging – 1.5% | ||||
| 82,100 | Toyo Seikan Group Holdings Ltd. (a) | 1,134,567 | ||
| Shares | Description | Value | ||
| Diversified Telecommunication Services – 3.7% | ||||
| 23,712 | BCE, Inc. | $1,062,171 | ||
| 1,398 | Swisscom AG (a) | 892,165 | ||
| 45,199 | TELUS Corp. | 897,291 | ||
| 2,851,627 | ||||
| Electric Utilities – 5.3% | ||||
| 205,114 | CK Infrastructure Holdings Ltd. (a) | 1,116,000 | ||
| 23,551 | Emera, Inc. | 967,482 | ||
| 220,407 | Power Assets Holdings Ltd. (a) | 1,182,444 | ||
| 102,739 | Terna-Rete Elettrica Nazionale S.p.A. (a) | 843,219 | ||
| 4,109,145 | ||||
| Food Products – 1.0% | ||||
| 107,232 | Orkla ASA (a) | 760,544 | ||
| Gas Utilities – 3.1% | ||||
| 128,595 | APA Group (a) | 873,573 | ||
| 588,183 | China Gas Holdings Ltd. (a) | 828,124 | ||
| 190,092 | China Resources Gas Group Ltd. (a) | 699,236 | ||
| 2,400,933 | ||||
| Household Durables – 2.6% | ||||
| 44,600 | Sekisui House Ltd. (a) | 909,003 | ||
| 55,600 | Sumitomo Forestry Co., Ltd. (a) | 1,104,517 | ||
| 2,013,520 | ||||
| Independent Power & Renewable Electricity Producers – 1.0% | ||||
| 26,525 | Capital Power Corp. | 817,241 | ||
| Industrial Conglomerates – 1.1% | ||||
| 14,821 | DCC PLC (a) | 863,936 | ||
| Insurance – 13.3% | ||||
| 3,964 | Allianz SE (a) | 915,034 | ||
| 5,307 | Baloise Holding AG (a) | 826,387 | ||
| 40,821 | Great-West Lifeco, Inc. | 1,081,915 | ||
| 7,210 | Helvetia Holding AG (a) | 1,004,991 | ||
| 418,653 | Legal & General Group PLC (a) | 1,238,212 | ||
| 48,011 | Manulife Financial Corp. | 881,001 | ||
| 26,100 | MS&AD Insurance Group Holdings, Inc. (a) | 808,862 | ||
| 123,143 | Ping An Insurance Group Co. of China Ltd., Class H (a) | 796,638 | ||
| 39,424 | Power Corp. of Canada | 1,007,551 | ||
| 1,580 | Swiss Life Holding AG (a) | 975,029 | ||
| 1,673 | Zurich Insurance Group AG (a) | 801,699 | ||
| 10,337,319 | ||||
| Shares | Description | Value | ||
| COMMON STOCKS (Continued) | ||||
| Metals & Mining – 1.0% | ||||
| 33,400 | Mitsui Mining & Smelting Co., Ltd. (a) | $812,584 | ||
| Multi-Utilities – 3.0% | ||||
| 940,207 | A2A S.p.A. (a) | 1,500,395 | ||
| 30,578 | Canadian Utilities Ltd., Class A | 852,066 | ||
| 2,352,461 | ||||
| Oil, Gas & Consumable Fuels – 5.1% | ||||
| 255,600 | ENEOS Holdings, Inc. (a) | 896,775 | ||
| 49,809 | Keyera Corp. | 1,090,528 | ||
| 28,121 | Pembina Pipeline Corp. | 910,941 | ||
| 27,521 | TC Energy Corp. | 1,070,499 | ||
| 3,968,743 | ||||
| Pharmaceuticals – 1.1% | ||||
| 25,600 | Takeda Pharmaceutical Co., Ltd. (a) | 840,795 | ||
| Professional Services – 2.0% | ||||
| 42,266 | Adecco Group AG (a) | 1,539,541 | ||
| Real Estate Management & Development – 9.7% | ||||
| 326,567 | Henderson Land Development Co., Ltd. (a) | 1,129,855 | ||
| 186,800 | Hongkong Land Holdings Ltd. (a) | 821,820 | ||
| 434,107 | Longfor Group Holdings Ltd. (a) (b) (c) | 1,224,341 | ||
| 581,098 | New World Development Co., Ltd. (a) | 1,557,693 | ||
| 824,871 | Sino Land Co., Ltd. (a) | 1,115,491 | ||
| 60,934 | Sun Hung Kai Properties Ltd. (a) | 853,661 | ||
| 319,106 | Swire Properties Ltd. (a) | 821,284 | ||
| 7,524,145 | ||||
| Semiconductors & Semiconductor Equipment – 1.5% | ||||
| 359,400 | Vanguard International Semiconductor Corp. (a) | 1,149,724 | ||
| Specialty Retail – 1.5% | ||||
| 42,246 | JB Hi-Fi Ltd. (a) | 1,205,673 | ||
| Technology Hardware, Storage & Peripherals – 1.9% | ||||
| 1,399,764 | Lenovo Group Ltd. (a) | 1,516,525 | ||
| Tobacco – 2.5% | ||||
| 32,235 | British American Tobacco PLC (a) | 1,129,979 | ||
| 12,833 | KT&G Corp. (a) | 824,751 | ||
| 1,954,730 | ||||
| Shares | Description | Value | ||
| Trading Companies & Distributors – 1.4% | ||||
| 42,094 | Russel Metals, Inc. | $1,069,247 | ||
| Water Utilities – 2.7% | ||||
| 1,254,817 | Guangdong Investment Ltd. (a) | 1,283,645 | ||
| 63,932 | United Utilities Group PLC (a) | 836,708 | ||
| 2,120,353 | ||||
| Total Common Stocks | 71,278,130 | |||
| (Cost $74,080,745) | ||||
| REAL ESTATE INVESTMENT TRUSTS – 6.1% | ||||
| Health Care REITs – 1.3% | ||||
| 766,590 | Primary Health Properties PLC (a) | 960,044 | ||
| Office REITs – 1.3% | ||||
| 56,522 | Allied Properties Real Estate Investment Trust | 1,018,776 | ||
| Retail REITs – 3.5% | ||||
| 1,067 | Japan Metropolitan Fund Investment Corp. (a) | 779,180 | ||
| 125,090 | Link REIT (a) | 804,358 | ||
| 58,445 | SmartCentres Real Estate Investment Trust | 1,149,008 | ||
| 2,732,546 | ||||
| Total Real Estate Investment Trusts | 4,711,366 | |||
| (Cost $5,818,993) | ||||
| Total Investments – 97.7% | 75,989,496 | |||
| (Cost $79,899,738) | ||||
| Net Other Assets and Liabilities – 2.3% | 1,785,798 | |||
| Net Assets – 100.0% | $77,775,294 | |||
| (a) | This security is fair valued by the Advisor’s Pricing Committee in accordance with procedures approved by the Trust’s Board of Trustees and in accordance with provisions of the Investment Company Act of 1940 and rules thereunder, as amended. At March 31, 2023, securities noted as such are valued at $56,631,196 or 72.8% of net assets. Certain of these securities are fair valued using a factor provided by a third-party pricing service due to the change in value between the foreign markets’ close and the New York Stock Exchange close exceeding a certain threshold. On days when this threshold is not exceeded, these securities are typically valued at the last sale price on the exchange on which they are principally traded. |
| (b) | This security may be resold to qualified foreign investors and foreign institutional buyers under Regulation S of the Securities Act of 1933, as amended (the “1933 Act”). |
| (c) | This security is exempt from registration upon resale under Rule 144A of the 1933 Act and may be resold in transactions exempt from registration, normally to qualified institutional buyers. This security is not restricted on the foreign exchange where it trades freely without any additional registration. As such, it does not require the additional disclosure required of restricted securities. |
| Currency Exposure Diversification | % of Total Investments |
| Canadian Dollar | 25.5% |
| Hong Kong Dollar | 19.7 |
| Japanese Yen | 19.0 |
| Swiss Franc | 9.2 |
| Euro | 9.0 |
| British Pound Sterling | 8.8 |
| Australian Dollar | 2.7 |
| New Taiwan Dollar | 1.5 |
| Singapore Dollar | 1.4 |
| South Korean Won | 1.1 |
| United States Dollar | 1.1 |
| Norwegian Krone | 1.0 |
| Total | 100.0% |
| Total Value at 3/31/2023 | Level 1 Quoted Prices | Level 2 Significant Observable Inputs | Level 3 Significant Unobservable Inputs | |
| Common Stocks: | ||||
| Banks | $ 4,269,566 | $ 3,537,784 | $ 731,782 | $ — |
| Broadline Retail | 978,876 | 978,876 | — | — |
| Capital Markets | 4,609,551 | 965,923 | 3,643,628 | — |
| Diversified Telecommunication Services | 2,851,627 | 1,959,462 | 892,165 | — |
| Electric Utilities | 4,109,145 | 967,482 | 3,141,663 | — |
| Independent Power & Renewable Electricity Producers | 817,241 | 817,241 | — | — |
| Insurance | 10,337,319 | 2,970,467 | 7,366,852 | — |
| Multi-Utilities | 2,352,461 | 852,066 | 1,500,395 | — |
| Oil, Gas & Consumable Fuels | 3,968,743 | 3,071,968 | 896,775 | — |
| Trading Companies & Distributors | 1,069,247 | 1,069,247 | — | — |
| Other Industry Categories* | 35,914,354 | — | 35,914,354 | — |
| Real Estate Investment Trusts: | ||||
| Health Care REITs | 960,044 | — | 960,044 | — |
| Office REITs | 1,018,776 | 1,018,776 | — | — |
| Retail REITs | 2,732,546 | 1,149,008 | 1,583,538 | — |
| Total Investments | $ 75,989,496 | $ 19,358,300 | $ 56,631,196 | $— |
| * | See Portfolio of Investments for industry breakout. |
| Shares | Description | Value | ||
| COMMON STOCKS – 96.4% | ||||
| Aerospace & Defense – 1.3% | ||||
| 2,504 | Boeing (The) Co. (a) | $531,925 | ||
| 2,551 | HEICO Corp., Class A | 346,681 | ||
| 1,124 | Lockheed Martin Corp. | 531,348 | ||
| 7,016 | Raytheon Technologies Corp. | 687,077 | ||
| 2,097,031 | ||||
| Air Freight & Logistics – 0.4% | ||||
| 3,403 | United Parcel Service, Inc., Class B | 660,148 | ||
| Automobiles – 2.0% | ||||
| 997 | Ferrari N.V. | 270,127 | ||
| 12,771 | Stellantis N.V. | 232,304 | ||
| 12,771 | Tesla, Inc. (a) | 2,649,472 | ||
| 3,151,903 | ||||
| Banks – 4.6% | ||||
| 32,968 | Bank of America Corp. | 942,885 | ||
| 8,973 | Citigroup, Inc. | 420,744 | ||
| 7,703 | Commerce Bancshares, Inc. | 449,470 | ||
| 10,368 | First Hawaiian, Inc. | 213,892 | ||
| 16,887 | FNB Corp. | 195,889 | ||
| 18,454 | Fulton Financial Corp. | 255,034 | ||
| 7,415 | HDFC Bank, Ltd., ADR | 494,358 | ||
| 4,198 | Independent Bank Corp. | 275,473 | ||
| 13,650 | JPMorgan Chase & Co. (b) | 1,778,731 | ||
| 7,696 | Royal Bank of Canada | 735,584 | ||
| 7,256 | Texas Capital Bancshares, Inc. (a) | 355,254 | ||
| 53,770 | Valley National Bancorp | 496,835 | ||
| 18,217 | Wells Fargo & Co. | 680,951 | ||
| 7,295,100 | ||||
| Beverages – 2.5% | ||||
| 8,586 | Anheuser-Busch InBev S.A., ADR | 572,944 | ||
| 18,645 | Coca-Cola (The) Co. | 1,156,549 | ||
| 15,964 | Coca-Cola Europacific Partners PLC | 944,909 | ||
| 6,742 | PepsiCo, Inc. | 1,229,067 | ||
| 3,903,469 | ||||
| Biotechnology – 1.7% | ||||
| 8,434 | AbbVie, Inc. (b) | 1,344,127 | ||
| 11,791 | Agios Pharmaceuticals, Inc. (a) | 270,839 | ||
| 2,608 | Amgen, Inc. | 630,484 | ||
| 6,133 | Gilead Sciences, Inc. | 508,855 | ||
| 2,754,305 | ||||
| Broadline Retail – 2.7% | ||||
| 41,527 | Amazon.com, Inc. (a) (b) | 4,289,324 | ||
| Capital Markets – 2.6% | ||||
| 9,505 | Artisan Partners Asset Management, Inc., Class A | 303,970 | ||
| 730 | BlackRock, Inc. | 488,458 | ||
| 7,541 | Charles Schwab (The) Corp. | 394,998 | ||
| 1,840 | Evercore, Inc., Class A | 212,299 | ||
| 1,631 | Goldman Sachs Group (The), Inc. | 533,516 | ||
| 22,794 | Jefferies Financial Group, Inc. | 723,481 | ||
| 11,164 | Moelis & Co., Class A | 429,144 | ||
| 6,191 | Morgan Stanley | 543,570 | ||
| Shares | Description | Value | ||
| COMMON STOCKS (Continued) | ||||
| Capital Markets (Continued) | ||||
| 1,577 | S&P Global, Inc. | $543,702 | ||
| 4,173,138 | ||||
| Chemicals – 1.7% | ||||
| 9,045 | Avient Corp. | 372,292 | ||
| 13,796 | Axalta Coating Systems Ltd. (a) | 417,881 | ||
| 8,227 | Huntsman Corp. | 225,091 | ||
| 2,209 | Linde PLC | 785,167 | ||
| 1,024 | NewMarket Corp. | 373,740 | ||
| 16,108 | Valvoline, Inc. | 562,813 | ||
| 2,736,984 | ||||
| Communications Equipment – 0.8% | ||||
| 19,459 | Cisco Systems, Inc. | 1,017,219 | ||
| 22,596 | Viavi Solutions, Inc. (a) | 244,715 | ||
| 1,261,934 | ||||
| Construction Materials – 0.2% | ||||
| 2,195 | Eagle Materials, Inc. | 322,116 | ||
| Consumer Finance – 1.2% | ||||
| 14,189 | Ally Financial, Inc. | 361,678 | ||
| 2,757 | American Express Co. | 454,767 | ||
| 18,344 | Navient Corp. | 293,320 | ||
| 20,089 | OneMain Holdings, Inc. | 744,900 | ||
| 1,854,665 | ||||
| Consumer Staples Distribution & Retail – 1.6% | ||||
| 2,157 | Costco Wholesale Corp. | 1,071,749 | ||
| 10,314 | US Foods Holding Corp. (a) | 380,999 | ||
| 6,873 | Walmart, Inc. | 1,013,424 | ||
| 2,466,172 | ||||
| Containers & Packaging – 1.7% | ||||
| 6,699 | Berry Global Group, Inc. | 394,571 | ||
| 19,628 | Crown Holdings, Inc. (b) | 1,623,432 | ||
| 9,844 | Graphic Packaging Holding Co. | 250,924 | ||
| 5,940 | Sonoco Products Co. (b) | 362,340 | ||
| 2,631,267 | ||||
| Diversified Consumer Services – 0.5% | ||||
| 8,386 | Frontdoor, Inc. (a) | 233,802 | ||
| 4,186 | Grand Canyon Education, Inc. (a) | 476,785 | ||
| 710,587 | ||||
| Diversified Telecommunication Services – 1.4% | ||||
| 35,295 | AT&T, Inc. (b) | 679,429 | ||
| 3,950 | Iridium Communications, Inc. | 244,623 | ||
| 21,737 | Liberty Global PLC, Class C (a) | 443,000 | ||
| 20,513 | Verizon Communications, Inc. | 797,751 | ||
| 2,164,803 | ||||
| Electric Utilities – 1.1% | ||||
| 7,289 | Hawaiian Electric Industries, Inc. | 279,898 | ||
| 4,564 | IDACORP, Inc. | 494,418 | ||
| 9,379 | NextEra Energy, Inc. | 722,933 | ||
| Shares | Description | Value | ||
| COMMON STOCKS (Continued) | ||||
| Electric Utilities (Continued) | ||||
| 3,317 | Otter Tail Corp. | $239,720 | ||
| 1,736,969 | ||||
| Electrical Equipment – 0.2% | ||||
| 1,949 | Acuity Brands, Inc. | 356,141 | ||
| Electronic Equipment, Instruments & Components – 0.2% | ||||
| 2,784 | Belden, Inc. | 241,568 | ||
| Energy Equipment & Services – 0.4% | ||||
| 49,101 | TechnipFMC PLC (a) | 670,229 | ||
| Entertainment – 1.0% | ||||
| 2,123 | Netflix, Inc. (a) | 733,454 | ||
| 8,585 | Walt Disney (The) Co. (a) | 859,616 | ||
| 1,593,070 | ||||
| Financial Services – 4.9% | ||||
| 8,335 | Berkshire Hathaway, Inc., Class B (a) (b) | 2,573,598 | ||
| 40,047 | Equitable Holdings, Inc. | 1,016,793 | ||
| 3,942 | Mastercard, Inc., Class A (b) | 1,432,562 | ||
| 7,654 | Visa, Inc., Class A (b) | 1,725,671 | ||
| 11,534 | Voya Financial, Inc. | 824,220 | ||
| 2,783 | Walker & Dunlop, Inc. | 211,981 | ||
| 7,784,825 | ||||
| Food Products – 1.5% | ||||
| 6,436 | Cal-Maine Foods, Inc. (b) | 391,888 | ||
| 29,787 | Flowers Foods, Inc. | 816,462 | ||
| 4,860 | Ingredion, Inc. | 494,408 | ||
| 6,570 | Mondelez International, Inc., Class A | 458,060 | ||
| 5,370 | TreeHouse Foods, Inc. (a) | 270,809 | ||
| 2,431,627 | ||||
| Gas Utilities – 0.5% | ||||
| 9,803 | ONE Gas, Inc. | 776,692 | ||
| Ground Transportation – 0.4% | ||||
| 2,752 | Union Pacific Corp. | 553,868 | ||
| Health Care Equipment & Supplies – 1.9% | ||||
| 8,241 | Abbott Laboratories | 834,484 | ||
| 6,221 | Enovis Corp. (a) | 332,761 | ||
| 14,265 | Envista Holdings Corp. (a) | 583,153 | ||
| 2,293 | GE HealthCare Technologies, Inc. (a) | 188,095 | ||
| 6,508 | Medtronic PLC | 524,675 | ||
| 1,590 | Stryker Corp. | 453,897 | ||
| 2,917,065 | ||||
| Health Care Providers & Services – 3.0% | ||||
| 1,007 | Chemed Corp. | 541,514 | ||
| 1,520 | Cigna (The) Group | 388,406 | ||
| 6,512 | CVS Health Corp. (b) | 483,907 | ||
| 1,154 | Elevance Health, Inc. | 530,621 | ||
| 5,260 | Encompass Health Corp. | 284,566 | ||
| 11,758 | Premier, Inc., Class A | 380,606 | ||
| 4,594 | UnitedHealth Group, Inc. | 2,171,078 | ||
| 4,780,698 | ||||
| Shares | Description | Value | ||
| COMMON STOCKS (Continued) | ||||
| Hotels, Restaurants & Leisure – 1.4% | ||||
| 171 | Booking Holdings, Inc. (a) | $453,562 | ||
| 11,529 | International Game Technology PLC | 308,977 | ||
| 3,472 | McDonald’s Corp. | 970,806 | ||
| 5,287 | Starbucks Corp. | 550,536 | ||
| 2,283,881 | ||||
| Household Durables – 0.5% | ||||
| 7,079 | Leggett & Platt, Inc. | 225,679 | ||
| 8,335 | Toll Brothers, Inc. | 500,350 | ||
| 726,029 | ||||
| Household Products – 1.1% | ||||
| 11,357 | Procter & Gamble (The) Co. (b) | 1,688,672 | ||
| Independent Power & Renewable Electricity Producers – 0.2% | ||||
| 8,354 | Atlantica Sustainable Infrastructure PLC | 246,944 | ||
| Industrial Conglomerates – 0.7% | ||||
| 4,955 | General Electric Co. | 473,698 | ||
| 3,167 | Honeywell International, Inc. | 605,277 | ||
| 1,078,975 | ||||
| Insurance – 1.2% | ||||
| 2,019 | Chubb Ltd. | 392,049 | ||
| 7,113 | First American Financial Corp. | 395,910 | ||
| 3,115 | Hanover Insurance Group (The), Inc. | 400,277 | ||
| 1,203 | Kinsale Capital Group, Inc. | 361,080 | ||
| 2,084 | RenaissanceRe Holdings Ltd. | 417,509 | ||
| 1,966,825 | ||||
| Interactive Media & Services – 4.7% | ||||
| 27,031 | Alphabet, Inc., Class A (a) | 2,803,925 | ||
| 23,911 | Alphabet, Inc., Class C (a) | 2,486,744 | ||
| 9,639 | Meta Platforms, Inc., Class A (a) | 2,042,890 | ||
| 7,333,559 | ||||
| IT Services – 1.2% | ||||
| 3,006 | Accenture PLC, Class A | 859,145 | ||
| 5,595 | Amdocs Ltd. | 537,288 | ||
| 4,373 | International Business Machines Corp. | 573,256 | ||
| 1,969,689 | ||||
| Life Sciences Tools & Services – 1.3% | ||||
| 3,157 | Bruker Corp. | 248,898 | ||
| 3,152 | Danaher Corp. | 794,430 | ||
| 1,853 | Thermo Fisher Scientific, Inc. | 1,068,014 | ||
| 2,111,342 | ||||
| Machinery – 1.2% | ||||
| 11,456 | Allison Transmission Holdings, Inc. | 518,269 | ||
| 2,347 | Caterpillar, Inc. | 537,088 | ||
| 1,281 | Deere & Co. | 528,899 | ||
| 4,883 | Graco, Inc. | 356,508 | ||
| 1,940,764 | ||||
| Marine Transportation – 0.2% | ||||
| 5,875 | Matson, Inc. | 350,561 | ||
| Shares | Description | Value | ||
| COMMON STOCKS (Continued) | ||||
| Media – 0.7% | ||||
| 20,912 | Comcast Corp., Class A | $792,774 | ||
| 1,411 | Nexstar Media Group, Inc. | 243,623 | ||
| 1,036,397 | ||||
| Metals & Mining – 0.4% | ||||
| 7,262 | Southern Copper Corp. | 553,727 | ||
| Oil, Gas & Consumable Fuels – 3.7% | ||||
| 7,344 | Arch Resources, Inc. | 965,442 | ||
| 8,347 | Chevron Corp. (b) | 1,361,897 | ||
| 5,780 | ConocoPhillips | 573,434 | ||
| 19,075 | Exxon Mobil Corp. (b) | 2,091,764 | ||
| 7,300 | Murphy Oil Corp. | 269,954 | ||
| 6,476 | Ovintiv, Inc. | 233,654 | ||
| 4,552 | PDC Energy, Inc. | 292,147 | ||
| 5,788,292 | ||||
| Passenger Airlines – 0.2% | ||||
| 48,752 | JetBlue Airways Corp. (a) | 354,915 | ||
| Personal Care Products – 2.0% | ||||
| 7,659 | BellRing Brands, Inc. (a) | 260,406 | ||
| 61,984 | Coty, Inc., Class A (a) | 747,527 | ||
| 40,161 | Unilever PLC, ADR | 2,085,561 | ||
| 3,093,494 | ||||
| Pharmaceuticals – 5.9% | ||||
| 95,609 | Bausch Health Cos., Inc. (a) | 774,433 | ||
| 10,480 | Bristol-Myers Squibb Co. | 726,369 | ||
| 3,872 | Eli Lilly & Co. (b) | 1,329,722 | ||
| 12,722 | Johnson & Johnson (b) | 1,971,910 | ||
| 12,080 | Merck & Co., Inc. (b) | 1,285,191 | ||
| 11,330 | Novo Nordisk A/S, ADR (b) | 1,803,056 | ||
| 27,559 | Pfizer, Inc. | 1,124,407 | ||
| 8,346 | Royalty Pharma PLC, Class A | 300,707 | ||
| 9,315,795 | ||||
| Professional Services – 0.4% | ||||
| 1,971 | Automatic Data Processing, Inc. | 438,804 | ||
| 5,438 | Genpact Ltd. | 251,344 | ||
| 690,148 | ||||
| Semiconductors & Semiconductor Equipment – 5.3% | ||||
| 7,284 | Advanced Micro Devices, Inc. (a) | 713,905 | ||
| 2,446 | Analog Devices, Inc. | 482,400 | ||
| 3,891 | Applied Materials, Inc. | 477,932 | ||
| 1,778 | Broadcom, Inc. | 1,140,658 | ||
| 18,872 | Intel Corp. | 616,548 | ||
| 11,548 | NVIDIA Corp. | 3,207,688 | ||
| 5,471 | QUALCOMM, Inc. | 697,990 | ||
| 1,367 | Silicon Laboratories, Inc. (a) | 239,348 | ||
| 4,266 | Texas Instruments, Inc. | 793,519 | ||
| 8,369,988 | ||||
| Software – 9.5% | ||||
| 2,086 | Adobe, Inc. (a) | 803,882 | ||
| 4,788 | Check Point Software Technologies Ltd. (a) | 622,440 | ||
| Shares | Description | Value | ||
| COMMON STOCKS (Continued) | ||||
| Software (Continued) | ||||
| 4,062 | CommVault Systems, Inc. (a) | $230,478 | ||
| 2,880 | Dolby Laboratories, Inc., Class A | 246,010 | ||
| 21,421 | Dropbox, Inc., Class A (a) | 463,122 | ||
| 1,368 | Intuit, Inc. | 609,895 | ||
| 34,789 | Microsoft Corp. (b) | 10,029,669 | ||
| 7,300 | Oracle Corp. | 678,316 | ||
| 4,119 | Salesforce, Inc. (a) | 822,894 | ||
| 916 | ServiceNow, Inc. (a) | 425,683 | ||
| 14,932,389 | ||||
| Specialty Retail – 1.7% | ||||
| 6,401 | Buckle (The), Inc. | 228,452 | ||
| 4,938 | Home Depot (The), Inc. (b) | 1,457,303 | ||
| 2,983 | Lowe’s Cos., Inc. | 596,510 | ||
| 5,548 | TJX (The) Cos., Inc. | 434,741 | ||
| 2,717,006 | ||||
| Technology Hardware, Storage & Peripherals – 8.3% | ||||
| 68,633 | Apple, Inc. | 11,317,582 | ||
| 32,645 | Dell Technologies, Inc., Class C | 1,312,655 | ||
| 27,455 | Xerox Holdings Corp. | 422,807 | ||
| 13,053,044 | ||||
| Textiles, Apparel & Luxury Goods – 0.8% | ||||
| 3,290 | Carter’s, Inc. | 236,617 | ||
| 6,856 | Kontoor Brands, Inc. | 331,762 | ||
| 6,007 | NIKE, Inc., Class B | 736,698 | ||
| 1,305,077 | ||||
| Tobacco – 0.5% | ||||
| 7,440 | Philip Morris International, Inc. | 723,540 | ||
| Trading Companies & Distributors – 1.1% | ||||
| 4,569 | Beacon Roofing Supply, Inc. (a) | 268,886 | ||
| 3,238 | Ferguson PLC | 433,082 | ||
| 3,082 | SiteOne Landscape Supply, Inc. (a) | 421,833 | ||
| 9,063 | Triton International Ltd. | 572,963 | ||
| 1,696,764 | ||||
| Water Utilities – 0.2% | ||||
| 3,639 | American States Water Co. | 323,471 | ||
Total Common Stocks | 151,966,986 | |||
| (Cost $148,189,734) | ||||
| REAL ESTATE INVESTMENT TRUSTS – 3.8% | ||||
| Health Care REITs – 0.2% | ||||
| 5,313 | National Health Investors, Inc. | 274,044 | ||
| Hotel & Resort REITs – 0.1% | ||||
| 14,261 | Apple Hospitality REIT, Inc. | 221,331 | ||
| Industrial REITs – 0.3% | ||||
| 4,273 | Prologis, Inc. | 533,142 | ||
| Mortgage Real Estate Investment Trusts – 2.2% | ||||
| 223,914 | AGNC Investment Corp. (b) | 2,257,053 | ||
| 39,253 | Chimera Investment Corp. | 221,387 | ||
| Shares | Description | Value | ||
| REAL ESTATE INVESTMENT TRUSTS (Continued) | ||||
| Mortgage Real Estate Investment Trusts (Continued) | ||||
| 79,023 | Rithm Capital Corp. | $632,184 | ||
| 23,930 | Two Harbors Investment Corp. | 352,010 | ||
| 3,462,634 | ||||
| Office REITs – 0.6% | ||||
| 13,401 | Corporate Office Properties Trust | 317,738 | ||
| 25,977 | Equity Commonwealth | 537,983 | ||
| 855,721 | ||||
| Retail REITs – 0.1% | ||||
| 19,831 | Macerich (The) Co. | 210,209 | ||
| Specialized REITs – 0.3% | ||||
| 2,240 | American Tower Corp. | 457,722 | ||
Total Real Estate Investment Trusts | 6,014,803 | |||
| (Cost $6,241,523) | ||||
| Units | Description | Value | ||
| MASTER LIMITED PARTNERSHIPS – 0.8% | ||||
| Oil, Gas & Consumable Fuels – 0.8% | ||||
| 27,648 | Energy Transfer, L.P. | 344,771 | ||
| 6,691 | Magellan Midstream Partners, L.P. | 363,054 | ||
| 16,299 | MPLX, L.P. | 561,500 | ||
Total Master Limited Partnerships | 1,269,325 | |||
| (Cost $1,209,677) | ||||
Total Investments – 101.0% | 159,251,114 | |||
| (Cost $155,640,934) | ||||
| Number of Contracts | Description | Notional Amount | Exercise Price | Expiration Date | Value | |||||
| CALL OPTIONS WRITTEN – (2.8)% | ||||||||||
| (37) | S&P 500® Index | $(15,204,447) | $3,925.00 | 04/21/23 | (726,051) | |||||
| (47) | S&P 500® Index | (19,313,757) | 3,975.00 | 04/21/23 | (754,303) | |||||
| (75) | S&P 500® Index | (30,819,825) | 4,000.00 | 04/21/23 | (1,079,250) | |||||
| (35) | S&P 500® Index | (14,382,585) | 4,025.00 | 04/21/23 | (400,225) | |||||
| (10) | S&P 500® Index | (4,109,310) | 4,050.00 | 04/21/23 | (95,890) | |||||
| (37) | S&P 500® Index | (15,204,447) | 3,950.00 | 05/19/23 | (803,048) | |||||
| (30) | S&P 500® Index | (12,327,930) | 4,000.00 | 05/19/23 | (563,700) | |||||
Total Call Options Written | (4,422,467) | |||||||||
| (Premiums received $2,341,683) | ||||||||||
Net Other Assets and Liabilities – 1.8% | 2,784,619 | ||
Net Assets – 100.0% | $157,613,266 |
| (a) | Non-income producing security. |
| (b) | All or a portion of this security is pledged as collateral for the options written. At March 31, 2023, the segregated value of these securities amounts to $15,595,351. |
| ADR | American Depositary Receipt |
| ASSETS TABLE | ||||
| Total Value at 3/31/2023 | Level 1 Quoted Prices | Level 2 Significant Observable Inputs | Level 3 Significant Unobservable Inputs | |
Common Stocks* | $ 151,966,986 | $ 151,966,986 | $ — | $ — |
Real Estate Investment Trusts* | 6,014,803 | 6,014,803 | — | — |
Master Limited Partnerships* | 1,269,325 | 1,269,325 | — | — |
Total Investments | $ 159,251,114 | $ 159,251,114 | $— | $— |
| LIABILITIES TABLE | ||||
| Total Value at 3/31/2023 | Level 1 Quoted Prices | Level 2 Significant Observable Inputs | Level 3 Significant Unobservable Inputs | |
Call Options Written | $ (4,422,467) | $ (4,422,467) | $ — | $ — |
| * | See Portfolio of Investments for industry breakout. |
| Shares | Description | Value | ||
| COMMON STOCKS – 101.9% | ||||
| Air Freight & Logistics – 0.3% | ||||
| 721 | Expeditors International of Washington, Inc. | $79,397 | ||
| Automobiles – 2.7% | ||||
| 3,921 | Tesla, Inc. (a) | 813,451 | ||
| Banks – 0.4% | ||||
| 537 | JPMorgan Chase & Co. | 69,976 | ||
| 6,554 | Valley National Bancorp | 60,559 | ||
| 130,535 | ||||
| Beverages – 3.6% | ||||
| 1,706 | Coca-Cola Europacific Partners PLC | 100,978 | ||
| 5,386 | PepsiCo, Inc. | 981,868 | ||
| 1,082,846 | ||||
| Biotechnology – 1.3% | ||||
| 948 | AbbVie, Inc. | 151,083 | ||
| 354 | BeiGene Ltd., ADR (a) | 76,298 | ||
| 747 | BioMarin Pharmaceutical, Inc. (a) | 72,638 | ||
| 2,029 | Genmab A/S, ADR (a) | 76,615 | ||
| 376,634 | ||||
| Broadline Retail – 3.4% | ||||
| 9,363 | Amazon.com, Inc. (a) (b) | 967,104 | ||
| 632 | Etsy, Inc. (a) | 70,361 | ||
| 1,037,465 | ||||
| Capital Markets – 3.2% | ||||
| 16,379 | BGC Partners, Inc., Class A | 85,662 | ||
| 971 | Charles Schwab (The) Corp. | 50,861 | ||
| 922 | CME Group, Inc. | 176,581 | ||
| 265 | Moody’s Corp. | 81,095 | ||
| 2,743 | Nasdaq, Inc. | 149,960 | ||
| 826 | Northern Trust Corp. | 72,795 | ||
| 293 | S&P Global, Inc. | 101,018 | ||
| 1,413 | T. Rowe Price Group, Inc. | 159,528 | ||
| 1,086 | Tradeweb Markets, Inc., Class A | 85,816 | ||
| 963,316 | ||||
| Chemicals – 0.5% | ||||
| 221 | Linde PLC | 78,552 | ||
| 346 | Sherwin-Williams (The) Co. | 77,771 | ||
| 156,323 | ||||
| Communications Equipment – 2.1% | ||||
| 10,576 | Cisco Systems, Inc. | 552,860 | ||
| 545 | F5, Inc. (a) | 79,401 | ||
| 632,261 | ||||
| Consumer Finance – 0.2% | ||||
| 11,871 | SoFi Technologies, Inc. (a) | 72,057 | ||
| Consumer Staples Distribution & Retail – 2.9% | ||||
| 365 | Casey’s General Stores, Inc. | 79,008 | ||
| 1,184 | Costco Wholesale Corp. (b) | 588,294 | ||
| 358 | Dollar General Corp. | 75,345 | ||
| Shares | Description | Value | ||
| COMMON STOCKS (Continued) | ||||
| Consumer Staples Distribution & Retail (Continued) | ||||
| 838 | Target Corp. | $138,798 | ||
| 881,445 | ||||
| Distributors – 0.3% | ||||
| 263 | Pool Corp. | 90,062 | ||
| Diversified Consumer Services – 0.4% | ||||
| 852 | Duolingo, Inc. (a) | 121,487 | ||
| Electric Utilities – 1.8% | ||||
| 3,518 | Alliant Energy Corp. | 187,861 | ||
| 798 | Duke Energy Corp. | 76,983 | ||
| 1,524 | Evergy, Inc. | 93,147 | ||
| 1,434 | NextEra Energy, Inc. | 110,533 | ||
| 1,189 | Southern (The) Co. | 82,730 | ||
| 551,254 | ||||
| Electronic Equipment, Instruments & Components – 1.0% | ||||
| 798 | CDW Corp. | 155,522 | ||
| 1,486 | Trimble, Inc. (a) | 77,896 | ||
| 259 | Zebra Technologies Corp., Class A (a) | 82,362 | ||
| 315,780 | ||||
| Entertainment – 2.0% | ||||
| 1,242 | Netflix, Inc. (a) (b) | 429,086 | ||
| 697 | Take-Two Interactive Software, Inc. (a) | 83,152 | ||
| 773 | Walt Disney (The) Co. (a) | 77,401 | ||
| 589,639 | ||||
| Financial Services – 0.3% | ||||
| 540 | Jack Henry & Associates, Inc. | 81,389 | ||
| Ground Transportation – 0.3% | ||||
| 580 | JB Hunt Transport Services, Inc. | 101,767 | ||
| Health Care Equipment & Supplies – 1.9% | ||||
| 2,266 | Abbott Laboratories | 229,455 | ||
| 2,223 | DENTSPLY SIRONA, Inc. | 87,319 | ||
| 990 | Edwards Lifesciences Corp. (a) | 81,903 | ||
| 1,014 | GE HealthCare Technologies, Inc. (a) | 83,178 | ||
| 457 | Masimo Corp. (a) | 84,335 | ||
| 566,190 | ||||
| Health Care Providers & Services – 0.5% | ||||
| 902 | CVS Health Corp. | 67,028 | ||
| 206 | UnitedHealth Group, Inc. | 97,353 | ||
| 164,381 | ||||
| Health Care Technology – 0.3% | ||||
| 4,260 | Certara, Inc. (a) | 102,709 | ||
| Hotels, Restaurants & Leisure – 1.2% | ||||
| 770 | Expedia Group, Inc. (a) | 74,713 | ||
| 2,801 | Starbucks Corp. | 291,668 | ||
| 366,381 | ||||
| Household Products – 0.3% | ||||
| 1,048 | Colgate-Palmolive Co. | 78,757 | ||
| Shares | Description | Value | ||
| COMMON STOCKS (Continued) | ||||
| Insurance – 0.3% | ||||
| 328 | Willis Towers Watson PLC | $76,221 | ||
| Interactive Media & Services – 6.8% | ||||
| 5,939 | Alphabet, Inc., Class A (a) | 616,052 | ||
| 5,922 | Alphabet, Inc., Class C (a) (b) | 615,888 | ||
| 3,485 | Meta Platforms, Inc., Class A (a) | 738,611 | ||
| 950 | Ziff Davis, Inc. (a) | 74,148 | ||
| 2,044,699 | ||||
| IT Services – 2.7% | ||||
| 942 | Accenture PLC, Class A | 269,233 | ||
| 1,857 | Akamai Technologies, Inc. (a) | 145,403 | ||
| 833 | Amdocs Ltd. | 79,993 | ||
| 245 | EPAM Systems, Inc. (a) | 73,255 | ||
| 586 | International Business Machines Corp. | 76,819 | ||
| 370 | MongoDB, Inc. (a) | 86,254 | ||
| 1,095 | Perficient, Inc. (a) | 79,048 | ||
| 810,005 | ||||
| Life Sciences Tools & Services – 1.8% | ||||
| 538 | Agilent Technologies, Inc. | 74,427 | ||
| 1,056 | Bio-Techne Corp. | 78,344 | ||
| 1,108 | Bruker Corp. | 87,355 | ||
| 435 | Danaher Corp. | 109,637 | ||
| 438 | Repligen Corp. (a) | 73,742 | ||
| 186 | Thermo Fisher Scientific, Inc. | 107,205 | ||
| 530,710 | ||||
| Machinery – 0.5% | ||||
| 183 | Deere & Co. | 75,557 | ||
| 348 | Nordson Corp. | 77,347 | ||
| 152,904 | ||||
| Media – 1.8% | ||||
| 10,336 | Comcast Corp., Class A | 391,838 | ||
| 867 | Liberty Broadband Corp., Class C (a) | 70,834 | ||
| 2,044 | TechTarget, Inc. (a) | 73,829 | ||
| 536,501 | ||||
| Multi-Utilities – 0.3% | ||||
| 1,363 | Dominion Energy, Inc. | 76,205 | ||
| Passenger Airlines – 0.3% | ||||
| 830 | Ryanair Holdings PLC, ADR (a) | 78,261 | ||
| Personal Care Products – 0.3% | ||||
| 354 | Estee Lauder (The) Cos., Inc., Class A | 87,247 | ||
| Pharmaceuticals – 2.7% | ||||
| 428 | Eli Lilly & Co. | 146,984 | ||
| 1,114 | Johnson & Johnson | 172,670 | ||
| 1,255 | Merck & Co., Inc. | 133,519 | ||
| 2,607 | Pfizer, Inc. | 106,366 | ||
| 2,116 | Royalty Pharma PLC, Class A | 76,239 | ||
| 970 | Zoetis, Inc. | 161,447 | ||
| 797,225 | ||||
| Shares | Description | Value | ||
| COMMON STOCKS (Continued) | ||||
| Professional Services – 0.7% | ||||
| 743 | Exponent, Inc. | $74,070 | ||
| 1,446 | SS&C Technologies Holdings, Inc. | 81,655 | ||
| 1,605 | TTEC Holdings, Inc. | 59,754 | ||
| 215,479 | ||||
| Real Estate Management & Development – 0.2% | ||||
| 660 | Colliers International Group, Inc. | 69,663 | ||
| Semiconductors & Semiconductor Equipment – 15.0% | ||||
| 3,747 | Advanced Micro Devices, Inc. (a) | 367,243 | ||
| 1,780 | Allegro MicroSystems, Inc. (a) | 85,422 | ||
| 832 | Ambarella, Inc. (a) | 64,413 | ||
| 3,924 | Applied Materials, Inc. (b) | 481,985 | ||
| 1,069 | Broadcom, Inc. (b) | 685,806 | ||
| 906 | Entegris, Inc. | 74,301 | ||
| 825 | MKS Instruments, Inc. | 73,112 | ||
| 186 | Monolithic Power Systems, Inc. | 93,100 | ||
| 4,683 | NVIDIA Corp. | 1,300,797 | ||
| 983 | ON Semiconductor Corp. (a) | 80,921 | ||
| 758 | Qorvo, Inc. (a) | 76,990 | ||
| 2,602 | QUALCOMM, Inc. | 331,963 | ||
| 435 | Silicon Laboratories, Inc. (a) | 76,164 | ||
| 646 | SiTime Corp. (a) | 91,881 | ||
| 645 | Synaptics, Inc. (a) | 71,692 | ||
| 757 | Teradyne, Inc. | 81,385 | ||
| 2,577 | Texas Instruments, Inc. (b) | 479,348 | ||
| 4,516,523 | ||||
| Software – 18.7% | ||||
| 2,934 | ACI Worldwide, Inc. (a) | 79,159 | ||
| 1,246 | Adobe, Inc. (a) (b) | 480,171 | ||
| 1,507 | Alarm.com Holdings, Inc. (a) | 75,772 | ||
| 5,754 | Amplitude, Inc., Class A (a) | 71,580 | ||
| 359 | Aspen Technology, Inc. (a) | 82,164 | ||
| 1,950 | Bentley Systems, Inc., Class B | 83,830 | ||
| 2,450 | Braze, Inc., Class A (a) | 84,696 | ||
| 616 | Check Point Software Technologies Ltd. (a) | 80,080 | ||
| 1,290 | CommVault Systems, Inc. (a) | 73,195 | ||
| 1,036 | Descartes Systems Group (The), Inc. (a) | 83,512 | ||
| 3,817 | Gen Digital, Inc. | 65,500 | ||
| 1,748 | Gitlab, Inc., Class A (a) | 59,939 | ||
| 3,573 | Jamf Holding Corp. (a) | 69,388 | ||
| 11,533 | Microsoft Corp. (b) | 3,324,964 | ||
| 483 | Monday.com Ltd. (a) | 68,948 | ||
| 2,804 | nCino, Inc. (a) | 69,483 | ||
| 1,651 | Oracle Corp. | 153,411 | ||
| 1,729 | Pegasystems, Inc. | 83,822 | ||
| 608 | PTC, Inc. (a) | 77,964 | ||
| 708 | Salesforce, Inc. (a) | 141,444 | ||
| 178 | ServiceNow, Inc. (a) | 82,720 | ||
| 523 | SPS Commerce, Inc. (a) | 79,653 | ||
| 236 | Tyler Technologies, Inc. (a) | 83,695 | ||
| 2,782 | Varonis Systems, Inc. (a) | 72,360 | ||
| 5,627,450 | ||||
| Shares | Description | Value | ||
| COMMON STOCKS (Continued) | ||||
| Specialty Retail – 2.4% | ||||
| 375 | Five Below, Inc. (a) | $77,239 | ||
| 949 | Home Depot (The), Inc. | 280,069 | ||
| 376 | Lowe’s Cos., Inc. | 75,189 | ||
| 1,099 | TJX (The) Cos., Inc. | 86,117 | ||
| 572 | Tractor Supply Co. | 134,443 | ||
| 147 | Ulta Beauty, Inc. (a) | 80,213 | ||
| 733,270 | ||||
| Technology Hardware, Storage & Peripherals – 13.9% | ||||
| 24,399 | Apple, Inc. | 4,023,395 | ||
| 1,177 | NetApp, Inc. | 75,152 | ||
| 1,400 | Seagate Technology Holdings PLC | 92,568 | ||
| 4,191,115 | ||||
| Textiles, Apparel & Luxury Goods – 0.6% | ||||
| 621 | Crocs, Inc. (a) | 78,519 | ||
| 716 | NIKE, Inc., Class B | 87,810 | ||
| 166,329 | ||||
| Tobacco – 0.3% | ||||
| 782 | Philip Morris International, Inc. | 76,049 | ||
| Trading Companies & Distributors – 0.1% | ||||
| 2,494 | Xometry, Inc., Class A (a) | 37,335 | ||
| Wireless Telecommunication Services – 1.6% | ||||
| 3,288 | T-Mobile US, Inc. (a) | 476,234 | ||
Total Common Stocks | 30,654,951 | |||
| (Cost $28,827,569) | ||||
| REAL ESTATE INVESTMENT TRUSTS – 2.1% | ||||
| Specialized REITs – 2.1% | ||||
| 780 | American Tower Corp. | 159,385 | ||
| 921 | Crown Castle, Inc. | 123,267 | ||
| 379 | Equinix, Inc. | 273,274 | ||
| 297 | SBA Communications Corp. | 77,538 | ||
Total Real Estate Investment Trusts | 633,464 | |||
| (Cost $612,608) | ||||
Total Investments – 104.0% | 31,288,415 | |||
| (Cost $29,440,177) | ||||
| Number of Contracts | Description | Notional Amount | Exercise Price | Expiration Date | Value | |||||
| CALL OPTIONS WRITTEN – (5.3)% | ||||||||||
| (7) | Nasdaq-100 Index® | $(9,226,945) | $12,250.00 | 04/21/23 | (655,053) | |||||
| (6) | Nasdaq-100 Index® | (7,908,810) | 12,500.00 | 04/21/23 | (459,624) | |||||
| (4) | Nasdaq-100 Index® | (5,272,540) | 12,750.00 | 04/21/23 | (205,340) | |||||
| (4) | Nasdaq-100 Index® | (5,272,540) | 12,750.00 | 05/19/23 | (262,240) | |||||
Total Call Options Written | (1,582,257) | |||||||||
| (Premiums received $759,410) | ||||||||||
Net Other Assets and Liabilities – 1.3% | 366,341 | ||
Net Assets – 100.0% | $30,072,499 |
| (a) | Non-income producing security. |
| (b) | All or a portion of this security is pledged as collateral for the options written. At March 31, 2023, the segregated value of these securities amounts to $4,930,600. |
| ADR | American Depositary Receipt |
| ASSETS TABLE | ||||
| Total Value at 3/31/2023 | Level 1 Quoted Prices | Level 2 Significant Observable Inputs | Level 3 Significant Unobservable Inputs | |
Common Stocks* | $ 30,654,951 | $ 30,654,951 | $ — | $ — |
Real Estate Investment Trusts* | 633,464 | 633,464 | — | — |
Total Investments | $ 31,288,415 | $ 31,288,415 | $— | $— |
| LIABILITIES TABLE | ||||
| Total Value at 3/31/2023 | Level 1 Quoted Prices | Level 2 Significant Observable Inputs | Level 3 Significant Unobservable Inputs | |
Call Options Written | $ (1,582,257) | $ (1,582,257) | $ — | $ — |
| * | See Portfolio of Investments for industry breakout. |
| Shares | Description | Value | ||
| COMMON STOCKS – 99.8% | ||||
| Banks – 15.7% | ||||
| 5,307,007 | Bank of America Corp. | $151,780,400 | ||
| 4,779,604 | Citizens Financial Group, Inc. | 145,156,574 | ||
| 3,383,777 | Comerica, Inc. | 146,923,597 | ||
| 14,264,849 | Huntington Bancshares, Inc. | 159,766,309 | ||
| 1,172,093 | JPMorgan Chase & Co. | 152,735,439 | ||
| 1,192,194 | PNC Financial Services Group (The), Inc. | 151,527,857 | ||
| 2,900,651 | Popular, Inc. | 166,526,374 | ||
| 8,244,713 | Regions Financial Corp. | 153,021,873 | ||
| 1,227,438,423 | ||||
| Capital Markets – 4.0% | ||||
| 485,928 | Goldman Sachs Group (The), Inc. | 158,951,908 | ||
| 1,752,180 | Morgan Stanley | 153,841,404 | ||
| 312,793,312 | ||||
| Chemicals – 1.9% | ||||
| 2,079,499 | CF Industries Holdings, Inc. | 150,742,883 | ||
| Communications Equipment – 2.0% | ||||
| 2,938,795 | Cisco Systems, Inc. | 153,625,509 | ||
| Consumer Finance – 8.0% | ||||
| 942,361 | American Express Co. | 155,442,447 | ||
| 1,644,171 | Capital One Financial Corp. | 158,103,483 | ||
| 1,599,070 | Discover Financial Services | 158,052,079 | ||
| 5,177,191 | Synchrony Financial | 150,552,714 | ||
| 622,150,723 | ||||
| Financial Services – 8.0% | ||||
| 6,287,266 | Equitable Holdings, Inc. | 159,633,684 | ||
| 421,834 | Mastercard, Inc., Class A | 153,298,694 | ||
| 11,904,592 | MGIC Investment Corp. | 159,759,625 | ||
| 678,497 | Visa, Inc., Class A | 152,973,933 | ||
| 625,665,936 | ||||
| Food Products – 2.0% | ||||
| 1,986,246 | Archer-Daniels-Midland Co. | 158,224,356 | ||
| Health Care Equipment & Supplies – 2.0% | ||||
| 1,520,830 | Abbott Laboratories | 153,999,246 | ||
| Health Care Providers & Services – 3.7% | ||||
| 318,452 | Elevance Health, Inc. | 146,427,414 | ||
| 297,644 | Humana, Inc. | 144,494,256 | ||
| 290,921,670 | ||||
| Household Durables – 1.9% | ||||
| 1,424,688 | Lennar Corp., Class A | 149,748,956 | ||
| Insurance – 4.0% | ||||
| 2,406,564 | Aflac, Inc. | 155,271,509 | ||
| Shares | Description | Value | ||
| Insurance (Continued) | ||||
| 2,107,429 | Principal Financial Group, Inc. | $156,624,124 | ||
| 311,895,633 | ||||
| IT Services – 4.1% | ||||
| 589,994 | Accenture PLC, Class A | 168,626,185 | ||
| 2,552,321 | Cognizant Technology Solutions Corp., Class A | 155,512,919 | ||
| 324,139,104 | ||||
| Machinery – 4.0% | ||||
| 2,092,768 | Mueller Industries, Inc. | 153,776,593 | ||
| 636,481 | Snap-on, Inc. | 157,140,794 | ||
| 310,917,387 | ||||
| Media – 4.2% | ||||
| 4,372,911 | Interpublic Group of (The) Cos., Inc. | 162,847,205 | ||
| 1,710,499 | Omnicom Group, Inc. | 161,368,476 | ||
| 324,215,681 | ||||
| Metals & Mining – 8.2% | ||||
| 4,071,153 | Freeport-McMoRan, Inc. | 166,550,869 | ||
| 1,023,444 | Nucor Corp. | 158,091,395 | ||
| 613,352 | Reliance Steel & Aluminum Co. | 157,471,992 | ||
| 1,419,483 | Steel Dynamics, Inc. | 160,486,748 | ||
| 642,601,004 | ||||
| Oil, Gas & Consumable Fuels – 12.4% | ||||
| 969,067 | Chevron Corp. | 158,112,972 | ||
| 1,213,870 | Chord Energy Corp. | 163,386,902 | ||
| 2,391,733 | Civitas Resources, Inc. | 163,451,033 | ||
| 1,562,647 | ConocoPhillips | 155,030,209 | ||
| 1,477,721 | Exxon Mobil Corp. | 162,046,885 | ||
| 7,510,069 | Magnolia Oil & Gas Corp., Class A | 164,320,309 | ||
| 966,348,310 | ||||
| Paper & Forest Products – 1.9% | ||||
| 2,712,369 | Louisiana-Pacific Corp. | 147,037,523 | ||
| Pharmaceuticals – 1.9% | ||||
| 3,675,211 | Pfizer, Inc. | 149,948,609 | ||
| Semiconductors & Semiconductor Equipment – 6.0% | ||||
| 290,137 | Lam Research Corp. | 153,807,426 | ||
| 2,603,219 | Micron Technology, Inc. | 157,078,235 | ||
| 839,443 | Texas Instruments, Inc. | 156,144,792 | ||
| 467,030,453 | ||||
| Software – 1.9% | ||||
| 527,852 | Microsoft Corp. | 152,179,732 | ||
| Shares | Description | Value | ||
| COMMON STOCKS (Continued) | ||||
| Technology Hardware, Storage & Peripherals – 2.0% | ||||
| 2,399,520 | NetApp, Inc. | $153,209,352 | ||
| Total Investments – 99.8% | 7,794,833,802 | |||
| (Cost $7,780,351,561) | ||||
| Net Other Assets and Liabilities – 0.2% | 12,537,508 | |||
| Net Assets – 100.0% | $7,807,371,310 | |||
| Total Value at 3/31/2023 | Level 1 Quoted Prices | Level 2 Significant Observable Inputs | Level 3 Significant Unobservable Inputs | |
| Common Stocks* | $ 7,794,833,802 | $ 7,794,833,802 | $ — | $ — |
| * | See Portfolio of Investments for industry breakout. |
| Shares | Description | Value | ||
| EXCHANGE-TRADED FUNDS – 99.8% | ||||
| Capital Markets (a) – 99.8% | ||||
| 12,309,910 | First Trust Consumer Discretionary AlphaDEX® Fund | $639,253,626 | ||
| 11,493,642 | First Trust Industrials/Producer Durables AlphaDEX® Fund | 638,471,813 | ||
| 9,738,120 | First Trust Materials AlphaDEX® Fund | 636,093,999 | ||
| 23,696,341 | First Trust Nasdaq Food & Beverage ETF | 636,957,646 | ||
| 9,950,938 | First Trust Nasdaq Semiconductor ETF | 644,920,292 | ||
| Total Investments – 99.8% | 3,195,697,376 | |||
| (Cost $3,145,616,040) | ||||
| Net Other Assets and Liabilities – 0.2% | 7,694,725 | |||
| Net Assets – 100.0% | $3,203,392,101 | |||
| (a) | Represents investments in affiliated funds. |
| Total Value at 3/31/2023 | Level 1 Quoted Prices | Level 2 Significant Observable Inputs | Level 3 Significant Unobservable Inputs | |
| Exchange-Traded Funds* | $ 3,195,697,376 | $ 3,195,697,376 | $ — | $ — |
| * | See Portfolio of Investments for industry breakout. |
| Shares | Description | Value | ||
| COMMON STOCKS – 99.8% | ||||
| Banks – 8.1% | ||||
| 29,065 | 1st Source Corp. | $1,254,155 | ||
| 67,409 | Associated Banc-Corp. | 1,212,014 | ||
| 64,131 | CNB Financial Corp. | 1,231,315 | ||
| 108,137 | First Commonwealth Financial Corp. | 1,344,143 | ||
| 63,755 | First Financial Bancorp | 1,387,946 | ||
| 33,904 | First Financial Corp. | 1,270,722 | ||
| 37,328 | First Merchants Corp. | 1,229,958 | ||
| 117,443 | FNB Corp. | 1,362,339 | ||
| 93,089 | Fulton Financial Corp. | 1,286,490 | ||
| 41,022 | German American Bancorp, Inc. | 1,368,904 | ||
| 33,139 | Heartland Financial USA, Inc. | 1,271,212 | ||
| 20,075 | Lakeland Financial Corp. | 1,257,498 | ||
| 42,236 | Mercantile Bank Corp. | 1,291,577 | ||
| 50,554 | Mid Penn Bancorp, Inc. | 1,294,688 | ||
| 46,625 | MidWestOne Financial Group, Inc. | 1,138,582 | ||
| 84,082 | Old National Bancorp | 1,212,462 | ||
| 10,988 | Park National Corp. | 1,302,847 | ||
| 54,558 | Peoples Bancorp, Inc. | 1,404,868 | ||
| 30,735 | QCR Holdings, Inc. | 1,349,574 | ||
| 17,869 | Wintrust Financial Corp. | 1,303,544 | ||
| 25,774,838 | ||||
| Commercial Services & Supplies – 6.5% | ||||
| 440,989 | Aris Water Solution, Inc., Class A (a) | 3,435,304 | ||
| 80,750 | Clean Harbors, Inc. (b) | 11,511,720 | ||
| 155,777 | Heritage-Crystal Clean, Inc. (b) | 5,547,219 | ||
| 20,494,243 | ||||
| Construction & Engineering – 38.8% | ||||
| 490,632 | APi Group Corp. (b) | 11,029,407 | ||
| 174,730 | Arcosa, Inc. | 11,027,210 | ||
| 121,871 | Argan, Inc. | 4,932,119 | ||
| 84,102 | Comfort Systems USA, Inc. | 12,275,528 | ||
| 361,641 | Construction Partners, Inc., Class A (b) | 9,742,609 | ||
| 103,355 | Dycom Industries, Inc. (b) | 9,679,196 | ||
| 67,475 | EMCOR Group, Inc. | 10,970,760 | ||
| 105,971 | MasTec, Inc. (b) | 10,007,901 | ||
| 328,731 | MDU Resources Group, Inc. | 10,019,721 | ||
| 55,730 | Northwest Pipe Co. (b) | 1,740,448 | ||
| 298,218 | Primoris Services Corp. | 7,354,056 | ||
| 66,696 | Quanta Services, Inc. | 11,114,222 | ||
| 269,427 | Sterling Infrastructure, Inc. (b) | 10,205,895 | ||
| 479,211 | Tutor Perini Corp. (b) | 2,956,732 | ||
| 123,055,804 | ||||
| Electrical Equipment – 18.8% | ||||
| 422,833 | Array Technologies, Inc. (b) | 9,251,586 | ||
| 81,754 | Atkore, Inc. (b) | 11,484,802 | ||
| 68,373 | Encore Wire Corp. | 12,671,568 | ||
| Shares | Description | Value | ||
| Electrical Equipment (Continued) | ||||
| 43,012 | Hubbell, Inc. | $10,465,250 | ||
| 180,751 | Powell Industries, Inc. | 7,698,185 | ||
| 347,207 | Shoals Technologies Group, Inc., Class A (b) | 7,912,848 | ||
| 59,484,239 | ||||
| Machinery – 27.6% | ||||
| 160,234 | Astec Industries, Inc. | 6,609,652 | ||
| 264,275 | Blue Bird Corp. (b) | 5,399,138 | ||
| 87,684 | Douglas Dynamics, Inc. | 2,796,243 | ||
| 203,179 | Federal Signal Corp. | 11,014,334 | ||
| 354,517 | Greenbrier (The) Cos., Inc. | 11,404,812 | ||
| 827,258 | Mueller Water Products, Inc., Class A | 11,531,976 | ||
| 367,118 | Proto Labs, Inc. (b) | 12,169,962 | ||
| 42,936 | RBC Bearings, Inc. (b) | 9,992,495 | ||
| 285,348 | Shyft Group (The), Inc. | 6,491,667 | ||
| 141,408 | SPX Technologies, Inc. (b) | 9,980,577 | ||
| 87,390,856 | ||||
| Total Common Stocks | 316,199,980 | |||
| (Cost $291,836,638) | ||||
| MONEY MARKET FUNDS – 0.0% | ||||
| 76,678 | Goldman Sachs Financial Square Treasury Obligations Fund - Institutional Class - 4.69% (c) (d) | 76,678 | ||
| (Cost $76,678) | ||||
| Principal Value | Description | Value | ||
| REPURCHASE AGREEMENTS – 0.0% | ||||
| $12,344 | BNP Paribas S.A., 4.74% (c), dated 3/31/23, due 4/3/23, with a maturity value of $12,349. Collateralized by U.S. Treasury Notes, interest rates of 1.50% to 2.13%, due 5/15/25 to 11/30/28. The value of the collateral including accrued interest is $12,629. (d) | 12,344 | ||
| (Cost $12,344) | ||||
| Total Investments – 99.8% | 316,289,002 | |||
| (Cost $291,925,660) | ||||
| Net Other Assets and Liabilities – 0.2% | 597,590 | |||
| Net Assets – 100.0% | $316,886,592 | |||
| (a) | All or a portion of this security is on loan (see Note 2G - Securities Lending in the Notes to Financial Statements). The remaining contractual maturity of all of the securities lending transactions is overnight and continuous. The aggregate value of such securities is $86,469 and the total value of the collateral held by the Fund is $89,022. |
| (b) | Non-income producing security. |
| (c) | Rate shown reflects yield as of March 31, 2023. |
| (d) | This security serves as collateral for securities on loan. |
| Securities Lending Agency Agreement | |
| Total gross amount presented on the Statements of Assets and Liabilities (1) | $86,469 |
| Non-cash Collateral (2) | (86,469) |
| Net Amount | $— |
| (1) | The amount presented on the Statements of Assets and Liabilities, which is included in “Investments, at value,” is not offset and is shown on a gross basis. |
| (2) | At March 31, 2023, the value of the collateral received from each borrower exceeded the value of the related securities loaned. This amount is disclosed on the Portfolio of Investments. |
| Repurchase Agreements | |
| Total gross amount presented on the Statements of Assets and Liabilities (3) | $12,344 |
| Non-cash Collateral (4) | (12,344) |
| Net Amount | $— |
| (3) | The amount is included in “Investments, at value” on the Statements of Assets and Liabilities. |
| (4) | At March 31, 2023, the value of the collateral received from each seller exceeded the value of the repurchase agreements. |
| Total Value at 3/31/2023 | Level 1 Quoted Prices | Level 2 Significant Observable Inputs | Level 3 Significant Unobservable Inputs | |
| Common Stocks* | $ 316,199,980 | $ 316,199,980 | $ — | $ — |
| Money Market Funds | 76,678 | 76,678 | — | — |
| Repurchase Agreements | 12,344 | — | 12,344 | — |
| Total Investments | $ 316,289,002 | $ 316,276,658 | $ 12,344 | $— |
| * | See Portfolio of Investments for industry breakout. |
| Shares | Description | Value | ||
| COMMON STOCKS – 68.2% | ||||
| Banks – 7.3% | ||||
| 18,843 | Bank OZK | $644,431 | ||
| 20,983 | Home BancShares, Inc. | 455,541 | ||
| 89,237 | Huntington Bancshares, Inc. | 999,454 | ||
| 44,508 | Regions Financial Corp. | 826,068 | ||
| 22,533 | United Bankshares, Inc. | 793,162 | ||
| 3,718,656 | ||||
| Beverages – 1.0% | ||||
| 9,983 | Molson Coors Beverage Co., Class B | 515,922 | ||
| Biotechnology – 2.0% | ||||
| 6,401 | AbbVie, Inc. | 1,020,127 | ||
| Capital Markets – 7.4% | ||||
| 42,824 | Franklin Resources, Inc. | 1,153,678 | ||
| 1,224 | Goldman Sachs Group (The), Inc. | 400,383 | ||
| 59,382 | Invesco, Ltd. | 973,865 | ||
| 13,381 | Jefferies Financial Group, Inc. | 424,713 | ||
| 9,769 | Morgan Stanley | 857,718 | ||
| 3,810,357 | ||||
| Chemicals – 1.1% | ||||
| 18,090 | Chemours (The) Co. | 541,615 | ||
| Communications Equipment – 1.1% | ||||
| 11,092 | Cisco Systems, Inc. | 579,834 | ||
| Consumer Finance – 6.1% | ||||
| 72,937 | OneMain Holdings, Inc. | 2,704,504 | ||
| 13,702 | Synchrony Financial | 398,454 | ||
| 3,102,958 | ||||
| Food Products – 1.9% | ||||
| 25,165 | Kraft Heinz (The) Co. | 973,131 | ||
| Gas Utilities – 1.0% | ||||
| 9,193 | National Fuel Gas Co. | 530,804 | ||
| Hotels, Restaurants & Leisure – 1.2% | ||||
| 3,984 | Darden Restaurants, Inc. | 618,158 | ||
| Independent Power & Renewable Electricity Producers – 1.7% | ||||
| 37,278 | Vistra Corp. | 894,672 | ||
| Insurance – 5.1% | ||||
| 5,941 | MetLife, Inc. | 344,222 | ||
| 5,617 | Principal Financial Group, Inc. | 417,455 | ||
| 14,404 | Prudential Financial, Inc. | 1,191,787 | ||
| 16,247 | Unum Group | 642,731 | ||
| 2,596,195 | ||||
| Shares | Description | Value | ||
| Media – 1.5% | ||||
| 20,076 | Interpublic Group of (The) Cos., Inc. | $747,630 | ||
| Oil, Gas & Consumable Fuels – 17.4% | ||||
| 204,010 | Antero Midstream Corp. | 2,140,065 | ||
| 3,922 | Chevron Corp. | 639,913 | ||
| 25,910 | DT Midstream, Inc. | 1,279,177 | ||
| 6,757 | Exxon Mobil Corp. | 740,973 | ||
| 91,249 | Kinder Morgan, Inc. | 1,597,770 | ||
| 22,728 | ONEOK, Inc. | 1,444,137 | ||
| 10,938 | Phillips 66 | 1,108,894 | ||
| 8,950,929 | ||||
| Pharmaceuticals – 4.4% | ||||
| 8,653 | Bristol-Myers Squibb Co. | 599,739 | ||
| 16,864 | Pfizer, Inc. | 688,051 | ||
| 102,180 | Viatris, Inc. | 982,972 | ||
| 2,270,762 | ||||
| Semiconductors & Semiconductor Equipment – 2.2% | ||||
| 1,117 | Broadcom, Inc. | 716,600 | ||
| 2,319 | Texas Instruments, Inc. | 431,358 | ||
| 1,147,958 | ||||
| Textiles, Apparel & Luxury Goods – 0.9% | ||||
| 11,046 | Tapestry, Inc. | 476,193 | ||
| Tobacco – 2.7% | ||||
| 14,352 | Philip Morris International, Inc. | 1,395,732 | ||
| Trading Companies & Distributors – 2.2% | ||||
| 3,464 | Watsco, Inc. | 1,102,106 | ||
| Total Common Stocks | 34,993,739 | |||
| (Cost $35,986,980) | ||||
| REAL ESTATE INVESTMENT TRUSTS – 31.2% | ||||
| Mortgage Real Estate Investment Trusts – 4.9% | ||||
| 140,914 | Starwood Property Trust, Inc. | 2,492,769 | ||
| Retail REITs – 14.5% | ||||
| 66,238 | Kimco Realty Corp. | 1,293,628 | ||
| 30,875 | National Retail Properties, Inc. | 1,363,131 | ||
| 20,433 | Regency Centers Corp. | 1,250,091 | ||
| 15,156 | Simon Property Group, Inc. | 1,697,018 | ||
| 46,492 | Spirit Realty Capital, Inc. | 1,852,241 | ||
| 7,456,109 | ||||
| Specialized REITs – 11.8% | ||||
| 31,540 | Gaming and Leisure Properties, Inc. | 1,641,972 | ||
| 29,042 | Iron Mountain, Inc. | 1,536,612 | ||
| Shares | Description | Value | ||
| REAL ESTATE INVESTMENT TRUSTS (Continued) | ||||
| Specialized REITs (Continued) | ||||
| 14,694 | Lamar Advertising Co., Class A | $1,467,784 | ||
| 44,086 | VICI Properties, Inc. | 1,438,085 | ||
| 6,084,453 | ||||
| Total Real Estate Investment Trusts | 16,033,331 | |||
| (Cost $17,641,250) | ||||
| Total Investments – 99.4% | 51,027,070 | |||
| (Cost $53,628,230) | ||||
| Net Other Assets and Liabilities – 0.6% | 288,910 | |||
| Net Assets – 100.0% | $51,315,980 | |||
| Total Value at 3/31/2023 | Level 1 Quoted Prices | Level 2 Significant Observable Inputs | Level 3 Significant Unobservable Inputs | |
| Common Stocks* | $ 34,993,739 | $ 34,993,739 | $ — | $ — |
| Real Estate Investment Trusts* | 16,033,331 | 16,033,331 | — | — |
| Total Investments | $ 51,027,070 | $ 51,027,070 | $— | $— |
| * | See Portfolio of Investments for industry breakout. |
| Shares | Description | Value | ||
| EXCHANGE-TRADED FUNDS – 99.9% | ||||
| Capital Markets (a) – 99.9% | ||||
| 1,898,905 | First Trust Dow Jones Global Select Dividend Index Fund | $41,984,790 | ||
| 951,825 | First Trust India NIFTY 50 Equal Weight ETF | 39,967,132 | ||
| 988,597 | First Trust Japan AlphaDEX® Fund | 44,810,037 | ||
| 2,613,963 | First Trust Latin America AlphaDEX® Fund | 45,232,016 | ||
| 755,642 | First Trust Switzerland AlphaDEX® Fund | 46,068,999 | ||
| Total Investments – 99.9% | 218,062,974 | |||
| (Cost $215,343,107) | ||||
| Net Other Assets and Liabilities – 0.1% | 121,289 | |||
| Net Assets – 100.0% | $218,184,263 | |||
| (a) | Represents investments in affiliated funds. |
| Total Value at 3/31/2023 | Level 1 Quoted Prices | Level 2 Significant Observable Inputs | Level 3 Significant Unobservable Inputs | |
| Exchange-Traded Funds* | $ 218,062,974 | $ 218,062,974 | $ — | $ — |
| * | See Portfolio of Investments for industry breakout. |
| Shares | Description | Value | ||
| EXCHANGE-TRADED FUNDS – 99.8% | ||||
| Capital Markets (a) – 99.8% | ||||
| 658,962 | First Trust Consumer Discretionary AlphaDEX® Fund | $34,219,897 | ||
| 1,376,397 | First Trust Enhanced Short Maturity ETF | 81,909,386 | ||
| 615,268 | First Trust Industrials/Producer Durables AlphaDEX® Fund | 34,178,137 | ||
| 521,292 | First Trust Materials AlphaDEX® Fund | 34,050,793 | ||
| 1,268,489 | First Trust Nasdaq Food & Beverage ETF | 34,096,984 | ||
| 532,684 | First Trust Nasdaq Semiconductor ETF | 34,523,250 | ||
| Total Investments – 99.8% | 252,978,447 | |||
| (Cost $248,306,884) | ||||
| Net Other Assets and Liabilities – 0.2% | 567,404 | |||
| Net Assets – 100.0% | $253,545,851 | |||
| (a) | Represents investments in affiliated funds. |
| Total Value at 3/31/2023 | Level 1 Quoted Prices | Level 2 Significant Observable Inputs | Level 3 Significant Unobservable Inputs | |
| Exchange-Traded Funds* | $ 252,978,447 | $ 252,978,447 | $ — | $ — |
| * | See Portfolio of Investments for industry breakout. |
| Shares | Description | Value | ||
| COMMON STOCKS – 99.2% | ||||
| Aerospace & Defense – 2.4% | ||||
| 7,112 | Airbus SE (a) | $949,932 | ||
| 4,650 | Boeing (The) Co. (b) | 987,800 | ||
| 1,967 | Lockheed Martin Corp. | 929,860 | ||
| 2,867,592 | ||||
| Automobiles – 3.4% | ||||
| 8,896 | Bayerische Motoren Werke AG (a) | 974,990 | ||
| 75,162 | Ford Motor Co. | 947,041 | ||
| 11,841 | Mercedes-Benz Group AG (a) | 910,606 | ||
| 5,412 | Tesla, Inc. (b) | 1,122,773 | ||
| 3,955,410 | ||||
| Banks – 22.5% | ||||
| 57,758 | ANZ Group Holdings Ltd. (a) | 890,058 | ||
| 88,402 | Axis Bank Ltd. (a) | 926,167 | ||
| 121,302 | Banco Bilbao Vizcaya Argentaria S.A. (a) (c) | 867,232 | ||
| 234,944 | Banco Santander S.A. (a) | 875,514 | ||
| 30,641 | Bank of America Corp. | 876,333 | ||
| 2,482,018 | Bank of China Ltd., Class H (a) | 951,524 | ||
| 1,537,049 | Bank of Communications Co., Ltd., Class H (a) | 966,657 | ||
| 480,763 | Barclays PLC (a) | 865,328 | ||
| 14,134 | BNP Paribas S.A. (a) | 844,048 | ||
| 267,290 | BOC Hong Kong Holdings Ltd. (a) | 832,142 | ||
| 3,105,637 | China CITIC Bank Corp., Ltd., Class H (a) | 1,562,329 | ||
| 183,873 | China Merchants Bank Co., Ltd., Class H (a) | 933,711 | ||
| 19,254 | Citigroup, Inc. | 902,820 | ||
| 37,800 | DBS Group Holdings Ltd. (a) | 939,774 | ||
| 243,740 | First Abu Dhabi Bank PJSC (a) | 856,066 | ||
| 14,140 | HDFC Bank, Ltd., ADR | 942,714 | ||
| 126,495 | HSBC Holdings PLC (a) | 859,724 | ||
| 71,258 | ICICI Bank, Ltd., ADR | 1,537,748 | ||
| 2,802,536 | Industrial & Commercial Bank of China Ltd., Class H (a) | 1,489,379 | ||
| 69,264 | ING Groep N.V., ADR (c) | 822,164 | ||
| 7,179 | JPMorgan Chase & Co. | 935,495 | ||
| 44,688 | Kotak Mahindra Bank Ltd. (a) | 944,564 | ||
| 389,901 | Lloyds Banking Group PLC, ADR | 904,570 | ||
| 117,359 | Nordea Bank Abp (a) | 1,253,983 | ||
| 1,480,634 | Postal Savings Bank of China Co., Ltd., Class H (a) (d) (e) | 878,100 | ||
| 9,512 | Royal Bank of Canada | 909,675 | ||
| 447,328 | Sberbank of Russia PJSC (a) (b) (f) (g) | 0 | ||
| 63,204 | Westpac Banking Corp. (a) | 920,225 | ||
| 26,488,044 | ||||
| Shares | Description | Value | ||
| Broadline Retail – 4.2% | ||||
| 17,556 | Alibaba Group Holding Ltd., ADR (b) | $1,793,872 | ||
| 15,866 | Amazon.com, Inc. (b) | 1,638,799 | ||
| 35,116 | JD.com, Inc., ADR | 1,541,241 | ||
| 4,973,912 | ||||
| Capital Markets – 6.5% | ||||
| 19,495 | Bank of New York Mellon (The) Corp. | 885,853 | ||
| 5,273 | CME Group, Inc. | 1,009,885 | ||
| 5,303 | Deutsche Boerse AG (a) | 1,032,548 | ||
| 2,735 | Goldman Sachs Group (The), Inc. | 894,646 | ||
| 10,637 | London Stock Exchange Group PLC (a) | 1,033,169 | ||
| 1,009 | Partners Group Holding AG (a) | 950,198 | ||
| 2,802 | S&P Global, Inc. | 966,045 | ||
| 43,637 | UBS Group AG (a) | 923,394 | ||
| 7,695,738 | ||||
| Communications Equipment – 3.0% | ||||
| 19,172 | Cisco Systems, Inc. | 1,002,216 | ||
| 197,418 | Nokia Oyj, ADR | 969,322 | ||
| 259,604 | Telefonaktiebolaget LM Ericsson, Class B (a) (c) | 1,521,754 | ||
| 3,493,292 | ||||
| Consumer Staples Distribution & Retail – 1.7% | ||||
| 19,805 | Kroger (The) Co. | 977,773 | ||
| 6,822 | Walmart, Inc. | 1,005,904 | ||
| 1,983,677 | ||||
| Diversified Telecommunication Services – 5.8% | ||||
| 79,892 | AT&T, Inc. | 1,537,921 | ||
| 64,202 | Deutsche Telekom AG (a) | 1,555,762 | ||
| 211,630 | Emirates Telecommunications Group Co., PJSC (a) | 1,271,569 | ||
| 2,341 | Swisscom AG (a) | 1,493,960 | ||
| 25,602 | Verizon Communications, Inc. | 995,662 | ||
| 6,854,874 | ||||
| Electric Utilities – 1.7% | ||||
| 82,708 | Iberdrola S.A. (a) | 1,030,360 | ||
| 11,158 | Verbund AG (a) | 970,554 | ||
| 2,000,914 | ||||
| Electronic Equipment, Instruments & Components – 0.8% | ||||
| 1,690 | Samsung SDI Co., Ltd. (a) | 959,986 | ||
| Financial Services – 3.3% | ||||
| 4,129 | Mastercard, Inc., Class A | 1,500,520 | ||
| Shares | Description | Value | ||
| COMMON STOCKS (Continued) | ||||
| Financial Services (Continued) | ||||
| 19,276 | PayPal Holdings, Inc. (b) | $1,463,820 | ||
| 4,253 | Visa, Inc., Class A | 958,881 | ||
| 3,923,221 | ||||
| Household Durables – 0.8% | ||||
| 10,811 | Sony Group Corp., ADR | 980,017 | ||
| Industrial Conglomerates – 2.0% | ||||
| 7,588 | Honeywell International, Inc. | 1,450,218 | ||
| 5,857 | Siemens AG (a) | 948,857 | ||
| 2,399,075 | ||||
| Insurance – 4.5% | ||||
| 85,873 | AIA Group Ltd. (a) | 900,581 | ||
| 3,976 | Allianz SE (a) | 917,804 | ||
| 16,770 | American International Group, Inc. | 844,537 | ||
| 29,415 | AXA S.A. (a) | 897,675 | ||
| 14,470 | MetLife, Inc. | 838,392 | ||
| 140,552 | Ping An Insurance Group Co. of China Ltd., Class H (a) | 909,261 | ||
| 5,308,250 | ||||
| Interactive Media & Services – 2.3% | ||||
| 11,134 | Baidu, Inc., ADR (b) | 1,680,343 | ||
| 21,598 | Tencent Holdings Ltd. (a) | 1,055,480 | ||
| 2,735,823 | ||||
| IT Services – 8.7% | ||||
| 5,635 | Accenture PLC, Class A | 1,610,539 | ||
| 7,704 | Capgemini SE (a) | 1,431,677 | ||
| 24,029 | Cognizant Technology Solutions Corp., Class A | 1,464,087 | ||
| 82,598 | Infosys Ltd., ADR | 1,440,509 | ||
| 11,601 | International Business Machines Corp. | 1,520,775 | ||
| 35,959 | Tata Consultancy Services Ltd. (a) | 1,409,516 | ||
| 309,435 | Wipro Ltd., ADR | 1,389,363 | ||
| 10,266,466 | ||||
| Marine Transportation – 1.0% | ||||
| 641 | AP Moller - Maersk A.S., Class B (a) | 1,165,152 | ||
| Metals & Mining – 1.6% | ||||
| 30,361 | BHP Group Ltd. (a) | 959,831 | ||
| 13,717 | Rio Tinto PLC, ADR (c) | 940,986 | ||
| 1,900,817 | ||||
| Multi-Utilities – 1.3% | ||||
| 98,215 | Engie S.A. (a) | 1,554,223 | ||
| Shares | Description | Value | ||
| Oil, Gas & Consumable Fuels – 0.8% | ||||
| 42,503 | Gazprom PJSC, ADR (a) (b) (f) (g) | $0 | ||
| 364,010 | Gazprom PJSC, ADR (a) (b) (f) (g) | 0 | ||
| 15,426 | Shell PLC, ADR | 887,612 | ||
| 887,612 | ||||
| Pharmaceuticals – 1.2% | ||||
| 8,739 | Zoetis, Inc. | 1,454,519 | ||
| Semiconductors & Semiconductor Equipment – 8.5% | ||||
| 17,418 | Advanced Micro Devices, Inc. (b) | 1,707,138 | ||
| 38,623 | Infineon Technologies AG (a) | 1,586,062 | ||
| 55,357 | Intel Corp. | 1,808,513 | ||
| 26,324 | Micron Technology, Inc. | 1,588,390 | ||
| 6,245 | NVIDIA Corp. | 1,734,674 | ||
| 16,467 | Taiwan Semiconductor Manufacturing Co., Ltd., ADR | 1,531,760 | ||
| 9,956,537 | ||||
| Software – 7.7% | ||||
| 5,801 | Microsoft Corp. | 1,672,428 | ||
| 16,849 | Oracle Corp. | 1,565,609 | ||
| 8,190 | Salesforce, Inc. (b) | 1,636,198 | ||
| 12,427 | SAP SE (a) | 1,569,164 | ||
| 12,369 | VMware, Inc., Class A (b) | 1,544,270 | ||
| 5,157 | Workday, Inc., Class A (b) | 1,065,127 | ||
| 9,052,796 | ||||
| Specialty Retail – 0.8% | ||||
| 3,249 | Home Depot (The), Inc. | 958,845 | ||
| Technology Hardware, Storage & Peripherals – 1.4% | ||||
| 32,201 | Samsung Electronics Co., Ltd. (a) | 1,592,370 | ||
| Wireless Telecommunication Services – 1.3% | ||||
| 128,000 | SoftBank Corp. (a) | 1,477,607 | ||
| Total Common Stocks | 116,886,769 | |||
| (Cost $121,750,768) | ||||
| MONEY MARKET FUNDS – 1.5% | ||||
| 1,800,849 | Goldman Sachs Financial Square Treasury Obligations Fund - Institutional Class - 4.69% (h) (i) | 1,800,849 | ||
| (Cost $1,800,849) | ||||
| Principal Value | Description | Value | ||
| REPURCHASE AGREEMENTS – 0.3% | ||||
| $289,901 | BNP Paribas S.A., 4.74% (h), dated 3/31/23, due 4/3/23, with a maturity value of $290,015. Collateralized by U.S. Treasury Notes, interest rates of 1.50% to 2.13%, due 5/15/25 to 11/30/28. The value of the collateral including accrued interest is $296,593. (i) | $289,901 | ||
| (Cost $289,901) | ||||
| Total Investments – 101.0% | 118,977,519 | |||
| (Cost $123,841,518) | ||||
| Net Other Assets and Liabilities – (1.0)% | (1,205,799) | |||
| Net Assets – 100.0% | $117,771,720 | |||
| (a) | This security is fair valued by the Advisor’s Pricing Committee in accordance with procedures approved by the Trust’s Board of Trustees and in accordance with provisions of the Investment Company Act of 1940 and rules thereunder, as amended. At March 31, 2023, securities noted as such are valued at $52,610,567 or 44.7% of net assets. Certain of these securities are fair valued using a factor provided by a third-party pricing service due to the change in value between the foreign markets’ close and the New York Stock Exchange close exceeding a certain threshold. On days when this threshold is not exceeded, these securities are typically valued at the last sale price on the exchange on which they are principally traded. |
| (b) | Non-income producing security. |
| (c) | All or a portion of this security is on loan (see Note 2G - Securities Lending in the Notes to Financial Statements). The remaining contractual maturity of all of the securities lending transactions is overnight and continuous. The aggregate value of such securities is $2,012,799 and the total value of the collateral held by the Fund is $2,090,750. |
| (d) | This security may be resold to qualified foreign investors and foreign institutional buyers under Regulation S of the Securities Act of 1933, as amended (the “1933 Act”). |
| (e) | This security is exempt from registration upon resale under Rule 144A of the 1933 Act and may be resold in transactions exempt from registration, normally to qualified institutional buyers. This security is not restricted on the foreign exchange where it trades freely without any additional registration. As such, it does not require the additional disclosure required of restricted securities. |
| (f) | Pursuant to procedures adopted by the Trust’s Board of Trustees, this security has been determined to be illiquid by First Trust Advisors L.P., the Fund’s advisor. |
| (g) | This security’s value was determined using significant unobservable inputs (see Note 2A – Portfolio Valuation in the Notes to Financial Statements). |
| (h) | Rate shown reflects yield as of March 31, 2023. |
| (i) | This security serves as collateral for securities on loan. |
| ADR | American Depositary Receipt |
| Securities Lending Agency Agreement | |
| Total gross amount presented on the Statements of Assets and Liabilities (1) | $2,012,799 |
| Non-cash Collateral (2) | (2,012,799) |
| Net Amount | $— |
| (1) | The amount presented on the Statements of Assets and Liabilities, which is included in “Investments, at value,” is not offset and is shown on a gross basis. |
| (2) | At March 31, 2023, the value of the collateral received from each borrower exceeded the value of the related securities loaned. This amount is disclosed on the Portfolio of Investments. |
| Repurchase Agreements | |
| Total gross amount presented on the Statements of Assets and Liabilities (3) | $289,901 |
| Non-cash Collateral (4) | (289,901) |
| Net Amount | $— |
| (3) | The amount is included in “Investments, at value” on the Statements of Assets and Liabilities. |
| (4) | At March 31, 2023, the value of the collateral received from each seller exceeded the value of the repurchase agreements. |
| Currency Exposure Diversification | % of Total Investments |
| United States Dollar | 55.0% |
| Euro | 17.0 |
| Hong Kong Dollar | 8.8 |
| Swiss Franc | 2.8 |
| Indian Rupee | 2.8 |
| Australian Dollar | 2.3 |
| British Pound Sterling | 2.3 |
| South Korean Won | 2.1 |
| United Arab Emirates Dirham | 1.8 |
| Swedish Krona | 1.3 |
| Japanese Yen | 1.2 |
| Danish Krone | 1.0 |
| Singapore Dollar | 0.8 |
| Canadian Dollar | 0.8 |
| Total | 100.0% |
| Total Value at 3/31/2023 | Level 1 Quoted Prices | Level 2 Significant Observable Inputs | Level 3 Significant Unobservable Inputs | |
| Common Stocks: | ||||
Aerospace & Defense | $ 2,867,592 | $ 1,917,660 | $ 949,932 | $ — |
Automobiles | 3,955,410 | 2,069,814 | 1,885,596 | — |
Banks | 26,488,044 | 7,831,519 | 18,656,525 | — * |
Capital Markets | 7,695,738 | 3,756,429 | 3,939,309 | — |
Communications Equipment | 3,493,292 | 1,971,538 | 1,521,754 | — |
Diversified Telecommunication Services | 6,854,874 | 2,533,583 | 4,321,291 | — |
Electric Utilities | 2,000,914 | — | 2,000,914 | — |
Electronic Equipment, Instruments & Components | 959,986 | — | 959,986 | — |
Industrial Conglomerates | 2,399,075 | 1,450,218 | 948,857 | — |
Insurance | 5,308,250 | 1,682,929 | 3,625,321 | — |
Interactive Media & Services | 2,735,823 | 1,680,343 | 1,055,480 | — |
IT Services | 10,266,466 | 7,425,273 | 2,841,193 | — |
Marine Transportation | 1,165,152 | — | 1,165,152 | — |
Metals & Mining | 1,900,817 | 940,986 | 959,831 | — |
Multi-Utilities | 1,554,223 | — | 1,554,223 | — |
Oil, Gas & Consumable Fuels | 887,612 | 887,612 | — | — * |
Semiconductors & Semiconductor Equipment | 9,956,537 | 8,370,475 | 1,586,062 | — |
Software | 9,052,796 | 7,483,632 | 1,569,164 | — |
Technology Hardware, Storage & Peripherals | 1,592,370 | — | 1,592,370 | — |
Wireless Telecommunication Services | 1,477,607 | — | 1,477,607 | — |
Other Industry Categories ** | 14,274,191 | 14,274,191 | — | — |
Money Market Funds | 1,800,849 | 1,800,849 | — | — |
Repurchase Agreements | 289,901 | — | 289,901 | — |
Total Investments | $ 118,977,519 | $ 66,077,051 | $ 52,900,468 | $ —* |
| * | Investment is valued at $0. |
| ** | See Portfolio of Investments for industry breakout. |
| Shares | Description | Value | ||
| COMMON STOCKS – 99.3% | ||||
| Aerospace & Defense – 6.0% | ||||
| 51,859 | AeroVironment, Inc. (a) | $4,753,396 | ||
| 26,219 | Elbit Systems Ltd. (b) | 4,465,374 | ||
| 1,855 | Northrop Grumman Corp. | 856,491 | ||
| 1,087,250 | QinetiQ Group PLC (b) | 4,367,963 | ||
| 14,443,224 | ||||
| Air Freight & Logistics – 0.4% | ||||
| 17,380 | GXO Logistics, Inc. (a) | 876,995 | ||
| Automobile Components – 8.4% | ||||
| 7,411 | Aptiv PLC (a) | 831,440 | ||
| 11,947 | Continental AG (b) | 895,182 | ||
| 16,000 | Denso Corp. (b) | 903,159 | ||
| 155,739 | Gentex Corp. | 4,365,364 | ||
| 496,801 | Luminar Technologies, Inc. (a) (c) | 3,224,238 | ||
| 15,459 | Magna International, Inc. | 828,139 | ||
| 112,539 | Mobileye Global, Inc., Class A (a) (c) | 4,869,563 | ||
| 212,451 | Valeo (b) | 4,359,449 | ||
| 20,276,534 | ||||
| Automobiles – 0.8% | ||||
| 91,745 | NIO, Inc., ADR (a) | 964,240 | ||
| 4,188 | Tesla, Inc. (a) | 868,842 | ||
| 1,833,082 | ||||
| Broadline Retail – 1.2% | ||||
| 9,814 | Alibaba Group Holding Ltd., ADR (a) | 1,002,795 | ||
| 9,143 | Amazon.com, Inc. (a) | 944,380 | ||
| 19,387 | JD.com, Inc., ADR | 850,895 | ||
| 2,798,070 | ||||
| Communications Equipment – 2.0% | ||||
| 92,210 | Ciena Corp. (a) | 4,842,869 | ||
| Consumer Staples Distribution & Retail – 0.3% | ||||
| 129,661 | Ocado Group PLC (a) (b) | 858,538 | ||
| Electrical Equipment – 3.5% | ||||
| 47,802 | ABB Ltd. (b) | 1,644,462 | ||
| 10,415 | Emerson Electric Co. | 907,563 | ||
| 76,600 | Mitsubishi Electric Corp. (b) | 915,380 | ||
| 31,600 | Nidec Corp. (b) | 1,644,496 | ||
| 5,410 | Rockwell Automation, Inc. | 1,587,564 | ||
| 9,891 | Schneider Electric SE (b) | 1,653,023 | ||
| 8,352,488 | ||||
| Electronic Equipment, Instruments & Components – 13.2% | ||||
| 33,644 | Cognex Corp. | 1,667,060 | ||
| Shares | Description | Value | ||
| Electronic Equipment, Instruments & Components (Continued) | ||||
| 169,664 | Delta Electronics, Inc. (b) | $1,683,345 | ||
| 58,652 | FARO Technologies, Inc. (a) | 1,443,426 | ||
| 169,720 | Halma PLC (b) | 4,685,376 | ||
| 399,221 | Hexagon AB, Class B (b) | 4,594,797 | ||
| 3,600 | Keyence Corp. (b) | 1,764,391 | ||
| 31,587 | National Instruments Corp. | 1,655,475 | ||
| 29,900 | Omron Corp. (b) | 1,749,954 | ||
| 338,200 | Topcon Corp. (b) | 4,576,379 | ||
| 85,409 | Trimble, Inc. (a) | 4,477,140 | ||
| 106,700 | Yokogawa Electric Corp. (b) | 1,737,453 | ||
| 5,313 | Zebra Technologies Corp., Class A (a) | 1,689,534 | ||
| 31,724,330 | ||||
| Health Care Equipment & Supplies – 1.9% | ||||
| 6,957 | Intuitive Surgical, Inc. (a) | 1,777,305 | ||
| 10,404 | Medtronic PLC | 838,771 | ||
| 15,824 | Omnicell, Inc. (a) | 928,394 | ||
| 3,277 | Stryker Corp. | 935,485 | ||
| 4,479,955 | ||||
| Health Care Technology – 0.3% | ||||
| 32,522 | Teladoc Health, Inc. (a) | 842,320 | ||
| Household Durables – 0.4% | ||||
| 10,300 | Sony Group Corp. (b) | 938,159 | ||
| Industrial Conglomerates – 0.4% | ||||
| 5,615 | Siemens AG (b) | 909,652 | ||
| Interactive Media & Services – 1.9% | ||||
| 9,567 | Alphabet, Inc., Class A (a) | 992,385 | ||
| 6,255 | Baidu, Inc., ADR (a) | 944,005 | ||
| 18,270 | Kakao Corp. (b) | 865,246 | ||
| 5,466 | NAVER Corp. (b) | 856,473 | ||
| 19,686 | Tencent Holdings Ltd. (b) | 962,041 | ||
| 4,620,150 | ||||
| IT Services – 2.7% | ||||
| 11,866 | Akamai Technologies, Inc. (a) | 929,108 | ||
| 311,960 | Atos SE (a) (b) | 3,869,958 | ||
| 6,663 | International Business Machines Corp. | 873,453 | ||
| 24,656 | Netcompany Group A.S. (a) (b) (d) (e) | 899,798 | ||
| 6,572,317 | ||||
| Life Sciences Tools & Services – 2.9% | ||||
| 22,323 | Illumina, Inc. (a) | 5,191,214 | ||
| Shares | Description | Value | ||
| COMMON STOCKS (Continued) | ||||
| Life Sciences Tools & Services (Continued) | ||||
| 3,928 | Tecan Group AG (b) | $1,720,620 | ||
| 6,911,834 | ||||
| Machinery – 10.8% | ||||
| 162,956 | 3D Systems Corp. (a) | 1,746,888 | ||
| 25,738 | ANDRITZ AG (b) | 1,741,541 | ||
| 39,454 | ATS Corp. (a) | 1,652,018 | ||
| 2,126,893 | AutoStore Holdings Ltd. (a) (b) (c) (d) (e) | 4,591,465 | ||
| 31,222 | Cargotec OYJ, Class B (b) | 1,519,909 | ||
| 88,200 | Daifuku Co., Ltd. (b) | 1,637,625 | ||
| 2,054 | Deere & Co. | 848,056 | ||
| 42,139 | Duerr AG (b) | 1,514,151 | ||
| 47,000 | FANUC Corp. (b) | 1,697,273 | ||
| 14,386 | John Bean Technologies Corp. | 1,572,246 | ||
| 39,300 | Kawasaki Heavy Industries, Ltd. (b) | 860,342 | ||
| 50,742 | Proto Labs, Inc. (a) | 1,682,097 | ||
| 68,600 | Shibaura Machine Co., Ltd. (b) | 1,638,697 | ||
| 48,109 | Valmet Oyj (b) | 1,561,801 | ||
| 40,700 | Yaskawa Electric Corp. (b) | 1,785,098 | ||
| 26,049,207 | ||||
| Pharmaceuticals – 0.4% | ||||
| 5,622 | Johnson & Johnson | 871,410 | ||
| Semiconductors & Semiconductor Equipment – 8.1% | ||||
| 10,963 | Advanced Micro Devices, Inc. (a) | 1,074,484 | ||
| 47,146 | Ambarella, Inc. (a) | 3,650,043 | ||
| 34,557 | Intel Corp. | 1,128,977 | ||
| 4,204 | KLA Corp. | 1,678,111 | ||
| 27,591 | Micron Technology, Inc. | 1,664,841 | ||
| 6,872 | NVIDIA Corp. | 1,908,836 | ||
| 8,938 | NXP Semiconductors N.V. | 1,666,714 | ||
| 12,914 | QUALCOMM, Inc. | 1,647,568 | ||
| 123,200 | Renesas Electronics Corp. (a) (b) | 1,784,036 | ||
| 18,322 | Taiwan Semiconductor Manufacturing Co., Ltd., ADR | 1,704,312 | ||
| 15,775 | Teradyne, Inc. | 1,695,970 | ||
| 19,603,892 | ||||
| Software – 32.7% | ||||
| 14,647 | ANSYS, Inc. (a) | 4,874,521 | ||
| 107,270 | Appian Corp., Class A (a) | 4,760,642 | ||
| 4,334 | Autodesk, Inc. (a) | 902,165 | ||
| 1,145,973 | BlackBerry Ltd. (a) | 5,225,637 | ||
| 4,381,022 | BrainChip Holdings Ltd. (a) (b) (c) | 1,409,707 | ||
| 196,918 | C3.ai, Inc., Class A (a) (c) | 6,610,537 | ||
| 23,046 | Cadence Design Systems, Inc. (a) | 4,841,734 | ||
| Shares | Description | Value | ||
| Software (Continued) | ||||
| 114,617 | Dassault Systemes SE (b) | $4,728,071 | ||
| 104,546 | Dynatrace, Inc. (a) | 4,422,296 | ||
| 3,456 | Microsoft Corp. | 996,365 | ||
| 21,439 | Nice Ltd., ADR (a) | 4,907,173 | ||
| 23,605 | Palo Alto Networks, Inc. (a) | 4,714,863 | ||
| 95,867 | Pegasystems, Inc. | 4,647,632 | ||
| 293,500 | PKSHA Technology, Inc. (a) (b) | 4,028,683 | ||
| 170,424 | PROS Holdings, Inc. (a) | 4,669,618 | ||
| 6,874 | PTC, Inc. (a) | 881,453 | ||
| 10,288 | ServiceNow, Inc. (a) | 4,781,039 | ||
| 12,223 | Synopsys, Inc. (a) | 4,721,134 | ||
| 299,623 | UiPath, Inc., Class A (a) | 5,261,380 | ||
| 225,012 | Veritone, Inc. (a) | 1,311,820 | ||
| 78,696,470 | ||||
| Technology Hardware, Storage & Peripherals – 0.7% | ||||
| 18,809 | Samsung Electronics Co., Ltd. (b) | 930,123 | ||
| 62,700 | Seiko Epson Corp. (b) (c) | 895,861 | ||
| 1,825,984 | ||||
| Wireless Telecommunication Services – 0.3% | ||||
| 21,300 | SoftBank Group Corp. (b) | 837,378 | ||
| Total Common Stocks | 239,164,858 | |||
| (Cost $248,597,828) | ||||
| REAL ESTATE INVESTMENT TRUSTS – 0.4% | ||||
| Specialized REITs – 0.4% | ||||
| 1,251 | Equinix, Inc. | 902,021 | ||
| (Cost $876,490) | ||||
| MONEY MARKET FUNDS – 6.3% | ||||
| 15,059,617 | Goldman Sachs Financial Square Treasury Obligations Fund - Institutional Class - 4.69% (f) (g) | 15,059,617 | ||
| (Cost $15,059,617) | ||||
| Principal Value | Description | Value | ||
| REPURCHASE AGREEMENTS – 1.0% | ||||
| $2,424,298 | BNP Paribas S.A., 4.74% (f), dated 3/31/23, due 4/3/23, with a maturity value of $2,425,255. Collateralized by U.S. Treasury Notes, interest rates of 1.50% to 2.13%, due 5/15/25 to 11/30/28. The value of the collateral including accrued interest is $2,480,263. (g) | $2,424,298 | ||
| (Cost $2,424,298) | ||||
| Total Investments – 107.0% | 257,550,794 | |||
| (Cost $266,958,233) | ||||
| Net Other Assets and Liabilities – (7.0)% | (16,860,473) | |||
| Net Assets – 100.0% | $240,690,321 | |||
| (a) | Non-income producing security. |
| (b) | This security is fair valued by the Advisor’s Pricing Committee in accordance with procedures approved by the Trust’s Board of Trustees and in accordance with provisions of the Investment Company Act of 1940 and rules thereunder, as amended. At March 31, 2023, securities noted as such are valued at $86,682,429 or 36.0% of net assets. Certain of these securities are fair valued using a factor provided by a third-party pricing service due to the change in value between the foreign markets’ close and the New York Stock Exchange close exceeding a certain threshold. On days when this threshold is not exceeded, these securities are typically valued at the last sale price on the exchange on which they are principally traded. |
| (c) | All or a portion of this security is on loan (see Note 2G - Securities Lending in the Notes to Financial Statements). The remaining contractual maturity of all of the securities lending transactions is overnight and continuous. The aggregate value of such securities is $18,124,198 and the total value of the collateral held by the Fund is $17,483,915. |
| (d) | This security may be resold to qualified foreign investors and foreign institutional buyers under Regulation S of the Securities Act of 1933, as amended (the “1933 Act”). |
| (e) | This security is exempt from registration upon resale under Rule 144A of the 1933 Act and may be resold in transactions exempt from registration, normally to qualified institutional buyers. This security is not restricted on the foreign exchange where it trades freely without any additional registration. As such, it does not require the additional disclosure required of restricted securities. |
| (f) | Rate shown reflects yield as of March 31, 2023. |
| (g) | This security serves as collateral for securities on loan. |
| ADR | American Depositary Receipt |
| Securities Lending Agency Agreement | |
| Total gross amount presented on the Statements of Assets and Liabilities (1) | $18,124,198 |
| Non-cash Collateral (2) | (17,483,915) |
| Net Amount | $ 640,283 |
| (1) | The amount presented on the Statements of Assets and Liabilities, which is included in “Investments, at value,” is not offset and is shown on a gross basis. |
| (2) | The collateral requirements are determined at the beginning of each business day based on the market value of the loaned securities from the end of the prior day. On March 31, 2023, the last business day of the period, there was sufficient collateral based on the end of day market value from the prior business day; however, as a result of market movement from March 30 to March 31, the value of the related securities loaned was above the collateral value received. See Note 2G - Securities Lending in the Notes to Financial Statements. |
| Repurchase Agreements | |
| Total gross amount presented on the Statements of Assets and Liabilities (3) | $2,424,298 |
| Non-cash Collateral (4) | (2,424,298) |
| Net Amount | $— |
| (3) | The amount is included in “Investments, at value” on the Statements of Assets and Liabilities. |
| (4) | At March 31, 2023, the value of the collateral received from each seller exceeded the value of the repurchase agreements. |
| Currency Exposure Diversification | % of Total Investments |
| United States Dollar | 65.7% |
| Japanese Yen | 11.4 |
| Euro | 8.8 |
| British Pound Sterling | 3.9 |
| Swedish Krona | 1.8 |
| Norwegian Krone | 1.8 |
| Israeli Shekel | 1.7 |
| Swiss Franc | 1.3 |
| South Korean Won | 1.0 |
| New Taiwan Dollar | 0.7 |
| Canadian Dollar | 0.6 |
| Australian Dollar | 0.5 |
| Hong Kong Dollar | 0.4 |
| Danish Krone | 0.4 |
| Total | 100.0% |
| Total Value at 3/31/2023 | Level 1 Quoted Prices | Level 2 Significant Observable Inputs | Level 3 Significant Unobservable Inputs | |
| Common Stocks: | ||||
Aerospace & Defense | $ 14,443,224 | $ 5,609,887 | $ 8,833,337 | $ — |
Automobile Components | 20,276,534 | 14,118,744 | 6,157,790 | — |
Consumer Staples Distribution & Retail | 858,538 | — | 858,538 | — |
Electrical Equipment | 8,352,488 | 2,495,127 | 5,857,361 | — |
Electronic Equipment, Instruments & Components | 31,724,330 | 10,932,635 | 20,791,695 | — |
Household Durables | 938,159 | — | 938,159 | — |
Industrial Conglomerates | 909,652 | — | 909,652 | — |
Interactive Media & Services | 4,620,150 | 1,936,390 | 2,683,760 | — |
IT Services | 6,572,317 | 1,802,561 | 4,769,756 | — |
Life Sciences Tools & Services | 6,911,834 | 5,191,214 | 1,720,620 | — |
Machinery | 26,049,207 | 7,501,305 | 18,547,902 | — |
Semiconductors & Semiconductor Equipment | 19,603,892 | 17,819,856 | 1,784,036 | — |
Software | 78,696,470 | 68,530,009 | 10,166,461 | — |
Technology Hardware, Storage & Peripherals | 1,825,984 | — | 1,825,984 | — |
Wireless Telecommunication Services | 837,378 | — | 837,378 | — |
Other Industry Categories* | 16,544,701 | 16,544,701 | — | — |
Real Estate Investment Trusts* | 902,021 | 902,021 | — | — |
Money Market Funds | 15,059,617 | 15,059,617 | — | — |
Repurchase Agreements | 2,424,298 | — | 2,424,298 | — |
Total Investments | $ 257,550,794 | $ 168,444,067 | $ 89,106,727 | $— |
| * | See Portfolio of Investments for industry breakout. |
| Shares | Description | Value | ||
| COMMON STOCKS – 99.3% | ||||
| Air Freight & Logistics – 1.9% | ||||
| 49,300 | SG Holdings Co., Ltd. (a) | $731,028 | ||
| Automobiles – 2.2% | ||||
| 13,817 | Kia Corp. (a) | 862,293 | ||
| Banks – 1.6% | ||||
| 10,381 | Toronto-Dominion Bank (The) | 621,785 | ||
| Beverages – 4.3% | ||||
| 5,619 | Carlsberg A.S., Class B (a) | 871,883 | ||
| 7,725 | Heineken N.V. (a) | 830,058 | ||
| 1,701,941 | ||||
| Biotechnology – 1.9% | ||||
| 3,824 | CSL Ltd. (a) | 740,596 | ||
| Capital Markets – 6.3% | ||||
| 4,132 | Deutsche Boerse AG (a) | 804,543 | ||
| 20,312 | Hong Kong Exchanges & Clearing Ltd. (a) | 900,324 | ||
| 49,900 | Japan Exchange Group, Inc. (a) | 763,164 | ||
| 2,468,031 | ||||
| Chemicals – 4.6% | ||||
| 8,921 | Croda International PLC (a) | 717,012 | ||
| 33,500 | Shin-Etsu Chemical Co., Ltd. (a) | 1,087,445 | ||
| 1,804,457 | ||||
| Consumer Staples Distribution & Retail – 2.0% | ||||
| 15,396 | Alimentation Couche-Tard, Inc. | 774,072 | ||
| Electrical Equipment – 4.3% | ||||
| 24,398 | ABB Ltd. (a) | 839,328 | ||
| 9,195 | Legrand S.A. (a) | 840,169 | ||
| 1,679,497 | ||||
| Electronic Equipment, Instruments & Components – 2.1% | ||||
| 15,100 | Hamamatsu Photonics K.K. (a) | 814,521 | ||
| Entertainment – 1.6% | ||||
| 16,100 | Nintendo Co., Ltd. (a) | 625,350 | ||
| Food Products – 3.8% | ||||
| 355 | Barry Callebaut AG (a) | 752,163 | ||
| 6,180 | Nestle S.A. (a) | 753,531 | ||
| 1,505,694 | ||||
| Ground Transportation – 1.7% | ||||
| 5,821 | Canadian National Railway Co. | 686,848 | ||
| Health Care Providers & Services – 2.0% | ||||
| 33,953 | Sonic Healthcare Ltd. (a) | 795,959 | ||
| Shares | Description | Value | ||
| Hotels, Restaurants & Leisure – 4.0% | ||||
| 29,676 | Aristocrat Leisure Ltd. (a) | $741,974 | ||
| 32,225 | Compass Group PLC (a) | 809,865 | ||
| 1,551,839 | ||||
| Household Products – 1.9% | ||||
| 9,804 | Reckitt Benckiser Group PLC (a) | 745,864 | ||
| Industrial Conglomerates – 1.6% | ||||
| 18,200 | Toshiba Corp. (a) | 611,148 | ||
| Insurance – 7.3% | ||||
| 4,656 | Intact Financial Corp. | 666,344 | ||
| 14,599 | Sampo Oyj, Class A (a) | 688,856 | ||
| 15,903 | Sun Life Financial, Inc. | 742,964 | ||
| 1,601 | Zurich Insurance Group AG (a) | 767,197 | ||
| 2,865,361 | ||||
| IT Services – 5.6% | ||||
| 8,600 | CGI, Inc. (b) | 828,820 | ||
| 27,600 | Nomura Research Institute Ltd. (a) | 645,501 | ||
| 4,700 | Obic Co., Ltd. (a) | 744,449 | ||
| 2,218,770 | ||||
| Leisure Products – 1.6% | ||||
| 30,000 | Bandai Namco Holdings, Inc. (a) | 646,774 | ||
| Machinery – 2.3% | ||||
| 4,123 | Schindler Holding AG (a) | 913,565 | ||
| Personal Care Products – 4.4% | ||||
| 2,147 | L’Oreal S.A. (a) | 959,371 | ||
| 14,869 | Unilever PLC (a) | 770,497 | ||
| 1,729,868 | ||||
| Pharmaceuticals – 7.2% | ||||
| 27,324 | Chugai Pharmaceutical Co., Ltd. (a) | 674,701 | ||
| 4,130 | Merck KGaA (a) | 769,976 | ||
| 8,594 | Novartis AG (a) | 789,089 | ||
| 2,028 | Roche Holding AG (a) | 579,486 | ||
| 2,813,252 | ||||
| Professional Services – 5.9% | ||||
| 27,644 | Bureau Veritas S.A. (a) | 794,281 | ||
| 306 | SGS S.A. (a) | 674,959 | ||
| 6,628 | Wolters Kluwer N.V. (a) | 836,696 | ||
| 2,305,936 | ||||
| Real Estate Management & Development – 1.7% | ||||
| 6,900 | Daito Trust Construction Co., Ltd. (a) | 687,446 | ||
| Software – 4.3% | ||||
| 480 | Constellation Software, Inc. | 902,432 | ||
| Shares | Description | Value | ||
| COMMON STOCKS (Continued) | ||||
| Software (Continued) | ||||
| 82,177 | Sage Group (The) PLC (a) | $788,607 | ||
| 1,691,039 | ||||
| Technology Hardware, Storage & Peripherals – 2.1% | ||||
| 16,820 | Samsung Electronics Co., Ltd. (a) | 831,765 | ||
| Textiles, Apparel & Luxury Goods – 4.9% | ||||
| 1,469 | Kering S.A. (a) | 958,417 | ||
| 1,051 | LVMH Moet Hennessy Louis Vuitton SE (a) | 964,722 | ||
| 1,923,139 | ||||
| Trading Companies & Distributors – 4.2% | ||||
| 11,297 | Brenntag SE (a) | 850,169 | ||
| 21,655 | Bunzl PLC (a) | 817,966 | ||
| 1,668,135 | ||||
| Total Investments – 99.3% | 39,015,973 | |||
| (Cost $36,602,054) | ||||
| Net Other Assets and Liabilities – 0.7% | 260,905 | |||
| Net Assets – 100.0% | $39,276,878 | |||
| (a) | This security is fair valued by the Advisor’s Pricing Committee in accordance with procedures approved by the Trust’s Board of Trustees and in accordance with provisions of the Investment Company Act of 1940 and rules thereunder, as amended. At March 31, 2023, securities noted as such are valued at $33,792,708 or 86.0% of net assets. Certain of these securities are fair valued using a factor provided by a third-party pricing service due to the change in value between the foreign markets’ close and the New York Stock Exchange close exceeding a certain threshold. On days when this threshold is not exceeded, these securities are typically valued at the last sale price on the exchange on which they are principally traded. |
| (b) | Non-income producing security. |
| Currency Exposure Diversification | % of Total Investments |
| Euro | 23.8% |
| Japanese Yen | 20.6 |
| Swiss Franc | 15.6 |
| Canadian Dollar | 13.4 |
| British Pound Sterling | 11.9 |
| Australian Dollar | 5.8 |
| South Korean Won | 4.4 |
| Hong Kong Dollar | 2.3 |
| Danish Krone | 2.2 |
| Total | 100.0% |
| Total Value at 3/31/2023 | Level 1 Quoted Prices | Level 2 Significant Observable Inputs | Level 3 Significant Unobservable Inputs | |
| Common Stocks: | ||||
| Banks | $ 621,785 | $ 621,785 | $ — | $ — |
| Consumer Staples Distribution & Retail | 774,072 | 774,072 | — | — |
| Ground Transportation | 686,848 | 686,848 | — | — |
| Insurance | 2,865,361 | 1,409,308 | 1,456,053 | — |
| IT Services | 2,218,770 | 828,820 | 1,389,950 | — |
| Software | 1,691,039 | 902,432 | 788,607 | — |
| Other Industry Categories* | 30,158,098 | — | 30,158,098 | — |
| Total Investments | $ 39,015,973 | $ 5,223,265 | $ 33,792,708 | $— |
| * | See Portfolio of Investments for industry breakout. |
| First Trust NASDAQ Technology Dividend Index Fund (TDIV) | Multi-Asset Diversified Income Index Fund (MDIV) | First Trust S&P International Dividend Aristocrats ETF (FID) | First Trust BuyWrite Income ETF (FTHI) | ||||
| ASSETS: | |||||||
Investments, at value - Unaffiliated | $ 1,730,524,216 | $ 339,325,113 | $ 75,989,496 | $ 159,251,114 | |||
Investments, at value - Affiliated | — | 90,848,618 | — | — | |||
Total investments, at value | 1,730,524,216 | 430,173,731 | 75,989,496 | 159,251,114 | |||
Cash | 1,332,118 | 1,041,106 | 1,064,775 | 2,751,086 | |||
Foreign currency | — | — | 32,067 | 253 | |||
| Receivables: | |||||||
Fund shares sold | 13,361,613 | 2,178,150 | — | 2,014,403 | |||
Dividends | 2,371,637 | 1,940,155 | 618,658 | 181,120 | |||
Dividend reclaims | 226,146 | — | 141,676 | 5,692 | |||
Investment securities sold | — | — | 946,115 | — | |||
Securities lending income | — | — | — | — | |||
Total Assets | 1,747,815,730 | 435,333,142 | 78,792,787 | 164,203,668 | |||
| LIABILITIES: | |||||||
Options written, at value | — | — | — | 4,422,467 | |||
Due to custodian | — | — | — | — | |||
Due to broker | — | — | — | 28,328 | |||
| Payables: | |||||||
Investment securities purchased | 13,340,384 | 2,163,304 | 978,998 | 2,035,085 | |||
Investment advisory fees | 686,849 | 175,926 | 38,495 | 104,522 | |||
Deferred foreign capital gains tax | — | — | — | — | |||
Fund shares redeemed | — | — | — | — | |||
Collateral for securities on loan | — | — | — | — | |||
Total Liabilities | 14,027,233 | 2,339,230 | 1,017,493 | 6,590,402 | |||
NET ASSETS | $1,733,788,497 | $432,993,912 | $77,775,294 | $157,613,266 | |||
| NET ASSETS consist of: | |||||||
Paid-in capital | $ 1,808,474,684 | $ 703,963,677 | $ 88,226,203 | $ 176,358,938 | |||
Par value | 320,550 | 296,000 | 49,500 | 78,242 | |||
Accumulated distributable earnings (loss) | (75,006,737) | (271,265,765) | (10,500,409) | (18,823,914) | |||
NET ASSETS | $1,733,788,497 | $432,993,912 | $77,775,294 | $157,613,266 | |||
NET ASSET VALUE, per share | $54.09 | $14.63 | $15.71 | $20.14 | |||
Number of shares outstanding (unlimited number of shares authorized, par value $0.01 per share) | 32,055,000 | 29,600,002 | 4,950,002 | 7,824,201 | |||
Investments, at cost - Unaffiliated | $1,551,683,672 | $336,574,316 | $79,899,738 | $155,640,934 | |||
Investments, at cost - Affiliated | $— | $108,928,601 | $— | $— | |||
Total investments, at cost | $1,551,683,672 | $445,502,917 | $79,899,738 | $155,640,934 | |||
Foreign currency, at cost (proceeds) | $— | $— | $32,024 | $262 | |||
Securities on loan, at value | $— | $— | $— | $— | |||
Premiums received on options written | $— | $— | $— | $2,341,683 |
| First Trust Nasdaq BuyWrite Income ETF (FTQI) | First Trust Rising Dividend Achievers ETF (RDVY) | First Trust Dorsey Wright Focus 5 ETF (FV) | First Trust RBA American Industrial Renaissance® ETF (AIRR) | First Trust Dorsey Wright Momentum & Dividend ETF (DDIV) | First Trust Dorsey Wright International Focus 5 ETF (IFV) | |||||
| $ 31,288,415 | $ 7,794,833,802 | $— | $ 316,289,002 | $ 51,027,070 | $— | |||||
| — | — | 3,195,697,376 | — | — | 218,062,974 | |||||
| 31,288,415 | 7,794,833,802 | 3,195,697,376 | 316,289,002 | 51,027,070 | 218,062,974 | |||||
| 380,240 | 7,261,140 | 3,119,296 | 760,206 | 82,335 | — | |||||
| — | — | — | — | — | — | |||||
| — | — | 2,255,856 | — | — | 1,707,738 | |||||
| 6,454 | 8,502,383 | 5,377,064 | 99,935 | 238,116 | 295,828 | |||||
| 1,189 | — | — | — | 3,076 | — | |||||
| — | 8,868,323 | — | — | 1,379,259 | — | |||||
| — | — | — | — | — | — | |||||
| 31,676,298 | 7,819,465,648 | 3,206,449,592 | 317,149,143 | 52,729,856 | 220,066,540 | |||||
| 1,582,257 | — | — | — | — | — | |||||
| — | — | — | — | — | 121,999 | |||||
| 754 | — | — | — | — | — | |||||
| — | — | 2,250,529 | — | — | 1,706,727 | |||||
| 20,788 | 3,214,496 | 806,962 | 173,529 | 26,970 | 53,551 | |||||
| — | — | — | — | — | — | |||||
| — | 8,879,842 | — | — | 1,386,906 | — | |||||
| — | — | — | 89,022 | — | — | |||||
| 1,603,799 | 12,094,338 | 3,057,491 | 262,551 | 1,413,876 | 1,882,277 | |||||
| $ 30,072,499 | $ 7,807,371,310 | $ 3,203,392,101 | $ 316,886,592 | $ 51,315,980 | $ 218,184,263 | |||||
| $ 32,509,955 | $ 8,619,244,207 | $ 3,743,756,540 | $ 327,236,715 | $ 81,884,477 | $ 375,253,464 | |||||
| 15,500 | 1,739,500 | 710,000 | 66,000 | 18,500 | 127,000 | |||||
| (2,452,956) | (813,612,397) | (541,074,439) | (10,416,123) | (30,586,997) | (157,196,201) | |||||
| $ 30,072,499 | $ 7,807,371,310 | $ 3,203,392,101 | $ 316,886,592 | $ 51,315,980 | $ 218,184,263 | |||||
| $19.40 | $44.88 | $45.12 | $48.01 | $27.74 | $17.18 | |||||
| 1,550,002 | 173,950,002 | 71,000,002 | 6,600,002 | 1,850,002 | 12,700,002 | |||||
| $29,440,177 | $7,780,351,561 | $— | $291,925,660 | $53,628,230 | $— | |||||
| $— | $— | $3,145,616,040 | $— | $— | $215,343,107 | |||||
| $29,440,177 | $7,780,351,561 | $3,145,616,040 | $291,925,660 | $53,628,230 | $215,343,107 | |||||
| $— | $— | $— | $— | $— | $— | |||||
| $— | $— | $— | $86,469 | $— | $— | |||||
| $759,410 | $— | $— | $— | $— | $— |
| First Trust Dorsey Wright Dynamic Focus 5 ETF (FVC) | First Trust Indxx Innovative Transaction & Process ETF (LEGR) | First Trust Nasdaq Artificial Intelligence and Robotics ETF (ROBT) | First Trust International Developed Capital Strength ETF (FICS) | ||||
| ASSETS: | |||||||
Investments, at value - Unaffiliated | $— | $ 118,977,519 | $ 257,550,794 | $ 39,015,973 | |||
Investments, at value - Affiliated | 252,978,447 | — | — | — | |||
Total investments, at value | 252,978,447 | 118,977,519 | 257,550,794 | 39,015,973 | |||
Cash | — | 57,605 | 243,571 | 14,238 | |||
Foreign currency | — | 322,349 | 406 | 11,698 | |||
| Receivables: | |||||||
Fund shares sold | — | — | — | — | |||
Dividends | 737,756 | 285,355 | 336,614 | 158,159 | |||
Dividend reclaims | — | 283,301 | 110,609 | 83,645 | |||
Investment securities sold | 1,642,727 | — | — | 15,583 | |||
Securities lending income | — | 754 | 54,291 | — | |||
Total Assets | 255,358,930 | 119,926,883 | 258,296,285 | 39,299,296 | |||
| LIABILITIES: | |||||||
Options written, at value | — | — | — | — | |||
Due to custodian | 98,372 | — | — | — | |||
Due to broker | — | — | — | — | |||
| Payables: | |||||||
Investment securities purchased | — | — | — | — | |||
Investment advisory fees | 68,398 | 60,651 | 122,049 | 22,418 | |||
Deferred foreign capital gains tax | — | 3,762 | — | — | |||
Fund shares redeemed | 1,646,309 | — | — | — | |||
Collateral for securities on loan | — | 2,090,750 | 17,483,915 | — | |||
Total Liabilities | 1,813,079 | 2,155,163 | 17,605,964 | 22,418 | |||
NET ASSETS | $253,545,851 | $117,771,720 | $240,690,321 | $39,276,878 | |||
| NET ASSETS consist of: | |||||||
Paid-in capital | $ 329,965,555 | $ 126,301,150 | $ 294,295,947 | $ 40,785,599 | |||
Par value | 77,000 | 31,500 | 56,500 | 12,500 | |||
Accumulated distributable earnings (loss) | (76,496,704) | (8,560,930) | (53,662,126) | (1,521,221) | |||
NET ASSETS | $253,545,851 | $117,771,720 | $240,690,321 | $39,276,878 | |||
NET ASSET VALUE, per share | $32.93 | $37.39 | $42.60 | $31.42 | |||
Number of shares outstanding (unlimited number of shares authorized, par value $0.01 per share) | 7,700,002 | 3,150,002 | 5,650,002 | 1,250,002 | |||
Investments, at cost - Unaffiliated | $— | $123,841,518 | $266,958,233 | $36,602,054 | |||
Investments, at cost - Affiliated | $248,306,884 | $— | $— | $— | |||
Total investments, at cost | $248,306,884 | $123,841,518 | $266,958,233 | $36,602,054 | |||
Foreign currency, at cost (proceeds) | $— | $322,986 | $406 | $11,689 | |||
Securities on loan, at value | $— | $2,012,799 | $18,124,198 | $— | |||
Premiums received on options written | $— | $— | $— | $— |
| First Trust NASDAQ Technology Dividend Index Fund (TDIV) | Multi-Asset Diversified Income Index Fund (MDIV) | First Trust S&P International Dividend Aristocrats ETF (FID) | First Trust BuyWrite Income ETF (FTHI) | |||||
| INVESTMENT INCOME: | ||||||||
Dividends - Unaffiliated | $ 21,961,141 | $ 11,873,159 | $ 1,470,048 | $ 1,360,331 | ||||
Dividends - Affiliated | — | 2,913,727 | — | — | ||||
Interest | 49,633 | 37,584 | — | 22,062 | ||||
Securities lending income (net of fees) | — | — | — | — | ||||
Foreign withholding tax | (561,726) | — | (138,361) | (5,818) | ||||
Other | 9 | 46 | 48 | 6 | ||||
Total investment income | 21,449,057 | 14,824,516 | 1,331,735 | 1,376,581 | ||||
| EXPENSES: | ||||||||
Investment advisory fees | 3,943,985 | 1,374,798 | 175,890 | 467,862 | ||||
Total expenses | 3,943,985 | 1,374,798 | 175,890 | 467,862 | ||||
Fees waived by the investment advisor | — | (275,752) | — | — | ||||
Net expenses | 3,943,985 | 1,099,046 | 175,890 | 467,862 | ||||
NET INVESTMENT INCOME (LOSS) | 17,505,072 | 13,725,470 | 1,155,845 | 908,719 | ||||
| NET REALIZED AND UNREALIZED GAIN (LOSS): | ||||||||
| Net realized gain (loss) on: | ||||||||
Investments - Unaffiliated | (40,328,996) | (24,166,400) | (1,254,384) | (3,458,595) | ||||
Investments - Affiliated | — | (629,431) | — | — | ||||
In-kind redemptions - Unaffiliated | 23,134,223 | 3,214,374 | — | 3,095,812 | ||||
In-kind redemptions - Affiliated | — | (130,228) | — | — | ||||
Written options contracts | — | — | — | 4,415,128 | ||||
Foreign currency transactions | — | — | 22,579 | — | ||||
Foreign capital gains tax | — | — | — | — | ||||
Net realized gain (loss) | (17,194,773) | (21,711,685) | (1,231,805) | 4,052,345 | ||||
| Net change in unrealized appreciation (depreciation) on: | ||||||||
Investments - Unaffiliated | 353,607,039 | 25,821,880 | 7,079,679 | 12,462,514 | ||||
Investments - Affiliated | — | 4,062,108 | — | — | ||||
Written options contracts | — | — | — | (3,912,849) | ||||
Foreign currency translation | — | — | 18,307 | 6 | ||||
Deferred foreign capital gains tax | — | — | — | — | ||||
Net change in unrealized appreciation (depreciation) | 353,607,039 | 29,883,988 | 7,097,986 | 8,549,671 | ||||
NET REALIZED AND UNREALIZED GAIN (LOSS) | 336,412,266 | 8,172,303 | 5,866,181 | 12,602,016 | ||||
NET INCREASE (DECREASE) IN NET ASSETS RESULTING FROM OPERATIONS | $ 353,917,338 | $ 21,897,773 | $ 7,022,026 | $ 13,510,735 | ||||
| First Trust Nasdaq BuyWrite Income ETF (FTQI) | First Trust Rising Dividend Achievers ETF (RDVY) | First Trust Dorsey Wright Focus 5 ETF (FV) | First Trust RBA American Industrial Renaissance® ETF (AIRR) | First Trust Dorsey Wright Momentum & Dividend ETF (DDIV) | First Trust Dorsey Wright International Focus 5 ETF (IFV) | First Trust Dorsey Wright Dynamic Focus 5 ETF (FVC) | |||||||
| $175,618 | $113,009,751 | $— | $1,122,194 | $1,805,309 | $— | $— | |||||||
| — | — | 28,739,748 | — | — | 2,357,124 | 3,728,306 | |||||||
| 10,513 | 245,230 | 154,882 | 6,322 | 2,714 | 25,244 | 26,703 | |||||||
| — | — | — | — | — | — | — | |||||||
| (112) | — | — | — | — | — | — | |||||||
| — | 23 | — | 19 | — | — | — | |||||||
| 186,019 | 113,255,004 | 28,894,630 | 1,128,535 | 1,808,023 | 2,382,368 | 3,755,009 | |||||||
| 124,682 | 19,561,079 | 4,681,400 | 823,462 | 192,761 | 263,580 | 398,886 | |||||||
| 124,682 | 19,561,079 | 4,681,400 | 823,462 | 192,761 | 263,580 | 398,886 | |||||||
| — | — | — | — | — | — | — | |||||||
| 124,682 | 19,561,079 | 4,681,400 | 823,462 | 192,761 | 263,580 | 398,886 | |||||||
| 61,337 | 93,693,925 | 24,213,230 | 305,073 | 1,615,262 | 2,118,788 | 3,356,123 | |||||||
| (334,225) | (658,005,171) | — | (7,589,382) | (5,481,184) | — | — | |||||||
| — | — | (21,652,736) | — | — | (15,581,420) | (22,323,635) | |||||||
| 512,292 | 72,177,998 | — | 8,751,368 | 703,156 | — | — | |||||||
| — | — | 13,608,990 | — | — | 406,145 | 2,898,829 | |||||||
| 535,854 | — | — | — | — | — | — | |||||||
| — | — | — | — | — | — | — | |||||||
| — | — | — | — | — | — | — | |||||||
| 713,921 | (585,827,173) | (8,043,746) | 1,161,986 | (4,778,028) | (15,175,275) | (19,424,806) | |||||||
| 4,401,763 | 1,714,590,143 | — | 43,828,362 | 8,054,055 | — | — | |||||||
| — | — | 249,042,763 | — | — | 24,917,948 | 13,573,013 | |||||||
| (1,203,844) | — | — | — | — | — | — | |||||||
| — | — | — | — | — | — | — | |||||||
| — | — | — | — | — | — | — | |||||||
| 3,197,919 | 1,714,590,143 | 249,042,763 | 43,828,362 | 8,054,055 | 24,917,948 | 13,573,013 | |||||||
| 3,911,840 | 1,128,762,970 | 240,999,017 | 44,990,348 | 3,276,027 | 9,742,673 | (5,851,793) | |||||||
| $3,973,177 | $1,222,456,895 | $265,212,247 | $45,295,421 | $4,891,289 | $11,861,461 | $(2,495,670) |
| First Trust Indxx Innovative Transaction & Process ETF (LEGR) | First Trust Nasdaq Artificial Intelligence and Robotics ETF (ROBT) | First Trust International Developed Capital Strength ETF (FICS) | ||||
| INVESTMENT INCOME: | ||||||
Dividends - Unaffiliated | $ 1,546,540 | $ 758,603 | $ 428,556 | |||
Dividends - Affiliated | — | — | — | |||
Interest | 2,873 | 9,635 | — | |||
Securities lending income (net of fees) | 3,247 | 161,619 | — | |||
Foreign withholding tax | (128,774) | (67,317) | (50,255) | |||
Other | 26 | 562 | 193 | |||
Total investment income | 1,423,912 | 863,102 | 378,494 | |||
| EXPENSES: | ||||||
Investment advisory fees | 359,494 | 626,486 | 106,330 | |||
Total expenses | 359,494 | 626,486 | 106,330 | |||
Fees waived by the investment advisor | — | — | — | |||
Net expenses | 359,494 | 626,486 | 106,330 | |||
NET INVESTMENT INCOME (LOSS) | 1,064,418 | 236,616 | 272,164 | |||
| NET REALIZED AND UNREALIZED GAIN (LOSS): | ||||||
| Net realized gain (loss) on: | ||||||
Investments - Unaffiliated | (795,393) | (18,309,058) | (2,901,534) | |||
Investments - Affiliated | — | — | — | |||
In-kind redemptions - Unaffiliated | 2,974,908 | 1,586,411 | 5,283 | |||
In-kind redemptions - Affiliated | — | — | — | |||
Written options contracts | — | — | — | |||
Foreign currency transactions | 10,359 | 8,720 | 33,343 | |||
Foreign capital gains tax | (11,508) | — | — | |||
Net realized gain (loss) | 2,178,366 | (16,713,927) | (2,862,908) | |||
| Net change in unrealized appreciation (depreciation) on: | ||||||
Investments - Unaffiliated | 20,748,849 | 62,053,738 | 8,073,886 | |||
Investments - Affiliated | — | — | — | |||
Written options contracts | — | — | — | |||
Foreign currency translation | 18,762 | 8,957 | 5,081 | |||
Deferred foreign capital gains tax | (20,645) | — | — | |||
Net change in unrealized appreciation (depreciation) | 20,746,966 | 62,062,695 | 8,078,967 | |||
NET REALIZED AND UNREALIZED GAIN (LOSS) | 22,925,332 | 45,348,768 | 5,216,059 | |||
NET INCREASE (DECREASE) IN NET ASSETS RESULTING FROM OPERATIONS | $ 23,989,750 | $ 45,585,384 | $ 5,488,223 | |||
| First Trust NASDAQ Technology Dividend Index Fund (TDIV) | Multi-Asset Diversified Income Index Fund (MDIV) | ||||||
| Six Months Ended 3/31/2023 (Unaudited) | Year Ended 9/30/2022 | Six Months Ended 3/31/2023 (Unaudited) | Year Ended 9/30/2022 | ||||
| OPERATIONS: | |||||||
Net investment income (loss) | $ 17,505,072 | $ 39,013,530 | $ 13,725,470 | $ 21,144,380 | |||
Net realized gain (loss) | (17,194,773) | 77,346,934 | (21,711,685) | 9,377,860 | |||
Net increase from payment by the advisor | — | — | — | — | |||
Net change in unrealized appreciation (depreciation) | 353,607,039 | (504,758,535) | 29,883,988 | (63,041,345) | |||
Net increase (decrease) in net assets resulting from operations | 353,917,338 | (388,398,071) | 21,897,773 | (32,519,105) | |||
| DISTRIBUTIONS TO SHAREHOLDERS FROM: | |||||||
Investment operations | (19,254,180) | (37,869,712) | (15,875,406) | (28,972,326) | |||
Return of capital | — | — | — | (634,126) | |||
Total distributions to shareholders | (19,254,180) | (37,869,712) | (15,875,406) | (29,606,452) | |||
| SHAREHOLDER TRANSACTIONS: | |||||||
Proceeds from shares sold | 57,201,416 | 585,823,081 | 37,930,273 | 136,630,172 | |||
Cost of shares redeemed | (88,687,034) | (342,711,470) | (57,059,672) | (98,607,101) | |||
Net increase (decrease) in net assets resulting from shareholder transactions | (31,485,618) | 243,111,611 | (19,129,399) | 38,023,071 | |||
Total increase (decrease) in net assets | 303,177,540 | (183,156,172) | (13,107,032) | (24,102,486) | |||
| NET ASSETS: | |||||||
Beginning of period | 1,430,610,957 | 1,613,767,129 | 446,100,944 | 470,203,430 | |||
End of period | $1,733,788,497 | $1,430,610,957 | $432,993,912 | $446,100,944 | |||
| CHANGES IN SHARES OUTSTANDING: | |||||||
Shares outstanding, beginning of period | 32,805,000 | 28,605,000 | 30,950,002 | 28,750,002 | |||
Shares sold | 1,100,000 | 10,150,000 | 2,500,000 | 8,450,000 | |||
Shares redeemed | (1,850,000) | (5,950,000) | (3,850,000) | (6,250,000) | |||
Shares outstanding, end of period | 32,055,000 | 32,805,000 | 29,600,002 | 30,950,002 | |||
| First Trust S&P International Dividend Aristocrats ETF (FID) | First Trust BuyWrite Income ETF (FTHI) | First Trust Nasdaq BuyWrite Income ETF (FTQI) | ||||||||
| Six Months Ended 3/31/2023 (Unaudited) | Year Ended 9/30/2022 | Six Months Ended 3/31/2023 (Unaudited) | Year Ended 9/30/2022 | Six Months Ended 3/31/2023 (Unaudited) | Year Ended 9/30/2022 | |||||
| $ 1,155,845 | $ 2,200,759 | $ 908,719 | $ 434,135 | $ 61,337 | $ 32,486 | |||||
| (1,231,805) | (407,597) | 4,052,345 | 1,233,335 | 713,921 | 528,556 | |||||
| — | — | — | — | — | — | |||||
| 7,097,986 | (12,316,027) | 8,549,671 | (11,115,307) | 3,197,919 | (2,670,841) | |||||
| 7,022,026 | (10,522,865) | 13,510,735 | (9,447,837) | 3,973,177 | (2,109,799) | |||||
| (829,765) | (2,134,072) | (4,738,974) | (4,161,738) | (1,682,602) | (627,504) | |||||
| — | — | — | — | — | (260,249) | |||||
| (829,765) | (2,134,072) | (4,738,974) | (4,161,738) | (1,682,602) | (887,753) | |||||
| 27,671,515 | 17,543,449 | 88,837,084 | 58,793,688 | 14,562,964 | 15,486,123 | |||||
| — | (3,114,320) | (29,522,467) | (2,232,301) | (5,668,602) | (3,127,943) | |||||
| 27,671,515 | 14,429,129 | 59,314,617 | 56,561,387 | 8,894,362 | 12,358,180 | |||||
| 33,863,776 | 1,772,192 | 68,086,378 | 42,951,812 | 11,184,937 | 9,360,628 | |||||
| 43,911,518 | 42,139,326 | 89,526,888 | 46,575,076 | 18,887,562 | 9,526,934 | |||||
| $77,775,294 | $43,911,518 | $157,613,266 | $89,526,888 | $30,072,499 | $18,887,562 | |||||
| 3,200,002 | 2,400,002 | 4,874,201 | 2,174,201 | 1,050,002 | 450,002 | |||||
| 1,750,000 | 1,000,000 | 4,500,000 | 2,800,000 | 800,000 | 750,000 | |||||
| — | (200,000) | (1,550,000) | (100,000) | (300,000) | (150,000) | |||||
| 4,950,002 | 3,200,002 | 7,824,201 | 4,874,201 | 1,550,002 | 1,050,002 | |||||
| First Trust Rising Dividend Achievers ETF (RDVY) | First Trust Dorsey Wright Focus 5 ETF (FV) | ||||||
| Six Months Ended 3/31/2023 (Unaudited) | Year Ended 9/30/2022 | Six Months Ended 3/31/2023 (Unaudited) | Year Ended 9/30/2022 | ||||
| OPERATIONS: | |||||||
Net investment income (loss) | $ 93,693,925 | $ 153,436,751 | $ 24,213,230 | $ 28,481,056 | |||
Net realized gain (loss) | (585,827,173) | 263,719,923 | (8,043,746) | 817,506,326 | |||
Net increase from payment by the advisor | — | — | — | — | |||
Net change in unrealized appreciation (depreciation) | 1,714,590,143 | (2,185,334,312) | 249,042,763 | (1,170,352,406) | |||
Net increase (decrease) in net assets resulting from operations | 1,222,456,895 | (1,768,177,638) | 265,212,247 | (324,365,024) | |||
| DISTRIBUTIONS TO SHAREHOLDERS FROM: | |||||||
Investment operations | (103,913,891) | (140,979,372) | (25,856,916) | (27,189,651) | |||
Return of capital | — | — | — | — | |||
Total distributions to shareholders | (103,913,891) | (140,979,372) | (25,856,916) | (27,189,651) | |||
| SHAREHOLDER TRANSACTIONS: | |||||||
Proceeds from shares sold | 117,683,723 | 5,962,228,272 | 492,114,821 | 2,838,226,345 | |||
Cost of shares redeemed | (719,630,196) | (2,501,951,722) | (120,883,441) | (2,588,053,448) | |||
Net increase (decrease) in net assets resulting from shareholder transactions | (601,946,473) | 3,460,276,550 | 371,231,380 | 250,172,897 | |||
Total increase (decrease) in net assets | 516,596,531 | 1,551,119,540 | 610,586,711 | (101,381,778) | |||
| NET ASSETS: | |||||||
Beginning of period | 7,290,774,779 | 5,739,655,239 | 2,592,805,390 | 2,694,187,168 | |||
End of period | $7,807,371,310 | $7,290,774,779 | $3,203,392,101 | $2,592,805,390 | |||
| CHANGES IN SHARES OUTSTANDING: | |||||||
Shares outstanding, beginning of period | 187,750,002 | 120,900,002 | 63,100,002 | 58,850,002 | |||
Shares sold | 2,600,000 | 120,450,000 | 10,500,000 | 59,550,000 | |||
Shares redeemed | (16,400,000) | (53,600,000) | (2,600,000) | (55,300,000) | |||
Shares outstanding, end of period | 173,950,002 | 187,750,002 | 71,000,002 | 63,100,002 | |||
| First Trust RBA American Industrial Renaissance® ETF (AIRR) | First Trust Dorsey Wright Momentum & Dividend ETF (DDIV) | First Trust Dorsey Wright International Focus 5 ETF (IFV) | ||||||||
| Six Months Ended 3/31/2023 (Unaudited) | Year Ended 9/30/2022 | Six Months Ended 3/31/2023 (Unaudited) | Year Ended 9/30/2022 | Six Months Ended 3/31/2023 (Unaudited) | Year Ended 9/30/2022 | |||||
| $ 305,073 | $ 225,149 | $ 1,615,262 | $ 1,982,242 | $ 2,118,788 | $ 5,854,400 | |||||
| 1,161,986 | 11,092,305 | (4,778,028) | 200,303 | (15,175,275) | (9,120,319) | |||||
| — | — | — | — | — | — | |||||
| 43,828,362 | (26,897,678) | 8,054,055 | (12,779,877) | 24,917,948 | (51,259,930) | |||||
| 45,295,421 | (15,580,224) | 4,891,289 | (10,597,332) | 11,861,461 | (54,525,849) | |||||
| (436,540) | (131,850) | (1,513,731) | (1,904,422) | (1,940,690) | (5,794,666) | |||||
| — | — | — | — | — | — | |||||
| (436,540) | (131,850) | (1,513,731) | (1,904,422) | (1,940,690) | (5,794,666) | |||||
| 138,811,251 | 67,434,447 | — | 79,279,112 | 83,381,526 | 2,531,736 | |||||
| (36,767,757) | (102,287,438) | (19,161,769) | (38,540,592) | (14,329,557) | (67,969,588) | |||||
| 102,043,494 | (34,852,991) | (19,161,769) | 40,738,520 | 69,051,969 | (65,437,852) | |||||
| 146,902,375 | (50,565,065) | (15,784,211) | 28,236,766 | 78,972,740 | (125,758,367) | |||||
| 169,984,217 | 220,549,282 | 67,100,191 | 38,863,425 | 139,211,523 | 264,969,890 | |||||
| $316,886,592 | $169,984,217 | $51,315,980 | $67,100,191 | $218,184,263 | $139,211,523 | |||||
| 4,450,002 | 5,400,002 | 2,500,002 | 1,250,002 | 8,650,002 | 11,650,002 | |||||
| 2,950,000 | 1,550,000 | — | 2,400,000 | 4,900,000 | 150,000 | |||||
| (800,000) | (2,500,000) | (650,000) | (1,150,000) | (850,000) | (3,150,000) | |||||
| 6,600,002 | 4,450,002 | 1,850,002 | 2,500,002 | 12,700,002 | 8,650,002 | |||||
| First Trust Dorsey Wright Dynamic Focus 5 ETF (FVC) | First Trust Indxx Innovative Transaction & Process ETF (LEGR) | ||||||
| Six Months Ended 3/31/2023 (Unaudited) | Year Ended 9/30/2022 | Six Months Ended 3/31/2023 (Unaudited) | Year Ended 9/30/2022 | ||||
| OPERATIONS: | |||||||
Net investment income (loss) | $ 3,356,123 | $ 2,056,794 | $ 1,064,418 | $ 3,986,062 | |||
Net realized gain (loss) | (19,424,806) | 51,807,908 | 2,178,366 | (1,524,697) | |||
Net increase from payment by the advisor | — | — | — | — | |||
Net change in unrealized appreciation (depreciation) | 13,573,013 | (67,491,422) | 20,746,966 | (40,908,476) | |||
Net increase (decrease) in net assets resulting from operations | (2,495,670) | (13,626,720) | 23,989,750 | (38,447,111) | |||
| DISTRIBUTIONS TO SHAREHOLDERS FROM: | |||||||
Investment operations | (3,312,211) | (1,833,976) | (643,860) | (3,919,682) | |||
Return of capital | — | — | — | — | |||
Total distributions to shareholders | (3,312,211) | (1,833,976) | (643,860) | (3,919,682) | |||
| SHAREHOLDER TRANSACTIONS: | |||||||
Proceeds from shares sold | 72,174,994 | 250,484,774 | 10,419,795 | 23,904,823 | |||
Cost of shares redeemed | (43,300,933) | (217,153,179) | (16,123,694) | (13,920,351) | |||
Net increase (decrease) in net assets resulting from shareholder transactions | 28,874,061 | 33,331,595 | (5,703,899) | 9,984,472 | |||
Total increase (decrease) in net assets | 23,066,180 | 17,870,899 | 17,641,991 | (32,382,321) | |||
| NET ASSETS: | |||||||
Beginning of period | 230,479,671 | 212,608,772 | 100,129,729 | 132,512,050 | |||
End of period | $253,545,851 | $230,479,671 | $117,771,720 | $100,129,729 | |||
| CHANGES IN SHARES OUTSTANDING: | |||||||
Shares outstanding, beginning of period | 6,900,002 | 6,050,002 | 3,300,002 | 3,150,002 | |||
Shares sold | 2,050,000 | 6,900,000 | 300,000 | 550,000 | |||
Shares redeemed | (1,250,000) | (6,050,000) | (450,000) | (400,000) | |||
Shares outstanding, end of period | 7,700,002 | 6,900,002 | 3,150,002 | 3,300,002 | |||
| First Trust Nasdaq Artificial Intelligence and Robotics ETF (ROBT) | First Trust International Developed Capital Strength ETF (FICS) | |||||
| Six Months Ended 3/31/2023 (Unaudited) | Year Ended 9/30/2022 | Six Months Ended 3/31/2023 (Unaudited) | Year Ended 9/30/2022 | |||
| $ 236,616 | $ 410,956 | $ 272,164 | $ 504,080 | |||
| (16,713,927) | (2,031,906) | (2,862,908) | (1,980,077) | |||
| — | 1,987 | — | — | |||
| 62,062,695 | (103,824,955) | 8,078,967 | (5,651,836) | |||
| 45,585,384 | (105,443,918) | 5,488,223 | (7,127,833) | |||
| (322,070) | (369,695) | (145,425) | (503,611) | |||
| — | — | — | — | |||
| (322,070) | (369,695) | (145,425) | (503,611) | |||
| 35,063,532 | 64,515,646 | 15,892,337 | 31,655,094 | |||
| (12,884,399) | (51,946,180) | (1,354,126) | (14,840,804) | |||
| 22,179,133 | 12,569,466 | 14,538,211 | 16,814,290 | |||
| 67,442,447 | (93,244,147) | 19,881,009 | 9,182,846 | |||
| 173,247,874 | 266,492,021 | 19,395,869 | 10,213,023 | |||
| $240,690,321 | $173,247,874 | $39,276,878 | $19,395,869 | |||
| 5,150,002 | 5,000,002 | 750,002 | 300,002 | |||
| 850,000 | 1,250,000 | 550,000 | 950,000 | |||
| (350,000) | (1,100,000) | (50,000) | (500,000) | |||
| 5,650,002 | 5,150,002 | 1,250,002 | 750,002 | |||
| Six Months Ended 3/31/2023 (Unaudited) | Year Ended September 30, | |||||||||||
| 2022 | 2021 | 2020 | 2019 | 2018 | ||||||||
Net asset value, beginning of period | $ 43.61 | $ 56.42 | $ 43.84 | $ 40.09 | $ 38.38 | $ 32.39 | ||||||
| Income from investment operations: | ||||||||||||
Net investment income (loss) | 0.55 | 1.24 | 1.10 | 0.93 | 0.97 | 0.96 | ||||||
Net realized and unrealized gain (loss) | 10.53 | (12.83) | 12.55 | 3.77 | 1.71 | 5.90 | ||||||
Total from investment operations | 11.08 | (11.59) | 13.65 | 4.70 | 2.68 | 6.86 | ||||||
| Distributions paid to shareholders from: | ||||||||||||
Net investment income | (0.60) | (1.22) | (1.07) | (0.95) | (0.97) | (0.87) | ||||||
Net asset value, end of period | $54.09 | $43.61 | $56.42 | $43.84 | $40.09 | $38.38 | ||||||
Total return (a) | 25.53% | (20.93)% | 31.29% | 11.91% | 7.21% | 21.37% | ||||||
| Ratios to average net assets/supplemental data: | ||||||||||||
Net assets, end of period (in 000’s) | $ 1,733,788 | $ 1,430,611 | $ 1,613,767 | $ 1,245,277 | $ 1,010,557 | $ 948,172 | ||||||
Ratio of total expenses to average net assets | 0.50% (b) | 0.50% | 0.50% | 0.50% | 0.50% | 0.50% | ||||||
Ratio of net investment income (loss) to average net assets | 2.22% (b) | 2.26% | 2.08% | 2.28% | 2.59% | 2.70% | ||||||
Portfolio turnover rate (c) | 12% | 36% | 38% | 49% | 37% | 27% | ||||||
| (a) | Total return is calculated assuming an initial investment made at the net asset value at the beginning of the period, reinvestment of all distributions at net asset value during the period, and redemption at net asset value on the last day of the period. The returns presented do not reflect the deduction of taxes that a shareholder would pay on Fund distributions or the redemption or sale of Fund shares. Total return is calculated for the time period presented and is not annualized for periods of less than a year. |
| (b) | Annualized. |
| (c) | Portfolio turnover is calculated for the time period presented and is not annualized for periods of less than a year and does not include securities received or delivered from processing creations or redemptions and in-kind transactions. |
| Six Months Ended 3/31/2023 (Unaudited) | Year Ended September 30, | |||||||||||
| 2022 | 2021 | 2020 | 2019 | 2018 | ||||||||
Net asset value, beginning of period | $ 14.41 | $ 16.35 | $ 13.52 | $ 18.43 | $ 18.54 | $ 19.22 | ||||||
| Income from investment operations: | ||||||||||||
Net investment income (loss) | 0.45 | 0.72 | 0.49 | 0.57 | 0.83 | 0.87 | ||||||
Net realized and unrealized gain (loss) | 0.30 | (1.67) | 3.18 | (4.52) | 0.18 | (0.36) | ||||||
Total from investment operations | 0.75 | (0.95) | 3.67 | (3.95) | 1.01 | 0.51 | ||||||
| Distributions paid to shareholders from: | ||||||||||||
Net investment income | (0.53) | (0.97) | (0.64) | (0.79) | (0.77) | (0.76) | ||||||
Return of capital | — | (0.02) | (0.20) | (0.17) | (0.35) | (0.43) | ||||||
Total distributions | (0.53) | (0.99) | (0.84) | (0.96) | (1.12) | (1.19) | ||||||
Net asset value, end of period | $14.63 | $14.41 | $16.35 | $13.52 | $18.43 | $18.54 | ||||||
Total return (a) | 5.13% | (6.25)% | 27.50% | (21.89)% | 5.74% | 2.82% | ||||||
| Ratios to average net assets/supplemental data: | ||||||||||||
Net assets, end of period (in 000’s) | $ 432,994 | $ 446,101 | $ 470,203 | $ 440,726 | $ 715,985 | $ 683,960 | ||||||
Ratio of total expenses to average net assets (b) | 0.60% (c) | 0.60% | 0.60% | 0.60% | 0.60% | 0.60% | ||||||
Ratio of net expenses to average net assets | 0.48% (c) | 0.48% | 0.48% | 0.47% | 0.48% | 0.48% | ||||||
Ratio of net investment income (loss) to average net assets | 5.99% (c) | 4.40% | 3.03% | 3.86% | 4.58% | 4.62% | ||||||
Portfolio turnover rate (d) | 34% | 85% | 100% | 106% | 73% | 84% | ||||||
| (a) | Total return is calculated assuming an initial investment made at the net asset value at the beginning of the period, reinvestment of all distributions at net asset value during the period, and redemption at net asset value on the last day of the period. The returns presented do not reflect the deduction of taxes that a shareholder would pay on Fund distributions or the redemption or sale of Fund shares. Total return is calculated for the time period presented and is not annualized for periods of less than a year. The total returns would have been lower if certain fees had not been waived and expenses reimbursed by the investment advisor. |
| (b) | The Fund indirectly bears its proportionate share of fees and expenses incurred by the underlying funds in which the Fund invests. This ratio does not include these indirect fees and expenses. |
| (c) | Annualized. |
| (d) | Portfolio turnover is calculated for the time period presented and is not annualized for periods of less than a year and does not include securities received or delivered from processing creations or redemptions and in-kind transactions. |
| Six Months Ended 3/31/2023 (Unaudited) | Year Ended September 30, | |||||||||||
| 2022 | 2021 | 2020 | 2019 | 2018 | ||||||||
Net asset value, beginning of period | $ 13.72 | $ 17.56 | $ 14.15 | $ 17.11 | $ 17.19 | $ 18.52 | ||||||
| Income from investment operations: | ||||||||||||
Net investment income (loss) | 0.28 | 0.71 | 0.62 | 0.64 | 0.63 | 0.85 | ||||||
Net realized and unrealized gain (loss) | 1.94 | (3.85) | 3.43 | (2.93) | (0.08) | (1.26) | ||||||
Total from investment operations | 2.22 | (3.14) | 4.05 | (2.29) | 0.55 | (0.41) | ||||||
| Distributions paid to shareholders from: | ||||||||||||
Net investment income | (0.23) | (0.70) | (0.64) | (0.67) | (0.63) | (0.92) | ||||||
Net asset value, end of period | $15.71 | $13.72 | $17.56 | $14.15 | $17.11 | $17.19 | ||||||
Total return (a) | 16.18% | (18.39)% | 28.79% | (13.62)% | 3.38% | (2.35)% | ||||||
| Ratios to average net assets/supplemental data: | ||||||||||||
Net assets, end of period (in 000’s) | $ 77,775 | $ 43,912 | $ 42,139 | $ 18,390 | $ 19,678 | $ 13,753 | ||||||
Ratio of total expenses to average net assets | 0.60% (b) | 0.60% | 0.60% | 0.60% | 0.60% | 0.69% (c) | ||||||
Ratio of net investment income (loss) to average net assets | 3.94% (b) | 4.39% | 4.10% | 4.03% | 4.01% | 4.70% | ||||||
Portfolio turnover rate (d) | 58% | 47% | 57% | 81% | 44% | 196% (e) | ||||||
| (a) | Total return is calculated assuming an initial investment made at the net asset value at the beginning of the period, reinvestment of all distributions at net asset value during the period, and redemption at net asset value on the last day of the period. The returns presented do not reflect the deduction of taxes that a shareholder would pay on Fund distributions or the redemption or sale of Fund shares. Total return is calculated for the time period presented and is not annualized for periods of less than a year. |
| (b) | Annualized. |
| (c) | On August 30, 2018, the Fund reduced the annual management fee payable to First Trust, from 0.70% of the Fund’s average daily net assets to 0.60% of the Fund’s average daily net assets. |
| (d) | Portfolio turnover is calculated for the time period presented and is not annualized for periods of less than a year and does not include securities received or delivered from processing creations or redemptions and in-kind transactions. |
| (e) | The variation in the portfolio turnover rate is due to the change in the Fund’s underlying index effective August 30, 2018, which resulted in a complete rebalance of the Fund’s portfolio. |
| Six Months Ended 3/31/2023 (Unaudited) | Year Ended September 30, | |||||||||||
| 2022 | 2021 | 2020 | 2019 | 2018 | ||||||||
Net asset value, beginning of period | $ 18.37 | $ 21.42 | $ 19.12 | $ 22.43 | $ 23.28 | $ 22.54 | ||||||
| Income from investment operations: | ||||||||||||
Net investment income (loss) | 0.16 (a) | 0.17 (a) | 0.12 | 0.23 | 0.40 | 0.35 | ||||||
Net realized and unrealized gain (loss) | 2.46 | (1.64) | 3.14 | (2.58) | (0.29) | 1.35 | ||||||
Total from investment operations | 2.62 | (1.47) | 3.26 | (2.35) | 0.11 | 1.70 | ||||||
| Distributions paid to shareholders from: | ||||||||||||
Net investment income | (0.85) | (1.58) | (0.96) | (0.23) | (0.86) | (0.96) | ||||||
Return of capital | — | — | — | (0.73) | (0.10) | — | ||||||
Total distributions | (0.85) | (1.58) | (0.96) | (0.96) | (0.96) | (0.96) | ||||||
Net asset value, end of period | $20.14 | $18.37 | $21.42 | $19.12 | $22.43 | $23.28 | ||||||
Total return (b) | 14.38% | (7.60)% | 17.31% | (10.63)% | 0.72% | 8.12% | ||||||
| Ratios to average net assets/supplemental data: | ||||||||||||
Net assets, end of period (in 000’s) | $ 157,613 | $ 89,527 | $ 46,575 | $ 59,733 | $ 80,155 | $ 66,898 | ||||||
Ratio of total expenses to average net assets | 0.85% (c) | 0.85% | 0.85% | 0.85% | 0.85% | 0.85% | ||||||
Ratio of net investment income (loss) to average net assets | 1.65% (c) | 0.81% | 1.29% | 1.10% | 1.43% | 1.34% | ||||||
Portfolio turnover rate (d) | 61% | 90% (e) | 199% | 210% | 209% | 239% | ||||||
| (a) | Based on average shares outstanding. |
| (b) | Total return is calculated assuming an initial investment made at the net asset value at the beginning of the period, reinvestment of all distributions at net asset value during the period, and redemption at net asset value on the last day of the period. The returns presented do not reflect the deduction of taxes that a shareholder would pay on Fund distributions or the redemption or sale of Fund shares. Total return is calculated for the time period presented and is not annualized for periods of less than a year. |
| (c) | Annualized. |
| (d) | Portfolio turnover is calculated for the time period presented and is not annualized for periods of less than a year and does not include securities received or delivered from processing creations or redemptions and in-kind transactions. |
| (e) | The variation in the portfolio turnover rate is due to lower than expected portfolio rebalancing, which was impacted by high levels of equity volatility and a downtrend in the U.S. equity markets. |
| Six Months Ended 3/31/2023 (Unaudited) | Year Ended September 30, | |||||||||||
| 2022 | 2021 | 2020 | 2019 | 2018 | ||||||||
Net asset value, beginning of period | $ 17.99 | $ 21.17 | $ 19.23 | $ 22.30 | $ 22.92 | $ 22.27 | ||||||
| Income from investment operations: | ||||||||||||
Net investment income (loss) | 0.02 | 0.06 (a) | 0.34 | 0.21 | 0.27 | 0.40 | ||||||
Net realized and unrealized gain (loss) | 2.46 | (1.83) | 2.26 | (2.62) | (0.23) | 0.91 | ||||||
Total from investment operations | 2.48 | (1.77) | 2.60 | (2.41) | 0.04 | 1.31 | ||||||
| Distributions paid to shareholders from: | ||||||||||||
Net investment income | (1.07) | (0.99) | (0.66) | (0.21) | (0.58) | (0.66) | ||||||
Return of capital | — | (0.42) | — | (0.45) | (0.08) | — | ||||||
Total distributions | (1.07) | (1.41) | (0.66) | (0.66) | (0.66) | (0.66) | ||||||
Net asset value, end of period | $19.40 | $17.99 | $21.17 | $19.23 | $22.30 | $22.92 | ||||||
Total return (b) | 14.14% | (9.00)% | 13.66% | (10.98)% | 0.29% | 5.95% | ||||||
| Ratios to average net assets/supplemental data: | ||||||||||||
Net assets, end of period (in 000’s) | $ 30,072 | $ 18,888 | $ 9,527 | $ 4,807 | $ 8,919 | $ 13,751 | ||||||
Ratio of total expenses to average net assets | 0.85% (c) | 0.85% | 0.85% | 0.85% | 0.85% | 0.85% | ||||||
Ratio of net investment income (loss) to average net assets | 0.42% (c) | 0.27% | 1.16% | 0.96% | 1.40% | 1.32% | ||||||
Portfolio turnover rate (d) | 68% | 107% (e) | 182% | 207% | 205% | 219% | ||||||
| (a) | Based on average shares outstanding. |
| (b) | Total return is calculated assuming an initial investment made at the net asset value at the beginning of the period, reinvestment of all distributions at net asset value during the period, and redemption at net asset value on the last day of the period. The returns presented do not reflect the deduction of taxes that a shareholder would pay on Fund distributions or the redemption or sale of Fund shares. Total return is calculated for the time period presented and is not annualized for periods of less than a year. |
| (c) | Annualized. |
| (d) | Portfolio turnover is calculated for the time period presented and is not annualized for periods of less than a year and does not include securities received or delivered from processing creations or redemptions and in-kind transactions. |
| (e) | The variation in the portfolio turnover rate is due to the change in the Fund’s index and investment strategy effective May 11, 2022, which resulted in fewer portfolio transactions. |
| Six Months Ended 3/31/2023 (Unaudited) | Year Ended September 30, | |||||||||||
| 2022 | 2021 | 2020 | 2019 | 2018 | ||||||||
Net asset value, beginning of period | $ 38.83 | $ 47.47 | $ 32.67 | $ 31.82 | $ 31.54 | $ 27.84 | ||||||
| Income from investment operations: | ||||||||||||
Net investment income (loss) | 0.54 | 0.82 | 0.59 | 0.58 | 0.54 | 0.41 | ||||||
Net realized and unrealized gain (loss) | 6.10 | (8.70) | 14.79 | 0.86 | 0.27 | 3.68 | ||||||
Total from investment operations | 6.64 | (7.88) | 15.38 | 1.44 | 0.81 | 4.09 | ||||||
| Distributions paid to shareholders from: | ||||||||||||
Net investment income | (0.59) | (0.76) | (0.58) | (0.59) | (0.53) | (0.39) | ||||||
Net asset value, end of period | $44.88 | $38.83 | $47.47 | $32.67 | $31.82 | $31.54 | ||||||
Total return (a) | 17.12% | (16.76)% | 47.21% | 4.61% | 2.72% | 14.78% | ||||||
| Ratios to average net assets/supplemental data: | ||||||||||||
Net assets, end of period (in 000’s) | $ 7,807,371 | $ 7,290,775 | $ 5,739,655 | $ 1,292,097 | $ 832,156 | $ 690,709 | ||||||
Ratio of total expenses to average net assets | 0.49% (b) | 0.50% | 0.50% | 0.50% | 0.50% | 0.50% | ||||||
Ratio of net investment income (loss) to average net assets | 2.34% (b) | 1.85% | 1.43% | 1.89% | 1.85% | 1.50% | ||||||
Portfolio turnover rate (c) | 50% | 59% | 45% | 62% | 63% | 40% | ||||||
| (a) | Total return is calculated assuming an initial investment made at the net asset value at the beginning of the period, reinvestment of all distributions at net asset value during the period, and redemption at net asset value on the last day of the period. The returns presented do not reflect the deduction of taxes that a shareholder would pay on Fund distributions or the redemption or sale of Fund shares. Total return is calculated for the time period presented and is not annualized for periods of less than a year. |
| (b) | Annualized. |
| (c) | Portfolio turnover is calculated for the time period presented and is not annualized for periods of less than a year and does not include securities received or delivered from processing creations or redemptions and in-kind transactions. |
| Six Months Ended 3/31/2023 (Unaudited) | Year Ended September 30, | |||||||||||
| 2022 | 2021 | 2020 | 2019 | 2018 | ||||||||
Net asset value, beginning of period | $ 41.09 | $ 45.78 | $ 34.10 | $ 29.63 | $ 30.93 | $ 26.17 | ||||||
| Income from investment operations: | ||||||||||||
Net investment income (loss) | 0.35 | 0.46 | 0.02 | 0.09 | 0.11 | 0.09 | ||||||
Net realized and unrealized gain (loss) | 4.06 | (4.71) | 11.68 | 4.49 | (1.31) | 4.83 | ||||||
Total from investment operations | 4.41 | (4.25) | 11.70 | 4.58 | (1.20) | 4.92 | ||||||
| Distributions paid to shareholders from: | ||||||||||||
Net investment income | (0.38) | (0.44) | (0.02) | (0.11) | (0.10) | (0.16) | ||||||
Net asset value, end of period | $45.12 | $41.09 | $45.78 | $34.10 | $29.63 | $30.93 | ||||||
Total return (a) | 10.71% | (9.32)% | 34.31% | 15.50% | (3.92)% | 18.91% | ||||||
| Ratios to average net assets/supplemental data: | ||||||||||||
Net assets, end of period (in 000’s) | $ 3,203,392 | $ 2,592,805 | $ 2,694,187 | $ 2,047,492 | $ 2,348,262 | $ 2,858,225 | ||||||
Ratio of total expenses to average net assets (b) | 0.30% (c) | 0.30% | 0.30% | 0.30% | 0.30% | 0.30% | ||||||
Ratio of net investment income (loss) to average net assets | 1.54% (c) | 1.01% | 0.04% | 0.30% | 0.34% | 0.30% | ||||||
Portfolio turnover rate (d) | 63% | 81% | 20% | 72% | 65% | 44% | ||||||
| (a) | Total return is calculated assuming an initial investment made at the net asset value at the beginning of the period, reinvestment of all distributions at net asset value during the period, and redemption at net asset value on the last day of the period. The returns presented do not reflect the deduction of taxes that a shareholder would pay on Fund distributions or the redemption or sale of Fund shares. Total return is calculated for the time period presented and is not annualized for periods of less than a year. |
| (b) | The Fund indirectly bears its proportionate share of fees and expenses incurred by the underlying funds in which the Fund invests. This ratio does not include these indirect fees and expenses. |
| (c) | Annualized. |
| (d) | Portfolio turnover is calculated for the time period presented and is not annualized for periods of less than a year and does not include securities received or delivered from processing creations or redemptions and in-kind transactions. |
| Six Months Ended 3/31/2023 (Unaudited) | Year Ended September 30, | |||||||||||
| 2022 | 2021 | 2020 | 2019 | 2018 | ||||||||
Net asset value, beginning of period | $ 38.20 | $ 40.84 | $ 25.68 | $ 26.76 | $ 27.93 | $ 26.04 | ||||||
| Income from investment operations: | ||||||||||||
Net investment income (loss) | 0.05 | 0.04 | 0.03 | (0.03) | 0.10 (a) | 0.09 | ||||||
Net realized and unrealized gain (loss) | 9.84 | (2.66) | 15.16 | (0.98) | (1.21) | 1.88 | ||||||
Total from investment operations | 9.89 | (2.62) | 15.19 | (1.01) | (1.11) | 1.97 | ||||||
| Distributions paid to shareholders from: | ||||||||||||
Net investment income | (0.08) | (0.02) | (0.03) | (0.07) | (0.06) | (0.08) | ||||||
Net asset value, end of period | $48.01 | $38.20 | $40.84 | $25.68 | $26.76 | $27.93 | ||||||
Total return (b) | 25.90% | (6.41)% | 59.15% | (3.81)% | (3.95)% | 7.56% | ||||||
| Ratios to average net assets/supplemental data: | ||||||||||||
Net assets, end of period (in 000’s) | $ 316,887 | $ 169,984 | $ 220,549 | $ 47,513 | $ 66,900 | $ 195,500 | ||||||
Ratio of total expenses to average net assets | 0.70% (c) | 0.70% | 0.70% | 0.70% | 0.70% | 0.70% | ||||||
Ratio of net investment income (loss) to average net assets | 0.26% (c) | 0.10% | 0.07% | (0.18)% | 0.40% | 0.32% | ||||||
Portfolio turnover rate (d) | 25% | 37% | 35% | 45% | 58% | 35% | ||||||
| (a) | Based on average shares outstanding. |
| (b) | Total return is calculated assuming an initial investment made at the net asset value at the beginning of the period, reinvestment of all distributions at net asset value during the period, and redemption at net asset value on the last day of the period. The returns presented do not reflect the deduction of taxes that a shareholder would pay on Fund distributions or the redemption or sale of Fund shares. Total return is calculated for the time period presented and is not annualized for periods of less than a year. |
| (c) | Annualized. |
| (d) | Portfolio turnover is calculated for the time period presented and is not annualized for periods of less than a year and does not include securities received or delivered from processing creations or redemptions and in-kind transactions. |
| Six Months Ended 3/31/2023 (Unaudited) | Year Ended September 30, | |||||||||||
| 2022 | 2021 | 2020 | 2019 | 2018 | ||||||||
Net asset value, beginning of period | $ 26.84 | $ 31.09 | $ 21.06 | $ 26.07 | $ 25.15 | $ 24.54 | ||||||
| Income from investment operations: | ||||||||||||
Net investment income (loss) | 0.79 | 0.88 | 0.73 | 0.68 | 0.78 | 0.65 | ||||||
Net realized and unrealized gain (loss) | 0.81 | (4.22) | 10.01 | (4.95) | 0.86 | 0.59 | ||||||
Total from investment operations | 1.60 | (3.34) | 10.74 | (4.27) | 1.64 | 1.24 | ||||||
| Distributions paid to shareholders from: | ||||||||||||
Net investment income | (0.70) | (0.91) | (0.71) | (0.74) | (0.72) | (0.63) | ||||||
Net asset value, end of period | $27.74 | $26.84 | $31.09 | $21.06 | $26.07 | $25.15 | ||||||
Total return (a) | 5.92% | (11.08)% | 51.29% | (16.49)% | 6.87% | 5.10% | ||||||
| Ratios to average net assets/supplemental data: | ||||||||||||
Net assets, end of period (in 000’s) | $ 51,316 | $ 67,100 | $ 38,863 | $ 29,484 | $ 44,313 | $ 37,727 | ||||||
Ratio of total expenses to average net assets | 0.60% (b) | 0.60% | 0.60% | 0.60% | 0.60% | 0.69% (c) | ||||||
Ratio of net investment income (loss) to average net assets | 5.03% (b) | 3.00% | 2.54% | 2.81% | 3.50% | 2.79% | ||||||
Portfolio turnover rate (d) | 85% | 172% | 186% | 193% | 160% | 297% (e) | ||||||
| (a) | Total return is calculated assuming an initial investment made at the net asset value at the beginning of the period, reinvestment of all distributions at net asset value during the period, and redemption at net asset value on the last day of the period. The returns presented do not reflect the deduction of taxes that a shareholder would pay on Fund distributions or the redemption or sale of Fund shares. Total return is calculated for the time period presented and is not annualized for periods of less than a year. |
| (b) | Annualized. |
| (c) | On September 6, 2018, the Fund reduced the annual management fee payable to First Trust, from 0.70% of the Fund’s average daily net assets to 0.60% of the Fund’s average daily net assets. |
| (d) | Portfolio turnover is calculated for the time period presented and is not annualized for periods of less than a year and does not include securities received or delivered from processing creations or redemptions and in-kind transactions. |
| (e) | The variation in the portfolio turnover rate is due to the change in the Fund’s underlying index effective September 6, 2018, which resulted in a complete rebalance of the Fund’s portfolio. |
| Six Months Ended 3/31/2023 (Unaudited) | Year Ended September 30, | |||||||||||
| 2022 | 2021 | 2020 | 2019 | 2018 | ||||||||
Net asset value, beginning of period | $ 16.09 | $ 22.74 | $ 18.83 | $ 19.07 | $ 20.33 | $ 21.35 | ||||||
| Income from investment operations: | ||||||||||||
Net investment income (loss) | 0.18 | 0.64 | 0.20 | 0.56 | 0.37 | 0.33 | ||||||
Net realized and unrealized gain (loss) | 1.08 | (6.66) | 3.93 | (0.23) | (1.26) | (0.93) | ||||||
Total from investment operations | 1.26 | (6.02) | 4.13 | 0.33 | (0.89) | (0.60) | ||||||
| Distributions paid to shareholders from: | ||||||||||||
Net investment income | (0.17) | (0.63) | (0.22) | (0.57) | (0.35) | (0.42) | ||||||
Return of capital | — | — | — | — | (0.02) | — | ||||||
Total distributions | (0.17) | (0.63) | (0.22) | (0.57) | (0.37) | (0.42) | ||||||
Net asset value, end of period | $17.18 | $16.09 | $22.74 | $18.83 | $19.07 | $20.33 | ||||||
Total return (a) | 7.85% | (26.89)% | 21.91% | 1.75% | (4.42)% | (2.91)% | ||||||
| Ratios to average net assets/supplemental data: | ||||||||||||
Net assets, end of period (in 000’s) | $ 218,184 | $ 139,212 | $ 264,970 | $ 218,452 | $ 453,757 | $ 774,665 | ||||||
Ratio of total expenses to average net assets (b) | 0.30% (c) | 0.30% | 0.30% | 0.30% | 0.30% | 0.30% | ||||||
Ratio of net investment income (loss) to average net assets | 2.41% (c) | 2.92% | 0.87% | 3.19% | 1.89% | 1.57% | ||||||
Portfolio turnover rate (d) | 75% | 104% | 66% | 29% | 42% | 0% | ||||||
| (a) | Total return is calculated assuming an initial investment made at the net asset value at the beginning of the period, reinvestment of all distributions at net asset value during the period, and redemption at net asset value on the last day of the period. The returns presented do not reflect the deduction of taxes that a shareholder would pay on Fund distributions or the redemption or sale of Fund shares. Total return is calculated for the time period presented and is not annualized for periods of less than a year. |
| (b) | The Fund indirectly bears its proportionate share of fees and expenses incurred by the underlying funds in which the Fund invests. This ratio does not include these indirect fees and expenses. |
| (c) | Annualized. |
| (d) | Portfolio turnover is calculated for the time period presented and is not annualized for periods of less than a year and does not include securities received or delivered from processing creations or redemptions and in-kind transactions. |
| Six Months Ended 3/31/2023 (Unaudited) | Year Ended September 30, | |||||||||||
| 2022 | 2021 | 2020 | 2019 | 2018 | ||||||||
Net asset value, beginning of period | $ 33.40 | $ 35.14 | $ 26.17 | $ 26.45 | $ 28.80 | $ 24.36 | ||||||
| Income from investment operations: | ||||||||||||
Net investment income (loss) | 0.42 | 0.31 | 0.01 | 0.13 | 0.22 | 0.08 | ||||||
Net realized and unrealized gain (loss) | (0.47) | (1.77) | 8.97 | (0.25) | (2.37) | 4.51 | ||||||
Total from investment operations | (0.05) | (1.46) | 8.98 | (0.12) | (2.15) | 4.59 | ||||||
| Distributions paid to shareholders from: | ||||||||||||
Net investment income | (0.42) | (0.28) | (0.01) | (0.16) | (0.20) | (0.15) | ||||||
Net asset value, end of period | $32.93 | $33.40 | $35.14 | $26.17 | $26.45 | $28.80 | ||||||
Total return (a) | (0.18)% | (4.18)% | 34.32% | (0.46)% | (7.46)% | 18.91% | ||||||
| Ratios to average net assets/supplemental data: | ||||||||||||
Net assets, end of period (in 000’s) | $ 253,546 | $ 230,480 | $ 212,609 | $ 223,754 | $ 468,253 | $ 620,537 | ||||||
Ratio of total expenses to average net assets (b) | 0.30% (c) | 0.30% | 0.30% | 0.30% | 0.30% | 0.30% | ||||||
Ratio of net investment income (loss) to average net assets | 2.52% (c) | 0.91% | 0.02% | 0.54% | 0.79% | 0.32% | ||||||
Portfolio turnover rate (d) | 197% | 164% | 20% | 225% | 90% | 42% | ||||||
| (a) | Total return is calculated assuming an initial investment made at the net asset value at the beginning of the period, reinvestment of all distributions at net asset value during the period, and redemption at net asset value on the last day of the period. The returns presented do not reflect the deduction of taxes that a shareholder would pay on Fund distributions or the redemption or sale of Fund shares. Total return is calculated for the time period presented and is not annualized for periods of less than a year. |
| (b) | The Fund indirectly bears its proportionate share of fees and expenses incurred by the underlying funds in which the Fund invests. This ratio does not include these indirect fees and expenses. |
| (c) | Annualized. |
| (d) | Portfolio turnover is calculated for the time period presented and is not annualized for periods of less than a year and does not include securities received or delivered from processing creations or redemptions and in-kind transactions. |
| Six Months Ended 3/31/2023 (Unaudited) | Year Ended September 30, | Period Ended 9/30/2018 (a) | ||||||||||
| 2022 | 2021 | 2020 | 2019 | |||||||||
Net asset value, beginning of period | $ 30.34 | $ 42.07 | $ 31.32 | $ 29.32 | $ 30.31 | $ 29.99 | ||||||
| Income from investment operations: | ||||||||||||
Net investment income (loss) | 0.33 | 1.15 | 0.61 | 0.35 | 0.59 | 0.26 | ||||||
Net realized and unrealized gain (loss) | 6.92 | (11.75) | 10.70 | 2.02 | (0.93) | 0.29 | ||||||
Total from investment operations | 7.25 | (10.60) | 11.31 | 2.37 | (0.34) | 0.55 | ||||||
| Distributions paid to shareholders from: | ||||||||||||
Net investment income | (0.20) | (1.13) | (0.56) | (0.37) | (0.65) | (0.23) | ||||||
Net asset value, end of period | $37.39 | $30.34 | $42.07 | $31.32 | $29.32 | $30.31 | ||||||
Total return (b) | 23.94% | (25.55)% | 36.13% | 8.13% | (1.08)% | 1.87% | ||||||
| Ratios to average net assets/supplemental data: | ||||||||||||
Net assets, end of period (in 000’s) | $ 117,772 | $ 100,130 | $ 132,512 | $ 42,280 | $ 41,048 | $ 50,017 | ||||||
Ratio of total expenses to average net assets | 0.65% (c) | 0.65% | 0.65% | 0.65% | 0.65% | 0.65% (c) | ||||||
Ratio of net investment income (loss) to average net assets | 1.92% (c) | 2.94% | 1.84% | 1.12% | 1.95% | 1.63% (c) | ||||||
Portfolio turnover rate (d) | 8% | 23% | 46% | 25% | 35% | 53% | ||||||
| (a) | Inception date is January 24, 2018, which is consistent with the commencement of investment operations and is the date the initial creation units were established. |
| (b) | Total return is calculated assuming an initial investment made at the net asset value at the beginning of the period, reinvestment of all distributions at net asset value during the period, and redemption at net asset value on the last day of the period. The returns presented do not reflect the deduction of taxes that a shareholder would pay on Fund distributions or the redemption or sale of Fund shares. Total return is calculated for the time period presented and is not annualized for periods of less than a year. |
| (c) | Annualized. |
| (d) | Portfolio turnover is calculated for the time period presented and is not annualized for periods of less than a year and does not include securities received or delivered from processing creations or redemptions and in-kind transactions. |
| Six Months Ended 3/31/2023 (Unaudited) | Year Ended September 30, | Period Ended 9/30/2018 (a) | ||||||||||
| 2022 | 2021 | 2020 | 2019 | |||||||||
Net asset value, beginning of period | $ 33.64 | $ 53.30 | $ 38.89 | $ 31.51 | $ 32.23 | $ 29.91 | ||||||
| Income from investment operations: | ||||||||||||
Net investment income (loss) | 0.04 | 0.08 | 0.05 | 0.04 | 0.17 | 0.12 | ||||||
Net realized and unrealized gain (loss) | 8.98 | (19.67) (b) | 14.44 | 7.39 | (0.75) | 2.31 | ||||||
Total from investment operations | 9.02 | (19.59) | 14.49 | 7.43 | (0.58) | 2.43 | ||||||
| Distributions paid to shareholders from: | ||||||||||||
Net investment income | (0.06) | (0.07) | (0.08) | (0.05) | (0.14) | (0.11) | ||||||
Net asset value, end of period | $42.60 | $33.64 | $53.30 | $38.89 | $31.51 | $32.23 | ||||||
Total return (c) | 26.86% | (36.76)% (b) | 37.27% | 23.60% | (1.81)% | 8.15% | ||||||
| Ratios to average net assets/supplemental data: | ||||||||||||
Net assets, end of period (in 000’s) | $ 240,690 | $ 173,248 | $ 266,492 | $ 120,549 | $ 61,443 | $ 32,226 | ||||||
Ratio of total expenses to average net assets | 0.65% (d) | 0.65% | 0.65% | 0.65% | 0.65% | 0.65% (d) | ||||||
Ratio of net investment income (loss) to average net assets | 0.25% (d) | 0.17% | 0.10% | 0.15% | 0.68% | 0.62% (d) | ||||||
Portfolio turnover rate (e) | 16% | 36% | 31% | 34% | 43% | 67% | ||||||
| (a) | Inception date is February 21, 2018, which is consistent with the commencement of investment operations and is the date the initial creation units were established. |
| (b) | The Fund received a reimbursement from the advisor in the amount of $1,987 in connection with a trade error, which represents less than $0.01 per share. Since the advisor reimbursed the Fund, there was no effect on the Fund’s total return. |
| (c) | Total return is calculated assuming an initial investment made at the net asset value at the beginning of the period, reinvestment of all distributions at net asset value during the period, and redemption at net asset value on the last day of the period. The returns presented do not reflect the deduction of taxes that a shareholder would pay on Fund distributions or the redemption or sale of Fund shares. Total return is calculated for the time period presented and is not annualized for periods of less than a year. |
| (d) | Annualized. |
| (e) | Portfolio turnover is calculated for the time period presented and is not annualized for periods of less than a year and does not include securities received or delivered from processing creations or redemptions and in-kind transactions. |
| Six Months Ended 3/31/2023 (Unaudited) | Year Ended 9/30/2022 | Period Ended 9/30/2021 (a) | |||
Net asset value, beginning of period | $ 25.86 | $ 34.04 | $ 30.09 | ||
| Income from investment operations: | |||||
Net investment income (loss) | 0.22 | 0.57 | 0.36 | ||
Net realized and unrealized gain (loss) | 5.47 | (8.16) | 3.93 | ||
Total from investment operations | 5.69 | (7.59) | 4.29 | ||
| Distributions paid to shareholders from: | |||||
Net investment income | (0.13) | (0.59) | (0.34) | ||
Net asset value, end of period | $31.42 | $25.86 | $34.04 | ||
Total return (b) | 22.00% | (22.50)% | 14.25% | ||
| Ratios to average net assets/supplemental data: | |||||
Net assets, end of period (in 000’s) | $ 39,277 | $ 19,396 | $ 10,213 | ||
Ratio of total expenses to average net assets | 0.70% (c) | 0.70% | 0.70% (c) | ||
Ratio of net investment income (loss) to average net assets | 1.79% (c) | 2.10% | 1.29% (c) | ||
Portfolio turnover rate (d) | 27% | 77% | 23% |
| (a) | Inception date is December 15, 2020, which is consistent with the commencement of investment operations and is the date the initial creation units were established. |
| (b) | Total return is calculated assuming an initial investment made at the net asset value at the beginning of the period, reinvestment of all distributions at net asset value during the period, and redemption at net asset value on the last day of the period. The returns presented do not reflect the deduction of taxes that a shareholder would pay on Fund distributions or the redemption or sale of Fund shares. Total return is calculated for the time period presented and is not annualized for periods of less than a year. |
| (c) | Annualized. |
| (d) | Portfolio turnover is calculated for the time period presented and is not annualized for periods of less than a year and does not include securities received or delivered from processing creations or redemptions and in-kind transactions. |
| Fund | Index |
| First Trust NASDAQ Technology Dividend Index Fund Multi-Asset Diversified Income Index Fund First Trust S&P International Dividend Aristocrats ETF First Trust Rising Dividend Achievers ETF First Trust Dorsey Wright Focus 5 ETF First Trust RBA American Industrial Renaissance® ETF First Trust Dorsey Wright Momentum & Dividend ETF First Trust Dorsey Wright International Focus 5 ETF First Trust Dorsey Wright Dynamic Focus 5 ETF First Trust Indxx Innovative Transaction & Process ETF First Trust Nasdaq Artificial Intelligence and Robotics ETF First Trust International Developed Capital Strength ETF | Nasdaq Technology DividendTM Index Nasdaq US Multi-Asset Diversified IncomeTM Index S&P International Dividend Aristocrats Index Nasdaq US Rising Dividend AchieversTM Index Dorsey Wright Focus FiveTM Index Richard Bernstein Advisors American Industrial Renaissance® Index Dorsey Wright Momentum Plus Dividend YieldTM Index Dorsey Wright International Focus FiveTM Index Dorsey Wright Dynamic Focus FiveTM Index Indxx Blockchain Index Nasdaq CTA Artificial Intelligence and RoboticsTM Index The International Developed Capital StrengthTM Index |
| 1) | the credit conditions in the relevant market and changes thereto; |
| 2) | the liquidity conditions in the relevant market and changes thereto; |
| 3) | the interest rate conditions in the relevant market and changes thereto (such as significant changes in interest rates); |
| 4) | issuer-specific conditions (such as significant credit deterioration); and |
| 5) | any other market-based data the Advisor’s Pricing Committee considers relevant. In this regard, the Advisor’s Pricing Committee may use last-obtained market-based data to assist it when valuing portfolio securities using amortized cost. |
| 1) | the last sale price on the exchange on which they are principally traded or, for Nasdaq and AIM securities, the official closing price; |
| 2) | the type of security; |
| 3) | the size of the holding; |
| 4) | the initial cost of the security; |
| 5) | transactions in comparable securities; |
| 6) | price quotes from dealers and/or third-party pricing services; |
| 7) | relationships among various securities; |
| 8) | information obtained by contacting the issuer, analysts, or the appropriate stock exchange; |
| 9) | an analysis of the issuer’s financial statements; |
| 10) | the existence of merger proposals or tender offers that might affect the value of the security; and |
| 11) | other relevant factors. |
| 1) | the value of similar foreign securities traded on other foreign markets; |
| 2) | ADR trading of similar securities; |
| 3) | closed-end fund or exchange-traded fund trading of similar securities; |
| 4) | foreign currency exchange activity; |
| 5) | the trading prices of financial products that are tied to baskets of foreign securities; |
| 6) | factors relating to the event that precipitated the pricing problem; |
| 7) | whether the event is likely to recur; |
| 8) | whether the effects of the event are isolated or whether they affect entire markets, countries or regions; and |
| 9) | other relevant factors. |
| • | Level 1 – Level 1 inputs are quoted prices in active markets for identical investments. An active market is a market in which transactions for the investment occur with sufficient frequency and volume to provide pricing information on an ongoing basis. |
| • | Level 2 – Level 2 inputs are observable inputs, either directly or indirectly, and include the following: |
| o | Quoted prices for similar investments in active markets. |
| o | Quoted prices for identical or similar investments in markets that are non-active. A non-active market is a market where there are few transactions for the investment, the prices are not current, or price quotations vary substantially either over time or among market makers, or in which little information is released publicly. |
| o | Inputs other than quoted prices that are observable for the investment (for example, interest rates and yield curves observable at commonly quoted intervals, volatilities, prepayment speeds, loss severities, credit risks, and default rates). |
| o | Inputs that are derived principally from or corroborated by observable market data by correlation or other means. |
| • | Level 3 – Level 3 inputs are unobservable inputs. Unobservable inputs may reflect the reporting entity’s own assumptions about the assumptions that market participants would use in pricing the investment. |
| Security Name | Shares at 3/31/2023 | Value at 9/30/2022 | Purchases | Sales | Change in Unrealized Appreciation (Depreciation) | Realized Gain (Loss) | Value at 3/31/2023 | Dividend Income |
| First Trust Tactical High Yield ETF | 2,284,925 | $ 91,828,017 | $ 9,994,186 | $ (14,276,034) | $ 4,062,108 | $ (759,659) | $ 90,848,618 | $ 2,913,727 |
| Security Name | Shares at 3/31/2023 | Value at 9/30/2022 | Purchases | Sales | Change in Unrealized Appreciation (Depreciation) | Realized Gain (Loss) | Value at 3/31/2023 | Dividend Income | ||||||
| First Trust Consumer Discretionary AlphaDEX® Fund | 12,309,910 | $ — | $604,275,106 | $ (428,682) | $35,403,734 | $3,468 | $639,253,626 | $ — | ||||||
| First Trust Energy AlphaDEX® Fund | — | 581,212,875 | 89,345,705 | (727,944,152) | 449,929 | 56,935,643 | — | 4,990,364 | ||||||
| First Trust Financials AlphaDEX® Fund | — | — | 674,340,221 | (527,783,992) | — | (146,556,229) | — | 3,106,028 | ||||||
| First Trust Industrials/Producer Durables AlphaDEX® Fund | 11,493,642 | 505,548,471 | 97,102,417 | (73,621,390) | 108,936,945 | 505,370 | 638,471,813 | 2,790,368 | ||||||
| First Trust Materials AlphaDEX® Fund | 9,738,120 | 426,900,733 | 121,957,992 | (24,862,085) | 110,519,363 | 1,577,996 | 636,093,999 | 4,672,755 | ||||||
| First Trust Nasdaq Food & Beverage ETF | 23,696,341 | 532,524,093 | 148,757,193 | (87,819,338) | 47,412,827 | (3,917,129) | 636,957,646 | 4,968,322 | ||||||
| First Trust Nasdaq Oil & Gas ETF | — | 541,275,552 | 105,610,767 | (654,159,549) | (76,138,600) | 83,411,830 | — | 8,211,911 | ||||||
| First Trust Nasdaq Semiconductor ETF | 9,950,938 | — | 622,900,077 | (433,655) | 22,458,565 | (4,695) | $644,920,292 | — | ||||||
| $2,587,461,724 | $2,464,289,478 | $(2,097,052,843) | $249,042,763 | $(8,043,746) | $3,195,697,376 | $28,739,748 |
| Security Name | Shares at 3/31/2023 | Value at 9/30/2022 | Purchases | Sales | Change in Unrealized Appreciation (Depreciation) | Realized Gain (Loss) | Value at 3/31/2023 | Dividend Income | ||||||
| First Trust BICK Index Fund | — | $27,247,140 | $795,680 | $ (30,900,508) | $2,920,019 | $ (62,331) | $ — | $ — | ||||||
| First Trust Brazil AlphaDEX® Fund | — | — | 41,876,650 | (39,225,682) | — | (2,650,968) | — | 361,882 | ||||||
| First Trust Chindia ETF | — | 27,506,086 | 1,833,202 | (28,053,438) | 3,006,867 | (4,292,717) | — | — | ||||||
| First Trust Dow Jones Global Select Dividend Index Fund | 1,898,905 | 26,988,029 | 44,995,408 | (29,219,743) | 7,858,526 | (8,637,430) | 41,984,790 | 204,161 | ||||||
| First Trust India NIFTY 50 Equal Weight ETF | 951,825 | 29,598,143 | 17,122,561 | (5,429,128) | (1,600,892) | 276,448 | 39,967,132 | 924,215 | ||||||
| First Trust Japan AlphaDEX® Fund | 988,597 | — | 45,222,756 | (2,838,939) | 2,443,830 | (17,610) | 44,810,037 | 230,456 | ||||||
| First Trust Latin America AlphaDEX® Fund | 2,613,963 | 27,672,640 | 19,533,495 | (5,059,109) | 3,387,044 | (302,054) | 45,232,016 | 503,101 | ||||||
| First Trust Switzerland AlphaDEX® Fund | 755,642 | — | 45,367,707 | (6,712,649) | 6,902,554 | 511,387 | 46,068,999 | 133,309 | ||||||
| $139,012,038 | $216,747,459 | $(147,439,196) | $24,917,948 | $(15,175,275) | $218,062,974 | $2,357,124 |
| Security Name | Shares at 3/31/2023 | Value at 9/30/2022 | Purchases | Sales | Change in Unrealized Appreciation (Depreciation) | Realized Gain (Loss) | Value at 3/31/2023 | Dividend Income | ||||||
| First Trust Consumer Discretionary AlphaDEX® Fund | 658,962 | $ — | $33,581,396 | $ (1,303,726) | $1,897,811 | $44,416 | $34,219,897 | $ — | ||||||
| First Trust Energy AlphaDEX® Fund | — | 31,230,271 | 28,852,388 | (62,591,205) | 94,476 | 2,414,070 | — | 163,979 | ||||||
| First Trust Enhanced Short Maturity ETF | 1,376,397 | 91,338,267 | 231,980,116 | (241,804,655) | (18,027) | 413,685 | 81,909,386 | 2,173,552 | ||||||
| First Trust Financials AlphaDEX® Fund | — | — | 57,574,745 | (45,299,822) | — | (12,274,923) | — | 259,712 | ||||||
| First Trust Industrials/Producer Durables AlphaDEX® Fund | 615,268 | 27,164,583 | 48,780,127 | (43,341,617) | 4,468,436 | (2,893,392) | 34,178,137 | 149,087 | ||||||
| First Trust Materials AlphaDEX® Fund | 521,292 | 22,938,522 | 49,578,219 | (38,742,308) | 5,338,803 | (5,062,443) | 34,050,793 | 275,964 | ||||||
| First Trust Nasdaq Food & Beverage ETF | 1,268,489 | 28,614,090 | 52,663,557 | (48,579,102) | 3,590,040 | (2,191,601) | 34,096,984 | 247,107 | ||||||
| First Trust Nasdaq Oil & Gas ETF | — | 29,084,238 | 52,260,542 | (78,436,951) | (3,002,391) | 94,562 | — | 458,905 | ||||||
| First Trust Nasdaq Semiconductor ETF | 532,684 | — | 34,617,547 | (1,328,982) | 1,203,865 | 30,820 | 34,523,250 | — | ||||||
| $230,369,971 | $589,888,637 | $(561,428,368) | $13,573,013 | $(19,424,806) | $252,978,447 | $3,728,306 |
| Distributions paid from Ordinary Income | Distributions paid from Capital Gains | Distributions paid from Return of Capital | |||
First Trust NASDAQ Technology Dividend Index Fund | $ 37,869,712 | $ — | $ — | ||
Multi-Asset Diversified Income Index Fund | 28,972,326 | — | 634,126 | ||
First Trust S&P International Dividend Aristocrats ETF | 2,134,072 | — | — | ||
First Trust BuyWrite Income ETF | 4,161,738 | — | — | ||
First Trust Nasdaq BuyWrite Income ETF | 627,504 | — | 260,249 | ||
First Trust Rising Dividend Achievers ETF | 140,979,372 | — | — | ||
First Trust Dorsey Wright Focus 5 ETF | 27,189,651 | — | — | ||
First Trust RBA American Industrial Renaissance® ETF | 131,850 | — | — | ||
First Trust Dorsey Wright Momentum & Dividend ETF | 1,904,422 | — | — | ||
First Trust Dorsey Wright International Focus 5 ETF | 5,794,666 | — | — | ||
First Trust Dorsey Wright Dynamic Focus 5 ETF | 1,833,976 | — | — | ||
First Trust Indxx Innovative Transaction & Process ETF | 3,919,682 | — | — | ||
First Trust Nasdaq Artificial Intelligence and Robotics ETF | 369,695 | — | — | ||
First Trust International Developed Capital Strength ETF | 503,611 | — | — |
| Undistributed Ordinary Income | Accumulated Capital and Other Gain (Loss) | Net Unrealized Appreciation (Depreciation) | |||
First Trust NASDAQ Technology Dividend Index Fund | $ 3,501,257 | $ (208,783,575) | $ (204,387,577) | ||
Multi-Asset Diversified Income Index Fund | — | (226,942,167) | (50,345,965) | ||
First Trust S&P International Dividend Aristocrats ETF | 164,542 | (5,293,852) | (11,563,360) | ||
First Trust BuyWrite Income ETF | — | (18,375,410) | (9,220,265) | ||
First Trust Nasdaq BuyWrite Income ETF | — | (2,123,105) | (2,620,426) | ||
First Trust Rising Dividend Achievers ETF | 15,703,375 | (149,050,822) | (1,798,807,954) | ||
First Trust Dorsey Wright Focus 5 ETF | 1,291,405 | (579,723,679) | (201,997,496) | ||
First Trust RBA American Industrial Renaissance® ETF | 142,573 | (33,161,068) | (22,256,509) | ||
First Trust Dorsey Wright Momentum & Dividend ETF | 221,298 | (23,321,490) | (10,864,363) | ||
First Trust Dorsey Wright International Focus 5 ETF | 81,382 | (144,990,579) | (22,207,775) | ||
First Trust Dorsey Wright Dynamic Focus 5 ETF | 222,818 | (60,339,002) | (10,572,639) | ||
First Trust Indxx Innovative Transaction & Process ETF | 115,148 | (4,605,254) | (27,416,714) | ||
First Trust Nasdaq Artificial Intelligence and Robotics ETF | 319,975 | (23,210,981) | (76,034,434) | ||
First Trust International Developed Capital Strength ETF | 20,290 | (1,161,324) | (5,722,985) |
| Non-Expiring Capital Loss Carryforward | |
First Trust NASDAQ Technology Dividend Index Fund | $ 208,783,575 |
Multi-Asset Diversified Income Index Fund | 226,942,167 |
First Trust S&P International Dividend Aristocrats ETF | 5,293,852 |
First Trust BuyWrite Income ETF | 18,375,410 |
First Trust Nasdaq BuyWrite Income ETF | 2,123,105 |
First Trust Rising Dividend Achievers ETF | 149,050,822 |
First Trust Dorsey Wright Focus 5 ETF | 579,723,679 |
First Trust RBA American Industrial Renaissance® ETF | 33,161,068 |
First Trust Dorsey Wright Momentum & Dividend ETF | 23,321,490 |
First Trust Dorsey Wright International Focus 5 ETF | 144,990,579 |
First Trust Dorsey Wright Dynamic Focus 5 ETF | 60,339,002 |
First Trust Indxx Innovative Transaction & Process ETF | 4,605,254 |
First Trust Nasdaq Artificial Intelligence and Robotics ETF | 23,210,981 |
First Trust International Developed Capital Strength ETF | 1,161,324 |
| Tax Cost | Gross Unrealized Appreciation | Gross Unrealized (Depreciation) | Net Unrealized Appreciation (Depreciation) | ||||
First Trust NASDAQ Technology Dividend Index Fund | $ 1,551,683,672 | $ 282,595,275 | $ (103,754,731) | $ 178,840,544 | |||
Multi-Asset Diversified Income Index Fund | 445,502,917 | 29,928,415 | (45,257,601) | (15,329,186) | |||
First Trust S&P International Dividend Aristocrats ETF | 79,899,738 | 1,880,704 | (5,790,946) | (3,910,242) | |||
First Trust BuyWrite Income ETF | 153,299,251 | 7,760,595 | (6,231,199) | 1,529,396 | |||
First Trust Nasdaq BuyWrite Income ETF | 28,680,767 | 2,530,577 | (1,505,186) | 1,025,391 | |||
First Trust Rising Dividend Achievers ETF | 7,780,351,561 | 419,002,575 | (404,520,334) | 14,482,241 | |||
First Trust Dorsey Wright Focus 5 ETF | 3,145,616,040 | 90,265,362 | (40,184,026) | 50,081,336 | |||
First Trust RBA American Industrial Renaissance® ETF | 291,925,660 | 38,899,625 | (14,536,283) | 24,363,342 | |||
First Trust Dorsey Wright Momentum & Dividend ETF | 53,628,230 | 1,849,428 | (4,450,588) | (2,601,160) | |||
First Trust Dorsey Wright International Focus 5 ETF | 215,343,107 | 9,346,384 | (6,626,517) | 2,719,867 | |||
First Trust Dorsey Wright Dynamic Focus 5 ETF | 248,306,884 | 4,946,843 | (275,280) | 4,671,563 | |||
First Trust Indxx Innovative Transaction & Process ETF | 123,841,518 | 9,146,882 | (14,010,881) | (4,863,999) | |||
First Trust Nasdaq Artificial Intelligence and Robotics ETF | 266,958,233 | 20,450,940 | (29,858,379) | (9,407,439) | |||
First Trust International Developed Capital Strength ETF | 36,602,054 | 3,517,659 | (1,103,740) | 2,413,919 |
| Fund | Licensor |
| First Trust NASDAQ Technology Dividend Index Fund | Nasdaq, Inc. |
| Multi-Asset Diversified Income Index Fund | Nasdaq, Inc. |
| First Trust S&P International Dividend Aristocrats ETF | S&P Dow Jones Indices, LLC |
| First Trust Rising Dividend Achievers ETF | Nasdaq, Inc. |
| First Trust Dorsey Wright Focus 5 ETF | Dorsey, Wright & Associates, LLC |
| First Trust RBA American Industrial Renaissance® ETF | Richard Bernstein Advisors LLC |
| First Trust Dorsey Wright Momentum & Dividend ETF | Nasdaq, Inc. |
| First Trust Dorsey Wright International Focus 5 ETF | Dorsey, Wright & Associates, LLC |
| First Trust Dorsey Wright Dynamic Focus 5 ETF | Dorsey, Wright & Associates, LLC |
| First Trust Indxx Innovative Transaction & Process ETF | Indxx, Inc. |
| First Trust Nasdaq Artificial Intelligence and Robotics ETF | Nasdaq, Inc. |
| First Trust International Developed Capital Strength ETF | Nasdaq, Inc. |
| Breakpoints | TDIV | RDVY | FV | AIRR | |||
| Fund net assets up to and including $2.5 billion | 0.5000% | 0.5000% | 0.3000% | 0.7000% | |||
| Fund net assets greater than $2.5 billion up to and including $5 billion | 0.4875% | 0.4875% | 0.2925% | 0.6825% | |||
| Fund net assets greater than $5 billion up to and including $7.5 billion | 0.4750% | 0.4750% | 0.2850% | 0.6650% | |||
| Fund net assets greater than $7.5 billion up to and including $10 billion | 0.4625% | 0.4625% | 0.2775% | 0.6475% | |||
| Fund net assets greater than $10 billion up to and including $15 billion | 0.4500% | 0.4500% | 0.2700% | 0.6300% | |||
| Fund net assets greater than $15 billion | 0.4250% | 0.4250% | 0.2550% | 0.5950% |
| Breakpoints | DDIV | IFV | FVC | ||||
| Fund net assets up to and including $2.5 billion | 0.600% | 0.3000% | 0.3000% | ||||
| Fund net assets greater than $2.5 billion up to and including $5 billion | 0.585% | 0.2925% | 0.2925% | ||||
| Fund net assets greater than $5 billion up to and including $7.5 billion | 0.570% | 0.2850% | 0.2850% | ||||
| Fund net assets greater than $7.5 billion up to and including $10 billion | 0.555% | 0.2775% | 0.2775% | ||||
| Fund net assets greater than $10 billion up to and including $15 billion | 0.540% | 0.2700% | 0.2700% | ||||
| Fund net assets greater than $15 billion | 0.510% | 0.2550% | 0.2550% |
| Breakpoints | MDIV | FID | FTHI | FTQI | |||
| Fund net assets up to and including $2.5 billion | 0.600% | 0.600% | 0.85000% | 0.85000% | |||
| Fund net assets greater than $2.5 billion up to and including $5 billion | 0.585% | 0.585% | 0.82875% | 0.82875% | |||
| Fund net assets greater than $5 billion up to and including $7.5 billion | 0.570% | 0.570% | 0.80750% | 0.80750% | |||
| Fund net assets greater than $7.5 billion up to and including $10 billion | 0.555% | 0.555% | 0.78625% | 0.78625% | |||
| Fund net assets greater than $10 billion | 0.540% | 0.540% | 0.76500% | 0.76500% |
| Breakpoints | LEGR | ROBT | FICS | ||||
| Fund net assets up to and including $2.5 billion | 0.65000% | 0.65000% | 0.7000% | ||||
| Fund net assets greater than $2.5 billion up to and including $5 billion | 0.63375% | 0.63375% | 0.6825% | ||||
| Fund net assets greater than $5 billion up to and including $7.5 billion | 0.61750% | 0.61750% | 0.6650% | ||||
| Fund net assets greater than $7.5 billion up to and including $10 billion | 0.60125% | 0.60125% | 0.6475% | ||||
| Fund net assets greater than $10 billion | 0.58500% | 0.58500% | 0.6300% |
| First Trust NASDAQ Technology Dividend Index Fund | 0.50% |
| Multi-Asset Diversified Income Index Fund | 0.60% |
| First Trust S&P International Dividend Aristocrats ETF | 0.60% |
| First Trust BuyWrite Income ETF | 0.85% |
| First Trust Nasdaq BuyWrite Income ETF | 0.85% |
| First Trust Rising Dividend Achievers ETF | 0.50% |
| First Trust Dorsey Wright Focus 5 ETF | 0.30% |
| First Trust RBA American Industrial Renaissance® ETF | 0.70% |
| First Trust Dorsey Wright Momentum & Dividend ETF | 0.60% |
| First Trust Dorsey Wright International Focus 5 ETF | 0.30% |
| First Trust Dorsey Wright Dynamic Focus 5 ETF | 0.30% |
| First Trust Indxx Innovative Transaction & Process ETF | 0.65% |
| First Trust Nasdaq Artificial Intelligence and Robotics ETF | 0.65% |
| First Trust International Developed Capital Strength ETF | 0.70% |
| Purchases | Sales | ||
| First Trust NASDAQ Technology Dividend Index Fund | $ 189,374,438 | $ 191,005,867 | |
| Multi-Asset Diversified Income Index Fund | 155,908,978 | 155,007,655 | |
| First Trust S&P International Dividend Aristocrats ETF | 38,373,894 | 33,502,372 | |
| First Trust BuyWrite Income ETF | 68,296,373 | 69,296,373 | |
| First Trust Nasdaq BuyWrite Income ETF | 19,340,307 | 19,855,494 | |
| First Trust Rising Dividend Achievers ETF | 3,964,071,923 | 3,972,949,531 | |
| First Trust Dorsey Wright Focus 5 ETF | 1,972,829,907 | 1,976,329,621 | |
| First Trust RBA American Industrial Renaissance® ETF | 60,746,133 | 61,348,422 | |
| First Trust Dorsey Wright Momentum & Dividend ETF | 54,881,064 | 54,702,231 | |
| First Trust Dorsey Wright International Focus 5 ETF | 133,383,526 | 133,102,227 | |
| First Trust Dorsey Wright Dynamic Focus 5 ETF | 517,787,607 | 518,177,200 | |
| First Trust Indxx Innovative Transaction & Process ETF | 8,706,913 | 8,728,252 | |
| First Trust Nasdaq Artificial Intelligence and Robotics ETF | 31,417,536 | 30,845,457 | |
| First Trust International Developed Capital Strength ETF | 9,038,216 | 8,230,722 | |
| Purchases | Sales | ||
| First Trust NASDAQ Technology Dividend Index Fund | $ 57,048,975 | $ 88,462,931 | |
| Multi-Asset Diversified Income Index Fund | 37,717,808 | 56,667,487 | |
| First Trust S&P International Dividend Aristocrats ETF | 21,778,156 | — | |
| First Trust BuyWrite Income ETF | 88,877,212 | 29,061,160 | |
| First Trust Nasdaq BuyWrite Income ETF | 14,365,188 | 5,582,060 | |
| First Trust Rising Dividend Achievers ETF | 116,948,155 | 716,674,290 | |
| First Trust Dorsey Wright Focus 5 ETF | 491,459,571 | 120,723,222 | |
| First Trust RBA American Industrial Renaissance® ETF | 138,602,629 | 36,686,736 | |
| First Trust Dorsey Wright Momentum & Dividend ETF | — | 19,095,034 | |
| First Trust Dorsey Wright International Focus 5 ETF | 83,363,933 | 14,336,969 | |
| First Trust Dorsey Wright Dynamic Focus 5 ETF | 72,101,030 | 43,251,168 | |
| First Trust Indxx Innovative Transaction & Process ETF | 8,949,516 | 14,767,009 | |
| First Trust Nasdaq Artificial Intelligence and Robotics ETF | 34,031,567 | 12,097,135 | |
| First Trust International Developed Capital Strength ETF | 15,031,797 | 1,347,248 |
| Asset Derivatives | Liability Derivatives | |||||||||
| Derivative Instrument | Risk Exposure | Statements of Assets and Liabilities Location | Value | Statements of Assets and Liabilities Location | Value | |||||
| Options | Equity Risk | — | $ — | Options written, at value | $ 4,422,467 | |||||
| Asset Derivatives | Liability Derivatives | |||||||||
| Derivative Instrument | Risk Exposure | Statements of Assets and Liabilities Location | Value | Statements of Assets and Liabilities Location | Value | |||||
| Options | Equity Risk | — | $ — | Options written, at value | $ 1,582,257 | |||||
| Equity Risk | ||
| Statements of Operations Location | FTHI | FTQI |
| Net realized gain (loss) on Written options contracts | $4,415,128 | $535,854 |
| Net change in unrealized gain (loss) on Written options contracts | (3,912,849) | (1,203,844) |
| NOT FDIC INSURED | NOT BANK GUARANTEED | MAY LOSE VALUE |
FUND ACCOUNTANT &
TRANSFER AGENT
PUBLIC ACCOUNTING FIRM

Book 2
First Trust SMID Cap Rising Dividend Achievers ETF (SDVY)
First Trust Dorsey Wright Momentum & Value ETF (DVLU)
First Trust Dorsey Wright Momentum & Low Volatility ETF (DVOL)
For the Six Months Ended
March 31, 2023
| 2 | |
| 3 | |
| Fund Performance Overview | |
| 4 | |
| 6 | |
| 8 | |
| 10 | |
| 11 | |
| Portfolio of Investments | |
| 12 | |
| 14 | |
| 16 | |
| 18 | |
| 19 | |
| 20 | |
| 22 | |
| 25 | |
| 31 |


| Performance | |||||||
| Average Annual Total Returns | Cumulative Total Returns | ||||||
| 6 Months Ended 3/31/23 | 1 Year Ended 3/31/23 | 5 Years Ended 3/31/23 | Inception (11/1/17) to 3/31/23 | 5 Years Ended 3/31/23 | Inception (11/1/17) to 3/31/23 | ||
| Fund Performance | |||||||
| NAV | 17.02% | -1.67% | 7.07% | 7.35% | 40.73% | 46.75% | |
| Market Price | 17.02% | -1.67% | 7.05% | 7.35% | 40.59% | 46.75% | |
| Index Performance | |||||||
| Nasdaq US Small Mid Cap Rising Dividend Achievers™ Index | 17.45% | -1.13% | 7.72% | 8.00% | 45.01% | 51.66% | |
| S&P 1000® Index | 14.10% | -6.24% | 7.26% | 7.40% | 41.96% | 47.12% | |
| Sector Allocation | % of Total Investments |
| Financials | 30.5% |
| Industrials | 25.1 |
| Consumer Discretionary | 13.7 |
| Information Technology | 10.1 |
| Energy | 9.4 |
| Materials | 6.1 |
| Communication Services | 2.1 |
| Consumer Staples | 2.0 |
| Real Estate | 1.0 |
| Total | 100.0% |
| Top Ten Holdings | % of Total Investments |
| Ally Financial, Inc. | 1.1% |
| AGCO Corp. | 1.1 |
| Popular, Inc. | 1.1 |
| Synovus Financial Corp. | 1.1 |
| Civitas Resources, Inc. | 1.1 |
| Cal-Maine Foods, Inc. | 1.1 |
| Magnolia Oil & Gas Corp., Class A | 1.1 |
| SM Energy Co. | 1.1 |
| Commercial Metals Co. | 1.1 |
| Interpublic Group of (The) Cos., Inc. | 1.1 |
| Total | 11.0% |
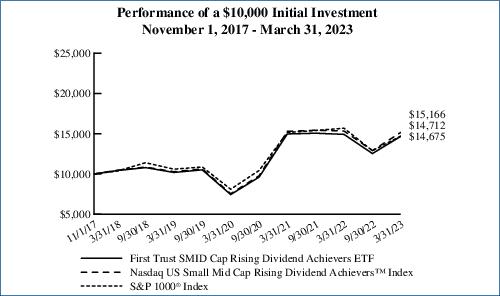
Performance figures assume reinvestment of all distributions and do not reflect the deduction of taxes that a shareholder would pay on Fund distributions or the redemption or sale of Fund shares. An index is a statistical composite that tracks a specified financial market or sector. Unlike the Fund, the indices do not actually hold a portfolio of securities and therefore do not incur the expenses incurred by the Fund. These expenses negatively impact the performance of the Fund. The Fund’s past performance does not predict future performance.
| Performance | ||||
| Average Annual Total Returns | Cumulative Total Returns | |||
| 6 Months Ended 3/31/23 | 1 Year Ended 3/31/23 | Inception (9/5/18) to 3/31/23 | Inception (9/5/18) to 3/31/23 | |
| Fund Performance | ||||
| NAV | 10.33% | -11.18% | 4.14% | 20.35% |
| Market Price | 10.22% | -11.25% | 4.13% | 20.29% |
| Index Performance | ||||
| Dorsey Wright Momentum Plus Value™ Index | 10.72% | -10.62% | 4.79% | 23.84% |
| S&P 500® Index | 15.62% | -7.73% | 9.93% | 54.07% |
| Sector Allocation | % of Total Investments |
| Financials | 26.0% |
| Materials | 21.4 |
| Health Care | 13.0 |
| Industrials | 10.9 |
| Energy | 10.5 |
| Consumer Discretionary | 6.9 |
| Utilities | 3.4 |
| Information Technology | 2.9 |
| Communication Services | 2.6 |
| Consumer Staples | 2.4 |
| Total | 100.0% |
| Top Ten Holdings | % of Total Investments |
| Builders FirstSource, Inc. | 3.7% |
| Reliance Steel & Aluminum Co. | 3.3 |
| Marathon Petroleum Corp. | 3.3 |
| Penske Automotive Group, Inc. | 3.2 |
| Tenet Healthcare Corp. | 3.1 |
| Westlake Corp. | 2.9 |
| Phillips 66 | 2.9 |
| United States Steel Corp. | 2.8 |
| Unum Group | 2.8 |
| UFP Industries, Inc. | 2.7 |
| Total | 30.7% |
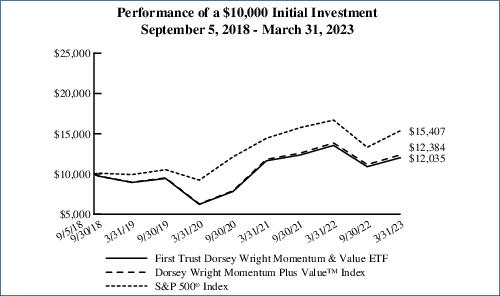
Performance figures assume reinvestment of all distributions and do not reflect the deduction of taxes that a shareholder would pay on Fund distributions or the redemption or sale of Fund shares. An index is a statistical composite that tracks a specified financial market or sector. Unlike the Fund, the indices do not actually hold a portfolio of securities and therefore do not incur the expenses incurred by the Fund. These expenses negatively impact the performance of the Fund. The Fund’s past performance does not predict future performance.
| Performance | ||||
| Average Annual Total Returns | Cumulative Total Returns | |||
| 6 Months Ended 3/31/23 | 1 Year Ended 3/31/23 | Inception (9/5/18) to 3/31/23 | Inception (9/5/18) to 3/31/23 | |
| Fund Performance | ||||
| NAV | 7.67% | -9.23% | 6.77% | 34.89% |
| Market Price | 7.54% | -9.30% | 6.76% | 34.84% |
| Index Performance | ||||
| Dorsey Wright Momentum Plus Low Volatility™ Index | 8.02% | -8.71% | 7.45% | 38.86% |
| S&P 500® Index | 15.62% | -7.73% | 9.93% | 54.07% |
| Sector Allocation | % of Total Investments |
| Health Care | 25.3% |
| Financials | 25.0 |
| Industrials | 16.5 |
| Consumer Staples | 12.9 |
| Consumer Discretionary | 8.5 |
| Real Estate | 5.9 |
| Utilities | 3.7 |
| Materials | 2.2 |
| Total | 100.0% |
| Top Ten Holdings | % of Total Investments |
| Hershey (The) Co. | 3.4% |
| McDonald’s Corp. | 3.2 |
| Republic Services, Inc. | 3.1 |
| Bristol-Myers Squibb Co. | 3.1 |
| Waste Management, Inc. | 3.1 |
| Chemed Corp. | 3.0 |
| Merck & Co., Inc. | 3.0 |
| AbbVie, Inc. | 2.8 |
| Procter & Gamble (The) Co. | 2.8 |
| Yum! Brands, Inc. | 2.7 |
| Total | 30.2% |

Performance figures assume reinvestment of all distributions and do not reflect the deduction of taxes that a shareholder would pay on Fund distributions or the redemption or sale of Fund shares. An index is a statistical composite that tracks a specified financial market or sector. Unlike the Fund, the indices do not actually hold a portfolio of securities and therefore do not incur the expenses incurred by the Fund. These expenses negatively impact the performance of the Fund. The Fund’s past performance does not predict future performance.
| Beginning Account Value October 1, 2022 | Ending Account Value March 31, 2023 | Annualized Expense Ratio Based on the Six-Month Period | Expenses Paid During the Six-Month Period (a) | |
| First Trust SMID Cap Rising Dividend Achievers ETF (SDVY) | ||||
| Actual | $1,000.00 | $1,170.20 | 0.60% | $3.25 |
| Hypothetical (5% return before expenses) | $1,000.00 | $1,021.94 | 0.60% | $3.02 |
| First Trust Dorsey Wright Momentum & Value ETF (DVLU) | ||||
| Actual | $1,000.00 | $1,103.30 | 0.60% | $3.15 |
| Hypothetical (5% return before expenses) | $1,000.00 | $1,021.94 | 0.60% | $3.02 |
| First Trust Dorsey Wright Momentum & Low Volatility ETF (DVOL) | ||||
| Actual | $1,000.00 | $1,076.70 | 0.60% | $3.11 |
| Hypothetical (5% return before expenses) | $1,000.00 | $1,021.94 | 0.60% | $3.02 |
| (a) | Expenses are equal to the annualized expense ratios as indicated in the table multiplied by the average account value over the period (October 1, 2022 through March 31, 2023), multiplied by 182/365 (to reflect the six-month period). |
| Shares | Description | Value | ||
| COMMON STOCKS – 99.8% | ||||
| Automobiles – 1.0% | ||||
| 182,365 | Winnebago Industries, Inc. | $10,522,461 | ||
| Banks – 15.2% | ||||
| 285,807 | Bank OZK | 9,774,599 | ||
| 486,710 | Cadence Bank | 10,104,100 | ||
| 284,660 | Cathay General Bancorp | 9,826,463 | ||
| 232,513 | Comerica, Inc. | 10,095,714 | ||
| 285,375 | Eagle Bancorp, Inc. | 9,551,501 | ||
| 186,491 | East West Bancorp, Inc. | 10,350,250 | ||
| 913,556 | First BanCorp | 10,432,810 | ||
| 1,340,282 | First Foundation, Inc. | 9,985,101 | ||
| 238,365 | International Bancshares Corp. | 10,206,789 | ||
| 398,674 | OFG Bancorp | 9,942,930 | ||
| 408,407 | Pacific Premier Bancorp, Inc. | 9,809,936 | ||
| 200,317 | Popular, Inc. | 11,500,199 | ||
| 371,214 | Synovus Financial Corp. | 11,444,528 | ||
| 538,095 | Veritex Holdings, Inc. | 9,825,615 | ||
| 140,453 | Wintrust Financial Corp. | 10,246,046 | ||
| 339,661 | Zions Bancorp N.A. | 10,166,054 | ||
| 163,262,635 | ||||
| Building Products – 3.0% | ||||
| 128,209 | Advanced Drainage Systems, Inc. | 10,796,480 | ||
| 113,448 | Owens Corning | 10,868,318 | ||
| 131,482 | UFP Industries, Inc. | 10,448,875 | ||
| 32,113,673 | ||||
| Capital Markets – 2.0% | ||||
| 90,282 | Evercore, Inc., Class A | 10,416,737 | ||
| 186,180 | Stifel Financial Corp. | 11,001,376 | ||
| 21,418,113 | ||||
| Chemicals – 1.0% | ||||
| 96,862 | Westlake Corp. | 11,234,055 | ||
| Commercial Services & Supplies – 1.0% | ||||
| 73,542 | Tetra Tech, Inc. | 10,804,055 | ||
| Communications Equipment – 1.0% | ||||
| 326,024 | Juniper Networks, Inc. | 11,221,746 | ||
| Construction & Engineering – 1.0% | ||||
| 123,678 | AECOM | 10,428,529 | ||
| Consumer Finance – 3.0% | ||||
| 456,983 | Ally Financial, Inc. | 11,648,497 | ||
| 850,427 | SLM Corp. | 10,536,790 | ||
| 357,534 | Synchrony Financial | 10,397,089 | ||
| 32,582,376 | ||||
| Electrical Equipment – 2.0% | ||||
| 43,589 | Hubbell, Inc. | 10,605,640 | ||
| Shares | Description | Value | ||
| Electrical Equipment (Continued) | ||||
| 74,174 | Regal Rexnord Corp. | $10,438,507 | ||
| 21,044,147 | ||||
| Electronic Equipment, Instruments & Components – 4.1% | ||||
| 109,355 | Advanced Energy Industries, Inc. | 10,716,790 | ||
| 461,330 | Benchmark Electronics, Inc. | 10,928,908 | ||
| 40,498 | Littelfuse, Inc. | 10,857,109 | ||
| 485,438 | Vishay Intertechnology, Inc. | 10,980,607 | ||
| 43,483,414 | ||||
| Financial Services – 6.1% | ||||
| 434,193 | Equitable Holdings, Inc. | 11,024,160 | ||
| 276,652 | Essent Group Ltd. | 11,079,913 | ||
| 292,889 | Jackson Financial, Inc., Class A | 10,956,978 | ||
| 822,127 | MGIC Investment Corp. | 11,032,944 | ||
| 500,057 | Radian Group, Inc. | 11,051,260 | ||
| 134,190 | Walker & Dunlop, Inc. | 10,221,252 | ||
| 65,366,507 | ||||
| Food Products – 1.0% | ||||
| 186,555 | Cal-Maine Foods, Inc. | 11,359,334 | ||
| Ground Transportation – 2.0% | ||||
| 59,399 | Landstar System, Inc. | 10,647,865 | ||
| 389,082 | Schneider National, Inc., Class B | 10,407,943 | ||
| 21,055,808 | ||||
| Household Durables – 6.0% | ||||
| 172,304 | Century Communities, Inc. | 11,013,672 | ||
| 384,178 | Ethan Allen Interiors, Inc. | 10,549,528 | ||
| 356,406 | La-Z-Boy, Inc. | 10,364,286 | ||
| 277,477 | MDC Holdings, Inc. | 10,785,531 | ||
| 184,602 | PulteGroup, Inc. | 10,758,604 | ||
| 175,754 | Toll Brothers, Inc. | 10,550,513 | ||
| 64,022,134 | ||||
| Insurance – 4.1% | ||||
| 87,445 | American Financial Group, Inc. | 10,624,568 | ||
| 317,229 | Fidelity National Financial, Inc. | 11,080,809 | ||
| 145,537 | Principal Financial Group, Inc. | 10,816,310 | ||
| 277,515 | Unum Group | 10,978,493 | ||
| 43,500,180 | ||||
| Leisure Products – 1.0% | ||||
| 185,909 | Sturm Ruger & Co., Inc. | 10,678,613 | ||
| Machinery – 8.2% | ||||
| 85,599 | AGCO Corp. | 11,572,985 | ||
| 92,267 | Crane Holdings Co. | 10,472,304 | ||
| 151,468 | Graco, Inc. | 11,058,679 | ||
| 47,215 | IDEX Corp. | 10,908,081 | ||
| 129,215 | ITT, Inc. | 11,151,254 | ||
| 144,870 | Mueller Industries, Inc. | 10,645,048 | ||
| 44,139 | Snap-on, Inc. | 10,897,478 | ||
| Shares | Description | Value | ||
| COMMON STOCKS (Continued) | ||||
| Machinery (Continued) | ||||
| 224,810 | Terex Corp. | $10,876,308 | ||
| 87,582,137 | ||||
| Marine Transportation – 1.9% | ||||
| 223,377 | Eagle Bulk Shipping, Inc. | 10,163,653 | ||
| 169,768 | Matson, Inc. | 10,130,057 | ||
| 20,293,710 | ||||
| Media – 2.1% | ||||
| 303,399 | Interpublic Group of (The) Cos., Inc. | 11,298,579 | ||
| 118,233 | Omnicom Group, Inc. | 11,154,101 | ||
| 22,452,680 | ||||
| Metals & Mining – 4.1% | ||||
| 70,233 | Alpha Metallurgical Resources, Inc. | 10,956,348 | ||
| 231,241 | Commercial Metals Co. | 11,307,685 | ||
| 42,173 | Reliance Steel & Aluminum Co. | 10,827,496 | ||
| 97,835 | Steel Dynamics, Inc. | 11,061,225 | ||
| 44,152,754 | ||||
| Oil, Gas & Consumable Fuels – 9.4% | ||||
| 286,371 | California Resources Corp. | 11,025,284 | ||
| 83,829 | Chord Energy Corp. | 11,283,383 | ||
| 166,271 | Civitas Resources, Inc. | 11,362,960 | ||
| 191,181 | CONSOL Energy, Inc. | 11,140,117 | ||
| 348,336 | EQT Corp. | 11,115,402 | ||
| 518,643 | Magnolia Oil & Gas Corp., Class A | 11,347,909 | ||
| 234,969 | Matador Resources, Co. | 11,196,273 | ||
| 402,296 | SM Energy Co. | 11,328,655 | ||
| 6,254 | Texas Pacific Land Corp. | 10,638,179 | ||
| 100,438,162 | ||||
| Paper & Forest Products – 0.9% | ||||
| 186,757 | Louisiana-Pacific Corp. | 10,124,097 | ||
| Personal Care Products – 1.0% | ||||
| 99,539 | Medifast, Inc. | 10,319,208 | ||
| Professional Services – 4.0% | ||||
| 233,178 | Genpact Ltd. | 10,777,487 | ||
| 87,701 | Insperity, Inc. | 10,660,057 | ||
| 593,945 | Resources Connection, Inc. | 10,132,702 | ||
| 138,374 | Robert Half International, Inc. | 11,148,793 | ||
| 42,719,039 | ||||
| Real Estate Management & Development – 1.0% | ||||
| 330,826 | Marcus & Millichap, Inc. | 10,622,823 | ||
| Shares | Description | Value | ||
| Semiconductors & Semiconductor Equipment – 4.0% | ||||
| 408,324 | Amkor Technology, Inc. | $10,624,590 | ||
| 89,516 | Skyworks Solutions, Inc. | 10,561,098 | ||
| 97,092 | Teradyne, Inc. | 10,438,361 | ||
| 71,718 | Universal Display Corp. | 11,125,613 | ||
| 42,749,662 | ||||
| Specialty Retail – 2.9% | ||||
| 132,608 | Best Buy Co., Inc. | 10,379,228 | ||
| 290,149 | Buckle (The), Inc. | 10,355,418 | ||
| 70,298 | Dick’s Sporting Goods, Inc. | 9,974,583 | ||
| 30,709,229 | ||||
| Technology Hardware, Storage & Peripherals – 1.0% | ||||
| 165,518 | NetApp, Inc. | 10,568,324 | ||
| Textiles, Apparel & Luxury Goods – 2.8% | ||||
| 118,698 | Columbia Sportswear Co. | 10,711,307 | ||
| 304,666 | Movado Group, Inc. | 8,765,241 | ||
| 287,908 | Steven Madden Ltd. | 10,364,688 | ||
| 29,841,236 | ||||
| Trading Companies & Distributors – 2.0% | ||||
| 166,570 | Boise Cascade Co. | 10,535,552 | ||
| 34,380 | Watsco, Inc. | 10,938,341 | ||
| 21,473,893 | ||||
| Total Investments – 99.8% | 1,068,144,734 | |||
| (Cost $1,086,442,976) | ||||
| Net Other Assets and Liabilities – 0.2% | 2,041,620 | |||
| Net Assets – 100.0% | $1,070,186,354 | |||
| Total Value at 3/31/2023 | Level 1 Quoted Prices | Level 2 Significant Observable Inputs | Level 3 Significant Unobservable Inputs | |
| Common Stocks* | $ 1,068,144,734 | $ 1,068,144,734 | $ — | $ — |
| * | See Portfolio of Investments for industry breakout. |
| Shares | Description | Value | ||
| COMMON STOCKS – 99.0% | ||||
| Banks – 0.9% | ||||
| 2,552 | Wintrust Financial Corp. | $186,168 | ||
| Beverages – 2.4% | ||||
| 9,139 | Molson Coors Beverage Co., Class B | 472,304 | ||
| Building Products – 6.4% | ||||
| 8,335 | Builders FirstSource, Inc. (a) | 739,982 | ||
| 6,790 | UFP Industries, Inc. | 539,601 | ||
| 1,279,583 | ||||
| Capital Markets – 4.7% | ||||
| 8,779 | Franklin Resources, Inc. | 236,506 | ||
| 600 | Goldman Sachs Group (The), Inc. | 196,266 | ||
| 15,171 | Invesco, Ltd. | 248,805 | ||
| 7,799 | Jefferies Financial Group, Inc. | 247,540 | ||
| 929,117 | ||||
| Chemicals – 6.0% | ||||
| 7,784 | Chemours (The) Co. | 233,053 | ||
| 6,746 | Olin Corp. | 374,403 | ||
| 5,023 | Westlake Corp. | 582,568 | ||
| 1,190,024 | ||||
| Consumer Finance – 5.1% | ||||
| 14,255 | OneMain Holdings, Inc. | 528,575 | ||
| 16,682 | Synchrony Financial | 485,113 | ||
| 1,013,688 | ||||
| Containers & Packaging – 1.4% | ||||
| 10,902 | Graphic Packaging Holding Co. | 277,892 | ||
| Electric Utilities – 1.1% | ||||
| 14,100 | PG&E Corp. (a) | 227,997 | ||
| Electronic Equipment, Instruments & Components – 1.7% | ||||
| 3,751 | Jabil, Inc. | 330,688 | ||
| Financial Services – 2.4% | ||||
| 18,921 | Equitable Holdings, Inc. | 480,404 | ||
| Ground Transportation – 2.0% | ||||
| 7,241 | Knight-Swift Transportation Holdings, Inc. | 409,696 | ||
| Health Care Providers & Services – 10.6% | ||||
| 4,611 | Cardinal Health, Inc. | 348,131 | ||
| 5,076 | Centene Corp. (a) | 320,854 | ||
| 758 | Cigna (The) Group | 193,692 | ||
| 5,540 | CVS Health Corp. | 411,677 | ||
| 617 | McKesson Corp. | 219,683 | ||
| 10,434 | Tenet Healthcare Corp. (a) | 619,988 | ||
| 2,114,025 | ||||
| Shares | Description | Value | ||
| Hotels, Restaurants & Leisure – 1.0% | ||||
| 1,462 | Marriott Vacations Worldwide Corp. | $197,165 | ||
| Independent Power & Renewable Electricity Producers – 2.2% | ||||
| 18,543 | Vistra Energy Corp. | 445,032 | ||
| Insurance – 12.0% | ||||
| 5,306 | American International Group, Inc. | 267,210 | ||
| 7,541 | MetLife, Inc. | 436,926 | ||
| 2,340 | Principal Financial Group, Inc. | 173,909 | ||
| 5,596 | Prudential Financial, Inc. | 463,013 | ||
| 3,774 | Reinsurance Group of America, Inc. | 501,036 | ||
| 14,083 | Unum Group | 557,123 | ||
| 2,399,217 | ||||
| Media – 2.6% | ||||
| 2,987 | Nexstar Media Group, Inc. | 515,735 | ||
| Metals & Mining – 12.8% | ||||
| 6,115 | Commercial Metals Co. | 299,024 | ||
| 3,456 | Nucor Corp. | 533,848 | ||
| 2,577 | Reliance Steel & Aluminum Co. | 661,619 | ||
| 4,520 | Steel Dynamics, Inc. | 511,031 | ||
| 21,460 | United States Steel Corp. | 560,106 | ||
| 2,565,628 | ||||
| Oil, Gas & Consumable Fuels – 10.5% | ||||
| 3,569 | Chesapeake Energy Corp. | 271,387 | ||
| 1,584 | Chevron Corp. | 258,446 | ||
| 3,162 | Exxon Mobil Corp. | 346,745 | ||
| 4,839 | Marathon Petroleum Corp. | 652,442 | ||
| 5,658 | Phillips 66 | 573,608 | ||
| 2,102,628 | ||||
| Paper & Forest Products – 1.2% | ||||
| 4,278 | Louisiana-Pacific Corp. | 231,910 | ||
| Pharmaceuticals – 2.4% | ||||
| 49,260 | Viatris, Inc. | 473,881 | ||
| Semiconductors & Semiconductor Equipment – 1.3% | ||||
| 9,799 | Amkor Technology, Inc. | 254,970 | ||
| Specialty Retail – 5.9% | ||||
| 3,955 | AutoNation, Inc. (a) | 531,394 | ||
| 4,569 | Penske Automotive Group, Inc. | 647,930 | ||
| 1,179,324 | ||||
| Shares | Description | Value | ||
| COMMON STOCKS (Continued) | ||||
| Trading Companies & Distributors – 2.4% | ||||
| 3,149 | WESCO International, Inc. | $486,646 | ||
| Total Common Stocks | 19,763,722 | |||
| (Cost $19,423,450) | ||||
| REAL ESTATE INVESTMENT TRUSTS – 0.9% | ||||
| Mortgage Real Estate Investment Trusts – 0.9% | ||||
| 10,359 | Starwood Property Trust, Inc. | 183,251 | ||
| (Cost $205,621) | ||||
| Total Investments – 99.9% | 19,946,973 | |||
| (Cost $19,629,071) | ||||
| Net Other Assets and Liabilities – 0.1% | 19,805 | |||
| Net Assets – 100.0% | $19,966,778 | |||
| (a) | Non-income producing security. |
| Total Value at 3/31/2023 | Level 1 Quoted Prices | Level 2 Significant Observable Inputs | Level 3 Significant Unobservable Inputs | |
| Common Stocks* | $ 19,763,722 | $ 19,763,722 | $ — | $ — |
| Real Estate Investment Trusts* | 183,251 | 183,251 | — | — |
| Total Investments | $ 19,946,973 | $ 19,946,973 | $— | $— |
| * | See Portfolio of Investments for industry breakout. |
| Shares | Description | Value | ||
| COMMON STOCKS – 93.9% | ||||
| Aerospace & Defense – 1.0% | ||||
| 2,886 | Huntington Ingalls Industries, Inc. | $597,460 | ||
| Banks – 1.2% | ||||
| 21,952 | United Bankshares, Inc. | 772,710 | ||
| Beverages – 1.8% | ||||
| 5,004 | Constellation Brands, Inc., Class A | 1,130,353 | ||
| Biotechnology – 2.8% | ||||
| 11,028 | AbbVie, Inc. | 1,757,532 | ||
| Commercial Services & Supplies – 6.1% | ||||
| 14,201 | Republic Services, Inc. | 1,920,259 | ||
| 11,703 | Waste Management, Inc. | 1,909,579 | ||
| 3,829,838 | ||||
| Containers & Packaging – 2.2% | ||||
| 26,064 | Silgan Holdings, Inc. | 1,398,855 | ||
| Distributors – 2.5% | ||||
| 9,354 | Genuine Parts Co. | 1,565,018 | ||
| Electrical Equipment – 2.5% | ||||
| 10,692 | AMETEK, Inc. | 1,553,868 | ||
| Financial Services – 1.6% | ||||
| 6,851 | Jack Henry & Associates, Inc. | 1,032,583 | ||
| Food Products – 6.2% | ||||
| 8,258 | Hershey (The) Co. | 2,100,918 | ||
| 25,143 | Kraft Heinz (The) Co. | 972,280 | ||
| 8,790 | Post Holdings, Inc. (a) | 789,957 | ||
| 3,863,155 | ||||
| Gas Utilities – 1.0% | ||||
| 11,109 | National Fuel Gas Co. | 641,434 | ||
| Health Care Providers & Services – 16.4% | ||||
| 10,221 | AmerisourceBergen Corp. | 1,636,484 | ||
| 10,064 | Cardinal Health, Inc. | 759,832 | ||
| 3,500 | Chemed Corp. | 1,882,125 | ||
| 2,455 | Cigna (The) Group | 627,326 | ||
| 8,445 | CVS Health Corp. | 627,548 | ||
| 4,381 | McKesson Corp. | 1,559,855 | ||
| 10,829 | Quest Diagnostics, Inc. | 1,532,087 | ||
| 3,442 | UnitedHealth Group, Inc. | 1,626,655 | ||
| 10,251,912 | ||||
| Hotels, Restaurants & Leisure – 6.0% | ||||
| 7,259 | McDonald’s Corp. | 2,029,689 | ||
| 12,976 | Yum! Brands, Inc. | 1,713,870 | ||
| 3,743,559 | ||||
| Shares | Description | Value | ||
| Household Products – 2.8% | ||||
| 11,809 | Procter & Gamble (The) Co. | $1,755,880 | ||
| Insurance – 22.1% | ||||
| 23,678 | Aflac, Inc. | 1,527,704 | ||
| 4,912 | American Financial Group, Inc. | 596,808 | ||
| 3,431 | Arthur J. Gallagher & Co. | 656,385 | ||
| 7,748 | Chubb Ltd. | 1,504,507 | ||
| 12,089 | Globe Life, Inc. | 1,330,032 | ||
| 7,130 | Hanover Insurance Group (The), Inc. | 916,205 | ||
| 5,851 | Marsh & McLennan Cos., Inc. | 974,484 | ||
| 15,916 | MetLife, Inc. | 922,173 | ||
| 7,740 | Progressive (The) Corp. | 1,107,284 | ||
| 6,653 | RLI Corp. | 884,250 | ||
| 7,865 | Selective Insurance Group, Inc. | 749,770 | ||
| 9,134 | Travelers (The) Cos., Inc. | 1,565,659 | ||
| 17,272 | W.R. Berkley Corp. | 1,075,355 | ||
| 13,810,616 | ||||
| Machinery – 5.2% | ||||
| 3,981 | IDEX Corp. | 919,730 | ||
| 3,552 | Illinois Tool Works, Inc. | 864,734 | ||
| 2,621 | Nordson Corp. | 582,544 | ||
| 3,495 | Snap-on, Inc. | 862,881 | ||
| 3,229,889 | ||||
| Multi-Utilities – 2.6% | ||||
| 56,173 | CenterPoint Energy, Inc. | 1,654,857 | ||
| Pharmaceuticals – 6.0% | ||||
| 27,661 | Bristol-Myers Squibb Co. | 1,917,184 | ||
| 17,542 | Merck & Co., Inc. | 1,866,293 | ||
| 3,783,477 | ||||
| Professional Services – 1.7% | ||||
| 11,797 | Leidos Holdings, Inc. | 1,086,032 | ||
| Tobacco – 2.2% | ||||
| 13,839 | Philip Morris International, Inc. | 1,345,843 | ||
| Total Common Stocks | 58,804,871 | |||
| (Cost $58,467,796) | ||||
| REAL ESTATE INVESTMENT TRUSTS – 5.9% | ||||
| Retail REITs – 2.6% | ||||
| 37,622 | National Retail Properties, Inc. | 1,661,011 | ||
| Specialized REITs – 3.3% | ||||
| 25,697 | Gaming and Leisure Properties, Inc. | 1,337,786 | ||
| Shares | Description | Value | ||
| REAL ESTATE INVESTMENT TRUSTS (Continued) | ||||
| Specialized REITs (Continued) | ||||
| 21,903 | VICI Properties, Inc. | $714,476 | ||
| 2,052,262 | ||||
| Total Real Estate Investment Trusts | 3,713,273 | |||
| (Cost $3,609,014) | ||||
| Total Investments – 99.8% | 62,518,144 | |||
| (Cost $62,076,810) | ||||
| Net Other Assets and Liabilities – 0.2% | 98,067 | |||
| Net Assets – 100.0% | $62,616,211 | |||
| (a) | Non-income producing security. |
| Total Value at 3/31/2023 | Level 1 Quoted Prices | Level 2 Significant Observable Inputs | Level 3 Significant Unobservable Inputs | |
| Common Stocks* | $ 58,804,871 | $ 58,804,871 | $ — | $ — |
| Real Estate Investment Trusts* | 3,713,273 | 3,713,273 | — | — |
| Total Investments | $ 62,518,144 | $ 62,518,144 | $— | $— |
| * | See Portfolio of Investments for industry breakout. |
| First Trust SMID Cap Rising Dividend Achievers ETF (SDVY) | First Trust Dorsey Wright Momentum & Value ETF (DVLU) | First Trust Dorsey Wright Momentum & Low Volatility ETF (DVOL) | |||
| ASSETS: | |||||
Investments, at value | $ 1,068,144,734 | $ 19,946,973 | $ 62,518,144 | ||
Cash | 715,288 | 14,072 | 40,231 | ||
| Receivables: | |||||
Dividends | 1,870,416 | 15,980 | 89,235 | ||
Dividend reclaims | 11,453 | — | — | ||
Total Assets | 1,070,741,891 | 19,977,025 | 62,647,610 | ||
| LIABILITIES: | |||||
| Payables: | |||||
Investment advisory fees | 555,537 | 10,247 | 31,399 | ||
Total Liabilities | 555,537 | 10,247 | 31,399 | ||
NET ASSETS | $1,070,186,354 | $19,966,778 | $62,616,211 | ||
| NET ASSETS consist of: | |||||
Paid-in capital | $ 1,165,053,438 | $ 31,731,833 | $ 86,808,708 | ||
Par value | 401,500 | 9,000 | 24,500 | ||
Accumulated distributable earnings (loss) | (95,268,584) | (11,774,055) | (24,216,997) | ||
NET ASSETS | $1,070,186,354 | $19,966,778 | $62,616,211 | ||
NET ASSET VALUE, per share | $26.65 | $22.19 | $25.56 | ||
Number of shares outstanding (unlimited number of shares authorized, par value $0.01 per share) | 40,150,002 | 900,002 | 2,450,002 | ||
Investments, at cost | $1,086,442,976 | $19,629,071 | $62,076,810 |
| First Trust SMID Cap Rising Dividend Achievers ETF (SDVY) | First Trust Dorsey Wright Momentum & Value ETF (DVLU) | First Trust Dorsey Wright Momentum & Low Volatility ETF (DVOL) | ||||
| INVESTMENT INCOME: | ||||||
Dividends | $ 17,052,870 | $ 351,052 | $ 736,321 | |||
Interest | 34,492 | 574 | 1,564 | |||
Foreign withholding tax | (43,295) | (359) | — | |||
Other | 31 | — | — | |||
Total investment income | 17,044,098 | 351,267 | 737,885 | |||
| EXPENSES: | ||||||
Investment advisory fees | 3,018,682 | 65,266 | 213,879 | |||
Total expenses | 3,018,682 | 65,266 | 213,879 | |||
NET INVESTMENT INCOME (LOSS) | 14,025,416 | 286,001 | 524,006 | |||
| NET REALIZED AND UNREALIZED GAIN (LOSS): | ||||||
| Net realized gain (loss) on: | ||||||
Investments | (57,421,905) | (549,322) | (4,663,542) | |||
In-kind redemptions | 9,254,692 | 187,062 | 563,047 | |||
Net realized gain (loss) | (48,167,213) | (362,260) | (4,100,495) | |||
| Net change in unrealized appreciation (depreciation) on: | ||||||
Investments | 168,592,364 | 2,185,917 | 9,711,660 | |||
NET REALIZED AND UNREALIZED GAIN (LOSS) | 120,425,151 | 1,823,657 | 5,611,165 | |||
NET INCREASE (DECREASE) IN NET ASSETS RESULTING FROM OPERATIONS | $ 134,450,567 | $ 2,109,658 | $ 6,135,171 | |||
| First Trust SMID Cap Rising Dividend Achievers ETF (SDVY) | First Trust Dorsey Wright Momentum & Value ETF (DVLU) | ||||||
| Six Months Ended 3/31/2023 (Unaudited) | Year Ended 9/30/2022 | Six Months Ended 3/31/2023 (Unaudited) | Year Ended 9/30/2022 | ||||
| OPERATIONS: | |||||||
Net investment income (loss) | $ 14,025,416 | $ 15,508,578 | $ 286,001 | $ 401,682 | |||
Net realized gain (loss) | (48,167,213) | (24,538,123) | (362,260) | (1,579,870) | |||
Net change in unrealized appreciation (depreciation) | 168,592,364 | (182,334,771) | 2,185,917 | (1,474,104) | |||
Net increase (decrease) in net assets resulting from operations | 134,450,567 | (191,364,316) | 2,109,658 | (2,652,292) | |||
| DISTRIBUTIONS TO SHAREHOLDERS FROM: | |||||||
Investment operations | (13,823,521) | (14,025,016) | (284,306) | (416,941) | |||
| SHAREHOLDER TRANSACTIONS: | |||||||
Proceeds from shares sold | 210,359,374 | 937,688,574 | 1,092,214 | 5,097,895 | |||
Cost of shares redeemed | (80,421,269) | (123,351,150) | (2,320,003) | (8,523,685) | |||
Net increase (decrease) in net assets resulting from shareholder transactions | 129,938,105 | 814,337,424 | (1,227,789) | (3,425,790) | |||
Total increase (decrease) in net assets | 250,565,151 | 608,948,092 | 597,563 | (6,495,023) | |||
| NET ASSETS: | |||||||
Beginning of period | 819,621,203 | 210,673,111 | 19,369,215 | 25,864,238 | |||
End of period | $1,070,186,354 | $819,621,203 | $19,966,778 | $19,369,215 | |||
| CHANGES IN SHARES OUTSTANDING: | |||||||
Shares outstanding, beginning of period | 35,500,002 | 7,450,002 | 950,002 | 1,100,002 | |||
Shares sold | 7,700,000 | 32,800,000 | 50,000 | 200,000 | |||
Shares redeemed | (3,050,000) | (4,750,000) | (100,000) | (350,000) | |||
Shares outstanding, end of period | 40,150,002 | 35,500,002 | 900,002 | 950,002 | |||
| First Trust Dorsey Wright Momentum & Low Volatility ETF (DVOL) | ||
| Six Months Ended 3/31/2023 (Unaudited) | Year Ended 9/30/2022 | |
| $ 524,006 | $ 1,144,440 | |
| (4,100,495) | 4,581,875 | |
| 9,711,660 | (18,738,146) | |
| 6,135,171 | (13,011,831) | |
| (629,266) | (1,071,096) | |
| 2,655,083 | 93,110,294 | |
| (26,998,338) | (118,688,168) | |
| (24,343,255) | (25,577,874) | |
| (18,837,350) | (39,660,801) | |
| 81,453,561 | 121,114,362 | |
| $62,616,211 | $81,453,561 | |
| 3,400,002 | 4,400,002 | |
| 100,000 | 3,300,000 | |
| (1,050,000) | (4,300,000) | |
| 2,450,002 | 3,400,002 | |
| Six Months Ended 3/31/2023 (Unaudited) | Year Ended September 30, | Period Ended 9/30/2018 (a) | ||||||||||
| 2022 | 2021 | 2020 | 2019 | |||||||||
Net asset value, beginning of period | $ 23.09 | $ 28.28 | $ 18.27 | $ 20.37 | $ 21.28 | $ 19.94 | ||||||
| Income from investment operations: | ||||||||||||
Net investment income (loss) | 0.36 | 0.51 | 0.36 | 0.33 | 0.35 | 0.26 | ||||||
Net realized and unrealized gain (loss) | 3.56 | (5.21) | 9.99 | (2.08) | (0.92) | 1.31 | ||||||
Total from investment operations | 3.92 | (4.70) | 10.35 | (1.75) | (0.57) | 1.57 | ||||||
| Distributions paid to shareholders from: | ||||||||||||
Net investment income | (0.36) | (0.49) | (0.34) | (0.35) | (0.34) | (0.23) | ||||||
Net asset value, end of period | $26.65 | $23.09 | $28.28 | $18.27 | $20.37 | $21.28 | ||||||
Total return (b) | 17.02% | (16.78)% | 56.77% | (8.56)% | (2.59)% | 7.92% | ||||||
| Ratios to average net assets/supplemental data: | ||||||||||||
Net assets, end of period (in 000’s) | $ 1,070,186 | $ 819,621 | $ 210,673 | $ 10,050 | $ 7,128 | $ 4,257 | ||||||
Ratio of total expenses to average net assets | 0.60% (c) | 0.60% | 0.60% | 0.60% | 0.60% | 0.60% (c) | ||||||
Ratio of net investment income (loss) to average net assets | 2.79% (c) | 2.25% | 1.77% | 1.83% | 1.95% | 1.49% (c) | ||||||
Portfolio turnover rate (d) | 48% | 86% | 36% | 76% | 78% | 72% | ||||||
| (a) | Inception date is November 1, 2017, which is consistent with the commencement of investment operations and is the date the initial creation units were established. |
| (b) | Total return is calculated assuming an initial investment made at the net asset value at the beginning of the period, reinvestment of all distributions at net asset value during the period, and redemption at net asset value on the last day of the period. The returns presented do not reflect the deduction of taxes that a shareholder would pay on Fund distributions or the redemption or sale of Fund shares. Total return is calculated for the time period presented and is not annualized for periods of less than a year. |
| (c) | Annualized. |
| (d) | Portfolio turnover is calculated for the time period presented and is not annualized for periods of less than a year and does not include securities received or delivered from processing creations or redemptions and in-kind transactions. |
| Six Months Ended 3/31/2023 (Unaudited) | Year Ended September 30, | Period Ended 9/30/2018 (a) | ||||||||||
| 2022 | 2021 | 2020 | 2019 | |||||||||
Net asset value, beginning of period | $ 20.39 | $ 23.51 | $ 15.07 | $ 18.52 | $ 19.46 | $ 19.98 | ||||||
| Income from investment operations: | ||||||||||||
Net investment income (loss) | 0.30 | 0.40 | 0.29 | 0.25 | 0.33 | 0.02 | ||||||
Net realized and unrealized gain (loss) | 1.80 | (3.11) | 8.42 | (3.44) | (0.94) | (0.54) | ||||||
Total from investment operations | 2.10 | (2.71) | 8.71 | (3.19) | (0.61) | (0.52) | ||||||
| Distributions paid to shareholders from: | ||||||||||||
Net investment income | (0.30) | (0.41) | (0.27) | (0.26) | (0.33) | — | ||||||
Net asset value, end of period | $22.19 | $20.39 | $23.51 | $15.07 | $18.52 | $19.46 | ||||||
Total return (b) | 10.33% | (11.71)% | 57.98% | (17.19)% | (3.04)% | (2.60)% | ||||||
| Ratios to average net assets/supplemental data: | ||||||||||||
Net assets, end of period (in 000’s) | $ 19,967 | $ 19,369 | $ 25,864 | $ 14,320 | $ 19,451 | $ 13,625 | ||||||
Ratio of total expenses to average net assets | 0.60% (c) | 0.60% | 0.60% | 0.60% | 0.60% | 0.60% (c) | ||||||
Ratio of net investment income (loss) to average net assets | 2.63% (c) | 1.64% | 1.68% | 1.56% | 2.01% | 3.61% (c) | ||||||
Portfolio turnover rate (d) | 97% | 230% | 195% | 205% | 152% | 0% | ||||||
| (a) | Inception date is September 5, 2018, which is consistent with the commencement of investment operations and is the date the initial creation units were established. |
| (b) | Total return is calculated assuming an initial investment made at the net asset value at the beginning of the period, reinvestment of all distributions at net asset value during the period, and redemption at net asset value on the last day of the period. The returns presented do not reflect the deduction of taxes that a shareholder would pay on Fund distributions or the redemption or sale of Fund shares. Total return is calculated for the time period presented and is not annualized for periods of less than a year. |
| (c) | Annualized. |
| (d) | Portfolio turnover is calculated for the time period presented and is not annualized for periods of less than a year and does not include securities received or delivered from processing creations or redemptions and in-kind transactions. |
| Six Months Ended 3/31/2023 (Unaudited) | Year Ended September 30, | Period Ended 9/30/2018 (a) | ||||||||||
| 2022 | 2021 | 2020 | 2019 | |||||||||
Net asset value, beginning of period | $ 23.96 | $ 27.53 | $ 22.46 | $ 22.81 | $ 19.94 | $ 19.97 | ||||||
| Income from investment operations: | ||||||||||||
Net investment income (loss) | 0.21 | 0.32 | 0.10 | 0.28 | 0.29 | 0.03 | ||||||
Net realized and unrealized gain (loss) | 1.63 | (3.60) | 5.06 | (0.30) | 2.85 | (0.06) | ||||||
Total from investment operations | 1.84 | (3.28) | 5.16 | (0.02) | 3.14 | (0.03) | ||||||
| Distributions paid to shareholders from: | ||||||||||||
Net investment income | (0.24) | (0.29) | (0.09) | (0.33) | (0.27) | — | ||||||
Net asset value, end of period | $25.56 | $23.96 | $27.53 | $22.46 | $22.81 | $19.94 | ||||||
Total return (b) | 7.67% | (12.02)% | 22.98% | 0.03% | 15.93% | (0.15)% | ||||||
| Ratios to average net assets/supplemental data: | ||||||||||||
Net assets, end of period (in 000’s) | $ 62,616 | $ 81,454 | $ 121,114 | $ 124,674 | $ 131,169 | $ 13,960 | ||||||
Ratio of total expenses to average net assets | 0.60% (c) | 0.60% | 0.60% | 0.60% | 0.60% | 0.60% (c) | ||||||
Ratio of net investment income (loss) to average net assets | 1.47% (c) | 1.04% | 0.36% | 1.21% | 2.37% | 3.81% (c) | ||||||
Portfolio turnover rate (d) | 63% | 169% | 136% | 187% | 81% | 0% | ||||||
| (a) | Inception date is September 5, 2018, which is consistent with the commencement of investment operations and is the date the initial creation units were established. |
| (b) | Total return is calculated assuming an initial investment made at the net asset value at the beginning of the period, reinvestment of all distributions at net asset value during the period, and redemption at net asset value on the last day of the period. The returns presented do not reflect the deduction of taxes that a shareholder would pay on Fund distributions or the redemption or sale of Fund shares. Total return is calculated for the time period presented and is not annualized for periods of less than a year. |
| (c) | Annualized. |
| (d) | Portfolio turnover is calculated for the time period presented and is not annualized for periods of less than a year and does not include securities received or delivered from processing creations or redemptions and in-kind transactions. |
| Fund | Index |
| First Trust SMID Cap Rising Dividend Achievers ETF | Nasdaq US Small Mid Cap Rising Dividend AchieversTM Index |
| First Trust Dorsey Wright Momentum & Value ETF | DorseyWright Momentum Plus ValueTM Index |
| First Trust Dorsey Wright Momentum & Low Volatility ETF | DorseyWright Momentum Plus Low VolatilityTM Index |
| 1) | the last sale price on the exchange on which they are principally traded or, for Nasdaq and AIM securities, the official closing price; |
| 2) | the type of security; |
| 3) | the size of the holding; |
| 4) | the initial cost of the security; |
| 5) | transactions in comparable securities; |
| 6) | price quotes from dealers and/or third-party pricing services; |
| 7) | relationships among various securities; |
| 8) | information obtained by contacting the issuer, analysts, or the appropriate stock exchange; |
| 9) | an analysis of the issuer’s financial statements; |
| 10) | the existence of merger proposals or tender offers that might affect the value of the security; and |
| 11) | other relevant factors. |
| • | Level 1 – Level 1 inputs are quoted prices in active markets for identical investments. An active market is a market in which transactions for the investment occur with sufficient frequency and volume to provide pricing information on an ongoing basis. |
| • | Level 2 – Level 2 inputs are observable inputs, either directly or indirectly, and include the following: |
| o | Quoted prices for similar investments in active markets. |
| o | Quoted prices for identical or similar investments in markets that are non-active. A non-active market is a market where there are few transactions for the investment, the prices are not current, or price quotations vary substantially either over time or among market makers, or in which little information is released publicly. |
| o | Inputs other than quoted prices that are observable for the investment (for example, interest rates and yield curves observable at commonly quoted intervals, volatilities, prepayment speeds, loss severities, credit risks, and default rates). |
| o | Inputs that are derived principally from or corroborated by observable market data by correlation or other means. |
| • | Level 3 – Level 3 inputs are unobservable inputs. Unobservable inputs may reflect the reporting entity’s own assumptions about the assumptions that market participants would use in pricing the investment. |
| Distributions paid from Ordinary Income | Distributions paid from Capital Gains | Distributions paid from Return of Capital | |||
First Trust SMID Cap Rising Dividend Achievers ETF | $ 14,025,016 | $ — | $ — | ||
First Trust Dorsey Wright Momentum & Value ETF | 416,941 | — | — | ||
First Trust Dorsey Wright Momentum & Low Volatility ETF | 1,071,096 | — | — |
| Undistributed Ordinary Income | Accumulated Capital and Other Gain (Loss) | Net Unrealized Appreciation (Depreciation) | |||
First Trust SMID Cap Rising Dividend Achievers ETF | $ 1,623,821 | $ (17,877,189) | $ (199,642,262) | ||
First Trust Dorsey Wright Momentum & Value ETF | 27,114 | (11,751,888) | (1,874,633) | ||
First Trust Dorsey Wright Momentum & Low Volatility ETF | 149,989 | (20,592,809) | (9,280,082) |
| Non-Expiring Capital Loss Carryforward | |
First Trust SMID Cap Rising Dividend Achievers ETF | $ 17,877,189 |
First Trust Dorsey Wright Momentum & Value ETF | 11,751,888 |
First Trust Dorsey Wright Momentum & Low Volatility ETF | 20,592,809 |
| Tax Cost | Gross Unrealized Appreciation | Gross Unrealized (Depreciation) | Net Unrealized Appreciation (Depreciation) | ||||
First Trust SMID Cap Rising Dividend Achievers ETF | $ 1,086,442,976 | $ 52,107,364 | $ (70,405,606) | $ (18,298,242) | |||
First Trust Dorsey Wright Momentum & Value ETF | 19,629,071 | 1,613,345 | (1,295,443) | 317,902 | |||
First Trust Dorsey Wright Momentum & Low Volatility ETF | 62,076,810 | 2,427,339 | (1,986,005) | 441,334 |
| Breakpoints | SDVY | DVLU | DVOL | ||||
| Fund net assets up to and including $2.5 billion | 0.600% | 0.600% | 0.600% | ||||
| Fund net assets greater than $2.5 billion up to and including $5 billion | 0.585% | 0.585% | 0.585% | ||||
| Fund net assets greater than $5 billion up to and including $7.5 billion | 0.570% | 0.570% | 0.570% | ||||
| Fund net assets greater than $7.5 billion up to and including $10 billion | 0.555% | 0.555% | 0.555% | ||||
| Fund net assets greater than $10 billion up to and including $15 billion | 0.540% | 0.540% | 0.540% | ||||
| Fund net assets greater than $15 billion | 0.510% | 0.510% | 0.510% |
| Purchases | Sales | ||
| First Trust SMID Cap Rising Dividend Achievers ETF | $ 484,915,624 | $ 484,969,559 | |
| First Trust Dorsey Wright Momentum & Value ETF | 20,987,923 | 20,994,318 | |
| First Trust Dorsey Wright Momentum & Low Volatility ETF | 45,737,504 | 45,800,279 | |
| Purchases | Sales | ||
| First Trust SMID Cap Rising Dividend Achievers ETF | $ 209,544,975 | $ 80,094,245 | |
| First Trust Dorsey Wright Momentum & Value ETF | 1,089,751 | 2,297,106 | |
| First Trust Dorsey Wright Momentum & Low Volatility ETF | 2,651,215 | 26,940,433 |
| NOT FDIC INSURED | NOT BANK GUARANTEED | MAY LOSE VALUE |
FUND ACCOUNTANT &
TRANSFER AGENT
PUBLIC ACCOUNTING FIRM
| (b) | Not applicable. |
Item 2. Code of Ethics.
Not applicable.
Item 3. Audit Committee Financial Expert.
Not applicable.
Item 4. Principal Accountant Fees and Services.
Not applicable.
Item 5. Audit Committee of Listed Registrants.
Not applicable.
Item 6. Schedule of Investments.
| (a) | Schedules of Investments in securities of unaffiliated issuers as of the close of the reporting period are included as part of the report to shareholders filed under Item 1 of this form. |
| (b) | Not applicable. |
Item 7. Disclosure of Proxy Voting Policies and Procedures for Closed-End Management Investment Companies.
Not applicable.
Item 8. Portfolio Managers of Closed-End Management Investment Companies.
Not applicable.
Item 9. Purchases of Equity Securities by Closed-End Management Investment Company and Affiliated Purchasers.
Not applicable.
Item 10. Submission of Matters to a Vote of Security Holders.
There have been no material changes to the procedures by which the shareholders may recommend nominees to the registrant’s board of directors, where those changes were implemented after the registrant last provided disclosure in response to the requirements of Item 407(c)(2)(iv) of Regulation S-K (17 CFR 229.407) (as required by Item 22(b)(15) of Schedule 14A (17 CFR 240.14a-101)), or this Item.
Item 11. Controls and Procedures.
| (a) | The registrant’s principal executive and principal financial officers, or persons performing similar functions, have concluded that the registrant’s disclosure controls and procedures (as defined in Rule 30a-3(c) under the Investment Company Act of 1940, as amended (the “1940 Act”) (17 CFR 270.30a-3 (c))) are effective, as of a date within 90 days of the filing date of the report that includes the disclosure required by this paragraph, based on their evaluation of these controls and procedures required by Rule 30a-3(b) under the 1940 Act (17 CFR 270.30a-3(b)) and Rules 13a-15(b) or 15d-15(b) under the Securities Exchange Act of 1934, as amended (17 CFR 240.13a-15(b) or 240.15d-15 (b)). |
| (b) | There were no changes in the registrant’s internal control over financial reporting (as defined in Rule 30a-3(d) under the 1940 Act (17 CFR 270.30a-3(d)) that occurred during the period covered by this report have materially affected, or are reasonably likely to materially affect, the registrant’s internal control over financial reporting. |
Item 12. Disclosure of Securities Lending Activities for Closed-End Management Investment Companies.
| (a) | Not applicable. |
| (b) | Not applicable. |
Item 13. Exhibits.
| (a)(1) | Not applicable. |
| (a)(2) | Certifications pursuant to Rule 30a-2(a) under the 1940 Act and Section 302 of the Sarbanes-Oxley Act of 2002 are attached hereto. |
| (a)(3) | Not applicable. |
| (a)(4) | Not applicable. |
| (b) | Certifications pursuant to Rule 30a-2(b) under the 1940 Act and Section 906 of the Sarbanes-Oxley Act of 2002 are attached hereto. |
SIGNATURES
Pursuant to the requirements of the Securities Exchange Act of 1934 and the Investment Company Act of 1940, the registrant has duly caused this report to be signed on its behalf by the undersigned, thereunto duly authorized.
| (registrant) | First Trust Exchange-Traded Fund VI |
| By (Signature and Title)* | /s/ James M. Dykas | |
| James M. Dykas, President and Chief Executive Officer (principal executive officer) |
| Date: | June 9, 2023 |
Pursuant to the requirements of the Securities Exchange Act of 1934 and the Investment Company Act of 1940, this report has been signed below by the following persons on behalf of the registrant and in the capacities and on the dates indicated.
| By (Signature and Title)* | /s/ James M. Dykas | |
| James M. Dykas, President and Chief Executive Officer (principal executive officer) |
| Date: | June 9, 2023 |
| By (Signature and Title)* | /s/ Donald P. Swade | |
| Donald P. Swade, Treasurer, Chief Financial Officer and Chief Accounting Officer (principal financial officer) |
| Date: | June 9, 2023 |
* Print the name and title of each signing officer under his or her signature.