UNITED STATES
SECURITIES AND EXCHANGE COMMISSION
Washington, D.C. 20549
FORM N-CSR
CERTIFIED SHAREHOLDER REPORT OF REGISTERED MANAGEMENT INVESTMENT COMPANIES
Investment Company Act file number 811-22717
| First Trust Exchange-Traded Fund VI |
| (Exact name of registrant as specified in charter) |
| 120 East Liberty Drive, Suite 400 Wheaton, IL 60187 |
| (Address of principal executive offices) |
| W. Scott Jardine, Esq. First Trust Portfolios L.P. 120 East Liberty Drive, Suite 400 Wheaton, IL 60187 |
| (Name and address of agent for service) |
Registrant’s telephone number, including area code: (630) 765-8000
Date of fiscal year end: September 30
Date of reporting period: September 30, 2022
Form N-CSR is to be used by management investment companies to file reports with the Commission not later than 10 days after the transmission to stockholders of any report that is required to be transmitted to stockholders under Rule 30e-1 under the Investment Company Act of 1940 (17 CFR 270.30e-1). The Commission may use the information provided on Form N-CSR in its regulatory, disclosure review, inspection, and policymaking roles.
A registrant is required to disclose the information specified by Form N-CSR, and the Commission will make this information public. A registrant is not required to respond to the collection of information contained in Form N-CSR unless the Form displays a currently valid Office of Management and Budget (“OMB”) control number. Please direct comments concerning the accuracy of the information collection burden estimate and any suggestions for reducing the burden to Secretary, Securities and Exchange Commission, 100 F Street, NE, Washington, DC 20549. The OMB has reviewed this collection of information under the clearance requirements of 44 U.S.C. § 3507.
Item 1. Report to Stockholders.
The registrant’s annual report transmitted to shareholders pursuant to Rule 30e-1 under the Investment Company Act of 1940 is as follows:

Book 1
First Trust NASDAQ Technology Dividend Index Fund (TDIV)
Multi-Asset Diversified Income Index Fund (MDIV)
First Trust S&P International Dividend Aristocrats ETF (FID)
First Trust BuyWrite Income ETF (FTHI)
First Trust Nasdaq BuyWrite Income ETF (FTQI)
(formerlyFirst Trust Hedged BuyWrite Income ETF (FTLB))
First Trust Rising Dividend Achievers ETF (RDVY)
First Trust Dorsey Wright Focus 5 ETF (FV)
First Trust RBA American Industrial Renaissance® ETF (AIRR)
First Trust Dorsey Wright Momentum & Dividend ETF (DDIV)
First Trust Dorsey Wright International Focus 5 ETF (IFV)
First Trust Dorsey Wright Dynamic Focus 5 ETF (FVC)
First Trust Indxx Innovative Transaction & Process ETF (LEGR)
First Trust Nasdaq Artificial Intelligence and Robotics ETF (ROBT)
First Trust International Developed Capital Strength ETF (FICS)
For the Year Ended
September 30, 2022
| 2 | |
| 3 | |
| Fund Performance Overview | |
| 4 | |
| 6 | |
| 8 | |
| 11 | |
| 14 | |
| 18 | |
| 20 | |
| 22 | |
| 24 | |
| 26 | |
| 28 | |
| 30 | |
| 32 | |
| 34 | |
| 36 | |
| 37 | |
| Portfolio of Investments | |
| 39 | |
| 41 | |
| 47 | |
| 50 | |
| 56 | |
| 60 | |
| 62 | |
| 63 | |
| 64 | |
| 66 | |
| 67 | |
| 68 | |
| 72 | |
| 76 | |
| 78 | |
| 82 | |
| 86 | |
| 92 | |
| 106 | |
| 124 | |
| 127 | |
| 138 | |
| 140 |


| Performance | ||||||||
| Average Annual Total Returns | Cumulative Total Returns | |||||||
| 1 Year Ended 9/30/22 | 5 Years Ended 9/30/22 | 10 Years Ended 9/30/22 | Inception (8/13/12) to 9/30/22 | 5 Years Ended 9/30/22 | 10 Years Ended 9/30/22 | Inception (8/13/12) to 9/30/22 | ||
| Fund Performance | ||||||||
| NAV | -20.93% | 8.61% | 10.97% | 10.74% | 51.16% | 183.23% | 181.19% | |
| Market Price | -20.90% | 8.63% | 10.97% | 10.74% | 51.23% | 183.12% | 181.22% | |
| Index Performance | ||||||||
| Nasdaq Technology Dividend IndexTM | -20.54% | 9.30% | 11.68% | 11.45% | 55.98% | 201.83% | 199.88% | |
| S&P 500® Index | -15.47% | 9.24% | 11.70% | 11.86% | 55.55% | 202.44% | 211.22% | |
| S&P 500® Information Technology Index | -20.00% | 16.74% | 17.09% | 17.13% | 116.78% | 384.27% | 396.21% | |
| Sector Allocation | % of Total Investments |
| Information Technology | 85.4% |
| Communication Services | 14.1 |
| Industrials | 0.5 |
| Total | 100.0% |
| Top Ten Holdings | % of Total Investments |
| International Business Machines Corp. | 8.5% |
| Microsoft Corp. | 8.1 |
| Broadcom, Inc. | 8.1 |
| Apple, Inc. | 8.0 |
| Intel Corp. | 7.4 |
| Texas Instruments, Inc. | 4.3 |
| QUALCOMM, Inc. | 3.9 |
| Oracle Corp. | 3.8 |
| Taiwan Semiconductor Manufacturing Co., Ltd., ADR | 2.9 |
| Analog Devices, Inc. | 2.4 |
| Total | 57.4% |
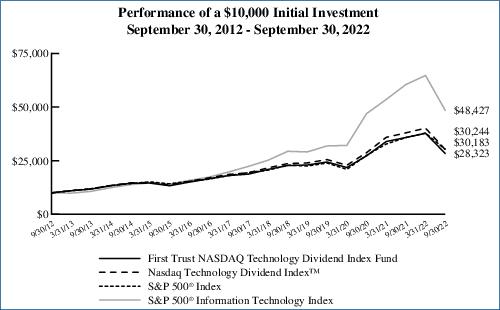
Performance figures assume reinvestment of all distributions and do not reflect the deduction of taxes that a shareholder would pay on Fund distributions or the redemption or sale of Fund shares. An index is a statistical composite that tracks a specified financial market or sector. Unlike the Fund, the indices do not actually hold a portfolio of securities and therefore do not incur the expenses incurred by the Fund. These expenses negatively impact the performance of the Fund. The Fund’s past performance does not predict future performance.
| Performance | ||||||||
| Average Annual Total Returns | Cumulative Total Returns | |||||||
| 1 Year Ended 9/30/22 | 5 Years Ended 9/30/22 | 10 Years Ended 9/30/22 | Inception (8/13/12) to 9/30/22 | 5 Years Ended 9/30/22 | 10 Years Ended 9/30/22 | Inception (8/13/12) to 9/30/22 | ||
| Fund Performance | ||||||||
| NAV | -6.25% | 0.30% | 2.71% | 2.79% | 1.52% | 30.59% | 32.14% | |
| Market Price | -6.25% | 0.35% | 2.71% | 2.80% | 1.75% | 30.62% | 32.23% | |
| Index Performance | ||||||||
| Nasdaq US Multi-Asset Diversified Income IndexSM | -5.80% | 0.84% | 3.34% | 3.43% | 4.29% | 38.87% | 40.71% | |
| S&P 500® Index | -15.47% | 9.24% | 11.70% | 11.86% | 55.55% | 202.44% | 211.22% | |
| Dow Jones U.S. Select DividendTM Index* | -3.10% | 6.89% | 10.53% | 10.53% | 39.56% | 172.03% | 175.69% | |
| * | The Dow Jones U.S. Select DividendTM Index represents 100 of the United States’ leading stocks by dividend yield. |
| Sector Allocation | % of Total Investments |
| Financials | 31.3% |
| Other* | 20.7 |
| Energy | 19.8 |
| Real Estate | 11.8 |
| Communication Services | 3.4 |
| Industrials | 3.3 |
| Consumer Staples | 2.9 |
| Utilities | 2.4 |
| Materials | 1.6 |
| Information Technology | 1.1 |
| Consumer Discretionary | 1.0 |
| Health Care | 0.7 |
| Total | 100.0% |
| * | Exchange-traded fund with holdings representing multiple sectors. |
| Top Ten Holdings | % of Total Investments |
| First Trust Tactical High Yield ETF | 20.7% |
| Icahn Enterprises, L.P. | 1.5 |
| SL Green Realty Corp. | 1.4 |
| Old Republic International Corp. | 1.2 |
| USA Compression Partners, L.P. | 1.2 |
| WESCO International, Inc., Series A | 1.2 |
| Ready Capital Corp. | 1.1 |
| KNOT Offshore Partners, L.P. | 1.1 |
| Broadmark Realty Capital, Inc. | 1.1 |
| Two Harbors Investment Corp. | 1.0 |
| Total | 31.5% |

Performance figures assume reinvestment of all distributions and do not reflect the deduction of taxes that a shareholder would pay on Fund distributions or the redemption or sale of Fund shares. An index is a statistical composite that tracks a specified financial market or sector. Unlike the Fund, the indices do not actually hold a portfolio of securities and therefore do not incur the expenses incurred by the Fund. These expenses negatively impact the performance of the Fund. The Fund’s past performance does not predict future performance.
| Performance | ||||||
| Average Annual Total Returns | Cumulative Total Returns | |||||
| 1 Year Ended 9/30/22 | 5 Years Ended 9/30/22 | Inception (8/22/13) to 9/30/22 | 5 Years Ended 9/30/22 | Inception (8/22/13) to 9/30/22 | ||
| Fund Performance | ||||||
| NAV | -18.39% | -1.73% | 0.53% | -8.34% | 4.93% | |
| Market Price | -18.15% | -1.80% | 0.54% | -8.69% | 4.99% | |
| Index Performance | ||||||
| S&P International Dividend Aristocrats Index(1) | -17.19% | N/A | N/A | N/A | N/A | |
| Dow Jones EPAC Select DividendTM Index(2) | -20.66% | -1.91% | 0.95% | -9.21% | 8.95% | |
| MSCI World ex USA Index | -23.91% | -0.39% | 2.33% | -1.96% | 23.34% | |
| (1) | On August 30, 2018, the Fund’s underlying index changed from the Nasdaq International Multi-Asset Diversified Income IndexSM to the S&P International Dividend Aristocrats Index (the “Index”). Therefore, the Fund’s performance and historical returns shown for the periods prior to August 30, 2018, are not necessarily indicative of the performance that the Fund, based on its current index, would have generated. Since the Index had an inception date of April 30, 2018, it was not in existence for all of the periods disclosed. The old index was terminated on November 23, 2018, so performance data does not exist for these time periods. |
| (2) | The Dow Jones EPAC Select DividendTM Index measures the performance of a selected group of companies, from non-U.S. developed markets (Europe, Pacific Asia, and Canada), that have provided relatively high dividend yields on a consistent basis over time. |
| Sector Allocation | % of Total Investments |
| Financials | 24.9% |
| Utilities | 24.0 |
| Real Estate | 16.4 |
| Industrials | 7.9 |
| Energy | 7.8 |
| Communication Services | 6.9 |
| Materials | 4.6 |
| Consumer Staples | 4.2 |
| Health Care | 3.3 |
| Total | 100.0% |
| Country Allocation | % of Total Investments |
| Canada | 25.3% |
| Japan | 17.4 |
| Hong Kong | 14.8 |
| Switzerland | 10.5 |
| United Kingdom | 6.1 |
| France | 3.3 |
| Germany | 2.8 |
| Spain | 2.2 |
| South Korea | 2.2 |
| Mexico | 2.0 |
| Finland | 2.0 |
| Australia | 1.8 |
| Bermuda | 1.6 |
| Norway | 1.4 |
| Singapore | 1.4 |
| Portugal | 1.3 |
| Belgium | 1.2 |
| Cayman Islands | 1.0 |
| Sweden | 0.9 |
| Netherlands | 0.8 |
| Total | 100.0% |
| Top Ten Holdings | % of Total Investments |
| Sino Land Co., Ltd. | 2.3% |
| Capital Power Corp. | 2.3 |
| Enagas S.A. | 2.2 |
| Keyera Corp. | 2.2 |
| KT&G Corp. | 2.2 |
| Electric Power Development Co., Ltd. | 2.1 |
| Takeda Pharmaceutical Co., Ltd. | 2.0 |
| Arca Continental S.A.B. de C.V. | 2.0 |
| New World Development Co., Ltd. | 1.9 |
| Sun Hung Kai Properties Ltd. | 1.9 |
| Total | 21.1% |
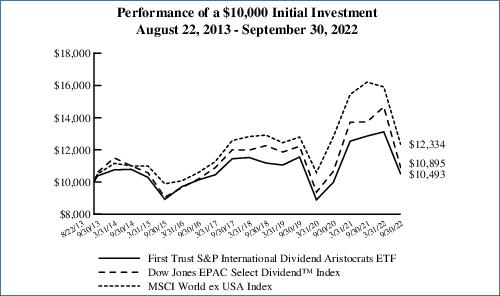
Performance figures assume reinvestment of all distributions and do not reflect the deduction of taxes that a shareholder would pay on Fund distributions or the redemption or sale of Fund shares. An index is a statistical composite that tracks a specified financial market or sector. Unlike the Fund, the indices do not actually hold a portfolio of securities and therefore do not incur the expenses incurred by the Fund. These expenses negatively impact the performance of the Fund. The Fund’s past performance does not predict future performance.
| Performance | ||||||
| Average Annual Total Returns | Cumulative Total Returns | |||||
| 1 Year Ended 9/30/22 | 5 Years Ended 9/30/22 | Inception (1/6/14) to 9/30/22 | 5 Years Ended 9/30/22 | Inception (1/6/14) to 9/30/22 | ||
| Fund Performance | ||||||
| NAV | -7.60% | 1.07% | 3.97% | 5.49% | 40.53% | |
| Market Price | -7.40% | 1.11% | 4.01% | 5.67% | 40.90% | |
| Index Performance | ||||||
| CBOE S&P 500 BuyWrite Monthly Index(1) | -11.21% | 1.94% | 4.28% | 10.11% | 44.16% | |
| S&P 500® Index | -15.47% | 9.24% | 10.12% | 55.55% | 131.98% | |
| (1) | The CBOE S&P 500 BuyWrite Monthly Index is a benchmark index designed to track the performance of a hypothetical buy-write strategy on the S&P 500® Index. |
| Sector Allocation | % of Total Investments |
| Information Technology | 25.2% |
| Health Care | 14.1 |
| Energy | 10.2 |
| Consumer Discretionary | 10.1 |
| Consumer Staples | 9.3 |
| Communication Services | 8.1 |
| Financials | 8.0 |
| Industrials | 4.7 |
| Utilities | 3.9 |
| Real Estate | 3.2 |
| Materials | 3.2 |
| Total | 100.0% |
| Fund Allocation | % of Net Assets |
| Common Stocks | 94.9% |
| Real Estate Investment Trusts | 3.2 |
| Master Limited Partnerships | 0.5 |
| Call Options Written | (0.1) |
| Net Other Assets and Liabilities | 1.5 |
| Total | 100.0% |
| Top Ten Holdings | % of Total Investments |
| Apple, Inc. | 7.2% |
| Microsoft Corp. | 6.0 |
| Amazon.com, Inc. | 3.4 |
| Tesla, Inc. | 2.2 |
| Alphabet, Inc., Class A | 2.1 |
| Alphabet, Inc., Class C | 1.9 |
| Berkshire Hathaway, Inc., Class B | 1.7 |
| Johnson & Johnson | 1.7 |
| Lantheus Holdings, Inc. | 1.5 |
| UnitedHealth Group, Inc. | 1.5 |
| Total | 29.2% |

Performance figures assume reinvestment of all distributions and do not reflect the deduction of taxes that a shareholder would pay on Fund distributions or the redemption or sale of Fund shares. An index is a statistical composite that tracks a specified financial market or sector. Unlike the Fund, the indices do not actually hold a portfolio of securities and therefore do not incur the expenses incurred by the Fund. These expenses negatively impact the performance of the Fund. The Fund’s past performance does not predict future performance.
| Performance | ||||||
| Average Annual Total Returns | Cumulative Total Returns | |||||
| 1 Year Ended 9/30/22 | 5 Years Ended 9/30/22 | Inception (1/6/14) to 9/30/22 | 5 Years Ended 9/30/22 | Inception (1/6/14) to 9/30/22 | ||
| Fund Performance | ||||||
| NAV | -9.00% | -0.44% | 2.45% | -2.16% | 23.53% | |
| Market Price | -8.89% | -0.47% | 2.47% | -2.31% | 23.76% | |
| Index Performance | ||||||
| CBOE S&P 500 95-110 Collar IndexSM(1) | -10.92% | 9.69% | 7.82% | 58.82% | 93.06% | |
| S&P 500® Index | -15.47% | 9.24% | 10.12% | 55.55% | 131.98% | |
| CBOE Nasdaq-100 Buywrite IndexSM(2) | -18.19% | 2.40% | 4.91% | 12.61% | 52.02% | |
| Nasdaq-100 Index®(3) | -24.72% | 13.95% | 15.09% | 92.16% | 241.03% | |
| (1) | The CBOE S&P 500 95-110 Collar IndexSM is designed to protect an investment in S&P 500® stocks against market declines. The passive collar strategy reflected by the index entails: holding the stocks in the S&P 500® Index; buying three-month S&P 500® put options to protect this S&P 500® portfolio from market decreases; and selling one-month S&P 500® call options to help finance the cost of the put options. |
| (2) | The Cboe Nasdaq-100 BuyWrite IndexSM is a benchmark index designed to track the performance of a hypothetical buy-write strategy on the Nasdaq-100 Index®. The index is a passive total return index based on (1) buying the Nasdaq-100 Index® stock index portfolio, and (2) “writing” (or selling) the near-term Nasdaq-100 Index® “covered” call option. |
| (3) | On May 11, 2022, the Fund’s primary benchmark changed from the S&P 500® Index to the Nasdaq-100 Index®, because the Advisor believes that the Nasdaq-100 Index® better reflects the investment strategies of the Fund. |
| Sector Allocation | % of Total Investments |
| Information Technology | 42.1% |
| Communication Services | 15.1 |
| Financials | 11.6 |
| Consumer Discretionary | 9.8 |
| Health Care | 7.2 |
| Consumer Staples | 6.1 |
| Utilities | 4.8 |
| Industrials | 3.0 |
| Real Estate | 0.3 |
| Total | 100.0% |
| Fund Allocation | % of Net Assets |
| Common Stocks | 97.6% |
| Call Options Written | (0.4) |
| Net Other Assets and Liabilities | 2.8 |
| Total | 100.0% |
| Top Ten Holdings | % of Total Investments |
| Apple, Inc. | 12.4% |
| Microsoft Corp. | 9.8 |
| Tesla, Inc. | 4.6 |
| Amazon.com, Inc. | 4.3 |
| NVIDIA Corp. | 2.5 |
| Meta Platforms, Inc., Class A | 2.4 |
| Costco Wholesale Corp. | 2.3 |
| Alphabet, Inc., Class C | 2.2 |
| Alphabet, Inc., Class A | 2.2 |
| PepsiCo, Inc. | 2.2 |
| Total | 44.9% |
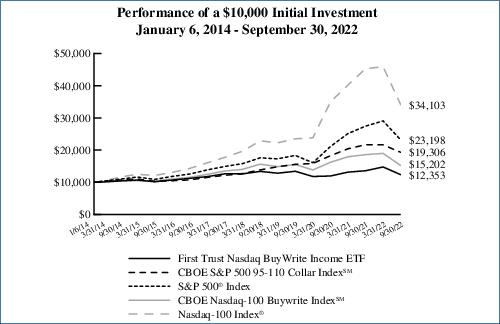
Performance figures assume reinvestment of all distributions and do not reflect the deduction of taxes that a shareholder would pay on Fund distributions or the redemption or sale of Fund shares. An index is a statistical composite that tracks a specified financial market or sector. Unlike the Fund, the indices do not actually hold a portfolio of securities and therefore do not incur the expenses incurred by the Fund. These expenses negatively impact the performance of the Fund. The Fund’s past performance does not predict future performance.
| Performance | ||||||
| Average Annual Total Returns | Cumulative Total Returns | |||||
| 1 Year Ended 9/30/22 | 5 Years Ended 9/30/22 | Inception (1/6/14) to 9/30/22 | 5 Years Ended 9/30/22 | Inception (1/6/14) to 9/30/22 | ||
| Fund Performance | ||||||
| NAV | -16.76% | 8.61% | 9.86% | 51.12% | 127.27% | |
| Market Price | -16.72% | 8.59% | 9.86% | 51.00% | 127.32% | |
| Index Performance | ||||||
| Nasdaq US Rising Dividend AchieversTM Index | -16.41% | 9.18% | 10.44% | 55.16% | 137.99% | |
| Dow Jones U.S. Select DividendTM Index* | -3.10% | 6.89% | 9.07% | 39.56% | 113.38% | |
| * | The Dow Jones U.S. Select DividendTM Index represents 100 of the United States’ leading stocks by dividend yield. |
| Sector Allocation | % of Total Investments |
| Financials | 35.4% |
| Information Technology | 25.8 |
| Health Care | 10.4 |
| Materials | 8.2 |
| Consumer Discretionary | 5.9 |
| Industrials | 4.1 |
| Communication Services | 4.1 |
| Energy | 4.0 |
| Consumer Staples | 2.1 |
| Total | 100.0% |
| Top Ten Holdings | % of Total Investments |
| Johnson & Johnson | 2.1% |
| Louisiana-Pacific Corp. | 2.1 |
| Humana, Inc. | 2.1 |
| UnitedHealth Group, Inc. | 2.1 |
| Cummins, Inc. | 2.1 |
| Allstate (The) Corp. | 2.1 |
| Huntsman Corp. | 2.1 |
| PulteGroup, Inc. | 2.1 |
| Microsoft Corp. | 2.1 |
| Pfizer, Inc. | 2.1 |
| Total | 21.0% |
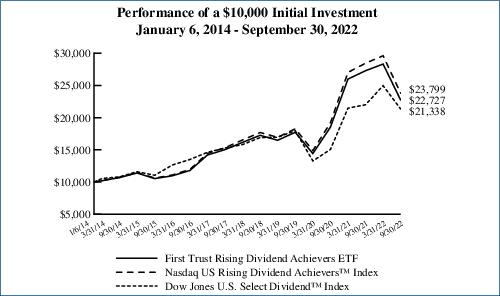
Performance figures assume reinvestment of all distributions and do not reflect the deduction of taxes that a shareholder would pay on Fund distributions or the redemption or sale of Fund shares. An index is a statistical composite that tracks a specified financial market or sector. Unlike the Fund, the indices do not actually hold a portfolio of securities and therefore do not incur the expenses incurred by the Fund. These expenses negatively impact the performance of the Fund. The Fund’s past performance does not predict future performance.
| Performance | ||||||
| Average Annual Total Returns | Cumulative Total Returns | |||||
| 1 Year Ended 9/30/22 | 5 Years Ended 9/30/22 | Inception (3/5/14) to 9/30/22 | 5 Years Ended 9/30/22 | Inception (3/5/14) to 9/30/22 | ||
| Fund Performance | ||||||
| NAV | -9.32% | 9.95% | 9.23% | 60.71% | 113.19% | |
| Market Price | -9.32% | 9.94% | 9.22% | 60.59% | 113.03% | |
| Index Performance | ||||||
| Dorsey Wright Focus FiveTM Index | -8.95% | 10.27% | 9.61% | 63.01% | 119.57% | |
| S&P 500® Index | -15.47% | 9.24% | 9.94% | 55.55% | 125.34% | |
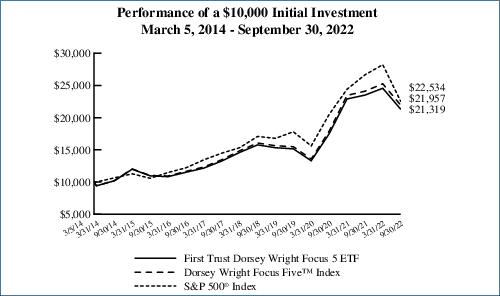
Performance figures assume reinvestment of all distributions and do not reflect the deduction of taxes that a shareholder would pay on Fund distributions or the redemption or sale of Fund shares. An index is a statistical composite that tracks a specified financial market or sector. Unlike the Fund, the indices do not actually hold a portfolio of securities and therefore do not incur the expenses incurred by the Fund. These expenses negatively impact the performance of the Fund. The Fund’s past performance does not predict future performance.
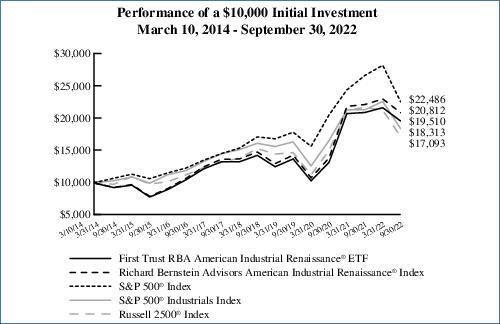
| Performance | ||||||
| Average Annual Total Returns | Cumulative Total Returns | |||||
| 1 Year Ended 9/30/22 | 5 Years Ended 9/30/22 | Inception (3/10/14) to 9/30/22 | 5 Years Ended 9/30/22 | Inception (3/10/14) to 9/30/22 | ||
| Fund Performance | ||||||
| NAV | -6.41% | 8.16% | 8.12% | 48.01% | 95.10% | |
| Market Price | -6.38% | 8.18% | 8.14% | 48.15% | 95.36% | |
| Index Performance | ||||||
| Richard Bernstein Advisors American Industrial Renaissance® Index | -5.74% | 8.93% | 8.94% | 53.34% | 108.12% | |
| S&P 500® Index | -15.47% | 9.24% | 9.93% | 55.55% | 124.86% | |
| S&P 500® Industrials Index | -13.87% | 4.87% | 7.32% | 26.87% | 83.13% | |
| Russell 2500® Index | -21.11% | 5.45% | 6.46% | 30.40% | 70.93% | |
| Sector Allocation | % of Total Investments |
| Industrials | 89.7% |
| Financials | 10.3 |
| Total | 100.0% |
| Top Ten Holdings | % of Total Investments |
| Clean Harbors, Inc. | 3.9% |
| Arcosa, Inc. | 3.8 |
| Hubbell, Inc. | 3.6 |
| Comfort Systems USA, Inc. | 3.4 |
| EMCOR Group, Inc. | 3.4 |
| Wabash National Corp. | 3.3 |
| NV5 Global, Inc. | 3.2 |
| Federal Signal Corp. | 3.2 |
| SPX Technologies, Inc. | 3.2 |
| RBC Bearings, Inc. | 3.1 |
| Total | 34.1% |
Performance figures assume reinvestment of all distributions and do not reflect the deduction of taxes that a shareholder would pay on Fund distributions or the redemption or sale of Fund shares. An index is a statistical composite that tracks a specified financial market or sector. Unlike the Fund, the indices do not actually hold a portfolio of securities and therefore do not incur the expenses incurred by the Fund. These expenses negatively impact the performance of the Fund. The Fund’s past performance does not predict future performance.
| Performance | ||||||
| Average Annual Total Returns | Cumulative Total Returns | |||||
| 1 Year Ended 9/30/22 | 5 Years Ended 9/30/22 | Inception (3/10/14) to 9/30/22 | 5 Years Ended 9/30/22 | Inception (3/10/14) to 9/30/22 | ||
| Fund Performance | ||||||
| NAV | -11.08% | 4.76% | 6.34% | 26.17% | 69.30% | |
| Market Price | -11.02% | 4.73% | 6.35% | 26.02% | 69.38% | |
| Index Performance | ||||||
| Dorsey Wright Momentum Plus Dividend YieldTM Index(1) | -10.57% | N/A | N/A | N/A | N/A | |
| Dow Jones U.S. Select DividendTM Index(2) | -3.10% | 6.89% | 8.91% | 39.56% | 107.69% | |
| S&P 500® Index | -15.47% | 9.24% | 9.93% | 55.55% | 124.86% | |
| (1) | On September 6, 2018, the Fund’s underlying index changed from the Richard Bernstein Advisors Quality Income Index to the Dorsey Wright Momentum Plus Dividend YieldTM Index (the “Index”). Therefore, the Fund’s performance and historical returns shown for the periods prior to September 6, 2018, are not necessarily indicative of the performance that the Fund, based on its current index, would have generated. Since the Index had an inception date of July 2, 2018, it was not in existence for all of the periods disclosed. |
| (2) | The Dow Jones U.S. Select DividendTM Index represents 100 of the United States’ leading stocks by dividend yield. |
| Sector Allocation | % of Total Investments |
| Financials | 30.6% |
| Real Estate | 30.3 |
| Energy | 15.7 |
| Utilities | 5.4 |
| Materials | 4.8 |
| Consumer Discretionary | 4.1 |
| Information Technology | 4.0 |
| Health Care | 3.4 |
| Industrials | 1.7 |
| Total | 100.0% |
| Top Ten Holdings | % of Total Investments |
| Rithm Capital Corp. | 4.4% |
| Starwood Property Trust, Inc. | 4.2 |
| Blackstone Mortgage Trust, Inc., Class A | 4.1 |
| Kinder Morgan, Inc. | 3.7 |
| ONEOK, Inc. | 3.4 |
| Spirit Realty Capital, Inc. | 3.3 |
| DT Midstream, Inc. | 3.1 |
| Williams (The) Cos., Inc. | 2.9 |
| Lamar Advertising Co., Class A | 2.8 |
| VICI Properties, Inc. | 2.7 |
| Total | 34.6% |

Performance figures assume reinvestment of all distributions and do not reflect the deduction of taxes that a shareholder would pay on Fund distributions or the redemption or sale of Fund shares. An index is a statistical composite that tracks a specified financial market or sector. Unlike the Fund, the indices do not actually hold a portfolio of securities and therefore do not incur the expenses incurred by the Fund. These expenses negatively impact the performance of the Fund. The Fund’s past performance does not predict future performance.
| Performance | ||||||
| Average Annual Total Returns | Cumulative Total Returns | |||||
| 1 Year Ended 9/30/22 | 5 Years Ended 9/30/22 | Inception (7/22/14) to 9/30/22 | 5 Years Ended 9/30/22 | Inception (7/22/14) to 9/30/22 | ||
| Fund Performance | ||||||
| NAV | -26.89% | -3.39% | -0.93% | -15.85% | -7.38% | |
| Market Price | -26.81% | -3.38% | -0.92% | -15.79% | -7.31% | |
| Index Performance | ||||||
| Dorsey Wright International Focus FiveTM Index | -26.69% | -2.91% | -0.52% | -13.72% | -4.16% | |
| MSCI ACWI ex USA Index | -25.17% | -0.81% | 0.49% | -4.00% | 4.10% | |
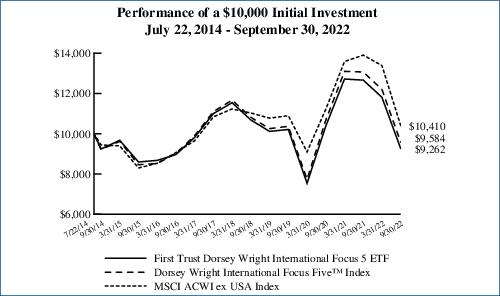
Performance figures assume reinvestment of all distributions and do not reflect the deduction of taxes that a shareholder would pay on Fund distributions or the redemption or sale of Fund shares. An index is a statistical composite that tracks a specified financial market or sector. Unlike the Fund, the indices do not actually hold a portfolio of securities and therefore do not incur the expenses incurred by the Fund. These expenses negatively impact the performance of the Fund. The Fund’s past performance does not predict future performance.
| Performance | ||||||
| Average Annual Total Returns | Cumulative Total Returns | |||||
| 1 Year Ended 9/30/22 | 5 Years Ended 9/30/22 | Inception (3/17/16) to 9/30/22 | 5 Years Ended 9/30/22 | Inception (3/17/16) to 9/30/22 | ||
| Fund Performance | ||||||
| NAV | -4.18% | 7.11% | 8.76% | 40.98% | 73.15% | |
| Market Price | -4.01% | 7.13% | 8.78% | 41.13% | 73.41% | |
| Index Performance | ||||||
| Dorsey Wright Dynamic Focus FiveTM Index | -3.74% | 7.44% | 9.11% | 43.15% | 76.82% | |
| S&P 500® Index | -15.47% | 9.24% | 11.03% | 55.55% | 98.24% | |
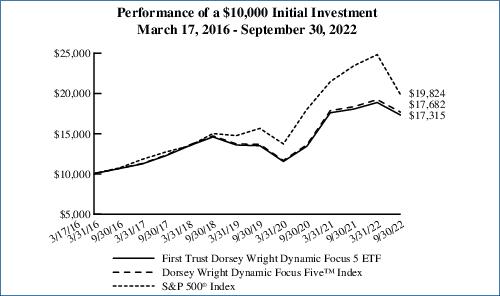
Performance figures assume reinvestment of all distributions and do not reflect the deduction of taxes that a shareholder would pay on Fund distributions or the redemption or sale of Fund shares. An index is a statistical composite that tracks a specified financial market or sector. Unlike the Fund, the indices do not actually hold a portfolio of securities and therefore do not incur the expenses incurred by the Fund. These expenses negatively impact the performance of the Fund. The Fund’s past performance does not predict future performance.
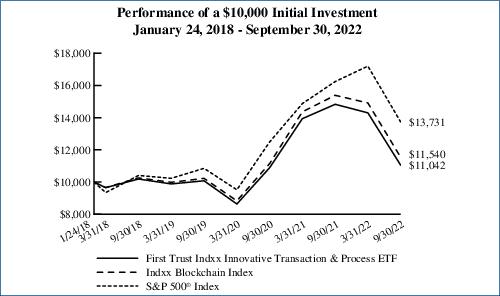
| Performance | |||
| Average Annual Total Returns | Cumulative Total Returns | ||
| 1 Year Ended 9/30/22 | Inception (1/24/18) to 9/30/22 | Inception (1/24/18) to 9/30/22 | |
| Fund Performance | |||
| NAV | -25.55% | 2.14% | 10.42% |
| Market Price | -25.97% | 2.08% | 10.09% |
| Index Performance | |||
| Indxx Blockchain Index | -25.03% | 3.11% | 15.40% |
| S&P 500® Index | -15.47% | 7.01% | 37.31% |
| Sector Allocation | % of Total Long-Term Investments |
| Financials | 36.0% |
| Information Technology | 31.7 |
| Communication Services | 9.5 |
| Consumer Discretionary | 8.5 |
| Industrials | 5.7 |
| Utilities | 2.9 |
| Materials | 1.8 |
| Consumer Staples | 1.7 |
| Health Care | 1.3 |
| Energy | 0.9 |
| Total | 100.0% |
| Top Ten Holdings | % of Total Long-Term Investments |
| Emirates Telecommunications Group Co., PJSC | 1.4% |
| SAP SE | 1.4 |
| Industrial & Commercial Bank of China Ltd., Class H | 1.4 |
| Softbank Corp. | 1.3 |
| Zoetis, Inc. | 1.3 |
| China CITIC Bank Corp., Ltd., Class H | 1.3 |
| Swisscom AG | 1.3 |
| International Business Machines Corp. | 1.3 |
| Tata Consultancy Services Ltd. | 1.3 |
| Nordea Bank Abp | 1.3 |
| Total | 13.3% |
Performance figures assume reinvestment of all distributions and do not reflect the deduction of taxes that a shareholder would pay on Fund distributions or the redemption or sale of Fund shares. An index is a statistical composite that tracks a specified financial market or sector. Unlike the Fund, the indices do not actually hold a portfolio of securities and therefore do not incur the expenses incurred by the Fund. These expenses negatively impact the performance of the Fund. The Fund’s past performance does not predict future performance.
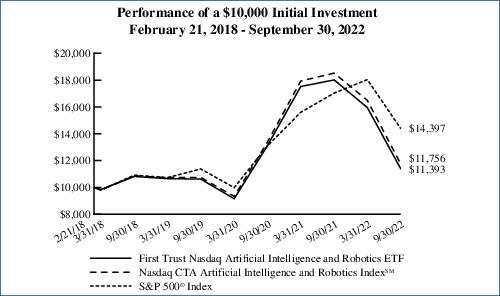
| Performance | |||
| Average Annual Total Returns | Cumulative Total Returns | ||
| 1 Year Ended 9/30/22 | Inception (2/21/18) to 9/30/22 | Inception (2/21/18) to 9/30/22 | |
| Fund Performance | |||
| NAV | -36.76% | 2.87% | 13.93% |
| Market Price | -36.85% | 2.86% | 13.86% |
| Index Performance | |||
| Nasdaq CTA Artificial Intelligence and Robotics IndexSM | -36.54% | 3.58% | 17.56% |
| S&P 500® Index | -15.47% | 8.24% | 43.97% |
| Sector Allocation | % of Total Long-Term Investments |
| Information Technology | 60.6% |
| Industrials | 22.3 |
| Consumer Discretionary | 8.9 |
| Health Care | 5.4 |
| Communication Services | 2.3 |
| Real Estate | 0.3 |
| Consumer Staples | 0.2 |
| Total | 100.0% |
| Top Ten Holdings | % of Total Long-Term Investments |
| PROS Holdings, Inc. | 2.6% |
| AVEVA Group PLC | 2.3 |
| Illumina, Inc. | 2.1 |
| Cadence Design Systems, Inc. | 2.1 |
| AeroVironment, Inc. | 2.1 |
| Halma PLC | 2.1 |
| Dynatrace, Inc. | 2.0 |
| Hexagon AB, Class B | 2.0 |
| QinetiQ Group PLC | 2.0 |
| ANSYS, Inc. | 2.0 |
| Total | 21.3% |
Performance figures assume reinvestment of all distributions and do not reflect the deduction of taxes that a shareholder would pay on Fund distributions or the redemption or sale of Fund shares. An index is a statistical composite that tracks a specified financial market or sector. Unlike the Fund, the indices do not actually hold a portfolio of securities and therefore do not incur the expenses incurred by the Fund. These expenses negatively impact the performance of the Fund. The Fund’s past performance does not predict future performance.
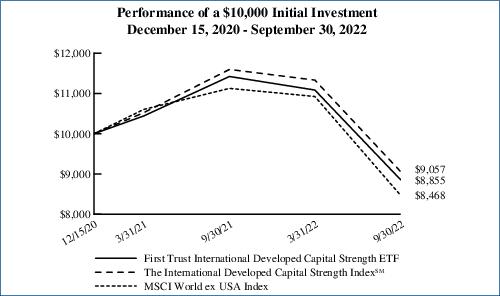
| Performance | |||
| Average Annual Total Returns | Cumulative Total Returns | ||
| 1 Year Ended 9/30/22 | Inception (12/15/20) to 9/30/22 | Inception (12/15/20) to 9/30/22 | |
| Fund Performance | |||
| NAV | -22.50% | -6.56% | -11.45% |
| Market Price | -22.33% | -6.34% | -11.08% |
| Index Performance | |||
| The International Developed Capital Strength IndexSM | -21.93% | -5.38% | -9.43% |
| MSCI World ex USA Index | -23.91% | -8.86% | -15.32% |
| Sector Allocation | % of Total Investments |
| Industrials | 31.6% |
| Consumer Staples | 17.1 |
| Financials | 16.3 |
| Health Care | 13.7 |
| Information Technology | 10.5 |
| Materials | 3.3 |
| Consumer Discretionary | 2.1 |
| Communication Services | 2.1 |
| Energy | 1.8 |
| Real Estate | 1.5 |
| Total | 100.0% |
| Top Ten Holdings | % of Total Investments |
| Unilever PLC | 2.5% |
| Intact Financial Corp. | 2.4 |
| Thomson Reuters Corp. | 2.4 |
| CGI, Inc. | 2.3 |
| CSL Ltd. | 2.3 |
| Obic Co., Ltd. | 2.3 |
| Wolters Kluwer N.V. | 2.3 |
| Deutsche Boerse AG | 2.3 |
| Heineken N.V. | 2.3 |
| Alimentation Couche-Tard, Inc. | 2.3 |
| Total | 23.4% |
Performance figures assume reinvestment of all distributions and do not reflect the deduction of taxes that a shareholder would pay on Fund distributions or the redemption or sale of Fund shares. An index is a statistical composite that tracks a specified financial market or sector. Unlike the Fund, the indices do not actually hold a portfolio of securities and therefore do not incur the expenses incurred by the Fund. These expenses negatively impact the performance of the Fund. The Fund’s past performance does not predict future performance.
| Beginning Account Value April 1, 2022 | Ending Account Value September 30, 2022 | Annualized Expense Ratio Based on the Six-Month Period | Expenses Paid During the Six-Month Period (a) | |
| First Trust NASDAQ Technology Dividend Index Fund (TDIV) | ||||
| Actual | $1,000.00 | $750.00 | 0.50% | $2.19 |
| Hypothetical (5% return before expenses) | $1,000.00 | $1,022.56 | 0.50% | $2.54 |
| Multi-Asset Diversified Income Index Fund (MDIV) (b) | ||||
| Actual | $1,000.00 | $885.30 | 0.49% | $2.32 |
| Hypothetical (5% return before expenses) | $1,000.00 | $1,022.61 | 0.49% | $2.48 |
| First Trust S&P International Dividend Aristocrats ETF (FID) | ||||
| Actual | $1,000.00 | $799.80 | 0.60% | $2.71 |
| Hypothetical (5% return before expenses) | $1,000.00 | $1,022.06 | 0.60% | $3.04 |
| First Trust BuyWrite Income ETF (FTHI) | ||||
| Actual | $1,000.00 | $841.30 | 0.85% | $3.92 |
| Hypothetical (5% return before expenses) | $1,000.00 | $1,020.81 | 0.85% | $4.31 |
| First Trust Nasdaq BuyWrite Income ETF (FTQI) | ||||
| Actual | $1,000.00 | $837.40 | 0.85% | $3.92 |
| Hypothetical (5% return before expenses) | $1,000.00 | $1,020.81 | 0.85% | $4.31 |
| Beginning Account Value April 1, 2022 | Ending Account Value September 30, 2022 | Annualized Expense Ratio Based on the Six-Month Period | Expenses Paid During the Six-Month Period (a) | |
| First Trust Rising Dividend Achievers ETF (RDVY) | ||||
| Actual | $1,000.00 | $802.00 | 0.50% | $2.26 |
| Hypothetical (5% return before expenses) | $1,000.00 | $1,022.56 | 0.50% | $2.54 |
| First Trust Dorsey Wright Focus 5 ETF (FV) (b) | ||||
| Actual | $1,000.00 | $867.70 | 0.30% | $1.40 |
| Hypothetical (5% return before expenses) | $1,000.00 | $1,023.56 | 0.30% | $1.52 |
| First Trust RBA American Industrial Renaissance® ETF (AIRR) | ||||
| Actual | $1,000.00 | $903.90 | 0.70% | $3.34 |
| Hypothetical (5% return before expenses) | $1,000.00 | $1,021.56 | 0.70% | $3.55 |
| First Trust Dorsey Wright Momentum & Dividend ETF (DDIV) | ||||
| Actual | $1,000.00 | $813.80 | 0.60% | $2.73 |
| Hypothetical (5% return before expenses) | $1,000.00 | $1,022.06 | 0.60% | $3.04 |
| First Trust Dorsey Wright International Focus 5 ETF (IFV) (b) | ||||
| Actual | $1,000.00 | $784.10 | 0.30% | $1.34 |
| Hypothetical (5% return before expenses) | $1,000.00 | $1,023.56 | 0.30% | $1.52 |
| First Trust Dorsey Wright Dynamic Focus 5 ETF (FVC) (b) | ||||
| Actual | $1,000.00 | $916.70 | 0.30% | $1.44 |
| Hypothetical (5% return before expenses) | $1,000.00 | $1,023.56 | 0.30% | $1.52 |
| First Trust Indxx Innovative Transaction & Process ETF (LEGR) | ||||
| Actual | $1,000.00 | $772.10 | 0.65% | $2.89 |
| Hypothetical (5% return before expenses) | $1,000.00 | $1,021.81 | 0.65% | $3.29 |
| First Trust Nasdaq Artificial Intelligence and Robotics ETF (ROBT) | ||||
| Actual | $1,000.00 | $714.00 | 0.65% | $2.79 |
| Hypothetical (5% return before expenses) | $1,000.00 | $1,021.81 | 0.65% | $3.29 |
| First Trust International Developed Capital Strength ETF (FICS) | ||||
| Actual | $1,000.00 | $798.60 | 0.70% | $3.16 |
| Hypothetical (5% return before expenses) | $1,000.00 | $1,021.56 | 0.70% | $3.55 |
| (a) | Expenses are equal to the annualized expense ratios as indicated in the table multiplied by the average account value over the period (April 1, 2022 through September 30, 2022), multiplied by 183/365 (to reflect the six-month period). |
| (b) | Annualized expense ratio and expenses paid during the six-month period do not include fees and expenses of the underlying funds in which the Fund invests. |
| Shares | Description | Value | ||
| COMMON STOCKS – 99.8% | ||||
| Communications Equipment – 5.9% | ||||
| 67,424 | ADTRAN Holdings, Inc. | $1,320,162 | ||
| 28,100 | AudioCodes Ltd. | 612,861 | ||
| 729,895 | Cisco Systems, Inc. | 29,195,800 | ||
| 523,303 | Juniper Networks, Inc. | 13,668,674 | ||
| 118,718 | Motorola Solutions, Inc. | 26,589,271 | ||
| 428,335 | Nokia Oyj, ADR | 1,828,990 | ||
| 634,465 | Telefonaktiebolaget LM Ericsson, ADR | 3,641,829 | ||
| 26,269 | Ubiquiti, Inc. | 7,711,528 | ||
| 84,569,115 | ||||
| Diversified Telecommunication Services – 9.4% | ||||
| 12,860 | ATN International, Inc. | 496,010 | ||
| 677,197 | BCE, Inc. | 28,401,642 | ||
| 90,892 | Chunghwa Telecom Co., Ltd., ADR | 3,229,393 | ||
| 170,832 | Cogent Communications Holdings, Inc. | 8,910,597 | ||
| 332,068 | KT Corp., ADR | 4,057,871 | ||
| 3,277,195 | Lumen Technologies, Inc. | 23,857,980 | ||
| 588,470 | Telefonica Brasil S.A., ADR | 4,425,294 | ||
| 80,903 | Telkom Indonesia Persero Tbk PT, ADR | 2,334,052 | ||
| 1,449,417 | TELUS Corp. | 28,785,422 | ||
| 780,694 | Verizon Communications, Inc. | 29,642,951 | ||
| 134,141,212 | ||||
| Electronic Equipment, Instruments & Components – 4.2% | ||||
| 150,387 | Amphenol Corp., Class A | 10,069,913 | ||
| 53,821 | Avnet, Inc. | 1,944,015 | ||
| 21,097 | Benchmark Electronics, Inc. | 522,784 | ||
| 37,563 | CDW Corp. | 5,862,833 | ||
| 626,905 | Corning, Inc. | 18,192,783 | ||
| 18,214 | Jabil, Inc. | 1,051,130 | ||
| 12,695 | Methode Electronics, Inc. | 471,619 | ||
| 91,347 | National Instruments Corp. | 3,447,436 | ||
| 27,324 | TD SYNNEX Corp. | 2,218,436 | ||
| 130,264 | TE Connectivity Ltd. | 14,375,935 | ||
| 65,485 | Vishay Intertechnology, Inc. | 1,164,978 | ||
| 59,321,862 | ||||
| Interactive Media & Services – 0.2% | ||||
| 97,365 | JOYY, Inc., ADR | 2,531,490 | ||
| 14,580 | Shutterstock, Inc. | 731,479 | ||
| 3,262,969 | ||||
| IT Services – 10.4% | ||||
| 53,768 | Amdocs Ltd. | 4,271,868 | ||
| 208,625 | Cognizant Technology Solutions Corp., Class A | 11,983,420 | ||
| Shares | Description | Value | ||
| IT Services (Continued) | ||||
| 10,324 | Concentrix Corp. | $1,152,468 | ||
| 14,253 | CSG Systems International, Inc. | 753,699 | ||
| 16,172 | Hackett Group (The), Inc. | 286,568 | ||
| 328,964 | Infosys Ltd., ADR | 5,582,519 | ||
| 1,016,455 | International Business Machines Corp. | 120,765,019 | ||
| 86,738 | SS&C Technologies Holdings, Inc. | 4,141,739 | ||
| 49,130 | Wipro Ltd., ADR | 231,402 | ||
| 149,168,702 | ||||
| Media – 2.0% | ||||
| 3,203 | Cable One, Inc. | 2,732,319 | ||
| 901,928 | Comcast Corp., Class A | 26,453,548 | ||
| 29,185,867 | ||||
| Professional Services – 0.6% | ||||
| 33,044 | KBR, Inc. | 1,428,162 | ||
| 51,618 | Leidos Holdings, Inc. | 4,515,026 | ||
| 22,581 | Science Applications International Corp. | 1,996,838 | ||
| 7,940,026 | ||||
| Semiconductors & Semiconductor Equipment – 37.4% | ||||
| 57,667 | Amkor Technology, Inc. | 983,222 | ||
| 245,629 | Analog Devices, Inc. | 34,225,945 | ||
| 223,644 | Applied Materials, Inc. | 18,323,153 | ||
| 522,495 | ASE Technology Holding Co., Ltd., ADR | 2,607,250 | ||
| 26,233 | ASML Holding N.V. | 10,895,877 | ||
| 261,592 | Broadcom, Inc. | 116,149,464 | ||
| 531,270 | Himax Technologies, Inc., ADR | 2,571,347 | ||
| 4,090,337 | Intel Corp. | 105,407,984 | ||
| 43,186 | KLA Corp. | 13,069,379 | ||
| 22,405 | Kulicke & Soffa Industries, Inc. | 863,265 | ||
| 46,836 | Lam Research Corp. | 17,141,976 | ||
| 206,956 | Microchip Technology, Inc. | 12,630,525 | ||
| 202,083 | Micron Technology, Inc. | 10,124,358 | ||
| 6,954 | Monolithic Power Systems, Inc. | 2,527,084 | ||
| 112,077 | NXP Semiconductors N.V. | 16,532,478 | ||
| 12,766 | Power Integrations, Inc. | 821,109 | ||
| 493,548 | QUALCOMM, Inc. | 55,761,053 | ||
| 91,003 | Skyworks Solutions, Inc. | 7,759,826 | ||
| 12,128 | STMicroelectronics N.V. | 375,240 | ||
| 613,354 | Taiwan Semiconductor Manufacturing Co., Ltd., ADR | 42,051,550 | ||
| 395,144 | Texas Instruments, Inc. | 61,160,388 | ||
| 224,943 | United Microelectronics Corp., ADR | 1,252,933 | ||
| 10,549 | Universal Display Corp. | 995,298 | ||
| 534,230,704 | ||||
| Software – 14.7% | ||||
| 20,514 | A10 Networks, Inc. | 272,221 | ||
| Shares | Description | Value | ||
| COMMON STOCKS (Continued) | ||||
| Software (Continued) | ||||
| 23,617 | American Software, Inc., Class A | $361,812 | ||
| 20,356 | Dolby Laboratories, Inc., Class A | 1,326,193 | ||
| 8,889 | Ebix, Inc. | 168,624 | ||
| 46,537 | InterDigital, Inc. | 1,881,026 | ||
| 44,339 | Intuit, Inc. | 17,173,381 | ||
| 499,346 | Microsoft Corp. | 116,297,683 | ||
| 315,572 | NortonLifeLock, Inc. | 6,355,620 | ||
| 188,983 | Open Text Corp. | 4,996,711 | ||
| 880,399 | Oracle Corp. | 53,765,967 | ||
| 15,774 | Progress Software Corp. | 671,184 | ||
| 15,920 | Roper Technologies, Inc. | 5,725,469 | ||
| 29,201 | Sapiens International Corp., N.V. | 560,075 | ||
| 32,684 | Xperi Holding Corp. | 462,152 | ||
| 210,018,118 | ||||
| Technology Hardware, Storage & Peripherals – 12.6% | ||||
| 830,450 | Apple, Inc. | 114,768,190 | ||
| 114,278 | Dell Technologies, Inc., Class C | 3,904,879 | ||
| 1,144,332 | Hewlett Packard Enterprise Co. | 13,709,097 | ||
| 848,312 | HP, Inc. | 21,139,935 | ||
| 76,513 | Logitech International S.A. | 3,519,598 | ||
| 150,394 | NetApp, Inc. | 9,301,869 | ||
| 215,495 | Seagate Technology Holdings PLC | 11,470,799 | ||
| 233,574 | Xerox Holdings Corp. | 3,055,148 | ||
| 180,869,515 | ||||
| Wireless Telecommunication Services – 2.4% | ||||
| 1,324,111 | Mobile TeleSystems PJSC, ADR (a) (b) (c) | 182,304 | ||
| 56,108 | PLDT, Inc., ADR | 1,419,532 | ||
| 758,034 | Rogers Communications, Inc., Class B | 29,214,630 | ||
| 261,351 | Telephone & Data Systems, Inc. | 3,632,779 | ||
| 34,449,245 | ||||
| Total Investments – 99.8% | 1,427,157,335 | |||
| (Cost $1,601,923,830) | ||||
| Net Other Assets and Liabilities – 0.2% | 3,453,622 | |||
| Net Assets – 100.0% | $1,430,610,957 | |||
| (a) | This security is fair valued by the Advisor’s Pricing Committee in accordance with procedures approved by the Trust’s Board of Trustees, and in accordance with the provisions of the Investment Company Act of 1940 and rules thereunder, as amended. At September 30, 2022, securities noted as such are valued at $182,304 or 0.0% of net assets. |
| (b) | Pursuant to procedures adopted by the Trust’s Board of Trustees, this security has been determined to be illiquid by First Trust Advisors, L.P., the Fund’s Advisor. |
| (c) | This security’s value was determined using significant unobservable inputs (see Note 2A – Portfolio Valuation in the Notes to Financial Statements). |
| ADR | American Depositary Receipt |
| Total Value at 9/30/2022 | Level 1 Quoted Prices | Level 2 Significant Observable Inputs | Level 3 Significant Unobservable Inputs | |
| Common Stocks: | ||||
| Wireless Telecommunication Services | $ 34,449,245 | $ 34,266,941 | $ — | $ 182,304 |
| Other Industry Categories* | 1,392,708,090 | 1,392,708,090 | — | — |
| Total Investments | $ 1,427,157,335 | $ 1,426,975,031 | $— | $ 182,304 |
| * | See Portfolio of Investments for industry breakout. |
| Shares/ Units | Description | Value | ||
| MASTER LIMITED PARTNERSHIPS – 20.2% | ||||
| Energy Equipment & Services – 1.2% | ||||
| 302,427 | USA Compression Partners, L.P. | $5,262,230 | ||
| Industrial Conglomerates – 1.5% | ||||
| 133,447 | Icahn Enterprises, L.P. | 6,628,312 | ||
| Oil, Gas & Consumable Fuels – 17.5% | ||||
| 251,368 | Black Stone Minerals, L.P. | 3,933,909 | ||
| 62,324 | Cheniere Energy Partners, L.P. | 3,325,609 | ||
| 163,844 | Crestwood Equity Partners, L.P. | 4,549,948 | ||
| 208,406 | CrossAmerica Partners, L.P. | 3,895,108 | ||
| 57,227 | DCP Midstream, L.P. | 2,150,018 | ||
| 52,426 | Delek Logistics Partners, L.P. | 2,670,581 | ||
| 160,184 | Dorchester Minerals, L.P. | 4,001,396 | ||
| 263,607 | Energy Transfer, L.P. | 2,907,585 | ||
| 199,635 | EnLink Midstream, LLC (a) | 1,774,755 | ||
| 121,532 | Enterprise Products Partners, L.P. | 2,890,031 | ||
| 135,213 | Global Partners, L.P. | 3,346,522 | ||
| 214,221 | Holly Energy Partners, L.P. | 3,515,367 | ||
| 256,583 | Kimbell Royalty Partners, L.P. (a) | 4,356,779 | ||
| 342,361 | KNOT Offshore Partners, L.P. (a) | 4,786,207 | ||
| 71,941 | Magellan Midstream Partners, L.P. | 3,417,917 | ||
| 147,560 | MPLX, L.P. | 4,428,276 | ||
| 62,993 | Natural Resource Partners, L.P. | 2,787,440 | ||
| 305,395 | NuStar Energy, L.P. | 4,122,833 | ||
| 282,470 | Plains All American Pipeline, L.P. | 2,971,584 | ||
| 273,312 | Plains GP Holdings, L.P., Class A (a) | 2,981,834 | ||
| 92,726 | Sunoco, L.P. | 3,613,532 | ||
| 114,461 | Viper Energy Partners, L.P. (a) | 3,280,452 | ||
| 100,987 | Western Midstream Partners, L.P. | 2,540,833 | ||
| 78,248,516 | ||||
Total Master Limited Partnerships | 90,139,058 | |||
| (Cost $74,218,615) | ||||
| COMMON STOCKS – 19.7% | ||||
| Banks – 4.5% | ||||
| 76,544 | Associated Banc-Corp. | 1,537,004 | ||
| 31,044 | Citigroup, Inc. | 1,293,604 | ||
| 73,553 | First Financial Bancorp | 1,550,497 | ||
| 61,164 | First Hawaiian, Inc. | 1,506,469 | ||
| 38,509 | First Interstate BancSystem, Inc., Class A | 1,553,838 | ||
| 129,769 | FNB Corp. | 1,505,320 | ||
| 133,112 | Huntington Bancshares, Inc. | 1,754,416 | ||
| 92,873 | KeyCorp | 1,487,826 | ||
| 152,414 | Northwest Bancshares, Inc. | 2,059,113 | ||
| 46,157 | Pacific Premier Bancorp, Inc. | 1,429,021 | ||
| 31,947 | Truist Financial Corp. | 1,390,972 | ||
| 32,951 | US Bancorp | 1,328,584 | ||
| 44,263 | WesBanco, Inc. | 1,477,056 | ||
| 19,873,720 | ||||
| Biotechnology – 0.7% | ||||
| 11,042 | AbbVie, Inc. | 1,481,947 | ||
| 29,281 | Gilead Sciences, Inc. | 1,806,345 | ||
| 3,288,292 | ||||
| Shares/ Units | Description | Value | ||
| COMMON STOCKS (Continued) | ||||
| Capital Markets – 1.4% | ||||
| 53,761 | Lazard Ltd., Class A | $1,711,213 | ||
| 97,337 | Moelis & Co., Class A | 3,290,964 | ||
| 69,069 | Virtu Financial, Inc., Class A | 1,434,563 | ||
| 6,436,740 | ||||
| Chemicals – 1.3% | ||||
| 39,778 | Dow, Inc. | 1,747,447 | ||
| 51,271 | LyondellBasell Industries N.V., Class A | 3,859,681 | ||
| 5,607,128 | ||||
| Containers & Packaging – 0.3% | ||||
| 40,051 | International Paper Co. | 1,269,617 | ||
| Diversified Telecommunication Services – 1.1% | ||||
| 186,628 | AT&T, Inc. | 2,862,874 | ||
| 51,083 | Verizon Communications, Inc. | 1,939,621 | ||
| 4,802,495 | ||||
| Electric Utilities – 1.2% | ||||
| 27,065 | ALLETE, Inc. | 1,354,603 | ||
| 23,198 | Edison International | 1,312,543 | ||
| 37,967 | OGE Energy Corp. | 1,384,277 | ||
| 23,680 | Pinnacle West Capital Corp. | 1,527,597 | ||
| 5,579,020 | ||||
| Food & Staples Retailing – 0.4% | ||||
| 53,062 | Walgreens Boots Alliance, Inc. | 1,666,147 | ||
| Food Products – 0.3% | ||||
| 44,783 | Kraft Heinz (The) Co. | 1,493,513 | ||
| Household Durables – 0.3% | ||||
| 43,247 | Leggett & Platt, Inc. | 1,436,665 | ||
| Household Products – 0.3% | ||||
| 55,744 | Energizer Holdings, Inc. | 1,401,404 | ||
| Industrial Conglomerates – 0.3% | ||||
| 12,870 | 3M Co. | 1,422,135 | ||
| Insurance – 2.6% | ||||
| 42,420 | Fidelity National Financial, Inc. | 1,535,604 | ||
| 258,624 | Old Republic International Corp. | 5,413,000 | ||
| 19,633 | Principal Financial Group, Inc. | 1,416,521 | ||
| 19,121 | Prudential Financial, Inc. | 1,640,199 | ||
| 17,798 | Safety Insurance Group, Inc. | 1,451,605 | ||
| 11,456,929 | ||||
| IT Services – 0.8% | ||||
| 15,108 | International Business Machines Corp. | 1,794,981 | ||
| 143,647 | Western Union (The) Co. | 1,939,235 | ||
| 3,734,216 | ||||
| Leisure Products – 0.4% | ||||
| 31,248 | Sturm Ruger & Co., Inc. | 1,587,086 | ||
| Media – 0.3% | ||||
| 23,109 | Omnicom Group, Inc. | 1,457,947 | ||
| Shares/ Units | Description | Value | ||
| COMMON STOCKS (Continued) | ||||
| Multi-Utilities – 0.4% | ||||
| 32,801 | NorthWestern Corp. | $1,616,433 | ||
| Semiconductors & Semiconductor Equipment – 0.3% | ||||
| 47,960 | Intel Corp. | 1,235,929 | ||
| Textiles, Apparel & Luxury Goods – 0.3% | ||||
| 41,415 | VF Corp. | 1,238,723 | ||
| Thrifts & Mortgage Finance – 0.8% | ||||
| 252,107 | New York Community Bancorp, Inc. | 2,150,473 | ||
| 65,380 | Provident Financial Services, Inc. | 1,274,910 | ||
| 3,425,383 | ||||
| Tobacco – 1.1% | ||||
| 70,127 | Altria Group, Inc. | 2,831,728 | ||
| 42,287 | Universal Corp. | 1,946,894 | ||
| 4,778,622 | ||||
| Trading Companies & Distributors – 0.3% | ||||
| 25,440 | Triton International Ltd. | 1,392,331 | ||
| Wireless Telecommunication Services – 0.3% | ||||
| 106,389 | Telephone & Data Systems, Inc. | 1,478,807 | ||
Total Common Stocks | 87,679,282 | |||
| (Cost $100,203,318) | ||||
| REAL ESTATE INVESTMENT TRUSTS – 17.9% | ||||
| Diversified REITs – 1.2% | ||||
| 101,445 | Essential Properties Realty Trust, Inc. | 1,973,105 | ||
| 104,779 | STORE Capital Corp. | 3,282,726 | ||
| 5,255,831 | ||||
| Health Care REITs – 0.6% | ||||
| 241,104 | Medical Properties Trust, Inc. | 2,859,494 | ||
| Mortgage REITs – 8.9% | ||||
| 264,072 | Annaly Capital Management, Inc. | 4,531,476 | ||
| 320,945 | Arbor Realty Trust, Inc. | 3,690,867 | ||
| 147,183 | Blackstone Mortgage Trust, Inc., Class A | 3,435,251 | ||
| 523,667 | BrightSpire Capital, Inc. | 3,304,339 | ||
| 913,978 | Broadmark Realty Capital, Inc. | 4,670,428 | ||
| 244,084 | KKR Real Estate Finance Trust, Inc. | 3,966,365 | ||
| 332,436 | Ladder Capital Corp. | 2,978,627 | ||
| 491,117 | Ready Capital Corp. | 4,979,926 | ||
| 188,836 | Starwood Property Trust, Inc. | 3,440,592 | ||
| 1,388,179 | Two Harbors Investment Corp. | 4,608,754 | ||
| 39,606,625 | ||||
| Office REITs – 2.5% | ||||
| 28,826 | Boston Properties, Inc. | 2,161,085 | ||
| 276,044 | Piedmont Office Realty Trust, Inc., Class A | 2,915,025 | ||
| 151,998 | SL Green Realty Corp. | 6,104,240 | ||
| 11,180,350 | ||||
| Retail REITs – 2.1% | ||||
| 100,019 | Brixmor Property Group, Inc. | 1,847,351 | ||
| 97,777 | Getty Realty Corp. | 2,629,223 | ||
| Shares/ Units | Description | Value | ||
| REAL ESTATE INVESTMENT TRUSTS (Continued) | ||||
| Retail REITs (Continued) | ||||
| 53,330 | National Retail Properties, Inc. | $2,125,734 | ||
| 31,264 | Simon Property Group, Inc. | 2,805,944 | ||
| 9,408,252 | ||||
| Specialized REITs – 2.6% | ||||
| 89,118 | Four Corners Property Trust, Inc. | 2,155,764 | ||
| 63,148 | Gaming and Leisure Properties, Inc. | 2,793,667 | ||
| 26,934 | Lamar Advertising Co., Class A | 2,221,786 | ||
| 341,379 | Uniti Group, Inc. | 2,372,584 | ||
| 68,002 | VICI Properties, Inc. | 2,029,860 | ||
| 11,573,661 | ||||
Total Real Estate Investment Trusts | 79,884,213 | |||
| (Cost $99,101,171) | ||||
| Shares | Description | Stated Rate | Stated Maturity | Value | ||||
| $25 PAR PREFERRED SECURITIES – 20.8% | ||||||||
| Banks – 4.0% | ||||||||
| 128,745 | Citigroup Capital XIII, 3 Mo. LIBOR + 6.37% (b) | 9.18% | 10/30/40 | 3,591,986 | ||||
| 146,052 | Citigroup, Inc., Series J (c) | 7.13% | (d) | 3,743,313 | ||||
| 141,116 | Citigroup, Inc., Series K (c) | 6.88% | (d) | 3,616,803 | ||||
| 130,701 | PNC Financial Services Group (The), Inc., Series P, 3 Mo. LIBOR + 4.07% (b) | 6.85% | (d) | 3,317,191 | ||||
| 141,435 | Wells Fargo & Co., Series R (c) | 6.63% | (d) | �� | 3,585,377 | |||
| 17,854,670 | ||||||||
| Capital Markets – 1.7% | ||||||||
| 148,292 | Morgan Stanley, Series E (c) | 7.13% | (d) | 3,787,378 | ||||
| 143,737 | Morgan Stanley, Series F (c) | 6.88% | (d) | 3,604,924 | ||||
| 7,392,302 | ||||||||
| Diversified Financial Services – 1.5% | ||||||||
| 144,200 | Apollo Asset Management, Inc., Class A | 6.38% | (d) | 3,492,524 | ||||
| 140,753 | Apollo Asset Management, Inc., Series B | 6.38% | (d) | 3,335,846 | ||||
| 6,828,370 | ||||||||
| Diversified Telecommunication Services – 1.7% | ||||||||
| 162,185 | Qwest Corp. | 6.50% | 09/01/56 | 3,675,112 | ||||
| 164,937 | Qwest Corp. | 6.75% | 06/15/57 | 3,793,551 | ||||
| 7,468,663 | ||||||||
| Food Products – 0.8% | ||||||||
| 140,544 | CHS, Inc., Series 1 | 7.88% | (d) | 3,644,306 | ||||
| Insurance – 1.5% | ||||||||
| 150,095 | Axis Capital Holdings Ltd., Series E | 5.50% | (d) | 3,164,002 | ||||
| 136,559 | Reinsurance Group of America, Inc., 3 Mo. LIBOR + 4.37% (b) | 7.66% | 09/15/42 | 3,444,018 | ||||
| 6,608,020 | ||||||||
| Mortgage Real Estate Investment Trusts – 4.2% | ||||||||
| 165,611 | AGNC Investment Corp., Series C (c) | 7.00% | (d) | 3,858,736 | ||||
| 180,591 | AGNC Investment Corp., Series E (c) | 6.50% | (d) | 3,720,175 | ||||
| 178,895 | AGNC Investment Corp., Series F (c) | 6.13% | (d) | 3,445,518 | ||||
| 229,162 | Chimera Investment Corp., Series B (c) | 8.00% | (d) | 4,033,251 | ||||
| Shares | Description | Stated Rate | Stated Maturity | Value | ||||
| $25 PAR PREFERRED SECURITIES (Continued) | ||||||||
| Mortgage Real Estate Investment Trusts (Continued) | ||||||||
| 221,814 | Two Harbors Investment Corp., Series B (c) | 7.63% | (d) | $3,912,799 | ||||
| 18,970,479 | ||||||||
| Multi-Utilities – 0.7% | ||||||||
| 134,545 | NiSource, Inc., Series B (c) | 6.50% | (d) | 3,320,571 | ||||
| Oil, Gas & Consumable Fuels – 0.9% | ||||||||
| 161,100 | NuStar Logistics L.P., 3 Mo. LIBOR + 6.73% (b) | 9.25% | 01/15/43 | 3,932,451 | ||||
| Real Estate Management & Development – 2.7% | ||||||||
| 174,640 | DigitalBridge Group, Inc., Class H | 7.13% | (d) | 3,917,175 | ||||
| 177,214 | DigitalBridge Group, Inc., Series I | 7.15% | (d) | 3,962,505 | ||||
| 176,656 | DigitalBridge Group, Inc., Series J | 7.13% | (d) | 4,003,025 | ||||
| 11,882,705 | ||||||||
| Trading Companies & Distributors – 1.1% | ||||||||
| 189,556 | WESCO International, Inc., Series A (c) | 10.63% | (d) | 5,108,534 | ||||
Total $25 Par Preferred Securities | 93,011,071 | |||||||
| (Cost $100,261,602) | ||||||||
| Shares | Description | Value | ||
| EXCHANGE-TRADED FUNDS – 20.6% | ||||
| 2,396,347 | First Trust Tactical High Yield ETF (e) | 91,828,017 | ||
| (Cost $113,970,109) | ||||
Total Investments – 99.2% | 442,541,641 | |||
| (Cost $487,754,815) | ||||
Net Other Assets and Liabilities – 0.8% | 3,559,303 | |||
Net Assets – 100.0% | $446,100,944 | |||
| (a) | This security is taxed as a “C” corporation for federal income tax purposes. |
| (b) | Floating rate security. |
| (c) | Fixed-to-floating or fixed-to-variable rate security. The interest rate shown reflects the fixed rate in effect at September 30, 2022. At a predetermined date, the fixed rate will change to a floating rate or a variable rate. |
| (d) | Perpetual maturity. |
| (e) | Investment in an affiliated fund. |
| LIBOR | London Interbank Offered Rate |
| Total Value at 9/30/2022 | Level 1 Quoted Prices | Level 2 Significant Observable Inputs | Level 3 Significant Unobservable Inputs | |
Master Limited Partnerships* | $ 90,139,058 | $ 90,139,058 | $ — | $ — |
Common Stocks* | 87,679,282 | 87,679,282 | — | — |
Real Estate Investment Trusts* | 79,884,213 | 79,884,213 | — | — |
$25 Par Preferred Securities* | 93,011,071 | 93,011,071 | — | — |
Exchange-Traded Funds | 91,828,017 | 91,828,017 | — | — |
Total Investments | $ 442,541,641 | $ 442,541,641 | $— | $— |
| * | See Portfolio of Investments for industry breakout. |
| Shares | Description | Value | ||
| COMMON STOCKS – 91.3% | ||||
| Aerospace & Defense – 3.3% | ||||
| 93,234 | BAE Systems PLC (a) | $819,193 | ||
| 249,600 | Singapore Technologies Engineering Ltd. (a) | 620,120 | ||
| 1,439,313 | ||||
| Banks – 7.4% | ||||
| 3,988 | Bank of Montreal | 349,533 | ||
| 7,304 | Bank of Nova Scotia (The) | 347,394 | ||
| 7,859 | Banque Cantonale Vaudoise (a) | 743,524 | ||
| 8,035 | Canadian Imperial Bank of Commerce | 351,682 | ||
| 33,300 | Fukuoka Financial Group, Inc. (a) | 593,046 | ||
| 96,200 | Mitsubishi UFJ Financial Group, Inc. (a) | 435,798 | ||
| 15,100 | Sumitomo Mitsui Trust Holdings, Inc. (a) | 429,440 | ||
| 3,250,417 | ||||
| Beverages – 2.0% | ||||
| 121,539 | Arca Continental S.A.B. de C.V. | 875,115 | ||
| Capital Markets – 3.8% | ||||
| 192,277 | Ashmore Group PLC (a) | 419,859 | ||
| 60,017 | IG Group Holdings PLC (a) | 508,630 | ||
| 15,505 | IGM Financial, Inc. | 386,348 | ||
| 19,600 | SBI Holdings, Inc. (a) | 351,723 | ||
| 1,666,560 | ||||
| Chemicals – 2.0% | ||||
| 12,093 | BASF SE (a) | 464,110 | ||
| 19,500 | Denka Co., Ltd. (a) | 428,790 | ||
| 892,900 | ||||
| Commercial Services & Supplies – 0.9% | ||||
| 31,494 | Intrum AB (a) | 395,839 | ||
| Construction & Engineering – 1.5% | ||||
| 25,558 | Bouygues S.A. (a) | 668,559 | ||
| Diversified Telecommunication Services – 5.7% | ||||
| 16,182 | BCE, Inc. | 678,511 | ||
| 1,301 | Swisscom AG (a) | 609,182 | ||
| 68,216 | Telenor ASA (a) | 624,321 | ||
| 29,707 | TELUS Corp. | 589,903 | ||
| 2,501,917 | ||||
| Electric Utilities – 7.9% | ||||
| 137,084 | CK Infrastructure Holdings Ltd. (a) | 699,173 | ||
| 68,212 | CLP Holdings, Ltd. (a) | 515,528 | ||
| 129,413 | EDP - Energias de Portugal S.A. (a) | 561,654 | ||
| Shares | Description | Value | ||
| Electric Utilities (Continued) | ||||
| 14,125 | Emera, Inc. | $571,504 | ||
| 25,042 | Fortum Oyj (a) | 336,491 | ||
| 161,084 | Power Assets Holdings Ltd. (a) | 807,478 | ||
| 3,491,828 | ||||
| Gas Utilities – 7.0% | ||||
| 124,767 | APA Group (a) | 767,685 | ||
| 204,004 | Beijing Enterprises Holdings Ltd. (a) | 571,734 | ||
| 62,978 | Enagas S.A. (a) | 974,833 | ||
| 36,656 | Rubis SCA (a) | 762,818 | ||
| 3,077,070 | ||||
| Independent Power & Renewable Electricity Producers – 4.4% | ||||
| 28,887 | Capital Power Corp. | 980,780 | ||
| 65,800 | Electric Power Development Co., Ltd. (a) | 930,510 | ||
| 1,911,290 | ||||
| Insurance – 13.5% | ||||
| 14,775 | Ageas S.A./N.V. (a) | 538,869 | ||
| 2,337 | Allianz SE (a) | 368,158 | ||
| 3,190 | Baloise Holding AG (a) | 407,601 | ||
| 19,985 | Great-West Lifeco, Inc. | 431,428 | ||
| 4,786 | Helvetia Holding AG (a) | 448,475 | ||
| 188,783 | Legal & General Group PLC (a) | 450,621 | ||
| 27,001 | Manulife Financial Corp. | 423,775 | ||
| 17,500 | MS&AD Insurance Group Holdings, Inc. (a) | 463,448 | ||
| 1,573 | Muenchener Rueckversicherungs-Gesellschaft AG in Muenchen (a) | 378,654 | ||
| 16,926 | Power Corp. of Canada | 381,443 | ||
| 7,838 | Sun Life Financial, Inc. | 311,682 | ||
| 754 | Swiss Life Holding AG (a) | 333,126 | ||
| 24,900 | Tokio Marine Holdings, Inc. (a) | 442,551 | ||
| 1,339 | Zurich Insurance Group AG (a) | 533,793 | ||
| 5,913,624 | ||||
| Machinery – 1.0% | ||||
| 7,908 | Sulzer AG (a) | 454,925 | ||
| Media – 1.1% | ||||
| 26,062 | Quebecor, Inc., Class B | 480,544 | ||
| Metals & Mining – 1.3% | ||||
| 41,400 | Asahi Holdings, Inc. (a) | 581,464 | ||
| Multi-Utilities – 3.0% | ||||
| 20,593 | ATCO Ltd., Class I | 632,840 | ||
| 26,925 | Canadian Utilities Ltd., Class A | 700,340 | ||
| 1,333,180 | ||||
| Shares | Description | Value | ||
| COMMON STOCKS (Continued) | ||||
| Oil, Gas & Consumable Fuels – 7.8% | ||||
| 13,315 | Canadian Natural Resources Ltd. | $619,796 | ||
| 220,300 | ENEOS Holdings, Inc. (a) | 710,501 | ||
| 47,248 | Keyera Corp. | 972,768 | ||
| 19,658 | Koninklijke Vopak N.V. (a) | 357,671 | ||
| 18,546 | TC Energy Corp. | 747,022 | ||
| 3,407,758 | ||||
| Paper & Forest Products – 1.2% | ||||
| 16,743 | UPM-Kymmene Oyj (a) | 531,330 | ||
| Pharmaceuticals – 3.3% | ||||
| 7,275 | Novartis AG (a) | 554,624 | ||
| 34,100 | Takeda Pharmaceutical Co., Ltd. (a) | 885,502 | ||
| 1,440,126 | ||||
| Professional Services – 1.1% | ||||
| 17,191 | Adecco Group AG (a) | 474,464 | ||
| Real Estate Management & Development – 8.5% | ||||
| 215,914 | Henderson Land Development Co., Ltd. (a) | 604,605 | ||
| 153,082 | Longfor Group Holdings Ltd. (a) (b) (c) | 438,817 | ||
| 292,914 | New World Development Co., Ltd. (a) | 831,902 | ||
| 774,146 | Sino Land Co., Ltd. (a) | 1,018,256 | ||
| 74,269 | Sun Hung Kai Properties Ltd. (a) | 819,653 | ||
| 3,713,233 | ||||
| Tobacco – 2.2% | ||||
| 15,929 | KT&G Corp. (a) | 961,793 | ||
| Water Utilities – 1.4% | ||||
| 789,839 | Guangdong Investment Ltd. (a) | 630,939 | ||
| Total Common Stocks | 40,094,188 | |||
| (Cost $49,981,207) | ||||
| REAL ESTATE INVESTMENT TRUSTS – 7.8% | ||||
| Equity Real Estate Investment Trusts – 7.8% | ||||
| 17,441 | Allied Properties Real Estate Investment Trust | 345,449 | ||
| 122 | Daiwa Office Investment Corp. (a) | 567,495 | ||
| 992 | Japan Metropolitan Fund Investment Corp. (a) | 744,807 | ||
| 88,806 | Link REIT (a) | 619,911 | ||
| 358,827 | Primary Health Properties PLC (a) | 454,674 | ||
| Shares | Description | Value | ||
| Equity Real Estate Investment Trusts (Continued) | ||||
| 36,623 | SmartCentres Real Estate Investment Trust | $687,999 | ||
| Total Real Estate Investment Trusts | 3,420,335 | |||
| (Cost $4,523,237) | ||||
| Total Investments – 99.1% | 43,514,523 | |||
| (Cost $54,504,444) | ||||
| Net Other Assets and Liabilities – 0.9% | 396,995 | |||
| Net Assets – 100.0% | $43,911,518 | |||
| (a) | This security is fair valued by the Advisor’s Pricing Committee in accordance with procedures approved by the Trust’s Board of Trustees and in accordance with provisions of the Investment Company Act of 1940 and rules thereunder, as amended. At September 30, 2022, securities noted as such are valued at $31,648,667 or 72.1% of net assets. Certain of these securities are fair valued using a factor provided by a third-party pricing service due to the change in value between the foreign markets’ close and the New York Stock Exchange close exceeding a certain threshold. On days when this threshold is not exceeded, these securities are typically valued at the last sale price on the exchange on which they are principally traded. |
| (b) | This security may be resold to qualified foreign investors and foreign institutional buyers under Regulation S of the Securities Act of 1933, as amended (the “1933 Act”). |
| (c) | This security is exempt from registration upon resale under Rule 144A of the 1933 Act and may be resold in transactions exempt from registration, normally to qualified institutional buyers. This security is not restricted on the foreign exchange where it trades freely without any additional registration. As such, it does not require the additional disclosure required of restricted securities. |
| Currency Exposure Diversification | % of Total Investments |
| Canadian Dollar | 25.2% |
| Japanese Yen | 17.4 |
| Hong Kong Dollar | 17.4 |
| Euro | 13.7 |
| Swiss Franc | 10.5 |
| British Pound Sterling | 6.1 |
| South Korean Won | 2.2 |
| Mexican Peso | 2.0 |
| Australian Dollar | 1.8 |
| Norwegian Krone | 1.4 |
| Singapore Dollar | 1.4 |
| Swedish Krona | 0.9 |
| Total | 100.0% |
| Total Value at 9/30/2022 | Level 1 Quoted Prices | Level 2 Significant Observable Inputs | Level 3 Significant Unobservable Inputs | |
| Common Stocks: | ||||
| Banks | $ 3,250,417 | $ 1,048,609 | $ 2,201,808 | $ — |
| Beverages | 875,115 | 875,115 | — | — |
| Capital Markets | 1,666,560 | 386,348 | 1,280,212 | — |
| Diversified Telecommunication Services | 2,501,917 | 1,268,414 | 1,233,503 | — |
| Electric Utilities | 3,491,828 | 571,504 | 2,920,324 | — |
| Independent Power & Renewable Electricity Producers | 1,911,290 | 980,780 | 930,510 | — |
| Insurance | 5,913,624 | 1,548,328 | 4,365,296 | — |
| Media | 480,544 | 480,544 | — | — |
| Multi-Utilities | 1,333,180 | 1,333,180 | — | — |
| Oil, Gas & Consumable Fuels | 3,407,758 | 2,339,586 | 1,068,172 | — |
| Other Industry Categories* | 15,261,955 | — | 15,261,955 | — |
| Real Estate Investment Trusts* | 3,420,335 | 1,033,448 | 2,386,887 | — |
| Total Investments | $ 43,514,523 | $ 11,865,856 | $ 31,648,667 | $— |
| * | See Portfolio of Investments for industry breakout. |
| Shares | Description | Value | ||
| COMMON STOCKS – 94.9% | ||||
| Aerospace & Defense – 0.8% | ||||
| 1,627 | Boeing (The) Co. (a) | $196,997 | ||
| 616 | Lockheed Martin Corp. | 237,955 | ||
| 3,384 | Raytheon Technologies Corp. | 277,014 | ||
| 711,966 | ||||
| Air Freight & Logistics – 0.3% | ||||
| 1,645 | United Parcel Service, Inc., Class B | 265,733 | ||
| Automobiles – 2.8% | ||||
| 44,320 | Stellantis N.V. | 524,749 | ||
| 7,335 | Tesla, Inc. (a) (b) | 1,945,609 | ||
| 2,470,358 | ||||
| Banks – 3.2% | ||||
| 23,239 | Bank of America Corp. | 701,818 | ||
| 5,112 | Citigroup, Inc. | 213,017 | ||
| 4,232 | HDFC Bank, Ltd., ADR | 247,233 | ||
| 9,741 | JPMorgan Chase & Co. (b) | 1,017,935 | ||
| 3,466 | Royal Bank of Canada | 312,079 | ||
| 8,679 | Wells Fargo & Co. (b) | 349,069 | ||
| 2,841,151 | ||||
| Beverages – 3.1% | ||||
| 9,961 | Coca-Cola (The) Co. | 558,015 | ||
| 31,096 | Coca-Cola European Partners PLC (b) | 1,325,312 | ||
| 2,998 | MGP Ingredients, Inc. | 318,268 | ||
| 3,567 | PepsiCo, Inc. | 582,348 | ||
| 2,783,943 | ||||
| Biotechnology – 1.0% | ||||
| 4,733 | AbbVie, Inc. (b) | 635,216 | ||
| 1,230 | Amgen, Inc. | 277,242 | ||
| 912,458 | ||||
| Building Products – 0.2% | ||||
| 2,741 | UFP Industries, Inc. | 197,791 | ||
| Capital Markets – 2.7% | ||||
| 17,351 | Artisan Partners Asset Management, Inc., Class A | 467,262 | ||
| 571 | BlackRock, Inc. | 314,210 | ||
| 3,607 | Charles Schwab (The) Corp. | 259,235 | ||
| 791 | Goldman Sachs Group (The), Inc. | 231,803 | ||
| 10,166 | Moelis & Co., Class A | 343,712 | ||
| 5,401 | Morgan Stanley | 426,733 | ||
| 1,323 | S&P Global, Inc. | 403,978 | ||
| 2,446,933 | ||||
| Chemicals – 1.1% | ||||
| 6,443 | Chemours (The) Co. | 158,820 | ||
| 1,169 | Linde PLC | 315,151 | ||
| 8,832 | Valvoline, Inc. | 223,803 | ||
| 3,373 | Westlake Corp. | 293,046 | ||
| 990,820 | ||||
| Communications Equipment – 0.9% | ||||
| 13,826 | Cisco Systems, Inc. | 553,040 | ||
| Shares | Description | Value | ||
| COMMON STOCKS (Continued) | ||||
| Communications Equipment (Continued) | ||||
| 35,661 | Telefonaktiebolaget LM Ericsson, ADR | $204,694 | ||
| 757,734 | ||||
| Consumer Finance – 0.3% | ||||
| 1,920 | American Express Co. | 259,027 | ||
| Containers & Packaging – 1.2% | ||||
| 18,919 | Sonoco Products Co. (b) | 1,073,275 | ||
| Diversified Financial Services – 1.7% | ||||
| 5,777 | Berkshire Hathaway, Inc., Class B (a) (b) | 1,542,574 | ||
| Diversified Telecommunication Services – 0.9% | ||||
| 15,622 | AT&T, Inc. (b) | 239,641 | ||
| 15,632 | Verizon Communications, Inc. | 593,547 | ||
| 833,188 | ||||
| Electric Utilities – 2.4% | ||||
| 20,190 | Avangrid, Inc. | 841,923 | ||
| 7,306 | IDACORP, Inc. | 723,367 | ||
| 4,749 | NextEra Energy, Inc. | 372,369 | ||
| 3,697 | Otter Tail Corp. | 227,440 | ||
| 2,165,099 | ||||
| Electrical Equipment – 0.4% | ||||
| 13,808 | ABB, Ltd., ADR | 354,313 | ||
| Entertainment – 0.9% | ||||
| 1,107 | Netflix, Inc. (a) | 260,632 | ||
| 6,118 | Walt Disney (The) Co. (a) | 577,111 | ||
| 837,743 | ||||
| Food & Staples Retailing – 1.5% | ||||
| 1,142 | Costco Wholesale Corp. | 539,332 | ||
| 6,465 | Grocery Outlet Holding Corp. (a) | 215,220 | ||
| 4,832 | Walmart, Inc. | 626,711 | ||
| 1,381,263 | ||||
| Food Products – 2.6% | ||||
| 22,811 | Cal-Maine Foods, Inc. (b) | 1,268,064 | ||
| 32,331 | Flowers Foods, Inc. | 798,252 | ||
| 4,174 | Mondelez International, Inc., Class A | 228,860 | ||
| 2,295,176 | ||||
| Health Care Equipment & Supplies – 3.1% | ||||
| 6,408 | Abbott Laboratories | 620,038 | ||
| 1,634 | Intuitive Surgical, Inc. (a) | 306,277 | ||
| 14,486 | Koninklijke Philips N.V. | 222,940 | ||
| 19,072 | Lantheus Holdings, Inc. (a) (b) | 1,341,334 | ||
| 2,986 | Medtronic PLC | 241,119 | ||
| 2,731,708 | ||||
| Health Care Providers & Services – 2.9% | ||||
| 944 | Cigna Corp. | 261,932 | ||
| 3,026 | CVS Health Corp. (b) | 288,590 | ||
| 560 | Elevance Health, Inc. | 254,374 | ||
| 20,410 | Patterson Cos., Inc. | 490,248 | ||
| Shares | Description | Value | ||
| COMMON STOCKS (Continued) | ||||
| Health Care Providers & Services (Continued) | ||||
| 2,635 | UnitedHealth Group, Inc. (b) | $1,330,780 | ||
| 2,625,924 | ||||
| Hotels, Restaurants & Leisure – 0.9% | ||||
| 1,809 | McDonald’s Corp. | 417,409 | ||
| 4,477 | Starbucks Corp. | 377,232 | ||
| 794,641 | ||||
| Household Durables – 0.3% | ||||
| 4,766 | Sony Group Corp., ADR | 305,262 | ||
| Household Products – 1.1% | ||||
| 7,933 | Procter & Gamble (The) Co. (b) | 1,001,541 | ||
| Independent Power & Renewable Electricity Producers – 1.0% | ||||
| 15,766 | Atlantica Sustainable Infrastructure PLC | 414,646 | ||
| 6,564 | Clearway Energy, Inc., Class C | 209,063 | ||
| 10,570 | Vistra Corp. | 221,970 | ||
| 845,679 | ||||
| Industrial Conglomerates – 0.8% | ||||
| 2,537 | 3M Co. | 280,339 | ||
| 2,558 | Honeywell International, Inc. | 427,109 | ||
| 707,448 | ||||
| Interactive Media & Services – 5.2% | ||||
| 19,324 | Alphabet, Inc., Class A (a) (b) | 1,848,341 | ||
| 17,785 | Alphabet, Inc., Class C (a) (b) | 1,710,028 | ||
| 7,764 | Meta Platforms, Inc., Class A (a) (b) | 1,053,419 | ||
| 4,611,788 | ||||
| Internet & Direct Marketing Retail – 3.3% | ||||
| 26,473 | Amazon.com, Inc. (a) (b) | 2,991,449 | ||
| IT Services – 3.7% | ||||
| 1,569 | Accenture PLC, Class A | 403,704 | ||
| 1,048 | Automatic Data Processing, Inc. | 237,047 | ||
| 13,632 | Infosys Ltd., ADR | 231,335 | ||
| 1,965 | International Business Machines Corp. | 233,462 | ||
| 2,866 | Mastercard, Inc., Class A | 814,918 | ||
| 4,684 | PayPal Holdings, Inc. (a) | 403,152 | ||
| 5,520 | Visa, Inc., Class A (b) | 980,628 | ||
| 3,304,246 | ||||
| Life Sciences Tools & Services – 1.4% | ||||
| 2,314 | Danaher Corp. | 597,683 | ||
| 1,309 | Thermo Fisher Scientific, Inc. (b) | 663,912 | ||
| 1,261,595 | ||||
| Machinery – 0.5% | ||||
| 1,382 | Caterpillar, Inc. | 226,758 | ||
| 746 | Deere & Co. | 249,082 | ||
| 475,840 | ||||
| Media – 0.6% | ||||
| 16,857 | Comcast Corp., Class A | 494,416 | ||
| Shares | Description | Value | ||
| COMMON STOCKS (Continued) | ||||
| Metals & Mining – 0.8% | ||||
| 2,846 | Reliance Steel & Aluminum Co. | $496,371 | ||
| 3,213 | Steel Dynamics, Inc. | 227,962 | ||
| 724,333 | ||||
| Multi-Utilities – 0.5% | ||||
| 12,080 | Avista Corp. | 447,564 | ||
| Oil, Gas & Consumable Fuels – 9.6% | ||||
| 39,481 | Antero Midstream Corp. | 362,436 | ||
| 6,542 | Antero Resources Corp. (a) | 199,727 | ||
| 10,258 | Archaea Energy, Inc. (a) | 184,747 | ||
| 10,637 | Chesapeake Energy Corp. (b) | 1,002,112 | ||
| 5,164 | Chevron Corp. | 741,912 | ||
| 58,129 | Comstock Resources, Inc. (a) (b) | 1,005,050 | ||
| 2,654 | ConocoPhillips | 271,610 | ||
| 17,634 | CVR Energy, Inc. | 511,033 | ||
| 14,423 | Delek US Holdings, Inc. | 391,440 | ||
| 13,027 | EQT Corp. | 530,850 | ||
| 11,234 | Exxon Mobil Corp. (b) | 980,841 | ||
| 11,401 | Magnolia Oil & Gas Corp., Class A | 225,854 | ||
| 8,369 | Murphy Oil Corp. | 294,338 | ||
| 6,333 | New Fortress Energy, Inc. | 276,815 | ||
| 10,601 | Ovintiv, Inc. | 487,646 | ||
| 7,622 | PBF Energy, Inc., Class A (a) | 267,990 | ||
| 7,548 | PDC Energy, Inc. | 436,199 | ||
| 7,923 | Range Resources Corp. | 200,135 | ||
| 26,037 | SFL Corp., Ltd. | 237,197 | ||
| 8,607,932 | ||||
| Personal Products – 0.5% | ||||
| 9,495 | Unilever PLC, ADR | 416,261 | ||
| Pharmaceuticals – 5.5% | ||||
| 4,984 | Bristol-Myers Squibb Co. | 354,313 | ||
| 2,012 | Eli Lilly & Co. | 650,580 | ||
| 9,241 | Johnson & Johnson (b) | 1,509,610 | ||
| 6,361 | Merck & Co., Inc. | 547,809 | ||
| 10,932 | Novartis AG, ADR | 830,942 | ||
| 15,082 | Pfizer, Inc. | 659,988 | ||
| 9,418 | Royalty Pharma PLC, Class A | 378,415 | ||
| 4,931,657 | ||||
| Professional Services – 0.2% | ||||
| 3,316 | TransUnion | 197,269 | ||
| Road & Rail – 0.3% | ||||
| 1,382 | Union Pacific Corp. | 269,241 | ||
| Semiconductors & Semiconductor Equipment – 3.8% | ||||
| 3,817 | Advanced Micro Devices, Inc. (a) | 241,845 | ||
| 1,589 | Analog Devices, Inc. | 221,411 | ||
| 3,694 | Applied Materials, Inc. | 302,650 | ||
| 1,039 | Broadcom, Inc. | 461,326 | ||
| 11,434 | Intel Corp. | 294,654 | ||
| 6,414 | NVIDIA Corp. (b) | 778,596 | ||
| 2,648 | QUALCOMM, Inc. | 299,171 | ||
| 5,632 | Taiwan Semiconductor Manufacturing Co., Ltd., ADR | 386,130 | ||
| Shares | Description | Value | ||
| COMMON STOCKS (Continued) | ||||
| Semiconductors & Semiconductor Equipment (Continued) | ||||
| 2,842 | Texas Instruments, Inc. | $439,885 | ||
| 3,425,668 | ||||
| Software – 9.4% | ||||
| 1,810 | Adobe, Inc. (a) | 498,112 | ||
| 1,091 | Intuit, Inc. | 422,566 | ||
| 22,682 | Microsoft Corp. (b) | 5,282,638 | ||
| 1,401 | Nice Ltd., ADR (a) | 263,724 | ||
| 6,086 | Oracle Corp. | 371,672 | ||
| 3,705 | salesforce.com, Inc. (a) | 532,927 | ||
| 8,797 | SAP SE, ADR | 714,756 | ||
| 816 | ServiceNow, Inc. (a) | 308,130 | ||
| 8,394,525 | ||||
| Specialty Retail – 2.2% | ||||
| 11,839 | Buckle (The), Inc. | 374,823 | ||
| 2,695 | Home Depot (The), Inc. (b) | 743,658 | ||
| 1,431 | Lowe’s Cos., Inc. | 268,756 | ||
| 2,054 | Murphy USA, Inc. | 564,665 | ||
| 1,951,902 | ||||
| Technology Hardware, Storage & Peripherals – 7.1% | ||||
| 46,018 | Apple, Inc. (b) | 6,359,688 | ||
| Textiles, Apparel & Luxury Goods – 0.5% | ||||
| 4,807 | NIKE, Inc., Class B | 399,558 | ||
| Tobacco – 0.3% | ||||
| 3,591 | Philip Morris International, Inc. | 298,089 | ||
| Trading Companies & Distributors – 1.0% | ||||
| 1,574 | Veritiv Corp (a) | 153,890 | ||
| 3,024 | Watsco, Inc. | 778,559 | ||
| 932,449 | ||||
| Wireless Telecommunication Services – 0.4% | ||||
| 2,536 | T-Mobile US, Inc. (a) | 340,255 | ||
Total Common Stocks | 84,968,473 | |||
| (Cost $93,396,209) | ||||
| REAL ESTATE INVESTMENT TRUSTS – 3.2% | ||||
| Equity Real Estate Investment Trusts – 3.2% | ||||
| 1,829 | American Tower Corp. | 392,686 | ||
| 47,409 | Apartment Investment and Management Co., Class A | 346,086 | ||
| 8,943 | EPR Properties | 320,696 | ||
| 23,074 | Equity Commonwealth | 562,083 | ||
| 13,921 | Omega Healthcare Investors, Inc. | 410,530 | ||
| 1,986 | Prologis, Inc. | 201,778 | ||
| 20,550 | VICI Properties, Inc. | 613,417 | ||
Total Real Estate Investment Trusts | 2,847,276 | |||
| (Cost $3,255,596) | ||||
| Units | Description | Value | ||
| MASTER LIMITED PARTNERSHIPS – 0.5% | ||||
| Oil, Gas & Consumable Fuels – 0.5% | ||||
| 15,020 | Viper Energy Partners, L.P. (c) | $430,473 | ||
| (Cost $446,751) | ||||
Total Investments – 98.6% | 88,246,222 | |||
| (Cost $97,098,556) | ||||
| Number of Contracts | Description | Notional Amount | Exercise Price | Expiration Date | Value | |||||
| CALL OPTIONS WRITTEN – (0.1)% | ||||||||||
| (16) | S&P 500® Index | $(5,736,992) | $3,950.00 | 10/21/22 | (6,912) | |||||
| (13) | S&P 500® Index | (4,661,306) | 4,050.00 | 10/21/22 | (2,041) | |||||
| (50) | S&P 500® Index | (17,928,100) | 4,100.00 | 10/21/22 | (4,750) | |||||
| (18) | S&P 500® Index | (6,454,116) | 4,300.00 | 10/21/22 | (360) | |||||
| (38) | S&P 500® Index | (13,625,356) | 4,325.00 | 10/21/22 | (855) | |||||
| (16) | S&P 500® Index | (5,736,992) | 3,975.00 | 11/18/22 | (29,008) | |||||
| (23) | S&P 500® Index | (8,246,926) | 4,000.00 | 11/18/22 | (35,420) | |||||
Total Call Options Written | (79,346) | |||||||||
| (Premiums received $1,911,411) | ||||||||||
Net Other Assets and Liabilities – 1.5% | 1,360,012 | ||
Net Assets – 100.0% | $89,526,888 |
| (a) | Non-income producing security. |
| (b) | All or a portion of this security is pledged to cover options written. |
| (c) | This security is taxed as a “C” corporation for federal income tax purposes. |
| ADR | American Depositary Receipt |
| ASSETS TABLE | ||||
| Total Value at 9/30/2022 | Level 1 Quoted Prices | Level 2 Significant Observable Inputs | Level 3 Significant Unobservable Inputs | |
Common Stocks* | $ 84,968,473 | $ 84,968,473 | $ — | $ — |
Real Estate Investment Trusts* | 2,847,276 | 2,847,276 | — | — |
Master Limited Partnerships* | 430,473 | 430,473 | — | — |
Total Investments | $ 88,246,222 | $ 88,246,222 | $— | $— |
| LIABILITIES TABLE | ||||
| Total Value at 9/30/2022 | Level 1 Quoted Prices | Level 2 Significant Observable Inputs | Level 3 Significant Unobservable Inputs | |
Call Options Written | $ (79,346) | $ (78,491) | $ (855) | $ — |
| * | See Portfolio of Investments for industry breakout. |
| Shares | Description | Value | ||
| COMMON STOCKS – 97.6% | ||||
| Aerospace & Defense – 0.5% | ||||
| 635 | AeroVironment, Inc. (a) | $52,934 | ||
| 9,973 | Rocket Lab USA, Inc. (a) | 40,590 | ||
| 93,524 | ||||
| Auto Components – 0.2% | ||||
| 5,059 | Luminar Technologies, Inc. (a) | 36,855 | ||
| Automobiles – 4.5% | ||||
| 3,217 | Tesla, Inc. (a) (b) | 853,309 | ||
| Banks – 3.4% | ||||
| 2,588 | ConnectOne Bancorp, Inc. | 59,679 | ||
| 690 | Independent Bank Group, Inc. | 42,359 | ||
| 2,184 | Lakeland Financial Corp. | 159,017 | ||
| 1,492 | Live Oak Bancshares, Inc. | 45,655 | ||
| 1,030 | Triumph Bancorp, Inc. (a) | 55,981 | ||
| 1,327 | UMB Financial Corp. | 111,853 | ||
| 4,540 | Valley National Bancorp | 49,032 | ||
| 2,080 | Veritex Holdings, Inc. | 55,307 | ||
| 1,154 | Zions Bancorp N.A. | 58,693 | ||
| 637,576 | ||||
| Beverages – 2.4% | ||||
| 899 | Coca-Cola (The) Co. | 50,362 | ||
| 2,431 | PepsiCo, Inc. (b) | 396,885 | ||
| 447,247 | ||||
| Biotechnology – 3.7% | ||||
| 2,351 | Ascendis Pharma A.S., ADR (a) | 242,764 | ||
| 4,410 | Avidity Biosciences, Inc. (a) | 72,015 | ||
| 1,805 | Legend Biotech Corp., ADR (a) | 73,644 | ||
| 2,435 | Prometheus Biosciences, Inc. (a) | 143,690 | ||
| 5,056 | Relay Therapeutics, Inc. (a) | 113,103 | ||
| 2,285 | Xencor, Inc. (a) | 59,364 | ||
| 704,580 | ||||
| Capital Markets – 5.1% | ||||
| 37,754 | BGC Partners, Inc., Class A | 118,547 | ||
| 1,129 | Coinbase Global, Inc., Class A (a) | 72,809 | ||
| 877 | MarketAxess Holdings, Inc. | 195,124 | ||
| 928 | Morningstar, Inc. | 197,033 | ||
| 2,103 | Northern Trust Corp. | 179,933 | ||
| 19,113 | Perella Weinberg Partners | 120,985 | ||
| 3,825 | Victory Capital Holdings, Inc., Class A | 89,161 | ||
| 973,592 | ||||
| Communications Equipment – 1.5% | ||||
| 6,998 | Cisco Systems, Inc. (b) | 279,920 | ||
| Consumer Finance – 0.3% | ||||
| 13,521 | SoFi Technologies, Inc. (a) | 65,983 | ||
| Diversified Telecommunication Services – 0.3% | ||||
| 1,387 | Anterix, Inc. (a) | 49,544 | ||
| Electric Utilities – 3.1% | ||||
| 3,712 | Alliant Energy Corp. (b) | 196,699 | ||
| 2,727 | MGE Energy, Inc. (b) | 178,973 | ||
| Shares | Description | Value | ||
| COMMON STOCKS (Continued) | ||||
| Electric Utilities (Continued) | ||||
| 3,401 | Otter Tail Corp. (b) | $209,229 | ||
| 584,901 | ||||
| Electrical Equipment – 0.5% | ||||
| 4,932 | Enovix Corp. (a) | 90,428 | ||
| Financial Services – 1.2% | ||||
| 23,126 | FTAC Hera Acquisition Corp., Class A (a) (b) | 229,526 | ||
| Food & Staples Retailing – 2.2% | ||||
| 884 | Costco Wholesale Corp. (b) | 417,487 | ||
| Health Care Equipment & Supplies – 1.6% | ||||
| 440 | Insulet Corp. (a) | 100,936 | ||
| 4,242 | OrthoPediatrics Corp. (a) | 195,726 | ||
| 296,662 | ||||
| Health Care Providers & Services – 0.9% | ||||
| 3,233 | Premier, Inc., Class A | 109,728 | ||
| 106 | UnitedHealth Group, Inc. | 53,534 | ||
| 163,262 | ||||
| Household Products – 1.4% | ||||
| 5,248 | Central Garden & Pet Co., Class A (a) | 179,272 | ||
| 709 | Procter & Gamble (The) Co. | 89,511 | ||
| 268,783 | ||||
| Independent Power & Renewable Electricity Producers – 0.6% | ||||
| 6,473 | Montauk Renewables, Inc. (a) | 112,889 | ||
| Interactive Media & Services – 6.8% | ||||
| 4,152 | Alphabet, Inc., Class A (a) (b) | 397,139 | ||
| 4,155 | Alphabet, Inc., Class C (a) (b) | 399,503 | ||
| 3,196 | Kanzhun Ltd., ADR (a) | 53,948 | ||
| 3,239 | Meta Platforms, Inc., Class A (a) (b) | 439,468 | ||
| 1,290,058 | ||||
| Internet & Direct Marketing Retail – 4.2% | ||||
| 6,948 | Amazon.com, Inc. (a) (b) | 785,124 | ||
| IT Services – 0.7% | ||||
| 2,329 | GDS Holdings Ltd., ADR (a) | 41,130 | ||
| 165 | Mastercard, Inc., Class A | 46,916 | ||
| 272 | Visa, Inc., Class A | 48,321 | ||
| 136,367 | ||||
| Leisure Products – 0.3% | ||||
| 3,861 | Clarus Corp. | 52,008 | ||
| Life Sciences Tools & Services – 0.5% | ||||
| 194 | Danaher Corp. | 50,108 | ||
| 101 | Thermo Fisher Scientific, Inc. | 51,226 | ||
| 101,334 | ||||
| Machinery – 0.2% | ||||
| 18,043 | Sarcos Technology and Robotics Corp. (a) | 40,055 | ||
| Media – 5.0% | ||||
| 9,153 | Comcast Corp., Class A (b) | 268,457 | ||
| Shares | Description | Value | ||
| COMMON STOCKS (Continued) | ||||
| Media (Continued) | ||||
| 6,993 | Fox Corp, Class B (b) | $199,301 | ||
| 2,058 | Liberty Broadband Corp., Class A (a) | 153,527 | ||
| 1,976 | Liberty Broadband Corp., Class C (a) | 145,829 | ||
| 12,008 | News Corp., Class B | 185,163 | ||
| 952,277 | ||||
| Pharmaceuticals – 0.3% | ||||
| 394 | Zoetis, Inc. | 58,426 | ||
| Real Estate Management & Development – 0.3% | ||||
| 1,684 | Zillow Group, Inc., Class C (a) | 48,179 | ||
| Road & Rail – 0.7% | ||||
| 3,782 | Werner Enterprises, Inc. | 142,203 | ||
| Semiconductors & Semiconductor Equipment – 10.7% | ||||
| 2,914 | Advanced Micro Devices, Inc. (a) (b) | 184,631 | ||
| 717 | Broadcom, Inc. (b) | 318,355 | ||
| 1,915 | Canadian Solar, Inc. (a) | 71,334 | ||
| 9,550 | indie Semiconductor, Inc., Class A (a) | 69,906 | ||
| 7,581 | Intel Corp. (b) | 195,362 | ||
| 6,933 | Navitas Semiconductor Corp. (a) | 33,625 | ||
| 2,291 | Nova, Ltd. (a) | 195,422 | ||
| 3,842 | NVIDIA Corp. (b) | 466,381 | ||
| 1,908 | QUALCOMM, Inc. (b) | 215,566 | ||
| 1,741 | Texas Instruments, Inc. (b) | 269,472 | ||
| 2,020,054 | ||||
| Software – 16.2% | ||||
| 6,467 | ACI Worldwide, Inc. (a) | 135,160 | ||
| 864 | Adobe, Inc. (a) (b) | 237,773 | ||
| 1,805 | Check Point Software Technologies Ltd. (a) (b) | 202,196 | ||
| 818 | Intuit, Inc. | 316,828 | ||
| 7,754 | Microsoft Corp. (b) | 1,805,907 | ||
| 273 | MicroStrategy, Inc., Class A (a) | 57,947 | ||
| 2,579 | Paycor HCM, Inc. (a) | 76,235 | ||
| 530 | Paylocity Holding Corp. (a) | 128,037 | ||
| 341 | salesforce.com, Inc. (a) | 49,050 | ||
| 122 | ServiceNow, Inc. (a) | 46,068 | ||
| 3,055,201 | ||||
| Specialty Retail – 0.2% | ||||
| 7,544 | Brilliant Earth Group, Inc., Class A (a) | 43,227 | ||
| Technology Hardware, Storage & Peripherals – 12.1% | ||||
| 16,504 | Apple, Inc. (b) | 2,280,853 | ||
| Textiles, Apparel & Luxury Goods – 0.2% | ||||
| 502 | NIKE, Inc., Class B | 41,726 | ||
| Thrifts & Mortgage Finance – 1.2% | ||||
| 10,096 | Enact Holdings, Inc. (b) | 223,828 | ||
| Trading Companies & Distributors – 1.0% | ||||
| 4,180 | Rush Enterprises, Inc., Class A | 183,335 | ||
| Water Utilities – 1.0% | ||||
| 2,494 | Middlesex Water Co. (b) | 192,537 | ||
| Shares | Description | Value | ||
| COMMON STOCKS (Continued) | ||||
| Wireless Telecommunication Services – 2.6% | ||||
| 3,466 | Shenandoah Telecommunications Co. | $58,991 | ||
| 2,293 | T-Mobile US, Inc. (a) | 307,652 | ||
| 10,692 | Vodafone Group PLC, ADR | 121,141 | ||
| 487,784 | ||||
Total Investments – 97.6% | 18,440,644 | |||
| (Cost $20,994,169) | ||||
| Number of Contracts | Description | Notional Amount | Exercise Price | Expiration Date | Value | |||||
| CALL OPTIONS WRITTEN – (0.4)% | ||||||||||
| (2) | Nasdaq-100 Index® | $(2,194,244) | $11,500.00 | 10/21/22 | (30,200) | |||||
| (2) | Nasdaq-100 Index® | (2,194,244) | 12,000.00 | 10/21/22 | (9,460) | |||||
| (2) | Nasdaq-100 Index® | (2,194,244) | 12,500.00 | 10/21/22 | (3,780) | |||||
| (2) | Nasdaq-100 Index® | (2,194,244) | 13,000.00 | 10/21/22 | (612) | |||||
| (2) | Nasdaq-100 Index® | (2,194,244) | 13,250.00 | 10/21/22 | (360) | |||||
| (2) | Nasdaq-100 Index® | (2,194,244) | 12,250.00 | 11/18/22 | (22,260) | |||||
| (1) | Nasdaq-100 Index® | (1,097,122) | 12,500.00 | 11/18/22 | (6,835) | |||||
Total Call Options Written | (73,507) | |||||||||
| (Premiums received $454,504) | ||||||||||
Net Other Assets and Liabilities – 2.8% | 520,425 | ||
Net Assets – 100.0% | $18,887,562 |
| (a) | Non-income producing security. |
| (b) | All or a portion of this security is pledged to cover options written. |
| ADR | American Depositary Receipt |
| ASSETS TABLE | ||||
| Total Value at 9/30/2022 | Level 1 Quoted Prices | Level 2 Significant Observable Inputs | Level 3 Significant Unobservable Inputs | |
Common Stocks* | $ 18,440,644 | $ 18,440,644 | $ — | $ — |
| LIABILITIES TABLE | ||||
| Total Value at 9/30/2022 | Level 1 Quoted Prices | Level 2 Significant Observable Inputs | Level 3 Significant Unobservable Inputs | |
Call Options Written | $ (73,507) | $ (50,887) | $ (22,620) | $ — |
| * | See Portfolio of Investments for industry breakout. |
| Shares | Description | Value | ||
| COMMON STOCKS – 99.8% | ||||
| Banks – 11.7% | ||||
| 4,626,764 | Bank of America Corp. | $139,728,273 | ||
| 4,281,665 | Citizens Financial Group, Inc. | 147,118,009 | ||
| 1,348,355 | JPMorgan Chase & Co. | 140,903,097 | ||
| 8,918,932 | KeyCorp | 142,881,291 | ||
| 7,198,559 | Regions Financial Corp. | 144,475,079 | ||
| 3,441,546 | US Bancorp | 138,763,135 | ||
| 853,868,884 | ||||
| Capital Markets – 5.8% | ||||
| 483,930 | Goldman Sachs Group (The), Inc. | 141,815,686 | ||
| 4,807,068 | Jefferies Financial Group, Inc. | 141,808,506 | ||
| 1,805,605 | Morgan Stanley | 142,660,851 | ||
| 426,285,043 | ||||
| Chemicals – 4.1% | ||||
| 2,573,201 | Corteva, Inc. | 147,058,437 | ||
| 6,147,339 | Huntsman Corp. | 150,855,699 | ||
| 297,914,136 | ||||
| Communications Equipment – 2.0% | ||||
| 3,645,831 | Cisco Systems, Inc. | 145,833,240 | ||
| Consumer Finance – 7.7% | ||||
| 1,031,230 | American Express Co. | 139,123,239 | ||
| 1,552,580 | Capital One Financial Corp. | 143,101,299 | ||
| 1,564,368 | Discover Financial Services | 142,232,338 | ||
| 4,855,816 | Synchrony Financial | 136,885,453 | ||
| 561,342,329 | ||||
| Food Products – 2.1% | ||||
| 1,862,277 | Archer-Daniels-Midland Co. | 149,820,185 | ||
| Health Care Providers & Services – 6.2% | ||||
| 328,698 | Elevance Health, Inc. | 149,307,779 | ||
| 315,866 | Humana, Inc. | 153,255,025 | ||
| 302,971 | UnitedHealth Group, Inc. | 153,012,474 | ||
| 455,575,278 | ||||
| Household Durables – 2.1% | ||||
| 4,010,823 | PulteGroup, Inc. | 150,405,862 | ||
| Insurance – 10.1% | ||||
| 2,653,153 | Aflac, Inc. | 149,107,199 | ||
| 1,219,793 | Allstate (The) Corp. | 151,900,822 | ||
| 1,620,649 | Cincinnati Financial Corp. | 145,161,531 | ||
| 3,933,789 | Fidelity National Financial, Inc. | 142,403,162 | ||
| 1,717,431 | Prudential Financial, Inc. | 147,321,231 | ||
| 735,893,945 | ||||
| IT Services – 5.9% | ||||
| 2,537,999 | Cognizant Technology Solutions Corp., Class A | 145,782,663 | ||
| 500,975 | Mastercard, Inc., Class A | 142,447,231 | ||
| Shares | Description | Value | ||
| IT Services (Continued) | ||||
| 816,712 | Visa, Inc., Class A | $145,088,887 | ||
| 433,318,781 | ||||
| Machinery – 4.1% | ||||
| 747,503 | Cummins, Inc. | 152,124,336 | ||
| 732,686 | Snap-on, Inc. | 147,526,326 | ||
| 299,650,662 | ||||
| Media – 4.1% | ||||
| 5,782,568 | Interpublic Group of (The) Cos., Inc. | 148,033,741 | ||
| 2,356,535 | Omnicom Group, Inc. | 148,673,793 | ||
| 296,707,534 | ||||
| Metals & Mining – 2.0% | ||||
| 5,382,337 | Freeport-McMoRan, Inc. | 147,099,270 | ||
| Oil, Gas & Consumable Fuels – 3.9% | ||||
| 1,299,844 | EOG Resources, Inc. | 145,231,570 | ||
| 659,115 | Pioneer Natural Resources Co. | 142,718,171 | ||
| 287,949,741 | ||||
| Paper & Forest Products – 2.1% | ||||
| 3,005,826 | Louisiana-Pacific Corp. | 153,868,233 | ||
| Pharmaceuticals – 4.2% | ||||
| 941,908 | Johnson & Johnson | 153,870,091 | ||
| 3,429,651 | Pfizer, Inc. | 150,081,528 | ||
| 303,951,619 | ||||
| Semiconductors & Semiconductor Equipment – 13.8% | ||||
| 1,776,350 | Applied Materials, Inc. | 145,536,356 | ||
| 5,398,942 | Intel Corp. | 139,130,735 | ||
| 470,510 | KLA Corp. | 142,390,441 | ||
| 385,747 | Lam Research Corp. | 141,183,402 | ||
| 1,196,083 | NVIDIA Corp. | 145,192,515 | ||
| 1,263,461 | QUALCOMM, Inc. | 142,745,824 | ||
| 955,270 | Texas Instruments, Inc. | 147,856,691 | ||
| 1,004,035,964 | ||||
| Software – 2.1% | ||||
| 645,012 | Microsoft Corp. | 150,223,295 | ||
| Specialty Retail – 3.8% | ||||
| 2,173,535 | Best Buy Co., Inc. | 137,671,707 | ||
| 1,175,121 | Williams-Sonoma, Inc. | 138,488,010 | ||
| 276,159,717 | ||||
| Shares | Description | Value | ||
| COMMON STOCKS (Continued) | ||||
| Technology Hardware, Storage & Peripherals – 2.0% | ||||
| 1,047,546 | Apple, Inc. | $144,770,857 | ||
| Total Investments – 99.8% | 7,274,674,575 | |||
| (Cost $8,974,782,477) | ||||
| Net Other Assets and Liabilities – 0.2% | 16,100,204 | |||
| Net Assets – 100.0% | $7,290,774,779 | |||
| Total Value at 9/30/2022 | Level 1 Quoted Prices | Level 2 Significant Observable Inputs | Level 3 Significant Unobservable Inputs | |
| Common Stocks* | $ 7,274,674,575 | $ 7,274,674,575 | $ — | $ — |
| * | See Portfolio of Investments for industry breakout. |
| Shares | Description | Value | ||
| EXCHANGE-TRADED FUNDS – 99.8% | ||||
| Capital Markets (a) – 99.8% | ||||
| 37,233,368 | First Trust Energy AlphaDEX® Fund | $581,212,875 | ||
| 11,002,143 | First Trust Industrials/Producer Durables AlphaDEX® Fund | 505,548,471 | ||
| 8,230,205 | First Trust Materials AlphaDEX® Fund | 426,900,733 | ||
| 21,438,168 | First Trust Nasdaq Food & Beverage ETF | 532,524,093 | ||
| 22,047,884 | First Trust Nasdaq Oil & Gas ETF | 541,275,552 | ||
| Total Investments – 99.8% | 2,587,461,724 | |||
| (Cost $2,786,423,151) | ||||
| Net Other Assets and Liabilities – 0.2% | 5,343,666 | |||
| Net Assets – 100.0% | $2,592,805,390 | |||
| (a) | Represents investments in affiliated funds. |
| Total Value at 9/30/2022 | Level 1 Quoted Prices | Level 2 Significant Observable Inputs | Level 3 Significant Unobservable Inputs | |
| Exchange-Traded Funds* | $ 2,587,461,724 | $ 2,587,461,724 | $ — | $ — |
| * | See Portfolio of Investments for industry breakout. |
| Shares | Description | Value | ||
| COMMON STOCKS – 99.9% | ||||
| Banks – 10.2% | ||||
| 19,220 | 1st Source Corp. | $889,886 | ||
| 48,647 | Associated Banc-Corp. | 976,832 | ||
| 27,076 | First Business Financial Services, Inc. | 874,825 | ||
| 79,375 | First Commonwealth Financial Corp. | 1,019,175 | ||
| 47,134 | First Financial Bancorp | 993,585 | ||
| 21,695 | First Financial Corp. | 980,397 | ||
| 23,412 | First Merchants Corp. | 905,576 | ||
| 122,247 | FNB Corp. | 1,418,065 | ||
| 69,762 | Fulton Financial Corp. | 1,102,240 | ||
| 24,346 | German American Bancorp, Inc. | 869,396 | ||
| 23,905 | Heartland Financial USA, Inc. | 1,036,521 | ||
| 12,530 | Lakeland Financial Corp. | 912,309 | ||
| 26,307 | Mercantile Bank Corp. | 781,581 | ||
| 65,218 | Old National Bancorp | 1,074,140 | ||
| 7,018 | Park National Corp. | 873,601 | ||
| 37,100 | Peoples Bancorp, Inc. | 1,073,303 | ||
| 15,587 | QCR Holdings, Inc. | 794,002 | ||
| 10,550 | Wintrust Financial Corp. | 860,352 | ||
| 17,435,786 | ||||
| Commercial Services & Supplies – 6.2% | ||||
| 123,368 | Aris Water Solution, Inc., Class A | 1,574,176 | ||
| 59,722 | Clean Harbors, Inc. (a) | 6,568,225 | ||
| 78,939 | Heritage-Crystal Clean, Inc. (a) | 2,334,226 | ||
| 10,476,627 | ||||
| Construction & Engineering – 43.2% | ||||
| 333,806 | APi Group Corp. (a) | 4,429,606 | ||
| 113,394 | Arcosa, Inc. | 6,483,869 | ||
| 100,769 | Argan, Inc. | 3,241,739 | ||
| 60,187 | Comfort Systems USA, Inc. | 5,858,001 | ||
| 193,665 | Construction Partners, Inc., Class A (a) | 5,079,833 | ||
| 45,803 | Dycom Industries, Inc. (a) | 4,375,560 | ||
| 50,524 | EMCOR Group, Inc. | 5,834,511 | ||
| 203,029 | Infrastructure and Energy Alternatives, Inc. (a) | 2,749,013 | ||
| 71,624 | MasTec, Inc. (a) | 4,548,124 | ||
| 190,656 | MDU Resources Group, Inc. | 5,214,442 | ||
| 59,877 | MYR Group, Inc. (a) | 5,073,378 | ||
| 42,253 | Northwest Pipe Co. (a) | 1,187,309 | ||
| 43,950 | NV5 Global, Inc. (a) | 5,441,889 | ||
| 240,408 | Primoris Services Corp. | 3,906,630 | ||
| 39,961 | Quanta Services, Inc. | 5,090,632 | ||
| 165,865 | Sterling Infrastructure, Inc. (a) | 3,561,121 | ||
| 234,804 | Tutor Perini Corp. (a) | 1,296,118 | ||
| 73,371,775 | ||||
| Electrical Equipment – 10.5% | ||||
| 102,089 | Array Technologies, Inc. (a) | 1,692,636 | ||
| Shares | Description | Value | ||
| Electrical Equipment (Continued) | ||||
| 47,902 | Atkore, Inc. (a) | $3,727,255 | ||
| 43,053 | Encore Wire Corp. | 4,974,343 | ||
| 27,586 | Hubbell, Inc. | 6,151,678 | ||
| 64,245 | Shoals Technologies Group, Inc., Class A (a) | 1,384,480 | ||
| 17,930,392 | ||||
| Machinery – 29.8% | ||||
| 101,095 | Astec Industries, Inc. | 3,153,153 | ||
| 114,090 | Blue Bird Corp. (a) | 952,651 | ||
| 83,686 | Douglas Dynamics, Inc. | 2,344,882 | ||
| 155,087 | Evoqua Water Technologies Corp. (a) | 5,128,727 | ||
| 143,974 | Federal Signal Corp. | 5,373,110 | ||
| 438,854 | Mueller Water Products, Inc., Class A | 4,507,031 | ||
| 63,409 | Oshkosh Corp. | 4,457,019 | ||
| 92,844 | Proto Labs, Inc. (a) | 3,382,307 | ||
| 25,700 | RBC Bearings, Inc. (a) | 5,340,717 | ||
| 249,254 | Shyft Group (The), Inc. | 5,092,259 | ||
| 96,939 | SPX Technologies, Inc. (a) | 5,352,971 | ||
| 359,680 | Wabash National Corp. | 5,596,621 | ||
| 50,681,448 | ||||
| Total Investments – 99.9% | 169,896,028 | |||
| (Cost $189,361,048) | ||||
| Net Other Assets and Liabilities – 0.1% | 88,189 | |||
| Net Assets – 100.0% | $169,984,217 | |||
| (a) | Non-income producing security. |
| Total Value at 9/30/2022 | Level 1 Quoted Prices | Level 2 Significant Observable Inputs | Level 3 Significant Unobservable Inputs | |
| Common Stocks* | $ 169,896,028 | $ 169,896,028 | $ — | $ — |
| * | See Portfolio of Investments for industry breakout. |
| Shares | Description | Value | ||
| COMMON STOCKS – 56.7% | ||||
| Banks – 8.8% | ||||
| 15,394 | Comerica, Inc. | $1,094,513 | ||
| 4,054 | M&T Bank Corp. | 714,801 | ||
| 58,053 | Regions Financial Corp. | 1,165,124 | ||
| 33,615 | Synovus Financial Corp. | 1,260,899 | ||
| 46,346 | United Bankshares, Inc. | 1,656,870 | ||
| 5,892,207 | ||||
| Biotechnology – 1.7% | ||||
| 8,507 | AbbVie, Inc. | 1,141,725 | ||
| Chemicals – 3.6% | ||||
| 9,121 | Eastman Chemical Co. | 648,047 | ||
| 23,610 | LyondellBasell Industries N.V., Class A | 1,777,361 | ||
| 2,425,408 | ||||
| Communications Equipment – 2.1% | ||||
| 22,038 | Cisco Systems, Inc. | 881,520 | ||
| 20,665 | Juniper Networks, Inc. | 539,770 | ||
| 1,421,290 | ||||
| Containers & Packaging – 1.2% | ||||
| 6,977 | Packaging Corp. of America | 783,447 | ||
| Electric Utilities – 4.6% | ||||
| 45,613 | FirstEnergy Corp. | 1,687,681 | ||
| 35,700 | NRG Energy, Inc. | 1,366,239 | ||
| 3,053,920 | ||||
| Gas Utilities – 0.8% | ||||
| 8,878 | National Fuel Gas Co. | 546,441 | ||
| Household Durables – 2.2% | ||||
| 10,725 | Whirlpool Corp. | 1,445,837 | ||
| Insurance – 9.0% | ||||
| 12,276 | Axis Capital Holdings Ltd. | 603,365 | ||
| 11,899 | MetLife, Inc. | 723,221 | ||
| 21,791 | Principal Financial Group, Inc. | 1,572,221 | ||
| 20,306 | Prudential Financial, Inc. | 1,741,849 | ||
| 36,358 | Unum Group | 1,410,690 | ||
| 6,051,346 | ||||
| Oil, Gas & Consumable Fuels – 15.6% | ||||
| 40,292 | DT Midstream, Inc. | 2,090,752 | ||
| 19,389 | Exxon Mobil Corp. | 1,692,854 | ||
| 148,228 | Kinder Morgan, Inc. | 2,466,514 | ||
| 44,581 | ONEOK, Inc. | 2,284,330 | ||
| 68,151 | Williams (The) Cos., Inc. | 1,951,163 | ||
| 10,485,613 | ||||
| Pharmaceuticals – 1.7% | ||||
| 25,923 | Organon & Co. | 606,598 | ||
| Shares | Description | Value | ||
| Pharmaceuticals (Continued) | ||||
| 11,716 | Pfizer, Inc. | $512,692 | ||
| 1,119,290 | ||||
| Semiconductors & Semiconductor Equipment – 1.1% | ||||
| 1,606 | Broadcom, Inc. | 713,080 | ||
| Specialty Retail – 1.0% | ||||
| 4,210 | Advance Auto Parts, Inc. | 658,191 | ||
| Technology Hardware, Storage & Peripherals – 0.8% | ||||
| 22,863 | HP, Inc. | 569,746 | ||
| Textiles, Apparel & Luxury Goods – 0.9% | ||||
| 21,969 | Tapestry, Inc. | 624,579 | ||
| Trading Companies & Distributors – 1.6% | ||||
| 4,290 | Watsco, Inc. | 1,104,503 | ||
| Total Common Stocks | 38,036,623 | |||
| (Cost $41,560,086) | ||||
| REAL ESTATE INVESTMENT TRUSTS – 42.7% | ||||
| Equity Real Estate Investment Trusts – 30.1% | ||||
| 41,438 | Apartment Income REIT Corp. | 1,600,336 | ||
| 91,710 | Brixmor Property Group, Inc. | 1,693,884 | ||
| 5,168 | Crown Castle, Inc. | 747,034 | ||
| 37,147 | CubeSmart | 1,488,109 | ||
| 5,310 | Extra Space Storage, Inc. | 917,090 | ||
| 40,584 | Iron Mountain, Inc. | 1,784,479 | ||
| 75,980 | Kimco Realty Corp. | 1,398,792 | ||
| 22,361 | Lamar Advertising Co., Class A | 1,844,559 | ||
| 12,215 | Life Storage, Inc. | 1,352,933 | ||
| 17,753 | Rayonier, Inc. | 532,057 | ||
| 27,931 | Regency Centers Corp. | 1,504,084 | ||
| 61,721 | Spirit Realty Capital, Inc. | 2,231,831 | ||
| 20,193 | Ventas, Inc. | 811,153 | ||
| 59,850 | VICI Properties, Inc. | 1,786,523 | ||
| 7,448 | Welltower, Inc. | 479,055 | ||
| 20,171,919 | ||||
| Mortgage Real Estate Investment Trusts – 12.6% | ||||
| 116,931 | Blackstone Mortgage Trust, Inc., Class A | 2,729,170 | ||
| 400,220 | Rithm Capital Corp. | 2,929,610 | ||
| Shares | Description | Value | ||
| REAL ESTATE INVESTMENT TRUSTS (Continued) | ||||
| Mortgage Real Estate Investment Trusts (Continued) | ||||
| 153,673 | Starwood Property Trust, Inc. | $2,799,922 | ||
| 8,458,702 | ||||
| Total Real Estate Investment Trusts | 28,630,621 | |||
| (Cost $35,762,373) | ||||
| Total Investments – 99.4% | 66,667,244 | |||
| (Cost $77,322,459) | ||||
| Net Other Assets and Liabilities – 0.6% | 432,947 | |||
| Net Assets – 100.0% | $67,100,191 | |||
| Total Value at 9/30/2022 | Level 1 Quoted Prices | Level 2 Significant Observable Inputs | Level 3 Significant Unobservable Inputs | |
| Common Stocks* | $ 38,036,623 | $ 38,036,623 | $ — | $ — |
| Real Estate Investment Trusts* | 28,630,621 | 28,630,621 | — | — |
| Total Investments | $ 66,667,244 | $ 66,667,244 | $— | $— |
| * | See Portfolio of Investments for industry breakout. |
| Shares | Description | Value | ||
| EXCHANGE-TRADED FUNDS – 99.9% | ||||
| Capital Markets (a) – 99.9% | ||||
| 1,148,699 | First Trust BICK Index Fund | $27,247,140 | ||
| 788,140 | First Trust Chindia ETF | 27,506,086 | ||
| 1,455,665 | First Trust Dow Jones Global Select Dividend Index Fund | 26,988,029 | ||
| 691,061 | First Trust India NIFTY 50 Equal Weight ETF | 29,598,143 | ||
| 1,765,963 | First Trust Latin America AlphaDEX® Fund | 27,672,640 | ||
| Total Investments – 99.9% | 139,012,038 | |||
| (Cost $161,210,119) | ||||
| Net Other Assets and Liabilities – 0.1% | 199,485 | |||
| Net Assets – 100.0% | $139,211,523 | |||
| (a) | Represents investments in affiliated funds. |
| Total Value at 9/30/2022 | Level 1 Quoted Prices | Level 2 Significant Observable Inputs | Level 3 Significant Unobservable Inputs | |
| Exchange-Traded Funds* | $ 139,012,038 | $ 139,012,038 | $ — | $ — |
| * | See Portfolio of Investments for industry breakout. |
| Shares | Description | Value | ||
| EXCHANGE-TRADED FUNDS – 100.0% | ||||
| Capital Markets (a) – 100.0% | ||||
| 2,000,658 | First Trust Energy AlphaDEX® Fund | $31,230,271 | ||
| 1,539,755 | First Trust Enhanced Short Maturity ETF | 91,338,267 | ||
| 591,177 | First Trust Industrials/Producer Durables AlphaDEX® Fund | 27,164,583 | ||
| 442,231 | First Trust Materials AlphaDEX® Fund | 22,938,522 | ||
| 1,151,936 | First Trust Nasdaq Food & Beverage ETF | 28,614,090 | ||
| 1,184,694 | First Trust Nasdaq Oil & Gas ETF | 29,084,238 | ||
| Total Investments – 100.0% | 230,369,971 | |||
| (Cost $239,271,421) | ||||
| Net Other Assets and Liabilities – 0.0% | 109,700 | |||
| Net Assets – 100.0% | $230,479,671 | |||
| (a) | Represents investments in affiliated funds. |
| Total Value at 9/30/2022 | Level 1 Quoted Prices | Level 2 Significant Observable Inputs | Level 3 Significant Unobservable Inputs | |
| Exchange-Traded Funds* | $ 230,369,971 | $ 230,369,971 | $ — | $ — |
| * | See Portfolio of Investments for industry breakout. |
| Shares | Description | Value | ||
| COMMON STOCKS – 99.7% | ||||
| Aerospace & Defense – 2.4% | ||||
| 9,461 | Airbus SE (a) | $815,542 | ||
| 5,747 | Boeing (The) Co. (b) | 695,847 | ||
| 2,161 | Lockheed Martin Corp. | 834,772 | ||
| 2,346,161 | ||||
| Automobiles – 3.2% | ||||
| 12,487 | Bayerische Motoren Werke AG (a) | 846,338 | ||
| 58,627 | Ford Motor Co. | 656,622 | ||
| 16,547 | Mercedes-Benz Group AG (a) | 836,733 | ||
| 3,135 | Tesla, Inc. (b) | 831,559 | ||
| 3,171,252 | ||||
| Banks – 24.5% | ||||
| 58,778 | Australia & New Zealand Banking Group Ltd. (a) | 860,440 | ||
| 92,726 | Axis Bank Ltd. (a) | 829,104 | ||
| 196,954 | Banco Bilbao Vizcaya Argentaria S.A. (a) | 883,505 | ||
| 371,725 | Banco Santander S.A. (a) | 864,967 | ||
| 26,174 | Bank of America Corp. | 790,455 | ||
| 2,636,718 | Bank of China Ltd., Class H (a) | 861,140 | ||
| 1,618,151 | Bank of Communications Co., Ltd., Class H (a) | 853,051 | ||
| 474,803 | Barclays PLC (a) | 755,476 | ||
| 19,201 | BNP Paribas S.A. (a) | 811,036 | ||
| 270,920 | BOC Hong Kong Holdings Ltd. (a) | 901,003 | ||
| 3,323,803 | China CITIC Bank Corp., Ltd., Class H (a) | 1,319,034 | ||
| 187,413 | China Merchants Bank Co., Ltd., Class H (a) | 867,321 | ||
| 18,175 | Citigroup, Inc. | 757,352 | ||
| 38,700 | DBS Group Holdings Ltd. (a) | 895,261 | ||
| 181,048 | First Abu Dhabi Bank PJSC (a) | 878,167 | ||
| 14,083 | HDFC Bank, Ltd., ADR | 822,729 | ||
| 150,220 | HSBC Holdings PLC (a) | 777,818 | ||
| 61,676 | ICICI Bank, Ltd., ADR | 1,293,346 | ||
| 2,884,790 | Industrial & Commercial Bank of China Ltd., Class H (a) | 1,353,273 | ||
| 102,019 | ING Groep N.V., ADR | 867,162 | ||
| 7,647 | JPMorgan Chase & Co. | 799,112 | ||
| 37,462 | Kotak Mahindra Bank Ltd. (a) | 831,450 | ||
| 442,414 | Lloyds Banking Group PLC, ADR | 791,921 | ||
| 152,430 | Nordea Bank Abp (a) | 1,302,632 | ||
| 1,534,098 | Postal Savings Bank of China Co., Ltd., Class H (a) (c) (d) | 901,689 | ||
| 9,478 | Royal Bank of Canada | 853,353 | ||
| 447,328 | Sberbank of Russia PJSC (a) (b) (e) (f) | 537 | ||
| 63,581 | Westpac Banking Corp. (a) | 841,177 | ||
| 24,563,511 | ||||
| Shares | Description | Value | ||
| Capital Markets – 6.4% | ||||
| 20,698 | Bank of New York Mellon (The) Corp. | $797,287 | ||
| 4,491 | CME Group, Inc. | 795,491 | ||
| 5,366 | Deutsche Boerse AG (a) | 879,631 | ||
| 2,704 | Goldman Sachs Group (The), Inc. | 792,407 | ||
| 9,863 | London Stock Exchange Group PLC (a) | 832,919 | ||
| 933 | Partners Group Holding AG (a) | 750,864 | ||
| 2,470 | S&P Global, Inc. | 754,215 | ||
| 56,773 | UBS Group AG (a) | 823,661 | ||
| 6,426,475 | ||||
| Communications Equipment – 2.7% | ||||
| 19,990 | Cisco Systems, Inc. | 799,600 | ||
| 181,390 | Nokia Oyj, ADR | 774,535 | ||
| 194,744 | Telefonaktiebolaget LM Ericsson, Class B (a) | 1,138,367 | ||
| 2,712,502 | ||||
| Diversified Telecommunication Services – 6.2% | ||||
| 84,589 | AT&T, Inc. | 1,297,595 | ||
| 75,689 | Deutsche Telekom AG (a) | 1,288,353 | ||
| 223,051 | Emirates Telecommunications Group Co., PJSC (a) | 1,417,714 | ||
| 2,807 | Swisscom AG (a) | 1,314,353 | ||
| 21,950 | Verizon Communications, Inc. | 833,442 | ||
| 6,151,457 | ||||
| Electric Utilities – 1.6% | ||||
| 84,697 | Iberdrola S.A. (a) | 789,730 | ||
| 9,676 | Verbund AG (a) | 826,112 | ||
| 1,615,842 | ||||
| Electronic Equipment, Instruments & Components – 0.8% | ||||
| 2,194 | Samsung SDI Co., Ltd. (a) | 825,259 | ||
| Food & Staples Retailing – 1.7% | ||||
| 18,754 | Kroger (The) Co. | 820,487 | ||
| 6,648 | Walmart, Inc. | 862,246 | ||
| 1,682,733 | ||||
| Household Durables – 0.8% | ||||
| 12,225 | Sony Group Corp., ADR | 783,011 | ||
| Industrial Conglomerates – 2.1% | ||||
| 7,553 | Honeywell International, Inc. | 1,261,124 | ||
| 8,833 | Siemens AG (a) | 863,363 | ||
| 2,124,487 | ||||
| Shares | Description | Value | ||
| COMMON STOCKS (Continued) | ||||
| Insurance – 4.9% | ||||
| 98,861 | AIA Group Ltd. (a) | $823,107 | ||
| 5,436 | Allianz SE (a) | 856,357 | ||
| 16,694 | American International Group, Inc. | 792,631 | ||
| 37,363 | AXA S.A. (a) | 815,743 | ||
| 13,573 | MetLife, Inc. | 824,967 | ||
| 157,902 | Ping An Insurance Group Co. of China Ltd., Class H (a) | 787,741 | ||
| 4,900,546 | ||||
| Interactive Media & Services – 2.0% | ||||
| 10,441 | Baidu, Inc., ADR (b) | 1,226,713 | ||
| 23,540 | Tencent Holdings Ltd. (a) | 795,095 | ||
| 2,021,808 | ||||
| Internet & Direct Marketing Retail – 3.7% | ||||
| 15,847 | Alibaba Group Holding Ltd., ADR (b) | 1,267,602 | ||
| 10,928 | Amazon.com, Inc. (b) | 1,234,864 | ||
| 23,678 | JD.com, Inc., ADR | 1,191,003 | ||
| 3,693,469 | ||||
| IT Services – 12.3% | ||||
| 4,926 | Accenture PLC, Class A | 1,267,460 | ||
| 8,116 | Capgemini SE (a) | 1,299,376 | ||
| 22,044 | Cognizant Technology Solutions Corp., Class A | 1,266,208 | ||
| 76,555 | Infosys Ltd., ADR | 1,299,138 | ||
| 11,042 | International Business Machines Corp. | 1,311,900 | ||
| 4,298 | Mastercard, Inc., Class A | 1,222,093 | ||
| 14,750 | PayPal Holdings, Inc. (b) | 1,269,533 | ||
| 35,678 | Tata Consultancy Services Ltd. (a) | 1,307,559 | ||
| 4,519 | Visa, Inc., Class A | 802,800 | ||
| 276,523 | Wipro Ltd., ADR | 1,302,423 | ||
| 12,348,490 | ||||
| Marine – 1.2% | ||||
| 655 | AP Moller - Maersk A.S., Class B (a) | 1,190,285 | ||
| Metals & Mining – 1.8% | ||||
| 36,458 | BHP Group Ltd. (a) | 906,278 | ||
| 16,388 | Rio Tinto PLC, ADR (g) | 902,323 | ||
| 1,808,601 | ||||
| Multi-Utilities – 1.3% | ||||
| 111,676 | Engie S.A. (a) | 1,285,378 | ||
| Oil, Gas & Consumable Fuels – 0.9% | ||||
| 224,508 | Gazprom PJSC, ADR (a) (b) (e) (f) | 13,812 | ||
| Shares | Description | Value | ||
| Oil, Gas & Consumable Fuels (Continued) | ||||
| 17,388 | Shell PLC, ADR | $865,227 | ||
| 879,039 | ||||
| Pharmaceuticals – 1.3% | ||||
| 8,951 | Zoetis, Inc. | 1,327,344 | ||
| Semiconductors & Semiconductor Equipment – 7.3% | ||||
| 17,137 | Advanced Micro Devices, Inc. (b) | 1,085,800 | ||
| 57,648 | Infineon Technologies AG (a) | 1,261,571 | ||
| 46,132 | Intel Corp. | 1,188,822 | ||
| 25,611 | Micron Technology, Inc. | 1,283,111 | ||
| 10,140 | NVIDIA Corp. | 1,230,895 | ||
| 17,679 | Taiwan Semiconductor Manufacturing Co., Ltd., ADR | 1,212,072 | ||
| 7,262,271 | ||||
| Software – 7.2% | ||||
| 5,487 | Microsoft Corp. | 1,277,922 | ||
| 19,002 | Oracle Corp. | 1,160,452 | ||
| 9,041 | salesforce.com, Inc. (b) | 1,300,458 | ||
| 16,670 | SAP SE (a) | 1,358,524 | ||
| 12,127 | VMware, Inc., Class A | 1,291,040 | ||
| 5,412 | Workday, Inc., Class A (b) | 823,815 | ||
| 7,212,211 | ||||
| Specialty Retail – 0.8% | ||||
| 3,024 | Home Depot (The), Inc. | 834,443 | ||
| Technology Hardware, Storage & Peripherals – 1.3% | ||||
| 35,228 | Samsung Electronics Co., Ltd. (a) | 1,293,546 | ||
| Wireless Telecommunication Services – 1.3% | ||||
| 133,900 | Softbank Corp. (a) | 1,337,116 | ||
| Total Common Stocks | 99,797,237 | |||
| (Cost $125,410,085) | ||||
| MONEY MARKET FUNDS – 0.8% | ||||
| 805,392 | Goldman Sachs Financial Square Treasury Obligations Fund - Institutional Class - 2.77% (h) (i) | 805,392 | ||
| (Cost $805,392) | ||||
| Total Investments – 100.5% | 100,602,629 | |||
| (Cost $126,215,477) | ||||
| Net Other Assets and Liabilities – (0.5)% | (472,900) | |||
| Net Assets – 100.0% | $100,129,729 | |||
| (a) | This security is fair valued by the Advisor’s Pricing Committee in accordance with procedures approved by the Trust’s Board of Trustees and in accordance with provisions of the Investment Company Act of 1940 and rules thereunder, as amended. At September 30, 2022, securities noted as such are valued at $47,168,508 or 47.1% of net assets. Certain of these securities are fair valued using a factor provided by a third-party pricing service due to the change in value between the foreign markets’ close and the New York Stock Exchange close exceeding a certain threshold. On days when this threshold is not exceeded, these securities are typically valued at the last sale price on the exchange on which they are principally traded. |
| (b) | Non-income producing security. |
| (c) | This security may be resold to qualified foreign investors and foreign institutional buyers under Regulation S of the Securities Act of 1933, as amended (the “1933 Act”). |
| (d) | This security is exempt from registration upon resale under Rule 144A of the 1933 Act and may be resold in transactions exempt from registration, normally to qualified institutional buyers. This security is not restricted on the foreign exchange where it trades freely without any additional registration. As such, it does not require the additional disclosure required of restricted securities. |
| (e) | Pursuant to procedures adopted by the Trust’s Board of Trustees, this security has been determined to be illiquid by First Trust Advisors L.P., the Fund’s advisor. |
| (f) | This security’s value was determined using significant unobservable inputs (see Note 2A – Portfolio Valuation in the Notes to Financial Statements). |
| (g) | All or a portion of this security is on loan (See Note 2G - Securities Lending in the Notes to Financial Statements). The remaining contractual maturity of all of the securities lending transactions is overnight and continuous. The aggregate value of such securities is $517,564 and the total value of the collateral held by the Fund is $805,392. |
| (h) | Rate shown reflects yield as of September 30, 2022. |
| (i) | This security serves as collateral for securities on loan. |
| ADR | American Depositary Receipt |
| Securities Lending Agency Agreement | |
| Total gross amount presented on the Statements of Assets and Liabilities (1) | $517,564 |
| Non-cash Collateral (2) | (517,564) |
| Net Amount | $— |
| (1) | The amount presented on the Statements of Assets and Liabilities, which is included in “Investments, at value,” is not offset and is shown on a gross basis. |
| (2) | At September 30, 2022, the value of the collateral received from each borrower exceeded the value of the related securities loaned. This amount is disclosed on the Portfolio of Investments. |
| Currency Exposure Diversification | % of Total Investments |
| United States Dollar | 52.3% |
| Euro | 17.8 |
| Hong Kong Dollar | 9.4 |
| Indian Rupee | 2.9 |
| Swiss Franc | 2.9 |
| Australian Dollar | 2.6 |
| British Pound Sterling | 2.4 |
| United Arab Emirates Dirham | 2.3 |
| South Korean Won | 2.1 |
| Japanese Yen | 1.3 |
| Danish Krone | 1.2 |
| Swedish Krona | 1.1 |
| Singapore Dollar | 0.9 |
| Canadian Dollar | 0.8 |
| Total | 100.0% |
| Total Value at 9/30/2022 | Level 1 Quoted Prices | Level 2 Significant Observable Inputs | Level 3 Significant Unobservable Inputs | |
| Common Stocks: | ||||
Aerospace & Defense | $ 2,346,161 | $ 1,530,619 | $ 815,542 | $ — |
Automobiles | 3,171,252 | 1,488,181 | 1,683,071 | — |
Banks | 24,563,511 | 6,975,430 | 17,587,544 | 537 |
Capital Markets | 6,426,475 | 3,139,400 | 3,287,075 | — |
Communications Equipment | 2,712,502 | 1,574,135 | 1,138,367 | — |
Diversified Telecommunication Services | 6,151,457 | 2,131,037 | 4,020,420 | — |
Food & Staples Retailing | 1,682,733 | 1,682,733 | — | — |
Household Durables | 783,011 | 783,011 | — | — |
Industrial Conglomerates | 2,124,487 | 1,261,124 | 863,363 | — |
Insurance | 4,900,546 | 1,617,598 | 3,282,948 | — |
Interactive Media & Services | 2,021,808 | 1,226,713 | 795,095 | — |
Internet & Direct Marketing Retail | 3,693,469 | 3,693,469 | — | — |
IT Services | 12,348,490 | 9,741,555 | 2,606,935 | — |
Metals & Mining | 1,808,601 | 902,323 | 906,278 | — |
Oil, Gas & Consumable Fuels | 879,039 | 865,227 | — | 13,812 |
Pharmaceuticals | 1,327,344 | 1,327,344 | — | — |
Semiconductors & Semiconductor Equipment | 7,262,271 | 6,000,700 | 1,261,571 | — |
Software | 7,212,211 | 5,853,687 | 1,358,524 | — |
Specialty Retail | 834,443 | 834,443 | — | — |
Other industry categories* | 7,547,426 | — | 7,547,426 | — |
Money Market Funds | 805,392 | 805,392 | — | — |
Total Investments | $ 100,602,629 | $ 53,434,121 | $ 47,154,159 | $ 14,349 |
| * | See Portfolio of Investments for industry breakout. |
| Shares | Description | Value | ||
| COMMON STOCKS – 99.1% | ||||
| Aerospace & Defense – 6.4% | ||||
| 43,040 | AeroVironment, Inc. (a) | $3,587,814 | ||
| 17,843 | Elbit Systems Ltd. (b) | 3,378,271 | ||
| 1,439 | Northrop Grumman Corp. | 676,791 | ||
| 941,165 | QinetiQ Group PLC (b) | 3,434,514 | ||
| 11,077,390 | ||||
| Air Freight & Logistics – 0.3% | ||||
| 15,495 | GXO Logistics, Inc. (a) | 543,255 | ||
| Auto Components – 6.8% | ||||
| 7,360 | Aptiv PLC (a) | 575,626 | ||
| 11,898 | Continental AG (b) | 527,954 | ||
| 12,500 | Denso Corp. (b) | 571,540 | ||
| 139,812 | Gentex Corp. | 3,333,118 | ||
| 442,629 | Luminar Technologies, Inc. (a) (c) | 3,224,552 | ||
| 11,912 | Magna International, Inc. | 564,867 | ||
| 198,245 | Valeo (b) | 2,995,453 | ||
| 11,793,110 | ||||
| Automobiles – 0.7% | ||||
| 34,539 | NIO, Inc., ADR (a) | 544,680 | ||
| 2,495 | Tesla, Inc. (a) | 661,799 | ||
| 1,206,479 | ||||
| Communications Equipment – 1.8% | ||||
| 75,196 | Ciena Corp. (a) | 3,040,174 | ||
| Electrical Equipment – 3.5% | ||||
| 48,199 | ABB Ltd. (b) | 1,244,471 | ||
| 8,413 | Emerson Electric Co. | 616,000 | ||
| 67,200 | Mitsubishi Electric Corp. (b) | 608,029 | ||
| 19,800 | Nidec Corp. (b) | 1,108,328 | ||
| 5,622 | Rockwell Automation, Inc. | 1,209,348 | ||
| 11,152 | Schneider Electric SE (b) | 1,259,627 | ||
| 6,045,803 | ||||
| Electronic Equipment, Instruments & Components – 13.2% | ||||
| 31,631 | Cognex Corp. | 1,311,105 | ||
| 154,152 | Delta Electronics, Inc. (b) | 1,224,449 | ||
| 39,701 | FARO Technologies, Inc. (a) | 1,089,395 | ||
| 158,025 | Halma PLC (b) | 3,554,356 | ||
| 370,679 | Hexagon AB, Class B (b) | 3,461,821 | ||
| 3,500 | Keyence Corp. (b) | 1,156,962 | ||
| 33,500 | National Instruments Corp. | 1,264,290 | ||
| 25,000 | Omron Corp. (b) | 1,145,432 | ||
| 278,700 | Topcon Corp. (b) | 3,108,210 | ||
| 60,323 | Trimble, Inc. (a) | 3,273,729 | ||
| 75,500 | Yokogawa Electric Corp. (b) | 1,189,439 | ||
| 4,416 | Zebra Technologies Corp., Class A (a) | 1,157,036 | ||
| 22,936,224 | ||||
| Shares | Description | Value | ||
| Entertainment – 0.4% | ||||
| 50,000 | DeNA Co., Ltd. (b) | $633,533 | ||
| Food & Staples Retailing – 0.2% | ||||
| 81,403 | Ocado Group PLC (a) (b) | 422,439 | ||
| Health Care Equipment & Supplies – 1.8% | ||||
| 6,474 | Intuitive Surgical, Inc. (a) | 1,213,487 | ||
| 7,822 | Medtronic PLC | 631,626 | ||
| 6,723 | Omnicell, Inc. (a) | 585,103 | ||
| 3,351 | Stryker Corp. | 678,711 | ||
| 3,108,927 | ||||
| Health Care Technology – 0.3% | ||||
| 22,140 | Teladoc Health, Inc. (a) | 561,249 | ||
| Household Durables – 0.3% | ||||
| 8,600 | Sony Group Corp. (b) | 553,964 | ||
| Industrial Conglomerates – 0.4% | ||||
| 6,766 | Siemens AG (b) | 661,328 | ||
| Interactive Media & Services – 1.6% | ||||
| 6,354 | Alphabet, Inc., Class A (a) | 607,760 | ||
| 4,777 | Baidu, Inc., ADR (a) | 561,250 | ||
| 12,531 | Kakao Corp. (b) | 493,088 | ||
| 3,832 | NAVER Corp. (b) | 510,484 | ||
| 16,506 | Tencent Holdings Ltd. (b) | 557,512 | ||
| 2,730,094 | ||||
| Internet & Direct Marketing Retail – 1.0% | ||||
| 7,208 | Alibaba Group Holding Ltd., ADR (a) | 576,568 | ||
| 5,424 | Amazon.com, Inc. (a) | 612,912 | ||
| 10,831 | JD.com, Inc., ADR | 544,799 | ||
| 1,734,279 | ||||
| IT Services – 2.8% | ||||
| 7,617 | Akamai Technologies, Inc. (a) | 611,797 | ||
| 375,127 | Atos SE (a) (b) | 2,965,514 | ||
| 6,809 | Endava PLC, ADR (a) | 549,010 | ||
| 5,354 | International Business Machines Corp. | 636,109 | ||
| 4,762,430 | ||||
| Life Sciences Tools & Services – 2.8% | ||||
| 18,922 | Illumina, Inc. (a) | 3,610,129 | ||
| 3,601 | Tecan Group AG (b) | 1,235,302 | ||
| 4,845,431 | ||||
| Machinery – 11.1% | ||||
| 131,488 | 3D Systems Corp. (a) | 1,049,274 | ||
| Shares | Description | Value | ||
| COMMON STOCKS (Continued) | ||||
| Machinery (Continued) | ||||
| 28,809 | ANDRITZ AG (b) | $1,219,191 | ||
| 43,479 | ATS Automation Tooling Systems, Inc. (a) | 1,147,605 | ||
| 2,868,579 | AutoStore Holdings Ltd. (a) (b) (d) (e) | 3,149,995 | ||
| 39,005 | Cargotec OYJ, Class B (b) | 1,178,033 | ||
| 22,500 | Daifuku Co., Ltd. (b) | 1,058,334 | ||
| 1,883 | Deere & Co. | 628,715 | ||
| 60,320 | Duerr AG (b) | 1,254,283 | ||
| 8,200 | FANUC Corp. (b) | 1,151,398 | ||
| 12,899 | John Bean Technologies Corp. | 1,109,314 | ||
| 35,100 | Kawasaki Heavy Industries, Ltd. (b) | 532,400 | ||
| 34,687 | Proto Labs, Inc. (a) | 1,263,647 | ||
| 43,348 | SFA Engineering Corp. (b) | 1,141,264 | ||
| 60,100 | Shibaura Machine Co., Ltd. (b) | 1,196,055 | ||
| 52,357 | Valmet Oyj (b) | 1,058,461 | ||
| 40,300 | Yaskawa Electric Corp. (b) | 1,159,758 | ||
| 19,297,727 | ||||
| Pharmaceuticals – 0.4% | ||||
| 4,262 | Johnson & Johnson | 696,240 | ||
| Road & Rail – 0.4% | ||||
| 95,643 | TuSimple Holdings, Inc., Class A (a) (c) | 726,887 | ||
| Semiconductors & Semiconductor Equipment – 7.8% | ||||
| 8,103 | Advanced Micro Devices, Inc. (a) | 513,406 | ||
| 56,209 | Ambarella, Inc. (a) | 3,157,822 | ||
| 21,544 | Intel Corp. | 555,189 | ||
| 3,870 | KLA Corp. | 1,171,178 | ||
| 23,562 | Micron Technology, Inc. | 1,180,456 | ||
| 8,825 | NVIDIA Corp. | 1,071,267 | ||
| 8,093 | NXP Semiconductors N.V. | 1,193,798 | ||
| 10,070 | QUALCOMM, Inc. | 1,137,709 | ||
| 139,500 | Renesas Electronics Corp. (a) (b) | 1,169,462 | ||
| 15,981 | Taiwan Semiconductor Manufacturing Co., Ltd., ADR | 1,095,657 | ||
| 15,737 | Teradyne, Inc. | 1,182,636 | ||
| 13,428,580 | ||||
| Software – 34.1% | ||||
| 15,366 | ANSYS, Inc. (a) | 3,406,642 | ||
| 81,353 | Appian Corp., Class A (a) | 3,321,643 | ||
| 3,409 | Autodesk, Inc. (a) | 636,801 | ||
| 117,108 | AVEVA Group PLC (b) | 4,040,490 | ||
| 642,334 | BlackBerry Ltd. (a) | 3,018,970 | ||
| 2,056,010 | BrainChip Holdings Ltd. (a) (b) (c) | 1,123,014 | ||
| 211,970 | C3.ai, Inc., Class A (a) | 2,649,625 | ||
| 21,957 | Cadence Design Systems, Inc. (a) | 3,588,432 | ||
| Shares | Description | Value | ||
| Software (Continued) | ||||
| 98,364 | Dassault Systemes SE (b) | $3,396,024 | ||
| 99,934 | Dynatrace, Inc. (a) | 3,478,703 | ||
| 2,630 | Microsoft Corp. | 612,527 | ||
| 16,820 | Netcompany Group A.S. (a) (b) (d) (e) | 562,349 | ||
| 17,882 | Nice Ltd., ADR (a) | 3,366,108 | ||
| 20,557 | Palo Alto Networks, Inc. (a) | 3,367,031 | ||
| 104,219 | Pegasystems, Inc. | 3,349,599 | ||
| 261,200 | PKSHA Technology, Inc. (a) (b) (c) | 3,397,785 | ||
| 182,996 | PROS Holdings, Inc. (a) | 4,520,001 | ||
| 5,986 | PTC, Inc. (a) | 626,136 | ||
| 8,779 | ServiceNow, Inc. (a) | 3,315,038 | ||
| 11,027 | Synopsys, Inc. (a) | 3,368,859 | ||
| 231,943 | UiPath, Inc., Class A (a) | 2,924,801 | ||
| 181,221 | Veritone, Inc. (a) (c) | 1,020,274 | ||
| 59,090,852 | ||||
| Technology Hardware, Storage & Peripherals – 0.7% | ||||
| 15,407 | Samsung Electronics Co., Ltd. (b) | 565,734 | ||
| 43,400 | Seiko Epson Corp. (b) | 592,603 | ||
| 1,158,337 | ||||
| Wireless Telecommunication Services – 0.3% | ||||
| 17,100 | SoftBank Group Corp. (b) | 579,538 | ||
| Total Common Stocks | 171,634,270 | |||
| (Cost $242,954,349) | ||||
| REAL ESTATE INVESTMENT TRUSTS – 0.3% | ||||
| Equity Real Estate Investment Trusts – 0.3% | ||||
| 1,046 | Equinix, Inc. | 595,007 | ||
| (Cost $736,105) | ||||
| MONEY MARKET FUNDS – 3.6% | ||||
| 6,153,553 | Goldman Sachs Financial Square Treasury Obligations Fund - Institutional Class - 2.77% (f) (g) | 6,153,553 | ||
| (Cost $6,153,553) | ||||
| Total Investments – 103.0% | 178,382,830 | |||
| (Cost $249,844,007) | ||||
| Net Other Assets and Liabilities – (3.0)% | (5,134,956) | |||
| Net Assets – 100.0% | $173,247,874 | |||
| (a) | Non-income producing security. |
| (b) | This security is fair valued by the Advisor’s Pricing Committee in accordance with procedures approved by the Trust’s Board of Trustees and in accordance with provisions of the Investment Company Act of 1940 and rules thereunder, as amended. At September 30, 2022, securities noted as such are valued at $67,528,191 or 39.0% of net assets. Certain of these securities are fair valued using a factor provided by a third-party pricing service due to the change in value between the foreign markets’ close and the New York Stock Exchange close exceeding a certain threshold. On days when this threshold is not exceeded, these securities are typically valued at the last sale price on the exchange on which they are principally traded. |
| (c) | All or a portion of this security is on loan (See Note 2G - Securities Lending in the Notes to Financial Statements). The remaining contractual maturity of all of the securities lending transactions is overnight and continuous. The aggregate value of such securities is $5,825,907 and the total value of the collateral held by the Fund is $6,153,553. |
| (d) | This security may be resold to qualified foreign investors and foreign institutional buyers under Regulation S of the Securities Act of 1933, as amended (the “1933 Act”). |
| (e) | This security is exempt from registration upon resale under Rule 144A of the 1933 Act and may be resold in transactions exempt from registration, normally to qualified institutional buyers. This security is not restricted on the foreign exchange where it trades freely without any additional registration. As such, it does not require the additional disclosure required of restricted securities. |
| (f) | Rate shown reflects yield as of September 30, 2022. |
| (g) | This security serves as collateral for securities on loan. |
| ADR | American Depositary Receipt |
| Securities Lending Agency Agreement | |
| Total gross amount presented on the Statements of Assets and Liabilities (1) | $5,825,907 |
| Non-cash Collateral (2) | (5,825,907) |
| Net Amount | $— |
| (1) | The amount presented on the Statements of Assets and Liabilities, which is included in “Investments, at value,” is not offset and is shown on a gross basis. |
| (2) | At September 30, 2022, the value of the collateral received from each borrower exceeded the value of the related securities loaned. This amount is disclosed on the Portfolio of Investments. |
| Currency Exposure Diversification | % of Total Investments |
| United States Dollar | 61.5% |
| Japanese Yen | 11.7 |
| Euro | 9.3 |
| British Pound Sterling | 6.4 |
| Swedish Krona | 1.9 |
| Israeli Shekel | 1.9 |
| Norwegian Krone | 1.8 |
| South Korean Won | 1.5 |
| Swiss Franc | 1.4 |
| New Taiwan Dollar | 0.7 |
| Canadian Dollar | 0.7 |
| Australian Dollar | 0.6 |
| Danish Krone | 0.3 |
| Hong Kong Dollar | 0.3 |
| Total | 100.0% |
| Total Value at 9/30/2022 | Level 1 Quoted Prices | Level 2 Significant Observable Inputs | Level 3 Significant Unobservable Inputs | |
| Common Stocks: | ||||
Aerospace & Defense | $ 11,077,390 | $ 4,264,605 | $ 6,812,785 | $ — |
Auto Components | 11,793,110 | 7,698,163 | 4,094,947 | — |
Electrical Equipment | 6,045,803 | 1,825,348 | 4,220,455 | — |
Electronic Equipment, Instruments & Components | 22,936,224 | 8,095,555 | 14,840,669 | — |
Entertainment | 633,533 | — | 633,533 | — |
Food & Staples Retailing | 422,439 | — | 422,439 | — |
Household Durables | 553,964 | — | 553,964 | — |
Industrial Conglomerates | 661,328 | — | 661,328 | — |
Interactive Media & Services | 2,730,094 | 1,169,010 | 1,561,084 | — |
IT Services | 4,762,430 | 1,796,916 | 2,965,514 | — |
Life Sciences Tools & Services | 4,845,431 | 3,610,129 | 1,235,302 | — |
Machinery | 19,297,727 | 5,198,555 | 14,099,172 | — |
Semiconductors & Semiconductor Equipment | 13,428,580 | 12,259,118 | 1,169,462 | — |
Software | 59,090,852 | 46,571,190 | 12,519,662 | — |
Technology Hardware, Storage & Peripherals | 1,158,337 | — | 1,158,337 | — |
Wireless Telecommunication Services | 579,538 | — | 579,538 | — |
Other industry categories* | 11,617,490 | 11,617,490 | — | — |
Real Estate Investment Trusts* | 595,007 | 595,007 | — | — |
Money Market Funds | 6,153,553 | 6,153,553 | — | — |
Total Investments | $ 178,382,830 | $ 110,854,639 | $ 67,528,191 | $— |
| * | See Portfolio of Investments for industry breakout. |
| Shares | Description | Value | ||
| COMMON STOCKS – 98.2% | ||||
| Aerospace & Defense – 2.2% | ||||
| 48,444 | BAE Systems PLC (a) | $425,650 | ||
| Banks – 4.0% | ||||
| 4,260 | Bank of Montreal | 373,373 | ||
| 6,491 | Toronto-Dominion Bank (The) | 398,101 | ||
| 771,474 | ||||
| Beverages – 4.3% | ||||
| 9,354 | Diageo PLC (a) | 393,743 | ||
| 4,989 | Heineken N.V. (a) | 435,695 | ||
| 829,438 | ||||
| Biotechnology – 2.3% | ||||
| 2,463 | CSL Ltd. (a) | 447,939 | ||
| Building Products – 1.8% | ||||
| 808 | Geberit AG (a) | 346,461 | ||
| Capital Markets – 4.2% | ||||
| 2,664 | Deutsche Boerse AG (a) | 436,701 | ||
| 27,900 | Japan Exchange Group, Inc. (a) | 377,070 | ||
| 813,771 | ||||
| Chemicals – 1.5% | ||||
| 1,445 | Sika AG (a) | 290,433 | ||
| Commercial Services & Supplies – 1.9% | ||||
| 70,120 | Rentokil Initial PLC (a) | 371,669 | ||
| Construction & Engineering – 1.5% | ||||
| 23,124 | Skanska AB, Class B (a) | 287,796 | ||
| Diversified Financial Services – 1.7% | ||||
| 22,190 | Investor AB, Class B (a) | 323,779 | ||
| Electrical Equipment – 3.9% | ||||
| 15,528 | ABB Ltd. (a) | 400,924 | ||
| 5,481 | Legrand S.A. (a) | 354,397 | ||
| 755,321 | ||||
| Electronic Equipment, Instruments & Components – 1.9% | ||||
| 7,900 | Murata Manufacturing Co., Ltd. (a) | 363,615 | ||
| Entertainment – 2.1% | ||||
| 10,000 | Nintendo Co., Ltd. (a) | 403,343 | ||
| Food & Staples Retailing – 2.2% | ||||
| 10,816 | Alimentation Couche-Tard, Inc. | 435,427 | ||
| Food Products – 6.0% | ||||
| 205 | Barry Callebaut AG (a) | 386,428 | ||
| 4,386 | Kerry Group PLC, Class A (a) | 390,934 | ||
| Shares | Description | Value | ||
| Food Products (Continued) | ||||
| 3,672 | Nestle S.A. (a) | $397,154 | ||
| 1,174,516 | ||||
| Health Care Providers & Services – 1.8% | ||||
| 18,365 | Sonic Healthcare Ltd. (a) | 358,213 | ||
| Hotels, Restaurants & Leisure – 2.1% | ||||
| 19,683 | Aristocrat Leisure Ltd. (a) | 415,047 | ||
| Insurance – 6.4% | ||||
| 3,344 | Intact Financial Corp. | 473,246 | ||
| 9,910 | Sampo Oyj, Class A (a) | 423,074 | ||
| 8,856 | Sun Life Financial, Inc. | 352,163 | ||
| 1,248,483 | ||||
| IT Services – 4.6% | ||||
| 6,022 | CGI, Inc. (b) | 453,345 | ||
| 3,300 | Obic Co., Ltd. (a) | 442,509 | ||
| 895,854 | ||||
| Machinery – 3.8% | ||||
| 9,644 | Kone Oyj, Class B (a) | 371,569 | ||
| 2,361 | Schindler Holding AG (a) | 366,426 | ||
| 737,995 | ||||
| Metals & Mining – 1.8% | ||||
| 13,960 | BHP Group Ltd. (a) | 347,019 | ||
| Oil, Gas & Consumable Fuels – 1.8% | ||||
| 7,354 | Canadian Natural Resources Ltd. | 342,319 | ||
| Personal Products – 4.5% | ||||
| 1,240 | L’Oreal S.A. (a) | 396,480 | ||
| 10,812 | Unilever PLC (a) | 475,078 | ||
| 871,558 | ||||
| Pharmaceuticals – 9.5% | ||||
| 14,324 | Chugai Pharmaceutical Co., Ltd. (a) | 357,858 | ||
| 20,481 | GSK PLC (a) | 295,801 | ||
| 5,219 | Novartis AG (a) | 397,881 | ||
| 4,121 | Novo Nordisk A.S., Class B (a) | 410,525 | ||
| 1,164 | Roche Holding AG (a) | 378,920 | ||
| 1,840,985 | ||||
| Professional Services – 10.4% | ||||
| 17,735 | Bureau Veritas S.A. (a) | 396,866 | ||
| 178 | SGS S.A. (a) | 380,874 | ||
| 1,341 | Teleperformance (a) | 340,190 | ||
| 4,544 | Thomson Reuters Corp. | 466,456 | ||
| 4,528 | Wolters Kluwer N.V. (a) | 440,908 | ||
| 2,025,294 | ||||
| Road & Rail – 2.1% | ||||
| 3,801 | Canadian National Railway Co. | 410,492 | ||
| Shares | Description | Value | ||
| COMMON STOCKS (Continued) | ||||
| Software – 4.0% | ||||
| 280 | Constellation Software, Inc. | $389,608 | ||
| 4,642 | SAP SE (a) | 378,301 | ||
| 767,909 | ||||
| Trading Companies & Distributors – 3.9% | ||||
| 12,101 | Bunzl PLC (a) | 369,722 | ||
| 3,700 | Ferguson PLC (a) | 383,798 | ||
| 753,520 | ||||
| Total Common Stocks | 19,055,320 | |||
| (Cost $24,532,035) | ||||
| REAL ESTATE INVESTMENT TRUSTS – 1.5% | ||||
| Equity Real Estate Investment Trusts – 1.5% | ||||
| 28,790 | Goodman Group (a) | 290,975 | ||
| (Cost $474,227) | ||||
| Total Investments – 99.7% | 19,346,295 | |||
| (Cost $25,006,262) | ||||
| Net Other Assets and Liabilities – 0.3% | 49,574 | |||
| Net Assets – 100.0% | $19,395,869 | |||
| (a) | This security is fair valued by the Advisor’s Pricing Committee in accordance with procedures approved by the Trust’s Board of Trustees and in accordance with provisions of the Investment Company Act of 1940 and rules thereunder, as amended. At September 30, 2022, securities noted as such are valued at $15,251,765 or 78.6% of net assets. Certain of these securities are fair valued using a factor provided by a third-party pricing service due to the change in value between the foreign markets’ close and the New York Stock Exchange close exceeding a certain threshold. On days when this threshold is not exceeded, these securities are typically valued at the last sale price on the exchange on which they are principally traded. |
| (b) | Non-income producing security. |
| Currency Exposure Diversification | % of Total Investments |
| Euro | 22.6% |
| Canadian Dollar | 21.2 |
| Swiss Franc | 17.3 |
| British Pound Sterling | 14.0 |
| Japanese Yen | 10.0 |
| Australian Dollar | 9.6 |
| Swedish Krona | 3.2 |
| Danish Krone | 2.1 |
| Total | 100.0% |
| Total Value at 9/30/2022 | Level 1 Quoted Prices | Level 2 Significant Observable Inputs | Level 3 Significant Unobservable Inputs | |
| Common Stocks: | ||||
| Banks | $ 771,474 | $ 771,474 | $ — | $ — |
| Food & Staples Retailing | 435,427 | 435,427 | — | — |
| Insurance | 1,248,483 | 825,409 | 423,074 | — |
| IT Services | 895,854 | 453,345 | 442,509 | — |
| Oil, Gas & Consumable Fuels | 342,319 | 342,319 | — | — |
| Professional Services | 2,025,294 | 466,456 | 1,558,838 | — |
| Road & Rail | 410,492 | 410,492 | — | — |
| Software | 767,909 | 389,608 | 378,301 | — |
| Other industry categories* | 12,158,068 | — | 12,158,068 | — |
| Real Estate Investment Trusts* | 290,975 | — | 290,975 | — |
| Total Investments | $ 19,346,295 | $ 4,094,530 | $ 15,251,765 | $— |
| * | See Portfolio of Investments for industry breakout. |
| First Trust NASDAQ Technology Dividend Index Fund (TDIV) | Multi-Asset Diversified Income Index Fund (MDIV) | First Trust S&P International Dividend Aristocrats ETF (FID) | First Trust BuyWrite Income ETF (FTHI) | ||||
| ASSETS: | |||||||
Investments, at value - Unaffiliated | $ 1,427,157,335 | $ 350,713,624 | $ 43,514,523 | $ 88,246,222 | |||
Investments, at value - Affiliated | — | 91,828,017 | — | — | |||
Total investments, at value | 1,427,157,335 | 442,541,641 | 43,514,523 | 88,246,222 | |||
Cash | 1,581,370 | 1,542,143 | 8,194 | 1,341,384 | |||
Foreign currency | — | — | 9,566 | 247 | |||
Due from authorized participant | — | — | — | — | |||
| Receivables: | |||||||
Dividends | 2,308,990 | 2,222,561 | 258,424 | 71,210 | |||
Dividend reclaims | 219,230 | — | 149,807 | 927 | |||
Fund shares sold | — | 1,441,353 | — | 918,369 | |||
Investment securities sold | — | 2,145,110 | 950,952 | — | |||
Securities lending income | — | — | — | — | |||
Miscellaneous | — | — | — | — | |||
Total Assets | 1,431,266,925 | 449,892,808 | 44,891,466 | 90,578,359 | |||
| LIABILITIES: | |||||||
Options written, at value | — | — | — | 79,346 | |||
Due to custodian | — | — | — | — | |||
Due to broker | — | — | — | 2,053 | |||
Due to authorized participant | — | — | — | — | |||
| Payables: | |||||||
Investment advisory fees | 655,968 | 199,759 | 23,970 | 64,075 | |||
Deferred foreign capital gains tax | — | — | — | — | |||
Fund shares redeemed | — | 2,162,029 | — | — | |||
Investment securities purchased | — | 1,430,076 | 955,978 | 905,997 | |||
Collateral for securities on loan | — | — | — | — | |||
Capital shares redeemed | — | — | — | — | |||
Other liabilities | — | — | — | — | |||
Total Liabilities | 655,968 | 3,791,864 | 979,948 | 1,051,471 | |||
NET ASSETS | $1,430,610,957 | $446,100,944 | $43,911,518 | $89,526,888 | |||
| NET ASSETS consist of: | |||||||
Paid-in capital | $ 1,839,952,802 | $ 723,079,576 | $ 60,572,188 | $ 117,073,821 | |||
Par value | 328,050 | 309,500 | 32,000 | 48,742 | |||
Accumulated distributable earnings (loss) | (409,669,895) | (277,288,132) | (16,692,670) | (27,595,675) | |||
NET ASSETS | $1,430,610,957 | $446,100,944 | $43,911,518 | $89,526,888 | |||
NET ASSET VALUE, per share | $43.61 | $14.41 | $13.72 | $18.37 | |||
Number of shares outstanding (unlimited number of shares authorized, par value $0.01 per share) | 32,805,000 | 30,950,002 | 3,200,002 | 4,874,201 | |||
Investments, at cost - Unaffiliated | $1,601,923,830 | $373,784,707 | $54,504,444 | $97,098,556 | |||
Investments, at cost - Affiliated | $— | $113,970,108 | $— | $— | |||
Total investments, at cost | $1,601,923,830 | $487,754,815 | $54,504,444 | $97,098,556 | |||
Foreign currency, at cost (proceeds) | $— | $— | $9,633 | $262 | |||
Securities on loan, at value | $— | $— | $— | $— | |||
Premiums received on options written | $— | $— | $— | $1,911,411 |
| First Trust Nasdaq BuyWrite Income ETF (FTQI) | First Trust Rising Dividend Achievers ETF (RDVY) | First Trust Dorsey Wright Focus 5 ETF (FV) | First Trust RBA American Industrial Renaissance® ETF (AIRR) | First Trust Dorsey Wright Momentum & Dividend ETF (DDIV) | ||||
| $ 18,440,644 | $ 7,274,674,575 | $— | $ 169,896,028 | $ 66,667,244 | ||||
| — | — | 2,587,461,724 | — | — | ||||
| 18,440,644 | 7,274,674,575 | 2,587,461,724 | 169,896,028 | 66,667,244 | ||||
| 527,597 | 8,940,841 | 6,034,829 | 124,676 | 80,755 | ||||
| — | — | — | — | — | ||||
| — | 25,287,100 | — | — | — | ||||
| 4,429 | 10,494,847 | — | 72,005 | 385,827 | ||||
| 883 | — | — | — | 3,077 | ||||
| — | — | — | — | — | ||||
| — | 9,732,739 | — | — | — | ||||
| — | — | — | — | — | ||||
| — | — | — | — | — | ||||
| 18,973,553 | 7,329,130,102 | 2,593,496,553 | 170,092,709 | 67,136,903 | ||||
| 73,507 | — | — | — | — | ||||
| — | — | — | — | — | ||||
| 321 | — | — | — | — | ||||
| — | — | — | — | — | ||||
| 12,163 | 3,316,055 | 691,163 | 108,492 | 36,712 | ||||
| — | — | — | — | — | ||||
| — | 9,752,168 | — | — | — | ||||
| — | — | — | — | — | ||||
| — | — | — | — | — | ||||
| — | 25,287,100 | — | — | — | ||||
| — | — | — | — | — | ||||
| 85,991 | 38,355,323 | 691,163 | 108,492 | 36,712 | ||||
| $ 18,887,562 | $ 7,290,774,779 | $ 2,592,805,390 | $ 169,984,217 | $ 67,100,191 | ||||
| $ 23,620,593 | $ 9,221,052,680 | $ 3,372,604,160 | $ 225,214,721 | $ 101,039,746 | ||||
| 10,500 | 1,877,500 | 631,000 | 44,500 | 25,000 | ||||
| (4,743,531) | (1,932,155,401) | (780,429,770) | (55,275,004) | (33,964,555) | ||||
| $ 18,887,562 | $ 7,290,774,779 | $ 2,592,805,390 | $ 169,984,217 | $ 67,100,191 | ||||
| $17.99 | $38.83 | $41.09 | $38.20 | $26.84 | ||||
| 1,050,002 | 187,750,002 | 63,100,002 | 4,450,002 | 2,500,002 | ||||
| $20,994,169 | $8,974,782,477 | $— | $189,361,048 | $77,322,459 | ||||
| $— | $— | $2,786,423,151 | $— | $— | ||||
| $20,994,169 | $8,974,782,477 | $2,786,423,151 | $189,361,048 | $77,322,459 | ||||
| $— | $— | $— | $— | $— | ||||
| $— | $— | $— | $— | $— | ||||
| $454,504 | $— | $— | $— | $— |
| First Trust Dorsey Wright International Focus 5 ETF (IFV) | First Trust Dorsey Wright Dynamic Focus 5 ETF (FVC) | First Trust Indxx Innovative Transaction & Process ETF (LEGR) | First Trust Nasdaq Artificial Intelligence and Robotics ETF (ROBT) | First Trust International Developed Capital Strength ETF (FICS) | |||||
| ASSETS: | |||||||||
Investments, at value - Unaffiliated | $— | $— | $ 100,602,629 | $ 178,382,830 | $ 19,346,295 | ||||
Investments, at value - Affiliated | 139,012,038 | 230,369,971 | — | — | — | ||||
Total investments, at value | 139,012,038 | 230,369,971 | 100,602,629 | 178,382,830 | 19,346,295 | ||||
Cash | 235,315 | 4,297 | 60,117 | 870,632 | — | ||||
Foreign currency | — | — | 36,745 | 416 | 5,388 | ||||
Due from authorized participant | — | — | — | — | 28,787 | ||||
| Receivables: | |||||||||
Dividends | — | 169,373 | 92,541 | 152,271 | 30,802 | ||||
Dividend reclaims | — | — | 184,928 | 82,380 | 49,001 | ||||
Fund shares sold | 1,597,638 | — | — | — | — | ||||
Investment securities sold | 803,566 | — | — | — | 138,266 | ||||
Securities lending income | — | — | 323 | 13,370 | — | ||||
Miscellaneous | — | — | 54,209 | — | — | ||||
Total Assets | 141,648,557 | 230,543,641 | 101,031,492 | 179,501,899 | 19,598,539 | ||||
| LIABILITIES: | |||||||||
Options written, at value | — | — | — | — | — | ||||
Due to custodian | — | — | — | — | 24,121 | ||||
Due to broker | — | — | — | — | — | ||||
Due to authorized participant | — | — | — | — | 138,225 | ||||
| Payables: | |||||||||
Investment advisory fees | 36,938 | 58,040 | 59,045 | 100,472 | 11,537 | ||||
Deferred foreign capital gains tax | — | — | 37,326 | — | — | ||||
Fund shares redeemed | 804,660 | — | — | — | — | ||||
Investment securities purchased | 1,595,436 | — | — | — | 28,787 | ||||
Collateral for securities on loan | — | — | 805,392 | 6,153,553 | — | ||||
Capital shares redeemed | — | — | — | — | — | ||||
Other liabilities | — | 5,930 | — | — | — | ||||
Total Liabilities | 2,437,034 | 63,970 | 901,763 | 6,254,025 | 202,670 | ||||
NET ASSETS | $139,211,523 | $230,479,671 | $100,129,729 | $173,247,874 | $19,395,869 | ||||
| NET ASSETS consist of: | |||||||||
Paid-in capital | $ 306,241,995 | $ 301,099,494 | $ 132,003,549 | $ 272,121,814 | $ 26,252,388 | ||||
Par value | 86,500 | 69,000 | 33,000 | 51,500 | 7,500 | ||||
Accumulated distributable earnings (loss) | (167,116,972) | (70,688,823) | (31,906,820) | (98,925,440) | (6,864,019) | ||||
NET ASSETS | $139,211,523 | $230,479,671 | $100,129,729 | $173,247,874 | $19,395,869 | ||||
NET ASSET VALUE, per share | $16.09 | $33.40 | $30.34 | $33.64 | $25.86 | ||||
Number of shares outstanding (unlimited number of shares authorized, par value $0.01 per share) | 8,650,002 | 6,900,002 | 3,300,002 | 5,150,002 | 750,002 | ||||
Investments, at cost - Unaffiliated | $— | $— | $126,215,477 | $249,844,007 | $25,006,262 | ||||
Investments, at cost - Affiliated | $161,210,119 | $239,271,421 | $— | $— | $— | ||||
Total investments, at cost | $161,210,119 | $239,271,421 | $126,215,477 | $249,844,007 | $25,006,262 | ||||
Foreign currency, at cost (proceeds) | $— | $— | $36,570 | $427 | $5,427 | ||||
Securities on loan, at value | $— | $— | $517,564 | $5,825,907 | $— | ||||
Premiums received on options written | $— | $— | $— | $— | $— |
| First Trust NASDAQ Technology Dividend Index Fund (TDIV) | Multi-Asset Diversified Income Index Fund (MDIV) | First Trust S&P International Dividend Aristocrats ETF (FID) | First Trust BuyWrite Income ETF (FTHI) | |||||
| INVESTMENT INCOME: | ||||||||
Dividends - Unaffiliated | $ 48,868,615 | $ 17,312,777 | $ 2,766,603 | $ 905,514 | ||||
Dividends - Affiliated | — | 6,142,722 | — | — | ||||
Interest | 12,456 | 18,060 | — | (16,095) | ||||
Securities lending income (net of fees) | — | — | — | — | ||||
Foreign withholding tax | (1,219,327) | — | (265,262) | (2,516) | ||||
Other | 35 | 146 | 7 | 171 | ||||
Total investment income | 47,661,779 | 23,473,705 | 2,501,348 | 887,074 | ||||
| EXPENSES: | ||||||||
Investment advisory fees | 8,648,249 | 2,884,898 | 300,589 | 452,939 | ||||
Total expenses | 8,648,249 | 2,884,898 | 300,589 | 452,939 | ||||
Fees waived by the investment advisor | — | (555,573) | — | — | ||||
Net expenses | 8,648,249 | 2,329,325 | 300,589 | 452,939 | ||||
NET INVESTMENT INCOME (LOSS) | 39,013,530 | 21,144,380 | 2,200,759 | 434,135 | ||||
| NET REALIZED AND UNREALIZED GAIN (LOSS): | ||||||||
| Net realized gain (loss) on: | ||||||||
Investments - Unaffiliated | (87,205,732) | 1,847,585 | (601,968) | (697,701) | ||||
Investments - Affiliated | — | (396,722) | — | — | ||||
In-kind redemptions - Unaffiliated | 164,552,666 | 8,223,204 | 237,748 | 485,068 | ||||
In-kind redemptions - Affiliated | — | (296,207) | — | — | ||||
Purchased options contracts | — | — | — | — | ||||
Written options contracts | — | — | — | 1,445,968 | ||||
Foreign currency transactions | — | — | (43,377) | — | ||||
Foreign capital gains tax | — | — | — | — | ||||
Net realized gain (loss) | 77,346,934 | 9,377,860 | (407,597) | 1,233,335 | ||||
Net increase from payment by the advisor | — | — | — | — | ||||
| Net change in unrealized appreciation (depreciation) on: | ||||||||
Investments - Unaffiliated | (504,758,535) | (42,266,288) | (12,295,974) | (12,514,919) | ||||
Investments - Affiliated | — | (20,775,057) | — | — | ||||
Purchased options contracts | — | — | — | — | ||||
Written options contracts | — | — | — | 1,399,627 | ||||
Foreign currency translation | — | — | (20,053) | (15) | ||||
Deferred foreign capital gains tax | — | — | — | — | ||||
Net change in unrealized appreciation (depreciation) | (504,758,535) | (63,041,345) | (12,316,027) | (11,115,307) | ||||
NET REALIZED AND UNREALIZED GAIN (LOSS) | (427,411,601) | (53,663,485) | (12,723,624) | (9,881,972) | ||||
NET INCREASE (DECREASE) IN NET ASSETS RESULTING FROM OPERATIONS | $(388,398,071) | $(32,519,105) | $(10,522,865) | $(9,447,837) | ||||
| First Trust Nasdaq BuyWrite Income ETF (FTQI) | First Trust Rising Dividend Achievers ETF (RDVY) | First Trust Dorsey Wright Focus 5 ETF (FV) | First Trust RBA American Industrial Renaissance® ETF (AIRR) | First Trust Dorsey Wright Momentum & Dividend ETF (DDIV) | First Trust Dorsey Wright International Focus 5 ETF (IFV) | First Trust Dorsey Wright Dynamic Focus 5 ETF (FVC) | |||||||
| $136,921 | $195,126,307 | $— | $1,729,346 | $2,378,164 | $— | $— | |||||||
| — | — | 36,928,638 | — | — | 6,445,800 | 2,730,563 | |||||||
| (1,879) | 61,189 | 14,538 | 638 | 628 | 9,266 | 1,427 | |||||||
| — | — | — | 689 | — | — | — | |||||||
| (360) | (223,787) | — | — | (371) | — | — | |||||||
| 213 | — | — | — | — | — | — | |||||||
| 134,895 | 194,963,709 | 36,943,176 | 1,730,673 | 2,378,421 | 6,455,066 | 2,731,990 | |||||||
| 102,409 | 41,526,958 | 8,462,120 | 1,505,524 | 396,179 | 600,666 | 675,196 | |||||||
| 102,409 | 41,526,958 | 8,462,120 | 1,505,524 | 396,179 | 600,666 | 675,196 | |||||||
| — | — | — | — | — | — | — | |||||||
| 102,409 | 41,526,958 | 8,462,120 | 1,505,524 | 396,179 | 600,666 | 675,196 | |||||||
| 32,486 | 153,436,751 | 28,481,056 | 225,149 | 1,982,242 | 5,854,400 | 2,056,794 | |||||||
| (256,890) | (181,261,781) | — | (8,541,854) | (5,019,706) | — | — | |||||||
| — | — | (58,995,234) | — | — | (13,718,074) | 929,491 | |||||||
| 241,835 | 444,981,704 | — | 19,634,159 | 5,220,009 | — | — | |||||||
| — | — | 876,501,560 | — | — | 4,597,755 | 50,878,417 | |||||||
| (31,942) | — | — | — | — | — | — | |||||||
| 575,553 | — | — | — | — | — | — | |||||||
| — | — | — | — | — | — | — | |||||||
| — | — | — | — | — | — | — | |||||||
| 528,556 | 263,719,923 | 817,506,326 | 11,092,305 | 200,303 | (9,120,319) | 51,807,908 | |||||||
| — | — | — | — | — | — | — | |||||||
| (2,985,751) | (2,185,334,312) | — | (26,897,678) | (12,779,877) | — | — | |||||||
| — | — | (1,170,352,406) | — | — | (51,259,930) | (67,491,422) | |||||||
| 21,726 | — | — | — | — | — | — | |||||||
| 293,184 | — | — | — | — | — | — | |||||||
| — | — | — | — | — | — | — | |||||||
| — | — | — | — | — | — | — | |||||||
| (2,670,841) | (2,185,334,312) | (1,170,352,406) | (26,897,678) | (12,779,877) | (51,259,930) | (67,491,422) | |||||||
| (2,142,285) | (1,921,614,389) | (352,846,080) | (15,805,373) | (12,579,574) | (60,380,249) | (15,683,514) | |||||||
| $(2,109,799) | $(1,768,177,638) | $(324,365,024) | $(15,580,224) | $(10,597,332) | $(54,525,849) | $(13,626,720) |
| First Trust Indxx Innovative Transaction & Process ETF (LEGR) | First Trust Nasdaq Artificial Intelligence and Robotics ETF (ROBT) | First Trust International Developed Capital Strength ETF (FICS) | ||||
| INVESTMENT INCOME: | ||||||
Dividends - Unaffiliated | $ 5,230,203 | $ 1,747,398 | $ 745,989 | |||
Dividends - Affiliated | — | — | — | |||
Interest | 1,836 | 2,405 | — | |||
Securities lending income (net of fees) | 29,683 | 367,496 | — | |||
Foreign withholding tax | (393,285) | (157,060) | (74,200) | |||
Other | 23 | 47 | 4 | |||
Total investment income | 4,868,460 | 1,960,286 | 671,793 | |||
| EXPENSES: | ||||||
Investment advisory fees | 882,398 | 1,549,330 | 167,713 | |||
Total expenses | 882,398 | 1,549,330 | 167,713 | |||
Fees waived by the investment advisor | — | — | — | |||
Net expenses | 882,398 | 1,549,330 | 167,713 | |||
NET INVESTMENT INCOME (LOSS) | 3,986,062 | 410,956 | 504,080 | |||
| NET REALIZED AND UNREALIZED GAIN (LOSS): | ||||||
| Net realized gain (loss) on: | ||||||
Investments - Unaffiliated | (3,897,325) | (19,712,624) | (1,262,455) | |||
Investments - Affiliated | — | — | — | |||
In-kind redemptions - Unaffiliated | 2,428,899 | 17,419,636 | (723,956) | |||
In-kind redemptions - Affiliated | — | — | — | |||
Purchased options contracts | — | — | — | |||
Written options contracts | — | — | — | |||
Foreign currency transactions | (27,439) | 261,082 | 6,334 | |||
Foreign capital gains tax | (28,832) | — | — | |||
Net realized gain (loss) | (1,524,697) | (2,031,906) | (1,980,077) | |||
Net increase from payment by the advisor | — | 1,987 | — | |||
| Net change in unrealized appreciation (depreciation) on: | ||||||
Investments - Unaffiliated | (40,992,272) | (103,811,853) | (5,646,939) | |||
Investments - Affiliated | — | — | — | |||
Purchased options contracts | — | — | — | |||
Written options contracts | — | — | — | |||
Foreign currency translation | (21,740) | (13,102) | (4,897) | |||
Deferred foreign capital gains tax | 105,536 | — | — | |||
Net change in unrealized appreciation (depreciation) | (40,908,476) | (103,824,955) | (5,651,836) | |||
NET REALIZED AND UNREALIZED GAIN (LOSS) | (42,433,173) | (105,854,874) | (7,631,913) | |||
NET INCREASE (DECREASE) IN NET ASSETS RESULTING FROM OPERATIONS | $(38,447,111) | $(105,443,918) | $(7,127,833) | |||
| First Trust NASDAQ Technology Dividend Index Fund (TDIV) | Multi-Asset Diversified Income Index Fund (MDIV) | ||||||
| Year Ended 9/30/2022 | Year Ended 9/30/2021 | Year Ended 9/30/2022 | Year Ended 9/30/2021 | ||||
| OPERATIONS: | |||||||
Net investment income (loss) | $ 39,013,530 | $ 30,828,737 | $ 21,144,380 | $ 14,299,976 | |||
Net realized gain (loss) | 77,346,934 | 266,500,553 | 9,377,860 | 36,831,045 | |||
Net increase from payment by the advisor | — | — | — | — | |||
Net change in unrealized appreciation (depreciation) | (504,758,535) | 71,094,267 | (63,041,345) | 60,843,085 | |||
Net increase (decrease) in net assets resulting from operations | (388,398,071) | 368,423,557 | (32,519,105) | 111,974,106 | |||
| DISTRIBUTIONS TO SHAREHOLDERS FROM: | |||||||
Investment operations | (37,869,712) | (29,861,800) | (28,972,326) | (18,794,700) | |||
Return of capital | — | — | (634,126) | (6,052,472) | |||
Total distributions to shareholders | (37,869,712) | (29,861,800) | (29,606,452) | (24,847,172) | |||
| SHAREHOLDER TRANSACTIONS: | |||||||
Proceeds from shares sold | 585,823,081 | 784,387,981 | 136,630,172 | 9,259,907 | |||
Cost of shares redeemed | (342,711,470) | (754,460,022) | (98,607,101) | (66,909,068) | |||
Net increase (decrease) in net assets resulting from shareholder transactions | 243,111,611 | 29,927,959 | 38,023,071 | (57,649,161) | |||
Total increase (decrease) in net assets | (183,156,172) | 368,489,716 | (24,102,486) | 29,477,773 | |||
| NET ASSETS: | |||||||
Beginning of period | 1,613,767,129 | 1,245,277,413 | 470,203,430 | 440,725,657 | |||
End of period | $1,430,610,957 | $1,613,767,129 | $446,100,944 | $470,203,430 | |||
| CHANGES IN SHARES OUTSTANDING: | |||||||
Shares outstanding, beginning of period | 28,605,000 | 28,405,000 | 28,750,002 | 32,600,002 | |||
Shares sold | 10,150,000 | 14,150,000 | 8,450,000 | 550,000 | |||
Shares redeemed | (5,950,000) | (13,950,000) | (6,250,000) | (4,400,000) | |||
Shares outstanding, end of period | 32,805,000 | 28,605,000 | 30,950,002 | 28,750,002 | |||
| First Trust S&P International Dividend Aristocrats ETF (FID) | First Trust BuyWrite Income ETF (FTHI) | First Trust Nasdaq BuyWrite Income ETF (FTQI) | ||||||||
| Year Ended 9/30/2022 | Year Ended 9/30/2021 | Year Ended 9/30/2022 | Year Ended 9/30/2021 | Year Ended 9/30/2022 | Year Ended 9/30/2021 | |||||
| $ 2,200,759 | $ 1,333,244 | $ 434,135 | $ 709,991 | $ 32,486 | $ 82,731 | |||||
| (407,597) | 140,357 | 1,233,335 | 8,266,105 | 528,556 | 367,409 | |||||
| — | — | — | — | — | — | |||||
| (12,316,027) | 4,299,027 | (11,115,307) | 250,450 | (2,670,841) | 267,151 | |||||
| (10,522,865) | 5,772,628 | (9,447,837) | 9,226,546 | (2,109,799) | 717,291 | |||||
| (2,134,072) | (1,317,871) | (4,161,738) | (2,535,233) | (627,504) | (228,251) | |||||
| — | — | — | — | (260,249) | — | |||||
| (2,134,072) | (1,317,871) | (4,161,738) | (2,535,233) | (887,753) | (228,251) | |||||
| 17,543,449 | 19,294,526 | 58,793,688 | 18,094,504 | 15,486,123 | 7,205,917 | |||||
| (3,114,320) | — | (2,232,301) | (37,943,500) | (3,127,943) | (2,974,588) | |||||
| 14,429,129 | 19,294,526 | 56,561,387 | (19,848,996) | 12,358,180 | 4,231,329 | |||||
| 1,772,192 | 23,749,283 | 42,951,812 | (13,157,683) | 9,360,628 | 4,720,369 | |||||
| 42,139,326 | 18,390,043 | 46,575,076 | 59,732,759 | 9,526,934 | 4,806,565 | |||||
| $43,911,518 | $42,139,326 | $89,526,888 | $46,575,076 | $18,887,562 | $9,526,934 | |||||
| 2,400,002 | 1,300,002 | 2,174,201 | 3,124,201 | 450,002 | 250,002 | |||||
| 1,000,000 | 1,100,000 | 2,800,000 | 900,000 | 750,000 | 350,000 | |||||
| (200,000) | — | (100,000) | (1,850,000) | (150,000) | (150,000) | |||||
| 3,200,002 | 2,400,002 | 4,874,201 | 2,174,201 | 1,050,002 | 450,002 | |||||
| First Trust Rising Dividend Achievers ETF (RDVY) | First Trust Dorsey Wright Focus 5 ETF (FV) | ||||||
| Year Ended 9/30/2022 | Year Ended 9/30/2021 | Year Ended 9/30/2022 | Year Ended 9/30/2021 | ||||
| OPERATIONS: | |||||||
Net investment income (loss) | $ 153,436,751 | $ 47,447,030 | $ 28,481,056 | $ 899,652 | |||
Net realized gain (loss) | 263,719,923 | 284,110,410 | 817,506,326 | 406,561,570 | |||
Net increase from payment by the advisor | — | — | — | — | |||
Net change in unrealized appreciation (depreciation) | (2,185,334,312) | 428,357,284 | (1,170,352,406) | 276,499,831 | |||
Net increase (decrease) in net assets resulting from operations | (1,768,177,638) | 759,914,724 | (324,365,024) | 683,961,053 | |||
| DISTRIBUTIONS TO SHAREHOLDERS FROM: | |||||||
Investment operations | (140,979,372) | (44,959,526) | (27,189,651) | (1,159,345) | |||
Return of capital | — | — | — | — | |||
Total distributions to shareholders | (140,979,372) | (44,959,526) | (27,189,651) | (1,159,345) | |||
| SHAREHOLDER TRANSACTIONS: | |||||||
Proceeds from shares sold | 5,962,228,272 | 5,044,833,796 | 2,838,226,345 | 650,797,839 | |||
Cost of shares redeemed | (2,501,951,722) | (1,312,230,974) | (2,588,053,448) | (686,904,053) | |||
Net increase (decrease) in net assets resulting from shareholder transactions | 3,460,276,550 | 3,732,602,822 | 250,172,897 | (36,106,214) | |||
Total increase (decrease) in net assets | 1,551,119,540 | 4,447,558,020 | (101,381,778) | 646,695,494 | |||
| NET ASSETS: | |||||||
Beginning of period | 5,739,655,239 | 1,292,097,219 | 2,694,187,168 | 2,047,491,674 | |||
End of period | $7,290,774,779 | $5,739,655,239 | $2,592,805,390 | $2,694,187,168 | |||
| CHANGES IN SHARES OUTSTANDING: | |||||||
Shares outstanding, beginning of period | 120,900,002 | 39,550,002 | 58,850,002 | 60,050,002 | |||
Shares sold | 120,450,000 | 111,000,000 | 59,550,000 | 14,950,000 | |||
Shares redeemed | (53,600,000) | (29,650,000) | (55,300,000) | (16,150,000) | |||
Shares outstanding, end of period | 187,750,002 | 120,900,002 | 63,100,002 | 58,850,002 | |||
| First Trust RBA American Industrial Renaissance® ETF (AIRR) | First Trust Dorsey Wright Momentum & Dividend ETF (DDIV) | First Trust Dorsey Wright International Focus 5 ETF (IFV) | ||||||||
| Year Ended 9/30/2022 | Year Ended 9/30/2021 | Year Ended 9/30/2022 | Year Ended 9/30/2021 | Year Ended 9/30/2022 | Year Ended 9/30/2021 | |||||
| $ 225,149 | $ 102,277 | $ 1,982,242 | $ 926,527 | $ 5,854,400 | $ 2,372,763 | |||||
| 11,092,305 | 22,206,086 | 200,303 | 12,028,581 | (9,120,319) | 39,219,683 | |||||
| — | — | — | — | — | — | |||||
| (26,897,678) | 9,760,455 | (12,779,877) | (91,117) | (51,259,930) | 6,817,205 | |||||
| (15,580,224) | 32,068,818 | (10,597,332) | 12,863,991 | (54,525,849) | 48,409,651 | |||||
| (131,850) | (68,330) | (1,904,422) | (903,831) | (5,794,666) | (2,584,930) | |||||
| — | — | — | — | — | — | |||||
| (131,850) | (68,330) | (1,904,422) | (903,831) | (5,794,666) | (2,584,930) | |||||
| 67,434,447 | 204,119,512 | 79,279,112 | 58,983,424 | 2,531,736 | 29,789,512 | |||||
| (102,287,438) | (63,084,042) | (38,540,592) | (61,564,516) | (67,969,588) | (29,096,455) | |||||
| (34,852,991) | 141,035,470 | 40,738,520 | (2,581,092) | (65,437,852) | 693,057 | |||||
| (50,565,065) | 173,035,958 | 28,236,766 | 9,379,068 | (125,758,367) | 46,517,778 | |||||
| 220,549,282 | 47,513,324 | 38,863,425 | 29,484,357 | 264,969,890 | 218,452,112 | |||||
| $169,984,217 | $220,549,282 | $67,100,191 | $38,863,425 | $139,211,523 | $264,969,890 | |||||
| 5,400,002 | 1,850,002 | 1,250,002 | 1,400,002 | 11,650,002 | 11,600,002 | |||||
| 1,550,000 | 5,150,000 | 2,400,000 | 2,050,000 | 150,000 | 1,350,000 | |||||
| (2,500,000) | (1,600,000) | (1,150,000) | (2,200,000) | (3,150,000) | (1,300,000) | |||||
| 4,450,002 | 5,400,002 | 2,500,002 | 1,250,002 | 8,650,002 | 11,650,002 | |||||
| First Trust Dorsey Wright Dynamic Focus 5 ETF (FVC) | First Trust Indxx Innovative Transaction & Process ETF (LEGR) | ||||||
| Year Ended 9/30/2022 | Year Ended 9/30/2021 | Year Ended 9/30/2022 | Year Ended 9/30/2021 | ||||
| OPERATIONS: | |||||||
Net investment income (loss) | $ 2,056,794 | $ 44,628 | $ 3,986,062 | $ 1,528,329 | |||
Net realized gain (loss) | 51,807,908 | 33,942,853 | (1,524,697) | 2,447,567 | |||
Net increase from payment by the advisor | — | — | — | — | |||
Net change in unrealized appreciation (depreciation) | (67,491,422) | 31,031,603 | (40,908,476) | 13,738,762 | |||
Net increase (decrease) in net assets resulting from operations | (13,626,720) | 65,019,084 | (38,447,111) | 17,714,658 | |||
| DISTRIBUTIONS TO SHAREHOLDERS FROM: | |||||||
Investment operations | (1,833,976) | (67,710) | (3,919,682) | (1,414,166) | |||
Return of capital | — | — | — | — | |||
Total distributions to shareholders | (1,833,976) | (67,710) | (3,919,682) | (1,414,166) | |||
| SHAREHOLDER TRANSACTIONS: | |||||||
Proceeds from shares sold | 250,484,774 | 49,813,076 | 23,904,823 | 73,931,252 | |||
Cost of shares redeemed | (217,153,179) | (125,909,677) | (13,920,351) | — | |||
Net increase (decrease) in net assets resulting from shareholder transactions | 33,331,595 | (76,096,601) | 9,984,472 | 73,931,252 | |||
Total increase (decrease) in net assets | 17,870,899 | (11,145,227) | (32,382,321) | 90,231,744 | |||
| NET ASSETS: | |||||||
Beginning of period | 212,608,772 | 223,753,999 | 132,512,050 | 42,280,306 | |||
End of period | $230,479,671 | $212,608,772 | $100,129,729 | $132,512,050 | |||
| CHANGES IN SHARES OUTSTANDING: | |||||||
Shares outstanding, beginning of period | 6,050,002 | 8,550,002 | 3,150,002 | 1,350,002 | |||
Shares sold | 6,900,000 | 1,500,000 | 550,000 | 1,800,000 | |||
Shares redeemed | (6,050,000) | (4,000,000) | (400,000) | — | |||
Shares outstanding, end of period | 6,900,002 | 6,050,002 | 3,300,002 | 3,150,002 | |||
| (a) | Inception date is December 15, 2020, which is consistent with the commencement of investment operations and is the date the initial creation units were established. |
| First Trust Nasdaq Artificial Intelligence and Robotics ETF (ROBT) | First Trust International Developed Capital Strength ETF (FICS) | |||||
| Year Ended 9/30/2022 | Year Ended 9/30/2021 | Year Ended 9/30/2022 | Period Ended 9/30/2021 (a) | |||
| $ 410,956 | $ 225,235 | $ 504,080 | $ 43,782 | |||
| (2,031,906) | 33,190,276 | (1,980,077) | 177,073 | |||
| 1,987 | — | — | — | |||
| (103,824,955) | 14,737,527 | (5,651,836) | (13,221) | |||
| (105,443,918) | 48,153,038 | (7,127,833) | 207,634 | |||
| (369,695) | (333,100) | (503,611) | (39,101) | |||
| — | — | — | — | |||
| (369,695) | (333,100) | (503,611) | (39,101) | |||
| 64,515,646 | 178,221,700 | 31,655,094 | 11,708,531 | |||
| (51,946,180) | (80,098,259) | (14,840,804) | (1,664,041) | |||
| 12,569,466 | 98,123,441 | 16,814,290 | 10,044,490 | |||
| (93,244,147) | 145,943,379 | 9,182,846 | 10,213,023 | |||
| 266,492,021 | 120,548,642 | 10,213,023 | — | |||
| $ 173,247,874 | $ 266,492,021 | $ 19,395,869 | $ 10,213,023 | |||
| 5,000,002 | 3,100,002 | 300,002 | — | |||
| 1,250,000 | 3,400,000 | 950,000 | 350,002 | |||
| (1,100,000) | (1,500,000) | (500,000) | (50,000) | |||
| 5,150,002 | 5,000,002 | 750,002 | 300,002 | |||
| Year Ended September 30, | |||||||||
| 2022 | 2021 | 2020 | 2019 | 2018 | |||||
Net asset value, beginning of period | $ 56.42 | $ 43.84 | $ 40.09 | $ 38.38 | $ 32.39 | ||||
| Income from investment operations: | |||||||||
Net investment income (loss) | 1.24 | 1.10 | 0.93 | 0.97 | 0.96 | ||||
Net realized and unrealized gain (loss) | (12.83) | 12.55 | 3.77 | 1.71 | 5.90 | ||||
Total from investment operations | (11.59) | 13.65 | 4.70 | 2.68 | 6.86 | ||||
| Distributions paid to shareholders from: | |||||||||
Net investment income | (1.22) | (1.07) | (0.95) | (0.97) | (0.87) | ||||
Net asset value, end of period | $43.61 | $56.42 | $43.84 | $40.09 | $38.38 | ||||
Total return (a) | (20.93)% | 31.29% | 11.91% | 7.21% | 21.37% | ||||
| Ratios to average net assets/supplemental data: | |||||||||
Net assets, end of period (in 000’s) | $ 1,430,611 | $ 1,613,767 | $ 1,245,277 | $ 1,010,557 | $ 948,172 | ||||
Ratio of total expenses to average net assets | 0.50% | 0.50% | 0.50% | 0.50% | 0.50% | ||||
Ratio of net investment income (loss) to average net assets | 2.26% | 2.08% | 2.28% | 2.59% | 2.70% | ||||
Portfolio turnover rate (b) | 36% | 38% | 49% | 37% | 27% | ||||
| (a) | Total return is calculated assuming an initial investment made at the net asset value at the beginning of the period, reinvestment of all distributions at net asset value during the period, and redemption at net asset value on the last day of the period. The returns presented do not reflect the deduction of taxes that a shareholder would pay on Fund distributions or the redemption or sale of Fund shares. Total return is calculated for the time period presented and is not annualized for periods of less than a year. |
| (b) | Portfolio turnover is calculated for the time period presented and is not annualized for periods of less than a year and does not include securities received or delivered from processing creations or redemptions and in-kind transactions. |
| Year Ended September 30, | |||||||||
| 2022 | 2021 | 2020 | 2019 | 2018 | |||||
Net asset value, beginning of period | $ 16.35 | $ 13.52 | $ 18.43 | $ 18.54 | $ 19.22 | ||||
| Income from investment operations: | |||||||||
Net investment income (loss) | 0.72 | 0.49 | 0.57 | 0.83 | 0.87 | ||||
Net realized and unrealized gain (loss) | (1.67) | 3.18 | (4.52) | 0.18 | (0.36) | ||||
Total from investment operations | (0.95) | 3.67 | (3.95) | 1.01 | 0.51 | ||||
| Distributions paid to shareholders from: | |||||||||
Net investment income | (0.97) | (0.64) | (0.79) | (0.77) | (0.76) | ||||
Return of capital | (0.02) | (0.20) | (0.17) | (0.35) | (0.43) | ||||
Total distributions | (0.99) | (0.84) | (0.96) | (1.12) | (1.19) | ||||
Net asset value, end of period | $14.41 | $16.35 | $13.52 | $18.43 | $18.54 | ||||
Total return (a) | (6.25)% | 27.50% | (21.89)% | 5.74% | 2.82% | ||||
| Ratios to average net assets/supplemental data: | |||||||||
Net assets, end of period (in 000’s) | $ 446,101 | $ 470,203 | $ 440,726 | $ 715,985 | $ 683,960 | ||||
Ratio of total expenses to average net assets (b) | 0.60% | 0.60% | 0.60% | 0.60% | 0.60% | ||||
Ratio of net expenses to average net assets (b) | 0.48% | 0.48% | 0.47% | 0.48% | 0.48% | ||||
Ratio of net investment income (loss) to average net assets | 4.40% | 3.03% | 3.86% | 4.58% | 4.62% | ||||
Portfolio turnover rate (c) | 85% | 100% | 106% | 73% | 84% | ||||
| (a) | Total return is calculated assuming an initial investment made at the net asset value at the beginning of the period, reinvestment of all distributions at net asset value during the period, and redemption at net asset value on the last day of the period. The returns presented do not reflect the deduction of taxes that a shareholder would pay on Fund distributions or the redemption or sale of Fund shares. Total return is calculated for the time period presented and is not annualized for periods of less than a year. The total returns would have been lower if certain fees had not been waived and expenses reimbursed by the investment advisor. |
| (b) | The Fund indirectly bears its proportionate share of fees and expenses incurred by the underlying funds in which the Fund invests. This ratio does not include these indirect fees and expenses. |
| (c) | Portfolio turnover is calculated for the time period presented and is not annualized for periods of less than a year and does not include securities received or delivered from processing creations or redemptions and in-kind transactions. |
| Year Ended September 30, | |||||||||
| 2022 | 2021 | 2020 | 2019 | 2018 | |||||
Net asset value, beginning of period | $ 17.56 | $ 14.15 | $ 17.11 | $ 17.19 | $ 18.52 | ||||
| Income from investment operations: | |||||||||
Net investment income (loss) | 0.71 | 0.62 | 0.64 | 0.63 | 0.85 | ||||
Net realized and unrealized gain (loss) | (3.85) | 3.43 | (2.93) | (0.08) | (1.26) | ||||
Total from investment operations | (3.14) | 4.05 | (2.29) | 0.55 | (0.41) | ||||
| Distributions paid to shareholders from: | |||||||||
Net investment income | (0.70) | (0.64) | (0.67) | (0.63) | (0.92) | ||||
Net asset value, end of period | $13.72 | $17.56 | $14.15 | $17.11 | $17.19 | ||||
Total return (a) | (18.39)% | 28.79% | (13.62)% | 3.38% | (2.35)% | ||||
| Ratios to average net assets/supplemental data: | |||||||||
Net assets, end of period (in 000’s) | $ 43,912 | $ 42,139 | $ 18,390 | $ 19,678 | $ 13,753 | ||||
Ratio of total expenses to average net assets | 0.60% | 0.60% | 0.60% | 0.60% | 0.69% (b) | ||||
Ratio of net investment income (loss) to average net assets | 4.39% | 4.10% | 4.03% | 4.01% | 4.70% | ||||
Portfolio turnover rate (c) | 47% | 57% | 81% | 44% | 196% (d) | ||||
| (a) | Total return is calculated assuming an initial investment made at the net asset value at the beginning of the period, reinvestment of all distributions at net asset value during the period, and redemption at net asset value on the last day of the period. The returns presented do not reflect the deduction of taxes that a shareholder would pay on Fund distributions or the redemption or sale of Fund shares. Total return is calculated for the time period presented and is not annualized for periods of less than a year. |
| (b) | On August 30, 2018, the Fund reduced the annual management fee payable to First Trust, from 0.70% of the Fund’s average daily net assets to 0.60% of the Fund’s average daily net assets. |
| (c) | Portfolio turnover is calculated for the time period presented and is not annualized for periods of less than a year and does not include securities received or delivered from processing creations or redemptions and in-kind transactions. |
| (d) | The variation in the portfolio turnover rate is due to the change in the Fund’s underlying index effective August 30, 2018, which resulted in a complete rebalance of the Fund’s portfolio. |
| Year Ended September 30, | |||||||||
| 2022 | 2021 | 2020 | 2019 | 2018 | |||||
Net asset value, beginning of period | $ 21.42 | $ 19.12 | $ 22.43 | $ 23.28 | $ 22.54 | ||||
| Income from investment operations: | |||||||||
Net investment income (loss) | 0.17 (a) | 0.12 | 0.23 | 0.40 | 0.35 | ||||
Net realized and unrealized gain (loss) | (1.64) | 3.14 | (2.58) | (0.29) | 1.35 | ||||
Total from investment operations | (1.47) | 3.26 | (2.35) | 0.11 | 1.70 | ||||
| Distributions paid to shareholders from: | |||||||||
Net investment income | (1.58) | (0.96) | (0.23) | (0.86) | (0.96) | ||||
Return of capital | — | — | (0.73) | (0.10) | — | ||||
Total distributions | (1.58) | (0.96) | (0.96) | (0.96) | (0.96) | ||||
Net asset value, end of period | $18.37 | $21.42 | $19.12 | $22.43 | $23.28 | ||||
Total return (b) | (7.60)% | 17.31% | (10.63)% | 0.72% | 8.12% | ||||
| Ratios to average net assets/supplemental data: | |||||||||
Net assets, end of period (in 000’s) | $ 89,527 | $ 46,575 | $ 59,733 | $ 80,155 | $ 66,898 | ||||
Ratio of total expenses to average net assets | 0.85% | 0.85% | 0.85% | 0.85% | 0.85% | ||||
Ratio of net investment income (loss) to average net assets | 0.81% | 1.29% | 1.10% | 1.43% | 1.34% | ||||
Portfolio turnover rate (c) | 90% (d) | 199% | 210% | 209% | 239% | ||||
| (a) | Based on average shares outstanding. |
| (b) | Total return is calculated assuming an initial investment made at the net asset value at the beginning of the period, reinvestment of all distributions at net asset value during the period, and redemption at net asset value on the last day of the period. The returns presented do not reflect the deduction of taxes that a shareholder would pay on Fund distributions or the redemption or sale of Fund shares. Total return is calculated for the time period presented and is not annualized for periods of less than a year. |
| (c) | Portfolio turnover is calculated for the time period presented and is not annualized for periods of less than a year and does not include securities received or delivered from processing creations or redemptions and in-kind transactions. |
| (d) | The variation in the portfolio turnover rate is due to lower than expected portfolio rebalancing, which was impacted by high levels of equity volatility and a downtrend in the U.S. equity markets. |
| Year Ended September 30, | |||||||||
| 2022 | 2021 | 2020 | 2019 | 2018 | |||||
Net asset value, beginning of period | $ 21.17 | $ 19.23 | $ 22.30 | $ 22.92 | $ 22.27 | ||||
| Income from investment operations: | |||||||||
Net investment income (loss) | 0.06 (a) | 0.34 | 0.21 | 0.27 | 0.40 | ||||
Net realized and unrealized gain (loss) | (1.83) | 2.26 | (2.62) | (0.23) | 0.91 | ||||
Total from investment operations | (1.77) | 2.60 | (2.41) | 0.04 | 1.31 | ||||
| Distributions paid to shareholders from: | |||||||||
Net investment income | (0.99) | (0.66) | (0.21) | (0.58) | (0.66) | ||||
Return of capital | (0.42) | — | (0.45) | (0.08) | — | ||||
Total distributions | (1.41) | (0.66) | (0.66) | (0.66) | (0.66) | ||||
Net asset value, end of period | $17.99 | $21.17 | $19.23 | $22.30 | $22.92 | ||||
Total return (b) | (9.00)% | 13.66% | (10.98)% | 0.29% | 5.95% | ||||
| Ratios to average net assets/supplemental data: | |||||||||
Net assets, end of period (in 000’s) | $ 18,888 | $ 9,527 | $ 4,807 | $ 8,919 | $ 13,751 | ||||
Ratio of total expenses to average net assets | 0.85% | 0.85% | 0.85% | 0.85% | 0.85% | ||||
Ratio of net investment income (loss) to average net assets | 0.27% | 1.16% | 0.96% | 1.40% | 1.32% | ||||
Portfolio turnover rate (c) | 107% (d) | 182% | 207% | 205% | 219% | ||||
| (a) | Based on average shares outstanding. |
| (b) | Total return is calculated assuming an initial investment made at the net asset value at the beginning of the period, reinvestment of all distributions at net asset value during the period, and redemption at net asset value on the last day of the period. The returns presented do not reflect the deduction of taxes that a shareholder would pay on Fund distributions or the redemption or sale of Fund shares. Total return is calculated for the time period presented and is not annualized for periods of less than a year. |
| (c) | Portfolio turnover is calculated for the time period presented and is not annualized for periods of less than a year and does not include securities received or delivered from processing creations or redemptions and in-kind transactions. |
| (d) | The variation in the portfolio turnover rate is due to the change in the Fund’s index and investment strategy effective May 11, 2022, which resulted in fewer portfolio transactions. |
| Year Ended September 30, | |||||||||
| 2022 | 2021 | 2020 | 2019 | 2018 | |||||
Net asset value, beginning of period | $ 47.47 | $ 32.67 | $ 31.82 | $ 31.54 | $ 27.84 | ||||
| Income from investment operations: | |||||||||
Net investment income (loss) | 0.82 | 0.59 | 0.58 | 0.54 | 0.41 | ||||
Net realized and unrealized gain (loss) | (8.70) | 14.79 | 0.86 | 0.27 | 3.68 | ||||
Total from investment operations | (7.88) | 15.38 | 1.44 | 0.81 | 4.09 | ||||
| Distributions paid to shareholders from: | |||||||||
Net investment income | (0.76) | (0.58) | (0.59) | (0.53) | (0.39) | ||||
Net asset value, end of period | $38.83 | $47.47 | $32.67 | $31.82 | $31.54 | ||||
Total return (a) | (16.76)% | 47.21% | 4.61% | 2.72% | 14.78% | ||||
| Ratios to average net assets/supplemental data: | |||||||||
Net assets, end of period (in 000’s) | $ 7,290,775 | $ 5,739,655 | $ 1,292,097 | $ 832,156 | $ 690,709 | ||||
Ratio of total expenses to average net assets | 0.50% | 0.50% | 0.50% | 0.50% | 0.50% | ||||
Ratio of net investment income (loss) to average net assets | 1.85% | 1.43% | 1.89% | 1.85% | 1.50% | ||||
Portfolio turnover rate (b) | 59% | 45% | 62% | 63% | 40% | ||||
| (a) | Total return is calculated assuming an initial investment made at the net asset value at the beginning of the period, reinvestment of all distributions at net asset value during the period, and redemption at net asset value on the last day of the period. The returns presented do not reflect the deduction of taxes that a shareholder would pay on Fund distributions or the redemption or sale of Fund shares. Total return is calculated for the time period presented and is not annualized for periods of less than a year. |
| (b) | Portfolio turnover is calculated for the time period presented and is not annualized for periods of less than a year and does not include securities received or delivered from processing creations or redemptions and in-kind transactions. |
| Year Ended September 30, | |||||||||
| 2022 | 2021 | 2020 | 2019 | 2018 | |||||
Net asset value, beginning of period | $ 45.78 | $ 34.10 | $ 29.63 | $ 30.93 | $ 26.17 | ||||
| Income from investment operations: | |||||||||
Net investment income (loss) | 0.46 | 0.02 | 0.09 | 0.11 | 0.09 | ||||
Net realized and unrealized gain (loss) | (4.71) | 11.68 | 4.49 | (1.31) | 4.83 | ||||
Total from investment operations | (4.25) | 11.70 | 4.58 | (1.20) | 4.92 | ||||
| Distributions paid to shareholders from: | |||||||||
Net investment income | (0.44) | (0.02) | (0.11) | (0.10) | (0.16) | ||||
Net asset value, end of period | $41.09 | $45.78 | $34.10 | $29.63 | $30.93 | ||||
Total return (a) | (9.32)% | 34.31% | 15.50% | (3.92)% | 18.91% | ||||
| Ratios to average net assets/supplemental data: | |||||||||
Net assets, end of period (in 000’s) | $ 2,592,805 | $ 2,694,187 | $ 2,047,492 | $ 2,348,262 | $ 2,858,225 | ||||
Ratio of total expenses to average net assets (b) | 0.30% | 0.30% | 0.30% | 0.30% | 0.30% | ||||
Ratio of net investment income (loss) to average net assets | 1.01% | 0.04% | 0.30% | 0.34% | 0.30% | ||||
Portfolio turnover rate (c) | 81% | 20% | 72% | 65% | 44% | ||||
| (a) | Total return is calculated assuming an initial investment made at the net asset value at the beginning of the period, reinvestment of all distributions at net asset value during the period, and redemption at net asset value on the last day of the period. The returns presented do not reflect the deduction of taxes that a shareholder would pay on Fund distributions or the redemption or sale of Fund shares. Total return is calculated for the time period presented and is not annualized for periods of less than a year. |
| (b) | The Fund indirectly bears its proportionate share of fees and expenses incurred by the underlying funds in which the Fund invests. This ratio does not include these indirect fees and expenses. |
| (c) | Portfolio turnover is calculated for the time period presented and is not annualized for periods of less than a year and does not include securities received or delivered from processing creations or redemptions and in-kind transactions. |
| Year Ended September 30, | |||||||||
| 2022 | 2021 | 2020 | 2019 | 2018 | |||||
Net asset value, beginning of period | $ 40.84 | $ 25.68 | $ 26.76 | $ 27.93 | $ 26.04 | ||||
| Income from investment operations: | |||||||||
Net investment income (loss) | 0.04 | 0.03 | (0.03) | 0.10 (a) | 0.09 | ||||
Net realized and unrealized gain (loss) | (2.66) | 15.16 | (0.98) | (1.21) | 1.88 | ||||
Total from investment operations | (2.62) | 15.19 | (1.01) | (1.11) | 1.97 | ||||
| Distributions paid to shareholders from: | |||||||||
Net investment income | (0.02) | (0.03) | (0.07) | (0.06) | (0.08) | ||||
Net asset value, end of period | $38.20 | $40.84 | $25.68 | $26.76 | $27.93 | ||||
Total return (b) | (6.41)% | 59.15% | (3.81)% | (3.95)% | 7.56% | ||||
| Ratios to average net assets/supplemental data: | |||||||||
Net assets, end of period (in 000’s) | $ 169,984 | $ 220,549 | $ 47,513 | $ 66,900 | $ 195,500 | ||||
Ratio of total expenses to average net assets | 0.70% | 0.70% | 0.70% | 0.70% | 0.70% | ||||
Ratio of net investment income (loss) to average net assets | 0.10% | 0.07% | (0.18)% | 0.40% | 0.32% | ||||
Portfolio turnover rate (c) | 37% | 35% | 45% | 58% | 35% | ||||
| (a) | Based on average shares outstanding. |
| (b) | Total return is calculated assuming an initial investment made at the net asset value at the beginning of the period, reinvestment of all distributions at net asset value during the period, and redemption at net asset value on the last day of the period. The returns presented do not reflect the deduction of taxes that a shareholder would pay on Fund distributions or the redemption or sale of Fund shares. Total return is calculated for the time period presented and is not annualized for periods of less than a year. |
| (c) | Portfolio turnover is calculated for the time period presented and is not annualized for periods of less than a year and does not include securities received or delivered from processing creations or redemptions and in-kind transactions. |
| Year Ended September 30, | |||||||||
| 2022 | 2021 | 2020 | 2019 | 2018 | |||||
Net asset value, beginning of period | $ 31.09 | $ 21.06 | $ 26.07 | $ 25.15 | $ 24.54 | ||||
| Income from investment operations: | |||||||||
Net investment income (loss) | 0.88 | 0.73 | 0.68 | 0.78 | 0.65 | ||||
Net realized and unrealized gain (loss) | (4.22) | 10.01 | (4.95) | 0.86 | 0.59 | ||||
Total from investment operations | (3.34) | 10.74 | (4.27) | 1.64 | 1.24 | ||||
| Distributions paid to shareholders from: | |||||||||
Net investment income | (0.91) | (0.71) | (0.74) | (0.72) | (0.63) | ||||
Net asset value, end of period | $26.84 | $31.09 | $21.06 | $26.07 | $25.15 | ||||
Total return (a) | (11.08)% | 51.29% | (16.49)% | 6.87% | 5.10% | ||||
| Ratios to average net assets/supplemental data: | |||||||||
Net assets, end of period (in 000’s) | $ 67,100 | $ 38,863 | $ 29,484 | $ 44,313 | $ 37,727 | ||||
Ratio of total expenses to average net assets | 0.60% | 0.60% | 0.60% | 0.60% | 0.69% (b) | ||||
Ratio of net investment income (loss) to average net assets | 3.00% | 2.54% | 2.81% | 3.50% | 2.79% | ||||
Portfolio turnover rate (c) | 172% | 186% | 193% | 160% | 297% (d) | ||||
| (a) | Total return is calculated assuming an initial investment made at the net asset value at the beginning of the period, reinvestment of all distributions at net asset value during the period, and redemption at net asset value on the last day of the period. The returns presented do not reflect the deduction of taxes that a shareholder would pay on Fund distributions or the redemption or sale of Fund shares. Total return is calculated for the time period presented and is not annualized for periods of less than a year. |
| (b) | On September 6, 2018, the Fund reduced the annual management fee payable to First Trust, from 0.70% of the Fund’s average daily net assets to 0.60% of the Fund’s average daily net assets. |
| (c) | Portfolio turnover is calculated for the time period presented and is not annualized for periods of less than a year and does not include securities received or delivered from processing creations or redemptions and in-kind transactions. |
| (d) | The variation in the portfolio turnover rate is due to the change in the Fund’s underlying index effective September 6, 2018, which resulted in a complete rebalance of the Fund’s portfolio. |
| Year Ended September 30, | |||||||||
| 2022 | 2021 | 2020 | 2019 | 2018 | |||||
Net asset value, beginning of period | $ 22.74 | $ 18.83 | $ 19.07 | $ 20.33 | $ 21.35 | ||||
| Income from investment operations: | |||||||||
Net investment income (loss) | 0.64 | 0.20 | 0.56 | 0.37 | 0.33 | ||||
Net realized and unrealized gain (loss) | (6.66) | 3.93 | (0.23) | (1.26) | (0.93) | ||||
Total from investment operations | (6.02) | 4.13 | 0.33 | (0.89) | (0.60) | ||||
| Distributions paid to shareholders from: | |||||||||
Net investment income | (0.63) | (0.22) | (0.57) | (0.35) | (0.42) | ||||
Return of capital | — | — | — | (0.02) | — | ||||
Total distributions | (0.63) | (0.22) | (0.57) | (0.37) | (0.42) | ||||
Net asset value, end of period | $16.09 | $22.74 | $18.83 | $19.07 | $20.33 | ||||
Total return (a) | (26.89)% | 21.91% | 1.75% | (4.42)% | (2.91)% | ||||
| Ratios to average net assets/supplemental data: | |||||||||
Net assets, end of period (in 000’s) | $ 139,212 | $ 264,970 | $ 218,452 | $ 453,757 | $ 774,665 | ||||
Ratio of total expenses to average net assets (b) | 0.30% | 0.30% | 0.30% | 0.30% | 0.30% | ||||
Ratio of net investment income (loss) to average net assets | 2.92% | 0.87% | 3.19% | 1.89% | 1.57% | ||||
Portfolio turnover rate (c) | 104% | 66% | 29% | 42% | 0% | ||||
| (a) | Total return is calculated assuming an initial investment made at the net asset value at the beginning of the period, reinvestment of all distributions at net asset value during the period, and redemption at net asset value on the last day of the period. The returns presented do not reflect the deduction of taxes that a shareholder would pay on Fund distributions or the redemption or sale of Fund shares. Total return is calculated for the time period presented and is not annualized for periods of less than a year. |
| (b) | The Fund indirectly bears its proportionate share of fees and expenses incurred by the underlying funds in which the Fund invests. This ratio does not include these indirect fees and expenses. |
| (c) | Portfolio turnover is calculated for the time period presented and is not annualized for periods of less than a year and does not include securities received or delivered from processing creations or redemptions and in-kind transactions. |
| Year Ended September 30, | |||||||||
| 2022 | 2021 | 2020 | 2019 | 2018 | |||||
Net asset value, beginning of period | $ 35.14 | $ 26.17 | $ 26.45 | $ 28.80 | $ 24.36 | ||||
| Income from investment operations: | |||||||||
Net investment income (loss) | 0.31 | 0.01 | 0.13 | 0.22 | 0.08 | ||||
Net realized and unrealized gain (loss) | (1.77) | 8.97 | (0.25) | (2.37) | 4.51 | ||||
Total from investment operations | (1.46) | 8.98 | (0.12) | (2.15) | 4.59 | ||||
| Distributions paid to shareholders from: | |||||||||
Net investment income | (0.28) | (0.01) | (0.16) | (0.20) | (0.15) | ||||
Net asset value, end of period | $33.40 | $35.14 | $26.17 | $26.45 | $28.80 | ||||
Total return (a) | (4.18)% | 34.32% | (0.46)% | (7.46)% | 18.91% | ||||
| Ratios to average net assets/supplemental data: | |||||||||
Net assets, end of period (in 000’s) | $ 230,480 | $ 212,609 | $ 223,754 | $ 468,253 | $ 620,537 | ||||
Ratio of total expenses to average net assets (b) | 0.30% | 0.30% | 0.30% | 0.30% | 0.30% | ||||
Ratio of net investment income (loss) to average net assets | 0.91% | 0.02% | 0.54% | 0.79% | 0.32% | ||||
Portfolio turnover rate (c) | 164% | 20% | 225% | 90% | 42% | ||||
| (a) | Total return is calculated assuming an initial investment made at the net asset value at the beginning of the period, reinvestment of all distributions at net asset value during the period, and redemption at net asset value on the last day of the period. The returns presented do not reflect the deduction of taxes that a shareholder would pay on Fund distributions or the redemption or sale of Fund shares. Total return is calculated for the time period presented and is not annualized for periods of less than a year. |
| (b) | The Fund indirectly bears its proportionate share of fees and expenses incurred by the underlying funds in which the Fund invests. This ratio does not include these indirect fees and expenses. |
| (c) | Portfolio turnover is calculated for the time period presented and is not annualized for periods of less than a year and does not include securities received or delivered from processing creations or redemptions and in-kind transactions. |
| Year Ended September 30, | Period Ended 9/30/2018 (a) | ||||||||
| 2022 | 2021 | 2020 | 2019 | ||||||
Net asset value, beginning of period | $ 42.07 | $ 31.32 | $ 29.32 | $ 30.31 | $ 29.99 | ||||
| Income from investment operations: | |||||||||
Net investment income (loss) | 1.15 | 0.61 | 0.35 | 0.59 | 0.26 | ||||
Net realized and unrealized gain (loss) | (11.75) | 10.70 | 2.02 | (0.93) | 0.29 | ||||
Total from investment operations | (10.60) | 11.31 | 2.37 | (0.34) | 0.55 | ||||
| Distributions paid to shareholders from: | |||||||||
Net investment income | (1.13) | (0.56) | (0.37) | (0.65) | (0.23) | ||||
Net asset value, end of period | $30.34 | $42.07 | $31.32 | $29.32 | $30.31 | ||||
Total return (b) | (25.55)% | 36.13% | 8.13% | (1.08)% | 1.87% | ||||
| Ratios to average net assets/supplemental data: | |||||||||
Net assets, end of period (in 000’s) | $ 100,130 | $ 132,512 | $ 42,280 | $ 41,048 | $ 50,017 | ||||
Ratio of total expenses to average net assets | 0.65% | 0.65% | 0.65% | 0.65% | 0.65% (c) | ||||
Ratio of net investment income (loss) to average net assets | 2.94% | 1.84% | 1.12% | 1.95% | 1.63% (c) | ||||
Portfolio turnover rate (d) | 23% | 46% | 25% | 35% | 53% | ||||
| (a) | Inception date is January 24, 2018, which is consistent with the commencement of investment operations and is the date the initial creation units were established. |
| (b) | Total return is calculated assuming an initial investment made at the net asset value at the beginning of the period, reinvestment of all distributions at net asset value during the period, and redemption at net asset value on the last day of the period. The returns presented do not reflect the deduction of taxes that a shareholder would pay on Fund distributions or the redemption or sale of Fund shares. Total return is calculated for the time period presented and is not annualized for periods of less than a year. |
| (c) | Annualized. |
| (d) | Portfolio turnover is calculated for the time period presented and is not annualized for periods of less than a year and does not include securities received or delivered from processing creations or redemptions and in-kind transactions. |
| Year Ended September 30, | Period Ended 9/30/2018 (a) | ||||||||
| 2022 | 2021 | 2020 | 2019 | ||||||
Net asset value, beginning of period | $ 53.30 | $ 38.89 | $ 31.51 | $ 32.23 | $ 29.91 | ||||
| Income from investment operations: | |||||||||
Net investment income (loss) | 0.08 | 0.05 | 0.04 | 0.17 | 0.12 | ||||
Net realized and unrealized gain (loss) | (19.67) (b) | 14.44 | 7.39 | (0.75) | 2.31 | ||||
Total from investment operations | (19.59) | 14.49 | 7.43 | (0.58) | 2.43 | ||||
| Distributions paid to shareholders from: | |||||||||
Net investment income | (0.07) | (0.08) | (0.05) | (0.14) | (0.11) | ||||
Net asset value, end of period | $33.64 | $53.30 | $38.89 | $31.51 | $32.23 | ||||
Total return (c) | (36.76)% (b) | 37.27% | 23.60% | (1.81)% | 8.15% | ||||
| Ratios to average net assets/supplemental data: | |||||||||
Net assets, end of period (in 000’s) | $ 173,248 | $ 266,492 | $ 120,549 | $ 61,443 | $ 32,226 | ||||
Ratio of total expenses to average net assets | 0.65% | 0.65% | 0.65% | 0.65% | 0.65% (d) | ||||
Ratio of net investment income (loss) to average net assets | 0.17% | 0.10% | 0.15% | 0.68% | 0.62% (d) | ||||
Portfolio turnover rate (e) | 36% | 31% | 34% | 43% | 67% | ||||
| (a) | Inception date is February 21, 2018, which is consistent with the commencement of investment operations and is the date the initial creation units were established. |
| (b) | The Fund received a reimbursement from the advisor in the amount of $1,987 in connection with a trade error, which represents less than $0.01 per share. Since the advisor reimbursed the Fund, there was no effect on the Fund’s total return. |
| (c) | Total return is calculated assuming an initial investment made at the net asset value at the beginning of the period, reinvestment of all distributions at net asset value during the period, and redemption at net asset value on the last day of the period. The returns presented do not reflect the deduction of taxes that a shareholder would pay on Fund distributions or the redemption or sale of Fund shares. Total return is calculated for the time period presented and is not annualized for periods of less than a year. |
| (d) | Annualized. |
| (e) | Portfolio turnover is calculated for the time period presented and is not annualized for periods of less than a year and does not include securities received or delivered from processing creations or redemptions and in-kind transactions. |
| Year Ended 9/30/2022 | Period Ended 9/30/2021 (a) | ||
Net asset value, beginning of period | $ 34.04 | $ 30.09 | |
| Income from investment operations: | |||
Net investment income (loss) | 0.57 | 0.36 | |
Net realized and unrealized gain (loss) | (8.16) | 3.93 | |
Total from investment operations | (7.59) | 4.29 | |
| Distributions paid to shareholders from: | |||
Net investment income | (0.59) | (0.34) | |
Net asset value, end of period | $25.86 | $34.04 | |
Total return (b) | (22.50)% | 14.25% | |
| Ratios to average net assets/supplemental data: | |||
Net assets, end of period (in 000’s) | $ 19,396 | $ 10,213 | |
Ratio of total expenses to average net assets | 0.70% | 0.70% (c) | |
Ratio of net investment income (loss) to average net assets | 2.10% | 1.29% (c) | |
Portfolio turnover rate (d) | 77% | 23% |
| (a) | Inception date is December 15, 2020, which is consistent with the commencement of investment operations and is the date the initial creation units were established. |
| (b) | Total return is calculated assuming an initial investment made at the net asset value at the beginning of the period, reinvestment of all distributions at net asset value during the period, and redemption at net asset value on the last day of the period. The returns presented do not reflect the deduction of taxes that a shareholder would pay on Fund distributions or the redemption or sale of Fund shares. Total return is calculated for the time period presented and is not annualized for periods of less than a year. |
| (c) | Annualized. |
| (d) | Portfolio turnover is calculated for the time period presented and is not annualized for periods of less than a year and does not include securities received or delivered from processing creations or redemptions and in-kind transactions. |
| Fund | Index |
| First Trust NASDAQ Technology Dividend Index Fund Multi-Asset Diversified Income Index Fund First Trust S&P International Dividend Aristocrats ETF First Trust Rising Dividend Achievers ETF First Trust Dorsey Wright Focus 5 ETF First Trust RBA American Industrial Renaissance® ETF First Trust Dorsey Wright Momentum & Dividend ETF First Trust Dorsey Wright International Focus 5 ETF First Trust Dorsey Wright Dynamic Focus 5 ETF First Trust Indxx Innovative Transaction & Process ETF First Trust Nasdaq Artificial Intelligence and Robotics ETF First Trust International Developed Capital Strength ETF | Nasdaq Technology Dividend IndexTM Nasdaq US Multi-Asset Diversified Income IndexSM S&P International Dividend Aristocrats Index Nasdaq US Rising Dividend AchieversTM Index Dorsey Wright Focus FiveTM Index Richard Bernstein Advisors American Industrial Renaissance® Index Dorsey Wright Momentum Plus Dividend YieldTM Index Dorsey Wright International Focus FiveTM Index Dorsey Wright Dynamic Focus FiveTM Index Indxx Blockchain Index Nasdaq CTA Artificial Intelligence and Robotics IndexSM The International Developed Capital Strength IndexSM |
| 1) | the credit conditions in the relevant market and changes thereto; |
| 2) | the liquidity conditions in the relevant market and changes thereto; |
| 3) | the interest rate conditions in the relevant market and changes thereto (such as significant changes in interest rates); |
| 4) | issuer-specific conditions (such as significant credit deterioration); and |
| 5) | any other market-based data the Advisor’s Pricing Committee considers relevant. In this regard, the Advisor’s Pricing Committee may use last-obtained market-based data to assist it when valuing portfolio securities using amortized cost. |
| 1) | the last sale price on the exchange on which they are principally traded or, for Nasdaq and AIM securities, the official closing price; |
| 2) | the type of security; |
| 3) | the size of the holding; |
| 4) | the initial cost of the security; |
| 5) | transactions in comparable securities; |
| 6) | price quotes from dealers and/or third-party pricing services; |
| 7) | relationships among various securities; |
| 8) | information obtained by contacting the issuer, analysts, or the appropriate stock exchange; |
| 9) | an analysis of the issuer’s financial statements; |
| 10) | the existence of merger proposals or tender offers that might affect the value of the security; and |
| 11) | other relevant factors. |
| 1) | the value of similar foreign securities traded on other foreign markets; |
| 2) | ADR trading of similar securities; |
| 3) | closed-end fund or exchange-traded fund trading of similar securities; |
| 4) | foreign currency exchange activity; |
| 5) | the trading prices of financial products that are tied to baskets of foreign securities; |
| 6) | factors relating to the event that precipitated the pricing problem; |
| 7) | whether the event is likely to recur; |
| 8) | whether the effects of the event are isolated or whether they affect entire markets, countries or regions; and |
| 9) | other relevant factors. |
| • | Level 1 – Level 1 inputs are quoted prices in active markets for identical investments. An active market is a market in which transactions for the investment occur with sufficient frequency and volume to provide pricing information on an ongoing basis. |
| • | Level 2 – Level 2 inputs are observable inputs, either directly or indirectly, and include the following: |
| o | Quoted prices for similar investments in active markets. |
| o | Quoted prices for identical or similar investments in markets that are non-active. A non-active market is a market where there are few transactions for the investment, the prices are not current, or price quotations vary substantially either over time or among market makers, or in which little information is released publicly. |
| o | Inputs other than quoted prices that are observable for the investment (for example, interest rates and yield curves observable at commonly quoted intervals, volatilities, prepayment speeds, loss severities, credit risks, and default rates). |
| o | Inputs that are derived principally from or corroborated by observable market data by correlation or other means. |
| • | Level 3 – Level 3 inputs are unobservable inputs. Unobservable inputs may reflect the reporting entity’s own assumptions about the assumptions that market participants would use in pricing the investment. |
| Security Name | Shares at 9/30/2022 | Value at 9/30/2021 | Purchases | Sales | Change in Unrealized Appreciation (Depreciation) | Realized Gain (Loss) | Value at 9/30/2022 | Dividend Income |
| First Trust Tactical High Yield ETF | 2,396,347 | $ 94,677,062 | $ 40,940,458 | $ (22,321,517) | $ (20,775,057) | $ (692,929) | $ 91,828,017 | $ 6,142,722 |
| Security Name | Shares at 9/30/2022 | Value at 9/30/2021 | Purchases | Sales | Change in Unrealized Appreciation (Depreciation) | Realized Gain (Loss) | Value at 9/30/2022 | Dividend Income | ||||||
| First Trust Consumer Discretionary AlphaDEX® Fund | — | $552,125,467 | $489,487,672 | $ (977,311,520) | $ (184,912,166) | $120,610,547 | $ — | $2,332,656 | ||||||
| First Trust Energy AlphaDEX® Fund | 37,233,368 | — | 726,588,423 | (140,809,237) | (449,929) | (4,116,382) | 581,212,875 | 9,631,857 | ||||||
| First Trust Industrials/Producer Durables AlphaDEX® Fund | 11,002,143 | 552,378,296 | 554,528,798 | (474,853,062) | (122,819,764) | (3,685,797) | 505,548,471 | 4,524,721 | ||||||
| First Trust Materials AlphaDEX® Fund | 8,230,205 | — | 756,865,736 | (197,537,048) | (128,236,435) | (4,191,520) | 426,900,733 | 5,632,668 | ||||||
| First Trust Nasdaq Food & Beverage ETF | 21,438,168 | — | 622,090,618 | (18,971,846) | (69,879,781) | (714,898) | 532,524,093 | 3,715,674 | ||||||
| First Trust Nasdaq Oil & Gas ETF | 22,047,884 | — | 1,123,919,311 | (693,393,430) | 76,138,600 | 34,611,071 | 541,275,552 | 9,808,801 | ||||||
| First Trust Nasdaq Transportation ETF | — | 513,660,400 | 362,824,428 | (857,633,271) | (111,437,489) | 92,585,932 | — | 1,240,830 | ||||||
| First Trust NASDAQ-100-Technology Sector Index Fund | — | 545,036,466 | 347,535,180 | (816,886,894) | (340,249,141) | 264,564,389 | — | 41,431 | ||||||
| First Trust Technology AlphaDEX® Fund | — | 528,789,844 | 126,483,451 | (684,609,978) | (288,506,301) | 317,842,984 | — | — | ||||||
| $2,691,990,473 | $5,110,323,617 | $(4,862,006,286) | $(1,170,352,406) | $817,506,326 | $2,587,461,724 | $36,928,638 |
| Security Name | Shares at 9/30/2022 | Value at 9/30/2021 | Purchases | Sales | Change in Unrealized Appreciation (Depreciation) | Realized Gain (Loss) | Value at 9/30/2022 | Dividend Income | ||||||
| First Trust BICK Index Fund | 1,148,699 | $ 52,406,007 | $ 30,335,962 | $ (54,810,146) | $ (9,225,736) | $ 8,541,053 | $ 27,247,140 | $ 48,538 | ||||||
| First Trust Chindia ETF | 788,140 | — | 32,950,175 | (2,490,543) | (3,006,866) | 53,320 | 27,506,086 | 46,949 | ||||||
| First Trust Dow Jones Global Select Dividend Index Fund | 1,455,665 | — | 41,756,094 | (4,815,221) | (9,493,741) | (459,103) | 26,988,029 | 1,272,651 | ||||||
| First Trust Eurozone AlphaDEX® Fund | — | — | 54,095,628 | (48,158,214) | — | (5,937,414) | — | 280,215 | ||||||
| First Trust Germany AlphaDEX® Fund | — | 52,146,239 | 1,776,695 | (46,009,598) | (6,627,154) | (1,286,182) | — | 146,489 | ||||||
| First Trust India NIFTY 50 Equal Weight ETF | 691,061 | 57,888,541 | 635,412 | (23,785,798) | (7,879,085) | 2,739,073 | 29,598,143 | 1,666,894 | ||||||
| First Trust Latin America AlphaDEX® Fund | 1,765,963 | — | 42,270,056 | (6,550,570) | (7,315,963) | (730,883) | 27,672,640 | 1,371,007 | ||||||
| First Trust Switzerland AlphaDEX® Fund | — | 50,668,510 | 1,607,980 | (44,869,379) | (10,736,246) | 3,329,135 | — | 240,132 | ||||||
| First Trust United Kingdom AlphaDEX® Fund | — | 51,626,570 | 4,221,806 | (43,503,919) | 3,024,861 | (15,369,318) | — | 1,372,925 | ||||||
| $264,735,867 | $209,649,808 | $(274,993,388) | $(51,259,930) | $(9,120,319) | $139,012,038 | $6,445,800 |
| Security Name | Shares at 9/30/2022 | Value at 9/30/2021 | Purchases | Sales | Change in Unrealized Appreciation (Depreciation) | Realized Gain (Loss) | Value at 9/30/2022 | Dividend Income | ||||||
| First Trust Consumer Discretionary AlphaDEX® Fund | — | $43,565,016 | $37,286,547 | $ (75,949,685) | $ (15,174,892) | $10,273,014 | $ — | $178,597 | ||||||
| First Trust Energy AlphaDEX® Fund | 2,000,658 | — | 71,385,000 | (40,927,478) | (94,476) | 867,225 | 31,230,271 | 498,208 | ||||||
| First Trust Enhanced Short Maturity ETF | 1,539,755 | — | 157,866,525 | (66,124,344) | (257,253) | (146,661) | 91,338,267 | 681,203 | ||||||
| First Trust Industrials/Producer Durables AlphaDEX® Fund | 591,177 | 43,584,937 | 55,819,497 | (64,677,952) | (7,174,983) | (386,916) | 27,164,583 | 270,838 | ||||||
| First Trust Materials AlphaDEX® Fund | 442,231 | — | 71,268,328 | (42,348,912) | (5,308,534) | (672,360) | 22,938,522 | 287,735 | ||||||
| First Trust Nasdaq Food & Beverage ETF | 1,151,936 | — | 62,524,664 | (29,924,196) | (2,899,246) | (1,087,132) | 28,614,090 | 174,632 | ||||||
| First Trust Nasdaq Oil & Gas ETF | 1,184,694 | — | 99,553,465 | (81,550,151) | 3,002,389 | 8,078,535 | 29,084,238 | 540,837 | ||||||
| First Trust Nasdaq Transportation ETF | — | 40,529,967 | 26,751,967 | (65,960,213) | (9,206,661) | 7,884,940 | — | 95,330 | ||||||
| First Trust NASDAQ-100-Technology Sector Index Fund | — | 43,005,865 | 25,610,473 | (62,900,115) | (14,879,858) | 9,163,635 | — | 3,183 | ||||||
| First Trust Technology AlphaDEX® Fund | — | 41,724,071 | 9,483,887 | (53,543,678) | (15,497,908) | 17,833,628 | — | — | ||||||
| $212,409,856 | $617,550,353 | $(583,906,724) | $(67,491,422) | $51,807,908 | $230,369,971 | $2,730,563 |
| Distributions paid from Ordinary Income | Distributions paid from Capital Gains | Distributions paid from Return of Capital | |||
First Trust NASDAQ Technology Dividend Index Fund | $ 37,869,712 | $ — | $ — | ||
Multi-Asset Diversified Income Index Fund | 28,972,326 | — | 634,126 | ||
First Trust S&P International Dividend Aristocrats ETF | 2,134,072 | — | — | ||
First Trust BuyWrite Income ETF | 4,161,738 | — | — | ||
First Trust Nasdaq BuyWrite Income ETF | 627,504 | — | 260,249 | ||
First Trust Rising Dividend Achievers ETF | 140,979,372 | — | — | ||
First Trust Dorsey Wright Focus 5 ETF | 27,189,651 | — | — | ||
First Trust RBA American Industrial Renaissance® ETF | 131,850 | — | — | ||
First Trust Dorsey Wright Momentum & Dividend ETF | 1,904,422 | — | — | ||
First Trust Dorsey Wright International Focus 5 ETF | 5,794,666 | — | — | ||
First Trust Dorsey Wright Dynamic Focus 5 ETF | 1,833,976 | — | — | ||
First Trust Indxx Innovative Transaction & Process ETF | 3,919,682 | — | — | ||
First Trust Nasdaq Artificial Intelligence and Robotics ETF | 369,695 | — | — | ||
First Trust International Developed Capital Strength ETF | 503,611 | — | — |
| Distributions paid from Ordinary Income | Distributions paid from Capital Gains | Distributions paid from Return of Capital | |||
First Trust NASDAQ Technology Dividend Index Fund | $ 29,861,800 | $ — | $ — | ||
Multi-Asset Diversified Income Index Fund | 18,794,700 | — | 6,052,472 | ||
First Trust S&P International Dividend Aristocrats ETF | 1,317,871 | — | — | ||
First Trust BuyWrite Income ETF | 2,535,233 | — | — | ||
First Trust Nasdaq BuyWrite Income ETF | 228,251 | — | — | ||
First Trust Rising Dividend Achievers ETF | 44,959,526 | — | — | ||
First Trust Dorsey Wright Focus 5 ETF | 1,159,345 | — | — | ||
First Trust RBA American Industrial Renaissance® ETF | 68,330 | — | — | ||
First Trust Dorsey Wright Momentum & Dividend ETF | 903,831 | — | — | ||
First Trust Dorsey Wright International Focus 5 ETF | 2,584,930 | — | — | ||
First Trust Dorsey Wright Dynamic Focus 5 ETF | 67,710 | — | — | ||
First Trust Indxx Innovative Transaction & Process ETF | 1,414,166 | — | — | ||
First Trust Nasdaq Artificial Intelligence and Robotics ETF | 333,100 | — | — | ||
First Trust International Developed Capital Strength ETF | 39,101 | — | — |
| Undistributed Ordinary Income | Accumulated Capital and Other Gain (Loss) | Net Unrealized Appreciation (Depreciation) | |||
First Trust NASDAQ Technology Dividend Index Fund | $ 3,501,257 | $ (208,783,575) | $ (204,387,577) | ||
Multi-Asset Diversified Income Index Fund | — | (226,942,167) | (50,345,965) | ||
First Trust S&P International Dividend Aristocrats ETF | 164,542 | (5,293,852) | (11,563,360) | ||
First Trust BuyWrite Income ETF | — | (18,375,410) | (9,220,265) | ||
First Trust Nasdaq BuyWrite Income ETF | — | (2,123,105) | (2,620,426) | ||
First Trust Rising Dividend Achievers ETF | 15,703,375 | (149,050,822) | (1,798,807,954) | ||
First Trust Dorsey Wright Focus 5 ETF | 1,291,405 | (579,723,679) | (201,997,496) | ||
First Trust RBA American Industrial Renaissance® ETF | 142,573 | (33,161,068) | (22,256,509) | ||
First Trust Dorsey Wright Momentum & Dividend ETF | 221,298 | (23,321,490) | (10,864,363) | ||
First Trust Dorsey Wright International Focus 5 ETF | 81,382 | (144,990,579) | (22,207,775) | ||
First Trust Dorsey Wright Dynamic Focus 5 ETF | 222,818 | (60,339,002) | (10,572,639) | ||
First Trust Indxx Innovative Transaction & Process ETF | 115,148 | (4,605,254) | (27,416,714) | ||
First Trust Nasdaq Artificial Intelligence and Robotics ETF | 319,975 | (23,210,981) | (76,034,434) | ||
First Trust International Developed Capital Strength ETF | 20,290 | (1,161,324) | (5,722,985) |
| Non-Expiring Capital Loss Carryforward | |
First Trust NASDAQ Technology Dividend Index Fund | $ 208,783,575 |
Multi-Asset Diversified Income Index Fund | 226,942,167 |
First Trust S&P International Dividend Aristocrats ETF | 5,293,852 |
First Trust BuyWrite Income ETF | 18,375,410 |
First Trust Nasdaq BuyWrite Income ETF | 2,123,105 |
First Trust Rising Dividend Achievers ETF | 149,050,822 |
First Trust Dorsey Wright Focus 5 ETF | 579,723,679 |
First Trust RBA American Industrial Renaissance® ETF | 33,161,068 |
First Trust Dorsey Wright Momentum & Dividend ETF | 23,321,490 |
First Trust Dorsey Wright International Focus 5 ETF | 144,990,579 |
First Trust Dorsey Wright Dynamic Focus 5 ETF | 60,339,002 |
First Trust Indxx Innovative Transaction & Process ETF | 4,605,254 |
First Trust Nasdaq Artificial Intelligence and Robotics ETF | 23,210,981 |
First Trust International Developed Capital Strength ETF | 1,161,324 |
| Accumulated Net Investment Income (Loss) | Accumulated Net Realized Gain (Loss) on Investments | Paid-in Capital | |||
First Trust NASDAQ Technology Dividend Index Fund | $ 242 | $ (160,295,622) | $ 160,295,380 | ||
Multi-Asset Diversified Income Index Fund | 3,354,116 | (6,332,597) | 2,978,481 | ||
First Trust S&P International Dividend Aristocrats ETF | (30,711) | (131,854) | 162,565 | ||
First Trust BuyWrite Income ETF | 3,757,034 | (497,007) | (3,260,027) | ||
First Trust Nasdaq BuyWrite Income ETF | 595,956 | (238,796) | (357,160) | ||
First Trust Rising Dividend Achievers ETF | — | (408,145,911) | 408,145,911 | ||
First Trust Dorsey Wright Focus 5 ETF | — | (871,252,353) | 871,252,353 | ||
First Trust RBA American Industrial Renaissance® ETF | — | (18,596,820) | 18,596,820 | ||
First Trust Dorsey Wright Momentum & Dividend ETF | — | (5,165,221) | 5,165,221 | ||
First Trust Dorsey Wright International Focus 5 ETF | — | (4,556,264) | 4,556,264 | ||
First Trust Dorsey Wright Dynamic Focus 5 ETF | — | (50,177,178) | 50,177,178 | ||
First Trust Indxx Innovative Transaction & Process ETF | (56,271) | (2,088,490) | 2,144,761 | ||
First Trust Nasdaq Artificial Intelligence and Robotics ETF | 305,363 | (16,580,301) | 16,274,938 | ||
First Trust International Developed Capital Strength ETF | 10,057 | 782,557 | (792,614) |
| Tax Cost | Gross Unrealized Appreciation | Gross Unrealized (Depreciation) | Net Unrealized Appreciation (Depreciation) | ||||
First Trust NASDAQ Technology Dividend Index Fund | $ 1,631,544,912 | $ 79,409,827 | $ (283,797,404) | $ (204,387,577) | |||
Multi-Asset Diversified Income Index Fund | 492,887,606 | 14,669,020 | (65,014,985) | (50,345,965) | |||
First Trust S&P International Dividend Aristocrats ETF | 55,057,084 | 594,676 | (12,137,237) | (11,542,561) | |||
First Trust BuyWrite Income ETF | 97,387,126 | 1,067,506 | (10,287,756) | (9,220,250) | |||
First Trust Nasdaq BuyWrite Income ETF | 20,987,563 | 182,297 | (2,802,723) | (2,620,426) | |||
First Trust Rising Dividend Achievers ETF | 9,073,482,529 | 85,689,108 | (1,884,497,062) | (1,798,807,954) | |||
First Trust Dorsey Wright Focus 5 ETF | 2,789,459,220 | 76,027,272 | (278,024,768) | (201,997,496) | |||
First Trust RBA American Industrial Renaissance® ETF | 192,152,537 | 8,747,973 | (31,004,482) | (22,256,509) | |||
First Trust Dorsey Wright Momentum & Dividend ETF | 77,531,607 | 499,783 | (11,364,146) | (10,864,363) | |||
First Trust Dorsey Wright International Focus 5 ETF | 161,219,813 | 538,507 | (22,746,282) | (22,207,775) | |||
First Trust Dorsey Wright Dynamic Focus 5 ETF | 240,942,610 | 2,891,695 | (13,464,334) | (10,572,639) | |||
First Trust Indxx Innovative Transaction & Process ETF | 128,015,310 | 1,775,980 | (29,188,661) | (27,412,681) | |||
First Trust Nasdaq Artificial Intelligence and Robotics ETF | 254,404,770 | 5,374,643 | (81,396,583) | (76,021,940) | |||
First Trust International Developed Capital Strength ETF | 25,064,190 | 13,128 | (5,731,023) | (5,717,895) |
| Fund | Licensor |
| First Trust NASDAQ Technology Dividend Index Fund | Nasdaq, Inc. |
| Multi-Asset Diversified Income Index Fund | Nasdaq, Inc. |
| First Trust S&P International Dividend Aristocrats ETF | S&P Dow Jones Indices, LLC |
| First Trust Rising Dividend Achievers ETF | Nasdaq, Inc. |
| First Trust Dorsey Wright Focus 5 ETF | Dorsey, Wright & Associates, LLC |
| First Trust RBA American Industrial Renaissance® ETF | Richard Bernstein Advisors LLC |
| First Trust Dorsey Wright Momentum & Dividend ETF | Nasdaq, Inc. |
| First Trust Dorsey Wright International Focus 5 ETF | Dorsey, Wright & Associates, LLC |
| First Trust Dorsey Wright Dynamic Focus 5 ETF | Dorsey, Wright & Associates, LLC |
| First Trust Indxx Innovative Transaction & Process ETF | Indxx Inc. |
| First Trust Nasdaq Artificial Intelligence and Robotics ETF | Nasdaq, Inc. |
| First Trust International Developed Capital Strength ETF | Nasdaq, Inc. |
| Rate | |
| First Trust NASDAQ Technology Dividend Index Fund | 0.50% |
| Multi-Asset Diversified Income Index Fund | 0.60% |
| First Trust S&P International Dividend Aristocrats ETF | 0.60% |
| First Trust BuyWrite Income ETF | 0.85% |
| First Trust Nasdaq BuyWrite Income ETF | 0.85% |
| First Trust Rising Dividend Achievers ETF | 0.50% |
| First Trust Dorsey Wright Focus 5 ETF | 0.30% |
| First Trust RBA American Industrial Renaissance® ETF | 0.70% |
| First Trust Dorsey Wright Momentum & Dividend ETF | 0.60% |
| First Trust Dorsey Wright International Focus 5 ETF | 0.30% |
| First Trust Dorsey Wright Dynamic Focus 5 ETF | 0.30% |
| First Trust Indxx Innovative Transaction & Process ETF | 0.65% |
| First Trust Nasdaq Artificial Intelligence and Robotics ETF | 0.65% |
| First Trust International Developed Capital Strength ETF | 0.70% |
| Purchases | Sales | ||
| First Trust NASDAQ Technology Dividend Index Fund | $ 616,115,477 | $ 612,999,941 | |
| Multi-Asset Diversified Income Index Fund | 402,578,657 | 400,871,685 | |
| First Trust S&P International Dividend Aristocrats ETF | 24,601,157 | 22,959,637 | |
| First Trust BuyWrite Income ETF | 48,589,467 | 50,792,045 | |
| First Trust Nasdaq BuyWrite Income ETF | 12,875,068 | 12,938,229 | |
| First Trust Rising Dividend Achievers ETF | 4,790,829,622 | 4,780,696,286 | |
| First Trust Dorsey Wright Focus 5 ETF | 2,272,871,425 | 2,281,398,606 | |
| First Trust RBA American Industrial Renaissance® ETF | 79,611,672 | 79,011,781 | |
| First Trust Dorsey Wright Momentum & Dividend ETF | 110,797,167 | 110,261,522 | |
| First Trust Dorsey Wright International Focus 5 ETF | 207,120,095 | 207,042,064 | |
| First Trust Dorsey Wright Dynamic Focus 5 ETF | 367,185,448 | 367,269,130 | |
| First Trust Indxx Innovative Transaction & Process ETF | 32,029,319 | 30,937,774 | |
| First Trust Nasdaq Artificial Intelligence and Robotics ETF | 103,592,862 | 86,390,542 | |
| First Trust International Developed Capital Strength ETF | 17,830,154 | 17,929,177 | |
| Purchases | Sales | ||
| First Trust NASDAQ Technology Dividend Index Fund | $ 583,961,573 | $ 343,724,649 | |
| Multi-Asset Diversified Income Index Fund | 135,918,665 | 98,183,758 | |
| First Trust S&P International Dividend Aristocrats ETF | 15,707,014 | 3,024,900 | |
| First Trust BuyWrite Income ETF | 59,226,782 | 2,148,878 | |
| First Trust Nasdaq BuyWrite Income ETF | 15,186,927 | 3,007,749 | |
| First Trust Rising Dividend Achievers ETF | 5,941,936,015 | 2,490,251,103 | |
| First Trust Dorsey Wright Focus 5 ETF | 2,837,452,192 | 2,580,607,680 | |
| First Trust RBA American Industrial Renaissance® ETF | 67,375,750 | 102,388,655 | |
| First Trust Dorsey Wright Momentum & Dividend ETF | 79,064,435 | 38,451,634 | |
| First Trust Dorsey Wright International Focus 5 ETF | 2,529,713 | 67,951,324 | |
| First Trust Dorsey Wright Dynamic Focus 5 ETF | 250,364,905 | 216,637,594 | |
| First Trust Indxx Innovative Transaction & Process ETF | 21,472,250 | 12,690,709 | |
| First Trust Nasdaq Artificial Intelligence and Robotics ETF | 47,186,813 | 50,794,243 | |
| First Trust International Developed Capital Strength ETF | 31,745,144 | 14,884,394 |
| Asset Derivatives | Liability Derivatives | |||||||||
| Derivative Instrument | Risk Exposure | Statements of Assets and Liabilities Location | Value | Statements of Assets and Liabilities Location | Value | |||||
| Options | Equity Risk | — | $ — | Options written, at value | $ 79,346 | |||||
| Asset Derivatives | Liability Derivatives | |||||||||
| Derivative Instrument | Risk Exposure | Statements of Assets and Liabilities Location | Value | Statements of Assets and Liabilities Location | Value | |||||
| Options | Equity Risk | — | $ — | Options written, at value | $ 73,507 | |||||
| Equity Risk | ||
| Statements of Operations Location | FTHI | FTQI |
| Net realized gain (loss) on Purchased options contracts | $— | $(31,942) |
| Net realized gain (loss) on Written options contracts | 1,445,968 | 575,553 |
| Net change in unrealized gain (loss) on Purchased options contracts | — | 21,726 |
| Net change in unrealized gain (loss) on Written options contracts | 1,399,627 | 293,184 |
| Individual Funds Included in the Trust | Statements of Changes in Net Assets | Financial Highlights |
| First Trust NASDAQ Technology Dividend Index Fund | For the years ended September 30, 2022 and 2021 | For the years ended September 30, 2022, 2021, 2020, 2019 and 2018 |
| Multi-Asset Diversified Income Index Fund | ||
| First Trust S&P International Dividend Aristocrats ETF | ||
| First Trust BuyWrite Income ETF | ||
| First Trust Nasdaq BuyWrite Income ETF (formerly known as First Trust Hedged BuyWrite Income ETF) | ||
| First Trust Rising Dividend Achievers ETF | ||
| First Trust Dorsey Wright Focus 5 ETF | ||
| First Trust RBA American Industrial Renaissance® ETF | ||
| First Trust Dorsey Wright Momentum & Dividend ETF | ||
| First Trust Dorsey Wright International Focus 5 ETF | ||
| First Trust Dorsey Wright Dynamic Focus 5 ETF | ||
| First Trust Indxx Innovative Transaction & Process ETF | For the years ended September 30, 2022 and 2021 | For the years ended September 30, 2022, 2021, 2020, 2019 and for the period from January 24, 2018 (commencement of operations) through September 30, 2018 |
| First Trust Nasdaq Artificial Intelligence and Robotics ETF | For the years ended September 30, 2022 and 2021 | For the years ended September 30, 2022, 2021, 2020, 2019 and for the period from February 21, 2018 (commencement of operations) through September 30, 2018 |
| First Trust International Developed Capital Strength ETF | For the year ended September 30, 2022 and for the period from December 15, 2020 (commencement of operations) through September 30, 2021 | |

| Dividends Received Deduction | |
First Trust NASDAQ Technology Dividend Index Fund | 100.00% |
Multi-Asset Diversified Income Index Fund | 30.08% |
First Trust S&P International Dividend Aristocrats ETF | 0.00% |
First Trust BuyWrite Income ETF | 19.08% |
First Trust Nasdaq BuyWrite Income ETF | 19.25% |
First Trust Rising Dividend Achievers ETF | 100.00% |
First Trust Dorsey Wright Focus 5 ETF | ** |
First Trust RBA American Industrial Renaissance® ETF | 100.00% |
First Trust Dorsey Wright Momentum & Dividend ETF | 65.29% |
First Trust Dorsey Wright International Focus 5 ETF | ** |
First Trust Dorsey Wright Dynamic Focus 5 ETF | ** |
First Trust Indxx Innovative Transaction & Process ETF | 19.63% |
First Trust Nasdaq Artificial Intelligence and Robotics ETF | 69.13% |
First Trust International Developed Capital Strength ETF | 0.00% |
| Qualified Dividend Income | |
First Trust NASDAQ Technology Dividend Index Fund | 100.00% |
Multi-Asset Diversified Income Index Fund | 29.85% |
First Trust S&P International Dividend Aristocrats ETF | 87.45% |
First Trust BuyWrite Income ETF | 18.22% |
First Trust Nasdaq BuyWrite Income ETF | 19.74% |
First Trust Rising Dividend Achievers ETF | 100.00% |
First Trust Dorsey Wright Focus 5 ETF | ** |
First Trust RBA American Industrial Renaissance® ETF | 100.00% |
First Trust Dorsey Wright Momentum & Dividend ETF | 71.95% |
First Trust Dorsey Wright International Focus 5 ETF | ** |
First Trust Dorsey Wright Dynamic Focus 5 ETF | ** |
First Trust Indxx Innovative Transaction & Process ETF | 100.00% |
First Trust Nasdaq Artificial Intelligence and Robotics ETF | 100.00% |
First Trust International Developed Capital Strength ETF | 100.00% |
| Gross Foreign Income | Foreign Taxes Paid | ||||||
| Amount | Per Share | Amount | Per Share | ||||
First Trust S&P International Dividend Aristocrats ETF | $ 2,766,582 | $ 0.86 | $ 263,783 | $ 0.08 | |||
First Trust Indxx Innovative Transaction & Process ETF | 4,087,700 | 1.24 | 356,094 | 0.11 | |||
First Trust International Developed Capital Strength ETF | 745,941 | 0.99 | 74,196 | 0.10 | |||
| NOT FDIC INSURED | NOT BANK GUARANTEED | MAY LOSE VALUE |
| Name, Year of Birth and Position with the Trust | Term of Office and Year First Elected or Appointed | Principal Occupations During Past 5 Years | Number of Portfolios in the First Trust Fund Complex Overseen by Trustee | Other Trusteeships or Directorships Held by Trustee During Past 5 Years |
| INDEPENDENT TRUSTEES | ||||
| Richard E. Erickson, Trustee (1951) | • Indefinite Term • Since Inception | Physician, Edward-Elmhurst Medical Group; Physician and Officer, Wheaton Orthopedics (1990 to 2021) | 221 | None |
| Thomas R. Kadlec, Trustee (1957) | • Indefinite Term • Since Inception | Retired; President, ADM Investor Services, Inc. (Futures Commission Merchant) (2010 to July 2022) | 221 | Director, National Futures Association and ADMIS Singapore Ltd.; Formerly, Director of ADM Investor Services, Inc., ADM Investor Services International, ADMIS Hong Kong Ltd., and Futures Industry Association |
| Denise M. Keefe, Trustee (1964) | • Indefinite Term • Since 2021 | Executive Vice President, Advocate Aurora Health and President, Advocate Aurora Continuing Health Division (Integrated Healthcare System) | 221 | Director and Board Chair of Advocate Home Health Services, Advocate Home Care Products and Advocate Hospice; Director and Board Chair of Aurora At Home (since 2018); Director of Advocate Physician Partners Accountable Care Organization; Director and Board Chair of RML Long Term Acute Care Hospitals; and Director of Senior Helpers (since 2021) |
| Robert F. Keith, Trustee (1956) | • Indefinite Term • Since Inception | President, Hibs Enterprises (Financial and Management Consulting) | 221 | Formerly, Director of Trust Company of Illinois |
| Niel B. Nielson, Trustee (1954) | • Indefinite Term • Since Inception | Senior Advisor (2018 to Present), Managing Director and Chief Operating Officer (2015 to 2018), Pelita Harapan Educational Foundation (Educational Products and Services) | 221 | None |
| INTERESTED TRUSTEE | ||||
| James A. Bowen(1), Trustee and Chairman of the Board (1955) | • Indefinite Term • Since Inception | Chief Executive Officer, First Trust Advisors L.P. and First Trust Portfolios L.P.; Chairman of the Board of Directors, BondWave LLC (Software Development Company) and Stonebridge Advisors LLC (Investment Advisor) | 221 | None |
| (1) | Mr. Bowen is deemed an “interested person” of the Trust due to his position as CEO of First Trust Advisors L.P., investment advisor of the Trust. |
| Name and Year of Birth | Position and Offices with Trust | Term of Office and Length of Service | Principal Occupations During Past 5 Years |
| OFFICERS(2) | |||
| James M. Dykas (1966) | President and Chief Executive Officer | • Indefinite Term • Since 2016 | Managing Director and Chief Financial Officer, First Trust Advisors L.P. and First Trust Portfolios L.P.; Chief Financial Officer, BondWave LLC (Software Development Company) and Stonebridge Advisors LLC (Investment Advisor) |
| Donald P. Swade (1972) | Treasurer, Chief Financial Officer and Chief Accounting Officer | • Indefinite Term • Since 2016 | Senior Vice President, First Trust Advisors L.P. and First Trust Portfolios L.P. |
| W. Scott Jardine (1960) | Secretary and Chief Legal Officer | • Indefinite Term • Since Inception | General Counsel, First Trust Advisors L.P. and First Trust Portfolios L.P.; Secretary and General Counsel, BondWave LLC; Secretary, Stonebridge Advisors LLC |
| Daniel J. Lindquist (1970) | Vice President | • Indefinite Term • Since Inception | Managing Director, First Trust Advisors L.P. and First Trust Portfolios L.P. |
| Kristi A. Maher (1966) | Chief Compliance Officer and Assistant Secretary | • Indefinite Term • Since Inception | Deputy General Counsel, First Trust Advisors L.P. and First Trust Portfolios L.P. |
| Roger F. Testin (1966) | Vice President | • Indefinite Term • Since Inception | Senior Vice President, First Trust Advisors L.P. and First Trust Portfolios L.P. |
| Stan Ueland (1970) | Vice President | • Indefinite Term • Since Inception | Senior Vice President, First Trust Advisors L.P. and First Trust Portfolios L.P. |
| (2) | The term “officer” means the president, vice president, secretary, treasurer, controller or any other officer who performs a policy making function. |
| • | Information we receive from you and your broker-dealer, investment professional or financial representative through interviews, applications, agreements or other forms; |
| • | Information about your transactions with us, our affiliates or others; |
| • | Information we receive from your inquiries by mail, e-mail or telephone; and |
| • | Information we collect on our website through the use of “cookies.” For example, we may identify the pages on our website that your browser requests or visits. |
| • | In order to provide you with products and services and to effect transactions that you request or authorize, we may disclose your personal information as described above to unaffiliated financial service providers and other companies that perform administrative or other services on our behalf, such as transfer agents, custodians and trustees, or that assist us in the distribution of investor materials such as trustees, banks, financial representatives, proxy services, solicitors and printers. |
| • | We may release information we have about you if you direct us to do so, if we are compelled by law to do so, or in other legally limited circumstances (for example to protect your account from fraud). |
FUND ACCOUNTANT &
TRANSFER AGENT
PUBLIC ACCOUNTING FIRM

Book 2
First Trust SMID Cap Rising Dividend Achievers ETF (SDVY)
First Trust Dorsey Wright Momentum & Value ETF (DVLU)
First Trust Dorsey Wright Momentum & Low Volatility ETF (DVOL)
For the Year Ended
September 30, 2022
| 2 | |
| 3 | |
| Fund Performance Overview | |
| 4 | |
| 6 | |
| 8 | |
| 10 | |
| 11 | |
| Portfolio of Investments | |
| 12 | |
| 15 | |
| 17 | |
| 19 | |
| 20 | |
| 22 | |
| 24 | |
| 27 | |
| 34 | |
| 35 | |
| 41 | |
| 43 |


| Performance | |||
| Average Annual Total Returns | Cumulative Total Returns | ||
| 1 Year Ended 9/30/22 | Inception (11/1/17) to 9/30/22 | Inception (11/1/17) to 9/30/22 | |
| Fund Performance | |||
| NAV | -16.78% | 4.72% | 25.41% |
| Market Price | -16.90% | 4.72% | 25.41% |
| Index Performance | |||
| Nasdaq US Small Mid Cap Rising Dividend Achievers™ Index | -16.36% | 5.34% | 29.13% |
| S&P 1000® Index | -16.35% | 5.31% | 28.94% |
| Sector Allocation | % of Total Investments |
| Financials | 28.8% |
| Consumer Discretionary | 23.8 |
| Industrials | 22.7 |
| Information Technology | 8.0 |
| Materials | 7.8 |
| Energy | 4.0 |
| Communication Services | 2.0 |
| Consumer Staples | 2.0 |
| Real Estate | 0.9 |
| Total | 100.0% |
| Top Ten Holdings | % of Total Investments |
| Landstar System, Inc. | 1.1% |
| Boise Cascade Co. | 1.1 |
| Texas Pacific Land Corp. | 1.1 |
| Allegion PLC | 1.1 |
| Robert Half International, Inc. | 1.1 |
| Mueller Industries, Inc. | 1.1 |
| Chord Energy Corp. | 1.1 |
| UFP Industries, Inc. | 1.0 |
| Sturm Ruger & Co., Inc. | 1.0 |
| EMCOR Group, Inc. | 1.0 |
| Total | 10.7% |
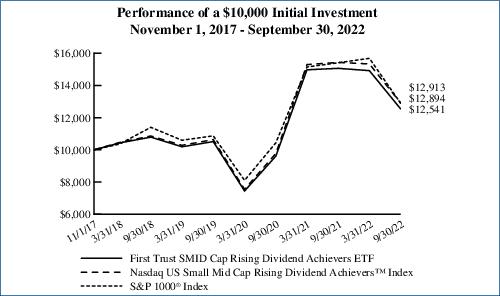
Performance figures assume reinvestment of all distributions and do not reflect the deduction of taxes that a shareholder would pay on Fund distributions or the redemption or sale of Fund shares. An index is a statistical composite that tracks a specified financial market or sector. Unlike the Fund, the indices do not actually hold a portfolio of securities and therefore do not incur the expenses incurred by the Fund. These expenses negatively impact the performance of the Fund. The Fund’s past performance does not predict future performance.
| Performance | |||
| Average Annual Total Returns | Cumulative Total Returns | ||
| 1 Year Ended 9/30/22 | Inception (9/5/18) to 9/30/22 | Inception (9/5/18) to 9/30/22 | |
| Fund Performance | |||
| NAV | -11.71% | 2.16% | 9.09% |
| Market Price | -11.66% | 2.17% | 9.14% |
| Index Performance | |||
| Dorsey Wright Momentum Plus Value™ Index | -11.14% | 2.79% | 11.85% |
| S&P 500® Index | -15.47% | 7.31% | 33.25% |
| Sector Allocation | % of Total Investments |
| Financials | 36.8% |
| Consumer Discretionary | 15.5 |
| Industrials | 9.5 |
| Materials | 8.8 |
| Health Care | 8.2 |
| Information Technology | 5.6 |
| Energy | 5.0 |
| Consumer Staples | 4.9 |
| Utilities | 2.9 |
| Communication Services | 2.8 |
| Total | 100.0% |
| Top Ten Holdings | % of Total Investments |
| Unum Group | 3.7% |
| Jabil, Inc. | 3.2 |
| UFP Industries, Inc. | 3.1 |
| Reliance Steel & Aluminum Co. | 2.9 |
| MetLife, Inc. | 2.9 |
| NRG Energy, Inc. | 2.9 |
| Nexstar Media Group, Inc. | 2.8 |
| McKesson Corp. | 2.8 |
| Prudential Financial, Inc. | 2.8 |
| American International Group, Inc. | 2.7 |
| Total | 29.8% |
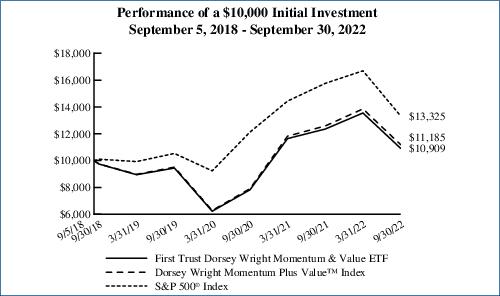
Performance figures assume reinvestment of all distributions and do not reflect the deduction of taxes that a shareholder would pay on Fund distributions or the redemption or sale of Fund shares. An index is a statistical composite that tracks a specified financial market or sector. Unlike the Fund, the indices do not actually hold a portfolio of securities and therefore do not incur the expenses incurred by the Fund. These expenses negatively impact the performance of the Fund. The Fund’s past performance does not predict future performance.
| Performance | |||
| Average Annual Total Returns | Cumulative Total Returns | ||
| 1 Year Ended 9/30/22 | Inception (9/5/18) to 9/30/22 | Inception (9/5/18) to 9/30/22 | |
| Fund Performance | |||
| NAV | -12.02% | 5.70% | 25.28% |
| Market Price | -11.94% | 5.72% | 25.38% |
| Index Performance | |||
| Dorsey Wright Momentum Plus Low Volatility™ Index | -11.49% | 6.37% | 28.55% |
| S&P 500® Index | -15.47% | 7.31% | 33.25% |
| Sector Allocation | % of Total Investments |
| Financials | 24.6% |
| Industrials | 19.6 |
| Real Estate | 14.8 |
| Utilities | 12.2 |
| Health Care | 11.6 |
| Information Technology | 6.5 |
| Consumer Staples | 5.6 |
| Consumer Discretionary | 3.0 |
| Materials | 1.1 |
| Energy | 1.0 |
| Total | 100.0% |
| Top Ten Holdings | % of Total Investments |
| Waste Management, Inc. | 3.2% |
| Republic Services, Inc. | 3.1 |
| FirstEnergy Corp. | 3.0 |
| Ameren Corp. | 3.0 |
| McDonald’s Corp. | 3.0 |
| McKesson Corp. | 3.0 |
| AMETEK, Inc. | 2.9 |
| Constellation Brands, Inc., Class A | 2.9 |
| CenterPoint Energy, Inc. | 2.8 |
| Procter & Gamble (The) Co. | 2.7 |
| Total | 29.6% |
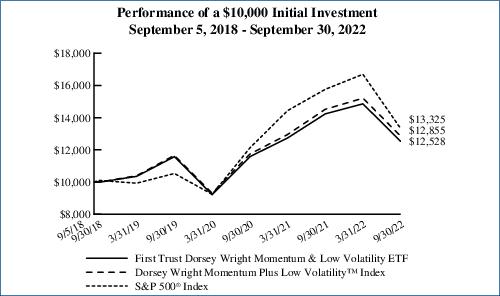
Performance figures assume reinvestment of all distributions and do not reflect the deduction of taxes that a shareholder would pay on Fund distributions or the redemption or sale of Fund shares. An index is a statistical composite that tracks a specified financial market or sector. Unlike the Fund, the indices do not actually hold a portfolio of securities and therefore do not incur the expenses incurred by the Fund. These expenses negatively impact the performance of the Fund. The Fund’s past performance does not predict future performance.
| Beginning Account Value April 1, 2022 | Ending Account Value September 30, 2022 | Annualized Expense Ratio Based on the Six-Month Period | Expenses Paid During the Six-Month Period (a) | |
| First Trust SMID Cap Rising Dividend Achievers ETF (SDVY) | ||||
| Actual | $1,000.00 | $840.30 | 0.60% | $2.77 |
| Hypothetical (5% return before expenses) | $1,000.00 | $1,022.06 | 0.60% | $3.04 |
| First Trust Dorsey Wright Momentum & Value ETF (DVLU) | ||||
| Actual | $1,000.00 | $805.10 | 0.60% | $2.72 |
| Hypothetical (5% return before expenses) | $1,000.00 | $1,022.06 | 0.60% | $3.04 |
| First Trust Dorsey Wright Momentum & Low Volatility ETF (DVOL) | ||||
| Actual | $1,000.00 | $843.00 | 0.60% | $2.77 |
| Hypothetical (5% return before expenses) | $1,000.00 | $1,022.06 | 0.60% | $3.04 |
| (a) | Expenses are equal to the annualized expense ratios as indicated in the table multiplied by the average account value over the period (April 1, 2022 through September 30, 2022), multiplied by 183/365 (to reflect the six-month period). |
| Shares | Description | Value | ||
| COMMON STOCKS – 99.8% | ||||
| Auto Components – 1.0% | ||||
| 254,321 | Standard Motor Products, Inc. | $8,265,433 | ||
| Banks – 12.0% | ||||
| 210,647 | Bank OZK | 8,333,195 | ||
| 237,101 | Citizens Financial Group, Inc. | 8,146,790 | ||
| 111,278 | Comerica, Inc. | 7,911,866 | ||
| 186,825 | Eagle Bancorp, Inc. | 8,373,496 | ||
| 120,292 | East West Bancorp, Inc. | 8,076,405 | ||
| 605,776 | First BanCorp | 8,287,016 | ||
| 328,512 | Hilltop Holdings, Inc. | 8,163,523 | ||
| 47,808 | M&T Bank Corp. | 8,429,507 | ||
| 270,204 | Pacific Premier Bancorp, Inc. | 8,365,516 | ||
| 111,822 | Popular, Inc. | 8,057,893 | ||
| 223,701 | Synovus Financial Corp. | 8,391,025 | ||
| 151,511 | Zions Bancorp N.A. | 7,705,849 | ||
| 98,242,081 | ||||
| Building Products – 4.1% | ||||
| 169,019 | A.O. Smith Corp. | 8,210,943 | ||
| 97,479 | Allegion PLC | 8,741,917 | ||
| 107,067 | Owens Corning | 8,416,537 | ||
| 119,015 | UFP Industries, Inc. | 8,588,122 | ||
| 33,957,519 | ||||
| Capital Markets – 3.9% | ||||
| 97,456 | Evercore, Inc., Class A | 8,015,756 | ||
| 362,137 | Franklin Resources, Inc. | 7,793,188 | ||
| 266,190 | Jefferies Financial Group, Inc. | 7,852,605 | ||
| 81,813 | Raymond James Financial, Inc. | 8,084,761 | ||
| 31,746,310 | ||||
| Chemicals – 2.9% | ||||
| 237,664 | Avient Corp. | 7,201,219 | ||
| 340,414 | Huntsman Corp. | 8,353,760 | ||
| 96,223 | Westlake Corp. | 8,359,854 | ||
| 23,914,833 | ||||
| Commercial Services & Supplies – 1.0% | ||||
| 65,758 | Tetra Tech, Inc. | 8,451,876 | ||
| Construction & Engineering – 2.1% | ||||
| 122,673 | AECOM | 8,387,153 | ||
| 74,056 | EMCOR Group, Inc. | 8,551,987 | ||
| 16,939,140 | ||||
| Consumer Finance – 1.0% | ||||
| 571,732 | SLM Corp. | 7,998,531 | ||
| Containers & Packaging – 1.0% | ||||
| 74,043 | Packaging Corp. of America | 8,314,288 | ||
| Diversified Consumer Services – 1.0% | ||||
| 15,801 | Graham Holdings Co., Class B | 8,500,622 | ||
| Shares | Description | Value | ||
| Diversified Financial Services – 1.0% | ||||
| 139,090 | Voya Financial, Inc. | $8,414,945 | ||
| Electronic Equipment, Instruments & Components – 1.0% | ||||
| 41,303 | Littelfuse, Inc. | 8,206,493 | ||
| Food Products – 1.0% | ||||
| 2,394 | Seaboard Corp. | 8,145,968 | ||
| Hotels, Restaurants & Leisure – 1.0% | ||||
| 96,594 | Texas Roadhouse, Inc. | 8,428,792 | ||
| Household Durables – 8.0% | ||||
| 190,474 | Century Communities, Inc. | 8,148,478 | ||
| 381,732 | Ethan Allen Interiors, Inc. | 8,069,814 | ||
| 102,359 | Installed Building Products, Inc. | 8,290,055 | ||
| 350,213 | La-Z-Boy, Inc. | 7,904,307 | ||
| 297,540 | MDC Holdings, Inc. | 8,158,547 | ||
| 222,109 | PulteGroup, Inc. | 8,329,088 | ||
| 200,231 | Toll Brothers, Inc. | 8,409,702 | ||
| 60,269 | Whirlpool Corp. | 8,124,864 | ||
| 65,434,855 | ||||
| Insurance – 8.0% | ||||
| 67,960 | American Financial Group, Inc. | 8,354,323 | ||
| 228,498 | CNA Financial Corp. | 8,431,576 | ||
| 30,882 | Everest Re Group Ltd. | 8,104,672 | ||
| 217,839 | Fidelity National Financial, Inc. | 7,885,772 | ||
| 172,899 | First American Financial Corp. | 7,970,644 | ||
| 400,481 | Old Republic International Corp. | 8,382,067 | ||
| 113,518 | Principal Financial Group, Inc. | 8,190,324 | ||
| 218,441 | Unum Group | 8,475,511 | ||
| 65,794,889 | ||||
| IT Services – 2.1% | ||||
| 194,393 | Genpact Ltd. | 8,508,582 | ||
| 617,779 | Western Union (The) Co. | 8,340,016 | ||
| 16,848,598 | ||||
| Leisure Products – 4.9% | ||||
| 182,018 | Acushnet Holdings Corp. | 7,915,963 | ||
| 159,529 | Johnson Outdoors, Inc., Class A | 8,185,433 | ||
| 81,070 | Polaris, Inc. | 7,754,345 | ||
| 770,909 | Smith & Wesson Brands, Inc. | 7,994,326 | ||
| 168,830 | Sturm Ruger & Co., Inc. | 8,574,876 | ||
| 40,424,943 | ||||
| Machinery – 9.2% | ||||
| 84,304 | AGCO Corp. | 8,107,516 | ||
| 96,234 | Crane Holdings Co. | 8,424,324 | ||
| 141,072 | Graco, Inc. | 8,457,266 | ||
| 42,659 | IDEX Corp. | 8,525,401 | ||
| 146,497 | Mueller Industries, Inc. | 8,707,782 | ||
| 39,919 | Nordson Corp. | 8,473,606 | ||
| Shares | Description | Value | ||
| COMMON STOCKS (Continued) | ||||
| Machinery (Continued) | ||||
| 40,571 | Snap-on, Inc. | $8,168,971 | ||
| 267,492 | Terex Corp. | 7,955,212 | ||
| 98,393 | Toro (The) Co. | 8,509,027 | ||
| 75,329,105 | ||||
| Marine – 2.0% | ||||
| 658,345 | Genco Shipping & Trading Ltd. | 8,249,063 | ||
| 125,979 | Matson, Inc. | 7,750,228 | ||
| 15,999,291 | ||||
| Media – 2.0% | ||||
| 320,218 | Interpublic Group of (The) Cos., Inc. | 8,197,581 | ||
| 130,501 | Omnicom Group, Inc. | 8,233,308 | ||
| 16,430,889 | ||||
| Metals & Mining – 2.8% | ||||
| 232,554 | Commercial Metals Co. | 8,251,016 | ||
| 116,535 | Steel Dynamics, Inc. | 8,268,158 | ||
| 170,566 | Worthington Industries, Inc. | 6,505,387 | ||
| 23,024,561 | ||||
| Oil, Gas & Consumable Fuels – 4.0% | ||||
| 201,885 | California Resources Corp. | 7,758,440 | ||
| 63,558 | Chord Energy Corp. | 8,692,828 | ||
| 385,083 | Magnolia Oil & Gas Corp., Class A | 7,628,494 | ||
| 4,930 | Texas Pacific Land Corp. | 8,761,744 | ||
| 32,841,506 | ||||
| Paper & Forest Products – 1.0% | ||||
| 166,450 | Louisiana-Pacific Corp. | 8,520,576 | ||
| Personal Products – 1.0% | ||||
| 73,485 | Medifast, Inc. | 7,962,835 | ||
| Professional Services – 1.1% | ||||
| 113,964 | Robert Half International, Inc. | 8,718,246 | ||
| Real Estate Management & Development – 0.9% | ||||
| 235,691 | Marcus & Millichap, Inc. | 7,725,951 | ||
| Road & Rail – 2.1% | ||||
| 61,998 | Landstar System, Inc. | 8,950,651 | ||
| 417,098 | Schneider National, Inc., Class B | 8,467,090 | ||
| 17,417,741 | ||||
| Semiconductors & Semiconductor Equipment – 2.9% | ||||
| 482,716 | Amkor Technology, Inc. | 8,230,308 | ||
| 94,198 | Entegris, Inc. | 7,820,318 | ||
| Shares | Description | Value | ||
| Semiconductors & Semiconductor Equipment (Continued) | ||||
| 85,964 | Universal Display Corp. | $8,110,703 | ||
| 24,161,329 | ||||
| Software – 1.0% | ||||
| 411,191 | NortonLifeLock, Inc. | 8,281,387 | ||
| Specialty Retail – 4.9% | ||||
| 798,428 | American Eagle Outfitters, Inc. | 7,768,704 | ||
| 260,031 | Buckle (The), Inc. | 8,232,581 | ||
| 78,307 | Dick’s Sporting Goods, Inc. | 8,194,045 | ||
| 326,923 | Haverty Furniture Cos., Inc. | 8,140,383 | ||
| 65,076 | Williams-Sonoma, Inc. | 7,669,207 | ||
| 40,004,920 | ||||
| Technology Hardware, Storage & Peripherals – 1.0% | ||||
| 127,284 | NetApp, Inc. | 7,872,515 | ||
| Textiles, Apparel & Luxury Goods – 2.9% | ||||
| 123,130 | Columbia Sportswear Co. | 8,286,649 | ||
| 496,156 | Levi Strauss & Co., Class A | 7,179,377 | ||
| 298,656 | Steven Madden Ltd. | 7,965,156 | ||
| 23,431,182 | ||||
| Thrifts & Mortgage Finance – 2.9% | ||||
| 224,672 | Essent Group Ltd. | 7,834,313 | ||
| 612,618 | MGIC Investment Corp. | 7,853,763 | ||
| 419,874 | Radian Group, Inc. | 8,099,369 | ||
| 23,787,445 | ||||
| Trading Companies & Distributors – 1.1% | ||||
| 147,716 | Boise Cascade Co. | 8,783,193 | ||
| Total Investments – 99.8% | 818,322,788 | |||
| (Cost $1,005,213,394) | ||||
| Net Other Assets and Liabilities – 0.2% | 1,298,415 | |||
| Net Assets – 100.0% | $819,621,203 | |||
| Total Value at 9/30/2022 | Level 1 Quoted Prices | Level 2 Significant Observable Inputs | Level 3 Significant Unobservable Inputs | |
| Common Stocks* | $ 818,322,788 | $ 818,322,788 | $ — | $ — |
| * | See Portfolio of Investments for industry breakout. |
| Shares | Description | Value | ||
| COMMON STOCKS – 97.5% | ||||
| Aerospace & Defense – 1.0% | ||||
| 3,402 | Textron, Inc. | $198,201 | ||
| Air Freight & Logistics – 0.7% | ||||
| 973 | FedEx Corp. | 144,461 | ||
| Banks – 9.1% | ||||
| 2,945 | Comerica, Inc. | 209,390 | ||
| 6,098 | Popular, Inc. | 439,422 | ||
| 20,469 | Regions Financial Corp. | 410,813 | ||
| 11,343 | Synovus Financial Corp. | 425,476 | ||
| 3,439 | Wintrust Financial Corp. | 280,450 | ||
| 1,765,551 | ||||
| Beverages – 2.4% | ||||
| 9,670 | Molson Coors Beverage Co., Class B | 464,063 | ||
| Building Products – 3.1% | ||||
| 8,201 | UFP Industries, Inc. | 591,784 | ||
| Chemicals – 5.9% | ||||
| 3,519 | CF Industries Holdings, Inc. | 338,704 | ||
| 4,451 | Eastman Chemical Co. | 316,244 | ||
| 6,448 | LyondellBasell Industries N.V., Class A | 485,405 | ||
| 1,140,353 | ||||
| Construction & Engineering – 1.6% | ||||
| 4,807 | MasTec, Inc. (a) | 305,244 | ||
| Consumer Finance – 1.1% | ||||
| 14,811 | SLM Corp. | 207,206 | ||
| Distributors – 1.0% | ||||
| 3,910 | LKQ Corp. | 184,357 | ||
| Electric Utilities – 2.9% | ||||
| 14,861 | NRG Energy, Inc. | 568,730 | ||
| Electronic Equipment, Instruments & Components – 3.2% | ||||
| 10,577 | Jabil, Inc. | 610,399 | ||
| Food & Staples Retailing – 2.5% | ||||
| 10,613 | Albertsons Cos., Inc., Class A | 263,839 | ||
| 4,860 | Kroger (The) Co. | 212,625 | ||
| 476,464 | ||||
| Health Care Providers & Services – 8.2% | ||||
| 4,259 | Centene Corp. (a) | 331,393 | ||
| 1,578 | Cigna Corp. | 437,848 | ||
| 1,342 | Laboratory Corp of America Holdings | 274,855 | ||
| Shares | Description | Value | ||
| Health Care Providers & Services (Continued) | ||||
| 1,580 | McKesson Corp. | $536,994 | ||
| 1,581,090 | ||||
| Hotels, Restaurants & Leisure – 1.1% | ||||
| 4,527 | Boyd Gaming Corp. | 215,712 | ||
| Household Durables – 4.7% | ||||
| 4,684 | Mohawk Industries, Inc. (a) | 427,134 | ||
| 3,559 | Whirlpool Corp. | 479,789 | ||
| 906,923 | ||||
| Insurance – 24.2% | ||||
| 11,108 | American International Group, Inc. | 527,408 | ||
| 7,085 | Arch Capital Group Ltd. (a) | 322,651 | ||
| 1,467 | Assurant, Inc. | 213,111 | ||
| 10,275 | Axis Capital Holdings Ltd. | 505,016 | ||
| 2,169 | Globe Life, Inc. | 216,249 | ||
| 1,688 | Hanover Insurance Group (The), Inc. | 216,300 | ||
| 9,377 | MetLife, Inc. | 569,934 | ||
| 7,279 | Principal Financial Group, Inc. | 525,180 | ||
| 6,209 | Prudential Financial, Inc. | 532,608 | ||
| 2,217 | Travelers (The) Cos., Inc. | 339,644 | ||
| 18,578 | Unum Group | 720,827 | ||
| 4,688,928 | ||||
| IT Services – 2.4% | ||||
| 19,333 | DXC Technology Co. (a) | 473,272 | ||
| Machinery – 1.9% | ||||
| 6,210 | Timken (The) Co. | 366,638 | ||
| Media – 2.8% | ||||
| 3,232 | Nexstar Media Group, Inc. | 539,259 | ||
| Metals & Mining – 2.9% | ||||
| 3,270 | Reliance Steel & Aluminum Co. | 570,321 | ||
| Oil, Gas & Consumable Fuels – 5.0% | ||||
| 5,259 | Exxon Mobil Corp. | 459,163 | ||
| 18,198 | Kinder Morgan, Inc. | 302,815 | ||
| 3,335 | Occidental Petroleum Corp. | 204,936 | ||
| 966,914 | ||||
| Professional Services – 1.2% | ||||
| 921 | CACI International, Inc., Class A (a) | 240,436 | ||
| Specialty Retail – 7.4% | ||||
| 4,828 | AutoNation, Inc. (a) | 491,828 | ||
| 2,034 | Lithia Motors, Inc. | 436,395 | ||
| 5,205 | Penske Automotive Group, Inc. | 512,328 | ||
| 1,440,551 | ||||
| Shares | Description | Value | ||
| COMMON STOCKS (Continued) | ||||
| Textiles, Apparel & Luxury Goods – 1.2% | ||||
| 8,484 | Tapestry, Inc. | $241,200 | ||
| Total Common Stocks | 18,888,057 | |||
| (Cost $20,557,061) | ||||
| REAL ESTATE INVESTMENT TRUSTS – 2.3% | ||||
| Mortgage Real Estate Investment Trusts – 2.3% | ||||
| 61,340 | Rithm Capital Corp. | 449,009 | ||
| (Cost $648,020) | ||||
| Total Investments – 99.8% | 19,337,066 | |||
| (Cost $21,205,081) | ||||
| Net Other Assets and Liabilities – 0.2% | 32,149 | |||
| Net Assets – 100.0% | $19,369,215 | |||
| (a) | Non-income producing security. |
| Total Value at 9/30/2022 | Level 1 Quoted Prices | Level 2 Significant Observable Inputs | Level 3 Significant Unobservable Inputs | |
| Common Stocks* | $ 18,888,057 | $ 18,888,057 | $ — | $ — |
| Real Estate Investment Trusts* | 449,009 | 449,009 | — | — |
| Total Investments | $ 19,337,066 | $ 19,337,066 | $— | $— |
| * | See Portfolio of Investments for industry breakout. |
| Shares | Description | Value | ||
| COMMON STOCKS – 82.3% | ||||
| Aerospace & Defense – 2.6% | ||||
| 4,480 | Huntington Ingalls Industries, Inc. | $992,320 | ||
| 13,350 | Raytheon Technologies Corp. | 1,092,831 | ||
| 2,085,151 | ||||
| Beverages – 2.9% | ||||
| 10,178 | Constellation Brands, Inc., Class A | 2,337,683 | ||
| Biotechnology – 2.6% | ||||
| 15,739 | AbbVie, Inc. | 2,112,331 | ||
| Commercial Services & Supplies – 6.2% | ||||
| 18,219 | Republic Services, Inc. | 2,478,513 | ||
| 16,121 | Waste Management, Inc. | 2,582,745 | ||
| 5,061,258 | ||||
| Containers & Packaging – 1.1% | ||||
| 8,092 | Packaging Corp. of America | 908,651 | ||
| Electric Utilities – 3.0% | ||||
| 66,759 | FirstEnergy Corp. | 2,470,083 | ||
| Electrical Equipment – 2.9% | ||||
| 20,872 | AMETEK, Inc. | 2,367,093 | ||
| Electronic Equipment, Instruments & Components – 1.3% | ||||
| 15,575 | Amphenol Corp., Class A | 1,042,902 | ||
| Gas Utilities – 1.7% | ||||
| 21,965 | National Fuel Gas Co. | 1,351,946 | ||
| Health Care Providers & Services – 9.0% | ||||
| 16,237 | AmerisourceBergen Corp. | 2,197,353 | ||
| 1,917 | Chemed Corp. | 836,886 | ||
| 7,105 | McKesson Corp. | 2,414,776 | ||
| 3,692 | UnitedHealth Group, Inc. | 1,864,608 | ||
| 7,313,623 | ||||
| Hotels, Restaurants & Leisure – 3.0% | ||||
| 10,482 | McDonald’s Corp. | 2,418,617 | ||
| Household Products – 2.7% | ||||
| 17,563 | Procter & Gamble (The) Co. | 2,217,329 | ||
| Insurance – 21.9% | ||||
| 6,252 | American Financial Group, Inc. | 768,558 | ||
| 34,095 | Arch Capital Group Ltd. (a) | 1,552,686 | ||
| 8,822 | Arthur J. Gallagher & Co. | 1,510,503 | ||
| 13,796 | Assurant, Inc. | 2,004,145 | ||
| 11,549 | Chubb Ltd. | 2,100,532 | ||
| 11,908 | Hanover Insurance Group (The), Inc. | 1,525,891 | ||
| Shares | Description | Value | ||
| Insurance (Continued) | ||||
| 14,652 | Marsh & McLennan Cos., Inc. | $2,187,397 | ||
| 18,398 | Progressive (The) Corp. | 2,138,032 | ||
| 13,473 | Travelers (The) Cos., Inc. | 2,064,064 | ||
| 30,364 | W.R. Berkley Corp. | 1,960,907 | ||
| 17,812,715 | ||||
| IT Services – 5.2% | ||||
| 5,976 | Automatic Data Processing, Inc. | 1,351,711 | ||
| 9,834 | Jack Henry & Associates, Inc. | 1,792,443 | ||
| 9,555 | Paychex, Inc. | 1,072,167 | ||
| 4,216,321 | ||||
| Machinery – 1.2% | ||||
| 8,519 | Dover Corp. | 993,145 | ||
| Multi-Utilities – 5.8% | ||||
| 30,198 | Ameren Corp. | 2,432,449 | ||
| 81,266 | CenterPoint Energy, Inc. | 2,290,076 | ||
| 4,722,525 | ||||
| Oil, Gas & Consumable Fuels – 0.9% | ||||
| 27,160 | Williams (The) Cos., Inc. | 777,591 | ||
| Professional Services – 1.0% | ||||
| 3,156 | CACI International, Inc., Class A (a) | 823,905 | ||
| Road & Rail – 2.5% | ||||
| 10,665 | Union Pacific Corp. | 2,077,755 | ||
| Trading Companies & Distributors – 3.1% | ||||
| 31,144 | Fastenal Co. | 1,433,870 | ||
| 2,285 | WW Grainger, Inc. | 1,117,799 | ||
| 2,551,669 | ||||
| Water Utilities – 1.7% | ||||
| 10,697 | American Water Works Co., Inc. | 1,392,321 | ||
| Total Common Stocks | 67,054,614 | |||
| (Cost $72,210,099) | ||||
| REAL ESTATE INVESTMENT TRUSTS – 17.5% | ||||
| Equity Real Estate Investment Trusts – 14.8% | ||||
| 32,966 | Apartment Income REIT Corp. | 1,273,147 | ||
| 14,709 | Camden Property Trust | 1,756,990 | ||
| 16,141 | Equity LifeStyle Properties, Inc. | 1,014,300 | ||
| 46,638 | First Industrial Realty Trust, Inc. | 2,089,849 | ||
| 12,474 | Mid-America Apartment Communities, Inc. | 1,934,343 | ||
| 4,416 | Public Storage | 1,293,049 | ||
| 7,518 | Sun Communities, Inc. | 1,017,411 | ||
| 17,545 | Terreno Realty Corp. | 929,710 | ||
| 11,342 | Welltower, Inc. | 729,517 | ||
| 12,038,316 | ||||
| Shares | Description | Value | ||
| REAL ESTATE INVESTMENT TRUSTS (Continued) | ||||
| Mortgage Real Estate Investment Trusts – 2.7% | ||||
| 60,662 | Blackstone Mortgage Trust, Inc., Class A | $1,415,851 | ||
| 41,174 | Starwood Property Trust, Inc. | 750,191 | ||
| 2,166,042 | ||||
| Total Real Estate Investment Trusts | 14,204,358 | |||
| (Cost $18,319,199) | ||||
| Total Investments – 99.8% | 81,258,972 | |||
| (Cost $90,529,298) | ||||
| Net Other Assets and Liabilities – 0.2% | 194,589 | |||
| Net Assets – 100.0% | $81,453,561 | |||
| (a) | Non-income producing security. |
| Total Value at 9/30/2022 | Level 1 Quoted Prices | Level 2 Significant Observable Inputs | Level 3 Significant Unobservable Inputs | |
| Common Stocks* | $ 67,054,614 | $ 67,054,614 | $ — | $ — |
| Real Estate Investment Trusts* | 14,204,358 | 14,204,358 | — | — |
| Total Investments | $ 81,258,972 | $ 81,258,972 | $— | $— |
| * | See Portfolio of Investments for industry breakout. |
| First Trust SMID Cap Rising Dividend Achievers ETF (SDVY) | First Trust Dorsey Wright Momentum & Value ETF (DVLU) | First Trust Dorsey Wright Momentum & Low Volatility ETF (DVOL) | |||
| ASSETS: | |||||
Investments, at value | $ 818,322,788 | $ 19,337,066 | $ 81,258,972 | ||
Cash | 791,404 | 18,521 | 77,073 | ||
| Receivables: | |||||
Dividends | 941,664 | 23,950 | 160,765 | ||
Dividend reclaims | 87 | — | — | ||
Total Assets | 820,055,943 | 19,379,537 | 81,496,810 | ||
| LIABILITIES: | |||||
| Payables: | |||||
Investment advisory fees | 434,740 | 10,322 | 43,249 | ||
Total Liabilities | 434,740 | 10,322 | 43,249 | ||
NET ASSETS | $819,621,203 | $19,369,215 | $81,453,561 | ||
| NET ASSETS consist of: | |||||
Paid-in capital | $ 1,035,161,833 | $ 32,959,122 | $ 111,142,463 | ||
Par value | 355,000 | 9,500 | 34,000 | ||
Accumulated distributable earnings (loss) | (215,895,630) | (13,599,407) | (29,722,902) | ||
NET ASSETS | $819,621,203 | $19,369,215 | $81,453,561 | ||
NET ASSET VALUE, per share | $23.09 | $20.39 | $23.96 | ||
Number of shares outstanding (unlimited number of shares authorized, par value $0.01 per share) | 35,500,002 | 950,002 | 3,400,002 | ||
Investments, at cost | $1,005,213,394 | $21,205,081 | $90,529,298 |
| First Trust SMID Cap Rising Dividend Achievers ETF (SDVY) | First Trust Dorsey Wright Momentum & Value ETF (DVLU) | First Trust Dorsey Wright Momentum & Low Volatility ETF (DVOL) | ||||
| INVESTMENT INCOME: | ||||||
Dividends | $ 19,672,042 | $ 549,320 | $ 1,803,013 | |||
Interest | 8,940 | 159 | 772 | |||
Foreign withholding tax | (36,758) | (1,129) | — | |||
Other | — | 44 | — | |||
Total investment income | 19,644,224 | 548,394 | 1,803,785 | |||
| EXPENSES: | ||||||
Investment advisory fees | 4,135,646 | 146,712 | 659,345 | |||
Total expenses | 4,135,646 | 146,712 | 659,345 | |||
NET INVESTMENT INCOME (LOSS) | 15,508,578 | 401,682 | 1,144,440 | |||
| NET REALIZED AND UNREALIZED GAIN (LOSS): | ||||||
| Net realized gain (loss) on: | ||||||
Investments | (33,667,645) | (1,910,979) | (6,255,044) | |||
In-kind redemptions | 9,129,522 | 331,109 | 10,836,919 | |||
Net realized gain (loss) | (24,538,123) | (1,579,870) | 4,581,875 | |||
| Net change in unrealized appreciation (depreciation) on: | ||||||
Investments | (182,334,771) | (1,474,104) | (18,738,146) | |||
NET REALIZED AND UNREALIZED GAIN (LOSS) | (206,872,894) | (3,053,974) | (14,156,271) | |||
NET INCREASE (DECREASE) IN NET ASSETS RESULTING FROM OPERATIONS | $(191,364,316) | $(2,652,292) | $(13,011,831) | |||
| First Trust SMID Cap Rising Dividend Achievers ETF (SDVY) | First Trust Dorsey Wright Momentum & Value ETF (DVLU) | ||||||
| Year Ended 9/30/2022 | Year Ended 9/30/2021 | Year Ended 9/30/2022 | Year Ended 9/30/2021 | ||||
| OPERATIONS: | |||||||
Net investment income (loss) | $ 15,508,578 | $ 1,215,419 | $ 401,682 | $ 403,881 | |||
Net realized gain (loss) | (24,538,123) | 4,399,493 | (1,579,870) | 7,489,708 | |||
Net change in unrealized appreciation (depreciation) | (182,334,771) | (4,309,095) | (1,474,104) | (1,439,711) | |||
Net increase (decrease) in net assets resulting from operations | (191,364,316) | 1,305,817 | (2,652,292) | 6,453,878 | |||
| DISTRIBUTIONS TO SHAREHOLDERS FROM: | |||||||
Investment operations | (14,025,016) | (1,005,851) | (416,941) | (376,450) | |||
| SHAREHOLDER TRANSACTIONS: | |||||||
Proceeds from shares sold | 937,688,574 | 225,198,706 | 5,097,895 | 63,958,085 | |||
Cost of shares redeemed | (123,351,150) | (24,875,461) | (8,523,685) | (58,491,461) | |||
Net increase (decrease) in net assets resulting from shareholder transactions | 814,337,424 | 200,323,245 | (3,425,790) | 5,466,624 | |||
Total increase (decrease) in net assets | 608,948,092 | 200,623,211 | (6,495,023) | 11,544,052 | |||
| NET ASSETS: | |||||||
Beginning of period | 210,673,111 | 10,049,900 | 25,864,238 | 14,320,186 | |||
End of period | $819,621,203 | $210,673,111 | $19,369,215 | $25,864,238 | |||
| CHANGES IN SHARES OUTSTANDING: | |||||||
Shares outstanding, beginning of period | 7,450,002 | 550,002 | 1,100,002 | 950,002 | |||
Shares sold | 32,800,000 | 7,800,000 | 200,000 | 2,900,000 | |||
Shares redeemed | (4,750,000) | (900,000) | (350,000) | (2,750,000) | |||
Shares outstanding, end of period | 35,500,002 | 7,450,002 | 950,002 | 1,100,002 | |||
| First Trust Dorsey Wright Momentum & Low Volatility ETF (DVOL) | ||
| Year Ended 9/30/2022 | Year Ended 9/30/2021 | |
| $ 1,144,440 | $ 436,137 | |
| 4,581,875 | 24,241,948 | |
| (18,738,146) | 750,009 | |
| (13,011,831) | 25,428,094 | |
| (1,071,096) | (398,380) | |
| 93,110,294 | 173,667,860 | |
| (118,688,168) | (202,257,238) | |
| (25,577,874) | (28,589,378) | |
| (39,660,801) | (3,559,664) | |
| 121,114,362 | 124,674,026 | |
| $81,453,561 | $121,114,362 | |
| 4,400,002 | 5,550,002 | |
| 3,300,000 | 6,800,000 | |
| (4,300,000) | (7,950,000) | |
| 3,400,002 | 4,400,002 | |
| Year Ended September 30, | Period Ended 9/30/2018 (a) | ||||||||
| 2022 | 2021 | 2020 | 2019 | ||||||
Net asset value, beginning of period | $ 28.28 | $ 18.27 | $ 20.37 | $ 21.28 | $ 19.94 | ||||
| Income from investment operations: | |||||||||
Net investment income (loss) | 0.51 | 0.36 | 0.33 | 0.35 | 0.26 | ||||
Net realized and unrealized gain (loss) | (5.21) | 9.99 | (2.08) | (0.92) | 1.31 | ||||
Total from investment operations | (4.70) | 10.35 | (1.75) | (0.57) | 1.57 | ||||
| Distributions paid to shareholders from: | |||||||||
Net investment income | (0.49) | (0.34) | (0.35) | (0.34) | (0.23) | ||||
Net asset value, end of period | $23.09 | $28.28 | $18.27 | $20.37 | $21.28 | ||||
Total return (b) | (16.78)% | 56.77% | (8.56)% | (2.59)% | 7.92% | ||||
| Ratios to average net assets/supplemental data: | |||||||||
Net assets, end of period (in 000’s) | $ 819,621 | $ 210,673 | $ 10,050 | $ 7,128 | $ 4,257 | ||||
Ratio of total expenses to average net assets | 0.60% | 0.60% | 0.60% | 0.60% | 0.60% (c) | ||||
Ratio of net investment income (loss) to average net assets | 2.25% | 1.77% | 1.83% | 1.95% | 1.49% (c) | ||||
Portfolio turnover rate (d) | 86% | 36% | 76% | 78% | 72% | ||||
| (a) | Inception date is November 1, 2017, which is consistent with the commencement of investment operations and is the date the initial creation units were established. |
| (b) | Total return is calculated assuming an initial investment made at the net asset value at the beginning of the period, reinvestment of all distributions at net asset value during the period, and redemption at net asset value on the last day of the period. The returns presented do not reflect the deduction of taxes that a shareholder would pay on Fund distributions or the redemption or sale of Fund shares. Total return is calculated for the time period presented and is not annualized for periods of less than a year. |
| (c) | Annualized. |
| (d) | Portfolio turnover is calculated for the time period presented and is not annualized for periods of less than a year and does not include securities received or delivered from processing creations or redemptions and in-kind transactions. |
| Year Ended September 30, | Period Ended 9/30/2018 (a) | ||||||||
| 2022 | 2021 | 2020 | 2019 | ||||||
Net asset value, beginning of period | $ 23.51 | $ 15.07 | $ 18.52 | $ 19.46 | $ 19.98 | ||||
| Income from investment operations: | |||||||||
Net investment income (loss) | 0.40 | 0.29 | 0.25 | 0.33 | 0.02 | ||||
Net realized and unrealized gain (loss) | (3.11) | 8.42 | (3.44) | (0.94) | (0.54) | ||||
Total from investment operations | (2.71) | 8.71 | (3.19) | (0.61) | (0.52) | ||||
| Distributions paid to shareholders from: | |||||||||
Net investment income | (0.41) | (0.27) | (0.26) | (0.33) | — | ||||
Net asset value, end of period | $20.39 | $23.51 | $15.07 | $18.52 | $19.46 | ||||
Total return (b) | (11.71)% | 57.98% | (17.19)% | (3.04)% | (2.60)% | ||||
| Ratios to average net assets/supplemental data: | |||||||||
Net assets, end of period (in 000’s) | $ 19,369 | $ 25,864 | $ 14,320 | $ 19,451 | $ 13,625 | ||||
Ratio of total expenses to average net assets | 0.60% | 0.60% | 0.60% | 0.60% | 0.60% (c) | ||||
Ratio of net investment income (loss) to average net assets | 1.64% | 1.68% | 1.56% | 2.01% | 3.61% (c) | ||||
Portfolio turnover rate (d) | 230% | 195% | 205% | 152% | 0% | ||||
| (a) | Inception date is September 5, 2018, which is consistent with the commencement of investment operations and is the date the initial creation units were established. |
| (b) | Total return is calculated assuming an initial investment made at the net asset value at the beginning of the period, reinvestment of all distributions at net asset value during the period, and redemption at net asset value on the last day of the period. The returns presented do not reflect the deduction of taxes that a shareholder would pay on Fund distributions or the redemption or sale of Fund shares. Total return is calculated for the time period presented and is not annualized for periods of less than a year. |
| (c) | Annualized. |
| (d) | Portfolio turnover is calculated for the time period presented and is not annualized for periods of less than a year and does not include securities received or delivered from processing creations or redemptions and in-kind transactions. |
| Year Ended September 30, | Period Ended 9/30/2018 (a) | ||||||||
| 2022 | 2021 | 2020 | 2019 | ||||||
Net asset value, beginning of period | $ 27.53 | $ 22.46 | $ 22.81 | $ 19.94 | $ 19.97 | ||||
| Income from investment operations: | |||||||||
Net investment income (loss) | 0.32 | 0.10 | 0.28 | 0.29 | 0.03 | ||||
Net realized and unrealized gain (loss) | (3.60) | 5.06 | (0.30) | 2.85 | (0.06) | ||||
Total from investment operations | (3.28) | 5.16 | (0.02) | 3.14 | (0.03) | ||||
| Distributions paid to shareholders from: | |||||||||
Net investment income | (0.29) | (0.09) | (0.33) | (0.27) | — | ||||
Net asset value, end of period | $23.96 | $27.53 | $22.46 | $22.81 | $19.94 | ||||
Total return (b) | (12.02)% | 22.98% | 0.03% | 15.93% | (0.15)% | ||||
| Ratios to average net assets/supplemental data: | |||||||||
Net assets, end of period (in 000’s) | $ 81,454 | $ 121,114 | $ 124,674 | $ 131,169 | $ 13,960 | ||||
Ratio of total expenses to average net assets | 0.60% | 0.60% | 0.60% | 0.60% | 0.60% (c) | ||||
Ratio of net investment income (loss) to average net assets | 1.04% | 0.36% | 1.21% | 2.37% | 3.81% (c) | ||||
Portfolio turnover rate (d) | 169% | 136% | 187% | 81% | 0% | ||||
| (a) | Inception date is September 5, 2018, which is consistent with the commencement of investment operations and is the date the initial creation units were established. |
| (b) | Total return is calculated assuming an initial investment made at the net asset value at the beginning of the period, reinvestment of all distributions at net asset value during the period, and redemption at net asset value on the last day of the period. The returns presented do not reflect the deduction of taxes that a shareholder would pay on Fund distributions or the redemption or sale of Fund shares. Total return is calculated for the time period presented and is not annualized for periods of less than a year. |
| (c) | Annualized. |
| (d) | Portfolio turnover is calculated for the time period presented and is not annualized for periods of less than a year and does not include securities received or delivered from processing creations or redemptions and in-kind transactions. |
| Fund | Index |
| First Trust SMID Cap Rising Dividend Achievers ETF | Nasdaq US Small Mid Cap Rising Dividend AchieversTM Index |
| First Trust DorseyWright Momentum & Value ETF | DorseyWright Momentum Plus ValueTM Index |
| First Trust DorseyWright Momentum & Low Volatility ETF | DorseyWright Momentum Plus Low VolatilityTM Index |
| 1) | the last sale price on the exchange on which they are principally traded or, for Nasdaq and AIM securities, the official closing price; |
| 2) | the type of security; |
| 3) | the size of the holding; |
| 4) | the initial cost of the security; |
| 5) | transactions in comparable securities; |
| 6) | price quotes from dealers and/or third-party pricing services; |
| 7) | relationships among various securities; |
| 8) | information obtained by contacting the issuer, analysts, or the appropriate stock exchange; |
| 9) | an analysis of the issuer’s financial statements; |
| 10) | the existence of merger proposals or tender offers that might affect the value of the security; and |
| 11) | other relevant factors. |
| • | Level 1 – Level 1 inputs are quoted prices in active markets for identical investments. An active market is a market in which transactions for the investment occur with sufficient frequency and volume to provide pricing information on an ongoing basis. |
| • | Level 2 – Level 2 inputs are observable inputs, either directly or indirectly, and include the following: |
| o | Quoted prices for similar investments in active markets. |
| o | Quoted prices for identical or similar investments in markets that are non-active. A non-active market is a market where there are few transactions for the investment, the prices are not current, or price quotations vary substantially either over time or among market makers, or in which little information is released publicly. |
| o | Inputs other than quoted prices that are observable for the investment (for example, interest rates and yield curves observable at commonly quoted intervals, volatilities, prepayment speeds, loss severities, credit risks, and default rates). |
| o | Inputs that are derived principally from or corroborated by observable market data by correlation or other means. |
| • | Level 3 – Level 3 inputs are unobservable inputs. Unobservable inputs may reflect the reporting entity’s own assumptions about the assumptions that market participants would use in pricing the investment. |
| Distributions paid from Ordinary Income | Distributions paid from Capital Gains | Distributions paid from Return of Capital | |||
First Trust SMID Cap Rising Dividend Achievers ETF | $ 14,025,016 | $ — | $ — | ||
First Trust Dorsey Wright Momentum & Value ETF | 416,941 | — | — | ||
First Trust Dorsey Wright Momentum & Low Volatility ETF | 1,071,096 | — | — |
| Distributions paid from Ordinary Income | Distributions paid from Capital Gains | Distributions paid from Return of Capital | |||
First Trust SMID Cap Rising Dividend Achievers ETF | $ 1,005,851 | $ — | $ — | ||
First Trust Dorsey Wright Momentum & Value ETF | 376,450 | — | — | ||
First Trust Dorsey Wright Momentum & Low Volatility ETF | 398,380 | — | — |
| Undistributed Ordinary Income | Accumulated Capital and Other Gain (Loss) | Unrealized Appreciation (Depreciation) | |||
First Trust SMID Cap Rising Dividend Achievers ETF | $ 1,623,821 | $ (17,877,189) | $ (199,642,262) | ||
First Trust Dorsey Wright Momentum & Value ETF | 27,114 | (11,751,888) | (1,874,633) | ||
First Trust Dorsey Wright Momentum & Low Volatility ETF | 149,989 | (20,592,809) | (9,280,082) |
| Non-Expiring Capital Loss Carryforward | |
First Trust SMID Cap Rising Dividend Achievers ETF | $ 17,877,189 |
First Trust Dorsey Wright Momentum & Value ETF | 11,751,888 |
First Trust Dorsey Wright Momentum & Low Volatility ETF | 20,592,809 |
| Accumulated Net Investment Income (Loss) | Accumulated Net Realized Gain (Loss) on Investments | Paid-in Capital | |||
First Trust SMID Cap Rising Dividend Achievers ETF | $ (63,976) | $ (4,127,148) | $ 4,191,124 | ||
First Trust Dorsey Wright Momentum & Value ETF | — | (321,760) | 321,760 | ||
First Trust Dorsey Wright Momentum & Low Volatility ETF | — | (10,163,408) | 10,163,408 |
| Tax Cost | Gross Unrealized Appreciation | Gross Unrealized (Depreciation) | Net Unrealized Appreciation (Depreciation) | ||||
First Trust SMID Cap Rising Dividend Achievers ETF | $ 1,017,965,050 | $ 5,776,857 | $ (205,419,119) | $ (199,642,262) | |||
First Trust Dorsey Wright Momentum & Value ETF | 21,211,699 | 352,347 | (2,226,980) | (1,874,633) | |||
First Trust Dorsey Wright Momentum & Low Volatility ETF | 90,539,054 | 866,611 | (10,146,693) | (9,280,082) |
| Purchases | Sales | ||
| First Trust SMID Cap Rising Dividend Achievers ETF | $ 579,485,139 | $ 578,777,525 | |
| First Trust Dorsey Wright Momentum & Value ETF | 55,509,543 | 55,493,786 | |
| First Trust Dorsey Wright Momentum & Low Volatility ETF | 184,490,584 | 184,197,238 | |
| Purchases | Sales | ||
| First Trust SMID Cap Rising Dividend Achievers ETF | $ 936,909,683 | $ 122,779,430 | |
| First Trust Dorsey Wright Momentum & Value ETF | 5,081,446 | 8,509,753 | |
| First Trust Dorsey Wright Momentum & Low Volatility ETF | 92,945,386 | 118,566,707 |
| Individual Funds Included in the Trust | Financial Highlights |
| First Trust SMID Cap Rising Dividend Achievers ETF | For the years ended September 30, 2022, 2021, 2020, 2019 and for the period from November 1, 2017 (commencement of operations) through September 30, 2018 |
| First Trust Dorsey Wright Momentum & Low Volatility ETF | For the years ended September 30, 2022, 2021, 2020, 2019 and for the period from September 5, 2018 (commencement of operations) through September 30, 2018 |
| First Trust Dorsey Wright Momentum & Value ETF |

| Dividends Received Deduction | |
First Trust SMID Cap Rising Dividend Achievers ETF | 100.00% |
First Trust Dorsey Wright Momentum & Value ETF | 100.00% |
First Trust Dorsey Wright Momentum & Low Volatility ETF | 91.44% |
| Qualified Dividend Income | |
First Trust SMID Cap Rising Dividend Achievers ETF | 100.00% |
First Trust Dorsey Wright Momentum & Value ETF | 100.00% |
First Trust Dorsey Wright Momentum & Low Volatility ETF | 100.00% |
| NOT FDIC INSURED | NOT BANK GUARANTEED | MAY LOSE VALUE |
| Name, Year of Birth and Position with the Trust | Term of Office and Year First Elected or Appointed | Principal Occupations During Past 5 Years | Number of Portfolios in the First Trust Fund Complex Overseen by Trustee | Other Trusteeships or Directorships Held by Trustee During Past 5 Years |
| INDEPENDENT TRUSTEES | ||||
| Richard E. Erickson, Trustee (1951) | • Indefinite Term • Since Inception | Physician, Edward-Elmhurst Medical Group; Physician and Officer, Wheaton Orthopedics (1990 to 2021) | 221 | None |
| Thomas R. Kadlec, Trustee (1957) | • Indefinite Term • Since Inception | Retired; President, ADM Investor Services, Inc. (Futures Commission Merchant) (2010 to July 2022) | 221 | Director, National Futures Association and ADMIS Singapore Ltd.; Formerly, Director of ADM Investor Services, Inc., ADM Investor Services International, ADMIS Hong Kong Ltd., and Futures Industry Association |
| Denise M. Keefe, Trustee (1964) | • Indefinite Term • Since 2021 | Executive Vice President, Advocate Aurora Health and President, Advocate Aurora Continuing Health Division (Integrated Healthcare System) | 221 | Director and Board Chair of Advocate Home Health Services, Advocate Home Care Products and Advocate Hospice; Director and Board Chair of Aurora At Home (since 2018); Director of Advocate Physician Partners Accountable Care Organization; Director and Board Chair of RML Long Term Acute Care Hospitals; and Director of Senior Helpers (since 2021) |
| Robert F. Keith, Trustee (1956) | • Indefinite Term • Since Inception | President, Hibs Enterprises (Financial and Management Consulting) | 221 | Formerly, Director of Trust Company of Illinois |
| Niel B. Nielson, Trustee (1954) | • Indefinite Term • Since Inception | Senior Advisor (2018 to Present), Managing Director and Chief Operating Officer (2015 to 2018), Pelita Harapan Educational Foundation (Educational Products and Services) | 221 | None |
| INTERESTED TRUSTEE | ||||
| James A. Bowen(1), Trustee and Chairman of the Board (1955) | • Indefinite Term • Since Inception | Chief Executive Officer, First Trust Advisors L.P. and First Trust Portfolios L.P.; Chairman of the Board of Directors, BondWave LLC (Software Development Company) and Stonebridge Advisors LLC (Investment Advisor) | 221 | None |
| (1) | Mr. Bowen is deemed an “interested person” of the Trust due to his position as CEO of First Trust Advisors L.P., investment advisor of the Trust. |
| Name and Year of Birth | Position and Offices with Trust | Term of Office and Length of Service | Principal Occupations During Past 5 Years |
| OFFICERS(2) | |||
| James M. Dykas (1966) | President and Chief Executive Officer | • Indefinite Term • Since 2016 | Managing Director and Chief Financial Officer, First Trust Advisors L.P. and First Trust Portfolios L.P.; Chief Financial Officer, BondWave LLC (Software Development Company) and Stonebridge Advisors LLC (Investment Advisor) |
| Donald P. Swade (1972) | Treasurer, Chief Financial Officer and Chief Accounting Officer | • Indefinite Term • Since 2016 | Senior Vice President, First Trust Advisors L.P. and First Trust Portfolios L.P. |
| W. Scott Jardine (1960) | Secretary and Chief Legal Officer | • Indefinite Term • Since Inception | General Counsel, First Trust Advisors L.P. and First Trust Portfolios L.P.; Secretary and General Counsel, BondWave LLC; Secretary, Stonebridge Advisors LLC |
| Daniel J. Lindquist (1970) | Vice President | • Indefinite Term • Since Inception | Managing Director, First Trust Advisors L.P. and First Trust Portfolios L.P. |
| Kristi A. Maher (1966) | Chief Compliance Officer and Assistant Secretary | • Indefinite Term • Since Inception | Deputy General Counsel, First Trust Advisors L.P. and First Trust Portfolios L.P. |
| Roger F. Testin (1966) | Vice President | • Indefinite Term • Since Inception | Senior Vice President, First Trust Advisors L.P. and First Trust Portfolios L.P. |
| Stan Ueland (1970) | Vice President | • Indefinite Term • Since Inception | Senior Vice President, First Trust Advisors L.P. and First Trust Portfolios L.P. |
| (2) | The term “officer” means the president, vice president, secretary, treasurer, controller or any other officer who performs a policy making function. |
| • | Information we receive from you and your broker-dealer, investment professional or financial representative through interviews, applications, agreements or other forms; |
| • | Information about your transactions with us, our affiliates or others; |
| • | Information we receive from your inquiries by mail, e-mail or telephone; and |
| • | Information we collect on our website through the use of “cookies.” For example, we may identify the pages on our website that your browser requests or visits. |
| • | In order to provide you with products and services and to effect transactions that you request or authorize, we may disclose your personal information as described above to unaffiliated financial service providers and other companies that perform administrative or other services on our behalf, such as transfer agents, custodians and trustees, or that assist us in the distribution of investor materials such as trustees, banks, financial representatives, proxy services, solicitors and printers. |
| • | We may release information we have about you if you direct us to do so, if we are compelled by law to do so, or in other legally limited circumstances (for example to protect your account from fraud). |
FUND ACCOUNTANT &
TRANSFER AGENT
PUBLIC ACCOUNTING FIRM
Item 2. Code of Ethics.
| (a) | The registrant, as of the end of the period covered by this report, has adopted a code of ethics that applies to the registrant’s principal executive officer, principal financial officer, principal accounting officer or controller, or persons performing similar functions, regardless of whether these individuals are employed by the registrant or a third party. |
| (b) | Not applicable. |
| (c) | There have been no amendments, during the period covered by this report, to a provision of the code of ethics that applies to the registrant’s principal executive officer, principal financial officer, principal accounting officer or controller, or persons performing similar functions, regardless of whether these individuals are employed by the registrant or a third party, and that relates to any element of the code of ethics description. |
| (d) | The registrant, during the period covered by this report, has not granted any waivers, including an implicit waiver, from a provision of the code of ethics that applies to the registrant’s principal executive officer, principal financial officer, principal accounting officer or controller, or persons performing similar functions, regardless of whether these individuals are employed by the registrant or a third party, that relates to one or more of the items set forth in paragraph (b) of this item’s instructions. |
| (e) | Not applicable. |
| (f) | A copy of the code of ethics that applies to the registrant’s principal executive officer, principal financial officer, principal accounting officer or controller is filed as an exhibit pursuant to Item 13(a)(1). |
Item 3. Audit Committee Financial Expert.
| (a) | As of the end of the period covered by the report, the registrant’s Board of Trustees has determined that Thomas R. Kadlec and Robert F. Keith are qualified to serve as audit committee financial experts serving on its audit committee and that each of them is “independent,” as defined by Item 3 of Form N-CSR. |
Item 4. Principal Accountant Fees and Services.
| (a) | Audit Fees (Registrant) -- The aggregate fees billed for professional services rendered by the principal accountant for the audit of the registrant’s annual financial statements or services that are normally provided by the accountant in connection with statutory and regulatory filings or engagements were $344,025 for the fiscal year ended September 30, 2021 and $363,713 for the fiscal year ended September 30, 2022. |
| (b) | Audit-Related Fees (Registrant) -- The aggregate fees billed for assurance and related services by the principal accountant that are reasonably related to the performance of the audit of the registrant’s financial statements and are not reported under paragraph (a) of this Item were $0 for the fiscal year ended September 30, 2021 and were $0 for the fiscal year ended September 30, 2022. |
Audit-Related Fees (Investment Advisor and Distributor) -- The aggregate fees billed for assurance and related services by the principal accountant that are reasonably related to the performance of the audit of the registrant’s financial statements and are not reported under paragraph (a) of this Item were $0 for the fiscal year ended September 30, 2021 and were $0 for the fiscal year ended September 30, 2022.
| (c) | Tax Fees (Registrant) -- The aggregate fees billed for professional services rendered by the principal accountant for tax compliance, tax advice, and tax planning to the registrant were $160,000 for the fiscal year ended September 30, 2021 and $176,104 for the fiscal year ended September 30, 2022. These fees were for tax consultation and/or tax return preparation. |
Tax Fees (Investment Advisor and Distributor) -- The aggregate fees billed for professional services rendered by the principal accountant for tax compliance, tax advice, and tax planning to the registrant’s advisor and distributor were $0 for the fiscal year ended September 30, 2021 and were $0 for the fiscal year ended September 30, 2022.
| (d) | All Other Fees (Registrant) -- The aggregate fees billed for products and services provided by the principal accountant to the registrant, other than the services reported in paragraphs (a) through (c) of this Item were $0 for the fiscal year ended September 30, 2021 and were $0 for the fiscal year ended September 30, 2022. |
All Other Fees (Investment Advisor and Distributor) -- The aggregate fees billed for products and services provided by the principal accountant to the registrant’s investment advisor and distributor, other than the services reported in paragraphs (a) through (c) of this Item were $0 for the fiscal year ended September 30, 2021 and were $0 for the fiscal year ended September 30, 2022.
| (e)(1) | Disclose the audit committee’s pre-approval policies and procedures described in paragraph (c) (7) of Rule 2-01 of Regulation S-X. |
Pursuant to its charter and its Audit and Non-Audit Services Pre-Approval Policy, the Audit Committee (the “Committee”) is responsible for the pre-approval of all audit services and permitted non-audit services (including the fees and terms thereof) to be performed for the registrant by its independent auditors. The Chairman of the Committee is authorized to give such pre-approvals on behalf of the Committee up to $25,000 and report any such pre-approval to the full Committee.
The Committee is also responsible for the pre-approval of the independent auditor’s engagements for non-audit services with the registrant’s advisor (not including a sub-advisor whose role is primarily portfolio management and is sub-contracted or overseen by another investment advisor) and any entity controlling, controlled by or under common control with the investment advisor that provides ongoing services to the registrant, if the engagement relates directly to the operations and financial reporting of the registrant, subject to the de minimis exceptions for non-audit services described in Rule 2-01 of Regulation S-X. If the independent auditor has provided non-audit services to the registrant’s advisor (other than any sub-advisor whose role is primarily portfolio management and is sub-contracted with or overseen by another investment advisor) and any entity controlling, controlled by or under common control with the investment advisor that provides ongoing services to the registrant that were not pre-approved pursuant to its policies, the Committee will consider whether the provision of such non-audit services is compatible with the auditor’s independence.
| (e)(2) | The percentage of services described in each of paragraphs (b) through (d) for the registrant and the registrant’s investment advisor and distributor of this Item that were approved by the audit committee pursuant to the pre-approval exceptions included in paragraph (c)(7)(i)(C) or paragraph(C)(7)(ii) of Rule 2-01 of Regulation S-X are as follows: |
| Registrant: | Advisor and Distributor: | ||
| (b) 0% | (b) 0% | ||
| (c) 0% | (c) 0% | ||
| (d) 0% | (d) 0% |
| (f) | The percentage of hours expended on the principal accountant’s engagement to audit the registrant’s financial statements for the most recent fiscal year that were attributed to work performed by persons other than the principal accountant’s full-time, permanent employees was less than fifty percent. |
| (g) | The aggregate non-audit fees billed by the registrant’s accountant for services rendered to the registrant, and rendered to the registrant’s investment advisor (not including any sub-advisor whose role is primarily portfolio management and is subcontracted with or overseen by another investment advisor), and any entity controlling, controlled by, or under common control with the advisor that provides ongoing services to the registrant for the fiscal year ended September 30, 2021 were $29,500 for the distributor, $23,200 for the advisor, and $160,000 for the registrant and for the fiscal year ended September 30, 2022 were $29,500 for the distributor, $16,500 for the advisor, and $176,104 for the registrant. |
| (h) | The registrant’s audit committee of its Board of Trustees has determined that the provision of non-audit services that were rendered to the registrant’s investment advisor (not including any sub-advisor whose role is primarily portfolio management and is subcontracted with or overseen by another investment advisor), and any entity controlling, controlled by, or under common control with the investment advisor that provides ongoing services to the registrant that were not pre-approved pursuant to paragraph (c)(7)(ii) of Rule 2-01 of Regulation S-X is compatible with maintaining the principal accountant’s independence. |
| (i) | No applicable. |
| (j) | Not applicable. |
Items 5. Audit Committee of Listed Registrants.
| (a) | The registrant has a separately designated standing audit committee established in accordance with Section 3(a)(58)(A) of the Securities Exchange Act of 1934. The audit committee of the registrant is comprised of: Thomas R. Kadlec, Denise M. Keefe, Niel B. Nielson, Richard E. Erickson and Robert F. Keith. |
| (b) | Not applicable. |
Item 6. Investments.
| (a) | The Schedule of Investments in securities of unaffiliated issuers as of the close of the reporting period is included as part of the report to shareholders filed under Item 1 of this form. |
| (b) | Not applicable. |
Item 7. Disclosure of Proxy Voting Policies and Procedures for Closed-End Management Investment Companies.
Not applicable.
Item 8. Portfolio Managers of Closed-End Management Investment Companies.
Not applicable.
Item 9. Purchases of Equity Securities by Closed-End Management Investment Company and Affiliated Purchasers.
Not applicable.
Item 10. Submission of Matters to a Vote of Security Holders.
There have been no material changes to the procedures by which the shareholders may recommend nominees to the registrant’s board of directors, where those changes were implemented after the registrant last provided disclosure in response to the requirements of Item 407 (c) (2) (iv) of Regulation S-K (17 CFR 229.407) (as required by Item 22 (b) (15) of Schedule 14A (17 CFR 240.14a-101)), or this Item.
Item 11. Controls and Procedures.
| (a) | The registrant’s principal executive and principal financial officers, or persons performing similar functions, have concluded that the registrant’s disclosure controls and procedures (as defined in Rule 30a-3(c) under the Investment Company Act of 1940, as amended (the “1940 Act”) (17 CFR 270.30a-3 (c))) are effective, as of a date within 90 days of the filing date of the report that includes the disclosure required by this paragraph, based on their evaluation of these controls and procedures required by Rule 30a-3(b) under the 1940 Act (17 CFR 270.30a-3(b)) and Rules 13a-15(b) or 15d-15(b) under the Securities Exchange Act of 1934, as amended (17 CFR 240.13a-15(b) or 240.15d-15 (b)). |
| (b) | There were no changes in the registrant’s internal control over financial reporting (as defined in Rule 30a-3(d) under the 1940 Act (17 CFR 270.30a-3(d)) that occurred during the registrant’s period covered by this report that have materially affected, or are reasonably likely to materially affect, the registrant’s internal control over financial reporting. |
Item 12. Disclosure of Securities Lending Activities for Closed-End Management Investment Companies.
| (a) | Not applicable. |
| (b) | Not applicable. |
Item 13. Exhibits.
| (a)(1) | Code of ethics, or any amendment thereto, that is the subject of disclosure required by Item 2 is attached hereto. |
| (a)(2) | Certifications pursuant to Rule 30a-2(a) under the 1940 Act and Section 302 of the Sarbanes-Oxley Act of 2002 are attached hereto. |
| (a)(3) | Not applicable |
| (b) | Certifications pursuant to Rule 30a-2(b) under the 1940 Act and Section 906 of the Sarbanes-Oxley Act of 2002 are attached hereto. |
SIGNATURES
Pursuant to the requirements of the Securities Exchange Act of 1934 and the Investment Company Act of 1940, the registrant has duly caused this report to be signed on its behalf by the undersigned, thereunto duly authorized.
| (Registrant) | First Trust Exchange-Traded Fund VI |
| By (Signature and Title)* | /s/ James M. Dykas | |
| James M. Dykas, President and Chief Executive Officer (principal executive officer) |
| Date: | December 9, 2022 |
Pursuant to the requirements of the Securities Exchange Act of 1934 and the Investment Company Act of 1940, this report has been signed below by the following persons on behalf of the registrant and in the capacities and on the dates indicated.
| By (Signature and Title)* | /s/ James M. Dykas | |
| James M. Dykas, President and Chief Executive Officer (principal executive officer) |
| Date: | December 9, 2022 |
| By (Signature and Title)* | /s/ Donald P. Swade | |
| Donald P. Swade, Treasurer, Chief Financial Officer and Chief Accounting Officer (principal financial officer) |
| Date: | December 9, 2022 |
* Print the name and title of each signing officer under his or her signature.