UNITED STATES
SECURITIES AND EXCHANGE COMMISSION
Washington, D.C. 20549
FORM N-CSR
CERTIFIED SHAREHOLDER REPORT OF REGISTERED MANAGEMENT INVESTMENT COMPANIES
Investment Company Act file number 811-22717
| First Trust Exchange-Traded Fund VI |
| (Exact name of registrant as specified in charter) |
| 120 East Liberty Drive, Suite 400 Wheaton, IL 60187 |
| (Address of principal executive offices) |
| W. Scott Jardine, Esq. First Trust Portfolios L.P. 120 East Liberty Drive, Suite 400 Wheaton, IL 60187 |
| (Name and address of agent for service) |
Registrant’s telephone number, including area code: (630) 765-8000
Date of fiscal year end: March 31
Date of reporting period: March 31, 2023
Form N-CSR is to be used by management investment companies to file reports with the Commission not later than 10 days after the transmission to stockholders of any report that is required to be transmitted to stockholders under Rule 30e-1 under the Investment Company Act of 1940 (17 CFR 270.30e-1). The Commission may use the information provided on Form N-CSR in its regulatory, disclosure review, inspection, and policymaking roles.
A registrant is required to disclose the information specified by Form N-CSR, and the Commission will make this information public. A registrant is not required to respond to the collection of information contained in Form N-CSR unless the Form displays a currently valid Office of Management and Budget (“OMB”) control number. Please direct comments concerning the accuracy of the information collection burden estimate and any suggestions for reducing the burden to Secretary, Securities and Exchange Commission, 100 F Street, NE, Washington, DC 20549. The OMB has reviewed this collection of information under the clearance requirements of 44 U.S.C. § 3507.
Item 1. Report to Stockholders.
| (a) | The registrant’s annual report transmitted to shareholders pursuant to Rule 30e-1 under the Investment Company Act of 1940 is as follows: |

First Trust Nasdaq Bank ETF (FTXO)
First Trust Nasdaq Food & Beverage ETF (FTXG)
First Trust Nasdaq Oil & Gas ETF (FTXN)
First Trust Nasdaq Pharmaceuticals ETF (FTXH)
First Trust S-Network E-Commerce ETF (ISHP)
First Trust Nasdaq Semiconductor ETF (FTXL)
First Trust Nasdaq Transportation ETF (FTXR)
First Trust S-Network Streaming & Gaming ETF (BNGE)
For the Year Ended
March 31, 2023
| 2 | |
| 3 | |
| Fund Performance Overview | |
| 4 | |
| 6 | |
| 8 | |
| 10 | |
| 12 | |
| 14 | |
| 16 | |
| 18 | |
| 20 | |
| 21 | |
| Portfolio of Investments | |
| 23 | |
| 24 | |
| 25 | |
| 26 | |
| 27 | |
| 29 | |
| 30 | |
| 31 | |
| 34 | |
| 36 | |
| 38 | |
| 42 | |
| 50 | |
| 60 | |
| 61 | |
| 66 | |
| 68 |


| Performance | ||||||
| Average Annual Total Returns | Cumulative Total Returns | |||||
| 1 Year Ended 3/31/23 | 5 Years Ended 3/31/23 | Inception (9/20/16) to 3/31/23 | 5 Years Ended 3/31/23 | Inception (9/20/16) to 3/31/23 | ||
| Fund Performance | ||||||
| NAV | -30.94% | -3.62% | 3.43% | -16.85% | 24.58% | |
| Market Price | -31.05% | -3.66% | 3.41% | -17.01% | 24.46% | |
| Index Performance | ||||||
| Nasdaq US Smart BanksTM Index | -30.60% | -3.01% | 4.10% | -14.18% | 29.98% | |
| Nasdaq US Benchmark Banks Index | -22.33% | 0.08% | 6.72% | 0.42% | 52.85% | |
| Nasdaq US BenchmarkTM Index | -8.97% | 10.44% | 12.01% | 64.29% | 109.61% | |
| Sector Allocation | % of Total Investments |
| Financials | 100.0% |
| Total | 100.0% |
| Top Ten Holdings | % of Total Investments |
| Citigroup, Inc. | 9.3% |
| JPMorgan Chase & Co. | 9.1 |
| Bank of America Corp. | 8.3 |
| Wells Fargo & Co. | 8.0 |
| Truist Financial Corp. | 7.3 |
| PNC Financial Services Group (The), Inc. | 4.0 |
| M&T Bank Corp. | 3.9 |
| US Bancorp | 3.8 |
| Fifth Third Bancorp | 3.7 |
| Citizens Financial Group, Inc. | 3.6 |
| Total | 61.0% |
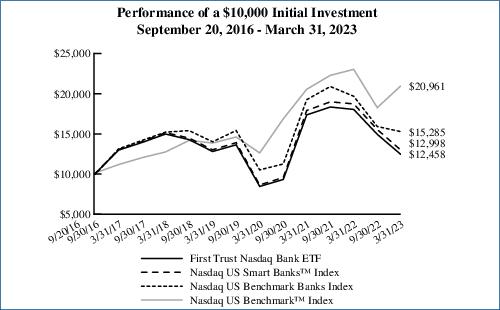
Performance figures assume reinvestment of all distributions and do not reflect the deduction of taxes that a shareholder would pay on Fund distributions or the redemption or sale of Fund shares. An index is a statistical composite that tracks a specified financial market or sector. Unlike the Fund, the indices do not actually hold a portfolio of securities and therefore do not incur the expenses incurred by the Fund. These expenses negatively impact the performance of the Fund. The Fund’s past performance does not predict future performance.
| Performance | ||||||
| Average Annual Total Returns | Cumulative Total Returns | |||||
| 1 Year Ended 3/31/23 | 5 Years Ended 3/31/23 | Inception (9/20/16) to 3/31/23 | 5 Years Ended 3/31/23 | Inception (9/20/16) to 3/31/23 | ||
| Fund Performance | ||||||
| NAV | 1.10% | 8.00% | 6.21% | 46.92% | 48.15% | |
| Market Price | 0.87% | 7.95% | 6.19% | 46.58% | 48.03% | |
| Index Performance | ||||||
| Nasdaq US Smart Food & BeverageTM Index | 1.70% | 8.69% | 6.89% | 51.70% | 54.44% | |
| Nasdaq US Benchmark Food, Beverage and Tobacco Index | 5.17% | 10.29% | 8.54% | 63.18% | 70.73% | |
| Nasdaq US BenchmarkTM Index | -8.97% | 10.44% | 12.01% | 64.29% | 109.61% | |
| Sector Allocation | % of Total Investments |
| Consumer Staples | 96.3% |
| Materials | 3.7 |
| Total | 100.0% |
| Top Ten Holdings | % of Total Investments |
| General Mills, Inc. | 8.3% |
| Mondelez International, Inc., Class A | 8.2 |
| PepsiCo, Inc. | 8.1 |
| Coca-Cola (The) Co. | 8.0 |
| Archer-Daniels-Midland Co. | 7.7 |
| Hershey (The) Co. | 4.1 |
| J.M. Smucker (The) Co. | 4.1 |
| Campbell Soup Co. | 4.0 |
| Conagra Brands, Inc. | 4.0 |
| Keurig Dr. Pepper, Inc. | 3.9 |
| Total | 60.4% |
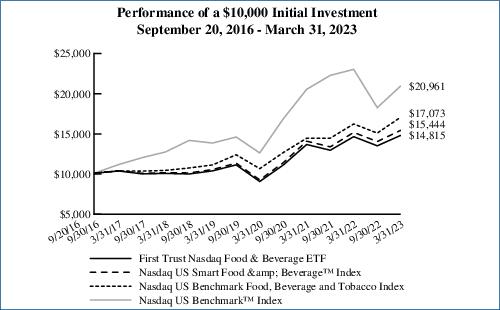
Performance figures assume reinvestment of all distributions and do not reflect the deduction of taxes that a shareholder would pay on Fund distributions or the redemption or sale of Fund shares. An index is a statistical composite that tracks a specified financial market or sector. Unlike the Fund, the indices do not actually hold a portfolio of securities and therefore do not incur the expenses incurred by the Fund. These expenses negatively impact the performance of the Fund. The Fund’s past performance does not predict future performance.
| Performance | ||||||
| Average Annual Total Returns | Cumulative Total Returns | |||||
| 1 Year Ended 3/31/23 | 5 Years Ended 3/31/23 | Inception (9/20/16) to 3/31/23 | 5 Years Ended 3/31/23 | Inception (9/20/16) to 3/31/23 | ||
| Fund Performance | ||||||
| NAV | 4.66% | 8.40% | 6.89% | 49.66% | 54.46% | |
| Market Price | 4.62% | 8.37% | 6.88% | 49.46% | 54.41% | |
| Index Performance | ||||||
| Nasdaq US Smart Oil & GasTM Index | 5.14% | 9.08% | 7.57% | 54.39% | 60.97% | |
| Nasdaq US Benchmark Energy Index | 11.05% | 8.91% | 7.63% | 53.25% | 61.62% | |
| Nasdaq US BenchmarkTM Index | -8.97% | 10.44% | 12.01% | 64.29% | 109.61% | |
| Sector Allocation | % of Total Investments |
| Energy | 100.0% |
| Total | 100.0% |
| Top Ten Holdings | % of Total Investments |
| Chevron Corp. | 8.0% |
| Exxon Mobil Corp. | 7.9 |
| ConocoPhillips | 7.6 |
| Occidental Petroleum Corp. | 7.5 |
| Marathon Petroleum Corp. | 7.5 |
| Valero Energy Corp. | 4.2 |
| Pioneer Natural Resources Co. | 4.0 |
| EOG Resources, Inc. | 4.0 |
| Cheniere Energy, Inc. | 4.0 |
| Phillips 66 | 3.9 |
| Total | 58.6% |
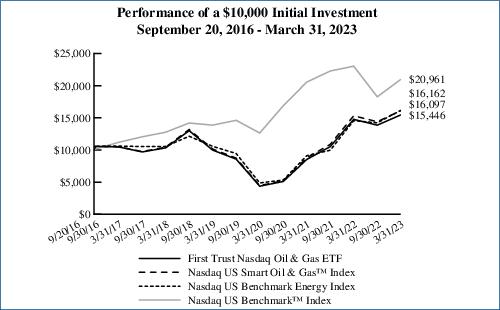
Performance figures assume reinvestment of all distributions and do not reflect the deduction of taxes that a shareholder would pay on Fund distributions or the redemption or sale of Fund shares. An index is a statistical composite that tracks a specified financial market or sector. Unlike the Fund, the indices do not actually hold a portfolio of securities and therefore do not incur the expenses incurred by the Fund. These expenses negatively impact the performance of the Fund. The Fund’s past performance does not predict future performance.
| Performance | ||||||
| Average Annual Total Returns | Cumulative Total Returns | |||||
| 1 Year Ended 3/31/23 | 5 Years Ended 3/31/23 | Inception (9/20/16) to 3/31/23 | 5 Years Ended 3/31/23 | Inception (9/20/16) to 3/31/23 | ||
| Fund Performance | ||||||
| NAV | -0.61% | 5.31% | 5.29% | 29.50% | 40.02% | |
| Market Price | -0.46% | 5.29% | 5.29% | 29.39% | 39.96% | |
| Index Performance | ||||||
| Nasdaq US Smart PharmaceuticalsTM Index | 0.07% | 5.99% | 5.99% | 33.79% | 46.17% | |
| Nasdaq US Benchmark Pharmaceuticals Index | 2.49% | 12.74% | 11.66% | 82.17% | 105.42% | |
| Nasdaq US BenchmarkTM Index | -8.97% | 10.44% | 12.01% | 64.29% | 109.61% | |
| Sector Allocation | % of Total Investments |
| Health Care | 100.0% |
| Total | 100.0% |
| Top Ten Holdings | % of Total Investments |
| AbbVie, Inc. | 7.4% |
| Johnson & Johnson | 7.2 |
| Pfizer, Inc. | 7.2 |
| Bristol-Myers Squibb Co. | 7.2 |
| Merck & Co., Inc. | 7.2 |
| Moderna, Inc. | 4.0 |
| Eli Lilly & Co. | 3.9 |
| Vertex Pharmaceuticals, Inc. | 3.9 |
| Regeneron Pharmaceuticals, Inc. | 3.9 |
| Amgen, Inc. | 3.7 |
| Total | 55.6% |
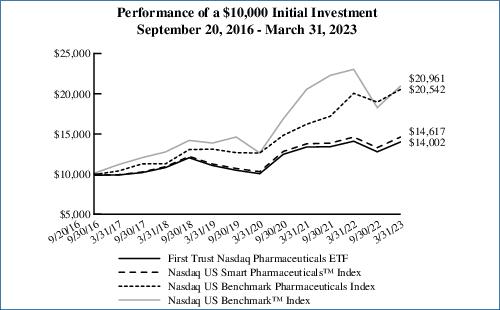
Performance figures assume reinvestment of all distributions and do not reflect the deduction of taxes that a shareholder would pay on Fund distributions or the redemption or sale of Fund shares. An index is a statistical composite that tracks a specified financial market or sector. Unlike the Fund, the indices do not actually hold a portfolio of securities and therefore do not incur the expenses incurred by the Fund. These expenses negatively impact the performance of the Fund. The Fund’s past performance does not predict future performance.
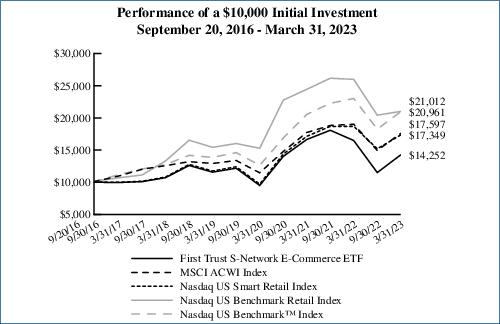
| Performance | ||||||
| Average Annual Total Returns | Cumulative Total Returns | |||||
| 1 Year Ended 3/31/23 | 5 Years Ended 3/31/23 | Inception (9/20/16) to 3/31/23 | 5 Years Ended 3/31/23 | Inception (9/20/16) to 3/31/23 | ||
| Fund Performance | ||||||
| NAV | -13.57% | 5.87% | 5.58% | 30.01% | 42.52% | |
| Market Price | -15.24% | 5.42% | 5.24% | 30.20% | 39.58% | |
| Index Performance | ||||||
| S-Network Global E-Commerce IndexTM(1)(2) | -13.91% | N/A | N/A | N/A | N/A | |
| MSCI ACWI Index(3) | -7.44% | 6.94% | 9.05% | 39.88% | 75.97% | |
| Nasdaq US Smart Retail Index | -7.15% | 9.91% | 8.81% | 60.39% | 73.49% | |
| Nasdaq US Benchmark Retail Index | -19.16% | 9.54% | 12.05% | 57.71% | 110.12% | |
| Nasdaq US BenchmarkTM Index | -8.97% | 10.44% | 12.01% | 64.29% | 109.61% | |
| (1) | On January 26, 2022, the Fund’s underlying index changed from the Nasdaq US Smart Retail Index to the S-Network Global E-Commerce IndexTM. Therefore, performance and historical returns shown for the periods prior to January 26, 2022, are not necessarily indicative of the performance of the Fund, based on its current Index, would have generated. |
| (2) | Because the Fund’s new underlying Index had an inception date of April 30, 2021, performance data is not available for all the periods shown in the table for the Index because performance data does not exist for some of the entire periods. |
| (3) | The MSCI ACWI Index serves as the Fund’s new primary benchmark index. The Fund’s investment advisor determined that the MSCI ACWI Index provides a more appropriate comparison to Fund returns. |
| Sector Allocation | % of Total Investments |
| Consumer Discretionary | 34.9% |
| Communication Services | 26.7 |
| Industrials | 15.6 |
| Financials | 11.3 |
| Real Estate | 5.0 |
| Consumer Staples | 4.4 |
| Information Technology | 2.1 |
| Total | 100.0% |
| Top Ten Holdings | % of Total Investments |
| Meta Platforms, Inc., Class A | 2.5% |
| Shopify, Inc., Class A | 2.1 |
| MercadoLibre, Inc. | 2.1 |
| Airbnb, Inc., Class A | 2.1 |
| DoorDash, Inc., Class A | 2.0 |
| Copart, Inc. | 2.0 |
| FedEx Corp. | 2.0 |
| Booking Holdings, Inc. | 1.9 |
| Snap, Inc., Class A | 1.9 |
| REA Group Ltd. | 1.9 |
| Total | 20.5% |
Performance figures assume reinvestment of all distributions and do not reflect the deduction of taxes that a shareholder would pay on Fund distributions or the redemption or sale of Fund shares. An index is a statistical composite that tracks a specified financial market or sector. Unlike the Fund, the indices do not actually hold a portfolio of securities and therefore do not incur the expenses incurred by the Fund. These expenses negatively impact the performance of the Fund. The Fund’s past performance does not predict future performance.
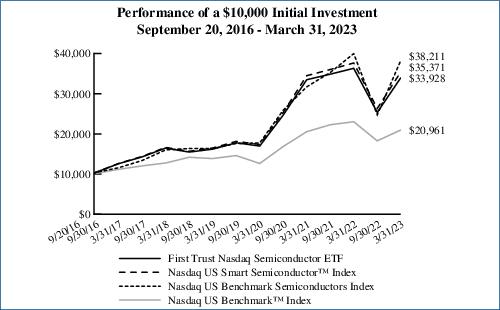
| Performance | ||||||
| Average Annual Total Returns | Cumulative Total Returns | |||||
| 1 Year Ended 3/31/23 | 5 Years Ended 3/31/23 | Inception (9/20/16) to 3/31/23 | 5 Years Ended 3/31/23 | Inception (9/20/16) to 3/31/23 | ||
| Fund Performance | ||||||
| NAV | -6.54% | 15.55% | 20.59% | 106.03% | 239.28% | |
| Market Price | -6.68% | 15.55% | 20.58% | 106.00% | 239.23% | |
| Index Performance | ||||||
| Nasdaq US Smart SemiconductorTM Index | -6.01% | 16.28% | 21.36% | 112.55% | 253.71% | |
| Nasdaq US Benchmark Semiconductors Index | -4.38% | 19.00% | 22.80% | 138.60% | 282.11% | |
| Nasdaq US BenchmarkTM Index | -8.97% | 10.44% | 12.01% | 64.29% | 109.61% | |
| Sector Allocation | % of Total Investments |
| Information Technology | 100.0% |
| Total | 100.0% |
| Top Ten Holdings | % of Total Investments |
| Intel Corp. | 9.6% |
| Texas Instruments, Inc. | 8.0 |
| Broadcom, Inc. | 7.9 |
| Micron Technology, Inc. | 7.7 |
| QUALCOMM, Inc. | 7.6 |
| NVIDIA Corp. | 4.4 |
| Lam Research Corp. | 4.0 |
| Analog Devices, Inc. | 3.9 |
| ON Semiconductor Corp. | 3.9 |
| Applied Materials, Inc. | 3.9 |
| Total | 60.9% |
Performance figures assume reinvestment of all distributions and do not reflect the deduction of taxes that a shareholder would pay on Fund distributions or the redemption or sale of Fund shares. An index is a statistical composite that tracks a specified financial market or sector. Unlike the Fund, the indices do not actually hold a portfolio of securities and therefore do not incur the expenses incurred by the Fund. These expenses negatively impact the performance of the Fund. The Fund’s past performance does not predict future performance.
| Performance | ||||||
| Average Annual Total Returns | Cumulative Total Returns | |||||
| 1 Year Ended 3/31/23 | 5 Years Ended 3/31/23 | Inception (9/20/16) to 3/31/23 | 5 Years Ended 3/31/23 | Inception (9/20/16) to 3/31/23 | ||
| Fund Performance | ||||||
| NAV | -13.76% | 3.11% | 6.26% | 16.55% | 48.60% | |
| Market Price | -13.78% | 3.08% | 6.26% | 16.37% | 48.59% | |
| Index Performance | ||||||
| Nasdaq US Smart TransportationTM Index | -13.63% | 3.50% | 6.73% | 18.75% | 53.00% | |
| Nasdaq US Benchmark Industrial Transportation Index | -9.67% | 11.77% | 14.50% | 74.43% | 142.02% | |
| Nasdaq US BenchmarkTM Index | -8.97% | 10.44% | 12.01% | 64.29% | 109.61% | |
| Sector Allocation | % of Total Investments |
| Industrials | 74.7% |
| Consumer Discretionary | 25.3 |
| Total | 100.0% |
| Top Ten Holdings | % of Total Investments |
| FedEx Corp. | 9.1% |
| United Parcel Service, Inc., Class B | 8.6 |
| Tesla, Inc. | 8.1 |
| Union Pacific Corp. | 7.8 |
| General Motors Co. | 7.6 |
| PACCAR, Inc. | 4.0 |
| CSX Corp. | 4.0 |
| Norfolk Southern Corp. | 3.8 |
| Delta Air Lines, Inc. | 3.7 |
| United Airlines Holdings, Inc. | 3.4 |
| Total | 60.1% |

Performance figures assume reinvestment of all distributions and do not reflect the deduction of taxes that a shareholder would pay on Fund distributions or the redemption or sale of Fund shares. An index is a statistical composite that tracks a specified financial market or sector. Unlike the Fund, the indices do not actually hold a portfolio of securities and therefore do not incur the expenses incurred by the Fund. These expenses negatively impact the performance of the Fund. The Fund’s past performance does not predict future performance.
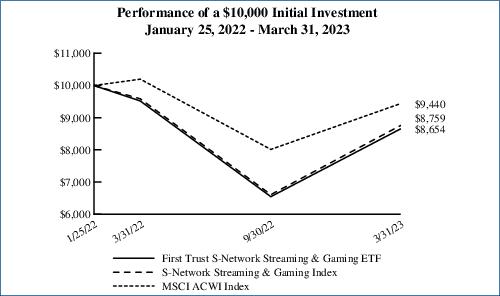
| Performance | |||
| Average Annual Total Returns | Cumulative Total Returns | ||
| 1 Year Ended 3/31/23 | Inception (1/25/22) to 3/31/23 | Inception (1/25/22) to 3/31/23 | |
| Fund Performance | |||
| NAV | -9.08% | -11.55% | -13.46% |
| Market Price | -9.37% | -11.37% | -13.25% |
| Index Performance | |||
| S-Network Streaming & Gaming Index | -8.64% | -10.64% | -12.41% |
| MSCI ACWI Index | -7.44% | -4.78% | -5.60% |
| Portfolio Sector Allocation | % of Total Long-Term Investments |
| Communication Services | 57.2% |
| Consumer Discretionary | 24.1 |
| Information Technology | 18.7 |
| Total | 100.0% |
| Top Ten Holdings | % of Total Long-Term Investments |
| NVIDIA Corp. | 6.9% |
| Advanced Micro Devices, Inc. | 5.7 |
| Warner Bros Discovery, Inc. | 4.7 |
| Flutter Entertainment PLC | 4.7 |
| Activision Blizzard, Inc. | 4.6 |
| Intel Corp. | 4.4 |
| Sony Group Corp. | 4.4 |
| Netflix, Inc. | 4.3 |
| Tencent Holdings Ltd. | 4.3 |
| NetEase, Inc., ADR | 4.3 |
| Total | 48.3% |
Performance figures assume reinvestment of all distributions and do not reflect the deduction of taxes that a shareholder would pay on Fund distributions or the redemption or sale of Fund shares. An index is a statistical composite that tracks a specified financial market or sector. Unlike the Fund, the indices do not actually hold a portfolio of securities and therefore do not incur the expenses incurred by the Fund. These expenses negatively impact the performance of the Fund. The Fund’s past performance does not predict future performance.
| Beginning Account Value October 1, 2022 | Ending Account Value March 31, 2023 | Annualized Expense Ratio Based on the Six-Month Period | Expenses Paid During the Six-Month Period (a) | |
| First Trust Nasdaq Bank ETF (FTXO) | ||||
| Actual | $1,000.00 | $833.60 | 0.60% | $2.74 |
| Hypothetical (5% return before expenses) | $1,000.00 | $1,021.94 | 0.60% | $3.02 |
| First Trust Nasdaq Food & Beverage ETF (FTXG) | ||||
| Actual | $1,000.00 | $1,096.00 | 0.60% | $3.14 |
| Hypothetical (5% return before expenses) | $1,000.00 | $1,021.94 | 0.60% | $3.02 |
| First Trust Nasdaq Oil & Gas ETF (FTXN) | ||||
| Actual | $1,000.00 | $1,114.90 | 0.60% | $3.16 |
| Hypothetical (5% return before expenses) | $1,000.00 | $1,021.94 | 0.60% | $3.02 |
| First Trust Nasdaq Pharmaceuticals ETF (FTXH) | ||||
| Actual | $1,000.00 | $1,096.20 | 0.60% | $3.14 |
| Hypothetical (5% return before expenses) | $1,000.00 | $1,021.94 | 0.60% | $3.02 |
| First Trust S-Network E-Commerce ETF (ISHP) | ||||
| Actual | $1,000.00 | $1,238.60 | 0.60% | $3.35 |
| Hypothetical (5% return before expenses) | $1,000.00 | $1,021.94 | 0.60% | $3.02 |
| First Trust Nasdaq Semiconductor ETF (FTXL) | ||||
| Actual | $1,000.00 | $1,339.10 | 0.60% | $3.50 |
| Hypothetical (5% return before expenses) | $1,000.00 | $1,021.94 | 0.60% | $3.02 |
| Beginning Account Value October 1, 2022 | Ending Account Value March 31, 2023 | Annualized Expense Ratio Based on the Six-Month Period | Expenses Paid During the Six-Month Period (a) | |
| First Trust Nasdaq Transportation ETF (FTXR) | ||||
| Actual | $1,000.00 | $1,178.80 | 0.60% | $3.26 |
| Hypothetical (5% return before expenses) | $1,000.00 | $1,021.94 | 0.60% | $3.02 |
| First Trust S-Network Streaming & Gaming ETF (BNGE) | ||||
| Actual | $1,000.00 | $1,322.20 | 0.70% | $4.05 |
| Hypothetical (5% return before expenses) | $1,000.00 | $1,021.44 | 0.70% | $3.53 |
| (a) | Expenses are equal to the annualized expense ratios as indicated in the table multiplied by the average account value over the period (October 1, 2022 through March 31, 2023), multiplied by 182/365 (to reflect the six-month period). |
| Shares | Description | Value | ||
| COMMON STOCKS – 99.7% | ||||
| Banks – 96.7% | ||||
| 27,479 | Ameris Bancorp | $1,005,182 | ||
| 67,909 | Associated Banc-Corp. | 1,221,004 | ||
| 27,558 | Atlantic Union Bankshares Corp. | 965,908 | ||
| 11,438 | BancFirst Corp. | 950,498 | ||
| 479,179 | Bank of America Corp. | 13,704,519 | ||
| 38,883 | Bank OZK | 1,329,799 | ||
| 18,402 | BOK Financial Corp. | 1,553,313 | ||
| 24,053 | Cathay General Bancorp | 830,310 | ||
| 324,241 | Citigroup, Inc. | 15,203,660 | ||
| 196,787 | Citizens Financial Group, Inc. | 5,976,421 | ||
| 28,094 | Comerica, Inc. | 1,219,841 | ||
| 15,605 | Commerce Bancshares, Inc. | 910,552 | ||
| 9,338 | Cullen/Frost Bankers, Inc. | 983,665 | ||
| 32,307 | East West Bancorp, Inc. | 1,793,038 | ||
| 226,387 | Fifth Third Bancorp | 6,030,950 | ||
| 4,922 | First Citizens BancShares, Inc., Class A | 4,789,598 | ||
| 37,744 | First Hawaiian, Inc. | 778,659 | ||
| 159,885 | FNB Corp. | 1,854,666 | ||
| 61,703 | Fulton Financial Corp. | 852,735 | ||
| 27,994 | Hancock Whitney Corp. | 1,018,982 | ||
| 60,197 | Home BancShares, Inc. | 1,306,877 | ||
| 417,944 | Huntington Bancshares, Inc. | 4,680,973 | ||
| 14,905 | Independent Bank Corp. | 978,066 | ||
| 21,273 | International Bancshares Corp. | 910,910 | ||
| 114,654 | JPMorgan Chase & Co. | 14,940,563 | ||
| 246,383 | KeyCorp | 3,084,715 | ||
| 52,921 | M&T Bank Corp. | 6,327,764 | ||
| 114,036 | Old National Bancorp | 1,644,399 | ||
| 35,510 | Pacific Premier Bancorp, Inc. | 852,950 | ||
| 29,441 | Pinnacle Financial Partners, Inc. | 1,623,966 | ||
| 52,038 | PNC Financial Services Group (The), Inc. | 6,614,030 | ||
| 23,459 | Popular, Inc. | 1,346,781 | ||
| 37,502 | Prosperity Bancshares, Inc. | 2,307,123 | ||
| 252,057 | Regions Financial Corp. | 4,678,178 | ||
| 25,877 | SouthState Corp. | 1,843,995 | ||
| 38,755 | Synovus Financial Corp. | 1,194,817 | ||
| 17,116 | Texas Capital Bancshares, Inc. (a) | 837,999 | ||
| 350,069 | Truist Financial Corp. | 11,937,353 | ||
| 12,103 | UMB Financial Corp. | 698,585 | ||
| 45,571 | United Bankshares, Inc. | 1,604,099 | ||
| 172,174 | US Bancorp | 6,206,873 | ||
| 219,945 | Valley National Bancorp | 2,032,292 | ||
| 57,993 | Webster Financial Corp. | 2,286,084 | ||
| 351,418 | Wells Fargo & Co. | 13,136,005 | ||
| 28,045 | Western Alliance Bancorp | 996,719 | ||
| 19,578 | Wintrust Financial Corp. | 1,428,215 | ||
| 20,686 | WSFS Financial Corp. | 778,000 | ||
| 159,251,631 | ||||
| Shares | Description | Value | ||
| Consumer Finance – 3.0% | ||||
| 49,711 | Discover Financial Services | $4,913,435 | ||
| Total Investments – 99.7% | 164,165,066 | |||
| (Cost $194,286,325) | ||||
| Net Other Assets and Liabilities – 0.3% | 542,958 | |||
| Net Assets – 100.0% | $164,708,024 | |||
| (a) | Non-income producing security. |
| Total Value at 3/31/2023 | Level 1 Quoted Prices | Level 2 Significant Observable Inputs | Level 3 Significant Unobservable Inputs | |
| Common Stocks* | $ 164,165,066 | $ 164,165,066 | $ — | $ — |
| * | See Portfolio of Investments for industry breakout. |
| Shares | Description | Value | ||
| COMMON STOCKS – 99.9% | ||||
| Beverages – 27.4% | ||||
| 581,855 | Brown-Forman Corp., Class B | $37,395,821 | ||
| 1,268,544 | Coca-Cola (The) Co. | 78,687,785 | ||
| 46,148 | Coca-Cola Consolidated, Inc. | 24,692,872 | ||
| 1,092,492 | Keurig Dr. Pepper, Inc. | 38,543,118 | ||
| 94,309 | Monster Beverage Corp. (a) | 5,093,629 | ||
| 120,442 | National Beverage Corp. (a) | 6,349,702 | ||
| 435,031 | PepsiCo, Inc. | 79,306,151 | ||
| 270,069,078 | ||||
| Chemicals – 3.7% | ||||
| 605,952 | Corteva, Inc. | 36,544,965 | ||
| Consumer Staples Distribution & Retail – 3.4% | ||||
| 897,496 | US Foods Holding Corp. (a) | 33,153,502 | ||
| Food Products – 64.9% | ||||
| 948,389 | Archer-Daniels-Midland Co. | 75,548,668 | ||
| 50,255 | Bunge Ltd. | 4,800,358 | ||
| 718,685 | Campbell Soup Co. | 39,513,301 | ||
| 1,036,674 | Conagra Brands, Inc. | 38,937,475 | ||
| 566,314 | Flowers Foods, Inc. | 15,522,667 | ||
| 949,426 | General Mills, Inc. | 81,137,946 | ||
| 158,356 | Hershey (The) Co. | 40,287,350 | ||
| 850,525 | Hormel Foods Corp. | 33,918,937 | ||
| 450,342 | Hostess Brands, Inc. (a) | 11,204,509 | ||
| 58,252 | Ingredion, Inc. | 5,925,976 | ||
| 255,231 | J.M. Smucker (The) Co. | 40,165,702 | ||
| 572,418 | Kellogg Co. | 38,329,109 | ||
| 969,309 | Kraft Heinz (The) Co. | 37,483,179 | ||
| 218,511 | Lamb Weston Holdings, Inc. | 22,838,770 | ||
| 46,449 | Lancaster Colony Corp. | 9,423,573 | ||
| 1,158,200 | Mondelez International, Inc., Class A | 80,749,704 | ||
| 159,886 | Post Holdings, Inc. (a) | 14,368,955 | ||
| 138,491 | Simply Good Foods (The), Co. (a) | 5,507,787 | ||
| 98,371 | TreeHouse Foods, Inc. (a) | 4,960,849 | ||
| 637,130 | Tyson Foods, Inc., Class A | 37,794,552 | ||
| 638,419,367 | ||||
| Personal Care Products – 0.5% | ||||
| 155,442 | BellRing Brands, Inc. (a) | 5,285,028 | ||
| Total Investments – 99.9% | 983,471,940 | |||
| (Cost $968,528,695) | ||||
| Net Other Assets and Liabilities – 0.1% | 867,494 | |||
| Net Assets – 100.0% | $984,339,434 | |||
| (a) | Non-income producing security. |
| Total Value at 3/31/2023 | Level 1 Quoted Prices | Level 2 Significant Observable Inputs | Level 3 Significant Unobservable Inputs | |
| Common Stocks* | $ 983,471,940 | $ 983,471,940 | $ — | $ — |
| * | See Portfolio of Investments for industry breakout. |
| Shares | Description | Value | ||
| COMMON STOCKS – 99.8% | ||||
| Energy Equipment & Services – 4.4% | ||||
| 80,592 | Baker Hughes Co. | $2,325,885 | ||
| 51,811 | ChampionX Corp. | 1,405,632 | ||
| 90,159 | Halliburton Co. | 2,852,631 | ||
| 104,186 | Liberty Energy, Inc. | 1,334,622 | ||
| 94,478 | Schlumberger N.V. | 4,638,870 | ||
| 23,911 | Weatherford International PLC (a) | 1,419,118 | ||
| 13,976,758 | ||||
| Oil, Gas & Consumable Fuels – 95.4% | ||||
| 187,817 | APA Corp. | 6,772,681 | ||
| 78,910 | Cheniere Energy, Inc. | 12,436,216 | ||
| 73,962 | Chesapeake Energy Corp. | 5,624,070 | ||
| 154,686 | Chevron Corp. | 25,238,568 | ||
| 20,409 | Chord Energy Corp. | 2,747,051 | ||
| 50,789 | Civitas Resources, Inc. | 3,470,920 | ||
| 203,317 | Comstock Resources, Inc. | 2,193,790 | ||
| 240,410 | ConocoPhillips | 23,851,076 | ||
| 314,173 | Coterra Energy, Inc. | 7,709,805 | ||
| 49,830 | CVR Energy, Inc. | 1,633,427 | ||
| 18,914 | Denbury, Inc. (a) | 1,657,434 | ||
| 229,251 | Devon Energy Corp. | 11,602,393 | ||
| 64,932 | Diamondback Energy, Inc. | 8,776,858 | ||
| 109,828 | EOG Resources, Inc. | 12,589,584 | ||
| 152,278 | EQT Corp. | 4,859,191 | ||
| 226,214 | Exxon Mobil Corp. | 24,806,627 | ||
| 42,708 | Hess Corp. | 5,651,977 | ||
| 110,336 | HF Sinclair Corp. | 5,338,056 | ||
| 202,768 | Kosmos Energy Ltd. (a) | 1,508,594 | ||
| 85,723 | Magnolia Oil & Gas Corp., Class A | 1,875,619 | ||
| 311,153 | Marathon Oil Corp. | 7,455,226 | ||
| 174,490 | Marathon Petroleum Corp. | 23,526,487 | ||
| 53,647 | Matador Resources, Co. | 2,556,280 | ||
| 78,664 | Murphy Oil Corp. | 2,908,995 | ||
| 378,479 | Occidental Petroleum Corp. | 23,628,444 | ||
| 65,009 | ONEOK, Inc. | 4,130,672 | ||
| 120,421 | Ovintiv, Inc. | 4,344,790 | ||
| 160,105 | PBF Energy, Inc., Class A | 6,942,153 | ||
| 59,910 | PDC Energy, Inc. | 3,845,024 | ||
| 172,513 | Permian Resources Corp. | 1,811,387 | ||
| 121,116 | Phillips 66 | 12,278,740 | ||
| 62,031 | Pioneer Natural Resources Co. | 12,669,211 | ||
| 58,810 | Range Resources Corp. | 1,556,701 | ||
| 846,191 | Southwestern Energy Co. (a) | 4,230,955 | ||
| 45,996 | Targa Resources Corp. | 3,355,408 | ||
| 786 | Texas Pacific Land Corp. | 1,337,002 | ||
| Shares | Description | Value | ||
| Oil, Gas & Consumable Fuels (Continued) | ||||
| 94,222 | Valero Energy Corp. | $13,153,391 | ||
| 300,074,803 | ||||
| Total Investments – 99.8% | 314,051,561 | |||
| (Cost $309,207,818) | ||||
| Net Other Assets and Liabilities – 0.2% | 544,677 | |||
| Net Assets – 100.0% | $314,596,238 | |||
| (a) | Non-income producing security. |
| Total Value at 3/31/2023 | Level 1 Quoted Prices | Level 2 Significant Observable Inputs | Level 3 Significant Unobservable Inputs | |
| Common Stocks* | $ 314,051,561 | $ 314,051,561 | $ — | $ — |
| * | See Portfolio of Investments for industry breakout. |
| Shares | Description | Value | ||
| COMMON STOCKS – 99.9% | ||||
| Biotechnology – 44.2% | ||||
| 15,163 | AbbVie, Inc. | $2,416,527 | ||
| 7,838 | ACADIA Pharmaceuticals, Inc. (a) | 147,511 | ||
| 6,065 | Alkermes PLC (a) | 170,972 | ||
| 847 | Alnylam Pharmaceuticals, Inc. (a) | 169,671 | ||
| 5,036 | Amgen, Inc. | 1,217,453 | ||
| 12,296 | Amicus Therapeutics, Inc. (a) | 136,363 | ||
| 3,862 | Biogen, Inc. (a) | 1,073,752 | ||
| 1,629 | BioMarin Pharmaceutical, Inc. (a) | 158,404 | ||
| 2,602 | Exact Sciences Corp. (a) | 176,442 | ||
| 15,179 | Exelixis, Inc. (a) | 294,624 | ||
| 14,489 | Gilead Sciences, Inc. | 1,202,152 | ||
| 4,657 | Halozyme Therapeutics, Inc. (a) | 177,851 | ||
| 9,690 | Incyte Corp. (a) | 700,296 | ||
| 4,517 | Ionis Pharmaceuticals, Inc. (a) | 161,438 | ||
| 7,804 | IVERIC bio, Inc. (a) | 189,871 | ||
| 813 | Karuna Therapeutics, Inc. (a) | 147,673 | ||
| 8,405 | Moderna, Inc. (a) | 1,290,840 | ||
| 1,875 | Neurocrine Biosciences, Inc. (a) | 189,788 | ||
| 1,325 | Prometheus Biosciences, Inc. (a) | 142,199 | ||
| 2,909 | Prothena Corp. PLC (a) | 140,999 | ||
| 3,713 | PTC Therapeutics, Inc. (a) | 179,858 | ||
| 1,535 | Regeneron Pharmaceuticals, Inc. (a) | 1,261,263 | ||
| 20,046 | Roivant Sciences Ltd. (a) | 147,940 | ||
| 1,328 | Sarepta Therapeutics, Inc. (a) | 183,038 | ||
| 903 | Seagen, Inc. (a) | 182,830 | ||
| 2,685 | United Therapeutics Corp. (a) | 601,333 | ||
| 3,958 | Vaxcyte, Inc. (a) | 148,346 | ||
| 4,019 | Vertex Pharmaceuticals, Inc. (a) | 1,266,266 | ||
| 7,113 | Vir Biotechnology, Inc. (a) | 165,520 | ||
| 14,441,220 | ||||
| Health Care Equipment & Supplies – 0.4% | ||||
| 2,107 | Novocure Ltd. (a) | 126,715 | ||
| Health Care Providers & Services – 3.6% | ||||
| 15,411 | Cardinal Health, Inc. | 1,163,530 | ||
| Life Sciences Tools & Services – 3.5% | ||||
| 2,421 | Charles River Laboratories International, Inc. (a) | 488,606 | ||
| 1,846 | Medpace Holdings, Inc. (a) | 347,141 | ||
| 8,600 | Syneos Health, Inc. (a) | 306,332 | ||
| 1,142,079 | ||||
| Pharmaceuticals – 48.2% | ||||
| 2,379 | Axsome Therapeutics, Inc. (a) | 146,737 | ||
| 33,840 | Bristol-Myers Squibb Co. | 2,345,450 | ||
| 4,113 | Catalent, Inc. (a) | 270,265 | ||
| 14,139 | Elanco Animal Health, Inc. (a) | 132,907 | ||
| Shares | Description | Value | ||
| Pharmaceuticals (Continued) | ||||
| 3,749 | Eli Lilly & Co. | $1,287,482 | ||
| 3,683 | Harmony Biosciences Holdings, Inc. (a) | 120,250 | ||
| 7,241 | Jazz Pharmaceuticals PLC (a) | 1,059,576 | ||
| 15,226 | Johnson & Johnson | 2,360,030 | ||
| 21,965 | Merck & Co., Inc. | 2,336,856 | ||
| 30,293 | Organon & Co. | 712,491 | ||
| 6,587 | Perrigo Co. PLC | 236,276 | ||
| 57,519 | Pfizer, Inc. | 2,346,775 | ||
| 3,548 | Prestige Consumer Healthcare, Inc. (a) | 222,211 | ||
| 102,348 | Viatris, Inc. | 984,588 | ||
| 6,987 | Zoetis, Inc. | 1,162,916 | ||
| 15,724,810 | ||||
| Total Investments – 99.9% | 32,598,354 | |||
| (Cost $32,505,824) | ||||
| Net Other Assets and Liabilities – 0.1% | 41,349 | |||
| Net Assets – 100.0% | $32,639,703 | |||
| (a) | Non-income producing security. |
| Total Value at 3/31/2023 | Level 1 Quoted Prices | Level 2 Significant Observable Inputs | Level 3 Significant Unobservable Inputs | |
| Common Stocks* | $ 32,598,354 | $ 32,598,354 | $ — | $ — |
| * | See Portfolio of Investments for industry breakout. |
| Shares | Description | Value | ||
| COMMON STOCKS – 97.6% | ||||
| Air Freight & Logistics – 7.2% | ||||
| 2,111 | Deutsche Post AG (a) | $98,870 | ||
| 452 | FedEx Corp. | 103,278 | ||
| 474 | United Parcel Service, Inc., Class B | 91,951 | ||
| 3,047 | ZTO Express Cayman, Inc., ADR (b) | 87,327 | ||
| 381,426 | ||||
| Banks – 1.4% | ||||
| 3,901 | KakoaBank Corp. (a) | 72,910 | ||
| Broadline Retail – 15.4% | ||||
| 766 | Alibaba Group Holding Ltd., ADR (b) | 78,270 | ||
| 909 | Amazon.com, Inc. (b) | 93,891 | ||
| 5,124 | Coupang, Inc. (b) | 81,984 | ||
| 1,866 | eBay, Inc. | 82,794 | ||
| 658 | Etsy, Inc. (b) | 73,255 | ||
| 1,372 | JD.com, Inc., ADR | 60,217 | ||
| 85 | MercadoLibre, Inc. (b) | 112,035 | ||
| 444 | Naspers Ltd., Class N (a) | 82,271 | ||
| 927 | PDD Holdings, Inc., ADR (b) | 70,359 | ||
| 1,066 | Prosus N.V. (a) | 83,472 | ||
| 818,548 | ||||
| Commercial Services & Supplies – 1.9% | ||||
| 1,385 | Copart, Inc. (b) | 104,166 | ||
| Consumer Staples Distribution & Retail – 4.3% | ||||
| 92,000 | Alibaba Health Information Technology Ltd. (a) (b) | 66,352 | ||
| 10,106 | JD Health International, Inc. (a) (b) (c) (d) | 74,936 | ||
| 598 | Walmart, Inc. | 88,175 | ||
| 229,463 | ||||
| Financial Services – 9.8% | ||||
| 61 | Adyen N.V. (a) (b) (c) (d) | 97,199 | ||
| 1,251 | Fidelity National Information Services, Inc. | 67,967 | ||
| 846 | Fiserv, Inc. (b) | 95,623 | ||
| 445 | FleetCor Technologies, Inc. (b) | 93,828 | ||
| 800 | Global Payments, Inc. | 84,192 | ||
| 1,086 | PayPal Holdings, Inc. (b) | 82,471 | ||
| 521,280 | ||||
| Ground Transportation – 1.8% | ||||
| 2,984 | Uber Technologies, Inc. (b) | 94,593 | ||
| Hotels, Restaurants & Leisure – 11.5% | ||||
| 880 | Airbnb, Inc., Class A (b) | 109,472 | ||
| 38 | Booking Holdings, Inc. (b) | 100,792 | ||
| 1,604 | Delivery Hero SE (a) (b) (c) (d) | 54,720 | ||
| Shares | Description | Value | ||
| Hotels, Restaurants & Leisure (Continued) | ||||
| 1,665 | DoorDash, Inc., Class A (b) | $105,827 | ||
| 841 | Expedia Group, Inc. (b) | 81,602 | ||
| 3,907 | Meituan, Class B (a) (b) (c) (d) | 70,882 | ||
| 2,343 | Trip.com Group Ltd., ADR (b) | 88,261 | ||
| 611,556 | ||||
| Interactive Media & Services – 24.8% | ||||
| 951 | Alphabet, Inc., Class A (b) | 98,647 | ||
| 12,901 | Auto Trader Group PLC (a) (c) (d) | 98,405 | ||
| 635 | Baidu, Inc., ADR (b) | 95,834 | ||
| 5,715 | carsales.com Ltd. (a) | 85,411 | ||
| 9,200 | Kuaishou Technology (a) (b) (c) (d) | 70,742 | ||
| 634 | Meta Platforms, Inc., Class A (b) | 134,370 | ||
| 555 | NAVER Corp. (a) | 86,963 | ||
| 3,277 | Pinterest, Inc., Class A (b) | 89,364 | ||
| 1,078 | REA Group Ltd. (a) | 100,516 | ||
| 13,062 | Rightmove PLC (a) | 90,920 | ||
| 5,600 | SEEK Ltd. (a) | 90,525 | ||
| 8,987 | Snap, Inc., Class A (b) | 100,744 | ||
| 4,328 | Weibo Corp., ADR (b) | 86,820 | ||
| 6,796 | Yandex N.V., Class A (a) (b) (e) (f) | 0 | ||
| 32,800 | Z Holdings Corp. (a) | 93,003 | ||
| 1,322,264 | ||||
| IT Services – 2.1% | ||||
| 2,357 | Shopify, Inc., Class A (b) | 112,995 | ||
| Marine Transportation – 3.2% | ||||
| 41 | AP Moller - Maersk A.S., Class B (a) | 74,526 | ||
| 84,500 | COSCO SHIPPING Holdings Co., Ltd., Class H (a) | 95,263 | ||
| 169,789 | ||||
| Professional Services – 1.4% | ||||
| 1,079 | CoStar Group, Inc. (b) | 74,289 | ||
| Real Estate Management & Development – 3.3% | ||||
| 4,601 | KE Holdings, Inc., ADR (b) | 86,683 | ||
| 2,004 | Zillow Group, Inc., Class C (b) | 89,118 | ||
| 175,801 | ||||
| Specialty Retail – 5.9% | ||||
| 1,003 | Best Buy Co., Inc. | 78,505 | ||
| 1,295 | CarMax, Inc. (b) | 83,243 | ||
| 1,980 | Chewy, Inc., Class A (b) | 74,012 | ||
| 1,914 | Zalando SE (a) (b) (c) (d) | 80,217 | ||
| 315,977 | ||||
| Shares | Description | Value | ||
| COMMON STOCKS (Continued) | ||||
| Textiles, Apparel & Luxury Goods – 1.9% | ||||
| 275 | Lululemon Athletica, Inc. (b) | $100,152 | ||
| Wireless Telecommunication Services – 1.7% | ||||
| 27,243 | Taiwan Mobile Co., Ltd. (a) | 90,394 | ||
| Total Common Stocks | 5,195,603 | |||
| (Cost $6,137,705) | ||||
| REAL ESTATE INVESTMENT TRUSTS – 1.6% | ||||
| Industrial REITs – 1.6% | ||||
| 709 | Prologis, Inc. | 88,462 | ||
| (Cost $108,155) | ||||
| Total Investments – 99.2% | 5,284,065 | |||
| (Cost $6,245,860) | ||||
| Net Other Assets and Liabilities – 0.8% | 40,163 | |||
| Net Assets – 100.0% | $5,324,228 | |||
| (a) | This security is fair valued by the Advisor’s Pricing Committee in accordance with procedures approved by the Trust’s Board of Trustees and in accordance with provisions of the Investment Company Act of 1940 and rules thereunder, as amended. At March 31, 2023, securities noted as such are valued at $1,758,497 or 33.0% of net assets. Certain of these securities are fair valued using a factor provided by a third-party pricing service due to the change in value between the foreign markets’ close and the New York Stock Exchange close exceeding a certain threshold. On days when this threshold is not exceeded, these securities are typically valued at the last sale price on the exchange on which they are principally traded. |
| (b) | Non-income producing security. |
| (c) | This security may be resold to qualified foreign investors and foreign institutional buyers under Regulation S of the Securities Act of 1933, as amended (the “1933 Act”). |
| (d) | This security is exempt from registration upon resale under Rule 144A of the 1933 Act and may be resold in transactions exempt from registration, normally to qualified institutional buyers. This security is not restricted on the foreign exchange where it trades freely without any additional registration. As such, it does not require the additional disclosure required of restricted securities. |
| (e) | Pursuant to procedures adopted by the Trust’s Board of Trustees, this security has been determined to be illiquid by the Advisor. |
| (f) | This security’s value was determined using significant unobservable inputs (see Note 2A – Portfolio Valuation in the Notes to Financial Statements). |
| ADR | American Depositary Receipt |
| Currency Exposure Diversification | % of Total Investments |
| United States Dollar | 66.7% |
| Euro | 7.8 |
| Hong Kong Dollar | 7.2 |
| Australian Dollar | 5.2 |
| British Pound Sterling | 3.6 |
| South Korean Won | 3.0 |
| Japanese Yen | 1.8 |
| New Taiwan Dollar | 1.7 |
| South African Rand | 1.6 |
| Danish Krone | 1.4 |
| Total | 100.0% |
| Total Value at 3/31/2023 | Level 1 Quoted Prices | Level 2 Significant Observable Inputs | Level 3 Significant Unobservable Inputs | |
| Common Stocks: | ||||
| Air Freight & Logistics | $ 381,426 | $ 282,556 | $ 98,870 | $ — |
| Banks | 72,910 | — | 72,910 | — |
| Broadline Retail | 818,548 | 652,805 | 165,743 | — |
| Consumer Staples Distribution & Retail | 229,463 | 88,175 | 141,288 | — |
| Financial Services | 521,280 | 424,081 | 97,199 | — |
| Hotels, Restaurants & Leisure | 611,556 | 485,954 | 125,602 | — |
| Interactive Media & Services | 1,322,264 | 605,779 | 716,485 | —** |
| Marine Transportation | 169,789 | — | 169,789 | — |
| Specialty Retail | 315,977 | 235,760 | 80,217 | — |
| Wireless Telecommunication Services | 90,394 | — | 90,394 | — |
| Other Industry Categories* | 661,996 | 661,996 | — | — |
| Real Estate Investment Trusts* | 88,462 | 88,462 | — | — |
| Total Investments | $ 5,284,065 | $ 3,525,568 | $ 1,758,497 | $—** |
| * | See Portfolio of Investments for industry breakout. |
| ** | Investment is valued at $0. |
| Shares | Description | Value | ||
| COMMON STOCKS – 99.8% | ||||
| Electronic Equipment, Instruments & Components – 4.2% | ||||
| 77,179 | Advanced Energy Industries, Inc. | $7,563,542 | ||
| 102,171 | Avnet, Inc. | 4,618,129 | ||
| 63,145 | IPG Photonics Corp. (a) | 7,786,410 | ||
| 961,048 | Vishay Intertechnology, Inc. | 21,738,906 | ||
| 41,706,987 | ||||
| Semiconductors & Semiconductor Equipment – 95.6% | ||||
| 128,417 | Allegro MicroSystems, Inc. (a) | 6,162,732 | ||
| 1,405,440 | Amkor Technology, Inc. | 36,569,549 | ||
| 197,334 | Analog Devices, Inc. | 38,918,212 | ||
| 311,709 | Applied Materials, Inc. | 38,287,216 | ||
| 65,891 | Axcelis Technologies, Inc. (a) | 8,779,976 | ||
| 121,715 | Broadcom, Inc. | 78,085,041 | ||
| 203,132 | Cirrus Logic, Inc. (a) | 22,218,578 | ||
| 169,878 | Diodes, Inc. (a) | 15,757,883 | ||
| 2,904,509 | Intel Corp. | 94,890,309 | ||
| 95,460 | KLA Corp. | 38,104,768 | ||
| 74,430 | Lam Research Corp. | 39,456,832 | ||
| 101,251 | Lattice Semiconductor Corp. (a) | 9,669,471 | ||
| 91,786 | MACOM Technology Solutions Holdings, Inc. (a) | 6,502,120 | ||
| 446,822 | Microchip Technology, Inc. | 37,434,747 | ||
| 1,252,327 | Micron Technology, Inc. | 75,565,411 | ||
| 14,012 | Monolithic Power Systems, Inc. | 7,013,566 | ||
| 155,867 | NVIDIA Corp. | 43,295,177 | ||
| 202,828 | NXP Semiconductors N.V. | 37,822,351 | ||
| 467,582 | ON Semiconductor Corp. (a) | 38,491,350 | ||
| 60,709 | Onto Innovation, Inc. (a) | 5,335,107 | ||
| 102,492 | Power Integrations, Inc. | 8,674,923 | ||
| 358,967 | Qorvo, Inc. (a) | 36,460,278 | ||
| 586,203 | QUALCOMM, Inc. | 74,787,779 | ||
| 25,615 | Silicon Laboratories, Inc. (a) | 4,484,930 | ||
| 324,517 | Skyworks Solutions, Inc. | 38,286,516 | ||
| 227,530 | Teradyne, Inc. | 24,461,750 | ||
| 422,412 | Texas Instruments, Inc. | 78,572,856 | ||
| 944,089,428 | ||||
| Total Investments – 99.8% | 985,796,415 | |||
| (Cost $945,362,146) | ||||
| Net Other Assets and Liabilities – 0.2% | 2,299,635 | |||
| Net Assets – 100.0% | $988,096,050 | |||
| (a) | Non-income producing security. |
| Total Value at 3/31/2023 | Level 1 Quoted Prices | Level 2 Significant Observable Inputs | Level 3 Significant Unobservable Inputs | |
| Common Stocks* | $ 985,796,415 | $ 985,796,415 | $ — | $ — |
| * | See Portfolio of Investments for industry breakout. |
| Shares | Description | Value | ||
| COMMON STOCKS – 99.9% | ||||
| Air Freight & Logistics – 23.6% | ||||
| 9,818 | CH Robinson Worldwide, Inc. | $975,615 | ||
| 12,287 | Expeditors International of Washington, Inc. | 1,353,044 | ||
| 18,897 | FedEx Corp. | 4,317,776 | ||
| 2,361 | Forward Air Corp. | 254,421 | ||
| 2,998 | Hub Group, Inc., Class A (a) | 251,652 | ||
| 21,044 | United Parcel Service, Inc., Class B | 4,082,326 | ||
| 11,234,834 | ||||
| Automobile Components – 6.1% | ||||
| 6,317 | Aptiv PLC (a) | 708,704 | ||
| 19,387 | BorgWarner, Inc. | 952,096 | ||
| 2,618 | Dorman Products, Inc. (a) | 225,829 | ||
| 8,530 | Gentex Corp. | 239,096 | ||
| 4,097 | Lear Corp. | 571,490 | ||
| 1,457 | Visteon Corp. (a) | 228,501 | ||
| 2,925,716 | ||||
| Automobiles – 15.7% | ||||
| 99,127 | General Motors Co. | 3,635,978 | ||
| 18,669 | Tesla, Inc. (a) | 3,873,071 | ||
| 7,509,049 | ||||
| Construction & Engineering – 0.9% | ||||
| 8,708 | WillScot Mobile Mini Holdings Corp. (a) | 408,231 | ||
| Distributors – 3.3% | ||||
| 5,041 | Genuine Parts Co. | 843,410 | ||
| 13,257 | LKQ Corp. | 752,467 | ||
| 1,595,877 | ||||
| Ground Transportation – 27.5% | ||||
| 62,974 | CSX Corp. | 1,885,442 | ||
| 5,966 | JB Hunt Transport Services, Inc. | 1,046,794 | ||
| 15,809 | Knight-Swift Transportation Holdings, Inc. | 894,473 | ||
| 2,112 | Landstar System, Inc. | 378,597 | ||
| 8,541 | Norfolk Southern Corp. | 1,810,692 | ||
| 3,075 | Old Dominion Freight Line, Inc. | 1,048,083 | ||
| 14,395 | Ryder System, Inc. | 1,284,610 | ||
| 1,085 | Saia, Inc. (a) | 295,207 | ||
| 18,527 | Union Pacific Corp. | 3,728,744 | ||
| 5,903 | Werner Enterprises, Inc. | 268,527 | ||
| 14,292 | XPO, Inc. (a) | 455,915 | ||
| 13,097,084 | ||||
| Machinery – 6.6% | ||||
| 8,369 | Allison Transmission Holdings, Inc. | 378,614 | ||
| Shares | Description | Value | ||
| Machinery (Continued) | ||||
| 4,616 | Federal Signal Corp. | $250,233 | ||
| 25,885 | PACCAR, Inc. | 1,894,782 | ||
| 5,976 | Westinghouse Air Brake Technologies Corp. | 603,934 | ||
| 3,127,563 | ||||
| Passenger Airlines – 9.6% | ||||
| 81,604 | American Airlines Group, Inc. (a) | 1,203,659 | ||
| 50,079 | Delta Air Lines, Inc. (a) | 1,748,759 | ||
| 36,952 | United Airlines Holdings, Inc. (a) | 1,635,126 | ||
| 4,587,544 | ||||
| Trading Companies & Distributors – 6.6% | ||||
| 3,881 | Herc Holdings, Inc. | 442,046 | ||
| 16,897 | Triton International Ltd. | 1,068,228 | ||
| 4,098 | United Rentals, Inc. | 1,621,825 | ||
| 3,132,099 | ||||
| Total Investments – 99.9% | 47,617,997 | |||
| (Cost $50,036,810) | ||||
| Net Other Assets and Liabilities – 0.1% | 47,311 | |||
| Net Assets – 100.0% | $47,665,308 | |||
| (a) | Non-income producing security. |
| Total Value at 3/31/2023 | Level 1 Quoted Prices | Level 2 Significant Observable Inputs | Level 3 Significant Unobservable Inputs | |
| Common Stocks* | $ 47,617,997 | $ 47,617,997 | $ — | $ — |
| * | See Portfolio of Investments for industry breakout. |
| Shares | Description | Value | ||
| COMMON STOCKS (a) – 99.5% | ||||
| Australia – 2.6% | ||||
| 3,706 | Aristocrat Leisure Ltd. (b) | $92,659 | ||
| 25,027 | Tabcorp Holdings Ltd. (b) | 16,687 | ||
| 109,346 | ||||
| Cayman Islands – 19.0% | ||||
| 2,004 | Bilibili, Inc., ADR (c) (d) | 47,094 | ||
| 1,889 | Hello Group, Inc., ADR | 17,190 | ||
| 5,077 | iQIYI, Inc., ADR (d) | 36,961 | ||
| 4,774 | JOYY, Inc., ADR | 148,853 | ||
| 13,775 | Kuaishou Technology (b) (d) (e) (f) | 105,921 | ||
| 2,014 | NetEase, Inc., ADR | 178,118 | ||
| 3,671 | Tencent Holdings Ltd. (b) | 179,399 | ||
| 10,636 | Tencent Music Entertainment Group, ADR (d) | 88,066 | ||
| 801,602 | ||||
| Greece – 0.5% | ||||
| 1,338 | OPAP S.A. (b) | 21,460 | ||
| Ireland – 4.6% | ||||
| 1,084 | Flutter Entertainment PLC (b) (d) | 195,599 | ||
| Isle Of Man (U.K.) – 1.3% | ||||
| 3,673 | Entain PLC (b) | 57,042 | ||
| Japan – 9.8% | ||||
| 2,861 | Nexon Co., Ltd. (b) | 68,317 | ||
| 4,090 | Nintendo Co., Ltd. (b) | 158,862 | ||
| 2,023 | Sony Group Corp. (b) | 184,262 | ||
| 411,441 | ||||
| Luxembourg – 2.7% | ||||
| 837 | Spotify Technology S.A. (d) | 111,840 | ||
| Malta – 0.5% | ||||
| 1,717 | Kindred Group PLC, SDR (b) | 19,227 | ||
| South Korea – 0.5% | ||||
| 302 | AfreecaTV Co., Ltd. (b) | 19,849 | ||
| Sweden – 4.1% | ||||
| 1,132 | Evolution AB (b) (e) (f) | 151,664 | ||
| 896 | Viaplay Group AB (b) (d) | 22,905 | ||
| 174,569 | ||||
| United States – 53.9% | ||||
| 2,233 | Activision Blizzard, Inc. | 191,122 | ||
| 2,426 | Advanced Micro Devices, Inc. (d) | 237,772 | ||
| 893 | Bally’s Corp. (d) | 17,431 | ||
| 2,431 | Draftkings, Inc., Class A (d) | 47,064 | ||
| 1,359 | Electronic Arts, Inc. | 163,692 | ||
| 9,131 | fuboTV, Inc. (d) | 11,049 | ||
| 1,633 | GameStop Corp., Class A (c) (d) | 37,592 | ||
| 2,562 | iHeartMedia, Inc., Class A (d) | 9,992 | ||
| Shares | Description | Value | ||
| United States (Continued) | ||||
| 5,670 | Intel Corp. | $185,239 | ||
| 587 | Light & Wonder, Inc. (d) | 35,249 | ||
| 2,011 | MGM Resorts International | 89,329 | ||
| 520 | Netflix, Inc. (d) | 179,650 | ||
| 1,040 | NVIDIA Corp. | 288,881 | ||
| 975 | Penn Entertainment, Inc. (d) | 28,918 | ||
| 2,661 | ROBLOX Corp., Class A (d) | 119,692 | ||
| 770 | Roku, Inc. (d) | 50,681 | ||
| 4,512 | Rush Street Interactive, Inc. (d) | 14,032 | ||
| 981 | Take-Two Interactive Software, Inc. (d) | 117,033 | ||
| 1,613 | Unity Software, Inc. (d) | 52,326 | ||
| 1,721 | Walt Disney (The) Co. (d) | 172,324 | ||
| 13,061 | Warner Bros Discovery, Inc. (d) | 197,221 | ||
| 1,926 | Xperi, Inc. | 21,051 | ||
| 2,267,340 | ||||
| Total Common Stocks | 4,189,315 | |||
| (Cost $4,213,648) | ||||
| WARRANTS (a) – 0.0% | ||||
| Australia – 0.0% | ||||
| 339 | �� | PointsBet Holdings Ltd., expiring 7/28/24 (b) (d) (g) | 0 | |
| (Cost $0) | ||||
| MONEY MARKET FUNDS – 1.7% | ||||
| 71,857 | Goldman Sachs Financial Square Treasury Obligations Fund - Institutional Class - 4.69% (h) (i) | 71,857 | ||
| (Cost $71,857) | ||||
| Principal Value | Description | Value | ||
| REPURCHASE AGREEMENTS – 0.3% | ||||
| $11,568 | BNP Paribas, 4.74% (h), dated 03/31/23, due 04/03/23 with a maturity value of $11,572. Collateralized by U.S. Treasury Securities, interest rates of 1.50% to 2.125%, due 05/15/2025 to 11/30/2028. The value of the collateral including accrued interest is 11,835. (i) | 11,568 | ||
| (Cost $11,568) | ||||
| Total Investments – 101.5% | 4,272,740 | |||
| (Cost $4,297,073) | ||||
| Net Other Assets and Liabilities – (1.5)% | (63,174) | |||
| Net Assets – 100.0% | $4,209,566 | |||
| (a) | Portfolio securities are categorized based upon their country of incorporation, which can be different from the country categorization of the Fund’s underlying index. For a breakdown of the portfolio securities by sector, please see the Fund Performance Overview. |
| (b) | This security is fair valued by the Advisor’s Pricing Committee in accordance with procedures approved by the Trust’s Board of Trustees and in accordance with provisions of the Investment Company Act of 1940 and rules thereunder, as amended. At March 31, 2023, securities noted as such are valued at $1,293,853 or 30.7% of net assets. Certain of these securities are fair valued using a factor provided by a third-party pricing service due to the change in value between the foreign markets’ close and the New York Stock Exchange close exceeding a certain threshold. On days when this threshold is not exceeded, these securities are typically valued at the last sale price on the exchange on which they are principally traded. |
| (c) | All or a portion of this security is on loan (See Note 2E - Securities Lending in the Notes to Financial Statements). The remaining contractual maturity of all of the securities lending transactions is overnight and continuous. The aggregate value of such securities is $79,180 and the total value of the collateral held by the Fund is $83,425. |
| (d) | Non-income producing security. |
| (e) | This security may be resold to qualified foreign investors and foreign institutional buyers under Regulation S of the Securities Act of 1933, as amended (the “1933 Act”). |
| (f) | This security is exempt from registration upon resale under Rule 144A of the 1933 Act and may be resold in transactions exempt from registration, normally to qualified institutional buyers. This security is not restricted on the foreign exchange where it trades freely without any additional registration. As such, it does not require the additional disclosure required of restricted securities. |
| (g) | Pursuant to procedures adopted by the Trust’s Board of Trustees, this security has been determined to be illiquid by the Advisor. |
| (h) | Rate shown reflects yield as of March 31, 2023. |
| (i) | This security serves as collateral for securities on loan. |
| ADR | American Depositary Receipt |
| SDR | Swedish Depositary Receipt |
| Securities Lending Agency Agreement | |
| Total gross amount presented on the Statements of Assets and Liabilities (1) | $79,180 |
| Non-cash Collateral (2) | (79,180) |
| Net Amount | $— |
| (1) | The amount presented on the Statements of Assets and Liabilities, which is included in “Investments, at value,” is not offset and is shown on a gross basis. |
| (2) | At March 31, 2023, the value of the collateral received from each borrower exceeded the value of the related securites loaned. This amount is disclosed on the Portfolio of Investments. |
| Repurchase Agreements | |
| Total gross amount presented on the Statements of Assets and Liabilities (3) | $11,568 |
| Non-cash Collateral (4) | (11,568) |
| Net Amount | $— |
| (3) | The amount is included in “Investments, at value” on the Statements of Assets and Liabilities. |
| (4) | At March 31, 2023, the value of the collateral received from each seller exceeded the value of the repurchase agreements. |
| Currency Exposure Diversification | % of Total Investments |
| United States Dollar | 69.7% |
| Japanese Yen | 9.6 |
| Hong Kong Dollar | 6.7 |
| British Pound Sterling | 5.9 |
| Swedish Krona | 4.5 |
| Australian Dollar | 2.6 |
| Euro | 0.5 |
| South Korean Won | 0.5 |
| Total | 100.0% |
| Total Value at 3/31/2023 | Level 1 Quoted Prices | Level 2 Significant Observable Inputs | Level 3 Significant Unobservable Inputs | |
| Common Stocks: | ||||
| Cayman Islands | $ 801,602 | $ 516,282 | $ 285,320 | $ — |
| Luxembourg | 111,840 | 111,840 | — | — |
| United States | 2,267,340 | 2,267,340 | — | — |
| Other Country Categories* | 1,008,533 | — | 1,008,533 | — |
| Warrants* | —** | — | —** | — |
| Money Market Funds | 71,857 | 71,857 | — | — |
| Repurchase Agreements | 11,568 | — | 11,568 | — |
| Total Investments | $ 4,272,740 | $ 2,967,319 | $ 1,305,421 | $— |
| * | See Portfolio of Investments for country breakout. |
| ** | Investment is valued at $0. |
| First Trust Nasdaq Bank ETF (FTXO) | First Trust Nasdaq Food & Beverage ETF (FTXG) | First Trust Nasdaq Oil & Gas ETF (FTXN) | |||
| ASSETS: | |||||
Investments, at value | $ 164,165,066 | $ 983,471,940 | $ 314,051,561 | ||
Cash | 76,277 | 341,165 | 434,206 | ||
Foreign currency | — | — | — | ||
Due from authorized participant | — | — | 242,635,773 | ||
| Receivables: | |||||
Fund shares sold | — | 4,030,886 | 1,350,154 | ||
Dividends | 574,981 | 1,045,983 | 445,275 | ||
Dividend reclaims | — | — | — | ||
Securities lending income | — | — | — | ||
Investment securities sold | 5,252,136 | 1,336,802 | 4,011,137 | ||
Miscellaneous | — | — | 229,350 | ||
Total Assets | 170,068,460 | 990,226,776 | 563,157,456 | ||
| LIABILITIES: | |||||
| Payables: | |||||
Investment securities purchased | — | 4,027,935 | 1,347,180 | ||
Investment advisory fees | 94,536 | 521,643 | 563,893 | ||
Collateral for securities on loan | — | — | — | ||
Fund shares redeemed | 5,265,900 | 1,337,764 | 246,650,145 | ||
Total Liabilities | 5,360,436 | 5,887,342 | 248,561,218 | ||
NET ASSETS | $164,708,024 | $984,339,434 | $314,596,238 | ||
| NET ASSETS consist of: | |||||
Paid-in capital | $ 344,117,195 | $ 1,034,664,153 | $ 410,543,839 | ||
Par value | 77,500 | 365,500 | 116,500 | ||
Accumulated distributable earnings (loss) | (179,486,671) | (50,690,219) | (96,064,101) | ||
NET ASSETS | $164,708,024 | $984,339,434 | $314,596,238 | ||
NET ASSET VALUE, per share | $21.25 | $26.93 | $27.00 | ||
Number of shares outstanding (unlimited number of shares authorized, par value $0.01 per share) | 7,750,002 | 36,550,002 | 11,650,002 | ||
Investments, at cost | $194,286,325 | $968,528,695 | $309,207,818 | ||
Foreign currency, at cost (proceeds) | $— | $— | $— | ||
Securities on loan, at value | $— | $— | $— |
| First Trust Nasdaq Pharmaceuticals ETF (FTXH) | First Trust S-Network E-Commerce ETF (ISHP) | First Trust Nasdaq Semiconductor ETF (FTXL) | First Trust Nasdaq Transportation ETF (FTXR) | First Trust S-Network Streaming & Gaming ETF (BNGE) | ||||
| $ 32,598,354 | $ 5,284,065 | $ 985,796,415 | $ 47,617,997 | $ 4,272,740 | ||||
| 30,351 | 5,451 | 2,023,674 | 28,299 | 10,757 | ||||
| — | 19,111 | — | — | — | ||||
| — | — | — | — | — | ||||
| — | — | — | — | — | ||||
| 28,901 | 9,411 | 53,791 | 26,858 | 5,371 | ||||
| 286 | 8,788 | — | 79 | 354 | ||||
| — | — | — | 18,852 | 149 | ||||
| — | — | 3,232,090 | — | 8,344 | ||||
| — | — | 342,265 | — | — | ||||
| 32,657,892 | 5,326,826 | 991,448,235 | 47,692,085 | 4,297,715 | ||||
| — | — | — | — | 2,377 | ||||
| 18,189 | 2,598 | 112,533 | 26,777 | 2,347 | ||||
| — | — | — | — | 83,425 | ||||
| — | — | 3,239,652 | — | — | ||||
| 18,189 | 2,598 | 3,352,185 | 26,777 | 88,149 | ||||
| $ 32,639,703 | $ 5,324,228 | $ 988,096,050 | $ 47,665,308 | $ 4,209,566 | ||||
| $ 37,818,562 | $ 11,336,914 | $ 968,156,049 | $ 111,954,016 | $ 4,614,814 | ||||
| 12,500 | 2,000 | 152,500 | 17,500 | 2,000 | ||||
| (5,191,359) | (6,014,686) | 19,787,501 | (64,306,208) | (407,248) | ||||
| $ 32,639,703 | $ 5,324,228 | $ 988,096,050 | $ 47,665,308 | $ 4,209,566 | ||||
| $26.11 | $26.62 | $64.79 | $27.24 | $21.05 | ||||
| 1,250,002 | 200,002 | 15,250,002 | 1,750,002 | 200,002 | ||||
| $32,505,824 | $6,245,860 | $945,362,146 | $50,036,810 | $4,297,073 | ||||
| $— | $19,146 | $— | $— | $— | ||||
| $— | $— | $— | $— | $79,180 |
| First Trust Nasdaq Bank ETF (FTXO) | First Trust Nasdaq Food & Beverage ETF (FTXG) | First Trust Nasdaq Oil & Gas ETF (FTXN) | ||||
| INVESTMENT INCOME: | ||||||
Dividends | $ 7,917,357 | $ 19,320,693 | $ 36,677,003 | |||
Interest | 8,412 | 26,560 | 40,458 | |||
Securities lending income (net of fees) | — | — | — | |||
Foreign withholding tax | (52,336) | — | — | |||
Other | — | — | — | |||
Total investment income | 7,873,433 | 19,347,253 | 36,717,461 | |||
| EXPENSES: | ||||||
Investment advisory fees | 1,405,400 | 5,021,610 | 7,013,809 | |||
Total expenses | 1,405,400 | 5,021,610 | 7,013,809 | |||
NET INVESTMENT INCOME (LOSS) | 6,468,033 | 14,325,643 | 29,703,652 | |||
| NET REALIZED AND UNREALIZED GAIN (LOSS): | ||||||
| Net realized gain (loss) on: | ||||||
Investments | (69,162,767) | (70,568,399) | (128,492,612) | |||
In-kind redemptions | 267,718 | 14,210,368 | 213,604,191 | |||
Foreign currency transactions | — | — | — | |||
Net realized gain (loss) | (68,895,049) | (56,358,031) | 85,111,579 | |||
| Net change in unrealized appreciation (depreciation) on: | ||||||
Investments | (24,928,953) | 14,148,675 | (160,545,326) | |||
Foreign currency translation | — | — | — | |||
Net change in unrealized appreciation (depreciation) | (24,928,953) | 14,148,675 | (160,545,326) | |||
NET REALIZED AND UNREALIZED GAIN (LOSS) | (93,824,002) | (42,209,356) | (75,433,747) | |||
NET INCREASE (DECREASE) IN NET ASSETS RESULTING FROM OPERATIONS | $(87,355,969) | $(27,883,713) | $(45,730,095) | |||
| First Trust Nasdaq Pharmaceuticals ETF (FTXH) | First Trust S-Network E-Commerce ETF (ISHP) | First Trust Nasdaq Semiconductor ETF (FTXL) | First Trust Nasdaq Transportation ETF (FTXR) | First Trust S-Network Streaming & Gaming ETF (BNGE) | |||||
| $708,752 | $65,572 | $1,314,577 | $1,585,755 | $29,871 | |||||
| 1,159 | 720 | 3,725 | 2,364 | — | |||||
| — | — | — | 319,005 | 1,106 | |||||
| — | (7,262) | (10,478) | — | (957) | |||||
| — | 154 | — | — | 6 | |||||
| 709,911 | 59,184 | 1,307,824 | 1,907,124 | 30,026 | |||||
| 212,943 | 43,089 | 566,621 | 567,449 | 24,152 | |||||
| 212,943 | 43,089 | 566,621 | 567,449 | 24,152 | |||||
| 496,968 | 16,095 | 741,203 | 1,339,675 | 5,874 | |||||
| (3,427,408) | (1,821,734) | (15,068,450) | (25,263,128) | (379,392) | |||||
| 4,266,164 | (2,213,337) | 7,202,562 | (24,343,883) | — | |||||
| — | (222) | — | — | 274 | |||||
| 838,756 | (4,035,293) | (7,865,888) | (49,607,011) | (379,118) | |||||
| (1,491,531) | 886,232 | 39,410,046 | 10,350,564 | 146,392 | |||||
| — | (177) | — | — | (14) | |||||
| (1,491,531) | 886,055 | 39,410,046 | 10,350,564 | 146,378 | |||||
| (652,775) | (3,149,238) | 31,544,158 | (39,256,447) | (232,740) | |||||
| $(155,807) | $(3,133,143) | $32,285,361 | $(37,916,772) | $(226,866) |
| First Trust Nasdaq Bank ETF (FTXO) | First Trust Nasdaq Food & Beverage ETF (FTXG) | ||||||
| Year Ended 3/31/2023 | Year Ended 3/31/2022 | Year Ended 3/31/2023 | Year Ended 3/31/2022 | ||||
| OPERATIONS: | |||||||
Net investment income (loss) | $ 6,468,033 | $ 5,262,818 | $ 14,325,643 | $ 109,767 | |||
Net realized gain (loss) | (68,895,049) | (1,019,467) | (56,358,031) | (349,011) | |||
Net change in unrealized appreciation (depreciation) | (24,928,953) | (11,467,228) | 14,148,675 | 692,861 | |||
Net increase (decrease) in net assets resulting from operations | (87,355,969) | (7,223,877) | (27,883,713) | 453,617 | |||
| DISTRIBUTIONS TO SHAREHOLDERS FROM: | |||||||
Investment operations | (6,261,407) | (5,155,141) | (13,322,256) | (116,496) | |||
Return of capital | — | — | — | — | |||
Total distributions to shareholders | (6,261,407) | (5,155,141) | (13,322,256) | (116,496) | |||
| SHAREHOLDER TRANSACTIONS: | |||||||
Proceeds from shares sold | 38,456,834 | 231,246,175 | 1,447,529,232 | 9,224,482 | |||
Cost of shares redeemed | (142,068,023) | (84,224,058) | (432,794,312) | (3,884,145) | |||
Net increase (decrease) in net assets resulting from shareholder transactions | (103,611,189) | 147,022,117 | 1,014,734,920 | 5,340,337 | |||
Total increase (decrease) in net assets | (197,228,565) | 134,643,099 | 973,528,951 | 5,677,458 | |||
| NET ASSETS: | |||||||
Beginning of period | 361,936,589 | 227,293,490 | 10,810,483 | 5,133,025 | |||
End of period | $164,708,024 | $361,936,589 | $984,339,434 | $10,810,483 | |||
| CHANGES IN SHARES OUTSTANDING: | |||||||
Shares outstanding, beginning of period | 11,400,002 | 7,300,002 | 400,002 | 200,002 | |||
Shares sold | 1,400,000 | 6,750,000 | 52,250,000 | 350,000 | |||
Shares redeemed | (5,050,000) | (2,650,000) | (16,100,000) | (150,000) | |||
Shares outstanding, end of period | 7,750,002 | 11,400,002 | 36,550,002 | 400,002 | |||
| First Trust Nasdaq Oil & Gas ETF (FTXN) | First Trust Nasdaq Pharmaceuticals ETF (FTXH) | First Trust S-Network E-Commerce ETF (ISHP) | ||||||||
| Year Ended 3/31/2023 | Year Ended 3/31/2022 | Year Ended 3/31/2023 | Year Ended 3/31/2022 | Year Ended 3/31/2023 | Year Ended 3/31/2022 | |||||
| $ 29,703,652 | $ 6,902,387 | $ 496,968 | $ 185,875 | $ 16,095 | $ 174,149 | |||||
| 85,111,579 | 170,957,349 | 838,756 | 387,327 | (4,035,293) | 359,766 | |||||
| (160,545,326) | 162,037,630 | (1,491,531) | 444,270 | 886,055 | (2,624,610) | |||||
| (45,730,095) | 339,897,366 | (155,807) | 1,017,472 | (3,133,143) | (2,090,695) | |||||
| (27,976,256) | (6,320,716) | (500,150) | (176,100) | (39,201) | (143,821) | |||||
| — | — | — | — | — | — | |||||
| (27,976,256) | (6,320,716) | (500,150) | (176,100) | (39,201) | (143,821) | |||||
| 1,343,270,023 | 1,655,064,859 | 50,373,967 | 2,582,284 | — | 36,521,440 | |||||
| (2,102,598,406) | (877,458,299) | (34,389,637) | (5,245,253) | (10,089,830) | (25,144,637) | |||||
| (759,328,383) | 777,606,560 | 15,984,330 | (2,662,969) | (10,089,830) | 11,376,803 | |||||
| (833,034,734) | 1,111,183,210 | 15,328,373 | (1,821,597) | (13,262,174) | 9,142,287 | |||||
| 1,147,630,972 | 36,447,762 | 17,311,330 | 19,132,927 | 18,586,402 | 9,444,115 | |||||
| $314,596,238 | $1,147,630,972 | $32,639,703 | $17,311,330 | $5,324,228 | $18,586,402 | |||||
| 43,350,002 | 2,350,002 | 650,002 | 750,002 | 600,002 | 300,002 | |||||
| 50,450,000 | 76,750,000 | 1,900,000 | 100,000 | — | 1,050,000 | |||||
| (82,150,000) | (35,750,000) | (1,300,000) | (200,000) | (400,000) | (750,000) | |||||
| 11,650,002 | 43,350,002 | 1,250,002 | 650,002 | 200,002 | 600,002 | |||||
| First Trust Nasdaq Semiconductor ETF (FTXL) | First Trust Nasdaq Transportation ETF (FTXR) | ||||||
| Year Ended 3/31/2023 | Year Ended 3/31/2022 | Year Ended 3/31/2023 | Year Ended 3/31/2022 | ||||
| OPERATIONS: | |||||||
Net investment income (loss) | $ 741,203 | $ 361,146 | $ 1,339,675 | $ 10,254,406 | |||
Net realized gain (loss) | (7,865,888) | 14,839,706 | (49,607,011) | 18,134,255 | |||
Net change in unrealized appreciation (depreciation) | 39,410,046 | (11,810,521) | 10,350,564 | (109,717,327) | |||
Net increase (decrease) in net assets resulting from operations | 32,285,361 | 3,390,331 | (37,916,772) | (81,328,666) | |||
| DISTRIBUTIONS TO SHAREHOLDERS FROM: | |||||||
Investment operations | (931,111) | (338,211) | (1,511,736) | (10,039,966) | |||
Return of capital | — | — | — | — | |||
Total distributions to shareholders | (931,111) | (338,211) | (1,511,736) | (10,039,966) | |||
| SHAREHOLDER TRANSACTIONS: | |||||||
Proceeds from shares sold | 903,564,157 | 93,443,236 | 2,951,382 | 720,128,082 | |||
Cost of shares redeemed | (55,273,060) | (72,200,805) | (196,699,292) | (1,419,772,038) | |||
Net increase (decrease) in net assets resulting from shareholder transactions | 848,291,097 | 21,242,431 | (193,747,910) | (699,643,956) | |||
Total increase (decrease) in net assets | 879,645,347 | 24,294,551 | (233,176,418) | (791,012,588) | |||
| NET ASSETS: | |||||||
Beginning of period | 108,450,703 | 84,156,152 | 280,841,726 | 1,071,854,314 | |||
End of period | $988,096,050 | $108,450,703 | $47,665,308 | $280,841,726 | |||
| CHANGES IN SHARES OUTSTANDING: | |||||||
Shares outstanding, beginning of period | 1,550,002 | 1,300,002 | 8,700,002 | 32,600,002 | |||
Shares sold | 14,600,000 | 1,300,000 | 100,000 | 22,150,000 | |||
Shares redeemed | (900,000) | (1,050,000) | (7,050,000) | (46,050,000) | |||
Shares outstanding, end of period | 15,250,002 | 1,550,002 | 1,750,002 | 8,700,002 | |||
| (a) | Inception date is January 25, 2022, which is consistent with the commencement of investment operations and is the date the initial creation units were established. |
| First Trust S-Network Streaming & Gaming ETF (BNGE) | ||
| Year Ended 3/31/2023 | Period Ended 3/31/2022 (a) | |
| $ 5,874 | $ 2,572 | |
| (379,118) | 91 | |
| 146,378 | (170,718) | |
| (226,866) | (168,055) | |
| (11,922) | (405) | |
| (3,048) | — | |
| (14,970) | (405) | |
| 959,545 | 3,660,317 | |
| — | — | |
| 959,545 | 3,660,317 | |
| 717,709 | 3,491,857 | |
| 3,491,857 | — | |
| $ 4,209,566 | $ 3,491,857 | |
| 150,002 | — | |
| 50,000 | 150,002 | |
| — | — | |
| 200,002 | 150,002 | |
| Year Ended March 31, | |||||||||
| 2023 | 2022 | 2021 | 2020 | 2019 | |||||
Net asset value, beginning of period | $ 31.75 | $ 31.14 | $ 15.64 | $ 24.41 | $ 29.50 | ||||
| Income from investment operations: | |||||||||
Net investment income (loss) | 0.83 | 0.61 | 0.59 (a) | 0.73 | 0.84 | ||||
Net realized and unrealized gain (loss) | (10.54) | 0.61 (b) | 15.50 | (8.77) | (5.14) | ||||
Total from investment operations | (9.71) | 1.22 | 16.09 | (8.04) | (4.30) | ||||
| Distributions paid to shareholders from: | |||||||||
Net investment income | (0.79) | (0.61) | (0.59) | (0.73) | (0.79) | ||||
Net asset value, end of period | $21.25 | $31.75 | $31.14 | $15.64 | $24.41 | ||||
Total return (c) | (30.94)% | 3.89% | 105.13% | (33.93)% | (14.49)% | ||||
| Ratios to average net assets/supplemental data: | |||||||||
Net assets, end of period (in 000’s) | $ 164,708 | $ 361,937 | $ 227,293 | $ 58,658 | $ 168,447 | ||||
Ratio of total expenses to average net assets | 0.60% | 0.60% | 0.60% | 0.60% | 0.60% | ||||
Ratio of net investment income (loss) to average net assets | 2.76% | 1.91% | 2.65% | 2.69% | 1.83% | ||||
Portfolio turnover rate (d) | 69% | 78% | 176% | 59% | 87% | ||||
| (a) | Based on average shares outstanding. |
| (b) | The per share amount does not correlate with the aggregate realized and unrealized gain (loss) due to the timing of the Fund share sales and repurchases in relation to market value fluctuation of the underlying investments. |
| (c) | Total return is calculated assuming an initial investment made at the net asset value at the beginning of the period, reinvestment of all distributions at net asset value during the period, and redemption at net asset value on the last day of the period. The returns presented do not reflect the deduction of taxes that a shareholder would pay on Fund distributions or the redemption or sale of Fund shares. Total return is calculated for the time period presented and is not annualized for periods of less than a year. |
| (d) | Portfolio turnover is calculated for the time period presented and is not annualized for periods of less than a year and does not include securities received or delivered from processing creations or redemptions and in-kind transactions. |
| Year Ended March 31, | |||||||||
| 2023 | 2022 | 2021 | 2020 | 2019 | |||||
Net asset value, beginning of period | $ 27.03 | $ 25.66 | $ 17.28 | $ 20.06 | $ 19.71 | ||||
| Income from investment operations: | |||||||||
Net investment income (loss) | 0.41 | 0.41 | 0.32 | 0.27 | 0.27 | ||||
Net realized and unrealized gain (loss) | (0.13) | 1.39 | 8.38 | (2.77) | 0.33 | ||||
Total from investment operations | 0.28 | 1.80 | 8.70 | (2.50) | 0.60 | ||||
| Distributions paid to shareholders from: | |||||||||
Net investment income | (0.38) | (0.43) | (0.32) | (0.28) | (0.25) | ||||
Net asset value, end of period | $26.93 | $27.03 | $25.66 | $17.28 | $20.06 | ||||
Total return (a) | 1.10% | 7.13% | 50.65% | (12.69)% | 3.13% | ||||
| Ratios to average net assets/supplemental data: | |||||||||
Net assets, end of period (in 000’s) | $ 984,339 | $ 10,810 | $ 5,133 | $ 2,592 | $ 2,006 | ||||
Ratio of total expenses to average net assets | 0.60% | 0.60% | 0.60% | 0.60% | 0.60% | ||||
Ratio of net investment income (loss) to average net assets | 1.71% | 1.61% | 1.44% | 1.58% | 1.55% | ||||
Portfolio turnover rate (b) | 78% | 77% | 131% | 59% | 108% | ||||
| (a) | Total return is calculated assuming an initial investment made at the net asset value at the beginning of the period, reinvestment of all distributions at net asset value during the period, and redemption at net asset value on the last day of the period. The returns presented do not reflect the deduction of taxes that a shareholder would pay on Fund distributions or the redemption or sale of Fund shares. Total return is calculated for the time period presented and is not annualized for periods of less than a year. |
| (b) | Portfolio turnover is calculated for the time period presented and is not annualized for periods of less than a year and does not include securities received or delivered from processing creations or redemptions and in-kind transactions. |
| Year Ended March 31, | |||||||||
| 2023 | 2022 | 2021 | 2020 | 2019 | |||||
Net asset value, beginning of period | $ 26.47 | $ 15.51 | $ 8.10 | $ 18.91 | $ 19.95 | ||||
| Income from investment operations: | |||||||||
Net investment income (loss) | 0.69 (a) | 0.31 | 0.22 | 0.31 | 0.41 | ||||
Net realized and unrealized gain (loss) | 0.50 (b) | 10.96 | 7.39 | (10.79) | (1.06) | ||||
Total from investment operations | 1.19 | 11.27 | 7.61 | (10.48) | (0.65) | ||||
| Distributions paid to shareholders from: | |||||||||
Net investment income | (0.66) | (0.31) | (0.20) | (0.32) | (0.39) | ||||
Return of capital | — | — | — | (0.01) | — | ||||
Total distributions | (0.66) | (0.31) | (0.20) | (0.33) | (0.39) | ||||
Net asset value, end of period | $27.00 | $26.47 | $15.51 | $8.10 | $18.91 | ||||
Total return (c) | 4.66% | 73.19% | 95.16% | (56.26)% | (3.27)% | ||||
| Ratios to average net assets/supplemental data: | |||||||||
Net assets, end of period (in 000’s) | $ 314,596 | $ 1,147,631 | $ 36,448 | $ 6,885 | $ 12,294 | ||||
Ratio of total expenses to average net assets | 0.60% | 0.60% | 0.60% | 0.60% | 0.60% | ||||
Ratio of net investment income (loss) to average net assets | 2.54% | 1.87% | 2.01% | 2.14% | 1.69% | ||||
Portfolio turnover rate (d) | 100% | 139% | 136% | 76% | 126% | ||||
| (a) | Based on average shares outstanding. |
| (b) | The per share amount does not correlate with the aggregate realized and unrealized gain (loss) due to the timing of the Fund share sales and repurchases in relation to market value fluctuation of the underlying investments. |
| (c) | Total return is calculated assuming an initial investment made at the net asset value at the beginning of the period, reinvestment of all distributions at net asset value during the period, and redemption at net asset value on the last day of the period. The returns presented do not reflect the deduction of taxes that a shareholder would pay on Fund distributions or the redemption or sale of Fund shares. Total return is calculated for the time period presented and is not annualized for periods of less than a year. |
| (d) | Portfolio turnover is calculated for the time period presented and is not annualized for periods of less than a year and does not include securities received or delivered from processing creations or redemptions and in-kind transactions. |
| Year Ended March 31, | |||||||||
| 2023 | 2022 | 2021 | 2020 | 2019 | |||||
Net asset value, beginning of period | $ 26.63 | $ 25.51 | $ 19.36 | $ 21.50 | $ 21.14 | ||||
| Income from investment operations: | |||||||||
Net investment income (loss) | 0.33 | 0.27 | 0.24 | 0.18 | 0.13 | ||||
Net realized and unrealized gain (loss) | (0.50) | 1.10 | 6.14 | (2.13) | 0.35 | ||||
Total from investment operations | (0.17) | 1.37 | 6.38 | (1.95) | 0.48 | ||||
| Distributions paid to shareholders from: | |||||||||
Net investment income | (0.35) | (0.25) | (0.23) | (0.19) | (0.12) | ||||
Net asset value, end of period | $26.11 | $26.63 | $25.51 | $19.36 | $21.50 | ||||
Total return (a) | (0.61)% | 5.39% | 33.00% | (9.13)% | 2.30% | ||||
| Ratios to average net assets/supplemental data: | |||||||||
Net assets, end of period (in 000’s) | $ 32,640 | $ 17,311 | $ 19,133 | $ 5,810 | $ 5,376 | ||||
Ratio of total expenses to average net assets | 0.60% | 0.60% | 0.60% | 0.60% | 0.60% | ||||
Ratio of net investment income (loss) to average net assets | 1.39% | 0.97% | 1.07% | 0.85% | 0.69% | ||||
Portfolio turnover rate (b) | 76% | 77% | 83% | 42% | 107% | ||||
| (a) | Total return is calculated assuming an initial investment made at the net asset value at the beginning of the period, reinvestment of all distributions at net asset value during the period, and redemption at net asset value on the last day of the period. The returns presented do not reflect the deduction of taxes that a shareholder would pay on Fund distributions or the redemption or sale of Fund shares. Total return is calculated for the time period presented and is not annualized for periods of less than a year. |
| (b) | Portfolio turnover is calculated for the time period presented and is not annualized for periods of less than a year and does not include securities received or delivered from processing creations or redemptions and in-kind transactions. |
| Year Ended March 31, | |||||||||
| 2023 | 2022 | 2021 | 2020 | 2019 | |||||
Net asset value, beginning of period | $ 30.98 | $ 31.48 | $ 18.10 | $ 22.34 | $ 20.86 | ||||
| Income from investment operations: | |||||||||
Net investment income (loss) | 0.06 (a) | 0.26 | 0.19 | 0.27 | 0.21 | ||||
Net realized and unrealized gain (loss) | (4.28) | (0.54) | 13.39 | (4.22) | 1.45 | ||||
Total from investment operations | (4.22) | (0.28) | 13.58 | (3.95) | 1.66 | ||||
| Distributions paid to shareholders from: | |||||||||
Net investment income | (0.14) | (0.22) | (0.20) | (0.29) | (0.18) | ||||
Net asset value, end of period | $26.62 | $30.98 | $31.48 | $18.10 | $22.34 | ||||
Total return (b) | (13.57)% | (0.94)% | 75.23% | (17.90)% | 7.98% | ||||
| Ratios to average net assets/supplemental data: | |||||||||
Net assets, end of period (in 000’s) | $ 5,324 | $ 18,586 | $ 9,444 | $ 3,619 | $ 8,934 | ||||
Ratio of total expenses to average net assets | 0.60% | 0.60% | 0.60% | 0.60% | 0.60% | ||||
Ratio of net investment income (loss) to average net assets | 0.23% | 0.91% | 0.70% | 1.11% | 1.41% | ||||
Portfolio turnover rate (c) | 95% | 213% | 114% | 65% | 127% | ||||
| (a) | Based on average shares outstanding. |
| (b) | Total return is calculated assuming an initial investment made at the net asset value at the beginning of the period, reinvestment of all distributions at net asset value during the period, and redemption at net asset value on the last day of the period. The returns presented do not reflect the deduction of taxes that a shareholder would pay on Fund distributions or the redemption or sale of Fund shares. Total return is calculated for the time period presented and is not annualized for periods of less than a year. |
| (c) | Portfolio turnover is calculated for the time period presented and is not annualized for periods of less than a year and does not include securities received or delivered from processing creations or redemptions and in-kind transactions. |
| Year Ended March 31, | |||||||||
| 2023 | 2022 | 2021 | 2020 | 2019 | |||||
Net asset value, beginning of period | $ 69.97 | $ 64.74 | $ 33.00 | $ 31.83 | $ 32.58 | ||||
| Income from investment operations: | |||||||||
Net investment income (loss) | 0.46 | 0.27 | 0.23 | 0.38 | 0.25 | ||||
Net realized and unrealized gain (loss) | (5.14) (a) | 5.22 | 31.75 | 1.18 | (0.79) | ||||
Total from investment operations | (4.68) | 5.49 | 31.98 | 1.56 | (0.54) | ||||
| Distributions paid to shareholders from: | |||||||||
Net investment income | (0.50) | (0.26) | (0.24) | (0.39) | (0.21) | ||||
Net asset value, end of period | $64.79 | $69.97 | $64.74 | $33.00 | $31.83 | ||||
Total return (b) | (6.54)% | 8.46% | 97.11% | 4.82% | (1.62)% | ||||
| Ratios to average net assets/supplemental data: | |||||||||
Net assets, end of period (in 000’s) | $ 988,096 | $ 108,451 | $ 84,156 | $ 31,353 | $ 30,242 | ||||
Ratio of total expenses to average net assets | 0.60% | 0.60% | 0.60% | 0.60% | 0.60% | ||||
Ratio of net investment income (loss) to average net assets | 0.78% | 0.40% | 0.45% | 1.00% | 0.78% | ||||
Portfolio turnover rate (c) | 46% | 58% | 113% | 64% | 94% | ||||
| (a) | The per share amount does not correlate with the aggregate realized and unrealized gain (loss) due to the timing of the Fund share sales and repurchases in relation to market value fluctuation of the underlying investments. |
| (b) | Total return is calculated assuming an initial investment made at the net asset value at the beginning of the period, reinvestment of all distributions at net asset value during the period, and redemption at net asset value on the last day of the period. The returns presented do not reflect the deduction of taxes that a shareholder would pay on Fund distributions or the redemption or sale of Fund shares. Total return is calculated for the time period presented and is not annualized for periods of less than a year. |
| (c) | Portfolio turnover is calculated for the time period presented and is not annualized for periods of less than a year and does not include securities received or delivered from processing creations or redemptions and in-kind transactions. |
| Year Ended March 31, | |||||||||
| 2023 | 2022 | 2021 | 2020 | 2019 | |||||
Net asset value, beginning of period | $ 32.28 | $ 32.88 | $ 15.11 | $ 23.33 | $ 24.93 | ||||
| Income from investment operations: | |||||||||
Net investment income (loss) | 0.56 | 0.45 | 0.04 | 0.30 | 0.35 | ||||
Net realized and unrealized gain (loss) | (5.04) | (0.62) | 17.79 | (8.22) | (1.62) | ||||
Total from investment operations | (4.48) | (0.17) | 17.83 | (7.92) | (1.27) | ||||
| Distributions paid to shareholders from: | |||||||||
Net investment income | (0.56) | (0.43) | (0.06) | (0.30) | (0.33) | ||||
Net asset value, end of period | $27.24 | $32.28 | $32.88 | $15.11 | $23.33 | ||||
Total return (a) | (13.76)% | (0.53)% | 118.10% | (34.35)% | (5.11)% | ||||
| Ratios to average net assets/supplemental data: | |||||||||
Net assets, end of period (in 000’s) | $ 47,665 | $ 280,842 | $ 1,071,854 | $ 1,511 | $ 2,333 | ||||
Ratio of total expenses to average net assets | 0.60% | 0.60% | 0.60% | 0.60% | 0.60% | ||||
Ratio of net investment income (loss) to average net assets | 1.42% | 0.92% | 0.10% | 1.04% | 1.38% | ||||
Portfolio turnover rate (b) | 71% | 43% | 129% | 89% | 108% | ||||
| (a) | Total return is calculated assuming an initial investment made at the net asset value at the beginning of the period, reinvestment of all distributions at net asset value during the period, and redemption at net asset value on the last day of the period. The returns presented do not reflect the deduction of taxes that a shareholder would pay on Fund distributions or the redemption or sale of Fund shares. Total return is calculated for the time period presented and is not annualized for periods of less than a year. |
| (b) | Portfolio turnover is calculated for the time period presented and is not annualized for periods of less than a year and does not include securities received or delivered from processing creations or redemptions and in-kind transactions. |
| Year Ended 3/31/2023 | Period Ended 3/31/2022 (a) | ||
Net asset value, beginning of period | $ 23.28 | $ 24.46 | |
| Income from investment operations: | |||
Net investment income (loss) | 0.04 | 0.03 | |
Net realized and unrealized gain (loss) | (2.17) | (1.20) | |
Total from investment operations | (2.13) | (1.17) | |
| Distributions paid to shareholders from: | |||
Net investment income | (0.08) | (0.00) (b) | |
Net realized gain | (0.02) | - | |
Total distributions | (0.10) | (0.00) | |
Net asset value, end of period | $21.05 | $23.28 | |
Total return (c) | (9.08)% | (4.81)% | |
| Ratios to average net assets/supplemental data: | |||
Net assets, end of period (in 000’s) | $ 4,210 | $ 3,492 | |
Ratio of total expenses to average net assets | 0.70% | 0.71% (d) | |
Ratio of net investment income (loss) to average net assets | 0.17% | 0.47% (d) | |
Portfolio turnover rate (e) | 42% | 0% |
| (a) | Inception date is January 25, 2022, which is consistent with the commencement of investment operations and is the date the initial creation units were established. |
| (b) | Amount is less than $0.01. |
| (c) | Total return is calculated assuming an initial investment made at the net asset value at the beginning of the period, reinvestment of all distributions at net asset value during the period, and redemption at net asset value on the last day of the period. The returns presented do not reflect the deduction of taxes that a shareholder would pay on Fund distributions or the redemption or sale of Fund shares. Total return is calculated for the time period presented and is not annualized for periods of less than a year. |
| (d) | Annualized. |
| (e) | Portfolio turnover is calculated for the time period presented and is not annualized for periods of less than a year and does not include securities received or delivered from processing creations or redemptions and in-kind transactions. |
| Fund | Index |
| First Trust Nasdaq Bank ETF | Nasdaq US Smart BanksTM Index |
| First Trust Nasdaq Food & Beverage ETF | Nasdaq US Smart Food & BeverageTM Index |
| First Trust Nasdaq Oil & Gas ETF | Nasdaq US Smart Oil & GasTM Index |
| First Trust Nasdaq Pharmaceuticals ETF | Nasdaq US Smart PharmaceuticalsTM Index |
| First Trust S-Network E-Commerce ETF | S-Network Global E-Commerce IndexTM |
| First Trust Nasdaq Semiconductor ETF | Nasdaq US Smart SemiconductorTM Index |
| First Trust Nasdaq Transportation ETF | Nasdaq US Smart TransportationTM Index |
| First Trust S-Network Streaming & Gaming ETF | S-Network Streaming & Gaming Index |
| 1) | the last sale price on the exchange on which they are principally traded or, for Nasdaq and AIM securities, the official closing price; |
| 2) | the type of security; |
| 3) | the size of the holding; |
| 4) | the initial cost of the security; |
| 5) | transactions in comparable securities; |
| 6) | price quotes from dealers and/or third-party pricing services; |
| 7) | relationships among various securities; |
| 8) | information obtained by contacting the issuer, analysts, or the appropriate stock exchange; |
| 9) | an analysis of the issuer’s financial statements; |
| 10) | the existence of merger proposals or tender offers that might affect the value of the security; and |
| 11) | other relevant factors. |
| 1) | the value of similar foreign securities traded on other foreign markets; |
| 2) | ADR trading of similar securities; |
| 3) | closed-end fund or exchange-traded fund trading of similar securities; |
| 4) | foreign currency exchange activity; |
| 5) | the trading prices of financial products that are tied to baskets of foreign securities; |
| 6) | factors relating to the event that precipitated the pricing problem; |
| 7) | whether the event is likely to recur; |
| 8) | whether the effects of the event are isolated or whether they affect entire markets, countries or regions; and |
| 9) | other relevant factors. |
| • | Level 1 – Level 1 inputs are quoted prices in active markets for identical investments. An active market is a market in which transactions for the investment occur with sufficient frequency and volume to provide pricing information on an ongoing basis. |
| • | Level 2 – Level 2 inputs are observable inputs, either directly or indirectly, and include the following: |
| o | Quoted prices for similar investments in active markets. |
| o | Quoted prices for identical or similar investments in markets that are non-active. A non-active market is a market where there are few transactions for the investment, the prices are not current, or price quotations vary substantially either over time or among market makers, or in which little information is released publicly. |
| o | Inputs other than quoted prices that are observable for the investment (for example, interest rates and yield curves observable at commonly quoted intervals, volatilities, prepayment speeds, loss severities, credit risks, and default rates). |
| o | Inputs that are derived principally from or corroborated by observable market data by correlation or other means. |
| • | Level 3 – Level 3 inputs are unobservable inputs. Unobservable inputs may reflect the reporting entity’s own assumptions about the assumptions that market participants would use in pricing the investment. |
| Distributions paid from Ordinary Income | Distributions paid from Capital Gains | Distributions paid from Return of Capital | |||
First Trust Nasdaq Bank ETF | $ 6,261,407 | $ — | $ — | ||
First Trust Nasdaq Food & Beverage ETF | 13,322,256 | — | — | ||
First Trust Nasdaq Oil & Gas ETF | 27,976,256 | — | — | ||
First Trust Nasdaq Pharmaceuticals ETF | 500,150 | — | — | ||
First Trust S-Network E-Commerce ETF | 39,201 | — | — | ||
First Trust Nasdaq Semiconductor ETF | 931,111 | — | — | ||
First Trust Nasdaq Transportation ETF | 1,511,736 | — | — | ||
First Trust S-Network Streaming & Gaming ETF | 11,922 | — | 3,048 |
| Distributions paid from Ordinary Income | Distributions paid from Capital Gains | Distributions paid from Return of Capital | |||
First Trust Nasdaq Bank ETF | $ 5,155,141 | $ — | $ — | ||
First Trust Nasdaq Food & Beverage ETF | 116,496 | — | — | ||
First Trust Nasdaq Oil & Gas ETF | 6,320,716 | — | — | ||
First Trust Nasdaq Pharmaceuticals ETF | 176,100 | — | — | ||
First Trust S-Network E-Commerce ETF | 143,821 | — | — | ||
First Trust Nasdaq Semiconductor ETF | 338,211 | — | — | ||
First Trust Nasdaq Transportation ETF | 10,039,966 | — | — | ||
First Trust S-Network Streaming & Gaming ETF | 405 | — | — |
| Undistributed Ordinary Income | Accumulated Capital and Other Gain (Loss) | Net Unrealized Appreciation (Depreciation) | |||
First Trust Nasdaq Bank ETF | $ 536,448 | $ (148,409,375) | $ (31,613,744) | ||
First Trust Nasdaq Food & Beverage ETF | 1,003,387 | (63,514,879) | 11,821,273 | ||
First Trust Nasdaq Oil & Gas ETF | 2,351,864 | (93,410,183) | (5,005,782) | ||
First Trust Nasdaq Pharmaceuticals ETF | 18,103 | (5,088,267) | (121,195) | ||
First Trust S-Network E-Commerce ETF | 67,042 | (5,050,919) | (1,030,809) | ||
First Trust Nasdaq Semiconductor ETF | — | (18,825,804) | 38,613,305 | ||
First Trust Nasdaq Transportation ETF | 42,379 | (61,692,799) | (2,655,788) | ||
First Trust S-Network Streaming & Gaming ETF | — | (287,109) | (120,139) |
| Non-Expiring Capital Loss Carryforward | |
First Trust Nasdaq Bank ETF | $ 148,409,375 |
First Trust Nasdaq Food & Beverage ETF | 63,514,879 |
First Trust Nasdaq Oil & Gas ETF | 93,410,183 |
First Trust Nasdaq Pharmaceuticals ETF | 5,088,267 |
First Trust S-Network E-Commerce ETF | 5,050,919 |
First Trust Nasdaq Semiconductor ETF | 18,825,804 |
First Trust Nasdaq Transportation ETF | 61,692,799 |
First Trust S-Network Streaming & Gaming ETF | 287,109 |
| Accumulated Net Investment Income (Loss) | Accumulated Net Realized Gain (Loss) on Investments | Paid-in Capital | |||
First Trust Nasdaq Bank ETF | $ — | $ 3,314,741 | $ (3,314,741) | ||
First Trust Nasdaq Food & Beverage ETF | — | (9,096,158) | 9,096,158 | ||
First Trust Nasdaq Oil & Gas ETF | — | (167,616,837) | 167,616,837 | ||
First Trust Nasdaq Pharmaceuticals ETF | — | (3,873,156) | 3,873,156 | ||
First Trust S-Network E-Commerce ETF | 30,380 | 2,208,454 | (2,238,834) | ||
First Trust Nasdaq Semiconductor ETF | 144,387 | (5,559,816) | 5,415,429 | ||
First Trust Nasdaq Transportation ETF | — | 25,029,562 | (25,029,562) | ||
First Trust S-Network Streaming & Gaming ETF | 2,763 | (2,763) | — |
| Tax Cost | Gross Unrealized Appreciation | Gross Unrealized (Depreciation) | Net Unrealized Appreciation (Depreciation) | ||||
First Trust Nasdaq Bank ETF | $ 195,778,810 | $ 1,960,847 | $ (33,574,591) | $ (31,613,744) | |||
First Trust Nasdaq Food & Beverage ETF | 971,650,667 | 46,101,647 | (34,280,374) | 11,821,273 | |||
First Trust Nasdaq Oil & Gas ETF | 319,057,343 | 11,090,775 | (16,096,557) | (5,005,782) | |||
First Trust Nasdaq Pharmaceuticals ETF | 32,719,549 | 1,416,176 | (1,537,371) | (121,195) | |||
First Trust S-Network E-Commerce ETF | 6,314,726 | 193,839 | (1,224,500) | (1,030,661) | |||
First Trust Nasdaq Semiconductor ETF | 947,183,110 | 40,698,040 | (2,084,735) | 38,613,305 | |||
First Trust Nasdaq Transportation ETF | 50,273,785 | 1,491,259 | (4,147,047) | (2,655,788) | |||
First Trust S-Network Streaming & Gaming ETF | 4,392,872 | 411,931 | (532,063) | (120,132) |
| Breakpoints | ISHP | BNGE | ||
| Fund net assets up to and including $2.5 billion | 0.600% | 0.7000% | ||
| Fund net assets greater than $2.5 billion up to and including $5 billion | 0.585% | 0.6825% | ||
| Fund net assets greater than $5 billion up to and including $7.5 billion | 0.570% | 0.6650% | ||
| Fund net assets greater than $7.5 billion up to and including $10 billion | 0.555% | 0.6475% | ||
| Fund net assets greater than $10 billion | 0.540% | 0.6300% |
| Breakpoints | ||||
| Fund net assets up to and including $2.5 billion | 0.600% | |||
| Fund net assets greater than $2.5 billion up to and including $5 billion | 0.585% | |||
| Fund net assets greater than $5 billion up to and including $7.5 billion | 0.570% | |||
| Fund net assets greater than $7.5 billion up to and including $10 billion | 0.555% | |||
| Fund net assets greater than $10 billion up to and including $15 billion | 0.540% | |||
| Fund net assets greater than $15 billion | 0.510% |
| Purchases | Sales | ||
| First Trust Nasdaq Bank ETF | $ 163,288,117 | $ 163,386,739 | |
| First Trust Nasdaq Food & Beverage ETF | 652,278,295 | 650,499,250 | |
| First Trust Nasdaq Oil & Gas ETF | 1,113,943,820 | 1,107,446,926 | |
| First Trust Nasdaq Pharmaceuticals ETF | 26,135,114 | 26,091,375 | |
| First Trust S-Network E-Commerce ETF | 7,006,172 | 7,353,055 | |
| First Trust Nasdaq Semiconductor ETF | 70,762,140 | 70,770,237 | |
| First Trust Nasdaq Transportation ETF | 71,370,257 | 71,021,714 | |
| First Trust S-Network Streaming & Gaming ETF | 1,526,516 | 1,457,582 | |
| Purchases | Sales | ||
| First Trust Nasdaq Bank ETF | $ 38,350,486 | $ 141,397,126 | |
| First Trust Nasdaq Food & Beverage ETF | 1,445,381,618 | 432,281,025 | |
| First Trust Nasdaq Oil & Gas ETF | 1,337,669,413 | 2,097,484,023 | |
| First Trust Nasdaq Pharmaceuticals ETF | 50,258,672 | 34,341,137 | |
| First Trust S-Network E-Commerce ETF | — | 9,745,589 | |
| First Trust Nasdaq Semiconductor ETF | 901,172,793 | 55,163,431 | |
| First Trust Nasdaq Transportation ETF | 2,948,082 | 196,275,531 | |
| First Trust S-Network Streaming & Gaming ETF | 876,675 | — |
| Individual Funds Included in the Trust | Statements of Changes in Net Assets | Financial Highlights |
| First Trust Nasdaq Bank ETF | For the years ended March 31, 2023 and 2022 | For the years ended March 31, 2023, 2022, 2021, 2020, and 2019 |
| First Trust Nasdaq Food & Beverage ETF | ||
| First Trust Nasdaq Oil & Gas ETF | ||
| First Trust Nasdaq Pharmaceuticals ETF | ||
| First Trust S-Network E-Commerce ETF | ||
| First Trust Nasdaq Semiconductor ETF | ||
| First Trust Nasdaq Transportation ETF | ||
| First Trust S-Network Streaming & Gaming ETF | For the year ended March 31, 2023, and for the period from January 25, 2022 (commencement of operations) through March 31, 2022 | |

| Dividends Received Deduction | |
First Trust Nasdaq Bank ETF | 100.00% |
First Trust Nasdaq Food & Beverage ETF | 100.00% |
First Trust Nasdaq Oil & Gas ETF | 100.00% |
First Trust Nasdaq Pharmaceuticals ETF | 100.00% |
First Trust S-Network E-Commerce ETF | 72.31% |
First Trust Nasdaq Semiconductor ETF | 100.00% |
First Trust Nasdaq Transportation ETF | 100.00% |
First Trust S-Network Streaming & Gaming ETF | 22.61% |
| Qualified Dividend Income | |
First Trust Nasdaq Bank ETF | 100.00% |
First Trust Nasdaq Food & Beverage ETF | 100.00% |
First Trust Nasdaq Oil & Gas ETF | 100.00% |
First Trust Nasdaq Pharmaceuticals ETF | 100.00% |
First Trust S-Network E-Commerce ETF | 100.00% |
First Trust Nasdaq Semiconductor ETF | 100.00% |
First Trust Nasdaq Transportation ETF | 100.00% |
First Trust S-Network Streaming & Gaming ETF | 50.00% |
| NOT FDIC INSURED | NOT BANK GUARANTEED | MAY LOSE VALUE |
| Name, Year of Birth and Position with the Trust | Term of Office and Year First Elected or Appointed | Principal Occupations During Past 5 Years | Number of Portfolios in the First Trust Fund Complex Overseen by Trustee | Other Trusteeships or Directorships Held by Trustee During Past 5 Years |
| INDEPENDENT TRUSTEES | ||||
| Richard E. Erickson, Trustee (1951) | • Indefinite Term • Since Inception | Physician, Edward-Elmhurst Medical Group; Physician and Officer, Wheaton Orthopedics (1990 to 2021) | 228 | None |
| Thomas R. Kadlec, Trustee (1957) | • Indefinite Term • Since Inception | Retired; President, ADM Investor Services, Inc. (Futures Commission Merchant) (2010 to July 2022) | 228 | Director, National Futures Association and ADMIS Singapore Ltd.; Formerly, Director of ADM Investor Services, Inc., ADM Investor Services International, ADMIS Hong Kong Ltd., and Futures Industry Association |
| Denise M. Keefe, Trustee (1964) | • Indefinite Term • Since 2021 | Executive Vice President, Advocate Aurora Health and President, Advocate Aurora Continuing Health Division (Integrated Healthcare System) | 228 | Director and Board Chair of Advocate Home Health Services, Advocate Home Care Products and Advocate Hospice; Director and Board Chair of Aurora At Home (since 2018); Director of Advocate Physician Partners Accountable Care Organization; Director and Board Chair of RML Long Term Acute Care Hospitals; and Director of Senior Helpers (since 2021) |
| Robert F. Keith, Trustee (1956) | • Indefinite Term • Since Inception | President, Hibs Enterprises (Financial and Management Consulting) | 228 | Formerly, Director of Trust Company of Illinois |
| Niel B. Nielson, Trustee (1954) | • Indefinite Term • Since Inception | Senior Advisor (2018 to Present), Managing Director and Chief Operating Officer (2015 to 2018), Pelita Harapan Educational Foundation (Educational Products and Services) | 228 | None |
| INTERESTED TRUSTEE | ||||
| James A. Bowen(1), Trustee and Chairman of the Board (1955) | • Indefinite Term • Since Inception | Chief Executive Officer, First Trust Advisors L.P. and First Trust Portfolios L.P.; Chairman of the Board of Directors, BondWave LLC (Software Development Company) and Stonebridge Advisors LLC (Investment Advisor) | 228 | None |
| (1) | Mr. Bowen is deemed an “interested person” of the Trust due to his position as CEO of First Trust Advisors L.P., investment advisor of the Trust. |
| Name and Year of Birth | Position and Offices with Trust | Term of Office and Length of Service | Principal Occupations During Past 5 Years |
| OFFICERS(2) | |||
| James M. Dykas (1966) | President and Chief Executive Officer | • Indefinite Term • Since 2016 | Managing Director and Chief Financial Officer, First Trust Advisors L.P. and First Trust Portfolios L.P.; Chief Financial Officer, BondWave LLC (Software Development Company) and Stonebridge Advisors LLC (Investment Advisor) |
| Donald P. Swade (1972) | Treasurer, Chief Financial Officer and Chief Accounting Officer | • Indefinite Term • Since 2016 | Senior Vice President, First Trust Advisors L.P. and First Trust Portfolios L.P. |
| W. Scott Jardine (1960) | Secretary and Chief Legal Officer | • Indefinite Term • Since Inception | General Counsel, First Trust Advisors L.P. and First Trust Portfolios L.P.; Secretary and General Counsel, BondWave LLC; Secretary, Stonebridge Advisors LLC |
| Daniel J. Lindquist (1970) | Vice President | • Indefinite Term • Since Inception | Managing Director, First Trust Advisors L.P. and First Trust Portfolios L.P. |
| Kristi A. Maher (1966) | Chief Compliance Officer and Assistant Secretary | • Indefinite Term • Since Inception | Deputy General Counsel, First Trust Advisors L.P. and First Trust Portfolios L.P. |
| Roger F. Testin (1966) | Vice President | • Indefinite Term • Since Inception | Senior Vice President, First Trust Advisors L.P. and First Trust Portfolios L.P. |
| Stan Ueland (1970) | Vice President | • Indefinite Term • Since Inception | Senior Vice President, First Trust Advisors L.P. and First Trust Portfolios L.P. |
| (2) | The term “officer” means the president, vice president, secretary, treasurer, controller or any other officer who performs a policy making function. |
| • | Information we receive from you and your broker-dealer, investment professional or financial representative through interviews, applications, agreements or other forms; |
| • | Information about your transactions with us, our affiliates or others; |
| • | Information we receive from your inquiries by mail, e-mail or telephone; and |
| • | Information we collect on our website through the use of “cookies.” For example, we may identify the pages on our website that your browser requests or visits. |
| • | In order to provide you with products and services and to effect transactions that you request or authorize, we may disclose your personal information as described above to unaffiliated financial service providers and other companies that perform administrative or other services on our behalf, such as transfer agents, custodians and trustees, or that assist us in the distribution of investor materials such as trustees, banks, financial representatives, proxy services, solicitors and printers. |
| • | We may release information we have about you if you direct us to do so, if we are compelled by law to do so, or in other legally limited circumstances (for example to protect your account from fraud). |
FUND ACCOUNTANT &
TRANSFER AGENT*
PUBLIC ACCOUNTING FIRM

Developed International Equity Select ETF (RNDM)
Emerging Markets Equity Select ETF (RNEM)
Large Cap US Equity Select ETF (RNLC)
Mid Cap US Equity Select ETF (RNMC)
Small Cap US Equity Select ETF (RNSC)
US Equity Dividend Select ETF (RNDV)
For the Year Ended
March 31, 2023
| 2 | |
| 3 | |
| Fund Performance Overview | |
| 4 | |
| 6 | |
| 8 | |
| 10 | |
| 12 | |
| 14 | |
| 16 | |
| 17 | |
| Portfolio of Investments | |
| 18 | |
| 25 | |
| 31 | |
| 37 | |
| 43 | |
| 49 | |
| 54 | |
| 56 | |
| 58 | |
| 60 | |
| 66 | |
| 76 | |
| 77 | |
| 82 | |
| 84 |


| Performance | ||||||
| Average Annual Total Returns | Cumulative Total Returns | |||||
| 1 Year Ended 3/31/23 | 5 Years Ended 3/31/23 | Inception (6/20/17) to 3/31/23 | 5 Years Ended 3/31/23 | Inception (6/20/17) to 3/31/23 | ||
| Fund Performance | ||||||
| NAV | -3.60% | 1.45% | 2.00% | 7.44% | 12.14% | |
| Market Price | -3.33% | 1.39% | 2.04% | 7.15% | 12.35% | |
| Index Performance | ||||||
| Nasdaq Riskalyze Developed MarketsTM Index | -3.36% | 2.73% | 3.22% | 14.42% | 20.08% | |
| Nasdaq Developed Markets Ex-US Large Mid CapTM Index | -2.90% | 4.15% | 5.04% | 22.54% | 32.85% | |
| MSCI World ex USA Index | -2.74% | 3.83% | 4.65% | 20.70% | 30.03% | |
| Sector Allocation | % of Total Investments |
| Financials | 22.0% |
| Industrials | 17.9 |
| Health Care | 13.1 |
| Consumer Discretionary | 11.7 |
| Consumer Staples | 11.3 |
| Communication Services | 6.9 |
| Materials | 4.2 |
| Utilities | 4.0 |
| Information Technology | 3.8 |
| Energy | 2.9 |
| Real Estate | 2.2 |
| Total | 100.0% |
| Top Ten Holdings | % of Total Investments |
| Sekisui House Ltd. | 3.1% |
| McDonald’s Holdings Co., Japan Ltd. | 3.0 |
| Secom Co., Ltd. | 2.7 |
| Tobu Railway Co., Ltd. | 2.5 |
| Enbridge, Inc. | 1.9 |
| RELX PLC | 1.5 |
| Takeda Pharmaceutical Co., Ltd. | 1.3 |
| Phoenix Group Holdings PLC | 1.1 |
| London Stock Exchange Group PLC | 1.1 |
| SEB S.A. | 1.1 |
| Total | 19.3% |
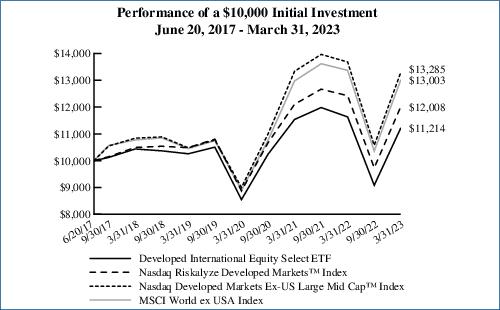
Performance figures assume reinvestment of all distributions and do not reflect the deduction of taxes that a shareholder would pay on Fund distributions or the redemption or sale of Fund shares. An index is a statistical composite that tracks a specified financial market or sector. Unlike the Fund, the indices do not actually hold a portfolio of securities and therefore do not incur the expenses incurred by the Fund. These expenses negatively impact the performance of the Fund. The Fund’s past performance does not predict future performance.
| Performance | ||||||
| Average Annual Total Returns | Cumulative Total Returns | |||||
| 1 Year Ended 3/31/23 | 5 Years Ended 3/31/23 | Inception (6/20/17) to 3/31/23 | 5 Years Ended 3/31/23 | Inception (6/20/17) to 3/31/23 | ||
| Fund Performance | ||||||
| NAV | -4.97% | -1.03% | 1.25% | -5.06% | 7.42% | |
| Market Price | -5.34% | -1.25% | 1.19% | -6.08% | 7.06% | |
| Index Performance | ||||||
| Nasdaq Riskalyze Emerging MarketsTM Index | -3.56% | 1.00% | 3.18% | 5.08% | 19.85% | |
| Nasdaq Emerging Large Mid CapTM Index | -8.71% | 0.16% | 3.10% | 0.78% | 19.30% | |
| MSCI Emerging Markets Index | -10.70% | -0.88% | 2.12% | -4.32% | 12.88% | |
| Sector Allocation | % of Total Investments |
| Financials | 32.3% |
| Information Technology | 22.0 |
| Materials | 10.4 |
| Consumer Staples | 7.9 |
| Industrials | 6.2 |
| Consumer Discretionary | 5.0 |
| Energy | 4.4 |
| Communication Services | 3.6 |
| Utilities | 3.3 |
| Health Care | 2.8 |
| Real Estate | 2.1 |
| Total | 100.0% |
| Top Ten Holdings | % of Total Investments |
| Wistron Corp. | 3.8% |
| Inventec Corp. | 3.4 |
| Powertech Technology, Inc. | 2.9 |
| Compal Electronics, Inc. | 2.8 |
| WPG Holdings Ltd. | 2.6 |
| Power Finance Corp., Ltd. | 2.6 |
| Hon Hai Precision Industry Co., Ltd. | 2.5 |
| REC Ltd. | 2.2 |
| Larsen & Toubro Ltd. | 2.1 |
| HDFC Bank Ltd. | 2.0 |
| Total | 26.9% |
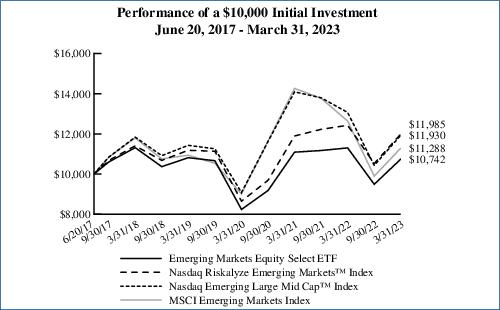
Performance figures assume reinvestment of all distributions and do not reflect the deduction of taxes that a shareholder would pay on Fund distributions or the redemption or sale of Fund shares. An index is a statistical composite that tracks a specified financial market or sector. Unlike the Fund, the indices do not actually hold a portfolio of securities and therefore do not incur the expenses incurred by the Fund. These expenses negatively impact the performance of the Fund. The Fund’s past performance does not predict future performance.
| Performance | ||||||
| Average Annual Total Returns | Cumulative Total Returns | |||||
| 1 Year Ended 3/31/23 | 5 Years Ended 3/31/23 | Inception (6/20/17) to 3/31/23 | 5 Years Ended 3/31/23 | Inception (6/20/17) to 3/31/23 | ||
| Fund Performance | ||||||
| NAV | -5.57% | 9.28% | 9.70% | 55.83% | 70.70% | |
| Market Price | -5.62% | 9.26% | 9.70% | 55.68% | 70.69% | |
| Index Performance | ||||||
| Nasdaq Riskalyze US Large CapTM Index | -5.02% | 9.96% | 10.37% | 60.75% | 76.88% | |
| Nasdaq US 500 Large CapTM Index | -8.29% | 11.04% | 11.34% | 68.84% | 86.01% | |
| S&P 500® Index | -7.73% | 11.19% | 11.43% | 69.94% | 86.93% | |
| Sector Allocation | % of Total Investments |
| Information Technology | 27.7% |
| Health Care | 15.0 |
| Industrials | 12.3 |
| Financials | 11.2 |
| Consumer Discretionary | 9.6 |
| Consumer Staples | 7.4 |
| Energy | 5.0 |
| Communication Services | 3.3 |
| Materials | 2.9 |
| Utilities | 2.8 |
| Real Estate | 2.8 |
| Total | 100.0% |
| Top Ten Holdings | % of Total Investments |
| NVIDIA Corp. | 1.3% |
| Monolithic Power Systems, Inc. | 1.0 |
| Skyworks Solutions, Inc. | 0.9 |
| Apple, Inc. | 0.9 |
| Lam Research Corp. | 0.9 |
| Applied Materials, Inc. | 0.9 |
| Seagate Technology Holdings PLC | 0.9 |
| Entegris, Inc. | 0.9 |
| Intel Corp. | 0.8 |
| Teradyne, Inc. | 0.8 |
| Total | 9.3% |

Performance figures assume reinvestment of all distributions and do not reflect the deduction of taxes that a shareholder would pay on Fund distributions or the redemption or sale of Fund shares. An index is a statistical composite that tracks a specified financial market or sector. Unlike the Fund, the indices do not actually hold a portfolio of securities and therefore do not incur the expenses incurred by the Fund. These expenses negatively impact the performance of the Fund. The Fund’s past performance does not predict future performance.
| Performance | ||||||
| Average Annual Total Returns | Cumulative Total Returns | |||||
| 1 Year Ended 3/31/23 | 5 Years Ended 3/31/23 | Inception (6/20/17) to 3/31/23 | 5 Years Ended 3/31/23 | Inception (6/20/17) to 3/31/23 | ||
| Fund Performance | ||||||
| NAV | -4.47% | 7.09% | 7.54% | 40.87% | 52.19% | |
| Market Price | -4.48% | 7.08% | 7.53% | 40.75% | 52.13% | |
| Index Performance | ||||||
| Nasdaq Riskalyze US Mid CapTM Index | -3.94% | 7.74% | 8.19% | 45.20% | 57.63% | |
| Nasdaq US 600 Mid CapTM Index | -9.77% | 6.73% | 7.78% | 38.46% | 54.18% | |
| S&P MidCap 400® Index | -5.12% | 7.67% | 8.20% | 44.72% | 57.70% | |
| Sector Allocation | % of Total Investments |
| Industrials | 20.0% |
| Consumer Discretionary | 16.2 |
| Financials | 14.9 |
| Health Care | 11.6 |
| Information Technology | 10.7 |
| Materials | 6.7 |
| Real Estate | 6.5 |
| Energy | 4.0 |
| Utilities | 3.9 |
| Consumer Staples | 3.0 |
| Communication Services | 2.5 |
| Total | 100.0% |
| Top Ten Holdings | % of Total Investments |
| DENTSPLY SIRONA, Inc. | 1.2% |
| Bruker Corp. | 1.1 |
| Universal Display Corp. | 1.1 |
| National Instruments Corp. | 1.1 |
| Chemed Corp. | 1.0 |
| Perrigo Co. PLC | 1.0 |
| Select Medical Holdings Corp. | 1.0 |
| Teleflex, Inc. | 1.0 |
| Ensign Group (The), Inc. | 1.0 |
| Jabil, Inc. | 1.0 |
| Total | 10.5% |
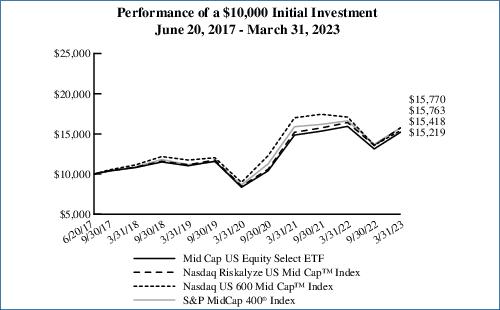
Performance figures assume reinvestment of all distributions and do not reflect the deduction of taxes that a shareholder would pay on Fund distributions or the redemption or sale of Fund shares. An index is a statistical composite that tracks a specified financial market or sector. Unlike the Fund, the indices do not actually hold a portfolio of securities and therefore do not incur the expenses incurred by the Fund. These expenses negatively impact the performance of the Fund. The Fund’s past performance does not predict future performance.
| Performance | ||||||
| Average Annual Total Returns | Cumulative Total Returns | |||||
| 1 Year Ended 3/31/23 | 5 Years Ended 3/31/23 | Inception (6/20/17) to 3/31/23 | 5 Years Ended 3/31/23 | Inception (6/20/17) to 3/31/23 | ||
| Fund Performance | ||||||
| NAV | -6.28% | 6.80% | 7.15% | 38.97% | 49.05% | |
| Market Price | -6.41% | 6.77% | 7.14% | 38.77% | 48.98% | |
| Index Performance | ||||||
| Nasdaq Riskalyze US Small CapTM Index | -5.73% | 7.50% | 7.86% | 43.59% | 54.81% | |
| Nasdaq US 700 Small CapTM Index | -12.49% | 6.33% | 7.19% | 35.91% | 49.39% | |
| S&P SmallCap 600® Index | -8.82% | 6.30% | 7.52% | 35.71% | 52.06% | |
| Sector Allocation | % of Total Investments |
| Industrials | 16.9% |
| Financials | 15.5 |
| Health Care | 15.2 |
| Consumer Discretionary | 12.5 |
| Information Technology | 11.7 |
| Real Estate | 6.5 |
| Consumer Staples | 5.8 |
| Energy | 5.2 |
| Materials | 4.4 |
| Communication Services | 3.9 |
| Utilities | 2.4 |
| Total | 100.0% |
| Top Ten Holdings | % of Total Investments |
| U.S. Physical Therapy, Inc. | 3.0% |
| CONMED Corp. | 2.9 |
| Atrion Corp. | 2.8 |
| Embecta Corp. | 2.8 |
| Patterson Cos., Inc. | 2.4 |
| Pegasystems, Inc. | 1.6 |
| Shutterstock, Inc. | 1.5 |
| CTS Corp. | 1.4 |
| Simulations Plus, Inc. | 1.3 |
| Advanced Energy Industries, Inc. | 1.3 |
| Total | 21.0% |

Performance figures assume reinvestment of all distributions and do not reflect the deduction of taxes that a shareholder would pay on Fund distributions or the redemption or sale of Fund shares. An index is a statistical composite that tracks a specified financial market or sector. Unlike the Fund, the indices do not actually hold a portfolio of securities and therefore do not incur the expenses incurred by the Fund. These expenses negatively impact the performance of the Fund. The Fund’s past performance does not predict future performance.
| Performance | ||||||
| Average Annual Total Returns | Cumulative Total Returns | |||||
| 1 Year Ended 3/31/23 | 5 Years Ended 3/31/23 | Inception (6/20/17) to 3/31/23 | 5 Years Ended 3/31/23 | Inception (6/20/17) to 3/31/23 | ||
| Fund Performance | ||||||
| NAV | -4.28% | 9.18% | 9.35% | 55.17% | 67.58% | |
| Market Price | -4.40% | 9.17% | 9.35% | 55.09% | 67.65% | |
| Index Performance | ||||||
| Nasdaq Riskalyze US Large Cap Select DividendTM Index | -3.83% | 9.79% | 9.95% | 59.49% | 72.95% | |
| Nasdaq US 500 Large CapTM Index | -8.29% | 11.04% | 11.34% | 68.84% | 86.01% | |
| S&P 500® Index | -7.73% | 11.19% | 11.43% | 69.94% | 86.93% | |
| Sector Allocation | % of Total Investments |
| Information Technology | 27.7% |
| Health Care | 14.3 |
| Financials | 11.3 |
| Industrials | 10.6 |
| Consumer Discretionary | 10.0 |
| Consumer Staples | 7.0 |
| Communication Services | 5.2 |
| Energy | 5.2 |
| Utilities | 3.1 |
| Materials | 2.8 |
| Real Estate | 2.8 |
| Total | 100.0% |
| Top Ten Holdings | % of Total Investments |
| Intel Corp. | 3.3% |
| Seagate Technology Holdings PLC | 3.2 |
| International Business Machines Corp. | 2.1 |
| HP, Inc. | 2.0 |
| Paramount Global, Class B | 1.9 |
| Medtronic PLC | 1.8 |
| Corning, Inc. | 1.8 |
| AbbVie, Inc. | 1.8 |
| NetApp, Inc. | 1.7 |
| Gilead Sciences, Inc. | 1.7 |
| Total | 21.3% |
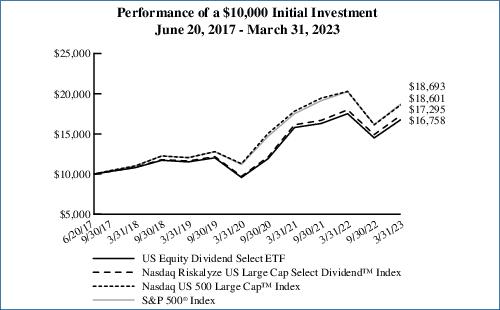
Performance figures assume reinvestment of all distributions and do not reflect the deduction of taxes that a shareholder would pay on Fund distributions or the redemption or sale of Fund shares. An index is a statistical composite that tracks a specified financial market or sector. Unlike the Fund, the indices do not actually hold a portfolio of securities and therefore do not incur the expenses incurred by the Fund. These expenses negatively impact the performance of the Fund. The Fund’s past performance does not predict future performance.
| Beginning Account Value October 1, 2022 | Ending Account Value March 31, 2023 | Annualized Expense Ratio Based on the Six-Month Period | Expenses Paid During the Six-Month Period (a) | |
| Developed International Equity Select ETF (RNDM) | ||||
| Actual | $1,000.00 | $1,234.50 | 0.65% | $3.62 |
| Hypothetical (5% return before expenses) | $1,000.00 | $1,021.69 | 0.65% | $3.28 |
| Emerging Markets Equity Select ETF (RNEM) | ||||
| Actual | $1,000.00 | $1,131.90 | 0.75% | $3.99 |
| Hypothetical (5% return before expenses) | $1,000.00 | $1,021.19 | 0.75% | $3.78 |
| Large Cap US Equity Select ETF (RNLC) | ||||
| Actual | $1,000.00 | $1,167.00 | 0.60% | $3.24 |
| Hypothetical (5% return before expenses) | $1,000.00 | $1,021.94 | 0.60% | $3.02 |
| Mid Cap US Equity Select ETF (RNMC) | ||||
| Actual | $1,000.00 | $1,159.00 | 0.60% | $3.23 |
| Hypothetical (5% return before expenses) | $1,000.00 | $1,021.94 | 0.60% | $3.02 |
| Small Cap US Equity Select ETF (RNSC) | ||||
| Actual | $1,000.00 | $1,166.00 | 0.60% | $3.24 |
| Hypothetical (5% return before expenses) | $1,000.00 | $1,021.94 | 0.60% | $3.02 |
| US Equity Dividend Select ETF (RNDV) | ||||
| Actual | $1,000.00 | $1,155.60 | 0.50% | $2.69 |
| Hypothetical (5% return before expenses) | $1,000.00 | $1,022.44 | 0.50% | $2.52 |
| (a) | Expenses are equal to the annualized expense ratios as indicated in the table multiplied by the average account value over the period (October 1, 2022 through March 31, 2023), multiplied by 182/365 (to reflect the six-month period). |
| Shares | Description | Value | ||
| COMMON STOCKS (a) – 97.7% | ||||
| Australia – 5.2% | ||||
| 3,679 | ANZ Group Holdings Ltd. (b) | $56,694 | ||
| 7,097 | APA Group (b) | 48,211 | ||
| 1,169 | ASX Ltd. (b) | 51,051 | ||
| 6,241 | Aurizon Holdings Ltd. (b) | 14,057 | ||
| 1,887 | Brambles Ltd. (b) | 17,014 | ||
| 2,074 | Coles Group Ltd. (b) | 25,060 | ||
| 925 | Commonwealth Bank of Australia (b) | 61,074 | ||
| 394 | CSL Ltd. (b) | 76,306 | ||
| 18,236 | Insurance Australia Group Ltd. (b) | 57,401 | ||
| 2,414 | Lendlease Corp., Ltd. (b) | 11,748 | ||
| 24,174 | Medibank Pvt Ltd. (b) | 54,553 | ||
| 2,912 | National Australia Bank Ltd. (b) | 54,260 | ||
| 1,270 | Seven Group Holdings Ltd. (b) | 19,728 | ||
| 3,668 | Sonic Healthcare Ltd. (b) | 85,989 | ||
| 8,363 | Suncorp Group Ltd. (b) | 67,950 | ||
| 14,884 | Telstra Corp., Ltd. (b) | 42,143 | ||
| 1,745 | Transurban Group (b) | 16,662 | ||
| 2,711 | Treasury Wine Estates Ltd. (b) | 23,799 | ||
| 2,560 | Washington H Soul Pattinson & Co., Ltd. (b) | 51,883 | ||
| 2,983 | Wesfarmers Ltd. (b) | 100,821 | ||
| 4,064 | Westpac Banking Corp. (b) | 59,170 | ||
| 1,004 | Woolworths Group Ltd. (b) | 25,524 | ||
| 1,021,098 | ||||
| Austria – 0.2% | ||||
| 91 | ANDRITZ AG (b) | 6,157 | ||
| 421 | Erste Group Bank AG (b) | 13,948 | ||
| 185 | OMV AG (b) | 8,496 | ||
| 154 | Verbund AG (b) | 13,395 | ||
| 41,996 | ||||
| Belgium – 0.9% | ||||
| 241 | Ageas S.A./N.V. (b) | 10,425 | ||
| 1,208 | Anheuser-Busch InBev S.A./N.V. (b) | 80,525 | ||
| 30 | D’ieteren Group (b) | 5,837 | ||
| 49 | Elia Group S.A./N.V. (b) | 6,471 | ||
| 126 | Groupe Bruxelles Lambert S.A. (b) | 10,753 | ||
| 186 | KBC Group N.V. (b) | 12,780 | ||
| 176 | Proximus S.A.D.P. (b) | 1,702 | ||
| 51 | Sofina S.A. (b) | 11,455 | ||
| 88 | Solvay S.A. (b) | 10,064 | ||
| 249 | UCB S.A. (b) | 22,255 | ||
| 234 | Umicore S.A. (b) | 7,938 | ||
| 180,205 | ||||
| Bermuda – 0.0% | ||||
| 1,200 | Hongkong Land Holdings Ltd. (b) | 5,279 | ||
| Shares | Description | Value | ||
| Canada – 7.9% | ||||
| 1,599 | Algonquin Power & Utilities Corp. | $13,417 | ||
| 763 | Bank of Montreal | 67,961 | ||
| 1,405 | Bank of Nova Scotia (The) | 70,764 | ||
| 1,204 | BCE, Inc. | 53,933 | ||
| 1,527 | Canadian Imperial Bank of Commerce | 64,752 | ||
| 671 | Canadian Utilities Ltd., Class A | 18,698 | ||
| 514 | Capital Power Corp. | 15,836 | ||
| 432 | Emera, Inc. | 17,747 | ||
| 9,463 | Enbridge, Inc. | 360,805 | ||
| 460 | Fortis, Inc. | 19,554 | ||
| 237 | George Weston Ltd. | 31,407 | ||
| 3,096 | Great-West Lifeco, Inc. | 82,056 | ||
| 714 | Hydro One Ltd. (c) (d) | 20,329 | ||
| 472 | Intact Financial Corp. | 67,550 | ||
| 495 | Metro, Inc. | 27,228 | ||
| 1,066 | National Bank of Canada | 76,249 | ||
| 596 | Northland Power, Inc. (CAD) | 14,941 | ||
| 2,966 | Power Corp. of Canada | 75,801 | ||
| 742 | Royal Bank of Canada | 70,961 | ||
| 1,681 | Sun Life Financial, Inc. | 78,534 | ||
| 2,542 | TELUS Corp. | 50,464 | ||
| 651 | Thomson Reuters Corp. | 84,700 | ||
| 727 | TMX Group Ltd. | 73,426 | ||
| 1,090 | Toronto-Dominion Bank (The) | 65,287 | ||
| 129 | Waste Connections, Inc. | 17,954 | ||
| 1,540,354 | ||||
| Cayman Islands – 0.5% | ||||
| 2,123 | CK Asset Holdings Ltd. (b) | 12,871 | ||
| 2,093 | CK Hutchison Holdings Ltd. (b) | 12,949 | ||
| 5,200 | Sands China Ltd. (b) (e) | 18,065 | ||
| 7,200 | Shimao Group Holdings Ltd. (e) (f) (g) | 2,027 | ||
| 14,446 | Sino Biopharmaceutical Ltd. (b) | 8,097 | ||
| 6,667 | SITC International Holdings Co., Ltd. (b) | 14,328 | ||
| 9,731 | WH Group Ltd. (b) (c) (d) | 5,801 | ||
| 2,400 | Wharf Real Estate Investment Co., Ltd. (b) | 13,818 | ||
| 87,956 | ||||
| Denmark – 2.7% | ||||
| 13 | AP Moller - Maersk A.S., Class B (b) | 23,630 | ||
| 127 | Carlsberg A.S., Class B (b) | 19,706 | ||
| 680 | Chr Hansen Holding A.S. (b) | 51,728 | ||
| 328 | Coloplast A.S., Class B (b) | 43,187 | ||
| 822 | Danske Bank A.S. (b) (e) | 16,538 | ||
| 1,348 | Demant A.S. (b) (e) | 47,323 | ||
| 196 | DSV A.S. (b) | 38,004 | ||
| 104 | Genmab A.S. (b) (e) | 39,313 | ||
| 1,900 | GN Store Nord A.S. (b) (e) | 42,603 | ||
| 10,477 | H Lundbeck A.S. (b) | 48,480 | ||
| Shares | Description | Value | ||
| COMMON STOCKS (a) (Continued) | ||||
| Denmark (Continued) | ||||
| 335 | Novo Nordisk A.S., Class B (b) | $53,205 | ||
| 665 | Novozymes A.S., Class B (b) | 34,050 | ||
| 244 | Orsted A.S. (b) (c) (d) | 20,805 | ||
| 105 | Pandora A.S. (b) | 10,079 | ||
| 497 | Tryg A.S. (b) | 10,867 | ||
| 1,236 | Vestas Wind Systems A/S (b) | 36,023 | ||
| 535,541 | ||||
| Finland – 1.3% | ||||
| 429 | Elisa Oyj (b) | 25,874 | ||
| 561 | Fortum Oyj (b) | 8,594 | ||
| 348 | Kesko Oyj, Class B (b) | 7,479 | ||
| 222 | Kone Oyj, Class B (b) | 11,578 | ||
| 1,281 | Metso Outotec Oyj (b) | 13,988 | ||
| 555 | Neste Oyj (b) | 27,419 | ||
| 4,502 | Nokia Oyj (b) | 22,100 | ||
| 3,514 | Nordea Bank Abp (b) | 37,523 | ||
| 128 | Orion Oyj, Class B (b) | 5,721 | ||
| 707 | Sampo Oyj, Class A (b) | 33,360 | ||
| 1,290 | Stora Enso Oyj, Class R (b) | 16,783 | ||
| 518 | UPM-Kymmene Oyj (b) | 17,398 | ||
| 422 | Valmet Oyj (b) | 13,700 | ||
| 1,334 | Wartsila OYJ Abp (b) | 12,589 | ||
| 254,106 | ||||
| France – 9.7% | ||||
| 716 | Air Liquide S.A. (b) | 119,850 | ||
| 2,293 | AXA S.A. (b) | 69,977 | ||
| 8,439 | Bollore SE (b) | 52,167 | ||
| 1,484 | Bouygues S.A. (b) | 50,050 | ||
| 1,734 | Bureau Veritas S.A. (b) | 49,822 | ||
| 2,261 | Carrefour S.A. (b) | 45,712 | ||
| 662 | Danone S.A. (b) | 41,192 | ||
| 841 | Edenred (b) | 49,774 | ||
| 483 | Eiffage S.A. (b) | 52,268 | ||
| 3,985 | Engie S.A. (b) | 63,061 | ||
| 685 | EssilorLuxottica S.A. (b) | 123,521 | ||
| 957 | Eurazeo SE (b) | 68,120 | ||
| 2,506 | Getlink SE (b) | 41,273 | ||
| 3,825 | La Francaise des Jeux SAEM (b) (c) (d) | 159,417 | ||
| 598 | Legrand S.A. (b) | 54,641 | ||
| 353 | L’Oreal S.A. (b) | 157,736 | ||
| 2,227 | Orange S.A. (b) | 26,457 | ||
| 170 | Pernod Ricard S.A. (b) | 38,493 | ||
| 1,226 | Sanofi (b) | 132,995 | ||
| 1,801 | SEB S.A. (b) | 204,925 | ||
| 153 | Teleperformance (b) | 36,970 | ||
| 353 | Thales S.A. (b) | 52,190 | ||
| 479 | Vinci S.A. (b) | 54,914 | ||
| 14,620 | Vivendi SE (b) | 147,831 | ||
| 1,893,356 | ||||
| Germany – 8.5% | ||||
| 314 | Allianz SE (b) | 72,483 | ||
| Shares | Description | Value | ||
| Germany (Continued) | ||||
| 640 | Bayer AG (b) | $40,884 | ||
| 1,865 | Bayerische Motoren Werke AG (b) | 204,402 | ||
| 199 | Beiersdorf AG (b) | 25,887 | ||
| 460 | Brenntag SE (b) | 34,618 | ||
| 302 | Deutsche Boerse AG (b) | 58,802 | ||
| 2,015 | Deutsche Post AG (b) | 94,374 | ||
| 2,832 | Deutsche Telekom AG (b) | 68,626 | ||
| 3,385 | E.ON SE (b) | 42,227 | ||
| 1,664 | Evonik Industries AG (b) | 35,009 | ||
| 1,045 | Fresenius Medical Care AG & Co., KGaA (b) | 44,354 | ||
| 1,382 | Fresenius SE & Co., KGaA (b) | 37,318 | ||
| 1,881 | GEA Group AG (b) | 85,807 | ||
| 330 | Hannover Rueck SE (b) | 64,542 | ||
| 1,535 | HeidelbergCement AG (b) | 112,081 | ||
| 2,139 | Henkel AG & Co., KGaA (Preference Shares) (b) | 167,343 | ||
| 243 | LEG Immobilien SE (b) | 13,354 | ||
| 182 | Merck KGaA (b) | 33,931 | ||
| 206 | Muenchener Rueckversicherungs-Gesellschaft AG in Muenchen (b) | 72,025 | ||
| 707 | RWE AG (b) | 30,421 | ||
| 945 | SAP SE (b) | 119,326 | ||
| 1,537 | Scout24 AG (b) (c) (d) | 91,419 | ||
| 286 | Symrise AG (b) | 31,124 | ||
| 23,900 | Telefonica Deutschland Holding AG (b) | 73,570 | ||
| 672 | Vonovia SE (b) | 12,657 | ||
| 1,666,584 | ||||
| Greece – 0.0% | ||||
| 254 | Hellenic Telecommunications Organization S.A. (b) | 3,720 | ||
| 243 | OPAP S.A. (b) | 3,898 | ||
| 7,618 | ||||
| Hong Kong – 1.9% | ||||
| 7,451 | AIA Group Ltd. (b) | 78,141 | ||
| 1,870 | CLP Holdings, Ltd. (b) | 13,513 | ||
| 2,111 | Galaxy Entertainment Group Ltd. (b) (e) | 14,121 | ||
| 6,838 | Hang Lung Properties Ltd. (b) | 12,795 | ||
| 4,124 | Hang Seng Bank Ltd. (b) | 58,624 | ||
| 3,782 | Henderson Land Development Co., Ltd. (b) | 13,085 | ||
| 14,417 | Hong Kong & China Gas Co., Ltd. (b) | 12,693 | ||
| 1,815 | Hong Kong Exchanges & Clearing Ltd. (b) | 80,449 | ||
| 2,902 | MTR Corp., Ltd. (b) | 14,006 | ||
| 4,393 | New World Development Co., Ltd. (b) | 11,776 | ||
| Shares | Description | Value | ||
| COMMON STOCKS (a) (Continued) | ||||
| Hong Kong (Continued) | ||||
| 2,419 | Power Assets Holdings Ltd. (b) | $12,978 | ||
| 8,905 | Sino Land Co., Ltd. (b) | 12,043 | ||
| 966 | Sun Hung Kai Properties Ltd. (b) | 13,533 | ||
| 640 | Swire Pacific Ltd., Class A (b) | 4,918 | ||
| 1,158 | Techtronic Industries Co., Ltd. (b) | 12,547 | ||
| 365,222 | ||||
| Ireland – 0.8% | ||||
| 2,244 | AIB Group PLC (b) | 9,083 | ||
| 837 | Bank of Ireland Group PLC (b) | 8,469 | ||
| 605 | CRH PLC (b) | 30,565 | ||
| 555 | DCC PLC (b) | 32,351 | ||
| 189 | Kerry Group PLC, Class A (b) | 18,848 | ||
| 432 | Kingspan Group PLC (b) | 29,603 | ||
| 289 | Ryanair Holdings PLC, ADR (e) | 27,250 | ||
| 156,169 | ||||
| Israel – 0.4% | ||||
| 46 | Azrieli Group Ltd. (b) | 2,643 | ||
| 1,184 | Bank Hapoalim BM (b) | 9,854 | ||
| 1,193 | Bank Leumi Le-Israel BM (b) | 9,025 | ||
| 6,270 | Bezeq Israeli Telecommunication Corp., Ltd. (b) | 8,536 | ||
| 29 | Elbit Systems Ltd. (b) | 4,939 | ||
| 796 | ICL Group Ltd. (b) | 5,394 | ||
| 2,054 | Israel Discount Bank Ltd., Class A (b) | 10,090 | ||
| 287 | Mizrahi Tefahot Bank Ltd. (b) | 8,997 | ||
| 54 | Nice, Ltd. (b) (e) | 12,301 | ||
| 1,344 | Teva Pharmaceutical Industries Ltd. (b) (e) | 11,934 | ||
| 83,713 | ||||
| Italy – 1.9% | ||||
| 129 | Amplifon S.p.A. (b) | 4,471 | ||
| 1,139 | Assicurazioni Generali S.p.A. (b) | 22,694 | ||
| 2,467 | Banca Mediolanum S.p.A. (b) | 22,331 | ||
| 31 | DiaSorin S.p.A. (b) | 3,267 | ||
| 4,389 | Enel S.p.A. (b) | 26,768 | ||
| 1,650 | Eni S.p.A. (b) | 23,012 | ||
| 1,253 | FinecoBank Banca Fineco S.p.A. (b) | 19,197 | ||
| 436 | Infrastrutture Wireless Italiane S.p.A. (b) (c) (d) | 5,728 | ||
| 289 | Interpump Group S.p.A. (b) | 16,207 | ||
| 9,374 | Intesa Sanpaolo S.p.A. (b) | 24,058 | ||
| 3,882 | Italgas S.p.A. (b) | 23,678 | ||
| 1,330 | Leonardo S.p.A. (b) | 15,598 | ||
| 1,981 | Mediobanca Banca di Credito Finanziario S.p.A. (b) | 19,907 | ||
| 268 | Moncler S.p.A. (b) | 18,511 | ||
| 1,160 | Nexi S.P.A (b) (c) (d) (e) | 9,427 | ||
| 2,049 | Poste Italiane S.p.A. (b) (c) (d) | 20,895 | ||
| 327 | Prysmian S.p.A. (b) | 13,731 | ||
| Shares | Description | Value | ||
| Italy (Continued) | ||||
| 92 | Recordati Industria Chimica e Farmaceutica S.p.A. (b) | $3,892 | ||
| 4,342 | Snam S.p.A. (b) | 23,021 | ||
| 20,543 | Telecom Italia S.p.A. (b) (e) | 6,775 | ||
| 2,966 | Terna-Rete Elettrica Nazionale S.p.A. (b) | 24,343 | ||
| 1,526 | UniCredit S.p.A. (b) | 28,762 | ||
| 376,273 | ||||
| Japan – 18.8% | ||||
| 14,800 | Japan Post Holdings Co., Ltd. (b) | 120,116 | ||
| 3,200 | Japan Tobacco, Inc. (b) | 67,595 | ||
| 3,200 | KDDI Corp. (b) | 98,681 | ||
| 3,400 | Kirin Holdings Co., Ltd. (b) | 53,791 | ||
| 13,800 | McDonald’s Holdings Co., Japan Ltd. (b) | 573,774 | ||
| 2,400 | MEIJI Holdings Co., Ltd. (b) | 57,080 | ||
| 22,700 | Mitsubishi HC Capital, Inc. (b) | 117,217 | ||
| 9,100 | Mizuho Financial Group, Inc. (b) | 128,925 | ||
| 3,400 | Nippon Telegraph & Telephone Corp. (b) | 101,601 | ||
| 800 | Nissin Foods Holdings Co., Ltd. (b) | 73,152 | ||
| 6,200 | Otsuka Holdings Co., Ltd. (b) | 196,848 | ||
| 8,400 | Secom Co., Ltd. (b) | 517,673 | ||
| 29,100 | Sekisui House Ltd. (b) | 593,094 | ||
| 9,300 | SoftBank Corp. (b) | 107,357 | ||
| 3,500 | Sumitomo Mitsui Financial Group, Inc. (b) | 140,061 | ||
| 7,500 | Takeda Pharmaceutical Co., Ltd. (b) | 246,327 | ||
| 20,500 | Tobu Railway Co., Ltd. (b) | 490,786 | ||
| 3,684,078 | ||||
| Jersey – 0.2% | ||||
| 979 | Experian PLC (b) | 32,236 | ||
| Luxembourg – 0.2% | ||||
| 471 | ArcelorMittal S.A. (b) | 14,269 | ||
| 1,357 | Tenaris S.A. (b) | 19,228 | ||
| 33,497 | ||||
| Netherlands – 4.4% | ||||
| 549 | Aalberts N.V. (b) | 25,933 | ||
| 1,549 | ABN AMRO Bank N.V. (b) (c) (d) | 24,563 | ||
| 14 | Adyen N.V. (b) (c) (d) (e) | 22,308 | ||
| 3,485 | Aegon N.V. (b) | 14,962 | ||
| 167 | Akzo Nobel N.V. (b) | 13,062 | ||
| 48 | Argenx SE (b) (e) | 17,825 | ||
| 338 | ASM International N.V. (b) | 137,195 | ||
| 182 | ASML Holding N.V. (b) | 124,024 | ||
| 361 | ASR Nederland N.V. (b) | 14,364 | ||
| 680 | Davide Campari-Milano N.V. (b) | 8,297 | ||
| 792 | Euronext N.V. (b) (c) (d) | 60,647 | ||
| Shares | Description | Value | ||
| COMMON STOCKS (a) (Continued) | ||||
| Netherlands (Continued) | ||||
| 330 | Heineken Holding N.V. (b) | $30,277 | ||
| 259 | Heineken N.V. (b) | 27,830 | ||
| 79 | IMCD N.V. (b) | 12,918 | ||
| 1,614 | ING Groep N.V. (b) | 19,167 | ||
| 891 | Koninklijke Ahold Delhaize N.V. (b) | 30,441 | ||
| 198 | Koninklijke DSM N.V. (b) | 23,432 | ||
| 3,723 | Koninklijke KPN N.V. (b) | 13,155 | ||
| 1,020 | Koninklijke Philips N.V. (b) | 18,734 | ||
| 358 | NN Group N.V. (b) | 12,999 | ||
| 259 | OCI N.V. (b) | 8,780 | ||
| 1,465 | Prosus N.V. (b) | 114,715 | ||
| 416 | Randstad N.V. (b) | 24,696 | ||
| 1,379 | Universal Music Group N.V. (b) | 34,923 | ||
| 267 | Wolters Kluwer N.V. (b) | 33,705 | ||
| 868,952 | ||||
| New Zealand – 0.2% | ||||
| 2,588 | Auckland International Airport Ltd. (b) (e) | 14,084 | ||
| 1,019 | Fisher & Paykel Healthcare Corp., Ltd. (b) | 17,034 | ||
| 2,383 | Spark New Zealand Ltd. (b) | 7,550 | ||
| 153 | Xero Ltd. (b) (e) | 9,280 | ||
| 47,948 | ||||
| Norway – 0.7% | ||||
| 1,015 | Aker BP ASA (b) | 24,893 | ||
| 1,269 | DNB Bank ASA (b) | 22,710 | ||
| 899 | Equinor ASA (b) | 25,557 | ||
| 127 | Kongsberg Gruppen ASA (b) | 5,134 | ||
| 437 | Mowi ASA (b) | 8,083 | ||
| 1,339 | Norsk Hydro ASA (b) | 9,993 | ||
| 755 | Orkla ASA (b) | 5,355 | ||
| 163 | Salmar ASA (b) | 7,100 | ||
| 820 | Telenor ASA (b) | 9,614 | ||
| 220 | TOMRA Systems ASA (b) | 3,714 | ||
| 210 | Yara International ASA (b) | 9,127 | ||
| 131,280 | ||||
| Portugal – 0.2% | ||||
| 3,372 | EDP - Energias de Portugal S.A. (b) | 18,374 | ||
| 1,068 | Galp Energia SGPS S.A. (b) | 12,084 | ||
| 353 | Jeronimo Martins SGPS S.A. (b) | 8,286 | ||
| 38,744 | ||||
| Singapore – 1.2% | ||||
| 2,200 | Capitaland Investment Ltd. (b) | 6,104 | ||
| 1,000 | City Developments Ltd. (b) | 5,549 | ||
| 1,500 | DBS Group Holdings Ltd. (b) | 37,293 | ||
| 7,800 | Genting Singapore Ltd. (b) | 6,583 | ||
| 200 | Jardine Cycle & Carriage Ltd. (b) | 4,710 | ||
| 2,700 | Keppel Corp., Ltd. (b) | 11,455 | ||
| Shares | Description | Value | ||
| Singapore (Continued) | ||||
| 4,200 | Oversea-Chinese Banking Corp., Ltd. (b) | $39,151 | ||
| 1,200 | Singapore Airlines Ltd. (b) | 5,176 | ||
| 5,300 | Singapore Exchange Ltd. (b) | 37,532 | ||
| 2,000 | Singapore Technologies Engineering Ltd. (b) | 5,506 | ||
| 10,100 | Singapore Telecommunications Ltd. (b) | 18,714 | ||
| 1,900 | United Overseas Bank Ltd. (b) | 42,615 | ||
| 1,200 | UOL Group Ltd. (b) | 6,266 | ||
| 4,100 | Wilmar International Ltd. (b) | 12,989 | ||
| 239,643 | ||||
| South Korea – 4.3% | ||||
| 33 | CJ CheilJedang Corp. (b) | 8,267 | ||
| 349 | Hana Financial Group, Inc. (b) | 10,930 | ||
| 100 | Hyundai Glovis Co., Ltd. (b) | 12,213 | ||
| 150 | Hyundai Mobis Co., Ltd. (b) | 24,913 | ||
| 162 | Hyundai Motor Co. (b) | 23,048 | ||
| 1,299 | Industrial Bank of Korea (b) | 10,103 | ||
| 283 | KB Financial Group, Inc. (b) | 10,336 | ||
| 398 | Kia Corp. (b) | 24,838 | ||
| 351 | Korea Electric Power Corp. (b) (e) | 4,864 | ||
| 1,296 | Korean Air Lines Co., Ltd. (b) | 23,139 | ||
| 642 | KT Corp., ADR | 7,280 | ||
| 153 | KT&G Corp. (b) | 9,833 | ||
| 219 | LG Corp. (b) | 13,945 | ||
| 754 | NAVER Corp. (b) | 118,145 | ||
| 346 | POSCO Holdings, Inc. (b) | 97,891 | ||
| 64 | Samsung Biologics Co., Ltd. (b) (c) (d) (e) | 38,795 | ||
| 157 | Samsung C&T Corp. (b) | 13,075 | ||
| 2,749 | Samsung Electronics Co., Ltd. (b) | 135,941 | ||
| 67 | Samsung Fire & Marine Insurance Co., Ltd. (b) | 10,591 | ||
| 198 | Samsung Life Insurance Co., Ltd. (b) | 9,548 | ||
| 1,269 | Samsung SDS Co., Ltd. (b) | 113,487 | ||
| 369 | Shinhan Financial Group Co., Ltd. (b) | 10,024 | ||
| 229 | SK Telecom Co., Ltd. (b) | 8,496 | ||
| 760 | SK, Inc. (b) | 101,264 | ||
| 1,156 | Woori Financial Group, Inc. (b) | 10,169 | ||
| 851,135 | ||||
| Spain – 2.5% | ||||
| 53 | Acciona S.A. (b) | 10,634 | ||
| 413 | ACS Actividades de Construccion y Servicios S.A. (b) | 13,154 | ||
| 89 | Aena SME S.A. (b) (c) (d) (e) | 14,392 | ||
| 522 | Amadeus IT Group S.A. (b) (e) | 35,018 | ||
| Shares | Description | Value | ||
| COMMON STOCKS (a) (Continued) | ||||
| Spain (Continued) | ||||
| 5,727 | Banco Bilbao Vizcaya Argentaria S.A. (b) | $40,944 | ||
| 11,037 | Banco Santander S.A. (b) | 41,129 | ||
| 7,992 | CaixaBank S.A. (b) | 31,184 | ||
| 741 | Cellnex Telecom S.A. (b) (c) (d) | 28,816 | ||
| 807 | Enagas S.A. (b) | 15,507 | ||
| 1,518 | Endesa S.A. (b) | 32,971 | ||
| 409 | Ferrovial S.A. (b) | 12,044 | ||
| 616 | Grifols S.A. (b) (e) | 6,097 | ||
| 2,442 | Iberdrola S.A. (b) | 30,422 | ||
| 1,464 | Industria de Diseno Textil S.A. (b) | 49,183 | ||
| 16,642 | Mapfre S.A. (b) | 33,540 | ||
| 986 | Naturgy Energy Group S.A. (b) | 29,682 | ||
| 1,490 | Red Electrica Corp. S.A. (b) | 26,219 | ||
| 1,083 | Repsol S.A. (b) | 16,654 | ||
| 6,975 | Telefonica S.A. (b) | 30,040 | ||
| 497,630 | ||||
| Sweden – 2.9% | ||||
| 939 | Alfa Laval AB (b) | 33,529 | ||
| 1,246 | Assa Abloy AB, Class B (b) | 29,845 | ||
| 2,494 | Atlas Copco AB, Class A (b) | 31,595 | ||
| 482 | Axfood AB (b) | 11,771 | ||
| 1,632 | Epiroc AB, Class A (b) | 32,395 | ||
| 556 | Essity AB, Class B (b) | 15,881 | ||
| 1,439 | H & M Hennes & Mauritz AB, Class B (b) | 20,574 | ||
| 2,741 | Hexagon AB, Class B (b) | 31,547 | ||
| 314 | Holmen AB, Class B (b) | 12,105 | ||
| 1,118 | Industrivarden AB, Class C (b) | 30,146 | ||
| 1,433 | Indutrade AB (b) | 30,496 | ||
| 1,526 | Investor AB, Class B (b) | 30,399 | ||
| 1,713 | Sandvik AB (b) | 36,360 | ||
| 2,337 | Skandinaviska Enskilda Banken AB, Class A (b) | 25,796 | ||
| 1,874 | Skanska AB, Class B (b) | 28,703 | ||
| 887 | SKF AB, Class B (b) | 17,471 | ||
| 938 | Svenska Cellulosa AB SCA, Class B (b) | 12,354 | ||
| 2,724 | Svenska Handelsbanken AB, Class A (b) | 23,592 | ||
| 1,700 | Swedbank AB, Class A (b) | 27,956 | ||
| 445 | Swedish Orphan Biovitrum AB (b) (e) | 10,369 | ||
| 1,496 | Tele2 AB, Class B (b) | 14,890 | ||
| 2,193 | Telefonaktiebolaget LM Ericsson, Class B (b) | 12,855 | ||
| 4,485 | Telia Co., AB (b) | 11,389 | ||
| 1,653 | Volvo AB, Class B (b) | 34,063 | ||
| 566,081 | ||||
| Switzerland – 9.6% | ||||
| 1,226 | ABB Ltd. (b) | 42,176 | ||
| 2,717 | Alcon, Inc. (b) | 192,873 | ||
| Shares | Description | Value | ||
| Switzerland (Continued) | ||||
| 316 | Baloise Holding AG (b) | $49,206 | ||
| 427 | Banque Cantonale Vaudoise (b) | 40,294 | ||
| 71 | Barry Callebaut AG (b) | 150,433 | ||
| 14 | Chocoladefabriken Lindt & Spruengli AG (b) | 165,349 | ||
| 31 | EMS-Chemie Holding AG (b) | 25,626 | ||
| 215 | Flughafen Zurich AG (b) (e) | 39,392 | ||
| 74 | Geberit AG (b) | 41,325 | ||
| 7 | Givaudan S.A. (b) | 22,784 | ||
| 431 | Helvetia Holding AG (b) | 60,077 | ||
| 772 | Holcim AG (b) | 49,787 | ||
| 325 | Lonza Group AG (b) | 195,650 | ||
| 1,236 | Nestle S.A. (b) | 150,706 | ||
| 2,092 | Novartis AG (b) | 192,084 | ||
| 67 | PSP Swiss Property AG (b) | 7,625 | ||
| 488 | Roche Holding AG (b) | 139,442 | ||
| 204 | Schindler Holding AG (b) | 45,202 | ||
| 15 | SGS S.A. (b) | 33,086 | ||
| 1,567 | SIG Group AG (b) | 40,371 | ||
| 91 | Swiss Life Holding AG (b) | 56,157 | ||
| 84 | Swiss Prime Site AG (b) | 6,985 | ||
| 547 | Swiss Re AG (b) | 56,195 | ||
| 33 | Swisscom AG (b) | 21,060 | ||
| 101 | Zurich Insurance Group AG (b) | 48,399 | ||
| 1,872,284 | ||||
| United Kingdom – 10.5% | ||||
| 1,461 | AstraZeneca PLC (b) | 202,428 | ||
| 3,298 | BAE Systems PLC (b) | 39,893 | ||
| 1,790 | British American Tobacco PLC (b) | 62,747 | ||
| 944 | Bunzl PLC (b) | 35,657 | ||
| 1,520 | Diageo PLC (b) | 67,837 | ||
| 11,128 | GSK PLC (b) | 196,624 | ||
| 3,113 | Imperial Brands PLC (b) | 71,586 | ||
| 703 | Intertek Group PLC (b) | 35,210 | ||
| 33,127 | J Sainsbury PLC (b) | 113,996 | ||
| 2,203 | London Stock Exchange Group PLC (b) | 213,977 | ||
| 2,152 | National Grid PLC (b) | 29,110 | ||
| 31,904 | Phoenix Group Holdings PLC (b) | 215,557 | ||
| 966 | Reckitt Benckiser Group PLC (b) | 73,491 | ||
| 9,209 | RELX PLC (b) | 298,251 | ||
| 5,454 | Rentokil Initial PLC (b) | 39,861 | ||
| 2,669 | Sage Group (The) PLC (b) | 25,613 | ||
| 851 | Severn Trent PLC (b) | 30,230 | ||
| 1,725 | Smiths Group PLC (b) | 36,585 | ||
| 1,312 | SSE PLC (b) | 29,276 | ||
| 27,921 | Tesco PLC (b) | 91,537 | ||
| 1,455 | Unilever PLC (b) | 75,397 | ||
| 2,254 | United Utilities Group PLC (b) | 29,499 | ||
| 39,474 | Vodafone Group PLC (b) | 43,544 | ||
| 2,057,906 | ||||
| Shares | Description | Value | ||
| COMMON STOCKS (a) (Continued) | ||||
| United States – 0.1% | ||||
| 196 | Autoliv, Inc., SDR (b) | $18,310 | ||
| Total Common Stocks | 19,155,194 | |||
| (Cost $18,077,496) | ||||
| REAL ESTATE INVESTMENT TRUSTS (a) – 1.3% | ||||
| Australia – 0.4% | ||||
| 4,036 | Dexus (b) | 20,405 | ||
| 8,135 | GPT (The) Group (b) | 23,248 | ||
| 9,529 | Stockland (b) | 25,517 | ||
| 69,170 | ||||
| Belgium – 0.0% | ||||
| 181 | Warehouses De Pauw CVA (b) | 5,382 | ||
| Hong Kong – 0.1% | ||||
| 1,608 | Link REIT (b) | 10,340 | ||
| Japan – 0.6% | ||||
| 8 | Daiwa House REIT Investment Corp. (b) | 16,392 | ||
| 16 | GLP J-REIT (b) | 17,295 | ||
| 23 | Japan Metropolitan Fund Investment Corp. (b) | 16,796 | ||
| 4 | Japan Real Estate Investment Corp. (b) | 15,941 | ||
| 4 | Nippon Building Fund, Inc. (b) | 16,650 | ||
| 8 | Nippon Prologis REIT, Inc. (b) | 16,936 | ||
| 16 | Nomura Real Estate Master Fund, Inc. (b) | 17,930 | ||
| 117,940 | ||||
| Multinational – 0.0% | ||||
| 108 | Unibail-Rodamco-Westfield (b) (e) | 5,811 | ||
| Singapore – 0.2% | ||||
| 2,900 | CapitaLand Ascendas REIT (b) | 6,253 | ||
| 4,001 | CapitaLand Integrated Commercial Trust (b) | 5,967 | ||
| 3,200 | Mapletree Industrial Trust (b) | 5,713 | ||
| 4,900 | Mapletree Logistics Trust (b) | 6,321 | ||
| 4,500 | Mapletree Pan Asia Commercial Trust (b) | 6,101 | ||
| 30,355 | ||||
| Shares | Description | Value | ||
| Spain – 0.0% | ||||
| 407 | Merlin Properties Socimi S.A. (b) | $3,561 | ||
| Total Real Estate Investment Trusts | 242,559 | |||
| (Cost $276,109) | ||||
| Total Investments – 99.0% | 19,397,753 | |||
| (Cost $18,353,605) | ||||
| Net Other Assets and Liabilities – 1.0% | 205,794 | |||
| Net Assets – 100.0% | $19,603,547 | |||
| (a) | Portfolio securities are categorized based upon their country of incorporation, which can be different from the country categorization of the Fund’s underlying index. For a breakdown of the portfolio securities by sector, please see the Fund Performance Overview. |
| (b) | This security is fair valued by the Advisor’s Pricing Committee in accordance with procedures approved by the Trust’s Board of Trustees and in accordance with provisions of the Investment Company Act of 1940 and rules thereunder, as amended. At March 31, 2023, securities noted as such are valued at $17,822,869 or 90.9% of net assets. Certain of these securities are fair valued using a factor provided by a third-party pricing service due to the change in value between the foreign markets’ close and the New York Stock Exchange close exceeding a certain threshold. On days when this threshold is not exceeded, these securities are typically valued at the last sale price on the exchange on which they are principally traded. |
| (c) | This security may be resold to qualified foreign investors and foreign institutional buyers under Regulation S of the Securities Act of 1933, as amended (the “1933 Act”). |
| (d) | This security is exempt from registration upon resale under Rule 144A of the 1933 Act and may be resold in transactions exempt from registration, normally to qualified institutional buyers. This security is not restricted on the foreign exchange where it trades freely without any additional registration. As such, it does not require the additional disclosure required of restricted securities. |
| (e) | Non-income producing security. |
| (f) | Pursuant to procedures adopted by the Trust’s Board of Trustees, this security has been determined to be illiquid by First Trust Advisors L.P., the Fund’s advisor. |
| (g) | This security’s value was determined using significant unobservable inputs (see Note 2A – Portfolio Valuation in the Notes to Financial Statements). |
| ADR | American Depositary Receipt |
| CAD | Canadian Dollar |
| SDR | Swedish Depositary Receipt |
| Currency Exposure Diversification | % of Total Investments |
| Euro | 30.6% |
| Japanese Yen | 19.6 |
| British Pound Sterling | 10.9 |
| Swiss Franc | 9.7 |
| Canadian Dollar | 7.9 |
| Australian Dollar | 5.7 |
| South Korean Won | 4.3 |
| Swedish Krona | 3.2 |
| Danish Krone | 2.8 |
| Hong Kong Dollar | 2.4 |
| Singapore Dollar | 1.4 |
| Norwegian Krone | 0.7 |
| Israeli Shekel | 0.4 |
| United States Dollar | 0.2 |
| New Zealand Dollar | 0.2 |
| Total | 100.0% |
| Total Value at 3/31/2023 | Level 1 Quoted Prices | Level 2 Significant Observable Inputs | Level 3 Significant Unobservable Inputs | |
| Common Stocks: | ||||
| Canada | $ 1,540,354 | $ 1,540,354 | $ — | $ — |
| Cayman Islands | 87,956 | — | 85,929 | 2,027 |
| Ireland | 156,169 | 27,250 | 128,919 | — |
| South Korea | 851,135 | 7,280 | 843,855 | — |
| Other Country Categories* | 16,519,580 | — | 16,519,580 | — |
| Real Estate Investment Trusts* | 242,559 | — | 242,559 | — |
| Total Investments | $ 19,397,753 | $ 1,574,884 | $ 17,820,842 | $ 2,027 |
| * | See Portfolio of Investments for country breakout. |
| Shares | Description | Value | ||
| COMMON STOCKS (a) – 99.7% | ||||
| Bermuda – 0.2% | ||||
| 130 | Credicorp Ltd. | $17,211 | ||
| Brazil – 8.7% | ||||
| 6,017 | Ambev S.A. | 17,012 | ||
| 4,837 | Atacadao S.A. | 11,824 | ||
| 12,602 | Banco Bradesco S.A. (Preference Shares) | 32,745 | ||
| 6,239 | Banco do Brasil S.A. | 48,143 | ||
| 7,921 | Banco Santander Brasil S.A. | 41,883 | ||
| 9,045 | BB Seguridade Participacoes S.A. | 58,016 | ||
| 1,029 | Cia de Saneamento Basico do Estado de Sao Paulo | 10,275 | ||
| 4,741 | Cia Energetica de Minas Gerais (Preference Shares) | 10,701 | ||
| 7,753 | Cia Paranaense de Energia, Class B (Preference Shares) | 10,616 | ||
| 41,429 | Cosan S.A. | 123,344 | ||
| 2,337 | EDP - Energias do Brasil S.A. | 10,301 | ||
| 1,218 | Energisa S.A. | 9,656 | ||
| 1,325 | Engie Brasil Energia S.A. | 10,501 | ||
| 1,896 | Equatorial Energia S.A. | 10,085 | ||
| 3,255 | Hypera S.A. | 24,211 | ||
| 8,565 | Itau Unibanco Holding S.A. (Preference Shares) | 41,807 | ||
| 27,170 | Itausa S.A. (Preference Shares) | 44,064 | ||
| 3,722 | JBS S.A. | 13,108 | ||
| 22,947 | Klabin S.A. | 81,901 | ||
| 11,374 | Porto Seguro S.A. | 52,781 | ||
| 4,114 | Raia Drogasil S.A. | 19,846 | ||
| 9,359 | Suzano S.A. | 76,815 | ||
| 781 | Telefonica Brasil S.A. | 5,957 | ||
| 2,619 | TIM S.A. | 6,501 | ||
| 1,310 | Transmissora Alianca de Energia Eletrica S.A. | 9,002 | ||
| 781,095 | ||||
| Cayman Islands – 2.3% | ||||
| 47,466 | ESR Group Ltd. (b) (c) (d) | 85,120 | ||
| 8,833 | Hengan International Group Co., Ltd. (b) | 40,915 | ||
| 24,000 | Tingyi Cayman Islands Holding Corp. (b) | 40,163 | ||
| 58,666 | Want Want China Holdings Ltd. (b) | 37,745 | ||
| 203,943 | ||||
| Chile – 0.9% | ||||
| 120,664 | Banco de Chile | 11,719 | ||
| 303,871 | Banco Santander Chile | 13,475 | ||
| 7,764 | Cencosud S.A. | 15,003 | ||
| 40,223 | Cia Sud Americana de Vapores S.A. (b) | 4,009 | ||
| 929 | Empresas Copec S.A. | 6,556 | ||
| 2,198 | Falabella S.A. (b) | 5,061 | ||
| Shares | Description | Value | ||
| Chile (Continued) | ||||
| 373 | Sociedad Quimica y Minera de Chile S.A., Class B (Preference Shares) (b) | $29,972 | ||
| 85,795 | ||||
| China – 11.6% | ||||
| 128,761 | Agricultural Bank of China Ltd., Class H (b) | 47,683 | ||
| 117,194 | Bank of China Ltd., Class H (b) | 44,928 | ||
| 72,897 | Bank of Communications Co., Ltd., Class H (b) | 45,845 | ||
| 155,000 | CGN Power Co., Ltd., Class H (b) (c) (d) | 37,109 | ||
| 96,534 | China CITIC Bank Corp., Ltd., Class H (b) | 48,563 | ||
| 66,598 | China Construction Bank Corp., Class H (b) | 43,102 | ||
| 30,000 | China Life Insurance Co., Ltd., Class H (b) | 49,232 | ||
| 134,598 | China Minsheng Banking Corp., Ltd., Class H (b) | 46,120 | ||
| 145,999 | China Petroleum & Chemical Corp., Class H (b) | 86,157 | ||
| 192,999 | China Railway Group Ltd., Class H (b) | 117,775 | ||
| 511,331 | China Tower Corp., Ltd., Class H (b) (c) (d) | 61,886 | ||
| 22,500 | CITIC Securities Co., Ltd., Class H (b) | 48,127 | ||
| 82,398 | Industrial & Commercial Bank of China Ltd., Class H (b) | 43,790 | ||
| 20,233 | New China Life Insurance Co., Ltd., Class H (b) | 48,054 | ||
| 133,000 | People’s Insurance Co. Group of China (The) Ltd., Class H (b) | 44,380 | ||
| 152,000 | PetroChina Co., Ltd., Class H (b) | 89,792 | ||
| 38,000 | PICC Property & Casualty Co., Ltd., Class H (b) | 38,764 | ||
| 65,000 | Postal Savings Bank of China Co., Ltd., Class H (b) (c) (d) | 38,549 | ||
| 19,200 | Sinopharm Group Co., Ltd., Class H (b) | 58,018 | ||
| 1,037,874 | ||||
| Czech Republic – 0.3% | ||||
| 372 | CEZ A.S. | 18,067 | ||
| 175 | Komercni Banka A.S. (b) | 5,807 | ||
| 23,874 | ||||
| Egypt – 0.1% | ||||
| 5,273 | Commercial International Bank Egypt SAE (b) | 8,727 | ||
| Hong Kong – 0.9% | ||||
| 11,600 | BOC Hong Kong Holdings Ltd. (b) | 36,114 | ||
| Shares | Description | Value | ||
| COMMON STOCKS (a) (Continued) | ||||
| Hong Kong (Continued) | ||||
| 42,400 | Guangdong Investment Ltd. (b) | $43,374 | ||
| 79,488 | ||||
| Hungary – 0.2% | ||||
| 1,039 | MOL Hungarian Oil & Gas PLC (b) | 7,610 | ||
| 510 | OTP Bank Nyrt (b) | 14,560 | ||
| 22,170 | ||||
| India – 26.7% | ||||
| 2,517 | Bajaj Auto Ltd. (b) | 119,066 | ||
| 21,019 | Berger Paints India Ltd. (b) | 149,064 | ||
| 7,164 | Bharti Airtel Ltd. (b) | 65,332 | ||
| 625 | Britannia Industries Ltd. (b) | 32,944 | ||
| 3,016 | Cipla Ltd. (b) | 33,103 | ||
| 1,474 | Colgate-Palmolive India Ltd. (b) | 27,066 | ||
| 4,191 | Dabur India Ltd. (b) | 27,828 | ||
| 776 | Dr. Reddy’s Laboratories Ltd. (b) | 43,758 | ||
| 9,662 | HCL Technologies Ltd. (b) | 128,269 | ||
| 9,237 | HDFC Bank Ltd. (b) | 181,681 | ||
| 891 | Hindustan Unilever Ltd. (b) | 27,825 | ||
| 15,230 | ICICI Bank Ltd. (b) | 162,754 | ||
| 6,374 | Infosys Ltd. (b) | 111,437 | ||
| 7,229 | ITC Ltd. (b) | 33,824 | ||
| 7,019 | Larsen & Toubro Ltd. (b) | 185,276 | ||
| 4,465 | Marico Ltd. (b) | 26,112 | ||
| 109 | MRF Ltd. (b) | 111,641 | ||
| 125 | Nestle India Ltd. (b) | 30,013 | ||
| 2,937 | Pidilite Industries Ltd. (b) | 84,249 | ||
| 125,511 | Power Finance Corp., Ltd. (b) | 232,325 | ||
| 22,945 | Power Grid Corp. of India Ltd. (b) | 63,169 | ||
| 139,664 | REC Ltd. (b) | 196,834 | ||
| 24,743 | State Bank of India (b) | 158,171 | ||
| 3,545 | Sun Pharmaceutical Industries Ltd. (b) | 42,477 | ||
| 3,059 | Tata Consultancy Services Ltd. (b) | 119,906 | ||
| 2,394,124 | ||||
| Indonesia – 3.2% | ||||
| 18,637 | Adaro Energy Indonesia Tbk PT (b) | 3,613 | ||
| 33,429 | Aneka Tambang Tbk (b) | 4,666 | ||
| 46,661 | Astra International Tbk PT (b) | 18,697 | ||
| 56,158 | Bank Central Asia Tbk PT (b) | 32,855 | ||
| 72,750 | Bank Jago Tbk PT (b) (e) | 11,790 | ||
| 50,945 | Bank Mandiri Persero Tbk PT (b) | 35,083 | ||
| 53,499 | Bank Negara Indonesia Persero Tbk PT (b) | 33,476 | ||
| 106,938 | Bank Rakyat Indonesia Persero Tbk PT (b) | 33,884 | ||
| 203,487 | Berkah Beton Sadaya Tbk PT (b) (f) | 8,075 | ||
| Shares | Description | Value | ||
| Indonesia (Continued) | ||||
| 1,928,415 | Bukalapak.com PT Tbk (b) (e) | $32,077 | ||
| 17,698 | Bukit Asam Tbk PT (b) | 4,714 | ||
| 463,234 | Bumi Resources Minerals Tbk PT (b) (e) | 5,258 | ||
| 1,782 | Indo Tambangraya Megah Tbk PT (b) | 4,688 | ||
| 16,460 | Merdeka Copper Gold Tbk PT (b) (e) | 4,610 | ||
| 24,029 | Perusahaan Gas Negara Tbk PT (b) | 2,218 | ||
| 131,759 | Sarana Menara Nusantara Tbk PT (b) | 8,150 | ||
| 2,034,029 | Smartfren Telecom Tbk PT (b) (e) | 8,306 | ||
| 36,485 | Telkom Indonesia Persero Tbk PT (b) | 9,907 | ||
| 57,499 | Tower Bersama Infrastructure Tbk PT (b) | 8,293 | ||
| 5,038 | United Tractors Tbk PT (b) | 9,791 | ||
| 10,133 | Vale Indonesia Tbk PT (b) (e) | 4,502 | ||
| 284,653 | ||||
| Luxembourg – 0.1% | ||||
| 1,217 | Allegro.eu S.A. (b) (c) (d) (e) | 8,309 | ||
| Malaysia – 1.2% | ||||
| 13,300 | CIMB Group Holdings Bhd (b) | 16,029 | ||
| 13,800 | Hartalega Holdings Bhd (b) | 5,960 | ||
| 3,300 | Hong Leong Bank Bhd (b) | 15,137 | ||
| 3,900 | IHH Healthcare Bhd (b) | 5,080 | ||
| 4,800 | Inari Amertron Bhd (b) | 2,694 | ||
| 7,900 | Malayan Banking Bhd (b) | 15,354 | ||
| 5,600 | Petronas Chemicals Group Bhd (b) | 8,999 | ||
| 11,700 | Press Metal Aluminium Holdings Bhd (b) | 12,959 | ||
| 16,100 | Public Bank Bhd (b) | 14,611 | ||
| 12,200 | RHB Bank Bhd (b) | 15,436 | ||
| 112,259 | ||||
| Mexico – 4.3% | ||||
| 1,969 | Arca Continental S.A.B. de C.V. | 17,852 | ||
| 45,636 | Cemex S.A.B. de C.V., Series CPO (e) | 25,123 | ||
| 2,262 | Fomento Economico Mexicano S.A.B. de C.V., Series UBD | 21,534 | ||
| 1,480 | Gruma S.A.B. de C.V., Class B | 21,925 | ||
| 1,244 | Grupo Aeroportuario del Pacifico S.A.B. de C.V., Class B | 24,268 | ||
| 798 | Grupo Aeroportuario del Sureste S.A.B. de C.V., Class B | 24,409 | ||
| 4,023 | Grupo Bimbo S.A.B. de C.V., Series A | 20,222 | ||
| 10,087 | Grupo Financiero Banorte S.A.B. de C.V., Class O | 84,928 | ||
| Shares | Description | Value | ||
| COMMON STOCKS (a) (Continued) | ||||
| Mexico (Continued) | ||||
| 8,416 | Grupo Mexico S.A.B. de C.V., Series B | $39,810 | ||
| 10,610 | Kimberly-Clark de Mexico S.A.B. de C.V., Class A | 22,368 | ||
| 9,376 | Orbia Advance Corp. S.A.B. de C.V. | 20,391 | ||
| 14,761 | Wal-Mart de Mexico S.A.B. de C.V. | 58,979 | ||
| 381,809 | ||||
| Netherlands – 0.1% | ||||
| 958 | NEPI Rockcastle N.V. | 5,559 | ||
| 247 | X5 Retail Group N.V., GDR (b) (c) (e) (f) (g) | 0 | ||
| 5,559 | ||||
| Philippines – 1.6% | ||||
| 40,010 | Ayala Land, Inc. (b) | 19,609 | ||
| 13,054 | BDO Unibank, Inc. (b) | 30,960 | ||
| 9,520 | International Container Terminal Services, Inc. (b) | 37,379 | ||
| 2,060 | SM Investments Corp. (b) | 33,814 | ||
| 30,300 | SM Prime Holdings, Inc. (b) | 18,333 | ||
| 140,095 | ||||
| Poland – 0.8% | ||||
| 550 | Bank Polska Kasa Opieki S.A. (b) | 10,941 | ||
| 262 | CD Projekt S.A. (b) | 6,783 | ||
| 111 | Dino Polska S.A. (b) (c) (d) (e) | 10,082 | ||
| 267 | KGHM Polska Miedz S.A. (b) | 7,584 | ||
| 852 | Polski Koncern Naftowy ORLEN S.A. (b) | 11,500 | ||
| 1,529 | Powszechna Kasa Oszczednosci Bank Polski S.A. (b) | 10,147 | ||
| 1,442 | Powszechny Zaklad Ubezpieczen S.A. (b) | 11,742 | ||
| 68,779 | ||||
| Russia – 0.0% | ||||
| 7,696 | Alrosa PJSC (b) (e) (f) (g) | 0 | ||
| 40,399 | Credit Bank of Moscow PJSC (b) (e) (f) (g) | 0 | ||
| 172,018 | Inter RAO UES PJSC (b) (f) (g) | 0 | ||
| 96 | Magnit PJSC (b) (e) (f) (g) | 0 | ||
| 15,021 | Magnitogorsk Iron & Steel Works PJSC (b) (e) (f) (g) | 0 | ||
| 47 | MMC Norilsk Nickel PJSC (b) (f) (g) | 0 | ||
| 2,140 | Mobile TeleSystems PJSC (b) (f) (g) | 0 | ||
| 1,668 | Moscow Exchange MICEX-RTS PJSC (b) (e) (f) (g) | 0 | ||
| 4,741 | Novolipetsk Steel PJSC (b) (f) (g) | 0 | ||
| Shares | Description | Value | ||
| Russia (Continued) | ||||
| 85 | Polyus PJSC (b) (e) (f) (g) | $0 | ||
| 676 | Severstal PAO (b) (e) (f) (g) | 0 | ||
| 10,776 | Sistema PJSFC (b) (e) (f) (g) | 0 | ||
| 3,253 | Tatneft PJSC (b) (f) (g) | 0 | ||
| 0 | ||||
| South Africa – 4.1% | ||||
| 1,490 | Absa Group Ltd. (b) | 15,230 | ||
| 3,252 | African Rainbow Minerals Ltd. (b) | 42,295 | ||
| 3,185 | AngloGold Ashanti Ltd. (b) | 77,570 | ||
| 730 | Aspen Pharmacare Holdings Ltd. (b) | 7,548 | ||
| 604 | Bid Corp., Ltd. | 13,518 | ||
| 565 | Bidvest Group (The) Ltd. | 8,042 | ||
| 169 | Capitec Bank Holdings Ltd. | 16,019 | ||
| 590 | Clicks Group Ltd. (b) | 8,487 | ||
| 2,507 | Discovery Ltd. (b) (e) | 19,668 | ||
| 814 | Exxaro Resources Ltd. (b) | 8,508 | ||
| 4,332 | FirstRand Ltd. (b) | 14,683 | ||
| 608 | Foschini Group (The) Ltd. (b) | 3,104 | ||
| 414 | Mr Price Group Ltd. | 3,353 | ||
| 1,806 | MTN Group Ltd. (b) | 12,939 | ||
| 1,872 | MultiChoice Group (b) | 13,009 | ||
| 1,317 | Nedbank Group Ltd. (b) | 16,070 | ||
| 26,902 | Old Mutual Ltd. (b) | 17,833 | ||
| 3,442 | Pepkor Holdings Ltd. (c) (d) | 3,333 | ||
| 1,982 | Remgro Ltd. | 14,964 | ||
| 5,100 | Sanlam Ltd. | 16,146 | ||
| 776 | Shoprite Holdings Ltd. (b) | 9,684 | ||
| 1,827 | Standard Bank Group Ltd. (b) | 17,714 | ||
| 1,171 | Woolworths Holdings Ltd. (b) | 4,206 | ||
| 363,923 | ||||
| Taiwan – 26.8% | ||||
| 54,181 | Asia Cement Corp. (b) | 77,152 | ||
| 74,337 | Chang Hwa Commercial Bank Ltd. (b) | 42,438 | ||
| 64,341 | Cheng Shin Rubber Industry Co., Ltd. (b) | 77,371 | ||
| 6,696 | Chunghwa Telecom Co., Ltd. (b) | 26,321 | ||
| 302,878 | Compal Electronics, Inc. (b) | 251,542 | ||
| 49,510 | E.Sun Financial Holding Co., Ltd. (b) | 41,231 | ||
| 48,598 | Far Eastern New Century Corp. (b) | 50,018 | ||
| 10,544 | Far EasTone Telecommunications Co., Ltd. (b) | 26,058 | ||
| 49,034 | First Financial Holding Co., Ltd. (b) | 42,679 | ||
| 22,752 | Formosa Chemicals & Fibre Corp. (b) | 51,639 | ||
| 7,811 | Highwealth Construction Corp. (b) | 10,570 | ||
| Shares | Description | Value | ||
| COMMON STOCKS (a) (Continued) | ||||
| Taiwan (Continued) | ||||
| 64,436 | Hon Hai Precision Industry Co., Ltd. (b) | $220,564 | ||
| 57,298 | Hua Nan Financial Holdings Co., Ltd. (b) | 42,151 | ||
| 287,007 | Inventec Corp. (b) | 301,668 | ||
| 40,927 | Mega Financial Holding Co., Ltd. (b) | 44,356 | ||
| 85,246 | Powertech Technology, Inc. (b) | 255,314 | ||
| 2,371 | President Chain Store Corp. (b) | 21,013 | ||
| 26,249 | Shanghai Commercial & Savings Bank (The) Ltd. (b) | 40,514 | ||
| 74,195 | SinoPac Financial Holdings Co., Ltd. (b) | 40,566 | ||
| 63,158 | Taiwan Cement Corp. (b) | 75,537 | ||
| 48,567 | Taiwan Cooperative Financial Holding Co., Ltd. (b) | 41,707 | ||
| 7,985 | Taiwan Mobile Co., Ltd. (b) | 26,495 | ||
| 9,952 | Uni-President Enterprises Corp. (b) | 23,526 | ||
| 247,550 | Wistron Corp. (b) | 340,792 | ||
| 141,495 | WPG Holdings Ltd. (b) | 233,789 | ||
| 2,405,011 | ||||
| Thailand – 4.5% | ||||
| 2,600 | Advanced Info Service PCL | 16,119 | ||
| 6,100 | Airports of Thailand PCL (e) | 12,666 | ||
| 4,500 | Bangkok Bank PCL (b) | 19,958 | ||
| 40,500 | Bangkok Dusit Medical Services PCL, Class F | 34,939 | ||
| 48,300 | Bangkok Expressway & Metro PCL | 12,501 | ||
| 47,100 | BTS Group Holdings PCL | 9,779 | ||
| 14,500 | Charoen Pokphand Foods PCL | 8,990 | ||
| 6,400 | CP ALL PCL (b) | 11,607 | ||
| 5,400 | Electricity Generating PCL | 24,556 | ||
| 29,000 | Home Product Center PCL | 12,212 | ||
| 7,000 | Intouch Holdings PCL, Class F | 15,148 | ||
| 4,300 | Kasikornbank PCL (b) | 16,684 | ||
| 36,800 | Krung Thai Bank PCL | 17,757 | ||
| 10,700 | Krungthai Card PCL | 16,975 | ||
| 87,400 | Land & Houses PCL | 25,176 | ||
| 13,300 | Osotspa PCL | 11,960 | ||
| 10,000 | PTT Global Chemical PCL | 13,379 | ||
| 36,200 | PTT Oil & Retail Business PCL | 22,549 | ||
| 27,400 | PTT PCL (b) | 25,406 | ||
| 21,800 | Ratch Group PCL | 24,545 | ||
| 8,500 | SCG Packaging PCL | 11,497 | ||
| 1,400 | Siam Cement (The) PCL | 12,897 | ||
| 20,308 | Siam Global House PCL | 10,987 | ||
| 23,000 | Thai Beverage PCL (b) | 10,906 | ||
| 19,400 | Thai Union Group PCL, Class F | 7,999 | ||
| 407,192 | ||||
| Turkey – 1.1% | ||||
| 5,440 | Akbank T.A.S. (b) | 4,814 | ||
| Shares | Description | Value | ||
| Turkey (Continued) | ||||
| 297 | Aksa Enerji Uretim A.S. | $434 | ||
| 865 | Arcelik A.S. (b) | 5,292 | ||
| 3,198 | Aselsan Elektronik Sanayi Ve Ticaret A.S. (b) | 8,668 | ||
| 1,240 | BIM Birlesik Magazalar A.S. (b) | 9,631 | ||
| 3,147 | Eregli Demir ve Celik Fabrikalari T.A.S. (b) (e) | 5,823 | ||
| 178 | Ford Otomotiv Sanayi A.S. (b) | 5,436 | ||
| 2,382 | Haci Omer Sabanci Holding A.S. (b) | 4,926 | ||
| 2,350 | KOC Holding A.S. (b) | 9,387 | ||
| 635 | Tofas Turk Otomobil Fabrikasi A.S. (b) | 6,196 | ||
| 823 | Turk Hava Yollari AO (b) (e) | 5,096 | ||
| 2,739 | Turkcell Iletisim Hizmetleri A.S. (b) | 4,583 | ||
| 3,161 | Turkiye Garanti Bankasi A.S. (b) | 4,603 | ||
| 8,167 | Turkiye Is Bankasi A.S., Class C (b) | 5,529 | ||
| 368 | Turkiye Petrol Rafinerileri A.S. (b) | 10,188 | ||
| 3,686 | Turkiye Sise ve Cam Fabrikalari A.S. (b) | 8,141 | ||
| 98,747 | ||||
| Total Common Stocks | 8,930,637 | |||
| (Cost $8,670,810) | ||||
| REAL ESTATE INVESTMENT TRUSTS (a) – 0.3% | ||||
| Mexico – 0.2% | ||||
| 11,411 | Fibra Uno Administracion S.A. de C.V. | 15,977 | ||
| South Africa – 0.1% | ||||
| 6,586 | Growthpoint Properties Ltd. (b) | 4,838 | ||
| Total Real Estate Investment Trusts | 20,815 | |||
| (Cost $20,291) | ||||
| Total Investments – 100.0% | 8,951,452 | |||
| (Cost $8,691,101) | ||||
| Net Other Assets and Liabilities – 0.0% | 4,267 | |||
| Net Assets – 100.0% | $8,955,719 | |||
| (a) | Portfolio securities are categorized based upon their country of incorporation, which can be different from the country categorization of the Fund’s underlying index. For a breakdown of the portfolio securities by sector, please see the Fund Performance Overview. |
| (b) | This security is fair valued by the Advisor’s Pricing Committee in accordance with procedures approved by the Trust’s Board of Trustees and in accordance with provisions of the Investment Company Act of 1940 and rules thereunder, as amended. At March 31, 2023, securities noted as such are valued at $7,286,541 or 81.4% of net assets. Certain of these securities are fair valued using a factor provided by a third-party pricing service due to the change in value between the foreign markets’ close and the New York Stock Exchange close exceeding a certain threshold. On days when this threshold is not exceeded, these securities are typically valued at the last sale price on the exchange on which they are principally traded. |
| (c) | This security may be resold to qualified foreign investors and foreign institutional buyers under Regulation S of the Securities Act of 1933, as amended (the “1933 Act”). |
| (d) | This security is exempt from registration upon resale under Rule 144A of the 1933 Act and may be resold in transactions exempt from registration, normally to qualified institutional buyers. This security is not restricted on the foreign exchange where it trades freely without any additional registration. As such, it does not require the additional disclosure required of restricted securities. |
| (e) | Non-income producing security. |
| (f) | Pursuant to procedures adopted by the Trust’s Board of Trustees, this security has been determined to be illiquid by First Trust Advisors L.P., the Fund’s advisor. |
| (g) | This security’s value was determined using significant unobservable inputs (see Note 2A – Portfolio Valuation in the Notes to Financial Statements). |
| GDR | Global Depositary Receipt |
| Currency Exposure Diversification | % of Total Investments |
| New Taiwan Dollar | 26.9% |
| Indian Rupee | 26.7 |
| Hong Kong Dollar | 14.8 |
| Brazilian Real | 8.7 |
| Mexican Peso | 4.4 |
| Thai Baht | 4.4 |
| South African Rand | 4.2 |
| Indonesian Rupiah | 3.2 |
| Philippine Peso | 1.6 |
| Malaysian Ringgit | 1.2 |
| Turkish Lira | 1.1 |
| Chilean Peso | 1.0 |
| Polish Zloty | 0.9 |
| Czech Republic Koruna | 0.3 |
| Hungarian Forint | 0.2 |
| United States Dollar | 0.2 |
| Singapore Dollar | 0.1 |
| Egyptian Pound | 0.1 |
| Russian Ruble | 0.0* |
| Total | 100.0% |
| * | Investment is valued at $0. |
| Total Value at 3/31/2023 | Level 1 Quoted Prices | Level 2 Significant Observable Inputs | Level 3 Significant Unobservable Inputs | |
| Common Stocks: | ||||
| Bermuda | $ 17,211 | $ 17,211 | $ — | $ — |
| Brazil | 781,095 | 781,095 | — | — |
| Chile | 85,795 | 46,753 | 39,042 | — |
| Czech Republic | 23,874 | 18,067 | 5,807 | — |
| Mexico | 381,809 | 381,809 | — | — |
| Netherlands | 5,559 | 5,559 | — | —* |
| Russia | —* | — | — | —* |
| South Africa | 363,923 | 75,375 | 288,548 | — |
| Turkey | 98,747 | 434 | 98,313 | — |
| Other Country Categories** | 7,172,624 | — | 7,172,624 | — |
| Real Estate Investment Trusts: | ||||
| Mexico | 15,977 | 15,977 | — | — |
| South Africa | 4,838 | — | 4,838 | — |
| Total Investments | $ 8,951,452 | $ 1,342,280 | $ 7,609,172 | $—* |
| * | Investment is valued at $0. |
| ** | See Portfolio of Investments for country breakout. |
| Shares | Description | Value | ||
| COMMON STOCKS – 97.0% | ||||
| Aerospace & Defense – 1.4% | ||||
| 124 | General Dynamics Corp. | $28,298 | ||
| 201 | HEICO Corp. | 34,379 | ||
| 783 | Howmet Aerospace, Inc. | 33,176 | ||
| 148 | L3Harris Technologies, Inc. | 29,043 | ||
| 63 | Lockheed Martin Corp. | 29,782 | ||
| 57 | Northrop Grumman Corp. | 26,318 | ||
| 306 | Raytheon Technologies Corp. | 29,967 | ||
| 436 | Textron, Inc. | 30,795 | ||
| 241,758 | ||||
| Air Freight & Logistics – 0.8% | ||||
| 337 | CH Robinson Worldwide, Inc. | 33,488 | ||
| 297 | Expeditors International of Washington, Inc. | 32,706 | ||
| 178 | FedEx Corp. | 40,671 | ||
| 178 | United Parcel Service, Inc., Class B | 34,530 | ||
| 141,395 | ||||
| Automobiles – 0.8% | ||||
| 5,582 | Ford Motor Co. | 70,333 | ||
| 1,837 | General Motors Co. | 67,381 | ||
| 137,714 | ||||
| Banks – 2.1% | ||||
| 964 | Bank of America Corp. | 27,570 | ||
| 706 | Citigroup, Inc. | 33,104 | ||
| 811 | Citizens Financial Group, Inc. | 24,630 | ||
| 973 | Fifth Third Bancorp | 25,921 | ||
| 262 | First Republic Bank | 3,665 | ||
| 2,264 | Huntington Bancshares, Inc. | 25,357 | ||
| 238 | JPMorgan Chase & Co. | 31,014 | ||
| 1,832 | KeyCorp | 22,937 | ||
| 220 | M&T Bank Corp. | 26,305 | ||
| 202 | PNC Financial Services Group (The), Inc. | 25,674 | ||
| 1,480 | Regions Financial Corp. | 27,469 | ||
| 742 | Truist Financial Corp. | 25,302 | ||
| 732 | US Bancorp | 26,389 | ||
| 773 | Wells Fargo & Co. | 28,895 | ||
| 354,232 | ||||
| Beverages – 1.0% | ||||
| 520 | Brown-Forman Corp., Class B | 33,420 | ||
| 537 | Coca-Cola (The) Co. | 33,310 | ||
| 147 | Constellation Brands, Inc., Class A | 33,206 | ||
| 958 | Keurig Dr. Pepper, Inc. | 33,798 | ||
| 189 | PepsiCo, Inc. | 34,455 | ||
| 168,189 | ||||
| Biotechnology – 1.3% | ||||
| 486 | AbbVie, Inc. | 77,454 | ||
| 299 | Amgen, Inc. | 72,283 | ||
| Shares | Description | Value | ||
| Biotechnology (Continued) | ||||
| 915 | Gilead Sciences, Inc. | $75,918 | ||
| 225,655 | ||||
| Broadline Retail – 0.4% | ||||
| 1,490 | eBay, Inc. | 66,111 | ||
| Building Products – 0.9% | ||||
| 131 | Carlisle Cos., Inc. | 29,615 | ||
| 748 | Carrier Global Corp. | 34,221 | ||
| 482 | Johnson Controls International PLC | 29,026 | ||
| 662 | Masco Corp. | 32,915 | ||
| 184 | Trane Technologies PLC | 33,852 | ||
| 159,629 | ||||
| Capital Markets – 4.3% | ||||
| 103 | Ameriprise Financial, Inc. | 31,570 | ||
| 701 | Bank of New York Mellon (The) Corp. | 31,853 | ||
| 45 | BlackRock, Inc. | 30,110 | ||
| 430 | Blackstone, Inc. | 37,771 | ||
| 1,070 | Carlyle Group (The), Inc. | 33,234 | ||
| 254 | Cboe Global Markets, Inc. | 34,097 | ||
| 383 | Charles Schwab (The) Corp. | 20,062 | ||
| 190 | CME Group, Inc. | 36,389 | ||
| 80 | FactSet Research Systems, Inc. | 33,207 | ||
| 1,210 | Franklin Resources, Inc. | 32,597 | ||
| 93 | Goldman Sachs Group (The), Inc. | 30,421 | ||
| 311 | Intercontinental Exchange, Inc. | 32,434 | ||
| 688 | KKR & Co., Inc. | 36,134 | ||
| 148 | LPL Financial Holdings, Inc. | 29,955 | ||
| 115 | Moody’s Corp. | 35,192 | ||
| 375 | Morgan Stanley | 32,925 | ||
| 69 | MSCI, Inc. | 38,619 | ||
| 520 | Nasdaq, Inc. | 28,428 | ||
| 361 | Northern Trust Corp. | 31,815 | ||
| 299 | Raymond James Financial, Inc. | 27,888 | ||
| 95 | S&P Global, Inc. | 32,753 | ||
| 411 | State Street Corp. | 31,109 | ||
| 293 | T. Rowe Price Group, Inc. | 33,080 | ||
| 741,643 | ||||
| Chemicals – 1.7% | ||||
| 41 | Air Products and Chemicals, Inc. | 11,776 | ||
| 58 | Albemarle Corp. | 12,820 | ||
| 123 | Celanese Corp. | 13,393 | ||
| 147 | CF Industries Holdings, Inc. | 10,656 | ||
| 581 | Corteva, Inc. | 35,040 | ||
| 249 | Dow, Inc. | 13,650 | ||
| 450 | DuPont de Nemours, Inc. | 32,297 | ||
| 154 | Eastman Chemical Co. | 12,988 | ||
| 86 | Ecolab, Inc. | 14,236 | ||
| 100 | FMC Corp. | 12,213 | ||
| 120 | International Flavors & Fragrances, Inc. | 11,035 | ||
| Shares | Description | Value | ||
| COMMON STOCKS (Continued) | ||||
| Chemicals (Continued) | ||||
| 151 | LyondellBasell Industries N.V., Class A | $14,177 | ||
| 286 | Mosaic (The) Co. | 13,122 | ||
| 246 | PPG Industries, Inc. | 32,861 | ||
| 130 | Sherwin-Williams (The) Co. | 29,220 | ||
| 122 | Westlake Corp. | 14,150 | ||
| 283,634 | ||||
| Commercial Services & Supplies – 0.8% | ||||
| 68 | Cintas Corp. | 31,462 | ||
| 143 | Republic Services, Inc. | 19,337 | ||
| 1,691 | Rollins, Inc. | 63,463 | ||
| 118 | Waste Management, Inc. | 19,254 | ||
| 133,516 | ||||
| Communications Equipment – 1.1% | ||||
| 1,838 | Cisco Systems, Inc. | 96,082 | ||
| 340 | Motorola Solutions, Inc. | 97,284 | ||
| 193,366 | ||||
| Construction & Engineering – 0.2% | ||||
| 217 | Quanta Services, Inc. | 36,161 | ||
| Construction Materials – 0.4% | ||||
| 91 | Martin Marietta Materials, Inc. | 32,310 | ||
| 176 | Vulcan Materials Co. | 30,195 | ||
| 62,505 | ||||
| Consumer Finance – 0.7% | ||||
| 209 | American Express Co. | 34,475 | ||
| 332 | Capital One Financial Corp. | 31,925 | ||
| 326 | Discover Financial Services | 32,222 | ||
| 940 | Synchrony Financial | 27,335 | ||
| 125,957 | ||||
| Consumer Staples Distribution & Retail – 2.1% | ||||
| 135 | Costco Wholesale Corp. | 67,077 | ||
| 251 | Dollar General Corp. | 52,826 | ||
| 766 | Kroger (The) Co. | 37,817 | ||
| 447 | Sysco Corp. | 34,522 | ||
| 415 | Target Corp. | 68,737 | ||
| 914 | Walgreens Boots Alliance, Inc. | 31,606 | ||
| 436 | Walmart, Inc. | 64,288 | ||
| 356,873 | ||||
| Containers & Packaging – 0.5% | ||||
| 69 | Avery Dennison Corp. | 12,346 | ||
| 604 | Ball Corp. | 33,286 | ||
| 362 | International Paper Co. | 13,054 | ||
| Shares | Description | Value | ||
| Containers & Packaging (Continued) | ||||
| 241 | Packaging Corp. of America | $33,458 | ||
| 92,144 | ||||
| Distributors – 1.1% | ||||
| 356 | Genuine Parts Co. | 59,562 | ||
| 1,157 | LKQ Corp. | 65,671 | ||
| 204 | Pool Corp. | 69,858 | ||
| 195,091 | ||||
| Diversified Telecommunication Services – 1.0% | ||||
| 4,756 | AT&T, Inc. | 91,553 | ||
| 2,222 | Verizon Communications, Inc. | 86,414 | ||
| 177,967 | ||||
| Electric Utilities – 1.5% | ||||
| 334 | Alliant Energy Corp. | 17,836 | ||
| 194 | American Electric Power Co., Inc. | 17,652 | ||
| 214 | Constellation Energy Corp. | 16,799 | ||
| 179 | Duke Energy Corp. | 17,268 | ||
| 290 | Edison International | 20,471 | ||
| 164 | Entergy Corp. | 17,669 | ||
| 293 | Evergy, Inc. | 17,908 | ||
| 220 | Eversource Energy | 17,217 | ||
| 427 | Exelon Corp. | 17,887 | ||
| 440 | FirstEnergy Corp. | 17,626 | ||
| 221 | NextEra Energy, Inc. | 17,035 | ||
| 631 | PPL Corp. | 17,536 | ||
| 258 | Southern (The) Co. | 17,952 | ||
| 263 | Xcel Energy, Inc. | 17,737 | ||
| 248,593 | ||||
| Electrical Equipment – 0.8% | ||||
| 221 | AMETEK, Inc. | 32,118 | ||
| 197 | Eaton Corp. PLC | 33,754 | ||
| 321 | Emerson Electric Co. | 27,972 | ||
| 120 | Rockwell Automation, Inc. | 35,214 | ||
| 129,058 | ||||
| Electronic Equipment, Instruments & Components – 3.0% | ||||
| 1,522 | Amphenol Corp., Class A | 124,378 | ||
| 649 | CDW Corp. | 126,484 | ||
| 3,628 | Corning, Inc. | 127,996 | ||
| 1,009 | TE Connectivity Ltd. | 132,330 | ||
| 511,188 | ||||
| Energy Equipment & Services – 0.6% | ||||
| 1,197 | Baker Hughes Co. | 34,545 | ||
| 898 | Halliburton Co. | 28,413 | ||
| Shares | Description | Value | ||
| COMMON STOCKS (Continued) | ||||
| Energy Equipment & Services (Continued) | ||||
| 661 | Schlumberger N.V. | $32,455 | ||
| 95,413 | ||||
| Entertainment – 0.4% | ||||
| 506 | Electronic Arts, Inc. | 60,948 | ||
| Financial Services – 1.1% | ||||
| 500 | Apollo Global Management, Inc. | 31,580 | ||
| 455 | Fidelity National Information Services, Inc. | 24,720 | ||
| 311 | Global Payments, Inc. | 32,730 | ||
| 176 | Jack Henry & Associates, Inc. | 26,527 | ||
| 89 | Mastercard, Inc., Class A | 32,343 | ||
| 149 | Visa, Inc., Class A | 33,594 | ||
| 181,494 | ||||
| Food Products – 2.5% | ||||
| 368 | Archer-Daniels-Midland Co. | 29,315 | ||
| 342 | Bunge Ltd. | 32,668 | ||
| 602 | Campbell Soup Co. | 33,098 | ||
| 883 | Conagra Brands, Inc. | 33,165 | ||
| 407 | General Mills, Inc. | 34,782 | ||
| 148 | Hershey (The) Co. | 37,653 | ||
| 750 | Hormel Foods Corp. | 29,910 | ||
| 216 | J.M. Smucker (The) Co. | 33,992 | ||
| 479 | Kellogg Co. | 32,074 | ||
| 839 | Kraft Heinz (The) Co. | 32,444 | ||
| 412 | McCormick & Co., Inc. | 34,282 | ||
| 513 | Mondelez International, Inc., Class A | 35,766 | ||
| 549 | Tyson Foods, Inc., Class A | 32,567 | ||
| 431,716 | ||||
| Gas Utilities – 0.1% | ||||
| 165 | Atmos Energy Corp. | 18,539 | ||
| Ground Transportation – 0.9% | ||||
| 997 | CSX Corp. | 29,850 | ||
| 177 | JB Hunt Transport Services, Inc. | 31,056 | ||
| 125 | Norfolk Southern Corp. | 26,500 | ||
| 109 | Old Dominion Freight Line, Inc. | 37,152 | ||
| 149 | Union Pacific Corp. | 29,988 | ||
| 154,546 | ||||
| Health Care Equipment & Supplies – 4.2% | ||||
| 715 | Abbott Laboratories | 72,401 | ||
| 1,541 | Baxter International, Inc. | 62,503 | ||
| 309 | Becton Dickinson and Co. | 76,490 | ||
| 238 | Cooper (The) Cos., Inc. | 88,859 | ||
| 1,011 | Medtronic PLC | 81,507 | ||
| 377 | ResMed, Inc. | 82,559 | ||
| 425 | STERIS PLC | 81,294 | ||
| 321 | Stryker Corp. | 91,636 | ||
| Shares | Description | Value | ||
| Health Care Equipment & Supplies (Continued) | ||||
| 616 | Zimmer Biomet Holdings, Inc. | $79,587 | ||
| 716,836 | ||||
| Health Care Providers & Services – 4.0% | ||||
| 206 | AmerisourceBergen Corp. | 32,983 | ||
| 1,022 | Cardinal Health, Inc. | 77,161 | ||
| 237 | Cigna (The) Group | 60,561 | ||
| 367 | CVS Health Corp. | 27,272 | ||
| 153 | Elevance Health, Inc. | 70,351 | ||
| 327 | HCA Healthcare, Inc. | 86,223 | ||
| 153 | Humana, Inc. | 74,275 | ||
| 334 | Laboratory Corp of America Holdings | 76,626 | ||
| 91 | McKesson Corp. | 32,401 | ||
| 502 | Quest Diagnostics, Inc. | 71,023 | ||
| 148 | UnitedHealth Group, Inc. | 69,943 | ||
| 678,819 | ||||
| Hotels, Restaurants & Leisure – 3.2% | ||||
| 447 | Darden Restaurants, Inc. | 69,356 | ||
| 178 | Domino’s Pizza, Inc. | 58,717 | ||
| 489 | Hilton Worldwide Holdings, Inc. | 68,885 | ||
| 415 | Marriott International, Inc., Class A | 68,907 | ||
| 234 | McDonald’s Corp. | 65,429 | ||
| 1,843 | MGM Resorts International | 81,866 | ||
| 623 | Starbucks Corp. | 64,873 | ||
| 482 | Yum! Brands, Inc. | 63,663 | ||
| 541,696 | ||||
| Household Durables – 1.2% | ||||
| 693 | DR Horton, Inc. | 67,699 | ||
| 669 | Garmin Ltd. | 67,516 | ||
| 683 | Lennar Corp., Class A | 71,790 | ||
| 207,005 | ||||
| Household Products – 1.0% | ||||
| 424 | Church & Dwight Co., Inc. | 37,486 | ||
| 243 | Clorox (The) Co. | 38,452 | ||
| 434 | Colgate-Palmolive Co. | 32,615 | ||
| 252 | Kimberly-Clark Corp. | 33,824 | ||
| 225 | Procter & Gamble (The) Co. | 33,455 | ||
| 175,832 | ||||
| Independent Power & Renewable Electricity Producers – 0.1% | ||||
| 641 | AES (The) Corp. | 15,435 | ||
| Industrial Conglomerates – 0.5% | ||||
| 257 | 3M Co. | 27,013 | ||
| 368 | General Electric Co. | 35,181 | ||
| Shares | Description | Value | ||
| COMMON STOCKS (Continued) | ||||
| Industrial Conglomerates (Continued) | ||||
| 144 | Honeywell International, Inc. | $27,521 | ||
| 89,715 | ||||
| Insurance – 3.0% | ||||
| 444 | Aflac, Inc. | 28,647 | ||
| 235 | Allstate (The) Corp. | 26,040 | ||
| 505 | American International Group, Inc. | 25,432 | ||
| 106 | Aon PLC, Class A | 33,421 | ||
| 169 | Arthur J. Gallagher & Co. | 32,331 | ||
| 560 | Brown & Brown, Inc. | 32,155 | ||
| 145 | Chubb Ltd. | 28,156 | ||
| 312 | Cincinnati Financial Corp. | 34,969 | ||
| 421 | Hartford Financial Services Group (The), Inc. | 29,339 | ||
| 547 | Loews Corp. | 31,737 | ||
| 193 | Marsh & McLennan Cos., Inc. | 32,144 | ||
| 441 | MetLife, Inc. | 25,552 | ||
| 380 | Principal Financial Group, Inc. | 28,242 | ||
| 246 | Progressive (The) Corp. | 35,193 | ||
| 321 | Prudential Financial, Inc. | 26,560 | ||
| 170 | Travelers (The) Cos., Inc. | 29,140 | ||
| 440 | W.R. Berkley Corp. | 27,394 | ||
| 506,452 | ||||
| IT Services – 1.6% | ||||
| 116 | Accenture PLC, Class A | 33,154 | ||
| 2,026 | Cognizant Technology Solutions Corp., Class A | 123,444 | ||
| 823 | International Business Machines Corp. | 107,887 | ||
| 264,485 | ||||
| Life Sciences Tools & Services – 2.9% | ||||
| 525 | Agilent Technologies, Inc. | 72,628 | ||
| 948 | Bio-Techne Corp. | 70,332 | ||
| 296 | Danaher Corp. | 74,604 | ||
| 560 | PerkinElmer, Inc. | 74,626 | ||
| 143 | Thermo Fisher Scientific, Inc. | 82,421 | ||
| 334 | West Pharmaceutical Services, Inc. | 115,721 | ||
| 490,332 | ||||
| Machinery – 2.8% | ||||
| 129 | Caterpillar, Inc. | 29,520 | ||
| 127 | Cummins, Inc. | 30,338 | ||
| 72 | Deere & Co. | 29,727 | ||
| 228 | Dover Corp. | 34,642 | ||
| 481 | Fortive Corp. | 32,790 | ||
| 135 | IDEX Corp. | 31,189 | ||
| 140 | Illinois Tool Works, Inc. | 34,083 | ||
| 591 | Ingersoll Rand, Inc. | 34,384 | ||
| 130 | Nordson Corp. | 28,894 | ||
| Shares | Description | Value | ||
| Machinery (Continued) | ||||
| 394 | Otis Worldwide Corp. | $33,254 | ||
| 468 | PACCAR, Inc. | 34,258 | ||
| 106 | Parker-Hannifin Corp. | 35,628 | ||
| 411 | Stanley Black & Decker, Inc. | 33,118 | ||
| 309 | Westinghouse Air Brake Technologies Corp. | 31,228 | ||
| 279 | Xylem, Inc. | 29,211 | ||
| 482,264 | ||||
| Media – 1.9% | ||||
| 2,504 | Comcast Corp., Class A | 94,927 | ||
| 2,034 | Fox Corp., Class A | 69,258 | ||
| 757 | Omnicom Group, Inc. | 71,415 | ||
| 3,660 | Paramount Global, Class B | 81,654 | ||
| 317,254 | ||||
| Metals & Mining – 0.3% | ||||
| 330 | Freeport-McMoRan, Inc. | 13,500 | ||
| 266 | Newmont Corp. | 13,039 | ||
| 95 | Nucor Corp. | 14,675 | ||
| 128 | Steel Dynamics, Inc. | 14,472 | ||
| 55,686 | ||||
| Multi-Utilities – 0.9% | ||||
| 207 | Ameren Corp. | 17,883 | ||
| 615 | CenterPoint Energy, Inc. | 18,118 | ||
| 291 | CMS Energy Corp. | 17,861 | ||
| 193 | Consolidated Edison, Inc. | 18,464 | ||
| 301 | Dominion Energy, Inc. | 16,829 | ||
| 157 | DTE Energy Co. | 17,198 | ||
| 301 | Public Service Enterprise Group, Inc. | 18,797 | ||
| 119 | Sempra Energy | 17,988 | ||
| 197 | WEC Energy Group, Inc. | 18,674 | ||
| 161,812 | ||||
| Oil, Gas & Consumable Fuels – 4.4% | ||||
| 757 | APA Corp. | 27,297 | ||
| 236 | Cheniere Energy, Inc. | 37,194 | ||
| 197 | Chevron Corp. | 32,143 | ||
| 300 | ConocoPhillips | 29,763 | ||
| 1,439 | Coterra Energy, Inc. | 35,313 | ||
| 575 | Devon Energy Corp. | 29,101 | ||
| 258 | Diamondback Energy, Inc. | 34,874 | ||
| 273 | EOG Resources, Inc. | 31,294 | ||
| 1,045 | EQT Corp. | 33,346 | ||
| 320 | Exxon Mobil Corp. | 35,091 | ||
| 249 | Hess Corp. | 32,953 | ||
| 1,955 | Kinder Morgan, Inc. | 34,232 | ||
| 1,306 | Marathon Oil Corp. | 31,292 | ||
| 304 | Marathon Petroleum Corp. | 40,988 | ||
| 561 | Occidental Petroleum Corp. | 35,023 | ||
| 538 | ONEOK, Inc. | 34,184 | ||
| 697 | Ovintiv, Inc. | 25,148 | ||
| 340 | Phillips 66 | 34,469 | ||
| Shares | Description | Value | ||
| COMMON STOCKS (Continued) | ||||
| Oil, Gas & Consumable Fuels (Continued) | ||||
| 155 | Pioneer Natural Resources Co. | $31,657 | ||
| 481 | Targa Resources Corp. | 35,089 | ||
| 15 | Texas Pacific Land Corp. | 25,515 | ||
| 279 | Valero Energy Corp. | 38,948 | ||
| 1,074 | Williams (The) Cos., Inc. | 32,070 | ||
| 756,984 | ||||
| Personal Care Products – 0.4% | ||||
| 249 | Estee Lauder (The) Cos., Inc., Class A | 61,369 | ||
| Pharmaceuticals – 2.6% | ||||
| 1,092 | Bristol-Myers Squibb Co. | 75,687 | ||
| 215 | Eli Lilly & Co. | 73,835 | ||
| 445 | Johnson & Johnson | 68,975 | ||
| 708 | Merck & Co., Inc. | 75,324 | ||
| 1,533 | Pfizer, Inc. | 62,546 | ||
| 536 | Zoetis, Inc. | 89,212 | ||
| 445,579 | ||||
| Professional Services – 2.8% | ||||
| 129 | Automatic Data Processing, Inc. | 28,719 | ||
| 295 | Booz Allen Hamilton Holding Corp. | 27,344 | ||
| 238 | Broadridge Financial Solutions, Inc. | 34,884 | ||
| 159 | Equifax, Inc. | 32,252 | ||
| 257 | Jacobs Solutions, Inc. | 30,200 | ||
| 1,102 | Leidos Holdings, Inc. | 101,450 | ||
| 267 | Paychex, Inc. | 30,596 | ||
| 2,226 | SS&C Technologies Holdings, Inc. | 125,702 | ||
| 544 | TransUnion | 33,804 | ||
| 175 | Verisk Analytics, Inc. | 33,575 | ||
| 478,526 | ||||
| Semiconductors & Semiconductor Equipment – 14.5% | ||||
| 706 | Analog Devices, Inc. | 139,237 | ||
| 1,190 | Applied Materials, Inc. | 146,168 | ||
| 207 | Broadcom, Inc. | 132,799 | ||
| 1,767 | Entegris, Inc. | 144,912 | ||
| 4,385 | Intel Corp. | 143,258 | ||
| 307 | KLA Corp. | 122,545 | ||
| 276 | Lam Research Corp. | 146,313 | ||
| 3,129 | Marvell Technology, Inc. | 135,486 | ||
| 1,650 | Microchip Technology, Inc. | 138,237 | ||
| 2,319 | Micron Technology, Inc. | 139,928 | ||
| 328 | Monolithic Power Systems, Inc. | 164,177 | ||
| 793 | NVIDIA Corp. | 220,272 | ||
| 733 | NXP Semiconductors N.V. | 136,686 | ||
| 1,054 | QUALCOMM, Inc. | 134,469 | ||
| 1,272 | Skyworks Solutions, Inc. | 150,070 | ||
| Shares | Description | Value | ||
| Semiconductors & Semiconductor Equipment (Continued) | ||||
| 1,327 | Teradyne, Inc. | $142,666 | ||
| 701 | Texas Instruments, Inc. | 130,393 | ||
| 2,467,616 | ||||
| Software – 3.6% | ||||
| 5,408 | Gen Digital, Inc. | 92,801 | ||
| 298 | Intuit, Inc. | 132,857 | ||
| 483 | Microsoft Corp. | 139,249 | ||
| 1,418 | Oracle Corp. | 131,761 | ||
| 268 | Roper Technologies, Inc. | 118,105 | ||
| 614,773 | ||||
| Specialty Retail – 2.1% | ||||
| 770 | Best Buy Co., Inc. | 60,268 | ||
| 196 | Home Depot (The), Inc. | 57,844 | ||
| 310 | Lowe’s Cos., Inc. | 61,991 | ||
| 532 | Ross Stores, Inc. | 56,461 | ||
| 776 | TJX (The) Cos., Inc. | 60,807 | ||
| 275 | Tractor Supply Co. | 64,636 | ||
| 362,007 | ||||
| Technology Hardware, Storage & Peripherals – 3.9% | ||||
| 892 | Apple, Inc. | 147,091 | ||
| 7,261 | Hewlett Packard Enterprise Co. | 115,668 | ||
| 4,313 | HP, Inc. | 126,586 | ||
| 1,929 | NetApp, Inc. | 123,167 | ||
| 2,203 | Seagate Technology Holdings PLC | 145,662 | ||
| 658,174 | ||||
| Textiles, Apparel & Luxury Goods – 0.7% | ||||
| 528 | NIKE, Inc., Class B | 64,754 | ||
| 2,238 | VF Corp. | 51,272 | ||
| 116,026 | ||||
| Tobacco – 0.4% | ||||
| 747 | Altria Group, Inc. | 33,331 | ||
| 338 | Philip Morris International, Inc. | 32,871 | ||
| 66,202 | ||||
| Trading Companies & Distributors – 0.3% | ||||
| 265 | Fastenal Co. | 14,294 | ||
| 56 | WW Grainger, Inc. | 38,573 | ||
| 52,867 | ||||
| Water Utilities – 0.2% | ||||
| 121 | American Water Works Co., Inc. | 17,725 | ||
| Shares | Description | Value | ||
| COMMON STOCKS (Continued) | ||||
| Water Utilities (Continued) | ||||
| 386 | Essential Utilities, Inc. | $16,849 | ||
| 34,574 | ||||
| Total Common Stocks | 16,543,355 | |||
| (Cost $16,310,372) | ||||
| REAL ESTATE INVESTMENT TRUSTS – 2.8% | ||||
| Diversified REITs – 0.1% | ||||
| 189 | WP Carey, Inc. | 14,638 | ||
| Health Care REITs – 0.3% | ||||
| 590 | Healthpeak Properties, Inc. | 12,962 | ||
| 328 | Ventas, Inc. | 14,219 | ||
| 226 | Welltower, Inc. | 16,202 | ||
| 43,383 | ||||
| Hotel & Resort REITs – 0.1% | ||||
| 922 | Host Hotels & Resorts, Inc. | 15,204 | ||
| Industrial REITs – 0.1% | ||||
| 131 | Prologis, Inc. | 16,345 | ||
| Office REITs – 0.1% | ||||
| 102 | Alexandria Real Estate Equities, Inc. | 12,810 | ||
| 219 | Boston Properties, Inc. | 11,852 | ||
| 24,662 | ||||
| Residential REITs – 0.9% | ||||
| 491 | American Homes 4 Rent, Class A | 15,442 | ||
| 92 | AvalonBay Communities, Inc. | 15,461 | ||
| 132 | Camden Property Trust | 13,839 | ||
| 229 | Equity LifeStyle Properties, Inc. | 15,373 | ||
| 251 | Equity Residential | 15,060 | ||
| 70 | Essex Property Trust, Inc. | 14,640 | ||
| 499 | Invitation Homes, Inc. | 15,584 | ||
| 94 | Mid-America Apartment Communities, Inc. | 14,198 | ||
| 103 | Sun Communities, Inc. | 14,510 | ||
| 382 | UDR, Inc. | 15,685 | ||
| 149,792 | ||||
| Retail REITs – 0.2% | ||||
| 698 | Kimco Realty Corp. | 13,632 | ||
| 233 | Realty Income Corp. | 14,754 | ||
| 126 | Simon Property Group, Inc. | 14,108 | ||
| 42,494 | ||||
| Specialized REITs – 1.0% | ||||
| 70 | American Tower Corp. | 14,304 | ||
| 109 | Crown Castle, Inc. | 14,589 | ||
| 148 | Digital Realty Trust, Inc. | 14,550 | ||
| 23 | Equinix, Inc. | 16,584 | ||
| 101 | Extra Space Storage, Inc. | 16,456 | ||
| 284 | Gaming and Leisure Properties, Inc. | 14,785 | ||
| Shares | Description | Value | ||
| Specialized REITs (Continued) | ||||
| 297 | Iron Mountain, Inc. | $15,714 | ||
| 53 | Public Storage | 16,013 | ||
| 53 | SBA Communications Corp. | 13,837 | ||
| 457 | VICI Properties, Inc. | 14,907 | ||
| 477 | Weyerhaeuser Co. | 14,372 | ||
| 166,111 | ||||
| Total Real Estate Investment Trusts | 472,629 | |||
| (Cost $513,719) | ||||
| Total Investments – 99.8% | 17,015,984 | |||
| (Cost $16,824,091) | ||||
| Net Other Assets and Liabilities – 0.2% | 29,529 | |||
| Net Assets – 100.0% | $17,045,513 | |||
| Total Value at 3/31/2023 | Level 1 Quoted Prices | Level 2 Significant Observable Inputs | Level 3 Significant Unobservable Inputs | |
| Common Stocks* | $ 16,543,355 | $ 16,543,355 | $ — | $ — |
| Real Estate Investment Trusts* | 472,629 | 472,629 | — | — |
| Total Investments | $ 17,015,984 | $ 17,015,984 | $— | $— |
| * | See Portfolio of Investments for industry breakout. |
| Shares | Description | Value | ||
| COMMON STOCKS – 92.5% | ||||
| Aerospace & Defense – 1.6% | ||||
| 543 | BWX Technologies, Inc. | $34,231 | ||
| 189 | Curtiss-Wright Corp. | 33,313 | ||
| 417 | Hexcel Corp. | 28,460 | ||
| 137 | Huntington Ingalls Industries, Inc. | 28,362 | ||
| 1,066 | Spirit AeroSystems Holdings, Inc., Class A | 36,809 | ||
| 327 | Woodward, Inc. | 31,840 | ||
| 193,015 | ||||
| Automobile Components – 1.5% | ||||
| 996 | BorgWarner, Inc. | 48,914 | ||
| 1,470 | Gentex Corp. | 41,204 | ||
| 434 | LCI Industries | 47,684 | ||
| 323 | Lear Corp. | 45,055 | ||
| 182,857 | ||||
| Automobiles – 0.6% | ||||
| 964 | Harley-Davidson, Inc. | 36,603 | ||
| 531 | Thor Industries, Inc. | 42,289 | ||
| 78,892 | ||||
| Banks – 5.4% | ||||
| 261 | BancFirst Corp. | 21,689 | ||
| 576 | Bank OZK | 19,699 | ||
| 222 | BOK Financial Corp. | 18,739 | ||
| 935 | Cadence Bank | 19,411 | ||
| 345 | Comerica, Inc. | 14,980 | ||
| 339 | Commerce Bancshares, Inc. | 19,781 | ||
| 366 | Community Bank System, Inc. | 19,211 | ||
| 172 | Cullen/Frost Bankers, Inc. | 18,118 | ||
| 894 | CVB Financial Corp. | 14,912 | ||
| 350 | East West Bancorp, Inc. | 19,425 | ||
| 1,337 | Eastern Bankshares, Inc. | 16,873 | ||
| 31 | First Citizens BancShares, Inc., Class A | 30,166 | ||
| 669 | First Financial Bankshares, Inc. | 21,341 | ||
| 596 | First Interstate BancSystem, Inc., Class A | 17,797 | ||
| 1,767 | FNB Corp. | 20,497 | ||
| 467 | Glacier Bancorp, Inc. | 19,619 | ||
| 476 | Hancock Whitney Corp. | 17,326 | ||
| 1,012 | Home BancShares, Inc. | 21,970 | ||
| 273 | Independent Bank Corp. | 17,914 | ||
| 2,681 | New York Community Bancorp, Inc. | 24,236 | ||
| 1,280 | Old National Bancorp | 18,458 | ||
| 314 | Pinnacle Financial Partners, Inc. | 17,320 | ||
| 348 | Popular, Inc. | 19,979 | ||
| 317 | Prosperity Bancshares, Inc. | 19,502 | ||
| 335 | ServisFirst Bancshares, Inc. | 18,301 | ||
| 302 | SouthState Corp. | 21,520 | ||
| 614 | Synovus Financial Corp. | 18,930 | ||
| 276 | UMB Financial Corp. | 15,931 | ||
| Shares | Description | Value | ||
| Banks (Continued) | ||||
| 569 | United Bankshares, Inc. | $20,029 | ||
| 681 | United Community Banks, Inc. | 19,150 | ||
| 2,039 | Valley National Bancorp | 18,840 | ||
| 487 | Webster Financial Corp. | 19,198 | ||
| 387 | Western Alliance Bancorp | 13,754 | ||
| 273 | Wintrust Financial Corp. | 19,915 | ||
| 469 | Zions Bancorp N.A. | 14,037 | ||
| 668,568 | ||||
| Beverages – 0.7% | ||||
| 78 | Coca-Cola Consolidated, Inc. | 41,736 | ||
| 776 | Molson Coors Beverage Co., Class B | 40,104 | ||
| 81,840 | ||||
| Broadline Retail – 0.9% | ||||
| 1,588 | Kohl’s Corp. | 37,381 | ||
| 1,942 | Macy’s, Inc. | 33,966 | ||
| 2,484 | Nordstrom, Inc. | 40,415 | ||
| 111,762 | ||||
| Building Products – 2.7% | ||||
| 551 | A.O. Smith Corp. | 38,101 | ||
| 385 | Advanced Drainage Systems, Inc. | 32,421 | ||
| 300 | Allegion PLC | 32,019 | ||
| 460 | Armstrong World Industries, Inc. | 32,770 | ||
| 552 | Fortune Brands Innovations, Inc. | 32,419 | ||
| 132 | Lennox International, Inc. | 33,169 | ||
| 370 | Owens Corning | 35,446 | ||
| 356 | Simpson Manufacturing Co., Inc. | 39,032 | ||
| 310 | UFP Industries, Inc. | 24,636 | ||
| 1,492 | Zurn Elkay Water Solutions Corp. | 31,869 | ||
| 331,882 | ||||
| Capital Markets – 2.7% | ||||
| 146 | Affiliated Managers Group, Inc. | 20,793 | ||
| 337 | Ares Management Corp., Class A | 28,119 | ||
| 357 | Cohen & Steers, Inc. | 22,834 | ||
| 211 | Evercore, Inc., Class A | 24,345 | ||
| 265 | Houlihan Lokey, Inc. | 23,185 | ||
| 319 | Interactive Brokers Group, Inc., Class A | 26,337 | ||
| 1,282 | Invesco, Ltd. | 21,025 | ||
| 673 | Jefferies Financial Group, Inc. | 21,361 | ||
| 664 | Lazard Ltd., Class A | 21,985 | ||
| 83 | MarketAxess Holdings, Inc. | 32,477 | ||
| 106 | Morningstar, Inc. | 21,521 | ||
| 395 | SEI Investments Co. | 22,732 | ||
| 395 | Stifel Financial Corp. | 23,341 | ||
| 355 | Tradeweb Markets, Inc., Class A | 28,052 | ||
| 338,107 | ||||
| Chemicals – 2.9% | ||||
| 228 | Ashland, Inc. | 23,418 | ||
| Shares | Description | Value | ||
| COMMON STOCKS (Continued) | ||||
| Chemicals (Continued) | ||||
| 727 | Avient Corp. | $29,923 | ||
| 201 | Balchem Corp. | 25,422 | ||
| 367 | Cabot Corp. | 28,127 | ||
| 802 | Chemours (The) Co. | 24,012 | ||
| 1,350 | Element Solutions, Inc. | 26,068 | ||
| 440 | HB Fuller Co. | 30,118 | ||
| 892 | Huntsman Corp. | 24,405 | ||
| 464 | Olin Corp. | 25,752 | ||
| 324 | RPM International, Inc. | 28,266 | ||
| 505 | Scotts Miracle-Gro (The) Co. | 35,219 | ||
| 337 | Sensient Technologies Corp. | 25,801 | ||
| 751 | Valvoline, Inc. | 26,240 | ||
| 352,771 | ||||
| Commercial Services & Supplies – 0.5% | ||||
| 219 | MSA Safety, Inc. | 29,237 | ||
| 217 | Tetra Tech, Inc. | 31,879 | ||
| 61,116 | ||||
| Communications Equipment – 0.6% | ||||
| 2,181 | Juniper Networks, Inc. | 75,070 | ||
| Construction & Engineering – 1.4% | ||||
| 371 | AECOM | 31,283 | ||
| 274 | Comfort Systems USA, Inc. | 39,993 | ||
| 213 | EMCOR Group, Inc. | 34,632 | ||
| 1,040 | MDU Resources Group, Inc. | 31,699 | ||
| 95 | Valmont Industries, Inc. | 30,331 | ||
| 167,938 | ||||
| Construction Materials – 0.3% | ||||
| 237 | Eagle Materials, Inc. | 34,780 | ||
| Consumer Finance – 0.7% | ||||
| 943 | Ally Financial, Inc. | 24,037 | ||
| 265 | FirstCash Holdings, Inc. | 25,273 | ||
| 692 | OneMain Holdings, Inc. | 25,659 | ||
| 1,389 | SLM Corp. | 17,210 | ||
| 92,179 | ||||
| Consumer Staples Distribution & Retail – 0.3% | ||||
| 178 | Casey’s General Stores, Inc. | 38,530 | ||
| Containers & Packaging – 2.3% | ||||
| 287 | AptarGroup, Inc. | 33,920 | ||
| 522 | Berry Global Group, Inc. | 30,746 | ||
| 384 | Crown Holdings, Inc. | 31,761 | ||
| 1,418 | Graphic Packaging Holding Co. | 36,145 | ||
| 470 | Greif, Inc., Class A | 29,784 | ||
| 632 | Sealed Air Corp. | 29,015 | ||
| 609 | Silgan Holdings, Inc. | 32,685 | ||
| Shares | Description | Value | ||
| Containers & Packaging (Continued) | ||||
| 520 | Sonoco Products Co. | $31,720 | ||
| 896 | WestRock Co. | 27,301 | ||
| 283,077 | ||||
| Diversified Consumer Services – 0.8% | ||||
| 3,478 | ADT, Inc. | 25,146 | ||
| 1,098 | H&R Block, Inc. | 38,705 | ||
| 580 | Service Corp. International | 39,892 | ||
| 103,743 | ||||
| Diversified Telecommunication Services – 0.3% | ||||
| 13,352 | Lumen Technologies, Inc. | 35,383 | ||
| Electric Utilities – 1.5% | ||||
| 419 | ALLETE, Inc. | 26,971 | ||
| 647 | Hawaiian Electric Industries, Inc. | 24,845 | ||
| 251 | IDACORP, Inc. | 27,191 | ||
| 849 | NRG Energy, Inc. | 29,112 | ||
| 683 | OGE Energy Corp. | 25,722 | ||
| 356 | Pinnacle West Capital Corp. | 28,209 | ||
| 552 | Portland General Electric Co. | 26,987 | ||
| 189,037 | ||||
| Electrical Equipment – 1.6% | ||||
| 190 | Acuity Brands, Inc. | 34,719 | ||
| 134 | Hubbell, Inc. | 32,603 | ||
| 263 | Regal Rexnord Corp. | 37,012 | ||
| 6,765 | Vertiv Holdings Co. | 96,807 | ||
| 201,141 | ||||
| Electronic Equipment, Instruments & Components – 4.5% | ||||
| 2,222 | Avnet, Inc. | 100,434 | ||
| 670 | Cognex Corp. | 33,198 | ||
| 1,355 | Jabil, Inc. | 119,457 | ||
| 143 | Littelfuse, Inc. | 38,337 | ||
| 2,504 | National Instruments Corp. | 131,235 | ||
| 976 | TD SYNNEX Corp. | 94,467 | ||
| 1,632 | Vontier Corp. | 44,619 | ||
| 561,747 | ||||
| Energy Equipment & Services – 0.7% | ||||
| 963 | ChampionX Corp. | 26,126 | ||
| 563 | Helmerich & Payne, Inc. | 20,127 | ||
| 1,337 | NOV, Inc. | 24,748 | ||
| 1,658 | Patterson-UTI Energy, Inc. | 19,399 | ||
| 90,400 | ||||
| Entertainment – 0.3% | ||||
| 1,145 | Warner Music Group Corp., Class A | 38,209 | ||
| Shares | Description | Value | ||
| COMMON STOCKS (Continued) | ||||
| Financial Services – 1.4% | ||||
| 802 | Equitable Holdings, Inc. | $20,363 | ||
| 593 | Essent Group Ltd. | 23,750 | ||
| 1,774 | MGIC Investment Corp. | 23,807 | ||
| 1,209 | Radian Group, Inc. | 26,719 | ||
| 375 | Voya Financial, Inc. | 26,797 | ||
| 294 | Walker & Dunlop, Inc. | 22,394 | ||
| 2,291 | Western Union (The) Co. | 25,545 | ||
| 169,375 | ||||
| Food Products – 1.7% | ||||
| 1,391 | Flowers Foods, Inc. | 38,127 | ||
| 408 | Ingredion, Inc. | 41,506 | ||
| 447 | Lamb Weston Holdings, Inc. | 46,720 | ||
| 203 | Lancaster Colony Corp. | 41,185 | ||
| 11 | Seaboard Corp. | 41,470 | ||
| 209,008 | ||||
| Gas Utilities – 1.3% | ||||
| 427 | National Fuel Gas Co. | 24,655 | ||
| 545 | New Jersey Resources Corp. | 28,994 | ||
| 357 | ONE Gas, Inc. | 28,285 | ||
| 437 | Southwest Gas Holdings, Inc. | 27,291 | ||
| 393 | Spire, Inc. | 27,565 | ||
| 729 | UGI Corp. | 25,340 | ||
| 162,130 | ||||
| Ground Transportation – 0.8% | ||||
| 602 | Knight-Swift Transportation Holdings, Inc. | 34,061 | ||
| 194 | Landstar System, Inc. | 34,776 | ||
| 377 | Ryder System, Inc. | 33,644 | ||
| 102,481 | ||||
| Health Care Equipment & Supplies – 2.2% | ||||
| 3,753 | DENTSPLY SIRONA, Inc. | 147,418 | ||
| 479 | Teleflex, Inc. | 121,335 | ||
| 268,753 | ||||
| Health Care Providers & Services – 5.6% | ||||
| 234 | Chemed Corp. | 125,833 | ||
| 1,998 | Encompass Health Corp. | 108,092 | ||
| 1,263 | Ensign Group (The), Inc. | 120,667 | ||
| 3,416 | Premier, Inc., Class A | 110,576 | ||
| 4,813 | Select Medical Holdings Corp. | 124,416 | ||
| 848 | Universal Health Services, Inc., Class B | 107,781 | ||
| 697,365 | ||||
| Hotels, Restaurants & Leisure – 4.1% | ||||
| 970 | Aramark | 34,726 | ||
| 735 | Boyd Gaming Corp. | 47,128 | ||
| 356 | Choice Hotels International, Inc. | 41,720 | ||
| Shares | Description | Value | ||
| Hotels, Restaurants & Leisure (Continued) | ||||
| 190 | Churchill Downs, Inc. | $48,840 | ||
| 298 | Marriott Vacations Worldwide Corp. | 40,188 | ||
| 487 | Papa John’s International, Inc. | 36,491 | ||
| 441 | Texas Roadhouse, Inc. | 47,654 | ||
| 1,102 | Travel + Leisure Co. | 43,198 | ||
| 168 | Vail Resorts, Inc. | 39,258 | ||
| 1,772 | Wendy’s (The) Co. | 38,594 | ||
| 291 | Wingstop, Inc. | 53,422 | ||
| 562 | Wyndham Hotels & Resorts, Inc. | 38,132 | ||
| 509,351 | ||||
| Household Durables – 2.1% | ||||
| 1,244 | Leggett & Platt, Inc. | 39,659 | ||
| 3,065 | Newell Brands, Inc. | 38,128 | ||
| 881 | PulteGroup, Inc. | 51,345 | ||
| 1,168 | Tempur Sealy International, Inc. | 46,124 | ||
| 803 | Toll Brothers, Inc. | 48,204 | ||
| 283 | Whirlpool Corp. | 37,362 | ||
| 260,822 | ||||
| Household Products – 0.3% | ||||
| 1,333 | Reynolds Consumer Products, Inc. | 36,658 | ||
| Independent Power & Renewable Electricity Producers – 0.7% | ||||
| 848 | Clearway Energy, Inc., Class C | 26,568 | ||
| 313 | Ormat Technologies, Inc. | 26,533 | ||
| 1,165 | Vistra Corp. | 27,960 | ||
| 81,061 | ||||
| Insurance – 3.8% | ||||
| 505 | American Equity Investment Life Holding Co. | 18,427 | ||
| 173 | American Financial Group, Inc. | 21,020 | ||
| 184 | Assurant, Inc. | 22,093 | ||
| 370 | Assured Guaranty Ltd. | 18,600 | ||
| 426 | Axis Capital Holdings Ltd. | 23,226 | ||
| 93 | Erie Indemnity Co., Class A | 21,544 | ||
| 70 | Everest Re Group Ltd. | 25,061 | ||
| 613 | Fidelity National Financial, Inc. | 21,412 | ||
| 441 | First American Financial Corp. | 24,546 | ||
| 191 | Globe Life, Inc. | 21,014 | ||
| 171 | Hanover Insurance Group (The), Inc. | 21,974 | ||
| 88 | Kinsale Capital Group, Inc. | 26,413 | ||
| 751 | Lincoln National Corp. | 16,875 | ||
| 955 | Old Republic International Corp. | 23,846 | ||
| 163 | Primerica, Inc. | 28,075 | ||
| 162 | Reinsurance Group of America, Inc. | 21,507 | ||
| 125 | RenaissanceRe Holdings Ltd. | 25,042 | ||
| 176 | RLI Corp. | 23,392 | ||
| Shares | Description | Value | ||
| COMMON STOCKS (Continued) | ||||
| Insurance (Continued) | ||||
| 260 | Selective Insurance Group, Inc. | $24,786 | ||
| 562 | Unum Group | 22,233 | ||
| 16 | White Mountains Insurance Group Ltd. | 22,040 | ||
| 473,126 | ||||
| Leisure Products – 1.3% | ||||
| 944 | Acushnet Holdings Corp. | 48,088 | ||
| 438 | Brunswick Corp. | 35,916 | ||
| 657 | Hasbro, Inc. | 35,274 | ||
| 397 | Polaris, Inc. | 43,920 | ||
| 163,198 | ||||
| Life Sciences Tools & Services – 1.1% | ||||
| 1,748 | Bruker Corp. | 137,812 | ||
| Machinery – 4.4% | ||||
| 227 | AGCO Corp. | 30,690 | ||
| 758 | Allison Transmission Holdings, Inc. | 34,292 | ||
| 314 | Crane Holdings Co. | 35,639 | ||
| 536 | Donaldson Co., Inc. | 35,022 | ||
| 1,028 | Flowserve Corp. | 34,952 | ||
| 396 | Franklin Electric Co., Inc. | 37,263 | ||
| 469 | Graco, Inc. | 34,242 | ||
| 389 | ITT, Inc. | 33,571 | ||
| 345 | John Bean Technologies Corp. | 37,705 | ||
| 218 | Lincoln Electric Holdings, Inc. | 36,864 | ||
| 416 | Mueller Industries, Inc. | 30,568 | ||
| 358 | Oshkosh Corp. | 29,778 | ||
| 138 | Snap-on, Inc. | 34,071 | ||
| 347 | Timken (The) Co. | 28,357 | ||
| 279 | Toro (The) Co. | 31,014 | ||
| 216 | Watts Water Technologies, Inc., Class A | 36,357 | ||
| 540,385 | ||||
| Marine Transportation – 0.2% | ||||
| 505 | Matson, Inc. | 30,133 | ||
| Media – 1.9% | ||||
| 98 | Cable One, Inc. | 68,796 | ||
| 1,204 | Interpublic Group of (The) Cos., Inc. | 44,837 | ||
| 1,235 | New York Times (The) Co., Class A | 48,017 | ||
| 2,203 | News Corp., Class A | 38,046 | ||
| 229 | Nexstar Media Group, Inc. | 39,539 | ||
| 239,235 | ||||
| Metals & Mining – 1.1% | ||||
| 540 | Alcoa Corp. | 22,982 | ||
| 508 | Commercial Metals Co. | 24,841 | ||
| 121 | Reliance Steel & Aluminum Co. | 31,066 | ||
| 218 | Royal Gold, Inc. | 28,277 | ||
| Shares | Description | Value | ||
| Metals & Mining (Continued) | ||||
| 980 | United States Steel Corp. | $25,578 | ||
| 132,744 | ||||
| Multi-Utilities – 0.4% | ||||
| 385 | Black Hills Corp. | 24,293 | ||
| 987 | NiSource, Inc. | 27,597 | ||
| 51,890 | ||||
| Oil, Gas & Consumable Fuels – 3.3% | ||||
| 2,588 | Antero Midstream Corp. | 27,148 | ||
| 641 | California Resources Corp. | 24,679 | ||
| 296 | Chesapeake Energy Corp. | 22,508 | ||
| 204 | Chord Energy Corp. | 27,458 | ||
| 482 | Civitas Resources, Inc. | 32,940 | ||
| 2,037 | Comstock Resources, Inc. | 21,979 | ||
| 505 | DT Midstream, Inc. | 24,932 | ||
| 527 | Enviva Inc. | 15,220 | ||
| 538 | HF Sinclair Corp. | 26,028 | ||
| 1,191 | Magnolia Oil & Gas Corp., Class A | 26,059 | ||
| 488 | Matador Resources, Co. | 23,253 | ||
| 648 | Murphy Oil Corp. | 23,963 | ||
| 685 | PBF Energy, Inc., Class A | 29,702 | ||
| 440 | PDC Energy, Inc. | 28,239 | ||
| 1,116 | Range Resources Corp. | 29,541 | ||
| 802 | SM Energy Co. | 22,584 | ||
| 406,233 | ||||
| Paper & Forest Products – 0.2% | ||||
| 533 | Louisiana-Pacific Corp. | 28,894 | ||
| Pharmaceuticals – 2.7% | ||||
| 4,278 | Organon & Co. | 100,619 | ||
| 3,505 | Perrigo Co. PLC | 125,724 | ||
| 10,737 | Viatris, Inc. | 103,290 | ||
| 329,633 | ||||
| Professional Services – 5.0% | ||||
| 694 | Concentrix Corp. | 84,356 | ||
| 7,538 | Dun & Bradstreet Holdings, Inc. | 88,496 | ||
| 318 | Exponent, Inc. | 31,701 | ||
| 681 | Genpact Ltd. | 31,476 | ||
| 278 | Insperity, Inc. | 33,791 | ||
| 1,750 | KBR, Inc. | 96,338 | ||
| 623 | Korn Ferry | 32,234 | ||
| 379 | ManpowerGroup, Inc. | 31,279 | ||
| 430 | Maximus, Inc. | 33,841 | ||
| 427 | Robert Half International, Inc. | 34,403 | ||
| 833 | Science Applications International Corp. | 89,514 | ||
| 715 | TTEC Holdings, Inc. | 26,619 | ||
| 614,048 | ||||
| Shares | Description | Value | ||
| COMMON STOCKS (Continued) | ||||
| Semiconductors & Semiconductor Equipment – 3.0% | ||||
| 3,854 | Amkor Technology, Inc. | $100,281 | ||
| 372 | MKS Instruments, Inc. | 32,967 | ||
| 1,288 | Power Integrations, Inc. | 109,016 | ||
| 855 | Universal Display Corp. | 132,636 | ||
| 374,900 | ||||
| Software – 1.8% | ||||
| 2,500 | Bentley Systems, Inc., Class B | 107,475 | ||
| 1,310 | Dolby Laboratories, Inc., Class A | 111,900 | ||
| 219,375 | ||||
| Specialty Retail – 3.0% | ||||
| 763 | Academy Sports & Outdoors, Inc. | 49,786 | ||
| 273 | Advance Auto Parts, Inc. | 33,200 | ||
| 951 | Bath & Body Works, Inc. | 34,788 | ||
| 333 | Dick’s Sporting Goods, Inc. | 47,249 | ||
| 3,554 | Gap (The), Inc. | 35,682 | ||
| 196 | Lithia Motors, Inc. | 44,870 | ||
| 143 | Murphy USA, Inc. | 36,901 | ||
| 349 | Penske Automotive Group, Inc. | 49,492 | ||
| 349 | Williams-Sonoma, Inc. | 42,459 | ||
| 374,427 | ||||
| Technology Hardware, Storage & Peripherals – 0.7% | ||||
| 2,298 | Dell Technologies, Inc., Class C | 92,403 | ||
| Textiles, Apparel & Luxury Goods – 1.7% | ||||
| 458 | Columbia Sportswear Co. | 41,330 | ||
| 6,304 | Hanesbrands, Inc. | 33,159 | ||
| 568 | PVH Corp. | 50,643 | ||
| 379 | Ralph Lauren Corp. | 44,218 | ||
| 1,053 | Tapestry, Inc. | 45,395 | ||
| 214,745 | ||||
| Trading Companies & Distributors – 1.9% | ||||
| 821 | Air Lease Corp. | 32,323 | ||
| 250 | Applied Industrial Technologies, Inc. | 35,532 | ||
| 297 | GATX Corp. | 32,676 | ||
| 240 | Herc Holdings, Inc. | 27,336 | ||
| 386 | MSC Industrial Direct Co., Inc., Class A | 32,424 | ||
| 459 | Triton International Ltd. | 29,018 | ||
| 126 | Watsco, Inc. | 40,088 | ||
| 229,397 | ||||
| Total Common Stocks | 11,461,626 | |||
| (Cost $11,819,403) | ||||
| Shares | Description | Value | ||
| REAL ESTATE INVESTMENT TRUSTS – 7.4% | ||||
| Diversified REITs – 0.2% | ||||
| 1,382 | Broadstone Net Lease, Inc. | $23,508 | ||
| Health Care REITs – 0.8% | ||||
| 1,164 | Healthcare Realty Trust, Inc. | 22,500 | ||
| 2,014 | Medical Properties Trust, Inc. | 16,555 | ||
| 803 | Omega Healthcare Investors, Inc. | 22,010 | ||
| 1,550 | Physicians Realty Trust | 23,141 | ||
| 1,805 | Sabra Health Care REIT, Inc. | 20,758 | ||
| 104,964 | ||||
| Hotel & Resort REITs – 0.6% | ||||
| 1,422 | Apple Hospitality REIT, Inc. | 22,070 | ||
| 1,903 | Park Hotels & Resorts, Inc. | 23,521 | ||
| 274 | Ryman Hospitality Properties, Inc. | 24,586 | ||
| 70,177 | ||||
| Industrial REITs – 1.2% | ||||
| 791 | Americold Realty Trust | 22,504 | ||
| 152 | EastGroup Properties, Inc. | 25,129 | ||
| 465 | First Industrial Realty Trust, Inc. | 24,738 | ||
| 411 | Rexford Industrial Realty, Inc. | 24,516 | ||
| 693 | STAG Industrial, Inc. | 23,437 | ||
| 394 | Terreno Realty Corp. | 25,452 | ||
| 145,776 | ||||
| Mortgage Real Estate Investment Trusts – 0.9% | ||||
| 2,228 | AGNC Investment Corp. | 22,458 | ||
| 1,094 | Annaly Capital Management, Inc. | 20,906 | ||
| 1,089 | Blackstone Mortgage Trust, Inc., Class A | 19,439 | ||
| 2,822 | Rithm Capital Corp. | 22,576 | ||
| 1,258 | Starwood Property Trust, Inc. | 22,254 | ||
| 107,633 | ||||
| Office REITs – 0.7% | ||||
| 886 | Cousins Properties, Inc. | 18,943 | ||
| 1,431 | Douglas Emmett, Inc. | 17,644 | ||
| 802 | Highwoods Properties, Inc. | 18,598 | ||
| 579 | Kilroy Realty Corp. | 18,760 | ||
| 1,078 | Vornado Realty Trust | 16,569 | ||
| 90,514 | ||||
| Other Specialized REITs – 0.4% | ||||
| 595 | EPR Properties | 22,669 | ||
| 238 | Lamar Advertising Co., Class A | 23,774 | ||
| 46,443 | ||||
| Residential REITs – 0.4% | ||||
| 653 | Apartment Income REIT Corp. | 23,384 | ||
| 1,328 | Independence Realty Trust, Inc. | 21,288 | ||
| 44,672 | ||||
| Shares | Description | Value | ||
| REAL ESTATE INVESTMENT TRUSTS (Continued) | ||||
| Retail REITs – 1.2% | ||||
| 316 | Agree Realty Corp. | $21,681 | ||
| 990 | Brixmor Property Group, Inc. | 21,305 | ||
| 1,066 | Kite Realty Group Trust | 22,301 | ||
| 490 | National Retail Properties, Inc. | 21,633 | ||
| 705 | Phillips Edison & Co, Inc. | 22,997 | ||
| 359 | Regency Centers Corp. | 21,964 | ||
| 562 | Spirit Realty Capital, Inc. | 22,390 | ||
| 154,271 | ||||
| Self-Storage REITs – 0.2% | ||||
| 228 | Life Storage, Inc. | 29,888 | ||
| Specialized REITs – 0.8% | ||||
| 557 | CubeSmart | 25,745 | ||
| 621 | National Storage Affiliates Trust | 25,945 | ||
| 510 | PotlatchDeltic Corp. | 25,245 | ||
| 680 | Rayonier, Inc. | 22,617 | ||
| 99,552 | ||||
| Total Real Estate Investment Trusts | 917,398 | |||
| (Cost $1,125,366) | ||||
| Total Investments – 99.9% | 12,379,024 | |||
| (Cost $12,944,769) | ||||
| Net Other Assets and Liabilities – 0.1% | 17,854 | |||
| Net Assets – 100.0% | $12,396,878 | |||
| Total Value at 3/31/2023 | Level 1 Quoted Prices | Level 2 Significant Observable Inputs | Level 3 Significant Unobservable Inputs | |
| Common Stocks* | $ 11,461,626 | $ 11,461,626 | $ — | $ — |
| Real Estate Investment Trusts* | 917,398 | 917,398 | — | — |
| Total Investments | $ 12,379,024 | $ 12,379,024 | $— | $— |
| * | See Portfolio of Investments for industry breakout. |
| Shares | Description | Value | ||
| COMMON STOCKS – 92.3% | ||||
| Aerospace & Defense – 0.4% | ||||
| 972 | Moog, Inc., Class A | $97,929 | ||
| Air Freight & Logistics – 0.3% | ||||
| 814 | Forward Air Corp. | 87,717 | ||
| Automobile Components – 0.7% | ||||
| 6,280 | Dana, Inc. | 94,514 | ||
| 1,408 | Patrick Industries, Inc. | 96,884 | ||
| 191,398 | ||||
| Automobiles – 0.4% | ||||
| 1,803 | Winnebago Industries, Inc. | 104,033 | ||
| Banks – 8.2% | ||||
| 945 | 1st Source Corp. | 40,777 | ||
| 1,064 | Ameris Bancorp | 38,921 | ||
| 2,172 | Associated Banc-Corp. | 39,052 | ||
| 1,427 | Atlantic Union Bankshares Corp. | 50,016 | ||
| 647 | Bank of Hawaii Corp. | 33,696 | ||
| 1,477 | BankUnited, Inc. | 33,351 | ||
| 794 | Banner Corp. | 43,170 | ||
| 1,678 | Berkshire Hills Bancorp, Inc. | 42,051 | ||
| 5,799 | Capitol Federal Financial, Inc. | 39,027 | ||
| 1,230 | Cathay General Bancorp | 42,460 | ||
| 539 | City Holding Co. | 48,984 | ||
| 1,665 | Columbia Banking System, Inc. | 35,664 | ||
| 1,576 | Dime Community Bancshares, Inc. | 35,807 | ||
| 1,138 | Eagle Bancorp, Inc. | 38,089 | ||
| 1,025 | Enterprise Financial Services Corp. | 45,705 | ||
| 1,388 | FB Financial Corp. | 43,139 | ||
| 1,171 | First Bancorp | 41,594 | ||
| 3,944 | First BanCorp | 45,040 | ||
| 2,029 | First Busey Corp. | 41,270 | ||
| 3,591 | First Commonwealth Financial Corp. | 44,636 | ||
| 2,070 | First Financial Bancorp | 45,064 | ||
| 3,500 | First Foundation, Inc. | 26,075 | ||
| 1,926 | First Hawaiian, Inc. | 39,733 | ||
| 1,220 | First Merchants Corp. | 40,199 | ||
| 2,981 | Fulton Financial Corp. | 41,197 | ||
| 1,076 | Heartland Financial USA, Inc. | 41,275 | ||
| 1,672 | Hilltop Holdings, Inc. | 49,608 | ||
| 3,916 | Hope Bancorp, Inc. | 38,455 | ||
| 835 | Independent Bank Group, Inc. | 38,702 | ||
| 1,096 | International Bancshares Corp. | 46,931 | ||
| 687 | Lakeland Financial Corp. | 43,034 | ||
| 1,661 | Live Oak Bancshares, Inc. | 40,479 | ||
| 1,192 | National Bank Holdings Corp., Class A | 39,884 | ||
| 1,155 | NBT Bancorp, Inc. | 38,935 | ||
| 3,588 | Northwest Bancshares, Inc. | 43,164 | ||
| 2,361 | OceanFirst Financial Corp. | 43,631 | ||
| 1,820 | OFG Bancorp | 45,391 | ||
| Shares | Description | Value | ||
| Banks (Continued) | ||||
| 1,589 | Pacific Premier Bancorp, Inc. | $38,168 | ||
| 2,186 | PacWest Bancorp | 21,270 | ||
| 356 | Park National Corp. | 42,211 | ||
| 2,348 | Provident Financial Services, Inc. | 45,035 | ||
| 1,334 | Renasant Corp. | 40,794 | ||
| 1,468 | S&T Bancorp, Inc. | 46,169 | ||
| 1,424 | Sandy Spring Bancorp, Inc. | 36,995 | ||
| 1,608 | Seacoast Banking Corp. of Florida | 38,110 | ||
| 2,324 | Simmons First National Corp., Class A | 40,647 | ||
| 1,394 | Southside Bancshares, Inc. | 46,281 | ||
| 772 | Stock Yards Bancorp, Inc. | 42,568 | ||
| 1,627 | Towne Bank | 43,359 | ||
| 984 | TriCo Bancshares | 40,924 | ||
| 1,437 | Trustmark Corp. | 35,494 | ||
| 1,786 | Veritex Holdings, Inc. | 32,612 | ||
| 1,495 | Washington Federal, Inc. | 45,029 | ||
| 1,356 | WesBanco, Inc. | 41,629 | ||
| 850 | Westamerica BanCorp | 37,655 | ||
| 1,106 | WSFS Financial Corp. | 41,597 | ||
| 2,280,753 | ||||
| Beverages – 0.2% | ||||
| 669 | MGP Ingredients, Inc. | 64,706 | ||
| Broadline Retail – 0.3% | ||||
| 294 | Dillard’s, Inc., Class A | 90,458 | ||
| Building Products – 1.0% | ||||
| 1,133 | AAON, Inc. | 109,550 | ||
| 736 | CSW Industrials, Inc. | 102,252 | ||
| 2,384 | Griffon Corp. | 76,312 | ||
| 288,114 | ||||
| Capital Markets – 2.5% | ||||
| 1,689 | Artisan Partners Asset Management, Inc., Class A | 54,014 | ||
| 1,467 | B. Riley Financial, Inc. (a) | 41,648 | ||
| 13,306 | BGC Partners, Inc., Class A | 69,590 | ||
| 1,381 | Federated Hermes, Inc. | 55,433 | ||
| 785 | Hamilton Lane, Inc., Class A | 58,074 | ||
| 1,307 | Moelis & Co., Class A | 50,241 | ||
| 385 | Piper Sandler Cos. | 53,365 | ||
| 681 | PJT Partners, Inc., Class A | 49,162 | ||
| 1,992 | StepStone Group, Inc., Class A | 48,346 | ||
| 1,802 | TPG, Inc. | 52,853 | ||
| 1,870 | Victory Capital Holdings, Inc., Class A | 54,735 | ||
| 2,458 | Virtu Financial, Inc., Class A | 46,456 | ||
| 262 | Virtus Investment Partners, Inc. | 49,882 | ||
| 683,799 | ||||
| Chemicals – 1.5% | ||||
| 519 | Innospec, Inc. | 53,286 | ||
| 2,557 | Mativ Holdings, Inc. | 54,899 | ||
| Shares | Description | Value | ||
| COMMON STOCKS (Continued) | ||||
| Chemicals (Continued) | ||||
| 880 | Minerals Technologies, Inc. | $53,170 | ||
| 172 | NewMarket Corp. | 62,776 | ||
| 320 | Quaker Chemical Corp. | 63,344 | ||
| 502 | Stepan Co. | 51,721 | ||
| 3,757 | Trinseo PLC | 78,333 | ||
| 417,529 | ||||
| Commercial Services & Supplies – 2.0% | ||||
| 1,921 | ABM Industries, Inc. | 86,330 | ||
| 1,812 | Brady Corp., Class A | 97,359 | ||
| 1,589 | Brink’s (The) Co. | 106,145 | ||
| 3,342 | HNI Corp. | 93,041 | ||
| 4,523 | MillerKnoll, Inc. | 92,495 | ||
| 442 | UniFirst Corp. | 77,894 | ||
| 553,264 | ||||
| Communications Equipment – 0.4% | ||||
| 7,310 | ADTRAN Holdings, Inc. | 115,937 | ||
| Construction & Engineering – 1.2% | ||||
| 2,067 | Arcosa, Inc. | 130,448 | ||
| 2,433 | Granite Construction, Inc. | 99,948 | ||
| 3,889 | Primoris Services Corp. | 95,903 | ||
| 326,299 | ||||
| Consumer Finance – 0.6% | ||||
| 2,266 | Bread Financial Holdings, Inc. | 68,705 | ||
| 3,049 | Navient Corp. | 48,754 | ||
| 553 | Nelnet, Inc., Class A | 50,815 | ||
| 168,274 | ||||
| Consumer Staples Distribution & Retail – 1.2% | ||||
| 2,033 | Andersons (The), Inc. | 84,004 | ||
| 737 | Ingles Markets, Inc., Class A | 65,372 | ||
| 1,563 | PriceSmart, Inc. | 111,723 | ||
| 864 | Weis Markets, Inc. | 73,155 | ||
| 334,254 | ||||
| Containers & Packaging – 0.5% | ||||
| 7,512 | Pactiv Evergreen, Inc. | 60,096 | ||
| 3,076 | TriMas Corp. | 85,697 | ||
| 145,793 | ||||
| Diversified Consumer Services – 0.7% | ||||
| 157 | Graham Holdings Co., Class B | 93,547 | ||
| 1,213 | Strategic Education, Inc. | 108,964 | ||
| 202,511 | ||||
| Diversified REITs – 0.1% | ||||
| 1,005 | Star Holdings | 17,477 | ||
| Shares | Description | Value | ||
| Diversified Telecommunication Services – 0.5% | ||||
| 2,406 | Cogent Communications Holdings, Inc. | $153,310 | ||
| Electric Utilities – 0.6% | ||||
| 880 | MGE Energy, Inc. | 68,350 | ||
| 1,453 | Otter Tail Corp. | 105,008 | ||
| 173,358 | ||||
| Electrical Equipment – 1.0% | ||||
| 620 | Encore Wire Corp. | 114,905 | ||
| 1,156 | EnerSys | 100,433 | ||
| 11,225 | GrafTech International Ltd. | 54,553 | ||
| 269,891 | ||||
| Electronic Equipment, Instruments & Components – 5.6% | ||||
| 3,569 | Advanced Energy Industries, Inc. | 349,762 | ||
| 783 | Badger Meter, Inc. | 95,385 | ||
| 1,187 | Belden, Inc. | 102,996 | ||
| 7,765 | CTS Corp. | 384,057 | ||
| 6,899 | Methode Electronics, Inc. | 302,728 | ||
| 14,192 | Vishay Intertechnology, Inc. | 321,023 | ||
| 1,555,951 | ||||
| Energy Equipment & Services – 1.4% | ||||
| 12,511 | Archrock, Inc. | 122,232 | ||
| 2,235 | Cactus, Inc., Class A | 92,149 | ||
| 7,017 | Liberty Energy, Inc. | 89,888 | ||
| 12,637 | RPC, Inc. | 97,179 | ||
| 401,448 | ||||
| Entertainment – 0.5% | ||||
| 1,387 | World Wrestling Entertainment, Inc., Class A | 126,578 | ||
| Financial Services – 0.9% | ||||
| 2,752 | Compass Diversified Holdings | 52,508 | ||
| 2,635 | EVERTEC, Inc. | 88,931 | ||
| 1,442 | Jackson Financial, Inc., Class A | 53,945 | ||
| 885 | PennyMac Financial Services, Inc. | 52,755 | ||
| 248,139 | ||||
| Food Products – 1.7% | ||||
| 6,379 | B&G Foods, Inc. | 99,066 | ||
| 1,306 | Cal-Maine Foods, Inc. | 79,522 | ||
| 2,716 | Fresh Del Monte Produce, Inc. | 81,779 | ||
| 475 | J&J Snack Foods Corp. | 70,405 | ||
| 1,721 | Tootsie Roll Industries, Inc. | 77,290 | ||
| 4,485 | Utz Brands, Inc. | 73,868 | ||
| 481,930 | ||||
| Gas Utilities – 0.5% | ||||
| 524 | Chesapeake Utilities Corp. | 67,067 | ||
| Shares | Description | Value | ||
| COMMON STOCKS (Continued) | ||||
| Gas Utilities (Continued) | ||||
| 1,302 | Northwest Natural Holding Co. | $61,923 | ||
| 128,990 | ||||
| Ground Transportation – 1.7% | ||||
| 1,218 | ArcBest Corp. | 112,568 | ||
| 5,563 | Heartland Express, Inc. | 88,563 | ||
| 4,314 | Marten Transport Ltd. | 90,378 | ||
| 3,647 | Schneider National, Inc., Class B | 97,557 | ||
| 2,120 | Werner Enterprises, Inc. | 96,439 | ||
| 485,505 | ||||
| Health Care Equipment & Supplies – 8.5% | ||||
| 1,242 | Atrion Corp. | 779,864 | ||
| 7,841 | CONMED Corp. | 814,366 | ||
| 27,482 | Embecta Corp. | 772,794 | ||
| 2,367,024 | ||||
| Health Care Providers & Services – 5.4% | ||||
| 24,795 | Patterson Cos., Inc. | 663,762 | ||
| 8,577 | U.S. Physical Therapy, Inc. | 839,774 | ||
| 1,503,536 | ||||
| Health Care Technology – 1.3% | ||||
| 8,371 | Simulations Plus, Inc. | 367,822 | ||
| Hotels, Restaurants & Leisure – 2.9% | ||||
| 4,723 | Bloomin’ Brands, Inc. | 121,145 | ||
| 2,996 | Cheesecake Factory (The), Inc. | 105,010 | ||
| 1,003 | Cracker Barrel Old Country Store, Inc. | 113,941 | ||
| 1,471 | Dine Brands Global, Inc. | 99,498 | ||
| 1,393 | Jack in the Box, Inc. | 122,013 | ||
| 9,207 | Krispy Kreme, Inc. | 143,169 | ||
| 2,375 | Red Rock Resorts, Inc., Class A | 105,853 | ||
| 810,629 | ||||
| Household Durables – 2.1% | ||||
| 1,900 | Century Communities, Inc. | 121,448 | ||
| 997 | Installed Building Products, Inc. | 113,688 | ||
| 2,983 | KB Home | 119,857 | ||
| 4,164 | La-Z-Boy, Inc. | 121,089 | ||
| 3,007 | MDC Holdings, Inc. | 116,882 | ||
| 592,964 | ||||
| Household Products – 0.8% | ||||
| 2,120 | Energizer Holdings, Inc. | 73,564 | ||
| 1,168 | Spectrum Brands Holdings, Inc. | 77,345 | ||
| 441 | WD-40 Co. | 78,520 | ||
| 229,429 | ||||
| Insurance – 1.2% | ||||
| 2,195 | CNO Financial Group, Inc. | 48,707 | ||
| Shares | Description | Value | ||
| Insurance (Continued) | ||||
| 1,342 | Horace Mann Educators Corp. | $44,930 | ||
| 1,020 | Kemper Corp. | 55,753 | ||
| 1,467 | Mercury General Corp. | 46,563 | ||
| 2,871 | ProAssurance Corp. | 53,056 | ||
| 595 | Safety Insurance Group, Inc. | 44,339 | ||
| 1,174 | Stewart Information Services Corp. | 47,371 | ||
| 340,719 | ||||
| Interactive Media & Services – 1.5% | ||||
| 5,806 | Shutterstock, Inc. | 421,516 | ||
| Machinery – 5.7% | ||||
| 603 | Alamo Group, Inc. | 111,048 | ||
| 866 | Albany International Corp., Class A | 77,386 | ||
| 2,089 | Barnes Group, Inc. | 84,145 | ||
| 3,353 | Enerpac Tool Group Corp. | 85,501 | ||
| 785 | EnPro Industries, Inc. | 81,554 | ||
| 1,819 | Esab Corp. | 107,448 | ||
| 975 | ESCO Technologies, Inc. | 93,064 | ||
| 1,836 | Federal Signal Corp. | 99,529 | ||
| 1,567 | Helios Technologies, Inc. | 102,482 | ||
| 2,000 | Hillenbrand, Inc. | 95,060 | ||
| 480 | Kadant, Inc. | 100,090 | ||
| 3,547 | Kennametal, Inc. | 97,826 | ||
| 524 | Lindsay Corp. | 79,192 | ||
| 7,931 | Mueller Water Products, Inc., Class A | 110,558 | ||
| 1,386 | Tennant Co. | 94,983 | ||
| 1,997 | Terex Corp. | 96,615 | ||
| 2,886 | Trinity Industries, Inc. | 70,303 | ||
| 1,586,784 | ||||
| Media – 0.9% | ||||
| 8,491 | Gray Television, Inc. | 74,042 | ||
| 2,372 | John Wiley & Sons, Inc., Class A | 91,962 | ||
| 2,408 | Scholastic Corp. | 82,402 | ||
| 248,406 | ||||
| Metals & Mining – 2.2% | ||||
| 767 | Alpha Metallurgical Resources, Inc. | 119,652 | ||
| 1,446 | Carpenter Technology Corp. | 64,723 | ||
| 1,303 | Compass Minerals International, Inc. | 44,680 | ||
| 9,610 | Hecla Mining Co. | 60,831 | ||
| 703 | Kaiser Aluminum Corp. | 52,465 | ||
| 611 | Materion Corp. | 70,876 | ||
| 3,243 | Warrior Met Coal, Inc. | 119,050 | ||
| 1,075 | Worthington Industries, Inc. | 69,499 | ||
| 601,776 | ||||
| Shares | Description | Value | ||
| COMMON STOCKS (Continued) | ||||
| Mortgage Real Estate Investment Trusts – 0.1% | ||||
| 3,410 | Claros Mortgage Trust, Inc. | $39,727 | ||
| Multi-Utilities – 0.4% | ||||
| 1,398 | Avista Corp. | 59,345 | ||
| 1,044 | NorthWestern Corp. | 60,406 | ||
| 119,751 | ||||
| Oil, Gas & Consumable Fuels – 3.8% | ||||
| 787 | Arch Resources, Inc. | 103,459 | ||
| 1,728 | CONSOL Energy, Inc. | 100,691 | ||
| 3,585 | CVR Energy, Inc. | 117,516 | ||
| 4,161 | Delek US Holdings, Inc. | 95,495 | ||
| 16,768 | Equitrans Midstream Corp. | 96,919 | ||
| 2,305 | International Seaways, Inc. | 96,072 | ||
| 3,396 | Kinetik Holdings, Inc. | 106,295 | ||
| 3,645 | Northern Oil and Gas, Inc. | 110,626 | ||
| 11,952 | Permian Resources Corp. | 125,496 | ||
| 4,111 | World Fuel Services Corp. | 105,036 | ||
| 1,057,605 | ||||
| Paper & Forest Products – 0.2% | ||||
| 1,100 | Sylvamo Corp. | 50,886 | ||
| Personal Care Products – 1.3% | ||||
| 1,846 | Edgewell Personal Care Co. | 78,307 | ||
| 984 | Inter Parfums, Inc. | 139,964 | ||
| 617 | Medifast, Inc. | 63,965 | ||
| 1,687 | Nu Skin Enterprises, Inc., Class A | 66,316 | ||
| 348,552 | ||||
| Professional Services – 1.7% | ||||
| 5,352 | CSG Systems International, Inc. | 287,402 | ||
| 862 | ICF International, Inc. | 94,561 | ||
| 1,556 | Kforce, Inc. | 98,402 | ||
| 480,365 | ||||
| Real Estate Management & Development – 0.9% | ||||
| 3,764 | DigitalBridge Group, Inc. | 45,130 | ||
| 3,716 | eXp World Holdings, Inc. | 47,156 | ||
| 2,618 | Kennedy-Wilson Holdings, Inc. | 43,433 | ||
| 1,195 | Marcus & Millichap, Inc. | 38,371 | ||
| 5,167 | Newmark Group, Inc., Class A | 36,582 | ||
| 1,065 | St. Joe (The) Co. | 44,315 | ||
| 254,987 | ||||
| Software – 4.6% | ||||
| 32,290 | Adeia, Inc. | 286,090 | ||
| 2,776 | InterDigital, Inc. | 202,370 | ||
| 8,940 | Pegasystems, Inc. | 433,411 | ||
| 6,068 | Progress Software Corp. | 348,607 | ||
| 1,270,478 | ||||
| Shares | Description | Value | ||
| Specialty Retail – 2.9% | ||||
| 6,807 | American Eagle Outfitters, Inc. | $91,486 | ||
| 2,095 | Buckle (The), Inc. | 74,771 | ||
| 2,514 | Foot Locker, Inc. | 99,781 | ||
| 3,989 | Franchise Group, Inc. | 108,700 | ||
| 527 | Group 1 Automotive, Inc. | 119,323 | ||
| 2,102 | Monro, Inc. | 103,902 | ||
| 4,214 | Rent-A-Center, Inc. | 103,285 | ||
| 1,397 | Signet Jewelers Ltd. | 108,659 | ||
| 809,907 | ||||
| Technology Hardware, Storage & Peripherals – 1.2% | ||||
| 20,967 | Xerox Holdings Corp. | 322,892 | ||
| Textiles, Apparel & Luxury Goods – 2.4% | ||||
| 1,274 | Carter’s, Inc. | 91,626 | ||
| 2,376 | Kontoor Brands, Inc. | 114,974 | ||
| 6,122 | Levi Strauss & Co., Class A | 111,604 | ||
| 1,020 | Oxford Industries, Inc. | 107,702 | ||
| 2,973 | Steven Madden Ltd. | 107,028 | ||
| 8,693 | Wolverine World Wide, Inc. | 148,216 | ||
| 681,150 | ||||
| Tobacco – 0.5% | ||||
| 1,347 | Universal Corp. | 71,243 | ||
| 5,997 | Vector Group Ltd. | 72,024 | ||
| 143,267 | ||||
| Trading Companies & Distributors – 1.8% | ||||
| 778 | Boise Cascade Co. | 49,209 | ||
| 4,038 | Global Industrial Co. | 108,380 | ||
| 1,880 | H&E Equipment Services, Inc. | 83,152 | ||
| 864 | McGrath RentCorp | 80,620 | ||
| 1,817 | Rush Enterprises, Inc., Class A | 99,208 | ||
| 701 | Veritiv Corp | 94,733 | ||
| 515,302 | ||||
| Water Utilities – 0.9% | ||||
| 670 | American States Water Co. | 59,556 | ||
| 1,022 | California Water Service Group | 59,480 | ||
| 788 | Middlesex Water Co. | 61,559 | ||
| 763 | SJW Group | 58,087 | ||
| 238,682 | ||||
| Wireless Telecommunication Services – 0.5% | ||||
| 13,095 | Telephone and Data Systems, Inc. | 137,628 | ||
| Total Common Stocks | 25,737,129 | |||
| (Cost $25,426,169) | ||||
| REAL ESTATE INVESTMENT TRUSTS – 7.3% | ||||
| Diversified REITs – 0.7% | ||||
| 2,199 | Alexander & Baldwin, Inc. | 41,583 | ||
| Shares | Description | Value | ||
| REAL ESTATE INVESTMENT TRUSTS (Continued) | ||||
| Diversified REITs (Continued) | ||||
| 1,554 | American Assets Trust, Inc. | $28,889 | ||
| 6,110 | Empire State Realty Trust, Inc., Class A | 39,654 | ||
| 1,755 | Essential Properties Realty Trust, Inc. | 43,612 | ||
| 3,276 | Global Net Lease, Inc. | 42,129 | ||
| 195,867 | ||||
| Health Care REITs – 0.5% | ||||
| 2,216 | CareTrust REIT, Inc. | 43,389 | ||
| 1,159 | LTC Properties, Inc. | 40,716 | ||
| 789 | National Health Investors, Inc. | 40,697 | ||
| 124,802 | ||||
| Hotel & Resort REITs – 0.8% | ||||
| 5,028 | DiamondRock Hospitality Co. | 40,878 | ||
| 3,075 | Pebblebrook Hotel Trust | 43,173 | ||
| 3,888 | RLJ Lodging Trust | 41,213 | ||
| 4,263 | Sunstone Hotel Investors, Inc. | 42,118 | ||
| 3,124 | Xenia Hotels & Resorts, Inc. | 40,893 | ||
| 208,275 | ||||
| Industrial REITs – 0.3% | ||||
| 406 | Innovative Industrial Properties, Inc. | 30,852 | ||
| 4,110 | LXP Industrial Trust | 42,374 | ||
| 73,226 | ||||
| Mortgage Real Estate Investment Trusts – 1.8% | ||||
| 4,662 | Apollo Commercial Real Estate Finance, Inc. | 43,403 | ||
| 3,803 | Arbor Realty Trust, Inc. | 43,696 | ||
| 9,120 | Chimera Investment Corp. | 51,437 | ||
| 3,889 | Franklin BSP Realty Trust, Inc. | 46,396 | ||
| 1,421 | Hannon Armstrong Sustainable Infrastructure Capital, Inc. | 40,641 | ||
| 3,593 | KKR Real Estate Finance Trust, Inc. | 40,924 | ||
| 4,996 | Ladder Capital Corp. | 47,212 | ||
| 5,093 | MFA Financial, Inc. | 50,523 | ||
| 4,898 | New York Mortgage Trust, Inc. | 48,784 | ||
| 4,049 | PennyMac Mortgage Investment Trust | 49,924 | ||
| 3,181 | Two Harbors Investment Corp. | 46,793 | ||
| 509,733 | ||||
| Office REITs – 0.9% | ||||
| 6,696 | Brandywine Realty Trust | 31,672 | ||
| 1,587 | Corporate Office Properties Trust | 37,628 | ||
| 2,886 | Easterly Government Properties, Inc. | 39,654 | ||
| 4,232 | Hudson Pacific Properties, Inc. | 28,143 | ||
| 2,170 | JBG SMITH Properties | 32,680 | ||
| 6,932 | Paramount Group, Inc. | 31,610 | ||
| Shares | Description | Value | ||
| Office REITs (Continued) | ||||
| 4,491 | Piedmont Office Realty Trust, Inc., Class A | $32,784 | ||
| 1,221 | SL Green Realty Corp. | 28,718 | ||
| 262,889 | ||||
| Residential REITs – 0.4% | ||||
| 702 | Centerspace | 38,350 | ||
| 2,313 | Elme Communities | 41,310 | ||
| 946 | NexPoint Residential Trust, Inc. | 41,312 | ||
| 120,972 | ||||
| Retail REITs – 1.4% | ||||
| 2,870 | Acadia Realty Trust | 40,037 | ||
| 187 | Alexander’s, Inc. | 36,231 | ||
| 1,216 | Getty Realty Corp. | 43,813 | ||
| 1,740 | InvenTrust Properties Corp. | 40,716 | ||
| 3,657 | Macerich (The) Co. | 38,764 | ||
| 2,740 | Retail Opportunity Investments Corp. | 38,250 | ||
| 1,012 | Saul Centers, Inc. | 39,468 | ||
| 3,015 | SITE Centers Corp. | 37,024 | ||
| 2,295 | Tanger Factory Outlet Centers, Inc. | 45,051 | ||
| 2,923 | Urban Edge Properties | 44,020 | ||
| 403,374 | ||||
| Specialized REITs – 0.5% | ||||
| 1,588 | Four Corners Property Trust, Inc. | 42,654 | ||
| 2,484 | Outfront Media, Inc. | 40,315 | ||
| 1,051 | Safehold, Inc. | 30,868 | ||
| 7,446 | Uniti Group, Inc. | 26,433 | ||
| 140,270 | ||||
| Total Real Estate Investment Trusts | 2,039,408 | |||
| (Cost $2,639,506) | ||||
| COMMON STOCKS – BUSINESS DEVELOPMENT COMPANIES - 0.2% | ||||
| Capital Markets – 0.2% | ||||
| 3,812 | Golub Capital BDC, Inc. | 51,691 | ||
| (Cost $57,216) | ||||
| MONEY MARKET FUNDS – 0.1% | ||||
| 34,796 | Goldman Sachs Financial Square Treasury Obligations Fund - Institutional Class - 4.69% (b) (c) | 34,796 | ||
| (Cost $34,796) | ||||
| Principal Value | Description | Value | ||
| REPURCHASE AGREEMENTS – 0.0% | ||||
| $5,601 | BNP Paribas S.A., 4.74% (b), dated 3/31/23, due 4/3/23, with a maturity value of $5,602. Collateralized by U.S. Treasury Notes, interest rates of 1.50% to 2.13%, due 5/15/25 to 11/30/28. The value of the collateral including accrued interest is $5,731. (c) | $5,601 | ||
| (Cost $5,601) | ||||
| Total Investments – 99.9% | 27,868,625 | |||
| (Cost $28,163,288) | ||||
| Net Other Assets and Liabilities – 0.1% | 17,973 | |||
| Net Assets – 100.0% | $27,886,598 | |||
| (a) | All or a portion of this security is on loan (see Note 2E - Securities Lending in the Notes to Financial Statements). The remaining contractual maturity of all of the securities lending transactions is overnight and continuous. The aggregate value of such securities is $39,547 and the total value of the collateral held by the Fund is $40,397. |
| (b) | Rate shown reflects yield as of March 31, 2023. |
| (c) | This security serves as collateral for securities on loan. |
| Securities Lending Agency Agreement | |
| Total gross amount presented on the Statements of Assets and Liabilities (1) | $39,547 |
| Non-cash Collateral (2) | (39,547) |
| Net Amount | $— |
| (1) | The amount presented on the Statement of Assets and Liabilities, which is included in “Investments, at value,” is not offset and is shown on a gross basis. |
| (2) | At March 31, 2023, the value of collateral received from each borrower exceeded the value of the related securities loaned. This amount is disclosed on the Portfolio of Investments. |
| Repurchase Agreements | |
| Total gross amount presented on the Statements of Assets and Liabilities (3) | $5,601 |
| Non-cash Collateral (4) | (5,601) |
| Net Amount | $— |
| (3) | The amount is included in “Investments, at value” on the Statements of Assets and Liabilities. |
| (4) | At March 31, 2023, the value of the collateral received from each seller exceeded the value of the repurchase agreements. |
| Total Value at 3/31/2023 | Level 1 Quoted Prices | Level 2 Significant Observable Inputs | Level 3 Significant Unobservable Inputs | |
| Common Stocks* | $ 25,737,129 | $ 25,737,129 | $ — | $ — |
| Real Estate Investment Trusts* | 2,039,408 | 2,039,408 | — | — |
| Common Stocks - Business Development Companies* | 51,691 | 51,691 | — | — |
| Money Market Funds | 34,796 | 34,796 | — | — |
| Repurchase Agreements | 5,601 | — | 5,601 | — |
| Total Investments | $ 27,868,625 | $ 27,863,024 | $ 5,601 | $— |
| * | See Portfolio of Investments for industry breakout. |
| Shares | Description | Value | ||
| COMMON STOCKS – 96.9% | ||||
| Aerospace & Defense – 1.5% | ||||
| 372 | General Dynamics Corp. | $84,894 | ||
| 476 | L3Harris Technologies, Inc. | 93,410 | ||
| 222 | Lockheed Martin Corp. | 104,946 | ||
| 977 | Raytheon Technologies Corp. | 95,678 | ||
| 378,928 | ||||
| Air Freight & Logistics – 1.8% | ||||
| 1,243 | CH Robinson Worldwide, Inc. | 123,517 | ||
| 646 | FedEx Corp. | 147,604 | ||
| 928 | United Parcel Service, Inc., Class B | 180,023 | ||
| 451,144 | ||||
| Automobiles – 1.3% | ||||
| 25,424 | Ford Motor Co. | 320,342 | ||
| Banks – 3.7% | ||||
| 1,813 | Bank of America Corp. | 51,852 | ||
| 2,305 | Citigroup, Inc. | 108,081 | ||
| 2,416 | Citizens Financial Group, Inc. | 73,374 | ||
| 2,706 | Fifth Third Bancorp | 72,088 | ||
| 7,210 | Huntington Bancshares, Inc. | 80,752 | ||
| 515 | JPMorgan Chase & Co. | 67,110 | ||
| 6,018 | KeyCorp | 75,345 | ||
| 527 | M&T Bank Corp. | 63,013 | ||
| 533 | PNC Financial Services Group (The), Inc. | 67,744 | ||
| 3,680 | Regions Financial Corp. | 68,301 | ||
| 2,497 | Truist Financial Corp. | 85,148 | ||
| 2,285 | US Bancorp | 82,374 | ||
| 1,492 | Wells Fargo & Co. | 55,771 | ||
| 950,953 | ||||
| Beverages – 0.6% | ||||
| 985 | Coca-Cola (The) Co. | 61,099 | ||
| 1,357 | Keurig Dr. Pepper, Inc. | 47,875 | ||
| 313 | PepsiCo, Inc. | 57,060 | ||
| 166,034 | ||||
| Biotechnology – 4.9% | ||||
| 2,833 | AbbVie, Inc. | 451,495 | ||
| 1,476 | Amgen, Inc. | 356,823 | ||
| 5,199 | Gilead Sciences, Inc. | 431,361 | ||
| 1,239,679 | ||||
| Broadline Retail – 0.6% | ||||
| 3,350 | eBay, Inc. | 148,639 | ||
| Building Products – 0.8% | ||||
| 1,576 | Johnson Controls International PLC | 94,907 | ||
| 2,371 | Masco Corp. | 117,886 | ||
| 212,793 | ||||
| Shares | Description | Value | ||
| Capital Markets – 3.8% | ||||
| 1,584 | Bank of New York Mellon (The) Corp. | $71,977 | ||
| 90 | BlackRock, Inc. | 60,221 | ||
| 2,075 | Blackstone, Inc. | 182,268 | ||
| 3,181 | Carlyle Group (The), Inc. | 98,802 | ||
| 327 | CME Group, Inc. | 62,627 | ||
| 3,887 | Franklin Resources, Inc. | 104,716 | ||
| 177 | Goldman Sachs Group (The), Inc. | 57,899 | ||
| 943 | Morgan Stanley | 82,795 | ||
| 857 | Northern Trust Corp. | 75,527 | ||
| 922 | State Street Corp. | 69,786 | ||
| 933 | T. Rowe Price Group, Inc. | 105,336 | ||
| 971,954 | ||||
| Chemicals – 1.7% | ||||
| 64 | Air Products and Chemicals, Inc. | 18,381 | ||
| 246 | Celanese Corp. | 26,787 | ||
| 194 | CF Industries Holdings, Inc. | 14,063 | ||
| 1,030 | Dow, Inc. | 56,465 | ||
| 1,292 | DuPont de Nemours, Inc. | 92,727 | ||
| 434 | Eastman Chemical Co. | 36,603 | ||
| 130 | FMC Corp. | 15,877 | ||
| 273 | International Flavors & Fragrances, Inc. | 25,105 | ||
| 637 | LyondellBasell Industries N.V., Class A | 59,808 | ||
| 705 | PPG Industries, Inc. | 94,174 | ||
| 439,990 | ||||
| Communications Equipment – 0.5% | ||||
| 2,384 | Cisco Systems, Inc. | 124,624 | ||
| Consumer Finance – 1.1% | ||||
| 1,280 | Capital One Financial Corp. | 123,085 | ||
| 556 | Discover Financial Services | 54,955 | ||
| 3,842 | Synchrony Financial | 111,725 | ||
| 289,765 | ||||
| Consumer Staples Distribution & Retail – 1.6% | ||||
| 1,070 | Kroger (The) Co. | 52,826 | ||
| 743 | Sysco Corp. | 57,382 | ||
| 1,167 | Target Corp. | 193,290 | ||
| 3,106 | Walgreens Boots Alliance, Inc. | 107,405 | ||
| 410,903 | ||||
| Containers & Packaging – 0.9% | ||||
| 1,442 | International Paper Co. | 51,998 | ||
| 1,338 | Packaging Corp. of America | 185,755 | ||
| 237,753 | ||||
| Distributors – 1.0% | ||||
| 778 | Genuine Parts Co. | 130,167 | ||
| Shares | Description | Value | ||
| COMMON STOCKS (Continued) | ||||
| Distributors (Continued) | ||||
| 2,352 | LKQ Corp. | $133,500 | ||
| 263,667 | ||||
| Diversified Telecommunication Services – 1.9% | ||||
| 12,955 | AT&T, Inc. | 249,384 | ||
| 5,940 | Verizon Communications, Inc. | 231,006 | ||
| 480,390 | ||||
| Electric Utilities – 1.7% | ||||
| 584 | Alliant Energy Corp. | 31,186 | ||
| 364 | American Electric Power Co., Inc. | 33,120 | ||
| 391 | Duke Energy Corp. | 37,720 | ||
| 727 | Edison International | 51,319 | ||
| 336 | Entergy Corp. | 36,201 | ||
| 610 | Evergy, Inc. | 37,283 | ||
| 376 | Eversource Energy | 29,426 | ||
| 752 | Exelon Corp. | 31,501 | ||
| 920 | FirstEnergy Corp. | 36,855 | ||
| 253 | NextEra Energy, Inc. | 19,501 | ||
| 1,067 | PPL Corp. | 29,652 | ||
| 550 | Southern (The) Co. | 38,269 | ||
| 413 | Xcel Energy, Inc. | 27,853 | ||
| 439,886 | ||||
| Electrical Equipment – 1.1% | ||||
| 607 | Eaton Corp. PLC | 104,004 | ||
| 1,031 | Emerson Electric Co. | 89,841 | ||
| 316 | Rockwell Automation, Inc. | 92,730 | ||
| 286,575 | ||||
| Electronic Equipment, Instruments & Components – 2.9% | ||||
| 13,064 | Corning, Inc. | 460,898 | ||
| 2,041 | TE Connectivity Ltd. | 267,677 | ||
| 728,575 | ||||
| Energy Equipment & Services – 0.2% | ||||
| 1,480 | Baker Hughes Co. | 42,713 | ||
| Financial Services – 0.6% | ||||
| 908 | Apollo Global Management, Inc. | 57,349 | ||
| 1,883 | Fidelity National Information Services, Inc. | 102,304 | ||
| 159,653 | ||||
| Food Products – 2.6% | ||||
| 523 | Bunge Ltd. | 49,957 | ||
| 1,040 | Campbell Soup Co. | 57,179 | ||
| 1,942 | Conagra Brands, Inc. | 72,942 | ||
| 676 | General Mills, Inc. | 57,771 | ||
| 1,134 | Hormel Foods Corp. | 45,224 | ||
| 362 | J.M. Smucker (The) Co. | 56,968 | ||
| Shares | Description | Value | ||
| Food Products (Continued) | ||||
| 1,044 | Kellogg Co. | $69,906 | ||
| 2,185 | Kraft Heinz (The) Co. | 84,494 | ||
| 496 | McCormick & Co., Inc. | 41,272 | ||
| 749 | Mondelez International, Inc., Class A | 52,220 | ||
| 1,086 | Tyson Foods, Inc., Class A | 64,422 | ||
| 652,355 | ||||
| Gas Utilities – 0.1% | ||||
| 230 | Atmos Energy Corp. | 25,843 | ||
| Ground Transportation – 0.7% | ||||
| 377 | Norfolk Southern Corp. | 79,924 | ||
| 546 | Union Pacific Corp. | 109,888 | ||
| 189,812 | ||||
| Health Care Equipment & Supplies – 2.8% | ||||
| 5,809 | Baxter International, Inc. | 235,613 | ||
| 5,800 | Medtronic PLC | 467,596 | ||
| 703,209 | ||||
| Health Care Providers & Services – 1.5% | ||||
| 4,393 | Cardinal Health, Inc. | 331,671 | ||
| 574 | CVS Health Corp. | 42,654 | ||
| 374,325 | ||||
| Hotels, Restaurants & Leisure – 2.6% | ||||
| 1,581 | Darden Restaurants, Inc. | 245,308 | ||
| 534 | McDonald’s Corp. | 149,311 | ||
| 1,331 | Starbucks Corp. | 138,597 | ||
| 910 | Yum! Brands, Inc. | 120,193 | ||
| 653,409 | ||||
| Household Durables – 0.9% | ||||
| 2,198 | Garmin Ltd. | 221,822 | ||
| Household Products – 1.0% | ||||
| 538 | Clorox (The) Co. | 85,133 | ||
| 678 | Colgate-Palmolive Co. | 50,952 | ||
| 570 | Kimberly-Clark Corp. | 76,505 | ||
| 356 | Procter & Gamble (The) Co. | 52,934 | ||
| 265,524 | ||||
| Independent Power & Renewable Electricity Producers – 0.1% | ||||
| 795 | AES (The) Corp. | 19,144 | ||
| Industrial Conglomerates – 1.1% | ||||
| 1,910 | 3M Co. | 200,760 | ||
| 398 | Honeywell International, Inc. | 76,066 | ||
| 276,826 | ||||
| Shares | Description | Value | ||
| COMMON STOCKS (Continued) | ||||
| Insurance – 1.9% | ||||
| 715 | Aflac, Inc. | $46,132 | ||
| 428 | Allstate (The) Corp. | 47,427 | ||
| 740 | American International Group, Inc. | 37,266 | ||
| 609 | Cincinnati Financial Corp. | 68,257 | ||
| 635 | Hartford Financial Services Group (The), Inc. | 44,253 | ||
| 874 | MetLife, Inc. | 50,640 | ||
| 841 | Principal Financial Group, Inc. | 62,503 | ||
| 1,121 | Prudential Financial, Inc. | 92,751 | ||
| 241 | Travelers (The) Cos., Inc. | 41,310 | ||
| 490,539 | ||||
| IT Services – 3.1% | ||||
| 4,074 | Cognizant Technology Solutions Corp., Class A | 248,229 | ||
| 4,097 | International Business Machines Corp. | 537,075 | ||
| 785,304 | ||||
| Machinery – 2.4% | ||||
| 371 | Caterpillar, Inc. | 84,900 | ||
| 474 | Cummins, Inc. | 113,229 | ||
| 481 | Illinois Tool Works, Inc. | 117,099 | ||
| 273 | Parker-Hannifin Corp. | 91,758 | ||
| 2,597 | Stanley Black & Decker, Inc. | 209,266 | ||
| 616,252 | ||||
| Media – 3.3% | ||||
| 2,374 | Comcast Corp., Class A | 89,998 | ||
| 2,755 | Omnicom Group, Inc. | 259,907 | ||
| 22,055 | Paramount Global, Class B | 492,047 | ||
| 841,952 | ||||
| Metals & Mining – 0.2% | ||||
| 923 | Newmont Corp. | 45,245 | ||
| Multi-Utilities – 1.1% | ||||
| 309 | Ameren Corp. | 26,694 | ||
| 810 | CenterPoint Energy, Inc. | 23,863 | ||
| 475 | CMS Energy Corp. | 29,155 | ||
| 362 | Consolidated Edison, Inc. | 34,632 | ||
| 737 | Dominion Energy, Inc. | 41,206 | ||
| 272 | DTE Energy Co. | 29,795 | ||
| 597 | Public Service Enterprise Group, Inc. | 37,283 | ||
| 199 | Sempra Energy | 30,081 | ||
| 343 | WEC Energy Group, Inc. | 32,513 | ||
| 285,222 | ||||
| Oil, Gas & Consumable Fuels – 5.0% | ||||
| 311 | Chevron Corp. | 50,743 | ||
| 633 | ConocoPhillips | 62,800 | ||
| 5,975 | Coterra Energy, Inc. | 146,626 | ||
| Shares | Description | Value | ||
| Oil, Gas & Consumable Fuels (Continued) | ||||
| 2,416 | Devon Energy Corp. | $122,274 | ||
| 847 | Diamondback Energy, Inc. | 114,489 | ||
| 318 | EOG Resources, Inc. | 36,452 | ||
| 516 | Exxon Mobil Corp. | 56,585 | ||
| 5,963 | Kinder Morgan, Inc. | 104,412 | ||
| 325 | Marathon Petroleum Corp. | 43,820 | ||
| 1,532 | ONEOK, Inc. | 97,343 | ||
| 655 | Ovintiv, Inc. | 23,632 | ||
| 625 | Phillips 66 | 63,363 | ||
| 862 | Pioneer Natural Resources Co. | 176,055 | ||
| 460 | Targa Resources Corp. | 33,557 | ||
| 431 | Valero Energy Corp. | 60,168 | ||
| 2,777 | Williams (The) Cos., Inc. | 82,921 | ||
| 1,275,240 | ||||
| Pharmaceuticals – 5.1% | ||||
| 5,475 | Bristol-Myers Squibb Co. | 379,472 | ||
| 1,871 | Johnson & Johnson | 290,005 | ||
| 2,985 | Merck & Co., Inc. | 317,574 | ||
| 7,997 | Pfizer, Inc. | 326,278 | ||
| 1,313,329 | ||||
| Professional Services – 1.0% | ||||
| 353 | Automatic Data Processing, Inc. | 78,588 | ||
| 350 | Broadridge Financial Solutions, Inc. | 51,300 | ||
| 1,046 | Paychex, Inc. | 119,861 | ||
| 249,749 | ||||
| Semiconductors & Semiconductor Equipment – 11.9% | ||||
| 1,394 | Analog Devices, Inc. | 274,925 | ||
| 667 | Broadcom, Inc. | 427,907 | ||
| 25,792 | Intel Corp. | 842,625 | ||
| 1,670 | NXP Semiconductors N.V. | 311,413 | ||
| 2,991 | QUALCOMM, Inc. | 381,592 | ||
| 3,507 | Skyworks Solutions, Inc. | 413,756 | ||
| 2,120 | Texas Instruments, Inc. | 394,341 | ||
| 3,046,559 | ||||
| Software – 0.9% | ||||
| 13,435 | Gen Digital, Inc. | 230,545 | ||
| Specialty Retail – 2.2% | ||||
| 3,582 | Best Buy Co., Inc. | 280,363 | ||
| 499 | Home Depot (The), Inc. | 147,265 | ||
| 610 | Lowe’s Cos., Inc. | 121,982 | ||
| 549,610 | ||||
| Technology Hardware, Storage & Peripherals – 8.4% | ||||
| 23,254 | Hewlett Packard Enterprise Co. | 370,436 | ||
| 17,305 | HP, Inc. | 507,902 | ||
| 6,842 | NetApp, Inc. | 436,862 | ||
| Shares | Description | Value | ||
| COMMON STOCKS (Continued) | ||||
| Technology Hardware, Storage & Peripherals (Continued) | ||||
| 12,484 | Seagate Technology Holdings PLC | $825,442 | ||
| 2,140,642 | ||||
| Textiles, Apparel & Luxury Goods – 1.5% | ||||
| 17,260 | VF Corp. | 395,427 | ||
| Tobacco – 1.1% | ||||
| 3,986 | Altria Group, Inc. | 177,855 | ||
| 1,114 | Philip Morris International, Inc. | 108,337 | ||
| 286,192 | ||||
| Trading Companies & Distributors – 0.1% | ||||
| 520 | Fastenal Co. | 28,049 | ||
| Water Utilities – 0.1% | ||||
| 507 | Essential Utilities, Inc. | 22,131 | ||
| Total Common Stocks | 24,729,216 | |||
| (Cost $25,201,098) | ||||
| REAL ESTATE INVESTMENT TRUSTS – 2.8% | ||||
| Diversified REITs – 0.1% | ||||
| 428 | WP Carey, Inc. | 33,149 | ||
| Health Care REITs – 0.3% | ||||
| 1,181 | Healthpeak Properties, Inc. | 25,946 | ||
| 548 | Ventas, Inc. | 23,756 | ||
| 349 | Welltower, Inc. | 25,020 | ||
| 74,722 | ||||
| Hotel & Resort REITs – 0.1% | ||||
| 792 | Host Hotels & Resorts, Inc. | 13,060 | ||
| Industrial REITs – 0.1% | ||||
| 154 | Prologis, Inc. | 19,214 | ||
| Office REITs – 0.2% | ||||
| 137 | Alexandria Real Estate Equities, Inc. | 17,206 | ||
| 530 | Boston Properties, Inc. | 28,683 | ||
| 45,889 | ||||
| Residential REITs – 0.8% | ||||
| 490 | American Homes 4 Rent, Class A | 15,411 | ||
| 150 | AvalonBay Communities, Inc. | 25,209 | ||
| 185 | Camden Property Trust | 19,395 | ||
| 244 | Equity LifeStyle Properties, Inc. | 16,380 | ||
| 443 | Equity Residential | 26,580 | ||
| 121 | Essex Property Trust, Inc. | 25,306 | ||
| 619 | Invitation Homes, Inc. | 19,331 | ||
| 116 | Mid-America Apartment Communities, Inc. | 17,521 | ||
| Shares | Description | Value | ||
| Residential REITs (Continued) | ||||
| 106 | Sun Communities, Inc. | $14,933 | ||
| 619 | UDR, Inc. | 25,416 | ||
| 205,482 | ||||
| Retail REITs – 0.3% | ||||
| 1,158 | Kimco Realty Corp. | 22,616 | ||
| 454 | Realty Income Corp. | 28,747 | ||
| 309 | Simon Property Group, Inc. | 34,599 | ||
| 85,962 | ||||
| Specialized REITs – 0.9% | ||||
| 80 | American Tower Corp. | 16,347 | ||
| 200 | Crown Castle, Inc. | 26,768 | ||
| 299 | Digital Realty Trust, Inc. | 29,395 | ||
| 18 | Equinix, Inc. | 12,979 | ||
| 170 | Extra Space Storage, Inc. | 27,698 | ||
| 640 | Gaming and Leisure Properties, Inc. | 33,318 | ||
| 613 | Iron Mountain, Inc. | 32,434 | ||
| 62 | Public Storage | 18,733 | ||
| 884 | VICI Properties, Inc. | 28,836 | ||
| 464 | Weyerhaeuser Co. | 13,980 | ||
| 240,488 | ||||
| Total Real Estate Investment Trusts | 717,966 | |||
| (Cost $779,113) | ||||
| Total Investments – 99.7% | 25,447,182 | |||
| (Cost $25,980,211) | ||||
| Net Other Assets and Liabilities – 0.3% | 87,142 | |||
| Net Assets – 100.0% | $25,534,324 | |||
| Total Value at 3/31/2023 | Level 1 Quoted Prices | Level 2 Significant Observable Inputs | Level 3 Significant Unobservable Inputs | |
| Common Stocks* | $ 24,729,216 | $ 24,729,216 | $ — | $ — |
| Real Estate Investment Trusts* | 717,966 | 717,966 | — | — |
| Total Investments | $ 25,447,182 | $ 25,447,182 | $— | $— |
| * | See Portfolio of Investments for industry breakout. |
| Developed International Equity Select ETF (RNDM) | Emerging Markets Equity Select ETF (RNEM) | Large Cap US Equity Select ETF (RNLC) | |||
| ASSETS: | |||||
Investments, at value | $ 19,397,753 | $ 8,951,452 | $ 17,015,984 | ||
Cash | 53,138 | 26,720 | 13,568 | ||
Foreign currency | 16,445 | 1,354 | — | ||
| Receivables: | |||||
Dividends | 92,438 | 17,252 | 21,400 | ||
Dividend reclaims | 53,921 | 726 | 3,046 | ||
Securities lending income | 12 | — | — | ||
Miscellaneous | 331 | — | — | ||
Total Assets | 19,614,038 | 8,997,504 | 17,053,998 | ||
| LIABILITIES: | |||||
| Payables: | |||||
Investment advisory fees | 10,491 | 5,568 | 8,485 | ||
Collateral for securities on loan | — | — | — | ||
Deferred foreign capital gains tax | — | 36,217 | — | ||
Total Liabilities | 10,491 | 41,785 | 8,485 | ||
NET ASSETS | $19,603,547 | $8,955,719 | $17,045,513 | ||
| NET ASSETS consist of: | |||||
Paid-in capital | $ 22,657,485 | $ 10,563,616 | $ 18,929,172 | ||
Par value | 4,000 | 2,000 | 5,500 | ||
Accumulated distributable earnings (loss) | (3,057,938) | (1,609,897) | (1,889,159) | ||
NET ASSETS | $19,603,547 | $8,955,719 | $17,045,513 | ||
NET ASSET VALUE, per share | $49.01 | $44.78 | $30.99 | ||
Number of shares outstanding (unlimited number of shares authorized, par value $0.01 per share) | 400,002 | 200,002 | 550,002 | ||
Investments, at cost | $18,353,605 | $8,691,101 | $16,824,091 | ||
Foreign currency, at cost (proceeds) | $16,459 | $1,353 | $— | ||
Securities on loan, at value | $— | $— | $— |
| Mid Cap US Equity Select ETF (RNMC) | Small Cap US Equity Select ETF (RNSC) | US Equity Dividend Select ETF (RNDV) | ||
| $ 12,379,024 | $ 27,868,625 | $ 25,447,182 | ||
| 5,511 | 21,844 | 35,053 | ||
| — | — | — | ||
| 18,092 | 50,746 | 58,254 | ||
| 521 | — | 3,909 | ||
| — | 186 | — | ||
| — | — | — | ||
| 12,403,148 | 27,941,401 | 25,544,398 | ||
| 6,270 | 14,406 | 10,074 | ||
| — | 40,397 | — | ||
| — | — | — | ||
| 6,270 | 54,803 | 10,074 | ||
| $ 12,396,878 | $ 27,886,598 | $ 25,534,324 | ||
| $ 15,834,871 | $ 31,509,407 | $ 27,529,845 | ||
| 4,500 | 10,500 | 9,000 | ||
| (3,442,493) | (3,633,309) | (2,004,521) | ||
| $ 12,396,878 | $ 27,886,598 | $ 25,534,324 | ||
| $27.55 | $26.56 | $28.37 | ||
| 450,002 | 1,050,002 | 900,002 | ||
| $12,944,769 | $28,163,288 | $25,980,211 | ||
| $— | $— | $— | ||
| $— | $39,547 | $— |
| Developed International Equity Select ETF (RNDM) | Emerging Markets Equity Select ETF (RNEM) | Large Cap US Equity Select ETF (RNLC) | ||||
| INVESTMENT INCOME: | ||||||
Dividends | $ 714,761 | $ 432,981 | $ 430,135 | |||
Interest | 1,019 | 680 | 600 | |||
Securities lending income (net of fees) | 580 | — | — | |||
Foreign withholding tax | (70,230) | (63,821) | (619) | |||
Other | 103 | 6 | 21 | |||
Total investment income | 646,233 | 369,846 | 430,137 | |||
| EXPENSES: | ||||||
Investment advisory fees | 120,773 | 63,551 | 117,468 | |||
Total expenses | 120,773 | 63,551 | 117,468 | |||
NET INVESTMENT INCOME (LOSS) | 525,460 | 306,295 | 312,669 | |||
| NET REALIZED AND UNREALIZED GAIN (LOSS): | ||||||
| Net realized gain (loss) on: | ||||||
Investments | (1,806,910) | (721,088) | (466,587) | |||
In-kind redemptions | 128,841 | — | 1,032,727 | |||
Foreign currency transactions | (9,698) | 4,758 | — | |||
Foreign capital gains tax | — | (8,220) | — | |||
Net realized gain (loss) | (1,687,767) | (724,550) | 566,140 | |||
| Net change in unrealized appreciation (depreciation) on: | ||||||
Investments | 543,788 | 45,503 | (2,385,080) | |||
Foreign currency translation | (1,290) | 167 | — | |||
Deferred foreign capital gains tax | — | (14,656) | — | |||
Net change in unrealized appreciation (depreciation) | 542,498 | 31,014 | (2,385,080) | |||
NET REALIZED AND UNREALIZED GAIN (LOSS) | (1,145,269) | (693,536) | (1,818,940) | |||
NET INCREASE (DECREASE) IN NET ASSETS RESULTING FROM OPERATIONS | $(619,809) | $(387,241) | $(1,506,271) | |||
| Mid Cap US Equity Select ETF (RNMC) | Small Cap US Equity Select ETF (RNSC) | US Equity Dividend Select ETF (RNDV) | |||
| $367,764 | $714,391 | $712,007 | |||
| 585 | 1,139 | 936 | |||
| — | 3,830 | — | |||
| (88) | (356) | (729) | |||
| 85 | 44 | 9 | |||
| 368,346 | 719,048 | 712,223 | |||
| 95,812 | 153,050 | 101,764 | |||
| 95,812 | 153,050 | 101,764 | |||
| 272,534 | 565,998 | 610,459 | |||
| (975,284) | (2,304,105) | (322,868) | |||
| 1,653,605 | 1,435,864 | 56 | |||
| — | — | — | |||
| — | — | — | |||
| 678,321 | (868,241) | (322,812) | |||
| (1,588,315) | (1,064,889) | (1,049,183) | |||
| — | — | — | |||
| — | — | — | |||
| (1,588,315) | (1,064,889) | (1,049,183) | |||
| (909,994) | (1,933,130) | (1,371,995) | |||
| $(637,460) | $(1,367,132) | $(761,536) |
| Developed International Equity Select ETF (RNDM) | Emerging Markets Equity Select ETF (RNEM) | ||||||
| Year Ended 3/31/2023 | Year Ended 3/31/2022 | Year Ended 3/31/2023 | Year Ended 3/31/2022 | ||||
| OPERATIONS: | |||||||
Net investment income (loss) | $ 525,460 | $ 612,626 | $ 306,295 | $ 242,593 | |||
Net realized gain (loss) | (1,687,767) | 2,370,496 | (724,550) | 364,099 | |||
Net change in unrealized appreciation (depreciation) | 542,498 | (2,937,328) | 31,014 | (464,909) | |||
Net increase (decrease) in net assets resulting from operations | (619,809) | 45,794 | (387,241) | 141,783 | |||
| DISTRIBUTIONS TO SHAREHOLDERS FROM: | |||||||
Investment operations | (486,763) | (703,193) | (254,643) | (180,487) | |||
Return of capital | — | — | — | (49,961) | |||
Total distributions to shareholders | (486,763) | (703,193) | (254,643) | (230,448) | |||
| SHAREHOLDER TRANSACTIONS: | |||||||
Proceeds from shares sold | 4,346,583 | 5,595,303 | 2,305,295 | — | |||
Cost of shares redeemed | (7,143,304) | (5,356,575) | — | — | |||
Net increase (decrease) in net assets resulting from shareholder transactions | (2,796,721) | 238,728 | 2,305,295 | — | |||
Total increase (decrease) in net assets | (3,903,293) | (418,671) | 1,663,411 | (88,665) | |||
| NET ASSETS: | |||||||
Beginning of period | 23,506,840 | 23,925,511 | 7,292,308 | 7,380,973 | |||
End of period | $19,603,547 | $23,506,840 | $8,955,719 | $7,292,308 | |||
| CHANGES IN SHARES OUTSTANDING: | |||||||
Shares outstanding, beginning of period | 450,002 | 450,002 | 150,002 | 150,002 | |||
Shares sold | 100,000 | 100,000 | 50,000 | — | |||
Shares redeemed | (150,000) | (100,000) | — | — | |||
Shares outstanding, end of period | 400,002 | 450,002 | 200,002 | 150,002 | |||
| Large Cap US Equity Select ETF (RNLC) | Mid Cap US Equity Select ETF (RNMC) | Small Cap US Equity Select ETF (RNSC) | US Equity Dividend Select ETF (RNDV) | |||||||||||
| Year Ended 3/31/2023 | Year Ended 3/31/2022 | Year Ended 3/31/2023 | Year Ended 3/31/2022 | Year Ended 3/31/2023 | Year Ended 3/31/2022 | Year Ended 3/31/2023 | Year Ended 3/31/2022 | |||||||
| $ 312,669 | $ 322,827 | $ 272,534 | $ 241,500 | $ 565,998 | $ 274,780 | $ 610,459 | $ 374,454 | |||||||
| 566,140 | 6,041,882 | 678,321 | 3,693,023 | (868,241) | 2,198,102 | (322,812) | 1,755,695 | |||||||
| (2,385,080) | (3,315,959) | (1,588,315) | (2,661,207) | (1,064,889) | (1,832,012) | (1,049,183) | (644,056) | |||||||
| (1,506,271) | 3,048,750 | (637,460) | 1,273,316 | (1,367,132) | 640,870 | (761,536) | 1,486,093 | |||||||
| (305,626) | (328,071) | (277,601) | (244,191) | (545,516) | (261,631) | (571,256) | (359,126) | |||||||
| — | — | — | — | — | — | — | — | |||||||
| (305,626) | (328,071) | (277,601) | (244,191) | (545,516) | (261,631) | (571,256) | (359,126) | |||||||
| 3,125,444 | 11,195,391 | 5,684,608 | 13,029,289 | 16,257,937 | 18,629,899 | 8,576,223 | 19,135,641 | |||||||
| (5,945,869) | (17,927,661) | (8,543,272) | (14,535,290) | (8,184,037) | (7,148,164) | — | (10,393,637) | |||||||
| (2,820,425) | (6,732,270) | (2,858,664) | (1,506,001) | 8,073,900 | 11,481,735 | 8,576,223 | 8,742,004 | |||||||
| (4,632,322) | (4,011,591) | (3,773,725) | (476,876) | 6,161,252 | 11,860,974 | 7,243,431 | 9,868,971 | |||||||
| 21,677,835 | 25,689,426 | 16,170,603 | 16,647,479 | 21,725,346 | 9,864,372 | 18,290,893 | 8,421,922 | |||||||
| $17,045,513 | $21,677,835 | $12,396,878 | $16,170,603 | $27,886,598 | $21,725,346 | $25,534,324 | $18,290,893 | |||||||
| 650,002 | 850,002 | 550,002 | 600,002 | 750,002 | 350,002 | 600,002 | 300,002 | |||||||
| 100,000 | 350,000 | 200,000 | 450,000 | 600,000 | 650,000 | 300,000 | 650,000 | |||||||
| (200,000) | (550,000) | (300,000) | (500,000) | (300,000) | (250,000) | — | (350,000) | |||||||
| 550,002 | 650,002 | 450,002 | 550,002 | 1,050,002 | 750,002 | 900,002 | 600,002 | |||||||
| Year Ended March 31, | |||||||||
| 2023 | 2022 | 2021 | 2020 | 2019 | |||||
Net asset value, beginning of period | $ 52.24 | $ 53.17 | $ 39.88 | $ 49.45 | $ 51.38 | ||||
| Income from investment operations: | |||||||||
Net investment income (loss) | 1.33 | 1.24 | 0.90 | 1.11 | 1.07 | ||||
Net realized and unrealized gain (loss) | (3.34) | (0.73) | 13.01 | (9.02) | (1.90) | ||||
Total from investment operations | (2.01) | 0.51 | 13.91 | (7.91) | (0.83) | ||||
| Distributions paid to shareholders from: | |||||||||
Net investment income | (1.22) | (1.44) | (0.62) | (1.66) | (1.10) | ||||
Net asset value, end of period | $49.01 | $52.24 | $53.17 | $39.88 | $49.45 | ||||
Total return (a) | (3.60)% | 0.82% | 34.93% | (16.64)% | (1.71)% | ||||
| Ratios to average net assets/supplemental data: | |||||||||
Net assets, end of period (in 000’s) | $ 19,604 | $ 23,507 | $ 23,926 | $ 23,929 | $ 24,727 | ||||
Ratio of total expenses to average net assets | 0.65% | 0.65% | 0.65% | 0.65% | 0.65% | ||||
Ratio of net investment income (loss) to average net assets | 2.83% | 2.26% | 1.86% | 2.24% | 2.32% | ||||
Portfolio turnover rate (b) | 73% | 69% | 89% | 62% | 52% | ||||
| (a) | Total return is calculated assuming an initial investment made at the net asset value at the beginning of the period, reinvestment of all distributions at net asset value during the period, and redemption at net asset value on the last day of the period. The returns presented do not reflect the deduction of taxes that a shareholder would pay on Fund distributions or the redemption or sale of Fund shares. Total return is calculated for the time period presented and is not annualized for periods of less than a year. |
| (b) | Portfolio turnover is calculated for the time period presented and is not annualized for periods of less than a year and does not include securities received or delivered from processing creations or redemptions and in-kind transactions. |
| Year Ended March 31, | |||||||||
| 2023 | 2022 | 2021 | 2020 | 2019 | |||||
Net asset value, beginning of period | $ 48.61 | $ 49.21 | $ 37.80 | $ 50.89 | $ 54.94 | ||||
| Income from investment operations: | |||||||||
Net investment income (loss) | 1.57 | 1.61 | 1.15 | 1.50 | 1.10 | ||||
Net realized and unrealized gain (loss) | (4.13) | (0.67) | 11.64 | (13.22) | (3.62) | ||||
Total from investment operations | (2.56) | 0.94 | 12.79 | (11.72) | (2.52) | ||||
| Distributions paid to shareholders from: | |||||||||
Net investment income | (1.27) | (1.20) | (1.38) | (1.37) | (1.19) | ||||
Net realized gain | — | — | — | — | (0.34) | ||||
Return of capital | — | (0.34) | — | — | — | ||||
Total distributions | (1.27) | (1.54) | (1.38) | (1.37) | (1.53) | ||||
Net asset value, end of period | $44.78 | $48.61 | $49.21 | $37.80 | $50.89 | ||||
Total return (a) | (4.97)% | 1.91% | 34.44% | (23.66)% | (4.48)% | ||||
| Ratios to average net assets/supplemental data: | |||||||||
Net assets, end of period (in 000’s) | $ 8,956 | $ 7,292 | $ 7,381 | $ 7,561 | $ 12,723 | ||||
Ratio of total expenses to average net assets | 0.75% | 0.75% | 0.75% | 0.75% | 0.75% | ||||
Ratio of net investment income (loss) to average net assets | 3.61% | 3.30% | 2.94% | 2.83% | 2.04% | ||||
Portfolio turnover rate (b) | 65% | 72% | 75% | 82% | 69% | ||||
| (a) | Total return is calculated assuming an initial investment made at the net asset value at the beginning of the period, reinvestment of all distributions at net asset value during the period, and redemption at net asset value on the last day of the period. The returns presented do not reflect the deduction of taxes that a shareholder would pay on Fund distributions or the redemption or sale of Fund shares. Total return is calculated for the time period presented and is not annualized for periods of less than a year. |
| (b) | Portfolio turnover is calculated for the time period presented and is not annualized for periods of less than a year and does not include securities received or delivered from processing creations or redemptions and in-kind transactions. |
| Year Ended March 31, | |||||||||
| 2023 | 2022 | 2021 | 2020 | 2019 | |||||
Net asset value, beginning of period | $ 33.35 | $ 30.22 | $ 18.85 | $ 22.12 | $ 21.54 | ||||
| Income from investment operations: | |||||||||
Net investment income (loss) | 0.49 | 0.38 | 0.34 | 0.46 | 0.38 | ||||
Net realized and unrealized gain (loss) | (2.38) | 3.13 | 11.39 | (3.27) | 0.56 | ||||
Total from investment operations | (1.89) | 3.51 | 11.73 | (2.81) | 0.94 | ||||
| Distributions paid to shareholders from: | |||||||||
Net investment income | (0.47) | (0.38) | (0.36) | (0.46) | (0.36) | ||||
Net asset value, end of period | $30.99 | $33.35 | $30.22 | $18.85 | $22.12 | ||||
Total return (a) | (5.57)% | 11.62% | 62.65% | (12.98)% | 4.45% | ||||
| Ratios to average net assets/supplemental data: | |||||||||
Net assets, end of period (in 000’s) | $ 17,046 | $ 21,678 | $ 25,689 | $ 15,081 | $ 18,800 | ||||
Ratio of total expenses to average net assets | 0.60% | 0.60% | 0.60% | 0.60% | 0.60% | ||||
Ratio of net investment income (loss) to average net assets | 1.60% | 1.13% | 1.41% | 2.03% | 1.72% | ||||
Portfolio turnover rate (b) | 30% | 21% | 34% | 24% | 28% | ||||
| (a) | Total return is calculated assuming an initial investment made at the net asset value at the beginning of the period, reinvestment of all distributions at net asset value during the period, and redemption at net asset value on the last day of the period. The returns presented do not reflect the deduction of taxes that a shareholder would pay on Fund distributions or the redemption or sale of Fund shares. Total return is calculated for the time period presented and is not annualized for periods of less than a year. |
| (b) | Portfolio turnover is calculated for the time period presented and is not annualized for periods of less than a year and does not include securities received or delivered from processing creations or redemptions and in-kind transactions. |
| Year Ended March 31, | |||||||||
| 2023 | 2022 | 2021 | 2020 | 2019 | |||||
Net asset value, beginning of period | $ 29.40 | $ 27.75 | $ 15.85 | $ 21.31 | $ 21.18 | ||||
| Income from investment operations: | |||||||||
Net investment income (loss) | 0.49 | 0.35 | 0.33 | 0.39 | 0.32 | ||||
Net realized and unrealized gain (loss) | (1.84) | 1.65 | 11.90 | (5.45) | 0.12 | ||||
Total from investment operations | (1.35) | 2.00 | 12.23 | (5.06) | 0.44 | ||||
| Distributions paid to shareholders from: | |||||||||
Net investment income | (0.50) | (0.35) | (0.33) | (0.40) | (0.31) | ||||
Net asset value, end of period | $27.55 | $29.40 | $27.75 | $15.85 | $21.31 | ||||
Total return (a) | (4.47)% | 7.26% | 77.60% | (24.23)% | 2.16% | ||||
| Ratios to average net assets/supplemental data: | |||||||||
Net assets, end of period (in 000’s) | $ 12,397 | $ 16,171 | $ 16,647 | $ 11,096 | $ 13,853 | ||||
Ratio of total expenses to average net assets | 0.60% | 0.60% | 0.60% | 0.60% | 0.60% | ||||
Ratio of net investment income (loss) to average net assets | 1.71% | 1.22% | 1.46% | 1.76% | 1.70% | ||||
Portfolio turnover rate (b) | 51% | 43% | 60% | 43% | 42% | ||||
| (a) | Total return is calculated assuming an initial investment made at the net asset value at the beginning of the period, reinvestment of all distributions at net asset value during the period, and redemption at net asset value on the last day of the period. The returns presented do not reflect the deduction of taxes that a shareholder would pay on Fund distributions or the redemption or sale of Fund shares. Total return is calculated for the time period presented and is not annualized for periods of less than a year. |
| (b) | Portfolio turnover is calculated for the time period presented and is not annualized for periods of less than a year and does not include securities received or delivered from processing creations or redemptions and in-kind transactions. |
| Year Ended March 31, | |||||||||
| 2023 | 2022 | 2021 | 2020 | 2019 | |||||
Net asset value, beginning of period | $ 28.97 | $ 28.18 | $ 14.87 | $ 20.84 | $ 20.88 | ||||
| Income from investment operations: | |||||||||
Net investment income (loss) | 0.56 | 0.46 | 0.28 | 0.36 | 0.46 | ||||
Net realized and unrealized gain (loss) | (2.42) | 0.78 | 13.34 | (5.98) | (0.09) | ||||
Total from investment operations | (1.86) | 1.24 | 13.62 | (5.62) | 0.37 | ||||
| Distributions paid to shareholders from: | |||||||||
Net investment income | (0.55) | (0.45) | (0.31) | (0.35) | (0.41) | ||||
Net asset value, end of period | $26.56 | $28.97 | $28.18 | $14.87 | $20.84 | ||||
Total return (a) | (6.28)% | 4.39% | 92.49% | (27.51)% | 1.78% | ||||
| Ratios to average net assets/supplemental data: | |||||||||
Net assets, end of period (in 000’s) | $ 27,887 | $ 21,725 | $ 9,864 | $ 5,946 | $ 5,210 | ||||
Ratio of total expenses to average net assets | 0.60% | 0.60% | 0.60% | 0.60% | 0.60% | ||||
Ratio of net investment income (loss) to average net assets | 2.22% | 1.79% | 1.37% | 1.97% | 2.25% | ||||
Portfolio turnover rate (b) | 72% | 49% | 71% | 52% | 52% | ||||
| (a) | Total return is calculated assuming an initial investment made at the net asset value at the beginning of the period, reinvestment of all distributions at net asset value during the period, and redemption at net asset value on the last day of the period. The returns presented do not reflect the deduction of taxes that a shareholder would pay on Fund distributions or the redemption or sale of Fund shares. Total return is calculated for the time period presented and is not annualized for periods of less than a year. |
| (b) | Portfolio turnover is calculated for the time period presented and is not annualized for periods of less than a year and does not include securities received or delivered from processing creations or redemptions and in-kind transactions. |
| Year Ended March 31, | |||||||||
| 2023 | 2022 | 2021 | 2020 | 2019 | |||||
Net asset value, beginning of period | $ 30.48 | $ 28.07 | $ 17.50 | $ 21.73 | $ 21.09 | ||||
| Income from investment operations: | |||||||||
Net investment income (loss) | 0.79 | 0.64 | 0.58 | 0.73 | 0.78 | ||||
Net realized and unrealized gain (loss) | (2.14) | 2.40 | 10.61 | (4.24) | 0.58 | ||||
Total from investment operations | (1.35) | 3.04 | 11.19 | (3.51) | 1.36 | ||||
| Distributions paid to shareholders from: | |||||||||
Net investment income | (0.76) | (0.63) | (0.62) | (0.72) | (0.72) | ||||
Net asset value, end of period | $28.37 | $30.48 | $28.07 | $17.50 | $21.73 | ||||
Total return (a) | (4.28)% | 10.86% | 64.82% | (16.81)% | 6.64% | ||||
| Ratios to average net assets/supplemental data: | |||||||||
Net assets, end of period (in 000’s) | $ 25,534 | $ 18,291 | $ 8,422 | $ 4,375 | $ 5,434 | ||||
Ratio of total expenses to average net assets | 0.50% | 0.50% | 0.50% | 0.50% | 0.50% | ||||
Ratio of net investment income (loss) to average net assets | 3.00% | 2.33% | 2.65% | 3.23% | 2.98% | ||||
Portfolio turnover rate (b) | 52% | 41% | 89% | 78% | 98% | ||||
| (a) | Total return is calculated assuming an initial investment made at the net asset value at the beginning of the period, reinvestment of all distributions at net asset value during the period, and redemption at net asset value on the last day of the period. The returns presented do not reflect the deduction of taxes that a shareholder would pay on Fund distributions or the redemption or sale of Fund shares. Total return is calculated for the time period presented and is not annualized for periods of less than a year. |
| (b) | Portfolio turnover is calculated for the time period presented and is not annualized for periods of less than a year and does not include securities received or delivered from processing creations or redemptions and in-kind transactions. |
| Fund | Index |
| Developed International Equity Select ETF Emerging Markets Equity Select ETF Large Cap US Equity Select ETF Mid Cap US Equity Select ETF Small Cap US Equity Select ETF US Equity Dividend Select ETF | Nasdaq Riskalyze Developed MarketsTM Index Nasdaq Riskalyze Emerging MarketsTM Index Nasdaq Riskalyze US Large CapTM Index Nasdaq Riskalyze US Mid CapTM Index Nasdaq Riskalyze US Small CapTM Index Nasdaq Riskalyze US Large Cap Select DividendTM Index |
| 1) | the last sale price on the exchange on which they are principally traded or, for Nasdaq and AIM securities, the official closing price; |
| 2) | the type of security; |
| 3) | the size of the holding; |
| 4) | the initial cost of the security; |
| 5) | transactions in comparable securities; |
| 6) | price quotes from dealers and/or third-party pricing services; |
| 7) | relationships among various securities; |
| 8) | information obtained by contacting the issuer, analysts, or the appropriate stock exchange; |
| 9) | an analysis of the issuer’s financial statements; |
| 10) | the existence of merger proposals or tender offers that might affect the value of the security; and |
| 11) | other relevant factors. |
| 1) | the value of similar foreign securities traded on other foreign markets; |
| 2) | ADR trading of similar securities; |
| 3) | closed-end fund or exchange-traded fund trading of similar securities; |
| 4) | foreign currency exchange activity; |
| 5) | the trading prices of financial products that are tied to baskets of foreign securities; |
| 6) | factors relating to the event that precipitated the pricing problem; |
| 7) | whether the event is likely to recur; |
| 8) | whether the effects of the event are isolated or whether they affect entire markets, countries or regions; and |
| 9) | other relevant factors. |
| • | Level 1 – Level 1 inputs are quoted prices in active markets for identical investments. An active market is a market in which transactions for the investment occur with sufficient frequency and volume to provide pricing information on an ongoing basis. |
| • | Level 2 – Level 2 inputs are observable inputs, either directly or indirectly, and include the following: |
| o | Quoted prices for similar investments in active markets. |
| o | Quoted prices for identical or similar investments in markets that are non-active. A non-active market is a market where there are few transactions for the investment, the prices are not current, or price quotations vary substantially either over time or among market makers, or in which little information is released publicly. |
| o | Inputs other than quoted prices that are observable for the investment (for example, interest rates and yield curves observable at commonly quoted intervals, volatilities, prepayment speeds, loss severities, credit risks, and default rates). |
| o | Inputs that are derived principally from or corroborated by observable market data by correlation or other means. |
| • | Level 3 – Level 3 inputs are unobservable inputs. Unobservable inputs may reflect the reporting entity’s own assumptions about the assumptions that market participants would use in pricing the investment. |
| Distributions paid from Ordinary Income | Distributions paid from Capital Gains | Distributions paid from Return of Capital | |||
Developed International Equity Select ETF | $ 486,763 | $ — | $ — | ||
Emerging Markets Equity Select ETF | 254,643 | — | — | ||
Large Cap US Equity Select ETF | 305,626 | — | — | ||
Mid Cap US Equity Select ETF | 277,601 | — | — | ||
Small Cap US Equity Select ETF | 545,516 | — | — | ||
US Equity Dividend Select ETF | 571,256 | — | — |
| Distributions paid from Ordinary Income | Distributions paid from Capital Gains | Distributions paid from Return of Capital | |||
Developed International Equity Select ETF | $ 703,193 | $ — | $ — | ||
Emerging Markets Equity Select ETF | 180,487 | — | 49,961 | ||
Large Cap US Equity Select ETF | 328,071 | — | — | ||
Mid Cap US Equity Select ETF | 244,191 | — | — | ||
Small Cap US Equity Select ETF | 261,631 | — | — | ||
US Equity Dividend Select ETF | 359,126 | — | — |
| Undistributed Ordinary Income | Accumulated Capital and Other Gain (Loss) | Net Unrealized Appreciation (Depreciation) | |||
Developed International Equity Select ETF | $ 105,700 | $ (4,165,895) | $ 1,002,257 | ||
Emerging Markets Equity Select ETF | 32,465 | (1,750,106) | 107,744 | ||
Large Cap US Equity Select ETF | 19,487 | (1,989,412) | 80,766 | ||
Mid Cap US Equity Select ETF | 7,814 | (2,665,399) | (784,908) | ||
Small Cap US Equity Select ETF | 37,020 | (2,797,779) | (872,550) | ||
US Equity Dividend Select ETF | 63,315 | (1,226,146) | (841,690) |
| Non-Expiring Capital Loss Carryforward | |
Developed International Equity Select ETF | $ 4,165,895 |
Emerging Markets Equity Select ETF | 1,750,106 |
Large Cap US Equity Select ETF | 1,989,412 |
Mid Cap US Equity Select ETF | 2,665,399 |
Small Cap US Equity Select ETF | 2,797,779 |
US Equity Dividend Select ETF | 1,226,146 |
| Accumulated Net Investment Income (Loss) | Accumulated Net Realized Gain (Loss) on Investments | Paid-in Capital | |||
Developed International Equity Select ETF | $ 8,147 | $ (101,524) | $ 93,377 | ||
Emerging Markets Equity Select ETF | (3,456) | 3,456 | — | ||
Large Cap US Equity Select ETF | — | (992,769) | 992,769 | ||
Mid Cap US Equity Select ETF | 753 | (1,541,392) | 1,540,639 | ||
Small Cap US Equity Select ETF | — | (1,164,877) | 1,164,877 | ||
US Equity Dividend Select ETF | — | (56) | 56 |
| Tax Cost | Gross Unrealized Appreciation | Gross Unrealized (Depreciation) | Net Unrealized Appreciation (Depreciation) | ||||
Developed International Equity Select ETF | $ 18,394,837 | $ 2,033,851 | $ (1,030,935) | $ 1,002,916 | |||
Emerging Markets Equity Select ETF | 8,807,805 | 1,023,237 | (879,590) | 143,647 | |||
Large Cap US Equity Select ETF | 16,935,218 | 1,621,288 | (1,540,522) | 80,766 | |||
Mid Cap US Equity Select ETF | 13,163,932 | 971,394 | (1,756,302) | (784,908) | |||
Small Cap US Equity Select ETF | 28,741,175 | 2,086,217 | (2,958,767) | (872,550) | |||
US Equity Dividend Select ETF | 26,288,872 | 1,243,556 | (2,085,246) | (841,690) |
| Breakpoints | RNDM | RNEM |
| Fund net assets up to and including $2.5 billion | 0.65000% | 0.75000% |
| Fund net assets greater than $2.5 billion up to and including $5 billion | 0.63375% | 0.73125% |
| Fund net assets greater than $5 billion up to and including $7.5 billion | 0.61750% | 0.71250% |
| Fund net assets greater than $7.5 billion up to and including $10 billion | 0.60125% | 0.69375% |
| Fund net assets greater than $10 billion | 0.58500% | 0.67500% |
| Breakpoints | RNLC | RNMC | RNSC | RNDV |
| Fund net assets up to and including $2.5 billion | 0.600% | 0.600% | 0.600% | 0.5000% |
| Fund net assets greater than $2.5 billion up to and including $5 billion | 0.585% | 0.585% | 0.585% | 0.4875% |
| Fund net assets greater than $5 billion up to and including $7.5 billion | 0.570% | 0.570% | 0.570% | 0.4750% |
| Fund net assets greater than $7.5 billion up to and including $10 billion | 0.555% | 0.555% | 0.555% | 0.4625% |
| Fund net assets greater than $10 billion up to and including $15 billion | 0.540% | 0.540% | 0.540% | 0.4500% |
| Fund net assets greater than $15 billion | 0.510% | 0.510% | 0.510% | 0.4250% |
| Developed International Equity Select ETF | 0.65% |
| Emerging Markets Equity Select ETF | 0.75% |
| Large Cap US Equity Select ETF | 0.60% |
| Mid Cap US Equity Select ETF | 0.60% |
| Small Cap US Equity Select ETF | 0.60% |
| US Equity Dividend Select ETF | 0.50% |
| Purchases | Sales | ||
| Developed International Equity Select ETF | $ 13,592,378 | $ 13,598,041 | |
| Emerging Markets Equity Select ETF | 7,329,360 | 5,412,565 | |
| Large Cap US Equity Select ETF | 5,947,051 | 5,948,037 | |
| Mid Cap US Equity Select ETF | 8,031,405 | 8,003,313 | |
| Small Cap US Equity Select ETF | 18,203,839 | 18,044,498 | |
| US Equity Dividend Select ETF | 10,622,529 | 10,574,808 | |
| Purchases | Sales | ||
| Developed International Equity Select ETF | $ 3,977,903 | $ 6,742,375 | |
| Emerging Markets Equity Select ETF | 462,995 | — | |
| Large Cap US Equity Select ETF | 3,120,346 | 5,929,031 | |
| Mid Cap US Equity Select ETF | 5,678,930 | 8,527,661 | |
| Small Cap US Equity Select ETF | 16,189,913 | 8,171,684 | |
| US Equity Dividend Select ETF | 8,535,600 | — |

| Dividends Received Deduction | |
Developed International Equity Select ETF | 0.00% |
Emerging Markets Equity Select ETF | 0.00% |
Large Cap US Equity Select ETF | 100.00% |
Mid Cap US Equity Select ETF | 100.00% |
Small Cap US Equity Select ETF | 100.00% |
US Equity Dividend Select ETF | 100.00% |
| Qualified Dividend Income | |
Developed International Equity Select ETF | 100.00% |
Emerging Markets Equity Select ETF | 59.84% |
Large Cap US Equity Select ETF | 100.00% |
Mid Cap US Equity Select ETF | 100.00% |
Small Cap US Equity Select ETF | 100.00% |
US Equity Dividend Select ETF | 100.00% |
| Gross Foreign Income | Foreign Taxes Paid | ||||||
| Amount | Per Share | Amount | Per Share | ||||
Developed International Equity Select ETF | $707,408 | $1.77 | $69,016 | $0.17 | |||
Emerging Markets Equity Select ETF | $432,334 | $2.16 | $71,766 | $0.36 | |||
| NOT FDIC INSURED | NOT BANK GUARANTEED | MAY LOSE VALUE |
Mid Cap US Equity Select ETF (RNMC)
Small Cap US Equity Select ETF (RNSC)
US Equity Dividend Select ETF (RNDV)
| Name, Year of Birth and Position with the Trust | Term of Office and Year First Elected or Appointed | Principal Occupations During Past 5 Years | Number of Portfolios in the First Trust Fund Complex Overseen by Trustee | Other Trusteeships or Directorships Held by Trustee During Past 5 Years |
| INDEPENDENT TRUSTEES | ||||
| Richard E. Erickson, Trustee (1951) | • Indefinite Term • Since Inception | Physician, Edward-Elmhurst Medical Group; Physician and Officer, Wheaton Orthopedics (1990 to 2021) | 228 | None |
| Thomas R. Kadlec, Trustee (1957) | • Indefinite Term • Since Inception | Retired; President, ADM Investor Services, Inc. (Futures Commission Merchant) (2010 to July 2022) | 228 | Director, National Futures Association and ADMIS Singapore Ltd.; Formerly, Director of ADM Investor Services, Inc., ADM Investor Services International, ADMIS Hong Kong Ltd., and Futures Industry Association |
| Denise M. Keefe, Trustee (1964) | • Indefinite Term • Since 2021 | Executive Vice President, Advocate Aurora Health and President, Advocate Aurora Continuing Health Division (Integrated Healthcare System) | 228 | Director and Board Chair of Advocate Home Health Services, Advocate Home Care Products and Advocate Hospice; Director and Board Chair of Aurora At Home (since 2018); Director of Advocate Physician Partners Accountable Care Organization; Director and Board Chair of RML Long Term Acute Care Hospitals; and Director of Senior Helpers (since 2021) |
| Robert F. Keith, Trustee (1956) | • Indefinite Term • Since Inception | President, Hibs Enterprises (Financial and Management Consulting) | 228 | Formerly, Director of Trust Company of Illinois |
| Niel B. Nielson, Trustee (1954) | • Indefinite Term • Since Inception | Senior Advisor (2018 to Present), Managing Director and Chief Operating Officer (2015 to 2018), Pelita Harapan Educational Foundation (Educational Products and Services) | 228 | None |
| INTERESTED TRUSTEE | ||||
| James A. Bowen(1), Trustee and Chairman of the Board (1955) | • Indefinite Term • Since Inception | Chief Executive Officer, First Trust Advisors L.P. and First Trust Portfolios L.P.; Chairman of the Board of Directors, BondWave LLC (Software Development Company) and Stonebridge Advisors LLC (Investment Advisor) | 228 | None |
| (1) | Mr. Bowen is deemed an “interested person” of the Trust due to his position as CEO of First Trust Advisors L.P., investment advisor of the Trust. |
| Name and Year of Birth | Position and Offices with Trust | Term of Office and Length of Service | Principal Occupations During Past 5 Years |
| OFFICERS(2) | |||
| James M. Dykas (1966) | President and Chief Executive Officer | • Indefinite Term • Since 2016 | Managing Director and Chief Financial Officer, First Trust Advisors L.P. and First Trust Portfolios L.P.; Chief Financial Officer, BondWave LLC (Software Development Company) and Stonebridge Advisors LLC (Investment Advisor) |
| Donald P. Swade (1972) | Treasurer, Chief Financial Officer and Chief Accounting Officer | • Indefinite Term • Since 2016 | Senior Vice President, First Trust Advisors L.P. and First Trust Portfolios L.P. |
| W. Scott Jardine (1960) | Secretary and Chief Legal Officer | • Indefinite Term • Since Inception | General Counsel, First Trust Advisors L.P. and First Trust Portfolios L.P.; Secretary and General Counsel, BondWave LLC; Secretary, Stonebridge Advisors LLC |
| Daniel J. Lindquist (1970) | Vice President | • Indefinite Term • Since Inception | Managing Director, First Trust Advisors L.P. and First Trust Portfolios L.P. |
| Kristi A. Maher (1966) | Chief Compliance Officer and Assistant Secretary | • Indefinite Term • Since Inception | Deputy General Counsel, First Trust Advisors L.P. and First Trust Portfolios L.P. |
| Roger F. Testin (1966) | Vice President | • Indefinite Term • Since Inception | Senior Vice President, First Trust Advisors L.P. and First Trust Portfolios L.P. |
| Stan Ueland (1970) | Vice President | • Indefinite Term • Since Inception | Senior Vice President, First Trust Advisors L.P. and First Trust Portfolios L.P. |
| (2) | The term “officer” means the president, vice president, secretary, treasurer, controller or any other officer who performs a policy making function. |
| • | Information we receive from you and your broker-dealer, investment professional or financial representative through interviews, applications, agreements or other forms; |
| • | Information about your transactions with us, our affiliates or others; |
| • | Information we receive from your inquiries by mail, e-mail or telephone; and |
| • | Information we collect on our website through the use of “cookies.” For example, we may identify the pages on our website that your browser requests or visits. |
| • | In order to provide you with products and services and to effect transactions that you request or authorize, we may disclose your personal information as described above to unaffiliated financial service providers and other companies that perform administrative or other services on our behalf, such as transfer agents, custodians and trustees, or that assist us in the distribution of investor materials such as trustees, banks, financial representatives, proxy services, solicitors and printers. |
| • | We may release information we have about you if you direct us to do so, if we are compelled by law to do so, or in other legally limited circumstances (for example to protect your account from fraud). |
FUND ACCOUNTANT &
TRANSFER AGENT
PUBLIC ACCOUNTING FIRM

First Trust Indxx Medical Devices ETF (MDEV)
For the Year Ended
March 31, 2023
| 1 | |
| 2 | |
| 3 | |
| 5 | |
| 6 | |
| 8 | |
| 9 | |
| 10 | |
| 11 | |
| 12 | |
| 18 | |
| 19 | |
| 24 | |
| 26 |


| Performance | |||
| Average Annual Total Returns | Cumulative Total Returns | ||
| 1 Year Ended 3/31/23 | Inception (6/22/21) to 3/31/23 | Inception (6/22/21) to 3/31/23 | |
| Fund Performance | |||
| NAV | -9.05% | -11.20% | -18.99% |
| Market Price | -9.27% | -11.25% | -19.07% |
| Index Performance | |||
| Indxx Global Medical Equipment Index | -8.98% | -10.71% | -18.19% |
| MSCI World Health Care Index | -3.69% | 1.10% | 1.95% |
| Sector Allocation | % of Total Investments |
| Health Care | 100.0% |
| Total | 100.0% |
| Top Ten Holdings | % of Total Investments |
| Exact Sciences Corp. | 3.7% |
| Align Technology, Inc. | 2.7 |
| Fisher & Paykel Healthcare Corp., Ltd. | 2.6 |
| Straumann Holding AG | 2.6 |
| Cooper (The) Cos., Inc. | 2.5 |
| Insulet Corp. | 2.4 |
| Amplifon S.p.A. | 2.4 |
| Koninklijke Philips N.V. | 2.3 |
| West Pharmaceutical Services, Inc. | 2.3 |
| Intuitive Surgical, Inc. | 2.3 |
| Total | 25.8% |
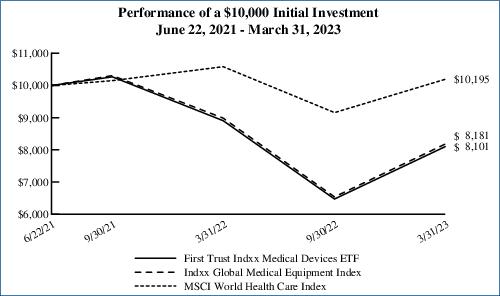
Performance figures assume reinvestment of all distributions and do not reflect the deduction of taxes that a shareholder would pay on Fund distributions or the redemption or sale of Fund shares. An index is a statistical composite that tracks a specified financial market or sector. Unlike the Fund, the indices do not actually hold a portfolio of securities and therefore do not incur the expenses incurred by the Fund. These expenses negatively impact the performance of the Fund. The Fund’s past performance does not predict future performance.
| Beginning Account Value October 1, 2022 | Ending Account Value March 31, 2023 | Annualized Expense Ratio Based on the Six-Month Period | Expenses Paid During the Six-Month Period (a) | |
| First Trust Indxx Medical Devices ETF (MDEV) | ||||
| Actual | $1,000.00 | $1,251.70 | 0.70% | $3.93 |
| Hypothetical (5% return before expenses) | $1,000.00 | $1,021.44 | 0.70% | $3.53 |
| (a) | Expenses are equal to the annualized expense ratios as indicated in the table multiplied by the average account value over the period (October 1, 2022 through March 31, 2023), multiplied by 182/365 (to reflect the six-month period). |
| Shares | Description | Value | ||
| COMMON STOCKS – 99.7% | ||||
| Biotechnology – 3.7% | ||||
| 1,104 | Exact Sciences Corp. (a) | $74,862 | ||
| Health Care Equipment & Supplies – 74.6% | ||||
| 332 | Abbott Laboratories | 33,618 | ||
| 574 | Alcon, Inc. (b) | 40,747 | ||
| 166 | Align Technology, Inc. (a) | 55,467 | ||
| 615 | Baxter International, Inc. | 24,944 | ||
| 149 | Becton Dickinson and Co. | 36,883 | ||
| 419 | BioMerieux (b) | 44,169 | ||
| 838 | Boston Scientific Corp. (a) | 41,925 | ||
| 296 | Carl Zeiss Meditec AG (b) | 41,230 | ||
| 274 | Cochlear Ltd. (b) | 43,621 | ||
| 328 | Coloplast A.S., Class B (b) | 43,187 | ||
| 135 | Cooper (The) Cos., Inc. | 50,404 | ||
| 1,263 | Demant A.S. (a) (b) | 44,339 | ||
| 1,177 | DENTSPLY SIRONA, Inc. | 46,233 | ||
| 344 | DexCom, Inc. (a) | 39,966 | ||
| 407 | Edwards Lifesciences Corp. (a) | 33,671 | ||
| 3,209 | Fisher & Paykel Healthcare Corp., Ltd. (b) | 53,645 | ||
| 551 | Globus Medical, Inc., Class A (a) | 31,209 | ||
| 536 | Hologic, Inc. (a) | 43,255 | ||
| 294 | Hoya Corp. (b) | 32,491 | ||
| 152 | Insulet Corp. (a) | 48,482 | ||
| 183 | Intuitive Surgical, Inc. (a) | 46,751 | ||
| 2,549 | Koninklijke Philips N.V. (b) | 46,817 | ||
| 253 | Masimo Corp. (a) | 46,689 | ||
| 411 | Medtronic PLC | 33,135 | ||
| 458 | Novocure Ltd. (a) | 27,544 | ||
| 1,640 | Olympus Corp. (b) | 28,803 | ||
| 158 | ResMed, Inc. | 34,600 | ||
| 788 | Siemens Healthineers AG (b) (c) (d) | 45,430 | ||
| 2,981 | Smith & Nephew PLC (b) | 41,438 | ||
| 151 | Sonova Holding AG (b) | 44,543 | ||
| 202 | STERIS PLC | 38,639 | ||
| 357 | Straumann Holding AG (b) | 53,545 | ||
| 160 | Stryker Corp. | 45,675 | ||
| 678 | Sysmex Corp. (b) | 44,498 | ||
| 171 | Teleflex, Inc. | 43,316 | ||
| 1,130 | Terumo Corp. (b) | 30,561 | ||
| 313 | Zimmer Biomet Holdings, Inc. | 40,440 | ||
| 1,521,910 | ||||
| Health Care Providers & Services – 2.4% | ||||
| 1,391 | Amplifon S.p.A. (b) | 48,213 | ||
| Life Sciences Tools & Services – 19.0% | ||||
| 267 | Agilent Technologies, Inc. | 36,937 | ||
| 85 | Bio-Rad Laboratories, Inc., Class A (a) | 40,717 | ||
| 132 | Danaher Corp. | 33,269 | ||
| Shares | Description | Value | ||
| Life Sciences Tools & Services (Continued) | ||||
| 30 | Mettler-Toledo International, Inc. (a) | $45,906 | ||
| 279 | PerkinElmer, Inc. | 37,180 | ||
| 102 | Sartorius Stedim Biotech (b) | 31,293 | ||
| 67 | Thermo Fisher Scientific, Inc. | 38,617 | ||
| 123 | Waters Corp. (a) | 38,084 | ||
| 135 | West Pharmaceutical Services, Inc. | 46,773 | ||
| 3,752 | WuXi AppTec Co., Ltd., Class H (b) (c) (d) | 39,294 | ||
| 388,070 | ||||
| Total Investments – 99.7% | 2,033,055 | |||
| (Cost $2,636,776) | ||||
| Net Other Assets and Liabilities – 0.3% | 6,420 | |||
| Net Assets – 100.0% | $2,039,475 | |||
| (a) | Non-income producing security. |
| (b) | This security is fair valued by the Advisor’s Pricing Committee in accordance with procedures approved by the Trust’s Board of Trustees and in accordance with provisions of the Investment Company Act of 1940 and rules thereunder, as amended. At March 31, 2023, securities noted as such are valued at $797,864 or 39.1% of net assets. Certain of these securities are fair valued using a factor provided by a third-party pricing service due to the change in value between the foreign markets’ close and the New York Stock Exchange close exceeding a certain threshold. On days when this threshold is not exceeded, these securities are typically valued at the last sale price on the exchange on which they are principally traded. |
| (c) | This security may be resold to qualified foreign investors and foreign institutional buyers under Regulation S of the Securities Act of 1933, as amended (the “1933 Act”). |
| (d) | This security is exempt from registration upon resale under Rule 144A of the 1933 Act and may be resold in transactions exempt from registration, normally to qualified institutional buyers. This security is not restricted on the foreign exchange where it trades freely without any additional registration. As such, it does not require the additional disclosure required of restricted securities. |
| Currency Exposure Diversification | % of Total Investments |
| United States Dollar | 60.8% |
| Euro | 12.7 |
| Swiss Franc | 6.8 |
| Japanese Yen | 6.7 |
| Danish Krone | 4.3 |
| New Zealand Dollar | 2.6 |
| Australian Dollar | 2.2 |
| British Pound Sterling | 2.0 |
| Hong Kong Dollar | 1.9 |
| Total | 100.0% |
| Total Value at 3/31/2023 | Level 1 Quoted Prices | Level 2 Significant Observable Inputs | Level 3 Significant Unobservable Inputs | |
| Common Stocks: | ||||
| Biotechnology | $ 74,862 | $ 74,862 | $ — | $ — |
| Health Care Equipment & Supplies | 1,521,910 | 842,846 | 679,064 | — |
| Health Care Providers & Services | 48,213 | — | 48,213 | — |
| Life Sciences Tools & Services | 388,070 | 317,483 | 70,587 | — |
| Total Investments | $ 2,033,055 | $ 1,235,191 | $ 797,864 | $— |
| ASSETS: | |
Investments, at value (Cost $2,636,776) | $ 2,033,055 |
Cash | 3,995 |
| Receivables: | |
Dividends | 2,524 |
Dividend reclaims | 1,062 |
Total Assets | 2,040,636 |
| LIABILITIES: | |
Investment advisory fees payable | 1,161 |
Total Liabilities | 1,161 |
NET ASSETS | $2,039,475 |
| NET ASSETS consist of: | |
Paid-in capital | $ 2,835,932 |
Par value | 1,000 |
Accumulated distributable earnings (loss) | (797,457) |
NET ASSETS | $2,039,475 |
NET ASSET VALUE, per share | $20.39 |
Number of shares outstanding (unlimited number of shares authorized, par value $0.01 per share) | 100,002 |
| INVESTMENT INCOME: | ||
Dividends | $ 15,024 | |
Foreign withholding tax | (998) | |
Other | 10 | |
Total investment income | 14,036 | |
| EXPENSES: | ||
Investment advisory fees | 13,307 | |
Total expenses | 13,307 | |
NET INVESTMENT INCOME (LOSS) | 729 | |
| NET REALIZED AND UNREALIZED GAIN (LOSS): | ||
| Net realized gain (loss) on: | ||
Investments | (175,015) | |
Foreign currency transactions | (1,049) | |
Net realized gain (loss) | (176,064) | |
| Net change in unrealized appreciation (depreciation) on: | ||
Investments | (27,552) | |
Foreign currency translation | (16) | |
Net change in unrealized appreciation (depreciation) | (27,568) | |
NET REALIZED AND UNREALIZED GAIN (LOSS) | (203,632) | |
NET INCREASE (DECREASE) IN NET ASSETS RESULTING FROM OPERATIONS | $(202,903) | |
| Year Ended 3/31/2023 | Period Ended 3/31/2022 (a) | ||
| OPERATIONS: | |||
Net investment income (loss) | $ 729 | $ (46,130) | |
Net realized gain (loss) | (176,064) | 131,318 | |
Net change in unrealized appreciation (depreciation) | (27,568) | (576,197) | |
Net increase (decrease) in net assets resulting from operations | (202,903) | (491,009) | |
| SHAREHOLDER TRANSACTIONS: | |||
Proceeds from shares sold | — | 40,832,103 | |
Cost of shares redeemed | — | (38,098,716) | |
Net increase (decrease) in net assets resulting from shareholder transactions | — | 2,733,387 | |
Total increase (decrease) in net assets | (202,903) | 2,242,378 | |
| NET ASSETS: | |||
Beginning of period | 2,242,378 | — | |
End of period | $2,039,475 | $2,242,378 | |
| CHANGES IN SHARES OUTSTANDING: | |||
Shares outstanding, beginning of period | 100,002 | — | |
Shares sold | — | 1,600,002 | |
Shares redeemed | — | (1,500,000) | |
Shares outstanding, end of period | 100,002 | 100,002 |
| (a) | Inception date is June 22, 2021, which is consistent with the commencement of investment operations and is the date the initial creation units were established. |
| Year Ended 3/31/2023 | Period Ended 3/31/2022 (a) | ||
Net asset value, beginning of period | $ 22.42 | $ 25.17 | |
| Income from investment operations: | |||
Net investment income (loss) | 0.01 | (0.46) | |
Net realized and unrealized gain (loss) | (2.04) | (2.29) | |
Total from investment operations | (2.03) | (2.75) | |
Net asset value, end of period | $20.39 | $22.42 | |
Total return (b) | (9.05)% | (10.93)% | |
| Ratios to average net assets/supplemental data: | |||
Net assets, end of period (in 000’s) | $ 2,039 | $ 2,242 | |
Ratio of total expenses to average net assets | 0.70% | 0.70% (c) | |
Ratio of net investment income (loss) to average net assets | 0.04% | (0.36)% (c) | |
Portfolio turnover rate (d) | 22% | 13% |
| (a) | Inception date is June 22, 2021, which is consistent with the commencement of investment operations and is the date the initial creation units were established. |
| (b) | Total return is calculated assuming an initial investment made at the net asset value at the beginning of the period, reinvestment of all distributions at net asset value during the period, and redemption at net asset value on the last day of the period. The returns presented do not reflect the deduction of taxes that a shareholder would pay on Fund distributions or the redemption or sale of Fund shares. Total return is calculated for the time period presented and is not annualized for periods of less than a year. |
| (c) | Annualized. |
| (d) | Portfolio turnover is calculated for the time period presented and is not annualized for periods of less than a year and does not include securities received or delivered from processing creations or redemptions and in-kind transactions. |
| 1) | the last sale price on the exchange on which they are principally traded or, for Nasdaq and AIM securities, the official closing price; |
| 2) | the type of security; |
| 3) | the size of the holding; |
| 4) | the initial cost of the security; |
| 5) | transactions in comparable securities; |
| 6) | price quotes from dealers and/or third-party pricing services; |
| 7) | relationships among various securities; |
| 8) | information obtained by contacting the issuer, analysts, or the appropriate stock exchange; |
| 9) | an analysis of the issuer’s financial statements; |
| 10) | the existence of merger proposals or tender offers that might affect the value of the security; and |
| 11) | other relevant factors. |
| 1) | the value of similar foreign securities traded on other foreign markets; |
| 2) | ADR trading of similar securities; |
| 3) | closed-end fund or exchange-traded fund trading of similar securities; |
| 4) | foreign currency exchange activity; |
| 5) | the trading prices of financial products that are tied to baskets of foreign securities; |
| 6) | factors relating to the event that precipitated the pricing problem; |
| 7) | whether the event is likely to recur; |
| 8) | whether the effects of the event are isolated or whether they affect entire markets, countries or regions; and |
| 9) | other relevant factors. |
| • | Level 1 – Level 1 inputs are quoted prices in active markets for identical investments. An active market is a market in which transactions for the investment occur with sufficient frequency and volume to provide pricing information on an ongoing basis. |
| • | Level 2 – Level 2 inputs are observable inputs, either directly or indirectly, and include the following: |
| o | Quoted prices for similar investments in active markets. |
| o | Quoted prices for identical or similar investments in markets that are non-active. A non-active market is a market where there are few transactions for the investment, the prices are not current, or price quotations vary substantially either over time or among market makers, or in which little information is released publicly. |
| o | Inputs other than quoted prices that are observable for the investment (for example, interest rates and yield curves observable at commonly quoted intervals, volatilities, prepayment speeds, loss severities, credit risks, and default rates). |
| o | Inputs that are derived principally from or corroborated by observable market data by correlation or other means. |
| • | Level 3 – Level 3 inputs are unobservable inputs. Unobservable inputs may reflect the reporting entity’s own assumptions about the assumptions that market participants would use in pricing the investment. |
Undistributed ordinary income | $— |
Accumulated capital and other gain (loss) | (186,936) |
Net unrealized appreciation (depreciation) | (610,521) |
| Accumulated Net Investment Income (Loss) | Accumulated Net Realized Gain (Loss) on Investments | Paid-in Capital | ||
| $4,157 | $1,049 | $(5,206) |
| Tax Cost | Gross Unrealized Appreciation | Gross Unrealized (Depreciation) | Net Unrealized Appreciation (Depreciation) | |||
| $2,643,532 | $13,619 | $(624,096) | $(610,477) |
| Breakpoints | ||||
| Fund net assets up to and including $2.5 billion | 0.7000% | |||
| Fund net assets greater than $2.5 billion up to and including $5 billion | 0.6825% | |||
| Fund net assets greater than $5 billion up to and including $7.5 billion | 0.6650% | |||
| Fund net assets greater than $7.5 billion up to and including $10 billion | 0.6475% | |||
| Fund net assets greater than $10 billion | 0.6300% |

| NOT FDIC INSURED | NOT BANK GUARANTEED | MAY LOSE VALUE |
| Name, Year of Birth and Position with the Trust | Term of Office and Year First Elected or Appointed | Principal Occupations During Past 5 Years | Number of Portfolios in the First Trust Fund Complex Overseen by Trustee | Other Trusteeships or Directorships Held by Trustee During Past 5 Years |
| INDEPENDENT TRUSTEES | ||||
| Richard E. Erickson, Trustee (1951) | • Indefinite Term • Since Inception | Physician, Edward-Elmhurst Medical Group; Physician and Officer, Wheaton Orthopedics (1990 to 2021) | 228 | None |
| Thomas R. Kadlec, Trustee (1957) | • Indefinite Term • Since Inception | Retired; President, ADM Investor Services, Inc. (Futures Commission Merchant) (2010 to July 2022) | 228 | Director, National Futures Association and ADMIS Singapore Ltd.; Formerly, Director of ADM Investor Services, Inc., ADM Investor Services International, ADMIS Hong Kong Ltd., and Futures Industry Association |
| Denise M. Keefe, Trustee (1964) | • Indefinite Term • Since 2021 | Executive Vice President, Advocate Aurora Health and President, Advocate Aurora Continuing Health Division (Integrated Healthcare System) | 228 | Director and Board Chair of Advocate Home Health Services, Advocate Home Care Products and Advocate Hospice; Director and Board Chair of Aurora At Home (since 2018); Director of Advocate Physician Partners Accountable Care Organization; Director and Board Chair of RML Long Term Acute Care Hospitals; and Director of Senior Helpers (since 2021) |
| Robert F. Keith, Trustee (1956) | • Indefinite Term • Since Inception | President, Hibs Enterprises (Financial and Management Consulting) | 228 | Formerly, Director of Trust Company of Illinois |
| Niel B. Nielson, Trustee (1954) | • Indefinite Term • Since Inception | Senior Advisor (2018 to Present), Managing Director and Chief Operating Officer (2015 to 2018), Pelita Harapan Educational Foundation (Educational Products and Services) | 228 | None |
| INTERESTED TRUSTEE | ||||
| James A. Bowen(1), Trustee and Chairman of the Board (1955) | • Indefinite Term • Since Inception | Chief Executive Officer, First Trust Advisors L.P. and First Trust Portfolios L.P.; Chairman of the Board of Directors, BondWave LLC (Software Development Company) and Stonebridge Advisors LLC (Investment Advisor) | 228 | None |
| (1) | Mr. Bowen is deemed an “interested person” of the Trust due to his position as CEO of First Trust Advisors L.P., investment advisor of the Trust. |
| Name and Year of Birth | Position and Offices with Trust | Term of Office and Length of Service | Principal Occupations During Past 5 Years |
| OFFICERS(2) | |||
| James M. Dykas (1966) | President and Chief Executive Officer | • Indefinite Term • Since 2016 | Managing Director and Chief Financial Officer, First Trust Advisors L.P. and First Trust Portfolios L.P.; Chief Financial Officer, BondWave LLC (Software Development Company) and Stonebridge Advisors LLC (Investment Advisor) |
| Donald P. Swade (1972) | Treasurer, Chief Financial Officer and Chief Accounting Officer | • Indefinite Term • Since 2016 | Senior Vice President, First Trust Advisors L.P. and First Trust Portfolios L.P. |
| W. Scott Jardine (1960) | Secretary and Chief Legal Officer | • Indefinite Term • Since Inception | General Counsel, First Trust Advisors L.P. and First Trust Portfolios L.P.; Secretary and General Counsel, BondWave LLC; Secretary, Stonebridge Advisors LLC |
| Daniel J. Lindquist (1970) | Vice President | • Indefinite Term • Since Inception | Managing Director, First Trust Advisors L.P. and First Trust Portfolios L.P. |
| Kristi A. Maher (1966) | Chief Compliance Officer and Assistant Secretary | • Indefinite Term • Since Inception | Deputy General Counsel, First Trust Advisors L.P. and First Trust Portfolios L.P. |
| Roger F. Testin (1966) | Vice President | • Indefinite Term • Since Inception | Senior Vice President, First Trust Advisors L.P. and First Trust Portfolios L.P. |
| Stan Ueland (1970) | Vice President | • Indefinite Term • Since Inception | Senior Vice President, First Trust Advisors L.P. and First Trust Portfolios L.P. |
| (2) | The term “officer” means the president, vice president, secretary, treasurer, controller or any other officer who performs a policy making function. |
| • | Information we receive from you and your broker-dealer, investment professional or financial representative through interviews, applications, agreements or other forms; |
| • | Information about your transactions with us, our affiliates or others; |
| • | Information we receive from your inquiries by mail, e-mail or telephone; and |
| • | Information we collect on our website through the use of “cookies.” For example, we may identify the pages on our website that your browser requests or visits. |
| • | In order to provide you with products and services and to effect transactions that you request or authorize, we may disclose your personal information as described above to unaffiliated financial service providers and other companies that perform administrative or other services on our behalf, such as transfer agents, custodians and trustees, or that assist us in the distribution of investor materials such as trustees, banks, financial representatives, proxy services, solicitors and printers. |
| • | We may release information we have about you if you direct us to do so, if we are compelled by law to do so, or in other legally limited circumstances (for example to protect your account from fraud). |
FUND ACCOUNTANT &
TRANSFER AGENT
PUBLIC ACCOUNTING FIRM
| (b) | Not applicable. |
Item 2. Code of Ethics.
| (a) | The registrant, as of the end of the period covered by this report, has adopted a code of ethics that applies to the registrant’s principal executive officer, principal financial officer, principal accounting officer or controller, or persons performing similar functions, regardless of whether these individuals are employed by the registrant or a third party. |
| (c) | There have been no amendments, during the period covered by this report, to a provision of the code of ethics that applies to the registrant’s principal executive officer, principal financial officer, principal accounting officer or controller, or persons performing similar functions, regardless of whether these individuals are employed by the registrant or a third party, and that relates to any element of the code of ethics description. |
| (d) | The registrant, during the period covered by this report, has not granted any waivers, including an implicit waiver, from a provision of the code of ethics that applies to the registrant’s principal executive officer, principal financial officer, principal accounting officer or controller, or persons performing similar functions, regardless of whether these individuals are employed by the registrant or a third party, that relates to one or more of the items set forth in paragraph (b) of this item’s instructions. |
| (e) | Not applicable. |
| (f) | A copy of the code of ethics that applies to the registrant’s principal executive officer, principal financial officer, principal accounting officer or controller is filed as an exhibit pursuant to Item 13(a)(1). |
Item 3. Audit Committee Financial Expert.
As of the end of the period covered by the report, the registrant’s Board of Trustees has determined that Thomas R. Kadlec and Robert F. Keith are qualified to serve as audit committee financial experts serving on its audit committee and that each of them is “independent,” as defined by Item 3 of Form N-CSR.
Item 4. Principal Accountant Fees and Services.
(a) Audit Fees (Registrant) -- The aggregate fees billed for professional services rendered by the principal accountant for the audit of the registrant’s annual financial statements or services that are normally provided by the accountant in connection with statutory and regulatory filings or engagements were $306,750 for the fiscal year ended March 31, 2022 and $304,626 for the fiscal year ended March 31, 2023.
(b) Audit-Related Fees (Registrant) -- The aggregate fees billed for assurance and related services by the principal accountant that are reasonably related to the performance of the audit of the registrant’s financial statements and are not reported under paragraph (a) of this Item were $0 for the fiscal year ended March 31, 2022 and $0 for the fiscal year ended March 31, 2023.
Audit-Related Fees (Investment Advisor and Distributor) -- The aggregate fees billed for assurance and related services by the principal accountant that are reasonably related to the performance of the audit of the registrant’s financial statements and are not reported under paragraph (a) of this Item were $0 for the fiscal year ended March 31, 2022 and $0 for the fiscal year ended March 31, 2023.
(c) Tax Fees (Registrant) -- The aggregate fees billed for professional services rendered by the principal accountant for tax compliance, tax advice, and tax planning to the registrant were $69,178 for the fiscal year ended March 31, 2022 and $78,357 for the fiscal year ended March 31, 2023. These fees were for tax consultation and/or tax return preparation and professional services rendered for PFIC (Passive Foreign Investment Company) Identification Services.
Tax Fees (Investment Advisor and Distributor) -- The aggregate fees billed for professional services rendered by the principal accountant for tax compliance, tax advice, and tax planning to the registrant’s advisor and distributor were $0 for the fiscal year ended March 31, 2022 and $0 for the fiscal year ended March 31, 2023.
(d) All Other Fees (Registrant) -- The aggregate fees billed for products and services provided by the principal accountant to the registrant, other than the services reported in paragraphs (a) through (c) of this Item were $0 for the fiscal year ended March 31, 2022 and $0 for the fiscal year ended March 31, 2023.
All Other Fees (Investment Advisor and Distributor) -- The aggregate fees billed for products and services provided by the principal accountant to the registrant’s investment advisor and distributor, other than the services reported in paragraphs (a) through (c) of this Item were $0 for the fiscal year ended March 31, 2022 and $0 for the fiscal year ended March 31, 2023.
(e)(1) Disclose the audit committee’s pre-approval policies and procedures described in paragraph (c) (7) of Rule 2-01 of Regulation S-X.
Pursuant to its charter and its Audit and Non-Audit Services Pre-Approval Policy, the Audit Committee (the “Committee”) is responsible for the pre-approval of all audit services and permitted non-audit services (including the fees and terms thereof) to be performed for the registrant by its independent auditors. The Chairman of the Committee is authorized to give such pre-approvals on behalf of the Committee up to $25,000 and report any such pre-approval to the full Committee.
The Committee is also responsible for the pre-approval of the independent auditor’s engagements for non-audit services with the registrant’s advisor (not including a sub-advisor whose role is primarily portfolio management and is sub-contracted or overseen by another investment advisor) and any entity controlling, controlled by or under common control with the investment advisor that provides ongoing services to the registrant, if the engagement relates directly to the operations and financial reporting of the registrant, subject to the de minimis exceptions for non-audit services described in Rule 2-01 of Regulation S-X. If the independent auditor has provided non-audit services to the registrant’s advisor (other than any sub-advisor whose role is primarily portfolio management and is sub-contracted with or overseen by another investment advisor) and any entity controlling, controlled by or under common control with the investment advisor that provides ongoing services to the registrant that were not pre-approved pursuant to its policies, the Committee will consider whether the provision of such non-audit services is compatible with the auditor’s independence.
(e)(2) The percentage of services described in each of paragraphs (b) through (d) for the registrant and the registrant’s investment advisor and distributor of this Item that were approved by the audit committee pursuant to the pre-approval exceptions included in paragraph (c)(7)(i)(C) or paragraph(C)(7)(ii) of Rule 2-01 of Regulation S-X are as follows:
| Registrant: | Advisor and Distributor: |
| (b) 0% | (b) 0% | |||
| (c) 0% | (c) 0% | |||
| (d) 0% | (d) 0% |
(f) The percentage of hours expended on the principal accountant’s engagement to audit the registrant’s financial statements for the most recent fiscal year that were attributed to work performed by persons other than the principal accountant’s full-time, permanent employees was less than fifty percent.
(g) The aggregate non-audit fees billed by the registrant’s accountant for services rendered to the registrant, and rendered to the registrant’s investment advisor (not including any sub-advisor whose role is primarily portfolio management and is subcontracted with or overseen by another investment advisor), and any entity controlling, controlled by, or under common control with the adviser that provides ongoing services to the registrant for the fiscal year ended March 31, 2022, were $69,178 for the registrant, $16,500 for the registrant’s investment advisor, and $29,500 for the registrant’s distributor and for the fiscal year ended March 31, 2023, were $78,357 for the registrant, $18,000 for the registrant’s investment advisor, and $30,500 for the registrant’s distributor.
(h) The registrant’s audit committee of its Board of Trustees has determined that the provision of non-audit services that were rendered to the registrant’s investment advisor (not including any sub-advisor whose role is primarily portfolio management and is subcontracted with or overseen by another investment advisor), and any entity controlling, controlled by, or under common control with the investment advisor that provides ongoing services to the registrant that were not pre-approved pursuant to paragraph (c)(7)(ii) of Rule 2-01 of Regulation S-X is compatible with maintaining the principal accountant’s independence.
(i) Not applicable.
(j) Not applicable.
Item 5. Audit Committee of Listed Registrants.
The registrant has a separately designated standing audit committee established in accordance with Section 3(a)(58)(A) of the Securities Exchange Act of 1934. The audit committee of the registrant is comprised of: Richard E. Erickson, Thomas R. Kadlec, Denise M. Keefe, Robert F. Keith and Niel B. Nielson.
Item 6. Investments.
| (a) | The Schedule of Investments in securities of unaffiliated issuers as of the close of the reporting period is included as part of the report to shareholders filed under Item 1 of this form. |
| (b) | Not applicable. |
Item 7. Disclosure of Proxy Voting Policies and Procedures for Closed-End Management Investment Companies.
Not applicable.
Item 8. Portfolio Managers of Closed-End Management Investment Companies.
Not applicable.
Item 9. Purchases of Equity Securities by Closed-End Management Investment Company and Affiliated Purchasers.
Not applicable.
Item 10. Submission of Matters to a Vote of Security Holders.
There have been no material changes to the procedures by which the shareholders may recommend nominees to the registrant’s board of directors, where those changes were implemented after the registrant last provided disclosure in response to the requirements of Item 407 (c) (2) (iv) of Regulation S-K (17 CFR 229.407) (as required by Item 22 (b) (15) of Schedule 14A (17 CFR 240.14a-101)), or this Item.
Item 11. Controls and Procedures.
| (a) | The registrant’s principal executive and principal financial officers, or persons performing similar functions, regarding the effectiveness of the registrant’s disclosure controls and procedures (as defined in Rule 30a-3(c) under the Act (17 CFR 270.30a-3(c))) as of a date within 90 days of the filing date of the report that includes the disclosure required by this paragraph, based on the evaluation of these controls and procedures required by Rule 30a-3(b) under the Act (17 CFR 270.30a-3(b)) and Rules 13a-15(b) or 15d-15(b) under the Exchange Act (17 CFR 240.13a-15(b) or 240.15d-15(b)). |
| (b) | There were no changes in the registrant’s internal control over financial reporting (as defined in Rule 30a-3(d) under the 1940 Act (17 CFR 270.30a-3(d)) that occurred during the period covered by this report that have materially affected, or are reasonably likely to materially affect, the registrant’s internal control over financial reporting. |
Item 12. Disclosure of Securities Lending Activities for Closed-End Management Investment Companies.
Not applicable.
Item 13. Exhibits.
| (a)(1) | Code of ethics, or any amendment thereto, that is the subject of disclosure required by Item 2 is attached hereto. |
| (a)(2) | Certifications pursuant to Rule 30a-2(a) under the 1940 Act and Section 302 of the Sarbanes-Oxley Act of 2002 are attached hereto. |
| (a)(3) | Not applicable. |
| (a)(4) | Not applicable. |
| (b) | Certifications pursuant to Rule 30a-2(b) under the 1940 Act and Section 906 of the Sarbanes-Oxley Act of 2002 are attached hereto. |
SIGNATURES
Pursuant to the requirements of the Securities Exchange Act of 1934 and the Investment Company Act of 1940, the registrant has duly caused this report to be signed on its behalf by the undersigned, thereunto duly authorized.
| (registrant) | First Trust Exchange-Traded Fund VI |
| By (Signature and Title)* | /s/ James M. Dykas | |
| James M. Dykas, President and Chief Executive Officer (principal executive officer) |
| Date: | June 9, 2023 |
Pursuant to the requirements of the Securities Exchange Act of 1934 and the Investment Company Act of 1940, this report has been signed below by the following persons on behalf of the registrant and in the capacities and on the dates indicated.
| By (Signature and Title)* | /s/ James M. Dykas | |
| James M. Dykas, President and Chief Executive Officer (principal executive officer) |
| Date: | June 9, 2023 |
| By (Signature and Title)* | /s/ Donald P. Swade | |
| Donald P. Swade, Treasurer, Chief Financial Officer and Chief Accounting Officer (principal financial officer) |
| Date: | June 9, 2023 |
* Print the name and title of each signing officer under his or her signature.