united states
securities and exchange commission
washington, d.c. 20549
form n-csr
certified shareholder report of registered management
investment companies
Investment Company Act file number 811-22718
Two Roads Shared Trust
(Exact name of registrant as specified in charter)
17605 Wright Street, Suite 102, Omaha, NE 68130
(Address of principal executive offices) (Zip code)
Richard Malinowski, Gemini Fund Services, LLC.
80 Arkay Drive Suite 110, Hauppauge, NY 11788
(Name and address of agent for service)
Registrant's telephone number, including area code: 631-470-2619
Date of fiscal year end: 10/31
Date of reporting period: 10/31/18
ITEM 1. REPORTS TO SHAREHOLDERS.
 | ||
| Annual Report | ||
| October 31, 2018 | ||
| Recurrent MLP & Infrastructure Fund | ||
| Class I Shares (RMLPX) | ||
| Recurrent Natural Resources Fund | ||
| Class I Shares (RNRGX) | ||
| 1-833-RECURRENT | ||
| (1-833-732-8773) | ||
| www.recurrentadvisors.com | ||
| Distributed by Northern Lights Distributors, LLC | ||
| Member FINRA | ||
| This report and the financial statements contained herein are submitted for the general information of shareholders and are not authorized for distribution to prospective investors unless preceded or accompanied by an effective prospectus, which contains information about each Fund’s investment objective, risks, fees and expenses. Investors are reminded to read the prospectus carefully before investing in a Fund. | ||
Beginning on January 1, 2021, as permitted by regulations adopted by the Securities and Exchange Commission, paper copies of the Fund’s shareholder reports like this one will no longer be sent by mail, unless you specifically request paper copies of the reports. Instead, the reports will be made available on the Fund’s website www.recurrentadvisors.com, and you will be notified by mail each time a report is posted and provided with a website link to access the report.
If you already elected to receive shareholder reports electronically, you will not be affected by this change and you need not take any action. You may elect to receive shareholder reports and other communications from the Fund electronically by contacting your financial intermediary (such as a broker-dealer or bank) or, if you are a direct investor, by following the instructions included with paper Fund documents that have been mailed to you.
1
 | Recurrent Natural Resources Fund (RNRGX) Recurrent MLP & Infrastructure Fund (RMLPX) Cycles happen. Invest accordingly. www.recurrentfunds.com |
Recurrent Funds – FY 2018 at a glance
Before discussing the specifics of the Recurrent Funds, Recurrent’s principals want to thank you in advance for your trust and support. And now, on to the fiscal year 2018 investment review:
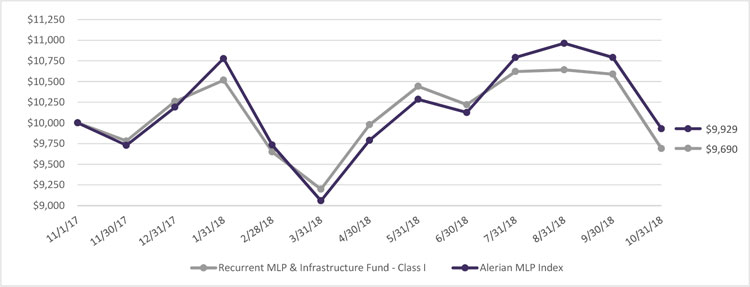
During FY 2018 (from inception through October 31, 2018), Recurrent MLP & Infrastructure Fund (RMLPX) generated -3.10% total returns, lagging the -0.71% return of the Alerian MLP Index (AMZ) by 2.39%.
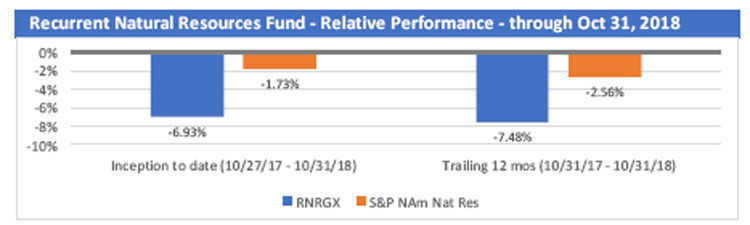
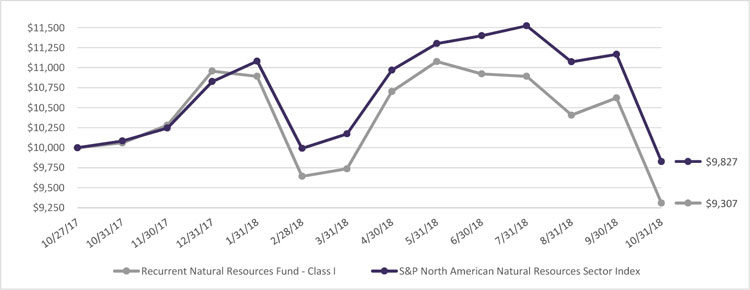
During FY 2018, Recurrent Natural Resources Fund (RNRGX) generated -7.48% total returns, 4.93% behind the -2.56% return of the S&P Select North American Natural Resources Index (SPGINRTR). Since inception through October 31, 2018, RNRGX generated -6.93% returns, 5.20% behind the -1.73% total return of the SPGINRTR.
The performance data quoted here represents past performance. For performance data current to the most recent month end, please call (833)-RECURRENT. Current performance may be lower or higher than the performance data quoted above. Past performance is no guarantee of future results. The investment return and principal value of an investment in the Fund will fluctuate so that investors’ shares, when redeemed, may be worth more or less than their original cost. Total Annual Operating Expenses are 2.24% for RNRGX and 2.74% for RMLPX; although the Adviser has agreed to cap total fund expenses for each fund at 1.25% through at least March 1, 2019.
We believe returns in “real assets” such as natural resources and infrastructure – could outperform broader equities after a multi-year period of dramatic underperformance.
Tightening commodity markets in 2018 have been driven primarily by companies’ unwillingness to commit to major, long-term capital projects, which have historically been a large source of supply growth in fossil fuel markets as well as in metals and mining. In the oil market, shale provides a “rapid response” source of supply that can keep a lid on commodity prices, but we continue to see evidence that the cost of producing oil is inflating during 2018, partly a result of insufficient infrastructure to accommodate shale growth. In the metals market, there is no “rapid response” equivalent to shale, and supply sources take years to come online after the decision to invest, although metals prices have been roiled by economic weakness in emerging markets.
As major western economies approach levels commensurate with “full” employment and inflation begins to tick higher, we are excited about the opportunities in both of our funds, where most companies have been driving down costs and debt loads since the commodity market peak in 2014 – we believe that gives the sectors where we invest an advantaged position to respond to a wide variety of macroeconomic environments.
Thank you for your trust – we look forward to speaking with you in person.
Best regards,
Mark Laskin and Brad Olsen
Co-Founders and Portfolio Managers
Recurrent Investment Advisors (Subadvisor of the Recurrent Funds)
The views in this report are those of the Fund’s management. This report contains certain forward-looking statements about factors that may affect the performance of the Fund in the future. These statements are based on the Fund’s management’s predictions and expectations concerning certain future events such as the performance of the economy as a whole and of specific industry sectors. Management believes these forward-looking statements are reasonable, although they are inherently uncertain and difficult to predict.
2
| Recurrent Natural Resources Fund (RNRGX) Recurrent MLP & Infrastructure Fund (RMLPX) Cycles happen. Invest accordingly. www.recurrentfunds.com |
Recurrent MLP & Infrastructure Fund (RMLPX) Commentary – FY 2018
While RMLPX generally performed well during periods of market volatility, such as the period in early 2018 following the unexpected announcement by the FERC (the US pipeline regulator) that regulated MLP cash flows might be subject to an unexpected regulatory reduction. During stronger markets in the summer of 2018, we lagged the Alerian MLP Index as outsized Alerian MLP Index weights benefitted from affiliated-party merger activity. Specifically, top-10 index weights Energy Transfer Partners (ETP) and Williams Partners (WPZ) received unexpected premium takeout bids from their parent companies, and they were not held in our portfolio. Additionally, performance in October was hampered by exposure to Colorado infrastructure assets, which suffered in the face of a referendum targeting oil and gas activity. The referendum failed in early November voting, removing some of the perceived regulatory risk.
Looking forward, we are encouraged by midstream company valuations which appear low compared to historical levels, as well as improving balance sheets, which we believe will leave more debt-adjusted cash flow available to reward MLP equityholders.
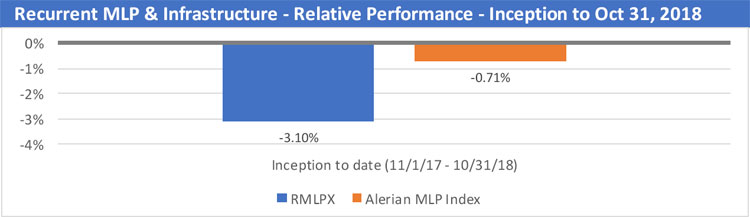
From inception through FY 2018 (one day less than a full year), the Recurrent MLP & Infrastructure Fund lost -3.10% on a total return basis, underperforming the Alerian MLP Index by -2.39%.
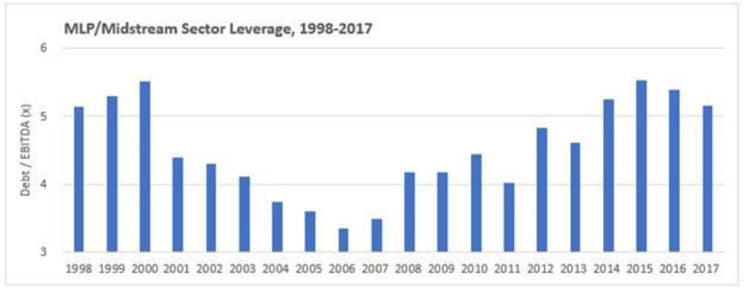
We believe declining debt loads could be a meaningful driver of MLP performance going forward
Source: Bloomberg. Public SEC filings.
3
| Recurrent Natural Resources Fund (RNRGX) Recurrent MLP & Infrastructure Fund (RMLPX) Cycles happen. Invest accordingly. www.recurrentfunds.com |
We have seen signs of continued improvement in the financial health of MLPs and midstream companies, including the continued emergence from a period of high debt during 2012-17 (see graph above). During July 2018, Kinder Morgan Inc (KMI) announced the sale of a large portion of their beleaguered Canadian assets for an attractive price. These assets had been burdened by inconsistent regulatory decisions for several years, and the sale furthered KMI’s progress towards debt reduction.
We also saw a string of affiliated-party merger announcements announced in 2018, including buyouts of public MLPs controlled by pipeline conglomerates Energy Transfer Equity (ETE), Williams Companies (WMB), Cheniere Energy Inc. (LNG), Enbridge Inc. (ENB), and others. Although our lack of involvement with ETP and WPZ hurt relative performance, we emerged from these merger announcements increasingly constructive on the sector, as complex structures are giving way to increasingly simplified companies with lower debt loads.
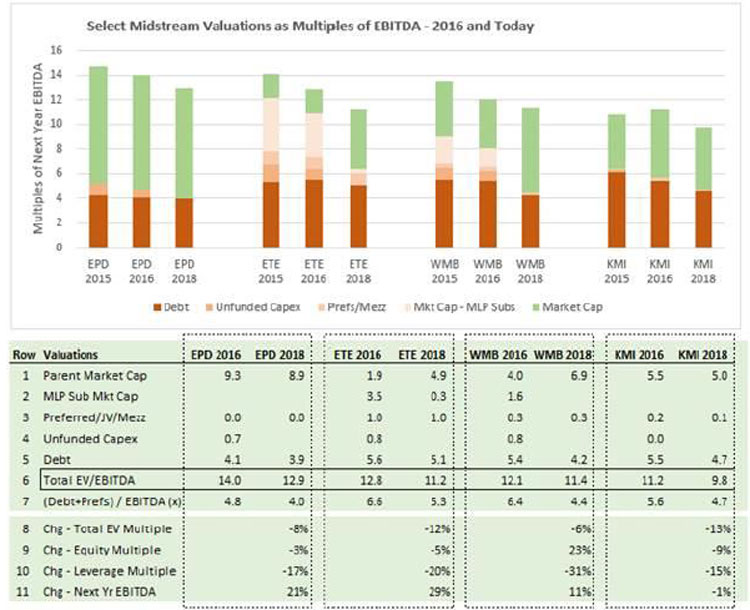
Since 2015, midstream equity valuations are lower even as debt loads have declined
With significant corporate structure changes within midstream since 2015, comparisons can be challenging, so we offer some of our “fully consolidated” midstream valuations below. Rows 7 and 10 in the table on the following page show leverage declining meaningfully from 2016 averages (in the early innings of the “balance sheet recession”) to current levels. As debt has fallen sharply, EBITDA has grown meaningfully for 3 of 4 companies, with KMI’s flat EBITDA reflecting large asset sales. Meanwhile, not only have total EV/EBITDA multiples declined since 2016, but equity value (as a multiple of EBITDA) has fallen for 3 of 4 companies. The result has been total EV/EBITDA valuations that have declined by 10% on average across the companies below.
It is worth reiterating that this valuation comparison is not comparing to a previous peak – the prior valuation is based on YE 2015 and 2016 average stock prices and balance sheets - a time when the Alerian MLP Index had already fallen 46% from mid-2014, and oil prices averaged in the low $40s.
4
| Recurrent Natural Resources Fund (RNRGX) Recurrent MLP & Infrastructure Fund (RMLPX) Cycles happen. Invest accordingly. www.recurrentfunds.com |
For informational purposes only. Does not constitute a recommendation of any individual security.
Source: Bloomberg estimates and public SEC filings. “Next year EBITDA” estimates reflect Bloomberg consensus.
5
| Recurrent Natural Resources Fund (RNRGX) Recurrent MLP & Infrastructure Fund (RMLPX) Cycles happen. Invest accordingly. www.recurrentfunds.com |
MLPs could see a return to the “uncorrelated income” reputation they enjoyed before 2015
With falling debt loads and attractive valuations today, we believe MLP could offer a differentiated source of income for investors navigating a market with rising interest rates and volatile equity prices.
Top 10 RMLPX Holdings from Latest Quarterly Filing
| Recurrent MLP & Infrastructure - as of October 31, 2018 | ||||
| Rank | Ticker | Company | Subsector | % of Port |
| 1 | ET | Energy Transfer LP | Gas Infra | 10.2% |
| 2 | KMI | Kinder Morgan Inc/DE | Gas Infra | 7.4% |
| 3 | ENBL | Enable Midstream Partners LP | G&P | 6.7% |
| 4 | PAGP | Plains GP Holdings LP | Unregulated Oil/NGL | 6.6% |
| 5 | SUN | Sunoco LP | Unregulated Oil/NGL | 6.0% |
| 6 | WES | Western Gas Partners LP | Unregulated Oil/NGL | 5.9% |
| 7 | BPL | Buckeye Partners LP | Regulated Oil/NGL | 5.2% |
| 8 | CEQP | Crestwood Equity Partners LP | G&P | 4.9% |
| 9 | NBLX | Noble Midstream Partners LP | G&P | 4.9% |
| 10 | EPD | Enterprise Products Partners LP | Gas Infra | 4.7% |
| Top 10 RMLPX Holdings as a% of Portfolio: | 62.6% | |||
Portfolio holdings are subject to change at any time and should not be considered investment advice.
Top 5 Contributors and Detractors to Performance
| RMLPX Top 5 Performance Contributors and Detractors in FY 2018 | |||||
| Company | Ticker | Contribution (bps) | Company | Ticker | Contribution (bps) |
| Viper Energy Partners | VNOM | +345 | EQT GP Holdings LP | EQGP | -165 |
| Hi-Crush Partners | HCLP | +118 | Enbridge Energy Ptrs | EEP | -116 |
| Crestwood Equity Ptrs | CEQP | +100 | Noble Midstream Ptrs | NBLX | -95 |
| Cheniere Energy Inc | LNG | +94 | SemGroup Corp | SEMG | -77 |
| Targa Resources Corp | TRGP | +84 | Rice Midstream Ptrs | RMP | -48 |
Portfolio holdings are subject to change at any time and should not be considered investment advice.
Top 5 Contributors to Performance
Viper Energy Partners LP (VNOM)
Viper Energy Partners owns a portfolio of royalty interests (also known as “mineral rights”) in oil-producing acreage primarily operated by Diamondback Energy (FANG), one of the fastest growing and efficient oil producers in the Permian Basin in west Texas. Royalties entitle owners such as VNOM to a share of revenues from oil and gas produced on the applicable acreage. Importantly, as a royalty owner, VNOM is not responsible for its share of drilling capital or operating expenses, making for a highly capital-efficient business model. Despite its business profile, Viper is very conservatively financed, and has very little net debt. As a result of its high returns on invested capital and low debt leverage, VNOM performed well in the fiscal year as Diamondback’s production profile continues to grow, which increases profitability for VNOM.
Hi-Crush Partners LP (HCLP)
Hi-Crush Partners mines and delivers sand to Exploration and Production companies. Hi-Crush’s operations generate significant cash flows from operations, and has generally maintained low debt leverage on its balance sheet. As a result, during 2018, Hi-Crush announced an aggressive payout policy that attracted many new
6
| Recurrent Natural Resources Fund (RNRGX) Recurrent MLP & Infrastructure Fund (RMLPX) Cycles happen. Invest accordingly. www.recurrentfunds.com |
investors to the company. While we ultimately viewed the aggressive payout policy as a risk to balance sheet health in a volatile sand market, the stock appreciated significantly, providing us with an attractive exit point for the stock.
Crestwood Equity Partners (CEQP)
Crestwood Equity Partners is an independent midstream company that operates a set of primarily short-haul gas gathering assets across various producing basins in the US. During the midstream boom of 2010-2015, Crestwood was a serial acquirer of assets, from the Marcellus region in West Virginia, to the Bakken in North Dakota, and most recently the Delaware Basin of West Texas. Amid the frenzy of dealmaking, CEQP entered into a merger with Inergy, an MLP focused on gas storage and regulated gas transportation primarily focused in the Northeast US. While the combined company struggled mightily with slowing production and high debt in 2014-16, CEQP aggressively reduced dividend payouts and merged entities into a single streamlined structure, all the while selling legacy assets. The result by late 2017 was a company with a significant set of growth assets, conservative balance sheet leverage and some upside optionality around regulated assets now owned through a JV with Consolidated Edison (ED). Going forward, we see CEQP able to continue to maintain low leverage while potentially growing its dividend in 2019 and beyond.
Cheniere Energy (LNG)
Cheniere is the premier independent LNG importer/exporter in the US, with two facilities on the Gulf Coast. With long term contracts and first-mover advantages, including locations thoroughly integrated with gas infrastructure along the Gulf Coast, Cheniere has benefited from the low cost of economic natural gas production in the United States and the growing demand for natural gas outside the US. Cheniere has a relatively new, but experienced, management team who appears well-incentivized to succeed.
Targa Resources Corp (TRGP)
TRGP is the largest operator of gas gathering and processing assets in the Permian Basin of West Texas and New Mexico; they also have considerable gathering assets in the Bakken, Midcon, and Eagle Ford regions. The production from these assets typically makes its way to end consumers through connectivity with Targa’s NGL fractionation (separation) and export dock facilities, which are located around Houston, Texas. The Houston area represents the world’s largest accumulation of NGL-consuming and exporting facilities in the world. Targa has significant growth opportunities around their existing asset base and will continue to spend but also grow cash flows for years to come.
Top 5 Detractors from Performance
EQT GP Holdings LP (EQGP)
EQGP’s sole asset is a claim on EQT Corp’s (EQT) Midstream assets. EQGP is a gas gathering company that services most of the combined gas production of EQT and RICE’s upstream assets, which merged in late 2017. With long-dated contracts signed with EQT and RICE that guarantee EQGP an excellent return on gathering capital deployed and a strong balance sheet, we have a very favorable view of EQGP’s fundamentals, even in light of Northeastern gas drilling activity, which is generally perceived as slowing through the early 2020s due to a lack of takeaway and unexciting gas prices. Concerns around the construction timeline of Mountain Valley, the large pipeline project EQGP is managing, as well as the slow process by which EQT management has spun off EQT’s current EQGP ownership have pressured the stock.
7
| Recurrent Natural Resources Fund (RNRGX) Recurrent MLP & Infrastructure Fund (RMLPX) Cycles happen. Invest accordingly. www.recurrentfunds.com |
Enbridge Energy Partners (EEP)
The last few years have been painful for Enbridge (ENB) and its US MLP subsidiary, EEP. While EEP had been, in our view, an undervalued (and undermanaged) MLP for years, we had expected EEP to benefit from ENB’s increased reliance on MLP vehicles, part of a strategy announced in 2014. With debt and complexity suddenly out of fashion in 2015 and 2016, Enbridge’s opted to accelerate debt paydown by reducing MLP dividend payouts. After the pipeline regulatory ruling in March (see “FERC” discussion above), ENB released an optimistic announcement (that EEP would be minimally impacted by the FERC ruling), and then decided to use the depressed post-FERC valuations to acquire EEP for no premium. Although ENB has since revised their EEP takeout offer higher, it remains well below EEP’s pre-FERC valuation.
Noble Midstream Partners (NBLX)
NBLX suffered from significant DJ Basin exposure during the fiscal year, which led to sustained selling pressure that took the stock from over $50 to $34 near the lows. With limited liquidity, NBLX is susceptible to volatility when larger holders of the stock want to exit. We see the DJ Basin/Colorado referendum risk as meaningfully overpriced in the stock, and used the dip as an opportunity to increase our exposure to NBLX. We look forward to significant Permian- and DJ-driven growth, combined with conservative financial policies (<50% payout ratio, limited debt) which we believe returns NBLX to its historical levels.
Semgroup Corp (SEMG)
In transitioning from a production-focused to an increasingly refinery-focused business model, SEMG accumulated an increased debt load compared to its history. SemGroup has indicated that it would be willing to sell assets to rapidly reduce the debt load, but after a torrid pace of asset sales in late 2017 and early 2018, progress stalled, and investors relegated SEMG to “show-me” status. We continue to think highly of SEMG management and their core asset base, but believe that they have erred in “over-promising” on asset sales in a market where asset-level M&A remains fairly confined to assets focused in the Permian Basin.
Rice Midstream Partners (RMP)
RMP, now merged into EQT Midstream (EQM) represents another claim on the same set of EQT Midstream assets owned by EQGP (see above). While RMP was a separate company before its proposed merger with RMP was announced in Q1 2018, it effectively became part of EQM, a gas gathering company that services all of the combined gas production of EQT and RICE’s upstream assets, which merged in late 2017. With long-dated contracts signed with EQT and RICE that guarantee EQGP an excellent return on gathering capital deployed and a strong balance sheet, we have a very favorable view of EQM, even in light of Northeastern gas drilling activity, which is generally perceived as slowing through the early 2020s due to a lack of takeaway and unexciting gas prices. During 2018, concerns around the agonizingly slow process by which EQT management separated EQT’s upstream and midstream assets continued to undermine the EQGP-EQM-RMP complex; we view these as transitory concerns and remain holders of the EQT Midstream complex.
8
| Recurrent Natural Resources Fund (RNRGX) Recurrent MLP & Infrastructure Fund (RMLPX) Cycles happen. Invest accordingly. www.recurrentfunds.com |
Recurrent Natural Resources Fund (RNRGX) Commentary – FY 2018
During the course of the year, many of the headline commodities such as crude oil and natural gas, have traded in a relatively tight range. Whereas in recent years, crude oil ranged from a low of $27/barrel to a high of $150/barrel in 2014, during the fiscal year crude prices as defined by West Texas Intermediate (WTI) ranged from $55-$75/barrel and ended the fiscal year near $65/barrel. Similarly, other than a short-lived spike during the winter cold, natural gas prices have generally remained in close proximity to $3/mcf, in line with the last 30 months.
Other key commodities saw mixed price reactions during the fiscal year. Copper, aluminum and nickel prices all traded in a relatively narrow range and ended the fiscal year lower than they started. Interestingly, iron ore prices were relatively strong over the course of the year and closed near their 52 week high price.
Portfolio Review
During the abbreviated period, the Recurrent Natural Resources Fund fell by 7.48% net of fees, compared to the 2.56% fall of the most relevant benchmark, the S&P North American Natural Resources Index.
Source: Bloomberg
During the course of the fiscal year, the portfolio had several positive and negative impacts to overall performance. While stock selection in the gold, Oil & Gas Exploration and Production (E&P) and Oil and Gas Equipment and Services all positively contributed to relative performance, stock selection in specialty chemicals, diversified metals, and housewares all negatively impacted relative performance. Additionally, the portfolio was underweighted the Oil and Gas Refining sector, which was the strongest performing sub-industry within the energy industry during the fiscal year.
As we enter fiscal year 2019, we at Recurrent believe that within the Natural Resources universe, energy subsectors such as Exploration and Production (E&P) and Midstream companies exhibit relative value compared to other sectors within the Natural Resources universe of companies. As a result, the portfolio reflects the relative valuation opportunities. More than 34% of the portfolio is in Energy Exploration and Production (E&P) companies which produce oil and natural gas, and more than 26% is in Energy midstream companies, which provide infrastructure and logistics. In comparison, we see limited value in the materials and industrials segments of the natural resources universe, reflected in the relatively smaller portfolio weighting. As global trade disputes continue, the economic sensitivity of industrial commodities negatively impacts equity values; the portfolio reflects the weakening global economy.
9
| Recurrent Natural Resources Fund (RNRGX) Recurrent MLP & Infrastructure Fund (RMLPX) Cycles happen. Invest accordingly. www.recurrentfunds.com |
Top 10 RNRGX Holdings
| Recurrent Natural Resources Fund - as of October 31, 2018 | ||||
| Rank | Ticker | Company | Subsector | % of Port |
| 1 | WRD | WildHorse Resource Development CorpExploration/Production | 5.6% | |
| 2 | XOM | Exxon Mobil Corp | Integrated Oil | 5.5% |
| 3 | KMI | Kinder Morgan Inc/DE | Midstream | 5.3% |
| 4 | ET | ENERGY TRANSFER LP | Midstream | 4.6% |
| 5 | FANG | Diamondback Energy Inc | Exploration/Production | 4.5% |
| 6 | PAGP | Plains GP Holdings LP | Midstream | 4.4% |
| 7 | CVE | Cenovus Energy Inc | Exploration/Production | 4.0% |
| 8 | GLNCY | Glencore PLC | End User - Mining | 4.0% |
| 9 | HAL | Halliburton Co | Oilfield Services | 3.7% |
| 10 | EPD | Enterprise Products Partners LP | Midstream | 3.7% |
| Top 10 RNRGX Holdings as a% of Portfolio: | 45.4% | |||
Portfolio holdings are subject to change at any time and should not be considered investment advice.
Top 5 Performance Contributors and Detractors
| RNRGX Top 5 Performance Contributors and Detractors in FY 2018 | |||||
| Company | Ticker | Contribution (bps) | Company | Ticker | Contribution (bps) |
| Viper Energy Partners | VNOM | +274 | US Silica Holdings Inc | SLCA | -207 |
| Wildhorse Resource Dev | WRD | +146 | NCI Building Systems | NCS | -126 |
| Oasis Petroleum Inc | OAS | +102 | Cimarex Energy | XEC | -114 |
| Hi-Crush Partners | HCLP | +102 | Newell Brands | NWL | -113 |
| Cheniere Energy Inc | LNG | +51 | Newfield Exploration | NFX | -113 |
Portfolio holdings are subject to change at any time and should not be considered investment advice.
Top 5 Contributors to Performance
Viper Energy Partners LP (VNOM)
Viper Energy Partners owns a portfolio of royalty interests (also known as “mineral rights”) in oil-producing acreage primarily operated by Diamondback Energy (FANG), one of the fastest growing and efficient oil producers in the Permian Basin in west Texas. Royalties entitle owners such as VNOM to a share of revenues from oil and gas produced on the applicable acreage. Importantly, as a royalty owner, VNOM is not responsible for its share of drilling capital or operating expenses, making for a highly capital-efficient business model. Despite its business profile, Viper is very conservatively financed, and has very little net debt. As a result of its high returns on invested capital and low debt leverage, VNOM performed well in the fiscal year as Diamondback’s production profile continues to grow, which increases profitability for VNOM.
Wildhorse Resource Development Corp. (WRD)
WRD is an Exploration and Production (E&P) company with operations in the Eagle Ford shale in southeastern Texas. Relative to other domestic shale E&P producers, Wildhorse has a higher percentage of oil production. Additionally, in other oil producing shale basins, a lack of pipeline capacity has inhibited oil production growth. However, Wildhorse’s production is not impacted by pipeline constrains, meaning at the current combination of current oil and natural gas commodity prices, Wildhorse has been able to generate higher profit margins per barrels than peer companies. In November 2018, Chesapeake Energy (CHK), a
10
| Recurrent Natural Resources Fund (RNRGX) Recurrent MLP & Infrastructure Fund (RMLPX) Cycles happen. Invest accordingly. www.recurrentfunds.com |
company with a lower percentage oil and more levered balance sheet than WRD, announced the acquisition of WRD, confirming our positive view of WRD’s assets.
Oasis Petroleum (OAS)
Oasis Petroleum is a US Exploration and Production company with operations in the Bakken shale in North Dakota and Montana, and more recently the Delaware basin in West Texas. As the oil price rose through the fiscal year, Oasis’ operations, particularly in the Bakken Shale, profitability likely increased, disproportionately benefitting the shares. With the acquisition of acreage in the low cost Delaware basin, Oasis positioned itself well for future oil price environments.
Hi-Crush Partners LP (HCLP)
Hi-Crush Partners mines and delivers sand to Exploration and Production companies. Hi-Crush’s operations generate significant cash flows from operations, and has generally maintained low debt leverage on its balance sheet. As a result, during 2018, Hi-Crush announced an aggressive payout policy that attracted many new investors to the company. While we ultimately viewed the aggressive payout policy as a risk to balance sheet health in a volatile sand market, the stock appreciated significantly, providing us with an attractive exit point for the stock.
Cheniere Energy (LNG)
Cheniere is the premier independent LNG importer/exporter in the US, with two facilities on the Gulf Coast. With long term contracts and first-mover advantages, including locations thoroughly integrated with gas infrastructure along the Gulf Coast, Cheniere has benefited from the low cost of economic natural gas production in the United States and the growing demand for natural gas outside the US. Cheniere has a relatively new, but experienced, management team who appears well-incentivized to succeed.
Top 5 Detractors to Performance
US Silica Holdings (SLCA)
US Silica Holdings mines and delivers sand used to produce oil and natural gas from shale formations. In the first half of 2018, oil prices rose, and companies drilling plans increased, increasing the demand for sand. In response, plans to increase sand supplies accelerated to meet expected demand, and expectations for sand prices fell, reducing profit expectations for sand companies.
NCI Building Systems (NCS)
After having reduced the portfolio weighting in the 2nd calendar quarter, NCI shares fell in the 3rd calendar quarter when the company merged with PlyGem, a private company. Prior to the merger, NCI generated significant cash flows from operations and had strong returns-on-capital. Furthermore, the companies have complimentary market positions in building materials and products, which would seemingly improve upon completion of the merger. However, the assumption of PlyGem’s large debt load is a departure from NCI historical strategy of financial conservatism and increasing the risk profile.
Cimarex Energy (XEC)
Cimarex Energy is a US Exploration and Production company with operations in Oklahoma and the Permian Basin in West Texas and New Mexico. Cimarex’s management team is keenly focused on the company’s
11
| Recurrent Natural Resources Fund (RNRGX) Recurrent MLP & Infrastructure Fund (RMLPX) Cycles happen. Invest accordingly. www.recurrentfunds.com |
returns-on-capital. Since the price received for oil produced in the Permian Basin is lower than in other parts of the US due to limited infrastructure capacity, management has diverted resources to its Oklahoma operations. Production in Oklahoma generally has a higher percentage of natural gas than production from West Texas and New Mexico. Therefore, in the short term, the value of production is lower because of the lower value Oklahoma production, but should improve when more resources are returned to the Permian Basin.
Newell Brands (NWL)
While we have not owned NWL since late 2017, the company produces a range of consumer goods manufactured from plastics and other chemical feedstocks. After several years of aggressively-financed acquisitions, NWL management announced in mid- and late-2017 that acquisition economics were tracking below expectations, and as a result cash available for shareholders would be significantly lower than Wall Street expectations.
Newfield Exploration (NFX)
During 2018, Newfield and other peer companies drilling for oil and natural gas in Oklahoma reduced their expectations for the percentage of oil (“oil cut”) coming from their wells in the future. In November 2018, NFX agreed to an all-stock takeout offer from Encana (ECA), a Canadian diversified E&P company. NFX agreed to the offer at a minimal premium to NFX’s historical trading range, which is a significant disappointment to us. As a standalone company, Newfield offered robust earnings growth combined with modest cash flow generation, and we believe Newfield continues to represent significant value at its current stock price.
Investments cannot be made in an index. Unmanaged index returns do not reflect any fees, expenses or sales charges. Past performance is no guarantee of future results and the index performance shown is not indicative of the performance of the Recurrent Funds.
Alerian MLP Index - is a composite of the 50 most prominent energy master limited partnerships calculated by Standard & Poor’s using a float-adjusted market capitalization methodology.
S&P 500 Index is an unmanaged composite of 500 large capitalization companies. This index is widely used by professional investors as a performance benchmark for large-cap stocks
S&P North American Natural Resources Index - seeks investment results that correspond generally to the price and yield performance, before fees and expenses, of U.S.-traded natural resource-related companies, including oil and gas production, transportation, refining, materials, and mining.
EBITDA - Earnings before interest, taxes, depreciation and amortization. EBITDA is a non-GAAP metric, typically used as a measure of a company’s operating cash flow, excluding changes in working capital.
EV/IC vs. ROIC - Enterprise Value / Invested Capital vs. Return on Invested Capital. Compares a company’s market value (EV) vs. the book value of its capital (IC).
Investors should carefully consider the investment objectives, risks, charges and expenses of the Recurrent Funds. This and other important information about the Funds is contained in the prospectus, which can be obtained by calling 832-241-5900. The prospectus should be read carefully before investing. The Recurrent Funds are distributed by Northern Lights Distributors, LLC, member FINRA/SIPC. Recurrent Investment Advisors is not affiliated with Northern Lights Distributors, LLC.
12
| Recurrent Natural Resources Fund (RNRGX) Recurrent MLP & Infrastructure Fund (RMLPX) Cycles happen. Invest accordingly. www.recurrentfunds.com |
Important Risk Disclosure (RNRGX)
Mutual Funds involve risk including the potential loss of principal. Higher turnover and frequent trading my result is higher costs. Cash available for distribution by MLP’s may vary and could be affected by the entity’s operations, including capital expenditures, operating, acquisition, construction, exploration and borrowing costs, reducing the amount of cash and MLP has available for distribution. MLP’s and other companies operating in the energy infrastructure industry may be affected by fluctuations in the prices of energy commodities. The Fund may focus on one or more industries, sectors or geographic regions of the economy and the value of an investment may fluctuate more widely than if it were diversified. The Fund could lose money if the issuer of a fixed income security in unwilling or unable to make payment. Cyber-attacks or failures affecting the Fund or service providers may adversely impact the Fund or its shareholders.
The value of fixed income securities and derivatives will fluctuate with changes in interest rates. Investments in high yield debt instruments may involve greater levels of interest rate, credit, liquidity and valuation risk than for higher rated instruments. The purchase of IPO shares may involve high transaction cost, market and liquidity risks. The investment strategies employed by the Advisor may not result in an increase in value or performance. Overall equity market risk may affect the value of individual instruments in which the Fund invests. Holders of MLP’s have limited control and voting rights, additionally, there are certain tax risks and conflicts of interest between holders of MLP’s and the general partner. The Fund focuses investments in the natural resource sector which is susceptible to adverse economic, environmental, business, regulatory and other occurrences affecting that sector. The Fun is newly-formed and may not grow to or maintain economically viable size, not be successful implementing its investment strategy, which could result in the Fund being liquidated. If the Fund fails to qualify as a RIC, it would be taxed as an ordinary corporation, subject to corporate income tax. The resulting corporate taxes could substantially reduce the Fund’s net attest, the amount of income available for distribution, amount of distributions and have adverse effects on the Fund and its shareholders.
Important Risk Disclosure (RMLPX)
Mutual Funds involve risk including the potential loss of principal. Higher turnover and frequent trading my result is higher costs. Cash available for distribution by MLP’s may vary and could be affected by the entity’s operations, including capital expenditures, operating, acquisition, construction, exploration and borrowing costs, reducing the amount of cash and MLP has available for distribution. The Fund may focus on one or more industries, sectors or geographic regions of the economy and the value of an investment may fluctuate more widely than if it were diversified. Tax risks associated with the Fund include fund structure risk, MLP tax risk, and tax estimation/NAV risk. Cyber-attacks or failures affecting the Fund or service providers may adversely impact the Fund or its shareholders.
The Fund invests primarily in the energy sector and infrastructure industry and is susceptible to adverse economic, environmental, and regulatory concerns. Additional risks include acquisition, catastrophic event, commodity price, depletion, natural resource, supply/demand and weather risk. The purchase of IPO shares may involve high transaction cost, market and liquidity risks. The investment strategies employed by the Advisor may not result in an increase in value or performance. Overall equity market risk may affect the value of individual instruments in which the Fund invests. Holders of MLP’s have limited control and voting rights, additionally, there are certain tax risks and conflicts of interest between holders of MLP’s and the general partner. The Fun is newly-formed and may not grow to or maintain economically viable size, not be successful implementing its investment strategy, which could result in the Fund being liquidated. (9085-NLD-12/03/2018)
13
| Recurrent MLP & Infrastructure Fund |
| PORTFOLIO REVIEW (Unaudited) |
| October 31, 2018 |
The Fund’s performance figures* for the period ended October 31, 2018, compared to its benchmarks:
| Since Inception (a) | |
| Recurrent MLP & Infrastructure Fund - Class I | (3.10)% |
| Alerian MLP Index ** | (0.71)% |
| (a) | Inception date is November 2, 2017. |
| * | The performance data quoted is historical. Past performance is no guarantee of future results. Current performance may be higher or lower than the performance data quoted. The principal value and investment return of an investment will fluctuate so that your shares, when redeemed, may be worth more or less than their original cost. Total returns for periods of less than one year are not annualized. Total returns would have been lower absent the advisor fee waiver. The returns shown do not reflect the deduction of taxes that a shareholder would pay on Fund distributions or on the redemptions of Fund shares. The Advisor has contractually agreed to waive fees and/or reimburse expenses to the Fund until at least March 1, 2019 but only to the extent necessary to maintain the Fund’s total annual operating expenses (excluding brokerage costs; borrowing costs, such as (a) interest and (b) dividends on securities sold short; taxes; costs of investing in acquired funds, and extraordinary expenses) at 1.25% for Class I shares, per the most recent prospectus dated February 28, 2018. The Fund’s estimated total annual fund operating expense ratio, gross of fee waivers or expense reimbursements are 2.74% for Class I per the Fund’s Prospectus dated February 28, 2018. Each waiver or reimbursement by the Advisor is subject to repayment by the Fund within the three fiscal years following the fiscal year in which that particular expense is incurred, if the Fund is able to make the repayment without exceeding the expense limitation in effect at the time of the waiver and the repayment is approved by the Board of Trustees. For performance information current to the most recent month-end, please call 1-877-594-1249. |
| ** | The Alerian MLP Index is a float-adjusted, capitalization-weighted index, whose constituents represent approximately 85% of total float-adjusted market capitalization. This index provides a comprehensive benchmark for investors to track the performance of the energy MLP sector. Investors cannot invest directly in an index. |
Comparison of Change in Value of a $10,000 Investment
Since Inception November 2, 2017 through October 31, 2018
| Holdings by type of investment | % of Net Assets | |||
| Common Stocks | 20.7 | % | ||
| MLP & MLP Related Securities | 77.7 | % | ||
| Short-Term Investment | 1.7 | % | ||
| Other Assets Less Liabilities | (0.1 | )% | ||
| 100.0 | % | |||
| Please refer to the Portfolio of Investments that follows in this annual report for a detail of the Fund’s holdings. | ||||
14
| Recurrent Natural Resources Fund |
| PORTFOLIO REVIEW (Unaudited) |
| October 31, 2018 |
The Fund’s performance figures* for the year ended October 31, 2018, compared to its benchmark:
| Annualized | ||
| One Year | Since Inception (a) | |
| Recurrent Natural Resources Fund - Class I | (7.48)% | (6.86)% |
| S&P North American Natural Resources Sector Index ** | (2.56)% | (1.71)% |
| (a) | The inception date for the Recurrent Natural Resources Fund is October 27, 2017. Start of performance is October 30, 2017. |
| * | The performance data quoted is historical. Past performance is no guarantee of future results. Current performance may be higher or lower than the performance data quoted. The principal value and investment return of an investment will fluctuate so that your shares, when redeemed, may be worth more or less than their original cost. The returns shown do not reflect the deduction of taxes that a shareholder would pay on Fund distributions or on the redemptions of Fund shares. Total returns would have been lower absent the advisor fee waiver. The Advisor has contractually agreed to waive fees and/or reimburse expenses to the Fund until at least March 1, 2019 but only to the extent necessary to maintain the Fund’s total annual operating expenses (excluding brokerage costs; borrowing costs, such as (a) interest and (b) dividends on securities sold short; taxes; costs of investing in acquired funds, and extraordinary expenses) at 1.25% for Class I shares, per the most recent prospectus dated February 28, 2018. The Fund’s estimated total annual fund operating expense ratio, gross of fee waivers or expense reimbursements are 2.24% for Class I per the Fund’s Prospectus dated February 28, 2018. Each waiver or reimbursement by the Advisor is subject to repayment by the Fund within the three fiscal years following the fiscal year in which that particular expense is incurred, if the Fund is able to make the repayment without exceeding the expense limitation in effect at the time of the waiver and the repayment is approved by the Board of Trustees. For performance information current to the most recent month-end, please call 1-877-594-1249. |
| ** | The S&P North American Natural Resources Sector Index provides investors with a benchmark that represents U.S. traded securities that are classified under the GICS® energy and materials sector excluding the chemicals industry, and steel sub-industry. Investors cannot invest directly in an index. |
Comparison of Change in Value of a $10,000 Investment
October 27, 2017 through October 31, 2018
| Holdings by type of investment | % of Net Assets | |||
| Common Stocks | 80.9 | % | ||
| MLP & MLP Related Securities | 16.5 | % | ||
| Short-Term Investment | 3.6 | % | ||
| Other Assets Less Liabilities | (1.0 | )% | ||
| 100.0 | % | |||
| Please refer to the Portfolio of Investments that follows in this annual report for a detail of the Fund’s holdings. | ||||
15
| Recurrent MLP & Infrastructure Fund |
| PORTFOLIO OF INVESTMENTS |
| October 31, 2018 |
| Shares | Security | Fair Value | ||||||
| COMMON STOCKS - 20.7% | ||||||||
| PIPELINES - 20.7% | ||||||||
| 37,605 | Kinder Morgan, Inc. | $ | 640,037 | |||||
| 26,694 | Plains GP Holdings LP | 570,451 | ||||||
| 4,871 | Targa Resources Corp. | 251,685 | ||||||
| 13,067 | Williams Cos., Inc. (The) | 317,920 | ||||||
| TOTAL COMMON STOCKS (Cost - $1,936,560) | 1,780,093 | |||||||
| MLP & MLP RELATED SECURITIES - 77.7% | ||||||||
| OIL & GAS - 12.6% | ||||||||
| 17,788 | EQGP Holdings LP | 279,272 | ||||||
| 18,939 | Sunoco LP | 517,792 | ||||||
| 8,001 | Viper Energy Partners LP | 287,716 | ||||||
| 1,084,780 | ||||||||
| OIL & GAS SERVICES - 2.0% | ||||||||
| 11,800 | USA Compression Partners LP | 172,870 | ||||||
| PIPELINES - 63.1% | ||||||||
| 45,989 | American Midstream Partners LP | 272,255 | ||||||
| 13,597 | Buckeye Partners LP | 446,118 | ||||||
| 12,516 | Crestwood Equity Partners LP | 421,914 | ||||||
| 5,913 | DCP Midstream LP | 212,809 | ||||||
| 8,066 | Delek Logistics Partners LP | 254,886 | ||||||
| 38,806 | Enable Midstream Partners LP | 573,165 | ||||||
| 56,745 | Energy Transfer LP | 881,817 | ||||||
| 15,088 | Enterprise Products Partners LP | 404,660 | ||||||
| 7,774 | EQM Midstream Partners LP | 356,904 | ||||||
| 4,808 | Magellan Midstream Partners LP | 296,557 | ||||||
| 11,071 | MPLX LP | 372,096 | ||||||
| 12,286 | Noble Midstream Partners LP | 419,444 | ||||||
| 12,807 | Western Gas Partners LP | 506,645 | ||||||
| 5,419,270 | ||||||||
| TOTAL MLP & MLP RELATED SECURITIES (Cost - $7,164,373) | 6,676,920 | |||||||
| SHORT-TERM INVESTMENT - 1.7% | ||||||||
| MONEY MARKET FUND - 1.7% | ||||||||
| 146,866 | Federated Government Obligations Fund - Institutional Class, 2.04% ^ | 146,866 | ||||||
| TOTAL SHORT-TERM INVESTMENT (Cost - $146,866) | ||||||||
| TOTAL INVESTMENTS - 100.1% (Cost - $9,247,799) | $ | 8,603,879 | ||||||
| ASSETS LESS OTHER LIABILITIES - (0.1)% | (12,838 | ) | ||||||
| NET ASSETS - 100.0% | $ | 8,591,041 | ||||||
| ^ | Money Market Fund; interest rate reflects effective yield on October 31, 2018. |
The accompanying notes are an integral part of these financial statements.
16
| Recurrent Natural Resources Fund |
| PORTFOLIO OF INVESTMENTS |
| October 31, 2018 |
| Shares | Security | Fair Value | ||||||
| COMMON STOCKS - 80.9% | ||||||||
| AUTO PARTS & EQUIPMENT - 2.2% | ||||||||
| 1,728 | Goodyear Tire & Rubber Co. (The) | $ | 36,392 | |||||
| BUILDING MATERIALS - 1.6% | ||||||||
| 2,088 | NCI Building Systems, Inc. * | 25,578 | ||||||
| CHEMICALS - 2.6% | ||||||||
| 429 | Albemarle Corp. | 42,565 | ||||||
| MINING - 7.6% | ||||||||
| 4,527 | Barrick Gold Corp. | 56,814 | ||||||
| 8,214 | Glencore PLC - ADR | 66,369 | ||||||
| 123,183 | ||||||||
| OIL & GAS - 44.0% | ||||||||
| 7,861 | Cenovus Energy, Inc. | 66,504 | ||||||
| 336 | Chevron Corp. | 37,515 | ||||||
| 716 | Cimarex Energy Co. | 56,901 | ||||||
| 746 | ConocoPhillips | 52,145 | ||||||
| 652 | Diamondback Energy, Inc. | 73,259 | ||||||
| 1,143 | Exxon Mobil Corp. | 91,074 | ||||||
| 2,331 | Marathon Oil Corp. | 44,266 | ||||||
| 638 | Marathon Petroleum Corp. | 44,947 | ||||||
| 1,937 | Newfield Exploration Co. * | 39,127 | ||||||
| 1,087 | Noble Energy, Inc. | 27,012 | ||||||
| 5,300 | Oasis Petroleum, Inc. * | 53,318 | ||||||
| 1,561 | Parsley Energy, Inc. * | 36,559 | ||||||
| 4,329 | WildHorse Resource Development Corp. * | 91,818 | ||||||
| 714,445 | ||||||||
| OIL & GAS SERVICES - 10.6% | ||||||||
| 1,210 | Dril-Quip, Inc. * | 51,498 | ||||||
| 1,761 | Halliburton Co. | 61,071 | ||||||
| 2,204 | Keane Group, Inc. * | 27,704 | ||||||
| 2,244 | US Silica Holdings, Inc. | 31,416 | ||||||
| 171,689 | ||||||||
| PACKAGING & CONTAINERS - 2.5% | ||||||||
| 955 | WestRock Co. | 41,036 | ||||||
| PIPELINES - 9.8% | ||||||||
| 5,120 | Kinder Morgan, Inc. | 87,142 | ||||||
| 3,407 | Plains GP Holdings LP | 72,808 | ||||||
| 159,950 | ||||||||
| TOTAL COMMON STOCKS (Cost - $1,500,651) | 1,314,838 | |||||||
The accompanying notes are an integral part of these financial statements.
17
| Recurrent Natural Resources Fund |
| PORTFOLIO OF INVESTMENTS (Continued) |
| October 31, 2018 |
| Shares | Security | Fair Value | ||||||
| MLP & MLP RELATED SECURITIES - 16.5% | ||||||||
| OIL & GAS - 5.8% | ||||||||
| 2,820 | EQGP Holdings LP | $ | 44,274 | |||||
| 1,838 | Sunoco LP | 50,251 | ||||||
| 94,525 | ||||||||
| PIPELINES - 10.7% | ||||||||
| 4,853 | Energy Transfer Equity LP | 75,416 | ||||||
| 2,259 | Enterprise Products Partners LP | 60,586 | ||||||
| 1,116 | Noble Midstream Partners LP | 38,100 | ||||||
| 174,102 | ||||||||
| TOTAL MLP & MLP RELATED SECURITIES (Cost - $315,725) | 268,627 | |||||||
| SHORT-TERM INVESTMENT - 3.6% | ||||||||
| MONEY MARKET FUND - 3.6% | ||||||||
| 57,858 | Federated Government Obligations Fund - Institutional Class, 2.04% ^ | 57,858 | ||||||
| TOTAL SHORT-TERM INVESTMENT (Cost - $57,858) | ||||||||
| TOTAL INVESTMENTS - 101.0% (Cost - $1,874,234) | $ | 1,641,323 | ||||||
| ASSETS LESS OTHER LIABILITIES - (1.0)% | (15,499 | ) | ||||||
| NET ASSETS - 100.0% | $ | 1,625,824 | ||||||
| * | Non-income producing security. |
| ^ | Money Market Fund; interest rate reflects effective yield on October 31, 2018. |
The accompanying notes are an integral part of these financial statements.
18
| Recurrent Funds |
| STATEMENTS OF ASSETS AND LIABILITIES |
| October 31, 2018 |
| Recurrent MLP & | Recurrent Natural | |||||||
| Infrastructure Fund | Resources Fund | |||||||
| ASSETS | ||||||||
| Investment securities: | ||||||||
| At cost | $ | 9,247,799 | $ | 1,874,234 | ||||
| At fair value | $ | 8,603,879 | $ | 1,641,323 | ||||
| Receivable for Fund shares sold | 29,000 | — | ||||||
| Interest and dividends receivable | 45,348 | 4,688 | ||||||
| Receivable for securities sold | 902,341 | — | ||||||
| Receivable due from Advisor | 2,645 | 17,262 | ||||||
| Prepaid expenses & other assets | 10,013 | 10,322 | ||||||
| TOTAL ASSETS | 9,593,226 | 1,673,595 | ||||||
| LIABILITIES | ||||||||
| Payable for securities purchased | 929,642 | — | ||||||
| Payable for Fund shares redeemed | 34,317 | 15,683 | ||||||
| Payable to related parties | 7,009 | 2,972 | ||||||
| Audit and tax fees | 17,500 | 21,094 | ||||||
| Trustees fees | 2,697 | 2,763 | ||||||
| Accrued expenses and other liabilities | 7,328 | 5,259 | ||||||
| TOTAL LIABILITIES | 1,002,185 | 47,771 | ||||||
| NET ASSETS | $ | 8,591,041 | $ | 1,625,824 | ||||
| Net Assets Consist Of: | ||||||||
| Paid in capital ($0 par value, unlimited shares authorized) | $ | 9,198,404 | $ | 1,819,652 | ||||
| Accumulated earnings/(losses) | (607,363 | ) | (193,828 | ) | ||||
| NET ASSETS | $ | 8,591,041 | $ | 1,625,824 | ||||
| Net Asset Value Per Share: | ||||||||
| Class I Shares: | ||||||||
| Net Assets | $ | 8,591,041 | $ | 1,625,824 | ||||
| Shares of beneficial interest outstanding ($0 par value, unlimited shares authorized) | 473,662 | 87,344 | ||||||
| Net asset value (Net Assets ÷ Shares Outstanding), offering price and redemption price per share | $ | 18.14 | $ | 18.61 | ||||
The accompanying notes are an integral part of these financial statements.
19
| Recurrent Funds |
| STATEMENTS OF OPERATIONS |
| For the Periods* Ended October 31, 2018 |
| Rucurrent MLP & | Recurrent Natural | |||||||
| Infrastructure Fund* | Resources Fund | |||||||
| INVESTMENT INCOME | ||||||||
| Distributions from MLPs | $ | 168,506 | $ | — | ||||
| Dividends (Foreign Taxes Withheld $0 and $79) | 55,131 | 33,168 | ||||||
| Interest | 2,336 | 814 | ||||||
| TOTAL INVESTMENT INCOME | 225,973 | 33,982 | ||||||
| EXPENSES | ||||||||
| Investment advisory fees | 33,148 | 12,027 | ||||||
| Administrative services fees | 64,643 | 63,409 | ||||||
| Audit and tax fees | 73,200 | 27,000 | ||||||
| Legal fees | 27,392 | 28,519 | ||||||
| Transfer agent fees | 18,897 | 20,712 | ||||||
| Chief compliance officer fees | 16,518 | 12,465 | ||||||
| Trustees fees and expenses | 11,935 | 11,968 | ||||||
| Registration fees | 9,797 | 9,822 | ||||||
| Printing and postage expenses | 7,957 | 12,337 | ||||||
| Custodian fees | 7,460 | 7,479 | ||||||
| Insurance fees | 391 | 131 | ||||||
| Other expenses | 2,487 | 2,493 | ||||||
| TOTAL EXPENSES | 273,825 | 208,362 | ||||||
| Less: Fees waived/reimbursed by the Advisor | (227,498 | ) | (191,607 | ) | ||||
| NET EXPENSES | 46,327 | 16,755 | ||||||
| NET INVESTMENT INCOME | 179,646 | 17,227 | ||||||
| REALIZED AND UNREALIZED GAIN/(LOSS) ON INVESTMENTS | ||||||||
| Net realized gain/(loss) on investments | (143,089 | ) | 21,859 | |||||
| Total realized gain/(loss) | (143,089 | ) | 21,859 | |||||
| Net change in unrealized appreciation/(depreciation) on investments | (643,920 | ) | (233,492 | ) | ||||
| Total unrealized appreciation/(depreciation) | (643,920 | ) | (233,492 | ) | ||||
| NET REALIZED AND UNREALIZED LOSS ON INVESTMENTS | (787,009 | ) | (211,633 | ) | ||||
| NET DECREASE IN NET ASSETS RESULTING FROM OPERATIONS | $ | (607,363 | ) | $ | (194,406 | ) | ||
| * | Recurrent MLP & Infrastructure Fund commenced operations on November 2, 2017. |
The accompanying notes are an integral part of these financial statements.
20
| Recurrent Funds |
| STATEMENT OF CHANGES IN NET ASSETS |
| Recurrent MLP & | ||||
| Infrastructure Fund | ||||
| Period Ended | ||||
| October 31, | ||||
| 2018 (a) | ||||
| FROM OPERATIONS | ||||
| Net investment income | $ | 179,646 | ||
| Net realized loss on investments | (143,089 | ) | ||
| Net change in unrealized depreciation on investments | (643,920 | ) | ||
| Net decrease in net assets resulting from operations | (607,363 | ) | ||
| DISTRIBUTIONS TO SHAREHOLDERS | ||||
| Return of capital | (312,200 | ) | ||
| Net decrease in net assets from distributions to shareholders | (312,200 | ) | ||
| FROM SHARES OF BENEFICIAL INTEREST | ||||
| Proceeds from shares sold: | 10,161,046 | |||
| Net asset value of shares issued in reinvestment of distributions: | 284,477 | |||
| Payments for shares redeemed: | (934,919 | ) | ||
| Net increase in net assets from shares of beneficial interest | 9,510,604 | |||
| TOTAL INCREASE IN NET ASSETS | 8,591,041 | |||
| NET ASSETS | ||||
| Beginning of Period | — | |||
| End of Period | $ | 8,591,041 | ||
| SHARE ACTIVITY | ||||
| Shares Sold | 507,580 | |||
| Shares Reinvested | 14,936 | |||
| Shares Redeemed | (48,854 | ) | ||
| Net increase in shares of beneficial interest outstanding | 473,662 | |||
| (a) | Recurrent MLP & Infrastructure Fund commenced operations on November 2, 2017. |
The accompanying notes are an integral part of these financial statements.
21
| Recurrent Funds |
| STATEMENT OF CHANGES IN NET ASSETS |
| Recurrent Natural Resources Fund | ||||||||
| Year Ended | Period Ended | |||||||
| October 31, | October 31, | |||||||
| 2018 | 2017 (a) | |||||||
| FROM OPERATIONS | ||||||||
| Net investment income | $ | 17,227 | $ | 162 | ||||
| Net realized gain from investments | 21,859 | — | ||||||
| Net change in unrealized appreciation/(depreciation) on investments | (233,492 | ) | 581 | |||||
| Net increase/(decrease) in net assets resulting from operations | (194,406 | ) | 743 | |||||
| DISTRIBUTIONS TO SHAREHOLDERS | ||||||||
| Total distributions paid * | (165 | ) | — | |||||
| From distributions to shareholders | (165 | ) | — | |||||
| FROM SHARES OF BENEFICIAL INTEREST | ||||||||
| Proceeds from shares sold: | 2,083,957 | 126,133 | ||||||
| Net asset value of shares issued in reinvestment of distributions: | 136 | — | ||||||
| Payments for shares redeemed: | (390,574 | ) | — | |||||
| Net increase in net assets from shares of beneficial interest | 1,693,519 | 126,133 | ||||||
| TOTAL INCREASE IN NET ASSETS | 1,498,948 | 126,876 | ||||||
| NET ASSETS | ||||||||
| Beginning of Period | 126,876 | — | ||||||
| End of Period ** | $ | 1,625,824 | $ | 126,876 | ||||
| SHARE ACTIVITY | ||||||||
| Shares Sold | 99,727 | 6,307 | ||||||
| Shares Reinvested | 6 | — | ||||||
| Shares Redeemed | (18,696 | ) | — | |||||
| Net increase in shares of beneficial interest outstanding | 81,037 | 6,307 | ||||||
| * | Distributions from net investment income and net realized capital gains are combined for the year ended October 31, 2018. See “New Accounting Pronouncements” in the Notes to Financial Statements for more information. |
| ** | Net Assets- End of Period includes distributions in excess of net investment loss of $162 as of October 31, 2017. |
| (a) | Recurrent Natural Resources Fund commenced operations on October 27, 2017. |
The accompanying notes are an integral part of these financial statements.
22
| Recurrent MLP & Infrastructure Fund |
| FINANCIAL HIGHLIGHTS |
| Per Share Data and Ratios for a Share of Beneficial Interest Outstanding Throughout The Period |
| Class I (1) | ||||
| For the | ||||
| Period Ended | ||||
| October 31, 2018 | ||||
| Net asset value, beginning of period | $ | 20.00 | ||
| Activity from investment operations: | ||||
| Net investment income (2) | 0.97 | |||
| Net realized and unrealized loss on investments (3) | (1.53 | ) | ||
| Total from investment operations | (0.56 | ) | ||
| Less distributions from: | ||||
| Return of capital | (1.30 | ) | ||
| Net asset value, end of period | $ | 18.14 | ||
| Total return (4) | (3.10 | )% | ||
| Net assets, at end of period (000’s) | $ | 8,591 | ||
| Ratio of net expenses to average net assets (5)(6)(7) | 1.25 | % | ||
| Ratio of gross expenses to average net assets (5)(7) | 7.39 | % | ||
| Ratio of net investment income to average net assets (7) | 4.85 | % | ||
| Portfolio Turnover Rate (8) | 116 | % | ||
| (1) | The Recurrent MLP & Infrastructure Fund commenced operations on November 2, 2017. |
| (2) | Per share amounts calculated using the average shares method, which more appropriately presents the per share data for the period. |
| (3) | Net realized and unrealized gain/(loss) on investments per share are balancing amounts necessary to reconcile the change in net asset value per share for the period, and may not reconcile with aggregate gains/(losses) in the statement of operations due to the share transactions for the period. |
| (4) | Total returns are historical and assume changes in share price and reinvestment of dividends and distributions. Total returns for periods of less than one year are not annualized. Total returns would be lower absent fee waivers. |
| (5) | Does not include the expenses of other investment companies in which the Fund invests, if any. |
| (6) | Represents the ratio of expenses to average net assets net of fee waivers and/or expense reimbursements by the Advisor. |
| (7) | Annualized. |
| (8) | Not annualized. |
The accompanying notes are an integral part of these financial statements.
23
| Recurrent Natural Resources Fund |
| FINANCIAL HIGHLIGHTS |
| Per Share Data and Ratios for a Share of Beneficial Interest Outstanding Throughout Each Period |
| Class I | ||||||||
| For the | For the | |||||||
| Year Ended | Period Ended | |||||||
| October 31, 2018 | October 31, 2017 (1) | |||||||
| Net asset value, beginning of period | $ | 20.12 | $ | 20.00 | ||||
| Activity from investment operations: | ||||||||
| Net investment income (2) | 0.27 | 0.03 | ||||||
| Net realized and unrealized gain on investments (3) | (1.78 | ) | 0.09 | |||||
| Total from investment operations | (1.51 | ) | 0.12 | |||||
| Less distributions from: | ||||||||
| Net investment income | (0.00 | ) (9) | — | |||||
| Net asset value, end of period | $ | 18.61 | $ | 20.12 | ||||
| Total return (4) | (7.48 | )% | 0.60 | % | ||||
| Net assets, at end of period (000’s) | $ | 1,626 | $ | 127 | ||||
| Ratio of net expenses to average net assets (5)(8) | 1.25 | % | 1.25 | % (6) | ||||
| Ratio of gross expenses to average net assets (5) | 15.54 | % | 155.35 | % (6) | ||||
| Ratio of net investment income to average net assets | 1.29 | % | 46.90 | % (6) | ||||
| Portfolio Turnover Rate | 160 | % | 0 | % (7) | ||||
| (1) | The Recurrent Natural Resources Fund Class I shares commenced operations on October 27, 2017. Start of performance is October 30, 2017. |
| (2) | Per share amounts calculated using the average shares method, which more appropriately presents the per share data for the period. |
| (3) | Net realized and unrealized gain/(loss) on investments per share are balancing amounts necessary to reconcile the change in net asset value per share for the period, and may not reconcile with aggregate gains/(losses) in the statement of operations due to the share transactions for the period. |
| (4) | Total returns are historical and assume changes in share price and reinvestment of dividends and distributions. Total returns for periods of less than one year are not annualized. Total returns would be lower absent fee waivers. |
| (5) | Does not include the expenses of other investment companies in which the Fund invests, if any. |
| (6) | Annualized. |
| (7) | Not Annualized. |
| (8) | Represents the ratio of expenses to average net assets absent fee waivers and/or expense reimbursements by the Advisor. |
| (9) | Amount represents less than $0.005. |
The accompanying notes are an integral part of these financial statements.
24
| Recurrent Funds |
| NOTES TO FINANCIAL STATEMENTS |
| October 31, 2018 |
| 1. | ORGANIZATION |
Recurrent MLP & Infrastructure Fund (the “MLP Fund”) and Recurrent Natural Resources Fund (the “Natural Resources Fund”), each a “Fund” or collectively the “Funds,” are each a series of shares of beneficial interest of the Two Roads Shared Trust (the “Trust”), a statutory trust organized under the laws of the State of Delaware on June 8, 2012, and are registered under the Investment Company Act of 1940, as amended (the “1940 Act”), as non-diversified, open-end management investment companies. The Funds each offer Class I shares. The MLP Fund commenced investment operations for Class I shares on November 2, 2017. The Natural Resources Fund commenced investment operations for Class I shares on October 27, 2017. The MLP Fund’s investment objective is to seek total return including substantial current income from a portfolio of MLP and energy infrastructure investments. The Natural Resources Fund’s investment objective is to seek total return. The Natural Resources Fund seeks to achieve its investment objective by investing in publicly traded equity and debt securities of U.S. natural resource-related companies.
| 2. | SIGNIFICANT ACCOUNTING POLICIES |
The following is a summary of significant accounting policies followed by the Funds in preparation of their financial statements. These policies are in conformity with U.S. generally accepted accounting principles in the United States of America (“GAAP”). The preparation of the financial statements requires management to make estimates and assumptions that affect the reported amounts of assets and liabilities and disclosure of contingent assets and liabilities at the date of the financial statements and the reported amounts of income and expenses for the period. Actual results could differ from those estimates. The Funds are each a series of a registered investment companies and accordingly follow the investment company accounting and reporting guidance of the Financial Accounting Standards Board (“FASB”) Accounting Standard Codification Topic 946 “Financial Services – Investment Companies”.
Securities Valuation – Securities listed on an exchange are valued at the last reported sale price at the close of the regular trading session of the exchange on the business day the value is being determined, or in the case of securities listed on NASDAQ at the NASDAQ Official Closing Price (“NOCP”). In the absence of a sale, such securities shall be valued at the mean between the current bid and ask prices on the primary exchange on the day of valuation. Short-term debt obligations having 60 days or less remaining until maturity, at the time of purchase, may be valued at amortized cost.
Valuation of Underlying Funds – The Funds may invest in portfolios of open-end or closed-end investment companies (the “Underlying Funds”). The Underlying Funds value securities in their portfolios for which market quotations are readily available at their market values (generally the last reported sale price) and all other securities and assets at their fair value according to the methods established by the board of directors of the Underlying Funds.
Open-end investment companies are valued at their respective net asset values as reported by such investment companies. The shares of many closed-end investment companies, after their initial public offering, frequently trade at a price per share, which is different than the net asset value per share. The difference represents a market premium or market discount of such shares. There can be no assurances that the market discount or market premium on shares of any closed-end investment company purchased by the Fund will not change.
Master Limited Partnerships (“MLPs”) - An MLP is an entity receiving partnership taxation treatment under the Internal Revenue Code of 1986, as amended (the “Code”) the partnership interests or “units” of which are traded on securities exchanges like shares of corporate stock. To qualify as an MLP for U.S. federal income tax purposes, an entity must receive at least 90% of its income from qualifying sources such as interest, dividends, income and gain from mineral or natural resources activities, income and gain from the transportation or storage of certain fuels, and, in certain circumstances, income and gain from commodities or futures, forwards and options with respect to commodities. For this purpose, mineral or natural resources activities include exploration, development, production, mining, refining, marketing and transportation (including pipelines) of oil and gas, minerals, geothermal energy, fertilizer, timber or industrial source carbon dioxide.
A typical MLP consists of a general partner and limited partners; however, some entities receiving partnership taxation treatment under the Code are established as limited liability companies (LLCs). The general partner of an MLP manages the partnership, has an ownership stake in the partnership and in some cases the general partners are eligible to receive an incentive distribution. The limited partners provide capital to the partnership, receive common units of the partnership, have a limited role in the operation and management of the partnership and are entitled to receive cash distributions with respect to their units. Currently,
25
| Recurrent Funds |
| NOTES TO FINANCIAL STATEMENTS (Continued) |
| October 31, 2018 |
most MLPs operate in the energy, natural resources and real estate sectors. Due to their partnership structure, MLPs generally do not pay income taxes. Thus, unlike investors in corporate securities, direct MLP investors are generally not subject to double taxation (i.e., corporate level tax and tax on corporate dividends).
The Funds may hold securities, such as private investments, interest in commodity pools, other non-traded securities or temporarily illiquid securities, for which market quotations are not readily available or are determined to be unreliable. These securities will be valued using the “fair value” procedures approved by the Trust’s Board of Trustees (the “Board”). The Board has delegated execution of these procedures to a fair value team composed of one or more representatives from each of the (i) Trust, (ii) administrator, and (iii) advisor. The team may also enlist third party consultants such as a valuation specialist at a public accounting firm, valuation consultant or financial officer of a security issuer on an as-needed basis to assist in determining a security-specific fair value. The Board has also engaged a third party valuation firm to attend valuation meetings held by the Trust, review minutes of such meetings and report to the Board on a quarterly basis. The Board reviews and ratifies the execution of this process and the resultant fair value prices at least quarterly to assure the process produces reliable results.
Fair Valuation Process – The applicable investments are valued collectively via inputs from each group within the fair value team. For example, fair value determinations are required for the following securities: (i) securities for which market quotations are insufficient or not readily available on a particular business day (including securities for which there is a short and temporary lapse in the provision of a price by the regular pricing source), (ii) securities for which, in the judgment of the advisor, the prices or values available do not represent the fair value of the instrument. Factors which may cause the Advisor to make such a judgment include, but are not limited to, the following: only a bid price or an ask price is available; the spread between bid and ask prices is substantial; the frequency of sales; the thinness of the market; the size of reported trades; and actions of the securities markets, such as the suspension or limitation of trading; (iii) securities determined to be illiquid; (iv) securities with respect to which an event that will affect the value thereof has occurred (a “significant event”) since the closing prices were established on the principal exchange on which they are traded, but prior to a Fund’s calculation of its net asset value. Specifically, interests in commodity pools or managed futures pools are valued on a daily basis by reference to the closing market prices of each futures contract or other asset held by a pool, as adjusted for pool expenses. Restricted or illiquid securities, such as private investments or non-traded securities are valued via inputs from the Advisor based upon the current bid for the security from two or more independent dealers or other parties reasonably familiar with the facts and circumstances of the security (who should take into consideration all relevant factors as may be appropriate under the circumstances). If the Advisor is unable to obtain a current bid from such independent dealers or other independent parties, the fair value team shall determine the fair value of such security using the following factors: (i) the type of security; (ii) the cost at date of purchase; (iii) the size and nature of a Fund’s holdings; (iv) the discount from market value of unrestricted securities of the same class at the time of purchase and subsequent thereto; (v) information as to any transactions or offers with respect to the security; (vi) the nature and duration of restrictions on disposition of the security and the existence of any registration rights; (vii) how the yield of the security compares to similar securities of companies of similar or equal creditworthiness; (viii) the level of recent trades of similar or comparable securities; (ix) the liquidity characteristics of the security; (x) current market conditions; and (xi) the market value of any securities into which the security is convertible or exchangeable.
The Funds utilize various methods to measure the fair value of all of their investments on a recurring basis. GAAP establishes a hierarchy that prioritizes inputs to valuation methods. The three levels of input are:
Level 1 – Unadjusted quoted prices in active markets for identical assets and liabilities that a Fund has the ability to access.
Level 2 – Observable inputs other than quoted prices included in Level 1 that are observable for the asset or liability, either directly or indirectly. These inputs may include quoted prices for the identical instrument in an inactive market, prices for similar instruments, interest rates, prepayment speeds, credit risk, yield curves, default rates and similar data.
Level 3 – Unobservable inputs for the asset or liability, to the extent relevant observable inputs are not available; representing a Fund’s own assumptions about the assumptions a market participant would use in valuing the asset or liability, and would be based on the best information available.
26
| Recurrent Funds |
| NOTES TO FINANCIAL STATEMENTS (Continued) |
| October 31, 2018 |
The availability of observable inputs can vary from security to security and is affected by a wide variety of factors, including, for example, the type of security, whether the security is new and not yet established in the marketplace, the liquidity of markets, and other characteristics particular to the security. To the extent that valuation is based on models or inputs that are less observable or unobservable in the market, the determination of fair value requires more judgment. Accordingly, the degree of judgment exercised in determining fair value is greatest for instruments categorized in Level 3.
The inputs used to measure fair value may fall into different levels of the fair value hierarchy. In such cases, for disclosure purposes, the level in the fair value hierarchy within which the fair value measurement falls in its entirety, is determined based on the lowest level input that is significant to the fair value measurement in its entirety.
The inputs or methodology used for valuing securities are not necessarily an indication of the risk associated with investing in those securities. The following tables summarize the inputs used as of October 31, 2018 for the Funds’ assets and liabilities measured at fair value:
| Recurrent MLP & Infrastructure Fund | ||||||||||||||||
| Assets * | Level 1 | Level 2 | Level 3 | Total | ||||||||||||
| Common Stocks | $ | 1,780,093 | $ | — | $ | — | $ | 1,780,093 | ||||||||
| MLP & MLP Related Securities | 6,676,920 | — | — | 6,676,920 | ||||||||||||
| Short-Term Investment | 146,866 | — | — | 146,866 | ||||||||||||
| Total Investments | $ | 8,603,879 | $ | — | $ | — | $ | 8,603,879 | ||||||||
| Recurrent Natural Resources Fund | ||||||||||||||||
| Assets * | Level 1 | Level 2 | Level 3 | Total | ||||||||||||
| Common Stocks | $ | 1,314,838 | $ | — | $ | — | $ | 1,314,838 | ||||||||
| MLP & MLP Related Securities | 268,627 | — | — | 268,627 | ||||||||||||
| Short-Term Investment | 57,858 | — | — | 57,858 | ||||||||||||
| Total Investments | $ | 1,641,323 | $ | — | $ | — | $ | 1,641,323 | ||||||||
| * | Refer to the Portfolio of Investments for classification. |
The Funds did not hold any Level 3 securities during the period ended October 31, 2018.
There were no transfers into or out of any Level during the reporting period. It is the Funds’ policy to recognize transfers into or out of any level at the end of the reporting period.
Security Transactions and Investment Income – Security transactions are accounted for on trade date basis. Interest income is recognized on an accrual basis. Discounts are accreted and premiums are amortized on securities purchased over the lives of the respective securities. Dividend income is recorded on the ex-dividend date. Realized gains or losses from sales of securities are determined by comparing the identified cost of the security lot sold with the net sales proceeds.
Dividends and Distributions to Shareholders – Dividends from net investment income are declared and distributed annually for the Natural Resources Fund. Dividends from net investment income are declared and distributed quarterly for the MLP Fund. Dividends from net realized capital gains are distributed annually. Dividends from net investment income and distributions from net realized gains are recorded on ex-dividend date and determined in accordance with federal income tax regulations, which may differ from GAAP. These “book/tax” differences are considered either temporary (i.e., deferred losses, capital loss carry forwards) or permanent in nature. To the extent these differences are permanent in nature, such amounts are reclassified within the composition of net assets based on their federal tax-basis treatment. Temporary differences do not require reclassification.
Federal Income Taxes – It is the Natural Resources Fund’s policy to qualify as a regulated investment company by complying with the provisions of the Internal Revenue Code that are applicable to regulated investment companies and to distribute substantially all of its taxable income and net realized gains to shareholders. Therefore, no federal income tax provision has been recorded.
27
| Recurrent Funds |
| NOTES TO FINANCIAL STATEMENTS (Continued) |
| October 31, 2018 |
The Natural Resources Fund recognizes the tax benefits of uncertain tax positions only where the position is “more likely than not” to be sustained assuming examination by tax authorities. Management has analyzed the Natural Resources Fund’s tax positions and has concluded that no liability for unrecognized tax benefits should be recorded related to uncertain tax positions taken on returns filed for open tax years ended October 31, 2017, or expected to be taken in the Fund’s October 31, 2018 year-end tax return. The Natural Resources Fund identifies its major tax jurisdictions as U.S. Federal and foreign jurisdictions where the Natural Resources Fund makes significant investments. The Natural Resources Fund is not aware of any tax positions for which it is reasonably possible that the total amounts of unrecognized tax benefits will change materially in the next twelve months.
MLP Income Taxes – The MLP Fund, as a corporation, is obligated to pay federal and state income tax on its taxable income. The MLP Fund does not intend to qualify as a regulated investment company pursuant to Subchapter M of the Internal Revenue Code. The MLP Fund intends to invest its assets primarily in MLPs, which generally are treated as partnerships for federal income tax purposes. As a limited partner in the MLPs, the MLP Fund reports its allocable share of the MLP’s taxable income in computing its own taxable income. Currently, the federal income tax rate for a corporation is 21 percent.
Cash distributions from MLPs to the MLP Fund are generally considered a tax-deferred return of capital that will reduce the MLP Fund’s adjusted tax basis in the MLP investments, to the extent that such basis exists. These reductions in the MLP Fund’s MLP investments’ adjusted tax basis will increase the amount of gain (or decrease the amount of loss) recognized by the MLP Fund on a subsequent sale of the MLP investments. The MLP Fund will accrue deferred income taxes for any future tax liability associated with (i) that portion of MLP distributions considered to be a tax-deferred return of capital as well as (ii) capital appreciation of its investments. Upon the sale of an MLP, the MLP Fund may be liable for previously deferred taxes. The MLP Fund will rely to some extent on information provided by the MLPs, which is not necessarily timely, to estimate its deferred tax liability for purposes of financial statement reporting and determining the NAV. From time to time, the MLP Fund will modify the estimates or assumptions related to the MLP Fund’s deferred tax liability as new information becomes available. The MLP Fund will generally compute deferred income taxes based on the federal income tax rate applicable to corporations and an assumed rate attributable to state taxes.
Expenses – Expenses of the Trust that are directly identifiable to a specific fund are charged to that fund. Expenses, which are not readily identifiable to a specific fund, are allocated in such a manner as deemed equitable, taking into consideration the nature and type of expense and the relative sizes of the funds in the Trust.
Indemnification – The Trust indemnifies its officers and Trustees for certain liabilities that may arise from the performance of their duties to the Trust. Additionally, in the normal course of business, the Funds enter into contracts that contain a variety of representations and warranties and which provide general indemnities. The Funds’ maximum exposure under these arrangements is unknown, as this would involve future claims that may be made against the Funds that have not yet occurred. However, the risk of loss due to these warranties and indemnities appears to be remote.
| 3. | INVESTMENT TRANSACTIONS AND ASSOCIATED RISKS |
For the year or period ended October 31, 2018, the aggregate purchases and sales of investments (excluding short-term investments) were:
| Recurrent Natural | ||||||||
| MLP & Infrastructure | Resources Fund | |||||||
| Purchases | $ | 13,838,470 | $ | 3,686,745 | ||||
| Sales | $ | 4,594,449 | $ | 2,014,399 | ||||
Please refer to each Fund’s prospectus and statement of additional information (“SAI”) for a full listing of risks associated with each Fund’s investments. These and other risks are also discussed more fully in each Fund’s prospectus and SAI which include but are not limited to activite trading risk, cash flow risk, commodities risk, commodity price risk, concentration risk, credit risk, energy sector focus risk, energy infrastructure industry focus risks, acquisition risk, catastrophic event risk, depletion risk, environmental and regulatory risk, interest rate risk, natural resources risk, supply and demand risk, weather risk, equity risk, fixed income risk, futures contract risk, geographic and sector risk, high yield risk, IPO risk, leveraging risk, liquidity risk, management risk, market capitalization risk, market events risk, market risk, master limited partnership risk, MLP tax risk, non-diversification risk, and tax risk.
28
| Recurrent Funds |
| NOTES TO FINANCIAL STATEMENTS (Continued) |
| October 31, 2018 |
Concentration Risk – Because the Funds may focus on one or more industries or sectors of the economy, their performance depends in large part on the performance of those sectors or industries. As a result, the value of an investment may fluctuate more widely than it would in a fund that is diversified across industries and sectors.
Equity Risk – The Funds are subject to equity risk. The market value of equities, such as common stocks or equity related investments, such as futures and options, may decline due to general market conditions, such as political or macroeconomic factors. Additionally, equities may decline in value due to specific factors affecting a related industry or industries. Equity securities are susceptible volatile increases and decreases in value as market confidence in and perceptions of their issuers change. Each equity security and equity related investments generally have greater market price volatility than fixed income securities.
Market Risk – Overall securities market risk may affect the value of individual instruments in which a Fund invests. Factors such as domestic and foreign economic growth and market conditions, interest rate levels, and political events affect the securities markets.
Master Limited Partnership Risk – An investment in MLP units involves certain risks which differ from an investment in the securities of a corporation. Holders of MLP units have limited control and voting rights on matters affecting the partnership. In addition, there are certain tax risks associated with an investment in MLP units and conflicts of interest exist between common unit holders of MLPs and the general partner, including those arising from incentive distribution payments.
MLP Tax Risk – Historically, MLPs have been able to offset a significant portion of their taxable income with tax deductions, including depreciation and amortization expense deductions. A change in current tax law, or a change in the business of a given MLP, could result in an MLP being treated as a corporation or other form of taxable entity for U.S. federal income tax purposes, which would result in the MLP being required to pay U.S. federal income tax, excise tax or another form of tax on its taxable income. The classification of an MLP as a corporation or other form of taxable entity for U.S. federal income tax purposes could reduce the amount of cash available for distribution by the MLP and could cause any such distributions received by the MLP Fund to be taxed as dividend income, return of capital, or capital gain. Therefore, if any MLPs owned by the MLP Fund were treated as corporations or other forms of taxable entity for U.S. federal income tax purposes, the after-tax return to a Fund with respect to its investment in such MLPs could be materially reduced which could cause a material decrease in the net asset value per share (“NAV”) of the MLP Fund’s shares.
Natural Resources Sector Focus Risk – The Natural Resources Fund focuses its investments in the natural resources sector which is comprised of natural resources, energy, industrial, consumer, infrastructure and logistics companies, and will therefore be susceptible to adverse economic, environmental, business, regulatory or other occurrences affecting that sector. The natural resources sector has historically experienced substantial price volatility. At times, the performance of these investments may lag the performance of other sectors or the market as a whole. Companies operating in the natural resources sector are subject to specific risks, including, among others, fluctuations in commodity prices; reduced consumer demand for commodities such as oil, natural gas or petroleum products; reduced availability of natural gas or other commodities for transporting, processing, storing or delivering; slowdowns in new construction; domestic and global competition, extreme weather or other natural disasters; and threats of attack by terrorists on energy assets. Additionally, natural resource sector companies are subject to substantial government regulation, including environmental regulation and liability for environmental damage, and changes in the regulatory environment for energy companies may adversely impact their profitability. Over time, depletion of natural gas reserves and other natural resources reserves may also affect the profitability of natural resources companies.
| 4. | INVESTMENT ADVISORY AGREEMENT AND TRANSACTION WITH RELATED PARTIES |
Recurrent Investment Advisors, LLC serves as the Funds’ investment advisor. Pursuant to an advisory agreement with the Trust on behalf of the Funds, the Advisor, under the oversight of the Board, directs the daily operations of the Funds and supervises the performance of administrative and professional services provided by others. As compensation for its services and the related expenses borne by the Advisor, the Funds pay the Advisor a fee computed and accrued daily paid monthly, based on each Fund’s average daily net assets and is computed at the annual rate of 0.90%. Pursuant to the advisory agreement, the MLP Fund and the Natural Resources Fund accrued $33,148 and $12,027, respectively, in advisory fees for the year or period ended October 31, 2018. As of October 31, 2018, the amounts due to the MLP Fund and the Natural Resources Fund from the Advisor were $2,645 and $17,262, respectively.
29
| Recurrent Funds |
| NOTES TO FINANCIAL STATEMENTS (Continued) |
| October 31, 2018 |
The Advisor has contractually agreed to reduce each Fund’s fees and/or absorb expenses of each Fund until at least March 1, 2019 to ensure that total annual Fund operating expenses after expense waiver and reimbursement (exclusive of any front-end or contingent deferred loads; brokerage fees and commissions; acquired fund fees and expenses; borrowing costs, such as interest and dividend expenses on securities sold short; taxes; and extraordinary expenses, such as litigation expenses) will not exceed 1.25% of average daily net assets attributable to Class I shares of each Fund. This agreement may be terminated by the Trust’s Board of Trustees on 60 days’ written notice to the advisor. These fee waivers and expense reimbursements are subject to possible recoupment from the Funds in future years on a rolling three year basis (within the three years after the fees have been waived or reimbursed) if such recoupment can be achieved within the foregoing expense limits. For the period ended October 31, 2018, the Advisor waived fees and reimbursed expenses for the MLP Fund and the Natural Resources Fund in the following amounts:
| FEES WAIVED/REIMBURSED | ||||
| MLP & Infrastructure | $ | 227,498 | ||
| Natural Resources | 191,607 | |||
Cumulative expenses previously waived or reimbursed subject to the aforementioned conditions will expire as presented in the table below:
| Natural Resources Fund | MLP & Infrastructure Fund | |||||||||
| 10/31/2020 | $ | 533 | 10/31/2021 | $ | 227,498 | |||||
| 10/31/2021 | 191,607 | |||||||||
The distributor of the Funds is Northern Lights Distributors, LLC (the “Distributor”), an affiliate of Gemini Fund Services, LLC. The Trust, on behalf of the Funds, has adopted the Trust’s Distribution and Shareholder Servicing Plan pursuant to Rule 12b-1 under the Investment Company Act of 1940 (the “Plan”), as amended, to pay for certain distribution activities and shareholder services. During the period ended October 31, 2018, the Funds did not pay distribution related charges pursuant to the Plan.
In addition, certain affiliates of the Distributor provide services to the Funds as follows:
Gemini Fund Services, LLC (“GFS”)
GFS, an affiliate of the Distributor, provides administration, fund accounting, and transfer agent services to the Trust. Pursuant to separate servicing agreements with GFS, the Funds pay GFS customary fees for providing administration, fund accounting and transfer agency services to the Funds. Certain officers of the Trust are also officers of GFS, and are not paid any fees directly by the Funds for serving in such capacities.
Northern Lights Compliance Services, LLC (“NLCS”)
NLCS, an affiliate of GFS and the Distributor, provides a Chief Compliance Officer to the Trust, as well as related compliance services, pursuant to a consulting agreement between NLCS and the Trust. Under the terms of such agreement, NLCS receives customary fees from the Funds.
Blu Giant, LLC (“Blu Giant”), an affiliate of GFS and the Distributor, provides EDGAR conversion and filing services as well as print management services for the Funds on an ad-hoc basis. For the provision of these services, Blu Giant receives customary fees from the Funds.
| 5. | AGGREGATE UNREALIZED APPRECIATION AND DEPRECIATION – TAX BASIS |
The identified cost of investments in securities owned by each Fund for federal income tax purposes, and its respective gross unrealized appreciation and depreciation at October 31, 2018, were as follows:
| Gross | Gross | Net Unrealized | ||||||||||||||
| Tax | Unrealized | Unrealized | Appreciation/ | |||||||||||||
| Cost | Appreciation | Depreciation | (Depreciation) | |||||||||||||
| MLP Fund | $ | 9,155,149 | $ | 109,580 | $ | (660,850 | ) | $ | (551,270 | ) | ||||||
| Natural Resources Fund | 1,887,356 | 13,361 | (259,394 | ) | (246,033 | ) | ||||||||||
30
| Recurrent Funds |
| NOTES TO FINANCIAL STATEMENTS (Continued) |
| October 31, 2018 |
| 6. | INCOME TAXES |
Total income taxes are computed by applying the federal statutory rate plus a blended state income tax rate to net investment income/loss and realized and unrealized gain/loss on investments. The federal statutory income tax rate is currently 21%. During the period ended October 31, 2018, the MLP Fund is using a blended state income tax rate of 2.76%. The reconciliation between the federal statutory income tax rate of 21% and the effective tax rate is as follows:
| As of October 31, 2018 | ||||
| Income tax expense at statutory rate | $ | (127,546 | ) | |
| State income taxes (net of federal benefit) | (16,763 | ) | ||
| Permanent Differences | (2,785 | ) | ||
| Valuation Allowance | 147,094 | |||
| Net income tax expense | $ | — | ||
The MLP Fund recognizes interest accrued related to unrecognized tax benefits and penalties as income tax expense. For the period ending October 31, 2018, the MLP Fund had no accrued penalties or interest.
Deferred tax assets and liabilities are measured using effective tax rates expected to apply to taxable income in the years such temporary differences are realized or otherwise settled. Components of the MLP Fund’s deferred tax assets and liabilities are as follows:
| As of October 31, 2018 | ||||
| Deferred tax assets: | ||||
| Net operating loss carryforward | $ | 9,304 | ||
| Net capital loss carryforward | 6,809 | |||
| Net unrealized loss on investments | 130,981 | |||
| Valuation Allowance | (147,094 | ) | ||
| Net Deferred Tax Asset / (Liability) | — | |||
The MLP Fund’s components of current and deferred tax expense/(benefit) are as follows:
| October 31, 2018 | Current | Deferred | Total | |||||||||
| Federal | $ | — | $ | (130,007 | ) | $ | (130,007 | ) | ||||
| State (net of federal benefit) | — | (17,087 | ) | (17,087 | ) | |||||||
| Valuation allowance | — | 147,094 | 147,094 | |||||||||
| Total tax expense | $ | — | $ | — | $ | — | ||||||
Net operating loss carryforwards are available to offset future taxable income and can be carried forward indefinitely. For federal income tax purposes the MLP Fund has net operating loss carryforwards as follows:
| Period-Ended | Amount | Expiration | ||||||
| October 31, 2018 | $ | 39,158 | Indefinite | |||||
31
| Recurrent Funds |
| NOTES TO FINANCIAL STATEMENTS (Continued) |
| October 31, 2018 |
Net capital loss carryforwards are available to offset future capital gains. Capital loss carryforwards can be carried forward for 5 years and carried back for 3 years. For federal income tax purposes the Fund has net capital loss carryforwards as follows:
| Period-Ended | Amount | Expiration | ||||
| October 31, 2018 | $ | 28,658 | October 31, 2023 | |||
The MLP Fund reviews the recoverability of its deferred tax assets based upon the weight of available evidence. When assessing the recoverability of its deferred tax assets, significant weight was given to the effects of potential future realized and unrealized gains on investments and the period over which these deferred tax assets can be realized. Any capital losses that may be generated by the MLP Fund are eligible to be carried back up to three years and can be carried forward for five years to offset capital gains recognized by the MLP Fund in those years. Net operating losses that may be generated by the MLP Fund are not eligible to be carried back and can be carried forward indefinitely to offset income generated by the MLP Fund in those years.
To the extent the MLP Fund has a deferred tax asset, consideration is given to whether or not a valuation allowance, which would offset the value of some or all of the deferred tax asset balance, is required. A valuation allowance is required if based on the evaluation criterion provided by Accounting Standards Codification (“ASC”) 740, Income Taxes (ASC 740) it is more likely than not that some portion, or all, of the deferred tax asset will not be realized. The factors considered in assessing the MLP Fund’s valuation allowance include: the nature, frequency and severity of current and cumulative losses, the duration of the statutory carryforward periods and the associated risks that operating and capital loss carryforwards may expire unutilized. From time to time, as new information becomes available, the MLP Fund will modify its estimates or assumptions regarding the deferred tax liability or asset.
Based upon the MLP Fund’s assessment, it has determined that is it “more likely than not” that its deferred tax assets will not be realized through future taxable income of the appropriate character. Accordingly, a valuation allowance has been established for the MLP Fund’s deferred tax assets. The MLP Fund will continue to assess the need for additional valuation allowance in the future. Significant increases in the fair value of its portfolio investments may change the MLP Fund’s assessment of the recoverability of these assets and may result in the removal of the valuation allowances against all or a portion of the MLP Fund’s gross deferred tax assets.
The MLP Fund recognizes the tax benefits of uncertain tax positions only where the position is “more likely than not” to be sustained assuming examination by tax authorities. Management has analyzed the MLP Fund’s tax positions, and has concluded that no liability for unrecognized tax benefits should be recorded related to uncertain tax positions taken by the MLP Fund. No U.S. federal or state income tax returns have yet been filed. Due to the nature of the MLP Fund’s investments, the MLP Fund may be required to file income tax returns in several states. The MLP Fund is not aware of any tax positions for which it is reasonably possible that the total amounts of unrecognized tax benefits will change materially in the next 12 months.
| 7. | DISTRIBUTION TO SHAREHOLDERS AND TAX COMPONENTS OF CAPITAL |
There were no distributions for the fiscal period ended October 31, 2017. The tax character of dividends paid during the period ended October 31, 2018 was as follows:
| Natural Resources | ||||||||
| Fiscal Year Ended | Fiscal Year Ended | |||||||
| October 31, 2018 | October 31, 2017 | |||||||
| Ordinary Income | $ | 165 | $ | — | ||||
| Long-Term Capital Gain | — | — | ||||||
| Return of Capital | — | — | ||||||
| $ | 165 | $ | — | |||||
32
| Recurrent Funds |
| NOTES TO FINANCIAL STATEMENTS (Continued) |
| October 31, 2018 |
As of October 31, 2018, the components of accumulated earnings/(deficit) on a tax basis were as follows:
| Undistributed | Undistributed | Post October Loss | Capital Loss | Other | Unrealized | Total | ||||||||||||||||||||
| Ordinary | Long-Term | and | Carry | Book/Tax | Appreciation/ | Accumulated | ||||||||||||||||||||
| Income | Gains | Late Year Loss | Forwards | Differences | (Depreciation) | Earnings/(Deficits) | ||||||||||||||||||||
| $ | 52,205 | $ | — | $ | — | $ | — | $ | — | $ | (246,033 | ) | $ | (193,828 | ) | |||||||||||
The difference between book basis and tax basis unrealized appreciation and undistributed net investment income is primarily attributable to tax adjustments for C-Corporation return of capital distributions, partnerships and the tax deferral of losses on wash sales.
| 8. | CONTROL OWNERSHIP |
The beneficial ownership, either directly or indirectly, of more than 25% of the voting securities of the Funds create presumption of control of the Funds, under Section 2(a) 9 of the Act. As of October 31, 2018, Charles Schwab & Co., Inc. held approximately 61% and 34% of the voting securities of the MLP Fund and the Natural Resources Fund, respectively.
| 9. | NEW ACCOUNTING PRONOUNCEMENTS |
In August 2018, the Securities and Exchange Commission adopted amendments to certain disclosure requirements under Regulation S-X to conform to US GAAP, including: (i) an amendment to require presentation of the total, rather than the components, of distributable earnings on the Statement of Assets and Liabilities; and (ii) an amendment to require presentation of the total, rather than the components, of distributions to shareholders, except for tax return of capital distributions, if any, on the Statement of Changes in Net Assets. The amendments also removed the requirement for parenthetical disclosure of undistributed net investment income on the Statement of Changes in Net Assets. These amendments have been adapted effective with these financial statements.
In August 2018, the FASB issued Accounting Standards Update (“ASU”) No. 2018-13, which changes certain fair value measurement disclosure requirements. The new ASU, in addition to other modifications and additions, removes the requirement to disclose the amount and reasons for transfers between Level 1 and Level 2 of the fair value hierarchy, and the policy for the timing of transfers between levels. For investment companies, the amendments are effective for financial statements issued for fiscal years beginning after December 15, 2019, and interim periods within those fiscal years. Early adoption is allowed. At this time, management is evaluating the implications of the ASU and any impact on the financial statement disclosures.
| 10. | SUBSEQUENT EVENTS |
Subsequent events after the date of the Statements of Assets and Liabilities have been evaluated through the date the financial statements were issued. Management has determined that, other than the event described below, no events or transactions occurred requiring adjustment or disclosure in the financial statements.
At a Board meeting held on December 21, 2018, the Board approved the liquidation of the Recurrent Natural Resources Fund. The Fund will be liquidated and terminated on or about January 31, 2019.
33
Report of Independent Registered Public Accounting Firm
To the Board of Trustees of Two Roads Shared Trust
and the Shareholders of Recurrent MLP & Infrastructure Fund
Opinion on the Financial Statements
We have audited the accompanying statement of assets and liabilities, including the portfolio of investments, of Recurrent MLP & Infrastructure Fund (the Fund) as of October 31, 2018, the related statements of operations, changes in net assets and financial highlights for the period from November 2, 2017 (commencement of operations) through October 31, 2018, including the related notes (collectively, the financial statements). In our opinion, the financial statements present fairly, in all material respects, the financial position of the Fund as of October 31, 2018, the results of its operations, changes in its net assets and the financial highlights for the period from November 2, 2017 (commencement of operations) through October 31, 2018, in conformity with accounting principles generally accepted in the United States of America.
Basis for Opinion
These financial statements are the responsibility of the Fund’s management. Our responsibility is to express an opinion on the Fund’s financial statements based on our audit. We are a public accounting firm registered with the Public Company Accounting Oversight Board (United States) (PCAOB) and are required to be independent with respect to the Fund in accordance with U.S. federal securities laws and the applicable rules and regulations of the Securities and Exchange Commission and the PCAOB.
We conducted our audit in accordance with the standards of the PCAOB. Those standards require that we plan and perform the audit to obtain reasonable assurance about whether the financial statements are free of material misstatement, whether due to error or fraud. The Fund is not required to have, nor were we engaged to perform, an audit of its internal control over financial reporting. As part of our audit, we are required to obtain an understanding of internal control over financial reporting but not for the purpose of expressing an opinion on the effectiveness of the Fund’s internal control over financial reporting. Accordingly, we express no such opinion.
Our audit included performing procedures to assess the risks of material misstatement of the financial statements, whether due to error or fraud, and performing procedures that respond to those risks. Such procedures included examining, on a test basis, evidence regarding the amounts and disclosures in the financial statements. Our audit also included evaluating the accounting principles used and significant estimates made by management, as well as evaluating the overall presentation of the financial statements. Our procedures included confirmation of securities owned as of October 31, 2018, by correspondence with the custodians and brokers. We believe that our audit provides a reasonable basis for our opinion.
/s/ RSM US LLP
We have served as the auditor of one or more Recurrent Investment Advisors, LLC advised investment companies since 2017.
Denver, Colorado
December 28, 2018
34
Report of Independent Registered Public Accounting Firm
To the Board of Trustees of Two Roads Shared Trust
and the Shareholders of Recurrent Natural Resources Fund
Opinion on the Financial Statements
We have audited the accompanying statement of assets and liabilities, including the portfolio of investments, of Recurrent National Resources Fund (the Fund) as of October 31, 2018, the related statement of operations for the year then ended, the statements of changes in net assets and financial highlights for the year then ended and for the period from October 27, 2017 (commencement of operations) through October 31, 2017, including the related notes (collectively, the financial statements). In our opinion, the financial statements present fairly, in all material respects, the financial position of the Fund as of October 31, 2018, the results of its operations, changes in its net assets and the financial highlights for the year then ended and the period from October 27, 2017 (commencement of operations) through October 31, 2017, in conformity with accounting principles generally accepted in the United States of America.
Basis for Opinion
These financial statements are the responsibility of the Fund’s management. Our responsibility is to express an opinion on the Fund’s financial statements based on our audits. We are a public accounting firm registered with the Public Company Accounting Oversight Board (United States) (PCAOB) and are required to be independent with respect to the Fund in accordance with U.S. federal securities laws and the applicable rules and regulations of the Securities and Exchange Commission and the PCAOB.
We conducted our audits in accordance with the standards of the PCAOB. Those standards require that we plan and perform the audit to obtain reasonable assurance about whether the financial statements are free of material misstatement, whether due to error or fraud. The Fund is not required to have, nor were we engaged to perform, an audit of its internal control over financial reporting. As part of our audits, we are required to obtain an understanding of internal control over financial reporting but not for the purpose of expressing an opinion on the effectiveness of the Fund’s internal control over financial reporting. Accordingly, we express no such opinion.
Our audits included performing procedures to assess the risks of material misstatement of the financial statements, whether due to error or fraud, and performing procedures that respond to those risks. Such procedures included examining, on a test basis, evidence regarding the amounts and disclosures in the financial statements. Our audits also included evaluating the accounting principles used and significant estimates made by management, as well as evaluating the overall presentation of the financial statements. Our procedures included confirmation of securities owned as of October 31, 2018, by correspondence with the custodians and brokers. We believe that our audits provide a reasonable basis for our opinion.
Emphasis of Matter
As discussed in Note 10 to the financial statements, the Board of Trustees of Two Roads Shared Trust approved a plan to liquidate the Fund. The liquidation and termination of the Fund is expected to take place on or about January 31, 2019. Our opinion is not modified with respect to this matter.
/s/ RSM US LLP
We have served as the auditor of one or more Recurrent Investment Advisors, LLC advised investment companies since 2017.
Denver, Colorado
December 28, 2018
35
| Recurrent Funds |
| EXPENSE EXAMPLES (Unaudited) |
| October 31, 2018 |
As a shareholder of the Funds, you incur two types of costs: (1) transaction costs; (2) ongoing costs, including management fees; and other Fund expenses. This example is intended to help you understand your ongoing costs (in dollars) of investing in the Funds and compare these costs with the ongoing costs of investing in other mutual funds.
The example is based on an investment of $1,000 invested at the beginning of the period* and held for the entire period from May 1, 2018 through October 31, 2018.
Actual Expenses
The “Actual Expenses” line in the table below provides information about actual account values and actual expenses. You may use the information below, together with the amount you invested, to estimate the expenses that you paid over the period. Simply divide your account value by $1,000 (for example, an $8,600 account value divided by $1,000 = 8.6), then multiply the result by the number in the table under the heading entitled “Expenses Paid During Period” to estimate the expenses you paid on your account during this period.
Hypothetical Example for Comparison Purposes
The “Hypothetical” line in the table below provides information about hypothetical account values and hypothetical expenses based on each Fund’s actual expense ratio and an assumed rate of return of 5% per year before expenses, which is not the Fund’s actual return. The hypothetical account values and expenses may not be used to estimate the actual ending account balances or expenses you paid for the period. You may use this information to compare this 5% hypothetical example with the 5% hypothetical examples that appear in the shareholder reports of other funds.
Please note that the expenses shown in the table are meant to highlight your ongoing costs only and do not reflect any transactional costs, such as sales loads, or redemption fees. Therefore, the table is useful in comparing ongoing costs only, and will not help you determine the relative total costs of owning different funds. In addition, if these transactional costs were included, your costs would have been higher.
| Hypothetical (5% return before | ||||||||||||||||||||
| Actual | expenses) | |||||||||||||||||||
| Fund’s | Beginning | |||||||||||||||||||
| Annualized | Account | Ending | Expenses Paid | Ending | Expenses Paid | |||||||||||||||
| Expense Ratio | Value | Account Value | During Period | Account Value | During Period | |||||||||||||||
| Class I: | ||||||||||||||||||||
| Recurrent MLP & Infrastructure Fund* | 1.25% | $1,000.00 | $971.20 | $6.21 | $1,018.90 | $6.36 | ||||||||||||||
| Recurrent Natural Resources Fund** | 1.25% | $1,000.00 | $869.60 | $5.89 | $1,018.90 | $6.36 | ||||||||||||||
| * | Expense information is equal to the average account value over the period, multiplied by the Fund’s annualized expense ratio, multiplied by the number of days in the period (183) divided by the number of days in the fiscal year (365). |
36
| Recurrent Funds |
| SUPPLEMENTAL INFORMATION (Unaudited) |
| October 31, 2018 |
Trustees and Officers. The Trustees and officers of the Trust, together with information as to their principal business occupations during the past five years and other information, are shown below. Unless otherwise noted, the address of each Trustee and Officer is 17605 Wright Street, Suite 2, Omaha, Nebraska 68130.
Independent Trustees *
| Number of | |||||
| Portfolios | |||||
| Position(s) | Term and | Principal | Overseen In | Other Directorships | |
| Name, Address, | Held with | Length | Occupation(s) During | The Fund | Held During Past 5 |
| Year of Birth | Registrant | Served | Past 5 Years | Complex** | Years |
| Mark Garbin Year of Birth: 1951 | Trustee | Indefinite, Since 2012 | Managing Principal, Coherent Capital Management LLC (since 2008) | 2 | Northern Lights Fund Trust (since 2013); Northern Lights Variable Trust (for series not affiliated with the Funds since 2013); Forethought Variable Insurance Trust (since 2013); Northern Lights Variable Trust (since 2013); OHA Mortgage Strategies Fund (offshore), Ltd. (2014 -2017); and Altegris KKR Commitments Master Fund (since 2014); and OFI Carlyle Private Credit Fund (since March 2018) |
| Mark D. Gersten Year of Birth: 1950 | Chairman, Trustee | Indefinite, Since 2012 | Independent Consultant (since 2012); Senior Vice President – Global Fund Administration Mutual Funds & Alternative Funds, AllianceBernstein LP (1985 – 2011). | 2 | Northern Lights Fund Trust (since 2013); Northern Lights Variable Trust (for series not affiliated with the Funds since 2013); Altegris KKR Commitments Master Fund (since 2014); previously, Ramius Archview Credit and Distressed Fund (2015-2017); and Schroder Global Series Trust (2012 to 2017) |
Neil M. Kaufman Year of Birth: 1960 | Trustee, Audit Committee Chairman | Indefinite, Since 2012 | Managing Member, Kaufman & Associates, LLC (legal services)(Since 2016); Partner, Abrams Fensterman, Fensterman, Eisman, Formato, Ferrara & Wolf, LLP (legal services)(2010-2016) | 2 | Altegris KKR Commitments Master Fund (since 2014) |
| Anita K. Krug Year of Birth: 1969 | Trustee | Indefinite, Since 2012 | Interim Vice Chancellor for Academic Affairs (since 2018) University of Washington Bothell; Interim Dean (2017-2018), Professor (since 2016), Associate Professor (2014-2016); and Assistant Professor (2010-2014), University of Washington School of Law | 2 | Altegris KKR Commitments Master Fund (since 2014); Centerstone Investors Trust (since 2016) |
| * | Information is as of October 31, 2018. |
| ** | As of October 31, 2018, the Trust was comprised of 21 active portfolios managed by seven unaffiliated investment advisers and two affiliated investment advisers. The term “Fund Complex” applies only to those funds that (i) are advised by a common investment adviser or by an investment adviser that is an affiliated person of the investment adviser of any of the other funds in the Trust or (ii) hold themselves out to investors as related companies for purposes of investment and investor services. The Funds do not hold themselves out as related to any other series within the Trust for investment purpose. |
10/31/18 – Two Roads v2
37
| Recurrent Funds |
| SUPPLEMENTAL INFORMATION (Unaudited)(Continued) |
| October 31, 2018 |
Officers of the Trust*
| Number of | ||||
| Portfolios | Other | |||
| Position(s) | Overseen In | Directorships | ||
| Name, Address, | Held with | Principal Occupation(s) During | The Fund | Held During Past |
| Year of Birth | Registrant | Past 5 Years | Complex** | 5 Years |
| James Colantino 80 Arkay Drive Hauppauge, NY 11788 Year of Birth: 1969 | President Since Feb. 2017 Treasurer (2012 to 2017) | Senior Vice President (2012- present); Vice President (2004 to 2012); Gemini Fund Services, LLC. | N/A | N/A |
| Laura Szalyga 80 Arkay Drive Hauppauge, NY 11788 Year of Birth: 1978 | Treasurer Since Feb. 2017 | Vice President, Gemini Fund Services, LLC (since 2015); Assistant Vice President, Gemini Fund Services, LLC (2011-2014). | N/A | N/A |
| Richard A. Malinowski 80 Arkay Drive Hauppauge, NY 11788 Year of Birth: 1983 | Vice President Since Sep. 2018 Secretary Since 2013 | Senior Vice President (since 2017); Vice President and Counsel (2016-2017) and Assistant Vice President (2012 – 2016), Gemini Fund Services, LLC | N/A | N/A |
| William B. Kimme Year of Birth: 1962 | Chief Compliance Officer Since Inception | Senior Compliance Officer, Northern Lights Compliance Services, LLC (September 2011 -present) | N/A | N/A |
| * | Information is as of October 31, 2018. |
| ** | As of October 31, 2018, the Trust was comprised of 21 active portfolios managed by seven unaffiliated investment advisers and two affiliated investment advisers. The term “Fund Complex” applies only to those funds that (i) are advised by a common investment adviser or by an investment adviser that is an affiliated person of the investment adviser of any of the other funds in the Trust or (ii) hold themselves out to investors as related companies for purposes of investment and investor services. The Funds do not hold themselves out as related to any other series within the Trust for investment purpose. |
The Fund’s Statement of Additional Information (“SAI”) includes additional information about the Trustees and is available free of charge, upon request, by calling toll-free at 1-833-732-8773.
10 /31/18 – Two Roads v2
38
PRIVACY NOTICE
| FACTS | WHAT DOES TWO ROADS SHARED TRUST DO WITH YOUR PERSONAL INFORMATION |
| Why? | Financial companies choose how they share your personal information. |
| Federal law gives consumers the right to limit some but not all sharing. | |
Federal law also requires us to tell you how we collect, share, and protect your personal information. | |
| What? | THE TYPES OF PERSONAL INFORMATION WE COLLECT AND SHARE DEPENDS ON THE PRODUCT OR SERVICE THAT YOU HAVE WITH US. THIS INFORMATION CAN INCLUDE: |
| ● Social Security number and income | |
| ● Account transactions and transaction history | |
| ● Investment experience and purchase history | |
| When you are no longer our customer, we continue to share your information as described in this notice. | |
| How? | All financial companies need to share customers’ personal information to run their everyday business. In the section below, we list the reasons financial companies can share their customers’ personal information; the reason Two Roads Shared Trust chooses to share and whether you can limit this sharing. |
| Reasons we can share your personal information | Does Two Roads Shared Trust share? | Can you limit this sharing? |
| For our everyday business purposes – | ||
| such as to process your transactions, maintain your account(s), respond to court orders and legal investigations, or report to credit bureaus | YES | NO |
| For our marketing purposes – | NO | We do not share |
| to offer our products and services to you | ||
| For joint marketing with other financial companies | NO | We do not share |
| For our affiliates’ everyday business purposes – | NO | We do not share |
| information about your transactions and experiences | ||
| For our affiliates’ everyday business purposes – | NO | We do not share |
| information about your creditworthiness | ||
| For our affiliates to market to you | NO | We do not share |
| For nonaffiliates to market to you | NO | We do not share |
| Questions? | Call 1-402-895-1600 |
39
What we do
| How does Two Roads Shared Trust protect my personal information? | To protect your personal information from unauthorized access and use, we use security measures that comply with federal law.
These measures include computer safeguards and secured files and buildings. |
| Our service providers are held accountable for adhering to strict policies and procedures to prevent any misuse of your nonpublic personal information. | |
| How does Two Roads Shared Trust | We collect your personal information, for example, when you |
| collect my personal information? | |
| ● open an account or give us contact information | |
| ● provide account information or give us your income information | |
| ● make deposits or withdrawals from your account | |
| We also collect your personal information from other companies. | |
| Why can’t I limit all sharing? | Federal law gives you the right to limit only |
| ● sharing for affiliates’ everyday business purposes – information about your creditworthiness | |
| ● affiliates from using your information to market to you | |
| ● sharing for nonaffiliates to market to you | |
| State laws and individual companies may give you additional rights to limit sharing. | |
| Definitions | |
| Affiliates | Companies related by common ownership or control. They can be financial and nonfinancial companies. |
| ● Two Roads Shared Trust has no affiliates. | |
| Nonaffiliates | Companies not related by common ownership or control. They can be financial and nonfinancial companies. |
| ● Two Roads Shared Trust does not share with nonaffiliates so they can market to you. | |
| Joint marketing | A formal agreement between nonaffiliates financial companies that together market financial products or services to you. |
| ● Two Roads Shared Trust does not jointly market. |
40
PROXY VOTING POLICY
Information regarding how each Fund voted proxies relating to portfolio securities for the most recent twelve month period ended June 30 as well as a description of the policies and procedures that each Fund uses to determine how to vote proxies is available without charge, upon request, by calling 1-833-RECURRENT (1-833-732-8773) or by referring to the Securities and Exchange Commission’s (“SEC”) website at http://www.sec.gov.
PORTFOLIO HOLDINGS
Each Fund files its complete schedule of portfolio holdings with the SEC for the first and third quarters of each fiscal year on Form N-Q. Form N-Q is available on the SEC’s website at http://www.sec.gov. The information on Form N-Q is available without charge, upon request, by calling 1-833-RECURRENT (1-833-732-8773).
| INVESTMENT ADVISOR |
| Recurrent Investment Advisors, LLC |
| 3801 Kirby Drive, Suite 654 |
| Houston, TX 77098 |
| ADMINISTRATOR |
| Gemini Fund Services, LLC |
| 80 Arkay Drive, Suite 110 |
| Hauppauge, New York 11788 |
ITEM 2. CODE OF ETHICS.
| (a) | The registrant has, as of the end of the period covered by this report, adopted a code of ethics that applies to the registrant's principal executive officer, principal financial officer, and principal accounting officer or controller, or persons performing similar functions, regardless of whether these individuals are employed by the registrant or a third party. |
| (b) | During the period covered by this report, there were no amendments to any provision of the code of ethics. |
| (c) | During the period covered by this report, there were no waivers or implicit waivers of a provision of the code of ethics. |
ITEM 3. AUDIT COMMITTEE FINANCIAL EXPERT.
| The registrant’s Board of Trustees has determined that it does not have an audit committee financial expert serving on its audit committee. At this time, the registrant believes that the experience provided by each member of the audit committee together offer the registrant adequate oversight for the registrant’s level of financial complexity. |
ITEM 4. PRINCIPAL ACCOUNTANT FEES AND SERVICES.
| (a) | Audit Fees. The aggregate fees billed for each of the last two fiscal years for professional services rendered by the registrant's principal accountant for the audit of the registrant's annual financial statements or services that are normally provided by the accountant in connection with statutory and regulatory filings or engagements for those fiscal years are as follows:
|
| Trust Series | 2018 | 2017 |
Recurrent Natural Resources Fund Recurrent MLP & Infrastructure Fund | 15,000 17,500 | 5,000 -- |
| (b) | Audit-Related Fees. There were no fees billed in each of the last two fiscal years for assurances and related services by the principal accountant that are reasonably related to the performance of the audit of the registrant’s financial statements and are not reported under paragraph (a) of this item. |
| (c) | Tax Fees. The aggregate fees billed in each of the last two fiscal years for professional services rendered by the principal accountant for tax compliance are as follows: |
| Trust Series | 2018 | 2017 | |
| Recurrent Natural Resources Fund | 6,000 | 1,000 | |
| Recurrent MLP & Infrastructure Fund | 55,700 | -- |
| (d) | All Other Fees. The aggregate fees billed in each of the last two fiscal years for products and services provided by the registrant’s principal accountant, other than the services reported in paragraphs (a) through (c) of this item were $0 and $0 for the fiscal years ended October 31, 2014 and 2013 respectively. |
| (e)(1) | The audit committee does not have pre-approval policies and procedures. Instead, the audit committee or audit committee chairman approves on a case-by-case basis each audit or non-audit service before the principal accountant is engaged by the registrant. |
| (e)(2) | There were no services described in each of paragraphs (b) through (d) of this Item that were approved by the audit committee pursuant to paragraph (c)(7)(i)(C) of Rule 2-01 of Regulation S-X. |
| f) | Not applicable. The percentage of hours expended on the principal accountant's engagement to audit the registrant's financial statements for the most recent fiscal year that were attributed to work performed by persons other than the principal accountant's full-time, permanent employees was zero percent (0%). |
| (g) | All non-audit fees billed by the registrant's principal accountant for services rendered to the registrant for the fiscal years ended October 31, 2015 and 2014 respectively are disclosed in (b)-(d) above. There were no audit or non-audit services performed by the registrant's principal accountant for the registrant's adviser. |
ITEM 5. AUDIT COMMITTEE OF LISTED REGISTRANTS.
Not applicable
ITEM 6. SCHEDULE OF INVESTMENT
Included in annual report to shareholders filed under item 1 of this form.
ITEM 7. DISCLOSURE OF PROXY VOTING POLICIES AND PROCEDURES FOR CLOSED-END MANAGEMENT INVESTMENT COMPANIES.
Not applicable Fund is an open-end management investment company
ITEM 8. PORTFOLIO MANAGERS OF CLOSED-END MANAGEMENT INVESTMENT COMPANIES
Not applicable Fund is an open-end management investment company
ITEM 9. PURCHASES OF EQUITY SECURITIES BY CLOSED-END MANAGEMENT INVESTMENT COMPANY AND AFFILIATED PURCHASERS.
Not applicable Fund is an open-end management investment company
ITEM 10. SUBMISSION OF MATTERS TO A VOTE OF SECURITY HOLDERS.
Not applicable at this time.
ITEM 11. CONTROLS AND PROCEDURES.
| (a) | The registrant's principal executive and principal financial officers, or persons performing similar functions, have concluded that the registrant's disclosure controls and procedures (as defined in Rule 30a-3(c) under the 1940 Act, are effective, as of a date within 90 days of the filing date of this report, based on the evaluation of these controls and procedures required by Rule 30a-3(b) under the 1940 Act and Rule 15d-15(b) under the Securities Exchange Act of 1934, as amended. |
| (b) | There were no changes in the registrant's internal control over financial reporting (as defined in Rule 30a-3(d) under the 1940 Act) that occurred during the period covered by this report that have materially affected, or are reasonably likely to materially affect, the registrant's internal control over financial reporting. |
ITEM 12. EXHIBITS
| (1) | Code of Ethics for Principal Executive and Senior Financial Officers is attached hereto. |
| (2) | Certifications pursuant to Section 302 of the Sarbanes-Oxley Act of 2002 are filed herewith. |
| (3) | Certifications pursuant to Section 906 of the Sarbanes-Oxley Act of 2002 are filed herewith. |
SIGNATURES
Pursuant to the requirements of the Securities Exchange Act of 1934 and the Investment Company Act of 1940, the registrant has duly caused this report to be signed on its behalf by the undersigned, thereunto duly authorized.
Two Roads Shared Trust
| By James Colantino | /s/ James Colantino |
| Principal Executive Officer, | |
| Date: 1/8/2019 | |
Pursuant to the requirements of the Securities Exchange Act of 1934 and the Investment Company Act of 1940, this report has been signed below by the following person on behalf of the registrant and in the capacities and on the date indicated.
| By James Colantino | /s/ James Colantino |
| Principal Executive Officer | |
| Date: 1/8/2019 | |
Pursuant to the requirements of the Securities Exchange Act of 1934 and the Investment Company Act of 1940, this report has been signed below by the following person on behalf of the registrant and in the capacities and on the date indicated.
| By Laura Szalyga | /s/ Laura Szalyga |
| Principal Financial Officer | |
| Date: 1/8/2019 | |