united states
securities and exchange commission
washington, d.c. 20549
form n-csr
certified shareholder report of registered management
investment companies
Investment Company Act file number 811-22718
Two Roads Shared Trust
(Exact name of registrant as specified in charter)
17605 Wright Street, Omaha, NE 68130
(Address of principal executive offices) (Zip code)
Richard Malinowski, Gemini Fund Services, LLC.
80 Arkay Drive Suite 110, Hauppauge, NY 11788
(Name and address of agent for service)
Registrant's telephone number, including area code: 631-470-2600
Date of fiscal year end: 10/31
Date of reporting period: 10/31/18
ITEM 1. REPORTS TO SHAREHOLDERS.
| Affinity World Leaders Equity ETF |
| WLDR |
| October 31, 2018 |
| Annual Report |
| Advised by: |
| Regents Park Funds, LLC |
| 4041 MacArthur Blvd., Suite 155 |
| Newport Beach, CA 92660 |
| RegentsParkFunds.com |
| 1-866-866-4848 |
| Distributed by Northern Lights Distributors, LLC |
| Member FINRA |
Beginning on January 1, 2021, as permitted by regulations adopted by the Securities and Exchange Commission, paper copies of the Fund’s shareholder reports like this one will no longer be sent by mail, unless you specifically request paper copies of the reports. Instead, the reports will be made available on the Fund’s website www.RegentsParkFunds.com, and you will be notified by mail each time a report is posted and provided with a website link to access the report.
If you already elected to receive shareholder reports electronically, you will not be affected by this change and you need not take any action. You may elect to receive shareholder reports and other communications from the Fund electronically by contacting your financial intermediary (such as a broker-dealer or bank) or, if you are a direct investor, by following the instructions included with paper Fund documents that have been mailed to you.
Dear Shareholders:
The Affinity World Leaders Equity ETF (“WLDR”) has returned -9.92% since inception (Jan 16, 2018) through Oct 31, 2018.
WLDR holds securities in developed countries around the world. However, the bulk (nearly 60%), is invested in the United States. This allocation has helped WLDR’s performance because equity market returns in the US have been less negative than those in the rest of the world. The disparity in geographical performance reflects the growing divide in economic performance between the US and the rest of the world. Stronger economic growth in the US is also reflected in the appreciation of the US Dollar against most world currencies. The OECD has forecast that real GDP growth in the US will be much higher than other advanced economies in 2019 too. WLDR has further increased its weight to US equity securities after its most recent rebalance in October.
While most sectors of the equity markets have posted negative returns for the year, the Health Care and Utilities sectors have been lone bright spots. Elevated equity market volatility, especially in February and more recently in October, has been a departure from the more copacetic market environment of 2017. Investors appear to have sought refuge in less cyclical sectors. WLDR is diversified across sectors, with Financials, Health Care, and Technology having the highest weights.
From a factor standpoint, 2018 has been a year, thus far, where value has been out of favor. Global Growth indexes have outperformed their Value counterparts. By construction, WLDR relies heavily on value factors – specifically, StarMine’s Relative Value and Intrinsic Value factors. As a consequence, the reliance on value has been a drag on WLDR’s performance. This has been partially offset by the relatively better performance of StarMine’s Earnings Quality factor that is also used to construct WLDR. Equities that rank higher on this measure of earnings quality have slightly outperformed their lower-ranked counterparts. The former are represented to a greater extent in WLDR.
Our long track record at Affinity underlies our investment philosophy that equity securities sporting a combination of value, positive analyst revisions, price momentum, and earnings quality will outperform over the long term. We thank you for continued interest and investment in WLDR.
Regards,
Gregory Lai, CFA
CEO and Lead Portfolio Manager
The views in this report are those of the Fund’s management. This report contains certain forward-looking statements about factors that may affect the performance of the Fund in the future. These statements are based on the Fund’s management’s predictions and expectations concerning certain future events such as the performance of the economy as a whole and of specific industry sectors. Management believes these forward-looking statements are reasonable, although they are inherently uncertain and difficult to predict.
8604-NLD-12/28/2018
1
Affinity World Leaders Equity ETF
PORTFOLIO REVIEW (Unaudited)
October 31, 2018
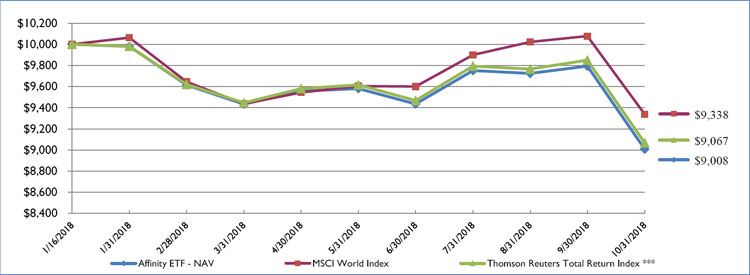
The Fund’s performance figures(*) for the period ended October 31, 2018, compared to its benchmark:
| Since Inception **** | |
| through October 31, 2018 | |
| Affinity World Leaders Equity ETF - NAV | (9.92)% |
| Affinity World Leaders Equity ETF - Market Price | (10.43)% |
| MSCI World Index ** | (6.62)% |
| Thomson Reuters Starmine Affinity World Leader Total Return Index *** | (9.33)% |
| * | The performance data quoted here represents past performance. Current performance may be lower or higher than the performance data quoted above. Investment return and principal value will fluctuate, so that shares, when redeemed, may be worth more or less than their original cost. The returns shown do not reflect the deduction of taxes that a shareholder would pay on Fund distributions or on the redemptions of Fund shares. Past performance is no guarantee of future results. Performance figures for periods less than 1 year are not annualized. The Fund’s adviser has contractually agreed to reduce the Fund’s fees and/or absorb expenses of the Fund until at least December 31, 2020 to ensure that total annual Fund operating expenses after fee waiver and reimbursement (exclusive of any taxes, interest, brokerage commissions, expenses incurred in connection with any merger or reorganization, indirect expenses, expenses of other investment companies in which the Fund may invest, or extraordinary expenses such as litigation) will not exceed 0.47% of average daily net assets. This agreement may be terminated by the Fund’s Board of Trustees on 60 days’ written notice to the adviser. These fee waivers and expense reimbursements are subject to possible recoupment from the Fund in future years on a rolling three year basis (within the three years after the fees have been waived or reimbursed) if such recoupment can be achieved within the foregoing expense limits as well as any expense limitation in effect at the time the reimbursement is made. Please review the Fund’s most recent prospectus for more detail on the expense waiver. |
The Fund’s per share net asset value or “NAV” is the value of one share of the Fund as calculated in accordance with the standard formula for valuing exchange traded fund shares. The NAV return is based on the NAV of the Fund and the market return is based on the market price per share of the Fund. The price used to calculate market return (“Market Price”) is determined by using the midpoint between the highest bid and the lowest offer on the primary stock exchange on which shares of the Fund are listed for trading, as of the time that the Fund’s NAV is calculated. Market and NAV returns assume that dividends and capital gain distributions have been reinvested in the Fund at Market Price and NAV, respectively. The Fund’s total annual operating expenses, are 0.47% per the most recent prospectus.
| ** | The MSCI World Index is a broad global equity index that represents large and mid-cap equity performance across 23 developed markets countries. It covers approximately 85% of the free float-adjusted market capitalization in each country and MSCI World Index does not offer exposure to emerging markets. The Fund’s portfolio holdings may differ significantly from the securities held in the Index, and unlike a mutual fund, an unmanaged index assumes no transaction costs, taxes, management fees or other expenses. Investors may not invest directly in an index. |
| *** | The Thomson Reuters Starmine Affinity World Leader Total Return Index consists of equity securities issued and traded in the US as well as international countries. The TRSAWL Index is expected to consist of approximately 150 to 250 stocks of companies located in the U.S. and in at least three countries outside of the U.S., and may invest in up to 20 countries. The TRSAWL Index will be significantly invested in the securities of international companies in addition to securities of U.S. companies. The Fund’s portfolio holdings may differ significantly from the securities held in the Index, and unlike a mutual fund, an unmanaged index assumes no transaction costs, taxes, management fees or other expenses. Investors may not invest directly in an index. |
| **** | As of the close of business on the day of commencement of trading January 16, 2018. |
Comparison of the Change in Value of a $10,000 Investment
2
Affinity World Leaders Equity ETF
PORTFOLIO REVIEW (Unaudited) (Continued)
October 31, 2018
Portfolio Composition as of October 31, 2018:
| Geographic Region | Percentage of Net Assets | |||
| United States | 61.0 | % | ||
| Japan | 14.0 | % | ||
| Great Britain | 9.4 | % | ||
| Europe | 6.0 | % | ||
| Canada | 2.3 | % | ||
| Sweden | 1.6 | % | ||
| Switzerland | 1.3 | % | ||
| Australia | 1.0 | % | ||
| Norway | 0.8 | % | ||
| Hong Kong | 0.5 | % | ||
| Other | 2.1 | % | ||
| 100.0 | % | |||
Please refer to the Schedule of Investments in this annual report for a detailed analysis of the Fund’s holdings.
3
Affinity World Leaders Equity ETF
SCHEDULE OF INVESTMENTS
October 31, 2018
| Shares | Fair Value | |||||||
| COMMON STOCKS - 95.1% | ||||||||
| AUSTRALIA - 0.8% | ||||||||
| 568 | Aristocrat Leisure Ltd. | $ | 10,668 | |||||
| 3,738 | Qantas Airways Ltd. | 14,492 | ||||||
| 7,197 | South32 Ltd. | 18,465 | ||||||
| 43,625 | ||||||||
| CANADA - 2.1% | ||||||||
| 1,379 | Bausch Health Cos., Inc. * | 31,628 | ||||||
| 249 | Canadian National Railway Co. | 21,338 | ||||||
| 223 | Methanex Corp. | 14,476 | ||||||
| 900 | Toronto-Dominion Bank | 50,049 | ||||||
| 117,491 | ||||||||
| EUROPE - 6.0% | ||||||||
| 4,196 | Aegon NV | 25,806 | ||||||
| 174 | Allianz SE | 36,363 | ||||||
| 750 | ArcelorMittal | 18,729 | ||||||
| 561 | ASR Nederland NV | 25,527 | ||||||
| 152 | Atos SE | 13,051 | ||||||
| 1,206 | AXA SA | 30,253 | ||||||
| 3,934 | Enel SpA * | 19,319 | ||||||
| 44 | Kering SA | 19,623 | ||||||
| 4,018 | Mediobanca Banca di Credito Finanziario SpA | 35,292 | ||||||
| 241 | OMV AG | 13,416 | ||||||
| 1,235 | Peugeot SA | 29,428 | ||||||
| 945 | ProSiebenSat.1 Media SE | 21,864 | ||||||
| 889 | Repsol SA | 15,940 | ||||||
| 553 | TOTAL SA | 32,557 | ||||||
| 337,168 | ||||||||
| GREAT BRITAIN - 9.4% | ||||||||
| 3,237 | 3i Group PLC | 36,323 | ||||||
| 1,017 | Anglo American PLC | 21,769 | ||||||
| 4,120 | Barratt Developments PLC | 27,059 | ||||||
| 4,593 | BP PLC | 33,293 | ||||||
| 1,029 | Coca-Cola European Partners PLC | 46,809 | ||||||
| 662 | Compass Group PLC | 13,027 | ||||||
| 2,470 | GlaxoSmithKline PLC | 47,694 | ||||||
| 1,332 | Imperial Brands PLC | 45,153 | ||||||
| 2,621 | Informa PLC | 23,898 | ||||||
| 1,946 | International Consolidated Airlines Group SA | 15,004 | ||||||
| 5,731 | J Sainsbury PLC | 22,789 | ||||||
| 11,909 | Legal & General Group PLC | 38,270 | ||||||
| 245 | Next PLC | 16,291 | ||||||
| 1,006 | Persimmon PLC | 29,488 | ||||||
| 1,084 | Royal Dutch Shell PLC | 34,634 | ||||||
| 13,900 | Taylor Wimpey PLC | 28,684 | ||||||
| 9,386 | Tesco PLC | 25,581 | ||||||
| 7,160 | Wm Morrison Supermarkets PLC | 22,698 | ||||||
| 528,464 | ||||||||
4
Affinity World Leaders Equity ETF
SCHEDULE OF INVESTMENTS (Continued)
October 31, 2018
| Shares | Fair Value | |||||||
| COMMON STOCKS - 95.1% (Continued) | ||||||||
| HONG KONG - 0.5% | ||||||||
| 9,936 | New World Development Co. Ltd. | $ | 12,598 | |||||
| 1,249 | Swire Pacific Ltd. | 12,961 | ||||||
| 25,559 | ||||||||
| JAPAN - 14.0% | ||||||||
| 832 | Alfresa Holdings Corp. | 22,228 | ||||||
| 1,355 | Asahi Kasei Corp. | 16,293 | ||||||
| 2,334 | Astellas Pharma, Inc. | 36,130 | ||||||
| 869 | Hitachi Ltd. | 26,658 | ||||||
| 417 | Hoya Corp. | 23,700 | ||||||
| 345 | Idemitsu Kosan Co. Ltd. | 15,744 | ||||||
| 1,992 | Isuzu Motors Ltd. | 26,159 | ||||||
| 508 | Japan Airlines Co. Ltd. | 18,082 | ||||||
| 908 | JFE Holdings, Inc. | 17,145 | ||||||
| 2,299 | JXTG Holdings, Inc. | 15,670 | ||||||
| 1,175 | Kajima Corp. | 15,159 | ||||||
| 1,085 | Kansai Electric Power Co., Inc. | 16,637 | ||||||
| 1,185 | KDDI Corp. | 29,553 | ||||||
| 2,497 | Konica Minolta, Inc. | 24,803 | ||||||
| 2,005 | Marubeni Corp. | 16,279 | ||||||
| 1,420 | MINEBEA MITSUMI, Inc. | 21,730 | ||||||
| 2,066 | Mitsubishi Chemical Holdings Corp. | 16,130 | ||||||
| 719 | Mitsubishi Corp. | 20,260 | ||||||
| 7,901 | Mitsubishi UFJ Financial Group, Inc. | 47,943 | ||||||
| 1,113 | Mitsui & Co. Ltd. | 18,595 | ||||||
| 25,216 | Mizuho Financial Group, Inc. | 43,347 | ||||||
| 162 | Murata Manufacturing Co. Ltd. | 24,640 | ||||||
| 1,576 | Nikon Corp. | 27,469 | ||||||
| 761 | Nippon Telegraph & Telephone Corp. | 32,030 | ||||||
| 1,245 | NTT Data Corp. * | 16,062 | ||||||
| 1,339 | SBI Holdings, Inc. | 35,132 | ||||||
| 364 | Showa Denko KK | 15,901 | ||||||
| 576 | Sony Corp. | 31,338 | ||||||
| 1,067 | Sumitomo Corp. | 16,200 | ||||||
| 1,077 | Sumitomo Mitsui Financial Group, Inc. | 42,124 | ||||||
| 268 | TDK Corp. | 23,154 | ||||||
| 3,086 | Tokyo Electric Power Co. Holdings, Inc. * | 15,805 | ||||||
| 673 | Tokyo Gas Co. Ltd. | 16,584 | ||||||
| 784,684 | ||||||||
| NORWAY - 0.8% | ||||||||
| 1,855 | Marine Harvest ASA | 45,023 | ||||||
| SWEDEN - 1.6% | ||||||||
| 1,572 | Sandvik AB | 24,922 | ||||||
| 845 | Swedish Match AB | 43,111 | ||||||
| 1,619 | Volvo AB | 24,233 | ||||||
| 92,266 | ||||||||
5
Affinity World Leaders Equity ETF
SCHEDULE OF INVESTMENTS (Continued)
October 31, 2018
| Shares | Fair Value | |||||||
| COMMON STOCKS - 95.1% (Continued) | ||||||||
| SWITZERLAND - 1.3% | ||||||||
| 795 | Novartis AG | $ | 69,739 | |||||
| UNITED STATES - 58.6% | ||||||||
| 935 | AbbVie, Inc. | 72,790 | ||||||
| 200 | Adobe, Inc. * | 49,152 | ||||||
| 1,148 | AES Corp. | 16,738 | ||||||
| 680 | Allison Transmission Holdings, Inc. | 29,974 | ||||||
| 342 | Ameriprise Financial, Inc. | 43,516 | ||||||
| 951 | Archer-Daniels-Midland Co. | 44,935 | ||||||
| 2,619 | AT&T, Inc. | 80,351 | ||||||
| 719 | Athene Holding Ltd. * | 32,873 | ||||||
| 658 | Best Buy Co., Inc. | 46,165 | ||||||
| 317 | Broadcom, Inc. | 70,846 | ||||||
| 300 | Brunswick Corp. | 15,597 | ||||||
| 842 | CA, Inc. | 37,351 | ||||||
| 310 | Caterpillar, Inc. | 37,609 | ||||||
| 522 | CBRE Group, Inc. * | 21,031 | ||||||
| 440 | CDW Corp. | 39,604 | ||||||
| 294 | Celanese Corp. | 28,500 | ||||||
| 900 | Celgene Corp. * | 64,440 | ||||||
| 339 | Centene Corp. * | 44,178 | ||||||
| 637 | CenterPoint Energy, Inc. | 17,205 | ||||||
| 2,691 | CenturyLink, Inc. | 55,542 | ||||||
| 1,982 | Cisco Systems, Inc. | 90,677 | ||||||
| 1,293 | Citizens Financial Group, Inc. | 48,294 | ||||||
| 544 | Comerica, Inc. | 44,369 | ||||||
| 141 | Cummins, Inc. | 19,273 | ||||||
| 699 | CVS Health Corp. | 50,601 | ||||||
| 364 | Darden Restaurants, Inc. | 38,784 | ||||||
| 494 | Delta Air Lines, Inc. | 27,037 | ||||||
| 673 | Discover Financial Services | 46,888 | ||||||
| 430 | DXC Technology Co. | 31,317 | ||||||
| 534 | Emerson Electric Co. | 36,248 | ||||||
| 212 | Entergy Corp. | 17,797 | ||||||
| 315 | Evergy, Inc. | 17,637 | ||||||
| 559 | Express Scripts Holding Co. * | 54,206 | ||||||
| 205 | F5 Networks, Inc. * | 35,932 | ||||||
| 480 | FirstEnergy Corp. | 17,894 | ||||||
| 1,632 | Gap, Inc. | 44,554 | ||||||
| 363 | HCA Healthcare, Inc. | 48,471 | ||||||
| 516 | HD Supply Holdings, Inc. * | 19,386 | ||||||
| 876 | Herbalife Nutrition Ltd. * | 46,656 | ||||||
| 2,766 | HP, Inc. | 66,771 | ||||||
| 372 | Ingersoll-Rand PLC | 35,690 | ||||||
| 366 | International Business Machines Corp. | 42,247 | ||||||
| 2,365 | Interpublic Group of Cos., Inc. | 54,773 | ||||||
6
Affinity World Leaders Equity ETF
SCHEDULE OF INVESTMENTS (Continued)
October 31, 2018
| Shares | Fair Value | |||||||
| COMMON STOCKS - 95.1% (Continued) | ||||||||
| UNITED STATES - 58.6% (Continued) | ||||||||
| 285 | Jacobs Engineering Group, Inc. | $ | 21,401 | |||||
| 644 | Kohl’s Corp. | 48,770 | ||||||
| 134 | Lear Corp. | 17,809 | ||||||
| 139 | Lockheed Martin Corp. | 40,845 | ||||||
| 765 | LPL Financial Holdings, Inc. | 47,124 | ||||||
| 328 | LyondellBasell Industries NV | 29,281 | ||||||
| 303 | M&T Bank Corp. | 50,119 | ||||||
| 1,385 | Macy’s, Inc. | 47,492 | ||||||
| 647 | Marathon Petroleum Corp. | 45,581 | ||||||
| 1,361 | Merck & Co., Inc. | 100,183 | ||||||
| 886 | MetLife, Inc. | 36,494 | ||||||
| 1,394 | Microsoft Corp. | 148,893 | ||||||
| 316 | Molina Healthcare, Inc. * | 40,059 | ||||||
| 826 | NetApp, Inc. | 64,833 | ||||||
| 152 | Norfolk Southern Corp. | 25,510 | ||||||
| 462 | NRG Energy, Inc. | 16,720 | ||||||
| 223 | Nucor Corp. | 13,184 | ||||||
| 708 | Occidental Petroleum Corp. | 47,486 | ||||||
| 1,724 | Old Republic International Corp. | 38,014 | ||||||
| 562 | PACCAR, Inc. | 32,152 | ||||||
| 941 | PBF Energy, Inc. | 39,381 | ||||||
| 594 | Progressive Corp. | 41,402 | ||||||
| 149 | Ralph Lauren Corp. | 19,312 | ||||||
| 328 | Royal Caribbean Cruises Ltd. | 34,351 | ||||||
| 1,424 | Seagate Technology PLC | 57,288 | ||||||
| 290 | Steel Dynamics, Inc. | 11,484 | ||||||
| 599 | Target Corp. | 50,094 | ||||||
| 275 | United Continental Holdings, Inc. * | 23,515 | ||||||
| 143 | United Rentals, Inc. * | 17,170 | ||||||
| 482 | Valero Energy Corp. | 43,905 | ||||||
| 1,567 | Verizon Communications, Inc. | 89,460 | ||||||
| 1,700 | Viacom, Inc. | 54,366 | ||||||
| 744 | Walgreens Boots Alliance, Inc. | 59,349 | ||||||
| 150 | WellCare Health Plans, Inc. * | 41,399 | ||||||
| 3,278,325 | ||||||||
| TOTAL COMMON STOCKS (Cost $5,744,449) | 5,322,344 | |||||||
7
Affinity World Leaders Equity ETF
SCHEDULE OF INVESTMENTS (Continued)
October 31, 2018
| Shares | Fair Value | |||||||
| REAL ESTATE INVESTMENT TRUSTS (REITs) - 2.8% | ||||||||
| AUSTRALIA - 0.2% | ||||||||
| 4,574 | Stockland * | $ | 11,703 | |||||
| CANADA - 0.2% | ||||||||
| 704 | RioCan Real Estate Investment Trust | 12,866 | ||||||
| UNITED STATES - 2.4% | ||||||||
| 602 | Gaming and Leisure Properties, Inc. | 20,281 | ||||||
| 1,078 | Host Hotels & Resorts, Inc. | 20,601 | ||||||
| 2,748 | New Residential Investment Corp. | 49,134 | ||||||
| 661 | Park Hotels & Resorts, Inc. | 19,215 | ||||||
| 326 | WP Carey, Inc. | 21,519 | ||||||
| 130,750 | ||||||||
| TOTAL REAL ESTATE INVESTMENT TRUSTS (REITs) (Cost $161,416) | 155,319 | |||||||
| TOTAL INVESTMENTS - 97.9% (Cost $5,905,865) | $ | 5,477,663 | ||||||
| OTHER ASSETS LESS LIABILITIES - 2.1% | 117,753 | |||||||
| NET ASSETS - 100.0% | $ | 5,595,416 | ||||||
PLC - Public Limited Company
| * | Non-income producing security. |
8
| Affinity World Leaders Equity ETF |
| STATEMENT OF ASSETS AND LIABILITIES |
| October 31, 2018 |
| ASSETS | ||||
| Investment securities: | ||||
| At cost | $ | 5,905,865 | ||
| At fair value | $ | 5,477,663 | ||
| Cash | 77,488 | |||
| Dividends receivable | 20,485 | |||
| Receivable due from Advisor, net | 49,582 | |||
| Prepaid expenses and other liabilities | 397 | |||
| TOTAL ASSETS | 5,625,615 | |||
| LIABILITIES | ||||
| Due to custodian | 8,180 | |||
| Trustee fees payable | 431 | |||
| Payable to related parties | 8,497 | |||
| Accrued expenses and other liabilities | 13,091 | |||
| TOTAL LIABILITIES | 30,199 | |||
| NET ASSETS | $ | 5,595,416 | ||
| Net Assets Consist Of: | ||||
| Paid in capital ($0 par value, unlimited shares authorized) | $ | 6,260,141 | ||
| Accumulated Earnings (Losses) | (664,725 | ) | ||
| NET ASSETS | $ | 5,595,416 | ||
| Net Asset Value Per Share: | ||||
| Shares: | ||||
| Net Assets | $ | 5,595,416 | ||
| Shares of beneficial interest outstanding (a) | 250,000 | |||
| Net asset value (Net Assets ÷ Shares Outstanding), offering price and redemption price per share | $ | 22.38 |
| (a) | Unlimited number of shares of beneficial interest authorized, no par value. |
See accompanying notes to financial statements.
9
| Affinity World Leaders Equity ETF |
| STATEMENT OF OPERATIONS |
| For the Period Ended October 31, 2018 * |
| INVESTMENT INCOME | ||||
| Dividends (net of $5,799 in foreign dividend tax withheld) | $ | 120,039 | ||
| TOTAL INVESTMENT INCOME | 120,039 | |||
| EXPENSES | ||||
| Investment advisory fees | 19,189 | |||
| Custodian fees | 39,288 | |||
| Professional fees | 53,615 | |||
| Administrative services fees | 35,449 | |||
| Printing and postage expenses | 12,177 | |||
| Compliance officer fees | 10,479 | |||
| Transfer agent fees | 9,054 | |||
| Trustees’ fees and expenses | 7,935 | |||
| Insurance expense | 165 | |||
| Other expenses | 3,194 | |||
| TOTAL EXPENSES | 190,545 | |||
| Less: Fees waived and expenses reimbursed by the Advisor | (171,356 | ) | ||
| NET EXPENSES | 19,189 | |||
| NET INVESTMENT INCOME | 100,850 | |||
| REALIZED AND UNREALIZED LOSS FROM INVESTMENTS | ||||
| Net realized loss from investments and foreign currency transactions | (323,716 | ) | ||
| Net change in unrealized depreciation on investments | (428,137 | ) | ||
| NET REALIZED AND UNREALIZED LOSS FROM INVESTMENTS | (751,853 | ) | ||
| NET DECREASE IN NET ASSETS RESULTING FROM OPERATIONS | $ | (651,003 | ) |
| * | The Affinity World Leaders Equity ETF commenced operations on January 16, 2018. |
See accompanying notes to financial statements.
10
| Affinity World Leaders Equity ETF |
| STATEMENTS OF CHANGES IN NET ASSETS |
| For the | ||||
| Period Ended | ||||
| October 31, 2018 * | ||||
| FROM OPERATIONS | ||||
| Net investment income | $ | 100,850 | ||
| Net realized loss from investments and foreign currency transactions | (323,716 | ) | ||
| Net change in unrealized depreciation on investments | (428,137 | ) | ||
| Net decrease in net assets resulting from operations | (651,003 | ) | ||
| DISTRIBUTIONS TO SHAREHOLDERS | ||||
| Total Distributions Paid | (74,075 | ) | ||
| Net decrease in net assets from distributions to shareholders | (74,075 | ) | ||
| FROM SHARES OF BENEFICIAL INTEREST | ||||
| Proceeds from shares sold | 7,420,568 | |||
| Payments for shares redeemed | (1,100,074 | ) | ||
| Net increase in net assets from shares of beneficial interest | 6,320,494 | |||
| TOTAL INCREASE IN NET ASSETS | 5,595,416 | |||
| NET ASSETS | ||||
| Beginning of Period | — | |||
| End of Period | $ | 5,595,416 | ||
| SHARE ACTIVITY | ||||
| Shares Sold | 300,000 | |||
| Shares Redeemed | (50,000 | ) | ||
| Net increase from share activity | 250,000 | |||
| * | The Affinity World Leaders Equity ETF commenced operations on January 16, 2018. |
See accompanying notes to financial statements.
11
| Affinity World Leaders Equity ETF |
| FINANCIAL HIGHLIGHTS |
Per Share Data and Ratios for a Share of Beneficial Interest Outstanding Throughout the Period Presented
| For the | ||||
| Period Ended | ||||
| October 31, 2018 (a) | ||||
| Net asset value, beginning of period | $ | 25.00 | ||
| Activity from investment operations: | ||||
| Net investment income (h) | 0.47 | |||
| Net realized and unrealized loss on investments | (2.74 | ) | ||
| Total loss from investment operations | (2.27 | ) | ||
| Less distributions from: | ||||
| Net investment income | (0.35 | ) | ||
| Total distributions | (0.35 | ) | ||
| Net asset value, end of period | $ | 22.38 | ||
| Market price, end of period | $ | 22.52 | ||
| Total return (b)(c)(d)(e) | (9.92 | )% | ||
| Net assets, end of period (000s) | $ | 5,595 | ||
| Ratio of gross expenses to average net assets (f)(i) | 4.66 | % | ||
| Ratio of net expenses to average net assets (f) | 0.47 | % | ||
| Ratio of net investment income to average net assets (f)(g) | 2.47 | % | ||
| Portfolio Turnover Rate (d) | 135 | % | ||
| (a) | The Affinity World Leades Equity ETF commenced operations on January 16, 2018. |
| (b) | Total return is calculated assuming a purchase of shares at net asset value on the first day and a sale at net asset value on the last day of the period. Distributions are assumed, for the purpose of this calculation, to be reinvested at the ex-dividend date net asset value per share on their respective payment dates. Had the Advisor not waived or reimbursed a portion of the Fund’s expenses, total returns would have been lower. |
| (c) | Includes adjustments in accordance with accounting principles generally accepted in the United States and, consequently, the net asset value for financial reporting purposes and the returns based upon those net asset values may differ from the net asset values and returns for shareholder transactions. |
| (d) | Not annualized. |
| (e) | Represents total return based on net asset values per share from commencement of investment operations on January 16, 2018 through October 31, 2018. Total return based on net asset value per share, as of the close of business on the day of commencement of trading on the BATS on January 16, 2018 through October 31, 2018 was (9.92)%. |
| (f) | Annualized. |
| (g) | Recognition of net investment income (loss) by the Fund is affected by the timing of the declaration of dividends by the underlying investment companies in which the Fund invests. |
| (h) | Per share amounts calculated using the average shares method, which more appropriately presents the per share data for the period. |
| (i) | Represents the ratio of expenses to average net assets absent fee waivers and/or expense reimbursements by the Adviser. |
See accompanying notes to financial statements.
12
| Affinity World Leaders Equity ETF |
| NOTES TO FINANCIAL STATEMENTS |
| October 31, 2018 |
| (1) | ORGANIZATION |
The Affinity World Leaders Equity ETF (the “Fund”) is a series of shares of beneficial interest of the Two Roads Shared Trust (the “Trust”), a statutory trust organized under the laws of the State of Delaware on June 8, 2012, and is registered under the Investment Company Act of 1940, as amended (the “1940 Act”), as a diversified, open-end management investment company. The Fund commenced operations on January 16, 2018. The Fund’s investment objective is to seek to provide investment results that correspond generally, before fees and expenses, to the performance of the Thomson Reuters StarMine Affinity World Leaders Index (the “TRSAWL Index” or the “Index”).
| (2) | SIGNIFICANT ACCOUNTING POLICIES |
The following is a summary of significant accounting policies followed by the Fund in preparation of its financial statements. These policies are in conformity with accounting principles generally accepted in the United States of America (“GAAP”). The preparation of financial statements requires management to make estimates and assumptions that affect the reported amounts of assets and liabilities and disclosure of contingent assets and liabilities at the date of the financial statements and the reported amounts of income and expenses for the period. Actual results could differ from those estimates. The Fund is an investment company and accordingly follows the investment company accounting and reporting guidance of the Financial Accounting Standards Board (“FASB”) Accounting Standard Codification Topic 946 “Financial Services – Investment Companies” including FASB Accounting Standard Update ASU 2013-08.
Security Valuation – Securities listed on an exchange are valued at the last reported sale price at the close of the regular trading session of the exchange on the business day the value is being determined, or in the case of securities listed on NASDAQ at the NASDAQ Official Closing Price (“NOCP”). In the absence of a sale such securities shall be valued at the mean between the current bid and ask prices on the day of valuation. Short-term debt obligations having 60 days or less remaining until maturity, at time of purchase may be valued at amortized cost. Investments in open-end investment companies are valued at net asset value.
The Fund may hold securities, such as private investments, interests in commodity pools, other non-traded securities or temporarily illiquid securities, for which market quotations are not readily available or are determined to be unreliable. These securities will be valued using the “fair value” procedures approved by the Board of Trustees (the “Board”). The Board has delegated execution of these procedures to a fair value team composed of one or more representatives from each of the (i) Trust, (ii) administrator, and (iii) Adviser. The team may also enlist third party consultants such as a valuation specialist at a public accounting firm, valuation consultant, or financial officer of a security issuer on an as-needed basis to assist in determining a security-specific fair value. The Board has also engaged a third party valuation firm to, as needed, attend valuation meetings held by the Trust, review minutes of such meetings and report to the Board on a quarterly basis. The Board reviews and ratifies the execution of this process and the resultant fair value prices at least quarterly to assure the process produces reliable results.
13
| Affinity World Leaders Equity ETF |
| NOTES TO FINANCIAL STATEMENTS (Continued) |
| October 31, 2018 |
Fair Valuation Process – As noted above, the fair value team is composed of one or more representatives from each of the (i) Trust, (ii) administrator, and (iii) Adviser. The applicable investments are valued collectively via inputs from each of these groups. For example, fair value determinations are required for the following securities: (i) securities for which market quotations are insufficient or not readily available on a particular business day (including securities for which there is a short and temporary lapse in the provision of a price by the regular pricing source), (ii) securities for which, in the judgment of the Adviser, the prices or values available do not represent the fair value of the instrument. Factors which may cause the Adviser to make such a judgment include, but are not limited to, the following: only a bid price or an asked price is available; the spread between bid and asked prices is substantial; the frequency of sales; the thinness of the market; the size of reported trades; and actions of the securities markets, such as the suspension or limitation of trading; (iii) securities determined to be illiquid; (iv) securities with respect to which an event that will affect the value thereof has occurred (a “significant event”) since the closing prices were established on the principal exchange on which they are traded, but prior to the Fund’s calculation of its net asset value. Restricted or illiquid securities, such as private investments or non-traded securities are valued via inputs from the Adviser based upon the current bid for the security from two or more independent dealers or other parties reasonably familiar with the facts and circumstances of the security (who should take into consideration all relevant factors as may be appropriate under the circumstances). If the Adviser is unable to obtain a current bid from such independent dealers or other independent parties, the fair value team shall determine the fair value of such security using the following factors: (i) the type of security; (ii) the cost at date of purchase; (iii) the size and nature of the Fund’s holdings; (iv) the discount from market value of unrestricted securities of the same class at the time of purchase and subsequent thereto; (v) information as to any transactions or offers with respect to the security; (vi) the nature and duration of restrictions on disposition of the security and the existence of any registration rights; (vii) how the yield of the security compares to similar securities of companies of similar or equal creditworthiness; (viii) the level of recent trades of similar or comparable securities; (ix) the liquidity characteristics of the security; (x) current market conditions; and (xi) the market value of any securities into which the security is convertible or exchangeable.
Valuation of Underlying Funds – The Fund may invest in portfolios of open-end or closed-end investment companies (the “Underlying Funds”). Investment companies are valued at their respective net asset values as reported by such investment companies. Open-end investment companies value securities in their portfolios for which market quotations are readily available at their market values (generally the last reported sale price) and all other securities and assets at their fair value to the methods established by the board of directors of the open-end funds. The shares of many closed-end investment companies and exchange traded funds (“ETFs”), after their initial public offering, frequently trade at a price per share, which is different than the net asset value per share. The difference represents a market premium or market discount of such shares. There can be no assurances that the market discount or market premium on shares of any closed-end investment company or ETF purchased by the Fund will not change.
Exchange Traded Funds – The Fund may invest in exchange traded funds (“ETFs”). ETFs are a type of fund bought and sold on a securities exchange. An ETF trades like common stock and represents a fixed portfolio of securities. The risks of owning an ETF generally reflect the risks of owning the underlying securities in which it invests, although the lack of liquidity on an ETF could result in it being more volatile. Additionally, ETFs have fees and expenses that reduce their value.
Time Deposits – Time deposits are issued by a depository institution in exchange for the deposit of funds. The issuer agrees to pay the amount deposited plus interest to the depositor on the date specified with respect to the deposit. Time deposits do not trade in the secondary market prior to maturity. However, some time deposits may be redeemable prior to maturity and may be subject to withdrawal penalties.
14
| Affinity World Leaders Equity ETF |
| NOTES TO FINANCIAL STATEMENTS (Continued) |
| October 31, 2018 |
In unusual circumstances, securities may be valued at their fair value as determined in good faith by the Trust’s Fair Value Committee and in accordance with the Trust’s Portfolio Securities Valuation Procedures (the “Procedures”). The Board will review the fair value method in use for securities requiring a fair market value determination at least quarterly. The Procedures consider, among others, the following factors to determine a security’s fair value: the nature and pricing history (if any) of the security; whether any dealer quotations for the security are available; and possible valuation methodologies that could be used to determine the fair value of the security.
The Fund utilizes various methods to measure the fair value of all of its investments on a recurring basis. GAAP establishes a hierarchy that prioritizes inputs to valuation methods. The three levels of input are:
Level 1 – Unadjusted quoted prices in active markets for identical assets and liabilities that the Fund has the ability to access.
Level 2 – Observable inputs other than quoted prices included in Level 1 that are observable for the asset or liability, either directly or indirectly. These inputs may include quoted prices for the identical instrument on an inactive market, prices for similar instruments, interest rates, prepayment speeds, credit risk, yield curves, default rates and similar data.
Level 3 – Unobservable inputs for the asset or liability, to the extent relevant observable inputs are not available, representing the Fund’s own assumptions about the assumptions a market participant would use in valuing the asset or liability, and would be based on the best information available.
The availability of observable inputs can vary from security to security and is affected by a wide variety of factors, including, for example, the type of security, whether the security is new and not yet established in the marketplace, the liquidity of markets, and other characteristics particular to the security. To the extent that valuation is based on models or inputs that are less observable or unobservable in the market, the determination of fair value requires more judgment. Accordingly, the degree of judgment exercised in determining fair value is greatest for instruments categorized in Level 3.
The inputs used to measure fair value may fall into different levels of the fair value hierarchy. In such cases, for disclosure purposes, the level in the fair value hierarchy within which the fair value measurement falls in its entirety, is determined based on the lowest level input that is significant to the fair value measurement in its entirety.
The inputs or methodology used for valuing securities are not necessarily an indication of the risk associated with investing in those securities. The following tables summarize the inputs used as of October 31, 2018 for the Fund’s assets and liabilities measured at fair value:
| Assets * | Level 1 | Level 2 | Level 3 | Total | ||||||||||||
| Common Stocks | $ | 5,322,344 | $ | — | $ | — | $ | 5,322,344 | ||||||||
| Real Estate Investment Trusts | 155,319 | — | — | 155,319 | ||||||||||||
| Total | $ | 5,477,663 | $ | — | $ | — | $ | 5,477,663 | ||||||||
There were no transfers into or out of Level 1 and Level 2 during the reporting period. It is the Fund’s policy to recognize transfers into or out of Level 1 and Level 2 at the end of the reporting period. The Fund did not hold any Level 3 securities during the period.
| * | Refer to the Schedule of Investments for portfolio composition. |
15
| Affinity World Leaders Equity ETF |
| NOTES TO FINANCIAL STATEMENTS (Continued) |
| October 31, 2018 |
Security Transactions and Related Income
Security transactions are accounted for on trade date basis. Interest income is recognized on an accrual basis. Discounts are accreted and premiums are amortized on securities purchased over the lives of the respective securities. Dividend income is recorded on the ex-dividend date. Realized gains or losses from sales of securities are determined by comparing the identified cost of the security lot sold with the net sales proceeds.
Dividends and Distributions to Shareholders
Ordinarily, dividends from net investment income, if any, are declared and paid quarterly by the Fund. The Fund distributes its net realized capital gains, if any, to shareholders annually. Dividends from net investment income and distributions from net realized gains are recorded on ex-dividend date and determined in accordance with federal income tax regulations, which may differ from GAAP. These “book/tax” differences are considered either temporary (i.e., deferred losses, capital loss carry forwards) or permanent in nature. To the extent these differences are permanent in nature, such amounts are reclassified within the composition of net assets based on their federal tax-basis treatment; temporary differences do not require reclassification.
Federal Income Taxes
The Fund intends to continue to comply with the requirements of the Internal Revenue Code applicable to regulated investment companies and to distribute all of its taxable income to its shareholders. Therefore, no provision for federal income tax is required. The Fund recognizes the tax benefits of uncertain tax positions only where the position is “more likely than not” to be sustained assuming examination by tax authorities. Management has analyzed the Fund’s tax positions and has concluded that no liability for unrecognized tax benefits should be recorded related to uncertain tax positions expected to be taken in the Fund’s October 31, 2018 year-end tax returns. The Fund identified its major tax jurisdictions as U.S. Federal and foreign jurisdictions where the Fund makes significant investments. The Fund is not aware of any tax positions for which it is reasonably possible that the total amounts of unrecognized tax benefits will change materially in the next twelve months.
Foreign Investment Risk
Foreign (non-U.S.) securities present greater investment risks than investing in the securities of U.S. issuers and may experience more rapid and extreme changes in value than the securities of U.S. companies, due to less information about foreign companies in the form of reports and ratings than about U.S. issuers; different accounting, auditing and financial reporting requirements; smaller markets; nationalization; expropriation or confiscatory taxation; currency blockage; or political changes or diplomatic developments. Foreign securities may also be less liquid and more difficult to value than securities of U.S. issuers.
Expenses
Expenses of the Trust that are directly identifiable to a specific fund are charged to that fund. Expenses, which are not readily identifiable to a specific fund, are allocated in such a manner as deemed equitable, taking into consideration the nature and type of expense and the relative sizes of the funds in the Trust.
Indemnification
The Trust indemnifies its officers and trustees for certain liabilities that may arise from the performance of their duties to the Fund. Additionally, in the normal course of business, the Fund enters into contracts that contain a variety of representations and warranties which provide general indemnities. The Fund’s maximum exposure under these arrangements is unknown, as this would involve future claims that may be made against the Fund that have not yet occurred. However, based on industry experience, the Fund expects the risk of loss due to these warranties and indemnities to be remote.
16
| Affinity World Leaders Equity ETF |
| NOTES TO FINANCIAL STATEMENTS (Continued) |
| October 31, 2018 |
| (3) | INVESTMENT TRANSACTIONS |
For the period ended October 31, 2018, cost of purchases and proceeds from sales of portfolio securities (excluding in-kind transactions and short-term investments), amounted to $5,835,377 and $5,920,498 respectively, for the Fund. For the period ended October 31, 2018, cost of purchases and proceeds from sales for in-kind transactions, amounted to $7,415,592 and $1,099,392 respectively, for the Fund.
| (4) | INVESTMENT ADVISORY AGREEMENT AND TRANSACTIONS WITH RELATED PARTIES |
Regents Park Funds, LLC serves as the Fund’s investment advisor (the “Adviser”). Pursuant to an Investment Advisory Agreement with the Fund, the Adviser, under the oversight of the Board, directs the daily operations of the Fund and supervises the performance of administrative and professional services provided by others. As compensation for its services, the Fund pays to the Adviser a monthly investment management fees at an annual rate of 0.47% of its average daily net assets. For the period ended October 31, 2018, the Adviser earned $19,189 in investment management fees. As of October 31, 2018, the amount due from the Advisor totaled $49,582.
The Adviser has engaged Affinity Investment Advisors, LLC to serve as Sub-Adviser to the Fund. The Sub-Adviser, with respect to the portion of the Fund’s assets allocated to the Sub-Adviser, is responsible for selecting investments and assuring that investments are made in accordance with the Fund’s investment objective, policies and restrictions.
The Adviser, pursuant to an Expense Limitation Agreement (the “Agreement”) has contractually agreed to reduce the Fund’s fees and/or absorb expenses of the Fund until at least December 31, 2020 to ensure that total annual Fund operating expenses after fee waiver and reimbursement (exclusive of any taxes, interest, brokerage commissions, expenses incurred in connection with any merger or reorganization, indirect expenses, expenses of other investment companies in which the Fund may invest, or extraordinary expenses such as litigation) will not exceed 0.47% of average daily net assets. This Agreement may be terminated by the Board of Trustees on 60 days’ written notice to the Adviser. These fee waivers and expense reimbursements are subject to possible recoupment from the Fund in future years on a rolling three-year basis (within the three years after the fees have been waived or reimbursed) if such recoupment can be achieved within the foregoing expense limits. No reimbursement amount will be paid to the Adviser in any fiscal quarter unless the Board has determined in advance that a reimbursement is in the best interest of the Fund and its shareholders. The Adviser and the Sub-Adviser have agreed that Affinity will reimburse all Fund expenses directly.
For the period ended October 31, 2018 the Adviser waived fees and reimbursed expenses of the Fund in the amount of $171,356, which is subject to recapture through October 31, 2021, pursuant to the Agreement.
The Trust, with respect to the Fund, has adopted a distribution and service plan (“Plan”) pursuant to Rule 12b-1 under the 1940 Act. Under the Plan, the Fund is authorized to pay distribution fees to the distributor and other firms that provide distribution and shareholder services (“Service Providers”). If a Service Provider provides these services, the Fund may pay fees at an annual rate not to exceed 0.25% of average daily net assets, pursuant to Rule 12b-1 under the 1940 Act.
No distribution or service fees are currently paid by the Fund and there are no current plans to impose these fees. In the event Rule 12b-1 fees were charged, over time they would increase the cost of an investment in the Fund.
17
| Affinity World Leaders Equity ETF |
| NOTES TO FINANCIAL STATEMENTS (Continued) |
| October 31, 2018 |
In addition, certain affiliates of the Distributor provide services to the Fund as follows:
Gemini Fund Services, LLC (“GFS”), an affiliate of the Distributor, provides administration, fund accounting, and transfer agent services to the Trust. Pursuant to separate servicing agreements with GFS, the Fund pays GFS customary fees for providing administration, fund accounting and transfer agency services to the Fund. Certain officers of the Trust are also officers of GFS, and are not paid any fees directly by the Fund for servicing in such capacities.
BluGiant, LLC (“BluGiant”), BluGiant, an affiliate of GFS and the Distributor, provides EDGAR conversion and filing services as well as print management services for the Fund on an ad-hoc basis. For the provision of these services, BluGiant receives customary fees from the Fund.
Northern Lights Compliance Services, LLC (“NLCS”), an affiliate of GFS and the Distributor, provides a Chief Compliance Officer to the Trust, as well as related compliance services, pursuant to a consulting agreement between NLCS and the Trust. Under the terms of such agreement, NLCS receives customary fees from the Fund.
| (6) | CAPITAL SHARE TRANSACTIONS |
Shares are not individually redeemable and may be redeemed by the Fund at NAV only in large blocks known as “Creation Units.” Shares are created and redeemed by the Fund only in Creation Unit size aggregations of 50,000 shares. Only Authorized Participants or transactions done through an Authorized Participant are permitted to purchase or redeem Creation Units from the Fund. An Authorized Participant is either (i) a broker-dealer or other participant in the clearing process through the Continuous Net Settlement System of the National Securities Clearing Corporation or (ii) a DTC participant and, in each case, must have executed a Participant Agreement with the Distributor. Such transactions are generally permitted on an in-kind basis, with a balancing cash component to equate the transaction to the NAV per share of the Fund on the transaction date. Cash may be substituted equivalent to the value of certain securities generally when they are not available in sufficient quantity for delivery, not eligible for trading by the Authorized Participant or as a result of other market circumstances. In addition, the Fund may impose transaction fees on purchases and redemptions of Fund shares to cover the custodial and other costs incurred by the Funds in effecting trades. A fixed fee payable to the Custodian may be imposed on each creation and redemption transaction regardless of the number of Creation Units involved in the transaction (“Fixed Fee”). Purchases and redemptions of Creation Units for cash or involving cash-in-lieu are required to pay an additional variable charge to compensate the Fund and its ongoing shareholders for brokerage and market impact expenses relating to Creation Unit transactions (“Variable Charge,” and together with the Fixed Fee, the “Transaction Fees”). Transactions in capital shares for the Fund are disclosed in the Statements of Changes in Net Assets.
The Transaction Fees for the Fund are listed in the table below:
| Minimum Additional | Maximum Additional | |
| Fee for In-Kind and | Variable Charge for | Variable Charge for |
| Cash Purchases | Cash Purchases* | Cash Purchases* |
| $1,800 | 0.20% | 2.00% |
| * | The maximum Transaction Fee may be up to 2.00% of the amount invested. |
18
| Affinity World Leaders Equity ETF |
| NOTES TO FINANCIAL STATEMENTS (Continued) |
| October 31, 2018 |
| (7) | PRINCIPLE INVESTMENT RISKS |
The Fund’s investments in securities, financial instruments and derivatives expose it to various risks, certain of which are discussed below. Please refer to the Fund’s prospectus and statement of additional information for a full listing of risks associated with the Fund’s investments which include, but are not limited to authorized participant concentration risk, calculation methodology risk, currency risk, equity risk, ETF structure risks, fluctuation of net asset value risk, foreign securities risk, geographic and sector risk, index tracking error risk, industry concentration risk, limited history of operations risk, management risk, market capitalization risk, and securities market risk.
Index Risk – Unlike many investment companies, the Fund does not utilize an investing strategy that seeks returns in excess of the Index. Therefore, they would not necessarily sell a security unless that security is removed from the Index, even if that security generally is underperforming.
ETF Structure Risks: The Fund is structured as an ETF and as a result is subject to the special risks, including:
| ● | Not Individually Redeemable. Shares are not individually redeemable and may be redeemed by the Fund at NAV only in large blocks known as “Creation Units.” You may incur brokerage costs purchasing enough Shares to constitute a Creation Unit. |
| ● | Trading Issues. Trading in Shares on the Cboe BZX Exchange, Inc. (the “Exchange”) may be halted due to market conditions or for reasons that, in the view of the Exchange, make trading in Shares inadvisable, such as extraordinary market volatility. There can be no assurance that Shares will continue to meet the listing requirements of the Exchange. An active trading market for the Fund’s shares may not be developed or maintained. If the Fund’s shares are traded outside a collateralized settlement system, the number of financial institutions that can act as authorized participants that can post collateral on an agency basis is limited, which may limit the market for the Fund’s shares. |
| ● | Market Price Variance Risk. The market prices of Shares will fluctuate in response to changes in NAV and supply and demand for Shares and will include a “bid-ask spread” charged by the exchange specialists, market makers or other participants that trade the particular security. There may be times when the market price and the NAV vary significantly. This means that Shares may trade at a discount to NAV. |
| ● | In times of market stress, market makers may step away from their role market making in shares of ETFs and in executing trades, which can lead to differences between the market value of Fund shares and the Fund’s NAV. |
| ● | The market price for the Fund’s shares may deviate from the Fund’s net asset value, particularly during times of market stress, with the result that investors may pay significantly more or significantly less for Fund shares than the Fund’s NAV, which is reflected in the bid and ask price for Fund shares or in the closing price. |
| ● | When all or a portion of an ETFs underlying securities trade in a market that is closed when the market for the Fund’s shares is open, there may be changes from the last quote of the closed market and the quote from the Fund’s domestic trading day, which could lead to differences between the market value of the Fund’s shares and the Fund’s NAV. |
| ● | In stressed market conditions, the market for the Fund’s shares may become less liquid in response to the deteriorating liquidity of the Fund’s portfolio. This adverse effect on the liquidity of the Fund’s shares may, in turn, lead to differences between the market value of the Fund’s shares and the Fund’s NAV. |
Fluctuation of Net Asset Value Risk: The NAV of the Fund’s shares will generally fluctuate with changes in the market value of the Fund’s holdings. The market prices of the Shares will generally fluctuate in accordance with changes in NAV as well as the relative supply of and demand for the shares on the Exchange. The Fund’s Sub- Adviser cannot predict whether the shares will trade below, at or above their NAV. Price differences may be due, in large part, to
19
| Affinity World Leaders Equity ETF |
| NOTES TO FINANCIAL STATEMENTS (Continued) |
| October 31, 2018 |
the fact that supply and demand forces at work in the secondary trading market for the Shares will be closely related to, but not identical to, the same forces influencing the prices of the Fund’s holdings trading individually or in the aggregate at any point in time. In addition, unlike conventional ETFs, the Fund is not an index fund. The Fund is actively managed and does not seek to replicate the performance of a specified index. Index based ETFs have generally traded at prices which closely correspond to NAV per share. Actively managed ETFs have a limited trading history and, therefore, there can be no assurance as to whether and/or the extent to which the Shares will trade at premiums or discounts to NAV.
| (8) | DISTRIBUTIONS TO SHAREHOLDERS AND TAX COMPONENTS OF CAPITAL |
The Statement of Assets and Liabilities represents cost for financial reporting purposes. Aggregate cost for federal tax purposes is $5,911,636 and differs from market value by net unrealized appreciation (depreciation) consisted of:
| Gross unrealized appreciation: | $ | 79,377 | ||
| Gross unrealized depreciation: | (513,350 | ) | ||
| Net unrealized depreciation: | $ | (433,973 | ) |
The tax character of fund distributions paid for the year ended October 31, 2018:
| Fiscal Year Ended | ||||
| October 31, 2018 | ||||
| Ordinary Income | $ | 74,075 | ||
| Long-Term Capital Gain | — | |||
| Return of Capital | — | |||
| $ | 74,075 | |||
As of October 31, 2018, the components of accumulated earnings/(deficit) on a tax basis were as follows:
| Undistributed | Undistributed | Post October Loss | Capital Loss | Other | Unrealized | Total | ||||||||||||||||||||
| Ordinary | Long-Term | and | Carry | Book/Tax | Appreciation/ | Accumulated | ||||||||||||||||||||
| Income | Gains | Late Year Loss | Forwards | Differences | (Depreciation) | Earnings/(Deficits) | ||||||||||||||||||||
| $ | 31,784 | $ | — | $ | — | $ | (262,601 | ) | $ | — | $ | (433,908 | ) | $ | (664,725 | ) | ||||||||||
The difference between book basis and tax basis undistributed net investment income/(loss), accumulated net realized gain/(loss), and unrealized appreciation/(depreciation) from investments is primarily attributable to the tax deferral of losses on wash sales
At October 31, 2018, the Fund had capital loss carryforwards for federal income tax purposes available to offset futures capital gains as follows:
| Non-Expiring | Non-Expiring | |||||||||||||
| Short-Term | Long-Term | Total | CLCF Utilized | |||||||||||
| $ | 262,601 | $ | — | $ | 262,601 | $ | — | |||||||
20
| Affinity World Leaders Equity ETF |
| NOTES TO FINANCIAL STATEMENTS (Continued) |
| October 31, 2018 |
Permanent book and tax differences, primarily attributable to the book/tax basis treatment of non-deductible expenses and adjustments related to transfers in kind, resulted in reclassification for the year ended October 31, 2018 as follows:
| Paid | Total | |||||
| In | Distributable | |||||
| Capital | Earnings (Losses) | |||||
| $ | (60,353 | ) | $ | 60,353 | ||
| (9) | RECENT ACCOUNTING PRONOUNCEMENTS AND REPORTING UPDATES |
In August 2018, the FASB issued Accounting Standards Update (“ASU”) No. 2018-13, which changes certain fair value measurement disclosure requirements. The new ASU, in addition to other modifications and additions, removes the requirement to disclose the amount and reasons for transfers between Level 1 and Level 2 of the fair value hierarchy, and the policy for the timing of transfers between levels. For investment companies, the amendments are effective for financial statements issued for fiscal years beginning after December 15, 2019, and interim periods within those fiscal years. Early adoption is allowed. At this time, management is evaluating the implications of the ASU and any impact on the financial statement disclosures.
In August 2018, the Securities and Exchange Commission adopted amendments to certain disclosure requirements under Regulation S-X to conform to US GAAP, including: (i) an amendment to require presentation of the total, rather than the components, of distributable earnings on the Statement of Assets and Liabilities; and (ii) an amendment to require presentation of the total, rather than the components, of distributions to shareholders, except for tax return of capital distributions, if any, on the Statement of Changes in Net Assets. The amendments also removed the requirement for parenthetical disclosure of undistributed net investment income on the Statement of Changes in Net Assets. These amendments have been adapted with these financial statements.
| (10) | SUBSEQUENT EVENTS |
Subsequent events after the Statement of Assets and Liabilities date have been evaluated through the date the financial statements were issued. Management has determined that no events or transactions occurred requiring adjustment or disclosure in the financial statements.
21
Report of Independent Registered Public Accounting Firm
To the Board of Trustees of Two Roads Shared Trust
and the Shareholders of Affinity World Leaders Equity ETF
Opinion on the Financial Statements
We have audited the accompanying statement of assets and liabilities, including the schedule of investments, of Affinity World Leaders Equity ETF (the Fund) as of October 31, 2018, the related statements of operations, changes in net assets, and the financial highlights for the period from January 16, 2018 (commencement of operations) through October 31, 2018, including the related notes (collectively, the financial statements). In our opinion, the financial statements present fairly, in all material respects, the financial position of the Fund as of October 31, 2018, the results of its operations, changes in its net assets and the financial highlights for the period from January 16, 2018 (commencement of operations) through October 31, 2018, in conformity with accounting principles generally accepted in the United States of America.
Basis for Opinion
These financial statements are the responsibility of the Fund’s management. Our responsibility is to express an opinion on the Fund’s financial statements based on our audit. We are a public accounting firm registered with the Public Company Accounting Oversight Board (United States) (PCAOB) and are required to be independent with respect to the Fund in accordance with U.S. federal securities laws and the applicable rules and regulations of the Securities and Exchange Commission and the PCAOB.
We conducted our audit in accordance with the standards of the PCAOB. Those standards require that we plan and perform the audit to obtain reasonable assurance about whether the financial statements are free of material misstatement, whether due to error or fraud. The Fund is not required to have, nor were we engaged to perform, an audit of its internal control over financial reporting. As part of our audit, we are required to obtain an understanding of internal control over financial reporting but not for the purpose of expressing an opinion on the effectiveness of the Fund’s internal control over financial reporting. Accordingly, we express no such opinion.
Our audit included performing procedures to assess the risks of material misstatement of the financial statements, whether due to error or fraud, and performing procedures that respond to those risks. Such procedures included examining, on a test basis, evidence regarding the amounts and disclosures in the financial statements. Our audit also included evaluating the accounting principles used and significant estimates made by management, as well as evaluating the overall presentation of the financial statements. Our procedures included confirmation of securities owned as of October 31, 2018, by correspondence with the custodians and brokers. We believe that our audit provides a reasonable basis for our opinion.
/s/ RSM US LLP
We have served as the auditor of one or more Regents Park Funds, LLC (and affiliated advisers) advised investment companies since 2013.
Denver, Colorado
December 28, 2018
22
| Affinity World Leaders Equity ETF |
| EXPENSE EXAMPLES (Unaudited) |
| October 31, 2018 |
As a shareholder of the Fund, you incur two types of costs: (1) transaction costs for purchasing and selling shares; and (2) ongoing costs, including management fees and other fund expenses. This example is intended to help you understand your ongoing costs (in dollars) of investing in the Fund and to compare these costs with the ongoing costs of investing in other mutual funds.
The Example is based on an investment of $1,000 invested at the beginning of the six-month period and held for the entire six-month period from May 1, 2018 to October 31, 2018 (the ’‘period’’).
Actual Expenses
The first line of the table below provides information about actual account values and actual expenses. You may use the information in this line, together with the amount you invested, to estimate the expenses that you paid over the period. Simply divide your account value by $1,000 (for example, an $8,600 account value divided by $1,000 = 8.6), then multiply the result by the number in the first line under the heading entitled ’‘Expenses Paid During the Period’’ to estimate the expenses you paid on your account during this period.
Hypothetical Example for Comparison Purposes
The second line of the table below provides information about hypothetical account values and hypothetical expenses based on the Fund’s actual expense ratio and an assumed rate of return of 5% per year before expenses, which is not the Fund’s actual return. The hypothetical account values and expenses may not be used to estimate the actual ending account balance or expenses you paid for the period. You may use this information to compare the ongoing costs of investing in the Fund and other funds. To do so, compare this 5% hypothetical example with the 5% hypothetical examples that appear in the shareholder reports of the other funds. Please note that the expenses shown in the table are meant to highlight your ongoing costs only and do not reflect any transactional costs, such as brokerage commissions on purchases or sales of Fund shares. Therefore, the second line of the table is useful in comparing ongoing costs only, and will not help you determine the relative total costs of owning different funds. In addition, if these transactional costs were included, your costs would have been higher.
| Beginning | Ending | Expenses Paid | Expense Ratio | |||||||||||
| Account Value | Account Value | During Period | During the Period | |||||||||||
| Actual | 5/1/18 | 10/31/18 | 5/1/18-10/31/18* | 5/1/18-10/31/18 | ||||||||||
| $1,000.00 | $942.50 | $2.30 | 0.47% | |||||||||||
| Beginning | Ending | Expenses Paid | Expense Ratio | |||||||||||
| Hypothetical | Account Value | Account Value | During Period | During the Period | ||||||||||
| (5% return before expenses) | 5/1/18 | 10/31/18 | 5/1/18-10/31/18* | 5/1/18-10/31/18 | ||||||||||
| $1,000.00 | $1,022.84 | $2.39 | 0.47% |
| * | Expenses are equal to the average account value over the period, multiplied by the Fund’s annualized expense ratio, multiplied by the number of days in the period (184) divided by the number of days in the fiscal year (365). |
23
| Affinity World Leaders Equity ETF |
| SUPPLEMENTAL INFORMATION (Unaudited) |
| October 31, 2018 |
Trustees and Officers. The Trustees and officers of the Trust, together with information as to their principal business occupations during the past five years and other information, are shown below. Unless otherwise noted, the address of each Trustee and Officer is 17605 Wright Street, Suite 2, Omaha, Nebraska 68130.
Independent Trustees *
| Name, Address, Year of Birth | Position(s) Held with Registrant | Term and Length Served | Principal Occupation(s) During Past 5 Years | Number of Portfolios Overseen In The Fund Complex** | Other Directorships Held During Past 5 Years |
| Mark Garbin Year of Birth: 1951 | Trustee | Indefinite, Since 2012 | Managing Principal, Coherent Capital Management LLC (since 2008) | 5 | Northern Lights Fund Trust (since 2013); Northern Lights Variable Trust (for series not affiliated with the Funds since 2013); Forethought Variable Insurance Trust (since 2013); Northern Lights Variable Trust (since 2013); OHA Mortgage Strategies Fund (offshore), Ltd. (2014 - 2017); and Altegris KKR Commitments Master Fund (since 2014); and OFI Carlyle Private Credit Fund (since March 2018) |
| Mark D. Gersten Year of Birth: 1950 | Chairman, Trustee | Indefinite, Since 2012 | Independent Consultant (since 2012); Senior Vice President – Global Fund Administration Mutual Funds & Alternative Funds, AllianceBernstein LP (1985 – 2011). | 5 | Northern Lights Fund Trust (since 2013);Northern Lights Variable Trust (for series not affiliated with the Funds since 2013); Altegris KKR Commitments Master Fund (since 2014); previously, Ramius Archview Credit and Distressed Fund (2015-2017); and Schroder Global Series Trust (2012 to 2017) |
| Neil M. Kaufman Year of Birth: 1960 | Trustee, Audit Committee Chairman | Indefinite, Since 2012 | Managing Member, Kaufman & Associates, LLC (legal services)(Since 2016); Partner, Abrams Fensterman, Fensterman, Eisman, Formato, Ferrara & Wolf, LLP (legal services)(2010-2016) | 5 | Altegris KKR Commitments Master Fund (since 2014) |
| Anita K. Krug Year of Birth: 1969 | Trustee | Indefinite, Since 2012 | Interim Vice Chancellor for Academic Affairs (since 2018) University of Washington Bothell;Interim Dean (2017-2018), Professor (since 2016), Associate Professor (2014-2016); and Assistant Professor(2010-2014), University of Washington School of Law | 5 | Altegris KKR Commitments Master Fund (since 2014); Centerstone Investors Trust (since 2016) |
| * | Information is as of October 31, 2018. |
| ** | As of October 31, 2018, the Trust was comprised of 21 active portfolios managed by seven unaffiliated investment advisers and two affiliated investment advisers. The term “Fund Complex” applies only to those funds that (i) are advised by a common investment adviser or by an investment adviser that is an affiliated person of the investment adviser of any of the other funds in the Trust or (ii) hold themselves out to investors as related companies for purposes of investment and investor services. The Fund does not hold itself out as related to any other series within the Trust except for the Anfield Capital Diversified Alternatives ETF, Affinity Small Cap Fund, Anfield Universal Fixed Income Fund and Anfield Universal Fixed Income ETF, each of which are advised by Regents Park Funds, LLC, an affiliate of the Fund’s Adviser. |
24
| Affinity World Leaders Equity ETF |
| SUPPLEMENTAL INFORMATION (Unaudited)(Continued) |
| October 31, 2018 |
Officers of the Trust*
| Name, Address, Year of Birth | Position(s) Held with Registrant | Principal Occupation(s) During Past 5 Years | Number of Portfolios Overseen In The Fund Complex** | Other Directorships Held During Past 5 Years |
| James Colantino 80 Arkay Drive Hauppauge, NY 11788 Year of Birth: 1969 | President Since Feb. 2017 Treasurer (2012 to 2017) | Senior Vice President (2012-present); Vice President (2004 to 2012); Gemini Fund Services, LLC. | N/A | N/A |
| Laura Szalyga 80 Arkay Drive Hauppauge, NY 11788 Year of Birth: 1978 | Treasurer Since Feb. 2017 | Vice President, Gemini Fund Services, LLC (since 2015); Assistant Vice President, Gemini Fund Services, LLC (2011-2014). | N/A | N/A |
| Richard A. Malinowski 80 Arkay Drive Hauppauge, NY 11788 Year of Birth: 1983 | Vice President Since Sep. 2018 Secretary Since 2013 | Senior Vice President (since 2017); Vice President and Counsel (2016-2017) and Assistant Vice President (2012 – 2016), Gemini Fund Services, LLC | N/A | N/A |
| William B. Kimme Year of Birth: 1962 | Chief Compliance Officer Since Inception | Senior Compliance Officer, Northern Lights Compliance Services, LLC (September 2011- present) | N/A | N/A |
| * | Information is as of October 31, 2018. |
| ** | As of October 31, 2018, the Trust was comprised of 21 active portfolios managed by seven unaffiliated investment advisers and two affiliated investment advisers. The term “Fund Complex” applies only to those funds that (i) are advised by a common investment adviser or by an investment adviser that is an affiliated person of the investment adviser of any of the other funds in the Trust or (ii) hold themselves out to investors as related companies for purposes of investment and investor services. The Fund does not hold itself out as related to any other series within the Trust except for the Anfield Capital Diversified Alternatives ETF, Affinity Small Cap Fund, Anfield Universal Fixed Income Fund and Anfield Universal Fixed Income ETF, each of which are advised by Regents Park Funds, LLC, an affiliate of the Fund’s Adviser. |
The Fund’s Statement of Additional Information (“SAI”) includes additional information about the Trustees and is available free of charge, upon request, by calling toll-free at 1-866-866-4848.
25
PRIVACY NOTICE
| FACTS | WHAT DOES TWO ROADS SHARED TRUST DO WITH YOUR PERSONAL INFORMATION |
| Why? | Financial companies choose how they share your personal information. |
| Federal law gives consumers the right to limit some but not all sharing. | |
| Federal law also requires us to tell you how we collect, share, and protect your personal information. Please read this notice carefully to understand what we do. | |
| What? | THE TYPES OF PERSONAL INFORMATION WE COLLECT AND SHARE DEPENDS ON THE PRODUCT OR SERVICE THAT YOU HAVE WITH US. THIS INFORMATION CAN INCLUDE: |
| ● Social Security number and income | |
| ● Account transactions and transaction history | |
| ● Investment experience and purchase history | |
| When you are no longer our customer, we continue to share your information as described in this notice. | |
| How? | All financial companies need to share customers’ personal information to run their everyday business. In the section below, we list the reasons financial companies can share their customers’ personal information; the reason Two Roads Shared Trust chooses to share and whether you can limit this sharing. |
| Reasons we can share your personal information | Does Two Roads Shared Trust share? | Can you limit this sharing? |
| For our everyday business purposes – | ||
| such as to process your transactions, maintain your account(s), respond to court orders and legal investigations, or report to credit bureaus | YES | NO |
| For our marketing purposes – | NO | We do not share |
| to offer our products and services to you | ||
| For joint marketing with other financial companies | NO | We do not share |
| For our affiliates’ everyday business purposes – | NO | We do not share |
| information about your transactions and experiences | ||
| For our affiliates’ everyday business purposes – | NO | We do not share |
| information about your creditworthiness | ||
| For our affiliates to market to you | NO | We do not share |
| For nonaffiliates to market to you | NO | We do not share |
| Questions? | Call 1-402-895-1600 |
26
What we do
| How does Two Roads Shared Trust protect my personal information? | To protect your personal information from unauthorized access and use, we use security measures that comply with federal law. These measures include computer safeguards and secured files and buildings. |
| Our service providers are held accountable for adhering to strict policies and procedures to prevent any misuse of your nonpublic personal information. | |
| How does Two Roads Shared Trust | We collect your personal information, for example, when you |
| collect my personal information? | |
| ● open an account or give us contact information | |
| ● provide account information or give us your income information | |
| ● make deposits or withdrawals from your account | |
| We also collect your personal information from other companies. | |
| Why can’t I limit all sharing? | Federal law gives you the right to limit only |
| ● sharing for affiliates’ everyday business purposes – information about your creditworthiness | |
| ● affiliates from using your information to market to you | |
| ● sharing for nonaffiliates to market to you | |
| State laws and individual companies may give you additional rights to limit sharing | |
| Definitions | |
| Affiliates | Companies related by common ownership or control. They can be financial and nonfinancial companies. |
| ● Two Roads Shared Trust has no affiliates. | |
| Nonaffiliates | Companies not related by common ownership or control. They can be financial and nonfinancial companies. |
| ● Two Roads Shared Trust does not share with nonaffiliates so they can market to you. | |
| Joint marketing | A formal agreement between nonaffiliates financial companies that together market financial products or services to you. |
| ● Two Roads Shared Trust does not jointly market. |
27
Proxy Voting Policy
Information regarding how the Fund votes proxies relating to portfolio securities for the twelve month period ended June 30th as well as a description of the policies and procedures that the Fund used to determine how to vote proxies is available without charge, upon request, by calling 1-866-866-4848 or by referring to the Securities and Exchange Commission’s (“SEC”) website at http://www.sec.gov.
Portfolio Holdings
The Fund files its complete schedule of portfolio holdings with the SEC for the first and third quarters of each fiscal year on Form N-Q. Form N-Q is available on the SEC’s website at http://www.sec.gov and may be reviewed and copied at the SEC’s Public Reference Room in Washington, DC (1-800-SEC-0330). The information on Form N-Q is available without charge, upon request, by calling 1-866-866-4848.
| Adviser |
| Regents Park Funds, LLC |
| 4041 MacArthur Blvd., Suite 155 |
| Newport Beach, CA 92660 |
| Administrator |
| Gemini Fund Services, LLC |
| 80 Arkay Drive, Suite 110 |
| Hauppauge, NY 11788 |
This report and the financial statements contained herein are submitted for the general information of shareholders and are not authorized for distribution to prospective investors unless preceded or accompanied by an effective prospectus, which contains information about the Fund’s investment objective, risks, fees and expenses. Investors are reminded to read the prospectus carefully before investing in the Fund.
ITEM 2. CODE OF ETHICS.
| (a) | The registrant has, as of the end of the period covered by this report, adopted a code of ethics that applies to the registrant's principal executive officer, principal financial officer, and principal accounting officer or controller, or persons performing similar functions, regardless of whether these individuals are employed by the registrant or a third party. |
| (b) | During the period covered by this report, there were no amendments to any provision of the code of ethics. |
| (c) | During the period covered by this report, there were no waivers or implicit waivers of a provision of the code of ethics. |
ITEM 3. AUDIT COMMITTEE FINANCIAL EXPERT.
| The Registrant’s board of trustees has determined that Mark Gersten is an audit committee financial expert, as defined in Item 3 of Form N-CSR. Mr. Gersten is independent for purposes of this Item 3. |
ITEM 4. PRINCIPAL ACCOUNTANT FEES AND SERVICES.
| (a) | Audit Fees |
| Trust Series | 2018 | |
| Affinity World Leaders Equity ETF | $15,000 |
| (b) | Audit-Related Fees – None |
| (c) | Tax Fees |
| Trust Series | 2018 | |
| Affinity World Leaders Equity ETF | $3,000 |
| (d) | All Other Fees – None |
| (e)(1) | The audit committee does not have pre-approval policies and procedures. Instead, the audit committee or audit committee chairman approves on a case-by-case basis each audit or non-audit service before the principal accountant is engaged by the registrant. |
| (e)(2) | There were no services described in each of paragraphs (b) through (d) of this Item that were approved by the audit committee pursuant to paragraph (c)(7)(i)(C) of Rule 2-01 of Regulation S-X. |
| f) | Not applicable. The percentage of hours expended on the principal accountant's engagement to audit the registrant's financial statements for the most recent fiscal year that were attributed to work performed by persons other than the principal accountant's full-time, permanent employees was zero percent (0%). |
| (g) | All non-audit fees billed by the registrant's principal accountant for services rendered to the registrant for the fiscal year ended October 31, 2018 are disclosed in (b)-(d) above. There were no audit or non-audit services performed by the registrant's principal accountant for the registrant's adviser. |
ITEM 5. AUDIT COMMITTEE OF LISTED REGISTRANTS.
Not applicable
ITEM 6. SCHEDULE OF INVESTMENT
Included in annual report to shareholders filed under item 1 of this form.
ITEM 7. DISCLOSURE OF PROXY VOTING POLICIES AND PROCEDURES FOR CLOSED-END MANAGEMENT INVESTMENT COMPANIES.
Not applicable Fund is an open-end management investment company
ITEM 8. PORTFOLIO MANAGERS OF CLOSED-END MANAGEMENT INVESTMENT COMPANIES
Not applicable Fund is an open-end management investment company
ITEM 9. PURCHASES OF EQUITY SECURITIES BY CLOSED-END MANAGEMENT INVESTMENT COMPANY AND AFFILIATED PURCHASERS.
Not applicable Fund is an open-end management investment company
ITEM 10. SUBMISSION OF MATTERS TO A VOTE OF SECURITY HOLDERS.
Not applicable at this time.
ITEM 11. CONTROLS AND PROCEDURES.
| (a) | The registrant's principal executive and principal financial officers, or persons performing similar functions, have concluded that the registrant's disclosure controls and procedures (as defined in Rule 30a-3(c) under the 1940 Act, are effective, as of a date within 90 days of the filing date of this report, based on the evaluation of these controls and procedures required by Rule 30a-3(b) under the 1940 Act and Rule 15d-15(b) under the Securities Exchange Act of 1934, as amended. |
| (b) | There were no changes in the registrant's internal control over financial reporting (as defined in Rule 30a-3(d) under the 1940 Act) that occurred during the period covered by this report that have materially affected, or are reasonably likely to materially affect, the registrant's internal control over financial reporting. |
ITEM 12. Disclosure of Securities Lending Activities for Closed-End Management Investment Companies.
Not applicable Fund is an open-end management investment company
ITEM 13. EXHIBITS
| (1) | Code of Ethics for Principal Executive and Senior Financial Officers is attached hereto. |
| (2) | Certifications pursuant to Section 302 of the Sarbanes-Oxley Act of 2002 are filed herewith. |
| (3) | Certifications pursuant to Section 906 of the Sarbanes-Oxley Act of 2002 are filed herewith. |
SIGNATURES
Pursuant to the requirements of the Securities Exchange Act of 1934 and the Investment Company Act of 1940, the registrant has duly caused this report to be signed on its behalf by the undersigned, thereunto duly authorized.
Two Roads Shared Trust
| By James Colantino | /s/ James Colantino |
| Principal Executive Officer/President, | |
| Date: January 4, 2019 | |
Pursuant to the requirements of the Securities Exchange Act of 1934 and the Investment Company Act of 1940, this report has been signed below by the following person on behalf of the registrant and in the capacities and on the date indicated.
| By Laura Szalyga | /s/ Laura Szalyga |
| Principal Financial Officer/Treasurer | |
| Date: January 4, 2019 | |