united states
securities and exchange commission
washington, d.c. 20549
form n-csr
certified shareholder report of registered management
investment companies
| Investment Company Act file number | 811-22718 |
| | |
| Two Roads Shared Trust |
| (Exact name of registrant as specified in charter) |
| |
| 225 Pictoria Drive, Suite 450, Cincinnati, OH | 45246 |
| (Address of principal executive offices) | (Zip code) |
| | |
| The Corporation Trust Company |
| 1209 Orange Street, Wilmington, DE 19801 |
| (Name and address of agent for service) |
| |
| Registrant’s telephone number, including area code: | 631-490-4300 |
| | |
| Date of fiscal year end: | 7/31 | |
| | | |
| Date of reporting period: | 7/31/2024 | |
Item 1. Reports to Stockholders.
Foundations Dynamic Core ETF
(FDCE) Cboe BZX Exchange, Inc.
Annual Shareholder Report - July 31, 2024
This annual shareholder report contains important information about Foundations Dynamic Core ETF for the period of October 2, 2023 to July 31, 2024. You can find additional information about the Fund at https://regentsparkfunds.com/our-funds/foundations-dynamic-core-equity-etf/?cb=2060. You can also request this information by contacting us at 949.891.0600.
What were the Fund’s costs for the last year?
(based on a hypothetical $10,000 investment)
| Fund Name | Costs of a $10,000 investment | Costs paid as a percentage of a $10,000 investment |
|---|
| Foundations Dynamic Core ETF | $83 | 0.74% |
How did the Fund perform during the reporting period?
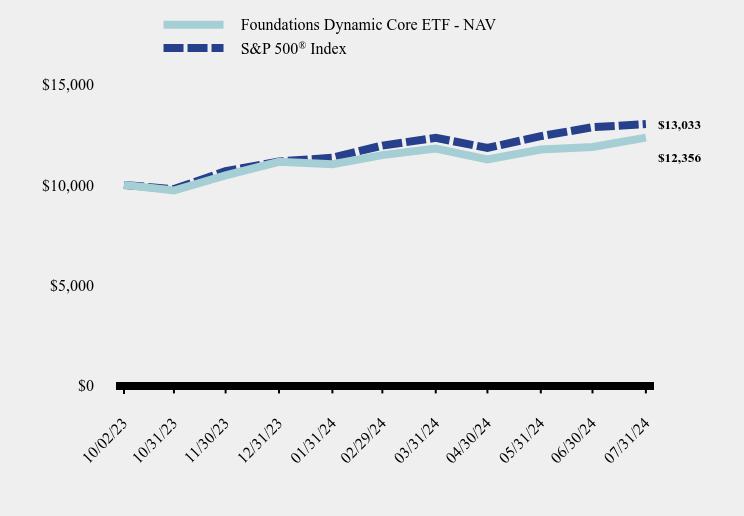
The Foundations Dynamic Core ETF (“FDCE” or “the Fund”) delivered positive returns the annual period ended July 31st, 2024, but underperformed its benchmark, although past performance does not guarantee future results. FDCE posted a net return of +23.56% since its inception date of 10/2/2023 versus the S&P 500’s +30.33%. The underperformance was mainly driven by the Fund’s positioning in value-oriented securities that underperformed the mega-cap growth securities. Mega-cap returns constituted a large portion of the S&P 500’s returns. Intraday volatility that dictates leverage use within the Fund changed quite often over the period and impacted the Fund's returns.
How has the Fund performed since inception?
Total Return Based on $10,000 Investment
| Foundations Dynamic Core ETF - NAV | S&P 500® Index |
|---|
| 10/02/23 | $10,000 | $10,000 |
| 10/31/23 | $9,720 | $9,789 |
| 11/30/23 | $10,470 | $10,683 |
| 12/31/23 | $11,154 | $11,168 |
| 01/31/24 | $11,034 | $11,356 |
| 02/29/24 | $11,485 | $11,962 |
| 03/31/24 | $11,815 | $12,347 |
| 04/30/24 | $11,274 | $11,843 |
| 05/31/24 | $11,765 | $12,430 |
| 06/30/24 | $11,895 | $12,876 |
| 07/31/24 | $12,356 | $13,033 |
Average Annual Total Returns
| Since Inception (October 2, 2023) |
|---|
| Foundations Dynamic Core ETF - NAV | 23.56% |
| Foundations Dynamic Core ETF - Market Price | 23.46% |
S&P 500® Index | 30.33% |
The Fund's past performance is not a good predictor of how the Fund will perform in the future. The graph and table do not reflect the deduction of taxes that a shareholder would pay on fund distributions or redemption of fund shares.
- Net Assets$9,863,676
- Number of Portfolio Holdings5
- Advisory Fee $26,400
- Portfolio Turnover0%
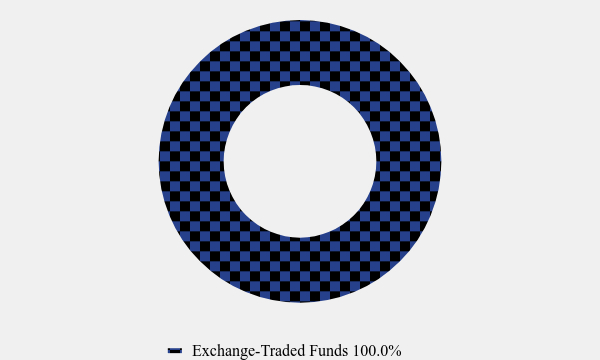
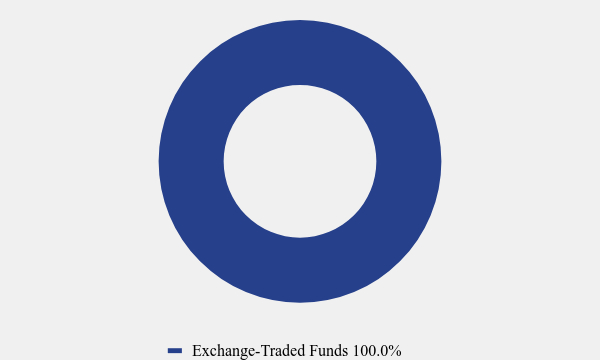
Asset Weighting (% of total investments)
| Value | Value |
|---|
| Exchange-Traded Funds | 100.0% |
What did the Fund invest in?
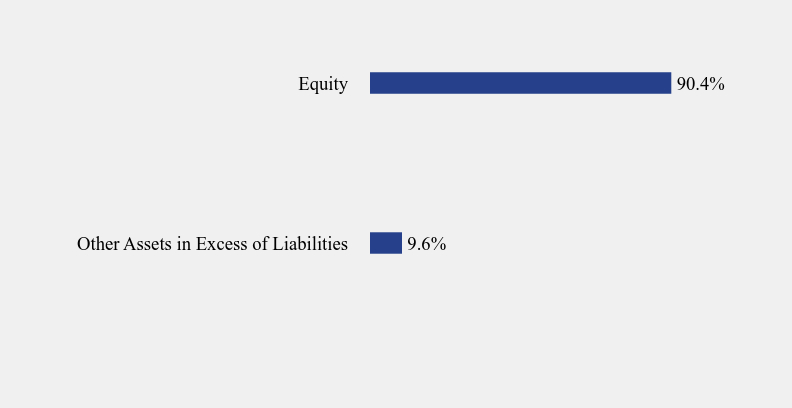
Sector Weighting (% of net assets)
| Value | Value |
|---|
| Other Assets in Excess of Liabilities | 9.6% |
| Equity | 90.4% |
Top 10 Holdings (% of net assets)
| Holding Name | % of Net Assets |
| Vanguard Total Stock Market ETF | 27.7% |
| iShares Core S&P Small-Cap ETF | 26.2% |
| iShares Core S&P 500 ETF USD Class, USD Class | 18.5% |
| Vanguard Large-Cap ETF | 9.3% |
| iShares Core S&P Mid-Cap ETF | 8.7% |
No material changes occurred during the year ended July 31, 2024.
Foundations Dynamic Core ETF
Annual Shareholder Report - July 31, 2024
Where can I find additional information about the Fund?
Additional information is available on the Fund's website ( https://regentsparkfunds.com/our-funds/foundations-dynamic-core-equity-etf/?cb=2060 ), including its:
Prospectus
Financial information
Holdings
Proxy voting information
Foundations Dynamic Growth ETF
(FDGR) Cboe BZX Exchange, Inc.
Annual Shareholder Report - July 31, 2024
This annual shareholder report contains important information about Foundations Dynamic Growth ETF for the period of October 2, 2023 to July 31, 2024. You can find additional information about the Fund at https://regentsparkfunds.com/our-funds/foundations-dynamic-growth-etf/?cb=2060. You can also request this information by contacting us at 949.891.0600.
What were the Fund’s costs for the last year?
(based on a hypothetical $10,000 investment)
| Fund Name | Costs of a $10,000 investment | Costs paid as a percentage of a $10,000 investment |
|---|
| Foundations Dynamic Growth ETF | $83 | 0.74% |
How did the Fund perform during the reporting period?
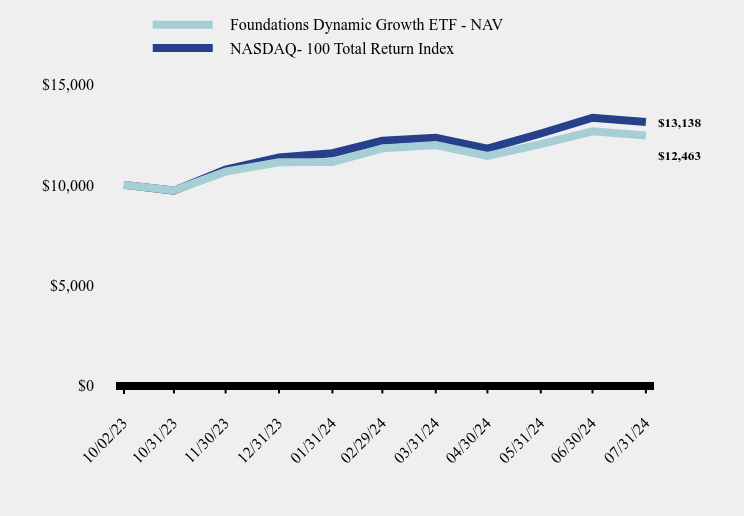
The Foundations Dynamic Growth ETF (“FDGR” or “the Fund”) delivered positive returns while underperforming its benchmark for the annual period ended July 31st, 2024, although past performance does not guarantee future results. FDGR posted a net return of +24.63% since its inception date of 10/2/2023 versus the Nasdaq 100 Index’s return of +31.38%. The underperformance was mainly driven by the Fund’s positioning in a broader set of growth securities that underperformed the mega-cap growth securities that greatly influenced the NASDAQ 100 Index returns. Intraday volatility that dictates leverage use within the Fund changed quite often over the period and impacted the Fund's returns.
How has the Fund performed since inception?
Total Return Based on $10,000 Investment
| Foundations Dynamic Growth ETF - NAV | NASDAQ- 100 Total Return Index |
|---|
| 10/02/23 | $10,000 | $10,000 |
| 10/31/23 | $9,720 | $9,716 |
| 11/30/23 | $10,660 | $10,767 |
| 12/31/23 | $11,132 | $11,365 |
| 01/31/24 | $11,142 | $11,580 |
| 02/29/24 | $11,823 | $12,206 |
| 03/31/24 | $11,983 | $12,356 |
| 04/30/24 | $11,442 | $11,809 |
| 05/31/24 | $12,033 | $12,564 |
| 06/30/24 | $12,674 | $13,351 |
| 07/31/24 | $12,463 | $13,138 |
Average Annual Total Returns
| Since Inception (October 2, 2023) |
|---|
| Foundations Dynamic Growth ETF - NAV | 24.63% |
| Foundations Dynamic Growth ETF - Market Price | 24.73% |
| NASDAQ- 100 Total Return Index | 31.38% |
The Fund's past performance is not a good predictor of how the Fund will perform in the future. The graph and table do not reflect the deduction of taxes that a shareholder would pay on fund distributions or redemption of fund shares.
| Net Assets | $17,425,343 |
| Number of Portfolio Holdings | 5 |
| Advisory Fee | $47,767 |
| Portfolio Turnover | 0% |
Asset Weighting (% of total investments)
| Value | Value |
|---|
| Exchange-Traded Funds | 100.0% |
What did the Fund invest in?
Sector Weighting (% of net assets)
| Value | Value |
|---|
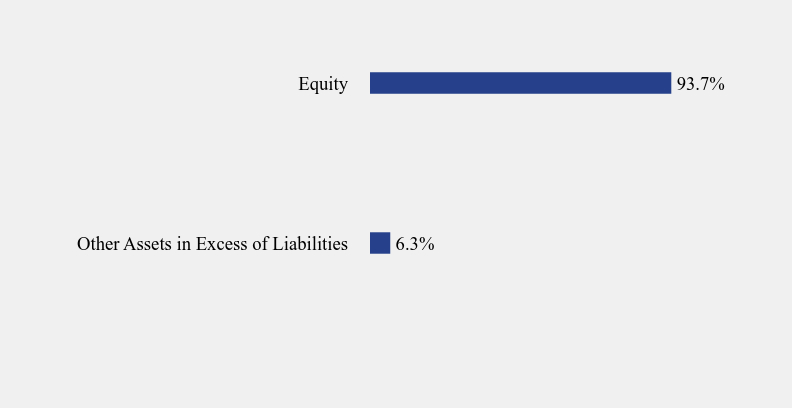
| Other Assets in Excess of Liabilities | 6.3% |
| Equity | 93.7% |
Top 10 Holdings (% of net assets)
| Holding Name | % of Net Assets |
| Vanguard Growth ETF | 48.0% |
| Vanguard Mega Cap Growth ETF | 14.5% |
| iShares Core S&P U.S. Growth ETF | 14.4% |
| Vanguard Mid-Cap Growth ETF | 8.4% |
| Vanguard Small-Cap Growth ETF | 8.4% |
No material changes occurred during the year ended July 31, 2024.
Foundations Dynamic Growth ETF
Annual Shareholder Report - July 31, 2024
Where can I find additional information about the Fund?
Additional information is available on the Fund's website ( https://regentsparkfunds.com/our-funds/foundations-dynamic-growth-etf/?cb=2060 ), including its:
Prospectus
Financial information
Holdings
Proxy voting information
Foundations Dynamic Income ETF
(FDTB) Cboe BZX Exchange, Inc.
Annual Shareholder Report - July 31, 2024
This annual shareholder report contains important information about Foundations Dynamic Income ETF for the period of October 2, 2023 to July 31, 2024. You can find additional information about the Fund at https://regentsparkfunds.com/our-funds/foundations-dynamic-income-etf/?cb=2061. You can also request this information by contacting us at 949.891.0600.
What were the Fund’s costs for the last year?
(based on a hypothetical $10,000 investment)
| Fund Name | Costs of a $10,000 investment | Costs paid as a percentage of a $10,000 investment |
|---|
| Foundations Dynamic Income ETF | $72 | 0.73% |
How did the Fund perform during the reporting period?
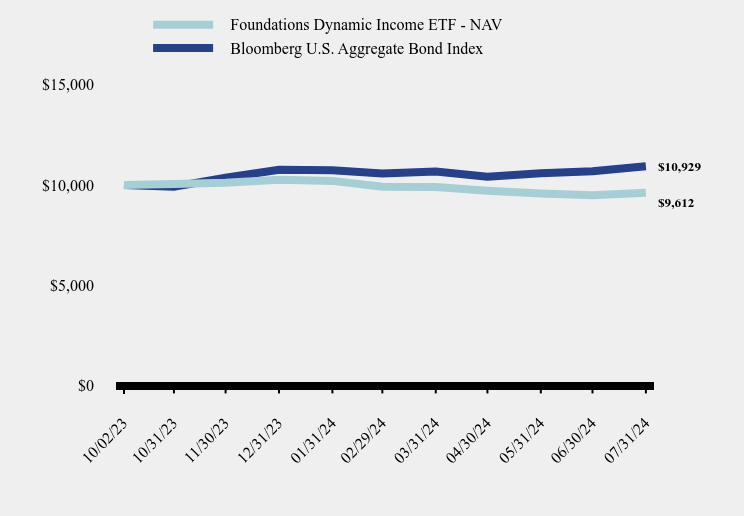
The Foundations Dynamic Income ETF (“FDTB” or “the Fund”) delivered negative returns and underperformed its benchmark for the annual period ended July 31st, 2024, although past performance does not guarantee future results. FDTB posted a net return of -3.88% since its inception date of 10/2/2023 versus the Bloomberg Aggregate Bond Index’s +9.29%. The underperformance was mainly driven by the Fund’s overweight and, at times, leveraged positioning in long-duration US Treasuries. The Fund’s allocation and leverage changed quite often as economic conditions toggled from a perceived inflationary period to a standard economic cycle to a slow growth period. These changing economic conditions were also accompanied by significant changes to intraday volatility that dictated degrees of leverage utilizing long-duration US Treasury futures.
How has the Fund performed since inception?
Total Return Based on $10,000 Investment
| Foundations Dynamic Income ETF - NAV | Bloomberg U.S. Aggregate Bond Index |
|---|
| 10/02/23 | $10,000 | $10,000 |
| 10/31/23 | $10,040 | $9,910 |
| 11/30/23 | $10,110 | $10,359 |
| 12/31/23 | $10,260 | $10,756 |
| 01/31/24 | $10,200 | $10,726 |
| 02/29/24 | $9,906 | $10,574 |
| 03/31/24 | $9,893 | $10,672 |
| 04/30/24 | $9,710 | $10,403 |
| 05/31/24 | $9,567 | $10,579 |
| 06/30/24 | $9,479 | $10,679 |
| 07/31/24 | $9,612 | $10,929 |
Average Annual Total Returns
| Since Inception (October 2, 2023) |
|---|
| Foundations Dynamic Income ETF - NAV | -3.88% |
| Foundations Dynamic Income ETF - Market Price | -3.88% |
| Bloomberg U.S. Aggregate Bond Index | 9.29% |
The Fund's past performance is not a good predictor of how the Fund will perform in the future. The graph and table do not reflect the deduction of taxes that a shareholder would pay on fund distributions or redemption of fund shares.
| Net Assets | $15,020,998 |
| Number of Portfolio Holdings | 9 |
| Advisory Fee | $40,653 |
| Portfolio Turnover | 1210% |
Asset Weighting (% of total investments)
| Value | Value |
|---|
| Exchange-Traded Funds | 100.0% |
What did the Fund invest in?
Sector Weighting (% of net assets)
| Value | Value |
|---|
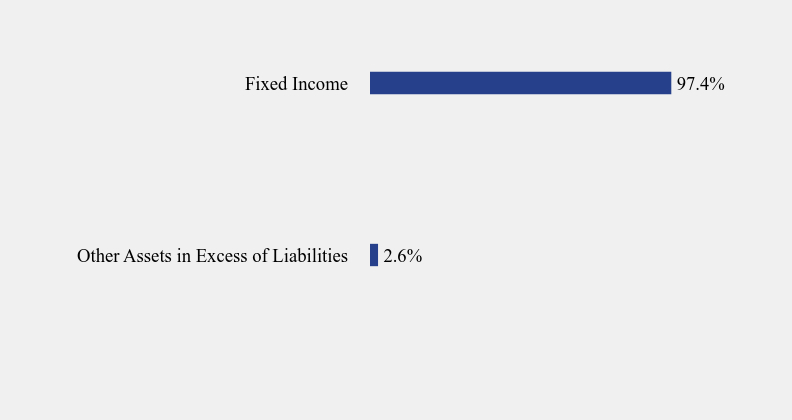
| Other Assets in Excess of Liabilities | 2.6% |
| Fixed Income | 97.4% |
Top 10 Holdings (% of net assets)
| Holding Name | % of Net Assets |
| Vanguard Long-Term Treasury ETF | 41.3% |
| iShares 20+ Year Treasury Bond ETF | 10.3% |
| Vanguard Intermediate-Term Treasury ETF | 10.2% |
| iShares Broad USD Investment Grade Corporate Bond | 10.2% |
| Vanguard Short-Term Treasury ETF | 10.2% |
| Vanguard Short-Term Corporate Bond ETF | 7.1% |
| Vanguard Long-Term Corporate Bond ETF | 5.1% |
| SPDR Bloomberg High Yield Bond ETF | 2.0% |
| Vanguard Intermediate-Term Corporate Bond ETF | 1.0% |
No material changes occurred during the year ended July 31, 2024.
Foundations Dynamic Income ETF
Annual Shareholder Report - July 31, 2024
Where can I find additional information about the Fund?
Additional information is available on the Fund's website ( https://regentsparkfunds.com/our-funds/foundations-dynamic-income-etf/?cb=2061 ), including its:
Prospectus
Financial information
Holdings
Proxy voting information
Foundations Dynamic Value ETF
(FDVL) Cboe BZX Exchange, Inc.
Annual Shareholder Report - July 31, 2024
This annual shareholder report contains important information about Foundations Dynamic Value ETF for the period of October 2, 2023 to July 31, 2024. You can find additional information about the Fund at https://regentsparkfunds.com/our-funds/foundations-dynamic-value-etf/?cb=2068. You can also request this information by contacting us at 949.891.0600.
What were the Fund’s costs for the last year?
(based on a hypothetical $10,000 investment)
| Fund Name | Costs of a $10,000 investment | Costs paid as a percentage of a $10,000 investment |
|---|
| Foundations Dynamic Value ETF | $81 | 0.73% |
How did the Fund perform during the reporting period?
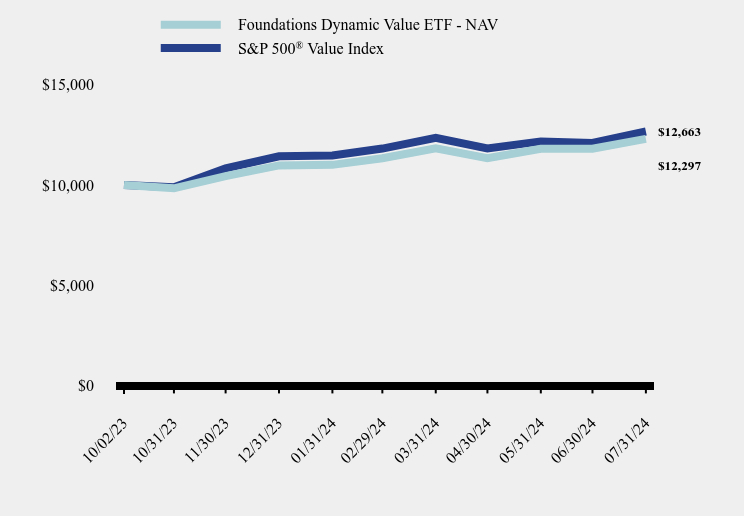
The Foundations Dynamic Value ETF (“FDVL” or “the Fund”) delivered positive returns while slightly underperforming its benchmark for the annual period ended July 31st, 2024, although past performance does not guarantee future results. FVDL posted a net return of +22.97% since its inception date of 10/2/2023 versus the S&P 500 Value Index’s return of +26.63%. Intraday volatility that dictates leverage use within the Fund changed quite often over the period and had an impact on the Fund's returns.
How has the Fund performed since inception?
Total Return Based on $10,000 Investment
| Foundations Dynamic Value ETF - NAV | S&P 500® Value Index |
|---|
| 10/02/23 | $10,000 | $10,000 |
| 10/31/23 | $9,830 | $9,883 |
| 11/30/23 | $10,440 | $10,829 |
| 12/31/23 | $10,970 | $11,428 |
| 01/31/24 | $11,000 | $11,462 |
| 02/29/24 | $11,332 | $11,811 |
| 03/31/24 | $11,825 | $12,348 |
| 04/30/24 | $11,332 | $11,817 |
| 05/31/24 | $11,805 | $12,169 |
| 06/30/24 | $11,805 | $12,089 |
| 07/31/24 | $12,297 | $12,663 |
Average Annual Total Returns
| Since Inception (October 2, 2023) |
|---|
| Foundations Dynamic Value ETF - NAV | 22.97% |
| Foundations Dynamic Value ETF - Market Price | 22.97% |
S&P 500® Value Index | 26.63% |
The Fund's past performance is not a good predictor of how the Fund will perform in the future. The graph and table do not reflect the deduction of taxes that a shareholder would pay on fund distributions or redemption of fund shares.
| Net Assets | $1,835,506 |
| Number of Portfolio Holdings | 7 |
| Advisory Fee | $36,318 |
| Portfolio Turnover | 0% |
Asset Weighting (% of total investments)
| Value | Value |
|---|
| Exchange-Traded Funds | 100.0% |
What did the Fund invest in?
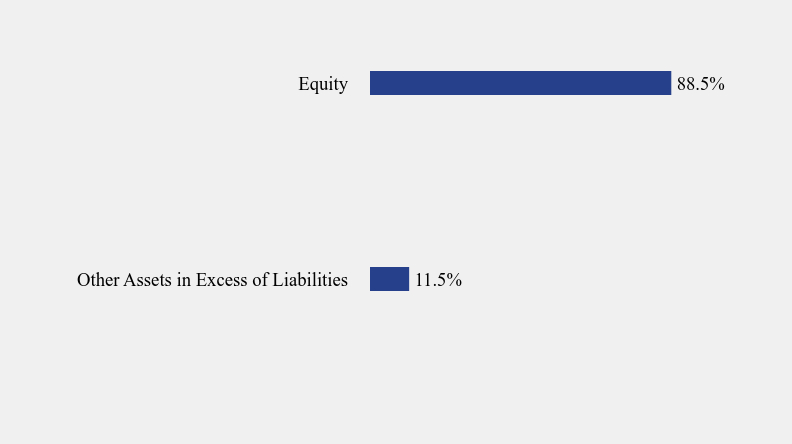
Sector Weighting (% of net assets)
| Value | Value |
|---|
| Other Assets in Excess of Liabilities | 11.5% |
| Equity | 88.5% |
Top 10 Holdings (% of net assets)
| Holding Name | % of Net Assets |
| Vanguard Value ETF | 26.6% |
| Vanguard Dividend Appreciation ETF | 13.3% |
| Vanguard High Dividend Yield ETF | 13.1% |
| Avantis US Large Cap Value ETF | 9.0% |
| Vanguard Mega Cap Value ETF | 8.9% |
| Vanguard Small-Cap Value ETF | 8.9% |
| Vanguard Mid-Cap Value ETF | 8.7% |
No material changes occurred during the year ended July 31, 2024.
Foundations Dynamic Value ETF
Annual Shareholder Report - July 31, 2024
Where can I find additional information about the Fund?
Additional information is available on the Fund's website ( https://regentsparkfunds.com/our-funds/foundations-dynamic-value-etf/?cb=2068 ), including its:
Prospectus
Financial information
Holdings
Proxy voting information
Item 2. Code of Ethics.
| (a) | The registrant has, as of the end of the period covered by this report, adopted a code of ethics that applies to the registrant’s principal executive officer, principal financial officer, and principal accounting officer or controller, or persons performing similar functions, regardless of whether these individuals are employed by the registrant or a third party. |
| (c) | During the period covered by this report, there were no amendments to any provision of the code of ethics. |
| (d) | During the period covered by this report, there were no waivers or implicit waivers of a provision of the code of ethics. |
Item 3. Audit Committee Financial Expert.
(a)(1) The registrant’s board of trustees has determined that the registrant has at least one audit committee financial expert serving on the audit committee.
(a)(2) Mark Gersten and Neil M. Kaufman are audit committee financial experts, as defined in Item 3 of Form N-CSR. Mr. Gersten and Mr. Kaufman are independent for purposes of this Item.
(a)(3) Not applicable.
Item 4. Principal Accountant Fees and Services.
| (a) | Audit Fees. The aggregate fees billed for each of the last two fiscal years for professional services rendered by the registrant’s principal accountant for the audit of the registrant’s annual financial statements or services that are normally provided by the accountant in connection with statutory and regulatory filings or engagements for those fiscal years are as follows: |
| Trust Series | | 2024 | |
| Foundations Dynamic Core ETF | | $ | 14,900 | |
| Foundations Dynamic Growth ETF | | | 14,900 | |
| Foundations Dynamic Income ETF | | | 14,900 | |
| Foundations Dynamic Value ETF | | | 14,900 | |
| | | | | |
| (b) | Audit-Related Fees. There were no fees billed in each of the last two fiscal years for assurances and related services by the principal accountant that are reasonably related to the performance of the audit of the registrant’s financial statements and are not reported under paragraph (a) of this Item. |
| (c) | Tax Fees. The aggregate fees billed in each of the last two fiscal years for professional services rendered by the principal accountant for tax compliance are as follows: |
| Trust Series | | 2024 | |
| Foundations Dynamic Core ETF | | $ | 4,600 | |
| Foundations Dynamic Growth ETF | | | 4,600 | |
| Foundations Dynamic Income ETF | | | 4,600 | |
| Foundations Dynamic Value ETF | | | 4,600 | |
| | | | | |
| | Preparation of Federal & State income tax returns, assistance with calculation of required income, capital gain and excise distributions and preparation of Item 4(c) Federal excise tax returns. |
| (d) | All Other Fees. The aggregate fees billed in each of the last two fiscal years for products and services provided by the registrant’s principal accountant, other than the services reported in paragraphs (a) through (c) of this item were $0 for the fiscal year ended July 31, 2024. |
| (e)(1) | The audit committee does not have pre-approval policies and procedures. Instead, the audit committee or audit committee chairman approves on a case-by-case basis each audit or non-audit service before the principal accountant is engaged by the registrant. |
| (e)(2) | There were no services described in each of paragraphs (b) through (d) of this Item that were approved by the audit committee pursuant to paragraph (c)(7)(i)(C) of Rule 2-01 of Regulation S-X. |
| (g) | All non-audit fees billed by the registrant’s principal accountant for services rendered to the registrant for the fiscal year ended July 31, 2024, are disclosed in (b)-(d) above. There were no audit or non-audit services performed by the registrant’s principal accountant for the registrant’s adviser. |
Item 5. Audit Committee of Listed Registrants.
The registrant is an issuer as defined in Rule 10A-3 under the Securities Exchange Act of 1934, as amended (the “Exchange Act”) and has a separately-designated standing audit committee established in accordance with Section 3(a)(58)A of the Exchange Act. The registrant’s audit committee members are Mark Garbin, Mark Gersten, Neil M. Kaufman and Anita K. Krug.
Item 6. Investments.
(a) The Registrant’s schedule of investments in unaffiliated issuers is included in the Financial Statements under Item 7 of this form.
(b) Not applicable.
Item 7. Financial Statements and Financial Highlights for Open-End Management Investment Companies.
| |
| |
| Foundations Dynamic Core ETF |
| FDCE |
| |
| Foundations Dynamic Growth ETF |
| FDGR |
| |
| Foundations Dynamic Income ETF |
| FDTB |
| |
| Foundations Dynamic Value ETF |
| FDVL |
| |
| |
| |
| |
| |
| |
| July 31, 2024 |
| |
| Annual Financial Statements |
| |
| |
| |
| |
| |
| |
| |
| |
| |
| |
| |
| |
| Advised by: |
| Regents Park Funds, LLC |
| 19900 MacArthur Blvd., Suite 655 |
| Irvine, CA 92612 |
| RegentsParkFunds.com |
| 1-866-866-4848 |
| Distributed by Northern Lights Distributors, LLC |
| Member FINRA |
| FOUNDATIONS DYNAMIC CORE ETF |
| SCHEDULE OF INVESTMENTS |
| July 31, 2024 |
| Shares | | | | | Fair Value | |
| | | | | EXCHANGE-TRADED FUNDS — 90.4% | | | | |
| | | | | EQUITY - 90.4% | | | | |
| | 3,296 | | | iShares Core S&P 500 ETF | | $ | 1,823,743 | |
| | 13,920 | | | iShares Core S&P Mid-Cap ETF | | | 862,622 | |
| | 21,856 | | | iShares Core S&P Small-Cap ETF | | | 2,586,439 | |
| | 3,616 | | | Vanguard Large-Cap ETF | | | 912,461 | |
| | 10,016 | | | Vanguard Total Stock Market ETF | | | 2,730,062 | |
| | | | | | | | 8,915,327 | |
| | | | | | | | | |
| | | | | TOTAL EXCHANGE-TRADED FUNDS (Cost $8,589,637) | | | 8,915,327 | |
| | | | | | | | | |
| | | | | TOTAL INVESTMENTS - 90.4% (Cost $8,589,637) | | $ | 8,915,327 | |
| | | | | OTHER ASSETS IN EXCESS OF LIABILITIES - 9.6% | | | 948,349 | |
| | | | | NET ASSETS - 100.0% | | $ | 9,863,676 | |
ETF - Exchange-Traded Fund
See accompanying notes to financial statements.
| FOUNDATIONS DYNAMIC GROWTH ETF |
| SCHEDULE OF INVESTMENTS |
| July 31, 2024 |
| Shares | | | | | Fair Value | |
| | | | | EXCHANGE-TRADED FUNDS — 93.7% | | | | |
| | | | | EQUITY - 93.7% | | | | |
| | 19,824 | | | iShares Core S&P U.S. Growth ETF | | $ | 2,499,410 | |
| | 22,792 | | | Vanguard Growth ETF | | | 8,371,502 | |
| | 8,232 | | | Vanguard Mega Cap Growth ETF | | | 2,527,306 | |
| | 6,272 | | | Vanguard Mid-Cap Growth ETF | | | 1,464,198 | |
| | 5,600 | | | Vanguard Small-Cap Growth ETF | | | 1,463,896 | |
| | | | | | | | 16,326,312 | |
| | | | | | | | | |
| | | | | TOTAL EXCHANGE-TRADED FUNDS (Cost $16,924,216) | | | 16,326,312 | |
| | | | | | | | | |
| | | | | TOTAL INVESTMENTS - 93.7% (Cost $16,924,216) | | $ | 16,326,312 | |
| | | | | OTHER ASSETS IN EXCESS OF LIABILITIES - 6.3% | | | 1,099,031 | |
| | | | | NET ASSETS - 100.0% | | $ | 17,425,343 | |
ETF - Exchange-Traded Fund
See accompanying notes to financial statements.
| FOUNDATIONS DYNAMIC INCOME ETF |
| SCHEDULE OF INVESTMENTS |
| July 31, 2024 |
| Shares | | | | | Fair Value | |
| | | | | EXCHANGE-TRADED FUNDS — 97.4% | | | | |
| | | | | FIXED INCOME - 97.4% | | | | |
| | 16,319 | | | iShares 20+ Year Treasury Bond ETF | | $ | 1,547,204 | |
| | 29,935 | | | iShares Broad USD Investment Grade Corporate Bond | | | 1,533,570 | |
| | 3,198 | | | SPDR Bloomberg High Yield Bond ETF | | | 306,496 | |
| | 1,891 | | | Vanguard Intermediate-Term Corporate Bond ETF | | | 154,476 | |
| | 25,894 | | | Vanguard Intermediate-Term Treasury ETF | | | 1,538,622 | |
| | 9,837 | | | Vanguard Long-Term Corporate Bond ETF | | | 767,089 | |
| | 104,112 | | | Vanguard Long-Term Treasury ETF | | | 6,195,706 | |
| | 13,613 | | | Vanguard Short-Term Corporate Bond ETF | | | 1,064,945 | |
| | 26,073 | | | Vanguard Short-Term Treasury ETF | | | 1,524,749 | |
| | | | | | | | 14,632,857 | |
| | | | | | | | | |
| | | | | TOTAL EXCHANGE-TRADED FUNDS (Cost $14,465,511) | | | 14,632,857 | |
| | | | | | | | | |
| | | | | TOTAL INVESTMENTS - 97.4% (Cost $14,465,511) | | $ | 14,632,857 | |
| | | | | OTHER ASSETS IN EXCESS OF LIABILITIES - 2.6% | | | 388,141 | |
| | | | | NET ASSETS - 100.0% | | $ | 15,020,998 | |
ETF - Exchange-Traded Fund
See accompanying notes to financial statements.
| FOUNDATIONS DYNAMIC VALUE ETF |
| SCHEDULE OF INVESTMENTS |
| July 31, 2024 |
| Shares | | | | | Fair Value | |
| | | | | EXCHANGE-TRADED FUNDS — 88.5% | | | | |
| | | | | EQUITY - 88.5% | | | | |
| | 2,556 | | | Avantis U.S. Large Cap Value ETF | | $ | 164,939 | |
| | 1,284 | | | Vanguard Dividend Appreciation ETF | | | 243,690 | |
| | 1,938 | | | Vanguard High Dividend Yield ETF | | | 240,952 | |
| | 1,326 | | | Vanguard Mega Cap Value ETF | | | 164,225 | |
| | 996 | | | Vanguard Mid-Cap Value ETF | | | 158,922 | |
| | 822 | | | Vanguard Small-Cap Value ETF | | | 163,027 | |
| | 2,910 | | | Vanguard Value ETF | | | 488,909 | |
| | | | | | | | 1,624,664 | |
| | | | | | | | | |
| | | | | TOTAL EXCHANGE-TRADED FUNDS (Cost $1,565,307) | | | 1,624,664 | |
| | | | | | | | | |
| | | | | TOTAL INVESTMENTS - 88.5% (Cost $1,565,307) | | $ | 1,624,664 | |
| | | | | OTHER ASSETS IN EXCESS OF LIABILITIES - 11.5% | | | 210,842 | |
| | | | | NET ASSETS - 100.0% | | $ | 1,835,506 | |
ETF - Exchange-Traded Fund
| Foundations ETFs |
| STATEMENTS OF ASSETS AND LIABILITIES |
| July 31, 2024 |
| | | Foundations | | | Foundations | | | Foundations | | | Foundations | |
| | | Dynamic Core ETF | | | Dynamic Growth ETF | | | Dynamic Income ETF | | | Dynamic Value ETF | |
| ASSETS | | | | | | | | | | | | | | | | |
| Investment securities: | | | | | | | | | | | | | | | | |
| At cost | | $ | 8,589,637 | | | $ | 16,924,216 | | | $ | 14,465,511 | | | $ | 1,565,307 | |
| At fair value | | $ | 8,915,327 | | | $ | 16,326,312 | | | $ | 14,632,857 | | | $ | 1,624,664 | |
| Cash | | | 461,717 | | | | 511,124 | | | | 144,038 | | | | 195,857 | |
| Deposits at broker for futures contracts | | | 480,906 | | | | 590,144 | | | | 241,353 | | | | 6,289 | |
| Receivable due from Adviser, net | | | 4,851 | | | | — | | | | 2,360 | | | | 8,696 | |
| Interest and dividends receivable | | | 875 | | | | 728 | | | | 390 | | | | — | |
| TOTAL ASSETS | | | 9,863,676 | | | | 17,428,308 | | | | 15,020,998 | | | | 1,835,506 | |
| | | | | | | | | | | | | | | | | |
| LIABILITIES | | | | | | | | | | | | | | | | |
| Accrued investment advisory fees | | | — | | | | 2,965 | | | | — | | | | — | |
| TOTAL LIABILITIES | | | — | | | | 2,965 | | | | — | | | | — | |
| NET ASSETS | | $ | 9,863,676 | | | $ | 17,425,343 | | | $ | 15,020,998 | | | $ | 1,835,506 | |
| | | | | | | | | | | | | | | | | |
| Net Assets Consist Of: | | | | | | | | | | | | | | | | |
| Paid-in capital | | $ | 9,591,693 | | | $ | 18,333,527 | | | $ | 15,595,743 | | | $ | 1,393,754 | |
| Accumulated earnings (losses) | | | 271,983 | | | | (908,184 | ) | | | (574,745 | ) | | | 441,752 | |
| NET ASSETS | | $ | 9,863,676 | | | $ | 17,425,343 | | | $ | 15,020,998 | | | $ | 1,835,506 | |
| | | | | | | | | | | | | | | | | |
| Net Asset Value Per Share: | | | | | | | | | | | | | | | | |
| Shares: | | | | | | | | | | | | | | | | |
| Net assets | | $ | 9,863,676 | | | $ | 17,425,343 | | | $ | 15,020,998 | | | $ | 1,835,506 | |
| Shares of beneficial interest outstanding (a) | | | 800,000 | | | | 1,400,000 | | | | 1,600,000 | | | | 150,000 | |
| | | | | | | | | | | | | | | | | |
| Net asset value (Net Assets ÷ Shares Outstanding), offering price and redemption price per share | | $ | 12.33 | | | $ | 12.45 | | | $ | 9.39 | | | $ | 12.24 | |
| (a) | Unlimited number of shares of beneficial interest authorized, no par value. |
See accompanying notes to financial statements.
| Foundations ETFs |
| STATEMENTS OF OPERATIONS |
| For the Period Ended July 31, 2024 * |
| | | Foundations | | | Foundations | | | Foundations | | | Foundations | |
| | | Dynamic Core ETF | | | Dynamic Growth ETF | | | Dynamic Income ETF | | | Dynamic Value ETF | |
| INVESTMENT INCOME | | | | | | | | | | | | | | | | |
| Dividend income | | $ | 38,759 | | | $ | 29,342 | | | $ | 211,470 | | | $ | 119,774 | |
| Interest income | | | 72 | | | | — | | | | — | | | | — | |
| TOTAL INVESTMENT INCOME | | | 38,831 | | | | 29,342 | | | | 211,470 | | | | 119,774 | |
| | | | | | | | | | | | | | | | | |
| EXPENSES | | | | | | | | | | | | | | | | |
| Investment advisory fees | | | 28,172 | | | | 51,022 | | | | 44,029 | | | | 39,350 | |
| TOTAL EXPENSES | | | 28,172 | | | | 51,022 | | | | 44,029 | | | | 39,350 | |
| Less: Fees waived and expenses reimbursed by the Adviser | | | (1,772 | ) | | | (3,255 | ) | | | (3,376 | ) | | | (3,032 | ) |
| NET EXPENSES | | | 26,400 | | | | 47,767 | | | | 40,653 | | | | 36,318 | |
| | | | | | | | | | | | | | | | | |
| NET INVESTMENT INCOME (LOSS) | | | 12,431 | | | | (18,425 | ) | | | 170,817 | | | | 83,456 | |
| | | | | | | | | | | | | | | | | |
| REALIZED AND UNREALIZED GAIN (LOSS) ON INVESTMENTS | | | | | | | | | | | | | | | | |
| Net realized loss from investments | | | — | | | | — | | | | (665,541 | ) | | | — | |
| Net realized gain (loss) from redemptions in-kind | | | 464,843 | | | | 2,310,921 | | | | (9,741 | ) | | | 1,027,059 | |
| Net realized gain (loss) from futures contracts | | | (64,338 | ) | | | (290,872 | ) | | | (113,194 | ) | | | 304,939 | |
| Net change in unrealized appreciation (depreciation) on investments | | | 325,690 | | | | (597,904 | ) | | | 167,346 | | | | 59,357 | |
| NET REALIZED AND UNREALIZED GAIN (LOSS) ON INVESTMENTS | | | 726,195 | | | | 1,422,145 | | | | (621,130 | ) | | | 1,391,355 | |
| | | | | | | | | | | | | | | | | |
| NET INCREASE (DECREASE) IN NET ASSETS RESULTING FROM OPERATIONS | | $ | 738,626 | | | $ | 1,403,720 | | | $ | (450,313 | ) | | $ | 1,474,811 | |
| * | The Foundations ETFs commenced operations on October 2, 2023. |
See accompanying notes to financial statements.
| Foundations ETFs |
| STATEMENTS OF CHANGES IN NET ASSETS |
| | | Foundations | | | Foundations | |
| | | Dynamic Core ETF | | | Dynamic Growth ETF | |
| | | | | | | |
| | | For the | | | For the | |
| | | Period Ended | | | Period Ended | |
| | | July 31, 2024 * | | | July 31, 2024 * | |
| FROM OPERATIONS | | | | | | | | |
| Net investment income (loss) | | $ | 12,431 | | | $ | (18,425 | ) |
| Net realized gain from redemptions in-kind | | | 464,843 | | | | 2,310,921 | |
| Net realized loss on futures contracts | | | (64,338 | ) | | | (290,872 | ) |
| Net change in unrealized appreciation (depreciation) on investments | | | 325,690 | | | | (597,904 | ) |
| Net increase (decrease) in net assets resulting from operations | | | 738,626 | | | | 1,403,720 | |
| | | | | | | | | |
| DISTRIBUTIONS TO SHAREHOLDERS | | | | | | | | |
| Total Distributions Paid | | | (1,800 | ) | | | (1,200 | ) |
| Net decrease in net assets from distributions to shareholders | | | (1,800 | ) | | | (1,200 | ) |
| | | | | | | | | |
| FROM SHARES OF BENEFICIAL INTEREST | | | | | | | | |
| Proceeds from shares sold | | | 47,719,892 | | | | 98,592,054 | |
| Payments for shares redeemed | | | (39,093,042 | ) | | | (83,069,231 | ) |
| Net increase in net assets from share transactions of beneficial interest | | | 8,626,850 | | | | 15,522,823 | |
| | | | | | | | | |
| TOTAL INCREASE IN NET ASSETS | | | 9,363,676 | | | | 16,925,343 | |
| | | | | | | | | |
| NET ASSETS | | | | | | | | |
| Beginning of period (a) | | | 500,000 | | | | 500,000 | |
| End of period | | $ | 9,863,676 | | | $ | 17,425,343 | |
| | | | | | | | | |
| SHARE ACTIVITY | | | | | | | | |
| Shares Sold | | | 4,150,000 | | | | 8,225,000 | |
| Shares Redeemed | | | (3,350,000 | ) | | | (6,825,000 | ) |
| Net increase in shares of beneficial interest outstanding | | | 800,000 | | | | 1,400,000 | |
| * | The Foundations Dynamic Core ETF and the Foundations Dynamic Growth ETF commenced operations on October 2, 2023. |
| (a) | Beginning capital of $500,000 for the Foundations Dynamic Core ETF and $500,000 for the Foundations Dynamic Growth ETF, was contributed by fund management of Regents Park Funds, LLC, investment adviser to the Funds, in exchange for 50,000 shares of the Foundations Dynamic Core ETF and 50,000 shares of the Foundations Dynamic Growth ETF in connection with the seeding of each ETF, both a series of the Trust. |
See accompanying notes to financial statements.
| Foundations ETFs |
| STATEMENTS OF CHANGES IN NET ASSETS (Continued) |
| | | Foundations | | | Foundations | |
| | | Dynamic Income ETF | | | Dynamic Value ETF | |
| | | | | | | |
| | | For the | | | For the | |
| | | Period Ended | | | Period Ended | |
| | | July 31, 2024 * | | | July 31, 2024 * | |
| FROM OPERATIONS | | | | | | | | |
| Net investment income | | $ | 170,817 | | | $ | 83,456 | |
| Net realized loss on investments | | | (665,541 | ) | | | — | |
| Net realized gain (loss) from redemptions in-kind | | | (9,741 | ) | | | 1,027,059 | |
| Net realized gain (loss) on futures contracts | | | (113,194 | ) | | | 304,939 | |
| Net change in unrealized appreciation on investments | | | 167,346 | | | | 59,357 | |
| Net increase (decrease) in net assets resulting from operations | | | (450,313 | ) | | | 1,474,811 | |
| | | | | | | | | |
| DISTRIBUTIONS TO SHAREHOLDERS | | | | | | | | |
| Total Distributions Paid | | | (142,590 | ) | | | (6,000 | ) |
| Net decrease in net assets from distributions to shareholders | | | (142,590 | ) | | | (6,000 | ) |
| | | | | | | | | |
| FROM SHARES OF BENEFICIAL INTEREST | | | | | | | | |
| Proceeds from shares sold | | | 32,762,918 | | | | 122,265,683 | |
| Cost of shares redeemed | | | (17,649,017 | ) | | | (122,398,988 | ) |
| Net increase (decrease) in net assets from share transactions of beneficial interest | | | 15,113,901 | | | | (133,305 | ) |
| | | | | | | | | |
| TOTAL INCREASE IN NET ASSETS | | | 14,520,998 | | | | 1,335,506 | |
| | | | | | | | | |
| NET ASSETS | | | | | | | | |
| Beginning of period (a) | | | 500,000 | | | | 500,000 | |
| End of period | | $ | 15,020,998 | | | $ | 1,835,506 | |
| | | | | | | | | |
| SHARE ACTIVITY | | | | | | | | |
| Shares Sold | | | 3,450,000 | | | | 10,650,000 | |
| Shares Redeemed | | | (1,850,000 | ) | | | (10,500,000 | ) |
| Net increase in shares of beneficial interest outstanding | | | 1,600,000 | | | | 150,000 | |
| * | The Foundations Dynamic Income ETF and the Foundations Dynamic Value ETF commenced operations on October 2, 2023. |
| (a) | Beginning capital of $500,000 for the Foundations Dynamic Income ETF and $500,000 for the Foundations Dynamic Value ETF, was contributed by fund management of Regents Park Funds, LLC, investment adviser to the Funds, in exchange for 50,000 shares of the Foundations Dynamic Income ETF and 50,000 shares of the Foundations Dynamic Value ETF in connection with the seeding of each ETF, both a series of the Trust. |
See accompanying notes to financial statements.
| Foundations Dynamic Core ETF |
| Financial Highlights |
Per Share Data and Ratios for a Share of Beneficial Interest Outstanding Throughout the Period Presented
| | | For the | |
| | | Period Ended | |
| | | July 31, 2024 * | |
| Net asset value, beginning of period | | $ | 10.00 | |
| Activity from investment operations: | | | | |
| Net investment income (a) | | | 0.03 | |
| Net realized and unrealized gain on investments | | | 2.32 | |
| Total income from investment operations | | | 2.35 | |
| Less distributions from: | | | | |
| Net investment income | | | (0.02 | ) |
| Total distributions | | | (0.02 | ) |
| Net asset value, end of period | | $ | 12.33 | |
| Market price, end of period | | $ | 12.32 | |
| Total return (b) | | | 23.56 | % (e)(f) |
| Market price total return | | | 23.46 | % (e) |
| Net assets, end of period (in 000’s) | | $ | 9,864 | |
| Ratio of gross expenses to average net assets | | | 0.79 | % (g) |
| Ratio of net expenses to average net assets | | | 0.74 | % (g) |
| Ratio of net investment income to average net assets (c) | | | 0.35 | % (g) |
| Portfolio turnover rate (d) | | | 0 | % (e) |
| | | | | |
| * | The Foundations Dynamic Core ETF commenced operations on October 2, 2023. |
| (a) | Per share amounts calculated using the average shares method, which more appropriately represents the per share data for the period. |
| (b) | Total return is calculated assuming a purchase of shares at net asset value on the first day and a sale at net asset value on the last day of the period. Distributions are assumed, for the purpose of this calculation, to be reinvested at the ex-dividend date net asset value per share on their respective payment dates. Total return would have been lower absent fee waiver/expense reimbursements. |
| (c) | Recognition of net investment income by the Fund is affected by the timing of the declaration of dividends by the underlying investment companies in which the Fund invests. |
| (d) | Portfolio turnover rate excludes securities received or delivered from in-kind transactions. |
| (f) | Represents total return based on net asset values per share from commencement of investment operations on October 2, 2023 through July 31, 2024. |
See accompanying notes to financial statements.
| Foundations Dynamic Growth ETF |
| Financial Highlights |
Per Share Data and Ratios for a Share of Beneficial Interest Outstanding Throughout the Period Presented
| | | For the | |
| | | Period Ended | |
| | | July 31, 2024 * | |
| Net asset value, beginning of period | | $ | 10.00 | |
| Activity from investment operations: | | | | |
| Net investment loss (a) | | | (0.03 | ) |
| Net realized and unrealized gain on investments | | | 2.49 | |
| Total income from investment operations | | | 2.46 | |
| Less distributions from: | | | | |
| Net investment income | | | (0.01 | ) |
| Total distributions | | | (0.01 | ) |
| Net asset value, end of period | | $ | 12.45 | |
| Market price, end of period | | $ | 12.46 | |
| Total return (b) | | | 24.63 | % (e)(f) |
| Market price total return | | | 24.73 | % (e) |
| Net assets, end of period (in 000’s) | | $ | 17,425 | |
| Ratio of gross expenses to average net assets | | | 0.79 | % (g) |
| Ratio of net expenses to average net assets | | | 0.74 | % (g) |
| Ratio of net investment loss to average net assets (c) | | | (0.28 | )% (g) |
| Portfolio turnover rate (d) | | | 0 | % (e) |
| | | | | |
| * | The Foundations Dynamic Growth ETF commenced operations on October 2, 2023. |
| (a) | Per share amounts calculated using the average shares method, which more appropriately represents the per share data for the period. |
| (b) | Total return is calculated assuming a purchase of shares at net asset value on the first day and a sale at net asset value on the last day of the period. Distributions are assumed, for the purpose of this calculation, to be reinvested at the ex-dividend date net asset value per share on their respective payment dates. Total return would have been lower absent fee waiver/expense reimbursements. |
| (c) | Recognition of net investment loss by the Fund is affected by the timing of the declaration of dividends by the underlying investment companies in which the Fund invests. |
| (d) | Portfolio turnover rate excludes securities received or delivered from in-kind transactions. |
| (f) | Represents total return based on net asset values per share from commencement of investment operations on October 2, 2023 through July 31, 2024. |
See accompanying notes to financial statements.
| Foundations Dynamic Income ETF |
| Financial Highlights |
| |
| Per Share Data and Ratios for a Share of Beneficial Interest Outstanding Throughout the Period Presented |
| | | For the | |
| | | Period Ended | |
| | | July 31, 2024 * | |
| Net asset value, beginning of period | | $ | 10.00 | |
| Activity from investment operations: | | | | |
| Net investment income (a) | | | 0.24 | |
| Net realized and unrealized gain (loss) on investments | | | (0.62 | ) |
| Total income from investment operations | | | (0.38 | ) |
| Less distributions from: | | | | |
| Net investment income | | | (0.23 | ) |
| Total distributions | | | (0.23 | ) |
| Net asset value, end of period | | $ | 9.39 | |
| Market price, end of period | | $ | 9.39 | |
| Total return (b) | | | (3.88 | )% (e)(f) |
| Market price total return | | | (3.88 | )% (e) |
| Net assets, end of period (in 000’s) | | $ | 15,021 | |
| Ratio of gross expenses to average net assets | | | 0.79 | % (g) |
| Ratio of net expenses to average net assets | | | 0.73 | % (g) |
| Ratio of net investment income to average net assets (c) | | | 3.01 | % (g) |
| Portfolio turnover rate (d) | | | 1210 | % (e) |
| | | | | |
| * | The Foundations Dynamic Income ETF commenced operations on October 2, 2023. |
| (a) | Per share amounts calculated using the average shares method, which more appropriately represents the per share data for the period. |
| (b) | Total return is calculated assuming a purchase of shares at net asset value on the first day and a sale at net asset value on the last day of the period. Distributions are assumed, for the purpose of this calculation, to be reinvested at the ex-dividend date net asset value per share on their respective payment dates. Total return would have been lower absent fee waiver/expense reimbursements. |
| (c) | Recognition of net investment income by the Fund is affected by the timing of the declaration of dividends by the underlying investment companies in which the Fund invests. |
| (d) | Portfolio turnover rate excludes securities received or delivered from in-kind transactions. |
| (f) | Represents total return based on net asset values per share from commencement of investment operations on October 2, 2023 through July 31, 2024. |
See accompanying notes to financial statements.
| Foundations Dynamic Value ETF |
| Financial Highlights |
| |
| Per Share Data and Ratios for a Share of Beneficial Interest Outstanding Throughout the Period Presented |
| | | For the | |
| | | Period Ended | |
| | | July 31, 2024 * | |
| Net asset value, beginning of period | | $ | 10.00 | |
| Activity from investment operations: | | | | |
| Net investment income (a) | | | 0.16 | |
| Net realized and unrealized gain on investments | | | 2.14 | |
| Total income from investment operations | | | 2.30 | |
| Less distributions from: | | | | |
| Net investment income | | | (0.06 | ) |
| Total distributions | | | (0.06 | ) |
| Net asset value, end of period | | $ | 12.24 | (h) |
| Market price, end of period | | $ | 12.23 | |
| Total return (b) | | | 23.07 | % (e)(f)(h) |
| Market price total return | | | 22.97 | % (e) |
| Net assets, end of period (in 000’s) | | $ | 1,836 | |
| Ratio of gross expenses to average net assets | | | 0.79 | % (g) |
| Ratio of net expenses to average net assets | | | 0.73 | % (g) |
| Ratio of net investment income to average net assets (c) | | | 1.65 | % (g) |
| Portfolio turnover rate (d) | | | 0 | % (e) |
| | | | | |
| * | The Foundations Dynamic Income ETF commenced operations on October 2, 2023. |
| (a) | Per share amounts calculated using the average shares method, which more appropriately represents the per share data for the period. |
| (b) | Total return is calculated assuming a purchase of shares at net asset value on the first day and a sale at net asset value on the last day of the period. Distributions are assumed, for the purpose of this calculation, to be reinvested at the ex-dividend date net asset value per share on their respective payment dates. Total return would have been lower absent fee waiver/expense reimbursements. |
| (c) | Recognition of net investment income by the Fund is affected by the timing of the declaration of dividends by the underlying investment companies in which the Fund invests. |
| (d) | Portfolio turnover rate excludes securities received or delivered from in-kind transactions. |
| (f) | Represents total return based on net asset values per share from commencement of investment operations on October 2, 2023 through July 31, 2024. |
| (h) | Includes adjustments in accordance with accounting principles generally accepted in the United States and, consequently, the net asset value for financial reporting purposes and the returns based upon those net asset values may differ from the net asset values and returns for shareholder transactions. |
See accompanying notes to financial statements.
| Foundations ETFs |
| NOTES TO FINANCIAL STATEMENTS |
| July 31, 2024 |
The Foundations Dynamic Core ETF, Foundations Dynamic Growth ETF, Foundations Dynamic Income ETF and Foundations Dynamic Value ETF (each a “Fund” and together the “Funds”) each is a series of shares of beneficial interest of the Two Roads Shared Trust (the “Trust”), a statutory trust organized under the laws of the State of Delaware on June 8, 2012, and is registered under the Investment Company Act of 1940, as amended (the “1940 Act”), as a diversified, open-end management investment company. The Funds commenced operations on October 2, 2023. Each Fund is a “fund of funds”, in that each Fund will generally invest in other investment companies. The investment objective for each of the Foundations Dynamic Core ETF, Foundations Dynamic Growth ETF and Foundations Dynamic Value ETF is to seek capital appreciation. The Foundations Dynamic Income ETF’s investment objective is to seek current income and long-term capital appreciation, consistent with prudent investment management.
| (2) | SIGNIFICANT ACCOUNTING POLICIES |
The following is a summary of significant accounting policies followed by the Funds in the preparation of their financial statements. These policies are in conformity with accounting principles generally accepted in the United States of America (’‘GAAP”) and require management to make estimates and assumptions that affect the reported amounts of assets and liabilities and disclosure of contingent assets and liabilities at the date of the financial statements and the reported amounts of increases and decreases in net assets from operations during the reporting period. Actual results could differ from those estimates. Each Fund is an investment company and accordingly follows the investment company accounting and reporting guidance of the Financial Accounting Standards Board (“FASB”) Accounting Standards Codification Topic 946 “Financial Services – Investment Companies”.
Security Valuation – Securities listed on an exchange are valued at the last quoted sale price at the close of the regular trading session of the exchange on the business day the value is being determined, or in the case of securities listed on NASDAQ at the NASDAQ Official Closing Price. In the absence of a sale such securities shall be valued at the mean between the current bid and ask prices on the day of valuation. Short-term debt obligations having 60 days or less remaining until maturity, at time of purchase may be valued at amortized cost (which approximates fair value) . Investments in open-end investment companies are valued at net asset value (“NAV”). Futures contracts listed for trading on a securities exchange or board of trade (whether domestic or foreign) for which market quotations are readily available shall be valued at the final settled price for the respective futures or futures options or, if no settled price is available, at the last sale price as of the close of business prior to the valuation time.
Each Fund may hold securities, such as private investments, interests in commodity pools, other non-traded securities or temporarily illiquid securities, for which market quotations are not readily available or are determined to be unreliable. These securities are valued using the “fair value” procedures approved by the Board of Trustees of the Trust (the “Board”) . The Board has appointed the Adviser as its valuation designee (the “Valuation Designee”) for all fair value determinations and responsibilities, other than overseeing pricing service providers used by the Trust. This designation is subject to Board oversight and certain reporting and other requirements designed to facilitate the Board’s ability effectively to oversee the designee’s fair value determinations. The Board may also enlist third party consultants such a valuation specialist at a public accounting firm, valuation consultant or financial officer of a security issuer on an as-needed basis to assist the Valuation Designee in determining a security-specific fair value. The Board is responsible for reviewing and approving fair value methodologies utilized by the Valuation Designee, approval of which shall be based upon whether the Valuation Designee followed the valuation procedures approved by the Board.
| Foundations ETFs |
| NOTES TO FINANCIAL STATEMENTS (Continued) |
| July 31, 2024 |
Exchange Traded Funds (“ETFs”) – Each Fund may invest in ETFs, which are a type of fund bought and sold on a securities exchange. An ETF trades like common stock and represents a fixed portfolio of securities. The risks of owning an ETF generally reflect the risks of owning the underlying securities in which it invests, although the lack of liquidity on an ETF could result in it being more volatile. Additionally, ETFs have fees and expenses that reduce their value.
Valuation of Underlying Funds – Each Fund may invest in portfolios of open -end investment companies (the “Underlying Funds”). Investment companies are valued at their respective net asset values as reported by such investment companies. Open-end investment companies value securities in their portfolios for which market quotations are readily available at their market values (generally the last reported sale price) and all other securities and assets at their fair value to the methods established by the board of directors of the open -end funds. The shares of many ETFs, after their initial public offering, frequently trade at a price per share, which is different than the net asset value per share. The difference represents a market premium or market discount of such shares. There can be no assurances that the market discount or market premium on shares of any exchange traded fund purchased by a Fund will not change.
Futures Contracts – Each Fund may purchase or sell futures contracts to gain exposure to, or hedge against, changes in the value of equities, interest rates, foreign currencies, or commodities. Initial margin deposits required upon entering into futures contracts are satisfied by the segregation of specific securities or cash as collateral for the account of the broker (the Funds’ agent in acquiring the futures position). During the period the futures contracts are open, changes in the value of the contracts are recognized as unrealized gains or losses by “marking to market” on a daily basis to reflect the market value of the contracts at the end of each day’s trading. Variation margin payments are received or made depending upon whether unrealized gains or losses are incurred. When the contracts are closed, a Fund recognizes a realized gain or loss equal to the difference between the proceeds from, or cost of, the closing transaction and a Fund’s basis in the contract. If a Fund was unable to liquidate a futures contract and/or enter into an offsetting closing transaction, a Fund would continue to be subject to market risk with respect to the value of the contracts and continue to be required to maintain the margin deposits on the futures contracts. Risks may exceed amounts recognized in the statements of assets and liabilities. With futures, there is minimal counterparty credit risk to a Fund since futures are exchange traded and the exchange’s clearinghouse, as counterparty to all exchange traded futures, guarantees the futures against default, however there could be adverse impacts if the clearinghouse is unable to fulfill such guarantee due to circumstances such as bankruptcy.
Fair Valuation Process – The applicable investments are valued by the Valuation Designee pursuant to valuation procedures approved by the Board. For example, fair value determinations are required for the following securities: (i) securities for which market quotations are insufficient or not readily available on a particular business day (including securities for which there is a short and temporary lapse in the provision of a price by the regular pricing source); (ii) securities for which, in the judgment of the Valuation Designee, the prices or values available do not represent the fair value of the instrument; factors which may cause the Valuation Designee to make such a judgment include, but are not limited to, the following: only a bid price or an asked price is available; the spread between bid and asked prices is substantial; the frequency of sales; the thinness of the market; the size of reported trades; and actions of the securities markets, such as the suspension or limitation of trading; (iii) securities determined to be illiquid; and (iv) securities with respect to which an event that affects the value thereof has occurred (a “significant event”) since the closing prices were established on the principal exchange on which they are traded, but prior to the Funds’ calculation of its net asset value. Specifically, interests in commodity pools or managed futures pools are valued on a daily basis by reference to the closing market prices of each futures contract or other asset held by a pool, as adjusted for pool expenses. Restricted or illiquid securities, such as private investments or non -traded securities are valued based upon the current bid for the security from two or more independent dealers or other parties reasonably familiar with the facts and circumstances of the security (who should take into consideration all relevant factors as may be appropriate under the circumstances). If a current bid from such independent dealers or other independent parties is unavailable, the Valuation Designee shall determine the fair value of such security using the following factors: (i) the type of security; (ii) the cost at
| Foundations ETFs |
| NOTES TO FINANCIAL STATEMENTS (Continued) |
| July 31, 2024 |
date of purchase; (iii) the size and nature of the Funds’ holdings; (iv) the discount from market value of unrestricted securities of the same class at the time of purchase and subsequent thereto; (v) information as to any transactions or offers with respect to the security; (vi) the nature and duration of restrictions on disposition of the security and the existence of any registration rights; (vii) how the yield of the security compares to similar securities of companies of similar or equal creditworthiness; (viii) the level of recent trades of similar or comparable securities; (ix) the liquidity characteristics of the security; (x) current market conditions; and (xi) the market value of any securities into which the security is convertible or exchangeable.
Each Fund utilizes various methods to measure the fair value of all of its investments on a recurring basis. GAAP establishes a hierarchy that prioritizes inputs to valuation methods. The three levels of input are:
Level 1 – Unadjusted quoted prices in active markets for identical assets and liabilities that the Fund has the ability to access.
Level 2 – Observable inputs other than quoted prices included in Level 1 that are observable for the asset or liability, either directly or indirectly. These inputs may include quoted prices for the identical instrument on an inactive market, prices for similar instruments, interest rates, prepayment speeds, credit risk, yield curves, default rates and similar data.
Level 3 – Unobservable inputs for the asset or liability, to the extent relevant observable inputs are not available, representing the Funds’ own assumptions about the assumptions a market participant would use in valuing the asset or liability, and would be based on the best information available.
The availability of observable inputs can vary from security to security and is affected by a wide variety of factors, including, for example, the type of security, whether the security is new and not yet established in the marketplace, the liquidity of markets, and other characteristics particular to the security. To the extent that valuation is based on models or inputs that are less observable or unobservable in the market, the determination of fair value requires more judgment. Accordingly, the degree of judgment exercised in determining fair value is greatest for instruments categorized in Level 3.
The inputs used to measure fair value may fall into different levels of the fair value hierarchy. In such cases, for disclosure purposes, the level in the fair value hierarchy within which the fair value measurement falls in its entirety, is determined based on the lowest level input that is significant to the fair value measurement in its entirety.
The inputs or methodology used for valuing securities are not necessarily an indication of the risk associated with investing in those securities. The following tables summarize the inputs used as of July 31, 2024, for the Funds’ assets and liabilities measured at fair value:
| Foundations Dynamic Core ETF | |
| | | | | | | | | | | | | |
| Assets* | | Level 1 | | | Level 2 | | | Level 3 | | | Total | |
| Exchange-Traded Funds | | $ | 8,915,327 | | | $ | — | | | $ | — | | | $ | 8,915,327 | |
| Total | | $ | 8,915,327 | | | $ | — | | | $ | — | | | $ | 8,915,327 | |
| | | | | | | | | | | | | | | | | |
| Foundations Dynamic Growth ETF | |
| | | | | | | | | | | | | |
| Assets* | | Level 1 | | | Level 2 | | | Level 3 | | | Total | |
| Exchange-Traded Funds | | $ | 16,326,312 | | | $ | — | | | $ | — | | | $ | 16,326,312 | |
| Total | | $ | 16,326,312 | | | $ | — | | | $ | — | | | $ | 16,326,312 | |
| Foundations ETFs |
| NOTES TO FINANCIAL STATEMENTS (Continued) |
| July 31, 2024 |
| Foundations Dynamic Income ETF | |
| | |
| Assets* | | Level 1 | | | Level 2 | | | Level 3 | | | Total | |
| Exchange-Traded Funds | | $ | 14,632,857 | | | $ | — | | | $ | — | | | $ | 14,632,857 | |
| Total | | $ | 14,632,857 | | | $ | — | | | $ | — | | | $ | 14,632,857 | |
| | | | | | | | | | | | | | | | | |
| Foundations Dynamic Value ETF | |
| | | | | | | | | | | | | |
| Assets* | | Level 1 | | | Level 2 | | | Level 3 | | | Total | |
| Exchange-Traded Funds | | $ | 1,624,664 | | | $ | — | | | $ | — | | | $ | 1,624,664 | |
| Total | | $ | 1,624,664 | | | $ | — | | | $ | — | | | $ | 1,624,664 | |
The Funds did not hold any Level 2 or Level 3 securities during the period.
| * | Refer to each Fund’s Schedule of Investments for portfolio composition. |
Impact of Derivatives on the Statements of Operations
The derivative instruments outstanding as of July 31, 2024 for the amounts of realized gains and losses on derivative instruments during the period as disclosed in the Statements of Operations serve as indicators of the volume of derivative activity for each Fund.
The following is a summary of the location of derivative investments on the Funds’ Statements of Operations as of
July 31, 2024:
| Foundations Dynamic Core ETF | |
| | |
| Derivative Investment Type | Location of Gain (Loss) on Derivatives |
| Equity Futures Contracts | Net realized gain (loss) from futures contracts |
| | |
| Foundations Dynamic Growth ETF | |
| | |
| Derivative Investment Type | Location of Gain (Loss) on Derivatives |
| Equity Futures Contracts | Net realized gain (loss) from futures contracts |
| | |
| Foundations Dynamic Income ETF | |
| | |
| Derivative Investment Type | Location of Gain (Loss) on Derivatives |
| Equity Futures Contracts | Net realized gain (loss) from futures contracts |
| | |
| Interest Futures Contracts | Net realized gain (loss) from futures contracts |
| | |
| Foundations Dynamic Value ETF | |
| | |
| Derivative Investment Type | Location of Gain (Loss) on Derivatives |
| Equity Futures Contracts | Net realized gain (loss) from futures contracts |
| Foundations ETFs |
| NOTES TO FINANCIAL STATEMENTS (Continued) |
| July 31, 2024 |
The following is a summary of the Funds’ realized gain (loss) on derivative investments recognized in the
Statements of Operations categorized by primary risk exposure for the period ended July 31, 2024:
| Foundations Dynamic Core ETF |
| |
| Realized loss on derivatives recognized in the Statements of Operations |
| | | | | | | | | Total for the | |
| Derivative Investment Type | | Equity Risk | | | Interest Risk | | | Period Ended July 31, 2024 | |
| Futures contracts | | $ | (64,338 | ) | | $ | — | | | $ | (64,338 | ) |
| | | | | | | | | | | | | |
| Foundations Dynamic Growth ETF |
| |
| Realized loss on derivatives recognized in the Statements of Operations |
| | | | | | | | | Total for the | |
| Derivative Investment Type | | Equity Risk | | | Interest Risk | | | Period Ended July 31, 2024 | |
| Futures contracts | | $ | (290,872 | ) | | $ | — | | | $ | (290,872 | ) |
| | | | | | | | | | | | | |
| Foundations Dynamic Income ETF |
| |
| Realized loss on derivatives recognized in the Statements of Operations |
| | | | | | | | | Total for the | |
| Derivative Investment Type | | Equity Risk | | | Interest Risk | | | Period Ended July 31, 2024 | |
| Futures contracts | | $ | (394 | ) | | $ | (112,800 | ) | | $ | (113,194 | ) |
| | | | | | | | | | | | | |
| Foundations Dynamic Value ETF |
| |
| Realized gain on derivatives recognized in the Statements of Operations |
| | | | | | | | | Total for the | |
| Derivative Investment Type | | Equity Risk | | | Interest Risk | | | Period Ended July 31, 2024 | |
| Futures contracts | | $ | 304,939 | | | $ | — | | | $ | 304,939 | |
Security Transactions and Related Income
Security transactions are accounted for on trade date basis. Interest income is recognized on an accrual basis. Discounts are accreted and premiums are amortized on securities purchased over the lives of the respective securities. Dividend income is recorded on the ex -dividend date. Realized gains or losses from sales of securities are determined by comparing the identified cost of the security lot sold with the net sales proceeds.
Dividends and Distributions to Shareholders
Ordinarily, dividends from net investment income, if any, are declared and paid quarterly by the Foundations Dynamic Income ETF and annually by each other Fund. Each Fund distributes its net realized capital gains, if any, to shareholders annually. Dividends from net investment income and distributions from net realized gains are recorded on ex-dividend date and determined in accordance with federal income tax regulations, which may differ from GAAP. These “book/tax” differences are considered either temporary (i.e., deferred losses, capital loss carry forwards) or permanent in nature. To the extent these differences are permanent in nature, such amounts are reclassified within the composition of net assets based on their federal tax-basis treatment; temporary differences do not require reclassification.
| Foundations ETFs |
| NOTES TO FINANCIAL STATEMENTS (Continued) |
| July 31, 2024 |
Federal Income Taxes
Each Fund intends to continue to comply with the requirements of the Internal Revenue Code applicable to regulated investment companies and to distribute all of its taxable income to its shareholders. Therefore, no provision for federal income tax is required. The Funds recognize the tax benefits of uncertain tax positions only where the position is “more likely than not” to be sustained assuming examination by tax authorities. Management has analyzed the Funds’ tax positions and has concluded that no liability for unrecognized tax benefits should be recorded related to uncertain tax positions taken on returns expected to be taken in the Funds’ July 31, 2024 year-end tax returns. Each Fund identified its major tax jurisdictions as U.S. Federal, Ohio and foreign jurisdictions where the Funds make significant investments. The Funds are not aware of any tax positions for which it is reasonably possible that the total amounts of unrecognized tax benefits will change materially in the next twelve months.
Expenses
Expenses of the Trust that are directly identifiable to a specific fund are charged to that fund. Expenses, which are not readily identifiable to a specific fund, are allocated in such a manner as deemed equitable (as determined by the Board), taking into consideration the nature and type of expense and the relative sizes of the funds in the Trust.
Indemnification
The Trust indemnifies its officers and trustees for certain liabilities that may arise from the performance of their duties to each Fund and Trust. Additionally, in the normal course of business, the Funds enter into contracts that contain a variety of representations and warranties which provide general indemnities. The Funds’ maximum exposure under these arrangements is unknown, as this would involve future claims that may be made against the Funds that have not yet occurred. However, the Funds expect the risk of loss due to these warranties and indemnities to be remote.
| (3) | INVESTMENT TRANSACTIONS |
For the period ended July 31, 2024 cost of purchases and proceeds from sales of portfolio securities (excluding in-kind transactions and short-term investments) and cost of purchases and proceeds from sales of portfolio securities for in-kind transactions for the Funds were as follows:
| | | Purchases | | | Proceeds | | | Purchases | | | Proceeds | |
| Fund | | (Excluding in-kind and short-term investments) | | | (In-kind transactions) | |
| Foundations Dynamic Core ETF | | $ | — | | | $ | — | | | $ | 43,224,348 | | | $ | 35,099,553 | |
| Foundations Dynamic Growth ETF | | | — | | | | — | | | | 91,424,803 | | | | 76,811,508 | |
| Foundations Dynamic Income ETF | | | 91,593,730 | | | | 90,883,976 | | | | 31,608,017 | | | | 17,176,978 | |
| Foundations Dynamic Value ETF | | | — | | | | — | | | | 109,194,541 | | | | 108,656,292 | |
| (4) | INVESTMENT ADVISORY AGREEMENT AND TRANSACTIONS WITH RELATED PARTIES |
Regents Park Funds, LLC serves as the Funds’ investment adviser (the “Adviser”). Pursuant to an Investment Advisory Agreement with the Funds, the Adviser, subject to the supervision of the Board, is responsible for managing the day to day operations of the Funds, including: selecting the overall investment strategies; monitoring and evaluating the Sub-Adviser (as defined below) performance; and providing related administrative services and facilities.
| Foundations ETFs |
| NOTES TO FINANCIAL STATEMENTS (Continued) |
| July 31, 2024 |
Anfield Group, LLC (“Anfield Group”), which is wholly owned by the David Young and Sandra G. Glain Family Trust, wholly owns the Adviser. As compensation for its services, each Fund pays to the Adviser a unitary management fee (computed daily and paid monthly) at an annual rate of 0.79% of its average daily net assets. The Adviser’s unitary management fee is designed to pay each Fund’s expenses and to compensate the Adviser for providing services for each Fund. Out of the unitary management fee, the Adviser pays substantially all expenses of the Funds, inclusive of fees and expenses of other investment companies in which the Funds may invest. The Funds, not the Adviser, pay the following expenses: all brokerage fees and commissions, taxes, borrowing costs (such as dividend expense on securities sold short and interest), and such extraordinary or nonrecurring expenses as may arise, including litigation to which the Funds may be a party and indemnification of the Board of Trustees and officers with respect thereto. For the period ended July 31, 2024, the Foundations Dynamic Core ETF, Foundations Dynamic Growth ETF, Foundations Dynamic Income ETF and Foundations Dynamic Value ETF incurred Advisory Fees of $28,172, $51,022, $44,029 and $39,350, respectively.
The Adviser has engaged Foundations Investment Advisors, LLC (“Foundations” or the “Sub-Adviser”) to serve as Sub -Adviser to the Funds. The Sub- Adviser and the Adviser may be deemed to be affiliates because certain officers and employees of the Adviser also serve as officers and/or employees of the Sub-Adviser. The Sub-Adviser, with respect to the portion of the Funds’ assets allocated to the Sub -Adviser, is responsible for selecting investments and assuring that investments are made in accordance with the Funds’ investment objective, policies and restrictions. The Adviser compensates the Sub-Adviser for its services from the management fees received from the Funds, at the annual rate of 0.72% of the Fund’s average net assets.
Acquired Fund Fees and Expenses are the indirect costs of investing in other investment companies. The Adviser has agreed to be responsible under its unitary fee for the amount of any Acquired Fund Fees and Expenses incurred by each Fund. These costs are borne by the Adviser as deductions from its unitary fee. For each fiscal period, these deductions are initially based on estimated Acquired Fund Fees and Expenses for the Funds (for the Funds’ initial fiscal period, the estimated Acquired Fund Fees and Expenses are provided by the Adviser; for subsequent fiscal years, the estimated Acquired Fund Fees and Expenses are the Acquired Fund Fees and Expenses incurred by the Funds in the prior fiscal period) and are subject to adjustment throughout the fiscal period to reflect and align with the most current Acquired Fund Fees and Expenses calculation for the Funds, calculated in accordance with the requirements of Item 3 of Form N-1A. If these costs were not offset by the Adviser, the estimated Acquired Fund Fees and Expenses to the Foundations Dynamic Core ETF, Foundations Dynamic Growth ETF, Foundations Dynamic Income ETF and Foundations Dynamic Value ETF for the current year are estimated to be 0.05%, 0.05%, 0.06% and 0.06%, respectively.
During the period ended July 31, 2024, the Adviser bore (as deductions from its unitary fee) $1,602, $3,665, $3,795 and $3,605 in Acquired Fund Fees and Expenses for the Foundations Dynamic Core ETF, Foundations Dynamic Growth ETF, Foundations Dynamic Income ETF and Foundations Dynamic Value ETF, respectively.
The Trust, with respect to each Fund, has adopted a distribution and service plan (“Plan”) pursuant to Rule 12b-1 under the 1940 Act. Under the Plan, the Funds are authorized to pay distribution fees to Northern Lights Distributors, LLC (the “Distributor” or “NLD”) and other firms that provide distribution and shareholder services (“Service Providers”). If a Service Provider provides these services, the Funds may pay fees at an annual rate not to exceed 0.25% of average daily net assets, pursuant to Rule 12b-1 under the 1940 Act.
No distribution or service fees are currently paid by the Funds and there are no current plans to impose these fees.
In the event Rule 12b-1 fees were charged, over time they would increase the cost of an investment in the Funds.
| Foundations ETFs |
| NOTES TO FINANCIAL STATEMENTS (Continued) |
| July 31, 2024 |
In addition, certain affiliates of the Distributor provide services to the Funds as follows:
Ultimus Fund Solutions, LLC (“UFS”), an affiliate of the Distributor, provides administration and fund accounting services to the Trust. Pursuant to separate servicing agreements with UFS, the Funds pay UFS customary fees for providing administration and fund accounting services to the Funds. Certain officers of the Trust are also officers of UFS, and are not paid any fees directly by the Funds for servicing in such capacities.
BluGiant, LLC (“BluGiant”), BluGiant, an affiliate of UFS and the Distributor, provides EDGAR conversion and filing services as well as print management services for the Funds on an ad-hoc basis. For the provision of these services, BluGiant receives customary fees from the Funds.
Northern Lights Compliance Services, LLC (“NLCS”) , an affiliate of UFS and the Distributor, provides a Chief Compliance Officer to the Trust, as well as related compliance services, pursuant to a consulting agreement between NLCS and the Trust. Under the terms of such agreement, NLCS receives customary fees from the Funds.
| (5) | DISTRIBUTIONS TO SHAREHOLDERS AND TAX COMPONENTS OF CAPITAL |
The Statements of Assets and Liabilities represents cost for financial reporting purposes. The following table represents aggregate cost for federal tax purposes for the Funds as of July 31, 2024 and differs from market value by net unrealized appreciation/depreciation which consisted of:
| | | | | | | | | | | | Total Unrealized | |
| | | | | | Gross Unrealized | | | Gross Unrealized | | | Appreciation | |
| Fund | | Aggregate Cost | | | Appreciation | | | Depreciation | | | (Depreciation) | |
| Foundations Dynamic Core ETF | | $ | 8,589,637 | | | $ | 334,178 | | | $ | (8,489 | ) | | $ | 325,689 | |
| Foundations Dynamic Growth ETF | | | 16,924,216 | | | | 89,527 | | | | (687,431 | ) | | | (597,904 | ) |
| Foundations Dynamic Income ETF | | | 14,698,179 | | | | 167,346 | | | | (232,668 | ) | | | (65,322 | ) |
| Foundations Dynamic Value ETF | | | 1,565,307 | | | | 59,357 | | | | — | | | | 59,357 | |
The tax character of fund distributions paid for the period ended July 31, 2024, was as follows:
| For fiscal year ended | | Ordinary | | | Long-Term | | | Return of | | | | |
| July 31, 2024 | | Income | | | Capital Gain | | | Capital | | | Total | |
| Foundations Dynamic Core ETF | | $ | 1,800 | | | $ | — | | | $ | — | | | $ | 1,800 | |
| Foundations Dynamic Growth ETF | | | 1,200 | | | | — | | | | — | | | | 1,200 | |
| Foundations Dynamic Income ETF | | | 142,590 | | | | — | | | | — | | | | 142,590 | |
| Foundations Dynamic Value ETF | | | 6,000 | | | | — | | | | — | | | | 6,000 | |
As of July 31, 2024, the components of accumulated earnings/ (deficit) on a tax basis were as follows:
| | | Undistributed | | | Undistributed | | | Post October Loss | | | Capital Loss | | | Other | | | Unrealized | | | Total | |
| | | Ordinary | | | Long-Term | | | and | | | Carry | | | Book/Tax | | | Appreciation/ | | | Accumulated | |
| | | Income | | | Capital Gains | | | Late Year Loss | | | Forwards | | | Differences | | | (Depreciation) | | | Earnings/(Deficits) | |
| Foundations Dynamic Core ETF | | $ | 10,631 | | | $ | — | | | $ | (64,338 | ) | | $ | — | | | $ | — | | | $ | 325,690 | | | $ | 271,983 | |
| Foundations Dynamic Growth ETF | | | — | | | | — | | | | (310,280 | ) | | | — | | | | — | | | | (597,904 | ) | | | (908,184 | ) |
| Foundations Dynamic Income ETF | | | 28,227 | | | | — | | | | (537,650 | ) | | | — | | | | — | | | | (65,322 | ) | | | (574,745 | ) |
| Foundations Dynamic Value ETF | | | 199,432 | | | | 182,963 | | | | — | | | | — | | | | — | | | | 59,357 | | | | 441,752 | |
| Foundations ETFs |
| NOTES TO FINANCIAL STATEMENTS (Continued) |
| July 31, 2024 |
| |
The difference between book basis and tax basis undistributed net investment income (losses), accumulated net realized gains (losses), and unrealized appreciation (depreciation) from investments is primarily attributable to the tax deferral of losses on wash sales.
Late year losses incurred after December 31 within the fiscal year are deemed to arise on the first business day of the following fiscal year for tax purposes. The Dynamic Growth ETF incurred and elected to defer such a loss of $19,408.
Capital losses incurred after October 31 within the fiscal year are deemed to arise on the first business day of the following fiscal year for tax purposes. The following Funds incurred and elected to defer such capital losses as follows:
| | | Post October | |
| Portfolio | | Losses | |
| Foundations Dynamic Core ETF | | $ | 64,338 | |
| Foundations Dynamic Growth ETF | | | 290,872 | |
| Foundations Dynamic Income ETF | | | 537,650 | |
| Foundations Dynamic Value ETF | | | — | |
| | | | | |
Permanent book and tax differences, primarily attributable to realized gain (loss) on in-kind redemptions, resulted in reclassifications for the tax year ended July 31, 2024, as follows:
| Portfolio | | Paid in Capital | | | Earnings (Losses) | |
| Foundations Dynamic Core ETF | | $ | 464,843 | | | $ | (464,843 | ) |
| Foundations Dynamic Growth ETF | | | 2,310,704 | | | | (2,310,704 | ) |
| Foundations Dynamic Income ETF | | | (18,158 | ) | | | 18,158 | |
| Foundations Dynamic Value ETF | | | 1,027,059 | | | | (1,027,059 | ) |
| | | | | | | | | |
| (6) | CAPITAL SHARE TRANSACTIONS |
Shares are not individually redeemable and may be redeemed by each Fund at NAV only in large blocks known as “Creation Units.” Shares are created and redeemed by the Funds only in Creation Unit size aggregations of 25,000 shares. Only Authorized Participants or transactions done through an Authorized Participant are permitted to purchase or redeem Creation Units from the Funds. An Authorized Participant is either (i) a broker-dealer or other participant in the clearing process through the Continuous Net Settlement System of the National Securities Clearing Corporation or (ii) a DTC participant and, in each case, must have executed a Participant Agreement with the Distributor. Such transactions are generally permitted on an in-kind basis, with a balancing cash component to equate the transaction to the NAV per share of the Funds on the transaction date. Cash may be substituted equivalent to the value of certain securities generally when they are not available in sufficient quantity for delivery, not eligible for trading by the Authorized Participant or as a result of other market circumstances. In addition, the Funds may impose transaction fees on purchases and redemptions of Fund shares to cover the custodial and other costs incurred by the Funds in effecting trades. A fixed fee payable to the Custodian may be imposed on each creation and redemption transaction regardless of the number of Creation Units involved in the transaction (“Fixed Fee”) . Purchases and redemptions of Creation Units for cash or involving cash-in-lieu are required to pay an additional variable charge to compensate the Funds and its ongoing shareholders for brokerage and market impact expenses relating to Creation Unit transactions (“Variable Charge,” and together with the Fixed Fee, the “Transaction Fees”). Transactions in capital shares for the Funds are disclosed in the Statements of Changes in Net Assets.
| Foundations ETFs |
| NOTES TO FINANCIAL STATEMENTS (Continued) |
| July 31, 2024 |
| |
The Transaction Fees for each Fund is listed in the table below:
| Fund | Fee for In-Kind and Cash
Purchases | Maximum Additional Variable
Charge for Cash Purchases* |
| Foundations Dynamic Core ETF | $250 | 2.00% |
| Foundations Dynamic Growth ETF | $250 | 2.00% |
| Foundations Dynamic Income ETF | $250 | 2.00% |
| Foundations Dynamic Value ETF | $250 | 2.00% |
| * | The maximum Transaction Fee may be up to 2.00% of the amount invested. |
| (7) | PRINCIPAL INVESTMENT RISKS |
The Funds’ investments in securities, financial instruments and derivatives expose them to various risks, certain of which are discussed below. Each Fund’s prospectus and statement of additional information (“SAI”) include further information regarding the risks associated with each Fund’s investments. These risks include, but are not limited to: active trading risk, allocation risk, authorized participant concentration risk, common stock risk, cash positions risk, cybersecurity risk, derivatives risk, ETF structure risk, fluctuation of net asset value risk, focus risk, forward and futures contract risk, gap risk, geographic risk, growth investing risk (Dynamic Growth ETF), hedging transactions risk (Dynamic Core and Dynamic Growth ETF), index risk, investment companies, investment style risk (Dynamic Core and Dynamic Value ETF), issuer- specific risk (Dynamic Core, Dynamic Growth and Dynamic Value ETFs), large-cap securities risk (Dynamic Core, Dynamic Growth and Dynamic Value ETFs), leveraging risk, liquidity risk, management risk, managed volatility strategy risk, market risk, market events risk, model and data risk, new fund risk, portfolio turnover risk, regulatory risk, sector risk, small- and mid- cap securities risk (Dynamic Core, Dynamic Growth and Dynamic Value ETFs), treasury inflation-protected securities (“TIPS”) risk, underlying fund risk, U.S. government securities risk, value investing risk (Dynamic Value ETF), valuation risk and volatility risk. Dynamic Income ETF includes the following additional risks: counterparty credit risk, credit risk, credit spread risk, fixed income securities risk, high yield risk, interest rate risk, odd lot pricing risk, prepayment and extension risk. The Funds may be subject to the risks listed and/or described below through its own direct investments and indirectly through its investments in other investment companies.
Investment Companies Risks – When the Funds invest in another investment companies (including ETFs), they will bear additional expenses based on their pro rata share of such investment company’s operating expenses, including the potential duplication of management fees, however the Adviser’s inclusion of acquired fund fees and expenses in its unitary fee will minimize the duplication of such operating expenses. The risk of owning another investment company (including an ETF) generally reflects the risks of owning the underlying investments held by the other investment company. Each Fund may also incur brokerage costs when it purchases and sells shares of investment companies. An ETF’s shares could trade at a significant premium or discount to its NAV.
Underlying Fund Risk – The Funds’ investment performance and its ability to achieve its investment objective are directly related to the performance of the underlying funds in which it invests. There can be no assurance that the Funds’ investments in the underlying funds will achieve their respective investment objectives. The Funds are subject to the risks of the underlying funds in direct proportion to the allocation of its assets among the underlying funds.
Derivatives Risk – The derivative instruments in which the Fund may invest, including futures, options, credit default swaps, total return swaps, repurchase agreements and other similar instruments, may be more volatile than other instruments and may be subject to unanticipated market movements, which are potentially unlimited. The risks associated with investments in derivatives also include liquidity, interest rate, market, credit and management risks, mispricing or improper valuation. The use of derivative instruments involves risks different from, or possibly
| Foundations ETFs |
| NOTES TO FINANCIAL STATEMENTS (Continued) |
| July 31, 2024 |
| |
greater than, the risks associated with investing directly in securities and other traditional investments, and certain derivatives may create a risk of loss greater than the amount invested by the Fund. These risks include (i) the risk that the counterparty to a derivative transaction may not fulfill its contractual obligations; (ii) risk of mispricing or improper valuation; and (iii) the risk that changes in the value of the derivative may not correlate perfectly with the underlying asset, rate or index. The risks associated with investments in derivatives also include leverage, liquidity, interest rate, market, credit and management risks. In addition, if a derivative is being used for hedging purposes there can be no assurance given that each derivative position will achieve a perfect correlation with the security or currency against which it is being hedged, or that a particular derivative position will be available when sought by the portfolio manager. Derivative prices are highly volatile and may fluctuate substantially during a short period of time. Such prices are influenced by numerous factors that affect the markets, including, but not limited to: changing supply and demand relationships; government programs and policies; and national and international political and economic events, changes in interest rates, and inflation and deflation and changes in supply and demand relationships. Trading derivative instruments involves risks different from, or possibly greater than, the risks associated with investing directly in securities and other more traditional investments, and certain derivatives may create a risk of loss greater than the amount invested.
ETF Structure Risks – The Funds are structured as an ETF and as a result is subject to the special risks. Shares are not individually redeemable and may be redeemed by the Funds at NAV only in large blocks known as “Creation Units.” Trading in shares on the Cboe BZX Exchange, Inc. (the “Exchange”) may be halted due to market conditions or for reasons that, in the view of the Exchange, make trading in shares inadvisable, such as extraordinary market volatility. There can be no assurance that shares will continue to meet the listing requirements of the Exchange. An active trading market for the Funds’ shares may not be developed or maintained. If the Funds’ shares are traded outside a collateralized settlement system, the number of financial institutions that can act as authorized participants that can post collateral on an agency basis is limited, which may limit the market for the Funds’ shares. The market prices of shares will fluctuate in response to changes in NAV and supply and demand for shares and will include a “bid-ask spread” charged by the exchange specialists, market makers or other participants that trade the particular security. There may be times when the market price and the NAV vary significantly, particularly during times of market stress, with the result that investors may pay significantly more or significantly less for Fund shares than the Funds’ NAV, which is reflected in the bid and ask price for Fund shares or in the closing price. If a shareholder purchases shares at a time when the market price is at a premium to the NAV or sells shares at a time when the market price is at a discount to NAV, the shareholder may sustain losses if the shares are sold at a price that is less than the price paid by the shareholder for the shares.
Fixed Income Securities Risk – Fixed income securities are subject to interest rate risk, call risk, prepayment and extension risk, credit risk, duration, and liquidity risk. In addition, current market conditions may pose heightened risks for fixed income securities. When the Fund and underlying funds invest in fixed income securities or derivatives, the value of your investment in the Fund will fluctuate with changes in interest rates. Typically, a rise in interest rates causes a decline in the value of fixed income securities or derivatives owned by the Fund or an Underlying Fund. Risks associated with rising interest rates are heightened given that interest rates in the U.S. currently remain near historic lows, but have recently risen and could rise further. Moreover, new regulations applicable to and changing business practices of financial intermediaries that make markets in fixed income securities have resulted in less market making activity for certain fixed income securities, which has reduced the liquidity and may increase the volatility for such fixed income securities. The fixed-income securities market can be susceptible to increases in volatility and decreases in liquidity. Liquidity may decline unpredictably in response to overall economic conditions or credit tightening. Duration risk arises when holding long duration and long maturity investments, which will magnify certain risks, including interest rate risk and credit risk. Longer-term securities may be more sensitive to interest rate changes.
Fluctuation of Net Asset Value Risk – Unlike conventional ETFs, the Funds are not index funds. The Funds are actively managed and do not seek to replicate the performance of a specified Index. The NAV of the Funds’ shares will generally fluctuate with changes in the market value of the Funds’ holdings. The market prices of the shares will generally fluctuate in accordance with changes in NAV as well as the relative supply of and demand for the shares
| Foundations ETFs |
| NOTES TO FINANCIAL STATEMENTS (Continued) |
| July 31, 2024 |
| |
on the Exchange. The Funds’ Sub- Adviser cannot predict whether the shares will trade below, at or above their NAV. Price differences may be due, in large part, to the fact that supply and demand forces at work in the secondary trading market for the shares will be closely related to, but not identical to, the same forces influencing the prices of the Funds’ holdings trading individually or in the aggregate at any point in time. Actively managed ETFs have a limited trading history and, therefore, there can be no assurance as to whether and/or the extent to which the Shares will trade at premiums or discounts to NAV.
Interest Rate Risk – Generally, when interest rates rise, prices of fixed-income securities fall. However, market factors, such as the demand for particular fixed income securities, may cause the price of certain fixed income securities to fall while the prices of other securities rise or remain unchanged. Certain countries have experienced negative interest rates on certain fixed-income instruments. Very low or negative interest rates may magnify interest rate risk. Changing interest rates, including rates that fall below zero, may have unpredictable effects on markets, may result in heightened market volatility and may detract from Fund performance to the extent a Fund is exposed to such interest rates and/or volatility.
Leveraging Risk – The use of certain derivatives may increase leveraging risk and adverse changes in the value or level of the underlying asset, rate, or index may result in a loss substantially greater than the amount paid for the derivative. The use of leverage may exaggerate any increase or decrease in the net asset value, causing the Fund to be more volatile. The use of leverage may increase expenses and increase the impact of the Funds’ other risks. Certain derivatives require the Fund to pledge its assets as collateral or to make initial margin payments, a form of security deposit intended to protect against nonperformance of the derivative contract. The Fund may have to pledge additional collateral or post additional margin if the value of the derivative position changes in a manner adverse to the Fund. The use of leverage may cause the Fund to liquidate portfolio positions when it may not be advantageous to do so to satisfy its obligations, to meet additional regulatory requirements resulting in increased volatility of returns. Leverage, including borrowing, may cause the Fund to be more volatile than if the Fund had not been leveraged.
Market Risk – Overall market risk may affect the value of individual instruments in which the Funds or an underlying fund invests. The Funds are subject to the risk that the securities markets will move down, sometimes rapidly and unpredictably, based on overall economic conditions and other factors, which may negatively affect the Funds’ performance. Factors such as domestic and foreign (non-U.S.) economic growth and market conditions, real or perceived adverse economic or political conditions, military conflict, acts of terrorism, social unrest, natural disasters, recessions, inflation, changes in interest rate levels, supply chain disruptions, sanctions, the spread of infectious illness or other public health threats, lack of liquidity in the bond and other markets, volatility in the equities or other securities markets, adverse investor sentiment affect the securities markets and political events affect the securities markets. U.S. and foreign stock markets have experienced periods of substantial price volatility in the past and may do so again in the future. Securities markets also may experience long periods of decline in value. A change in financial condition or other event affecting a single issuer or market may adversely impact securities markets as a whole. Rates of inflation have recently risen. The value of assets or income from an investment may be worth less in the future as inflation decreases the value of money. As inflation increases, the real value of the Funds’ assets can decline as can the value of the Funds’ distributions. When the value of the Funds’ investments goes down, your investment in the Funds decrease in value and you could lose money.
Local, state, regional, national or global events such as war, acts of terrorism, the spread of infectious illness or other public health issues, recessions, or other events could have a significant impact on the Funds and its investments and could result in decreases to the Funds’ net asset value. Political, geopolitical, natural and other events, including war, terrorism, trade disputes, government shutdowns, market closures, natural and environmental disasters, epidemics, pandemics and other public health crises and related events and governments’ reactions to such events have led, and in the future may lead, to economic uncertainty, decreased economic activity, increased market volatility and other disruptive effects on U.S. and global economies and markets. Such events may have significant adverse direct or indirect effects on the Funds and its investments. For example, a widespread health crisis such as a global pandemic could cause substantial market volatility, exchange trading
| Foundations ETFs |
| NOTES TO FINANCIAL STATEMENTS (Continued) |
| July 31, 2024 |
| |
suspensions and closures, impact the ability to complete redemptions, and affect Fund performance. A health crisis may exacerbate other pre-existing political, social and economic risks. In addition, the increasing interconnectedness of markets around the world may result in many markets being affected by events or conditions in a single country or region or events affecting a single or small number of issuers.
| (8) | UNDERLYING INVESTMENT IN OTHER INVESTMENT COMPANIES |
The Foundations Dynamic Core ETF currently seeks to achieve its investment objectives by, among other things, investing a portion of its assets in underlying Funds. As of July 31, 2024, the percentage of the Fund’s net assets invested in the Vanguard Total Stock Market ETF and iShares Core S&P Small-Cap ETF was 27.7% and 26.2%, respectively. The Foundations Dynamic Core ETF may sell its investments in these securities at any time if the Adviser determines that it is in the best interest of the Foundations Dynamic Core ETF and its shareholders to do so.
The Foundations Dynamic Growth ETF currently seeks to achieve its investment objectives by, among other things, investing a portion of its assets in underlying Funds. As of July 31, 2024, the percentage of the Fund’s net assets invested in the Vanguard Growth ETF was 48.0%. The Foundations Dynamic Growth ETF may sell its investments in this security at any time if the Adviser determines that it is in the best interest of the Foundations Dynamic Growth ETF and its shareholders to do so.
The Foundations Dynamic Income ETF currently seeks to achieve its investment objectives by, among other things, investing a portion of its assets in underlying Funds. As of July 31, 2024, the percentage of the Fund’s net assets invested in the Vanguard Long-Term Treasury ETF was 41.2%. The Foundations Dynamic Income ETF may sell its investments in this security at any time if the Adviser determines that it is in the best interest of the Foundations Dynamic Income ETF and its shareholders to do so.
The Foundations Dynamic Value ETF currently seeks to achieve its investment objectives by, among other things, investing a portion of its assets in underlying Funds. As of July 31, 2024, the percentage of the Fund’s net assets invested in the Vanguard Value ETF was 26.6%. The Foundations Dynamic Value ETF may sell its investments in this security at any time if the Adviser determines that it is in the best interest of the Foundations Dynamic Value ETF and its shareholders to do so.
The performance of each Fund will be directly affected by the performance of each security noted above with respect to such Fund (each a “Security”). The annual report of each, along with the report of the independent registered public accounting firm is included in such Security’s N-CSR’s available at “www.sec.gov”.
Subsequent events after the Statements of Assets and Liabilities date have been evaluated through the date the financial statements were issued. Management has determined that no events or transactions occurred requiring adjustment or disclosure in the financial statements.
REPORT OF INDEPENDENT REGISTERED PUBLIC ACCOUNTING FIRM
To the Board of Trustees of Two Roads Shared Trust and the Shareholders of Foundations Dynamic Core ETF, Foundations Dynamic Growth ETF, Foundations Dynamic Income ETF and Foundations Dynamic Value ETF
Opinion on the Financial Statements and Financial Highlights
We have audited the accompanying statements of assets and liabilities of Foundations Dynamic Core ETF, Foundations Dynamic Growth ETF, Foundations Dynamic Income ETF and Foundations Dynamic Value ETF (each the “Fund”, collectively the “Funds”), each a fund constituting the Two Shared Roads Trust (the “Trust”), including the schedules of investments, as of July 31, 2024, the related statements of operations, the statements of changes in net assets and the financial highlights for the period from October 2, 2023 (commencement of operations) to July 31, 2024, and the related notes. In our opinion, the financial statements and financial highlights present fairly, in all material respects, the financial position of the Funds as of July 31, 2024, and the results of their operations, the changes in their net assets, and the financial highlights for the period from October 2, 2023 (commencement of operations) through July 31, 2024, in conformity with accounting principles generally accepted in the United States of America.
Basis for Opinion
These financial statements and financial highlights are the responsibility of the Funds’ management. Our responsibility is to express an opinion on the Funds’ financial statements and financial highlights based on our audit. We are a public accounting firm registered with the Public Company Accounting Oversight Board (United States) (PCAOB) and are required to be independent with respect to the Funds in accordance with the U.S. federal securities laws and the applicable rules and regulations of the Securities and Exchange Commission and the PCAOB.
We conducted our audit in accordance with the standards of the PCAOB. Those standards require that we plan and perform the audit to obtain reasonable assurance about whether the financial statements and financial highlights are free of material misstatement, whether due to error or fraud. The Funds are not required to have, nor were we engaged to perform, an audit of its internal control over financial reporting. As part of our audit we are required to obtain an understanding of internal control over financial reporting but not for the purpose of expressing an opinion on the effectiveness of the Funds’ internal control over financial reporting. Accordingly, we express no such opinion.
Our audit included performing procedures to assess the risks of material misstatement of the financial statements and financial highlights, whether due to error or fraud, and performing procedures that respond to those risks. Such procedures included examining, on a test basis, evidence regarding the amounts and disclosures in the financial statements and financial highlights. Our audit also included evaluating the accounting principles used and significant estimates made by management, as well as evaluating the overall presentation of the financial statements and financial highlights. Our procedures included confirmation of securities owned as of July 31, 2024, by correspondence with the custodian and brokers. We believe that our audit provides a reasonable basis for our opinion.

Costa Mesa, California
September 27, 2024
We have served as the auditor of one or more Regents Park Funds, LLC investment companies since 2022.
PRIVACY NOTICE
| FACTS | WHAT DOES TWO ROADS SHARED TRUST DO WITH YOUR PERSONAL INFORMATION |
| | |
| Why? | Financial companies choose how they share your personal information. |
| | |
| | Federal law gives consumers the right to limit some but not all sharing. |
| | Federal law also requires us to tell you how we collect, share, and protect your personal information.
Please read this notice carefully to understand what we do. |
| | |
| What? | THE TYPES OF PERSONAL INFORMATION WE COLLECT AND SHARE DEPENDS ON THE PRODUCT OR SERVICE THAT YOU HAVE WITH US. THIS INFORMATION CAN INCLUDE: |
| | |
| | ● Social Security number and income |
| | |
| | ● Account transactions and transaction history |
| | |
| | ● Investment experience and purchase history |
| | |
| | When you are no longer our customer, we continue to share your information as described in this notice. |
| | |
| How? | All financial companies need to share customers’ personal information to run their everyday business. In the section below, we list the reasons financial companies can share their customers’ personal information; the reason Two Roads Shared Trust chooses to share and whether you can limit this sharing. |
| Reasons we can share your personal information | Does Two Roads
Shared Trust share? | Can you limit
this sharing? |
| For our everyday business purposes – | | |
| such as to process your transactions, maintain your account(s), respond to court orders and legal investigations, or report to credit bureaus | YES | NO |
| For our marketing purposes – | NO | We do not share |
| to offer our products and services to you | | |
| For joint marketing with other financial companies | NO | We do not share |
| | | |
| | | |
| For our affiliates’ everyday business purposes – | NO | We do not share |
| information about your transactions and experiences | | |
| | | |
| For our affiliates’ everyday business purposes – | NO | We do not share |
| information about your creditworthiness | | |
| For our affiliates to market to you | NO | We do not share |
| | | |
| For nonaffiliates to market to you | NO | We do not share |
| | | |
| Questions? | Call 1-631-490-4300 |
What we do
How does Two Roads Shared Trust
protect my personal information? | To protect your personal information from unauthorized access and use, we use security measures that comply with federal law.
These measures include computer safeguards and secured files and buildings. |
| | |
| | Our service providers are held accountable for adhering to strict policies and procedures to prevent any misuse of your nonpublic personal information. |
| How does Two Roads Shared Trust | We collect your personal information, for example, when you |
| collect my personal information? | |
| | ● open an account or give us contact information |
| | |
| | ● provide account information or give us your income information |
| | |
| | ● make deposits or withdrawals from your account |
| | |
| | We also collect your personal information from other companies. |
| Why can’t I limit all sharing? | Federal law gives you the right to limit only |
| | |
| | ● sharing for affiliates’ everyday business purposes – information about your creditworthiness |
| | |
| | ● affiliates from using your information to market to you |
| | |
| | ● sharing for nonaffiliates to market to you |
| | |
| | State laws and individual companies may give you additional rights to limit sharing. |
| | |
| Definitions | |
| Affiliates | Companies related by common ownership or control. They can be financial and nonfinancial companies. |
| | |
| | ● Two Roads Shared Trust has no affiliates. |
| Nonaffiliates | Companies not related by common ownership or control. They can be financial and nonfinancial companies. |
| | |
| | ● Two Roads Shared Trust does not share with nonaffiliates so they can market to you. |
| Joint marketing | A formal agreement between nonaffiliates financial companies that together market financial products or services to you. |
| | |
| | ● Two Roads Shared Trust does not jointly market. |
| |
| Adviser |
| Regents Park Funds, LLC |
| 19900 MacArthur Blvd., Suite 655 |
| Irvine, CA 92612 |
| |
| Administrator |
| Ultimus Fund Solutions, LLC |
| 225 Pictoria Drive, Suite 450 |
| Cincinnati, OH 45246 |
| |
This report and the financial statements contained herein are submitted for the general information of shareholders and are not authorized for distribution to prospective investors unless preceded or accompanied by an effective prospectus. Nothing contained herein is to be considered an offer of sale or solicitation of an offer to buy shares of the Funds. Such an offering is made only by a prospectus, which contains information about each Fund’s investment objective, risks, fees and expenses. Investors are reminded to read the prospectus carefully before investing in a Fund.
FOUND-AR24
Item 8. Changes in and Disagreements with Accountants for Open-End Management Investment Companies.
Not applicable.
Item 9. Proxy Disclosures for Open-End Management Investment Companies.
Not applicable.
Item 10. Remuneration Paid to Directors, Officers, and Others of Open-End Management Investment Companies.
Included under Item 7.
Item 11. Statement Regarding Basis for Approval of Investment Advisory Contract.
Not applicable.
Item 12. Disclosure of Proxy Voting Policies and Procedures for Closed-End Management Investment Companies.
Not applicable
Item 13. Portfolio Managers of Closed-End Management Investment Companies.
Not applicable.
Item 14. Purchases of Equity Securities by Closed-End Management Investment Company and Affiliated Purchasers.
Not applicable.
Item 15. Submission of Matters to a Vote of Security Holders.
None
Item 16. Controls and Procedures
(a) The registrant’s Principal Executive Officer and Principal Financial Officer have concluded that the registrant’s disclosure controls and procedures (as defined in Rule 30a-3(c) under the Act) are effective in design and operation as of a date within 90 days of this report on Form N-CSR, based on their evaluation of these disclosure controls and procedures as required by Rule 30a-3(b) under the Act.
(b) There were no changes in the registrant’s internal control over financial reporting (as defined in Rule 30a-3(d) under the Act) during the period covered by this report that have materially affected, or are reasonably likely to materially affect, the registrant’s internal control over financial reporting.
Item 17. Disclosure of Securities Lending Activities for Closed-End Management Investment Companies.
Not applicable.
Item 18. Recovery of Erroneously Awarded Compensation.
Item 19. Exhibits.
| (a)(3) | A separate certification for each principal executive officer and principal financial officer of the registrant as required by Rule 30a-2(a) under the Act (17 CFR 270.30a-2(a)): Attached hereto. |
| (b) | Certifications required by Rule 30a-2(b) under the Act (17 CFR 270.30a-2(b)): Attached hereto |
SIGNATURES
Pursuant to the requirements of the Securities Exchange Act of 1934 and the Investment Company Act of 1940, the registrant has duly caused this report to be signed on its behalf by the undersigned, thereunto duly authorized.
Two Roads Shared Trust
| By | /s/ James Colantino | |
| James Colantino |
| Principal Executive Officer/President |
| Date: 9/27/2024 |
| | | |
Pursuant to the requirements of the Securities Exchange Act of 1934 and the Investment Company Act of 1940, this report has been signed below by the following persons on behalf of the registrant and in the capacities and on the dates indicated.
| By | /s/ James Colantino | |
| James Colantino |
| Principal Executive Officer/President |
| Date: 9/27/2024 |
| | |
| By | /s/ Laura Szalyga | |
| Laura Szalyga |
| Principal Financial Officer/Treasurer |
| Date: 9/27/2024 |