united states
securities and exchange commission
washington, d.c. 20549
form n-csr
certified shareholder report of registered management
investment companies
Investment Company Act file number 811-22718
Two Roads Shared Trust
(Exact name of registrant as specified in charter)
225 Pictoria Drive, Suite 450 Cincinnati, OH 45246
(Address of principal executive offices) (Zip code)
The Corporation Trust Company
1209 Orange Street, Wilmington, DE 19801
(Name and address of agent for service)
Registrant's telephone number, including area code: 631-490-4300
Date of fiscal year end: 10/31
Date of reporting period: 10/31/2024
Item 1. Reports to Stockholders.
(a)
LeaderShares Activist Leaders ETF
Annual Shareholder Report - October 31, 2024
This annual shareholder report contains important information about LeaderShares Activist Leaders ETF for the period of November 1, 2023 to October 31, 2024. You can find additional information about the Fund at www.leadersharesetfs.com. You can also request this information by contacting us at 1-888-617-1444.
What were the Fund’s costs for the last year?
(based on a hypothetical $10,000 investment)
| Fund Name | Costs of a $10,000 investment | Costs paid as a percentage of a $10,000 investment |
|---|
| LeaderShares Activist Leaders ETF | $81 | 0.75% |
|---|
How did the Fund perform during the reporting period?
During the LeaderShares® Activist Leaders® ETF’s (the “Fund”) fiscal year, risk markets extended their upward trajectory as the long-anticipated Federal Reserve rate cuts materialized, reigniting investor risk appetite and driving equity markets to all-time highs. Although favorable economic indicators and policy shifts helped buoy markets, concerns about potential recessions and geopolitical tensions introduced caution among investors.
The Fund posted a return of 17.17% (Source: Ultimus) during the period as compared to 38.02% for the S&P 500**. During the period, the Fund was invested in a portfolio of stocks based on its quantitative selection methodology. The Fund is an active fund and does not track an index. Mega-cap tech stocks continue to boost market-cap weighted indices like the S&P 500 higher. Meanwhile, the Fund’s concentrated exposure in companies involved in shareholder activism which tend to be smaller sized value tiled companies, drove the underperformance against the S&P 500 Index. The Fund will continue to implement its disciplined quantitative stock selection process.
**Standard and Poor’s 500 Total Return Index is a capitalization-weighted index of 500 stocks. The index is designed to measure the performance of the broad domestic economy through changes in the aggregate market value of 500 stocks representing all major industries. Investors cannot invest directly in an index or benchmark. Index returns are gross of any fees, brokerage commissions or other expenses of investing.
How has the Fund performed since inception?
Total Return Based on $10,000 Investment
| LeaderShares Activist Leaders ETF - NAV | S&P 500® Index |
|---|
| 10/26/20 | $10,000 | $10,000 |
|---|
| 10/31/20 | $9,716 | $9,617 |
|---|
| 10/31/21 | $15,410 | $13,744 |
|---|
| 10/31/22 | $12,465 | $11,736 |
|---|
| 10/31/23 | $12,037 | $12,926 |
|---|
| 10/31/24 | $14,104 | $17,840 |
|---|
Average Annual Total Returns
| 1 Year | Since Inception (October 26, 2020) |
|---|
| LeaderShares Activist Leaders ETF - NAV | 17.17% | 8.94% |
|---|
S&P 500® Index | 38.02% | 15.51% |
|---|
The Fund's past performance is not a good predictor of how the Fund will perform in the future. The graph and table do not reflect the deduction of taxes that a shareholder would pay on fund distributions or redemption of fund shares.
| Net Assets | $69,970,100 |
|---|
| Number of Portfolio Holdings | 50 |
|---|
| Advisory Fee | $615,328 |
|---|
| Portfolio Turnover | 90% |
|---|
Asset Weighting (% of total investments)
| Value | Value |
|---|
| Common Stocks | 100.0% |
What did the Fund invest in?
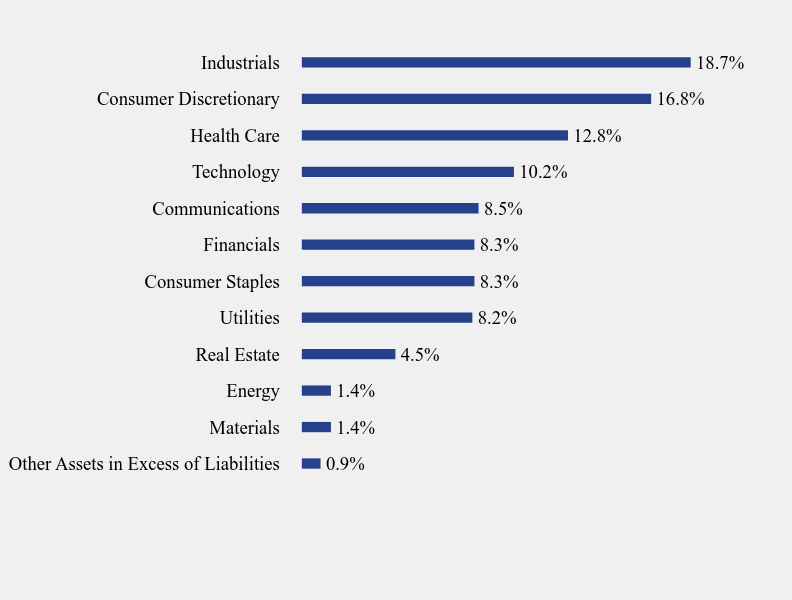
Sector Weighting (% of net assets)
| Value | Value |
|---|
| Other Assets in Excess of Liabilities | 0.9% |
| Materials | 1.4% |
| Energy | 1.4% |
| Real Estate | 4.5% |
| Utilities | 8.2% |
| Consumer Staples | 8.3% |
| Financials | 8.3% |
| Communications | 8.5% |
| Technology | 10.2% |
| Health Care | 12.8% |
| Consumer Discretionary | 16.8% |
| Industrials | 18.7% |
Top 10 Holdings (% of net assets)
| Holding Name | % of Net Assets |
| Bausch Health Companies, Inc. | 3.8% |
| Janus Henderson Group plc | 3.8% |
| Lamb Weston Holdings, Inc. | 3.8% |
| Algonquin Power & Utilities Corporation | 3.8% |
| Invesco Ltd. | 3.8% |
| Restaurant Brands International, Inc. | 3.8% |
| Rapid7, Inc. | 3.8% |
| Fortrea Holdings, Inc. | 3.8% |
| Howard Hughes Holdings, Inc. | 3.8% |
| Innoviva, Inc. | 3.7% |
No material changes occurred during the year ended October 31, 2024.
LeaderShares Activist Leaders ETF - Fund (ACTV)
Annual Shareholder Report - October 31, 2024
Where can I find additional information about the Fund?
Additional information is available on the Fund's website ( www.leadersharesetfs.com ), including its:
Prospectus
Financial information
Holdings
Proxy voting information
LeaderShares AlphaFactor Tactical Focused ETF
Annual Shareholder Report - October 31, 2024
This annual shareholder report contains important information about LeaderShares AlphaFactor Tactical Focused ETF for the period of November 1, 2023 to October 31, 2024. You can find additional information about the Fund at www.leadersharesetfs.com. You can also request this information by contacting us at 1-888-617-1444.
What were the Fund’s costs for the last year?
(based on a hypothetical $10,000 investment)
| Fund Name | Costs of a $10,000 investment | Costs paid as a percentage of a $10,000 investment |
|---|
| LeaderShares AlphaFactor Tactical Focused ETF | $113 | 0.99% |
|---|
How did the Fund perform during the reporting period?
During the LeaderShares® AlphaFactor® Tactical Focused ETF’s (the “Fund”) fiscal year, risk markets extended their upward trajectory as the long-anticipated Federal Reserve rate cuts materialized, reigniting investor risk appetite and driving equity markets to all-time highs. Although favorable economic indicators and policy shifts helped buoy markets, concerns about potential recessions and geopolitical tensions introduced caution among investors.
The Fund posted a return of 27.93% (Source: Ultimus) during the period as compared to 38.02% for the S&P 500**. In response to the strong uptrend in equity markets, our quantitative risk-managed process strategically positioned the Fund to remain fully invested in risk assets throughout the period, capitalizing on favorable market conditions. The Fund's portfolio consisted of stocks selected through its disciplined quantitative methodology. As an actively managed fund, it does not track an index. Mega-cap tech stocks continue to boost market-cap weighted indices like the S&P 500 higher. Meanwhile, the Fund’s characteristic of being equal-weighted and value-tilted led to some of the underperformance against the S&P 500 Index. The Fund will continue to implement its disciplined quantitative security selection and risk management process.
**Standard and Poor’s 500 Total Return Index is a capitalization-weighted index of 500 stocks. The index is designed to measure the performance of the broad domestic economy through changes in the aggregate market value of 500 stocks representing all major industries. Investors cannot invest directly in an index or benchmark. Index returns are gross of any fees, brokerage commissions or other expenses of investing.
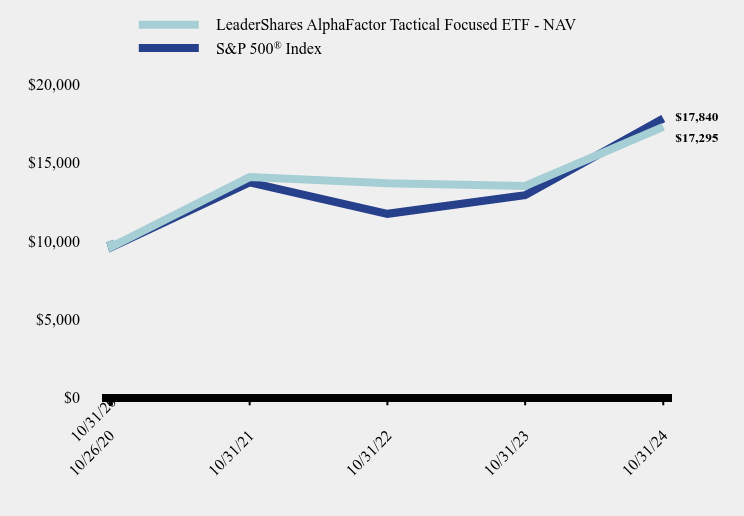
How has the Fund performed since inception?
Total Return Based on $10,000 Investment
| LeaderShares AlphaFactor Tactical Focused ETF - NAV | S&P 500® Index |
|---|
| 10/26/20 | $10,000 | $10,000 |
|---|
| 10/31/20 | $9,636 | $9,617 |
|---|
| 10/31/21 | $14,088 | $13,744 |
|---|
| 10/31/22 | $13,699 | $11,736 |
|---|
| 10/31/23 | $13,519 | $12,926 |
|---|
| 10/31/24 | $17,295 | $17,840 |
|---|
Average Annual Total Returns
| 1 Year | Since Inception (October 26, 2020) |
|---|
| LeaderShares AlphaFactor Tactical Focused ETF - NAV | 27.93% | 14.62% |
|---|
S&P 500® Index | 38.02% | 15.51% |
|---|
The Fund's past performance is not a good predictor of how the Fund will perform in the future. The graph and table do not reflect the deduction of taxes that a shareholder would pay on fund distributions or redemption of fund shares.
| Net Assets | $122,195,560 |
|---|
| Number of Portfolio Holdings | 30 |
|---|
| Advisory Fee | $1,388,273 |
|---|
| Portfolio Turnover | 107% |
|---|
Asset Weighting (% of total investments)
| Value | Value |
|---|
| Common Stocks | 100.0% |
What did the Fund invest in?
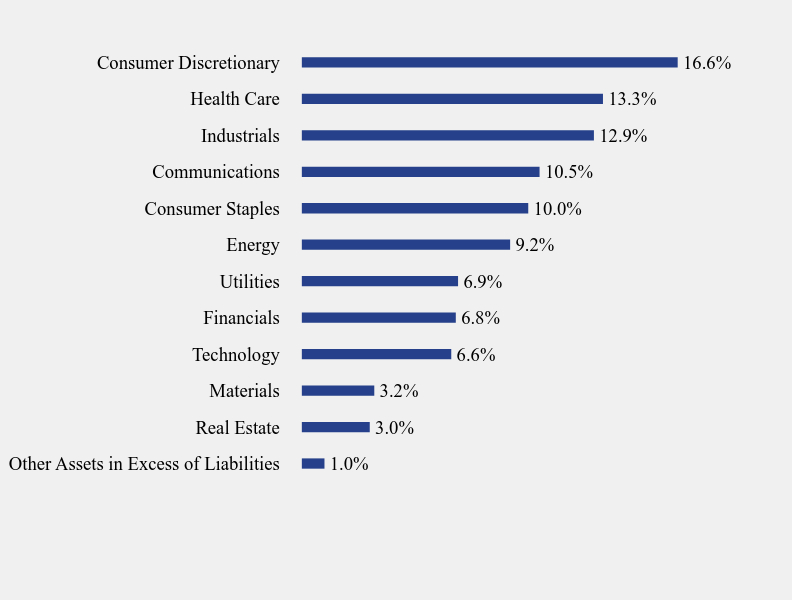
Sector Weighting (% of net assets)
| Value | Value |
|---|
| Other Assets in Excess of Liabilities | 1.0% |
| Real Estate | 3.0% |
| Materials | 3.2% |
| Technology | 6.6% |
| Financials | 6.8% |
| Utilities | 6.9% |
| Energy | 9.2% |
| Consumer Staples | 10.0% |
| Communications | 10.5% |
| Industrials | 12.9% |
| Health Care | 13.3% |
| Consumer Discretionary | 16.6% |
Top 10 Holdings (% of net assets)
| Holding Name | % of Net Assets |
| Bristol-Myers Squibb Company | 3.7% |
| Pilgrim's Pride Corporation | 3.6% |
| Teradata Corporation | 3.6% |
| Nexstar Media Group, Inc. | 3.6% |
| Comcast Corporation, Class A | 3.5% |
| Marriott International, Inc., Class A | 3.5% |
| Vistra Corporation | 3.5% |
| Jefferies Financial Group, Inc. | 3.5% |
| Travel + Leisure Company | 3.5% |
| Labcorp Holdings, Inc. | 3.5% |
No material changes occurred during the year ended October 31, 2024.
LeaderShares AlphaFactor Tactical Focused ETF - Fund (LSAT)
Annual Shareholder Report - October 31, 2024
Where can I find additional information about the Fund?
Additional information is available on the Fund's website ( www.leadersharesetfs.com ), including its:
Prospectus
Financial information
Holdings
Proxy voting information
LeaderShares AlphaFactor US Core Equity ETF
Annual Shareholder Report - October 31, 2024
This annual shareholder report contains important information about LeaderShares AlphaFactor US Core Equity ETF for the period of November 1, 2023 to October 31, 2024. You can find additional information about the Fund at www.leadersharesetfs.com. You can also request this information by contacting us at 1-888-617-1444.
What were the Fund’s costs for the last year?
(based on a hypothetical $10,000 investment)
| Fund Name | Costs of a $10,000 investment | Costs paid as a percentage of a $10,000 investment |
|---|
| LeaderShares AlphaFactor U.S. Core Equity ETF | $88 | 0.75% |
|---|
How did the Fund perform during the reporting period?
During the LeaderShares® AlphaFactor® US Core Equity ETF’s (the “Fund”) fiscal year, risk markets extended their upward trajectory as the long-anticipated Federal Reserve rate cuts materialized, reigniting investor risk appetite and driving equity markets to all-time highs. Although favorable economic indicators and policy shifts helped buoy markets, concerns about potential recessions and geopolitical tensions introduced caution among investors.
The Fund posted a return of 34.79% (Source: Ultimus) for the year ended October 31, 2024, as compared to the 36.17% return of its benchmark AlphaFactor® US Core Equity Index** (Source: Ultimus). During the period, the Fund was invested in a portfolio of stocks based on its quantitative selection methodology. Generally, systematic correlation to the overall U.S. equity market was as expected on both down and up trends. The Fund will continue to implement its disciplined quantitative stock selection process.
Capital markets are infinitely complex. Every day, new information becomes available that changes the risk and return dynamic of any investment. We do not attempt to forecast or suggest what may lie ahead. Instead, we utilize a quantitative approach, aiming to minimize the subjectivity of investing.
**The AlphaFactor® US Core Equity Index utilizes a quantitative rules-based investment methodology that applies a multi-factor ranking process focused on the largest 1,000 U.S. common stocks based on market capitalization. The methodology selects stocks based on a number of characteristics that include, net share count reduction, cash flow growth, dividend yield, volatility, and debt/asset ratios.
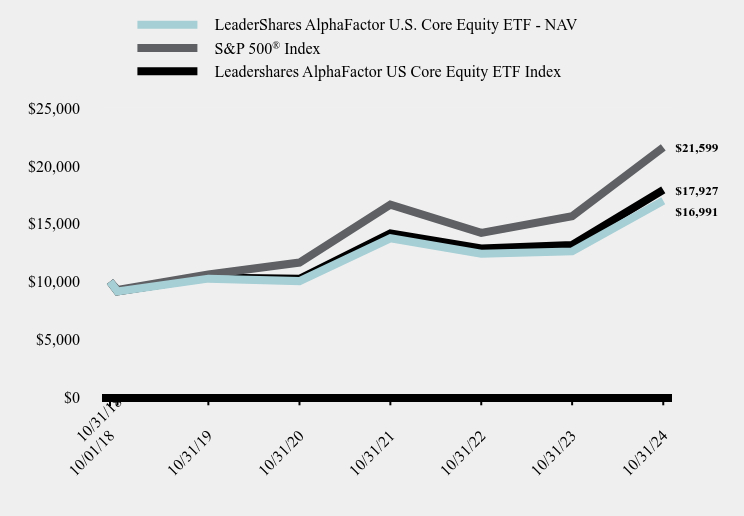
How has the Fund performed since inception?
Total Return Based on $10,000 Investment
| LeaderShares AlphaFactor U.S. Core Equity ETF - NAV | S&P 500® Index | Leadershares AlphaFactor US Core Equity ETF Index |
|---|
| 10/01/18 | $10,000 | $10,000 | $10,000 |
|---|
| 10/31/18 | $9,140 | $9,283 | $9,142 |
|---|
| 10/31/19 | $10,251 | $10,612 | $10,358 |
|---|
| 10/31/20 | $10,038 | $11,643 | $10,237 |
|---|
| 10/31/21 | $13,741 | $16,639 | $14,165 |
|---|
| 10/31/22 | $12,399 | $14,208 | $12,853 |
|---|
| 10/31/23 | $12,606 | $15,649 | $13,165 |
|---|
| 10/31/24 | $16,991 | $21,599 | $17,927 |
|---|
Average Annual Total Returns
| 1 Year | 5 Years | Since Inception (October 1, 2018) |
|---|
| LeaderShares AlphaFactor U.S. Core Equity ETF - NAV | 34.79% | 10.63% | 9.11% |
|---|
S&P 500® Index | 38.02% | 15.27% | 13.50% |
|---|
| Leadershares AlphaFactor US Core Equity ETF Index | 36.17% | 11.59% | 10.07% |
|---|
The Fund's past performance is not a good predictor of how the Fund will perform in the future. The graph and table do not reflect the deduction of taxes that a shareholder would pay on fund distributions or redemption of fund shares.
| Net Assets | $156,310,878 |
|---|
| Number of Portfolio Holdings | 100 |
|---|
| Advisory Fee | $1,109,457 |
|---|
| Portfolio Turnover | 146% |
|---|
Asset Weighting (% of total investments)
| Value | Value |
|---|
| Common Stocks | 100.0% |
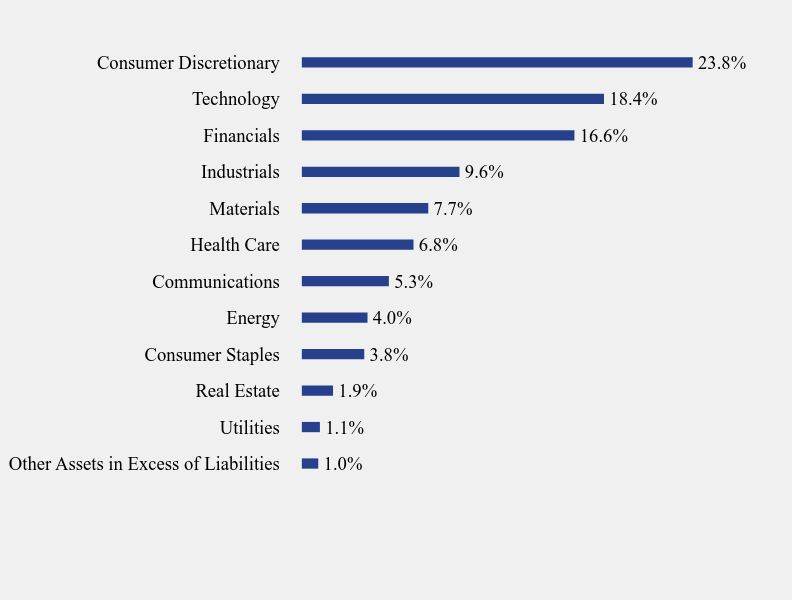
What did the Fund invest in?
Sector Weighting (% of net assets)
| Value | Value |
|---|
| Other Assets in Excess of Liabilities | 1.0% |
| Utilities | 1.1% |
| Real Estate | 1.9% |
| Consumer Staples | 3.8% |
| Energy | 4.0% |
| Communications | 5.3% |
| Health Care | 6.8% |
| Materials | 7.7% |
| Industrials | 9.6% |
| Financials | 16.6% |
| Technology | 18.4% |
| Consumer Discretionary | 23.8% |
Top 10 Holdings (% of net assets)
| Holding Name | % of Net Assets |
| Exelixis, Inc. | 1.3% |
| Blue Owl Capital, Inc. | 1.1% |
| Targa Resources Corporation | 1.2% |
| General Motors Company | 1.1% |
| Synchrony Financial | 1.1% |
| Booking Holdings, Inc. | 1.1% |
| Fiserv, Inc. | 1.1% |
| Affiliated Managers Group, Inc. | 1.1% |
| Unum Group | 1.1% |
| Ameriprise Financial, Inc. | 1.1% |
No material changes occurred during the year ended October 31, 2024.
LeaderShares AlphaFactor US Core Equity ETF - Fund (LSAF)
Annual Shareholder Report - October 31, 2024
Where can I find additional information about the Fund?
Additional information is available on the Fund's website ( www.leadersharesetfs.com ), including its:
Prospectus
Financial information
Holdings
Proxy voting information
LeaderShares Dynamic Yield ETF
Annual Shareholder Report - October 31, 2024
This annual shareholder report contains important information about LeaderShares Dynamic Yield ETF for the period of November 1, 2023 to October 31, 2024. You can find additional information about the Fund at www.leadersharesetfs.com. You can also request this information by contacting us at 1-888-617-1444.
What were the Fund’s costs for the last year?
(based on a hypothetical $10,000 investment)
| Fund Name | Costs of a $10,000 investment | Costs paid as a percentage of a $10,000 investment |
|---|
| LeaderShares Dynamic Yield ETF | $79 | 0.75% |
|---|
How did the Fund perform during the reporting period?
During the LeaderShares® Dynamic Yield ETF’s (the “Fund”) fiscal year, bond markets faced a complex environment as the Federal Reserve’s anticipated rate cuts materialized, directly impacting the demand for fixed-income securities. U.S. Treasury fell overall driven by resilient economic data and tempered expectations for further cuts. Corporate bonds performed strongly, with investment-grade spreads tightening to 36 basis points and high-yield spreads narrowing to their lowest point since 2021.
The Fund returned 9.80% (Source: Ultimus). The Fund is actively managed and does not track an index. Utilizing its quantitative selection methodology, the Fund invested in a portfolio comprising high-yield corporate bonds, investment-grade corporate bonds, and U.S. treasuries, which collectively contributed to its total return. During the period, the Fund underperformed its benchmark, the Bloomberg U.S. Aggregate Bond Index**, which returned 10.55% (Source: Ultimus). A key factor was the Fund's significant allocation to short-term treasuries, which lagged broader fixed-income securities early in the period. Meanwhile, the benchmark, with its focus on investment-grade corporate bonds and treasuries, benefitted from a shift toward discounted securities well-positioned for gains from rate cuts.
Capital markets are infinitely complex. Every day, new information becomes available that changes the risk and return dynamic of any investment. We do not attempt to forecast or suggest what may lie ahead. Instead, we utilize a disciplined, quantitative approach, aiming to minimize the subjectivity of investing.
**The Bloomberg U.S. Aggregate Bond Index is a broad-based benchmark that measures the investment grade, U.S. dollar-denominated, fixed-rate taxable bond market. This includes Treasuries, government-related and corporate securities, mortgage-backed securities, asset-backed securities and collateralized mortgage-backed securities.
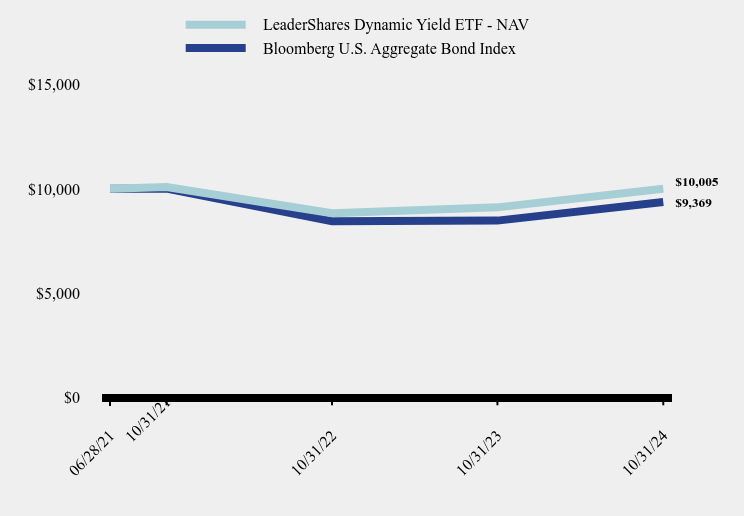
How has the Fund performed since inception?
Total Return Based on $10,000 Investment
| LeaderShares Dynamic Yield ETF - NAV | Bloomberg U.S. Aggregate Bond Index |
|---|
| 06/28/21 | $10,000 | $10,000 |
|---|
| 10/31/21 | $10,088 | $10,016 |
|---|
| 10/31/22 | $8,832 | $8,445 |
|---|
| 10/31/23 | $9,112 | $8,476 |
|---|
| 10/31/24 | $10,005 | $9,369 |
|---|
Average Annual Total Returns
| 1 Year | Since Inception (June 28, 2021) |
|---|
| LeaderShares Dynamic Yield ETF - NAV | 9.80% | 0.02% |
|---|
| Bloomberg U.S. Aggregate Bond Index | 10.55% | -1.93% |
|---|
The Fund's past performance is not a good predictor of how the Fund will perform in the future. The graph and table do not reflect the deduction of taxes that a shareholder would pay on fund distributions or redemption of fund shares.
| Net Assets | $68,079,841 |
|---|
| Number of Portfolio Holdings | 226 |
|---|
| Advisory Fee | $548,013 |
|---|
| Portfolio Turnover | 47% |
|---|
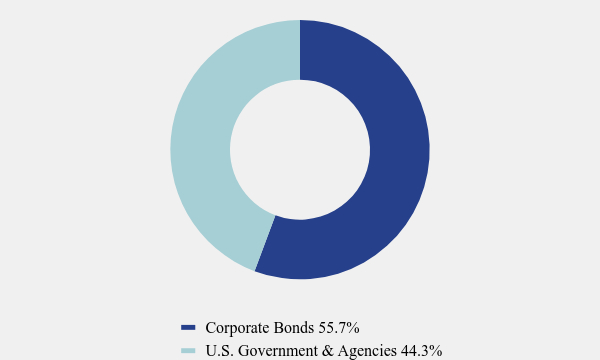
Asset Weighting (% of total investments)
| Value | Value |
|---|
| Corporate Bonds | 55.7% |
| U.S. Government & Agencies | 44.3% |
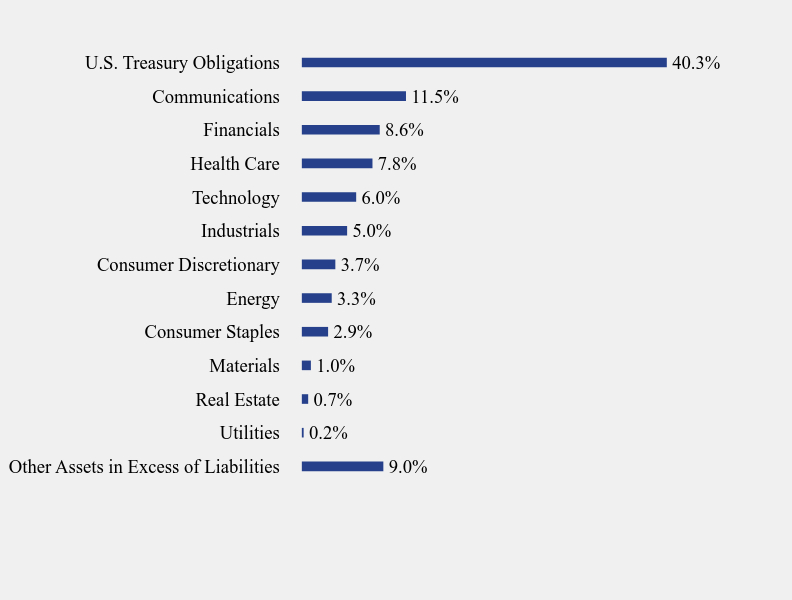
What did the Fund invest in?
Sector Weighting (% of net assets)
| Value | Value |
|---|
| Other Assets in Excess of Liabilities | 9.0% |
| Utilities | 0.2% |
| Real Estate | 0.7% |
| Materials | 1.0% |
| Consumer Staples | 2.9% |
| Energy | 3.3% |
| Consumer Discretionary | 3.7% |
| Industrials | 5.0% |
| Technology | 6.0% |
| Health Care | 7.8% |
| Financials | 8.6% |
| Communications | 11.5% |
| U.S. Treasury Obligations | 40.3% |
Top 10 Holdings (% of net assets)
| Holding Name | % of Net Assets |
| United States Treasury Bill, , 4.0500%, 11/07/24 | 35.4% |
| United States Treasury Note, , 1.5000%, 02/15/25 | 4.6% |
| Veritas US, Inc., , 7.5000%, 09/01/25 | 0.3% |
| DISH DBS Corporation, , 5.2500%, 12/01/26 | 0.3% |
| DISH DBS Corporation, , 5.7500%, 12/01/28 | 0.3% |
| DISH DBS Corporation, , 5.8750%, 11/15/24 | 0.3% |
| Tenneco, Inc., , 8.0000%, 11/17/28 | 0.3% |
| Bausch Health Companies, Inc., , 5.5000%, 11/01/25 | 0.3% |
| Condor Merger Sub, Inc., , 7.3750%, 02/15/30 | 0.3% |
| Cloud Software Group, Inc., , 9.0000%, 09/30/29 | 0.3% |
No material changes occurred during the year ended October 31, 2024.
LeaderShares Dynamic Yield ETF - Fund (DYLD)
Annual Shareholder Report - October 31, 2024
Where can I find additional information about the Fund?
Additional information is available on the Fund's website ( www.leadersharesetfs.com ), including its:
Prospectus
Financial information
Holdings
Proxy voting information
LeaderShares Equity Skew ETF
Annual Shareholder Report - October 31, 2024
This annual shareholder report contains important information about LeaderShares Equity Skew ETF for the period of November 1, 2023 to October 31, 2024. You can find additional information about the Fund at www.leadersharesetfs.com. You can also request this information by contacting us at 1-888-617-1444.
What were the Fund’s costs for the last year?
(based on a hypothetical $10,000 investment)
| Fund Name | Costs of a $10,000 investment | Costs paid as a percentage of a $10,000 investment |
|---|
| LeaderShares Equity Skew ETF | $84 | 0.75% |
How did the Fund perform during the reporting period?
During the LeaderShares® Equity Skew ETF’s (the “Fund”) fiscal year, risk markets extended their upward trajectory as the long-anticipated Federal Reserve rate cuts materialized, reigniting investor risk appetite and driving equity markets to all-time highs. Although favorable economic indicators and policy shifts helped buoy markets, concerns about potential recessions and geopolitical tensions introduced caution among investors.
The Fund posted a return of 22.73% (Source: Ultimus) during the period as compared to 38.02% for the S&P 500**. During the period, the Fund was invested in a portfolio of stocks and ETFs based on its quantitative selection methodology. The Fund is an active fund and does not track an index. Mega-cap tech stocks continue to boost market-cap weighted indices like the S&P 500 higher. The Fund’s overexposure to factors like emerging market equities drove the underperformance against the S&P 500 Index for the reporting period. However, systematic correlation to the overall U.S. equity market was as expected on both down and up trends. The Fund will continue to implement its disciplined quantitative stock selection process.
Capital markets are infinitely complex. Every day, new information becomes available that changes the risk and return dynamic of any investment. We do not attempt to forecast or suggest what may lie ahead. Instead, we utilize a quantitative approach, aiming to minimize the subjectivity of investing.
**Standard and Poor’s 500 Total Return Index is a capitalization-weighted index of 500 stocks. The index is designed to measure the performance of the broad domestic economy through changes in the aggregate market value of 500 stocks representing all major industries. Investors cannot invest directly in an index or benchmark. Index returns are gross of any fees, brokerage commissions or other expenses of investing.
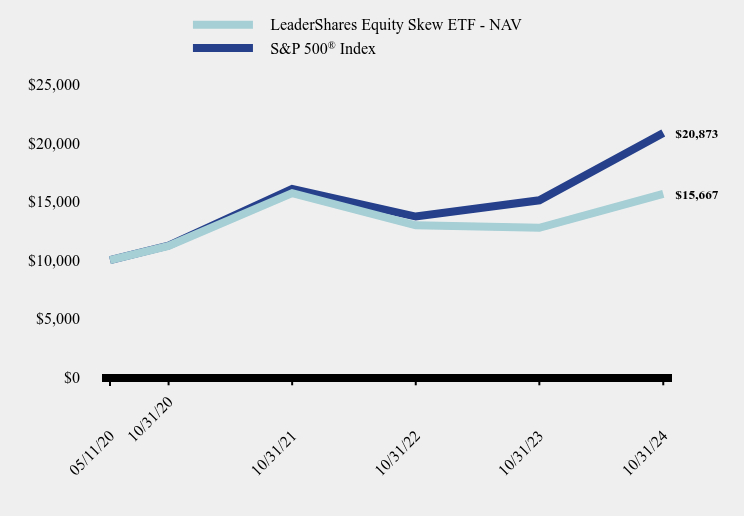
How has the Fund performed since inception?
Total Return Based on $10,000 Investment
| LeaderShares Equity Skew ETF - NAV | S&P 500® Index |
|---|
| 05/11/20 | $10,000 | $10,000 |
| 10/31/20 | $11,224 | $11,252 |
| 10/31/21 | $15,733 | $16,080 |
| 10/31/22 | $12,985 | $13,731 |
| 10/31/23 | $12,765 | $15,123 |
| 10/31/24 | $15,667 | $20,873 |
Average Annual Total Returns
| 1 Year | Since Inception (May 11, 2020) |
|---|
| LeaderShares Equity Skew ETF - NAV | 22.73% | 10.56% |
S&P 500® Index | 38.02% | 17.88% |
The Fund's past performance is not a good predictor of how the Fund will perform in the future. The graph and table do not reflect the deduction of taxes that a shareholder would pay on fund distributions or redemption of fund shares.
| Net Assets | $100,063,873 |
| Number of Portfolio Holdings | 5 |
| Advisory Fee | $896,976 |
| Portfolio Turnover | 190% |
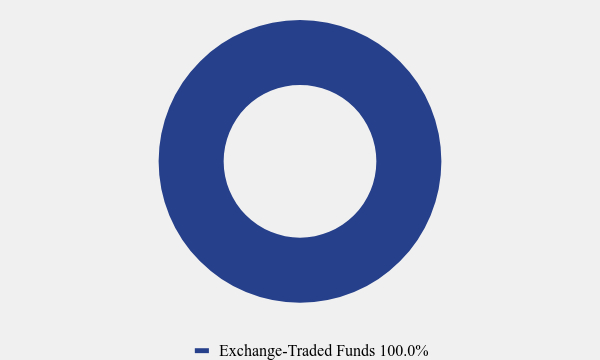
Asset Weighting (% of total investments)
| Value | Value |
|---|
| Exchange-Traded Funds | 100.0% |
What did the Fund invest in?
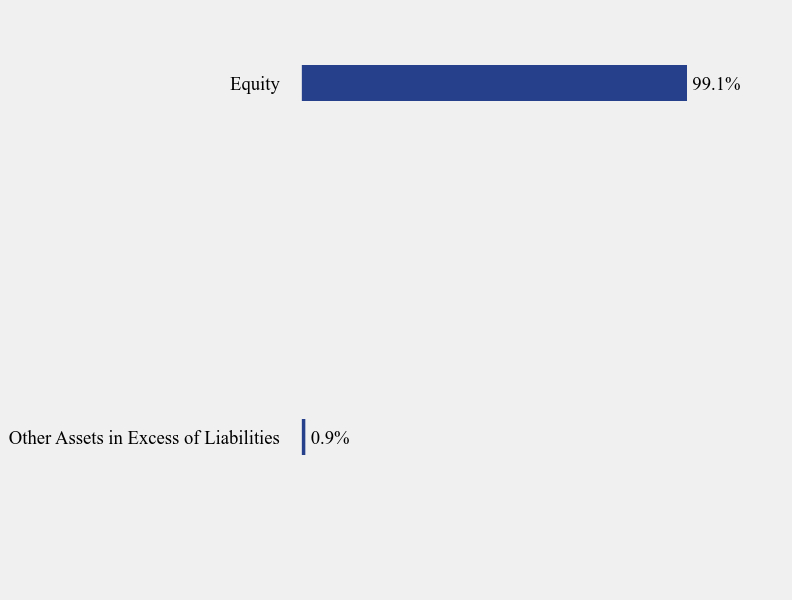
Sector Weighting (% of net assets)
| Value | Value |
|---|
| Other Assets in Excess of Liabilities | 0.9% |
| Equity | 99.1% |
Top 10 Holdings (% of net assets)
| Holding Name | % of Net Assets |
| SPDR S&P 600 Small Cap Value ETF, N | 42.7% |
| iShares Russell 2000 ETF | 35.8% |
| Vanguard FTSE Emerging Markets ETF | 13.7% |
| SPDR S&P 600 Small Cap Growth ETF | 3.9% |
| SPDR Portfolio S&P 500 Value ETF | 3.0% |
No material changes occurred during the year ended October 31, 2024.
LeaderShares Equity Skew ETF - Fund (SQEW)
Annual Shareholder Report - October 31, 2024
Where can I find additional information about the Fund?
Additional information is available on the Fund's website ( www.leadersharesetfs.com ), including its:
Prospectus
Financial information
Holdings
Proxy voting information
(b) Not applicable
Item 2. Code of Ethics.
| (a) | The registrant has, as of the end of the period covered by this report, adopted a code of ethics that applies to the registrant's principal executive officer, principal financial officer, and principal accounting officer or controller, or persons performing similar functions, regardless of whether these individuals are employed by the registrant or a third party. |
(b) (c) | N/A During the period covered by this report, there were no amendments to any provision of the code of ethics. |
(d) (e) (f) | During the period covered by this report, there were no waivers or implicit waivers of a provision of the code of ethics. N/A See Item 19(a)(1) |
Item 3. Audit Committee Financial Expert.
| | (a)(1) The Registrant’s board of trustees has determined that Mark Gersten and Neil M. Kaufman are audit committee financial experts, as defined in Item 3 of Form N-CSR. Mr. Mark Gersten and Mr. Neil M. Kaufman are independent for purposes of this Item 3. (a)(2) Not applicable. (a)(3) Not applicable. |
Item 4. Principal Accountant Fees and Services.
| (a) | Audit Fees. The aggregate fees billed for each of the last two fiscal years for professional services rendered by the registrant's principal accountant for the audit of the registrant's annual financial statements or services that are normally provided by the accountant in connection with statutory and regulatory filings or engagements for those fiscal years are as follows: |
Audit Fees
| Trust Series | 2024 | 2023 |
| LeaderShares AlphaFactor US Core Equity ETF | $14,250 | $13,200 |
| LeaderShares Activist Leaders ETF | $14,250 | $13,200 |
| LeaderShares AlphaFactor Tactical Focused ETF | $14,250 | $13,200 |
| LeaderShares Equity Skew ETF | $15,300 | $13,200 |
| LeaderShares Dynamic Yield ETF | $14,250 | $13,200 |
| (b) | Audit-Related Fees. There were no fees billed in each of the last two fiscal years for assurances and related services by the principal accountant that are reasonably related to the performance of the audit of the registrant’s financial statements and are not reported under paragraph (a) of this Item. |
| (c) | Tax Fees. The aggregate fees billed in each of the last two fiscal years for professional services rendered by the principal accountant for tax compliance are as follows: |
Tax Fees
| Trust Series | 2024 | 2023 |
| LeaderShares AlphaFactor US Core Equity ETF | $3,200 | $3,200 |
| LeaderShares Activist Leaders ETF | $3,200 | $3,200 |
| LeaderShares AlphaFactor Tactical Focused ETF | $3,200 | $3,200 |
| LeaderShares Equity Skew ETF | $3,200 | $3,200 |
| LeaderShares Dynamic Yield ETF | $3,200 | $3,200 |
Preparation of Federal & State income tax returns, assistance with calculation of required income, capital gain and excise distributions and preparation of Federal excise tax returns.
| (d) | All Other Fees. The aggregate fees billed in each of the last two fiscal years for products and services provided by the registrant’s principal accountant, other than the services reported in paragraphs (a) through (c) of this item were $0 and $0 for the fiscal years ended October 31, 2024 and 2023 respectively. |
| (e)(1) | The registrant’s Audit Committee is required to pre-approve all audit services and, when appropriate, any non-audit services (including audit-related, tax and all other services) to the registrant. The registrant’s Audit Committee also is required to pre-approve, when appropriate, any non-audit services (including audit-related, tax and all other services) to its adviser, or any entity controlling, controlled by or under common control with the adviser that provides ongoing services to the registrant, to the extent that the services may be determined to have an impact on the operations or financial reporting of the registrant. Services are reviewed on an engagement by engagement basis by the Audit Committee. |
| (e)(2) | There were no services described in each of paragraphs (b) through (d) of this Item that were approved by the audit committee pursuant to paragraph (c)(7)(i)(C) of Rule 2-01 of Regulation S-X. |
| (f) | During the audit of registrant's financial statements for the most recent fiscal year, less than 50 percent of the hours expended on the principal accountant's engagement were attributed to work performed by persons other than the principal accountant's full-time, permanent employees. |
| (g) | The aggregate non-audit fees billed by the registrant's accountant for services rendered to the registrant, and rendered to the registrant's investment adviser (not including any sub-adviser whose role is primarily portfolio management and is subcontracted with or overseen by another investment adviser), and any entity controlling, controlled by, or under common control with the adviser that provides ongoing services to the registrant: 2024 - None 2023 - None |
| (h) | The registrant's audit committee has considered whether the provision of non-audit services to the registrant's investment adviser (not including any sub-adviser whose role is primarily portfolio management and is subcontracted with or overseen by another investment adviser), and any entity controlling, controlled by, or under common control with the investment adviser that provides ongoing services to the registrant, that were not pre-approved pursuant to paragraph (c)(7)(ii) of Rule 2-01 of Regulation S-X, is compatible with maintaining the principal accountant's independence. |
| (i) | Not applicable. |
| (j) | Not applicable. |
Item 5. Audit Committee of Listed Registrants.
Not Applicable.
Item 6. Investments.
The Registrant’s schedule of investments in unaffiliated issuers is included in the Financial Statements under Item 7 of this form.
Item 7. Financial Statements and Financial Highlights for Open-End Management Investment Companies.

| LEADERSHARES ACTIVIST LEADERS ETF |
| SCHEDULE OF INVESTMENTS |
| October 31, 2024 |
| |
| Shares | | | | | Fair Value | |
| | | | | COMMON STOCKS — 99.1% | | | | |
| | | | | AEROSPACE & DEFENSE - 3.7% | | | | |
| | 79,971 | | | Mercury Systems, Inc.(a) | | $ | 2,587,062 | |
| | | | | | | | | |
| | | | | ASSET MANAGEMENT - 7.6% | | | | |
| | 153,131 | | | Invesco Ltd. | | | 2,655,292 | |
| | 64,641 | | | Janus Henderson Group plc | | | 2,670,319 | |
| | | | | | | | 5,325,611 | |
| | | | | AUTOMOTIVE - 3.7% | | | | |
| | 343,532 | | | Dana, Inc. | | | 2,634,890 | |
| | | | | | | | | |
| | | | | BANKING - 0.7% | | | | |
| | 30,935 | | | Banc of California, Inc. | | | 475,162 | |
| | | | | | | | | |
| | | | | BIOTECH & PHARMA - 7.5% | | | | |
| | 291,419 | | | Bausch Health Companies, Inc.(a) | | | 2,681,055 | |
| | 135,333 | | | Innoviva, Inc.(a) | | | 2,647,113 | |
| | | | | | | | 5,328,168 | |
| | | | | CHEMICALS - 0.7% | | | | |
| | 4,715 | | | Rogers Corporation(a) | | | 472,820 | |
| | | | | | | | | |
| | | | | COMMERCIAL SUPPORT SERVICES - 7.4% | | | | |
| | 380,094 | | | Alight, Inc., Class A(a) | | | 2,634,051 | |
| | 194,920 | | | Vestis Corporation | | | 2,635,319 | |
| | | | | | | | 5,269,370 | |
| | | | | CONSTRUCTION MATERIALS - 0.7% | | | | |
| | 16,521 | | | MDU Resources Group, Inc. | | | 476,631 | |
| | | | | | | | | |
| | | | | CONSUMER SERVICES - 0.7% | | | | |
| | 16,198 | | | Upbound Group, Inc. | | | 473,630 | |
| | | | | | | | | |
| | | | | E-COMMERCE DISCRETIONARY - 0.7% | | | | |
| | 9,262 | | | Etsy, Inc.(a) | | | 476,437 | |
| | | | | | | | | |
| | | | | ELECTRIC UTILITIES - 4.5% | | | | |
| | 548,725 | | | Algonquin Power & Utilities Corporation | | | 2,655,828 | |
| | | | | | | | | |
See accompanying notes which are an integral part of these financial statements.
| LEADERSHARES ACTIVIST LEADERS ETF |
| SCHEDULE OF INVESTMENTS (Continued) |
| October 31, 2024 |
| |
| Shares | | | | | Fair Value | |
| | | | | COMMON STOCKS — 99.1% (Continued) | | | | |
| | | | | ELECTRIC UTILITIES - 4.5% (Continued) | | | | |
| | 23,657 | | | PG&E Corporation | | $ | 478,345 | |
| | | | | | | | 3,134,173 | |
| | | | | FOOD - 7.6% | | | | |
| | 34,291 | | | Lamb Weston Holdings, Inc. | | | 2,664,067 | |
| | 72,655 | | | TreeHouse Foods, Inc.(a) | | | 2,643,189 | |
| | | | | | | | 5,307,256 | |
| | | | | GAS & WATER UTILITIES - 3.8% | | | | |
| | 36,047 | | | Southwest Gas Holdings, Inc. | | | 2,640,443 | |
| | | | | | | | | |
| | | | | HEALTH CARE FACILITIES & SERVICES - 4.5% | | | | |
| | 8,191 | | | Catalent, Inc.(a) | | | 479,993 | |
| | 157,622 | | | Fortrea Holdings, Inc.(a) | | | 2,651,202 | |
| | | | | | | | 3,131,195 | |
| | | | | HOME CONSTRUCTION - 0.7% | | | | |
| | 6,120 | | | KB Home | | | 480,420 | |
| | | | | | | | | |
| | | | | INFRASTRUCTURE REIT - 0.7% | | | | |
| | 93,166 | | | Uniti Group, Inc. | | | 472,352 | |
| | | | | | | | | |
| | | | | INTERNET MEDIA & SERVICES - 5.8% | | | | |
| | 3,084 | | | Expedia Group, Inc.(a) | | | 482,060 | |
| | 2,867 | | | GoDaddy, Inc., Class A(a) | | | 478,216 | |
| | 72,904 | | | Match Group, Inc.(a) | | | 2,626,731 | |
| | 14,997 | | | Pinterest, Inc., Class A(a) | | | 476,755 | |
| | | | | | | | 4,063,762 | |
| | | | | LEISURE FACILITIES & SERVICES - 10.2% | | | | |
| | 159,416 | | | Bloomin’ Brands, Inc. | | | 2,644,712 | |
| | 8,528 | | | Chipotle Mexican Grill, Inc.(a) | | | 475,607 | |
| | 16,163 | | | Cinemark Holdings, Inc.(a) | | | 480,849 | |
| | 13,067 | | | MGM Resorts International(a) | | | 481,780 | |
| | 38,159 | | | Restaurant Brands International, Inc. | | | 2,653,959 | |
| | 25,377 | | | Wendy’s Company (The) | | | 484,954 | |
| | | | | | | | 7,221,861 | |
| | | | | | | | | |
See accompanying notes which are an integral part of these financial statements.
| LEADERSHARES ACTIVIST LEADERS ETF |
| SCHEDULE OF INVESTMENTS (Continued) |
| October 31, 2024 |
| |
| Shares | | | | | Fair Value | |
| | | | | COMMON STOCKS — 99.1% (Continued) | | | | |
| | | | | MEDICAL EQUIPMENT & DEVICES - 0.7% | | | | |
| | 6,550 | | | Solventum Corporation(a) | | $ | 475,399 | |
| | | | | | | | | |
| | | | | OIL & GAS PRODUCERS - 1.4% | | | | |
| | 29,861 | | | CVR Energy, Inc. | | | 474,790 | |
| | 12,846 | | | Suncor Energy, Inc. | | | 485,193 | |
| | | | | | | | 959,983 | |
| | | | | PUBLISHING & BROADCASTING - 0.7% | | | | |
| | 16,557 | | | News Corporation, Class B | | | 480,815 | |
| | | | | | | | | |
| | | | | REAL ESTATE OWNERS & DEVELOPERS - 3.8% | | | | |
| | 34,848 | | | Howard Hughes Holdings, Inc.(a) | | | 2,649,842 | |
| | | | | | | | | |
| | | | | RETAIL - DISCRETIONARY - 0.7% | | | | |
| | 13,473 | | | Advance Auto Parts, Inc. | | | 480,851 | |
| | | | | | | | | |
| | | | | SEMICONDUCTORS - 0.7% | | | | |
| | 36,256 | | | Wolfspeed, Inc.(a) | | | 482,567 | |
| | | | | | | | | |
| | | | | SOFTWARE - 4.6% | | | | |
| | 16,569 | | | Gen Digital, Inc. | | | 482,324 | |
| | 65,598 | | | Rapid7, Inc.(a) | | | 2,651,470 | |
| | | | | | | | 3,133,794 | |
| | | | | TECHNOLOGY HARDWARE - 1.3% | | | | |
| | 17,899 | | | NCR Atleos Corporation(a) | | | 468,596 | |
| | 36,796 | | | NCR Voyix Corporation(a) | | | 471,357 | |
| | | | | | | | 939,953 | |
| | | | | TECHNOLOGY SERVICES - 3.7% | | | | |
| | 14,978 | | | Insight Enterprises, Inc.(a) | | | 2,619,952 | |
| | | | | | | | | |
| | | | | TELECOMMUNICATIONS - 2.1% | | | | |
| | 30,562 | | | DigitalBridge Group, Inc. | | | 479,518 | |
| | 13,420 | | | Frontier Communications Parent, Inc.(a) | | | 479,497 | |
| | 16,206 | | | Telephone and Data Systems, Inc. | | | 482,128 | |
| | | | | | | | 1,441,143 | |
| | | | | | | | | |
See accompanying notes which are an integral part of these financial statements.
| LEADERSHARES ACTIVIST LEADERS ETF |
| SCHEDULE OF INVESTMENTS (Continued) |
| October 31, 2024 |
| |
| Shares | | | | | Fair Value | |
| | | | | COMMON STOCKS — 99.1% (Continued) | | | | |
| | | | | TRANSPORTATION & LOGISTICS - 7.5% | | | | |
| | 456,374 | | | JetBlue Airways Corporation(a) | | $ | 2,601,332 | |
| | 85,800 | | | Southwest Airlines Company | | | 2,623,764 | |
| | | | | | | | 5,225,096 | |
| | | | | WHOLESALE - CONSUMER STAPLES - 0.7% | | | | |
| | 12,117 | | | Chefs’ Warehouse, Inc. (The)(a) | | | 483,711 | |
| | | | | | | | | |
| | | | | TOTAL COMMON STOCKS (Cost $71,771,964) | | | 69,344,349 | |
| | | | | | | | | |
| | | | | TOTAL INVESTMENTS - 99.1% (Cost $71,771,964) | | $ | 69,344,349 | |
| | | | | OTHER ASSETS IN EXCESS OF LIABILITIES - 0.9% | | | 625,751 | |
| | | | | NET ASSETS - 100.0% | | $ | 69,970,100 | |
| | | | | | | | | |
| LTD | - Limited Company |
| | |
| PLC | - Public Limited Company |
| | |
| REIT | - Real Estate Investment Trust |
| (a) | Non-income producing security |
| | |
See accompanying notes which are an integral part of these financial statements.
| SCHEDULE OF INVESTMENTS |
| LEADERSHARES ACTIVIST LEADERS ETF |
| OCTOBER 31, 2024 |
| |
| Diversification of Assets |
| Country | | % of Net Assets | |
| United States | | | 79.4 | % |
| Canada | | | 12.1 | % |
| Bermuda | | | 3.8 | % |
| Jersey | | | 3.8 | % |
| Total | | | 99.1 | % |
| Other Assets Less Liabilities - Net | | | 0.9 | % |
| Grand Total | | | 100.0 | % |
| | | | | |
See accompanying notes which are an integral part of these financial statements.
| LEADERSHARES ALPHAFACTOR TACTICAL FOCUSED ETF |
| SCHEDULE OF INVESTMENTS |
| October 31, 2024 |
| |
| Shares | | | | | Fair Value | |
| | | | | COMMON STOCKS — 99.0% | | | | |
| | | | | BIOTECH & PHARMA - 7.0% | | | | |
| | 80,235 | | | Bristol-Myers Squibb Company | | $ | 4,474,706 | |
| | 25,615 | | | Johnson & Johnson | | | 4,094,814 | |
| | | | | | | | 8,569,520 | |
| | | | | CABLE & SATELLITE - 3.5% | | | | |
| | 99,111 | | | Comcast Corporation, Class A | | | 4,328,177 | |
| | | | | | | | | |
| | | | | CHEMICALS - 3.2% | | | | |
| | 46,565 | | | DuPont de Nemours, Inc. | | | 3,864,429 | |
| | | | | | | | | |
| | | | | COMMERCIAL SUPPORT SERVICES - 6.5% | | | | |
| | 568,922 | | | ADT, Inc. | | | 4,096,238 | |
| | 64,664 | | | H&R Block, Inc. | | | 3,862,381 | |
| | | | | | | | 7,958,619 | |
| | | | | E-COMMERCE DISCRETIONARY - 3.0% | | | | |
| | 63,276 | | | eBay, Inc. | | | 3,639,002 | |
| | | | | | | | | |
| | | | | ELECTRIC UTILITIES - 6.9% | | | | |
| | 49,576 | | | SEMPRA | | | 4,133,151 | |
| | 34,495 | | | Vistra Corporation | | | 4,310,495 | |
| | | | | | | | 8,443,646 | |
| | | | | ENTERTAINMENT CONTENT - 3.4% | | | | |
| | 106,461 | | | Fox Corporation - Class B, CLASS B | | | 4,147,721 | |
| | | | | | | | | |
| | | | | FOOD - 6.8% | | | | |
| | 91,017 | | | Pilgrim’s Pride Corporation(a) | | | 4,408,864 | |
| | 35,826 | | | Post Holdings, Inc.(a) | | | 3,912,557 | |
| | | | | | | | 8,321,421 | |
| | | | | HEALTH CARE FACILITIES & SERVICES - 6.3% | | | | |
| | 55,111 | | | Centene Corporation(a) | | | 3,431,211 | |
| | 18,540 | | | Labcorp Holdings, Inc. | | | 4,232,126 | |
| | | | | | | | 7,663,337 | |
| | | | | HOUSEHOLD PRODUCTS - 3.2% | | | | |
| | 43,744 | | | Spectrum Brands Holdings, Inc. | | | 3,920,337 | |
| | | | | | | | | |
See accompanying notes which are an integral part of these financial statements.
| LEADERSHARES ALPHAFACTOR TACTICAL FOCUSED ETF |
| SCHEDULE OF INVESTMENTS (Continued) |
| October 31, 2024 |
| |
| Shares | | | | | Fair Value | |
| | | | | COMMON STOCKS — 99.0% (Continued) | | | | |
| | | | | INSTITUTIONAL FINANCIAL SERVICES - 3.5% | | | | |
| | 67,140 | | | Jefferies Financial Group, Inc. | | $ | 4,295,617 | |
| | | | | | | | | |
| | | | | LEISURE FACILITIES & SERVICES - 10.5% | | | | |
| | 17,905 | | | Hilton Worldwide Holdings, Inc. | | | 4,204,989 | |
| | 16,594 | | | Marriott International, Inc., Class A | | | 4,314,772 | |
| | 89,421 | | | Travel + Leisure Company | | | 4,275,218 | |
| | | | | | | | 12,794,979 | |
| | | | | MACHINERY - 3.3% | | | | |
| | 9,917 | | | Deere & Company | | | 4,013,311 | |
| | | | | | | | | |
| | | | | OIL & GAS PRODUCERS - 9.2% | | | | |
| | 92,748 | | | HF Sinclair Corporation | | | 3,581,000 | |
| | 25,454 | | | Marathon Petroleum Corporation | | | 3,702,793 | |
| | 30,565 | | | Valero Energy Corporation | | | 3,966,115 | |
| | | | | | | | 11,249,908 | |
| | | | | PUBLISHING & BROADCASTING - 3.6% | | | | |
| | 24,840 | | | Nexstar Media Group, Inc. | | | 4,369,853 | |
| | | | | | | | | |
| | | | | RETAIL - DISCRETIONARY - 3.2% | | | | |
| | 19,933 | | | Dick’s Sporting Goods, Inc. | | | 3,901,885 | |
| | | | | | | | | |
| | | | | SELF-STORAGE REIT - 2.9% | | | | |
| | 85,498 | | | National Storage Affiliates Trust | | | 3,603,741 | |
| | | | | | | | | |
| | | | | SOFTWARE - 3.6% | | | | |
| | 136,002 | | | Teradata Corporation(a) | | | 4,383,344 | |
| | | | | | | | | |
| | | | | SPECIALTY FINANCE - 3.3% | | | | |
| | 161,500 | | | MGIC Investment Corporation | | | 4,043,960 | |
| | | | | | | | | |
| | | | | TECHNOLOGY HARDWARE - 3.0% | | | | |
| | 30,995 | | | Arrow Electronics, Inc.(a) | | | 3,678,177 | |
| | | | | | | | | |
See accompanying notes which are an integral part of these financial statements.
| LEADERSHARES ALPHAFACTOR TACTICAL FOCUSED ETF |
| SCHEDULE OF INVESTMENTS (Continued) |
| October 31, 2024 |
| |
| Shares | | | | | Fair Value | |
| | | | | COMMON STOCKS — 99.0% (Continued) | | | | |
| | | | | TRANSPORTATION & LOGISTICS - 3.1% | | | | |
| | 31,485 | | | Expeditors International of Washington, Inc. | | $ | 3,746,715 | |
| | | | | | | | | |
| | | | | TOTAL COMMON STOCKS (Cost $107,342,086) | | | 120,937,699 | |
| | | | | | | | | |
| | | | | TOTAL INVESTMENTS - 99.0% (Cost $107,342,086) | | $ | 120,937,699 | |
| | | | | OTHER ASSETS IN EXCESS OF LIABILITIES - 1.0% | | | 1,257,861 | |
| | | | | NET ASSETS - 100.0% | | $ | 122,195,560 | |
| | | | | | | | | |
| REIT | - Real Estate Investment Trust |
| (a) | Non-income producing security. |
| | |
See accompanying notes which are an integral part of these financial statements.
| LEADERSHARES ALPHAFACTOR US CORE EQUITY ETF |
| SCHEDULE OF INVESTMENTS |
| October 31, 2024 |
| |
| Shares | | | | | Fair Value | |
| | | | | COMMON STOCKS — 99.0% | | | | |
| | | | | AEROSPACE & DEFENSE - 2.7% | | | | |
| | 2,694 | | | Lockheed Martin Corporation, B | | $ | 1,471,058 | |
| | 17,790 | | | Textron, Inc. | | | 1,430,672 | |
| | 9,184 | | | Woodward, Inc. | | | 1,507,002 | |
| | | | | | | | 4,408,732 | |
| | | | | APPAREL & TEXTILE PRODUCTS - 3.7% | | | | |
| | 18,928 | | | Columbia Sportswear Company | | | 1,523,136 | |
| | 10,841 | | | Crocs, Inc.(a) | | | 1,168,877 | |
| | 15,505 | | | PVH Corporation | | | 1,526,622 | |
| | 8,061 | | | Ralph Lauren Corporation | | | 1,595,514 | |
| | | | | | | | 5,814,149 | |
| | | | | ASSET MANAGEMENT - 3.3% | | | | |
| | 8,848 | | | Affiliated Managers Group, Inc. | | | 1,715,627 | |
| | 3,344 | | | Ameriprise Financial, Inc. | | | 1,706,443 | |
| | 80,967 | | | Blue Owl Capital, Inc. | | | 1,810,423 | |
| | | | | | | | 5,232,493 | |
| | | | | AUTOMOTIVE - 1.1% | | | | |
| | 34,903 | | | General Motors Company | | | 1,771,676 | |
| | | | | | | | | |
| | | | | BEVERAGES - 0.9% | | | | |
| | 1,198 | | | Coca-Cola Consolidated, Inc. | | | 1,346,863 | |
| | | | | | | | | |
| | | | | BIOTECH & PHARMA - 2.3% | | | | |
| | 60,501 | | | Exelixis, Inc.(a) | | | 2,008,634 | |
| | 4,388 | | | United Therapeutics Corporation(a) | | | 1,640,980 | |
| | | | | | | | 3,649,614 | |
| | | | | CHEMICALS - 0.9% | | | | |
| | 17,615 | | | DuPont de Nemours, Inc. | | | 1,461,869 | |
| | | | | | | | | |
| | | | | COMMERCIAL SUPPORT SERVICES - 0.9% | | | | |
| | 24,557 | | | H&R Block, Inc. | | | 1,466,790 | |
| | | | | | | | | |
| | | | | CONSTRUCTION MATERIALS - 2.9% | | | | |
| | 9,865 | | | Advanced Drainage Systems, Inc. | | | 1,478,566 | |
| | 3,500 | | | Carlisle Companies, Inc. | | | 1,477,805 | |
| | | | | | | | | |
See accompanying notes which are an integral part of these financial statements.
| LEADERSHARES ALPHAFACTOR US CORE EQUITY ETF |
| SCHEDULE OF INVESTMENTS (Continued) |
| October 31, 2024 |
| |
| Shares | | | | | Fair Value | |
| | | | | COMMON STOCKS — 99.0% (Continued) | | | | |
| | | | | CONSTRUCTION MATERIALS - 2.9% (Continued) | | | | |
| | 5,436 | | | Eagle Materials, Inc. | | $ | 1,551,762 | |
| | | | | | | | 4,508,133 | |
| | | | | CONSUMER SERVICES - 1.0% | | | | |
| | 10,978 | | | Grand Canyon Education, Inc.(a) | | | 1,505,194 | |
| | | | | | | | | |
| | | | | CONTAINERS & PACKAGING - 1.0% | | | | |
| | 53,005 | | | Graphic Packaging Holding Company | | | 1,497,921 | |
| | | | | | | | | |
| | | | | E-COMMERCE DISCRETIONARY - 0.9% | | | | |
| | 23,995 | | | eBay, Inc. | | | 1,379,952 | |
| | | | | | | | | |
| | | | | ELECTRIC UTILITIES - 1.1% | | | | |
| | 13,160 | | | Vistra Corporation | | | 1,644,474 | |
| | | | | | | | | |
| | | | | ELECTRICAL EQUIPMENT - 1.1% | | | | |
| | 14,379 | | | AAON, Inc. | | | 1,642,369 | |
| | | | | | | | | |
| | | | | ENGINEERING & CONSTRUCTION - 1.9% | | | | |
| | 23,988 | | | KBR, Inc. | | | 1,607,436 | |
| | 3,828 | | | TopBuild Corporation(a) | | | 1,352,739 | |
| | | | | | | | 2,960,175 | |
| | | | | ENTERTAINMENT CONTENT - 1.0% | | | | |
| | 37,013 | | | Fox Corporation, Class A | | | 1,554,546 | |
| | | | | | | | | |
| | | | | FOOD - 0.9% | | | | |
| | 13,589 | | | Post Holdings, Inc.(a) | | | 1,484,055 | |
| | | | | | | | | |
| | | | | FORESTRY, PAPER & WOOD PRODUCTS - 0.9% | | | | |
| | 14,446 | | | Louisiana-Pacific Corporation | | | 1,428,709 | |
| | | | | | | | | |
| | | | | HEALTH CARE FACILITIES & SERVICES - 3.6% | | | | |
| | 4,527 | | | Cigna Group (The) | | | 1,425,145 | |
| | 9,605 | | | DaVita, Inc.(a) | | | 1,342,875 | |
| | 3,877 | | | HCA Healthcare, Inc. | | | 1,390,835 | |
| | | | | | | | | |
See accompanying notes which are an integral part of these financial statements.
| LEADERSHARES ALPHAFACTOR US CORE EQUITY ETF |
| SCHEDULE OF INVESTMENTS (Continued) |
| October 31, 2024 |
| |
| Shares | | | | | Fair Value | |
| | | | | COMMON STOCKS — 99.0% (Continued) | | | | |
| | | | | HEALTH CARE FACILITIES & SERVICES - 3.6% (Continued) | | | | |
| | 9,515 | | | Tenet Healthcare Corporation(a) | | $ | 1,475,015 | |
| | | | | | | | 5,633,870 | |
| | | | | HOME CONSTRUCTION - 6.4% | | | | |
| | 17,457 | | | Fortune Brands Innovations, Inc. | | | 1,454,692 | |
| | 8,333 | | | Lennar Corporation, Class A | | | 1,419,110 | |
| | 18,616 | | | Masco Corporation | | | 1,487,605 | |
| | 9,720 | | | Mohawk Industries, Inc.(a) | | | 1,305,104 | |
| | 159 | | | NVR, Inc.(a) | | | 1,455,297 | |
| | 10,910 | | | PulteGroup, Inc. | | | 1,413,172 | |
| | 10,126 | | | Toll Brothers, Inc. | | | 1,482,851 | |
| | | | | | | | 10,017,831 | |
| | | | | HOUSEHOLD PRODUCTS - 0.9% | | | | |
| | 16,522 | | | Spectrum Brands Holdings, Inc. | | | 1,480,702 | |
| | | | | | | | | |
| | | | | INDUSTRIAL SUPPORT SERVICES - 1.0% | | | | |
| | 3,179 | | | Watsco, Inc. | | | 1,503,699 | |
| | | | | | | | | |
| | | | | INSTITUTIONAL FINANCIAL SERVICES - 1.0% | | | | |
| | 3,168 | | | Goldman Sachs Group, Inc. | | | 1,640,359 | |
| | | | | | | | | |
| | | | | INSURANCE - 9.2% | | | | |
| | 14,059 | | | Aflac, Inc. | | | 1,473,243 | |
| | 21,428 | | | American International Group, Inc. | | | 1,625,957 | |
| | 37,309 | | | Equitable Holdings, Inc. | | | 1,691,589 | |
| | 13,396 | | | Hartford Financial Services Group, Inc. (The) | | | 1,479,454 | |
| | 19,004 | | | MetLife, Inc. | | | 1,490,294 | |
| | 44,299 | | | Old Republic International Corporation | | | 1,547,364 | |
| | 5,893 | | | Primerica, Inc. | | | 1,631,241 | |
| | 26,611 | | | Unum Group | | | 1,707,893 | |
| | 27,809 | | | W R Berkley Corporation | | | 1,589,841 | |
| | | | | | | | 14,236,876 | |
| | | | | INTERNET MEDIA & SERVICES - 3.2% | | | | |
| | 9,507 | | | Alphabet, Inc., Class A | | | 1,626,743 | |
| | 370 | | | Booking Holdings, Inc. | | | 1,730,212 | |
| | | | | | | | | |
See accompanying notes which are an integral part of these financial statements.
| LEADERSHARES ALPHAFACTOR US CORE EQUITY ETF |
| SCHEDULE OF INVESTMENTS (Continued) |
| October 31, 2024 |
| |
| Shares | | | | | Fair Value | |
| | | | | COMMON STOCKS — 99.0% (Continued) | | | | |
| | | | | INTERNET MEDIA & SERVICES - 3.2% (Continued) | | | | |
| | 10,574 | | | Expedia Group, Inc.(a) | | $ | 1,652,822 | |
| | | | | | | | 5,009,777 | |
| | | | | LEISURE FACILITIES & SERVICES - 5.0% | | | | |
| | 6,774 | | | Hilton Worldwide Holdings, Inc. | | | 1,590,874 | |
| | 10,272 | | | Hyatt Hotels Corporation, Class A | | | 1,494,062 | |
| | 17,411 | | | Light & Wonder, Inc.(a) | | | 1,632,804 | |
| | 6,297 | | | Marriott International, Inc., Class A | | | 1,637,346 | |
| | 19,270 | | | Planet Fitness, Inc., A(a) | | | 1,513,080 | |
| | | | | | | | 7,868,166 | |
| | | | | MACHINERY - 1.0% | | | | |
| | 3,989 | | | Caterpillar, Inc. | | | 1,500,662 | |
| | | | | | | | | |
| | | | | MEDICAL EQUIPMENT & DEVICES - 0.9% | | | | |
| | 1,047 | | | Mettler-Toledo International, Inc.(a) | | | 1,352,462 | |
| | | | | | | | | |
| | | | | OIL & GAS PRODUCERS - 4.0% | | | | |
| | 9,643 | | | Marathon Petroleum Corporation | | | 1,402,767 | |
| | 3,171 | | | Murphy USA, Inc. | | | 1,548,875 | |
| | 11,942 | | | Phillips 66 | | | 1,454,774 | |
| | 10,678 | | | Targa Resources Corporation | | | 1,782,799 | |
| | | | | | | | 6,189,215 | |
| | | | | RETAIL - DISCRETIONARY - 5.7% | | | | |
| | 8,707 | | | AutoNation, Inc.(a) | | | 1,353,677 | |
| | 494 | | | AutoZone, Inc.(a) | | | 1,486,446 | |
| | 8,019 | | | Builders FirstSource, Inc.(a) | | | 1,374,457 | |
| | 7,930 | | | Ferguson Enterprises, Inc. | | | 1,560,148 | |
| | 5,780 | | | Lowe’s Companies, Inc. | | | 1,513,377 | |
| | 1,354 | | | O’Reilly Automotive, Inc.(a) | | | 1,561,352 | |
| | | | | | | | 8,849,457 | |
| | | | | RETAIL REIT - 1.0% | | | | |
| | 21,741 | | | Regency Centers Corporation | | | 1,553,177 | |
| | | | | | | | | |
See accompanying notes which are an integral part of these financial statements.
| LEADERSHARES ALPHAFACTOR US CORE EQUITY ETF |
| SCHEDULE OF INVESTMENTS (Continued) |
| October 31, 2024 |
| |
| Shares | | | | | Fair Value | |
| | | | | COMMON STOCKS — 99.0% (Continued) | | | | |
| | | | | SELF-STORAGE REIT - 0.9% | | | | |
| | 32,476 | | | National Storage Affiliates Trust | | $ | 1,368,863 | |
| | | | | | | | | |
| | | | | SOFTWARE - 5.2% | | | | |
| | 5,559 | | | Duolingo, Inc.(a) | | | 1,628,620 | |
| | 20,211 | | | Fortinet, Inc.(a) | | | 1,589,797 | |
| | 56,888 | | | Gen Digital, Inc. | | | 1,656,010 | |
| | 8,600 | | | Guidewire Software, Inc.(a) | | | 1,601,836 | |
| | 26,500 | | | Nutanix, Inc., Class A(a) | | | 1,645,650 | |
| | | | | | | | 8,121,913 | |
| | | | | SPECIALTY FINANCE - 3.1% | | | | |
| | 5,792 | | | American Express Company | | | 1,564,303 | |
| | 61,197 | | | MGIC Investment Corporation | | | 1,532,373 | |
| | 31,481 | | | Synchrony Financial | | | 1,735,863 | |
| | | | | | | | 4,832,539 | |
| | | | | STEEL - 2.0% | | | | |
| | 5,430 | | | Reliance, Inc. | | | 1,554,826 | |
| | 12,456 | | | Steel Dynamics, Inc. | | | 1,625,508 | |
| | | | | | | | 3,180,334 | |
| | | | | TECHNOLOGY HARDWARE - 3.0% | | | | |
| | 6,754 | | | Apple, Inc. | | | 1,525,796 | |
| | 13,105 | | | Jabil, Inc. | | | 1,613,094 | |
| | 13,068 | | | TD SYNNEX Corporation | | | 1,507,394 | |
| | | | | | | | 4,646,284 | |
| | | | | TECHNOLOGY SERVICES - 10.2% | | | | |
| | 7,303 | | | Broadridge Financial Solutions, Inc. | | | 1,539,911 | |
| | 5,003 | | | Corpay, Inc.(a) | | | 1,649,589 | |
| | 15,771 | | | Euronet Worldwide, Inc.(a) | | | 1,552,970 | |
| | 809 | | | Fair Isaac Corporation(a) | | | 1,612,426 | |
| | 18,797 | | | Fidelity National Information Services, Inc. | | | 1,686,655 | |
| | 8,725 | | | Fiserv, Inc.(a) | | | 1,726,678 | |
| | 3,101 | | | Gartner, Inc.(a) | | | 1,558,253 | |
| | 15,150 | | | Parsons Corporation(a) | | | 1,638,624 | |
| | 3,043 | | | S&P Global, Inc. | | | 1,461,735 | |
| | | | | | | | | |
See accompanying notes which are an integral part of these financial statements.
| LEADERSHARES ALPHAFACTOR US CORE EQUITY ETF |
| SCHEDULE OF INVESTMENTS (Continued) |
| October 31, 2024 |
| |
| Shares | | | | | Fair Value | |
| | | | | COMMON STOCKS — 99.0% (Continued) | | | | |
| | | | | TECHNOLOGY SERVICES - 10.2% (Continued) | | | | |
| | 11,247 | | | Science Applications International Corporation | | $ | 1,622,830 | |
| | | | | | | | 16,049,671 | |
| | | | | TELECOMMUNICATIONS - 1.1% | | | | |
| | 7,574 | | | T-Mobile US, Inc. | | | 1,690,214 | |
| | | | | | | | | |
| | | | | TOBACCO & CANNABIS - 1.1% | | | | |
| | 30,707 | | | Altria Group, Inc. | | | 1,672,303 | |
| | | | | | | | | |
| | | | | TRANSPORTATION EQUIPMENT - 1.0% | | | | |
| | 4,825 | | | Cummins, Inc. | | | 1,587,329 | |
| | | | | | | | | |
| | | | | TOTAL COMMON STOCKS (Cost $139,009,239) | | | 154,743,417 | |
| | | | | | | | | |
| | | | | TOTAL INVESTMENTS - 99.0% (Cost $139,009,239) | | $ | 154,743,417 | |
| | | | | OTHER ASSETS IN EXCESS OF LIABILITIES - 1.0% | | | 1,567,461 | |
| | | | | NET ASSETS - 100.0% | | $ | 156,310,878 | |
| | | | | | | | | |
| REIT | - Real Estate Investment Trust |
| | |
| (a) | Non-income producing security. |
| | |
See accompanying notes which are an integral part of these financial statements.
| LEADERSHARES EQUITY SKEW ETF |
| SCHEDULE OF INVESTMENTS |
| October 31, 2024 |
| |
| Shares | | | | | Fair Value | |
| | | | | EXCHANGE-TRADED FUNDS — 99.1% | | | | |
| | | | | EQUITY - 99.1% | | | | |
| | 164,544 | | | iShares Russell 2000 ETF | | $ | 35,831,101 | |
| | 57,574 | | | SPDR Portfolio S&P 500 Value ETF | | | 3,006,514 | |
| | 43,362 | | | SPDR S&P 600 Small Cap Growth ETF | | | 3,898,244 | |
| | 500,439 | | | SPDR S&P 600 Small Cap Value ETF | | | 42,697,456 | |
| | 295,395 | | | Vanguard FTSE Emerging Markets ETF | | | 13,756,545 | |
| | | | | | | | 99,189,860 | |
| | | | | | | | | |
| | | | | TOTAL EXCHANGE-TRADED FUNDS (Cost $99,269,635) | | | 99,189,860 | |
| | | | | | | | | |
| | | | | TOTAL INVESTMENTS - 99.1% (Cost $99,269,635) | | $ | 99,189,860 | |
| | | | | OTHER ASSETS IN EXCESS OF LIABILITIES - 0.9% | | | 874,013 | |
| | | | | NET ASSETS - 100.0% | | $ | 100,063,873 | |
| | | | | | | | | |
| ETF | - Exchange-Traded Fund |
| | |
| SPDR | - Standard & Poor’s Depositary Receipt |
| | |
See accompanying notes which are an integral part of these financial statements.
| LEADERSHARES DYNAMIC YIELD ETF |
| SCHEDULE OF INVESTMENTS |
| October 31, 2024 |
| |
| Principal | | | | | | | Coupon Rate | | | | | |
| Amount ($) | | | | | Spread | | (%) | | Maturity | | Fair Value | |
| | | | | CORPORATE BONDS — 50.7% | | | | | | | | | | |
| | | | | AEROSPACE & DEFENSE — 2.6% | | | | | | | | | | |
| | 145,000 | | | Boeing Company (The) | | | | 4.8750 | | 05/01/25 | | $ | 144,697 | |
| | 156,000 | | | Boeing Company (The) | | | | 2.1960 | | 02/04/26 | | | 150,276 | |
| | 145,000 | | | Boeing Company (The) | | | | 5.1500 | | 05/01/30 | | | 143,134 | |
| | 146,000 | | | Boeing Company (The) | | | | 5.7050 | | 05/01/40 | | | 140,503 | |
| | 147,000 | | | Boeing Company (The) | | | | 5.8050 | | 05/01/50 | | | 138,870 | |
| | 149,000 | | | Boeing Company (The) | | | | 5.9300 | | 05/01/60 | | | 139,092 | |
| | 84,000 | | | Bombardier, Inc.(a) | | | | 7.8750 | | 04/15/27 | | | 84,218 | |
| | 152,000 | | | RTX Corporation | | | | 4.1250 | | 11/16/28 | | | 148,693 | |
| | 173,000 | | | RTX Corporation | | | | 4.5000 | | 06/01/42 | | | 154,093 | |
| | 166,000 | | | TransDigm, Inc. | | | | 5.5000 | | 11/15/27 | | | 164,652 | |
| | 158,000 | | | TransDigm, Inc.(a) | | | | 6.7500 | | 08/15/28 | | | 161,700 | |
| | 158,000 | | | TransDigm, Inc.(a) | | | | 6.8750 | | 12/15/30 | | | 162,324 | |
| | | | | | | | | | | | | | 1,732,252 | |
| | | | | AUTOMOTIVE — 0.5% | | | | | | | | | | |
| | 157,000 | | | Clarios Global, L.P. / Clarios US Finance Company(a) | | | | 8.5000 | | 05/15/27 | | | 158,049 | |
| | 199,000 | | | Tenneco, Inc.(a) | | | | 8.0000 | | 11/17/28 | | | 184,410 | |
| | | | | | | | | | | | | | 342,459 | |
| | | | | BANKING — 6.2% | | | | | | | | | | |
| | 162,000 | | | Bank of America Corporation(b) | | SOFRRATE + 0.960% | | 1.7340 | | 07/22/27 | | | 153,815 | |
| | 159,000 | | | Bank of America Corporation(b) | | TSFR3M + 1.302% | | 3.4190 | | 12/20/28 | | | 152,420 | |
| | 154,000 | | | Bank of America Corporation Series N(b) | | TSFR3M + 1.572% | | 4.2710 | | 07/23/29 | | | 150,821 | |
| | 158,000 | | | Bank of America Corporation(b) | | TSFR3M + 1.472% | | 3.9740 | | 02/07/30 | | | 152,061 | |
| | 179,000 | | | Bank of America Corporation(b) | | TSFR3M + 1.252% | | 2.4960 | | 02/13/31 | | | 158,268 | |
| | 184,000 | | | Bank of America Corporation(b) | | SOFRRATE + 1.320% | | 2.6870 | | 04/22/32 | | | 159,590 | |
| | 216,000 | | | Bank of America Corporation(b) | | SOFRRATE + 1.930% | | 2.6760 | | 06/19/41 | | | 154,545 | |
| | 206,000 | | | Bank of America Corporation(b) | | SOFRRATE + 1.580% | | 3.3110 | | 04/22/42 | | | 159,291 | |
| | 191,000 | | | Bank of America Corporation B(b) | | TSFR3M + 3.412% | | 4.0830 | | 03/20/51 | | | 156,874 | |
| | 149,000 | | | Citigroup, Inc.(b) | | SOFRRATE + 2.842% | | 3.1060 | | 04/08/26 | | | 147,713 | |
| | 151,000 | | | Citigroup, Inc. | | | | 4.4500 | | 09/29/27 | | | 149,020 | |
| | 154,000 | | | Citigroup, Inc.(b) | | SOFRRATE + 3.914% | | 4.4120 | | 03/31/31 | | | 149,129 | |
| | 176,000 | | | Citigroup, Inc.(b) | | SOFRRATE + 2.107% | | 2.5720 | | 06/03/31 | | | 154,394 | |
| | | | | | | | | | | | | | | |
See accompanying notes which are an integral part of these financial statements.
| LEADERSHARES DYNAMIC YIELD ETF |
| SCHEDULE OF INVESTMENTS (Continued) |
| October 31, 2024 |
| |
| Principal | | | | | | | Coupon Rate | | | | | |
| Amount ($) | | | | | Spread | | (%) | | Maturity | | Fair Value | |
| | | | | CORPORATE BONDS — 50.7% (Continued) | | | | | | | | | | |
| | | | | BANKING — 6.2% (Continued) | | | | | | | | | | |
| | 153,000 | | | JPMorgan Chase & Company(b) | | SOFRRATE + 1.850% | | 2.0830 | | 04/22/26 | | $ | 150,885 | |
| | 161,000 | | | JPMorgan Chase & Company(b) | | SOFRRATE + 0.885% | | 1.5780 | | 04/22/27 | | | 153,697 | |
| | 171,000 | | | JPMorgan Chase & Company(b) | | TSFR3M + 1.510% | | 2.7390 | | 10/15/30 | | | 154,755 | |
| | 153,000 | | | JPMorgan Chase & Company(b) | | TSFR3M + 3.790% | | 4.4930 | | 03/24/31 | | | 149,942 | |
| | 183,000 | | | JPMorgan Chase & Company(b) | | TSFR3M + 1.250% | | 2.5800 | | 04/22/32 | | | 158,639 | |
| | 138,000 | | | JPMorgan Chase & Company | | | | 6.4000 | | 05/15/38 | | | 154,669 | |
| | 190,000 | | | JPMorgan Chase & Company(b) | | TSFR3M + 1.642% | | 3.9640 | | 11/15/48 | | | 155,329 | |
| | 209,000 | | | JPMorgan Chase & Company(b) | | SOFRRATE + 1.580% | | 3.3280 | | 04/22/52 | | | 151,468 | |
| | 154,000 | | | Wells Fargo & Company | | | | 3.0000 | | 04/22/26 | | | 150,370 | |
| | 155,000 | | | Wells Fargo & Company | | | | 3.0000 | | 10/23/26 | | | 150,157 | |
| | 163,000 | | | Wells Fargo & Company(b) | | SOFRRATE + 2.100% | | 2.3930 | | 06/02/28 | | | 153,328 | |
| | 172,000 | | | Wells Fargo & Company(b) | | TSFR3M + 1.432% | | 2.8790 | | 10/30/30 | | | 156,025 | |
| | 213,000 | | | Wells Fargo & Company(b) | | SOFRRATE + 2.530% | | 3.0680 | | 04/30/41 | | | 160,337 | |
| | 165,000 | | | Wells Fargo & Company(b) | | TSFR3M + 4.502% | | 5.0130 | | 04/04/51 | | | 154,431 | |
| | | | | | | | | | | | | | 4,151,973 | |
| | | | | BEVERAGES — 0.9% | | | | | | | | | | |
| | 152,000 | | | Anheuser-Busch Companies, LLC / Anheuser-Busch | | | | 4.7000 | | 02/01/36 | | | 146,603 | |
| | 157,000 | | | Anheuser-Busch Companies, LLC / Anheuser-Busch | | | | 4.9000 | | 02/01/46 | | | 146,652 | |
| | 144,000 | | | Anheuser-Busch InBev Worldwide, Inc. | | | | 4.7500 | | 01/23/29 | | | 144,676 | |
| | 150,000 | | | Anheuser-Busch InBev Worldwide, Inc. | | | | 5.5500 | | 01/23/49 | | | 153,200 | |
| | | | | | | | | | | | | | 591,131 | |
| | | | | BIOTECH & PHARMA — 2.9% | | | | | | | | | | |
| | 149,000 | | | AbbVie, Inc. | | | | 2.6000 | | 11/21/24 | | | 148,793 | |
| | 148,000 | | | AbbVie, Inc. | | | | 3.6000 | | 05/14/25 | | | 147,131 | |
| | 153,000 | | | AbbVie, Inc. | | | | 2.9500 | | 11/21/26 | | | 148,428 | |
| | 161,000 | | | AbbVie, Inc. | | | | 3.2000 | | 11/21/29 | | | 150,444 | |
| | 172,000 | | | AbbVie, Inc. | | | | 4.0500 | | 11/21/39 | | | 151,131 | |
| | 176,000 | | | AbbVie, Inc. | | | | 4.2500 | | 11/21/49 | | | 149,918 | |
| | 173,000 | | | Amgen, Inc. | | | | 4.6630 | | 06/15/51 | | | 151,709 | |
| | 136,000 | | | AstraZeneca plc | | | | 6.4500 | | 09/15/37 | | | 152,618 | |
| | 186,000 | | | Bausch Health Companies, Inc.(a) | | | | 5.5000 | | 11/01/25 | | | 182,757 | |
| | 157,000 | | | Bristol-Myers Squibb Company | | | | 3.4000 | | 07/26/29 | | | 149,283 | |
| | | | | | | | | | | | | | | |
See accompanying notes which are an integral part of these financial statements.
| LEADERSHARES DYNAMIC YIELD ETF |
| SCHEDULE OF INVESTMENTS (Continued) |
| October 31, 2024 |
| |
| Principal | | | | | | | Coupon Rate | | | | | |
| Amount ($) | | | | | Spread | | (%) | | Maturity | | Fair Value | |
| | | | | CORPORATE BONDS — 50.7% (Continued) | | | | | | | | | | |
| | | | | BIOTECH & PHARMA — 2.9% (Continued) | | | | | | | | | | |
| | 180,000 | | | Bristol-Myers Squibb Company | | | | 4.2500 | | 10/26/49 | | $ | 150,927 | |
| | 136,000 | | | GlaxoSmithKline Capital, Inc. | | | | 6.3750 | | 05/15/38 | | | 151,594 | |
| | 126,000 | | | Pfizer, Inc. | | | | 7.2000 | | 03/15/39 | | | 150,488 | |
| | | | | | | | | | | | | | 1,985,221 | |
| | | | | CABLE & SATELLITE — 5.4% | | | | | | | | | | |
| | 167,000 | | | CCO Holdings, LLC / CCO Holdings Capital(a) | | | | 5.1250 | | 05/01/27 | | | 163,631 | |
| | 170,000 | | | CCO Holdings, LLC / CCO Holdings Capital(a) | | | | 5.0000 | | 02/01/28 | | | 164,580 | |
| | 174,000 | | | CCO Holdings, LLC / CCO Holdings Capital(a) | | | | 5.3750 | | 06/01/29 | | | 166,252 | |
| | 165,000 | | | CCO Holdings, LLC / CCO Holdings Capital(a) | | | | 6.3750 | | 09/01/29 | | | 163,501 | |
| | 185,000 | | | CCO Holdings, LLC / CCO Holdings Capital(a) | | | | 4.7500 | | 03/01/30 | | | 168,464 | |
| | 189,000 | | | CCO Holdings, LLC / CCO Holdings Capital(a) | | | | 4.5000 | | 08/15/30 | | | 168,965 | |
| | 195,000 | | | CCO Holdings, LLC / CCO Holdings Capital(a) | | | | 4.2500 | | 02/01/31 | | | 169,795 | |
| | 199,000 | | | CCO Holdings, LLC / CCO Holdings Capital | | | | 4.5000 | | 05/01/32 | | | 169,499 | |
| | 205,000 | | | CCO Holdings, LLC / CCO Holdings Capital(a) | | | | 4.5000 | | 06/01/33 | | | 170,726 | |
| | 212,000 | | | CCO Holdings, LLC / CCO Holdings Capital(a) | | | | 4.2500 | | 01/15/34 | | | 169,599 | |
| | 150,000 | | | Comcast Corporation | | | | 4.1500 | | 10/15/28 | | | 147,326 | |
| | 160,000 | | | Comcast Corporation | | | | 4.6000 | | 10/15/38 | | | 148,249 | |
| | 165,000 | | | Comcast Corporation | | | | 4.7000 | | 10/15/48 | | | 149,032 | |
| | 236,000 | | | Comcast Corporation | | | | 2.8870 | | 11/01/51 | | | 149,775 | |
| | 244,000 | | | Comcast Corporation | | | | 2.9370 | | 11/01/56 | | | 151,088 | |
| | 179,000 | | | DIRECTV Holdings, LLC / DIRECTV Financing Company(a) | | | | 5.8750 | | 08/15/27 | | | 172,569 | |
| | 190,000 | | | DISH DBS Corporation | | | | 5.8750 | | 11/15/24 | | | 188,706 | |
| | 210,000 | | | DISH DBS Corporation(a) | | | | 5.2500 | | 12/01/26 | | | 194,766 | |
| | 221,000 | | | DISH DBS Corporation(a) | | | | 5.7500 | | 12/01/28 | | | 193,577 | |
| | 165,000 | | | DISH Network Corporation(a) | | | | 11.7500 | | 11/15/27 | | | 173,809 | |
| | 167,000 | | | Sirius XM Radio, Inc.(a) | | | | 5.0000 | | 08/01/27 | | | 163,714 | |
| | 181,000 | | | Sirius XM Radio, Inc.(a) | | | | 4.0000 | | 07/15/28 | | | 168,967 | |
| | | | | | | | | | | | | | 3,676,590 | |
| | | | | CONSTRUCTION MATERIALS — 0.2% | | | | | | | | | | |
| | 185,000 | | | Standard Industries, Inc.(a) | | | | 4.3750 | | 07/15/30 | | | 170,137 | |
| | | | | | | | | | | | | | | |
| | | | | CONTAINERS & PACKAGING — 0.2% | | | | | | | | | | |
| | 165,000 | | | Mauser Packaging Solutions Holding Company(a) | | | | 7.8750 | | 08/15/26 | | | 167,466 | |
| | | | | | | | | | | | | | | |
See accompanying notes which are an integral part of these financial statements.
| LEADERSHARES DYNAMIC YIELD ETF |
| SCHEDULE OF INVESTMENTS (Continued) |
| October 31, 2024 |
| |
| Principal | | | | | | | Coupon Rate | | | | | |
| Amount ($) | | | | | Spread | | (%) | | Maturity | | Fair Value | |
| | | | | CORPORATE BONDS — 50.7% (Continued) | | | | | | | | | | |
| | | | | DIVERSIFIED INDUSTRIALS — 0.2% | | | | | | | | | | |
| | 137,000 | | | General Electric Company | | | | 6.7500 | | 03/15/32 | | $ | 152,665 | |
| | | | | | | | | | | | | | | |
| | | | | E-COMMERCE DISCRETIONARY — 0.4% | | | | | | | | | | |
| | 153,000 | | | Amazon.com, Inc. | | | | 3.1500 | | 08/22/27 | | | 148,135 | |
| | 174,000 | | | Amazon.com, Inc. | | | | 4.0500 | | 08/22/47 | | | 148,107 | |
| | | | | | | | | | | | | | 296,242 | |
| | | | | ELECTRIC UTILITIES — 0.2% | | | | | | | | | | |
| | 168,000 | | | FirstEnergy Corporation | | | | 3.9000 | | 07/15/27 | | | 164,174 | |
| | | | | | | | | | | | | | | |
| | | | | ELECTRICAL EQUIPMENT — 0.5% | | | | | | | | | | |
| | 159,000 | | | Emerald Debt Merger Sub, LLC(a) | | | | 6.6250 | | 12/15/30 | | | 161,896 | |
| | 155,000 | | | WESCO Distribution, Inc.(a) | | | | 7.2500 | | 06/15/28 | | | 158,775 | |
| | | | | | | | | | | | | | 320,671 | |
| | | | | ENGINEERING & CONSTRUCTION — 0.2% | | | | | | | | | | |
| | 152,000 | | | Brand Industrial Services, Inc.(a) | | | | 10.3750 | | 08/01/30 | | | 161,332 | |
| | | | | | | | | | | | | | | |
| | | | | ENTERTAINMENT CONTENT — 0.2% | | | | | | | | | | |
| | 161,000 | | | Univision Communications, Inc.(a) | | | | 6.6250 | | 06/01/27 | | | 159,892 | |
| | | | | | | | | | | | | | | |
| | | | | FOOD — 1.8% | | | | | | | | | | |
| | 153,000 | | | Kraft Heinz Foods Company | | | | 3.0000 | | 06/01/26 | | | 149,021 | |
| | 151,000 | | | Kraft Heinz Foods Company | | | | 3.8750 | | 05/15/27 | | | 148,119 | |
| | 156,000 | | | Kraft Heinz Foods Company | | | | 4.2500 | | 03/01/31 | | | 151,835 | |
| | 137,000 | | | Kraft Heinz Foods Company(a) | | | | 7.1250 | | 08/01/39 | | | 156,171 | |
| | 162,000 | | | Kraft Heinz Foods Company | | | | 5.0000 | | 06/04/42 | | | 150,927 | |
| | 160,000 | | | Kraft Heinz Foods Company | | | | 5.2000 | | 07/15/45 | | | 150,138 | |
| | 183,000 | | | Kraft Heinz Foods Company | | | | 4.3750 | | 06/01/46 | | | 153,569 | |
| | 167,000 | | | Kraft Heinz Foods Company | | | | 4.8750 | | 10/01/49 | | | 149,498 | |
| | | | | | | | | | | | | | 1,209,278 | |
| | | | | HEALTH CARE FACILITIES & SERVICES — 3.7% | | | | | | | | | | |
| | 182,000 | | | CHS/Community Health Systems, Inc.(a) | | | | 5.6250 | | 03/15/27 | | | 177,631 | |
| | 150,000 | | | Cigna Group (The) | | | | 4.3750 | | 10/15/28 | | | 147,440 | |
| | 166,000 | | | Cigna Group (The) | | | | 4.9000 | | 12/15/48 | | | 147,549 | |
| | 149,000 | | | CVS Health Corporation | | | | 4.3000 | | 03/25/28 | | | 145,262 | |
| | | | | | | | | | | | | | | |
See accompanying notes which are an integral part of these financial statements.
| LEADERSHARES DYNAMIC YIELD ETF |
| SCHEDULE OF INVESTMENTS (Continued) |
| October 31, 2024 |
| |
| Principal | | | | | | | Coupon Rate | | | | | |
| Amount ($) | | | | | Spread | | (%) | | Maturity | | Fair Value | |
| | | | | CORPORATE BONDS — 50.7% (Continued) | | | | | | | | | | |
| | | | | HEALTH CARE FACILITIES & SERVICES — 3.7% (Continued) | | | | | | | | | | |
| | 163,000 | | | CVS Health Corporation | | | | 4.7800 | | 03/25/38 | | $ | 145,585 | |
| | 165,000 | | | CVS Health Corporation | | | | 5.1250 | | 07/20/45 | | | 144,648 | |
| | 168,000 | | | CVS Health Corporation | | | | 5.0500 | | 03/25/48 | | | 145,374 | |
| | 193,000 | | | DaVita, Inc.(a) | | | | 4.6250 | | 06/01/30 | | | 177,794 | |
| | 145,000 | | | HCA, Inc. | | | | 5.3750 | | 02/01/25 | | | 145,017 | |
| | 143,000 | | | HCA, Inc. | | | | 5.8750 | | 02/15/26 | | | 144,021 | |
| | 153,000 | | | HCA, Inc. | | | | 5.6250 | | 09/01/28 | | | 156,211 | |
| | 167,000 | | | HCA, Inc. | | | | 3.5000 | | 09/01/30 | | | 153,182 | |
| | 159,000 | | | Tenet Healthcare Corporation | | | | 6.2500 | | 02/01/27 | | | 159,280 | |
| | 166,000 | | | Tenet Healthcare Corporation | | | | 5.1250 | | 11/01/27 | | | 164,780 | |
| | 164,000 | | | Tenet Healthcare Corporation | | | | 6.1250 | | 10/01/28 | | | 164,261 | |
| | 163,000 | | | Tenet Healthcare Corporation | | | | 6.1250 | | 06/15/30 | | | 163,971 | |
| | | | | | | | | | | | | | 2,482,006 | |
| | | | | HOME & OFFICE PRODUCTS — 0.2% | | | | | | | | | | |
| | 165,000 | | | Newell Brands, Inc. | | | | 5.7000 | | 04/01/26 | | | 165,483 | |
| | | | | | | | | | | | | | | |
| | | | | INDUSTRIAL INTERMEDIATE PROD — 0.2% | | | | | | | | | | |
| | 155,000 | | | Chart Industries, Inc.(a) | | | | 7.5000 | | 01/01/30 | | | 161,420 | |
| | | | | | | | | | | | | | | |
| | | | | INDUSTRIAL SUPPORT SERVICES — 0.2% | | | | | | | | | | |
| | 166,000 | | | United Rentals North America, Inc. | | | | 4.8750 | | 01/15/28 | | | 162,626 | |
| | | | | | | | | | | | | | | |
| | | | | INSTITUTIONAL FINANCIAL SERVICES — 2.0% | | | | | | | | | | |
| | 148,000 | | | Goldman Sachs Group, Inc. (The) | | | | 3.5000 | | 04/01/25 | | | 147,228 | |
| | 152,000 | | | Goldman Sachs Group, Inc. (The)(b) | | TSFR3M + 1.563% | | 4.2230 | | 05/01/29 | | | 148,564 | |
| | 181,000 | | | Goldman Sachs Group, Inc. (The)(b) | | SOFRRATE + 1.281% | | 2.6150 | | 04/22/32 | | | 155,907 | |
| | 143,000 | | | Goldman Sachs Group, Inc. (The) | | | | 6.7500 | | 10/01/37 | | | 156,985 | |
| | 144,000 | | | Goldman Sachs Group, Inc. (The) | | | | 6.2500 | | 02/01/41 | | | 156,348 | |
| | 149,000 | | | Morgan Stanley | | | | 3.8750 | | 01/27/26 | | | 147,673 | |
| | 162,000 | | | Morgan Stanley(b) | | SOFRRATE + 0.879% | | 1.5930 | | 05/04/27 | | | 154,502 | |
| | 153,000 | | | Morgan Stanley(b) | | TSFR3M + 1.890% | | 4.4310 | | 01/23/30 | | | 150,087 | |
| | 176,000 | | | Morgan Stanley Series GMTN(b) | | SOFRRATE + 1.143% | | 2.6990 | | 01/22/31 | | | 157,535 | |
| | | | | | | | | | | | | | 1,374,829 | |
| | | | | | | | | | | | | | | |
See accompanying notes which are an integral part of these financial statements.
| LEADERSHARES DYNAMIC YIELD ETF |
| SCHEDULE OF INVESTMENTS (Continued) |
| October 31, 2024 |
| |
| Principal | | | | | | | Coupon Rate | | | | | |
| Amount ($) | | | | | Spread | | (%) | | Maturity | | Fair Value | |
| | | | | CORPORATE BONDS — 50.7% (Continued) | | | | | | | | | | |
| | | | | INSURANCE — 0.2% | | | | | | | | | | |
| | 154,000 | | | HUB International Ltd.(a) | | | | 7.2500 | | 06/15/30 | | $ | 159,254 | |
| | | | | | | | | | | | | | | |
| | | | | INTERNET MEDIA & SERVICES — 0.5% | | | | | | | | | | |
| | 155,000 | | | Uber Technologies, Inc.(a) | | | | 8.0000 | | 11/01/26 | | | 155,000 | |
| | 174,000 | | | Uber Technologies, Inc.(a) | | | | 4.5000 | | 08/15/29 | | | 169,091 | |
| | | | | | | | | | | | | | 324,091 | |
| | | | | LEISURE FACILITIES & SERVICES — 2.4% | | | | | | | | | | |
| | 174,000 | | | 1011778 BC ULC / New Red Finance, Inc.(a) | | | | 3.8750 | | 01/15/28 | | | 166,052 | |
| | 53,000 | | | Caesars Entertainment, Inc.(a) | | | | 8.1250 | | 07/01/27 | | | 54,070 | |
| | 158,000 | | | Caesars Entertainment, Inc.(a) | | | | 7.0000 | | 02/15/30 | | | 162,264 | |
| | 157,000 | | | Carnival Corporation(a) | | | | 7.6250 | | 03/01/26 | | | 158,200 | |
| | 168,000 | | | Carnival Corporation(a) | | | | 5.7500 | | 03/01/27 | | | 168,595 | |
| | 178,000 | | | Carnival Corporation(a) | | | | 4.0000 | | 08/01/28 | | | 169,823 | |
| | 174,000 | | | Carnival Corporation(a) | | | | 6.0000 | | 05/01/29 | | | 174,398 | |
| | 143,000 | | | Carnival Holdings Bermuda Ltd.(a) | | | | 10.3750 | | 05/01/28 | | | 153,594 | |
| | 189,000 | | | New Red Finance, Inc.(a) | | | | 4.0000 | | 10/15/30 | | | 170,723 | |
| | 167,000 | | | Royal Caribbean Cruises Ltd.(a) | | | | 5.5000 | | 04/01/28 | | | 167,093 | |
| | | | | | | | | | | | | | 1,544,812 | |
| | | | | MEDICAL EQUIPMENT & DEVICES — 1.2% | | | | | | | | | | |
| | 150,000 | | | Abbott Laboratories | | | | 4.9000 | | 11/30/46 | | | 145,120 | |
| | 171,000 | | | Avantor Funding, Inc.(a) | | | | 4.6250 | | 07/15/28 | | | 165,490 | |
| | 154,000 | | | Bausch & Lomb Escrow Corporation(a) | | | | 8.3750 | | 10/01/28 | | | 161,915 | |
| | 182,000 | | | Medline Borrower, L.P.(a) | | | | 3.8750 | | 04/01/29 | | | 170,427 | |
| | 178,000 | | | Medline Borrower, L.P.(a) | | | | 5.2500 | | 10/01/29 | | | 172,654 | |
| | | | | | | | | | | | | | 815,606 | |
| | | | | METALS & MINING — 0.6% | | | | | | | | | | |
| | 163,000 | | | Freeport-McMoRan, Inc. | | | | 5.4500 | | 03/15/43 | | | 156,678 | |
| | 177,000 | | | Novelis Corporation(a) | | | | 4.7500 | | 01/30/30 | | | 166,208 | |
| | | | | | | | | | | | | | 322,886 | |
| | | | | OIL & GAS PRODUCERS — 3.1% | | | | | | | | | | |
| | 183,000 | | | Cheniere Energy Partners, L.P. | | | | 4.0000 | | 03/01/31 | | | 169,187 | |
| | 153,000 | | | Civitas Resources, Inc.(a) | | | | 8.3750 | | 07/01/28 | | | 158,316 | |
| | | | | | | | | | | | | | | |
See accompanying notes which are an integral part of these financial statements.
| LEADERSHARES DYNAMIC YIELD ETF |
| SCHEDULE OF INVESTMENTS (Continued) |
| October 31, 2024 |
| |
| Principal | | | | | | | Coupon Rate | | | | | |
| Amount ($) | | | | | Spread | | (%) | | Maturity | | Fair Value | |
| | | | | CORPORATE BONDS — 50.7% (Continued) | | | | | | | | | | |
| | | | | OIL & GAS PRODUCERS — 3.1% (Continued) | | | | | | | | | | |
| | 152,000 | | | Civitas Resources, Inc.(a) | | | | 8.7500 | | 07/01/31 | | $ | 159,412 | |
| | 136,000 | | | ConocoPhillips | | | | 6.5000 | | 02/01/39 | | | 150,951 | |
| | 199,000 | | | ConocoPhillips Company | | | | 4.0250 | | 03/15/62 | | | 151,314 | |
| | 149,000 | | | Continental Resources Inc/OK(a) | | | | 5.7500 | | 01/15/31 | | | 149,242 | |
| | 168,000 | | | New Fortress Energy, Inc.(a) | | | | 6.5000 | | 09/30/26 | | | 155,752 | |
| | 137,000 | | | Shell International Finance BV | | | | 6.3750 | | 12/15/38 | | | 152,707 | |
| | 170,829 | | | Shell International Finance BV | | | | 4.3750 | | 05/11/45 | | | 150,086 | |
| | 159,000 | | | Venture Global LNG, Inc.(a) | | | | 8.1250 | | 06/01/28 | | | 165,116 | |
| | 152,000 | | | Venture Global LNG, Inc.(a) | | | | 9.5000 | | 02/01/29 | | | 168,069 | |
| | 161,000 | | | Venture Global LNG, Inc.(a) | | | | 8.3750 | | 06/01/31 | | | 167,346 | |
| | 154,000 | | | Venture Global LNG, Inc.(a) | | | | 9.8750 | | 02/01/32 | | | 168,163 | |
| | | | | | | | | | | | | | 2,065,661 | |
| | | | | OIL & GAS SERVICES & EQUIPMENT — 0.2% | | | | | | | | | | |
| | 152,000 | | | Weatherford International Ltd.(a) | | | | 8.6250 | | 04/30/30 | | | 157,237 | |
| | | | | | | | | | | | | | | |
| | | | | PUBLISHING & BROADCASTING — 0.2% | | | | | | | | | | |
| | 169,000 | | | Nexstar Media, Inc.(a) | | | | 5.6250 | | 07/15/27 | | | 166,201 | |
| | | | | | | | | | | | | | | |
| | | | | REAL ESTATE INVESTMENT TRUSTS — 0.7% | | | | | | | | | | |
| | 170,000 | | | SBA Communications Corporation | | | | 3.8750 | | 02/15/27 | | | 164,656 | |
| | 186,000 | | | SBA Communications Corporation | | | | 3.1250 | | 02/01/29 | | | 169,387 | |
| | 161,000 | | | Uniti Group, L.P. / Uniti Group Finance, Inc. (a) | | | | 10.5000 | | 02/15/28 | | | 171,466 | |
| | | | | | | | | | | | | | 505,509 | |
| | | | | RETAIL - DISCRETIONARY — 0.2% | | | | | | | | | | |
| | 142,000 | | | Home Depot, Inc. (The) | | | | 5.8750 | | 12/16/36 | | | 152,405 | |
| | | | | | | | | | | | | | | |
| | | | | SEMICONDUCTORS — 0.5% | | | | | | | | | | |
| | 193,000 | | | Broadcom, Inc.(a) | | | | 3.1370 | | 11/15/35 | | | 158,638 | |
| | 197,000 | | | Broadcom, Inc.(a) | | | | 3.1870 | | 11/15/36 | | | 160,190 | |
| | | | | | | | | | | | | | 318,828 | |
| | | | | SOFTWARE — 3.3% | | | | | | | | | | |
| | 187,000 | | | AthenaHealth Group, Inc. | | | | 6.5000 | | 02/15/30 | | | 176.971 | |
| | 174,000 | | | Cloud Software Group, Inc | | | | 6.5000 | | 03/31/29 | | | 170,043 | |
| | 179,000 | | | Cloud Software Group, Inc.(a) | | | | 9.0000 | | 09/30/29 | | | 179,012 | |
| | 187,000 | | | McAfee Corporation (a) | | | | 7.3750 | | 02/15/30 | | | 180,338 | |
| | | | | | | | | | | | | | | |
See accompanying notes which are an integral part of these financial statements.
| LEADERSHARES DYNAMIC YIELD ETF |
| SCHEDULE OF INVESTMENTS (Continued) |
| October 31, 2024 |
| |
| Principal | | | | | | | Coupon Rate | | | | | |
| Amount ($) | | | | | Spread | | (%) | | Maturity | | Fair Value | |
| | | | | CORPORATE BONDS — 50.7% (Continued) | | | | | | | | | | |
| | | | | SOFTWARE — 3.3% (Continued) | | | | | | | | | | |
| | 154,000 | | | Microsoft Corporation | | | | 2.4000 | | 08/08/26 | | $ | 149,144 | |
| | 150,000 | | | Microsoft Corporation | | | | 3.3000 | | 02/06/27 | | | 146,976 | |
| | 230,000 | | | Microsoft Corporation | | | | 2.5250 | | 06/01/50 | | | 147,535 | |
| | 211,000 | | | Microsoft Corporation | | | | 2.9210 | | 03/17/52 | | | 146,019 | |
| | 236,000 | | | Microsoft Corporation | | | | 2.6750 | | 06/01/60 | | | 144,452 | |
| | 151,000 | | | Oracle Corporation | | | | 2.5000 | | 04/01/25 | | | 149,506 | |
| | 209,000 | | | Oracle Corporation | | | | 3.6000 | | 04/01/50 | | | 150,748 | |
| | 213,000 | | | Oracle Corporation | | | | 3.8500 | | 04/01/60 | | | 151,487 | |
| | 164,000 | | | SS&C Technologies, Inc.(a) | | | | 5.5000 | | 09/30/27 | | | 163,444 | |
| | 212,000 | | | Veritas US, Inc.(a) | | | | 7.5000 | | 09/01/25 | | | 201,974 | |
| | | | | | | | | | | | | | 2,257,649 | |
| | | | | SPECIALTY FINANCE — 0.2% | | | | | | | | | | |
| | 157,000 | | | OneMain Finance Corporation | | | | 7.1250 | | 03/15/26 | | | 160,941 | |
| | | | | | | | | | | | | | | |
| | | | | TECHNOLOGY HARDWARE — 1.5% | | | | | | | | | | |
| | 149,000 | | | Apple, Inc. | | | | 3.2500 | | 02/23/26 | | | 146,917 | |
| | 173,000 | | | Apple, Inc. | | | | 3.8500 | | 05/04/43 | | | 147,687 | |
| | 153,000 | | | Apple, Inc. | | | | 4.6500 | | 02/23/46 | | | 144,033 | |
| | 106,000 | | | Dell International, LLC / EMC Corporation | | | | 6.0200 | | 06/15/26 | | | 107,828 | |
| | 177,000 | | | Imola Merger Corporation(a) | | | | 4.7500 | | 05/15/29 | | | 169,417 | |
| | 152,000 | | | NCR Atleos Escrow Corporation(a) | | | | 9.5000 | | 04/01/29 | | | 167,327 | |
| | 165,000 | | | Western Digital Corporation | | | | 4.7500 | | 02/15/26 | | | 163,179 | |
| | | | | | | | | | | | | | 1,046,388 | |
| | | | | TECHNOLOGY SERVICES — 0.7% | | | | | | | | | | |
| | 172,000 | | | Neptune Bidco US, Inc.(a) | | | | 9.2900 | | 04/15/29 | | | 160,483 | |
| | 150,000 | | | Visa, Inc. | | | | 3.1500 | | 12/14/25 | | | 147,988 | |
| | 165,000 | | | Visa, Inc. | | | | 4.3000 | | 12/14/45 | | | 146,377 | |
| | | | | | | | | | | | | | 454,848 | |
| | | | | TELECOMMUNICATIONS — 5.2% | | | | | | | | | | |
| | 151,000 | | | AT&T, Inc. | | | | 4.3500 | | 03/01/29 | | | 148,965 | |
| | 153,000 | | | AT&T, Inc. | | | | 4.3000 | | 02/15/30 | | | 148,979 | |
| | 193,000 | | | AT&T, Inc. | | | | 2.5500 | | 12/01/33 | | | 157,073 | |
| | 221,000 | | | AT&T, Inc. | | | | 3.5000 | | 09/15/53 | | | 154,306 | |
| | | | | | | | | | | | | | | |
See accompanying notes which are an integral part of these financial statements.
| LEADERSHARES DYNAMIC YIELD ETF |
| SCHEDULE OF INVESTMENTS (Continued) |
| October 31, 2024 |
| |
| Principal | | | | | | | Coupon Rate | | | | | |
| Amount ($) | | | | | Spread | | (%) | | Maturity | | Fair Value | |
| | | | | CORPORATE BONDS — 50.7% (Continued) | | | | | | | | | | |
| | | | | TELECOMMUNICATIONS — 5.2% (Continued) | | | | | | | | | | |
| | 222,000 | | | AT&T, Inc. | | | | 3.5500 | | 09/15/55 | | $ | 154,151 | |
| | 214,000 | | | AT&T, Inc. | | | | 3.8000 | | 12/01/57 | | | 153,943 | |
| | 223,000 | | | AT&T, Inc. | | | | 3.6500 | | 09/15/59 | | | 153,642 | |
| | 123,000 | | | British Telecommunications plc | | | | 9.6250 | | 12/15/30 | | | 151,322 | |
| | 127,000 | | | Deutsche Telekom International Finance BV | | | | 8.7500 | | 06/15/30 | | | 149,559 | |
| | 180,000 | | | Frontier Communications Corporation(a) | | | | 5.0000 | | 05/01/28 | | | 177,242 | |
| | 173,000 | | | Intelsat Jackson Holdings S.A.(a) | | | | 6.5000 | | 03/15/30 | | | 163,432 | |
| | 123,000 | | | Orange S.A. | | | | 9.0000 | | 03/01/31 | | | 148,954 | |
| | 155,000 | | | Verizon Communications, Inc. | | | | 4.1250 | | 03/16/27 | | | 153,227 | |
| | 150,000 | | | Verizon Communications, Inc. | | | | 4.3290 | | 09/21/28 | | | 148,140 | |
| | 155,000 | | | Verizon Communications, Inc. | | | | 4.0160 | | 12/03/29 | | | 149,103 | |
| | 179,000 | | | Verizon Communications, Inc. | | | | 2.5500 | | 03/21/31 | | | 155,441 | |
| | 156,000 | | | Verizon Communications, Inc. | | | | 4.5000 | | 08/10/33 | | | 149,053 | |
| | 200,000 | | | Verizon Communications, Inc. | | | | 3.4000 | | 03/22/41 | | | 154,886 | |
| | 164,000 | | | Verizon Communications, Inc. | | | | 4.8620 | | 08/21/46 | | | 150,938 | |
| | 212,000 | | | Verizon Communications, Inc. | | | | 3.5500 | | 03/22/51 | | | 155,306 | |
| | 205,000 | | | Verizon Communications, Inc. | | | | 3.7000 | | 03/22/61 | | | 146,414 | |
| | 161,000 | | | Vodafone Group plc | | | | 5.2500 | | 05/30/48 | | | 152,427 | |
| | 156,000 | | | Vodafone Group plc(b) | | USSW5 + 4.873% | | 7.0000 | | 04/04/79 | | | 163,635 | |
| | | | | | | | | | | | | | 3,540,138 | |
| | | | | TOBACCO & CANNABIS — 0.2% | | | | | | | | | | |
| | 155,000 | | | BAT Capital Corporation | | | | 3.5570 | | 08/15/27 | | | 150,324 | |
| | | | | | | | | | | | | | | |
| | | | | TRANSPORTATION & LOGISTICS — 1.1% | | | | | | | | | | |
| | 80,500 | | | American Airlines, Inc./AAdvantage Loyalty IP Ltd.(a) | | | | 5.5000 | | 04/20/26 | | | 80,303 | |
| | 167,000 | | | American Airlines, Inc./AAdvantage Loyalty IP Ltd.(a) | | | | 5.7500 | | 04/20/29 | | | 165,501 | |
| | 149,000 | | | Delta Air Lines, Inc. | | | | 7.3750 | | 01/15/26 | | | 152,764 | |
| | 168,000 | | | United Airlines, Inc.(a) | | | | 4.3750 | | 04/15/26 | | | 165,029 | |
| | 181,000 | | | United Airlines, Inc.(a) | | | | 4.6250 | | 04/15/29 | | | 173,329 | |
| | | | | | | | | | | | | | 736,926 | |
| | | | | TOTAL CORPORATE BONDS (Cost $35,984,732) | | | | | | | | | 34,507,551 | |
| | | | | | | | | | | | | | | |
See accompanying notes which are an integral part of these financial statements.
| LEADERSHARES DYNAMIC YIELD ETF |
| SCHEDULE OF INVESTMENTS (Continued) |
| October 31, 2024 |
| |
| Principal | | | | | | | Coupon Rate | | | | | |
| Amount ($) | | | | | | | (%) | | Maturity | | Fair Value | |
| | | | | U.S. GOVERNMENT & AGENCIES — 40.3% | | | | | | | | | | |
| | | | | U.S. TREASURY NOTES & BILLS — 40.3% | | | | | | | | | | |
| | 24,125,000 | | | United States Treasury Bill(c) | | | | 4.0500 | | 11/07/24 | | $ | 24,106,287 | |
| | 3,177,000 | | | United States Treasury Note | | | | 1.5000 | | 02/15/25 | | | 3,148,905 | |
| | 94,000 | | | United States Treasury Note | | | | 1.6250 | | 05/15/31 | | | 80,190 | |
| | 87,000 | | | United States Treasury Note | | | | 2.2500 | | 05/15/41 | | | 63,970 | |
| | 89,000 | | | United States Treasury Note | | | | 2.3750 | | 05/15/51 | | | 59,217 | |
| | | | | TOTAL U.S. GOVERNMENT & AGENCIES (Cost $27,539,152) | | | | | | 27,458,569 | |
| | | | | | | | | | | | | | | |
| | | | | TOTAL INVESTMENTS - 91.0% (Cost $63,523,884) | | | | | | $ | 61,966,120 | |
| | | | | OTHER ASSETS IN EXCESS OF LIABILITIES - 9.0% | | | | | | | 6,113,721 | |
| | | | | NET ASSETS - 100.0% | | | | | | $ | 68,079,841 | |
| | | | | | | | | | | | | | | |
| LLC | - Limited Liability Company |
| | |
| LTD | - Limited Company |
| | |
| PLC | - Public Limited Company |
| | |
| REIT | - Real Estate Investment Trust |
| | |
| S/A | - Société Anonyme |
| | |
| SOFRRATE | United States SOFR Secured Overnight Financing Rate |
| | |
| TSFR3M | Treasury Secured Overnight Financing Rate (SOFR) 3 Month |
| | |
| USSW5 | USD 5 Years Interest Rate Swap |
| | |
| (a) | Security exempt from registration under Rule 144A or Section 4(2) of the Securities Act of 1933. The security may be resold in transactions exempt from registration, normally to qualified institutional buyers. As of October 31, 2024 the total market value of 144A securities is $12,622,731 or 18.5% of net assets. |
| (b) | Variable rate security; the rate shown represents the rate on October 31, 2024. |
| (c) | Zero coupon bond. Rate disclosed is the current yield as of October 31, 2024. |
See accompanying notes which are an integral part of these financial statements.
| LeaderShares® ETFs |
| STATEMENTS OF ASSETS AND LIABILITIES |
| October 31, 2024 |
| | | | | | LeaderShares® | | | LeaderShares® | | | | | | | |
| ASSETS | | LeaderShares® | | | AlphaFactor® | | | AlphaFactor® | | | LeaderShares® | | | LeaderShares® | |
| Investment securities: | | Activist Leaders® ETF | | | Tactical Focused ETF | | | US Core Equity ETF | | | Equity Skew ETF | | | Dynamic Yield ETF | |
| Investments, at cost | | $ | 71,771,964 | | | $ | 107,342,086 | | | $ | 139,009,239 | | | $ | 99,269,635 | | | $ | 63,523,884 | |
| Investments, at fair value | | $ | 69,344,349 | | | $ | 120,937,699 | | | $ | 154,743,417 | | | $ | 99,189,860 | | | $ | 61,966,120 | |
| Cash | | | 685,267 | | | | 1,286,603 | | | | 1,600,824 | | | | 928,803 | | | | 5,912,476 | |
| Receivable for capital stock sold | | | 1,635,894 | | | | — | | | | — | | | | — | | | | — | |
| Receivable for investments sold | | | 8,590,002 | | | | — | | | | — | | | | — | | | | — | |
| Dividends and interest receivable | | | 60,809 | | | | 72,526 | | | | 53,307 | | | | — | | | | 488,648 | |
| TOTAL ASSETS | | | 80,316,321 | | | | 122,296,828 | | | | 156,397,548 | | | | 100,118,663 | | | | 68,367,244 | |
| | | | | | | | | | | | | | | | | | | | | |
| LIABILITIES | | | | | | | | | | | | | | | | | | | | |
| Payable for investments purchased | | | 8,689,498 | | | | — | | | | — | | | | — | | | | — | |
| Payable for capital shares redeemed | | | 1,607,908 | | | | — | | | | — | | | | — | | | | — | |
| Investment advisory fees payable | | | 48,815 | | | | 101,268 | | | | 86,670 | | | | 54,790 | | | | 28,803 | |
| Dividends payable | | | — | | | | — | | | | — | | | | — | | | | 258,600 | |
| TOTAL LIABILITIES | | | 10,346,221 | | | | 101,268 | | | | 86,670 | | | | 54,790 | | | | 287,403 | |
| NET ASSETS | | $ | 69,970,100 | | | $ | 122,195,560 | | | $ | 156,310,878 | | | $ | 100,063,873 | | | $ | 68,079,841 | |
| | | | | | | | | | | | | | | | | | | | | |
| Net Assets Consist Of: | | | | | | | | | | | | | | | | | | | | |
| Paid in capital | | $ | 109,282,678 | | | $ | 138,681,272 | | | $ | 189,825,625 | | | $ | 135,103,839 | | | $ | 76,200,126 | |
| Accumulated earnings (deficit) | | | (39,312,578 | ) | | | (16,485,712 | ) | | | (33,514,747 | ) | | | (35,039,966 | ) | | | (8,120,285 | ) |
| NET ASSETS | | $ | 69,970,100 | | | $ | 122,195,560 | | | $ | 156,310,878 | | | $ | 100,063,873 | | | $ | 68,079,841 | |
| | | | | | | | | | | | | | | | | | | | | |
| Net Asset Value Per Share: | | | | | | | | | | | | | | | | | | | | |
| Net Assets | | $ | 69,970,100 | | | $ | 122,195,560 | | | $ | 156,310,878 | | | $ | 100,063,873 | | | $ | 68,079,841 | |
| Shares of beneficial interest outstanding ($0 par value, unlimited shares authorized) | | | 2,175,000 | | | | 3,000,000 | | | | 3,825,000 | | | | 2,975,000 | | | | 3,000,000 | |
| Net asset value (Net Assets ÷ Shares Outstanding) | | $ | 32.17 | | | $ | 40.73 | | | $ | 40.87 | | | $ | 33.63 | | | $ | 22.69 | |
| | | | | | | | | | | | | | | | | | | | | |
See accompanying notes which are an integral part of these financial statements.
| LeaderShares® ETFs |
| STATEMENTS OF OPERATIONS |
| For the Year Ended October 31, 2024 |
| | | | | | LeaderShares® | | | LeaderShares® | | | | | | | |
| | | LeaderShares® | | | AlphaFactor® | | | AlphaFactor® | | | LeaderShares® | | | LeaderShares® | |
| INVESTMENT INCOME | | Activist Leaders® ETF | | | Tactical Focused ETF | | | US Core Equity ETF | | | Equity Skew ETF | | | Dynamic Yield ETF | |
| Dividends | | $ | 1,396,958 | | | $ | 2,964,744 | | | $ | 1,765,781 | | | $ | 2,215,687 | | | $ | — | |
| Interest | | | 43,105 | | | | 289,832 | | | | 64,231 | | | | 49,158 | | | | 3,793,832 | |
| Less: Foreign withholding expense | | | (45,690 | ) | | | (5,808 | ) | | | — | | | | — | | | | — | |
| TOTAL INVESTMENT INCOME | | | 1,394,373 | | | | 3,248,768 | | | | 1,830,012 | | | | 2,264,845 | | | | 3,793,832 | |
| | | | | | | | | | | | | | | | | | | | | |
| EXPENSES | | | | | | | | | | | | | | | | | | | | |
| Investment advisory fees | | | 615,328 | | | | 1,388,273 | | | | 1,109,457 | | | | 896,976 | | | | 548,013 | |
| TOTAL EXPENSES | | | 615,328 | | | | 1,388,273 | | | | 1,109,457 | | | | 896,976 | | | | 548,013 | |
| NET INVESTMENT INCOME | | | 779,045 | | | | 1,860,495 | | | | 720,555 | | | | 1,367,869 | | | | 3,245,819 | |
| | | | | | | | | | | | | | | | | | | | | |
| REALIZED AND UNREALIZED GAIN (LOSS) ON INVESTMENTS | | | | | | | | | | | | | | | | | | | | |
| Net realized gain (loss) on: | | | | | | | | | | | | | | | | | | | | |
| Investments | | | (10,108,424 | ) | | | (829,688 | ) | | | (7,079,158 | ) | | | 69,635 | | | | (3,630,338 | ) |
| In-kind redemptions | | | 15,542,840 | | | | 19,288,642 | | | | 38,499,073 | | | | 20,950,182 | | | | (606,955 | ) |
| Realized gain (loss) on investments | | | 5,434,416 | | | | 18,458,954 | | | | 31,419,915 | | | | 21,019,817 | | | | (4,237,293 | ) |
| Change in unrealized appreciation on: | | | | | | | | | | | | | | | | | | | | |
| Investments | | | 8,133,888 | | | | 13,599,324 | | | | 11,432,517 | | | | 3,429,162 | | | | 8,200,972 | |
| | | | | | | | | | | | | | | | | | | | | |
| NET REALIZED AND UNREALIZED GAIN ON INVESTMENTS | | | 13,568,304 | | | | 32,058,278 | | | | 42,852,432 | | | | 24,448,979 | | | | 3,963,679 | |
| | | | | | | | | | | | | | | | | | | | | |
| NET INCREASE IN NET ASSETS RESULTING FROM OPERATIONS | | $ | 14,347,349 | | | $ | 33,918,773 | | | $ | 43,572,987 | | | $ | 25,816,848 | | | $ | 7,209,498 | |
| | | | | | | | | | | | | | | | | | | | | |
See accompanying notes which are an integral part of these financial statements.
| LeaderShares® Activist Leaders® ETF |
| STATEMENTS OF CHANGES IN NET ASSETS |
| | | For the Year | | | For the Year | |
| | | Ended | | | Ended | |
| | | October 31, 2024 | | | October 31, 2023 | |
| FROM OPERATIONS | | | | | | | | |
| Net investment income | | $ | 779,045 | | | $ | 1,002,457 | |
| Net realized loss on investments | | | (10,108,424 | ) | | | (15,585,791 | ) |
| Net realized gain on in-kind redemptions | | | 15,542,840 | | | | 13,363,512 | |
| Unrealized appreciation (depreciation) on investments | | | 8,133,888 | | | | (2,174,800 | ) |
| Net increase (decrease) in net assets resulting from operations | | | 14,347,349 | | | | (3,394,622 | ) |
| | | | | | | | | |
| DISTRIBUTIONS TO SHAREHOLDERS FROM | | | | | | | | |
| Distributable Earnings | | | (1,076,375 | ) | | | (243,068 | ) |
| Net decrease in net assets resulting from distributions to shareholders | | | (1,076,375 | ) | | | (243,068 | ) |
| | | | | | | | | |
| FROM SHARES OF BENEFICIAL INTEREST | | | | | | | | |
| Proceeds from shares sold | | | 51,962,162 | | | | 76,050,884 | |
| Cost of shares redeemed | | | (82,799,657 | ) | | | (67,131,486 | ) |
| Net increase (decrease) in net assets resulting from shares of beneficial interest | | | (30,837,495 | ) | | | 8,919,398 | |
| | | | | | | | | |
| TOTAL INCREASE (DECREASE) IN NET ASSETS | | | (17,566,521 | ) | | | 5,281,708 | |
| | | | | | | | | |
| NET ASSETS | | | | | | | | |
| Beginning of Year | | | 87,536,621 | | | | 82,254,913 | |
| End of Year | | $ | 69,970,100 | | | $ | 87,536,621 | |
| | | | | | | | | |
| SHARE ACTIVITY | | | | | | | | |
| Shares sold | | | 1,575,000 | | | | 2,425,000 | |
| Shares redeemed | | | (2,550,000 | ) | | | (2,125,000 | ) |
| Net increase (decrease) in shares of beneficial interest outstanding | | | (975,000 | ) | | | 300,000 | |
| | | | | | | | | |
See accompanying notes which are an integral part of these financial statements.
| LeaderShares® AlphaFactor® Tactical Focused ETF |
| STATEMENTS OF CHANGES IN NET ASSETS |
| | | For the Year | | | For the Year | |
| | | Ended | | | Ended | |
| | | October 31, 2024 | | | October 31, 2023 | |
| FROM OPERATIONS | | | | | | | | |
| Net investment income | | $ | 1,860,495 | | | $ | 2,502,084 | |
| Net realized loss on investments | | | (829,688 | ) | | | (17,207,554 | ) |
| Net realized gain on in-kind redemptions | | | 19,288,642 | | | | 16,621,389 | |
| Unrealized appreciation (depreciation) on investments | | | 13,599,324 | | | | (3,554,782 | ) |
| Net increase (decrease) in net assets resulting from operations | | | 33,918,773 | | | | (1,638,863 | ) |
| | | | | | | | | |
| DISTRIBUTIONS TO SHAREHOLDERS FROM | | | | | | | | |
| Distributable Earnings | | | (2,646,455 | ) | | | (596,625 | ) |
| Net decrease in net assets resulting from distributions to shareholders | | | (2,646,455 | ) | | | (596,625 | ) |
| | | | | | | | | |
| FROM SHARES OF BENEFICIAL INTEREST | | | | | | | | |
| Proceeds from shares sold | | | 118,981,911 | | | | 210,728,219 | |
| Cost of shares redeemed | | | (214,512,961 | ) | | | (179,523,658 | ) |
| Net increase (decrease) in net assets resulting from shares of beneficial interest | | | (95,531,050 | ) | | | 31,204,561 | |
| | | | | | | | | |
| TOTAL INCREASE (DECREASE) IN NET ASSETS | | | (64,258,732 | ) | | | 28,969,073 | |
| | | | | | | | | |
| NET ASSETS | | | | | | | | |
| Beginning of Year | | | 186,454,292 | | | | 157,485,219 | |
| End of Year | | $ | 122,195,560 | | | $ | 186,454,292 | |
| | | | | | | | | |
| SHARE ACTIVITY | | | | | | | | |
| Shares sold | | | 3,375,000 | | | | 6,525,000 | |
| Shares redeemed | | | (6,125,000 | ) | | | (5,550,000 | ) |
| Net increase (decrease) in shares of beneficial interest outstanding | | | (2,750,000 | ) | | | 975,000 | |
| | | | | | | | | |
See accompanying notes which are an integral part of these financial statements.
| LeaderShares® AlphaFactor® US Core Equity ETF |
| STATEMENTS OF CHANGES IN NET ASSETS |
| | | For the Year | | | For the Year | |
| | | Ended | | | Ended | |
| | | October 31, 2024 | | | October 31, 2023 | |
| FROM OPERATIONS | | | | | | | | |
| Net investment income | | $ | 720,555 | | | $ | 1,368,515 | |
| Net realized loss on investments | | | (7,079,158 | ) | | | (11,918,281 | ) |
| Net realized gain on in-kind redemptions | | | 38,499,073 | | | | 19,366,208 | |
| Unrealized appreciation (depreciation) on investments | | | 11,432,517 | | | | (5,982,151 | ) |
| Net increase in net assets resulting from operations | | | 43,572,987 | | | | 2,834,291 | |
| | | | | | | | | |
| DISTRIBUTIONS TO SHAREHOLDERS FROM | | | | | | | | |
| Distributable Earnings | | | (1,243,170 | ) | | | (502,425 | ) |
| Net decrease in net assets resulting from distributions to shareholders | | | (1,243,170 | ) | | | (502,425 | ) |
| | | | | | | | | |
| FROM SHARES OF BENEFICIAL INTEREST | | | | | | | | |
| Proceeds from shares sold | | | 195,868,329 | | | | 141,748,704 | |
| Cost of shares redeemed | | | (237,067,222 | ) | | | (135,285,199 | ) |
| Net increase (decrease) in net assets resulting from shares of beneficial interest | | | (41,198,893 | ) | | | 6,463,505 | |
| | | | | | | | | |
| TOTAL INCREASE IN NET ASSETS | | | 1,130,924 | | | | 8,795,371 | |
| | | | | | | | | |
| NET ASSETS | | | | | | | | |
| Beginning of Year | | | 155,179,954 | | | | 146,384,583 | |
| End of Year | | $ | 156,310,878 | | | $ | 155,179,954 | |
| | | | | | | | | |
| SHARE ACTIVITY | | | | | | | | |
| Shares sold | | | 5,075,000 | | | | 4,600,000 | |
| Shares redeemed | | | (6,325,000 | ) | | | (4,375,000 | ) |
| Net increase (decrease) in shares of beneficial interest outstanding | | | (1,250,000 | ) | | | 225,000 | |
| | | | | | | | | |
See accompanying notes which are an integral part of these financial statements.
| LeaderShares® Equity Skew ETF |
| STATEMENTS OF CHANGES IN NET ASSETS |
| | | For the Year | | | For the Year | |
| | | Ended | | | Ended | |
| | | October 31, 2024 | | | October 31, 2023 | |
| FROM OPERATIONS | | | | | | | | |
| Net investment income | | $ | 1,367,869 | | | $ | 1,229,109 | |
| Net realized gain (loss) on investments | | | 69,635 | | | | (14,628,955 | ) |
| Net realized gain on in-kind redemptions | | | 20,950,182 | | | | 9,761,192 | |
| Unrealized appreciation (depreciation) on investments | | | 3,429,162 | | | | 1,009,043 | |
| Net increase (decrease) in net assets resulting from operations | | | 25,816,848 | | | | (2,629,611 | ) |
| | | | | | | | | |
| DISTRIBUTIONS TO SHAREHOLDERS FROM | | | | | | | | |
| Distributable Earnings | | | (1,535,565 | ) | | | (480,938 | ) |
| Net decrease in net assets resulting from distributions to shareholders | | | (1,535,565 | ) | | | (480,938 | ) |
| | | | | | | | | |
| FROM SHARES OF BENEFICIAL INTEREST | | | | | | | | |
| Proceeds from shares sold | | | 166,407,290 | | | | 135,827,916 | |
| Cost of shares redeemed | | | (224,436,843 | ) | | | (115,722,042 | ) |
| Net increase (decrease) in net assets resulting from shares of beneficial interest | | | (58,029,553 | ) | | | 20,105,874 | |
| | | | | | | | | |
| TOTAL INCREASE (DECREASE) IN NET ASSETS | | | (33,748,270 | ) | | | 16,995,325 | |
| | | | | | | | | |
| NET ASSETS | | | | | | | | |
| Beginning of Year | | | 133,812,143 | | | | 116,816,818 | |
| End of Year | | $ | 100,063,873 | | | $ | 133,812,143 | |
| | | | | | | | | |
| SHARE ACTIVITY | | | | | | | | |
| Shares sold | | | 5,125,000 | | | | 4,700,000 | |
| Shares redeemed | | | (6,975,000 | ) | | | (4,000,000 | ) |
| Net increase (decrease) in shares of beneficial interest outstanding | | | (1,850,000 | ) | | | 700,000 | |
| | | | | | | | | |
See accompanying notes which are an integral part of these financial statements.
| LeaderShares® Dynamic Yield ETF |
| STATEMENTS OF CHANGES IN NET ASSETS |
| | | For the Year | | | For the Year | |
| | | Ended | | | Ended | |
| | | October 31, 2024 | | | October 31, 2023 | |
| FROM OPERATIONS | | | | | | | | |
| Net investment income | | $ | 3,245,819 | | | $ | 3,267,525 | |
| Net realized loss on investments | | | (3,630,338 | ) | | | — | |
| Net realized loss on in-kind redemptions | | | (606,955 | ) | | | (358,853 | ) |
| Unrealized appreciation (depreciation) on investments | | | 8,200,972 | | | | (70,568 | ) |
| Net increase in net assets resulting from operations | | | 7,209,498 | | | | 2,838,104 | |
| | | | | | | | | |
| DISTRIBUTIONS TO SHAREHOLDERS FROM | | | | | | | | |
| Distributable Earnings | | | (3,187,125 | ) | | | (3,214,975 | ) |
| Net decrease in net assets resulting from distributions to shareholders | | | (3,187,125 | ) | | | (3,214,975 | ) |
| | | | | | | | | |
| FROM SHARES OF BENEFICIAL INTEREST | | | | | | | | |
| Proceeds from shares sold | | | — | | | | 17,822,910 | |
| Cost of shares redeemed | | | (24,458,926 | ) | | | (18,582,377 | ) |
| Net decrease in net assets resulting from shares of beneficial interest | | | (24,458,926 | ) | | | (759,467 | ) |
| | | | | | | | | |
| TOTAL DECREASE IN NET ASSETS | | | (20,436,553 | ) | | | (1,136,338 | ) |
| | | | | | | | | |
| NET ASSETS | | | | | | | | |
| Beginning of Year | | | 88,516,394 | | | | 89,652,732 | |
| End of Year | | $ | 68,079,841 | | | $ | 88,516,394 | |
| | | | | | | | | |
| SHARE ACTIVITY | | | | | | | | |
| Shares sold | | | — | | | | 800,000 | |
| Shares redeemed | | | (1,100,000 | ) | | | (850,000 | ) |
| Net decrease in shares of beneficial interest outstanding | | | (1,100,000 | ) | | | (50,000 | ) |
| | | | | | | | | |
See accompanying notes which are an integral part of these financial statements.
| LeaderShares® Activist Leaders® ETF |
| FINANCIAL HIGHLIGHTS |
| |
| Per Share Data and Ratios for a Share of Beneficial Interest Outstanding Throughout the Year/Period Presented |
| | | For the Year | | | For the Year | | | For the Year | | | For the Year | | | For the Period | |
| | | Ended | | | Ended | | | Ended | | | Ended | | | Ended | |
| | | October 31, 2024 | | | October 31, 2023 | | | October 31, 2022 | | | October 31, 2021 | | | October 31, 2020 * | |
| Net asset value, beginning of year/period | | $ | 27.79 | | | $ | 28.86 | | | $ | 38.48 | | | $ | 24.29 | | | $ | 25.00 | |
| Activity from investment operations: | | | | | | | | | | | | | | | | | | | | |
| Net investment income (loss) (1) | | | 0.31 | | | | 0.33 | | | | 0.15 | | | | 0.01 | | | | (0.00 | ) ** |
| Net realized and unrealized gain (loss) on investments | | | 4.47 | | | | (1.32 | ) | | | (6.98 | ) | | | 14.21 | | | | (0.71 | ) |
| Total from investment operations | | | 4.78 | | | | (0.99 | ) | | | (6.83 | ) | | | 14.22 | | | | (0.71 | ) |
| Less distributions from: | | | | | | | | | | | | | | | | | | | | |
| Net investment income | | | (0.40 | ) | | | (0.08 | ) | | | (0.36 | ) | | | (0.03 | ) | | | — | |
| Return of capital | | | — | | | | — | | | | (2.43 | ) | | | — | | | | — | |
| Total distributions | | | (0.40 | ) | | | (0.08 | ) | | | (2.79 | ) | | | (0.03 | ) | | | — | |
| Net asset value, end of year/period | | $ | 32.17 | | | $ | 27.79 | | | $ | 28.86 | | | $ | 38.48 | | | $ | 24.29 | |
| Market price, end of year/period | | $ | 32.16 | | | $ | 27.81 | | | $ | 28.90 | | | $ | 38.49 | | | $ | 24.30 | |
| Total return (2) | | | 17.17 | % | | | (3.43 | )% | | | (19.11 | )% | | | 58.60 | % | | | (2.84 | )% (4) |
| Net assets, at end of year/period (000s) | | $ | 69,970 | | | $ | 87,537 | | | $ | 82,255 | | | $ | 76,961 | | | $ | 42,513 | |
| Ratio of expenses to average net assets | | | 0.75 | % | | | 0.75 | % | | | 0.75 | % | | | 0.75 | % | | | 0.75 | % (3) |
| Ratio of net investment income (loss) to average net assets | | | 0.95 | % | | | 1.07 | % | | | 0.45 | % | | | 0.02 | % | | | (0.75 | )% (3) |
| Portfolio Turnover Rate (5) | | | 90 | % | | | 89 | % | | | 67 | % | | | 49 | % | | | 3 | % (4) |
| * | Fund commenced operation on October 26, 2020. |
| ** | Represents less than $0.01 per share. |
| (1) | Per share amounts calculated using the average shares method, which more appropriately presents the per share data for each year/period. |
| (2) | Total return is calculated assuming a purchase of shares at net asset value on the first day and a sale at net asset value on the last day of the period. Distributions are assumed, for the purpose of this calculation, to be reinvested at the ex-dividend date net asset value per share. |
| (5) | Portfolio turnover rate excludes portfolio securities received or delivered as a result of processing capital share transactions in creations or redemptions. (Note 7) |
See accompanying notes which are an integral part of these financial statements.
| LeaderShares® AlphaFactor® Tactical Focused ETF |
| FINANCIAL HIGHLIGHTS |
| |
| Per Share Data and Ratios for a Share of Beneficial Interest Outstanding Throughout the Year/Period Presented |
| | | For the Year | | | For the Year | | | For the Year | | | For the Year | | | For the Period | |
| | | Ended | | | Ended | | | Ended | | | Ended | | | Ended | |
| | | October 31, 2024 | | | October 31, 2023 | | | October 31, 2022 | | | October 31, 2021 | | | October 31, 2020* | |
| Net asset value, beginning of year/period | | $ | 32.43 | | | $ | 32.98 | | | $ | 35.11 | | | $ | 24.09 | | | $ | 25.00 | |
| Activity from investment operations: | | | | | | | | | | | | | | | | | | | | |
| Net investment income (1) | | | 0.49 | | | | 0.44 | | | | 0.49 | | | | 0.51 | | | | 0.03 | |
| Net realized and unrealized gain (loss) on investments | | | 8.45 | | | | (0.88 | ) | | | (1.40 | ) | | | 10.60 | | | | (0.94 | ) |
| Total from investment operations | | | 8.94 | | | | (0.44 | ) | | | (0.91 | ) | | | 11.11 | | | | (0.91 | ) |
| Less distributions from: | | | | | | | | | | | | | | | | | | | | |
| Net investment income | | | (0.64 | ) | | | (0.11 | ) | | | (0.88 | ) | | | (0.09 | ) | | | — | |
| Return of capital | | | — | | | | — | | | | (0.34 | ) | | | — | | | | — | |
| Total distributions | | | (0.64 | ) | | | (0.11 | ) | | | (1.22 | ) | | | (0.09 | ) | | | — | |
| Net asset value, end of year/period | | $ | 40.73 | | | $ | 32.43 | | | $ | 32.98 | | | $ | 35.11 | | | $ | 24.09 | |
| Market price, end of year/period | | $ | 40.77 | | | $ | 32.42 | | | $ | 32.93 | | | $ | 35.13 | | | $ | 24.10 | |
| Total return (2) | | | 27.93 | % | | | (1.32 | )% | | | (2.76 | )% | | | 46.20 | % | | | 3.64 | % (4) |
| Net assets, at end of year/period (000s) | | $ | 122,196 | | | $ | 186,454 | | | $ | 157,485 | | | $ | 128,144 | | | $ | 47,571 | |
| Ratio of expenses to average net assets | | | 0.99 | % | | | 0.99 | % | | | 0.99 | % | | | 0.99 | % | | | 0.99 | % (3) |
| Ratio of net investment income to average net assets | | | 1.33 | % | | | 1.33 | % | | | 1.48 | % | | | 1.53 | % | | | 16.95 | % (3) |
| Portfolio Turnover Rate (5) | | | 107 | % | | | 192 | % | | | 229 | % | | | 78 | % | | | 0 | % (4) |
| * | Fund commenced operation on October 26, 2020. |
| (1) | Per share amounts calculated using the average shares method, which more appropriately presents the per share data for each year/period. |
| (2) | Total return is calculated assuming a purchase of shares at net asset value on the first day and a sale at net asset value on the last day of the period. Distributions are assumed, for the purpose of this calculation, to be reinvested at the ex-dividend date net asset value per share. |
| (5) | Portfolio turnover rate excludes portfolio securities received or delivered as a result of processing capital share transactions in creations or redemptions. (Note 7 |
See accompanying notes which are an integral part of these financial statements.
| LeaderShares® AlphaFactor® US Core Equity ETF |
| FINANCIAL HIGHLIGHTS |
| |
| Per Share Data and Ratios for a Share of Beneficial Interest Outstanding Throughout the Year Presented |
| | | For the Year | | | For the Year | | | For the Year | | | For the Year | | | For the Year | |
| | | Ended | | | Ended | | | Ended | | | Ended | | | Ended | |
| | | October 31, 2024 | | | October 31, 2023 | | | October 31, 2022 | | | October 31, 2021 | | | October 31, 2020 | |
| Net asset value, beginning of year | | $ | 30.58 | | | $ | 30.18 | | | $ | 33.72 | | | $ | 24.72 | | | $ | 25.44 | |
| Activity from investment operations: | | | | | | | | | | | | | | | | | | | | |
| Net investment income (1) | | | 0.18 | | | | 0.27 | | | | 0.27 | | | | 0.11 | | | | 0.17 | |
| Net realized and unrealized gain (loss) on investments | | | 10.40 | | | | 0.23 | | | | (3.56 | ) | | | 8.99 | | | | (0.71 | ) |
| Total from investment operations | | | 10.58 | | | | 0.50 | | | | (3.29 | ) | | | 9.10 | | | | (0.54 | ) |
| Less distributions from: | | | | | | | | | | | | | | | | | | | | |
| Net investment income | | | (0.29 | ) | | | (0.10 | ) | | | (0.25 | ) | | | (0.10 | ) | | | (0.18 | ) |
| Return of capital | | | — | | | | — | | | | — | | | | — | | | | (0.00 | ) * |
| Total distributions | | | (0.29 | ) | | | (0.10 | ) | | | (0.25 | ) | | | (0.10 | ) | | | (0.18 | ) |
| Net asset value, end of year | | $ | 40.87 | | | $ | 30.58 | | | $ | 30.18 | | | $ | 33.72 | | | $ | 24.72 | |
| Market price, end of year | | $ | 40.85 | | | $ | 30.56 | | | $ | 30.20 | | | $ | 33.78 | | | $ | 24.72 | |
| Total return (2) | | | 34.79 | % | | | 1.66 | % | | | (9.76 | )% | | | 36.84 | % | | | (2.09 | )% |
| Net assets, at end of year (000s) | | $ | 156,311 | | | $ | 155,180 | | | $ | 146,385 | | | $ | 123,093 | | | $ | 73,540 | |
| Ratio of expenses to average net assets | | | 0.75 | % | | | 0.75 | % | | | 0.75 | % | | | 0.75 | % | | | 0.75 | % |
| Ratio of net investment income to average net assets | | | 0.49 | % | | | 0.85 | % | | | 0.88 | % | | | 0.35 | % | | | 0.70 | % |
| Portfolio Turnover Rate (3) | | | 146 | % | | | 136 | % | | | 150 | % | | | 177 | % | | | 181 | % |
| * | Represents less than $0.01 per share. |
| (1) | Per share amounts calculated using the average shares method, which more appropriately presents the per share data for each year/period. |
| (2) | Total return is calculated assuming a purchase of shares at net asset value on the first day and a sale at net asset value on the last day of the period. Distributions are assumed, for the purpose of this calculation, to be reinvested at the ex-dividend date net asset value per share. |
| (3) | Portfolio turnover rate excludes portfolio securities received or delivered as a result of processing capital share transactions in creations or redemptions. (Note 7) |
See accompanying notes which are an integral part of these financial statements.
| LeaderShares® Equity Skew ETF |
| FINANCIAL HIGHLIGHTS |
| |
| Per Share Data and Ratios for a Share of Beneficial Interest Outstanding Throughout the Year/Period Presented |
| | | For the Year | | | For the Year | | | For the Year | | | For the Year | | | For the Period | |
| | | Ended | | | Ended | | | Ended | | | Ended | | | Ended | |
| | | October 31, 2024 | | | October 31, 2023 | | | October 31, 2022 | | | October 31, 2021 | | | October 31, 2020* | |
| Net asset value, beginning of year/period | | $ | 27.73 | | | $ | 28.32 | | | $ | 37.34 | | | $ | 28.06 | | | $ | 25.00 | |
| Activity from investment operations: | | | | | | | | | | | | | | | | | | | | |
| Net investment income (1) | | | 0.37 | | | | 0.27 | | | | 0.30 | | | | 0.28 | | | | 0.09 | |
| Net realized and unrealized gain (loss) on investments | | | 5.90 | | | | (0.75 | ) | | | (6.31 | ) | | | 10.67 | | | | 2.97 | |
| Total from investment operations | | | 6.27 | | | | (0.48 | ) | | | (6.01 | ) | | | 10.95 | | | | 3.06 | |
| Less distributions from: | | | | | | | | | | | | | | | | | | | | |
| Net investment income | | | (0.37 | ) | | | (0.11 | ) | | | (0.46 | ) | | | (0.26 | ) | | | — | |
| Net realized gains | | | — | | | | — | | | | — | | | | (1.41 | ) | | | — | |
| Return of capital | | | — | | | | — | | | | (2.55 | ) | | | — | | | | — | |
| Total distributions | | | (0.37 | ) | | | (0.11 | ) | | | (3.01 | ) | | | (1.67 | ) | | | — | |
| Net asset value, end of year/period | | $ | 33.63 | | | $ | 27.73 | | | $ | 28.32 | | | $ | 37.34 | | | $ | 28.06 | |
| Market price, end of year/period | | $ | 33.67 | | | $ | 27.69 | | | $ | 28.27 | | | $ | 37.41 | | | $ | 27.83 | |
| Total return (2) | | | 22.73 | % | | | (1.69 | )% | | | (17.47 | )% | | | 40.17 | % | | | 12.24 | % (4) |
| Net assets, at end of year/period (000s) | | $ | 100,064 | | | $ | 133,812 | | | $ | 116,817 | | | $ | 105,478 | | | $ | 54,020 | |
| Ratio of expenses to average net assets | | | 0.75 | % | | | 0.75 | % | | | 0.75 | % | | | 0.75 | % | | | 0.75 | % (3) |
| Ratio of net investment income to average net assets | | | 1.14 | % | | | 0.92 | % | | | 0.95 | % | | | 0.80 | % | | | 0.71 | % (3) |
| Portfolio Turnover Rate (5) | | | 190 | % | | | 143 | % | | | 184 | % | | | 58 | % | | | 57 | % (4) |
| * | Fund commenced operation on May 11, 2020. |
| (1) | Per share amounts calculated using the average shares method, which more appropriately presents the per share data for each year/period. |
| (2) | Total return is calculated assuming a purchase of shares at net asset value on the first day and a sale at net asset value on the last day of the period. Distributions are assumed, for the purpose of this calculation, to be reinvested at the ex-dividend date net asset value per share. |
| (5) | Portfolio turnover rate excludes portfolio securities received or delivered as a result of processing capital share transactions in creations or redemptions. (Note 7) |
See accompanying notes which are an integral part of these financial statements.
| LeaderShares® Dynamic Yield ETF |
| FINANCIAL HIGHLIGHTS |
| |
| Per Share Data and Ratios for a Share of Beneficial Interest Outstanding Throughout the Year/Period Presented |
| | | For the Year | | | For the Year | | | For the Year | | | For the Period | |
| | | Ended | | | Ended | | | Ended | | | Ended | |
| | | October 31, 2024 | | | October 31, 2023 | | | October 31, 2022 | | | October 31, 2021 * | |
| Net asset value, beginning of year/period | | $ | 21.59 | | | $ | 21.60 | | | $ | 25.07 | | | $ | 25.00 | |
| Activity from investment operations: | | | | | | | | | | | | | | | | |
| Net investment income (1) | | | 1.00 | | | | 0.72 | | | | 0.36 | | | | 0.18 | |
| Net realized and unrealized gain (loss) on investments | | | 1.09 | | | | (0.03 | ) | | | (3.46 | ) | | | 0.04 | |
| Total from investment operations | | | 2.09 | | | | 0.69 | | | | (3.10 | ) | | | 0.22 | |
| Less distributions from: | | | | | | | | | | | | | | | | |
| Net investment income | | | (0.99 | ) | | | (0.70 | ) | | | (0.36 | ) | | | (0.15 | ) |
| Net realized gains | | | — | | | | — | | | | (0.01 | ) | | | — | |
| Total distributions | | | (0.99 | ) | | | (0.70 | ) | | | (0.37 | ) | | | (0.15 | ) |
| Net asset value, end of year/period | | $ | 22.69 | | | $ | 21.59 | | | $ | 21.60 | | | $ | 25.07 | |
| Market price, end of year/period | | $ | 22.64 | | | $ | 21.54 | | | $ | 21.61 | | | $ | 25.12 | |
| Total return (2) | | | 9.80 | % | | | 3.17 | % | | | (12.45 | )% | | | 0.88 | % (4) |
| Net assets, at end of year/period (000s) | | $ | 68,080 | | | $ | 88,516 | | | $ | 89,653 | | | $ | 71,461 | |
| Ratio of expenses to average net assets | | | 0.75 | % | | | 0.75 | % | | | 0.75 | % | | | 0.75 | % (3) |
| Ratio of net investment income to average net assets | | | 4.43 | % | | | 3.23 | % | | | 1.58 | % | | | 2.11 | % (3) |
| Portfolio Turnover Rate (5) | | | 47 | % | | | 0 | % | | | 66 | % | | | 6 | % (4) |
| * | Fund commenced operation on June 28, 2021. |
| (1) | Per share amounts calculated using the average shares method, which more appropriately presents the per share data for each year/period. |
| (2) | Total return is calculated assuming a purchase of shares at net asset value on the first day and a sale at net asset value on the last day of the period. Distributions are assumed, for the purpose of this calculation, to be reinvested at the ex-dividend date net asset value per share. |
| (5) | Portfolio turnover rate excludes portfolio securities received or delivered as a result of processing capital share transactions in creations or redemptions. (Note 7) |
See accompanying notes which are an integral part of these financial statements.
| LeaderShares® ETFs |
| NOTES TO FINANCIAL STATEMENTS |
| October 31, 2024 |
The LeaderShares® Activist Leaders® ETF, LeaderShares® AlphaFactor® Tactical Focused ETF, LeaderShares® AlphaFactor® US Core Equity ETF, LeaderShares® Equity Skew ETF, and LeaderShares® Dynamic Yield ETF (each, a “Fund” and collectively the “Funds”) are each a series of shares of beneficial interest of the Two Roads Shared Trust (the “Trust”), a statutory trust organized under the laws of the State of Delaware on June 8, 2012, and registered under the Investment Company Act of 1940, as amended (the “1940 Act”), as diversified, open-end management investment companies. The LeaderShares® Activist Leaders® ETF, LeaderShares® AlphaFactor® Tactical Focused ETF and LeaderShares® Equity Skew ETF seek to generate long-term capital growth. The LeaderShares® AlphaFactor® US Core Equity ETF seeks to provide investment results that correspond generally, before fees and expenses, to the performance of the AlphaFactor® US Core Equity Index. The LeaderShares® Dynamic Yield ETF seeks current income. The LeaderShares® AlphaFactor® US Core Equity ETF commenced operations on October 1, 2018. The LeaderShares® Equity Skew ETF commenced operations May 11, 2020. The LeaderShares® Activist Leaders® ETF and LeaderShares®AlphaFactor® Tactical Focused ETF commenced operations on October 26, 2020. The LeaderShares® Dynamic Yield ETF commenced operations on June 28, 2021. The LeaderShares® Equity Skew ETF is a “fund of funds” in that Fund will generally invest in other investment companies.
| 2. | SIGNIFICANT ACCOUNTING POLICIES |
The following is a summary of significant accounting policies followed by the Funds in preparation of their financial statements. These policies are in conformity with accounting principles generally accepted in the United States of America (“GAAP”). The preparation of financial statements requires management to make estimates and assumptions that affect the reported amounts of assets and liabilities and disclosure of contingent assets and liabilities at the date of the financial statements and the reported amounts of increases and decreases in net assets from operations during the reporting period. Actual results could differ from those estimates. The Funds are investment companies and accordingly follow the investment company accounting and reporting guidance of the Financial Accounting Standards Board (“FASB”) Accounting Standards Codification Topic 946 “Financial Services – Investment Companies” including FASB Accounting Standards Update ASU 2013-08.
Security Valuation – Securities listed on an exchange are valued at the last quoted sale price at the close of the regular trading session of the exchange on the business day the value is being determined, or in the case of securities listed on NASDAQ at the NASDAQ Official Closing Price. In the absence of a sale, such securities shall be valued at the mean between the current bid and ask prices on the day of valuation. Debt securities not traded on an exchange may be valued at prices supplied by a pricing agent(s) based on broker or dealer supplied valuations or matrix pricing, a method of valuing securities by reference to the value of other securities with similar characteristics, such as rating, interest rate and maturity. The independent pricing service does not distinguish between smaller-sized bond positions known as “odd lots” and larger institutional-sized bond positions known as “round lots”. The Funds may fair value a particular bond if the adviser does not believe that the round lot value provided by the independent pricing service reflects fair value of the Funds’ holding. Short-term debt obligations having 60 days or less remaining until maturity, at time of purchase may be valued at amortized cost (which approximates fair value). Investments in open-end investment companies are valued at net asset value.
| LeaderShares® ETFs |
| NOTES TO FINANCIAL STATEMENTS (Continued) |
| October 31, 2024 |
Valuation of Underlying Funds – The Funds may invest in portfolios of open-end or closed-end investment companies (the “Underlying Funds”). The Underlying Funds value securities in their portfolios for which market quotations are readily available at their market values (generally the last reported sale price) and all other securities and assets at their fair value to the methods established by the board of directors of the Underlying Funds.
Open-end funds are valued at their respective net asset values as reported by such investment companies. The shares of many exchange-traded and many closed-end investment companies, after their initial public offering, frequently trade at a price per share, which is different than the net asset value per share. The difference represents a market premium or market discount of such shares. There can be no assurances that the market discount or premium on shares of any closed-end investment company purchased by the Funds will not change.
Exchange Traded Funds – The Funds may invest in exchange traded funds (“ETFs”). ETFs are a type of index fund bought and sold on a securities exchange. An ETF trades like common stock and may be actively traded or represent a fixed portfolio of securities designed to track the performance and dividend yield of a particular domestic or foreign market index. The risks of owning an ETF generally reflect the risks of owning the underlying securities they are designed to track, although the lack of liquidity on an ETF could result in it being more volatile. Each ETF is subject to specific risks, depending on the nature of the ETF. Additionally, ETFs have fees and expenses that reduce their value.
The Funds may hold securities, such as private investments, interests in commodity pools, other non-traded securities or temporarily illiquid securities, for which market quotations are not readily available or are determined to be unreliable. These securities are valued using the “fair value” procedures approved by the Board of Trustees of the Trust (the “Board”). The Board has appointed the Funds’ Adviser as its valuation designee (the “Valuation Designee”) for all fair value determinations and responsibilities, other than overseeing pricing service providers used by the Trust. This designation is subject to Board oversight and certain reporting and other requirements designed to facilitate the Board’s ability effectively to oversee the fair value determinations. The Board may also enlist third party consultants such a valuation specialist at a public accounting firm, valuation consultant or financial officer of a security issuer on an as -needed basis to assist the Valuation Designee in determining a security-specific fair value. The Board is responsible for reviewing and approving fair value methodologies utilized by the Valuation Designee, approval of which shall be based upon whether the Valuation Designee followed the valuation procedures approved by the Board.
Fair Valuation Process – The applicable investments are valued by the Valuation Designee pursuant to valuation procedures approved by the Board. For example, fair value determinations are required for the following securities: (i) securities for which market quotations are insufficient or not readily available on a particular business day (including securities for which there is a short and temporary lapse in the provision of a price by the regular pricing source); (ii) securities for which, in the judgment of the Valuation Designee, the prices or values available do not represent the fair value of the instrument; factors which may cause the Valuation Designee to make such a judgment include, but are not limited to, the following: only a bid price or an asked price is available; the spread between bid and
| LeaderShares® ETFs |
| NOTES TO FINANCIAL STATEMENTS (Continued) |
| October 31, 2024 |
asked prices is substantial; the frequency of sales; the thinness of the market; the size of reported trades; and actions of the securities markets, such as the suspension or limitation of trading; (iii) securities determined to be illiquid; and (iv) securities with respect to which an event that affects the value thereof has occurred (a “significant event”) since the closing prices were established on the principal exchange on which they are traded, but prior to each Fund’s calculation of its net asset value. Specifically, interests in commodity pools or managed futures pools are valued on a daily basis by reference to the closing market prices of each futures contract or other asset held by a pool, as adjusted for pool expenses. Restricted or illiquid securities, such as private investments or non-traded securities are valued based upon the current bid for the security from two or more independent dealers or other parties reasonably familiar with the facts and circumstances of the security (who should take into consideration all relevant factors as may be appropriate under the circumstances). If a current bid from such independent dealers or other independent parties is unavailable, the Valuation Designee shall determine the fair value of such security using the following factors: (i) the type of security; (ii) the cost at date of purchase; (iii) the size and nature of the Fund’s holdings; (iv) the discount from market value of unrestricted securities of the same class at the time of purchase and subsequent thereto; (v) information as to any transactions or offers with respect to the security; (vi) the nature and duration of restrictions on disposition of the security and the existence of any registration rights; (vii) how the yield of the security compares to similar securities of companies of similar or equal creditworthiness; (viii) the level of recent trades of similar or comparable securities; (ix) the liquidity characteristics of the security; (x) current market conditions; and (xi) the market value of any securities into which the security is convertible or exchangeable.
The Funds utilize various methods to measure the fair value of all of their investments on a recurring basis. GAAP establishes a hierarchy that prioritizes inputs to valuation methods. The three levels of input are:
Level 1 – Unadjusted quoted prices in active markets for identical assets and liabilities that the Fund has the ability to access.
Level 2 – Observable inputs other than quoted prices included in Level 1 that are observable for the asset or liability, either directly or indirectly. These inputs may include quoted prices for the identical instrument on an inactive market, prices for similar instruments, interest rates, prepayment speeds, credit risk, yield curves, default rates and similar data.
Level 3 – Unobservable inputs for the asset or liability, to the extent relevant observable inputs are not available, representing the Fund’s own assumptions about the assumptions a market participant would use in valuing the asset or liability, and would be based on the best information available.
The availability of observable inputs can vary from security to security and is affected by a wide variety of factors, including, for example, the type of security, whether the security is new and not yet established in the marketplace, the liquidity of markets, and other characteristics particular to the security. To the extent that valuation is based on models or inputs that are less observable or unobservable in the market, the determination of fair value requires more judgment. Accordingly, the degree of judgment exercised in determining fair value is greatest for instruments categorized in Level 3.
| LeaderShares® ETFs |
| NOTES TO FINANCIAL STATEMENTS (Continued) |
| October 31, 2024 |
The inputs used to measure fair value may fall into different levels of the fair value hierarchy. In such cases, for disclosure purposes, the level in the fair value hierarchy within which the fair value measurement falls in its entirety, is determined based on the lowest level input that is significant to the fair value measurement in its entirety.
The inputs or methodology used for valuing securities are not necessarily an indication of the risk associated with investing in those securities. The following tables summarize the inputs used as of October 31, 2024, for the Funds’ investments measured at fair value:
| LeaderShares®Activist Leaders® ETF | |
| | | | | | | | | | | | | |
| Assets * | | Level 1 | | | Level 2 | | | Level 3 | | | Total | |
| Common Stocks | | $ | 69,344,349 | | | $ | — | | | $ | — | | | $ | 69,344,349 | |
| Total | | $ | 69,344,349 | | | $ | — | | | $ | — | | | $ | 69,344,349 | |
| | | | | | | | | | | | | | | | | |
| LeaderShares®AlphaFactor® Tactical Focused ETF | |
| | | | | | | | | | | | | |
| Assets * | | Level 1 | | | Level 2 | | | Level 3 | | | Total | |
| Common Stocks | | $ | 120,937,699 | | | $ | — | | | $ | — | | | $ | 120,937,699 | |
| Total | | $ | 120,937,699 | | | $ | — | | | $ | — | | | $ | 120,937,699 | |
| | | | | | | | | | | | | | | | | |
| LeaderShares®AlphaFactor® US Core Equity ETF | |
| | | | | | | | | | | | | |
| Assets * | | Level 1 | | | Level 2 | | | Level 3 | | | Total | |
| Common Stocks | | $ | 154,743,417 | | | $ | — | | | $ | — | | | $ | 154,743,417 | |
| Total | | $ | 154,743,417 | | | $ | — | | | $ | — | | | $ | 154,743,417 | |
| | | | | | | | | | | | | | | | | |
| LeaderShares®Equity Skew ETF | |
| | | | | | | | | | | | | |
| Assets * | | Level 1 | | | Level 2 | | | Level 3 | | | Total | |
| Exchange-Traded Funds | | | 99,189,860 | | | $ | — | | | $ | — | | | | 99,189,860 | |
| Total | | $ | 99,189,860 | | | $ | — | | | $ | — | | | $ | 99,189,860 | |
| | | | | | | | | | | | | | | | | |
| LeaderShares®Dynamic Yield ETF | |
| | | | | | | | | | | | | |
| Assets * | | Level 1 | | | Level 2 | | | Level 3 | | | Total | |
| Corporate Bonds | | $ | — | | | $ | 34,507,551 | | | $ | — | | | $ | 34,507,551 | |
| U.S. Government & Agencies | | | — | | | | 27,458,569 | | | | — | | | | 27,458,569 | |
| Total | | $ | — | | | $ | 61,966,120 | | | $ | — | | | $ | 61,966,120 | |
| | | | | | | | | | | | | | | | | |
The Funds did not hold any Level 3 securities during the year.
| * | See Schedule of Investments for industry classification. |
Security Transactions and Related Income – Security transactions are accounted for on the trade date. Interest income is recognized on an accrual basis. Discounts are accreted and premiums are amortized on securities purchased over the lives of the respective securities. Dividend income is recorded on the ex-dividend date. Realized gains or losses from sales of securities are determined by comparing the identified cost of the security lot sold with the net sales proceeds. Withholding taxes on foreign dividends have been provided for in accordance with the Funds’ understanding of the applicable country’s tax rules and rates.
| LeaderShares® ETFs |
| NOTES TO FINANCIAL STATEMENTS (Continued) |
| October 31, 2024 |
Dividends and Distributions to Shareholders – For the LeaderShares® Activist Leader® ETF, LeaderShares® AlphaFactor® Tactical Focused ETF, LeaderShares® AlphaFactor® US Core Equity ETF and the LeaderShares® US Equity Skew ETF, dividends from net investment income, if any, are declared and paid annually. For the LeaderShares® Dynamic Yield ETF, dividends from net investment income, if any, are declared and paid monthly. Distributable net realized capital gains, if any, are declared and distributed annually. Dividends from net investment income and distributions from net realized gains are determined in accordance with federal income tax regulations, which may differ from GAAP. These “book/tax” differences are considered either temporary (e.g., deferred losses) or permanent in nature. To the extent these differences are permanent in nature, such amounts are reclassified within the composition of net assets based on their federal tax-basis treatment; temporary differences do not require reclassification. Quarterly distributions in excess of ordinary taxable income are treated as returns of capital. Dividends and distributions to shareholders are recorded on the ex-dividend date.
Cash – The Funds consider their investments in an FDIC insured interest bearing savings account to be cash. The Funds maintain cash balances, which, at times, may exceed federally insured limits. The Funds maintain these balances with a high quality financial institution.
Option Transactions – The Funds are subject to equity price risk in the normal course of pursuing their investment objective and may purchase or sell options to help hedge against risk. When a Fund writes put and call options, an amount equal to the premium received is included in the statement of assets and liability as a liability. The amount of the liability is subsequently marked-to-market to reflect the current market value of the option. If an option expires on its stipulated expiration date or if a Fund enters into a closing purchase transaction, a gain or loss is realized. If a written call option is exercised, a gain or loss is realized for the sale of the underlying security and the proceeds from the sale are increased by the premium originally received. As writer of an option, the Funds have no control over whether the option will be exercised and, as a result, retain the market risk of an unfavorable change in the price of the security underlying the written option.
Put options are purchased to hedge against a decline in the value of securities held in the Funds’ portfolio. If such a decline occurs, the put options will permit the Funds to sell the securities underlying such options at the exercise price, or to close out the options at a profit. The premium paid for a put or call option plus any transaction costs will reduce the benefit, if any, realized by the Funds upon exercise of the option, and, unless the price of the underlying security rises or declines sufficiently, the option may expire worthless to the Funds. In addition, in the event that the price of the security in connection with which an option was purchased moves in a direction favorable to the Funds, the benefits realized by the Funds as a result of such favorable movement will be reduced by the amount of the premium paid for the option and related transaction costs. Written and purchased options are non-income producing securities. With purchased options, there is minimal counterparty risk to the Funds since these options are exchange traded and the exchange’s clearinghouse, as counterparty to all exchange traded options, guarantees against a possible default. There were no options held at October 31, 2024 and there were no options transactions for the year ended October 31, 2024.
| LeaderShares® ETFs |
| NOTES TO FINANCIAL STATEMENTS (Continued) |
| October 31, 2024 |
Federal Income Taxes – It is each Fund’s policy to qualify as a regulated investment company by complying with the provisions of the Internal Revenue Code that are applicable to regulated investment companies and to distribute substantially all of their taxable income and net realized gains to shareholders. Therefore, no federal income tax provision has been recorded.
Management has analyzed the Funds’ tax positions and has concluded that no liability for unrecognized tax benefits should be recorded related to uncertain tax positions taken on returns filed for open tax years ended October 31, 2021 to October 31, 2023 or expected to be taken in the Funds’ October 31, 2024 year-end tax returns. The Funds identify their major tax jurisdictions as U.S. Federal, Ohio and foreign jurisdictions where the Funds make significant investments; however the Funds are not aware of any tax positions for which it is reasonably expected that the total amounts of unrecognized tax benefits will change materially in the next twelve months.
The Funds recognize interest and penalties, if any, related to unrecognized tax benefits as income tax expense in the Statements of Operations. During the period, the Funds did not incur any interest or penalties.
Indemnification – The Trust indemnifies its officers and Trustees for certain liabilities that may arise from the performance of their duties to the Trust. Additionally, in the normal course of business, the Funds enter into contracts that contain a variety of representations and warranties and which provide general indemnities. The Funds’ maximum exposure under these arrangements is unknown, as this would involve future claims that may be made against the Funds that have not yet occurred. However, the risk of loss due to these warranties and indemnities appears to be remote.
| LeaderShares® ETFs |
| NOTES TO FINANCIAL STATEMENTS (Continued) |
| October 31, 2024 |
| 3. | INVESTMENT TRANSACTIONS |
For the year ended October 31, 2024, cost of purchases and proceeds from sales of portfolio securities (excluding in-kind transactions and short-term investments), as well as cost of purchases and proceeds from sales of portfolio securities for in-kind transactions amounted to:
| | | Purchases | | | Sales | |
| | | | | | U.S. Gov’t | | | | | | U.S. Gov’t | |
| | | Other | | | Obligations | | | Other | | | Obligations | |
| LeaderShares® Activist Leaders® ETF | | $ | 77,484,873 | | | $ | — | | | $ | 76,531,286 | | | $ | — | |
| LeaderShares® AlphaFactor® Tactical Focused ETF | | | 274,268,145 | | | | — | | | | 327,787,910 | | | | — | |
| LeaderShares® AlphaFactor® US Core Equity ETF | | | 233,829,772 | | | | — | | | | 235,481,144 | | | | — | |
| LeaderShares® Equity Skew ETF | | | 246,160,260 | | | | — | | | | 246,783,973 | | | | — | |
| LeaderShares® Dynamic Yield ETF | | | 18,425,888 | | | | 51,217 | | | | 17,461,089 | | | | 1,040,470 | |
| | | | | | | | | | | | | | | | | |
| | | Purchases In-Kind | | | Sales In-Kind | |
| | | | | | U.S. Gov’t | | | | | | U.S. Gov’t | |
| | | Other | | | Obligations | | | Other | | | Obligations | |
| LeaderShares® Activist Leaders® ETF | | $ | 51,548,307 | | | $ | — | | | $ | 83,351,693 | | | $ | — | |
| LeaderShares® AlphaFactor® Tactical Focused ETF | | | 120,163,481 | | | | — | | | | 162,020,163 | | | | — | |
| LeaderShares® AlphaFactor® US Core Equity ETF | | | 193,397,642 | | | | — | | | | 233,433,342 | | | | — | |
| LeaderShares® Equity Skew ETF | | | 162,455,892 | | | | — | | | | 219,537,835 | | | | — | |
| LeaderShares® Dynamic Yield ETF | | | — | | | | — | | | | 12,160,392 | | | | 2,172,831 | |
| 4. | INVESTMENT ADVISORY AGREEMENT AND TRANSACTIONS WITH RELATED PARTIES |
Redwood Investment Management, LLC serves as the Funds’ Investment Adviser (the “Adviser”). Pursuant to investment advisory agreements with the Funds, the Adviser, under the oversight of the Board, directs the daily operations of the Funds and supervises the performance of administrative and professional services provided by others. As compensation for its services and the related expenses borne by the Adviser, the LeaderShares® Activist Leaders® ETF, LeaderShares® AlphaFactor®Tactical Focused ETF, LeaderShares® AlphaFactor® US Core Equity ETF, LeaderShares ® Equity Skew ETF, and LeaderShares® Dynamic Yield ETF pay the Adviser a unitary management fee, computed and accrued daily and paid monthly, at an annual rate of 0.75%, 0.99%, 0.75%, 0.75% and 0.75% respectively of each Funds’ average daily net assets. For the year ended October 31, 2024 the Funds incurred the following advisory fees:
| | | Investment Advisory Fees | |
| LeaderShares® Activist Leaders® ETF | | $ | 615,328 | |
| LeaderShares® AlphaFactor® Tactical Focused ETF | | | 1,388,273 | |
| LeaderShares® AlphaFactor® US Core Equity ETF | | | 1,109,457 | |
| LeaderShares® Equity Skew ETF | | | 896,976 | |
| LeaderShares® Dynamic Yield ETF | | | 548,013 | |
| LeaderShares® ETFs |
| NOTES TO FINANCIAL STATEMENTS (Continued) |
| October 31, 2024 |
The Adviser’s unitary management fee is designed to pay the Funds’ expenses and to compensate the Adviser for providing services for the Funds. Out of the unitary management fee, the Adviser pays substantially all expenses of the Funds, including the costs of transfer agency, custody, fund administration, legal, audit and other services and Independent Trustees’ fees, but not payments under the Funds’ 12b-1 plan, brokerage fees and commissions, taxes, borrowing costs (such as dividend expense on securities sold short and interest), fees and expenses of other investment companies in which the Funds may invest, and extraordinary or non-recurring expenses (including litigation to which the Trust or the Funds may be a party and indemnification of the Trustees and officers with respect thereto). The Adviser, and not the Funds’ shareholders, would benefit from any reduction in fees paid for third-party services, including reductions based on increases in net assets.
The Funds have adopted a distribution and service plan (“Plan”) pursuant to Rule 12b-1 under the 1940 Act. Under the Plan, the Funds are authorized to pay distribution fees to the distributor and other firms that provide distribution and shareholder services (“Service Providers”). If a Service Provider provides these services, the Funds may pay fees at an annual rate not to exceed 0.25% of average daily net assets, pursuant to Rule 12b-1 under the 1940 Act. No distribution or service fees are currently paid by the Funds, and there are no current plans to impose these fees. In the event Rule 12b-1 fees were charged, over time they would increase the cost of an investment in the Funds. Northern Lights Distributors, LLC, the Funds’ distributor (the “Distributor”), its affiliates, and the Funds’ Adviser or its affiliates may, at their own expense and out of their own legitimate profits, provide additional cash payments to financial intermediaries who sell shares of the Funds, including affiliates of the Adviser.
Ultimus Fund Solutions, LLC (“UFS”) – UFS, an affiliate of the Distributor, provides administration and fund accounting services to the Funds. Pursuant to a separate servicing agreement with UFS, the Adviser on behalf of the Funds pay UFS customary fees for providing administration and fund accounting services to the Funds. Certain officers of the Trust are also officers of UFS, and are not paid any fees directly by the Funds for serving in such capacities.
Northern Lights Compliance Services, LLC (“NLCS”) – NLCS, an affiliate of UFS and the Distributor, provides a Chief Compliance Officer to the Trust, as well as related compliance services, pursuant to a consulting agreement between NLCS and the Funds. Under the terms of such agreement, NLCS receives customary fees from the Adviser on behalf of the Funds. The Chief Compliance Officer of the Trust is also an officer of NLCS, and is not paid any fees directly by the Adviser or Funds for serving in such capacity.
Blu Giant, LLC (“Blu Giant”) – Blu Giant, an affiliate of UFS and the Distributor, provides EDGAR conversion and filing services as well as print management services for the Funds on an ad-hoc basis. For the provision of these services, Blu Giant receives customary fees from the Adviser on behalf of the Funds.
| LeaderShares® ETFs |
| NOTES TO FINANCIAL STATEMENTS (Continued) |
| October 31, 2024 |
| 5. | AGGREGATE UNREALIZED APPRECIATION AND DEPRECIATION – TAX BASIS |
The identified cost of investments in securities owned by the Funds for federal income tax purposes and its respective gross unrealized appreciation and depreciation at October 31, 2024, was as follows:
| | | Cost for | | | | | | | | | Tax Net | |
| | | Federal Tax | | | Unrealized | | | Unrealized | | | Unrealized | |
| Portfolio | | Purposes | | | Appreciation | | | Depreciation | | | App/Dep | |
| LeaderShares® Activist Leaders® ETF | | $ | 72,690,235 | | | $ | 4,983,372 | | | $ | (8,329,258 | ) | | $ | (3,345,886 | ) |
| LeaderShares® AlphaFactor® Tactical Focused ETF | | | 107,656,223 | | | | 16,990,398 | | | | (3,708,922 | ) | | | 13,281,476 | |
| LeaderShares® AlphaFactor® US Core Equity ETF | | | 139,010,308 | | | | 18,831,233 | | | | (3,098,124 | ) | | | 15,733,109 | |
| LeaderShares® Equity Skew ETF | | | 99,611,307 | | | | 1,119,247 | | | | (1,540,694 | ) | | | (421,447 | ) |
| LeaderShares® Dynamic Yield ETF | | | 63,530,232 | | | | 424,293 | | | | (1,988,405 | ) | | | (1,564,112 | ) |
| 6. | FEDERAL INCOME TAX NOTE |
Management has analyzed the Funds’ tax positions and has concluded that no liability for unrecognized tax benefits should be recorded related to uncertain tax positions taken on returns filed for open tax years or expected to be taken in the Funds’ October 31, 2024 year-end tax returns.
| 7. | DISTRIBUTIONS TO SHAREHOLDERS AND TAX COMPONENTS OF CAPITAL |
The tax character of fund distributions paid for the year ended October 31, 2024 and October 31, 2023 was as follows:
| For the period ended October 31, 2024: |
| | | Ordinary | | | Long-Term | | | Return | | | Tax Exempt | | | | |
| Portfolio | | Income | | | Capital Gains | | | of Capital | | | Income | | | Total | |
| LeaderShares® Activist Leaders ETF | | $ | 1,076,375 | | | $ | — | | | $ | — | | | $ | — | | | $ | 1,076,375 | |
| LeaderShares® AlphaFactor Tactical Focused ETF | | | 2,646,455 | | | | — | | | | — | | | | — | | | | 2,646,455 | |
| LeaderShares® AlphaFactor® US Core Equity ETF | | | 1,243,170 | | | | — | | | | — | | | | — | | | | 1,243,170 | |
| LeaderShares® Equity Skew ETF | | | 1,535,565 | | | | — | | | | — | | | | — | | | | 1,535,565 | |
| LeaderShares® Dynamic Yield ETF | | | 3,187,125 | | | | — | | | | — | | | | — | | | | 3,187,125 | |
| | | | | | | | | | | | | | | | | | | | | |
| For the period ended October 31, 2023: |
| | | Ordinary | | | Long-Term | | | Return | | | Tax Exempt | | | | |
| Portfolio | | Income | | | Capital Gains | | | of Capital | | | Income | | | Total | |
| LeaderShares® Activist Leaders ETF | | $ | 243,068 | | | $ | — | | | $ | — | | | $ | — | | | $ | 243,068 | |
| LeaderShares® AlphaFactor Tactical Focused ETF | | | 596,625 | | | | — | | | | — | | | | — | | | | 596,625 | |
| LeaderShares® AlphaFactor® US Core Equity ETF | | | 502,425 | | | | — | | | | — | | | | — | | | | 502,425 | |
| LeaderShares® Equity Skew ETF | | | 480,938 | | | | — | | | | — | | | | — | | | | 480,938 | |
| LeaderShares® Dynamic Yield ETF | | | 3,214,975 | | | | — | | | | — | | | | — | | | | 3,214,975 | |
| LeaderShares® ETFs |
| NOTES TO FINANCIAL STATEMENTS (Continued) |
| October 31, 2024 |
As of October 31, 2024, the components of accumulated earnings/ (deficit) on a tax basis were as follows:
| | | Undistributed | | | Undistributed | | | Post October Loss | | | Capital Loss | | | Other | | | Unrealized | | | Total | |
| | | Ordinary | | | Long-Term | | | and | | | Carry | | | Book/Tax | | | Appreciation/ | | | Accumulated | |
| Portfolio | | Income | | | Capital Gains | | | Late Year Loss | | | Forwards | | | Differences | | | (Depreciation) | | | Earnings/(Deficits) | |
| LeaderShares® Activist Leaders® ETF | | $ | 339,342 | | | $ | — | | | $ | — | | | $ | (36,306,005 | ) | | $ | — | | | $ | (3,345,915 | ) | | $ | (39,312,578 | ) |
| LeaderShares® AlphaFactor® Tactical Focused ETF | | | 1,119,499 | | | | — | | | | — | | | | (30,886,687 | ) | | | — | | | | 13,281,476 | | | | (16,485,712 | ) |
| LeaderShares® AlphaFactor® US Core Equity ETF | | | 417,188 | | | | — | | | | — | | | | (49,665,044 | ) | | | — | | | | 15,733,109 | | | | (33,514,747 | ) |
| LeaderShares® Equity Skew ETF | | | 576,420 | | | | — | | | | — | | | | (35,194,939 | ) | | | — | | | | (421,447 | ) | | | (35,039,966 | ) |
| LeaderShares® Dynamic Yield ETF | | | 167,969 | | | | — | | | | — | | | | (6,724,142 | ) | | | — | | | | (1,564,112 | ) | | | (8,120,285 | ) |
The difference between book basis and tax basis undistributed net investment income, accumulated net realized gains and unrealized appreciation/(depreciation) from investments is primarily attributable to the tax deferral of losses on wash sales, adjustments for debt modification and adjustments for C-Corps.
At October 31, 2024, the Fund had capital loss carry forwards for federal income tax purposes available to offset future capital gains, as follows:
| | | Non-Expiring | | | | | | | |
| Portfolio | | Short-Term | | | Long-Term | | | Total | | | CLCF Utilized | |
| LeaderShares®Activist Leaders ETF | | | 25,419,569 | | | | 10,886,436 | | | | 36,306,005 | | | | — | |
| LeaderShares® AlphaFactor® Tactical Focused ETF | | | 30,886,687 | | | | — | | | | 30,886,687 | | | | — | |
| LeaderShares® AlphaFactor® US Core Equity ETF | | | 46,930,313 | | | | 2,734,731 | | | | 49,665,044 | | | | — | |
| LeaderShares® Equity Skew ETF | | | 35,078,377 | | | | 116,562 | | | | 35,194,939 | | | | 436,621 | |
| LeaderShares® Dynamic Yield ETF | | | 3,034,628 | | | | 3,689,514 | | | | 6,724,142 | | | | — | |
Permanent book and tax differences, primarily attributable to the book/tax basis treatment of realized gain (loss) on in-kind redemptions, and adjustments for prior year tax returns resulted in reclassifications for the Funds for the year ended October 31, 2024 as follows:
| | | Paid in | | | Accumulated | |
| Portfolio | | Capital | | | Earnings (Losses) | |
| LeaderShares®Activist Leaders ETF | | $ | 14,519,098 | | | $ | (14,519,098 | ) |
| LeaderShares® AlphaFactor® Tactical Focused ETF | | | 11,762,936 | | | | (11,762,936 | ) |
| LeaderShares® AlphaFactor® US Core Equity ETF | | | 38,498,329 | | | | (38,498,329 | ) |
| LeaderShares® Equity Skew ETF | | | 20,926,584 | | | | (20,926,584 | ) |
| LeaderShares® Dynamic Yield ETF | | | (606,955 | ) | | | 606,955 | |
| 7. | CAPITAL SHARE TRANSACTIONS |
Shares are not individually redeemable and may be redeemed by the Funds at net asset value (“NAV”) only in large blocks known as “Creation Units.” Shares are created and redeemed by the Funds only in Creation Unit size aggregations of 25,000 shares. Only Authorized Participants are permitted to purchase or redeem Creation Units from the Funds. An Authorized Participant is either (i) a broker-dealer or other participant in the clearing process through the Continuous Net Settlement System of the National Securities Clearing Corporation or (ii) a Depository Trust Company participant and, in each case, must have executed a Participant Agreement with the Distributor. Such transactions are generally permitted on an in-kind basis, with a balancing cash component to equate the transaction to the NAV per share of
| LeaderShares® ETFs |
| NOTES TO FINANCIAL STATEMENTS (Continued) |
| October 31, 2024 |
the Funds on the transaction date. Cash may be substituted equivalent to the value of certain securities generally when they are not available in sufficient quantity for delivery, not eligible for trading by the Authorized Participant or as a result of other market circumstances. In addition, the Funds may impose transaction fees on purchases and redemptions of Funds shares to cover the custodial and other costs incurred by the Funds in effecting trades. A fixed fee payable to the custodian is imposed on each creation and redemption transaction regardless of the number of Creation Units involved in the transaction (“Fixed Fee”). Purchases and redemptions of Creation Units for cash or involving cash-in-lieu are required to pay an additional variable charge to compensate the Funds and its ongoing shareholders for brokerage and market impact expenses relating to Creation Unit transactions (“Variable Charge,” and together with the Fixed Fee, the “Transaction Fees”). Transactions in capital shares for the Funds are disclosed in the Statements of Changes in Net Assets.
Investors who use the services of a broker, or other such intermediary may be charged a fee for such services. The Transaction Fees for the Funds are listed in the tables below:
| LeaderShares® Activist Leaders® ETF, LeaderShares® AlphaFactor® Tactical Focused ETF, LeaderShares® AlphaFactor® US Core Equity ETF and LeaderShares® Equity Skew ETF |
| Fee for In-Kind and | Minimum Additional Variable | Maximum Additional Variable |
| Cash Purchases | Charge for Cash Purchases* | Charge for Cash Purchases* |
| $600 | 0.20% | 2.00% |
| | | |
| LeaderShares® Dynamic Yield ETF |
| Fee for In-Kind and | Minimum Additional Variable | Maximum Additional Variable |
| Cash Purchases | Charge for Cash Purchases* | Charge for Cash Purchases* |
| $500 | 0.20% | 2.00% |
| * | As a percentage of the amount invested. |
| 8. | PRINCIPAL INVESTMENT RISKS |
The Funds’ investments in securities and financial instruments expose it to various risks, certain of which are discussed below. Each Fund’s prospectus and statement of additional information include further information regarding the risks associated with each Fund’s investments. The Risks associated with the Funds’ investments include, but are not limited to:
LeaderShares® Activist Leaders® ETF: activist risk, active trading risk, authorized participant concentration risk, cybersecurity risk, equity risk, ETF structure risks, fluctuation of net asset value risk, gap risk, information technology sector risk, management risk, market capitalization risk, market risk, market events risk, quantitative investing risk, rules-based strategy risk, sector risk and volatility risk.
LeaderShares® AlphaFactor® Tactical Focused ETF: active trading risk, authorized participant concentration risk, cash positions risk, cybersecurity risk, equity risk, ETF structure risks, fluctuation of net asset value risk, focus risk, gap risk, investment companies risk, management risk, market capitalization risk, market risk, market events risk, money market instrument risk, quantitative investing risk, rules-based strategy risk, sector risk, tactical overlay strategy risk, underlying funds risk, U.S.
| LeaderShares® ETFs |
| NOTES TO FINANCIAL STATEMENTS (Continued) |
| October 31, 2024 |
Government securities risk, and volatility risk.
LeaderShares® AlphaFactor® US Core Equity ETF: active trading risk, authorized participant concentration risk, calculation methodology risk, concentration risk, consumer discretionary sector risk, cybersecurity risk, ETF structure risks, equity risk, financial sector risk, fluctuation of net asset value risk, gap risk, index risk, index tracking error risk, industrial sectors risk, information technology sector risk, management risk, market capitalization risk, market risk, market events risk, passive investment risk, portfolio turnover risk, retail sector risk, rules-based strategy risk, and volatility risk.
LeaderShares® Equity Skew ETF: active trading risk, authorized participant concentration risk, cybersecurity risk, equity risk, emerging markets risk, ETF structure risks, fluctuation of net asset value risk, foreign (Non-US) investments risk, gap risk, geographic and sector risk, investment companies Risk, management risk, market capitalization risk, market risk, market events risk, quantitative investing risk, and underlying funds risk.
LeaderShares® Dynamic Yield ETF: active trading risk, asset allocation risk, authorized participant concentration risk, bank loan risk, cash positions risk, convertible securities risk, credit risk, credit spread risk, currency risk, cybersecurity risk, emerging markets risk, ETF structure risk, equity risk, fixed income securities risk, fluctuation of net asset value risk, foreign (Non-US) investments risk, gap risk, high yield risk, index risk, investment companies risk, issuer-specific risk, leveraging risk, LIBOR risk, liquidity risk, management risk, market events risk, market risk, model risk, mortgage-backed and asset-backed securities risk, new fund risk, odd lot pricing risk, portfolio turnover risk, prepayment and extension risk, regulatory risk, sector risk, swap risk, underlying funds risk, US government securities risk, valuation risk, variable or floating rate securities risk, and volatility risk.
Consumer Discretionary Sector Risk.
ETF Structure Risks. Each Fund is structured as an ETF and as a result is subject to special risks. Shares are not individually redeemable and may be redeemed by the Fund at NAV only in large blocks known as “Creation Units.”
Trading in shares on the New York Stock Exchange (the “Exchange”) may be halted due to market conditions or for reasons that, in the view of the Exchange, make trading in shares inadvisable, such as extraordinary market volatility. There can be no assurance that shares will continue to meet the listing requirements of the Exchange. An active trading market for the Fund’s shares may not be developed or maintained. If the Fund’s shares are traded outside a collateralized settlement system, the number of financial institutions that can act as authorized participants that can post collateral on an agency basis is limited, which may limit the market for the Fund’s shares.
The market prices of shares will fluctuate in response to changes in NAV and supply and demand for shares and will include a “bid-ask spread” charged by the exchange specialists, market makers or other participants that trade the particular security. There may be times when the market price and the NAV vary significantly, particularly during times of market stress, with the result that investors may pay significantly more or significantly less for Fund shares than the Fund’s NAV, which is reflected in the bid and ask price for Fund shares or in the closing price. If a shareholder purchases shares at a time when
| LeaderShares® ETFs |
| NOTES TO FINANCIAL STATEMENTS (Continued) |
| October 31, 2024 |
the market price is at a premium to the NAV or sells shares at a time when the market price is at a discount to NAV, the shareholder may sustain losses if the shares are sold at a price that is less than the
price paid by the shareholder for the shares. When all or a portion of an ETFs underlying securities trade in a market that is closed when the market for the Fund’s shares is open, there may be changes from the last quote of the closed market and the quote from the Fund’s domestic trading day, which could lead to differences between the market value of the Fund’s shares and the Fund’s NAV. In stressed market conditions, the market for the Fund’s shares may become less liquid in response to the deteriorating liquidity of the Fund’s portfolio. This adverse effect on the liquidity of the Fund’s shares may, in turn, lead to differences between the market value of the Fund’s shares and the Fund’s NAV.
Equity Risk. Equity securities are susceptible to general market fluctuations, volatile increases and decreases in value as market confidence in and perceptions of their issuers change and unexpected trading activity among retail investors. Factors that may influence the price of equity securities include developments affecting a specific company or industry, or the changing economic, political or market conditions.
Fluctuation of Net Asset Value Risk. The NAV of the Funds’ shares will generally fluctuate with changes in the market value of the Fund’s holdings. The market prices of the shares will generally fluctuate in accordance with changes in NAV as well as the relative supply of and demand for the shares on the Exchange. The Adviser cannot predict whether the shares will trade below, at or above their NAV. Price differences may be due, in large part, to the fact that supply and demand forces at work in the secondary trading market for the shares will be closely related to, but not identical to, the same forces influencing the prices of the Funds’ holdings trading individually or in the aggregate at any point in time. Unlike conventional ETFs, LeaderShares® Activist Leaders® ETF, LeaderShares® AlphaFactor® Tactical Focused ETF, LeaderShares® Equity Skew ETF, and LeaderShares® Dynamic Yield ETF are not index funds. The Funds are actively managed and do not seek to replicate the performance of a specified Index. Actively managed ETFs have a limited trading history and, therefore, there can be no assurance as to whether and/or the extent to which the shares will trade at premiums or discounts to NAV.
Index Tracking Error Risk. As with all index funds, the performance of the Fund and the Index may differ from each other for a variety of reasons. For example, the Funds incur operating expenses and portfolio transaction costs not incurred by the Index. In addition, the Funds may not be fully invested in the securities of the Index at all times, may deviate from the relative weightings of Index or may hold securities not included in the Index. Tracking error risk may be heightened during times or market volatility or other unusual market conditions.
Market Risk. Overall market risk may affect the value of individual instruments in which the Funds invests. The Funds are is subject to the risk that the securities markets will move down, sometimes rapidly and unpredictably, based on overall economic conditions and other factors, which may negatively affect the Funds’ performance. Factors such as domestic and foreign (non-U.S.) economic growth and market conditions, real or perceived adverse economic or political conditions, military conflict, acts of terrorism, social unrest, natural disasters, recessions, inflation, changes in interest rate levels, supply chain disruptions, sanctions, the spread of infectious illness or other public health threats, lack of liquidity in the bond or other markets, volatility in the securities markets, adverse investor sentiment affect the
| LeaderShares® ETFs |
| NOTES TO FINANCIAL STATEMENTS (Continued) |
| October 31, 2024 |
securities markets and political events affect the securities markets. U.S. and foreign stock markets have experienced periods of substantial price volatility in the past and may do so again in the future. Securities markets also may experience long periods of decline in value. A change in financial condition or other
event affecting a single issuer or market may adversely impact securities markets as a whole. Rates of inflation have recently risen. The value of assets or income from an investment may be worth less in the future as inflation decreases the value of money. As inflation increases, the real value of the Funds’ assets can decline as can the value of the Funds’ distributions. When the value of the Funds’ investments goes down, your investment in the Funds decreases in value and you could lose money.
Local, state, regional, national or global events such as war, acts of terrorism, the spread of infectious illness or other public health issues, recessions, or other events could have a significant impact on the Funds and its investments and could result in decreases to the Fund’s net asset values. Political, geopolitical, natural and other events, including war, terrorism, trade disputes, government shutdowns, market closures, natural and environmental disasters, epidemics, pandemics and other public health crises and related events and governments’ reactions to such events have led, and in the future may lead, to economic uncertainty, decreased economic activity, increased market volatility and other disruptive effects on U.S. and global economies and markets. Such events may have significant adverse direct or indirect effects on the Funds and their investments. For example, a widespread health crisis such as a global pandemic could cause substantial market volatility, exchange trading suspensions and closures, impact the ability to complete redemptions, and affect Fund performance. A health crisis may exacerbate other pre-existing political, social and economic risks. In addition, the increasing interconnectedness of markets around the world may result in many markets being affected by events or conditions in a single country or region or events affecting a single or small number of issuers.
| 9. | UNDERLYING INVESTMENT IN OTHER INVESTMENT COMPANIES |
The LeaderShares® Equity Skew ETF currently seeks to achieve its investment objective by investing a significant portion of its assets in the iShares Russell 2000 ETF (“iShares”) and the SPDR S&P 600 Small Cap Value ETF (“SPDR”), registered open-end investment companies. The Fund may redeem its investment from SPDR at any time if the Adviser determines that it is in the best interest of the Fund and its shareholders to do so.
The performance of the Fund will be directly affected by the performance of iShares and SPDR. The annual reports of iShares and SPDR, along with the report of the independent registered public accounting firm is included in iShares and SPDR’s N-CSRs available at “www.sec.gov” or on the websites “www.ishares.com” and “www.SSGA.com”. As of October 31, 2024, the percentage of the Fund’s net assets invested in iShares and SPDR were 35.8% and 42.7%, respectively.
| LeaderShares® ETFs |
| NOTES TO FINANCIAL STATEMENTS (Continued) |
| October 31, 2024 |
Subsequent events after the date of the Statements of Assets and Liabilities have been evaluated through the date the financial statements were issued. Management has determined that no events or transactions occurred requiring adjustment or disclosure in the financial statements other than the following.
On December 10th, 2024, the Board of Trustees of the Two Roads Shared (the “Trust”) approved an Agreements and Plans of Reorganization (collectively, the “Plan”) pursuant to which each of the Redwood AlphaFactor Tactical International Fund, Redwood Managed Municipal Income Fund, Redwood Managed Volatility Fund, Redwood Systematic Macro Trend (“SMarT®”) Fund, LeaderShares Activist Leaders ETF, LeaderShares AlphaFactor® Tactical Focused ETF, LeaderShares® Activist Leaders® ETF, LeaderShares® AlphaFactor® Tactical Focused ETF, LeaderShares® AlphaFactor® US Core Equity ETF, LeaderShares® Equity Skew ETF, and LeaderShares® Dynamic Yield ETF (each an “Existing Fund”) will reorganize into a corresponding newly created series (each an “Acquiring Fund”) of Investment Managers Series Trust II (each a “Reorganization” and collectively, the “Reorganizations”). Redwood Investment Management, LLC (the “Adviser”) will continue to serve as the investment adviser to each of the Acquiring Funds following the Reorganizations. Each Acquiring Fund will have the same investment objective, and substantially similar principal investment strategies, policies and risks as its corresponding Existing Fund, and each Acquiring Fund will be managed by the same portfolio managers as the Existing Funds. The Reorganization with respect to each of the Existing Funds is expected to close by the end of the first quarter of 2025, subject to the fulfillment of closing conditions, including the approval of the Plan with respect to each of the Existing Funds by its respective shareholders.

REPORT OF INDEPENDENT REGISTERED PUBLIC ACCOUNTING FIRM
To the Shareholders of the LeaderShares® Activist Leaders® ETF, LeaderShares® AlphaFactor® Tactical Focused ETF, LeaderShares® AlphaFactor® US Core Equity ETF, LeaderShares® Equity Skew ETF and LeaderShares® Dynamic Yield ETF and Board of Trustees of Two Roads Shared Trust
Opinion on the Financial Statements
We have audited the accompanying statements of assets and liabilities, including the schedules of investments, of LeaderShares® Activist Leaders® ETF, LeaderShares® AlphaFactor® Tactical Focused ETF, LeaderShares® AlphaFactor® US Core Equity ETF, LeaderShares® Equity Skew ETF and LeaderShares® Dynamic Yield ETF (the “Funds”), each a series of Two Roads Shared Trust, as of October 31, 2024, the related statements of operations for the year then ended, the statements of changes in net assets for each of the two years in the two-year period then ended, the financial highlights for each of the years in the three-year period then ended, and the related notes (collectively referred to as the “financial statements”). In our opinion, the financial statements present fairly, in all material respects, the financial position of each of the Funds as of October 31, 2024, the results of their operations for the year then ended, the changes in net assets for each of the years in the two-year period then ended, and the financial highlights for each of the years in the three-year period then ended, in conformity with accounting principles generally accepted in the United States of America.
The Fund’s financial highlights for the year ended October 31, 2021, and prior, were audited by other auditors whose report dated January 10, 2022, expressed an unqualified opinion on those financial highlights.
Basis for Opinion
These financial statements are the responsibility of the Funds’ management. Our responsibility is to express an opinion on the Funds’ financial statements based on our audits. We are a public accounting firm registered with the Public Company Accounting Oversight Board (United States) (“PCAOB”) and are required to be independent with respect to the Funds in accordance with the U.S. federal securities laws and the applicable rules and regulations of the Securities and Exchange Commission and the PCAOB.
We conducted our audits in accordance with the standards of the PCAOB. Those standards require that we plan and perform the audits to obtain reasonable assurance about whether the financial statements are free of material misstatement whether due to error or fraud.
Our audits included performing procedures to assess the risks of material misstatement of the financial statements, whether due to error or fraud, and performing procedures that respond to those risks. Such procedures included examining, on a test basis, evidence regarding the amounts and disclosures in the financial statements. Our procedures included confirmation of securities owned as of October 31, 2024, by correspondence with the custodians and brokers; when replies from brokers were not received, we performed other auditing procedures. Our audits also included evaluating the accounting principles used and significant estimates made by management, as well as evaluating the overall presentation of the financial statements. We believe that our audits provide a reasonable basis for our opinion.
We have served as the Funds’ auditor since 2022.
COHEN & COMPANY, LTD.
Philadelphia, Pennsylvania
December 30, 2024
COHEN & COMPANY, LTD.
800.229.1099 | 866.818.4538 fax | cohencpa.com
Registered with the Public Company Accounting Oversight Board
Proxy Voting Policy
Information regarding how the Funds vote proxies relating to portfolio securities for the 6 month period ended June 30th as well as a description of the policies and procedures that the Funds used to determine how to vote proxies is available without charge, upon request, by calling 1-888-617-1444 or by referring to the Securities and Exchange Commission’s (“SEC”) website at http://www.sec.gov.
Item 8. Changes in and Disagreements with Accountants for Open-End Management Investment Companies.
Not applicable
Item 9. Proxy Disclosures for Open-End Management Investment Companies.
Not applicable
Item 10. Remuneration Paid to Directors, Officers, and Others of Open-End Management Investment Companies.
Included under Item 7
Item 11. Statement Regarding Basis for Approval of Investment Advisory Contract.
Included under Item 7
Item 12. Disclosure of Proxy Voting Policies and Procedures for Closed-End Management Investment Companies.
Not applicable
Item 13. Portfolio Managers of Closed-End Management Investment Companies.
Not applicable
Item 14. Purchases of Equity Securities by Closed-End Management Investment Company and Affiliated Purchasers.
Not applicable
Item 15. Submission of Matters to a Vote of Security Holders.
None
Item 16. Controls and Procedures
(a) The registrant’s Principal Executive Officer and Principal Financial Officer have concluded that the registrant’s disclosure controls and procedures (as defined in Rule 30a-3(c) under the Act) are effective in design and operation and are sufficient to form the basis of the certifications required by Rule 30a-(2) under the Act, based on their evaluation of these disclosure controls and procedures as of a date within 90 days of this report on Form N-CSR.
(b) There were no changes in the registrant’s internal control over financial reporting (as defined in Rule 30a-3(d) under the Act) during the period covered by this report that have materially affected, or are reasonably likely to materially affect, the registrant’s internal control over financial reporting.
Item 17. Disclosure of Securities Lending Activities for Closed-End Management Investment Companies.
Not applicable
Item 18. Recovery of Erroneously Awarded Compensation.
(a) Not applicable
(b) Not applicable
Item 19. Exhibits.
(a)(1) Code of Ethics for Principal Executive and Senior Financial Officers.
(a)(2) Not applicable
(a)(3) A separate certification for each principal executive officer and principal financial officer of the registrant as required by Rule 30a-2(a) under the Act (17 CFR 270.30a-2(a)): Attached hereto.
(a)(4) Not applicable
(b) Certifications required by Rule 30a-2(b) under the Act (17 CFR 270.30a-2(b)): Attached hereto.
SIGNATURES
Pursuant to the requirements of the Securities Exchange Act of 1934 and the Investment Company Act of 1940, the registrant has duly caused this report to be signed on its behalf by the undersigned, thereunto duly authorized.
Two Roads Shared Trust
| By James Colantino | /s/James Colantino |
| President/Principal Executive Officer |
| Date: January 8, 2025 | |
Pursuant to the requirements of the Securities Exchange Act of 1934 and the Investment Company Act of 1940, this report has been signed below by the following person on behalf of the registrant and in the capacities and on the date indicated.
| By Laura Szalyga | /s/ Laura Szalyga |
| Treasurer/Principal Financial Officer |
| Date: January 8, 2025 | |