UNITED STATES
SECURITIES AND EXCHANGE COMMISSION
WASHINGTON, D.C. 20549
FORM N-CSR
CERTIFIED SHAREHOLDER REPORT OF REGISTERED MANAGEMENT
INVESTMENT COMPANIES
| Investment Company Act file number | 811-22718 |
| | |
| Two Roads Shared Trust |
| (Exact name of registrant as specified in charter) |
| |
| 225 Pictoria Drive, Suite 450, Cincinnati, Ohio | 45246 |
| (Address of principal executive offices) | (Zip code) |
| | |
| The Corporation Trust Company |
| 1209 Orange Street, Wilmington, DE 19801 |
| (Name and address of agent for service) |
| |
| Registrant’s telephone number, including area code: | 631-490-4300 | |
| | | |
| Date of fiscal year end: | 10/31 | |
| | | |
| Date of reporting period: | 10/31/2024 | |
Item 1. Reports to Stockholders.
Anfield Universal Fixed Income Fund
Annual Shareholder Report - October 31, 2024
This annual shareholder report contains important information about Anfield Universal Fixed Income Fund for the period of November 1, 2023 to October 31, 2024. You can find additional information about the Fund at https://anfieldaflix.com/our-fund/. You can also request this information by contacting us at 949.891.0600.
What were the Fund’s costs for the last year?
(based on a hypothetical $10,000 investment)
| Class Name | Costs of a $10,000 investment | Costs paid as a percentage of a $10,000 investment |
|---|
| Class A | $164 | 1.58% |
|---|
How did the Fund perform during the reporting period?
The Anfield Universal Fixed Income Fund (‘AFLEX’ or ‘the Fund’) generated a total return of 7.75% for the annual period ended October 31st, 2024, which underperformed the Bloomberg US Aggregate (BAGG) by 280 basis points, although past performance does not guarantee future results. The underperformance was caused in part by the Fund’s underweight to US Treasuries, which rallied on weakening economic data and the beginning of the Federal Reserve’s easing cycle. When compared to the Bloomberg US 1-3 Year Index, however, AFLEX performed very well, exceeding the index returns by 148 basis points. Contributors to overall performance during the period include the overweight to credit (BB HY; BBB IG; CLOs and bank loans) and underweight duration (around 1/3rd of the index). The emphasis on short maturity bonds also benefited the Fund relative to broad corporate bond indices which typically have longer duration exposure.
The portfolio management team continues to like floating rate debt instruments such as bank loans and CLOs. These positions have been performing well since trade implementation, and the portfolio management team expects interest rates to remain high and relatively stable throughout most of 2024 and into 2025, despite the Fed beginning its easing cycle. As a result, the team is maintaining their conservative duration positioning (roughly 1/3 of the US Aggregate Bond Index). We continue to emphasize higher quality, yield-enhancing corporate credit, mortgage-backed, and asset-backed security allocations. Finally, we favor the front-end of the yield curve as we do not believe we are being compensated to extend further out and take on additional risk. The team continues to selectively add to positions they believe will outperform in the current interest rate environment, including shorter duration high yield bonds, bank loans, and select CLO tranches.
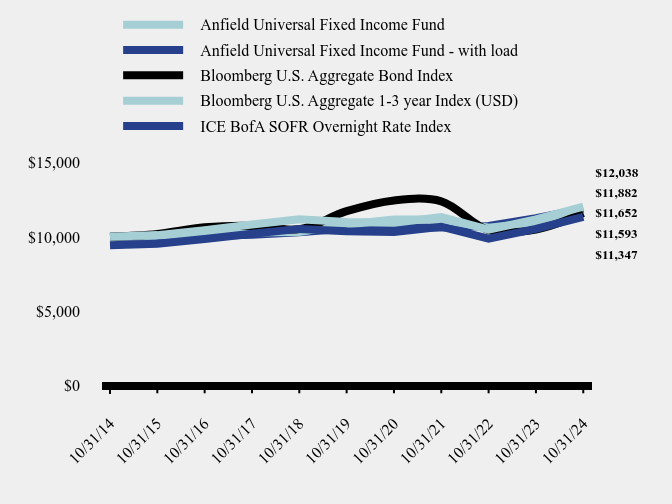
How has the Fund performed over the last ten years?
Total Return Based on $10,000 Investment
| Anfield Universal Fixed Income Fund | Anfield Universal Fixed Income Fund - with load | Bloomberg U.S. Aggregate Bond Index | Bloomberg U.S. Aggregate 1-3 year Index (USD) | ICE BofA SOFR Overnight Rate Index |
|---|
| 10/31/14 | $10,000 | $9,426 | $10,000 | $10,000 | $10,000 |
|---|
| 10/31/15 | $10,116 | $9,536 | $10,196 | $10,088 | $10,013 |
|---|
| 10/31/16 | $10,452 | $9,852 | $10,641 | $10,223 | $10,049 |
|---|
| 10/31/17 | $10,825 | $10,203 | $10,737 | $10,294 | $10,141 |
|---|
| 10/31/18 | $11,176 | $10,535 | $10,517 | $10,329 | $10,315 |
|---|
| 10/31/19 | $11,005 | $10,373 | $11,727 | $10,836 | $10,554 |
|---|
| 10/31/20 | $10,951 | $10,322 | $12,453 | $11,171 | $10,621 |
|---|
| 10/31/21 | $11,334 | $10,683 | $12,393 | $11,167 | $10,626 |
|---|
| 10/31/22 | $10,479 | $9,877 | $10,450 | $10,617 | $10,732 |
|---|
| 10/31/23 | $11,172 | $10,531 | $10,487 | $10,964 | $11,262 |
|---|
| 10/31/24 | $12,038 | $11,347 | $11,593 | $11,652 | $11,882 |
|---|
Average Annual Total Returns
| 1 Year | 5 Years | 10 Years |
|---|
| Anfield Universal Fixed Income Fund | | | |
|---|
| Without Load | 7.75% | 1.81% | 1.87% |
|---|
| With Load* | 1.51% | 0.61% | 1.27% |
|---|
| Bloomberg U.S. Aggregate 1-3 year Index (USD) | 6.27% | 1.46% | 1.54% |
|---|
| Bloomberg U.S. Aggregate Bond Index | 10.55% | -0.23% | 1.49% |
|---|
| ICE BofA SOFR Overnight Rate Index | 5.50% | 2.40% | 1.74% |
|---|
The Fund's past performance is not a good predictor of how the Fund will perform in the future. The graph and table do not reflect the deduction of taxes that a shareholder would pay on fund distributions or redemption of fund shares.
What did the Fund invest in?
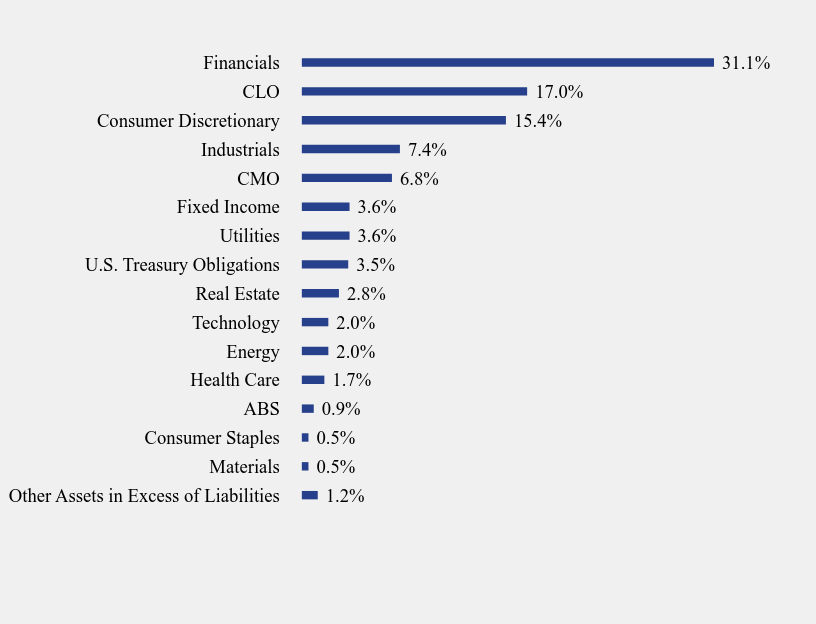
Sector Weighting (% of net assets)
| Value | Value |
|---|
| Other Assets in Excess of Liabilities | 1.2% |
| Materials | 0.5% |
| Consumer Staples | 0.5% |
| ABS | 0.9% |
| Health Care | 1.7% |
| Energy | 2.0% |
| Technology | 2.0% |
| Real Estate | 2.8% |
| U.S. Treasury Obligations | 3.5% |
| Utilities | 3.6% |
| Fixed Income | 3.6% |
| CMO | 6.8% |
| Industrials | 7.4% |
| Consumer Discretionary | 15.4% |
| CLO | 17.0% |
| Financials | 31.1% |
| Net Assets | $139,811,832 |
|---|
| Number of Portfolio Holdings | 335 |
|---|
| Advisory Fee | $1,115,332 |
|---|
| Portfolio Turnover | 62% |
|---|
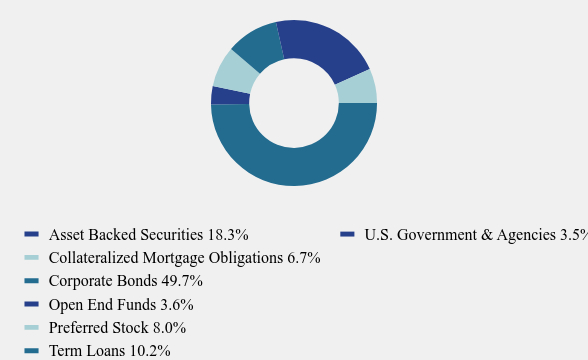
Asset Weighting (% of total investments)
| Value | Value |
|---|
| Asset Backed Securities | 18.3% |
| Collateralized Mortgage Obligations | 6.7% |
| Corporate Bonds | 49.7% |
| Open End Funds | 3.6% |
| Preferred Stock | 8.0% |
| Term Loans | 10.2% |
| U.S. Government & Agencies | 3.5% |
Top 10 Holdings (% of net assets)
| Holding Name | % of Net Assets |
| United States Treasury Bill | 3.5% |
| First Citizens BancShares, Inc. | 2.7% |
| Voya CLO Ltd., C | 2.0% |
| Fidelity Advisor Floating Rate High Income Fund | 1.9% |
| Aramark Services, Inc. | 1.9% |
| Man GLG US CLO, BR | 1.7% |
| Vanguard High-Yield Corporate Fund, Admiral Class | 1.7% |
| Electricite de France S.A. | 1.6% |
| VICI Properties, L.P. / VICI Note Company, Inc. | 1.6% |
| Zais Matrix CDO I, D1 | 1.4% |
No material changes occurred during the year ended October 31, 2024.
Where can I find additional information about the Fund?
Additional information is available on the Fund's website ( https://anfieldaflix.com/our-fund/ ), including its:
Prospectus
Financial information
Holdings
Proxy voting information
Anfield Universal Fixed Income Fund - Class A (AFLEX )
Annual Shareholder Report - October 31, 2024
Anfield Universal Fixed Income Fund
Annual Shareholder Report - October 31, 2024
This annual shareholder report contains important information about Anfield Universal Fixed Income Fund for the period of November 1, 2023 to October 31, 2024. You can find additional information about the Fund at https://anfieldaflix.com/our-fund/. You can also request this information by contacting us at 949.891.0600.
What were the Fund’s costs for the last year?
(based on a hypothetical $10,000 investment)
| Class Name | Costs of a $10,000 investment | Costs paid as a percentage of a $10,000 investment |
|---|
| Class C | $242 | 2.34% |
|---|
How did the Fund perform during the reporting period?
The Anfield Universal Fixed Income Fund (‘AFLKX’ or ‘the Fund’) generated a total return of 6.88% for the annual period ended October 31st, 2024, which underperformed the Bloomberg US Aggregate (BAGG) by 367 basis points, although past performance does not guarantee future results. The underperformance was caused in part by the Fund’s underweight to US Treasuries, which rallied on weakening economic data and the beginning of the Federal Reserve’s easing cycle. When compared to the Bloomberg US 1-3 Year Index, however, AFLKX performed very well, exceeding the index returns by 61 basis points. Contributors to overall performance during the period include the overweight to credit (BB HY; BBB IG; CLOs and bank loans) and underweight duration (around 1/3rd of the index). The emphasis on short maturity bonds also benefited the Fund relative to broad corporate bond indices which typically have longer duration exposure.
The portfolio management team continues to like floating rate debt instruments such as bank loans and CLOs. These positions have been performing well since trade implementation, and the portfolio management team expects interest rates to remain high and relatively stable throughout most of 2024 and into 2025, despite the Fed beginning its easing cycle. As a result, the team is maintaining their conservative duration positioning (roughly 1/3 of the US Aggregate Bond Index). We continue to emphasize higher quality, yield-enhancing corporate credit, mortgage-backed, and asset-backed security allocations. Finally, we favor the front-end of the yield curve as we do not believe we are being compensated to extend further out and take on additional risk. The team continues to selectively add to positions they believe will outperform in the current interest rate environment, including shorter duration high yield bonds, bank loans, and select CLO tranches.
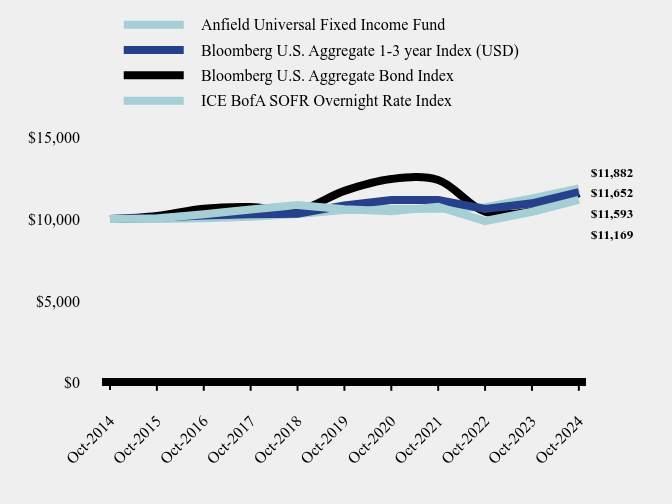
How has the Fund performed over the last ten years?
Total Return Based on $10,000 Investment
| Anfield Universal Fixed Income Fund | Bloomberg U.S. Aggregate 1-3 year Index (USD) | Bloomberg U.S. Aggregate Bond Index | ICE BofA SOFR Overnight Rate Index |
|---|
| Oct-2014 | $10,000 | $10,000 | $10,000 | $10,000 |
|---|
| Oct-2015 | $10,045 | $10,088 | $10,196 | $10,013 |
|---|
| Oct-2016 | $10,298 | $10,223 | $10,641 | $10,049 |
|---|
| Oct-2017 | $10,586 | $10,294 | $10,737 | $10,141 |
|---|
| Oct-2018 | $10,860 | $10,329 | $10,517 | $10,315 |
|---|
| Oct-2019 | $10,606 | $10,836 | $11,727 | $10,554 |
|---|
| Oct-2020 | $10,475 | $11,171 | $12,453 | $10,621 |
|---|
| Oct-2021 | $10,759 | $11,167 | $12,393 | $10,626 |
|---|
| Oct-2022 | $9,882 | $10,617 | $10,450 | $10,732 |
|---|
| Oct-2023 | $10,450 | $10,964 | $10,487 | $11,262 |
|---|
| Oct-2024 | $11,169 | $11,652 | $11,593 | $11,882 |
|---|
Average Annual Total Returns
| 1 Year | 5 Years | 10 Years |
|---|
| Anfield Universal Fixed Income Fund | 6.88% | 1.04% | 1.11% |
|---|
| Bloomberg U.S. Aggregate 1-3 year Index (USD) | 6.27% | 1.46% | 1.54% |
|---|
| Bloomberg U.S. Aggregate Bond Index | 10.55% | -0.23% | 1.49% |
|---|
| ICE BofA SOFR Overnight Rate Index | 5.50% | 2.40% | 1.74% |
|---|
The Fund's past performance is not a good predictor of how the Fund will perform in the future. The graph and table do not reflect the deduction of taxes that a shareholder would pay on fund distributions or redemption of fund shares.
What did the Fund invest in?
Sector Weighting (% of net assets)
| Value | Value |
|---|
| Other Assets in Excess of Liabilities | 1.2% |
| Materials | 0.5% |
| Consumer Staples | 0.5% |
| ABS | 0.9% |
| Health Care | 1.7% |
| Energy | 2.0% |
| Technology | 2.0% |
| Real Estate | 2.8% |
| U.S. Treasury Obligations | 3.5% |
| Utilities | 3.6% |
| Fixed Income | 3.6% |
| CMO | 6.8% |
| Industrials | 7.4% |
| Consumer Discretionary | 15.4% |
| CLO | 17.0% |
| Financials | 31.1% |
| Net Assets | $139,811,832 |
|---|
| Number of Portfolio Holdings | 335 |
|---|
| Advisory Fee | $1,115,332 |
|---|
| Portfolio Turnover | 62% |
|---|
Asset Weighting (% of total investments)
| Value | Value |
|---|
| Asset Backed Securities | 18.3% |
| Collateralized Mortgage Obligations | 6.7% |
| Corporate Bonds | 49.7% |
| Open End Funds | 3.6% |
| Preferred Stock | 8.0% |
| Term Loans | 10.2% |
| U.S. Government & Agencies | 3.5% |
Top 10 Holdings (% of net assets)
| Holding Name | % of Net Assets |
| United States Treasury Bill | 3.5% |
| First Citizens BancShares, Inc. | 2.7% |
| Voya CLO Ltd., C | 2.0% |
| Fidelity Advisor Floating Rate High Income Fund | 1.9% |
| Aramark Services, Inc. | 1.9% |
| Man GLG US CLO, BR | 1.7% |
| Vanguard High-Yield Corporate Fund, Admiral Class | 1.7% |
| Electricite de France S.A. | 1.6% |
| VICI Properties, L.P. / VICI Note Company, Inc. | 1.6% |
| Zais Matrix CDO I, D1 | 1.4% |
No material changes occurred during the year ended October 31, 2024.
Where can I find additional information about the Fund?
Additional information is available on the Fund's website ( https://anfieldaflix.com/our-fund/ ), including its:
Prospectus
Financial information
Holdings
Proxy voting information
Anfield Universal Fixed Income Fund - Class C (AFLKX )
Annual Shareholder Report - October 31, 2024
Anfield Universal Fixed Income Fund
Annual Shareholder Report - October 31, 2024
This annual shareholder report contains important information about Anfield Universal Fixed Income Fund for the period of November 1, 2023 to October 31, 2024. You can find additional information about the Fund at https://anfieldaflix.com/our-fund/. You can also request this information by contacting us at 949.891.0600.
What were the Fund’s costs for the last year?
(based on a hypothetical $10,000 investment)
| Class Name | Costs of a $10,000 investment | Costs paid as a percentage of a $10,000 investment |
|---|
| Class I | $139 | 1.34% |
|---|
How did the Fund perform during the reporting period?
The Anfield Universal Fixed Income Fund (‘AFLIX’ or ‘the Fund’) generated a total return of 8.00% for the annual period ended October 31st, 2024, which underperformed the Bloomberg US Aggregate (BAGG) by 255 basis points, although past performance does not guarantee future results. The underperformance was caused in part by the Fund’s underweight to US Treasuries, which rallied on weakening economic data and the beginning of the Federal Reserve’s easing cycle. When compared to the Bloomberg US 1-3 Year Index, however, AFLIX performed very well, exceeding the index returns by 173 basis points. Contributors to overall performance during the period include the overweight to credit (BB HY; BBB IG; CLOs and bank loans) and underweight duration (around 1/3rd of the index). The emphasis on short maturity bonds also benefited the Fund relative to broad corporate bond indices which typically have longer duration exposure.
The portfolio management team continues to like floating rate debt instruments such as bank loans and CLOs. These positions have been performing well since trade implementation, and the portfolio management team expects interest rates to remain high and relatively stable throughout most of 2024 and into 2025, despite the Fed beginning its easing cycle. As a result, the team is maintaining their conservative duration positioning (roughly 1/3 of the US Aggregate Bond Index). We continue to emphasize higher quality, yield-enhancing corporate credit, mortgage-backed, and asset-backed security allocations. Finally, we favor the front-end of the yield curve as we do not believe we are being compensated to extend further out and take on additional risk. The team continues to selectively add to positions they believe will outperform in the current interest rate environment, including shorter duration high yield bonds, bank loans, and select CLO tranches.
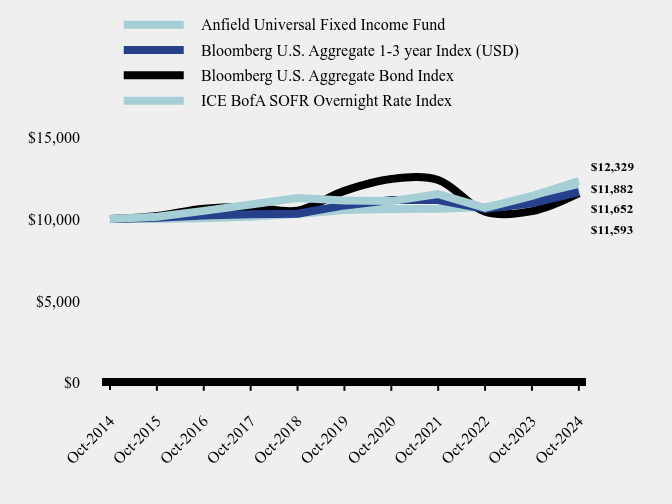
How has the Fund performed over the last ten years?
Total Return Based on $10,000 Investment
| Anfield Universal Fixed Income Fund | Bloomberg U.S. Aggregate 1-3 year Index (USD) | Bloomberg U.S. Aggregate Bond Index | ICE BofA SOFR Overnight Rate Index |
|---|
| Oct-2014 | $10,000 | $10,000 | $10,000 | $10,000 |
|---|
| Oct-2015 | $10,142 | $10,088 | $10,196 | $10,013 |
|---|
| Oct-2016 | $10,503 | $10,223 | $10,641 | $10,049 |
|---|
| Oct-2017 | $10,891 | $10,294 | $10,737 | $10,141 |
|---|
| Oct-2018 | $11,284 | $10,329 | $10,517 | $10,315 |
|---|
| Oct-2019 | $11,138 | $10,836 | $11,727 | $10,554 |
|---|
| Oct-2020 | $11,101 | $11,171 | $12,453 | $10,621 |
|---|
| Oct-2021 | $11,530 | $11,167 | $12,393 | $10,626 |
|---|
| Oct-2022 | $10,690 | $10,617 | $10,450 | $10,732 |
|---|
| Oct-2023 | $11,416 | $10,964 | $10,487 | $11,262 |
|---|
| Oct-2024 | $12,329 | $11,652 | $11,593 | $11,882 |
|---|
Average Annual Total Returns
| 1 Year | 5 Years | 10 Years |
|---|
| Anfield Universal Fixed Income Fund | 8.00% | 2.05% | 2.12% |
|---|
| Bloomberg U.S. Aggregate 1-3 year Index (USD) | 6.27% | 1.46% | 1.54% |
|---|
| Bloomberg U.S. Aggregate Bond Index | 10.55% | -0.23% | 1.49% |
|---|
| ICE BofA SOFR Overnight Rate Index | 5.50% | 2.40% | 1.74% |
|---|
The Fund's past performance is not a good predictor of how the Fund will perform in the future. The graph and table do not reflect the deduction of taxes that a shareholder would pay on fund distributions or redemption of fund shares.
What did the Fund invest in?
Sector Weighting (% of net assets)
| Value | Value |
|---|
| Other Assets in Excess of Liabilities | 1.2% |
| Materials | 0.5% |
| Consumer Staples | 0.5% |
| ABS | 0.9% |
| Health Care | 1.7% |
| Energy | 2.0% |
| Technology | 2.0% |
| Real Estate | 2.8% |
| U.S. Treasury Obligations | 3.5% |
| Utilities | 3.6% |
| Fixed Income | 3.6% |
| CMO | 6.8% |
| Industrials | 7.4% |
| Consumer Discretionary | 15.4% |
| CLO | 17.0% |
| Financials | 31.1% |
| Net Assets | $139,811,832 |
|---|
| Number of Portfolio Holdings | 335 |
|---|
| Advisory Fee | $1,115,332 |
|---|
| Portfolio Turnover | 62% |
|---|
Asset Weighting (% of total investments)
| Value | Value |
|---|
| Asset Backed Securities | 18.3% |
| Collateralized Mortgage Obligations | 6.7% |
| Corporate Bonds | 49.7% |
| Open End Funds | 3.6% |
| Preferred Stock | 8.0% |
| Term Loans | 10.2% |
| U.S. Government & Agencies | 3.5% |
Top 10 Holdings (% of net assets)
| Holding Name | % of Net Assets |
| United States Treasury Bill | 3.5% |
| First Citizens BancShares, Inc. | 2.7% |
| Voya CLO Ltd., C | 2.0% |
| Fidelity Advisor Floating Rate High Income Fund | 1.9% |
| Aramark Services, Inc. | 1.9% |
| Man GLG US CLO, BR | 1.7% |
| Vanguard High-Yield Corporate Fund, Admiral Class | 1.7% |
| Electricite de France S.A. | 1.6% |
| VICI Properties, L.P. / VICI Note Company, Inc. | 1.6% |
| Zais Matrix CDO I, D1 | 1.4% |
No material changes occurred during the year ended October 31, 2024.
Where can I find additional information about the Fund?
Additional information is available on the Fund's website ( https://anfieldaflix.com/our-fund/ ), including its:
Prospectus
Financial information
Holdings
Proxy voting information
Anfield Universal Fixed Income Fund - Class I (AFLIX )
Annual Shareholder Report - October 31, 2024
Item 2. Code of Ethics.
| (a) | The registrant has, as of the end of the period covered by this report, adopted a code of ethics that applies to the registrant’s principal executive officer, principal financial officer, and principal accounting officer or controller, or persons performing similar functions, regardless of whether these individuals are employed by the registrant or a third party. |
| | |
| (b) | Not applicable. |
| | |
| (c) | During the period covered by this report, there were no amendments to any provision of the code of ethics. |
| | |
| (d) | During the period covered by this report, there were no waivers or implicit waivers of a provision of the code of ethics. |
| | |
| (e) | Not applicable. |
| | |
| (f) | See Item 19(a)(1) |
| | |
Item 3. Audit Committee Financial Expert.
(a)(1) The Registrant’s Board of Trustees has determined that the registrant has at least one audit committee financial expert serving on the audit committee.
(a)(2) Mark Gersten and Neil M. Kaufman are audit committee financial experts, as defined in Item 3 of Form N-CSR. Mr. Gersten and Mr. Kaufman are independent for purposes of this Item.
(a)(3) Not applicable.
Item 4. Principal Accountant Fees and Services.
| (a) | Audit Fees. The aggregate fees billed for each of the last two fiscal years for professional services rendered by the registrant’s principal accountant for the audit of the registrant’s annual financial statements or services that are normally provided by the accountant in connection with statutory and regulatory filings or engagements for those fiscal years are as follows: |
| | |
| 2024 $ 21,000 |
| 2023 $ 20,000 |
| |
| (b) | Audit-Related Fees. There were no fees billed in each of the last two fiscal years for assurances and related services by the principal accountant that are reasonably related to the performance of the audit of the registrant’s financial statements and are not reported under paragraph (a) of this Item. |
| | |
| (c) | Tax Fees - The aggregate fees billed in each of the last two fiscal years for professional services rendered by the principal accountant for tax compliance are as follows: |
| | |
Preparation of Federal & State income tax returns, assistance with calculation of required income, capital gain and excise distributions and preparation of Federal excise tax returns.
| (d) | All Other Fees. The aggregate fees billed in each of the last two fiscal years for products and services provided by the registrant’s principal accountant, other than the services reported in paragraphs (a) through (c) of this item were $0 and $0 for the fiscal years ended October 31, 2024, and 2023, respectively. |
| | |
| (e)(1) | The audit committee does not have pre-approval policies and procedures. Instead, the audit committee or audit committee chairman (subject to ratification by the Audit Committee) approves on a case-by-case basis each audit or non-audit service before the principal accountant is engaged by the registrant to render such audit or non-audit service. |
| | |
| (e)(2) | There were no services described in each of paragraphs (b) through (d) of this Item that were approved by the audit committee pursuant to paragraph (c)(7)(i)(C) of Rule 2-01 of Regulation S-X. |
| | |
| (f) | Not applicable. |
| | |
| (g) | All non-audit fees billed by the registrant’s principal accountant for services rendered to the registrant for the fiscal years ended October 31, 2024, and 2023, respectively are disclosed in (b)-(d) above. There were no audit or non-audit services performed by the registrant’s principal accountant for the registrant’s adviser. |
| | |
| (h) | Not applicable. |
| | |
| (i) | Not applicable. |
| | |
| (j) | Not applicable. |
Item 5. Audit Committee of Listed Registrants.
Not applicable.
Item 6. Investments.
(a) The Registrant’s schedule of investments in unaffiliated issuers is included in the Financial Statements under Item 7 of this form.
(b) Not applicable.
Item 7. Financial Statements and Financial Highlights for Open-End Management Investment Companies.
| |
| |
 |
| |
| |
| Anfield Universal Fixed Income Fund |
| |
| |
| |
| |
| |
| Class A Shares | (AFLEX) |
| Class C Shares | (AFLKX) |
| Class I Shares | (AFLIX) |
| |
| |
| |
| |
| |
| October 31, 2024 |
| |
| Annual Financial Statements |
| |
| |
| |
| |
| |
| |
| |
| |
| |
| |
| Advised by: |
| Anfield Capital Management, LLC |
| 4041 MacArthur Blvd. |
| Suite 155 |
| Newport Beach, CA 92660 |
| www.AnfieldFunds.com |
| |
| Distributed by Northern Lights Distributors, LLC |
| Member FINRA |
| ANFIELD UNIVERSAL FIXED INCOME FUND |
| SCHEDULE OF INVESTMENTS |
| October 31, 2024 |
| Shares | | | | | | | | | | | Fair Value | |
| | | | | OPEN END FUNDS — 3.5% | | | | | | | | | | |
| | | | | FIXED INCOME - 3.5% | | | | | | | | | | |
| | 286,672 | | | Fidelity Advisor Floating Rate High Income Fund | | | | | | | | $ | 2,660,312 | |
| | 422,170 | | | Vanguard High-Yield Corporate Fund, Admiral Class | | | | | | | | | 2,300,825 | |
| | | | | | | | | | | | | | 4,961,137 | |
| | | | | | | | | | | | | | | |
| | | | | TOTAL OPEN END FUNDS (Cost $5,171,518) | | | | | | | | | 4,961,137 | |
| | | | | | | | | | | | | | | |
| Principal | | | | | | | | | | | | | |
| Amount | | | | | | | Coupon | | | | | | |
| ($) | | | | | Spread | | Rate (%) | | Maturity | | Fair Value | |
| | | | | ASSET BACKED SECURITIES — 18.1% | | | | | | | | | | |
| | | | | CLO — 17.0% | | | | | | | | | | |
| | 1,000,000 | | | AMMC CLO XI Ltd. Series 2012-11A CR2(a),(b) | | TSFR3M + 2.162% | | 6.7510 | | 04/30/31 | | | 1,000,181 | |
| | 1,000,000 | | | Balboa Bay Loan Funding 2024-1 Ltd. Series 1A D1(a),(b) | | TSFR3M + 3.200% | | 8.5190 | | 07/20/37 | | | 1,005,489 | |
| | 2,000,000 | | | BlueMountain Fuji US Clo II Ltd. Series 2A C(a),(b) | | TSFR3M + 3.262% | | 7.8790 | | 10/20/30 | | | 1,972,309 | |
| | 500,500 | | | Crown Point CLO IV Ltd. Series 2018-4A B(a),(b) | | TSFR3M + 1.762% | | 6.3790 | | 04/20/31 | | | 501,104 | |
| | 1,000,000 | | | Dryden 55 CLO Ltd. Series 2018-55A D(a),(b) | | TSFR3M + 3.112% | | 7.7680 | | 04/15/31 | | | 1,000,365 | |
| | 1,500,000 | | | Greenwood Park CLO Ltd. Series 2018-1A D(a),(b) | | TSFR3M + 2.762% | | 7.4180 | | 04/15/31 | | | 1,501,875 | |
| | 1,795,064 | | | Halcyon Loan Advisors Funding Ltd. Series 2015-2A E(a),(b),(c) | | TSFR3M + 5.962% | | 10.5870 | | 07/25/27 | | | 133,352 | |
| | 2,400,000 | | | Man GLG US CLO Series 2018-1A BR(a),(b) | | TSFR3M + 2.232% | | 6.8490 | | 04/22/30 | | | 2,407,475 | |
| | 1,500,000 | | | Mountain View CLO IX Ltd. Series 2015-9A CR(a),(b) | | TSFR3M + 3.382% | | 8.0380 | | 07/15/31 | | | 1,495,650 | |
| | 1,000,000 | | | Octagon Investment Partners 32 Ltd. Series 1A A2R3(a),(b) | | TSFR3M + 1.600% | | 0.0001 | | 10/31/37 | | | 1,000,926 | |
| | 1,500,000 | | | Rockford Tower CLO 2017-1 Ltd. Series 2017-1A DR2B(a),(b) | | TSFR3M + 5.242% | | 9.8590 | | 04/20/34 | | | 1,502,070 | |
| | 2,000,000 | | | Sound Point CLO II Ltd. Series 2013-1A A3R(a),(b) | | TSFR3M + 2.112% | | 6.7290 | | 01/26/31 | | | 2,004,958 | |
| | 520,000 | | | Steele Creek CLO Ltd. Series 2014-1RA B(a),(b) | | TSFR3M + 1.762% | | 6.3790 | | 04/21/31 | | | 521,201 | |
| | 2,000,000 | | | Venture 33 CLO Ltd. Series 33A D(a),(b) | | TSFR3M + 3.422% | | 8.0780 | | 07/15/31 | | | 1,924,756 | |
| | 1,000,000 | | | Venture XV CLO Ltd. Series 2013-15A DR2(a),(b) | | TSFR3M + 4.182% | | 8.8380 | | 07/15/32 | | | 976,090 | |
| | 2,750,000 | | | Voya CLO Ltd. Series 2018-1A C(a),(b) | | TSFR3M + 2.862% | | 7.4790 | | 04/19/31 | | | 2,759,909 | |
| | 2,000,000 | | | Zais Matrix CDO I Series 2022-18A D1(a),(b) | | TSFR3M + 4.670% | | 9.2960 | | 01/25/35 | | | 2,006,988 | |
| | | | | | | | | | | | | | 23,714,698 | |
| | | | | COLLATERALIZED MORTGAGE OBLIGATIONS — 0.2% | | | | | | | | | | |
| | 121,498 | | | Alternative Loan Trust Series 2004-35T2 A4(d) | | | | 6.0000 | | 02/25/35 | | | 19,610 | |
| | 3,462 | | | Banc of America Mortgage Trust Series 2004-A 2A4(b) | | | | 5.5820 | | 02/25/34 | | | 3,406 | |
| | 5,942,938 | | | BCAP, LLC Trust Series 2007-AA2 21IO(b),(d) | | | | 0.4240 | | 04/25/37 | | | 67,283 | |
| | 6,765 | | | Bear Stearns ARM Trust Series 2003-4 3A1(b) | | | | 7.0370 | | 07/25/33 | | | 6,460 | |
| | 4,310 | | | Bear Stearns Asset Backed Securities Trust Series 2003-AC5 A2(e) | | | | 5.5000 | | 10/25/33 | | | 4,291 | |
| | 1,312 | | | Chase Mortgage Finance Trust Series Series 2007-A1 7A1(b) | | | | 7.6120 | | 02/25/37 | | | 1,332 | |
See accompanying notes to financial statements.
| ANFIELD UNIVERSAL FIXED INCOME FUND |
| SCHEDULE OF INVESTMENTS (Continued) |
| October 31, 2024 |
| Principal | | | | | | | | | | | | |
| Amount | | | | | | | Coupon | | | | | |
| ($) | | | | | Spread | | Rate (%) | | Maturity | | Fair Value | |
| | | | | ASSET BACKED SECURITIES — 18.1% (Continued) | | | | | | | | | | |
| | | | | COLLATERALIZED MORTGAGE OBLIGATIONS — 0.2% (Continued) | | | | | | | | | | |
| | 18,224 | | | CHL Mortgage Pass-Through Trust Series 2004-7 3A1(b) | | | | 6.7990 | | 05/25/34 | | $ | 17,144 | |
| | 4,802 | | | Citigroup Global Markets Mortgage Securities VII, Inc. Series 2003-1 A2(a) | | | | 6.0000 | | 09/25/33 | | | 2,588 | |
| | 2,903 | | | Deutsche Mortgage Securities, Inc. Mortgage Loan Trust Series 2004-4 7AR2(b) | | TSFR1M + 0.564% | | 5.3020 | | 06/25/34 | | | 2,661 | |
| | 36,717 | | | GSR Mortgage Loan Trust Series 2004-2F 7A2(b),(d) | | TSFR1M + 7.536% | | 2.7980 | | 01/25/34 | | | 821 | |
| | 6,056 | | | GSR Mortgage Loan Trust Series 2004-6F 2A6 | | | | 5.5000 | | 05/25/34 | | | 5,965 | |
| | 10,527 | | | Impac CMB Trust Series 2004-4 1M3(b) | | TSFR1M + 1.014% | | 5.7520 | | 09/25/34 | | | 10,371 | |
| | 18,879 | | | Impac CMB Trust Series 2004-6 M1(b) | | TSFR1M + 1.034% | | 5.6770 | | 10/25/34 | | | 18,118 | |
| | 2,306 | | | Impac CMB Trust Series 2004-5 1A3(b) | | TSFR1M + 0.939% | | 5.7720 | | 10/25/34 | | | 2,283 | |
| | 14,932 | | | JP Morgan Mortgage Trust Series 2005-A1 3A5(b) | | | | 5.4840 | | 02/25/35 | | | 13,949 | |
| | 12,673 | | | MASTR Alternative Loan Trust Series 2003-7 6A1 | | | | 6.5000 | | 12/25/33 | | | 12,452 | |
| | 440,800 | | | MASTR Alternative Loan Trust Series 2007-HF1 4AX(d) | | | | 7.0000 | | 10/25/47 | | | 83,690 | |
| | 3,536 | | | Morgan Stanley Mortgage Loan Trust Series 2004-7AR 2A6(b) | | | | 6.1620 | | 09/25/34 | | | 3,477 | |
| | 7,592 | | | Morgan Stanley Mortgage Loan Trust Series 2004-10AR 4A(b) | | | | 7.2020 | | 11/25/34 | | | 7,089 | |
| | 56,018 | | | Wilshire Funding Corporation Series 1997-WFC1 M3(b) | | | | 7.2500 | | 08/25/27 | | | 54,608 | |
| | | | | | | | | | | | | | 337,598 | |
| | | | | HOME EQUITY — 0.5% | | | | | | | | | | |
| | 25,248 | | | Aames Mortgage Trust Mortgage Pass Through Certs Series 2001-1 M2(e) | | | | 8.0880 | | 06/25/31 | | | 24,901 | |
| | 7,661 | | | AFC Trust Series 2000-1 1A(b) | | TSFR1M + 0.844% | | 5.5820 | | 03/25/30 | | | 7,423 | |
| | 166 | | | Ameriquest Mortgage Securities Asset-Backed Pass-Through Ctfs Series 2003-11 AF6(e) | | | | 5.4270 | | 12/25/33 | | | 270 | |
| | 21,144 | | | Asset Backed Securities Corporation Home Equity Loan Trust Series 2003-HE6 M2(b) | | TSFR1M + 2.589% | | 7.3270 | | 11/25/33 | | | 25,958 | |
| | 135,000 | | | Bear Stearns Asset Backed Securities I Trust Series 2004-BO1 M9B(b) | | TSFR1M + 6.114% | | 10.8520 | | 10/25/34 | | | 135,716 | |
| | 15,591 | | | Bear Stearns Asset Backed Securities Trust Series 2003-ABF1 A(b) | | TSFR1M + 0.854% | | 5.5920 | | 01/25/34 | | | 15,262 | |
| | 133,516 | | | CDC Mortgage Capital Trust Series 2004-HE1 M2(b) | | TSFR1M + 1.914% | | 6.6520 | | 06/25/34 | | | 133,687 | |
| | 95,854 | | | CDC Mortgage Capital Trust Series 2004-HE3 M2(b) | | TSFR1M + 1.914% | | 6.6520 | | 11/25/34 | | | 91,102 | |
| | 22,742 | | | Credit Suisse First Boston Mortgage Securities Corporation Series 2001-HE8 A1(e) | | | | 6.9900 | | 02/25/31 | | | 22,288 | |
| | 3,845 | | | Meritage Mortgage Loan Trust Series 2003-1 M2(b) | | TSFR1M + 2.439% | | 7.1770 | | 11/25/33 | | | 3,794 | |
| | 28,884 | | | Meritage Mortgage Loan Trust Series 2003-1 M3(b) | | TSFR1M + 2.814% | | 7.5520 | | 11/25/33 | | | 28,149 | |
| | 17,020 | | | Merrill Lynch Mortgage Investors Trust Series 2003-OPT1 M2 (b) | | TSFR1M + 2.289% | | 7.0270 | | 07/25/34 | | | 12,767 | |
| | 15,485 | | | New Century Home Equity Loan Trust Series 2003-A M1(a),(b) | | TSFR1M + 1.239% | | 3.5890 | | 10/25/33 | | | 16,446 | |
| | 1,843 | | | NovaStar Mortgage Funding Trust Series 2004-1 M5(b) | | TSFR1M + 1.689% | | 6.4270 | | 06/25/34 | | | 1,735 | |
| | 10,790 | | | Option One Mortgage Loan Trust Series 2003-5 A2(b) | | TSFR1M + 0.754% | | 5.4920 | | 08/25/33 | | | 10,830 | |
See accompanying notes to financial statements.
| ANFIELD UNIVERSAL FIXED INCOME FUND |
| SCHEDULE OF INVESTMENTS (Continued) |
| October 31, 2024 |
| Principal | | | | | | | | | | | | |
| Amount | | | | | | | Coupon | | | | | |
| ($) | | | | | Spread | | Rate (%) | | Maturity | | Fair Value | |
| | | | | ASSET BACKED SECURITIES — 18.1% (Continued) | | | | | | | | | | |
| | | | | HOME EQUITY — 0.5% (Continued) | | | | | | | | | | |
| | 65,244 | | | RASC Series Trust Series 2003-KS4 MI1(e) | | | | 4.6100 | | 06/25/33 | | $ | 64,500 | |
| | 11,440 | | | Saxon Asset Securities Trust Series 2003-3 M2(b) | | TSFR1M + 2.514% | | 4.2190 | | 12/25/33 | | | 10,483 | |
| | 47,506 | | | Terwin Mortgage Trust Series TMTS Series 2003-2HE M2(b) | | TSFR1M + 2.264% | | 8.0770 | | 07/25/34 | | | 57,022 | |
| | | | | | | | | | | | | | 662,333 | |
| | | | | MANUFACTURED HOUSING — 0.0%(f) | | | | | | | | | | |
| | 2,988 | | | Conseco Finance Corporation Series 1997-1 M1(b) | | | | 7.2200 | | 03/15/28 | | | 3,002 | |
| | | | | | | | | | | | | | | |
| | | | | RESIDENTIAL MORTGAGE — 0.4% | | | | | | | | | | |
| | 87,399 | | | Credit-Based Asset Servicing and Securitization, LLC Series 2004-CB3 B1(b) | | TSFR1M + 2.889% | | 3.3860 | | 03/25/34 | | | 101,708 | |
| | 75,114 | | | Credit-Based Asset Servicing and Securitization, LLC Series 2004-CB6 M2(b) | | TSFR1M + 1.839% | | 5.0290 | | 07/25/35 | | | 70,514 | |
| | 31,524 | | | CWABS, Inc. Asset-Backed Certificates Trust Series 2004-6 2A4(b) | | TSFR1M + 1.014% | | 5.7520 | | 11/25/34 | | | 30,673 | |
| | 21,837 | | | CWABS, Inc. Asset-Backed Certificates Trust Series 2A3 2A3(b) | | TSFR1M + 1.314% | | 6.0520 | | 11/25/34 | | | 21,823 | |
| | 12,402 | | | Equity One Mortgage Pass-Through Trust Series 2002-5 M1(e) | | | | 5.8030 | | 11/25/32 | | | 11,944 | |
| | 10,832 | | | First Franklin Mortgage Loan Trust Series 2002-FF1 1A2(b) | | TSFR1M + 1.239% | | 6.0840 | | 04/25/32 | | | 11,174 | |
| | 14,313 | | | Long Beach Mortgage Loan Trust Series 2003-2 M2(b) | | TSFR1M + 2.964% | | 7.7020 | | 06/25/33 | | | 16,044 | |
| | 29,467 | | | Morgan Stanley A.B.S Capital I, Inc. Trust Series 2004-NC7 M4(b) | | TSFR1M + 1.839% | | 6.5770 | | 07/25/34 | | | 31,406 | |
| | 109,279 | | | Structured Asset Securities Corporation Series 2005-WF1 M7(b) | | TSFR1M + 2.019% | | 6.7570 | | 02/25/35 | | | 113,571 | |
| | 143,305 | | | Structured Asset Securities Corporation Series 2005-WF1 M8(b) | | TSFR1M + 2.169% | | 6.9070 | | 02/25/35 | | | 147,676 | |
| | | | | | | | | | | | | | 556,533 | |
| | | | | TOTAL ASSET BACKED SECURITIES (Cost $26,814,232) | | | | | | | | | 25,252,244 | |
| | | | | | | | | | | | | | | |
| Principal | | | | | | | | | | | | | |
| Amount | | | | | | | Coupon | | | | | | |
| ($) | | | | | Spread | | Rate (%) | | Maturity | | Fair Value | |
| | | | | COLLATERALIZED MORTGAGE OBLIGATIONS — 6.6% | | | | | | | | | | |
| | 112,759 | | | Fannie Mae Interest Strip(d) | | | | 5.5000 | | 08/25/35 | | | 17,784 | |
| | 264,620 | | | Fannie Mae Interest Strip Series 384 2(d) | | | | 4.5000 | | 07/25/37 | | | 32,418 | |
| | 373,875 | | | Fannie Mae Interest Strip Series 385 3(d) | | | | 5.0000 | | 01/25/38 | | | 60,311 | |
| | 920,853 | | | Fannie Mae Interest Strip Series 407 40(d) | | | | 6.0000 | | 01/25/38 | | | 186,251 | |
| | 233,505 | | | Fannie Mae Interest Strip Series 418 141(b),(d) | | | | 5.5000 | | 05/25/39 | | | 37,500 | |
| | 238,770 | | | Fannie Mae Interest Strip Series 418 147(b),(d) | | | | 6.0000 | | 05/25/39 | | | 39,797 | |
| | 106,723 | | | Fannie Mae Interest Strip Series 409 80(b),(d) | | | | 4.5000 | | 11/25/39 | | | 20,940 | |
| | 452,424 | | | Fannie Mae Interest Strip Series 408 9(b),(d) | | | | 4.5000 | | 10/25/40 | | | 84,810 | |
See accompanying notes to financial statements.
| ANFIELD UNIVERSAL FIXED INCOME FUND |
| SCHEDULE OF INVESTMENTS (Continued) |
| October 31, 2024 |
| Principal | | | | | | | | | | | | |
| Amount | | | | | | | Coupon | | | | | |
| ($) | | | | | Spread | | Rate (%) | | Maturity | | Fair Value | |
| | | | | COLLATERALIZED MORTGAGE OBLIGATIONS — 6.6% (Continued) | | | | | | | | | | |
| | 287,451 | | | Fannie Mae Interest Strip Series 409 83(b),(d) | | | | 4.5000 | | 11/25/40 | | $ | 47,729 | |
| | 1,137,128 | | | Fannie Mae Interest Strip Series 406 15(d) | | | | 5.0000 | | 12/25/40 | | | 255,219 | |
| | 192,067 | | | Fannie Mae Interest Strip Series 409 C13(d) | | | | 3.5000 | | 11/25/41 | | | 29,006 | |
| | 133,311 | | | Fannie Mae Interest Strip Series 409 64(b),(d) | | | | 4.0000 | | 11/25/41 | | | 21,736 | |
| | 164,512 | | | Fannie Mae Interest Strip Series 413 126(b),(d) | | | | 4.0000 | | 07/25/42 | | | 26,745 | |
| | 166,813 | | | Fannie Mae Interest Strip Series 413 177(b),(d) | | | | 4.5000 | | 07/25/42 | | | 30,575 | |
| | 347,205 | | | Fannie Mae Interest Strip Series 413 155(b),(d) | | | | 4.5000 | | 07/25/42 | | | 63,975 | |
| | 852,233 | | | Fannie Mae Interest Strip Series 417 C24(d) | | | | 3.5000 | | 12/25/42 | | | 110,412 | |
| | 368,114 | | | Fannie Mae Interest Strip Series 419 C3(d) | | | | 3.0000 | | 11/25/43 | | | 51,022 | |
| | 482,163 | | | Fannie Mae Interest Strip Series 426 292(b),(d) | | | | 3.5000 | | 08/25/51 | | | 78,979 | |
| | 320,721 | | | Fannie Mae REMICS Series 2004-70 XJ(b),(d) | | | | 5.0000 | | 10/25/34 | | | 46,863 | |
| | 504,793 | | | Fannie Mae REMICS Series 2006-109 SG(b),(d) | | SOFR30A + 6.516% | | 1.6590 | | 11/25/36 | | | 43,244 | |
| | 207,777 | | | Fannie Mae REMICS Series 2007-39 AI(b),(d) | | SOFR30A + 6.006% | | 1.1490 | | 05/25/37 | | | 17,673 | |
| | 145,640 | | | Fannie Mae REMICS Series 2007-92 SK(b),(d) | | SOFR30A + 6.336% | | 1.4790 | | 09/25/37 | | | 15,239 | |
| | 151,561 | | | Fannie Mae REMICS Series 2007-112 SA(b),(d) | | SOFR30A + 6.450% | | 1.4790 | | 12/25/37 | | | 17,774 | |
| | 74,449 | | | Fannie Mae REMICS Series 2009-31 PI(d) | | | | 5.0000 | | 11/25/38 | | | 2,108 | |
| | 397,766 | | | Fannie Mae REMICS Series 2009-101 MI(d) | | | | 6.0000 | | 12/25/39 | | | 40,057 | |
| | 414,519 | | | Fannie Mae REMICS Series 2009-113 XI(b),(d) | | | | 5.0000 | | 01/25/40 | | | 65,730 | |
| | 521,105 | | | Fannie Mae REMICS Series 2010-150 SP(b),(d) | | SOFR30A + 6.486% | | 1.6290 | | 10/25/40 | | | 46,445 | |
| | 1,512,176 | | | Fannie Mae REMICS Series 2011-149 MS(b),(d) | | SOFR30A + 5.886% | | 1.0290 | | 11/25/41 | | | 75,756 | |
| | 122,616 | | | Fannie Mae REMICS Series 2012-84 KI(b),(d) | | SOFR30A + 6.000% | | 6.0000 | | 08/25/42 | | | 18,922 | |
| | 154,101 | | | Fannie Mae REMICS Series 2013-10 SJ(b),(d) | | SOFR30A + 6.036% | | 1.1790 | | 02/25/43 | | | 15,752 | |
| | 452,410 | | | Fannie Mae REMICS Series 2014-68 IB(d) | | | | 4.5000 | | 02/25/43 | | | 52,472 | |
| | 95,663 | | | Fannie Mae REMICS Series 2015-16 IN(d) | | | | 4.5000 | | 09/25/43 | | | 3,334 | |
| | 1,159,066 | | | Fannie Mae REMICS Series 2013-103 JS(b),(d) | | SOFR30A + 5.886% | | 1.0290 | | 10/25/43 | | | 104,110 | |
| | 149,376 | | | Fannie Mae REMICS Series 2015-22 BS(b),(d) | | SOFR30A + 6.036% | | 4.5980 | | 04/25/45 | | | 17,447 | |
| | 7,119,288 | | | Fannie Mae REMICS Series 2015-40 LT(b),(d) | | SOFR30A + 6.200% | | 0.0300 | | 06/25/45 | | | 11,007 | |
| | 2,108,596 | | | Fannie Mae REMICS Series 2015-34 HI(d) | | | | 6.0000 | | 06/25/45 | | | 479,640 | |
| | 83,856 | | | Fannie Mae REMICS Series 2017-78 KI(d) | | | | 3.5000 | | 10/25/47 | | | 13,897 | |
| | 71,538 | | | Fannie Mae REMICS Series 2018-37 CI(d) | | | | 4.0000 | | 10/25/47 | | | 1,991 | |
| | 1,022,314 | | | Fannie Mae REMICS Series 2017-97 SW(b),(d) | | SOFR30A + 6.086% | | 1.2290 | | 12/25/47 | | | 122,356 | |
| | 305,359 | | | Fannie Mae REMICS Series 2017-99 DI(d) | | | | 3.5000 | | 12/25/47 | | | 40,243 | |
| | 163,780 | | | Fannie Mae REMICS Series 2018-2 LI(d) | | | | 3.5000 | | 12/25/47 | | | 16,061 | |
| | 292,814 | | | Fannie Mae REMICS Series 2018-31 IO(d) | | | | 4.5000 | | 12/25/47 | | | 57,410 | |
See accompanying notes to financial statements.
| ANFIELD UNIVERSAL FIXED INCOME FUND |
| SCHEDULE OF INVESTMENTS (Continued) |
| October 31, 2024 |
| Principal | | | | | | | | | | | | |
| Amount | | | | | | | Coupon | | | | | |
| ($) | | | | | Spread | | Rate (%) | | Maturity | | Fair Value | |
| | | | | COLLATERALIZED MORTGAGE OBLIGATIONS — 6.6% (Continued) | | | | | | | | | | |
| | 1,027,635 | | | Fannie Mae REMICS Series 2018-16 MI(d) | | | | 4.0000 | | 03/25/48 | | $ | 211,088 | |
| | 201,794 | | | Fannie Mae REMICS Series 2018-34 CI(d) | | | | 4.0000 | | 05/25/48 | | | 34,547 | |
| | 244,085 | | | Fannie Mae REMICS Series 2018-35 KI(d) | | | | 4.0000 | | 05/25/48 | | | 41,963 | |
| | 1,126,627 | | | Fannie Mae REMICS Series 2018-54 SA(b),(d) | | SOFR30A + 6.136% | | 1.2790 | | 08/25/48 | | | 98,519 | |
| | 427,066 | | | Fannie Mae REMICS Series 2018-74 MI(d) | | | | 4.5000 | | 10/25/48 | | | 83,264 | |
| | 599,488 | | | Fannie Mae REMICS Series 2019-44 IC(d) | | | | 3.5000 | | 08/25/49 | | | 87,998 | |
| | 222,950 | | | Fannie Mae REMICS Series 2021-27 GI(d) | | | | 4.5000 | | 05/25/51 | | | 58,443 | |
| | 1,022,014 | | | Fannie Mae REMICS Series 2020-10 S(b),(d) | | SOFR30A + 5.936% | | 1.0790 | | 05/25/59 | | | 108,359 | |
| | 18,175 | | | Freddie Mac REMICS Series 2433 SA(b) | | SOFR30A + 20.632% | | 7.6070 | | 02/15/32 | | | 20,608 | |
| | 795,471 | | | Freddie Mac REMICS Series 5112 IB(d) | | | | 6.5000 | | 05/15/32 | | | 95,346 | |
| | 4,377 | | | Freddie Mac REMICS Series 4325 GI(d) | | | | 3.5000 | | 04/15/33 | | | 9 | |
| | 199,021 | | | Freddie Mac REMICS Series 4394 BI(d) | | | | 5.5000 | | 07/15/37 | | | 26,974 | |
| | 74,448 | | | Freddie Mac REMICS Series 4419 EI(d) | | | | 6.0000 | | 10/15/37 | | | 8,003 | |
| | 3,385,631 | | | Freddie Mac REMICS Series 4669 TI(b),(d) | | SOFR30A + 5.986% | | 0.1000 | | 09/15/40 | | | 6,677 | |
| | 82,365 | | | Freddie Mac REMICS Series 3772 SA(b) | | SOFR30A + 14.567% | | — | | 12/15/40 | | | 66,044 | |
| | 453,650 | | | Freddie Mac REMICS Series 3935 SH(b),(d) | | SOFR30A + 6.486% | | 1.4760 | | 12/15/40 | | | 12,437 | |
| | 34,708 | | | Freddie Mac REMICS Series 4493 HI(d) | | | | 3.0000 | | 06/15/41 | | | 199 | |
| | 172,639 | | | Freddie Mac REMICS Series 4076 SW(b),(d) | | SOFR30A + 5.936% | | 0.9260 | | 07/15/42 | | | 16,325 | |
| | 102,250 | | | Freddie Mac REMICS Series 4139 PO(g) | | | | — | | 08/15/42 | | | 66,396 | |
| | 229,010 | | | Freddie Mac REMICS Series 4091 ES(b),(d) | | SOFR30A + 6.436% | | 1.4260 | | 08/15/42 | | | 30,995 | |
| | 464,613 | | | Freddie Mac REMICS Series 4197 IG(d) | | | | 4.0000 | | 04/15/43 | | | 58,646 | |
| | 6,523 | | | Freddie Mac REMICS Series 4558 DI(d) | | | | 3.5000 | | 07/15/43 | | | 7 | |
| | 9,874,112 | | | Freddie Mac REMICS Series 4765 SI(b),(d) | | | | 0.2070 | | 08/15/44 | | | 86,409 | |
| | 291,716 | | | Freddie Mac REMICS Series 4416 DS(b),(d) | | SOFR30A + 5.985% | | 0.9760 | | 12/15/44 | | | 32,848 | |
| | 245,323 | | | Freddie Mac REMICS Series 4480 IN(d) | | | | 4.0000 | | 03/15/45 | | | 29,307 | |
| | 284,276 | | | Freddie Mac REMICS Series 4473 AS(b),(d) | | SOFR30A + 5.486% | | 0.4760 | | 05/15/45 | | | 26,454 | |
| | 105,074 | | | Freddie Mac REMICS Series 4591 QI(d) | | | | 3.5000 | | 04/15/46 | | | 18,014 | |
| | 761,672 | | | Freddie Mac REMICS Series 4583 ST(b),(d) | | SOFR30A + 5.886% | | 0.8760 | | 05/15/46 | | | 78,766 | |
| | 654,531 | | | Freddie Mac REMICS Series 4699 NI(d) | | | | 4.0000 | | 12/15/46 | | | 82,737 | |
| | 182,389 | | | Freddie Mac REMICS Series 4792 AI(d) | | | | 4.0000 | | 05/15/48 | | | 32,980 | |
| | 1,028,252 | | | Freddie Mac REMICS Series 4827 BI(d) | | | | 4.5000 | | 09/15/48 | | | 165,190 | |
| | 348,566 | | | Freddie Mac REMICS Series 5093 NI(d) | | | | 4.0000 | | 08/25/49 | | | 71,399 | |
| | 781,369 | | | Freddie Mac REMICS Series 5022 IO(d) | | | | 3.0000 | | 09/25/50 | | | 134,733 | |
See accompanying notes to financial statements.
| ANFIELD UNIVERSAL FIXED INCOME FUND |
| SCHEDULE OF INVESTMENTS (Continued) |
| October 31, 2024 |
| Principal | | | | | | | | | | | | |
| Amount | | | | | | | Coupon | | | | | |
| ($) | | | | | Spread | | Rate (%) | | Maturity | | Fair Value | |
| | | | | COLLATERALIZED MORTGAGE OBLIGATIONS — 6.6% (Continued) | | | | | | | | | | |
| | 440,496 | | | Freddie Mac REMICS Series 5023 MI(d) | | | | 3.0000 | | 10/25/50 | | $ | 75,344 | |
| | 315,887 | | | Freddie Mac REMICS Series 5082 HI(d) | | | | 3.0000 | | 03/25/51 | | | 43,266 | |
| | 454,284 | | | Freddie Mac REMICS Series 5086 IW(d) | | | | 3.0000 | | 03/25/51 | | | 64,657 | |
| | 853,779 | | | Freddie Mac REMICS Series 5086 HI(d) | | | | 4.5000 | | 03/25/51 | | | 190,657 | |
| | 1,254,835 | | | Freddie Mac REMICS Series 5174 NI(d) | | | | 3.5000 | | 12/25/51 | | | 223,167 | |
| | 313,092 | | | Freddie Mac REMICS Series 4291 MS(b),(d) | | SOFR30A + 5.786% | | 0.7760 | | 01/15/54 | | | 31,611 | |
| | 41,212 | | | Freddie Mac Strips Series 202 IO(d) | | | | 6.5000 | | 04/01/29 | | | 4,176 | |
| | 479,011 | | | Freddie Mac Strips Series 256 50(d) | | | | 5.0000 | | 06/15/38 | | | 62,032 | |
| | 174,549 | | | Freddie Mac Strips Series 303 181(b),(d) | | | | 4.5000 | | 12/15/39 | | | 21,243 | |
| | 176,629 | | | Freddie Mac Strips Series 303 175(b),(d) | | | | 4.5000 | | 12/15/40 | | | 24,320 | |
| | 249,406 | | | Freddie Mac Strips Series 303 141(b),(d) | | | | 4.5000 | | 01/15/43 | | | 39,058 | |
| | 505,288 | | | Freddie Mac Strips Series 324 C24(d) | | | | 5.0000 | | 12/15/43 | | | 108,322 | |
| | 574,887 | | | Freddie Mac Strips Series 365 C10(d) | | | | 3.5000 | | 06/15/49 | | | 109,092 | |
| | 12,178 | | | Government National Mortgage Association Series 2011-157 AI(d) | | | | 4.0000 | | 12/16/26 | | | 236 | |
| | 506,313 | | | Government National Mortgage Association Series 2021-78 QI(d) | | | | 5.0000 | | 05/20/34 | | | 48,596 | |
| | 2,381,619 | | | Government National Mortgage Association Series 2009-87 IW(b),(dd) | | TSFR1M + 6.736% | | 1.9760 | | 07/20/34 | | | 92,216 | |
| | 6,028,202 | | | Government National Mortgage Association Series 2014-94 JI(b),(d) | | TSFR1M + 6.586% | | 0.1500 | | 09/16/34 | | | 30,060 | |
| | 717,578 | | | Government National Mortgage Association Series 2007-26 SD(b),(d) | | TSFR1M + 6.686% | | 1.9000 | | 05/16/37 | | | 80,078 | |
| | 4,257,481 | | | Government National Mortgage Association Series 2017-60 SA(b),(d) | | TSFR1M + 6.576% | | 1.8160 | | 10/20/37 | | | 222,273 | |
| | 1,229,107 | | | Government National Mortgage Association Series 2008-60 SH(b),(d) | | TSFR1M + 6.036% | | 1.2500 | | 07/16/38 | | | 30,606 | |
| | 824,640 | | | Government National Mortgage Association Series 2017-88 IB(d) | | | | 5.5000 | | 02/20/39 | | | 116,354 | |
| | 240,366 | | | Government National Mortgage Association Series 2009-61 AS(b),(d) | | TSFR1M + 5.986% | | 1.2260 | | 03/20/39 | | | 3,093 | |
| | 672,107 | | | Government National Mortgage Association Series 2009-69 IV(d) | | | | 5.5000 | | 08/20/39 | | | 95,855 | |
| | 2,203,376 | | | Government National Mortgage Association Series 2010-29 SA(b),(d) | | TSFR1M + 6.436% | | 1.6760 | | 10/20/39 | | | 248,351 | |
| | 257,487 | | | Government National Mortgage Association Series 2013-90 AI(d) | | | | 3.5000 | | 10/20/39 | | | 5,222 | |
| | 685,628 | | | Government National Mortgage Association Series 2017-60 SU(b),(d) | | TSFR1M + 6.286% | | 1.5000 | | 01/16/40 | | | 58,180 | |
| | 812,836 | | | Government National Mortgage Association Series 2013-20 IM(d) | | | | 5.0000 | | 04/20/40 | | | 128,979 | |
| | 1,161,129 | | | Government National Mortgage Association Series 2017-160 TI(b),(d) | | | | 0.5000 | | 06/20/40 | | | 18,267 | |
| | 1,022,315 | | | Government National Mortgage Association Series 2010-133 SB(b),(d) | | TSFR1M + 5.906% | | 1.1200 | | 10/16/40 | | | 114,213 | |
| | 182,791 | | | Government National Mortgage Association Series 2019-22 HI(d) | | | | 5.0000 | | 10/16/40 | | | 22,898 | |
| | 1,806,244 | | | Government National Mortgage Association Series 2010-166 SA(b),(d) | | TSFR1M + 5.936% | | 1.1500 | | 12/16/40 | | | 189,263 | |
| | 267,813 | | | Government National Mortgage Association Series 2012-69 QI(d) | | | | 4.0000 | | 03/16/41 | | | 29,828 | |
| | 186,215 | | | Government National Mortgage Association Series 2011-68 EI(d) | | | | 6.0000 | | 04/20/41 | | | 21,840 | |
| | 109,932 | | | Government National Mortgage Association Series 2013-75 GI(d) | | | | 3.0000 | | 06/20/41 | | | 833 | |
See accompanying notes to financial statements.
| ANFIELD UNIVERSAL FIXED INCOME FUND |
| SCHEDULE OF INVESTMENTS (Continued) |
| October 31, 2024 |
| Principal | | | | | | | | | | | | |
| Amount | | | | | | | Coupon | | | | | |
| ($) | | | | | Spread | | Rate (%) | | Maturity | | Fair Value | |
| | | | | COLLATERALIZED MORTGAGE OBLIGATIONS — 6.6% (Continued) | | | | | | | | | | |
| | 337,976 | | | Government National Mortgage Association Series 2015-44 AI(d) | | | | 3.0000 | | 08/20/41 | | $ | 3,097 | |
| | 246,918 | | | Government National Mortgage Association Series 2012-108 PS(b),(d) | | TSFR1M + 6.636% | | 1.8500 | | 03/16/42 | | | 28,718 | |
| | 978,777 | | | Government National Mortgage Association Series 2013-4 ID(d) | | | | 5.5000 | | 05/16/42 | | | 182,207 | |
| | 171,349 | | | Government National Mortgage Association Series 2012-149 GI(d) | | | | 5.0000 | | 07/20/42 | | | 16,060 | |
| | 341,529 | | | Government National Mortgage Association Series 2012-98 HS(b),(d) | | TSFR1M + 5.885% | | 1.1260 | | 08/20/42 | | | 34,517 | |
| | 817,531 | | | Government National Mortgage Association Series 2012-126 IO(d) | | | | 3.5000 | | 10/20/42 | | | 115,043 | |
| | 427,430 | | | Government National Mortgage Association Series 2012-140 IC(d) | | | | 3.5000 | | 11/20/42 | | | 65,037 | |
| | 245,577 | | | Government National Mortgage Association Series 2012-149 CS(b),(d) | | TSFR1M + 6.086% | | 1.3260 | | 12/20/42 | | | 17,619 | |
| | 71,192 | | | Government National Mortgage Association Series 2013-5 BI(d) | | | | 3.5000 | | 01/20/43 | | | 11,683 | |
| | 346,634 | | | Government National Mortgage Association Series 2013-20 KI(d) | | | | 5.0000 | | 01/20/43 | | | 59,730 | |
| | 1,037,967 | | | Government National Mortgage Association Series 2013-144 AS(b),(d) | | TSFR1M + 6.636% | | 1.8760 | | 03/20/43 | | | 14,004 | |
| | 365,127 | | | Government National Mortgage Association Series 2013-82 IG(d) | | | | 3.5000 | | 05/20/43 | | | 55,397 | |
| | 535,456 | | | Government National Mortgage Association Series 2019-22 EI(b),(d) | | | | 1.0000 | | 07/20/43 | | | 11,431 | |
| | 71,651 | | | Government National Mortgage Association Series 2013-103 DS(b),(d) | | TSFR1M + 6.036% | | 1.2760 | | 07/20/43 | | | 7,850 | |
| | 319,746 | | | Government National Mortgage Association Series 2013-189 PS(b),(d) | | TSFR1M + 6.036% | | 1.2760 | | 07/20/43 | | | 26,511 | |
| | 633,914 | | | Government National Mortgage Association Series 2013-122 SB(b),(d) | | TSFR1M + 5.986% | | 1.2000 | | 08/16/43 | | | 69,850 | |
| | 8,967,193 | | | Government National Mortgage Association Series 2019-21 SI(b),(d) | | | | 0.2660 | | 10/20/43 | | | 69,194 | |
| | 213,695 | | | Government National Mortgage Association Series 2014-132 SL(b),(d) | | TSFR1M + 5.986% | | 1.2260 | | 10/20/43 | | | 9,544 | |
| | 147,478 | | | Government National Mortgage Association Series 2013-181 SA(b),(d) | | TSFR1M + 5.986% | | 1.2260 | | 11/20/43 | | | 11,818 | |
| | 318,038 | | | Government National Mortgage Association Series 2014-91 SB(b),(d) | | TSFR1M + 5.486% | | 0.7000 | | 06/16/44 | | | 30,821 | |
| | 99,455 | | | Government National Mortgage Association Series 2014-133 BS(b),(d) | | TSFR1M + 5.486% | | 0.7260 | | 09/20/44 | | | 7,193 | |
| | 499,716 | | | Government National Mortgage Association Series 2019-22 SA(b),(d) | | TSFR1M + 5.486% | | 0.7260 | | 02/20/45 | | | 44,741 | |
| | 138,057 | | | Government National Mortgage Association Series 2017-99 DI(d) | | | | 4.0000 | | 07/20/45 | | | 7,363 | |
| | 462,274 | | | Government National Mortgage Association Series 2017-112 KI(d) | | | | 4.5000 | | 08/20/45 | | | 49,054 | |
| | 577,825 | | | Government National Mortgage Association Series 2016-163 KI(d) | | | | 6.0000 | | 08/20/45 | | | 54,178 | |
| | 342,803 | | | Government National Mortgage Association Series 2017-130 LI(d) | | | | 4.5000 | | 10/16/45 | | | 28,071 | |
| | 2,059,465 | | | Government National Mortgage Association Series 2019-22 CI(b),(d) | | TSFR1M + 30.678% | | 1.0000 | | 10/20/45 | | | 122,094 | |
| | 274,555 | | | Government National Mortgage Association Series 2015-179 GS(b),(d) | | TSFR1M + 6.636% | | 1.8760 | | 12/20/45 | | | 39,154 | |
| | 97,253 | | | Government National Mortgage Association Series 2016-54 PI(d) | | | | 3.0000 | | 04/20/46 | | | 9,805 | |
| | 290,121 | | | Government National Mortgage Association Series 2016-46 IO(d) | | | | 3.5000 | | 04/20/46 | | | 48,499 | |
| | 81,067 | | | Government National Mortgage Association Series 2017-101 ID(d) | | | | 4.5000 | | 04/20/46 | | | 6,102 | |
| | 174,542 | | | Government National Mortgage Association Series 2016-81 IO(d) | | | | 4.0000 | | 06/20/46 | | | 33,360 | |
| | 881,105 | | | Government National Mortgage Association Series 2016-121 JS(b),(d) | | TSFR1M + 5.986% | | 1.2260 | | 09/20/46 | | | 107,019 | |
| | 308,989 | | | Government National Mortgage Association Series 2016-116 IJ(d) | | | | 3.5000 | | 09/20/46 | | | 33,376 | |
See accompanying notes to financial statements.
| ANFIELD UNIVERSAL FIXED INCOME FUND |
| SCHEDULE OF INVESTMENTS (Continued) |
| October 31, 2024 |
| Principal | | | | | | | | | | | | |
| Amount | | | | | | | Coupon | | | | | |
| ($) | | | | | Spread | | Rate (%) | | Maturity | | Fair Value | |
| | | | | COLLATERALIZED MORTGAGE OBLIGATIONS — 6.6% (Continued) | | | | | | | | | | |
| | 136,160 | | | Government National Mortgage Association Series 2019-11 MI(d) | | | | 5.0000 | | 11/20/46 | | $ | 7,639 | |
| | 161,337 | | | Government National Mortgage Association Series 2017-114 CI(d) | | | | 3.5000 | | 03/20/47 | | | 12,482 | |
| | 11,625 | | | Government National Mortgage Association Series 2017-141 ID(d) | | | | 3.5000 | | 07/20/47 | | | 1,688 | |
| | 313,523 | | | Government National Mortgage Association Series 2018-18 BI(d) | | | | 4.0000 | | 11/20/47 | | | 28,019 | |
| | 776,334 | | | Government National Mortgage Association Series 2017-179 KS(b),(d) | | TSFR1M + 6.086% | | 1.3260 | | 12/20/47 | | | 96,581 | |
| | 126,345 | | | Government National Mortgage Association Series 2017-179 WI(d) | | | | 5.0000 | | 12/20/47 | | | 26,425 | |
| | 308,818 | | | Government National Mortgage Association Series 2018-1 IP(d) | | | | 3.5000 | | 01/20/48 | | | 33,418 | |
| | 18,104,336 | | | Government National Mortgage Association Series 2020-86 TK(b),(d) | | TSFR1M + 6.086% | | 0.1500 | | 08/20/48 | | | 92,274 | |
| | 171,588 | | | Government National Mortgage Association Series 2018-120 JI(d) | | | | 5.5000 | | 09/20/48 | | | 24,900 | |
| | 244,171 | | | Government National Mortgage Association Series 2018-154 IT(d) | | | | 5.5000 | | 10/20/48 | | | 44,866 | |
| | 445,337 | | | Government National Mortgage Association Series 2019-6 SA(b),(d) | | TSFR1M + 5.936% | | 1.1760 | | 01/20/49 | | | 47,534 | |
| | 226,172 | | | Government National Mortgage Association Series 2019-18 CS(b),(d) | | TSFR1M + 5.936% | | 1.1760 | | 02/20/49 | | | 17,863 | |
| | 947,533 | | | Government National Mortgage Association Series 2020-47 MI(d) | | | | 3.5000 | | 04/20/50 | | | 175,469 | |
| | 403,422 | | | Government National Mortgage Association Series 2020-127 IN(d) | | | | 2.5000 | | 08/20/50 | | | 57,349 | |
| | 631,310 | | | Government National Mortgage Association Series 2020-167 NS(b),(d) | | TSFR1M + 6.186% | | 1.4260 | | 11/20/50 | | | 83,129 | |
| | 2,246,910 | | | Government National Mortgage Association Series 2019-H16 CI(b),(d) | | | | 0.9280 | | 10/20/69 | | | 99,635 | |
| | | | | | | | | | | | | | 9,246,021 | |
| | | | | TOTAL COLLATERALIZED MORTGAGE OBLIGATIONS (Cost $20,585,589) | | | | | | | | | 9,246,021 | |
| | | | | | | | | | | | | | | |
| Principal | | | | | | | | | | | | | |
| Amount | | | | | | | Coupon | | | | | | |
| ($) | | | | | Spread | | Rate (%) | | Maturity | | Fair Value | |
| | | | | CORPORATE BONDS — 57.0% | | | | | | | | | | |
| | | | | ASSET MANAGEMENT — 5.7% | | | | | | | | | | |
| | 1,000,000 | | | Ares Capital Corporation | | | | 4.2500 | | 03/01/25 | | | 996,497 | |
| | 1,750,000 | | | Bain Capital Specialty Finance, Inc. | | | | 2.9500 | | 03/10/26 | | | 1,689,405 | |
| | 600,000 | | | Blackstone Secured Lending Fund | | | | 3.6250 | | 01/15/26 | | | 586,715 | |
| | 1,301,000 | | | FS KKR Capital Corporation | | | | 4.1250 | | 02/01/25 | | | 1,295,596 | |
| | 850,000 | | | FS KKR Capital Corporation | | | | 3.4000 | | 01/15/26 | | | 827,465 | |
| | 1,125,000 | | | Icahn Enterprises, L.P. / Icahn Enterprises | | | | 6.2500 | | 05/15/26 | | | 1,106,904 | |
| | 700,000 | | | Nuveen Finance, LLC(a) | | | | 4.1250 | | 11/01/24 | | | 700,000 | |
| | 750,000 | | | UBS Group A.G.(a),(d) | | H15T1Y + 1.550% | | 4.4880 | | 05/12/26 | | | 747,128 | |
| | | | | | | | | | | | | | 7,949,710 | |
See accompanying notes to financial statements.
| ANFIELD UNIVERSAL FIXED INCOME FUND |
| SCHEDULE OF INVESTMENTS (Continued) |
| October 31, 2024 |
| Principal | | | | | | | | | | | | |
| Amount | | | | | | | Coupon | | | | | |
| ($) | | | | | Spread | | Rate (%) | | Maturity | | Fair Value | |
| | | | | CORPORATE BONDS — 57.0% (Continued) | | | | | | | | | | |
| | | | | AUTOMOTIVE — 5.4% | | | | | | | | | | |
| | 750,000 | | | Ford Motor Credit Company, LLC | | | | 2.3000 | | 02/10/25 | | $ | 743,321 | |
| | 400,000 | | | Ford Motor Credit Company, LLC | | | | 4.6870 | | 06/09/25 | | | 398,380 | |
| | 1,650,000 | | | Ford Motor Credit Company, LLC | | | | 5.1250 | | 06/16/25 | | | 1,645,971 | |
| | 1,935,000 | | | Ford Motor Credit Company, LLC | | | | 3.3750 | | 11/13/25 | | | 1,898,355 | |
| | 1,000,000 | | | Ford Motor Credit Company, LLC | | | | 6.2000 | | 06/20/34 | | | 1,001,505 | |
| | 515,000 | | | Harley-Davidson Financial Services, Inc.(a) | | | | 3.3500 | | 06/08/25 | | | 509,057 | |
| | 600,000 | | | Nissan Motor Acceptance Company, LLC(a) | | | | 5.3000 | | 09/13/27 | | | 590,629 | |
| | 850,000 | | | Nissan Motor Acceptance Corporation(a) | | | | 2.0000 | | 03/09/26 | | | 808,476 | |
| | | | | | | | | | | | | | 7,595,694 | |
| | | | | BANKING — 13.2% | | | | | | | | | | |
| | 500,000 | | | ABN AMRO Bank N.V.(a) | | | | 4.7500 | | 07/28/25 | | | 497,878 | |
| | 550,000 | | | Bank of America Corporation | | | | 4.0000 | | 01/22/25 | | | 548,733 | |
| | 500,000 | | | Bank of Montreal | | | | 5.1000 | | 01/31/25 | | | 497,358 | |
| | 650,000 | | | Barclays plc | | | | 3.6500 | | 03/16/25 | | | 646,688 | |
| | 500,000 | | | Barclays plc(d) | | SOFRRATE + 2.714% | | 2.8520 | | 05/07/26 | | | 494,023 | |
| | 300,000 | | | BBVA USA | | | | 3.8750 | | 04/10/25 | | | 298,630 | |
| | 600,000 | | | BNP Paribas S.A.(a) | | | | 4.3750 | | 09/28/25 | | | 594,704 | |
| | 250,000 | | | BNP Paribas S.A.(a),(d) | | SOFRRATE + 2.074% | | 2.2190 | | 06/09/26 | | | 245,523 | |
| | 1,000,000 | | | BNP Paribas S.A.(a),(d) | | H15T5Y + 3.196% | | 4.6250 | | Perpetual | | | 937,777 | |
| | 1,382,000 | | | BPCE S.A.(a) | | | | 4.5000 | | 03/15/25 | | | 1,376,966 | |
| | 1,605,000 | | | Credit Agricole S.A.(a) | | | | 4.3750 | | 03/17/25 | | | 1,598,751 | |
| | 550,000 | | | Credit Agricole S.A.(a),(d) | | SOFRRATE + 1.676% | | 1.9070 | | 06/16/26 | | | 538,803 | |
| | 900,000 | | | Danske Bank A/S(a),(d) | | US0003M + 1.591% | | 3.2440 | | 12/20/25 | | | 897,069 | |
| | 1,023,000 | | | Deutsche Bank A.G. | | | | 4.5000 | | 04/01/25 | | | 1,019,628 | |
| | 1,500,000 | | | Deutsche Bank A.G.(d) | | SOFRRATE + 2.581% | | 3.9610 | | 11/26/25 | | | 1,498,065 | |
| | 1,000,000 | | | Deutsche Bank A.G.(d) | | H15T5Y + 4.524% | | 6.0000 | | Perpetual | | | 979,980 | |
| | 1,000,000 | | | KeyCorporation(d) | | SOFRINDX + 1.250% | | 6.3210 | | 05/23/25 | | | 1,003,041 | |
| | 750,000 | | | Lloyds Banking Group plc | | | | 4.5000 | | 11/04/24 | | | 749,953 | |
| | 500,000 | | | Manufacturers & Traders Trust Company | | | | 2.9000 | | 02/06/25 | | | 496,715 | |
| | 250,000 | | | NatWest Group plc(d) | | H15T5Y + 2.100% | | 3.7540 | | 11/01/29 | | | 250,000 | |
| | 1,749,000 | | | Societe Generale S.A.(a) | | | | 4.2500 | | 04/14/25 | | | 1,737,529 | |
See accompanying notes to financial statements.
| ANFIELD UNIVERSAL FIXED INCOME FUND |
| SCHEDULE OF INVESTMENTS (Continued) |
| October 31, 2024 |
| Principal | | | | | | | | | | | | |
| Amount | | | | | | | Coupon | | | | | |
| ($) | | | | | Spread | | Rate (%) | | Maturity | | Fair Value | |
| | | | | CORPORATE BONDS — 57.0% (Continued) | | | | | | | | | | |
| | | | | BANKING — 13.2% (Continued) | | | | | | | | | | |
| | 550,000 | | | Societe Generale S.A.(a) | | | | 4.7500 | | 11/24/25 | | $ | 546,144 | |
| | 500,000 | | | Synchrony Bank | | | | 5.4000 | | 08/22/25 | | | 500,310 | |
| | 500,000 | | | Wells Fargo & Company(d) | | SOFRRATE + 2.000% | | 2.1880 | | 04/30/26 | | | 492,856 | |
| | | | | | | | | | | | | | 18,447,124 | |
| | | | | BIOTECH & PHARMA — 1.7% | | | | | | | | | | |
| | 625,000 | | | Teva Pharmaceutical Finance Netherlands III BV | | | | 7.1250 | | 01/31/25 | | | 624,940 | |
| | 501,000 | | | Teva Pharmaceutical Finance Netherlands III BV | | | | 3.1500 | | 10/01/26 | | | 477,997 | |
| | 1,325,000 | | | Teva Pharmaceutical Finance Netherlands III BV | | | | 4.7500 | | 05/09/27 | | | 1,290,309 | |
| | | | | | | | | | | | | | 2,393,246 | |
| | | | | COMMERCIAL SUPPORT SERVICES — 0.4% | | | | | | | | | | |
| | 550,000 | | | Aramark Services, Inc.(a) | | | | 5.0000 | | 02/01/28 | | | 540,628 | |
| | | | | | | | | | | | | | | |
| | | | | ELECTRIC UTILITIES — 3.6% | | | | | | | | | | |
| | 1,000,000 | | | American Electric Power Company, Inc.(d) | | H15T5Y + 2.675% | | 3.8750 | | 02/15/62 | | | 948,446 | |
| | 2,000,000 | | | Electricite de France S.A.(a),(d) | | H15T5Y + 5.411% | | 9.1250 | | Perpetual | | | 2,270,562 | |
| | 376,000 | | | FirstEnergy Corporation | | | | 2.0500 | | 03/01/25 | | | 372,407 | |
| | 150,000 | | | FirstEnergy Corporation | | | | 4.1500 | | 07/15/27 | | | 146,584 | |
| | 625,000 | | | FirstEnergy Transmission, LLC(a) | | | | 4.3500 | | 01/15/25 | | | 623,666 | |
| | 697,000 | | | Pennsylvania Electric Company(a) | | | | 4.1500 | | 04/15/25 | | | 691,909 | |
| | | | | | | | | | | | | | 5,053,574 | |
| | | | | FORESTRY, PAPER & WOOD PRODUCTS — 0.6% | | | | | | | | | | |
| | 775,000 | | | Carter Holt Harvey Ltd.(c),(g) | | | | 9.5000 | | 12/01/24 | | | 774,892 | |
| | | | | | | | | | | | | | | |
| | | | | INSTITUTIONAL FINANCIAL SERVICES — 0.6% | | | | | | | | | | |
| | 600,000 | | | Morgan Stanley(d) | | SOFRRATE + 0.509% | | 5.3360 | | 01/22/25 | | | 600,303 | |
| | 250,000 | | | State Street Corporation(d) | | SOFRRATE + 0.940% | | 2.3540 | | 11/01/25 | | | 250,000 | |
| | | | | | | | | | | | | | 850,303 | |
| | | | | INSURANCE — 0.8% | | | | | | | | | | |
| | 580,000 | | | Athene Global Funding(a) | | | | 2.5000 | | 01/14/25 | | | 576,810 | |
| | 506,000 | | | Kemper Corporation | | | | 4.3500 | | 02/15/25 | | | 504,027 | |
| | | | | | | | | | | | | | 1,080,837 | |
See accompanying notes to financial statements.
| ANFIELD UNIVERSAL FIXED INCOME FUND |
| SCHEDULE OF INVESTMENTS (Continued) |
| October 31, 2024 |
| Principal | | | | | | | | | | | | |
| Amount | | | | | | | Coupon | | | | | |
| ($) | | | | | Spread | | Rate (%) | | Maturity | | Fair Value | |
| | | | | CORPORATE BONDS — 57.0% (Continued) | | | | | | | | | | |
| | | | | LEISURE FACILITIES & SERVICES — 4.8% | | | | | | | | | | |
| | 838,000 | | | Caesars Entertainment, Inc.(a) | | | | 4.6250 | | 10/15/29 | | $ | 786,572 | |
| | 265,000 | | | International Game Technology plc(a) | | | | 4.1250 | | 04/15/26 | | | 261,387 | |
| | 263,000 | | | International Game Technology plc(a) | | | | 6.2500 | | 01/15/27 | | | 265,799 | |
| | 500,000 | | | International Game Technology plc(a) | | | | 5.2500 | | 01/15/29 | | | 491,654 | |
| | 1,000,000 | | | Las Vegas Sands Corporation | | | | 2.9000 | | 06/25/25 | | | 985,200 | |
| | 1,025,000 | | | Penn National Gaming, Inc.(a) | | | | 5.6250 | | 01/15/27 | | | 1,006,247 | |
| | 725,000 | | | Penn National Gaming, Inc.(a) | | | | 4.1250 | | 07/01/29 | | | 651,498 | |
| | 844,000 | | | Scientific Games International, Inc.(a) | | | | 7.0000 | | 05/15/28 | | | 848,251 | |
| | 350,000 | | | Scientific Games International, Inc.(a) | | | | 7.2500 | | 11/15/29 | | | 358,105 | |
| | 1,138,000 | | | Station Casinos, LLC(a) | | | | 4.5000 | | 02/15/28 | | | 1,087,305 | |
| | | | | | | | | | | | | | 6,742,018 | |
| | | | | OIL & GAS PRODUCERS — 0.6% | | | | | | | | | | |
| | 780,000 | | | Plains All American Pipeline, L.P. / PAA Finance | | | | 3.6000 | | 11/01/24 | | | 780,000 | |
| | | | | | | | | | | | | | | |
| | | | | REAL ESTATE INVESTMENT TRUSTS — 2.8% | | | | | | | | | | |
| | 200,000 | | | American Tower Corporation | | | | 2.4000 | | 03/15/25 | | | 198,116 | |
| | 1,000,000 | | | GLP Capital, L.P. / GLP Financing II, Inc. | | | | 5.2500 | | 06/01/25 | | | 998,709 | |
| | 500,000 | | | GLP Capital, L.P. / GLP Financing II, Inc. | | | | 5.3750 | | 04/15/26 | | | 500,694 | |
| | 2,253,000 | | | VICI Properties, L.P. / VICI Note Company, Inc.(a) | | | | 4.6250 | | 06/15/25 | | | 2,242,856 | |
| | | | | | | | | | | | | | 3,940,375 | |
| | | | | RETAIL - CONSUMER STAPLES — 0.5% | | | | | | | | | | |
| | 665,000 | | | Walgreens Boots Alliance, Inc. | | | | 3.8000 | | 11/18/24 | | | 664,108 | |
| | | | | | | | | | | | | | | |
| | | | | RETAIL - DISCRETIONARY — 1.6% | | | | | | | | | | |
| | 750,000 | | | AutoNation, Inc. | | | | 3.5000 | | 11/15/24 | | | 749,444 | |
| | 1,563,000 | | | Penske Automotive Group, Inc. | | | | 3.5000 | | 09/01/25 | | | 1,540,578 | |
| | | | | | | | | | | | | | 2,290,022 | |
| | | | | SPECIALTY FINANCE — 4.3% | | | | | | | | | | |
| | 650,000 | | | AerCap Global Aviation Trust(a),(d) | | TSFR3M + 4.562% | | 6.5000 | | 06/15/45 | | | 649,876 | |
| | 500,000 | | | AerCap Ireland Capital DAC / AerCap Global | | | | 3.5000 | | 01/15/25 | | | 498,247 | |
| | 715,000 | | | Ally Financial, Inc. | | | | 5.7500 | | 11/20/25 | | | 718,635 | |
| | 250,000 | | | Ally Financial, Inc. | | | | 6.0000 | | 07/15/29 | | | 248,285 | |
| | 969,000 | | | Aviation Capital Group, LLC(a) | | | | 5.5000 | | 12/15/24 | | | 968,997 | |
| | 500,000 | | | Aviation Capital Group, LLC(a) | | | | 4.8750 | | 10/01/25 | | | 499,104 | |
| | 250,000 | | | Aviation Capital Group, LLC(a) | | | | 1.9500 | | 01/30/26 | | | 240,213 | |
See accompanying notes to financial statements.
| ANFIELD UNIVERSAL FIXED INCOME FUND |
| SCHEDULE OF INVESTMENTS (Continued) |
| October 31, 2024 |
| Principal | | | | | | | | | | | | |
| Amount | | | | | | | Coupon | | | | | |
| ($) | | | | | Spread | | Rate (%) | | Maturity | | Fair Value | |
| | | | | CORPORATE BONDS — 57.0% (Continued) | | | | | | | | | | |
| | | | | SPECIALTY FINANCE — 4.3% (Continued) | | | | | | | | | | |
| | 358,000 | | | Capital One Financial Corporation(d) | | SOFRRATE + 1.290% | | 2.6360 | | 03/03/26 | | $ | 354,749 | |
| | 1,000,000 | | | ILFC E-Capital Trust I(a),(d) | | TSFR3M + 1.812% | | 6.5650 | | 12/21/65 | | | 801,534 | |
| | 855,000 | | | Synchrony Financial | | | | 4.5000 | | 07/23/25 | | | 850,730 | |
| | 250,000 | | | Synchrony Financial | | | | 3.7000 | | 08/04/26 | | | 243,998 | |
| | | | | | | | | | | | | | 6,074,368 | |
| | | | | TECHNOLOGY SERVICES — 0.5% | | | | | | | | | | |
| | 650,000 | | | Leidos, Inc. | | | | 3.6250 | | 05/15/25 | | | 644,567 | |
| | | | | | | | | | | | | | | |
| | | | | TRANSPORTATION & LOGISTICS — 2.0% | | | | | | | | | | |
| | 1,075,000 | | | Air Canada(a) | | | | 3.8750 | | 08/15/26 | | | 1,040,794 | |
| | 1,072,540 | | | American Airlines 2016-2 Class A Pass Through Series 2016-2 A | | | | 3.6500 | | 06/15/28 | | | 995,327 | |
| | 750,000 | | | Delta Air Lines Inc / SkyMiles IP Ltd.(a) | | | | 4.5000 | | 10/20/25 | | | 746,033 | |
| | | | | | | | | | | | | | 2,782,154 | |
| | | | | TOTAL CORPORATE BONDS (Cost $68,565,091) | | | | | | | | | 68,603,620 | |
| | | | | | | | | | | | | | | |
| Principal | | | | | | | | | | | | | |
| Amount | | | | | | | Coupon | | | | | | |
| ($) | | | | | Spread | | Rate (%) | | Maturity | | Fair Value | |
| | | | | PREFERRED STOCK — 7.9% | | | | | | | | | | |
| | | | | ASSET MANAGEMENT — 1.0% | | | | | | | | | | |
| | 1,500,000 | | | Charles Schwab Corporation (The)(d) | | H15T5Y + 3.168% | | 4.0000 | | Perpetual | | | 1,440,081 | |
| | | | | | | | | | | | | | | |
| | | | | BANKING — 3.4% | | | | | | | | | | |
| | 3,704,000 | | | First Citizens BancShares, Inc. (a),(d) | | TSFR3M + 4.234% | | 9.1800 | | Perpetual | | | 3,796,544 | |
| | 1,000,000 | | | Wells Fargo & Company Series BB(d) | | H15T5Y + 3.453% | | 3.9000 | | Perpetual | | | 969,081 | |
| | | | | | | | | | | | | | 4,765,625 | |
| | | | | INSTITUTIONAL FINANCIAL SERVICES — 2.1% | | | | | | | | | | |
| | 2,025,000 | | | Bank of New York Mellon Corporation (The) Series H(d) | | H15T5Y + 3.352% | | 3.7000 | | Perpetual | | | 1,961,434 | |
| | 1,000,000 | | | Goldman Sachs Group, Inc. (The)(d) | | H15T5Y + 2.915% | | 3.6500 | | Perpetual | | | 954,455 | |
| | | | | | | | | | | | | | 2,915,889 | |
| | | | | OIL & GAS PRODUCERS — 1.4% | | | | | | | | | | |
| | 1,977,000 | | | Energy Transfer, L.P.(d) | | H15T5Y + 5.694% | | 6.5000 | | Perpetual | | | 1,975,710 | |
| | | | | TOTAL PREFERRED STOCK (Cost $11,078,856) | | | | | | | | | 11,097,305 | |
See accompanying notes to financial statements.
| ANFIELD UNIVERSAL FIXED INCOME FUND |
| SCHEDULE OF INVESTMENTS (Continued) |
| October 31, 2024 |
| Principal | | | | | | | | | | | | |
| Amount | | | | | | | Coupon | | | | | |
| ($) | | | | | Spread | | Rate (%) | | Maturity | | Fair Value | |
| | | | | TERM LOANS — 10.1% | | | | | | | | | | |
| | | | | COMMERCIAL SUPPORT SERVICES — 1.9% | | | | | | | | | | |
| | 2,630,573 | | | Aramark Services, Inc.(b) | | TSFR1M + 2.000% | | 7.2470 | | 04/06/28 | | $ | 2,636,492 | |
| | | | | | | | | | | | | | | |
| | | | | LEISURE FACILITIES & SERVICES — 2.1% | | | | | | | | | | |
| | 995,006 | | | Restaurant Brands(b) | | TSFR1M + 1.750% | | 6.5950 | | 09/20/30 | | | 988,041 | |
| | 995,000 | | | Caesars Entertainment, Inc.(b) | | TSFR1M + 2.750% | | 7.5950 | | 02/06/31 | | | 997,099 | |
| | 945,634 | | | Light & Wonder International, Inc.(b) | | TSFR1M + 2.350% | | 7.0340 | | 04/14/29 | | | 946,665 | |
| | | | | | | | | | | | | | 2,931,805 | |
| | | | | RETAIL - DISCRETIONARY — 1.4% | | | | | | | | | | |
| | 1,957,277 | | | Great Outdoors Group, LLC(b) | | TSFR1M + 3.865% | | 9.1110 | | 03/05/28 | | | 1,964,128 | |
| | | | | | | | | | | | | | | |
| | | | | SEMICONDUCTORS — 0.8% | | | | | | | | | | |
| | 1,162,509 | | | MKS Instruments, Inc.(b) | | TSFR1M + 2.250% | | 7.5590 | | 08/17/29 | | | 1,165,416 | |
| | | | | | | | | | | | | | | |
| | | | | SOFTWARE — 0.7% | | | | | | | | | | |
| | 997,442 | | | Sunshine Software Merger Sub, Inc.(b) | | TSFR1M + 3.865% | | 9.1110 | | 10/15/28 | | | 940,508 | |
| | | | | | | | | | | | | | | |
| | | | | TRANSPORTATION & LOGISTICS — 3.2% | | | | | | | | | | |
| | 700,000 | | | AAdvantage Loyalty IP Ltd.(b) | | TSFR3M + 5.012% | | 8.0330 | | 03/10/28 | | | 721,039 | |
| | 1,990,000 | | | Air Canada(b) | | TSFR3M + 2.500% | | 7.2530 | | 03/21/31 | | | 1,994,775 | |
| | 1,670,000 | | | United Airlines, Inc.(b) | | TSFR1M + 2.000% | | 6.7450 | | 02/22/31 | | | 1,675,812 | |
| | | | | | | | | | | | | | 4,391,626 | |
| | | | | TOTAL TERM LOANS (Cost $14,010,586) | | | | | | | | | 14,029,975 | |
| | | | | | | | | | | | | | | |
| Principal | | | | | | | | | | | | | |
| Amount | | | | | | | Coupon | | | | | | |
| ($) | | | | | | | Rate (%) | | Maturity | | Fair Value | |
| | | | | U.S. GOVERNMENT & AGENCIES — 3.5% | | | | | | | | | | |
| | | | | U.S. TREASURY BILLS — 3.5% | | | | | | | | | | |
| | 5,000,000 | | | United States Treasury Bill(h) | | | | 4.4700 | | 03/27/25 | | | 4,911,488 | |
| | | | | | | | | | | | | | | |
| | | | | TOTAL U.S. GOVERNMENT & AGENCIES (Cost $4,913,933) | | | | | | | | | 4,911,488 | |
| | | | | | | | | | | | | | | |
| | | | | TOTAL INVESTMENTS - 98.8% (Cost $151,434,870) | | | | | | | | $ | 138,123,710 | |
| | | | | OTHER ASSETS IN EXCESS OF LIABILITIES - 1.2% | | | | | | | | | 1,668,122 | |
| | | | | NET ASSETS - 100.0% | | | | | | | | $ | 139,811,832 | |
See accompanying notes to financial statements.
| ANFIELD UNIVERSAL FIXED INCOME FUND |
| SCHEDULE OF INVESTMENTS (Continued) |
| October 31, 2024 |
| OPEN FUTURES CONTRACTS | |
Number
of
Contracts | | | Open Long Futures Contracts | | Broker | | Expiration | | Notional
Amount(i) | | | Value and Unrealized
Depreciation | |
| | 20 | | | CBOT 5 Year US Treasury Note | | Interactive Brokers | | 01/01/2025 | | $ | 2,144,688 | | | $ | (26,875 | ) |
| | 20 | | | CBOT 10 Year US Treasury Note | | Interactive Brokers | | 12/20/2024 | | | 2,209,375 | | | | (39,375 | ) |
| | 20 | | | CBOT US Treasure Bond Futures | | Interactive Brokers | | 12/20/2024 | | | 2,359,375 | | | | (61,250 | ) |
| | | | | TOTAL FUTURES CONTRACTS | | | | | | | | | | | | |
| | | | | | | | | | | | | | | $ | (127,500 | ) |
| A.G. | - Aktiengesellschaft |
| | |
| A/S | - Anonim Sirketi |
| | |
| CLO | - Collateralized Loan Obligation |
| | |
| CBOT | - Chicago Board of Trade |
| | |
| LLC | - Limited Liability Company |
| | |
| L.P. | - Limited Partnership |
| | |
| LTD | - Limited Company |
| | |
| N.V. | - Naamioze Vennootschap |
| | |
| PLC | - Public Limited Company |
| | |
| REMIC | - Real Estate Mortgage Investment Conduit |
| | |
| S/A | - Société Anonyme |
| | |
| H15T1Y | US Treasury Yield Curve Rate T Note Constant Maturity 1 Year |
| | |
| H15T5Y | US Treasury Yield Curve Rate T Note Constant Maturity 5 Year |
| | |
| SOFR30A | United States 30 Day Average SOFR Secured Overnight Financing Rate |
| | |
| SOFRINDX | United States SOFR Secured Overnight Financing Index |
| | |
| SOFRRATE | United States SOFR Secured Overnight Financing Rate |
| | |
| TSFR1M | Term SOFR Secured Overnight Financing Rate 1 month |
| | |
| TSFR3M | Term SOFR Secured Overnight Financing Rate 3 month |
| | |
| US0003M | ICE LIBOR USD 3 Month |
| (a) | Security exempt from registration under Rule 144A or Section 4(2) of the Securities Act of 1933. The security may be resold in transactions exempt from registration, normally to qualified institutional buyers. As of October 31, 2024, the total market value of 144A securities is $57,506,509 or 41.1% of net assets. |
| (b) | Variable or floating rate security, the interest rate of which adjusts periodically based on changes in current interest rates and prepayments on the underlying pool of assets. |
| (c) | Illiquid security. The total fair value of these securities as of October 31, 2024, was $908,244 representing 0.7% of net assets. |
| (d) | Interest only securities. |
| (e) | Step bond. Coupon rate is fixed rate that changes on a specified date. The rate shown is the current rate at October 31, 2024. |
| (f) | Percentage rounds to less than 0.1%. |
| (g) | The value of this security has been determined in good faith under policies of the Board of Trustees. |
| (i) | The amounts shown are the underlying reference notional amounts to stock exchange indices, equities and treasury notes upon which the fair value of the futures contracts held by the Fund are based. Notional values do not represent the current fair value of, and are not necessarily indicative of the future cash flows of the Fund’s futures contracts. Further, the underlying price changes in relation to the variables specified by the notional values affects the fair value of these derivative financial instruments. The notional values as set forth within this schedule do not purport to affect economic value at risk to the Fund. |
See accompanying notes to financial statements.
| Anfield Universal Fixed Income Fund |
| STATEMENT OF ASSETS AND LIABILITIES |
| October 31, 2024 |
| ASSETS | | | | |
| Investment securities: | | | | |
| At cost | | $ | 151,434,870 | |
| At fair value | | $ | 138,123,710 | |
| Cash | | | 2,603,044 | |
| Due from broker | | | 242,477 | |
| Receivable for securities sold | | | 370,000 | |
| Dividends and interest receivable | | | 1,390,665 | |
| Deposits with brokers | | | 354,357 | |
| Receivable for Fund shares sold | | | 107,088 | |
| Prepaid expenses and other assets | | | 33,345 | |
| TOTAL ASSETS | | | 143,224,686 | |
| | | | | |
| LIABILITIES | | | | |
| Payable for securities purchased | | | 3,057,909 | |
| Net unrealized depreciation on futures contracts | | | 127,500 | |
| Payable for Fund shares redeemed | | | 62,739 | |
| Investment advisory fees payable | | | 94,640 | |
| Payable to related parties | | | 35,581 | |
| Distribution (12b-1) fees payable | | | 246 | |
| Accrued expenses and other liabilities | | | 34,239 | |
| TOTAL LIABILITIES | | | 3,412,854 | |
| NET ASSETS | | $ | 139,811,832 | |
| | | | | |
| Composition of Net Assets: | | | | |
| Paid in capital | | $ | 166,496,240 | |
| Accumulated losses | | | (26,684,408 | ) |
| NET ASSETS | | $ | 139,811,832 | |
See accompanying notes to financial statements.
| Anfield Universal Fixed Income Fund |
| STATEMENT OF ASSETS AND LIABILITIES (Continued) |
| October 31, 2024 |
| Net Asset Value Per Share: | | | | |
| Class A Shares: | | | | |
| Net Assets | | $ | 763,369 | |
| Shares of beneficial interest outstanding (a) | | | 87,727 | |
| Net asset value (Net Assets ÷ Shares Outstanding), offering price and redemption price per share | | $ | 8.70 | |
| Maximum offering price per share (net asset value plus maximum sales charge of 5.75%) | | $ | 9.23 | |
| | | | | |
| Class C Shares: | | | | |
| Net Assets | | $ | 80,682 | |
| Shares of beneficial interest outstanding (a) | | | 9,268 | |
| Net asset value (Net Assets ÷ Shares Outstanding), offering price and redemption price per share | | $ | 8.71 | |
| | | | | |
| Class I Shares: | | | | |
| Net Assets | | $ | 138,967,781 | |
| Shares of beneficial interest outstanding (a) | | | 15,965,558 | |
| Net asset value (Net Assets ÷ Shares Outstanding), offering price and redemption price per share | | $ | 8.70 | |
| (a) | Unlimited number of shares of beneficial interest authorized, no par value. |
See accompanying notes to financial statements.
| Anfield Universal Fixed Income Fund |
| STATEMENT OF OPERATIONS |
| For the Year Ended October 31, 2024 |
| INVESTMENT INCOME | | | | |
| Dividends | | $ | 405,251 | |
| Interest | | | 8,905,415 | |
| TOTAL INVESTMENT INCOME | | | 9,310,666 | |
| | | | | |
| EXPENSES | | | | |
| Investment advisory fees | | | 1,115,332 | |
| Distribution (12b-1) fees: | | | | |
| Class A | | | 2,277 | |
| Class C | | | 824 | |
| Administration fees | | | 287,075 | |
| Third party administration servicing fees | | | 125,132 | |
| Transfer agent fees | | | 75,179 | |
| Registration fees | | | 46,925 | |
| Accounting services fees | | | 42,975 | |
| Legal fees | | | 32,562 | |
| Custodian fees | | | 31,868 | |
| Printing and postage expenses | | | 31,202 | |
| Compliance officer fees | | | 25,302 | |
| Trustees fees and expenses | | | 22,320 | |
| Audit fees | | | 17,380 | |
| Insurance expense | | | 6,795 | |
| Other expenses | | | 4,024 | |
| TOTAL EXPENSES | | | 1,867,172 | |
| NET INVESTMENT INCOME | | | 7,443,494 | |
| | | | | |
| NET REALIZED AND UNREALIZED GAIN (LOSS) FROM INVESTMENTS | | | | |
| Net realized loss from investments and foreign currency transactions | | | (1,953,432 | ) |
| Net realized loss from futures contracts | | | (99 | ) |
| Net change in unrealized appreciation on investments | | | 5,299,497 | |
| Net change in unrealized depreciation on futures contracts | | | (127,500 | ) |
| NET REALIZED AND UNREALIZED GAIN FROM INVESTMENTS | | | 3,218,466 | |
| | | | | |
| NET INCREASE IN NET ASSETS RESULTING FROM OPERATIONS | | $ | 10,661,960 | |
See accompanying notes to financial statements.
| Anfield Universal Fixed Income Fund |
| STATEMENTS OF CHANGES IN NET ASSETS |
| | | For the | | | For the | |
| | | Year Ended | | | Year Ended | |
| | | October 31, 2024 | | | October 31, 2023 | |
| FROM OPERATIONS | | | | | | | | |
| Net investment income | | $ | 7,443,494 | | | $ | 6,485,584 | |
| Net realized loss from investments | | | (1,953,432 | ) | | | (1,563,358 | ) |
| Net realized loss from futures contracts | | | (99 | ) | | | — | |
| Net change in unrealized appreciation on investments | | | 5,299,497 | | | | 3,103,633 | |
| Net change in unrealized depreciation on futures contracts | | | (127,500 | ) | | | — | |
| Net increase in net assets resulting from operations | | | 10,661,960 | | | | 8,025,859 | |
| | | | | | | | | |
| DISTRIBUTIONS TO SHAREHOLDERS | | | | | | | | |
| Total Distributions Paid | | | | | | | | |
| Class A | | | (45,929 | ) | | | (76,320 | ) |
| Class C | | | (3,648 | ) | | | (6,840 | ) |
| Class I | | | (7,434,267 | ) | | | (6,779,171 | ) |
| From Return of Capital | | | | | | | | |
| Class A | | | (11,693 | ) | | | — | |
| Class C | | | (1,059 | ) | | | — | |
| Class I | | | (1,778,975 | ) | | | — | |
| Total distributions to shareholders | | | (9,275,571 | ) | | | (6,862,331 | ) |
| | | | | | | | | |
| FROM SHARES OF BENEFICIAL INTEREST | | | | | | | | |
| Proceeds from shares sold: | | | | | | | | |
| Class A | | | 11,555 | | | | 13,642 | |
| Class I | | | 67,239,137 | | | | 82,004,828 | |
| Net asset value of shares issued in reinvestment of distributions: | | | | | | | | |
| Class A | | | 51,190 | | | | 74,223 | |
| Class C | | | 4,707 | | | | 6,840 | |
| Class I | | | 7,424,715 | | | | 4,068,271 | |
| Payments for shares redeemed: | | | | | | | | |
| Class A | | | (414,931 | ) | | | (1,034,199 | ) |
| Class C | | | (11,329 | ) | | | (241,995 | ) |
| Class I | | | (78,104,076 | ) | | | (53,297,448 | ) |
| Net increase (decrease) in net assets from shares of beneficial interest | | | (3,799,032 | ) | | | 31,594,162 | |
| | | | | | | | | |
| TOTAL INCREASE (DECREASE) IN NET ASSETS | | | (2,412,643 | ) | | | 32,757,690 | |
| | | | | | | | | |
| NET ASSETS | | | | | | | | |
| Beginning of the year | | | 142,224,475 | | | | 109,466,785 | |
| End of the year | | $ | 139,811,832 | | | $ | 142,224,475 | |
See accompanying notes to financial statements.
| Anfield Universal Fixed Income Fund |
| STATEMENTS OF CHANGES IN NET ASSETS (Continued) |
| | | For the | | | For the | |
| | | Year Ended | | | Year Ended | |
| | | October 31, 2024 | | | October 31, 2023 | |
| SHARE ACTIVITY | | | | | | | | |
| Class A: | | | | | | | | |
| Shares Sold | | | 1,319 | | | | 1,581 | |
| Shares Reinvested | | | 5,870 | | | | 8,646 | |
| Shares Redeemed | | | (47,418 | ) | | | (120,116 | ) |
| Net decrease in shares of beneficial interest outstanding | | | (40,229 | ) | | | (109,889 | ) |
| | | | | | | | | |
| Class C: | | | | | | | | |
| Shares Reinvested | | | 540 | | | | 797 | |
| Shares Redeemed | | | (1,295 | ) | | | (28,178 | ) |
| Net decrease in shares of beneficial interest outstanding | | | (755 | ) | | | (27,381 | ) |
| | | | | | | | | |
| Class I: | | | | | | | | |
| Shares Sold | | | 7,688,466 | | | | 9,518,860 | |
| Shares Reinvested | | | 851,202 | | | | 473,659 | |
| Shares Redeemed | | | (8,937,332 | ) | | | (6,191,493 | ) |
| Net increase (decrease) in shares of beneficial interest outstanding | | | (397,664 | ) | | | 3,801,026 | |
See accompanying notes to financial statements.
| Anfield Universal Fixed Income Fund |
| FINANCIAL HIGHLIGHTS |
Per Share Data and Ratios for a Share of Beneficial Interest Outstanding Throughout each Year
| | | Class A | |
| | | Year Ended | | | Year Ended | | | Year Ended | | | Year Ended | | | Year Ended | |
| | | October 31, | | | October 31, | | | October 31, | | | October 31, | | | October 31, | |
| | | 2024 | | | 2023 | | | 2022 | | | 2021 | | | 2020 | |
| Net asset value, beginning of year | | $ | 8.62 | | | $ | 8.52 | | | $ | 9.48 | | | $ | 9.51 | | | $ | 9.82 | |
| Activity from investment operations: | | | | | | | | | | | | | | | | | | | | |
| Net investment income (1) | | | 0.44 | | | | 0.41 | | | | 0.25 | | | | 0.22 | | | | 0.23 | |
| Net realized and unrealized gain (loss) on investments (2) | | | 0.20 | | | | 0.14 | | | | (0.96 | ) | | | 0.11 | | | | (0.28 | ) |
| Total from investment operations | | | 0.64 | | | | 0.55 | | | | (0.71 | ) | | | 0.33 | | | | (0.05 | ) |
| Less distributions from: | | | | | | | | | | | | | | | | | | | | |
| Net investment income | | | (0.45 | ) | | | (0.45 | ) | | | (0.25 | ) | | | (0.36 | ) | | | (0.26 | ) |
| Return of Capital | | | (0.11 | ) | | | — | | | | — | | | | — | | | | — | |
| Total distributions | | | (0.56 | ) | | | (0.45 | ) | | | (0.25 | ) | | | (0.36 | ) | | | (0.26 | ) |
| Net asset value, end of year | | $ | 8.70 | | | $ | 8.62 | | | $ | 8.52 | | | $ | 9.48 | | | $ | 9.51 | |
| Total return (3) | | | 7.63 | % (7) | | | 6.62 | % | | | (7.54 | )% | | | 3.50 | % | | | (0.49 | )% |
| Net assets, at end of year (000)s | | $ | 763 | | | $ | 1,103 | | | $ | 2,027 | | | $ | 8,096 | | | $ | 10,937 | |
| Ratio of gross expenses to average net assets (4)(5)(6) | | | 1.58 | % | | | 1.60 | % | | | 1.64 | % | | | 1.50 | % | | | 1.47 | % |
| Ratio of net expenses to average net assets (5)(6) | | | 1.58 | % | | | 1.60 | % | | | 1.64 | % | | | 1.50 | % | | | 1.47 | % |
| Ratio of net investment income to average net assets (5)(6) | | | 5.09 | % | | | 4.79 | % | | | 2.75 | % | | | 2.27 | % | | | 2.33 | % |
| Portfolio Turnover Rate | | | 62 | % | | | 26 | % | | | 44 | % | | | 52 | % | | | 33 | % |
| (1) | Per share amounts calculated using the average shares method, which more appropriately represents the per share data for the period. |
| (2) | Net realized and unrealized gain (loss) on investments per share are balancing amounts necessary to reconcile the change in net asset value per share for the year, and may not reconcile with aggregate gains (losses) in the statement of operations due to the share transactions for the period. |
| (3) | Total return shown excludes the effect of applicable sales charges. Total returns are historical in nature and assume changes in sale price, reinvestment of dividends and capital gain distributions. Had the adviser not waived a portion of the Fund’s expenses, total returns would have been lower. |
| (4) | Represents the ratio of expenses to average net assets absent fee waivers and/or expense reimbursements by the adviser. |
| (5) | The ratios of expenses to average net assets and net investment income (loss) to average net assets do not reflect the expenses of the underlying investment companies in which the Fund invests. |
| (6) | Ratio calculated for each share class as a whole, therefore an individual investor’s ratio may vary. |
| (7) | Includes adjustments in accordance with accounting principles generally accepted in the United States of America and, consequently, the net asset value for financial reporting purposes and the returns based upon those net asset values may differ from the net asset values and returns for shareholder transactions. |
See accompanying notes to financial statements.
| Anfield Universal Fixed Income Fund |
| FINANCIAL HIGHLIGHTS |
Per Share Data and Ratios for a Share of Beneficial Interest Outstanding Throughout each Year
| | | Class C | |
| | | Year Ended | | | Year Ended | | | Year Ended | | | Year Ended | | | Year Ended | |
| | | October 31, | | | October 31, | | | October 31, | | | October 31, | | | October 31, | |
| | | 2024 | | | 2023 | | | 2022 | | | 2021 | | | 2020 | |
| Net asset value, beginning of year | | $ | 8.63 | | | $ | 8.53 | | | $ | 9.48 | | | $ | 9.51 | | | $ | 9.82 | |
| Activity from investment operations: | | | | | | | | | | | | | | | | | | | | |
| Net investment income (1) | | | 0.38 | | | | 0.35 | | | | 0.19 | | | | 0.15 | | | | 0.16 | |
| Net realized and unrealized gain (loss) on investments (2) | | | 0.20 | | | | 0.13 | | | | (0.96 | ) | | | 0.11 | | | | (0.28 | ) |
| Total from investment operations | | | 0.58 | | | | 0.48 | | | | (0.77 | ) | | | 0.26 | | | | (0.12 | ) |
| Less distributions from: | | | | | | | | | | | | | | | | | | | | |
| Net investment income | | | (0.39 | ) | | | (0.38 | ) | | | (0.18 | ) | | | (0.29 | ) | | | (0.19 | ) |
| Return of Capital | | | (0.11 | ) | | | — | | | | — | | | | — | | | | — | |
| Total distributions | | | (0.50 | ) | | | (0.38 | ) | | | (0.18 | ) | | | (0.29 | ) | | | (0.19 | ) |
| Net asset value, end of year | | $ | 8.71 | | | $ | 8.63 | | | $ | 8.53 | | | $ | 9.48 | | | $ | 9.51 | |
| Total return (3) | | | 6.88 | % | | | 5.75 | % | | | (8.15 | )% | | | 2.71 | % | | | (1.23 | )% |
| Net assets, at end of year (000)s | | $ | 81 | | | $ | 86 | | | $ | 319 | | | $ | 671 | | | $ | 1,203 | |
| Ratio of gross expenses to average net assets (4)(5)(6) | | | 2.34 | % | | | 2.35 | % | | | 2.39 | % | | | 2.25 | % | | | 2.22 | % |
| Ratio of net expenses to average net assets (5)(6) | | | 2.34 | % | | | 2.35 | % | | | 2.39 | % | | | 2.25 | % | | | 2.22 | % |
| Ratio of net investment income to average net assets (5)(6) | | | 4.34 | % | | | 4.02 | % | | | 2.08 | % | | | 1.51 | % | | | 1.59 | % |
| Portfolio Turnover Rate | | | 62 | % | | | 26 | % | | | 44 | % | | | 52 | % | | | 33 | % |
| (1) | Per share amounts calculated using the average shares method, which more appropriately represents the per share data for the period. |
| (2) | Net realized and unrealized gain (loss) on investments per share are balancing amounts necessary to reconcile the change in net asset value per share for the year, and may not reconcile with aggregate gains (losses) in the statement of operations due to the share transactions for the period. |
| (3) | Total returns are historical in nature and assume changes in sale price, reinvestment of dividends and capital gain distributions. Had the adviser not waived a portion of the Fund’s expenses, total returns would have been lower. |
| (4) | Represents the ratio of expenses to average net assets absent fee waivers and/or expense reimbursements by the adviser. |
| (5) | The ratios of expenses to average net assets and net investment income (loss) to average net assets do not reflect the expenses of the underlying investment companies in which the Fund invests. |
| (6) | Ratio calculated for each share class as a whole, therefore an individual investor’s ratio may vary. |
See accompanying notes to financial statements.
| Anfield Universal Fixed Income Fund |
| FINANCIAL HIGHLIGHTS |
Per Share Data and Ratios for a Share of Beneficial Interest Outstanding Throughout each Year
| | | Class I | |
| | | Year Ended | | | Year Ended | | | Year Ended | | | Year Ended | | | Year Ended | |
| | | October 31, | | | October 31, | | | October 31, | | | October 31, | | | October 31, | |
| | | 2024 | | | 2023 | | | 2022 | | | 2021 | | | 2020 | |
| Net asset value, beginning of year | | $ | 8.62 | | | $ | 8.53 | | | $ | 9.49 | | | $ | 9.51 | | | $ | 9.83 | |
| Activity from investment operations: | | | | | | | | | | | | | | | | | | | | |
| Net investment income (1) | | | 0.46 | | | | 0.44 | | | | 0.30 | | | | 0.24 | | | | 0.25 | |
| Net realized and unrealized gain (loss) on investments (2) | | | 0.20 | | | | 0.12 | | | | (0.98 | ) | | | 0.12 | | | | (0.28 | ) |
| Total from investment operations | | | 0.66 | | | | 0.56 | | | | (0.68 | ) | | | 0.36 | | | | (0.03 | ) |
| Less distributions from: | | | | | | | | | | | | | | | | | | | | |
| Net investment income | | | (0.47 | ) | | | (0.47 | ) | | | (0.28 | ) | | | (0.38 | ) | | | (0.29 | ) |
| Return of Capital | | | (0.11 | ) | | | — | | | | — | | | | — | | | | — | |
| Total distributions | | | (0.58 | ) | | | (0.47 | ) | | | (0.28 | ) | | | (0.38 | ) | | | (0.29 | ) |
| Net asset value, end of year | | $ | 8.70 | | | $ | 8.62 | | | $ | 8.53 | | | $ | 9.49 | | | $ | 9.51 | |
| Total return (3) | | | 7.88 | % (7) | | | 6.78 | % | | | (7.28 | )% | | | 3.87 | % | | | (0.34 | )% |
| Net assets, at end of year (000)s | | $ | 138,968 | | | $ | 141,035 | | | $ | 107,121 | | | $ | 126,814 | | | $ | 156,042 | |
| Ratio of gross expenses to average net assets (4)(5)(6) | | | 1.34 | % | | | 1.35 | % | | | 1.39 | % | | | 1.25 | % | | | 1.22 | % |
| Ratio of net expenses to average net assets (5)(6) | | | 1.34 | % | | | 1.35 | % | | | 1.39 | % | | | 1.25 | % | | | 1.22 | % |
| Ratio of net investment income to average net assets (5)(6) | | | 5.34 | % | | | 5.20 | % | | | 3.24 | % | | | 2.54 | % | | | 2.59 | % |
| Portfolio Turnover Rate | | | 62 | % | | | 26 | % | | | 44 | % | | | 52 | % | | | 33 | % |
| (1) | Per share amounts calculated using the average shares method, which more appropriately represents the per share data for the period. |
| (2) | Net realized and unrealized gain (loss) on investments per share are balancing amounts necessary to reconcile the change in net asset value per share for the year, and may not reconcile with aggregate gains (losses) in the statement of operations due to the share transactions for the period. |
| (3) | Total returns are historical in nature and assume changes in sale price, reinvestment of dividends and capital gain distributions. Had the adviser not waived a portion of the Fund’s expenses, total returns would have been lower. |
| (4) | Represents the ratio of expenses to average net assets absent fee waivers and/or expense reimbursements by the adviser. |
| (5) | The ratios of expenses to average net assets and net investment income (loss) to average net assets do not reflect the expenses of the underlying investment companies in which the Fund invests. |
| (6) | Ratio calculated for each share class as a whole, therefore an individual investor’s ratio may vary. |
| (7) | Includes adjustments in accordance with accounting principles generally accepted in the United States of America and, consequently, the net asset value for financial reporting purposes and the returns based upon those net asset values may differ from the net asset values and returns for shareholder transactions. |
See accompanying notes to financial statements.
Anfield Universal Fixed Income Fund
NOTES TO FINANCIAL STATEMENTS
October 31, 2024
The Anfield Universal Fixed Income Fund (the “Fund”), is a series of shares of beneficial interest of the Two Roads Shared Trust (the “Trust”), a statutory trust organized under the laws of the State of Delaware on June 8, 2012, and is registered under the Investment Company Act of 1940, as amended (the “1940 Act”), as a diversified, open-end management investment company. The Fund commenced operations on June 28, 2013. The investment objective is to seek current income.
The Fund offers Class A, Class C, and Class I shares. Class A shares are offered at net asset value (“NAV”) plus a maximum sales charge of 5.75%. Investors that purchase $1,000,000 or more of the Fund’s Class A shares will pay a 1.00% sales charge on the purchase. Class C shares of the Fund are sold at NAV without an initial sales charge. Class I shares of the Fund are sold at NAV without an initial sales charge and are not subject to 12b-1 distribution fees but have a higher minimum initial investment than Class A and Class C shares. Each share class represents an interest in the same assets of the Fund and classes are identical except for differences in their sales charge structures and ongoing service and distribution charges. All classes of shares have equal voting privileges except that each class has exclusive voting rights with respect to its service and/or distribution plans. The Fund’s income, expenses (other than class specific distribution fees), and realized and unrealized gains and losses are allocated proportionately each day based upon the relative net assets of each class.
| 2. | SUMMARY OF SIGNIFICANT ACCOUNTING POLICIES |
The following is a summary of significant accounting policies followed by the Fund in preparation of its financial statements. These policies are in conformity with accounting principles generally accepted in the United States of America (“GAAP”). The preparation of financial statements requires management to make estimates and assumptions that affect the reported amounts of assets and liabilities and disclosure of contingent assets and liabilities at the date of the financial statements and the reported amounts of income and expenses for the period. Actual results could differ from those estimates. The Fund is an investment company and accordingly follows the investment company accounting and reporting guidance of the Financial Accounting Standards Board (“FASB”) Accounting Standard Codification Topic 946 “Financial Services – Investment Companies”.
Security Valuation – Securities listed on an exchange are valued at the last quoted sale price at the close of the regular trading session of the exchange on the business day the value is being determined, or in the case of securities listed on NASDAQ at the NASDAQ Official Closing Price. In the absence of a sale such securities shall be valued at the mean between the current bid and ask prices on the day of valuation. Debt securities (other than short- term obligations) are valued each day by an independent pricing service approved by the Board of Trustees (the “Board”) using methods which include current market quotations from a major market maker in the securities and based on methods which include the consideration of yields or prices of securities- of comparable quality, coupon, maturity and type. The independent- pricing service does not distinguish between smaller sized bond positions known as “odd lots” and larger institutional sized bond positions known as “round lots”. The Fund may fair value a particular bond if the adviser does not believe that the round lot value provided by the independent pricing service reflects fair value of the Fund’s holding. Futures and future options are valued at the final settled price or, in the absence of a settled price, at the last sale price on the day of valuation. Short-term debt obligations, excluding U.S. Treasury Bills, having 60 days or less remaining until maturity, at time of purchase, may be valued at amortized cost.
The Fund may hold securities, such as private investments, interests in commodity pools, other non-traded securities or temporarily illiquid securities, for which market quotations are not readily available or are determined to be unreliable. These securities are valued using the “fair value” procedures approved by the Board. The Board has appointed the Adviser as its valuation designee (the “Valuation Designee”) for all fair value determinations and responsibilities, other than overseeing pricing service providers used by the Trust. This designation is subject to Board oversight and certain reporting and other requirements designed to facilitate the Board’s ability effectively to oversee the designee’s fair value determinations. The Board may also enlist third party consultants such a valuation specialist at a public accounting firm, valuation consultant or financial officer of a security issuer on an as- needed basis to assist the Valuation Designee in determining a security-specific fair value. The Board is responsible for reviewing and approving fair value methodologies utilized by the Valuation Designee, approval of which shall be based upon whether the Valuation Designee followed the valuation procedures approved by the Board.
Anfield Universal Fixed Income Fund
NOTES TO FINANCIAL STATEMENTS (Continued)
October 31, 2024
Exchange- Traded Funds – The Fund may invest in exchange-traded funds (“ETFs”). ETFs are a type of index fund bought and sold on a securities exchange. An ETF trades like common stock and represents a fixed portfolio of securities designed to track the performance and dividend yield of a particular domestic or foreign market index. The Fund may purchase an ETF to temporarily gain exposure to a portion of the U.S. or a foreign market. The risks of owning an ETF generally reflect the risks of owning the underlying securities they are designed to track, although the lack of liquidity on an ETF could result in it being more volatile. Additionally, ETFs have fees and expenses that reduce their value.
Futures Contracts – The Fund may purchase or sell futures contracts to gain exposure to, or hedge against, changes in the value of equities, interest rates, foreign currencies, or commodities. Initial margin deposits required upon entering into futures contracts are satisfied by the segregation of specific securities or cash as collateral for the account of the broker (the Fund’s agent in acquiring the futures position). During the period the futures contracts are open, changes in the value of the contracts are recognized as unrealized gains or losses by “marking to market” on a daily basis to reflect the market value of the contracts at the end of each day’s trading. Variation margin payments are received or made depending upon whether unrealized gains or losses are incurred. When the contracts are closed, the Fund recognizes a realized gain or loss equal to the difference between the proceeds from, or cost of, the closing transaction and the Fund’s basis in the contract. If the Fund was unable to liquidate a futures contract and/or enter into an offsetting closing transaction, the Fund would continue to be subject to market risk with respect to the value of the contracts and continue to be required to maintain the margin deposits on the futures contracts. The Fund segregates liquid securities having a value at least equal to the amount of the current obligation under any open futures contract. Risks may exceed amounts recognized in the consolidated statement of assets and liabilities. With futures, there is minimal counterparty credit risk to the Fund since futures are exchange traded and the exchange’s clearinghouse, as counterparty to all exchange traded futures, guarantees the futures against default, however, there could be adverse impacts if the clearinghouse is unable to fulfill such guarantee due to circumstances such as bankruptcy.
Option Transactions – The Fund is subject to equity price risk in the normal course of pursuing its investment objective and may purchase or sell options to help hedge against risk. When the Fund writes a call option, an amount equal to the premium received is included in the statement of assets and liabilities as a liability. The amount of the liability is subsequently marked-to- market to reflect the current market value of the option. If an option expires on its stipulated expiration date or if the Fund enters into a closing purchase transaction, a gain or loss is realized. If a written call option is exercised, a gain or loss is realized for the sale of the underlying security and the proceeds from the sale are increased by the premium originally received. As writer of an option, the Fund has no control over whether the option will be exercised and, as a result, retains the market risk of an unfavorable change in the price of the security underlying the written option.
The Fund may purchase put and call options. Put options are purchased to hedge against a decline in the value of securities held in the Fund’s portfolio. If such a decline occurs, the put options will permit the Fund to sell the securities underlying such options at the exercise price, or to close out the options at a profit. The premium paid for a put or call option plus any transaction costs will reduce the benefit, if any, realized by the Fund upon exercise of the option, and, unless the price of the underlying security rises or declines sufficiently, the option may expire worthless to the Fund. In addition, in the event that the price of the security in connection with which an option was purchased moves in a direction favorable to the Fund, the benefits realized by the Fund as a result of such favorable movement will be reduced by the amount of the premium paid for the option and related transaction costs. Written and purchased options are non-income producing securities. With purchased options, there is minimal counterparty risk to the Fund since these options are exchange traded and the exchange’s clearinghouse, as counterparty to all exchange traded options, guarantees against a possible default, however, there could be adverse impacts if the clearinghouse is unable to fulfill such guarantee due to circumstances such as bankruptcy.
Valuation of Fund of Fund – The Fund may invest in portfolios of open-end or closed-end investment companies (the “Underlying Funds”). The Underlying Funds value securities in their portfolios for which market quotations are readily available at their market values (generally the last reported sale price) and all other securities and assets at their fair value according to the methods approved by the board of directors of the Underlying Funds.
Anfield Universal Fixed Income Fund
NOTES TO FINANCIAL STATEMENTS (Continued)
October 31, 2024
Open-ended funds are valued at their respective net asset values as reported by such investment companies. The shares of many closed-end investment companies, after their initial public offering, frequently trade at a price per share, which is different than the net asset value per share. The difference represents a market premium or market discount of such shares. There can be no assurances that the market discount or market premium on shares of any closed-end investment company purchased by the Fund will not change.
Fair Valuation Process – The applicable investments are valued by the Valuation Designee pursuant to valuation procedures approved by the Board. For example, fair value determinations are required for the following securities: (i) securities for which market quotations are insufficient or not readily available on a particular business day (including securities for which there is a short and temporary lapse in the provision of a price by the regular pricing source); (ii) securities for which, in the judgment of the Valuation Designee, the prices or values available do not represent the fair value of the instrument; factors which may cause the Valuation Designee to make such a judgment include, but are not limited to, the following: only a bid price or an asked price is available; the spread between bid and asked prices is substantial; the frequency of sales; the thinness of the market; the size of reported trades; and actions of the securities markets, such as the suspension or limitation of trading; (iii) securities determined to be illiquid; and (iv) securities with respect to which an event that affects the value thereof has occurred (a “significant event”) since the closing prices were established on the principal exchange on which they are traded, but prior to the Fund’s calculation of its net asset value. Specifically, interests in commodity pools or managed futures pools are valued on a daily basis by reference to the closing market prices of each futures contract or other asset held by a pool, as adjusted for pool expenses. Restricted or illiquid securities, such as private investments or non-traded securities are valued based upon the current bid for the security from two or more independent dealers or other parties reasonably familiar with the facts and circumstances of the security (who should take into consideration all relevant factors as may be appropriate under the circumstances). If a current bid from such independent dealers or other independent parties is unavailable, the Valuation Designee shall determine the fair value of such security using the following factors: (i) the type of security; (ii) the cost at date of purchase; (iii) the size and nature of the Fund’s holdings; (iv) the discount from market value of unrestricted securities of the same class at the time of purchase and subsequent thereto; (v) information as to any transactions or offers with respect to the security; (vi) the nature and duration of restrictions on disposition of the security and the existence of any registration rights; (vii) how the yield of the security compares to similar securities of companies of similar or equal creditworthiness; (viii) the level of recent trades of similar or comparable securities; (ix) the liquidity characteristics of the security; (x) current market conditions; and (xi) the market value of any securities into which the security is convertible or exchangeable.
The Fund utilizes various methods to measure the fair value of all of its investments on a recurring basis. GAAP establishes a hierarchy that prioritizes inputs to valuation methods. The three levels of input are:
Level 1 – Unadjusted quoted prices in active markets for identical assets and liabilities that the Fund has the ability to access.
Level 2 – Observable inputs other than quoted prices included in Level 1 that are observable for the asset or liability, either directly or indirectly. These inputs may include quoted prices for the identical instrument on an inactive market, prices for similar instruments, interest rates, prepayment speeds, credit risk, yield curves, default rates and similar data.
Level 3 – Unobservable inputs for the asset or liability, to the extent relevant observable inputs are not available, representing the Fund’s own assumptions about the assumptions a market participant would use in valuing the asset or liability, and would be based on the best information available.
The availability of observable inputs can vary from security to security and is affected by a wide variety of factors, including, for example, the type of security, whether the security is new and not yet established in the marketplace, the liquidity of markets, and other characteristics particular to the security. To the extent that valuation is based on models or inputs that are less observable or unobservable in the market, the determination of fair value requires more judgment. Accordingly, the degree of judgment exercised in determining fair value is greatest for instruments categorized in Level 3.
The inputs used to measure fair value may fall into different levels of the fair value hierarchy. In such cases, for disclosure purposes, the level in the fair value hierarchy within which the fair value measurement falls in its entirety, is determined based on the lowest level input that is significant to the fair value measurement in its entirety.
Anfield Universal Fixed Income Fund
NOTES TO FINANCIAL STATEMENTS (Continued)
October 31, 2024
The inputs or methodology used for valuing securities are not necessarily an indication of the risk associated with investing in those securities. The following tables summarize the inputs used as of October 31, 2024, for the Fund’s assets and liabilities measured at fair value:
| Assets* | | Level 1 | | | Level 2 | | | Level 3 | | | Total | |
| Open End Funds | | $ | 4,961,137 | | | $ | — | | | $ | — | | | $ | 4,961,137 | |
| Asset Backed Securities | | | — | | | | 25,274,164 | | | | — | | | | 25,274,164 | |
| Collateralized Mortgage Obligations | | | — | | | | 9,246,021 | | | | — | | | | 9,246,021 | |
| Corporate Bonds | | | — | | | | 67,828,728 | | | | 774,892 | | | | 68,603,620 | |
| Preferred Stock | | | — | | | | 11,097,305 | | | | — | | | | 11,097,305 | |
| Term Loans | | | — | | | | 14,029,975 | | | | — | | | | 14,029,975 | |
| U.S. Government & Agencies | | | — | | | | 4,911,488 | | | | — | | | | 4,911,488 | |
| Total | | $ | 4,961,137 | | | $ | 132,387,681 | | | $ | 774,892 | | | $ | 138,123,710 | |
| | | | | | | | | | | | | | | | | |
| Liabilities* | | | | | | | | | | | | | | | | |
| Futures Contracts ** | | | (127,500 | ) | | | — | | | | — | | | | (127,500 | ) |
| Total | | $ | (127,500 | ) | | $ | — | | | $ | — | | | $ | (127,500 | ) |
| * | Refer to the Schedule of Investments for classifications. |
| ** | Represents the net unrealized depreciation of futures contracts. |
The following table presents changes in assets classified in Level 3 of the fair value hierarchy during the year ended attributable to the following:
| | | Corporate Bonds | |
| Beginning Balance November 1, 2023 | | $ | 762,957 | |
| Total realized gain (loss) | | | — | |
| Change in Unrealized Appreciation | | | (3,214 | ) |
| Cost of Purchases | | | — | |
| Proceeds from Sales | | | — | |
| Amortization | | | 15,149 | |
| Net transfers in/out of level 3 | | | — | |
| Ending Balance October 31, 2024 | | $ | 774,892 | |
The following table summarizes the valuation techniques and significant unobservable inputs used for the Fund’s investments that are categorized in Level 3 of the fair value hierarchy as of October 31, 2024:
| Fair Value at October 31, 2024 | Valuation Techniques | Unobservable Input | Impact to Valuation |
| $98.45 Per bond | Spread to comparable security adjusted for a fixed spread as of the last trade date. | 340 basis point spread to comparable security with a rate of 4.875%. | These inputs included the discount rate or yield and the term to maturity used. Significant increases to the yield/discount rate would cause fair value to decrease; decreases to the yield/discount rate would cause fair value to increase. |
Anfield Universal Fixed Income Fund
NOTES TO FINANCIAL STATEMENTS (Continued)
October 31, 2024
Impact of Derivatives on the Statement of Assets and Liabilities and Statement of Operations
The derivative instruments outstanding as of October 31, 2024 as disclosed in the Schedule of Investments and the amounts of realized and changes in unrealized gains and losses on derivative instruments during the year as disclosed in the Statement of Operations serve as indicators of the volume of derivative activity for the Fund. The average market value for the period was $6,713,438.
The following is a summary of the location of derivative investments on the Fund’s Statement of Assets and Liabilities as of October 31, 2024:
| | | Liability Derivatives |
| Contract Type/Primary Risk | | | | | |
| Exposure | | Statement of Assets and Liabilities Location | | Fair Value | |
| Futures Contracts - Interest Risk | | Net unrealized depreciation on futures contracts | | $ | (127,500 | ) |
| | | | | $ | (127,500 | ) |
The following is a summary of the location of derivative investments on the Fund’s Statement of Operations as of October 31, 2024:
| Derivative Investment Type | Location of Gain (Loss) on Derivatives |
| Futures Contracts | Net realized loss from futures contracts/Net change in unrealized depreciation on futures contracts |
The following is a summary of the Fund’s realized loss and unrealized depreciation on derivative investments recognized in the Statement of Operations categorized by primary risk exposure for the year ended October 31, 2024:
| Realized loss on derivatives recognized in the Statement of Operations |
| | | | | | Total for the | |
| Derivative Investment Type | | Interest Risk | | | Year Ended October 31, 2024 | |
| Futures Contracts | | $ | (99 | ) | | $ | (99 | ) |
| Net change in unrealized depreciation on derivatives recognized in the Statement of Operations |
| | | | | | Total for the | |
| Derivative Investment Type | | Interest Risk | | | Year Ended October 31, 2024 | |
| Futures Contracts | | $ | (127,500 | ) | | $ | (127,500 | ) |
Security Transactions and Related Income – Security transactions are accounted for on trade date basis. Interest income is recognized on an accrual basis. Discounts are accreted and premiums are amortized on securities purchased over the lives of the respective securities. Dividend income is recorded on the ex-dividend date. Realized gains or losses from sales of securities are determined by comparing the identified cost of the security lot sold with the net sales proceeds. Due from broker balance is comprised of margin balance held at the broker.
Dividends and Distributions to Shareholders – Dividends from net investment income are declared and distributed monthly. Distributable net realized capital gains are declared and distributed annually. Dividends from net investment income and distributions from net realized gains are recorded on ex dividend date and determined in accordance with federal income tax regulations, which may differ from GAAP. These “book/tax” differences are considered either temporary (i.e., deferred losses, capital loss carry forwards) or permanent in nature. To the extent these differences are permanent in nature, such amounts are reclassified within the composition of net assets based on their federal tax-basis treatment; temporary differences do not require reclassification.
Anfield Universal Fixed Income Fund
NOTES TO FINANCIAL STATEMENTS (Continued)
October 31, 2024
Federal Income Taxes – It is the Fund’s policy to qualify as a regulated investment company by complying with the provisions of the Internal Revenue Code that are applicable to regulated investment companies and to distribute substantially all of its taxable income and net realized gains to shareholders. Therefore, no federal income tax provision has been recorded.
The Fund recognizes the tax benefits of uncertain tax positions only where the position is “more likely than not” to be sustained assuming examination by tax authorities. Management has analyzed the Fund’s tax positions and has concluded that no liability for unrecognized tax benefits should be recorded related to uncertain tax positions taken on returns filed for open tax years ended October 31, 2021, to October 31, 2023, or expected to be taken in the Fund’s October 31, 2024, year- end tax returns. The Fund identifies its major tax jurisdictions as U.S. Federal, Ohio and foreign jurisdictions where the Fund makes significant investments; however the Fund is not aware of any tax positions for which it is reasonably possible that the total amounts of unrecognized tax benefits will change materially in the next twelve months.
Expenses – Expenses of the Trust that are directly identifiable to a specific fund are charged to that fund. Expenses, which are not readily identifiable to a specific fund, are allocated in such a manner as deemed equitable, taking into consideration the nature and type of expense and the relative sizes of the funds in the Trust.
Indemnification – The Trust indemnifies its officers and trustees for certain liabilities that may arise from the performance of their duties to the Trust. Additionally, in the normal course of business, the Fund enters into contracts that contain a variety of representations and warranties and which provide general indemnities. The Fund’s maximum exposure under these arrangements is unknown, as this would involve future claims that may be made against the Fund that have not yet occurred. However, the Fund expects the risk of loss due to these warranties and indemnities to be remote.
| 3. | PRINCIPAL INVESTMENT RISKS |
The Fund’s investments in securities, financial instruments and derivatives expose it to various risks, certain of which are discussed in these Notes to Financial Statements. Please refer to the Fund’s prospectus and statement of additional information for further information regarding the risks associated with the Fund’s investments which include, but are not limited to: active trading risk, bank loan risk, cash positions risk, collateralized loan obligations risk, common stock risk, convertible securities risk, counterparty credit risk, credit risk, credit spread risk, currency risk, cybersecurity risk, derivatives risk, emerging markets risks, energy sector risk, financial sector risk, fixed income securities risk, foreign custody risk, foreign (non-U.S.) investment risk, futures contract risk, gap risk, hedging transactions risk, high yield risk, index risk, interest rate risk, issuer-specific risk, investment companies and exchange-traded funds risks, leverage risk, LIBOR risk, liquidity risk, management risk, market risk, market events risk, MLP risk, mortgage-backed and asset-backed securities risk, odd lot risk, preferred securities risk, prepayment and extension risk, real estate sector risk, REIT risk, regulatory risk, sector risk, securities lending risk, short sales risk, sovereign debt risk, swap risk, underlying fund risk, U.S. government securities risk, valuation risk, variable or floating rate securities risk and volatility risk.
Bank Loan Risk – The Fund’s investments in secured and unsecured participations in bank loans and assignments of such loans may create substantial risk. In making investments in such loans, which are made by banks or other financial intermediaries to borrowers, the Fund will depend primarily upon the creditworthiness of the borrower for payment of principal and interest.
Currency Risk – The risk that foreign (non-U.S.) currencies will decline in value relative to the U.S. dollar and adversely affect the value of the Fund’s investments in foreign (non-U.S.) currencies or in securities that trade in, and receive revenues in, or in derivatives that provide exposure to, foreign (non-U.S.) currencies.
Collateralized Loan Obligations Risk – The Fund is subject to certain risks as a result of its investments in Collateralized Loan Obligations (“CLOs”). The CLO’s performance is linked to the expertise of the CLO manager. One of the primary risks to investors of a CLO is the potential change in CLO manager, over which the Fund will have no control. The Fund may be adversely affected by new (or revised) laws or regulations that may be imposed by government regulators or self-regulatory organizations that supervise the financial markets. CLO debt securities are limited recourse obligations of their issuers. If income from the underlying loans is insufficient to make payments on the CLO debt, no other assets will be available for payment. In the event of an early redemption, holders of the CLO debt being redeemed will be repaid earlier than the stated maturity of the debt. The timing of redemptions may adversely affect the returns on CLO debt. The CLO
Anfield Universal Fixed Income Fund
NOTES TO FINANCIAL STATEMENTS (Continued)
October 31, 2024
manager may not find suitable assets in which to invest during the reinvestment period or to replace assets that the manager has determined are no longer suitable for investment. Additionally, there is a risk that the reinvestment period may terminate early if, for example, the CLO defaults on payments on the securities which it issues or if the CLO manager determines that it can no longer reinvest in underlying assets.
Convertible Securities Risk – The market value of a convertible security performs like that of a regular debt security; that is, if market interest rates rise, the value of a convertible security usually falls. In addition, convertible securities are subject to the risk that the issuer will not be able to pay interest or dividends when due, and their market value may change based on changes in the issuer’s credit rating or the market’s perception of the issuer’s creditworthiness. Since it derives a portion of its value from the common stock into which it may be converted, a convertible security is also subject to the same types of market and issuer risks that apply to the underlying common stock. If a convertible security’s investment value is greater than its conversion value, its price will likely increase when interest rates fall and decrease when interest rates rise. If the conversion value exceeds the investment value, the price of the convertible security will tend to fluctuate directly with the price of the underlying equity security.
Counterparty Credit Risk – The Fund may enter into various types of derivative contracts. Many of these derivative contracts will be privately negotiated in the over-the-counter market. These contracts also involve exposure to credit risk, since contract performance depends in part on the financial condition of the counterparty. If a privately negotiated over-the-counter contract calls for payments by the Fund, the Fund must be prepared to make such payments when due. In addition, if a counterparty’s creditworthiness declines, the Fund may not receive payments owed under the contract, or such payments may be delayed under such circumstances and the value of agreements with such counterparty can be expected to decline, potentially resulting in losses to the Fund. The Adviser considers factors such as counterparty credit ratings and financial statements among others when determining whether a counterparty is creditworthy. The Adviser regularly monitors the creditworthiness of each counterparty with which the Fund enters into a transaction. In addition, the Fund may enter into swap agreements that involve a limited number of counterparties, which may increase the Fund’s exposure to counterparty risk.
Derivatives Risk – The derivative instruments in which the Fund may invest, including futures, options, credit default swaps, total return swaps, repurchase agreements and other similar instruments, may be more volatile than other instruments and may be subject to unanticipated market movements, which are potentially unlimited. The risks associated with investments in derivatives also include leverage, liquidity, interest rate, market, credit and management risks, mispricing or improper valuation. Changes in the market value of the derivative may not correlate perfectly with the underlying asset, rate or index, and the Fund could lose more than the principal amount invested. In addition, if a derivative is being used for hedging purposes there can be no assurance given that each derivative position will achieve a perfect correlation with the security or currency against which it is being hedged, or that a particular derivative position will be available when sought by the portfolio manager.
Financial Sector Risk – The financial sector can be significantly affected by changes in interest rates, government regulation, the rate of defaults on corporate, consumer and government debt, the availability and cost of capital, and the impact of more stringent capital requirements. The Fund may be adversely affected by events or developments negatively impacting the financial sector.
Fixed Income Securities Risk – Fixed income securities are subject to interest rate risk, call risk, prepayment and extension risk, credit risk, duration risk, and liquidity risk. In addition, current market conditions may pose heightened risks for fixed income securities. When the Fund invests in fixed income securities or derivatives, the value of your investment in the Fund will fluctuate with changes in interest rates. Typically, a rise in interest rates causes a decline in the value of fixed income securities or derivatives owned by the Fund. Moreover, new regulations applicable to and changing business practices of financial intermediaries that make markets in fixed income securities have resulted in less market making activity for certain fixed income securities, which has reduced the liquidity and may increase the volatility for such fixed income securities. The fixed-income securities market can be susceptible to increases in volatility and decreases in liquidity. Liquidity may decline unpredictably in response to overall economic conditions or credit tightening.
Anfield Universal Fixed Income Fund
NOTES TO FINANCIAL STATEMENTS (Continued)
October 31, 2024
Foreign (non-U.S.) Investment Risk – Foreign (non-U.S.) securities present greater investment risks than investing in the securities of U.S. issuers and may experience more rapid and extreme changes in value than the securities of U.S. companies, due to less information about foreign (non-U.S.) companies in the form of reports and ratings than about U.S. issuers; different accounting, auditing and financial reporting requirements; smaller markets; nationalization; expropriation or confiscatory taxation; currency blockage; or political changes or diplomatic developments. Foreign (non-U.S.) securities may also be less liquid and more difficult to value than securities of U.S. issuers.
Investment Companies and Exchange-Traded Funds (“ETFs”) Risk – When the Fund invests in other investment companies, including ETFs, it will bear additional expenses based on its pro rata share of the other investment company’s operating expenses including the management fees of the investment company in addition to those paid by the Fund. The risk of owning an investment company generally reflects the risks of owning the underlying investments held by the investment company. The Fund also will incur brokerage costs when it purchases and sells. During periods of market volatility, inverse ETFs may not perform as expected.
Market Risk – Overall market risk may appropriately affect the value of individual instruments in which the Fund invests. The Fund is subject to the risk that the securities markets will move down, sometimes rapidly and unpredictably, based on overall economic conditions and other factors, which may negatively affect the Fund’s performance. Factors such as domestic and foreign (non-U.S.) economic growth and market conditions, real or perceived adverse economic or political conditions, military conflicts, acts of terrorism, social unrest, natural disasters, recessions, inflation, changes in interest rate levels, supply chain disruptions, sanctions, the spread of infection or other public health threats, lack of liquidity in the bond markets, volatility in the securities markets, adverse investor sentiment and political events affect the securities markets. U.S. and foreign stock markets have experienced periods of substantial price volatility in the past and may do so again in the future. Securities markets also may experience long periods of decline in value. A change in financial condition or other event affecting a single issuer or market may adversely impact securities markets as a whole. Rates of inflation have recently risen. The value of assets or income from an investment may be worth less in the future as inflation decreases the value of money. As inflation increases, the real value of the Fund’s assets can decline as can the value of the Fund’s distributions. When the value of the Fund’s investments goes down, your investment in the Fund decreases in value and you could lose money.
Local, state, regional, national or global events such as war, acts of terrorism, the spread of infectious illness or other public health issues, recessions, or other events could have a significant impact on the Fund and its investments and could result in decreases to the Fund’s net asset value. Political, geopolitical, natural and other events, including war, terrorism, trade disputes, government shutdowns, market closures, natural and environmental disasters, epidemics, pandemics and other public health crises and related events and governments’ reactions to such events have led, and in the future may lead, to economic uncertainty, decreased economic activity, increased market volatility and other disruptive effects on U.S. and global economies and markets. Such events may have significant adverse direct or indirect effects on the Fund and its investments. For example, a widespread health crisis such as a global pandemic could cause substantial market volatility, exchange trading suspensions and closures, impact the ability to complete redemptions, and affect Fund performance. A health crisis may exacerbate other pre -existing political, social and economic risks. In addition, the increasing interconnectedness of markets around the world may result in many markets being affected by events or conditions in a single country or region or events affecting a single or small number of issuers.
Mortgage-Backed and Asset-Backed Securities Risk – The risk of investing in mortgage-backed and other asset-backed securities, including prepayment risk, extension risk, interest rate risk, market risk and management risk. Mortgage-backed securities include caps and floors, inverse floaters, mortgage dollar rolls, private mortgage pass-through securities, resets and stripped mortgage securities. A systemic and persistent increase in interest rate volatility may also negatively impact a number of the Fund’s mortgage-backed and asset-backed securities holdings.
Odd Lot Risk – Bonds may be purchased and held as smaller sized bond positions known as “odd lots”. Pricing services generally value such securities based on bid prices for larger institutional sized bond positions known as “round lots”; and such round lot prices may reflect more favorable pricing than odd lot holdings. The Fund may purchase securities suitable for its investment strategies in odd lots. Special valuation considerations may apply with respect to the Fund’s odd-lot positions, as the Fund may receive different prices when it sells such positions than it would receive for sales of institutional round lot positions. The Fund may fair value a particular bond if the Adviser does not believe that the round lot value provided by the independent pricing service reflects fair value of the Fund’s holding. There can be no assurance that the
Anfield Universal Fixed Income Fund
NOTES TO FINANCIAL STATEMENTS (Continued)
October 31, 2024
Fund’s valuation procedures will result in pricing data that is completely congruent with prices that the Fund might obtain on the open market.
U.S. Government Securities Risk – Treasury obligations may differ in their interest rates, maturities, times of issuance and other characteristics. Obligations of U.S. Government agencies and authorities are supported by varying degrees of credit but generally are not backed by the full faith and credit of the U.S. Government. No assurance can be given that the U.S. Government will provide financial support to its agencies and authorities if it is not obligated by law to do so. In addition, the value of U.S. Government securities may be affected by changes in the credit rating of the U.S. Government.
Volatility Risk – The Fund’s investments may appreciate or decrease significantly in value over short periods of time. The value of an investment in the Fund’s portfolio may fluctuate due to factors that affect markets generally or that affect a particular industry or sector. The value of an investment in the Fund’s portfolio may also be more volatile than the market as a whole. This volatility may affect the Fund’s net asset value per share, including by causing it to experience significant increases or declines in value over short periods of time. Events or financial circumstances affecting individual investments, industries or sectors may increase the volatility of the Fund.
| 4. | INVESTMENT TRANSACTIONS |
The cost of purchases and proceeds from the sale of securities, other than short-term and Government securities, for the year ended October 31, 2024, amounted to $80,802,119 and $80,189,795, respectively. The cost of purchases and the proceeds from the sale of U.S. Government securities for the year ended October 31, 2024, amounted to $34,809,985 and $39,724,659, respectively.
| 5. | INVESTMENT ADVISORY AGREEMENT AND TRANSACTIONS WITH RELATED PARTIES |
Advisory Fees – Anfield Capital Management, LLC serves as the Fund’s investment adviser (the “Adviser”). Pursuant to an Investment Advisory Agreement with the Fund, the Adviser, under the oversight of the Board, directs the daily operations of the Fund and supervises the performance of administrative and professional services provided by others. As compensation for its services and the related expenses borne by the Adviser, the Fund pays the Adviser an investment advisory fee, computed and accrued daily and paid monthly, at an annual rate of 0.80% of the Fund’s average daily net assets totaling $1,115,332 for the year ended October 31, 2024.
The Adviser has contractually agreed to reduce its fees and/or reimburse expenses of the Fund, until at least March 1, 2025, to ensure that total annual fund operating expenses after fee waiver and/or reimbursement (excluding any front-end or contingent deferred loads; brokerage fees and commissions, acquired fund fees and expenses; borrowing costs (such as interest and dividend expense on securities sold short); taxes; and extraordinary expenses, such as litigation expenses) do not exceed 1.75%, 2.50%, and 1.50% of the Fund’s average daily net assets for Class A, Class C, and Class I shares, respectively. This agreement may be terminated by the Fund’s Board of Trustees on 60 days’ written notice to the adviser. These fee waivers and/or expense reimbursements are subject to possible recoupment from the Fund in future years on a rolling three year basis (within the three years after the date such fees have been waived or reimbursed) if such recoupment can be achieved within the foregoing expense limits as well as any expense limitation that was in effect at the time the waiver or reimbursement was made. Prior to March 1, 2021, the expense limitations in effect for the Fund were 1.50%, 2.25% and 1.25% for Class A, Class C and Class I shares, respectively.
During the year ended October 31, 2024, the Adviser did not waive any fees or expenses.
The Board has adopted a Distribution Plan (the “Plan”) pursuant to Rule 12b-1 under the 1940 Act. The Plan provides that a monthly service and/or distribution fee is calculated by the Fund at an annual rate of up to 0.25% and 1.00% of its average daily net assets for Class A and Class C, respectively, and is paid to Northern Lights Distributors, LLC (the “Distributor” and “NLD”), an affiliate of Ultimus Fund Solutions, LLC (“UFS”), to provide compensation for ongoing shareholder servicing and distribution-related activities or services and/or maintenance of the Fund’s shareholder accounts not otherwise required to be provided by the Adviser.
Anfield Universal Fixed Income Fund
NOTES TO FINANCIAL STATEMENTS (Continued)
October 31, 2024
The Distributor acts as the Fund’s principal underwriter in a continuous public offering of the Fund’s shares. During the year ended October 31, 2024, neither the distributor nor the principal underwriter received underwriting commissions. Class C shares and Class I shares of the Fund are not subject to an initial sales charge.
In addition, certain affiliates of the Distributor provide services to the Fund as follows:
Ultimus Fund Solutions, LLC (“UFS”) – an affiliate of the Distributor, provides administration, fund accounting, and transfer agent services to the Trust. Pursuant to separate servicing agreements with UFS, the Fund pays UFS customary fees for providing administration, fund accounting and transfer agency services to the Fund. Certain officers of the Trust are also officers of UFS and are not paid any fees directly by the Fund for serving in such capacities.
Northern Lights Compliance Services, LLC (“NLCS”) – an affiliate of UFS and the Distributor, provides a Chief Compliance Officer to the Trust, as well as related compliance services, pursuant to a consulting agreement between NLCS and the Trust. Under the terms of such agreement, NLCS receives customary fees from the Fund.
BluGiant, LLC (“BluGiant”) – BluGiant, an affiliate of UFS and the Distributor, provides EDGAR conversion and filing services as well as print management services for the Fund on an ad- hoc basis. For the provision of these services, BluGiant receives customary fees from UFS under the administrative servicing agreement.
| 6. | DISTRIBUTIONS TO SHAREHOLDERS AND TAX COMPONENTS OF CAPITAL |
The Statement of Assets and Liabilities represents cost for financial reporting purposes. As of October 31, 2024, aggregate cost for federal tax purposes is $151,264,392 and differs from market value by net unrealized appreciation (depreciation) consisted of:
| Gross unrealized appreciation: | | $ | 3,760,368 | |
| Gross unrealized depreciation: | | | (16,901,050 | ) |
| Net unrealized depreciation: | | $ | (13,140,682 | ) |
The tax character of distributions paid during the fiscal years ended October 31, 2024, and October 31, 2023, was as follows:
| | | Fiscal Year Ended | | | Fiscal Year Ended | |
| | | October 31, 2024 | | | October 31, 2023 | |
| Ordinary Income | | $ | 7,483,844 | | | $ | 6,862,331 | |
| Long-Term Capital Gain | | | — | | | | — | |
| Return of Capital | | | 1,791,727 | | | | — | |
| | | $ | 9,275,571 | | | $ | 6,862,331 | |
As of October 31, 2024, the components of accumulated deficit on a tax basis were as follows:
| Undistributed | | | Undistributed | | | Post October Loss | | | Capital Loss | | | Other | | | Unrealized | | | Total | |
| Ordinary | | | Long-Term | | | and | | | Carry | | | Book/Tax | | | Appreciation/ | | | Accumulated | |
| Income | | | Gains | | | Late Year Loss | | | Forwards | | | Differences | | | (Depreciation) | | | Earnings/(Deficits) | |
| $ | — | | | $ | — | | | $ | — | | | $ | (13,543,726 | ) | | $ | — | | | $ | (13,140,682 | ) | | $ | (26,684,408 | ) |
The difference between book basis and tax basis undistributed net investment income/(loss), accumulated net realized gain/(loss), and unrealized appreciation/(depreciation) from investments is primarily attributable to the mark-to-market open future 1256 contracts and adjustments for perpetual bonds.
Anfield Universal Fixed Income Fund
NOTES TO FINANCIAL STATEMENTS (Continued)
October 31, 2024
At October 31, 2024, the Fund had capital loss carry forwards for federal income tax purposes available to offset future capital gains as follows:
| Short-Term | | | Long-Term | | | Total | | | CLCF Utilized | |
| $ | 1,088,494 | | | $ | 12,455,232 | | | $ | 13,543,726 | | | $ | — | |
The beneficial ownership, either directly or indirectly, of more than 25% of the voting securities of a fund creates a presumption of control of the fund, under Section 2(a)(9) of the 1940 Act. As of October 31, 2024, Charles Schwab & Co., Inc. was the record owner of 78.81% of the Fund’s outstanding shares, respectively. Charles Schwab & Co. may be the beneficial owner of some or all of the shares for the Fund or may hold the shares for the benefit of others. As a result, Charles Schwab & Co. may be deemed to control the Fund, respectively. Persons controlling the Fund can determine the outcome of any proposal submitted to the shareholders for approval, including changes to the Fund’s fundamental policies or the terms of the advisory agreement with the Adviser.
Subsequent events after the date of the Statement of Assets and Liabilities have been evaluated through the date the financial statements were issued. Management has determined that no events or transactions occurred requiring adjustment or disclosure in the financial statements.
REPORT OF INDEPENDENT REGISTERED PUBLIC ACCOUNTING FIRM
To the Board of Trustees of Two Roads Shared Trust and the Shareholders of Anfield Universal Fixed Income Fund
Opinion on the Financial Statements and Financial Highlights
We have audited the accompanying statement of assets and liabilities of Anfield Universal Fixed Income Fund (the “Fund”), one of the funds constituting the Two Roads Shared Trust (the “Trust”), including the schedule of investments, as of October 31 2024, the related statement of operations for the year then ended, the statements of changes in net assets for each of the two years in the period then ended, the financial highlights for each of the three years in the period then ended, and the related notes. In our opinion, the financial statements and financial highlights present fairly, in all material respects, the financial position of the Fund as of October 31, 2024, and the results of its operations for the year then ended, the changes in its net assets for each of the two years in the period then ended, and the financial highlights for each of the three years in the period then ended in conformity with accounting principles generally accepted in the United States of America. The financial highlights for each of the two years in the period ended October 31, 2021 were audited by other auditors whose report, dated December 28, 2021, expressed an unqualified opinion on those statements.
Basis for Opinion
These financial statements and financial highlights are the responsibility of the Fund’s management. Our responsibility is to express an opinion on the Fund’s financial statements and financial highlights based on our audits. We are a public accounting firm registered with the Public Company Accounting Oversight Board (United States) (PCAOB) and are required to be independent with respect to the Fund in accordance with the U.S. federal securities laws and the applicable rules and regulations of the Securities and Exchange Commission and the PCAOB.
We conducted our audits in accordance with the standards of the PCAOB. Those standards require that we plan and perform the audit to obtain reasonable assurance about whether the financial statements and financial highlights are free of material misstatement, whether due to error or fraud. The Fund is not required to have, nor were we engaged to perform, an audit of its internal control over financial reporting. As part of our audits we are required to obtain an understanding of internal control over financial reporting but not for the purpose of expressing an opinion on the effectiveness of the Fund’s internal control over financial reporting. Accordingly, we express no such opinion.
Our audits included performing procedures to assess the risks of material misstatement of the financial statements and financial highlights, whether due to error or fraud, and performing procedures that respond to those risks. Such procedures included examining, on a test basis, evidence regarding the amounts and disclosures in the financial statements and financial highlights. Our audits also included evaluating the accounting principles used and significant estimates made by management, as well as evaluating the overall presentation of the financial statements and financial highlights. Our procedures included confirmation of securities owned as of October 31, 2024, by correspondence with the custodian and brokers; when replies were not received from brokers, we performed other auditing procedures. We believe that our audits provide a reasonable basis for our opinion.

Costa Mesa, California
December 23, 2024
We have served as the auditor of one or more Regent Park Funds, LLC investment companies since 2022.
Proxy Voting Policy
Information regarding how the Fund votes proxies relating to portfolio securities for the twelve month period ended June 30 as well as a description of the policies and procedures that the Fund used to determine how to vote proxies is available without charge, upon request, by calling 1-866-866-4848 or by referring to the Securities and Exchange Commission’s (“SEC”) website at http://www.sec.gov.
Portfolio Holdings
The Fund files its complete schedule of portfolio holdings with the SEC for the first and third quarters of each fiscal year as an exhibit to its reports on Form N-PORT, within sixty days after the end of the period. Form N-PORT reports are available on the SEC’s website at http://www.sec.gov. The information on Form N-PORT is available without charge, upon request, by calling 1-866-866-4848.
| |
| |
| |
| |
| |
| |
| |
| |
| |
| |
| |
| |
| |
| |
| |
| |
| |
| |
| |
| |
| |
| |
| |
| |
| |
| |
| Adviser |
| Anfield Capital Management, LLC |
| 4041 MacArthur Blvd., Suite 155 |
| Newport Beach, CA 92660 |
| |
| Administrator |
| Ultimus Fund Solutions |
| 225 Pictoria Drive, Suite 450 |
| Cincinnati, OH 45246 |
| |
This report and the financial statements contained herein are submitted for the general information of shareholders and are not authorized for distribution to prospective investors unless preceded or accompanied by an effective prospectus. Nothing contained herein is to be considered an offer of sale or solicitation of an offer to buy shares of the Fund. Such an offering is made only by a prospectus, which contains information about the Fund’s investment objective, risks, fees and expenses. Investors are reminded to read the prospectus carefully before investing in the Fund.
Item 8. Changes in and Disagreements with Accountants for Open-End Management Investment Companies.
Not applicable.
Item 9. Proxy Disclosures for Open-End Management Investment Companies.
Not applicable.
Item 10. Remuneration Paid to Directors, Officers, and Others of Open-End Management Investment Companies.
Included under Item 7
Item 11. Statement Regarding Basis for Approval of Investment Advisory Contract.
Included under Item 7
Item 12. Disclosure of Proxy Voting Policies and Procedures for Closed-End Management Investment Companies.
Not applicable.
Item 13. Portfolio Managers of Closed-End Management Investment Companies.
Not applicable.
Item 14. Purchases of Equity Securities by Closed-End Management Investment Company and Affiliated Purchasers.
Not applicable.
Item 15. Submission of Matters to a Vote of Security Holders.
None
Item 16. Controls and Procedures
(a) The registrant’s Principal Executive Officer and Principal Financial Officer have concluded that the registrant’s disclosure controls and procedures (as defined in Rule 30a-3(c) under the Act) are effective in design and operation as of a date within 90 days of this report on Form N-CSR, based on their evaluation of these disclosure controls and procedures as required by Rule 30a-3(b) under the Act.
(b) There were no changes in the registrant’s internal control over financial reporting (as defined in Rule 30a-3(d) under the Act) during the period covered by this report that have materially affected, or are reasonably likely to materially affect, the registrant’s internal control over financial reporting.
Item 17. Disclosure of Securities Lending Activities for Closed-End Management Investment Companies.
Not applicable.
Item 18. Recovery of Erroneously Awarded Compensation.
Item 19. Exhibits.
(a)(1) Code of Ethics for Principal Executive and Senior Financial Officers.
(a)(2) Not applicable.
(a)(3) A separate certification for each principal executive officer and principal financial officer of the registrant as required by Rule 30a-2(a) under the Act (17 CFR 270.30a-2(a)): Attached hereto.
(a)(4) Not applicable.
(b) Certifications required by Rule 30a-2(b) under the Act (17 CFR 270.30a-2(b)): Attached hereto.
SIGNATURES
Pursuant to the requirements of the Securities Exchange Act of 1934 and the Investment Company Act of 1940, the registrant has duly caused this report to be signed on its behalf by the undersigned, thereunto duly authorized.
Two Roads Shared Trust
| By | /s/ James Colantino | |
| James Colantino |
| Principal Executive Officer/President |
| Date: 12/24/2024 | |
| | |
Pursuant to the requirements of the Securities Exchange Act of 1934 and the Investment Company Act of 1940, this report has been signed below by the following persons on behalf of the registrant and in the capacities and on the dates indicated.
| By | /s/ James Colantino | |
| James Colantino |
| Principal Executive Officer/President |
| Date: 12/24/2024 | |
| | |
| By | /s/ Laura Szalyga | |
| Laura Szalyga |
| Principal Financial Officer/Treasurer |
| Date: 12/24/2024 | |