UNITED STATES
SECURITIES AND EXCHANGE COMMISSION
WASHINGTON, D.C. 20549
FORM N-CSR
CERTIFIED SHAREHOLDER REPORT OF REGISTERED
MANAGEMENT INVESTMENT COMPANIES
811-22749
(Investment Company Act file number)
Resource Real Estate Diversified Income Fund
(Exact name of registrant as specified in charter)
One Crescent Drive, Suite 203
Philadelphia, PA 19103
(Address of principal executive offices) (Zip code)
Shelle Weisbaum
Resource Real Estate, Inc.
1845 Walnut Street, 18th Floor
Philadelphia, PA 19103
(Name and address of agent for service)
Copy to:
ALPS Fund Services, Inc.
1290 Broadway, Suite 1100
Denver, CO 80203
Registrant's telephone number, including area code: (215) 231-7050
Date of fiscal year end: September 30
Date of reporting period: March 1, 2015 – September 30, 2015
Item 1. Reports to Stockholders.
TABLE OF CONTENTS
| Shareholder Letter | 1 |
| Portfolio Update | 3 |
| Portfolio of Investments | 5 |
| Statement of Assets and Liabilities | 9 |
| Statement of Operations | 11 |
| Statements of Changes in Net Assets | 12 |
| Statements of Cash Flows | 15 |
| Financial Highlights | |
| Class A | 16 |
| Class C | 17 |
| Class W | 18 |
| Class I | 19 |
| Class U | 20 |
| Class T | 21 |
| Class D | 22 |
| Notes to Financial Statements | 23 |
| Report of Independent Registered Public Accounting Firm | 32 |
| Additional Information | 33 |
| Trustees & Officers | 34 |
| Privacy Notice | 36 |
| Resource Real Estate Diversified Income Fund | Shareholder Letter |
| | September 30, 2015 (Unaudited) |
Dear Shareholders:
We are pleased to present you with the Resource Real Estate Diversified Income Fund Annual Report for 2015. The Fund is an alternative real estate investment that seeks to deliver income and low volatility, with a liquidity feature. We are proud to report that the Fund continues to grow and deliver value to shareholders by:
| | ● | Providing our investors access to a diversified portfolio of both private and public real estate investments across the capital structure. |
| | ● | Delivering a growing income yield. Our current annualized dividend represents an over 6.1%1 distribution rate. We have grown our distribution by 9% since our inception. |
| | ● | Providing total return and low volatility. During the calendar year ended September 30, 2015, the Fund's Class A share class produced a total return of 5.79% with less than half the volatility of the REIT index. |
Investment Philosophy and Process
As the Fund's advisor, Resource Real Estate, Inc. (the "Advisor") has retained a consistent approach to investing our clients' capital. Our investment focus remains on high quality real estate investments. Our investable universe broadly encompasses three main strategies: Traded Equity (US and international REITs), Real Estate Credit (preferred REIT equity and bonds) and Direct Real Estate (including Private Equity and Non‐traded REITs). Each investment strategy offers relative advantages. For instance, Traded REIT Equity can offer higher levels of growth, liquidity, and access to a more global opportunity set. Direct Real Estate can offer higher levels of capital stability and attractive income. Real Estate Credit can offer higher security and income.
As the Advisor, our first decision is to determine the correct balance within the Fund among these three real estate investment strategies. We base this decision upon where we see the best relative value as well as the context of maintaining the Fund's strategic objectives.2
Investment Environment and Fund Performance
During the fiscal year ended September 30, 2015, the Fund delivered on our key goal of providing an alternative investment return profile with less price volatility when compared to other equity investments, including publicly traded REITs. Over the year, we saw strong performance from our private real estate investments. As an example, our largest private real estate holding, Clarion Lion Properties Fund, provided a total return of 15.7% during the fiscal year. Our real estate credit investments provided steady performance and helped reduce the overall volatility of the portfolio.
Our publicly traded REIT portfolio was impacted by rising volatility in the broader REIT sector. While REIT valuations rose over the first half of the year, the devaluation of the Chinese Yuan combined with concerns regarding the potential for rising interest rates, led to sharp declines in REIT stocks over the summer and into September. Despite these developments, our Fund experienced volatility of 7.53% during the fiscal year ended September 30, 2015, much lower than that of the NAREIT index, which experienced 15.65% volatility over that same period.
After a severe downturn, the U.S. economy continues to recover at a steady pace. The medium‐term outlook for real estate fundamentals is still very attractive, with private market transactions and merger and acquisition activity continuing to support strong real estate values.
Investment Positioning
Our investment portfolio seeks to address the key challenge of producing current income today while positioning the portfolio for a changing environment. We are especially focused on the possibility that the Federal Reserve will increase interest rates towards the end of 2015 and in 2016. To position the Fund for a higher interest rate environment, we have taken several steps including:
The Fund has chosen to focus its investments into real estate companies in sectors that have historically benefitted the most from a rising interest rate environment. These include hotels, residential, central business district office, and industrial. These asset classes tend to have shorter duration leases, thus reducing their sensitivity to interest rates.
The Fund also reduced its exposure to international markets, at a profit, due to the potential increase in the relative value of the dollar in a rising interest rate environment.
As real estate credit investments have the potential to be the most sensitive to interest rates, the Fund focuses on allocating to investments with floating rate debt and shorter durations to decrease its interest rate sensitivity.
In our private real estate holdings, the Fund has reduced its exposure to certain non‐traded REITs that tend to have exposure to long duration leases with little to no rental increase. At the same time, we have increased our allocation to private equity real estate, as these investments target prime assets in major metro markets, which tend to have a track record of rising rents and capital value growth.
| Annual Report | September 30, 2015 | 1 |
| Resource Real Estate Diversified Income Fund | Shareholder Letter |
| | September 30, 2015 (Unaudited) |
The longer-term prognosis for real estate values is positively impacted by improving economic growth, and we have positioned the Fund to potentially benefit from this growth, even in the event of rising interest rates. Overall, we believe that the macro environment provides attractive opportunities, given improving tenant demand and rental growth and moderate supply coming into the market.
Our focus remains on bottom up stock selection, so while refinements to our strategy have been helpful for the Fund's investment results, our underlying positions can all be explained by their individual real estate market stories. Our belief is that at this point in the cycle, accessing companies with exposure to strong growth in intrinsic value is the best way to maximize returns. We believe that this approach will allow us to continue to deliver on our key investment objectives over the course of the next year and beyond.
The Fund holds a future position as a hedge on two Euro denominated investments in the portfolio. The futures positions were purchased in June, 2015 and were accretive to the Fund in the fiscal year ending September 30, 2015.
Thank you for being a shareholder of the Resource Real Estate Diversified Income Fund.
Sincerely,
John Snowden
Portfolio Manager
Resource Real Estate Diversified Income Fund
1 | Because certain investments the Fund may make, including preferred and common equity investments, may generate dividends and other distributions to the Fund that are treated for tax purposes as a return of capital, a portion of the Fund's ordinary cash distributions (and therefore a portion of the Fund's ordinary cash distributions) may also be deemed to constitute a return of capital for tax purposes to the extent that the Fund may use such dividends or other distribution proceeds as a source of distributions. The annual distribution for the tax year 2014 was comprised of approximately 12% of return of capital. The distribution rate is the annual distribution per share as a percentage of the net asset value per share. |
2 | The Fund seeks to provide: 1) a growing income distribution above 5%; 2) diversification; 3) low volatility as compared to the broader equity markets and 4) liquidity. |
| Resource Real Estate Diversified Income Fund | Portfolio Update |
| | September 30, 2015 (Unaudited) |
The Fund's performance figures for the periods ended September 30, 2015*, compared to its benchmark:
| Resource Real Estate Diversified Income Fund | | Fiscal Year** | | 1 Year | | Since Inception | | Inception |
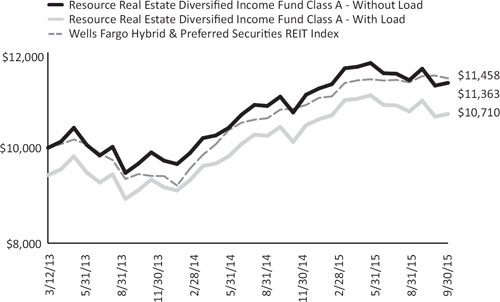
| Class A Shares – Without Load | | -2.50% | | 5.79% | | | 5.13% | | | | 3/12/13 |
| Class A Shares – With Load | | -8.83% | | -1.08% | | | 2.72% | | | | 3/12/13 |
| Class C Shares – Without Load | | -2.86% | | 5.07% | | | 3.28% | | | | 8/1/14 |
| Class C Shares – With Load | | -4.32% | | 3.48% | | | 1.97% | | | | 8/1/14 |
| Class W Shares | | -2.79% | | — | | | 1.48% | ^ | | | 11/21/14 |
| Class I Shares | | -2.51% | | 5.32% | | | 3.57% | | | | 8/1/14 |
Class U Shares – Without Load1 | | -2.40% | | 5.79% | | | 5.13% | | | | 2/12/15 |
| Class U Shares – With Load | | -8.74% | | -1.08% | | | 2.38% | | | | 2/12/15 |
Class T Shares – Without Load2 | | -2.96% | | 4.96% | | | 3.19% | | | | 2/12/15 |
| Class T Shares – With Load | | -4.42% | | 3.38% | | | 1.89% | | | | 2/12/15 |
Class D Shares3 | | -2.69% | | — | | | 1.48% | ^ | | | 2/12/15 |
| Wells Fargo Hybrid and Preferred Securities REIT Index | | 0.36% | | 5.90% | | | 5.47% | | | | 3/12/13 |
| * | Returns for periods greater than one year are annualized. |
| ** | Returns shown are for the period, March 1, 2015 to September 30, 2015 and include adjustments in accordance with accounting principles generally accepted in the United States of America. |
| ^ | Cumulative total return; not annualized. |
1 | Returns shown prior to 2/12/2015 are based on the returns of RREDX Class A Shares. If Class U Shares had been available during periods prior to 2/12/2015, the performance shown may have been different. |
2 | Returns shown prior to 2/12/2015 are based on the returns of CRREX Class C Shares. If Class T Shares had been available during periods prior to 2/12/2015, the performance shown may have been different. |
3 | Returns shown prior to 2/12/2015 are based on the returns of WRREX Class W Shares. If Class D Shares had been available during periods prior to 2/12/2015, the performance shown may have been different. |
The Wells Fargo® Hybrid and Preferred Securities REIT ("WHPSR") Index is designed to track the performance of preferred securities issued in the U.S. market by real estate investment trusts. The WHPSR Index is composed exclusively of preferred shares and depositary shares. Investors cannot invest directly in an index.
Past performance is not predictive of future results. The investment return and principal value of an investment will fluctuate. An investor's shares when redeemed, may be worth more or less than the original cost. Total return is calculated assuming reinvestment of all dividends and distributions. Performance figures for periods greater than one year are annualized. The Fund's total annual operating expense, including underlying funds before fee waivers is 4.86% for Class A, 5.61% for Class C, 5.36% for Class W, 4.65% for Class I , 4.85% for Class U, 5.60% for Class T and 5.35% for Class D shares per the most recent Class specific prospectus filings. After fee waivers, the Fund's total annual operating expense is 2.34% for Class A, 3.09% for Class C, 2.84% for Class W, 2.13% for Class I, 2.33% for Class U, 3.08% for Class T and 2.83% for Class D shares. Class A and Class U shares are subject to a maximum sales load of 6.50% imposed on purchases. Class C and Class T shares are subject to a maximum sales load of 1.50% imposed on purchases. For performance information current to the most recent month-end, please call toll-free 1-855-747-9559.
| Annual Report | September 30, 2015 | 3 |
| Resource Real Estate Diversified Income Fund | Portfolio Update |
| | September 30, 2015 (Unaudited) |
Comparison of the Change in Value of a $10,000 Investment
Portfolio Composition as of September 30, 2015
| | | | |
| Asset Type | | Percent of
Net Assets | |
| Real Estate Investment Trusts - Common Stocks | | 86.58% | |
| Bonds & Notes | | 20.32% | |
| Real Estate Investment Trusts - Preferred Stocks | | 5.36% | |
| Common Stocks | | 4.20% | |
| Short Term Investments | | 0.17% | |
| Total Investments | | 116.63% | |
| Liabilities in Excess of Other Assets | | -16.63% | |
| Net Assets | | 100.00% | |
| Resource Real Estate Diversified Income Fund | Portfolio of Investments |
| Principal ($) | | | | Value | |
| | BONDS & NOTES (20.32%) | | | |
| | ASSET BACKED SECURITIES (2.18%)(a) | | | |
| | 1,750,000 | | ACA CLO 2007-1, Ltd., 0.000% 06/15/2022(b)(c) | | $ | 577,500 | |
| | 825,000 | | Connecticut Valley Structured Credit CDO III 2006- 3A, Ltd., 0.000% 03/23/2023(b)(c) | | | 570,240 | |
| | 1,184 | | Rosedale CLO, Ltd., 0.000% 07/26/2021(b)(c) | | | 266,400 | |
| | | | | | | 1,414,140 | |
| | | | COMMERCIAL MORTGAGE BACKED SECURITIES (18.14%) | | | | |
| | 200,000 | | Banc of America Commercial Mortgage Trust 2006-4, 5.734% 08/10/2016(d)(e) | | | 199,769 | |
| | 2,160,000 | | Banc of America Commercial Mortgage Trust 2007-3, 5.741% 06/10/2017(e) | | | 2,205,427 | |
| | 1,250,000 | | Commercial Mortgage Trust 2005-GG5, 5.238% 10/10/2015(d)(e) | | | 1,249,220 | |
| | 3,168,658 | | EuroProp EMC SA 2006-4, Class A, 8.000% 04/30/2018(a)(e) | | | 4,036,354 | |
| | 2,973,248 | | EuroProp EMC SA 2006-4, Class B, 8.000% 04/30/2018(a)(e) | | | 1,328,924 | |
| | 1,000,000 | | JP Morgan Chase Commercial Mortgage Securities Trust 2005- LDP5, 5.560% 01/15/2016(e) | | | 999,889 | |
| | 500,000 | | JP Morgan Chase Commercial Mortgage Securities Trust 2006- LDP6, 5.749% 04/15/2016(e) | | | 500,745 | |
| | 300,000 | | LB-UBS Commercial Mortgage Trust 2007-C1, 5.514% 02/15/2040 | | | 306,582 | |
| | 500,000 | | Morgan Stanley Capital I Trust 2006-HQ8, 5.667% 03/12/2044(e) | | | 498,184 | |
| | 200,000 | | Morgan Stanley Capital I Trust 2007-HQ11, 5.538% 02/12/2044(d)(e) | | | 200,866 | |
| | 250,000 | | Wachovia Bank Commercial Mortgage Trust 2007- C31, 5.660% 04/15/2017(e) | | | 254,884 | |
| | | | | | | 11,780,844 | |
| | | | TOTAL BONDS & NOTES | | | | |
| | | | (Cost $13,129,536) | | | 13,194,984 | |
| | | | | | | | |
| Shares | | | | Value | |
| | | | COMMON STOCKS (4.20%) | | | | |
| | | | INVESTMENT COMPANIES (4.20%) | | | | |
| | 51,351 | | Ares Capital Corp.(d) | | | 743,563 | |
| | 24,785 | | Golub Capital BDC, Inc.(d) | | | 396,064 | |
| | 33,070 | | Main Street Capital Corp.(d) | | | 881,646 | |
| | 29,940 | | New Mountain Finance Corp.(d) | | | 406,885 | |
| | 18,796 | | Saratoga Investment Corp.(d) | | | 303,743 | |
| | | | | | | 2,731,901 | |
| | | | TOTAL COMMON STOCKS | | | | |
| | | | (Cost $3,055,245) | | | 2,731,901 | |
| | | | | | | | |
| | | | PREFERRED STOCKS (5.36%) | | | | |
| | | | REAL ESTATE INVESTMENT TRUSTS (5.36%) | | | | |
| | 13,900 | | Annaly Capital Management, Inc., Series D, 7.500%(d) | | | 342,774 | |
| | 24,208 | | Campus Crest Communities, Inc., Series A, 8.000%(d) | | | 588,981 | |
| | 9,820 | | Digital Realty Trust, Inc., Series H, 7.375%(d) | | | 262,096 | |
| | 10,305 | | Digital Realty Trust, Inc., Series F, 6.625%(d) | | | 260,716 | |
| | 16,497 | | NorthStar Realty Finance Corp., Series D, 8.500%(d) | | | 395,928 | |
| | 20,700 | | NorthStar Realty Finance Corp., Series C, 8.875%(d) | | | 503,424 | |
| | 17,464 | | Pennsylvania Real Estate Investment Trust, Series B, 7.375%(d) | | | 442,712 | |
| | 10,672 | | PS Business Parks, Inc., Series S, 6.450%(d) | | | 270,749 | |
| | 10,127 | | Retail Properties of America, Inc., Series A, 7.000%(d) | | | 259,251 | |
| | 6,173 | | WP Glimcher, Inc., Series D, 6.875%(d) | | | 153,461 | |
| | | | | | | 3,480,092 | |
| | | | | | | | |
| | | | TOTAL PREFERRED STOCKS | | | | |
| | | | (Cost $3,545,445) | | | 3,480,092 | |
| See Notes to Financial Statements. | |
| Annual Report | September 30, 2015 | 5 |
| Resource Real Estate Diversified Income Fund | Portfolio of Investments |
| Shares | | | | Value | |
| | REAL ESTATE INVESTMENT TRUSTS - COMMON STOCKS (86.58%) | | | |
| | PUBLIC NON-TRADED REAL ESTATE INVESTMENT TRUSTS (21.09%)(f) | | | |
| | 2,981 | | American Realty Capital Healthcare Trust II(a) | | $ | 69,069 | |
| | 4,839 | | Cole Credit Property Trust IV, Inc.(a) | | | 43,887 | |
| | 164,930 | | Cole Real Estate Income Strategy (Daily NAV), Inc. | | | 3,006,671 | |
| | 37,823 | | Corporate Property Associates Global, Inc., Class A(a) | | | 346,077 | |
| | 191,111 | | Corporate Property Associates Global, Inc., Class C(a) | | | 1,758,222 | |
| | 30,292 | | Dividend Capital Diversified Property Fund | | | 224,770 | |
| | 446,837 | | Inventrust Properties Trust, Inc.(a) | | | 1,814,160 | |
| | 265,355 | | Jones Lang LaSalle Income Property Trust | | | 2,948,089 | |
| | 321,623 | | NorthStar Healthcare Income, Inc.(a) | | | 2,987,882 | |
| | 37,429 | | NorthStar Real Estate Income II(a) | | | 346,597 | |
| | 14,984 | | Phillips Edison Grocery Center REIT I, Inc.(a) | | | 152,838 | |
| | | | | | | 13,698,262 | |
| | | | PRIVATE REAL ESTATE INVESTMENT TRUSTS (20.34%)(f) | | | | |
| | 480,678 | | Charter Hall Direct VA Trust | | | 351,052 | |
| | 2,544 | | Clarion Gables Multi Private REIT | | | 2,782,879 | |
| | 1,486 | | Clarion Lion Industrials Trust | | | 2,015,594 | |
| | 5,102 | | Clarion Lion Properties Trust | | | 6,460,565 | |
| | 67,940 | | Cottonwood Residential, Inc. | | | 985,816 | |
| | 40,000 | | Reverse Mortgage Investment Trust, Inc.(a)(b)(d) | | | 616,000 | |
| | | | | | | 13,211,906 | |
| | | | TRADED REAL ESTATE INVESTMENT TRUSTS (45.15%) | | | | |
| | 9,377 | | Alexandria REIT(d) | | | 793,951 | |
| | 9,880 | | AvalonBay Communities, Inc.(d) | | | 1,727,222 | |
| | 122,715 | | Blackstone Mortgage Trust, Inc., Class A(d) | | | 3,367,300 | |
| | 7,294 | | Boston Properties, Inc.(d) | | | 863,610 | |
| | 8,141 | | Care Capital Properties, Inc.(d) | | | 268,083 | |
| | 96,634 | | CBL & Associates Properties, Inc.(d) | | | 1,328,717 | |
| | 55,993 | | Colony Capital, Inc., Class A(d) | | | 1,095,223 | |
| | 11,261 | | Digital Realty Trust, Inc.(d) | | | 735,568 | |
| | 26,284 | | EPR Properties, Inc.(d) | | | 1,355,466 | |
| | 10,655 | | Essex Property Trust, Inc.(d) | | | 2,380,540 | |
| | 20,571 | | Extra Space Storage, Inc.(d) | | | 1,587,258 | |
| | 46,667 | | Great Ajax Corp.(d) | | | 577,271 | |
| | 19,889 | | Kilroy Realty Corp.(d) | | | 1,295,967 | |
| | 38,742 | | Medical Properties Trust, Inc. | | | 428,486 | |
| | 26,680 | | National Retail Properties, Inc.(d) | | | 967,684 | |
| | 19,820 | | Omega Healthcare Investors, Inc.(d) | | | 696,673 | |
| | 53,199 | | Pebblebrook Hotel Trust(d) | | | 1,885,905 | |
| | 10,719 | | Prologis, Inc.(d) | | | 416,969 | |
| | 99,042 | | RLJ Lodging Trust(d) | | | 2,502,791 | |
| | 9,173 | | SL Green Realty Corp.(d) | | | 992,152 | |
| | 40,755 | | STAG Industrial, Inc.(d) | | | 742,149 | |
| | 17,762 | | Sun Communities, Inc.(d) | | | 1,203,553 | |
| | 23,371 | | Ventas, Inc.(d) | | | 1,310,178 | |
| | 7,517 | | WP Carey, Inc. | | | 434,558 | |
| | 31,015 | | WP Glimcher, Inc. | | | 361,635 | |
| | | | | | | 29,318,909 | |
| | | | | | | | |
| | | | TOTAL REAL ESTATE INVESTMENT TRUSTS - COMMON STOCKS | | | | |
| | | | (Cost $56,764,090) | | | 56,229,077 | |
| See Notes to Financial Statements. | |
| Resource Real Estate Diversified Income Fund | Portfolio of Investments |
| Shares | | | | Value | |
| | SHORT TERM INVESTMENTS (0.17%) | | | |
| | 109,363 | | Dreyfus Treasury Cash Management, Institutional Class, 0.01% (d)(g) (Cost $109,363) | | $ | 109,363 | |
| | | | | | | | |
| | | | TOTAL SHORT TERM INVESTMENTS | | | | |
| | | | (Cost $109,363) | | | 109,363 | |
| | | | | | | | |
| | | | TOTAL INVESTMENTS (116.63%) | | | | |
| | | | (Cost $76,603,679) | | $ | 75,745,417 | |
| | | | | | | | |
| | | | LIABILITIES IN EXCESS OF OTHER ASSETS (‐16.63%) | | | (10,801,296 | ) |
| | | | | | | | |
| | | | NET ASSETS (100.00%) | | $ | 64,944,121 | |
(a) | Fair Value estimated using Fair Valuation Procedures adopted by the Board of Trustees. Total value of such securities is $14,914,150 representing 22.96% of net assets. |
(b) | Securities exempt from registration under Rule 144A of the Securities Act of 1933. These securities may be sold in the ordinary course of business in transactions exempt from registration, normally to qualified institutional buyers. As of September 30, 2015, the aggregate market value of those securities was $2,030,140, representing 3.13% of net assets. |
(c) | Issued with a zero coupon. Income is recognized through the accretion of discount. |
(d) | All or a portion of each of these securities may be segregated as collateral for the Fund's line of credit. (See Note 8) |
(e) | Variable rate security. The rate shown is the effective interest rate as of September 30, 2015. |
(f) | Illiquid security. See below. |
(g) | Money market fund; interest rate reflects seven-day effective yield on September 30, 2015. |
Securities determined to be illiquid under the procedures approved by the Fund's Board of Trustees.
Information related to the illiquid securities is as follows:
| Date(s) of Purchase | | Security | | Cost | | Value | | % of Net
Assets |
| 11/08/13 | | American Realty Capital Healthcare Trust II | | $ | 61,027 | | $ | 69,069 | | 0.11% |
| 04/15/14 | | Charter Hall Direct VA Trust | | | 449,712 | | | 351,052 | | 0.54% |
| 07/02/15 | | Clarion Gables Multi Private REIT | | | 2,700,000 | | | 2,782,879 | | 4.28% |
| 01/01/14‐04/01/15 | | Clarion Lion Industrials Trust | | | 1,800,000 | | | 2,015,594 | | 3.10% |
| 01/01/14‐07/02/15 | | Clarion Lion Properties Trust | | | 5,950,000 | | | 6,460,565 | | 9.95% |
| 05/22/13 | | Cole Credit Property Trust IV, Inc. | | | 41,489 | | | 43,887 | | 0.07% |
| 04/17/14‐08/14/15 | | Cole Real Estate Income Strategy (Daily NAV), Inc. | | | 2,866,637 | | | 3,006,671 | | 4.63% |
| 11/05/13‐05/30/14 | | Corporate Property Associates Global, Inc., Class A | | | 315,956 | | | 346,077 | | 0.53% |
| 03/12/15 | | Corporate Property Associates Global, Inc., Class C | | | 1,683,156 | | | 1,758,222 | | 2.71% |
| 02/24/14‐07/21/14 | | Cottonwood Residential, Inc. | | | 758,212 | | | 985,816 | | 1.52% |
| 04/05/13‐11/12/14 | | Dividend Capital Diversified Property Fund | | | 154,357 | | | 224,770 | | 0.35% |
| 02/06/15 | | Inventrust Properties Trust, Inc. | | | 1,567,706 | | | 1,814,160 | | 2.79% |
| 06/09/15‐08/14/15 | | Jones Lang LaSalle Income Property Trust | | | 2,846,010 | | | 2,948,089 | | 4.54% |
| 11/27/13‐03/12/15 | | NorthStar Healthcare Income, Inc. | | | 2,921,783 | | | 2,987,882 | | 4.60% |
| 03/11/14‐06/30/15 | | NorthStar Real Estate Income II | | | 318,341 | | | 346,597 | | 0.53% |
| 08/07/13‐11/25/13 | | Phillips Edison Grocery Center REIT I, Inc. | | | 123,640 | | | 152,838 | | 0.23% |
| 02/06/14‐06/06/14 | | Reverse Mortgage Investment Trust, Inc. | | | 616,500 | | | 616,000 | | 0.95% |
| | | Total | | $ | 25,174,526 | | $ | 26,910,168 | | 41.43% |
REITS - Real Estate Investment Trusts.
| See Notes to Financial Statements. | |
| Annual Report | September 30, 2015 | 7 |
| Resource Real Estate Diversified Income Fund | Portfolio of Investments |
Additional information on investments in private real estate investment trusts:
| Value | | Security | | Redemption
Frequency | | | Redemption Notice
(Days) | | | Unfunded Commitments as of September 30, 2015(a) | |
| $ | 351,052 | | Charter Hall Direct VA Trust | | | N/A | | | | N/A | | | $ | – | |
| | 2,782,879 | | Clarion Gables Multi Private REIT | | Quarterly | | | | 90 | | | | 300,000 | |
| | 2,015,594 | | Clarion Lion Industrials Trust | | Quarterly | | | | 90 | | | | 2,800,000 | |
| | 6,460,565 | | Clarion Lion Properties Trust | | Quarterly | | | | 90 | | | | – | |
| | 985,816 | | Cottonwood Residential, Inc. | | Daily | | | | 60 | | | | – | |
| | 616,000 | | Reverse Mortgage Investment Trust, Inc.(b) | | | N/A | | | IPO(c) | | | | – | |
(a) | Refer to Note 9 for additional information on unfunded commitments. |
(b) | The fair values of this investment has been estimated using the net asset value per share of the investments and adjusted as necessary for any changes in market conditions. |
(c) | Redemption eligible after the completion of the Initial Price Offering (IPO). |
FUTURES CONTRACTS
At September 30, 2015, the Fund had the following outstanding futures contracts:
| Description | Position | | Contracts | | Expiration Date | | Notional Value | | | Unrealized
Appreciation | |
| Euro Foreign Exchange | | | | | | | | | | | |
| Currency Future | Short | | | (37) | | 12/15/15 | | $ | (5,170,288 | ) | | $ | 24,884 | |
| | | | | | | | | $ | (5,170,288 | ) | | $ | 24,884 | |
| See Notes to Financial Statements. | |
| Resource Real Estate Diversified Income Fund | Statement of Assets and Liabilities |
| ASSETS | | | | |
| Investments, at value (Cost $76,603,679) | | $ | 75,745,417 | |
| Cash | | | 452,413 | |
| Deposit with broker for futures contracts | | | 531,199 | |
| Variation margin receivable | | | 43,013 | |
| Dividends and interest receivable | | | 720,257 | |
| Receivable for fund shares sold | | | 394,494 | |
| Prepaid expenses and other assets | | | 42,891 | |
| Total assets | | | 77,929,684 | |
| | | | | |
| LIABILITIES | | | | |
| Line of credit payable | | | 12,373,059 | |
| Payable due to adviser | | | 228 | |
| Administration fees payable | | | 13,285 | |
| Custody fees payable | | | 2,325 | |
| Payable for trustee fees and expenses | | | 277 | |
| Distribution fees payable | | | 8,156 | |
| Distribution due to shareholders | | | 446,604 | |
| Shareholder servicing fees payable | | | 27,596 | |
| Dealer manager fees payable | | | 5,308 | |
| Payable for transfer agency fees | | | 10,008 | |
| Accrued expenses and other liabilities | | | 98,717 | |
| Total liabilities | | | 12,985,563 | |
| NET ASSETS | | $ | 64,944,121 | |
| | | | | |
| NET ASSETS CONSISTS OF | | | | |
| Paid‐in capital | | $ | 65,727,344 | |
| Accumulated net realized gain on investments, futures contracts and foreign currency transactions | | | 49,899 | |
| Net unrealized depreciation on investments, futures contracts and translation of assets and liabilities in foreign currencies | | | (833,122 | ) |
| NET ASSETS | | $ | 64,944,121 | |
| Commitments and Contingencies (Note 9) | | | | |
| See Notes to Financial Statements. | |
| Annual Report | September 30, 2015 | 9 |
| Resource Real Estate Diversified Income Fund | Statement of Assets and Liabilities |
| PRICING OF SHARES | | | | |
| Class A | | | | |
| Net Assets | | $ | 37,398,705 | |
| Shares of beneficial interest outstanding (unlimited number of shares, no par value common stock authorized) | | | 3,811,137 | |
Net Asset Value and redemption price per share(a) | | $ | 9.81 | |
| Maximum Offering Price Per Share (Maximum Sales Charge of 6.50%) | | $ | 10.49 | |
| Class C | | | | |
| Net Assets | | $ | 13,435,980 | |
| Shares of beneficial interest outstanding (unlimited number of shares, no par value common stock authorized) | | | 1,369,842 | |
Net Asset Value and redemption price per share(a) | | $ | 9.81 | |
| Maximum Offering Price Per Share (Maximum Sales Charge of 1.50%) | | $ | 9.96 | |
| Class W | | | | |
| Net Assets | | $ | 11,420,693 | |
| Shares of beneficial interest outstanding (unlimited number of shares, no par value common stock authorized) | | | 1,146,691 | |
| Net Asset Value, offering and redemption price per share | | $ | 9.96 | |
| Class I | | | | |
| Net Assets | | $ | 49,243 | |
| Shares of beneficial interest outstanding (unlimited number of shares, no par value common stock authorized) | | | 4,751 | |
| Net Asset Value, offering and redemption price per share | | $ | 10.36 | |
| Class U | | | | |
| Net Assets | | $ | 61,287 | |
| Shares of beneficial interest outstanding (unlimited number of shares, no par value common stock authorized) | | | 6,244 | |
Net Asset Value and redemption price per share(a) | | $ | 9.82 | |
| Maximum Offering Price Per Share (Maximum Sales Charge of 6.50%) | | $ | 10.50 | |
| Class T | | | | |
| Net Assets | | $ | 447,273 | |
| Shares of beneficial interest outstanding (unlimited number of shares, no par value common stock authorized) | | | 45,633 | |
Net Asset Value and redemption price per share(a) | | $ | 9.80 | |
| Maximum Offering Price Per Share (Maximum Sales Charge of 1.50%) | | $ | 9.95 | |
| Class D | | | | |
| Net Assets | | $ | 2,130,940 | |
| Shares of beneficial interest outstanding (unlimited number of shares, no par value common stock authorized) | | | 213,805 | |
| Net Asset Value, offering and redemption price per share | | $ | 9.97 | |
(a) | Redemption price varies based on length of time held (Note 1). |
| See Notes to Financial Statements. | |
| Resource Real Estate Diversified Income Fund | Statement of Operations |
| | | | | | | | |
| | | For the Period Ended September 30, 2015(a) | | For the Year Ended February 28, 2015 | |
| INVESTMENT INCOME | | | | | | | |
| Dividends | | $ | 1,169,942 | | $ | 726,765 | |
| Interest | | | 534,336 | | | 197,416 | |
| Less: Foreign withholding taxes | | | – | | | (5,219 | ) |
| Total investment income | | | 1,704,278 | | | 918,962 | |
| EXPENSES | | | | | | | |
| Investment advisory fees (Note 3) | | | 361,606 | | | 209,301 | |
| Administrative fees (Note 3) | | | 81,421 | | | 125,146 | |
| Distribution fees (Note 3): | | | | | | | |
| Class C | | | 40,694 | | | 7,421 | |
| Class T | | | 446 | | | 1 | |
| Shareholder servicing fees (Note 3): | | | | | | | |
| Class A | | | 48,221 | | | 39,317 | |
| Class C | | | 13,565 | | | 2,474 | |
| Class W | | | 9,422 | | | 66 | |
| Class U | | | 25 | | | – | |
| Class T | | | 149 | | | – | |
| Class D | | | 899 | | | – | |
| Dealer manager fees (Note 3): | | | | | | | |
| Class W | | | 18,845 | | | 131 | |
| Class D | | | 1,797 | | | 1 | |
| Interest expense | | | 71,210 | | | 49,840 | |
| Transfer agent fees (Note 3) | | | 114,289 | | | 104,211 | |
| Audit fees | | | 17,600 | | | 28,000 | |
| Legal fees | | | 74,604 | | | 102,662 | |
| Printing expense | | | 44,374 | | | 58,139 | |
| Registration fees | | | 49,599 | | | 27,147 | |
| Custody fees | | | 4,930 | | | 10,120 | |
| Trustee fees and expenses (Note 3) | | | 22,097 | | | 30,458 | |
| Other expenses | | | 42,413 | | | 28,124 | |
| Total expenses | | | 1,018,206 | | | 822,559 | |
| Less fees waived/expenses reimbursed by investment adviser (Note 3) | | | (307,831 | ) | | (431,960 | ) |
| Total net expenses | | | 710,375 | | | 390,599 | |
| NET INVESTMENT INCOME | | | 993,903 | | | 528,363 | |
| REALIZED AND UNREALIZED GAIN/(LOSS) ON INVESTMENTS | | | | | | | |
| Net realized gain on investments | | | 133,364 | | | 340,940 | |
| Net realized gain on futures contracts | | | 94,338 | | | – | |
| Net realized loss on foreign currency transactions | | | (12,083 | ) | | (228,245 | ) |
| Long‐term capital gains from other investment companies | | | 8,465 | | | – | |
| Net change in unrealized appreciation/(depreciation) on investments | | | (2,613,757 | ) | | 1,665,223 | |
| Net change in unrealized appreciation on futures contracts | | | 24,884 | | | – | |
| Net change in unrealized appreciation/(depreciation) on translation of assets and liabilities in foreign currencies | | | 2,418 | | | (2,154 | ) |
| NET REALIZED AND UNREALIZED GAIN/(LOSS) ON INVESTMENTS, FUTURES CONTRACTS AND FOREIGN CURRENCY TRANSACTIONS | | | (2,362,371 | ) | | 1,775,764 | |
| NET INCREASE/(DECREASE) IN NET ASSETS RESULTING FROM OPERATIONS | | $ | (1,368,468 | ) | $ | 2,304,127 | |
(a) | With the approval of the Board, effective September 30, 2015, the Fund's fiscal year end was changed from February 28 to September 30 (See Note 1). |
| See Notes to Financial Statements. |
| Annual Report | September 30, 2015 | 11 |
| Resource Real Estate Diversified Income Fund | Statements of Changes in Net Assets |
| | | | | | | | | | | |
| | | For the Period Ended September 30, 2015(a) | | For the Year Ended February 28, 2015(b) | | Period Ended February 28, 2014(c) | |
| OPERATIONS | | | | | | | | | | |
| Net investment income | | $ | 993,903 | | $ | 528,363 | | $ | 38,817 | |
| Net realized gain on investments, futures contracts and foreign currency transactions | | | 224,084 | | | 112,695 | | | 2,690 | |
| Net change in unrealized appreciation/(depreciation) on investments, futures contracts and translation of assets and liabilities in foreign currencies | | | (2,586,455 | ) | | 1,663,069 | | | 90,264 | |
| Net increase/(decrease) in net assets resulting from operations | | $ | (1,368,468 | ) | $ | 2,304,127 | | $ | 131,771 | |
| DISTRIBUTIONS TO SHAREHOLDERS | | | | | | | | | | |
| From investment income: | | | | | | | | | | |
| Class A | | | (532,818 | ) | | (681,335 | ) | | (59,167 | ) |
| Class C | | | (127,483 | ) | | (34,341 | ) | | – | |
| Class W | | | (86,896 | ) | | – | | | – | |
| Class I | | | (178 | ) | | – | | | – | |
| Class U | | | (247 | ) | | – | | | – | |
| Class T | | | (1,218 | ) | | – | | | – | |
| Class D | | | (8,622 | ) | | – | | | – | |
| From realized gains on investments: | | | | | | | | | | |
| Class A | | | (116,405 | ) | | (111,045 | ) | | (451 | ) |
| Class C | | | (41,653 | ) | | (5,597 | ) | | – | |
| Class W | | | (34,900 | ) | | – | | | – | |
| Class I | | | (145 | ) | | – | | | – | |
| Class U | | | (193 | ) | | – | | | – | |
| Class T | | | (1,405 | ) | | – | | | – | |
| Class D | | | (6,554 | ) | | – | | | – | |
| From return of capital: | | | | | | | | | | |
| Class A | | | (840,103 | ) | | (106,091 | ) | | (7,984 | ) |
| Class C | | | (218,427 | ) | | (5,347 | ) | | – | |
| Class W | | | (157,913 | ) | | – | | | – | |
| Class I | | | (418 | ) | | – | | | – | |
| Class U | | | (568 | ) | | – | | | – | |
| Class T | | | (3,394 | ) | | – | | | – | |
| Class D | | | (19,567 | ) | | – | | | – | |
| Net decrease in net assets from distributions | | | (2,199,107 | ) | | (943,756 | ) | | (67,602 | ) |
| CAPITAL SHARE TRANSACTIONS | | | | | | | | | | |
| Class A | | | | | | | | | | |
| Proceeds from sales of shares | | | 11,798,656 | | | 22,459,088 | | | 4,609,647 | |
| Distributions reinvested | | | 701,023 | | | 357,128 | | | 61,832 | |
| Cost of shares redeemed | | | (620,522 | ) | | (1,063,753 | ) | | (12,697 | ) |
| Net increase from capital shares transactions | | | 11,879,157 | | | 21,752,463 | | | 4,658,782 | |
| Class C | | | | | | | | | | |
| Proceeds from sales of shares | | | 10,162,184 | | | 3,857,659 | | | – | |
| Distributions reinvested | | | 282,757 | | | 32,425 | | | – | |
| Cost of shares redeemed | | | (64,440 | ) | | (261,196 | ) | | – | |
| Net increase from capital shares transactions | | | 10,380,501 | | | 3,628,888 | | | – | |
| Class W | | | | | | | | | | |
| Proceeds from sales of shares | | | 10,610,794 | | | 1,209,498 | | | – | |
| Distributions reinvested | | | 111,946 | | | – | | | – | |
| Cost of shares redeemed | | | (12,187 | ) | | – | | | – | |
| Net increase from capital shares transactions | | | 10,710,553 | | | 1,209,498 | | | – | |
| Class I | | | | | | | | | | |
| Proceeds from sales of shares | | | 50,000 | | | 20 | | | – | |
| See Notes to Financial Statements. | |
| Resource Real Estate Diversified Income Fund | Statements of Changes in Net Assets (continued) |
| | | For the Period Ended September 30, 2015(a) | | | For the Year Ended February 28, 2015(b) | | | Period Ended February 28, 2014(c) | |
| Distributions reinvested | | | 741 | | | | – | | | | – | |
| Net increase from capital shares transactions | | | 50,741 | | | | 20 | | | | – | |
| | | | | | | | | | | | | |
| Class U | | | | | | | | | | | | |
| Proceeds from sales of shares | | | 60,795 | | | | 2,500 | | | | – | |
| Net increase from capital shares transactions | | | 60,795 | | | | 2,500 | | | | – | |
| | | | | | | | | | | | | |
| Class T | | | | | | | | | | | | |
| Proceeds from sales of shares | | | 454,829 | | | | 2,500 | | | | – | |
| Distributions reinvested | | | 1,389 | | | | – | | | | – | |
| Net increase from capital shares transactions | | | 456,218 | | | | 2,500 | | | | – | |
| | | | | | | | | | | | | |
| Class D | | | | | | | | | | | | |
| Proceeds from sales of shares | | | 2,171,457 | | | | 2,500 | | | | – | |
| Distributions reinvested | | | 20,583 | | | | – | | | | – | |
| Net increase from capital shares transactions | | | 2,192,040 | | | | 2,500 | | | | – | |
| | | | | | | | | | | | | |
| Net increase in net assets | | | 32,162,430 | | | | 27,958,740 | | | | – | |
| | | | | | | | | | | | | |
| NET ASSETS | | | | | | | | | | | | |
| Beginning of period | | | 32,781,691 | | | | 4,822,951 | | | | 100,000 | |
| End of period* | | $ | 64,944,121 | | | $ | 32,781,691 | | | $ | 4,822,951 | |
| | | | | | | | | | | | | |
| *Including accumulated net investment loss of: | | $ | – | | | $ | – | | | $ | (16,562 | ) |
| See Notes to Financial Statements. |
| Annual Report | September 30, 2015 | 13 |
| Resource Real Estate Diversified Income Fund | Statements of Changes in Net Assets (continued) |
| | | | | | | | | | |
| | | For the Period Ended September 30, 2015(a) | | | For the Year Ended February 28, 2015(b) | | | Period Ended February 28, 2014(c) | |
| OTHER INFORMATION | | | | | | | | | |
| Capital Shares Transactions | | | | | | | | | |
| Class A | | | | | | | | | |
| Issued | | | 1,155,322 | | | | 2,218,819 | | | | 479,602 | |
| Distributions reinvested | | | 70,208 | | | | 35,636 | | | | 6,600 | |
| Redeemed | | | (60,300 | ) | | | (103,394 | ) | | | (1,356 | ) |
| Net increase in capital shares | | | 1,165,230 | | | | 2,151,061 | | | | 484,846 | |
| | | | | | | | | | | | | |
| Class C | | | | | | | | | | | | |
| Issued | | | 992,068 | | | | 377,181 | | | | – | |
| Distributions reinvested | | | 28,471 | | | | 3,207 | | | | – | |
| Redeemed | | | (6,233 | ) | | | (24,852 | ) | | | – | |
| Net increase in capital shares | | | 1,014,306 | | | | 355,536 | | | | – | |
| | | | | | | | | | | | | |
| Class W | | | | | | | | | | | | |
| Issued | | | 1,023,118 | | | | 113,580 | | | | – | |
| Distributions reinvested | | | 11,153 | | | | – | | | | – | |
| Redeemed | | | (1,160 | ) | | | – | | | | – | |
| Net increase in capital shares | | | 1,033,111 | | | | 113,580 | | | | – | |
| | | | | | | | | | | | | |
| Class I | | | | | | | | | | | | |
| Issued | | | 4,677 | | | | 2 | | | | – | |
| Distributions reinvested | | | 72 | | | | – | | | | – | |
| Net increase in capital shares | | | 4,749 | | | | 2 | | | | – | |
| | | | | | | | | | | | | |
| Class U | | | | | | | | | | | | |
| Issued | | | 6,007 | | | | 237 | | | | – | |
| Net increase in capital shares | | | 6,007 | | | | 237 | | | | – | |
| | | | | | | | | | | | | |
| Class T | | | | | | | | | | | | |
| Issued | | | 45,253 | | | | 237 | | | | – | |
| Distributions reinvested | | | 143 | | | | – | | | | – | |
| Net increase in capital shares | | | 45,396 | | | | 237 | | | | – | |
| | | | | | | | | | | | | |
| Class D | | | | | | | | | | | | |
| Issued | | | 211,499 | | | | 233 | | | | – | |
| Distributions reinvested | | | 2,073 | | | | – | | | | – | |
| Net increase in capital shares | | | 213,572 | | | | 233 | | | | – | |
(a) | With the approval of the Board, effective September 30, 2015, the Fund's fiscal year end was changed from February 28 to September 30 (See Note 1). |
(b) | The Resource Real Estate Diversified Income Fund Class C and Class I commenced operations on August 1, 2014. Class W commenced operations on November 24, 2014. Class D, Class T and Class U commenced operations on February 13, 2015. |
(c) | The Resource Real Estate Diversified Income Fund Class A commenced operations on March 12, 2013. |
| See Notes to Financial Statements. | |
| Resource Real Estate Diversified Income Fund | Statements of Cash Flows |
| | For the Period Ended September 30, 2015 |
| | | For the Period Ended September 30, 2015(a) | | | For the Period Ended February 28, 2015 | |
| Cash Flow from Operating Activities: | | | | | | |
| Net decrease in net assets resulting from operations | | $ | (1,368,468 | ) | | $ | 2,304,127 | |
| Adjustments to reconcile net decrease in net assets resulting from operations to net cash | | | | | | | | |
| used by operating activities: | | | | | | | | |
| Purchases of investments | | | (45,955,217 | ) | | | (46,922,063 | ) |
| Proceeds from sales | | | 3,180,286 | | | | 17,597,660 | |
Net short‐term purchases | | | 1,326,806 | | | | (1,431,360 | ) |
| Net discounts amortized | | | 10,188 | | | | (6,186 | ) |
| Net realized (gain)/loss on: | | | | | | | | |
| Net realized gain on investments | | | (133,364 | ) | | | (340,940 | ) |
| Net realized loss on foreign currency transactions | | | 12,083 | | | | 228,245 | |
Long‐term capital gain distributions from other investment companies | | | (8,465 | ) | | | – | |
| Net change in unrealized appreciation/(depreciation) on investments and translation of assets and | | | | | | | | |
| liabilities in foreign currency transactions | | | 2,611,339 | | | | (1,663,069 | ) |
| Changes in assets and liabilities: | | | | | | | | |
| Increase in deposit with broker for futures contracts | | | (531,199 | ) | | | – | |
| Increase in dividends and interest receivable | | | (622,291 | ) | | | (85,688 | ) |
| (Increase)/Decrease in adviser fee payable | | | 58,128 | | | | (28,297 | ) |
| Decrease in deferred offering costs | | | – | | | | 5,567 | |
| (Increase)/Decrease in prepaid expenses and other assets | | | 27,711 | | | | (64,816 | ) |
| Increase/(Decrease) in custody fees payable | | | (174 | ) | | | 1,901 | |
| Increase/(Decrease) in payable for return of securities on loan | | | (43,013 | ) | | | – | |
| Increase in dealer manager fees payable | | | 5,176 | | | | 132 | |
| Increase in distribution fees payable | | | 6,280 | | | | 1,945 | |
| Increase in shareholder servicing fees payable | | | 19,017 | | | | 7,890 | |
| Decrease in payable for organizational expenses | | | – | | | | (23,302 | ) |
| Increase in distribution due to shareholders | | | 446,604 | | | | – | |
| Increase/(Decrease) in administration fees payable | | | (18,894 | ) | | | 27,336 | |
| Decrease in payable for trustees fees and expenses | | | (2,158 | ) | | | (1,907 | ) |
| Increase/(Decrease) in payable for transfer agency fees | | | (26,119 | ) | | | 31,252 | |
| Increase in accrued expenses and other liabilities | | | 51,440 | | | | 18,209 | |
| Net cash used by operating activities | | | (40,954,304 | ) | | | (30,343,364 | ) |
| | | | | | | | | |
| Cash Flows from Financing Activities: | | | | | | | | |
| Increase in line of credit payable | | | 7,185,209 | | | | 5,123,737 | |
| Proceeds from shares sold | | | 35,377,376 | | | | 27,272,822 | |
| Payment on shares redeemed | | | (697,149 | ) | | | (1,324,969 | ) |
| Cash distributions paid | | | (634,064 | ) | | | (554,203 | ) |
| Net cash provided by financing activities | | | 41,231,372 | | | | 30,517,387 | |
| | | | | | | | | |
| Effect of Exchange Rates On Cash & Foreign Currency | | | 2,418 | | | | (2,154 | ) |
| | | | | | | | | |
| Net Increase in Cash & Foreign Rates On Cash & Foreign Currency | | | 279,486 | | | | 171,869 | |
| Cash & Foreign Currency, Beginning of Period | | | 172,927 | | | | 1,058 | |
| Cash & Foreign Currency, End of Period | | $ | 452,413 | | | $ | 172,927 | |
| | | | | | | | | |
Non‐cash financing activities not included herein consist of reinvestment of distributions of: | | $ | 1,118,439 | | | $ | 389,553 | |
��
(a) | With the approval of the Board, effective September 30, 2015, the Fund's fiscal year end was changed from February 28 to September 30 (See Note 1). |
| See Notes to Financial Statements. | |
| Annual Report | September 30, 2015 | 15 |
| Resource Real Estate Diversified Income Fund – Class A | Financial Highlights |
| | For a Share Outstanding Throughout the Periods Presented |
| | | For the Period Ended September 30, 2015(a) | | | Year Ended February 28, 2015 | | | For the Period Ended February 28, 2014(b) | |
| NET ASSET VALUE, BEGINNING OF PERIOD | | $ | 10.52 | | | $ | 9.75 | | | $ | 10.00 | |
| | | | | | | | | | | | | |
| INCOME FROM INVESTMENT OPERATIONS | | | | | | | | | | | | |
Net investment income(c)(d) | | | 0.21 | | | | 0.33 | | | | 0.24 | |
| Net realized and unrealized gain/(loss) on investments | | | (0.47 | ) | | | 1.05 | | | | (0.06 | )(e) |
| Total income/(loss) from investment operations | | | (0.26 | ) | | | 1.38 | | | | 0.18 | |
| | | | | | | | | | | | | |
| DISTRIBUTIONS TO SHAREHOLDERS | | | | | | | | | | | | |
| From net investment income | | | (0.17 | ) | | | (0.48 | ) | | | (0.39 | ) |
| From net realized gain on investments | | | (0.03 | ) | | | (0.05 | ) | | | (0.00 | )(f) |
| From return of capital | | | (0.25 | ) | | | (0.08 | ) | | | (0.04 | ) |
| Total distributions | | | (0.45 | ) | | | (0.61 | ) | | | (0.43 | ) |
| INCREASE/DECREASE IN NET ASSET VALUE | | | (0.71 | ) | | | 0.77 | | | | (0.25 | ) |
| NET ASSET VALUE, END OF PERIOD | | $ | 9.81 | | | $ | 10.52 | | | $ | 9.75 | |
| | | | | | | | | | | | | |
TOTAL RETURN(g) | | | (2.50 | )%(h) | | | 14.70 | % | | | 2.03 | % |
| | | | | | | | | | | | | |
| RATIOS AND SUPPLEMENTAL DATA | | | | | | | | | | | | |
| Net assets, end of period (in 000s) | | $ | 37,399 | | | $ | 27,830 | | | $ | 4,823 | |
| | | | | | | | | | | | | |
| RATIOS TO AVERAGE NET ASSETS | | | | | | | | | | | | |
Including interest expense:(i) | | | | | | | | | | | | |
| Expenses, gross | | | 3.30 | %(j) | | | 4.81 | % | | | 24.79 | %(j) |
| Expenses, net of fees waived/expenses reimbursed by investment adviser | | | 2.24 | %(j) | | | 2.29 | % | | | 2.32 | %(j) |
Excluding interest expense:(i) | | | | | | | | | | | | |
| Expenses, gross | | | 3.05 | %(j) | | | 4.51 | % | | | 24.46 | %(j) |
| Expenses, net of fees waived/expenses reimbursed by investment adviser | | | 1.99 | %(j) | | | 1.99 | % | | | 1.99 | %(j) |
| Net investment income | | | 3.57 | %(j) | | | 3.21 | % | | | 2.54 | %(j) |
| | | | | | | | | | | | | |
| PORTFOLIO TURNOVER RATE | | | 5 | %(k) | | | 91 | % | | | 4 | %(k) |
(a) | With the approval of the Board, effective September 30, 2015, the Fund's fiscal year end was changed from February 28 to September 30 (See Note 1). |
(b) | The Fund's Class A commenced operations on March 12, 2013. |
(c) | Per share numbers have been calculated using the average shares method. |
(d) | Recognition of net investment income is affected by timing and declaration of dividends by underlying investment companies. |
(e) | Realized and unrealized losses per share do not correlate to the aggregate of the net realized and unrealized gains on the Statement of Operations for the period ended February 28, 2014, primarily due to the timing of sales and repurchases of the Fund's shares in relation to fluctuating market values for the Fund's portfolio. |
(f) | Amount is less than $0.005 |
(g) | Total returns shown are historical in nature and assume changes in share price, reinvestment of dividends and capital gains distribution, if any. Had the Adviser not absorbed a portion of Fund expenses, total returns would have been lower. Total returns for periods less than one year are not annualized. |
(h) | Includes adjustments in accordance with accounting principles generally accepted in the United States of America and as such, the new asset values for financial reporting purposes and the returns based upon those net asset values may differ from net asset values and returns for shareholder transactions. |
(i) | Ratios do not include expenses of underlying investment companies in which the Fund invests. |
| See Notes to Financial Statements. | |
| Resource Real Estate Diversified Income Fund – Class C | Financial Highlights |
| For a Share Outstanding Throughout the Periods Presented |
| | | For the Period Ended September 30, 2015(a) | | | For the Period Ended February 28, 2015(b) | |
| NET ASSET VALUE, BEGINNING OF PERIOD | | $ | 10.50 | | | $ | 10.06 | |
| | | | | | | | | |
| INCOME FROM INVESTMENT OPERATIONS | | | | | | | | |
Net investment income(c)(d) | | | 0.18 | | | | 0.14 | |
| Net realized and unrealized gain/(loss) on investments | | | (0.48 | ) | | | 0.58 | |
| Total income/(loss) from investment operations | | | (0.30 | ) | | | 0.72 | |
| | | | | | | | | |
| DISTRIBUTIONS TO SHAREHOLDERS | | | | | | | | |
| From net investment income | | | (0.14 | ) | | | (0.20 | ) |
| From net realized gain on investments | | | (0.03 | ) | | | (0.05 | ) |
| From return of capital | | | (0.22 | ) | | | (0.03 | ) |
| Total distributions | | | (0.39 | ) | | | (0.28 | ) |
| INCREASE/DECREASE IN NET ASSET VALUE | | | (0.69 | ) | | | 0.44 | |
| NET ASSET VALUE, END OF PERIOD | | $ | 9.81 | | | $ | 10.50 | |
| | | | | | | | | |
TOTAL RETURN(e) | | | (2.86 | )%(f) | | | 7.33 | % |
| | | | | | | | | |
| RATIOS AND SUPPLEMENTAL DATA | | | | | | | | |
| Net assets, end of period (in 000s) | | $ | 13,436 | | | $ | 3,732 | |
| | | | | | | | | |
| RATIOS TO AVERAGE NET ASSETS | | | | | | | | |
Including interest expense:(g) | | | | | | | | |
| Expenses, gross | | | 4.04 | %(h) | | | 6.37 | %(h) |
| Expenses, net of fees waived/expenses reimbursed by investment adviser | | | 2.99 | %(h) | | | 3.04 | %(h) |
Excluding interest expense:(g) | | | | | | | | |
| Expenses, gross | | | 3.79 | %(h) | | | 6.07 | %(h) |
| Expenses, net of fees waived/expenses reimbursed by investment adviser | | | 2.74 | %(h) | | | 2.74 | %(h) |
| Net investment income | | | 2.97 | %(h) | | | 2.34 | %(h) |
| | | | | | | | | |
| PORTFOLIO TURNOVER RATE | | | 5 | %(i) | | | 91 | %(i) |
(a) | With the approval of the Board, effective September 30, 2015, the Fund's fiscal year end was changed from February 28 to September 30 (See Note 1). |
(b) | The Fund's Class C commenced operations on August 1, 2014. |
(c) | Per share numbers have been calculated using the average shares method. |
(d) | Recognition of net investment income is affected by timing and declaration of dividends by underlying investment companies. |
(e) | Total returns shown are historical in nature and assume changes in share price, reinvestment of dividends and capital gains distribution, if any. Had the Adviser not absorbed a portion of Fund expenses, total returns would have been lower. Total returns for periods less than one year are not annualized. |
(f) | Includes adjustments in accordance with accounting principles generally accepted in the United States of America and as such, the new asset values for financial reporting purposes and the returns based upon those net asset values may differ from net asset values and returns for shareholder transactions. |
(g) | Ratios do not include expenses of underlying investment companies in which the Fund invests. |
| See Notes to Financial Statements. | | |
| Annual Report | September 30, 2015 | | 17 |
| Resource Real Estate Diversified Income Fund – Class W | Financial Highlights |
| For a Share Outstanding Throughout the Periods Presented |
| | | For the Period Ended September 30, 2015(a) | | | For the Period Ended February 28, 2015(b) | |
| NET ASSET VALUE, BEGINNING OF PERIOD | | $ | 10.67 | | | $ | 10.18 | �� |
| | | | | | | | | |
| INCOME FROM INVESTMENT OPERATIONS | | | | | | | | |
Net investment income(c)(d) | | | 0.20 | | | | 0.03 | |
| Net realized and unrealized gain/(loss) on investments | | | (0.49 | ) | | | 0.46 | |
| Total income/(loss) from investment operations | | | (0.29 | ) | | | 0.49 | |
| | | | | | | | | |
| DISTRIBUTIONS TO SHAREHOLDERS | | | | | | | | |
| From net investment income | | | (0.15 | ) | | | – | |
| From net realized gain on investments | | | (0.03 | ) | | | – | |
| From return of capital | | | (0.24 | ) | | | – | |
| Total distributions | | | (0.42 | ) | | | – | |
| INCREASE/DECREASE IN NET ASSET VALUE | | | (0.71 | ) | | | 0.49 | |
| NET ASSET VALUE, END OF PERIOD | | $ | 9.96 | | | $ | 10.67 | |
| | | | | | | | | |
TOTAL RETURN(e) | | | (2.79 | )%(f) | | | 4.81 | %(f) |
| | | | | | | | | |
| RATIOS AND SUPPLEMENTAL DATA | | | | | | | | |
| Net assets, end of period (in 000s) | | $ | 11,421 | | | $ | 1,211 | |
| | | | | | | | | |
| RATIOS TO AVERAGE NET ASSETS | | | | | | | | |
Including interest expense:(g) | | | | | | | | |
| Expenses, gross | | | 3.78 | %(h) | | | 11.30 | %(h) |
| Expenses, net of fees waived/expenses reimbursed by investment adviser | | | 2.74 | %(h) | | | 2.79 | %(h) |
Excluding interest expense:(g) | | | | | | | | |
| Expenses, gross | | | 3.53 | %(h) | | | 11.00 | %(h) |
| Expenses, net of fees waived/expenses reimbursed by investment adviser | | | 2.49 | %(h) | | | 2.49 | %(h) |
| Net investment income | | | 3.28 | %(h) | | | 1.31 | %(h) |
| | | | | | | | | |
| PORTFOLIO TURNOVER RATE | | | 5 | %(i) | | | 91 | %(i) |
(a) | With the approval of the Board, effective September 30, 2015, the Fund's fiscal year end was changed from February 28 to September 30 (See Note 1). |
(b) | The Fund's Class W commenced operations on November 24, 2014. |
(c) | Per share numbers have been calculated using the average shares method. |
(d) | Recognition of net investment income is affected by timing and declaration of dividends by underlying investment companies. |
(e) | Total returns shown are historical in nature and assume changes in share price, reinvestment of dividends and capital gains distribution, if any. Had the Adviser not absorbed a portion of Fund expenses, total returns would have been lower. Total returns for periods less than one year are not annualized. |
(f) | Includes adjustments in accordance with accounting principles generally accepted in the United States of America and as such, the new asset values for financial reporting purposes and the returns based upon those net asset values may differ from net asset values and returns for shareholder transactions. |
(g) | Ratios do not include expenses of underlying investment companies in which the Fund invests. |
| See Notes to Financial Statements. | |
| Resource Real Estate Diversified Income Fund – Class I | Financial Highlights |
| For a Share Outstanding Throughout the Periods Presented |
| | | | | | | | |
| | | For the Period Ended September 30, 2015(a) | | For the Period Ended February 28, 2015(b) | |
| NET ASSET VALUE, BEGINNING OF PERIOD | | $ | 10.79 | | $ | 10.06 | |
| | | | | | | | |
| INCOME FROM INVESTMENT OPERATIONS | | | | | | | |
Net investment income(c)(d) | | | 0.27 | | | 0.14 | |
| Net realized and unrealized gain/(loss) on investments | | | (0.54 | ) | | 0.59 | |
| Total income/(loss) from investment operations | | | (0.27 | ) | | 0.73 | |
| | | | | | | | |
| DISTRIBUTIONS TO SHAREHOLDERS | | | | | | | |
| From net investment income | | | (0.04 | ) | | – | |
| From net realized gain on investments | | | (0.03 | ) | | – | |
| From return of capital | | | (0.09 | ) | | – | |
| Total distributions | | | (0.16 | ) | | – | |
| INCREASE/DECREASE IN NET ASSET VALUE | | | (0.43 | ) | | 0.73 | |
| NET ASSET VALUE, END OF PERIOD | | $ | 10.36 | | $ | 10.79 | |
| | | | | | | | |
TOTAL RETURN(e) | | | (2.51 | )%(f) | | 7.26 | % |
| | | | | | | | |
| RATIOS AND SUPPLEMENTAL DATA | | | | | | | |
| Net assets, end of period (in 000s) | | $ | 49 | | $ | 0 | (g) |
| | | | | | | | |
| RATIOS TO AVERAGE NET ASSETS | | | | | | | |
Including interest expense:(h) | | | | | | | |
| Expenses, gross | | | 2.96 | %(i) | | 3.94 | %(i) |
| Expenses, net of fees waived/expenses reimbursed by investment adviser | | | 1.99 | %(i) | | 2.08 | %(i) |
Excluding interest expense:(h) | | | | | | | |
| Expenses, gross | | | 2.71 | %(i) | | 3.60 | %(i) |
| Expenses, net of fees waived/expenses reimbursed by investment adviser | | | 1.74 | %(i) | | 1.74 | %(i) |
| Net investment income | | | 4.46 | %(i) | | 2.36 | %(i) |
| | | | | | | | |
| PORTFOLIO TURNOVER RATE | | | 5 | %(j) | | 91 | %(j) |
(a) | With the approval of the Board, effective September 30, 2015, the Fund's fiscal year end was changed from February 28 to September 30 (See Note 1). |
(b) | The Fund's Class I commenced operations on August 1, 2014. |
(c) | Per share numbers have been calculated using the average shares method. |
(d) | Recognition of net investment income is affected by timing and declaration of dividends by underlying investment companies. |
(e) | Total returns shown are historical in nature and assume changes in share price, reinvestment of dividends and capital gains distribution, if any. Had the Adviser not absorbed a portion of Fund expenses, total returns would have been lower. Total returns for periods less than one year are not annualized. |
(f) | Includes adjustments in accordance with accounting principles generally accepted in the United States of America and as such, the new asset values for financial reporting purposes and the returns based upon those net asset values may differ from net asset values and returns for shareholder transactions. |
(g) | Amount less than $1,000. As of February 28, 2015, the actual net assets were $21. |
(h) | Ratios do not include expenses of underlying investment companies in which the Fund invests. |
| See Notes to Financial Statements. | |
| Annual Report | September 30, 2015 | 19 |
| Resource Real Estate Diversified Income Fund – Class U | Financial Highlights |
| For a Share Outstanding Throughout the Periods Presented |
| | | | | | | | |
| | | | For the Period Ended September 30, 2015(a) | | | For the Period Ended February 28, 2015(b) | |
| NET ASSET VALUE, BEGINNING OF PERIOD | | $ | 10.52 | | $ | 10.57 | |
| | | | | | | | |
| INCOME FROM INVESTMENT OPERATIONS | | | | | | | |
Net investment income(c)(d) | | | 0.27 | | | 0.00 | (e) |
| Net realized and unrealized loss on investments | | | (0.52 | ) | | (0.05 | )(f) |
| Total loss from investment operations | | | (0.25 | ) | | (0.05 | ) |
| | | | | | | | |
| DISTRIBUTIONS TO SHAREHOLDERS | | | | | | | |
| From net investment income | | | (0.17 | ) | | – | |
| From net realized gain on investments | | | (0.03 | ) | | – | |
| From return of capital | | | (0.25 | ) | | – | |
| Total distributions | | | (0.45 | ) | | – | |
| DECREASE IN NET ASSET VALUE | | | (0.70 | ) | | (0.05 | ) |
| NET ASSET VALUE, END OF PERIOD | | $ | 9.82 | | $ | 10.52 | |
| | | | | | | | |
TOTAL RETURN(g) | | | (2.40 | )%(h) | | (0.47 | )% |
| | | | | | | | |
| RATIOS AND SUPPLEMENTAL DATA | | | | | | | |
| Net assets, end of period (in 000s) | | $ | 61 | | $ | 2 | |
| | | | | | | | |
| RATIOS TO AVERAGE NET ASSETS | | | | | | | |
Including interest expense:(i) | | | | | | | |
| Expenses, gross | | | 3.42 | %(j) | | 7.74 | %(j) |
| Expenses, net of fees waived/expenses reimbursed by investment adviser | | | 2.24 | %(j) | | 2.28 | %(j) |
Excluding interest expense:(i) | | | | | | | |
| Expenses, gross | | | 3.17 | %(j) | | 7.45 | %(j) |
| Expenses, net of fees waived/expenses reimbursed by investment adviser | | | 1.99 | %(j) | | 1.99 | %(j) |
| Net investment income | | | 4.64 | %(j) | | 0.97 | %(j) |
| | | | | | | | |
| PORTFOLIO TURNOVER RATE | | | 5 | %(k) | | 91 | %(k) |
(a) | With the approval of the Board, effective September 30, 2015, the Fund's fiscal year end was changed from February 28 to September 30 (See Note 1). |
(b) | The Fund's Class U commenced operations on February 13, 2015. |
(c) | Per share numbers have been calculated using the average shares method. |
(d) | Recognition of net investment income is affected by timing and declaration of dividends by underlying investment companies. |
(e) | Amount is less than $0.005 |
(f) | Realized and unrealized losses per share do not correlate to the aggregate of the net realized and unrealized gains on the Statement of Operations for the period ended February 28, 2015, primarily due to the timing of sales and repurchases of the Fund's shares in relation to fluctuating market values for the Fund's portfolio. |
(g) | Total returns shown are historical in nature and assume changes in share price, reinvestment of dividends and capital gains distribution, if any. Had the Adviser not absorbed a portion of Fund expenses, total returns would have been lower. Total returns for periods less than one year are not annualized. |
(h) | Includes adjustments in accordance with accounting principles generally accepted in the United States of America and as such, the new asset values for financial reporting purposes and the returns based upon those net asset values may differ from net asset values and returns for shareholder transactions. |
(i) | Ratios do not include expenses of underlying investment companies in which the Fund invests. |
| See Notes to Financial Statements. | |
| Resource Real Estate Diversified Income Fund – Class T | Financial Highlights |
| For a Share Outstanding Throughout the Periods Presented |
| | | For the Period Ended September 30, 2015(a) | | For the Period Ended February 28, 2015(b) | |
| NET ASSET VALUE, BEGINNING OF PERIOD | | $ | 10.50 | | $ | 10.55 | |
| | | | | | | | |
| INCOME FROM INVESTMENT OPERATIONS | | | | | | | |
Net investment income(c)(d) | | | 0.22 | | | 0.00 | (e) |
| Net realized and unrealized loss on investments | | | (0.53 | ) | | (0.05 | )(f) |
| Total loss from investment operations | | | (0.31 | ) | | (0.05 | ) |
| | | | | | | | |
| DISTRIBUTIONS TO SHAREHOLDERS | | | | | | | |
| From net investment income | | | (0.14 | ) | | – | |
| From net realized gain on investments | | | (0.03 | ) | | – | |
| From return of capital | | | (0.22 | ) | | – | |
| Total distributions | | | (0.39 | ) | | – | |
| DECREASE IN NET ASSET VALUE | | | (0.70 | ) | | (0.05 | ) |
| NET ASSET VALUE, END OF PERIOD | | $ | 9.80 | | $ | 10.50 | |
| | | | | | | | |
TOTAL RETURN(g) | | | (2.96 | )%(h) | | (0.47 | )% |
| | | | | | | | |
| RATIOS AND SUPPLEMENTAL DATA | | | | | | | |
| Net assets, end of period (in 000s) | | $ | 447 | | $ | 2 | |
| | | | | | | | |
| RATIOS TO AVERAGE NET ASSETS | | | | | | | |
Including interest expense:(i) | | | | | | | |
| Expenses, gross | | | 4.10 | %(j) | | 8.49 | %(j) |
| Expenses, net of fees waived/expenses reimbursed by investment adviser | | | 2.99 | %(j) | | 3.03 | %(j) |
Excluding interest expense:(i) | | | | | | | |
| Expenses, gross | | | 3.85 | %(j) | | 8.20 | %(j) |
| Expenses, net of fees waived/expenses reimbursed by investment adviser | | | 2.74 | %(j) | | 2.74 | %(j) |
| Net investment income | | | 3.87 | %(j) | | 0.22 | %(j) |
| | | | | | | | |
| PORTFOLIO TURNOVER RATE | | | 5 | %(k) | | 91 | %(k) |
(a) | With the approval of the Board, effective September 30, 2015, the Fund's fiscal year end was changed from February 28 to September 30 (See Note 1). |
(b) | The Fund's Class T commenced operations on February 13, 2015. |
(c) | Per share numbers have been calculated using the average shares method. |
(d) | Recognition of net investment income is affected by timing and declaration of dividends by underlying investment companies. |
(e) | Amount is less than $0.005 |
(f) | Realized and unrealized losses per share do not correlate to the aggregate of the net realized and unrealized gains on the Statement of Operations for the period ended February 28, 2015, primarily due to the timing of sales and repurchases of the Fund's shares in relation to fluctuating market values for the Fund's portfolio. |
(g) | Total returns shown are historical in nature and assume changes in share price, reinvestment of dividends and capital gains distribution, if any. Had the Adviser not absorbed a portion of Fund expenses, total returns would have been lower. Total returns for periods less than one year are not annualized. |
(h) | Includes adjustments in accordance with accounting principles generally accepted in the United States of America and as such, the new asset values for financial reporting purposes and the returns based upon those net asset values may differ from net asset values and returns for shareholder transactions. |
(i) | Ratios do not include expenses of underlying investment companies in which the Fund invests. |
| See Notes to Financial Statements. | |
| Annual Report | September 30, 2015 | 21 |
| Resource Real Estate Diversified Income Fund – Class D | Financial Highlights |
| For a Share Outstanding Throughout the Periods Presented |
| | | | | | | | |
| | | For the Period Ended September 30, 2015(a) | | For the Period Ended February 28, 2015(b) | |
| NET ASSET VALUE, BEGINNING OF PERIOD | | $ | 10.67 | | $ | 10.72 | |
| | | | | | | | |
| INCOME FROM INVESTMENT OPERATIONS | | | | | | | |
Net investment income(c)(d) | | | 0.24 | | | 0.00 | (e) |
| Net realized and unrealized loss on investments | | | (0.52 | ) | | (0.05 | )(f) |
| Total loss from investment operations | | | (0.28 | ) | | (0.05 | ) |
| | | | | | | | |
| DISTRIBUTIONS TO SHAREHOLDERS | | | | | | | |
| From net investment income | | | (0.15 | ) | | – | |
| From net realized gain on investments | | | (0.03 | ) | | – | |
| From return of capital | | | (0.24 | ) | | – | |
| Total distributions | | | (0.42 | ) | | – | |
| DECREASE IN NET ASSET VALUE | | | (0.70 | ) | | (0.05 | ) |
| NET ASSET VALUE, END OF PERIOD | | $ | 9.97 | | $ | 10.67 | |
| | | | | | | | |
TOTAL RETURN(g) | | | (2.69 | )%(h) | | (0.47 | )% |
| | | | | | | | |
| RATIOS AND SUPPLEMENTAL DATA | | | | | | | |
| Net assets, end of period (in 000s) | | $ | 2,131 | | $ | 2 | |
| | | | | | | | |
| RATIOS TO AVERAGE NET ASSETS | | | | | | | |
Including interest expense:(i) | | | | | | | |
| Expenses, gross | | | 3.85 | %(j) | | 8.19 | %(j) |
| Expenses, net of fees waived/expenses reimbursed by investment adviser | | | 2.74 | %(j) | | 2.78 | %(j) |
Excluding interest expense:(i) | | | | | | | |
| Expenses, gross | | | 3.60 | %(j) | | 7.90 | %(j) |
| Expenses, net of fees waived/expenses reimbursed by investment adviser | | | 2.49 | %(j) | | 2.49 | %(j) |
| Net investment income | | | 4.13 | %(j) | | 0.47 | %(j) |
| | | | | | | | |
| PORTFOLIO TURNOVER RATE | | | 5 | %(k) | | 91 | %(k) |
(a) | With the approval of the Board, effective September 30, 2015, the Fund's fiscal year end was changed from February 28 to September 30 (See Note 1). |
(b) | The Fund's Class D commenced operations on February 13, 2015. |
(c) | Per share numbers have been calculated using the average shares method. |
(d) | Recognition of net investment income is affected by timing and declaration of dividends by underlying investment companies. |
(e) | Amount is less than $0.005 |
(f) | Realized and unrealized losses per share do not correlate to the aggregate of the net realized and unrealized gains on the Statement of Operations for the period ended February 28, 2015, primarily due to the timing of sales and repurchases of the Fund's shares in relation to fluctuating market values for the Fund's portfolio. |
(g) | Total returns shown are historical in nature and assume changes in share price, reinvestment of dividends and capital gains distribution, if any. Had the Adviser not absorbed a portion of Fund expenses, total returns would have been lower. Total returns for periods less than one year are not annualized. |
(h) | Includes adjustments in accordance with accounting principles generally accepted in the United States of America and as such, the new asset values for financial reporting purposes and the returns based upon those net asset values may differ from net asset values and returns for shareholder transactions. |
(i) | Ratios do not include expenses of underlying investment companies in which the Fund invests. |
| See Notes to Financial Statements. | |
| Resource Real Estate Diversified Income Fund | Notes to Financial Statements |
Resource Real Estate Diversified Income Fund (the "Trust" or the "Fund") was organized as a Delaware statutory trust on August 1, 2012 and is registered under the Investment Company Act of 1940, as amended (the "1940 Act"), as a diversified, closed‐end management investment company that operates as an interval fund with a continuous offering of Fund shares. The Fund's investment adviser is Resource Real Estate Inc. (the "Adviser").The Fund's primary investment objective is to produce current income, with a secondary objective to achieve a long‐term capital appreciation with moderate volatility and low to moderate correlation to the broader equity markets. The Fund pursues its investment objectives by investing, under normal circumstances, at least 80% of assets (defined in net assets plus the amount of any borrowing for investment purposes) in real estate and real estate related industry securities, primarily in income producing equity and debt securities.
The Fund currently offers Class A, Class C, Class W, Class I, Class U, Class T and Class D shares. Class A shares commenced operations on March 12, 2013, Class C and Class I shares commenced operations on August 1, 2014, Class W shares commenced operations on November 24, 2014 and Class U, Class T and Class D shares commenced operations on February 13, 2015. With the approval of the Board, effective September 30, 2015, the Fund's fiscal year end was changed from February 28 to September 30. Class W, Class I and Class D shares are offered at net asset value. Class A and Class U shares are offered at net asset value plus a maximum sales charge of 6.50% and may also be subject to a 0.50% early withdrawal charge, which will be deducted from repurchase proceeds, for shareholders tendering shares fewer than 365 days after the original purchase date, if (i) the original purchase was for amounts of $1 million or more and (ii) the selling broker received the reallowance of the dealer‐manager fee. Class C and Class T shares are offered at net asset value plus a maximum sales charge of 1.50% and may also be subject to a 1.00% early withdrawal charge, which will be deducted from repurchase proceeds, for shareholders tendering shares fewer than 365 days after the original purchase date. Each class represents an interest in the same assets of the Fund and classes are identical except for differences in their sales charge structures and ongoing service and distribution charges. All classes of shares have equal voting privileges except that each class has exclusive voting rights with respect to its service and/or distribution plans. The Fund's income, expenses (other than class specific distribution fees) and realized and unrealized gains and losses are allocated proportionately each day based upon the relative net assets of each class.
| 2. SIGNIFICANT ACCOUNTING POLICIES |
The following is a summary of significant accounting policies followed by the Fund in preparation of its financial statements. These policies are in conformity with accounting principles generally accepted in the United States of America ("GAAP"). The Fund is considered an investment company for financial reporting purposes under GAAP. The preparation of financial statements requires management to make estimates and assumptions that affect the reported amounts of assets and liabilities and disclosure of contingent assets and liabilities at the date of the financial statements and the reported amounts of income and expenses for the period. Actual results could differ from those estimates.
Security Valuation – Securities listed on an exchange are valued at the last reported sale price at the close of the regular trading session of the exchange on the business day the value is being determined, or in the case of securities listed on NASDAQ, at the NASDAQ Official Closing Price ("NOCP"). In the absence of a sale, such securities shall be valued at the last bid price. Futures are valued based on their daily settlement value. Short‐term investments that mature in 60 days or less may be valued at amortized cost, provided such valuations represent fair value.
When price quotations for certain securities are not readily available, or if the available quotations are not believed to be reflective of market value by the Adviser, those securities will be valued at "fair value" as determined in good faith by the Valuation Committee using procedures adopted by and under the supervision of the Fund's Board of Trustees (the "Board"). There can be no assurance that the Fund could purchase or sell a portfolio security at the price used to calculate the Fund's net asset value ("NAV").
Fair valuation procedures may be used to value a substantial portion of the assets of the Fund. The Fund may use the fair value of a security to calculate its NAV when, for example, (1) a portfolio security is not traded in a public market or the principal market in which the security trades is closed, (2) trading in a portfolio security is suspended and not resumed prior to the normal market close, (3) a portfolio security is not traded in significant volume for a substantial period, or (4) the Adviser determines that the quotation or price for a portfolio security provided by a broker‐dealer or independent pricing service is inaccurate.
The "fair value" of securities may be difficult to determine and thus judgment plays a greater role in the valuation process. The fair valuation methodology may include or consider the following guidelines, as appropriate: (1) evaluation of all relevant factors, including but not limited to, pricing history, current market level, supply and demand of the respective security; (2) comparison to the values and current pricing of securities that have comparable characteristics; (3) knowledge of historical market information with respect to the security; (4) other factors relevant to the security which would include, but not be limited to, duration, yield, fundamental analytical data, the Treasury yield curve and credit quality.
| Annual Report | September 30, 2015 | 23 |
| Resource Real Estate Diversified Income Fund | Notes to Financial Statements |
Valuation of Private REITS – The Fund invests a large portion of its assets in Private Real Estate Investment Trusts ("Private REITs"). The Private REITs measure their investment assets at fair value, and report a NAV per share on a calendar quarter basis. In accordance with Accounting Standards Codification ("ASC") 820, the Fund has elected to apply the practical expedient and to value its investments in Private REITs at their respective NAVs at each quarter. For non‐calendar quarter days, the Valuation Committee estimates the fair value of each Private REIT by adjusting the most recent NAV for each REIT, as necessary, by the change in a relevant benchmark that the Valuation Committee has deemed to be representative of the entire Private REIT market.
Valuation of Public Non‐Traded REITS – The Fund also invests a large portion of its assets in Public Non‐Traded Real Estate Investment Trusts ("Public Non‐Traded REITs"). The Public Non‐Traded REITs do not timely report periodic NAVs and therefore cannot be valued using the practical expedient. The Valuation Committee determines the fair value of Public Non‐Traded REITs by considering various factors such as the most recent published NAV, the transaction price, secondary market trades, shareholder redemption and dividend reinvestment programs, discounted cash flows and potentially illiquidity discounts.
Fair Value Measurements – A three‐tier hierarchy has been established to classify fair value measurements for disclosure purposes. Inputs refer broadly to the assumptions that market participants would use in pricing the asset or liability, including assumptions about risk. Inputs may be observable or unobservable. Observable inputs are inputs that reflect the assumptions market participants would use in pricing the asset or liability that are developed based on market data obtained from sources independent of the reporting entity. Unobservable inputs are inputs that reflect the reporting entity's own assumptions about the assumptions market participants would use in pricing the asset or liability that are developed based on the best information available. In accordance with the authoritative guidance on fair value measurements and disclosure under GAAP, the Fund discloses fair value of it's investments in a hierarchy that prioritizes the inputs to valuation techniques used to measure the fair value.
Various inputs are used in determining the value of the Fund's investments as of the reporting period end. These inputs are categorized in the following hierarchy under applicable financial accounting standards:
| Level 1 | – | Unadjusted quoted prices in active markets for identical, unrestricted assets or liabilities that the Fund has the ability to access at the measurement date; |
| | | |
| Level 2 | – | Quoted prices which are not active, quoted prices for similar assets or liabilities in active markets or inputs other than quoted prices that are observable (either directly or indirectly) for substantially the full term of the asset or liability at the measurement date; and |
| | | |
| Level 3 | – | Significant unobservable prices or inputs (including the Fund's own assumptions in determining the fair value of investments) where there is little or no market activity for the asset or liability at the measurement date. |
The availability of observable inputs can vary from security to security and is affected by a wide variety of factors, including, for example, the type of security, whether the security is new and not yet established in the marketplace, the liquidity of markets and other characteristics particular to the security. To the extent that valuation is based on models or inputs that are less observable or unobservable in the market, the determination of fair value requires more judgment. Accordingly, the degree of judgment exercised in determining fair value is greatest for instruments categorized in Level 3.
An investment level within the fair value hierarchy is based on the lowest level input, individually or in the aggregate, that is significant to fair value measurement. The valuation techniques used by the Fund to measure fair value during the period ended September 30, 2015 maximized the use of observable inputs and minimized the use of unobservable inputs.
| Resource Real Estate Diversified Income Fund | Notes to Financial Statements |
The inputs or methodologies used for valuing securities are not necessarily an indication of the risk or liquidity associated with investing in those securities. The following is a summary of the inputs used in valuing the Fund's investments as of September 30, 2015:
| Investments in Securities at Value | | Level 1 | | | Level 2 | | | Level 3 | | | Total | |
| Bonds & Notes | | | | | | | | | | | | |
| Asset Backed Securities | | $ | – | | | $ | – | | | $ | 1,414,140 | | | $ | 1,414,140 | |
| Commercial Mortgage Backed Securities | | | – | | | | 6,415,566 | | | | 5,365,278 | | | | 11,780,844 | |
Common Stocks(a) | | $ | 2,731,901 | | | $ | – | | | $ | – | | | $ | 2,731,901 | |
Preferred Stocks(a) | | | 3,480,092 | | | | – | | | | – | | | | 3,480,092 | |
Real Estate Investment Trusts ‐ Common Stocks Public Non‐Traded Real Estate Investment Trusts | | | 6,179,530 | | | | – | | | | 7,518,732 | | | | 13,698,262 | |
| Private Real Estate Investment Trusts | | | – | | | | – | | | | 616,000 | | | | 616,000 | |
Private Real Estate Investment Trusts (Measured at net asset value)(b) | | | – | | | | – | | | | – | | | | 12,595,906 | |
| Traded Real Estate Investment Trusts | | | 29,318,909 | | | | – | | | | – | | | | 29,318,909 | |
| Short Term Investments | | | 109,363 | | | | – | | | | – | | | | 109,363 | |
| TOTAL | | $ | 41,819,795 | | | $ | 6,415,566 | | | $ | 14,914,150 | | | $ | 75,745,417 | |
| Other Financial Instruments | | Level 1 | | | Level 2 | | | Level 3 | | | Total | |
| Futures Contracts | | $ | 24,884 | | | $ | – | | | $ | – | | | $ | 24,884 | |
| TOTAL | | $ | 24,884 | | | $ | – | | | $ | – | | | $ | 24,884 | |
(a) | For detailed descriptions, see the accompanying Portfolio of Investments. |
(b) | In accordance with Subtopic 820-10, certain investments that are measured at fair value using the net asset value per share (or its equivalent) practical ixedient have not been classified in the fair value hierarchy. The fair value amounts presented in this table are intended to permit reconciliation of the fair value hierarchy to the amounts presented in the Statement of Assets and Liabilities. |
There were no transfers between Levels 1, 2 and 3 during the period ended September 30, 2015. It is the Fund's policy to recognize transfers between levels at the end of the reporting period.
The following is a reconciliation of assets in which Level 3 inputs were used in determining value:
| Investments in Securities | | Balance as of February 28, 2015 | | Accrued discount/ premium | | Return of Capital | | Realized Gain/(Loss) | | Change in Unrealized Appreciation/(Depreciation) | | Purchases | | Sales Proceeds | | Transfer into Level 3 | | Transfer out of Level 3 | | Balance as of September 30, 2015 | | Net change in unrealized appreciation (depreciation) included in the Statements of Operations attributable to Level 3 investments held at September 30, 2015 |
| Resource Real Estate Diversified Income Fund | | | | | | | | | | | | | | | | | | | | | | |
| Bonds & Notes | | $ | 3,019,775 | | $ | 10,649 | | $ | – | | $ | 80,652 | | $ | (3,413 | ) | $ | 6,062,330 | | $ | (2,390,575 | ) | $ | – | | $ | – | | $ | 6,779,418 | | $ | 7,866 |
| Real Estate Investment Trusts ‐ Common Stock | | | 4,981,668 | | | – | | | (300,935 | ) | | – | | | 379,492 | | | 6,305,948 | | | – | | | – | | | (3,231,441 | ) | | 8,134,732 | | | 240,470 |
| Total | | $ | 8,001,443 | | $ | 10,649 | | $ | (300,935 | ) | $ | 80,652 | | $ | 376,079 | | $ | 12,368,278 | | $ | (2,390,575 | ) | $ | – | | $ | (3,231,441 | ) | $ | 14,914,150 | | $ | 248,336 |
| Annual Report | September 30, 2015 | 25 |
| Resource Real Estate Diversified Income Fund | Notes to Financial Statements |
Significant unobservable valuation inputs for material Level 3 investments as of September 30, 2015 are as follows:
| | | Fair Value at 9/30/2015 | | Valuation Technique | | Unobservable Input | | Range (Weighted Average) | |
| Asset Backed Securities | | $ | 6,779,418 | | Transaction Data | | N/A | | N/A | |
| Private Real Estate Investment Trusts | | $ | 616,000 | | Net Asset Value adjusted as necessary for any changes in market conditions | | N/A | | N/A | |
| Non‐Traded Real Estate | | | | | | | | | | |
| Investment Trusts | | $ | 7,518,732 | | Transaction Data | | Secondary Market Prices Weighting of Transaction Prices | | $2.50 ‐ $9.10 | |
| | | | | | Discounted Cash Flows | | by Volume(a) | | 20% | |
| | | | | | | | Discounted Rate | | 3% ‐ 14% | |
(a) | Represents amounts used when the reporting entity has determined that market participant would use such multiples when pricing the investments. |
A change to the unobservable input may result in a significant change to the value of the investment as follows:
| Unobservable Input | Impact to Value if Input Increases | Impact to Value if Input Decreases |
| Secondary Market Prices | Increase | Decrease |
| Weighting Transaction Prices by Volume | Increase | Decrease |
| Discounted Rate | Decrease | Increase |
Security Transactions and Investment Income – Investment security transactions are accounted for on a trade date basis. Cost is determined and gains and losses are based upon the specific identification method for both financial statement and federal income tax purposes. Dividend income is recorded on the ex‐dividend date and interest income is recorded on the accrual basis. Purchase discounts and premiums on securities are accreted and amortized over the life of the respective securities.
Industry Concentration – If a Fund has significant investments in the securities of issuers within a particular industry, any development affecting that industry will have a greater impact on the value of the net assets of the Fund than would be the case if the Fund did not have significant investments in that industry. In addition, this may increase the risk of loss in the Fund and increase the volatility of the Fund's net asset value per share. Occasionally, market conditions, regulatory changes or other developments may negatively impact this industry, and therefore the value of the Fund's portfolio will be adversely affected. As of September 30, 2015, the Fund had 91.94% of the value of its net assets invested within the Real Estate industry.
Concentration of Credit Risk – The Fund places its cash with one banking institution, which is insured by Federal Deposit Insurance Corporation (FDIC). The FDIC limit is $250,000. At various times throughout the year, the amount on deposit may exceed the FDIC limit and subject the Fund to a credit risk. The Fund does not believe that such deposits are subject to any unusual risk associated with investment activities.
Federal and Other Taxes – No provision for income taxes is included in the accompanying financial statements, as the Fund intends to distribute to shareholders all taxable investment income and realized gains and otherwise comply with Subchapter M of the Internal Revenue Code of 1986, as amended, applicable to regulated investment companies.
The Fund evaluates tax positions taken (or expected to be taken) in the course of preparing the Fund's tax provisions to determine whether these positions meet a "more‐likely‐than‐not" standard that, based on the technical merits, have a more than fifty percent likelihood of being sustained by a taxing authority upon examination. A tax position that meets the "more‐likely‐than‐not" recognition threshold is measured to determine the amount of benefit to recognize in the financial statements.
As of and during the period ended September 30, 2015, the Fund did not have a liability for any unrecognized tax benefits. The Fund files U.S. federal, state and local tax returns as required. The Fund's tax returns are subject to examination by the relevant tax authorities until expiration of the applicable statute of limitations which is generally three years after the filing of the tax return for federal purposes and four years for most state returns. Tax returns for open years have incorporated no uncertain tax positions that require a provision for income taxes.
Foreign Currency – The accounting records of the Fund are maintained in U.S. dollars. Investment securities and other assets and liabilities denominated in a foreign currency and income receipts and expense payments are translated into U.S. dollars using the prevailing exchange rate at the London market close. Purchases and sales of securities are translated into U.S. dollars at the contractual currency rates established at the approximate time of the trade. Net realized gains and losses on foreign currency transactions represent net gains and losses from currency realized between the trade and settlement dates on securities transactions and the difference between income accrued versus income received. The effects of changes in foreign currency exchange rates on investments in securities are included with the net realized and unrealized gain or loss on investment securities.
| Resource Real Estate Diversified Income Fund | Notes to Financial Statements |
Distributions to Shareholders – Distributions from investment income are declared and paid quarterly. Distributions from net realized capital gains, if any, are declared and paid annually and are recorded on the ex‐dividend date. The character of income and gains to be distributed is determined in accordance with income tax regulations, which may differ from GAAP.
Indemnification – The Trust indemnifies its officers and Trustees for certain liabilities that may arise from the performance of their duties to the Trust. Additionally, in the normal course of business, the Fund enters into contracts that contain a variety of representations and warranties and which provide general indemnities. The Fund's maximum exposure under these arrangements is unknown, as this would involve future claims that may be made against the Fund that have not yet occurred. However, based on industry experience, the Trust expects the risk of loss due to these warranties and indemnities to be remote.
| 3. | ADVISORY FEES AND OTHER RELATED PARTY TRANSACTIONS |
Advisory Fees – Pursuant to an investment advisory agreement (the "Advisory Agreement"), investment advisory services are provided to the Fund by the Adviser. Under the terms of the Advisory Agreement, the Adviser receives monthly fees calculated at an annual rate of 1.25% of the average daily net assets of the Fund.
The Adviser has contractually agreed to waive all or part of its management fees and/or make payments to limit Fund expenses, (including all organization and offering expenses, but excluding interest, brokerage commissions, acquired fund fees and expenses and extraordinary expenses) at least until February 28, 2016, so that the total annual operating expenses of the Fund do not exceed 1.99% per annum of Class A average daily net assets, 2.74% per annum of Class C average daily net assets, 2.49% per annum of Class W average daily net assets, 1.74% per annum of Class I average daily net assets, 1.99% per annum of Class U and average daily net assets, 2.74% per annum of Class T average daily net assets and 2.49% per annum of Class D average daily net assets. Fee waivers and expense payments may be recouped by the Adviser from the Fund, to the extent that overall expenses fall below the expense limitation, within three years of when the amounts were waived or reimbursed. During the period ended September 30, 2015, the Adviser waived fees of $307,831, all of which is available to be recouped by the Adviser until September 30, 2018. During the year ended February 28, 2015, the Adviser waived fees and reimbursed expenses of $431,960, all of which is available to be recouped by the Adviser until February 28, 2018. During the period ended February 28, 2014, the Adviser waived fees and reimbursed expenses of $343,290, all of which is available to be recouped by the Adviser until February 28, 2017. The Adviser waived fees and reimbursed expenses of $28,487 from the seed audit which is available to be recouped by the Adviser until March 8, 2016.
Fund Accounting Fees and Expenses – ALPS Fund Services, Inc. ("ALPS") serves as the Fund's Administrator and Accounting Agent (the "Administrator") and receives customary fees from the Fund for such services.
Transfer Agent – DST Systems Inc., an affiliate of ALPS, serves as transfer, dividend paying and shareholder servicing agent for the Fund ("Transfer Agent").
Distributor – ALPS Distributors, Inc. (the "Distributor") serves as the Fund's distributor. There are no fees paid to the Distributor pursuant to the Distribution Agreement. The Board has adopted, on behalf of the Fund, a Shareholder Servicing Plan under which the Fund may compensate financial industry professionals for providing ongoing services in respect of clients with whom they have distributed shares of the Fund. Under the Shareholder Servicing Plan, the Fund's Class A, Class C, Class W, Class U, Class T and Class D shares are subject to a shareholder servicing fee at an annual rate of 0.25% of the average daily net assets attributable to that share class. For the period ended September 30, 2015, the Fund incurred shareholder servicing fees of $72,281. The Class C and Class T shares also pay to the Distributor a distribution fee, payable under a distribution plan adopted by the board, that accrues at an annual rate equal to 0.75% of the Fund's average daily net assets attributable to Class C and Class T shares and is payable on a quarterly basis. In addition, Class W and Class D shares pay to Resource Securities, Inc. (the "Dealer Manager"), an affiliate of the Adviser, a dealer manager fee, payable under a distribution plan adopted by the board, that accrues at an annual rate equal to 0.50% of the Fund's average daily net assets attributable to Class W and Class D shares and is payable on a quarterly basis. Class A, Class I and Class U shares are not currently subject to a distribution fee. For the period ended September 30, 2015, the Fund accrued $41,140 in distribution fees and $20,642 in dealer manager fees.
| Annual Report | September 30, 2015 | 27 |
| Resource Real Estate Diversified Income Fund | Notes to Financial Statements |
The Distributor acts as the Fund's principal underwriter in a continuous public offering of the Fund's shares. The Distributor is an affiliate of ALPS. During the period ended September 30, 2015, no fees were retained by the Distributor.
Trustees – Effective November 21, 2014, each Trustee who is not affiliated with the Trust or Adviser will receive an annual fee of $10,000, plus $2,000 for attending the annual in‐person meeting of the Board of Trustees, plus $500 for attending each of the remaining telephonic meetings, as well as reimbursement for any reasonable expenses incurred attending the meetings. None of the executive officers receive compensation from the Trust. Prior to November 21, 2014, each Trustee who was not affiliated with the Trust or Adviser received an annual fee of $5,000, as well as reimbursement for any reasonable expenses incurred attending the meetings.
| 4. | INVESTMENT TRANSACTIONS |
The cost of purchases and proceeds from the sale of securities, other than short‐term securities, for the period ended September 30, 2015 amounted to $46,008,774 and $3,017,885, respectively.
| 5. | DERIVATIVE TRANSACTIONS |
Derivative Instruments and Hedging Activities – The following discloses the Fund's use of derivative instruments and hedging activities.
The Fund's investment objectives not only permit the Fund to purchase investment securities, it also allows the Fund to enter into various types of derivative contracts such as futures. In doing so, the Fund will employ strategies in differing combinations to permit them to increase, decrease, or change the level or types of exposure to market factors. Central to those strategies are features inherent to derivatives that make them more attractive for this purpose than equity or debt securities; they require little or no initial cash investment, they can focus exposure on only certain selected risk factors, and they may not require the ultimate receipt or delivery of the underlying security (or securities) to the contract. This may allow the Fund to pursue their objectives more quickly and efficiently than if it were to make direct purchases or sales of securities capable of effecting a similar response to market factors.
Market Risk Factors – In pursuit of its investment objectives, the Fund may seek to use derivatives to increase or decrease their exposure to the following market risk factors:
Foreign Exchange Rate Risk: Foreign exchange rate risk relates to the change in the U.S. dollar value of a security held that is denominated in a foreign currency. The value of a foreign currency denominated security will decrease as the dollar appreciates against the currency, while the value of the foreign currency denominated security will increase as the dollar depreciates against the currency.
Risk of Investing in Derivatives: The Fund's use of derivatives can result in losses due to unanticipated changes in the market risk factors and the overall market.
Derivatives may have little or no initial cash investment relative to their market value exposure and therefore can produce significant gains or losses in excess of their cost. This use of embedded leverage allows the Fund to increase its market value exposure relative to its net assets and can substantially increase the volatility of the Fund's performance.
Additional associated risks from investing in derivatives also exist and potentially could have significant effects on the valuation of the derivative and the Fund. Typically, the associated risks are not the risks that the Fund is attempting to increase or decrease exposure to, per their investment objectives, but are the additional risks from investing in derivatives.
Examples of these associated risks are liquidity risk, which is the risk that the Fund will not be able to sell the derivative in the open market in a timely manner, and counterparty credit risk, which is the risk that the counterparty will not fulfill its obligation to the Fund.
Futures – The Fund may invest in futures contracts in accordance with its investment objectives. The Fund does so for a variety of reasons, including for cash management, hedging or non‐hedging purposes in an attempt to achieve investment returns consistent with the Fund's investment objective. A futures contract provides for the future sale by one party and purchase by another party of a specified quantity of the security or other financial instrument at a specified price and time. A futures contract on an index is an agreement pursuant to which two parties agree to take or make delivery of an amount of cash equal to the difference between the value of the index at the close of the last trading day of the contract and the price at which the index contract was originally written. Futures transactions may result in losses in excess of the amount invested in the futures contract. There can be no guarantee that there will be a correlation between price movements in the hedging vehicle and in the portfolio securities being hedged. An incorrect correlation could result in a loss on both the hedged securities in a Fund and the hedging vehicle so that the portfolio return might have been greater had hedging not been attempted. There can be no assurance that a liquid market will exist at a time when a Fund seeks to close out a futures contract or a futures option position. Lack of a liquid market for any reason may prevent the Fund from liquidating an unfavorable position, and the Fund would remain obligated to meet margin requirements until the position is closed. In addition, the Fund could be exposed to risk if the counterparties to the contracts are unable to meet the terms of their contracts. With exchange‐traded futures, there is minimal counterparty credit risk to the Fund since futures are exchange‐traded and the exchange's clearinghouse, as counterparty to all exchange‐traded futures, guarantees the futures against default.
| Resource Real Estate Diversified Income Fund | Notes to Financial Statements |
When a purchase or sale of a futures contract is made by the Fund, the Fund is required to deposit with its custodian (or broker, if legally permitted) a specified amount of liquid assets ("initial margin"). The margin required for a futures contract is set by the exchange on which the contract is traded and may be modified during the term of the contract. The initial margin is in the nature of a performance bond or good faith deposit on the futures contract that is returned to the Fund upon termination of the contract, assuming all contractual obligations have been satisfied. Each day the Fund may pay or receive cash, called "variation margin," equal to the daily change in value of the futures contract. Such payments or receipts are recorded for financial statement purposes as unrealized gains or losses by the Fund. Variation margin does not represent a borrowing or loan by the Fund but is instead a settlement between the Fund and the broker of the amount one would owe the other if the futures contract expired. When the contract is closed, the Fund records a realized gain or loss equal to the difference between the value of the contract at the time it was opened and the value at the time it was closed.
The location in the Statement of Assets and Liabilities of the Fund's derivative positions as of September 30, 2015 are as follows:
| Risk Exposure | | Statement of Assets
and Liabilities
Location | | | Value | | Statement of Assets
and Liabilities
Location | | | Value | |
| Resource Real Estate Diversified Income Fund | | | | | | | | | | | |
Foreign Exchange Contracts (Futures contracts)(a) | | Variation margin receivable | | | 24,884 | | Variation margin payable | | | – | |
| Total | | | | $ | 24,884 | | | | $ | – | |
(a) | The value presented includes cumulative gain on open futures contracts; however, the value reflected on the accompanying Statement of Assets and Liabilities is only the unsettled variation margin receivable as of September 30, 2015. |
The location in the Statement of Operations of the Fund's derivative positions for the period ended September 30, 2015 are as follows:
| | | | | | | | | | |
| Risk Exposure | | Statement of Operations Location | | Realized Gain/(Loss) on Derivatives Recognized in Income | | Change in Unrealized Gain/(Loss) on Derivatives Recognized in Income | |
| Resource Real Estate Diversified Income Fund | | | | | | | | | |
| Foreign Exchange Contracts (Futures contracts) | | Net realized gain on futures contracts/Net change in unrealized apprecation on futures contracts | | | 94,338 | | | 24,884 | |
| Total | | | | $ | 94,338 | | $ | 24,884 | |
The average notional value of futures contracts during the period ended September 30, 2015 was $2,464,818.
For the period ended September 30, 2015, the following reclassifications, which had no impact on results of operations or net assets, were recorded to reflect tax character.
| | | | | | | | | | | |
| | | Paid-in Capital | | Accumulated Net Investment Income | | Accumulated Net Realized Gain on Investments | |
| Resource Real Estate Diversified Income Fund | | $ | – | | $ | (236,441 | ) | $ | 236,441 | |
| Annual Report | September 30, 2015 | 29 |
| Resource Real Estate Diversified Income Fund | Notes to Financial Statements |
The tax character of distributions paid for the periods ended September 30, 2015 and February 28, 2015 were as follows:
| | | | | | | | | | | |
| September 30, 2015 | | Ordinary Income | | Long-Term Capital Gain | | Return of Capital | |
| Resource Real Estate Diversified Income Fund | | $ | 757,462 | | $ | 201,255 | | $ | 1,240,390 | |
| | | | | | | | | | | |
| February 28, 2015 | | Ordinary Income | | Long-Term Capital Gain | | Return of Capital | |
| Resource Real Estate Diversified Income Fund | | $ | 817,261 | | $ | 15,057 | | $ | 111,438 | |
As of September 30, 2015, the components of accumulated earnings/(deficit) on a tax basis were as follows:
| Undistributed ordinary income | | $ | – | |
| Accumulated capital gains | | | – | |
| Net unrealized depreciation on investments | | | (758,339 | ) |
| Other cumulative effect of timing differences | | | (24,884 | ) |
| Total | | $ | (783,223 | ) |
The following information is computed on a tax basis for each item as of September 30, 2015:
| | | | | | | | | | | | | | | | | |
| | | Gross Appreciation (excess of value over tax cost) | | Gross Depreciation(excess of tax cost over value) | | Net Appreciation of Foreign Currency | | Net Unrealized Depreciation | | Cost of Investments for Income Tax Purposes | |
| Resource Real Estate Diversified Income Fund | | $ | 3,114,519 | | $ | (3,897,998 | ) | $ | 25,140 | | $ | (758,339 | ) | $ | 76,528,896 | |
The difference between book basis and tax basis distributable earnings and unrealized appreciation/(depreciation) is primarily attributable to the tax deferral of losses on wash sales, investments in partnerships and certain other investments.
Pursuant to Rule 23c-3 under the 1940 Act the Fund offers shareholders on a quarterly basis the option of redeeming shares, at net asset value, of up to 5% of its issued and outstanding shares as of the close of regular business hours on the New York Stock Exchange on the Repurchase Pricing Date (defined below). If shareholders tender for repurchase more than 5% of the outstanding shares of the Fund, the Fund may, but is not required to, repurchase up to an additional 2%. If the Fund determines not to repurchase an additional 2%, or if more than 7% of the shares are tendered, then the Fund will repurchase shares on a pro rata basis based upon the number of shares tendered by each shareholder. There can be no assurance that the Fund will be able to repurchase all shares that each shareholder has tendered, even if all the shares in a shareholder's account are tendered. In the event of an oversubscribed offer, you may not be able to tender all shares that you wish to tender and may have to wait until the next quarterly repurchase offer to tender the remaining shares. Subsequent repurchase requests will not be given priority over other shareholder requests.
During the period ended September 30, 2015, the Fund completed two quarterly repurchase offers. In these offers, the Fund offered to repurchase up to 5% of the number of its outstanding shares as of the Repurchase Pricing Dates. The result of those repurchase offers were as follows:
| | | Repurchase Offer #1 | | Repurchase Offer #2 |
| Commencement Date | | March 17, 2015 | | June 17, 2015 |
| Repurchase Request Deadline | | April 15, 2015 | | July 17, 2015 |
| Repurchase Pricing Date | | April 15, 2015 | | July 17, 2015 |
| Amount Repurchased | | $361,760 | | $335,389 |
| Shares Repurchased | | 34,908 | | 32,785 |
The Fund has a $25,000,000 secured revolving bank line of credit through BNP Paribas Prime Brokerage International, Ltd. (the "Bank") for purpose of investment purchases subject to the limitations of the 1940 Act for borrowings.
| Resource Real Estate Diversified Income Fund | Notes to Financial Statements |
Borrowings under this arrangement bear interest at the Bank's 3 month LIBOR plus 95 basis points at the time of borrowing. During the period ended September 30, 2015, the Fund incurred $71,210 of interest expense related to the borrowings. Average borrowings and the average interest rate during the period ended September 30, 2015 were $9,577,416 and 1.24%, respectively. The largest outstanding borrowing during the period ended September 30, 2015 was $13,578,443. As of September 30, 2015, the Fund had $12,373,059 of outstanding borrowings.
As collateral security for the Bank line of credit, the Fund grants the Bank a first position security interest in and lien on all securities of any kind or description held by the Fund in the pledge account. As of September 30, 2015, the Fund had $35,032,706 in securities pledged as collateral for the line of credit.
As of September 30, 2015, in addition to the unfunded commitments for investments currently held as of the reporting date (Refer to Portfolio of Investments footnote disclosures), the Fund had $10,500,000 of unfunded commitments relating to potential future investments not currently held as reported below. The value of unfunded commitments reported as of September 30, 2015 approximates fair value.
| | | | |
| Security | | Unfunded Commitments as of September 30, 2015 |
| Cornerstone | | $2,500,000 | |
| UBS Trumball Property Fund | | 4,000,000 | |
| UBS Trumball Property Income Fund | | 4,000,000 | |
| 10. NEW ACCOUNTING PRONOUNCEMENTS |
In May 2015, the Financial Accounting Standards Board ("FASB") issued Accounting Standards Update ("ASU") 2015-07, "Disclosures for Investments in Certain Entities that Calculate Net Asset Value Per Share (or its Equivalent)." This is an update to Accounting Standards Codification Topic 820, Fair Value Measurement. ASU 2015-07 removes the requirement to categorize within the fair value hierarchy investments for which fair value is measured at net asset value per share (or its equivalent) using the practical expedient.
ASU 2015-17 is effective for annual reporting periods beginning on or after December 15, 2015, and interim periods within those annual periods, with retrospective application for all periods presented. Early adoption is permitted. Management has elected to early adopt ASU 2015-07, and the disclosures in Note 2 are presented accordingly.
Subsequent events after the date of the Statement of Assets and Liabilities have been evaluated through the date the financial statements were issued.
The Fund completed a quarterly repurchase offer on October 16, 2015 which resulted in 82,274 of Fund shares being repurchased for $886,480.
Management has determined that there were no other subsequent events to report through the issuance of these financial statements.
| Annual Report | September 30, 2015 | 31 |
| Resource Real Estate Diversified Income Fund | Report of Independent Registered
Public Accounting Firm |
To the Board of Trustees and the Shareholders of
Resource Real Estate Diversified Income Fund
We have audited the accompanying statement of assets and liabilities of Resource Real Estate Diversified Income Fund (the "Fund"), including the portfolio of investments, as of September 30, 2015, and the related statements of operations and cash flows for the seven-month period then ended and for the year ended February 28, 2015, and the statements of changes in net assets and the financial highlights for each of the years or periods presented. These financial statements and financial highlights are the responsibility of the Fund's management. Our responsibility is to express an opinion on these financial statements and financial highlights based on our audits.
We conducted our audits in accordance with the standards of the Public Company Accounting Oversight Board (United States). Those standards require that we plan and perform the audits to obtain reasonable assurance about whether the financial statements and financial highlights are free of material misstatement. An audit includes examining, on a test basis, evidence supporting the amounts and disclosures in the financial statements. Our procedures included confirmation of securities owned as of September 30, 2015 by correspondence with the custodian, brokers and other appropriate parties. An audit also includes assessing the accounting principles used and significant estimates made by management, as well as evaluating the overall financial statement presentation. We believe that our audits provide a reasonable basis for our opinion.
As explained in the notes, the financial statements involve securities valued at $14,914,150 (22.96% of net assets), whose fair values have been estimated by the Board of Trustees in the absence of readily ascertainable fair values. These estimated values may differ significantly from the values that would have been used had a ready market for the securities existed, and the differences could be material.
In our opinion, the financial statements and financial highlights referred to above present fairly, in all material respects, the financial position of Resource Real Estate Diversified Income Fund as of September 30, 2015, and the results of its operations and cash flows, the changes in its net assets and its financial highlights for each of the years or periods presented, in conformity with accounting principles generally accepted in the United States of America.
BBD, LLP
Philadelphia, Pennsylvania
November 25, 2015
| Resource Real Estate Diversified Income Fund | Additional Information |
| | September 30, 2015 (Unaudited) |
| 1. PROXY VOTING POLICIES AND VOTING RECORD |
A description of the policies and procedures that the Fund uses to vote proxies relating to portfolio securities is available without charge upon request by calling toll-free 855-747-9559, or on the Securities and Exchange Commission's ("SEC") website at http://www.sec.gov. Information regarding how the Fund voted proxies relating to portfolio securities during the most recent 12-month period ended June 30th is available without charge upon request by calling toll-free 855-747-9559, or on the SEC's website at http://www.sec.gov.
| 2. QUARTERLY PORTFOLIO HOLDINGS |
The Fund files a complete listing of portfolio holdings for the Fund with the SEC as of the first and third quarters of each fiscal year on Form N-Q. The filings are available upon request by calling 855-747-9559. Furthermore, you may obtain a copy of the filing on the SEC's website at http://www.sec.gov. The Fund's Form N-Q may also be reviewed and copied at the SEC's Public Reference Room in Washington, D.C., and information on the operation of the Public Reference Room may be obtained by calling 1-800-SEC-0330.
Pursuant to Section 852(b)(3) of the Internal Revenue Code, the Fund designated $201,255 as long-term capital gain distribution for the year ended September 30, 2015.
| Annual Report | September 30, 2015 | 33 |
| Resource Real Estate Diversified Income Fund | Trustees & Officers |
| | September 30, 2015 (Unaudited) |
The business and affairs of the Fund are managed under the direction of the Trustees. Information concerning the Trustees and officers of the Fund is set forth below. Generally, each Trustee and officer serves an indefinite term or until certain circumstances such as his resignation, death or otherwise as specified in the Fund's organizational documents. Any Trustee may be removed at a meeting of shareholders by a vote meeting the requirements of the Fund's organizational documents. The Statement of Additional Information of the Fund includes additional information about the Trustees and officers and is available, without charge, upon request by calling the Fund's toll-free at 855-747-9559. Refer to footnote 3 of the financial statements, for additional information on Independent Trustee compensation. The Interested Trustees and officers do not receive compensation from the Fund for their services to the Fund.
Name, Address*,
and Year of Birth | Position(s) Held with Fund** | Principal Occupation During
Past Five Years | Number of
Portfolios in
Fund Complex
Overseen by
Trustee*** | Other Directorships Held by
Trustee During the Past
Five Years*** |
| INDEPENDENT TRUSTEES | | | |
Enrique Casanova
Born in 1973 | Trustee | Team Epic, Marketing Consultant (December 2003 to Present) | 2 | Independent Director, RCP Reserves Holdings Manager, Inc. August 2006 to October 2012, Resource Credit Income Fund, since February 2015 |
Fred Berlinsky, Esq.
Born in 1959 | Trustee,
Chairman of
the Board | Markeim-Chalmers, Inc. President (since March 1986) | 2 | Resource Credit Income Fund, since February 2015 |
David Burns
Born in 1974 | Trustee | Ampure Capital, LLC, President (since June 2004), GT Securities, Registered Representative (since June 2010), Anthrotect, Acting CFO (since December 2012); Doorways, LTD (since January 2001) | 2 | Doorways, LTD, since January 2001, RCP Regents Center, since June 2006, Resource Credit Income Fund, since February 2015 |
| Resource Real Estate Diversified Income Fund | Trustees & Officers |
| | September 30, 2015 (Unaudited) |
Name, Address*,
and Year of Birth | Position(s) Held
with Fund** | Principal Occupation During
Past Five Years | Number of
Portfolios in
Fund Complex
Overseen by
Trustee*** | Other Directorships Held by
Trustee During the Past
Five Years*** |
| INTERESTED TRUSTEES AND OFFICERS |
Jeffrey F. Brotman, Esq.
Born in 1963 | Trustee | Resource America, Inc. Executive Vice President (since June 2007). Resource Capital Corp, Executive Vice President (since 2009). | 2 | Chairman of the Board of Directors of TRM Corporation, September 2006 to September 2008. Resource Real Estate, Inc., since 2008, Resource Credit Income Fund, since February 2015 |
Alan Feldman
Born in 1963 | Trustee and CEO | Resource Real Estate, Inc. – CEO and director since May 2004. Resource America, Inc. – SVP since August 2002. | 2 | Resource Real Estate, Inc., since 2004, Resource Credit Income Fund, since February 2015 |
Scott Crowe
Born in 1977 | Trustee | Resource Real Estate, Inc. – Managing Director (November 2012 to June 2015). Cohen & Steers, Global Portfolio Manager (March 2007 to May 2012). | 1 | None |
Kevin Finkel
Born in 1971 | President | Resource Real Estate, Inc. Executive Vice President (since November 2002). | N/A | N/A |
Steven Saltzman
Born in 1963 | Treasurer and Senior Vice President | Resource Real Estate, Inc., Chief Financial Officer (since January 2014); Vice President – Finance (May 2004 to December 2013) | N/A | N/A |
Darshan Patel
Born in 1970 | Chief Compliance Officer, Secretary and Senior Vice President | Resource Real Estate, Inc., Senior Vice President and Secretary (since October 2014); Chief Compliance Officer and Chief Legal Officer of Resource Financial Fund Management, Inc., an affiliate of Resource Real Estate, Inc. (since 2002); Chief Compliance Officer and President of Resource Securities, Inc., an affiliate of Resource Real Estate, Inc. (since 2004). | N/A | N/A |
| * | Unless otherwise noted, the address of each Trustee and Officer is c/o Resource Real Estate, Inc., One Crescent Drive, Suite 203, Philadelphia, PA 19112. |
| ** | The term of office for each Trustee and officer listed above will continue indefinitely. |
| *** | The term "Fund Complex" refers to the Resource Real Estate Diversified Income Fund and the Resource Credit Income Fund. |
| Annual Report | September 30, 2015 | 35 |
| Resource Real Estate Diversified Income Fund | Privacy Notice |
Rev. 5/2014
| | | | | | | |
| FACTS | | WHAT DOES RESOURCE REAL ESTATE DIVERSIFIED INCOME FUND DO WITH YOUR PERSONAL INFORMATION? |
| | | | | | | |
| Why? | | Financial companies choose how they share your personal information. Federal law gives consumers the right to limit some but not all sharing. Federal law also requires us to tell you how we collect, share, and protect your personal information. Please read this notice carefully to understand what we do. |
| | | | | | | |
| What? | | The types of personal information we collect and share depend on the product or service you have with us. This information can include: |
| | | | ■ | Social Security number | ■ | Purchase History |
| | | | ■ | Assets | ■ | Account Balances |
| | | | ■ | Retirement Assets | ■ | Account Transactions |
| | | | ■ | Transaction History | ■ | Wire Transfer Instructions |
| | | | ■ | Checking Account Information | | |
| | | When you are no longer our customer, we continue to share your information as described in this notice. |
| | | | | | | |
| How? | | All financial companies need to share customers' personal information to run their everyday business. In the section below, we list the reasons financial companies can share their customers' personal information; the reasons Resource Real Estate Diversified Income Fund chooses to share; and whether you can limit this sharing. |
| Reasons we can share your personal information | | Does Resource Real
Estate Diversified
Income Fund share? | | Can you limit this sharing? |
| | | | | |
| For our everyday business purposes – | | | | |
| such as to process your transactions, maintain your account(s), respond to court orders and legal investigations, or report to credit bureaus | | Yes | | No |
| | | | | |
| For our marketing purposes – | | | | |
| to offer our products and services to you | | No | | We don't share |
| | | | | |
| For joint marketing with other financial companies | | No | | We don't share |
| | | | | |
| For our affiliates' everyday business purposes – | | | | |
| information about your transactions and experiences | | No | | We don't share |
| | | | | |
| For our affiliates' everyday business purposes – | | No | | We don't share |
| information about your creditworthiness | | | | |
| | | No | | We don't share |
| For nonaffiliates to market to you | | | | |
| Questions? | Call 1-855-747-9559 | |
| Resource Real Estate Diversified Income Fund | Privacy Notice |
| Who we are | | | | |
| | | | | |
| Who is providing this notice? | | Resource Real Estate Diversified Income Fund |
| | | | | |
| What we do | | | | |
| | | | | |
| How does Resource Real Estate Diversified Income Fund protect my personal information? | | To protect your personal information from unauthorized access and use, we use security measures that comply with federal law. These measures include computer safeguards and secured files and buildings. |
| | | | | |
| | | Our service providers are held accountable for adhering to strict policies and procedures to prevent any misuse of your nonpublic personal information. |
| | | |
| How does Resource Real Estate Diversified Income Fund collect my personal information? | | We collect your personal information, for example, when you |
| | | ■ | Open an account |
| | | ■ | Provide account information |
| | | ■ | Give us your contact information |
| | | ■ | Make deposits or withdrawals from your account |
| | | ■ | Make a wire transfer |
| | | ■ | Tell us where to send the money |
| | | | ■ | Tells us who receives the money |
| | | | ■ | Show your government-issued ID |
| | | | ■ | Show your driver's license |
| | | We also collect your personal information from other companies. |
| | | | | |
| Why can't I limit all sharing? | | Federal law gives you the right to limit only |
| | | | ■ | Sharing for affiliates' everyday business purposes – information about your creditworthiness |
| | | | ■ | Affiliates from using your information to market to you |
| | | | ■ | Sharing for nonaffiliates to market to you |
| | | | | |
| | | State laws and individual companies may give you additional rights to limit sharing. |
| | | | | |
| Definitions | | | | |
| | | | | |
| Affiliates | | Companies related by common ownership or control. They can be financial and nonfinancial companies. |
| | | | ■ | Resource Real Estate Diversified Income Fund does not share with our affiliates. |
| | | | | |
| Nonaffiliates | | Companies not related by common ownership or control. They can be financial and nonfinancial companies |
| | | | ■ | Resource Real Estate Diversified Income Fund does not share with nonaffiliates so they can market to you. |
| | | | | |
| Joint marketing | | A formal agreement between nonaffiliated financial companies that together market financial products or services to you. |
| | | | ■ | Resource Real Estate Diversified Income Fund doesn't jointly market. |
| Annual Report | September 30, 2015 | 37 |
| INVESTMENT ADVISER |
Resource Real Estate, Inc.
One Crescent Drive, Suite 203
Philadelphia, Pennsylvania 19112 |
| |
| DISTRIBUTOR |
ALPS Distributors, Inc.
1290 Broadway, Suite 1100
Denver, Colorado 80203 |
| |
| LEGAL COUNSEL |
| Thompson Hine LLP |
41 South High Street, Suite 1700
Columbus, Ohio 43215 |
| |
INDEPENDENT REGISTERED
PUBLIC ACCOUNTING FIRM |
| BBD, LLP |
1835 Market Street, 26th Floor
Philadelphia, Pennsylvania 19103 |
| |
| Must be accompanied or preceded by a Prospectus. |
| ALPS Distributors, Inc. is the Distributor for Resource Real Estate Diversified Income Fund. |
Item 2. Code of Ethics.
| (a) | As of the end of the period covered by this report, the registrant has adopted a code of ethics that applies to the registrant's principal executive officer, principal financial officer, principal accounting officer or controller, or persons performing similar functions, regardless of whether these individuals are employed by the registrant or a third party. |
| (c) | During the period covered by this report, there have not been any amendments to the provisions of the code of ethics adopted in Item 2(a) of this report. |
| (d) | During the period covered by this report, the registrant had not granted any express or implicit waivers from the provisions of the code of ethics adopted in Item 2(a) of this report. |
| (f) | The registrant's Code of Ethics is attached as an Exhibit hereto. |
Item 3. Audit Committee Financial Expert.
(a)(1)(ii) The Board of Trustees of the registrant has determined that the registrant has at least one Audit Committee Financial Expert serving on its audit committee.
| (a)(2) | The Board of Trustees of the registrant has designated Mr. David M. Burns as the registrant's Audit Committee Financial Expert. Mr. Burns is "independent" as defined in paragraph (a)(2) of Item 3 to Form N-CSR. |
Item 4. Principal Accountant Fees and Services.
| (a) | Audit Fees: For the registrant's last fiscal year ended February 28, 2015 and fiscal period ended September 30, 2015, the aggregate fees billed for professional services rendered by the principal accountant for the audit of the registrant's annual financial statements or services that are normally provided by the accountant in connection with statutory and regulatory filings or engagements were $22,000 and $17,600, respectively. |
| (b) | Audit-Related Fees: For the registrant's last fiscal year ended February 28, 2015 and fiscal period ended September 30, 2015, the aggregate fees billed for assurance and related services by the principal accountant that are reasonably related to the performance of the audit of the registrant's financial statements and are not otherwise reported under paragraph (a) of this Item 4 were $0 and $0, respectively. |
| (c) | Tax Fees: For the registrant's last fiscal year ended February 28, 2015 and fiscal period ended September 30, 2015, the aggregate fees billed for professional services rendered by the principal accountant for tax compliance, tax advice and tax planning, which were comprised of the preparation of Federal and state income tax returns, assistance with calculation of required income, capital gain and excise distributions and preparation of Federal excise tax returns, were $3,000 and $3,000, respectively. |
| (d) | All Other Fees: For the registrant's last fiscal year ended February 28, 2015 and fiscal period ended September 30, 2015, the aggregate fees billed for products and services provided by the principal accountant, other than the services reported in paragraphs (a) through (c) of this Item 4, were $0 and $0, respectively. |
| (e) (1) | The registrant's audit committee is required to pre-approve all audit services and, when appropriate, any non-audit services (including audit-related, tax and all other services) to the registrant. The registrant's audit also is required to pre-approve, when appropriate, any non-audit services (including audit-related, tax and all other services) to its adviser, or any entity controlling, controlled by or under common control with the adviser that provides ongoing services to the registrant, to the extent that the services may be determined to have an impact on the operations or financial reporting of the registrant. Services are reviewed on an engagement by engagement basis by the Audit Committee. |
| (2) | No services described in paragraphs (b) through (d) of this Item 4 were approved by the registrant's audit committee pursuant to paragraph (c)(7)(i)(C) of Rule 2-01 of Regulation S-X. |
| (f) | During the audit of registrant's financial statements for the most recent fiscal year, less than 50 percent of the hours expended on the principal accountant's engagement were attributed to work performed by persons other than the principal accountant's full-time, permanent employees. |
| (g) | For the registrant's last fiscal year ended February 28, 2015 and fiscal period ended September 30, 2015, the aggregate non-audit fees for services billed by the registrant's accountant for services rendered to the registrant and rendered to the registrant's investment adviser (not including any sub-adviser whose role is primarily portfolio management and is subcontracted with or overseen by another investment adviser) and any entity controlling, controlled by, or under common control with the adviser that provides ongoing services to the registrant were $3,000 and $3,000, respectively. |
| (h) | The registrant's audit committee has considered whether the provision of non-audit services to the registrant's investment adviser (not including any sub-adviser whose role is primarily portfolio management and is subcontracted with or overseen by another investment adviser), and any entity controlling, controlled by, or under common control with the investment adviser that provides ongoing services to the registrant, that were not pre-approved pursuant to paragraph (c)(7)(ii) of Rule 2-01 of Regulation S-X, is compatible with maintaining the principal accountant's independence. |
Item 5. Audit Committee of Listed Registrants.
Not applicable to the registrant.
Item 6. Investments.
| (a) | The schedule of investments is included as part of the Reports to Stockholders filed under Item 1 of this report. |
| (b) | Not applicable to the registrant. |
Item 7. Disclosure of Proxy Voting Policies and Procedures for Closed-End Management Investment Companies.
I. Background
Pursuant to Rule 206(4)-6 and Rule 204-2 under the Advisers Act, it is a fraudulent, deceptive, or manipulative act, practice or course of business, within the meaning of Section 206(4) of the Advisers Act, for an investment adviser to exercise voting authority with respect to client securities, unless (i) the adviser has adopted and implemented written policies and procedures that are reasonably designed to ensure that the adviser votes proxies in the best interests of its clients, (ii) the adviser describes its proxy voting procedures to its clients and provides copies on request, and (iii) the adviser discloses to clients how they may obtain information on how the adviser voted their proxies.
II. Policy
The Adviser will vote proxies on behalf of its individual clients. In order to fulfill its responsibilities under the Advisers Act, the Adviser has adopted the following policies and procedures for proxy voting with regard to companies in the investment portfolio of the Fund(s).
Voting Proxies
1. All proxies sent to clients that are actually received by the Adviser (to vote on behalf of the client) will be provided to the Operations Unit.
2. The Operations Unit will generally adhere to the following procedures (subject to limited exception):
(a) A written record of each proxy received by the Adviser (on behalf of its clients) will be kept in the Adviser's files;
(b) The Operations Unit will determine which client of the Adviser holds the security to which the proxy relates;
(c) Prior to voting any proxies, the Operations Unit will determine if there are any conflicts of interest related to the proxy in question in accordance with the general guidelines set forth below. If a conflict is identified, the Operations Unit will then make a determination (which may be in consultation with outside legal counsel) as to whether the conflict is material;
(d) If no material conflict is identified pursuant to these procedures, the Operations Unit will vote the proxy in accordance with the guidelines set forth below. The Operations Unit will deliver the proxy in accordance with instructions related to such proxy in a timely and appropriate manner.
Conflicts of Interest
1. As stated above, in evaluating how to vote a proxy, the Operations Unit will first determine whether there is a conflict of interest related to the proxy in question between Adviser and its clients. This examination will include (but will not be limited to) an evaluation of whether the Adviser (or any affiliate of the Adviser) has any relationship with the company (or an affiliate of the company) to which the proxy relates outside of an investment in such company by a client of the Adviser.
2. If a conflict is identified and deemed "material" by the Operations Unit, the Adviser will determine whether voting in accordance with the proxy voting guidelines outlined below is in the best interests of the client (which may include utilizing an independent third party to vote such proxies).
3. With respect to material conflicts, the Adviser will determine whether it is appropriate to disclose the conflict to affected clients and give such clients the opportunity to vote the proxies in question themselves. However, with respect to ERISA clients whose advisory contract reserves the right to vote proxies when the Adviser has determined that a material conflict exists that affects its best judgment as a fiduciary to the ERISA client, the Adviser will:
(a) Give the ERISA client the opportunity to vote the proxies in question themselves; or
(b) Follow designated special proxy voting procedures related to voting proxies pursuant to the terms of the investment management agreement with such ERISA clients (if any).
Proxy Voting Guidelines
To be determined by the Adviser.
Disclosure of Procedures
A summary of the above proxy voting procedures will be included in Part II of the Adviser's Form ADV and will be updated whenever these policies and procedures are updated. Clients will be provided with contact information as to how they can obtain information about: (a) the Adviser's proxy voting procedures (i.e., a copy of these procedures); and (b) how the Adviser voted proxies that are relevant to the affected client.
Record-keeping Requirements
The Operations Unit will be responsible for maintaining files relating to the Adviser's proxy voting procedures. Records will be maintained and preserved for five years from the end of the fiscal year during which the last entry was made on record, with records for the first two years kept in the offices of the Adviser. Records of the following will be included in the files:
1. Copies of these proxy voting policies and procedures, and any amendments thereto;
2. A copy of each proxy statement that the Adviser actually received; provided, however, that the Adviser may rely on obtaining a copy of proxy statements from the SEC's EDGAR system for those proxy statements that are so available;
3. A record of each vote that the Adviser casts;
4. A copy of any document that the Adviser created that was material to making a decision how to vote the proxies, or memorializes that decision (if any); and
5. A copy of each written request for information on how the Adviser voted such client's proxies and a copy of any written response to any request for information on how the Adviser voted proxies on behalf of clients.
Item 8. Portfolio Managers of Closed-End Management Investment Companies.
John Snowden serves as the Fund's portfolio manager and is primarily responsible for the day-to-day management of the Fund. Prior to becoming portfolio manager for the Fund in June 2015, Mr. Snowden has been active in setting the strategy along with the Adviser's Real Estate Securities Division to acquire and manage global REIT investment portfolios. From June 2013 until June 2015, Mr. Snowden served as Managing Director for Resource Real Estate Global Property Securities (Aust.) Pty Ltd (a company that is 75% owned by the Fund's portfolio manager). From February 2010 to April 2013, Mr. Snowden served as Managing Director, Head of Global Equity & Real Estate Securities for AIMS Snowden Global Securities Management PL ("AIMS"), a company founded by Mr. Snowden that specializes in the management of Asian and Australian real estate and equity portfolios. While at AIMS, Mr. Snowden hired and managed several U.S. REIT analysts. From January 2006 to April 2009, Mr. Snowden served as Managing Director, Head of Global Property Securities and Infrastructure for Colonial First State Global Asset Management ("Colonial"), where he was responsible for the setup of U.S. operations and the management of approximately 20 global, Australian, Asian, European and other opportunistic property investment funds. Mr. Snowden was responsible for creating Colonial's New York City based U.S. operations. From February 1998 to January 2006, Mr. Snowden served in several leadership roles in the real estate and equities investment division of UBS Global Asset Management, reporting directly to that firm's New York City based Global Head of Real Estate. From November 1989 to January 1998, Mr. Snowden served JPMorgan IM Australia Limited and J.P. Morgan Securities, Inc. as a Vice President with responsibility for investments in real estate, banking and financial institutions, and other industrial sectors, and he worked in their New York City office for two years. Mr. Snowden earned a Bachelor of Laws from the University of New South Wales in Sydney, Australia, and a Master of Laws from the University of Sydney in Sydney, Australia. Mr. Snowden is also a Chartered Financial Analyst (CFA).
As of September 30, 2015, Mr. Snowden did not manage any accounts other than the Fund.
Kate Davis serves as a portfolio manager for the Fund and has served in this capacity since October 2015. Ms. Davis has over a decade of experience in real estate and finance and joined the Adviser in July 2014. From January 2013 until July 2014, Ms. Davis served as Vice President at an affiliate of the Adviser, Resource Capital Corp, where she was responsible for underwriting commercial real estate mortgage loans across all asset classes. From August 2009 until December 2012, Ms. Davis worked in Corporate Finance for Microsoft. During that time, Ms. Davis rose in the ranks to become a Finance Manager with responsibility for a $150 million budget within Microsoft's IT division. From 2003 to 2008, Ms. Davis was Vice President at Tandem Realty Corp, a real estate private equity firm, overseeing the development and management of commercial office and residential projects. Ms. Davis earned a Bachelor of Science degree in Finance from the University of Illinois at Urbana-Champaign, and a Master of Business Administration degree from the University of Chicago Booth School of Business.
As of October 20, 2015, Ms. Davis did not manage any other accounts in addition to the Fund.
Item 9. Purchases of Equity Securities by Closed-End Management Investment Company and Affiliates Purchasers.
None.
Item 10. Submission of Matters to a Vote of Security Holders.
None.
Item 11. Controls and Procedures.
| (a) | Based on an evaluation of the registrant's disclosure controls and procedures as of a date within 90 days of the filing date of this report, the registrant's principal executive officer and principal financial officer have concluded that the disclosure controls and procedures are reasonably designed to ensure that the information required in filings on Form N-CSR is recorded, processed, summarized and reported by the filing date, including that information required to be disclosed is accumulated and communicated to the registrant's management, including the registrant's principal executive officer and principal financial officer, as appropriate to allow timely decisions regarding required disclosure. |
| (b) | There were no significant changes in the registrant's internal control over financial reporting that occurred during the registrant's last fiscal half-year that have materially affected, or are reasonably likely to materially affect, the registrant's internal control over financial reporting. |
Item 12. Exhibits.
| (a)(1) | Registrant's Financial Officer Code of Ethics is filed herewith as Exhibit 12(a)(1). |
| (a)(2) | Certifications required by Item 12(a)(2) of Form N-CSR are filed herewith as Exhibit 99.CERT. |
| (a)(3) | Not applicable. |
| (b) | Certifications required by Item 12(b) of Form N-CSR are filed herewith as Exhibit 99.906CERT. |
SIGNATURES
Pursuant to the requirements of the Securities Exchange Act of 1934 and the Investment Company Act of 1940, the registrant has duly caused this report to be signed on its behalf by the undersigned, thereunto duly authorized.
RESOURCE REAL ESTATE DIVERSIFIED INCOME FUND
By: | /s/ Alan Feldman | |
| Alan Feldman |
| Chief Executive Officer (Principal Executive Officer) |
| | | |
| Date: December 9, 2015 | |
Pursuant to the requirements of the Securities Exchange Act of 1934 and the Investment Company Act of 1940, this report has been signed below by the following persons on behalf of the registrant and in the capacities and on the dates indicated.
| | |
By (Signature and Title) | |
| | | |
| By: | /s/ Alan Feldman | |
| Alan Feldman |
| | Chief Executive Officer (Principal Executive Officer) |
| | | |
| Date: December 9, 2015 |
| | |
By (Signature and Title) | |
| | | |
| By: | /s/ Steven R. Saltzman | |
| Steven Saltzman | |
| | Treasurer (Principal Financial Officer) |
| | | |
| Date: December 9, 2015 |