| Shareholder Letter | 1 |
| Portfolio Update | 3 |
| Portfolio of Investments | 5 |
| Statement of Assets and Liabilities | 10 |
| Statement of Operations | 12 |
| Statements of Changes in Net Assets | 13 |
| Statements of Cash Flows | 16 |
| Financial Highlights | |
| Class A | 17 |
| Class C | 18 |
| Class W | 19 |
| Class I | 20 |
| Class U | 21 |
| Class T | 22 |
| Class D | 23 |
| Notes to Financial Statements | 24 |
| Additional Information | 33 |
| Renewal of Advisory Agreement | 34 |
| Resource Real Estate Diversified Income Fund | Shareholder Letter |
March 31, 2016 (Unaudited)Dear Shareholders:
We are pleased to present you with the Resource Real Estate Diversified Income Fund Semi-Annual Report for the 2016 fiscal year. We are also proud to report that the Fund continued to grow, and over the last six months of operations we have continued to deliver value to shareholders by:
| ● | Providing our investors access to a diversified portfolio of both private and public real estate investments across the capital structure. |
| ● | Delivering a growing distribution rate. Our current annualized distribution represents an over 6% target annualized distribution1. We have paid a consistent distribution for 12 straight quarters. |
| ● | Providing total return and low volatility. The Fund continued to experience significantly lower volatility than publicly traded REIT indices. |
Investment Philosophy and Process
As the Fund’s Advisor, Resource Real Estate has maintained a consistent approach to investing our clients’ capital. Our investment focus remains exclusively on high quality real estate investments. Our investable universe broadly encompasses three main strategies: Traded Equity (US and international REITs), Real Estate Credit (preferred REIT equity and bonds) and Direct Real Estate (including Private Equity and Non-traded REITs). Each investment type offers relative advantages. For instance, publicly traded REITs offer higher levels of growth and liquidity. Direct real estate offers higher levels of capital stability and attractive income. Real estate credit can offer higher security and income.
As the Advisor, our first decision is to determine the appropriate balance within the Fund among these three real estate investment strategies. We base this decision upon where we see the best relative value in the context of achieving the Fund’s strategic objectives.
Investment Environment
The first half of the Fund’s fiscal year was characterized by extreme volatility as the financial markets were whipsawed by competing concerns regarding rising interest rates in the US and a slowing global economy. From September 30, 2015 through February 29, 2016, the S&P 500 was essentially flat while the NAREIT index rose slightly. Investors’ reduced appetite for risk was also evident in the credit markets as spreads on the Bank of America Merrill Lynch U.S. High Yield Index2 widened by more than 100 basis points3. Moreover, financial markets became highly correlated to energy markets as investors looked to the price of oil and other commodities as an indicator of global economic health.
In contrast to volatile financial markets, the US economy continued to grow at a steady pace as evidenced by consistent job creation averaging 246,000 per month over the six month period. Favorable trends in spending and housing combined with solid corporate earnings in the quarter ended December 31, 2015 provided further evidence that the US economy remained on track.
Within the commercial real estate market, the beneficial effects of a growing economy were further bolstered by favorable demographic trends and constrained supply. For example, millennials continue to show a greater propensity to rent than prior generations, increasing demand for apartments, while growth in online shopping is driving peak occupancy rates in the industrial sector. At the same time, except in a few market sub-segments, new supply of commercial real estate remained constrained, sometimes barely keeping up with obsolescence.
The commercial real estate mergers and acquisitions (M&A) market provided another counterbalance to the volatile public markets. Throughout the market turmoil, private investors remained sanguine regarding real estate fundamentals, and the market for commercial real estate properties remained healthy both in terms of volume and valuation. Sophisticated investors also took advantage of declines in the public markets to acquire REITs at a significant discount to net asset value. Blackstone’s acquisition of Strategic Hotels and Resorts, Inc. for $6 billion is a prime example of this dynamic.
With favorable economic data and a robust M&A market as backdrop, REIT investor sentiment shifted dramatically at the end of February as the NAREIT index gained 10.17% in March.
Fund Performance
Although not immune to market volatility, the Fund delivered on its objectives of providing attractive current income and lower volatility than the broader equity markets for its shareholders. Through the end of March 2016, the Fund has paid a consistent distribution of around 6%1 for 12 straight quarters. In addition, for the six months ended March 31, 2016, the Fund’s volatility (as measured by standard deviation) was 9.41% compared to 16.76% for the S&P500 and 13.97% for the NAREIT index. The Fund had a total return of 1.33% for the first half of the fiscal year driven primarily by declining values in the public equities portfolio and, to a lesser extent, the credit portfolio. As intended, volatility and price pressure in the public markets was offset to a degree by the private equity portfolio which returned 2.66% over the period.
| Semi-Annual Report | March 31, 2016 | 1 |
| Resource Real Estate Diversified Income Fund | Shareholder Letter |
March 31, 2016 (Unaudited)Investment Positioning
The US economy continued in a prolonged but slow-paced recovery. In the commercial real estate market, the recovery has translated into higher occupancy rates and rising rents. Although income growth rates have tapered over the past six months from their torrid pace in 2014 and the first half of 2015, we believe the outlook for 2016 remains healthy.
In this type of slower growth environment, we believe that sector analysis becomes the key to portfolio management. It is not difficult to understand that sectors as differentiated as data warehouses, nursing homes, apartment buildings, and hotels face highly distinct competitive dynamics. Therefore, our research focuses on which companies are best positioned to capitalize on trends that are fundamental to their respective sectors. It is also important to manage exposures by geography as we begin to see shifting supply dynamics in a few select markets. The New York City lodging market, for example, has seen a large increase in supply since the beginning of 2015.
We also remain vigilant regarding interest rates. While current indicators remain benign, we know that a sudden movement can have a dramatic impact on income oriented investments such as real estate. Among other strategies, we hedge our exposure to interest rates by investing in shorter tenors within our credit portfolio and buying REITs with floating rate exposure.
Our focus remains on providing current income and lower volatility by appropriately balancing our portfolio across private real estate equity, public real estate equity and real estate credit. At the same time, our commitment to thorough fundamental research enhances our security selection within each of those three strategies. In combination, we believe that our approach will allow us to continue to deliver on our key investment objectives over the course of the next year and beyond.
Thank you for being a shareholder of the Resource Real Estate Diversified Income Fund.
Sincerely,
John Snowden
Global Portfolio Manager
Resource Real Estate Diversified Income Fund
| 1 | To calculate the quarterly distribution, the Fund’s management will take the income received from the Fund’s portfolio, subtract expenses and divide the result by the total number of shares the Fund’s investors own. The annualized distribution represents a single distribution from the Fund and does not represent the total returns of the Fund. A portion of our distribution has been comprised of a return of capital because certain Fund investments have included preferred and common equity investments, which may include a return of capital. Distributions are not guaranteed. |
| 2 | Bank of America Merrill Lynch U.S. High Yield Index (H0A0) tracks the performance of U.S. dollar denominated below investment grade corporate debt publicly issued in the U.S. domestic market. One cannot directly invest in an index. |
| 3 | A basis point is a unit of measure that is equal to 1/100th of 1%. |
| Resource Real Estate Diversified Income Fund | Portfolio Update |
March 31, 2016 (Unaudited)The Fund’s performance figures for the periods ended March 31, 2016*, compared to its benchmark:
| Resource Real Estate Diversified Income Fund | 6 Month** | 1 Year | Since Inception | Inception |
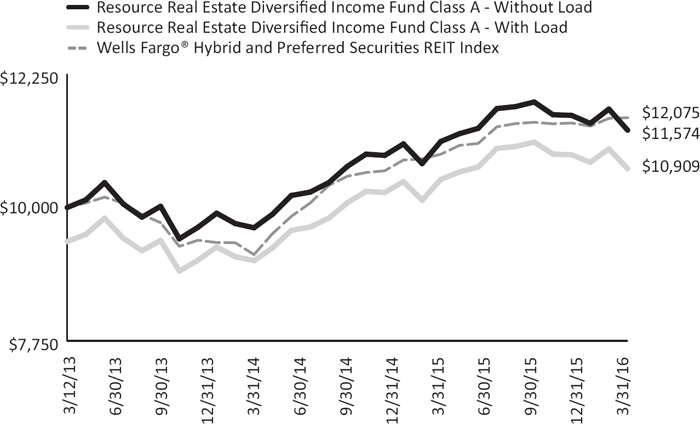
| Class A Shares – Without Load | 1.44% | -1.75% | 4.91% | 3/12/2013 |
| Class A Shares – With Load | -4.41% | -8.17% | 2.89% | 3/12/2013 |
| Class C Shares – Without Load | 1.06% | -2.40% | 3.19% | 8/1/2014 |
| Class C Shares – With Load | -0.46% | -3.88% | 2.27% | 8/1/2014 |
| Class W Shares | 1.21% | -2.14% | 2.30% | 11/21/2014 |
| Class I Shares | 1.33% | -1.85% | 3.54% | 8/1/2014 |
Class U Shares – Without Load1 | 1.34% | -1.66% | 4.91% | 2/12/2015 |
| Class U Shares – With Load | -5.23% | -8.09% | 2.89% | 2/12/2015 |
Class T Shares – Without Load2 | 0.95% | -2.51% | 3.06% | 2/12/2015 |
| Class T Shares – With Load | -0.57% | -3.98% | 2.23% | 2/12/2015 |
Class D Shares3 | 1.11% | -2.13% | 2.30% | 2/12/2015 |
Wells Fargo® Hybrid and Preferred Securities REIT Index | 5.39% | 5.57% | 6.37% | 3/12/2013 |
| * | Returns for periods greater than one year are annualized. |
| ** | Returns shown are for the period, October 1, 2015 to March 31, 2016 and include adjustments in accordance with accounting principles generally accepted in the United States of America. |
| 1 | Returns shown prior to 2/12/2015 are based on the returns of RREDX Class A Shares. If Class U Shares had been available during periods prior to 2/12/2015, the performance shown may have been different. |
| 2 | Returns shown prior to 2/12/2015 are based on the returns of CRREX Class C Shares. If Class T Shares had been available during periods prior to 2/12/2015, the performance shown may have been different. |
| 3 | Returns shown prior to 2/12/2015 are based on the returns of WRREX Class W Shares. If Class D Shares had been available during periods prior to 2/12/2015, the performance shown may have been different. |
The Wells Fargo® Hybrid and Preferred Securities REIT (“WHPSR”) Index is designed to track the performance of preferred securities issued in the U.S. market by real estate investment trusts. The WHPSR Index is composed exclusively of preferred shares and depositary shares. Investors cannot invest directly in an index.
Past performance is not predictive of future results. The investment return and principal value of an investment will fluctuate. An investor’s shares when redeemed, may be worth more or less than the original cost. Total return is calculated assuming reinvestment of all dividends and distributions. Performance figures for periods greater than one year are annualized. The Fund’s total annual operating expense, including underlying funds before fee waivers is 3.30% for Class A, 4.05% for Class C, 3.80% for Class W, 3.05% for Class I, 3.30% for Class U, 4.05% for Class T and 3.80% for Class D shares per the most recent Class specific prospectus filings. After fee waivers, the Fund’s total annual operating expense is 2.24% for Class A, 2.99% for Class C, 2.74% for Class W, 1.99% for Class I, 2.24% for Class U, 2.99% for Class T and 2.74% for Class D shares. Class A and Class U shares are subject to a maximum sales load of 6.50% imposed on purchases. Class T shares are subject to a maximum sales load of 1.50% imposed on purchases. For performance information current to the most recent month-end, please call toll-free 1-855-747-9559.
| Semi-Annual Report | March 31, 2016 | 3 |
| Resource Real Estate Diversified Income Fund | Portfolio Update |
March 31, 2016 (Unaudited)Comparison of the Change in Value of a $10,000 Investment
Portfolio Composition as of March 31, 2016
| Asset Type | Percent of Net Assets |
Real Estate Investment Trusts - Common Stocks | 87.89% |
| Bonds & Notes | 21.01% |
Real Estate Investment Trusts - Preferred Stocks | 9.06% |
| Common Stocks | 1.71% |
| Short Term Investments | 0.12% |
| Total Investments | 119.79% |
| Liabilities in Excess of Other Assets | -19.79% |
| Net Assets | 100.00% |
| Resource Real Estate Diversified Income Fund | Notes to Financial Statements |
March 31, 2016 (Unaudited)
1. ORGANIZATION
Resource Real Estate Diversified Income Fund (the “Trust” or the “Fund”) was organized as a Delaware statutory trust on August 1, 2012 and is registered under the Investment Company Act of 1940, as amended (the “1940 Act”), as a diversified, closed-end management investment company that operates as an interval fund with a continuous offering of Fund shares. The Fund’s investment adviser is Resource Real Estate Inc. (the “Adviser”). The Fund’s primary investment objective is to produce current income, with a secondary objective to achieve a long-term capital appreciation with low to moderate volatility and low to moderate correlation to the broader equity markets. The Fund pursues its investment objectives by investing, under normal circumstances, at least 80% of assets (defined in net assets plus the amount of any borrowing for investment purposes) in real estate and real estate related industry securities, primarily in income producing equity and debt securities.
The Fund currently offers Class A, Class C, Class W, Class I, Class U, Class T and Class D shares. Class A shares commenced operations on March 12, 2013, Class C and Class I shares commenced operations on August 1, 2014, Class W shares commenced operations on November 24, 2014 and Class U, Class T and Class D shares commenced operations on February 13, 2015. With the approval of the Board, effective September 30, 2015, the Fund’s fiscal year end was changed from February 28 to September 30. Class W, Class I and Class D shares are offered at net asset value. Class A and Class U shares are offered at net asset value plus a maximum sales charge of 6.50% and may also be subject to a 0.50% early withdrawal charge, which will be deducted from repurchase proceeds, for shareholders tendering shares fewer than 365 days after the original purchase date, if (i) the original purchase was for amounts of $1 million or more and (ii) the selling broker received the reallowance of the dealer-manager fee. Class C shares are offered at net asset value and may also be subject to a 1.00% early withdrawal charge, which will be deducted from repurchase proceeds, for shareholders tendering shares fewer than 365 days after the original purchase date. Class T shares are offered at net asset value plus a maximum sales charge of 1.50% and may also be subject to a 1.00% early withdrawal charge, which will be deducted from repurchase proceeds, for shareholders tendering shares fewer than 365 days after the original purchase date. Each class represents an interest in the same assets of the Fund and classes are identical except for differences in their sales charge structures and ongoing service and distribution charges. All classes of shares have equal voting privileges except that each class has exclusive voting rights with respect to its service and/or distribution plans. The Fund’s income, expenses (other than class specific distribution fees) and realized and unrealized gains and losses are allocated proportionately each day based upon the relative net assets of each class.
2. SIGNIFICANT ACCOUNTING POLICIES
The following is a summary of significant accounting policies followed by the Fund in preparation of its financial statements. These policies are in conformity with accounting principles generally accepted in the United States of America (“GAAP”). The Fund is considered an investment company for financial reporting purposes under GAAP. The preparation of financial statements requires management to make estimates and assumptions that affect the reported amounts of assets and liabilities and disclosure of contingent assets and liabilities at the date of the financial statements and the reported amounts of income and expenses for the period. Actual results could differ from those estimates.
Security Valuation – Securities listed on an exchange are valued at the last reported sale price at the close of the regular trading session of the exchange on the business day the value is being determined, or in the case of securities listed on NASDAQ, at the NASDAQ Official Closing Price (“NOCP”). In the absence of a sale, such securities shall be valued at the last bid price. Futures are valued based on their daily settlement value. Short-term investments that mature in 60 days or less may be valued at amortized cost, provided such valuations represent fair value.
When price quotations for certain securities are not readily available, or if the available quotations are not believed to be reflective of market value by the Adviser, those securities will be valued at “fair value” as determined in good faith by the Valuation Committee using procedures adopted by and under the supervision of the Fund’s Board of Trustees (the “Board”). There can be no assurance that the Fund could purchase or sell a portfolio security at the price used to calculate the Fund’s net asset value (“NAV”).
Fair valuation procedures may be used to value a substantial portion of the assets of the Fund. The Fund may use the fair value of a security to calculate its NAV when, for example, (1) a portfolio security is not traded in a public market or the principal market in which the security trades is closed, (2) trading in a portfolio security is suspended and not resumed prior to the normal market close, (3) a portfolio security is not traded in significant volume for a substantial period, or (4) the Adviser determines that the quotation or price for a portfolio security provided by a broker-dealer or independent pricing service is inaccurate.
The “fair value” of securities may be difficult to determine and thus judgment plays a greater role in the valuation process. The fair valuation methodology may include or consider the following guidelines, as appropriate: (1) evaluation of all relevant factors, including but not limited to, pricing history, current market level, supply and demand of the respective security; (2) comparison to the values and current pricing of securities that have comparable characteristics; (3) knowledge of historical market information with respect to the security; (4) other factors relevant to the security which would include, but not be limited to, duration, yield, fundamental analytical data, the Treasury yield curve and credit quality.
| Resource Real Estate Diversified Income Fund | Notes to Financial Statements |
March 31, 2016 (Unaudited)
Valuation of Private REITS – The Fund invests a large portion of its assets in Private Real Estate Investment Trusts (“Private REITs”). The Private REITs measure their investment assets at fair value, and report a NAV per share on a calendar quarter basis. In accordance with Accounting Standards Codification (“ASC”) 820, the Fund has elected to apply the practical expedient and to value its investments in Private REITs at their respective NAVs at each quarter. For non-calendar quarter days, the Valuation Committee estimates the fair value of each Private REIT by adjusting the most recent NAV for each REIT, as necessary, by the change in a relevant benchmark that the Valuation Committee has deemed to be representative of the entire Private REIT market.
Valuation of Public Non-Traded REITS – The Fund invests a large portion of its assets in Public Non-Traded Real Estate Investment Trusts (“Public Non-Traded REITs”). The Public Non-Traded REITs do not timely report periodic NAVs and therefore cannot be valued using the practical expedient. The Valuation Committee determines the fair value of Public Non-Traded REITs by considering various factors such as the most recent published NAV, the transaction price, secondary market trades, shareholder redemption and dividend reinvestment programs, discounted cash flows and potentially illiquidity discounts.
Fair Value Measurements – A three-tier hierarchy has been established to classify fair value measurements for disclosure purposes. Inputs refer broadly to the assumptions that market participants would use in pricing the asset or liability, including assumptions about risk. Inputs may be observable or unobservable. Observable inputs are inputs that reflect the assumptions market participants would use in pricing the asset or liability that are developed based on market data obtained from sources independent of the reporting entity. Unobservable inputs are inputs that reflect the reporting entity’s own assumptions about the assumptions market participants would use in pricing the asset or liability that are developed based on the best information available. In accordance with the authoritative guidance on fair value measurements and disclosure under GAAP, the Fund discloses fair value of its investments in a hierarchy that prioritizes the inputs to valuation techniques used to measure the fair value.
Various inputs are used in determining the value of the Fund’s investments as of the reporting period end. These inputs are categorized in the following hierarchy under applicable financial accounting standards:
| Level 1 – | Unadjusted quoted prices in active markets for identical, unrestricted assets or liabilities that the Fund has the ability to access at the measurement date; |
| Level 2 – | Quoted prices which are not active, quoted prices for similar assets or liabilities in active markets or inputs other than quoted prices that are observable (either directly or indirectly) for substantially the full term of the asset or liability at the measurement date; and |
| Level 3 – | Significant unobservable prices or inputs (including the Fund’s own assumptions in determining the fair value of investments) where there is little or no market activity for the asset or liability at the measurement date. |
The availability of observable inputs can vary from security to security and is affected by a wide variety of factors, including, for example, the type of security, whether the security is new and not yet established in the marketplace, the liquidity of markets and other characteristics particular to the security. To the extent that valuation is based on models or inputs that are less observable or unobservable in the market, the determination of fair value requires more judgment. Accordingly, the degree of judgment exercised in determining fair value is greatest for instruments categorized in Level 3.
An investment level within the fair value hierarchy is based on the lowest level input, individually or in the aggregate, that is significant to fair value measurement. The valuation techniques used by the Fund to measure fair value during the six months ended March 31, 2016 maximized the use of observable inputs and minimized the use of unobservable inputs.
| Semi-Annual Report | March 31, 2016 | 25 |
| Resource Real Estate Diversified Income Fund | Notes to Financial Statements |
March 31, 2016 (Unaudited)
The inputs or methodologies used for valuing securities are not necessarily an indication of the risk or liquidity associated with investing in those securities. The following is a summary of the inputs used in valuing the Fund’s investments as of March 31, 2016:
| Investments in Securities at Value | | Level 1 | | | Level 2 | | | Level 3 | | | Total | |
Bonds & Notes(a) | | $ | – | | | $ | 19,691,798 | | | $ | – | | | $ | 19,691,798 | |
Common Stocks(a) | | | 1,600,419 | | | | – | | | | – | | | | 1,600,419 | |
Preferred Stocks(a) | | | 8,491,228 | | | | – | | | | – | | | | 8,491,228 | |
| Real Estate Investment Trusts - Common Stocks | | | | | | | | | | | | | | | | |
Public Non-Traded Real Estate Investment Trusts | | | 3,189,617 | | | | – | | | | 9,720,867 | | | | 12,910,484 | |
Public Non-Traded Real Estate Investment Trusts (Measured at net asset value)(b) | | | – | | | | – | | | | – | | | | 152,838 | |
| Private Real Estate Investment Trusts | | | – | | | | – | | | | 400,000 | | | | 400,000 | |
Private Real Estate Investment Trusts (Measured at net asset value)(b) | | | – | | | | – | | | | – | | | | 24,950,563 | |
| Traded Real Estate Investment Trusts | | | 43,957,679 | | | | – | | | | – | | | | 43,957,679 | |
| Short Term Investments | | | 109,916 | | | | – | | | | – | | | | 109,916 | |
| TOTAL | | $ | 57,348,859 | | | $ | 19,691,798 | | | $ | 10,120,867 | | | $ | 112,264,925 | |
| Other Financial Instruments | | Level 1 | | | Level 2 | | | Level 3 | | | Total | |
| Liabilities | | | | | | | | | | | | |
| Futures Contracts | | $ | (196,926 | ) | | $ | – | | | $ | – | | | $ | (196,926 | ) |
| TOTAL | | $ | (196,926 | ) | | $ | – | | | $ | – | | | $ | (196,926 | ) |
| (a) | For detailed descriptions, see the accompanying Portfolio of Investments. |
| (b) | In accordance with Subtopic 820-10, certain investments that are measured at fair value using the net asset value per share (or its equivalent) practical expedient have not been classified in the fair value hierarchy. The fair value amounts presented in this table are intended to permit reconciliation of the fair value hierarchy to the amounts presented in the Statement of Assets and Liabilities. |
There were no transfers between Levels 1 and 2 during the six months ended March 31, 2016. It is the Fund’s policy to recognize transfers between levels at the end of the reporting period.
The following is a reconciliation of assets in which Level 3 inputs were used in determining value:
| Investments in Securities | Balance as of September 30, 2015 | Accrued discount/ premium | Realized Gain/ (Loss) | Change in Unrealized Appreciation/ (Depreciation) | Purchases | Sales Proceeds | Transfer into Level 3 | Transfer out of Level 3 | Balance as of March 31, 2016 | Net change in unrealized appreciation/ (depreciation) included in the Statements of Operations attributable to Level 3 investments held at March 31, 2016 |
| Resource Real Estate Diversified | | | | | | | | | |
| Income Fund | | | | | | | | |
| Bonds & Notes | $6,779,418 | $(16,994) | $(186,339) | $(562,431) | $– | $(1,174,648) | $– | $(4,839,006) | $– | $– |
Real Estate Investment Trusts -Common Stock | 7,981,894 | – | – | (890,788) | – | – | 3,029,761 | – | 10,120,867 | (727,663) |
| Total | $14,761,312 | $(16,994) | $(186,339) | $(1,453,219) | $– | $(1,174,648) | $3,029,761 | $(4,839,006) | $10,120,867 | $(727,663) |
| Resource Real Estate Diversified Income Fund | Notes to Financial Statements |
March 31, 2016 (Unaudited)
Significant unobservable valuation inputs for material Level 3 investments as of March 31, 2016 are as follows:
| | Fair Value at 3/31/2016 | Valuation Technique | Unobservable Input | Range (Weighted Average) |
| Private Real Estate | | | | |
| Investment Trusts | $400,000 | Net Asset Value adjusted as necessary for any changes in market conditions | N/A | N/A |
| Non-Traded Real Estate | | | | |
| Investment Trusts | $9,720,867 | Transaction Data | Secondary Market Prices | $5.00 - $10.10 |
| | | Discounted Cash Flows | Weighting of Transaction Prices by Volume(a) | 20% |
| | | | Discounted Rate | 3% - 14% |
(a) | Represents amounts used when the reporting entity has determined that market participant would use such multiples when pricing the investments. |
A change to the unobservable input may result in a significant change to the value of the investment as follows:
| Unobservable Input | Impact to Value if Input Increases | Impact to Value if Input Decreases |
| Secondary Market Prices | Increase | Decrease |
| Weighting Transaction Prices by Volume | Increase | Decrease |
| Discounted Rate | Decrease | Increase |
Security Transactions and Investment Income – Investment security transactions are accounted for on a trade date basis. Cost is determined and gains and losses are based upon the specific identification method for both financial statement and federal income tax purposes. Dividend income is recorded on the ex-dividend date and interest income is recorded on the accrual basis. Purchase discounts and premiums on securities are accreted and amortized over the life of the respective securities.
Industry Concentration – If the Fund has significant investments in the securities of issuers within a particular industry, any development affecting that industry will have a greater impact on the value of the net assets of the Fund than would be the case if the Fund did not have significant investments in that industry. In addition, this may increase the risk of loss in the Fund and increase the volatility of the Fund's net asset value per share. Occasionally, market conditions, regulatory changes or other developments may negatively impact this industry, and therefore the value of the Fund's portfolio will be adversely affected. As of March 31, 2016, the Fund had 96.95% of the value of its net assets invested within the Real Estate industry.
Concentration of Credit Risk – The Fund places its cash with one banking institution, which is insured by Federal Deposit Insurance Corporation (FDIC). The FDIC limit is $250,000. At various times throughout the year, the amount on deposit may exceed the FDIC limit and subject the Fund to a credit risk. The Fund does not believe that such deposits are subject to any unusual risk associated with investment activities.
Federal and Other Taxes – No provision for income taxes is included in the accompanying financial statements, as the Fund intends to distribute to shareholders all taxable investment income and realized gains and otherwise comply with Subchapter M of the Internal Revenue Code of 1986, as amended, applicable to regulated investment companies.
The Fund evaluates tax positions taken (or expected to be taken) in the course of preparing the Fund’s tax provisions to determine whether these positions meet a “more-likely-than-not” standard that, based on the technical merits, have a more than fifty percent likelihood of being sustained by a taxing authority upon examination. A tax position that meets the “more-likely-than-not” recognition threshold is measured to determine the amount of benefit to recognize in the financial statements.
As of and during the six months ended March 31, 2016, the Fund did not have a liability for any unrecognized tax benefits. The Fund files U.S. federal, state and local tax returns as required. The Fund’s tax returns are subject to examination by the relevant tax authorities until expiration of the applicable statute of limitations which is generally three years after the filing of the tax return for federal purposes and four years for most state returns. Tax returns for open years have incorporated no uncertain tax positions that require a provision for income taxes.
| Semi-Annual Report | March 31, 2016 | 27 |
| Resource Real Estate Diversified Income Fund | Notes to Financial Statements |
March 31, 2016 (Unaudited)
Foreign Currency – The accounting records of the Fund are maintained in U.S. dollars. Investment securities and other assets and liabilities denominated in a foreign currency and income receipts and expense payments are translated into U.S. dollars using the prevailing exchange rate at the London market close. Purchases and sales of securities are translated into U.S. dollars at the contractual currency rates established at the approximate time of the trade. Net realized gains and losses on foreign currency transactions represent net gains and losses from currency realized between the trade and settlement dates on securities transactions and the difference between income accrued versus income received. The effects of changes in foreign currency exchange rates on investments in securities are included with the net realized and unrealized gain or loss on investment securities.
Distributions to Shareholders – Distributions from investment income are declared and paid quarterly. Distributions from net realized capital gains, if any, are declared and paid annually and are recorded on the ex-dividend date. The character of income and gains to be distributed is determined in accordance with income tax regulations, which may differ from GAAP.
Indemnification – The Trust indemnifies its officers and Trustees for certain liabilities that may arise from the performance of their duties to the Trust. Additionally, in the normal course of business, the Fund enters into contracts that contain a variety of representations and warranties and which provide general indemnities. The Fund’s maximum exposure under these arrangements is unknown, as this would involve future claims that may be made against the Fund that have not yet occurred. However, based on industry experience, the Trust expects the risk of loss due to these warranties and indemnities to be remote.
3. ADVISORY FEES AND OTHER RELATED PARTY TRANSACTIONS
Advisory Fees – Pursuant to an investment advisory agreement (the “Advisory Agreement”), investment advisory services are provided to the Fund by the Adviser. Under the terms of the Advisory Agreement, the Adviser receives monthly fees calculated at an annual rate of 1.25% of the average daily net assets of the Fund. During the six months ended March 31, 2016, the Fund accrued $491,929 in advisory fees.
The Adviser has contractually agreed to waive all or part of its management fees and/or make payments to limit Fund expenses, (including all organization and offering expenses, but excluding interest, brokerage commissions, acquired fund fees and expenses and extraordinary expenses) at least until January 31, 2017, so that the total annual operating expenses of the Fund do not exceed 1.99% per annum of Class A average daily net assets, 2.74% per annum of Class C average daily net assets, 2.49% per annum of Class W average daily net assets, 1.74% per annum of Class I average daily net assets, 1.99% per annum of Class U and average daily net assets, 2.74% per annum of Class T average daily net assets and 2.49% per annum of Class D average daily net assets. Fee waivers and expense payments may be recouped by the Adviser from the Fund, to the extent that overall expenses fall below the expense limitation, within three years of when the amounts were waived or reimbursed. During the six months ended March 31, 2016, the Adviser waived fees and reimbursed expenses of $158,814. During the period ended September 30, 2015, the Adviser waived fees of $307,831, all of which is available to be recouped by the Adviser until September 30, 2018. During the year ended February 28, 2015, the Adviser waived fees and reimbursed expenses of $431,960, all of which is available to be recouped by the Adviser until February 28, 2018. During the period ended February 28, 2014, the Adviser waived fees and reimbursed expenses of $343,290, all of which is available to be recouped by the Adviser until February 28, 2017. The Adviser waived fees and reimbursed expenses of $28,487 from the seed audit which is available to be recouped by the Adviser until March 8, 2016.
Fund Accounting Fees and Expenses – ALPS Fund Services, Inc. (“ALPS”) serves as the Fund’s administrator and accounting agent (the “Administrator”) and receives customary fees from the Fund for such services.
Transfer Agent – DST Systems Inc., an affiliate of ALPS, serves as transfer, dividend paying and shareholder servicing agent for the Fund (“Transfer Agent”).
Distributor – ALPS Distributors, Inc. (the "Distributor") serves as the Fund's distributor. There are no fees paid to the Distributor pursuant to the Distribution Agreement. The Board has adopted, on behalf of the Fund, a Shareholder Servicing Plan under which the Fund may compensate financial industry professionals for providing ongoing services in respect of clients with whom they have distributed shares of the Fund. Under the Shareholder Servicing Plan, the Fund’s Class A, Class C, Class W, Class U, Class T and Class D shares are subject to a shareholder servicing fee at an annual rate of 0.25% of the average daily net assets attributable to that share class. For the six months ended March 31, 2016, the Fund incurred shareholder servicing fees of $98,386. The Class C and Class T shares also pay to the Distributor a distribution fee, payable under a distribution plan adopted by the board, that accrues at an annual rate equal to 0.75% of the Fund’s average daily net assets attributable to Class C and Class T shares and is payable on a quarterly basis. In addition, Class W and Class D shares pay to Resource Securities, Inc. (the “Dealer Manager”), an affiliate of the Adviser, a dealer manager fee, payable under a distribution plan adopted by the board, that accrues at an annual rate equal to 0.50% of the Fund’s average daily net assets attributable to Class W and Class D shares and is payable on a quarterly basis. Class A, Class I and Class U shares are not currently subject to a distribution fee. For the six months ended March 31, 2016, the Fund accrued $71,274 in distribution fees and $44,803 in dealer manager fees.
| Resource Real Estate Diversified Income Fund | Notes to Financial Statements |
March 31, 2016 (Unaudited)
The Distributor acts as the Fund’s principal underwriter in a continuous public offering of the Fund’s shares. The Distributor is an affiliate of ALPS. During the six months ended March 31, 2016, no fees were retained by the Distributor.
Trustees – Effective November 21, 2014, each Trustee who is not affiliated with the Trust or Adviser will receive an annual fee of $10,000, plus $2,000 for attending the annual in-person meeting of the Board of Trustees, plus $500 for attending each of the remaining telephonic meetings, as well as reimbursement for any reasonable expenses incurred attending the meetings. None of the executive officers receive compensation from the Trust. Prior to November 21, 2014, each Trustee who was not affiliated with the Trust or Adviser received an annual fee of $5,000, as well as reimbursement for any reasonable expenses incurred attending the meetings.
4. INVESTMENT TRANSACTIONS
The cost of purchases and proceeds from the sale of securities, other than short-term securities, for the six months ended March 31, 2016 amounted to $43,030,209 and $5,948,640, respectively.
5. DERIVATIVE TRANSACTIONS
Derivative Instruments and Hedging Activities – The following discloses the Fund’s use of derivative instruments and hedging activities.
The Fund’s investment objectives not only permit the Fund to purchase investment securities, it also allows the Fund to enter into various types of derivative contracts such as futures. In doing so, the Fund will employ strategies in differing combinations to permit them to increase, decrease, or change the level or types of exposure to market factors. Central to those strategies are features inherent to derivatives that make them more attractive for this purpose than equity or debt securities; they require little or no initial cash investment, they can focus exposure on only certain selected risk factors, and they may not require the ultimate receipt or delivery of the underlying security (or securities) to the contract. This may allow the Fund to pursue their objectives more quickly and efficiently than if it were to make direct purchases or sales of securities capable of effecting a similar response to market factors.
Market Risk Factors – In pursuit of its investment objectives, the Fund may seek to use derivatives to increase or decrease their exposure to the following market risk factors:
Foreign Exchange Rate Risk: Foreign exchange rate risk relates to the change in the U.S. dollar value of a security held that is denominated in a foreign currency. The value of a foreign currency denominated security will decrease as the dollar appreciates against the currency, while the value of the foreign currency denominated security will increase as the dollar depreciates against the currency.
Risk of Investing in Derivatives: The Fund’s use of derivatives can result in losses due to unanticipated changes in the market risk factors and the overall market.
Derivatives may have little or no initial cash investment relative to their market value exposure and therefore can produce significant gains or losses in excess of their cost. This use of embedded leverage allows the Fund to increase its market value exposure relative to its net assets and can substantially increase the volatility of the Fund’s performance.
Additional associated risks from investing in derivatives also exist and potentially could have significant effects on the valuation of the derivative and the Fund. Typically, the associated risks are not the risks that the Fund is attempting to increase or decrease exposure to, per their investment objectives, but are the additional risks from investing in derivatives.
Examples of these associated risks are liquidity risk, which is the risk that the Fund will not be able to sell the derivative in the open market in a timely manner, and counterparty credit risk, which is the risk that the counterparty will not fulfill its obligation to the Fund.
Futures – The Fund may invest in futures contracts in accordance with its investment objective. The Fund does so for a variety of reasons, including for cash management, hedging or non-hedging purposes in an attempt to achieve investment returns consistent with the Fund’s investment objective. A futures contract provides for the future sale by one party and purchase by another party of a specified quantity of the security or other financial instrument at a specified price and time. A futures contract on an index is an agreement pursuant to which two parties agree to take or make delivery of an amount of cash equal to the difference between the value of the index at the close of the last trading day of the contract and the price at which the index contract was originally written. Futures transactions may result in losses in excess of the amount invested in the futures contract. There can be no guarantee that there will be a correlation between price movements in the hedging vehicle and in the portfolio securities being hedged. An incorrect correlation could result in a loss on both the hedged securities in the Fund and the hedging vehicle so that the portfolio return might have been greater had hedging not been attempted. There can be no assurance that a liquid market will exist at a time when a Fund seeks to close out a futures contract or a futures option position. Lack of a liquid market for any reason may prevent the Fund from liquidating an unfavorable position, and the Fund would remain obligated to meet margin requirements until the position is closed. In addition, a Fund could be exposed to risk if the counterparties to the contracts are unable to meet the terms of their contracts. With exchange-traded futures, there is minimal counterparty credit risk to the Fund since futures are exchange-traded and the exchange’s clearinghouse, as counterparty to all exchange-traded futures, guarantees the futures against default.
| Semi-Annual Report | March 31, 2016 | 29 |
| Resource Real Estate Diversified Income Fund | Notes to Financial Statements |
March 31, 2016 (Unaudited)
When a purchase or sale of a futures contract is made by the Fund, the Fund is required to deposit with its custodian (or broker, if legally permitted) a specified amount of liquid assets (“initial margin”). The margin required for a futures contract is set by the exchange on which the contract is traded and may be modified during the term of the contract. The initial margin is in the nature of a performance bond or good faith deposit on the futures contract that is returned to the Fund upon termination of the contract, assuming all contractual obligations have been satisfied. Each day the Fund may pay or receive cash, called “variation margin,” equal to the daily change in value of the futures contract. Such payments or receipts are recorded for financial statement purposes as unrealized gains or losses by the Fund. Variation margin does not represent a borrowing or loan by the Fund but is instead a settlement between the Fund and the broker of the amount one would owe the other if the futures contract expired. When the contract is closed, the Fund records a realized gain or loss equal to the difference between the value of the contract at the time it was opened and the value at the time it was closed.
The location in the Statements of Assets and Liabilities of the Fund’s derivative positions as of March 31, 2016 are as follows:
| Risk Exposure | Statement of Assets and Liabilities Location | | Value | | Statement of Assets and Liabilities Location | | Value | |
| Resource Real Estate Diversified Income Fund | | | | | | | | |
Foreign Exchange Contracts (Futures contracts)(a) | Variation margin receivable | | $ | – | | Variation margin payable | | $ | (196,926 | ) |
| Total | | | $ | – | | | | $ | (196,926 | ) |
| (a) | The value presented includes cumulative gain on open futures contracts; however, the value reflected on the accompanying Statement of Assets and Liabilities is only the unsettled variation margin payable as of March 31, 2016. |
The location in the Statement of Operations of the Fund’s derivative positions for the six months ended March 31, 2016 are as follows:
| Risk Exposure | Statement of Operations Location | | Realized Gain/(Loss) on Derivatives Recognized in Income | | | Change in Unrealized Gain/(Loss) on Derivatives Recognized in Income | |
| Resource Real Estate Diversified Income Fund | | | | | | | |
| Foreign Exchange Contracts (Futures contracts) | Net realized gain on futures contracts/Net change in unrealized deprecation on futures contracts | | $ | 98,330 | | | $ | (221,810 | ) |
| Total | | | $ | 98,330 | | | $ | (221,810 | ) |
The average notional value of futures contracts during the six months ended March 31, 2016 was $(5,024,115).
| Resource Real Estate Diversified Income Fund | Notes to Financial Statements |
March 31, 2016 (Unaudited)
6. TAX BASIS INFORMATION
The tax character of distributions paid for the periods ended September 30, 2015 and February 28, 2015 were as follows:
| | | Ordinary Income | | | Long-Term Capital Gain | | | Return of Capital | |
| Resource Real Estate Diversified Income Fund | | $ | 757,462 | | | $ | 201,255 | | | $ | 1,240,390 | |
| | | Ordinary Income | | | Long-Term Capital Gain | | | Return of Capital | |
| Resource Real Estate Diversified Income Fund | | $ | 817,261 | | | $ | 15,057 | | | $ | 111,438 | |
The following information is computed on a tax basis for each item as of March 31, 2016:
| | | Gross Appreciation (excess of value over tax cost) | | | Gross Depreciation (excess of tax cost over value) | | | Net Unrealized Appreciation | | | Cost of Investments for Income Tax Purposes | |
| Resource Real Estate Diversified Income Fund | | $ | 6,728,642 | | | $ | (6,722,074 | ) | | $ | 6,568 | | | $ | 112,258,357 | |
The difference between book basis and tax basis distributable earnings and unrealized appreciation/(depreciation) is primarily attributable to the tax deferral of losses on wash sales, mark-to-market on passive foreign investment companies and certain other investments.
7. REPURCHASE OFFERS
Pursuant to Rule 23c-3 under the 1940 Act, the Fund offers shareholders on a quarterly basis the option of redeeming shares, at net asset value, of up to 5% of its issued and outstanding shares as of the close of regular business hours on the New York Stock Exchange on the Repurchase Pricing Date (defined below). If shareholders tender for repurchase more than 5% of the outstanding shares of the Fund, the Fund may, but is not required to, repurchase up to an additional 2%. If the Fund determines not to repurchase an additional 2%, or if more than 7% of the shares are tendered, then the Fund will repurchase shares on a pro rata basis based upon the number of shares tendered by each shareholder. There can be no assurance that the Fund will be able to repurchase all shares that each shareholder has tendered, even if all the shares in a shareholder's account are tendered. In the event of an oversubscribed offer, you may not be able to tender all shares that you wish to tender and may have to wait until the next quarterly repurchase offer to tender the remaining shares. Subsequent repurchase requests will not be given priority over other shareholder requests.
During the six months ended March 31, 2016, the Fund completed two quarterly repurchase offers. In these offers, the Fund offered to repurchase up to 5% of the number of its outstanding shares as of the Repurchase Pricing Dates. The result of those repurchase offers were as follows:
| | Repurchase Offer #1 | Repurchase Offer #2 |
| Commencement Date | September 17, 2015 | December 16, 2015 |
| Repurchase Request Deadline | October 16, 2015 | January 15, 2016 |
| Repurchase Pricing Date | October 16, 2015 | January 15, 2016 |
| Amount Repurchased | $886,480 | $3,929,625 |
| Shares Repurchased | 88,275 | 419,548 |
Exchanges between classes of shares can occur outside of the quarterly repurchase offer window.
8. BANK LINE OF CREDIT
The Fund has a $25,000,000 secured revolving bank line of credit through BNP Paribas Prime Brokerage International, Ltd. (the “Bank”) for purpose of investment purchases subject to the limitations of the 1940 Act for borrowings.
Borrowings under this arrangement bear interest at the Bank’s 3 month LIBOR plus 95 basis points at the time of borrowing. During the six months ended March 31, 2016, the Fund incurred $112,435 of interest expense related to the borrowings. Average borrowings and the average interest rate during the six months ended March 31, 2016 were $15,059,855 and 1.47%, respectively. The largest outstanding borrowing during the six months ended March 31, 2016 was $19,704,560. As of March 31, 2016, the Fund had $17,743,493 of outstanding borrowings.
| Semi-Annual Report | March 31, 2016 | 31 |
| Resource Real Estate Diversified Income Fund | Notes to Financial Statements |
March 31, 2016 (Unaudited)
As collateral security for the Bank line of credit, the Fund grants the Bank a first position security interest in and lien on all securities of any kind or description held by the Fund in the pledge account. As of March 31, 2016, the Fund had $35,826,612 in securities pledged as collateral for the line of credit.
9. UNFUNDED COMMITMENTS
As of March 31, 2016, in addition to the unfunded commitments for investments currently held as of the reporting date (Refer to Portfolio of Investments footnote disclosures), the Fund had $9,100,000 of unfunded commitments relating to potential future investments not currently held as reported below. The value of unfunded commitments reported as of March 31, 2016 approximates fair value.
| Security | | Unfunded Commitments as of March 31, 2016 | |
| Clarion Partners Debt Fund REIT, LLC | | $ | 2,000,000 | |
| Clarion Ventures 4, LP | | | 2,500,000 | |
| UBS Trumbull Property Income Fund, LP | | | 4,600,000 | |
10. SUBSEQUENT EVENTS
Subsequent events after the date of the Statement of Assets and Liabilities have been evaluated through the date the financial statements were issued.
The Fund completed a quarterly repurchase offer on April 13, 2016 which resulted in 303,788 of Fund shares being repurchased for $2,937,988.
Effective May 4th, the Fund's secured bank line of credit through the Bank has been increased from $25,000,000 to $50,000,000.
Management has determined that there were no other subsequent events to report through the issuance of these financial statements.
| Resource Real Estate Diversified Income Fund | Additional Information |
March 31, 2016 (Unaudited)
1. PROXY VOTING POLICIES AND VOTING RECORD
A description of the policies and procedures that the Fund uses to vote proxies relating to portfolio securities is available without charge upon request by calling toll-free 855-747-9559, or on the Securities and Exchange Commission’s (“SEC”) website at http://www.sec.gov. Information regarding how the Fund voted proxies relating to portfolio securities during the most recent 12-month period ended June 30th is available without charge upon request by calling toll-free 855-747-9559, or on the SEC’s website at http://www.sec.gov.
2. QUARTERLY PORTFOLIO HOLDINGS
The Fund files a complete listing of portfolio holdings for the Fund with the SEC as of the first and third quarters of each fiscal year on Form N-Q. The filings are available upon request by calling 855-747-9559. Furthermore, you may obtain a copy of the filing on the SEC’s website at http://www.sec.gov. The Fund’s Form N-Q may also be reviewed and copied at the SEC’s Public Reference Room in Washington, D.C., and information on the operation of the Public Reference Room may be obtained by calling 1-800-SEC-0330.
| Semi-Annual Report | March 31, 2016 | 33 |
| Resource Real Estate Diversified Income Fund | Renewal of Advisory Agreement |
March 31, 2016 (Unaudited)
At a meeting held on November 11, 2015 (the “Meeting”), the Board of Trustees (the “Board” or the “Trustees”) of Resource Real Estate Diversified Income Fund (the “Trust” or the “Fund”), including a majority of those Trustees who are not “interested persons” of the Trust, as such term is defined under Section 2(a)(19) of the Investment Company Act of 1940, as amended, considered the renewal of the investment advisory agreement (the “Management Agreement”) between Resource Real Estate, Inc. (the “Adviser”) and the Trust. In considering the renewal of the Management Agreement, the Trustees received materials specifically relating to the Management Agreement.
The Trustees were assisted by legal counsel throughout the Management Agreement review process. The Board relied upon the advice of legal counsel and their own business judgment in determining the material factors to be considered in evaluating the Management Agreement and the weight to be given to each factor considered. The conclusions reached by the Trustees were based on a comprehensive evaluation of all of the information provided and were not the result of any one factor. Moreover, each Trustee may have afforded different weight to the various factors in reaching his conclusions with respect to the approval of the Management Agreement.
Nature, Extent and Quality of Service: The Board examined the nature, extent and quality of the services provided by the Adviser to the Fund. They noted that the Board receives a significant level of input and quality materials from the Adviser and provides professional managerial and operational teams to run and support the Fund. They further noted that the Adviser continues to invest in high quality professional personnel to support the Fund, having recently added an experienced Lead Portfolio Manager and an Associate Analyst since the last renewal of the Management Agreement. The Adviser reported that its parent company has extensive experience sponsoring investment funds. The Trustees discussed the nature of the Adviser’s operations, the quality of the Adviser’s compliance infrastructure and the experience and background of all key personnel of its fund management team. The Trustees further considered the key risks associated with the Fund’s investment strategy and the policies and procedures adopted by the Adviser to mitigate those risks. They also discussed the Adviser’s practices for monitoring compliance with the Fund’s investment limitations as well as the Adviser’s broker-dealer selection practices. The Trustees concluded that the Adviser had sufficient quality and depth of personnel, resources, investment methods and compliance policies and procedures essential to the continued performance of its duties under the Management Agreement and that the nature, overall quality and extent of the management services provided by the Adviser to the Fund were satisfactory.
Performance: The Trustees considered the performance of the Fund. They noted that the Fund outperformed its peer group and substantially outperformed its Morningstar category average over the one-year period. The Trustees also noted that the Fund only slightly underperformed its benchmark index (the Wells Fargo® Hybrid and Preferred Securities REIT Index) over the one-year period and since inception. The Trustees expressed their appreciation for the performance and the careful, thoughtful and professional manner in which the Adviser implemented the strategy. They reasoned that the Adviser was managing the Fund’s portfolio in accordance with prospectus guidelines and concluded that the Fund’s performance was satisfactory.
Fees and Expenses: The Trustees noted that the Fund charges a 1.25% management fee and that the fee was below the average of the Fund’s Morningstar category and slightly higher, but reasonably within the range, of its peer group. They further noted that the Fund’s net expense ratio was below the averages of the Morningstar category funds and the peer group funds. The Trustees further noted the expense cap in place, and after further discussion, concluded that the Fund’s fees and expenses were not unreasonable.
Economies of Scale: The Trustees considered whether there will be economies of scale with respect to the management of the Fund. They considered that the Adviser reported its belief that that the size of the Fund would be approximately $175 million at the end of 2016 and that the Fund would likely begin to benefit from economies of scale when assets under management reach approximately $200 million. After further discussion, the Trustees concluded that the absence of breakpoints at this time was acceptable, but that economies of scale would be revisited in the future if the Fund grows materially in size.
Profitability: The Trustees reviewed the profitability analysis provided by the Adviser and noted that the Adviser had estimated that it incurred a loss over the past fiscal year due to its relationship with the Fund, due in part to its participation in the Fund’s fee waiver and expense limitation arrangement. The Trustees concluded excessive profitability was not a concern.
Conclusion: Having requested and received such information from the Adviser as the Board of the Fund believed to be reasonably necessary to evaluate the terms of the Management Agreement, and as assisted by the advice of counsel, the Board concluded that the advisory fee is reasonable and that renewal of the Management Agreement is in the best interests of the shareholders of the Fund.
Page Intentionally Left Blank
INVESTMENT ADVISER
Resource Real Estate, Inc.
One Crescent Drive, Suite 203
Philadelphia, Pennsylvania 19112
DISTRIBUTOR
ALPS Distributors, Inc.
1290 Broadway, Suite 1100
Denver, Colorado 80203
LEGAL COUNSEL
Thompson Hine LLP
41 South High Street, Suite 1700
Columbus, Ohio 43215
INDEPENDENT REGISTERED
PUBLIC ACCOUNTING FIRM
BBD, LLP
1835 Market Street, 26th Floor
Philadelphia, Pennsylvania 19103
Must be accompanied or preceded by a Prospectus.
ALPS Distributors, Inc. is the Distributor for Resource Real Estate Diversified Income Fund.
Item 2. Code of Ethics.
Not applicable to this report.
Item 3. Audit Committee Financial Expert.
Not applicable to this report.
Item 4. Principal Accountant Fees and Services.
Not applicable to this report.
Item 5. Audit Committee of Listed Registrants.
Not applicable to the registrant.
Item 6. Investments.
| (a) | The schedule of investments is included as part of the Report to Shareholders filed under Item 1 of this report. |
| (b) | Not applicable to the registrant. |
Item 7. Disclosure of Proxy Voting Policies and Procedures for Closed-End Management Investment Companies.
Not applicable to this report.
Item 8. Portfolio Managers of Closed-End Management Investment Companies.
| (a) | Not applicable to this report. |
| (b) | Not applicable to this report. |
Item 9. Purchases of Equity Securities by Closed-End Management Investment Company and Affiliates Purchasers.
None.
Item 10. Submission of Matters to a Vote of Security Holders.
None.
Item 11. Controls and Procedures.
| (a) | Based on an evaluation of the registrant’s disclosure controls and procedures as of a date within 90 days of the filing date of this report, the registrant’s principal executive officer and principal financial officer have concluded that the disclosure controls and procedures are reasonably designed to ensure that the information required in filings on Form N-CSR is recorded, processed, summarized and reported by the filing date, including that information required to be disclosed is accumulated and communicated to the registrant’s management, including the registrant’s principal executive officer and principal financial officer, as appropriate to allow timely decisions regarding required disclosure. |
| (b) | There were no significant changes in the registrant’s internal control over financial reporting that occurred during the registrant’s last fiscal half-year that have materially affected, or are reasonably likely to materially affect, the registrant’s internal control over financial reporting. |
Item 12. Exhibits.
| (a)(2) | Certifications required by Item 12(a)(2) of Form N-CSR are filed herewith as Exhibit 99.CERT. |
| (b) | Certifications required by Item 12(b) of Form N-CSR are filed herewith as Exhibit 99.906CERT. |
SIGNATURES
Pursuant to the requirements of the Securities Exchange Act of 1934 and the Investment Company Act of 1940, the registrant has duly caused this report to be signed on its behalf by the undersigned, thereunto duly authorized.
RESOURCE REAL ESTATE DIVERSIFIED INCOME FUND
| By: | /s/ Alan Feldman | |
| | Alan Feldman | |
| | Chief Executive Officer (Principal Executive Officer) | |
Date: June 2, 2016
Pursuant to the requirements of the Securities Exchange Act of 1934 and the Investment Company Act of 1940, this report has been signed below by the following persons on behalf of the registrant and in the capacities and on the dates indicated.
| By: | /s/Alan Feldman | |
| | Alan Feldman | |
| | Chief Executive Officer (Principal Executive Officer) | |
Date: June 2, 2016
| By: | /s/ Steven R. Saltzman | |
| | Steven R. Saltzman | |
| | Treasurer (Principal Financial Officer) | |
Date: June 2, 2016