UNITED STATES
SECURITIES AND EXCHANGE COMMISSION
WASHINGTON, D.C. 20549
FORM N-CSR
CERTIFIED SHAREHOLDER REPORT OF REGISTERED
MANAGEMENT INVESTMENT COMPANIES
811-22749
(Investment Company Act file number)
Resource Real Estate Diversified Income Fund
(Exact name of registrant as specified in charter)
1845 Walnut Street, 18th Floor
Philadelphia, PA 19103
(Address of principal executive offices) (Zip code)
The Corporation Trust Company
Corporation Trust Center, 1209 Orange Street
Wilmington, DE 19801
(Name and address of agent for service)
Copy to:
JoAnn M. Strasser Thompson Hine LLP 41 South High Street, 17th Floor Columbus, OH 43215 (614) 469-3265 | Darshan Patel Resource Real Estate Diversified Income Fund 712 Fifth Avenue, 12th Floor New York, NY 10019 (212) 506-3899 |
Registrant's telephone number, including area code: (215) 231-7050
Date of fiscal year end: September 30
Date of reporting period: October 1, 2016 - March 31, 2017
Item 1. Reports to Stockholders.
TABLE OF CONTENTS
| Shareholder Letter | 1 |
| Portfolio Update | 3 |
| Portfolio of Investments | 5 |
| Statement of Assets and Liabilities | 11 |
| Statement of Operations | 13 |
| Statements of Changes in Net Assets | 14 |
| Statements of Cash Flows | 17 |
| Financial Highlights | |
| Class A | 18 |
| Class C | 19 |
| Class W | 20 |
| Class I | 21 |
| Class U | 22 |
| Class T | 23 |
| Class D | 24 |
| Notes to Financial Statements | 25 |
| Additional Information | 34 |
| Resource Real Estate Diversified Income Fund | Shareholder Letter |
March 31, 2017 (Unaudited)
Dear Shareholders:
We are pleased to present you with the Resource Real Estate Diversified Income Fund Semi Annual Report for the first half of the 2017 fiscal year. As the Fund’s Advisor, Resource Real Estate has maintained a consistent approach to investing our clients’ capital and has continued to deliver on its key investment objectives of current income and low to moderate volatility.
Our investable universe broadly encompasses three main strategies: Traded Equity (US and international REITs), Real Estate Credit (preferred REIT equity and bonds) and Direct Real Estate (including Private Equity and Non‐traded REITs). Each investment type offers relative advantages. For instance, Traded Equity is a more liquid asset class. Direct Real Estate offers higher levels of capital stability and Real Estate Credit can offer higher security and income.
Our first decision is to determine the appropriate balance within the Fund among these three investment strategies. We base this decision upon where we see the best relative value in the context of achieving the Fund’s strategic objectives.
Investment Environment
We believe that US real estate markets remain solid with manageable supply dynamics, steady economic growth, leverage in line with historical norms, and financing rates still below historical averages. That said, guidance from both REIT CEOs and Real Estate Private Equity managers suggest that the rate of earnings growth is likely to slow from approximately 6‐7%1 on average in 2016 to a range of 2‐4% in 2017. We are not surprised to find some deceleration of growth given the strong performance over the past three years.
With real estate sector growth expectations moderating, the six months ended March 31, 2017 was a period of underperformance for the US NAREIT Index relative to the broader equity markets. The S&P500 realized total returns of 10.12% during the period, reflecting investor optimism regarding strengthening in the global economy and the potential for stimulative economic policies from the new Administration. By contrast, the US NAREIT Index declined by 0.81% as investors absorbed guidance towards lower sector growth and also reacted to the potential for higher interest rates.
The small movement in the US NAREIT Index during the six month period masked interim periods of higher volatility tied to interest rate concerns as well as divergent performance in certain subsectors. Regional mall REITs were down over 15%2 based on concerns regarding competition from online retailers and poor performance from conventional mall anchors such as Macy’s and Sears. Healthcare REITs recovered somewhat as prospects for the repeal of the Affordable Care Act receded but still ended up down by more than 4%3 for the period. In stark contrast to those two sectors, the Hotel REIT sector returned over 18%4 as rising business and consumer confidence improved prospects for the travel industry.
Fund Performance
The Fund continued to deliver on its objectives of providing attractive current income and lower volatility than the broader equity markets for its shareholders. Through March 31, 2017, the Fund has paid a consistent distribution for 16 straight quarters, which corresponded to an annualized rate of 5.88%5 for the most recent quarter ended March 31, 2017. In addition, for that same period, the Fund’s volatility (as measured by standard deviation) was 4.80% compared to 7.70% for the S&P500, 5.87% for the Wells Fargo Hybrid and Preferred Securities REIT Index, and 13.82% for the US NAREIT Index.
Given our defensive positioning, we were pleased that the Fund had a total return of 3.02% for the first half of the fiscal year as compared to a return of 0.95% for the Wells Fargo Hybrid and Preferred Securities REIT Index and a decline of 0.81% for the US NAREIT Index. All three of the Fund’s primary investment strategies advanced. Within the Traded Equity strategy, rising valuations for Mortgage REITs helped offset a small decline in Equity REITs.
Investment Positioning
We target an approximately equal weighting in each of our main strategies but diverge from that balanced approach when we believe we can capture incremental returns by doing so. Thus, we begin the second half of the 2017 fiscal year with slight overweight in the Public Equity Strategy and a slight underweight in the Private Equity strategy as we took advantage of volatility in early 2017 to acquire REIT stocks at what we believe to be attractive valuations. As relative value between these strategies shifts through the second half of the fiscal year, we will rebalance as appropriate.
We seek broad diversification6 not only at an asset class level but also across real estate sectors Such diversification may protect the portfolio as real estate markets continue to adjust to policy changes by the new Administration. Furthermore, our commitment to thorough fundamental research is intended to enhance our security selection within each of those sectors.
| Semi-Annual Report | March 31, 2017 | 1 |
| Resource Real Estate Diversified Income Fund | Shareholder Letter |
March 31, 2017 (Unaudited)
We also continue to be vigilant regarding interest rates. In fact, the sharp spike in Treasury rates after the Presidential election illustrated the importance of our allocations to investments that perform well in a rising rate environment such as Mortgage REITs as well as floating rate and short term credit instruments. Our Direct Real Estate strategy also seeks to provide a source of stability as market sentiment on interest rates shifts.
We are proud of our track record over the past four years and believe that our approach to asset allocation, security selection and diversification will enable us to continue to deliver on our key investment objectives over the course of the next year and beyond. Thank you for being a shareholder of the Resource Real Estate Diversified Income Fund.
Sincerely,
John Snowden
Global Portfolio Manager
Resource Real Estate Diversified Income Fund
| 1 | Annual Net Operating Income growth rate per US NAREIT T-Tracker Q4 2016 report. |
| 2 | Bloomberg Mall REIT Index (BBREMALL). Data as of 3/31/2017. |
| 3 | Bloomberg Healthcare REIT Index (BBREHLTH). Data as of 3/31/2017. |
| 4 | Bloomberg Hotel REIT Index (BBREHOTL). Data as of 3/31/2017. |
| 5 | To calculate the quarterly distribution, the Fund’s management takes the income received from the Fund’s portfolio, subtracts expenses and divides the result by the total number of shares the Fund’s investors own. The annualized distribution represents a single distribution from the Fund and does not represent the total returns of the Fund. A portion of our distribution has been comprised of a return of capital because certain Fund investments have included preferred and common equity investments, which may include a return of capital. Distributions are not guaranteed. |
| 6 | Diversification does not eliminate the risk of experiencing investment losses. |
| Resource Real Estate Diversified Income Fund | Portfolio Update |
March 31, 2017 (Unaudited)
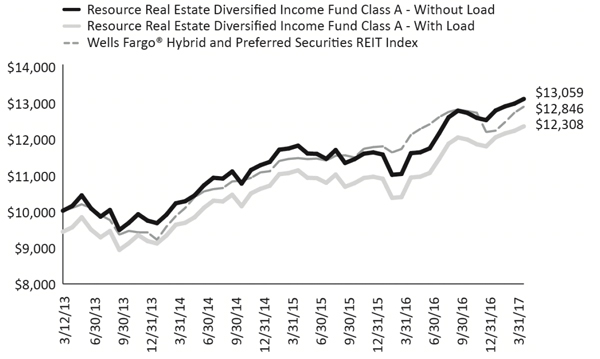
The Fund’s performance figures for the periods ended March 31, 2017*, compared to its benchmark:
| Resource Real Estate Diversified Income Fund | 6 Month** | 1 Year | 3 Year | Since Inception | Inception |
| Class A Shares – Without Load | 3.02% | 12.82% | 8.37% | 6.81% | 3/12/2013 |
| Class A Shares – With Load | ‐3.65% | 5.50% | 6.25% | 5.26% | 3/12/2013 |
| Class C Shares | 2.63% | 11.87% | – | 6.37% | 8/1/2014 |
| Class W Shares | 2.89% | 12.30% | – | 6.43% | 11/21/2014 |
| Class I Shares | 2.57% | 11.47% | – | 6.45% | 8/1/2014 |
Class U Shares – Without Load1 | 3.12% | 12.93% | 8.41% | 6.83% | 2/12/2015 |
| Class U Shares – With Load | ‐3.55% | 5.60% | 6.01% | 5.06% | 2/12/2015 |
Class T Shares – Without Load2 | 2.73% | 11.99% | – | 6.33% | 2/12/2015 |
| Class T Shares – With Load | 1.15% | 10.27% | – | 5.74% | 2/12/2015 |
Class D Shares3 | 2.86% | 12.26% | – | 6.41% | 2/12/2015 |
Wells Fargo® Hybrid and Preferred Securities REIT Index | 0.95% | 6.38% | 8.44% | 6.38% | 3/12/2013 |
| * | Returns for periods greater than one year are annualized. |
| ** | Returns shown are for the period, October 1, 2016 to March 31, 2017 and include adjustments in accordance with accounting principles generally accepted in the United States of America. |
| 1 | Returns shown prior to 2/12/2015 are based on the returns of RREDX Class A Shares. If Class U Shares had been available during periods prior to 2/12/2015, the performance shown may have been different. |
| 2 | Returns shown prior to 2/12/2015 are based on the returns of CRREX Class C Shares. If Class T Shares had been available during periods prior to 2/12/2015, the performance shown may have been different. |
| 3 | Returns shown prior to 2/12/2015 are based on the returns of WRREX Class W Shares. If Class D Shares had been available during periods prior to 2/12/2015, the performance shown may have been different. |
The Wells Fargo® Hybrid and Preferred Securities REIT (“WHPSR”) Index is designed to track the performance of preferred securities issued in the U.S. market by real estate investment trusts. The WHPSR Index is composed exclusively of preferred shares and depositary shares. Investors cannot invest directly in an index.
Past performance is not predictive of future results. The investment return and principal value of an investment will fluctuate. An investor’s shares when redeemed, may be worth more or less than the original cost. Total return is calculated assuming reinvestment of all dividends and distributions. Performance figures for periods greater than one year are annualized. The Fund’s total annual operating expense, including underlying funds before fee waivers is 2.93% for Class A, 3.68% for Class C, 2.93% for Class W, 2.68% for Class I, 2.93% for Class U, 3.68% for Class T and 3.43% for Class D shares per the most recent Class specific prospectus filings. After fee waivers, the Fund’s total annual operating expense is 2.54% for Class A, 3.29% for Class C, 2.54% for Class W, 2.29% for Class I, 2.54% for Class U, 3.29% for Class T and 3.04% for Class D shares. Class A are subject to a maximum sales load of 5.75% imposed on purchases Class U shares are subject to a maximum sales load of 6.50% imposed on purchases. Class T shares are subject to a maximum sales load of 1.50% imposed on purchases. For performance information current to the most recent month-end, please call toll-free 1-855-747-9559.
| Semi-Annual Report | March 31, 2017 | 3 |
| Resource Real Estate Diversified Income Fund | Portfolio Update |
March 31, 2017 (Unaudited)
Comparison of the Change in Value of a $10,000 Investment
Portfolio Composition as of March 31, 2017
| Asset Type | Percent of Net Assets |
| Real Estate Investment Trusts ‐ Common Stocks | 87.27% |
| Real Estate Investment Trusts ‐ Preferred Stocks | 23.47% |
| Bonds & Notes | 13.31% |
| Private Investment Funds | 1.15% |
| Purchased Options | 0.52% |
| Bank Loan | ‐25.41% |
| Total Investments | 100.31% |
| Liabilities in Excess of Other Assets | ‐0.31% |
| Net Assets | 100.00% |
| Resource Real Estate Diversified Income Fund | Portfolio of Investments |
March 31, 2017 (Unaudited)
| Principal ($) | | | | Value |
| | | | BONDS & NOTES (13.31%) | | | | |
| | | | ASSET BACKED SECURITIES (0.99%) | | | | |
| | 1,750,000 | | ACA CLO 2007‐1, Ltd., 0.000%, 06/15/2022(a)(b) | | $ | 175 | |
| | 2,000,000 | | Z Capital Credit Partners CLO 2015‐1, Ltd., 6.993%, 07/16/2027(c) | | | 1,941,474 | |
| | | | | | | 1,941,649 | |
| | | | COMMERCIAL MORTGAGE BACKED SECURITIES (12.32%) | | | | |
| | 200,000 | | Banc of America Commercial Mortgage Trust 2006‐4, 5.734%, 07/10/2046(c)(d) | | | 186,850 | |
| | 500,000 | | Banc of America Commercial Mortgage Trust 2007‐3 AJ, 5.761%, 06/10/2017(c) | | | 502,395 | |
| | 1,660,000 | | Banc of America Commercial Mortgage Trust 2007‐3 B, 5.761%, 06/10/2017(c) | | | 1,664,202 | |
| | 320,000 | | CD 2007‐CD5 Mortgage Trust, 6.159%, 11/15/2017(c) | | | 324,948 | |
| | 758,958 | | Commercial Mortgage Trust 2006‐C8, 5.377%, 12/10/2046 | | | 762,374 | |
| | 5,100,000 | | Commercial Mortgage Trust 2007‐C9, 5.808%, 07/10/2017(a)(c) | | | 5,057,755 | |
| | 1,319,709 | | EuroProp EMC SA 2006‐4, Class A, 8.000%, 04/30/2013(c)(e) | | | 1,185,583 | |
| | 2,973,248 | | EuroProp EMC SA 2006‐4, Class B, 8.000%, 04/30/2013(c)(e) | | | 63,437 | |
| | 649,218 | | EuroProp EMC SA 2006‐6, Class B, 0.000%, 04/30/2017(b) | | | 529,828 | |
| | 2,200,000 | | Hypo Real Estate Bank International AG, 0.562%, 03/20/2022(c)(f) | | | 799,349 | |
| | 986,876 | | JP Morgan Chase Commercial Mortgage Securities Trust 2005‐LDP5, 5.699%, 12/15/2044(c) | | | 984,420 | |
| | 2,000,000 | | JP Morgan Chase Commercial Mortgage Securities Trust 2007‐CIBC20, 6.178%, 09/12/2017(c) | | | 2,048,750 | |
| | 3,000,000 | | JP Morgan Chase Commercial Mortgage Securities Trust 2007‐LD12, 6.066%, 08/15/2017(c) | | | 2,859,486 | |
| | 3,495,000 | | Merrill Lynch CFC Commercial Mortgage Trust 2007‐8, 6.156%, 08/12/2049(c) | | | 3,478,198 | |
| | 500,000 | | Morgan Stanley Capital I Trust 2006‐HQ8, 5.399%, 03/12/2044(c) | | | 486,856 | |
| | 1,700,000 | | Morgan Stanley Capital I Trust 2007‐HQ11, 5.538%, 02/12/2044(c)(d) | | | 1,595,940 | |
| | 1,320,825 | | Wachovia Bank Commercial Mortgage Trust 2006‐C25, 5.880%, 05/15/2043(c) | | | 1,318,582 | |
| | 250,000 | | Wachovia Bank Commercial Mortgage Trust 2007‐C31, 5.660%, 04/15/2017(c) | | | 251,146 | |
| | | | | | | 24,100,099 | |
| | | | TOTAL BONDS & NOTES (Cost $28,519,937) | | | 26,041,748 | |
See Notes to Financial Statements.
| Semi-Annual Report | March 31, 2017 | 5 |
| Resource Real Estate Diversified Income Fund | Portfolio of Investments |
March 31, 2017 (Unaudited)
| Shares | | | | Value |
| | | | PREFERRED STOCKS (23.47%) | | | | |
| | | | REAL ESTATE INVESTMENT TRUSTS (23.47%) | | | | |
| | 44,000 | | American Homes 4 Rent, Series E, 6.350%(d) | | $ | 1,126,400 | |
| | 118,328 | | Annaly Capital Management, Inc., Series D, 7.500%(d) | | | 2,958,200 | |
| | 60,000 | | Ares Management LP, Series A, 7.000%(d) | | | 1,575,600 | |
| | 161,972 | | ARMOUR Residential REIT, Inc., Series B, 7.875%(d) | | | 3,822,539 | |
| | 36,800 | | Chimera Investment Corp., Series B, 8.000%(c) | | | 934,352 | |
| | 120,000 | | City Office REIT, Inc., Series A, 6.625%(d) | | | 3,012,000 | |
| | 70,953 | | Colony NorthStar, Inc., Series H, 7.125%(d) | | | 1,771,696 | |
| | 121,289 | | Colony NorthStar, Inc., Series E, 8.750%(d) | | | 3,191,114 | |
| | 36,497 | | Colony NorthStar, Inc., Series D, 8.500%(d) | | | 944,907 | |
| | 20,700 | | Colony NorthStar, Inc., Series C, 8.875%(d) | | | 531,369 | |
| | 6,123 | | CYS Investments, Inc., Series B, 7.500% | | | 143,891 | |
| | 9,820 | | Digital Realty Trust, Inc., Series H, 7.375%(d) | | | 270,050 | |
| | 10,305 | | Digital Realty Trust, Inc., Series F, 6.625%(d) | | | 259,995 | |
| | 135,006 | | Five Oaks Investment Corp., Series A, 8.750%(c)(d) | | | 3,327,898 | |
| | 57,000 | | Gladstone Commercial Corp., Series D, 7.000%(d) | | | 1,434,690 | |
| | 100,000 | | Monmouth Real Estate Investment Corp., Series C, 6.125%(d) | | | 2,489,000 | |
| | 59,376 | | New York Mortgage Trust, Inc., Series C, 7.875%(d) | | | 1,412,555 | |
| | 129,600 | | Pennsylvania Real Estate Investment Trust, Series C, 7.200% | | | 3,461,616 | |
| | 17,464 | | Pennsylvania Real Estate Investment Trust, Series B, 7.375%(d) | | | 439,744 | |
| | 10,127 | | Retail Properties of America, Inc., Series A, 7.000%(d) | | | 258,745 | |
| | 120,000 | | Sotherly Hotels, Inc., Series B, 8.000%(d) | | | 3,087,000 | |
| | 25,000 | | STAG Industrial, Inc., Series C, 6.875%(d) | | | 650,500 | |
| | 120,000 | | Two Harbors Investment Corp., Series A, 8.125%(c) | | | 3,136,800 | |
| | 34,000 | | UMH Properties, Inc., Series B, 8.000%(d) | | | 915,110 | |
| | 6,173 | | Washington Prime Group, Inc., Series I, 6.875%(d) | | | 154,016 | |
| | 176,700 | | Wheeler Real Estate Investment Trust, Inc., Series D, 8.750%(d) | | | 4,595,967 | |
| | | | | | | | |
| | | | TOTAL PREFERRED STOCKS (Cost $43,792,736) | | | 45,905,754 | |
| | | | | | | | |
| | | | REAL ESTATE INVESTMENT TRUSTS ‐COMMON STOCKS (87.27%) | | | | |
| | | | PUBLIC NON‐TRADED REAL ESTATE INVESTMENT TRUSTS (8.12%)(g) | | | | |
| | 4,839 | | Cole Credit Property Trust IV, Inc.(f) | | | 48,097 | |
| | 274,251 | | Cole Real Estate Income Strategy (Daily NAV), Inc., Class I(f) | | | 4,996,848 | |
| | 37,823 | | Corporate Property Associates 18 Global, Inc., Class A(f) | | | 293,504 | |
| | 191,111 | | Corporate Property Associates 18 Global, Inc., Class C(f) | | | 1,484,933 | |
| | 30,292 | | Dividend Capital Diversified Property Fund(f) | | | 227,800 | |
| | 132,979 | | Dividend Capital Diversified Property Fund, Class I | | | 1,000,000 | |
| | 2,981 | | Healthcare Trust, Inc.(f) | | | 60,216 | |
| | 446,837 | | Highlands REIT, Inc.(f) | | | 156,393 | |
| | 446,837 | | InvenTrust Properties Corp.(f) | | | 1,353,917 | |
| | 265,355 | | Jones Lang LaSalle Income Property Trust, Inc.(f) | | | 3,011,774 | |
| | 321,623 | | NorthStar Healthcare Income, Inc.(f) | | | 2,772,394 | |
| | 37,429 | | NorthStar Real Estate Income II, Inc.(f) | | | 332,748 | |
| | 14,984 | | Phillips Edison Grocery Center REIT I, Inc.(f) | | | 144,446 | |
| | | | | | | 15,883,070 | |
See Notes to Financial Statements.
| Resource Real Estate Diversified Income Fund | Portfolio of Investments |
March 31, 2017 (Unaudited)
| Shares | | | | Value |
| | | | PRIVATE REAL ESTATE INVESTMENT TRUSTS (34.39%)(g) | | | | |
| | 38,601 | | Barings Core Property Fund, LP(f) | | $ | 4,761,008 | |
| | 103,239 | | Broadstone Net Lease(f) | | | 8,155,844 | |
| | 480,678 | | Charter Hall Direct VA Trust(f) | | | 453,833 | |
| | 991,074 | | Clarion Debt Fund(f) | | | 981,163 | |
| | 4,153 | | Clarion Gables Multifamily Trust, LP(f) | | | 4,824,709 | |
| | 5,761 | | Clarion Lion Industrial Trust(f) | | | 8,988,605 | |
| | 11,362 | | Clarion Lion Properties Fund, LP(f) | | | 15,694,510 | |
| | 1,407,155 | | Clarion Ventures(f) | | | 1,533,800 | |
| | 67,940 | | Cottonwood Residential, Inc.(f) | | | 1,146,156 | |
| | 8,966,398 | | Guggenheim US Property Private REIT(f) | | | 9,091,750 | |
| | 40,000 | | Reverse Mortgage Investment Trust, Inc.(a)(d)(f) | | | 190,000 | |
| | 1,588,902 | | Talmage Private Credit Fund(f) | | | 1,541,235 | |
| | 386 | | UBS Trumbull LP(f) | | | 4,641,505 | |
| | 490 | | UBS Trumbull Property Fund(f) | | | 5,261,273 | |
| | | | | | | 67,265,391 | |
| | | | TRADED REAL ESTATE INVESTMENT TRUSTS (44.76%) | | | | |
| | 431,004 | | Arlington Asset Investment Corp., Class A(d) | | | 6,090,087 | |
| | 141,746 | | Blackstone Mortgage Trust, Inc., Class A(d) | | | 4,388,456 | |
| | 411,734 | | CBL & Associates Properties, Inc.(d) | | | 3,927,942 | |
| | 347,834 | | City Office REIT, Inc.(d) | | | 4,226,183 | |
| | 82,102 | | Colony NorthStar, Inc.(d) | | | 1,059,937 | |
| | 302,500 | | Condor Hospitality Trust, Inc. | | | 3,206,500 | |
| | 11,261 | | Digital Realty Trust, Inc.(d) | | | 1,198,058 | |
| | 30,584 | | EPR Properties, Inc.(d) | | | 2,251,900 | |
| | 20,571 | | Extra Space Storage, Inc.(d) | | | 1,530,277 | |
| | 368,716 | | Five Oaks Investment Corp.(d) | | | 1,891,513 | |
| | 665,949 | | Global Medical REIT, Inc.(d) | | | 6,046,817 | |
| | 46,667 | | Great Ajax Corp.(d) | | | 609,004 | |
| | 533,623 | | Independence Realty Trust, Inc.(d) | | | 5,000,048 | |
| | 226,431 | | Innovative Industrial Properties, Inc.(d) | | | 3,862,913 | |
| | 145,500 | | Lexington Realty Trust(d) | | | 1,452,090 | |
| | 215,000 | | MedEquities Realty Trust, Inc.(a)(d) | | | 2,410,150 | |
| | 120,111 | | Medical Properties Trust, Inc.(d) | | | 1,548,231 | |
| | 26,700 | | National Storage Affiliates Trust(d) | | | 638,130 | |
| | 299,700 | | New Residential Investment Corp.(d) | | | 5,088,906 | |
| | 231,500 | | New Senior Investment Group, Inc.(d) | | | 2,361,300 | |
| | 26,920 | | Omega Healthcare Investors, Inc.(d) | | | 888,091 | |
| | 422,162 | | Orchid Island Capital, Inc.(d) | | | 4,217,398 | |
| | 78,554 | | Park Hotels & Resorts, Inc. | | | 2,016,481 | |
| | 600,000 | | Sachem Capital Corp. | | | 3,084,000 | |
| | 211,600 | | Spirit Realty Capital, Inc.(d) | | | 2,143,508 | |
| | 103,260 | | STAG Industrial, Inc.(d) | | | 2,583,565 | |
| | 177,800 | | Uniti Group, Inc.(d) | | | 4,596,130 | |
| | 22,376 | | Ventas, Inc.(d) | | | 1,455,335 | |
| | 369,515 | | Washington Prime Group, Inc.(d) | | | 3,211,085 | |
| | 215,328 | | Whitestone REIT(d) | | | 2,980,140 | |
| | 25,197 | | WP Carey, Inc.(d) | | | 1,567,757 | |
| | | | | | | 87,531,932 | |
| | | | TOTAL REAL ESTATE INVESTMENT TRUSTS ‐ COMMON STOCKS (Cost $163,908,621) | | | 170,680,393 | |
See Notes to Financial Statements.
| Semi-Annual Report | March 31, 2017 | 7 |
| Resource Real Estate Diversified Income Fund | Portfolio of Investments |
March 31, 2017 (Unaudited)
| Shares | | | | Value |
| | | | PRIVATE INVESTMENT FUNDS (1.15%) | | | | |
| | | | REITS (1.15%) | | | | |
| | 2,039,791 | | Truman REIT(f)(g) | | $ | 2,250,369 | |
| | | | | | | | |
| | | | TOTAL PRIVATE INVESTMENT FUNDS (Cost $1,952,428) | | | 2,250,369 | |
| | | | | | | | |
| Number of Contracts | | | | | | |
| | | | PURCHASED OPTIONS (0.52%) | | | | |
| | 10,000(d) | | iShares U.S. Real Estate ETF, Put, Exercise Price $76, (expiring 06/16/17)(d) | | | 1,020,000 | |
| | | | | | | | |
| | | | TOTAL PURCHASED OPTIONS (Cost $1,695,731) | | | 1,020,000 | |
| | | | | | | | |
| | | | TOTAL INVESTMENTS (125.72%) (Cost $239,869,453) | | $ | 245,898,264 | |
| | | | | | | | |
| | | | LINE OF CREDIT (‐25.41%) | | | (49,702,248 | ) |
| | | | | | | | |
| | | | LIABILITIES IN EXCESS OF OTHER ASSETS (‐0.31%) | | | (611,107 | )(h) |
| | | | | | | | |
| | | | NET ASSETS (100.00%) | | $ | 195,584,909 | |
(a) | Securities exempt from registration under Rule 144A of the Securities Act of 1933. These securities may be sold in the ordinary course of business in transactions exempt from registration, normally to qualified institutional buyers. As of March 31, 2017, the aggregate market value of those securities was $7,658,080, representing 3.92% of net assets. |
(b) | Issued with a zero coupon. Income is recognized through the accretion of discount. |
(c) | Floating or variable rate security. The rate shown is the effective interest rate as of March 31, 2017. |
(d) | All or a portion of each of these securities may be segregated as collateral for written options and the Fund's line of credit. |
(e) | Security in default on interest payments. |
(f) | Fair Value estimated using Fair Valuation Procedures adopted by the Board of Trustees. Total value of such securities is $85,248,178, representing 43.59% of net assets. |
(g) | Illiquid security. See below. |
(h) | Includes cash which is being held as collateral for written options. |
See Notes to Financial Statements.
| Resource Real Estate Diversified Income Fund | Portfolio of Investments |
March 31, 2017 (Unaudited)
Securities determined to be illiquid under the procedures approved by the Fund's Board of Trustees.
Information related to the illiquid securities is as follows:
| Date(s) of Purchase | Security | | Cost | | | Value | | | % of Net Assets | |
10/01/15-07/01/16 | Barings Core Property Fund, LP | | $ | 4,500,000 | | | $ | 4,761,008 | | | | 2.43 | % |
10/31/16-03/31/17 | Broadstone Net Lease | | | 8,000,000 | | | | 8,155,844 | | | | 4.17 | % |
| 04/15/14 | Charter Hall Direct VA Trust | | | 449,712 | | | | 453,833 | | | | 0.23 | % |
| 02/14/17 | Clarion Debt Fund | | | 991,074 | | | | 981,163 | | | | 0.50 | % |
07/02/15-07/01/16 | Clarion Gables Multifamily Trust, LP | | | 4,500,000 | | | | 4,824,709 | | | | 2.47 | % |
01/01/14-01/03/17 | Clarion Lion Industrial Trust | | | 8,050,000 | | | | 8,988,605 | | | | 4.60 | % |
01/01/14-07/01/16 | Clarion Lion Properties Fund, LP | | | 14,050,000 | | | | 15,694,510 | | | | 8.02 | % |
07/01/16-11/09/16 | Clarion Ventures | | | 1,406,152 | | | | 1,533,800 | | | | 0.78 | % |
| 05/22/13 | Cole Credit Property Trust IV, Inc. | | | 40,489 | | | | 48,097 | | | | 0.02 | % |
04/17/14-03/31/17 | Cole Real Estate Income Strategy (Daily NAV), Inc., Class I | | | 4,828,154 | | | | 4,996,848 | | | | 2.55 | % |
11/05/13-05/30/14 | Corporate Property Associates 18 Global, Inc., Class A | | | 307,648 | | | | 293,504 | | | | 0.15 | % |
| 03/12/15 | Corporate Property Associates 18 Global, Inc., Class C | | | 1,720,000 | | | | 1,484,933 | | | | 0.76 | % |
02/24/14-07/21/14 | Cottonwood Residential, Inc. | | | 701,368 | | | | 1,146,156 | | | | 0.59 | % |
04/05/13-11/12/14 | Dividend Capital Diversified Property Fund | | | 154,016 | | | | 227,800 | | | | 0.12 | % |
| 03/31/17 | Dividend Capital Diversified Property Fund, Class I | | | 1,000,000 | | | | 1,000,000 | | | | 0.51 | % |
09/01/16-01/03/17 | Guggenheim US Property Private REIT | | | 9,000,000 | | | | 9,091,750 | | | | 4.65 | % |
| 11/08/13 | Healthcare Trust, Inc. | | | 55,886 | | | | 60,216 | | | | 0.03 | % |
| 02/06/15 | Highlands REIT, Inc. | | | 142,639 | | | | 156,393 | | | | 0.08 | % |
| 02/06/15 | InvenTrust Properties Corp. | | | 1,380,078 | | | | 1,353,917 | | | | 0.69 | % |
06/09/15-08/14/15 | Jones Lang LaSalle Income Property Trust, Inc. | | | 2,748,859 | | | | 3,011,774 | | | | 1.54 | % |
11/27/13-03/12/15 | NorthStar Healthcare Income, Inc. | | | 2,687,879 | | | | 2,772,394 | | | | 1.42 | % |
03/11/14-06/30/15 | NorthStar Real Estate Income II, Inc. | | | 297,024 | | | | 332,748 | | | | 0.17 | % |
08/07/13-11/25/13 | Phillips Edison Grocery Center REIT I, Inc. | | | 119,650 | | | | 144,446 | | | | 0.07 | % |
02/06/14-06/06/14 | Reverse Mortgage Investment Trust, Inc. | | | 576,500 | | | | 190,000 | | | | 0.10 | % |
| 01/03/17 | Talmage Private Credit Fund | | | 1,588,902 | | | | 1,541,235 | | | | 0.79 | % |
06/24/16-12/15/16 | Truman REIT | | | 1,952,428 | | | | 2,250,369 | | | | 1.15 | % |
07/01/16-01/03/17 | UBS Trumbull LP | | | 4,600,000 | | | | 4,641,505 | | | | 2.37 | % |
01/04/16-01/03/17 | UBS Trumbull Property Fund | | | 5,200,000 | | | | 5,261,273 | | | | 2.69 | % |
| | Total | | $ | 81,048,458 | | | $ | 85,398,830 | | | | 43.66 | % |
See Notes to Financial Statements.
| Semi-Annual Report | March 31, 2017 | 9 |
| Resource Real Estate Diversified Income Fund | Portfolio of Investments |
March 31, 2017 (Unaudited)
Additional information on investments in private real estate investment trusts:
| Value | | Security | | Redemption Frequency | | Redemption Notice (Days) | | Unfunded Commitments as of March 31, 2017(a) | |
| $ | 4,761,008 | | Barings Core Property Fund, LP | | Quarterly | | 30 | | $ | – | |
| | 8,155,844 | | Broadstone Net Lease | | N/A | | N/A | | | – | |
| | 453,833 | | Charter Hall Direct VA Trust | | N/A | | N/A | | | – | |
| | 981,163 | | Clarion Debt Fund | | N/A | | N/A | | | 1,037,294 | |
| | 4,824,709 | | Clarion Gables Multifamily Trust, LP | | Quarterly | | 90 | | | – | |
| | 8,988,605 | | Clarion Lion Industrial Trust | | Quarterly | | 90 | | | 2,250,000 | |
| | 15,694,510 | | Clarion Lion Properties Fund, LP | | Quarterly | | 90 | | | – | |
| | 1,533,800 | | Clarion Ventures | | N/A | | N/A | | | 1,178,553 | |
| | 1,146,156 | | Cottonwood Residential, Inc. | | Daily | | 60 | | | – | |
| | 9,091,750 | | Guggenheim US Property Private REIT | | Quarterly | | 60 | | | – | |
| | 190,000 | | Reverse Mortgage Investment Trust, Inc.(b) | | N/A | | IPO(c) | | | – | |
| | 1,541,235 | | Talmage Private Credit Fund | | N/A | | N/A | | | 6,424,871 | |
| | 4,641,505 | | UBS Trumbull LP | | Quarterly | | 60 | | | 600,000 | |
| | 5,261,273 | | UBS Trumbull Property Fund | | Quarterly | | 60 | | | – | |
(a) | Refer to Note 9 for additional information on unfunded commitments. |
(b) | The fair value of this investment has been estimated using the net asset value per share of the investment and adjusted for any changes in market conditions. |
(c) | Redemption eligible after the completion of the Initial Price Offering (IPO). |
Schedule Of Written Options
At March 31, 2017, the Fund had the following outstanding written options:
| | | Number of Contracts | | | Exercise Price | | Maturity Date | | Value | |
| Call Options | | | | | | | | | | |
| iShares U.S. Real Estate ETF | | | (10,000 | ) | | $ | 81.00 | | 6/16/2017 | | $ | (790,000 | ) |
| | | | | | | | | | | | | | |
| Put Options | | | | | | | | | | | | | |
| iShares U.S. Real Estate ETF | | | (10,000 | ) | | $ | 72.00 | | 6/16/2017 | | $ | (360,000 | ) |
| | | | | | | | | | | | | | |
| Total Written Options (Premiums $1,508,505) | | | | | | | | | | | $ | (1,150,000 | ) |
See Notes to Financial Statements.
| Resource Real Estate Diversified Income Fund | Statement of Assets and Liabilities |
March 31, 2017 (Unaudited)
| ASSETS | | | |
| Investments, at value (Cost $239,869,453) | | $ | 245,898,264 | |
| Due from broker | | | 110,104 | |
| Deposit with broker for written options | | | 150,000 | |
| Dividends and interest receivable | | | 2,100,050 | |
| Receivable for fund shares sold | | | 1,844,551 | |
| Prepaid expenses and other assets | | | 75,678 | |
| Total assets | | | 250,178,647 | |
| | | | | |
| LIABILITIES | | | | |
| Line of credit payable | | | 49,702,248 | |
| Interest on line of credit payable | | | 6,953 | |
| Written options, at value (Proceeds 1,508,505) | | | 1,150,000 | |
| Payable to custodian | | | 1,246,880 | |
| Payable for investments purchased | | | 1,981,593 | |
| Payable due to adviser | | | 178,903 | |
| Administration fees payable | | | 38,548 | |
| Custody fees payable | | | 7,066 | |
| Distribution fees payable | | | 30,021 | |
| Distribution due to shareholders | | | 162 | |
| Shareholder servicing fees payable | | | 52,473 | |
| Dealer manager fees payable | | | 2,797 | |
| Payable for transfer agency fees | | | 61,420 | |
| Accrued expenses and other liabilities | | | 134,674 | |
| Total liabilities | | | 54,593,738 | |
| NET ASSETS | | $ | 195,584,909 | |
| | | | | |
| NET ASSETS CONSISTS OF | | | | |
Paid-in capital | | $ | 188,254,635 | |
| Accumulated net investment income | | | 159,682 | |
| Accumulated net realized gain | | | 783,272 | |
| Net unrealized appreciation | | | 6,387,320 | |
| NET ASSETS | | $ | 195,584,909 | |
Commitments and Contingencies (Note 9)
See Notes to Financial Statements.
| Semi-Annual Report | March 31, 2017 | 11 |
| Resource Real Estate Diversified Income Fund | Statement of Assets and Liabilities |
March 31, 2017 (Unaudited)
| PRICING OF SHARES | | | |
| Class A | | | |
| Net Assets | | $ | 78,219,490 | |
| Shares of beneficial interest outstanding (unlimited number of shares, no par value common stock authorized) | | | 7,647,661 | |
Net Asset Value and redemption price per share(a) | | $ | 10.23 | |
| Maximum Offering Price Per Share (Maximum Sales Charge of 5.75%) | | $ | 10.85 | |
| Class C | | | | |
| Net Assets | | $ | 45,180,282 | |
| Shares of beneficial interest outstanding (unlimited number of shares, no par value common stock authorized) | | | 4,419,362 | |
| Net Asset Value and redemption price per share | | $ | 10.22 | |
| Class W | | | | |
| Net Assets | | $ | 48,821,352 | |
| Shares of beneficial interest outstanding (unlimited number of shares, no par value common stock authorized) | | | 4,701,771 | |
| Net Asset Value, offering and redemption price per share | | $ | 10.38 | |
| Class I | | | | |
| Net Assets | | $ | 100,820 | |
| Shares of beneficial interest outstanding (unlimited number of shares, no par value common stock authorized) | | | 9,465 | |
| Net Asset Value, offering and redemption price per share | | $ | 10.65 | |
| Class U | | | | |
| Net Assets | | $ | 11,047,037 | |
| Shares of beneficial interest outstanding (unlimited number of shares, no par value common stock authorized) | | | 1,079,288 | |
Net Asset Value and redemption price per share(a) | | $ | 10.24 | |
| Maximum Offering Price Per Share (Maximum Sales Charge of 6.50%) | | $ | 10.95 | |
| Class T | | | | |
| Net Assets | | $ | 4,986,235 | |
| Shares of beneficial interest outstanding (unlimited number of shares, no par value common stock authorized) | | | 488,537 | |
Net Asset Value and redemption price per share(a) | | $ | 10.21 | |
| Maximum Offering Price Per Share (Maximum Sales Charge of 1.50%) | | $ | 10.37 | |
| Class D | | | | |
| Net Assets | | $ | 7,229,693 | |
| Shares of beneficial interest outstanding (unlimited number of shares, no par value common stock authorized) | | | 696,012 | |
| Net Asset Value, offering and redemption price per share | | $ | 10.39 | |
(a) | Redemption price varies based on length of time held (Note 1). |
See Notes to Financial Statements.
| Resource Real Estate Diversified Income Fund | Statement of Operations |
For the Six Months Ended March 31, 2017 (Unaudited)
| INVESTMENT INCOME | | | |
| Dividends | | $ | 6,426,900 | |
| Interest | | | 1,005,143 | |
| Total investment income | | | 7,432,043 | |
| EXPENSES | | | | |
| Investment advisory fees (Note 3) | | | 1,007,182 | |
| Administrative fees (Note 3) | | | 83,781 | |
| Distribution fees (Note 3): | | | | |
| Class C | | | 137,841 | |
| Class T | | | 14,166 | |
| Shareholder servicing fees (Note 3): | | | | |
| Class A | | | 85,392 | |
| Class C | | | 45,947 | |
| Class W | | | 48,058 | |
| Class U | | | 10,308 | |
| Class T | | | 4,722 | |
| Class D | | | 6,986 | |
| Dealer manager fees (Note3): | | | | |
Class W(a) | | | 46,720 | |
| Class D | | | 13,971 | |
| Interest expense | | | 531,391 | |
| Transfer agent fees (Note 3) | | | 123,073 | |
| Audit fees | | | 12,533 | |
| Legal fees | | | 38,713 | |
| Printing expense | | | 55,046 | |
| Registration fees | | | 41,868 | |
| Custody fees | | | 22,765 | |
| Trustee fees and expenses (Note 3) | | | 21,921 | |
| Other expenses | | | 62,312 | |
| Total expenses | | | 2,414,696 | |
| Less fees waived/expenses reimbursed by investment adviser (Note 3) | | | (67,140 | ) |
| Total net expenses | | | 2,347,556 | |
| NET INVESTMENT INCOME | | | 5,084,487 | |
| REALIZED AND UNREALIZED GAIN/(LOSS) ON INVESTMENTS | | | | |
| Net realized loss on investments | | | (2,681,508 | ) |
| Net realized gain on futures contracts | | | 322,214 | |
| Net realized gain on written options | | | 3,435,268 | |
| Net realized loss on foreign currency transactions | | | (1,170 | ) |
| Total net realized gain | | | 1,074,804 | |
| Net change in unrealized depreciation on investments | | | (212,580 | ) |
| Net change in unrealized depreciation on futures contracts | | | (19,235 | ) |
| Net change in unrealized depreciation on written options | | | (539,599 | ) |
| Net change in unrealized depreciation on translation of assets and liabilities in foreign currencies | | | (70 | ) |
| Total net change in unrealized depreciation | | | (771,484 | ) |
| NET REALIZED AND UNREALIZED GAIN ON INVESTMENTS AND FOREIGN CURRENCY TRANSACTIONS | | | 303,320 | |
| NET INCREASE IN NET ASSETS RESULTING FROM OPERATIONS | | $ | 5,387,807 | |
(a) | Effective January 6, 2017, Class W shares are no longer subject to a dealer manager fee. |
See Notes to Financial Statements.
| Semi-Annual Report | March 31, 2017 | 13 |
| Resource Real Estate Diversified Income Fund | Statements of Changes in Net Assets |
| | | For the Six Months Ended March 31, 2017 (Unaudited) | | | For the Year Ended September 30, 2016 | |
| OPERATIONS | | | | | | |
| Net investment income | | $ | 5,084,487 | | | $ | 3,137,494 | |
| Net realized gain | | | 1,074,804 | | | | 35,806 | |
| Net change in unrealized appreciation | | | (771,484 | ) | | | 7,991,926 | |
| Net increase in net assets resulting from operations | | $ | 5,387,807 | | | $ | 11,165,226 | |
| | | | | | | | | |
| DISTRIBUTIONS TO SHAREHOLDERS | | | | | | | | |
| From investment income: | | | | | | | | |
| Class A | | | (2,143,466 | ) | | | (1,509,210 | ) |
| Class C | | | (1,028,642 | ) | | | (658,437 | ) |
| Class W | | | (1,201,802 | ) | | | (601,298 | ) |
| Class I | | | (1,542 | ) | | | – | |
| Class U | | | (271,069 | ) | | | (70,780 | ) |
| Class T | | | (109,048 | ) | | | (50,499 | ) |
| Class D | | | (169,236 | ) | | | (121,430 | ) |
| From realized gains on investments: | | | | | | | | |
| Class A | | | (215,368 | ) | | | – | |
| Class C | | | (113,360 | ) | | | – | |
| Class W | | | (118,447 | ) | | | – | |
| Class U | | | (26,415 | ) | | | – | |
| Class T | | | (11,690 | ) | | | – | |
| Class D | | | (17,832 | ) | | | – | |
| From return of capital: | | | | | | | | |
| Class A | | | – | | | | (1,517,924 | ) |
| Class C | | | – | | | | (662,238 | ) |
| Class W | | | – | | | | (604,770 | ) |
| Class I | | | – | | | | (1 | ) |
| Class U | | | – | | | | (71,188 | ) |
| Class T | | | – | | | | (50,790 | ) |
| Class D | | | – | | | | (122,132 | ) |
| Net decrease in net assets from distributions | | | (5,427,917 | ) | | | (6,040,697 | ) |
| | | | | | | | | |
| CAPITAL SHARE TRANSACTIONS | | | | | | | | |
| Class A | | | | | | | | |
| Proceeds from sales of shares | | | 17,931,616 | | | | 24,246,411 | |
| Distributions reinvested | | | 1,161,258 | | | | 1,531,196 | |
| Cost of shares redeemed | | | (2,270,111 | ) | | | (4,085,281 | ) |
| Net increase from capital shares transactions | | | 16,822,763 | | | | 21,692,326 | |
| | | | | | | | | |
| Class C | | | | | | | | |
| Proceeds from sales of shares | | | 13,371,813 | | | | 19,427,546 | |
| Distributions reinvested | | | 737,985 | | | | 887,888 | |
| Cost of shares redeemed | | | (2,037,346 | ) | | | (1,893,250 | ) |
| Net increase from capital shares transactions | | | 12,072,452 | | | | 18,422,184 | |
| | | | | | | | | |
| Class W | | | | | | | | |
| Proceeds from sales of shares | | | 19,212,485 | | | | 22,518,683 | |
| Distributions reinvested | | | 635,692 | | | | 552,421 | |
| Cost of shares redeemed | | | (2,127,093 | ) | | | (4,368,496 | ) |
| Net increase from capital shares transactions | | | 17,721,084 | | | | 18,702,608 | |
| | | | | | | | | |
| Class I | | | | | | | | |
| Proceeds from sales of shares | | | 101,507 | | | | – | |
| Distributions reinvested | | | 23 | | | | – | |
| Cost of shares redeemed | | | – | | | | (49,324 | ) |
| Net increase/(decrease) from capital shares transactions | | | 101,530 | | | | (49,324 | ) |
See Notes to Financial Statements.
| Resource Real Estate Diversified Income Fund | Statements of Changes in Net Assets (continued) |
| | | For the Six Months Ended March 31, 2017 (Unaudited) | | | For the Year Ended September 30, 2016 | |
| Class U | | | | | | |
| Proceeds from sales of shares | | | 5,220,435 | | | | 5,539,265 | |
| Distributions reinvested | | | 122,243 | | | | 54,034 | |
| Cost of shares redeemed | | | (71,887 | ) | | | (10,180 | ) |
| Net increase from capital shares transactions | | | 5,270,791 | | | | 5,583,119 | |
| | | | | | | | | |
| Class T | | | | | | | | |
| Proceeds from sales of shares | | | 1,747,866 | | | | 2,599,685 | |
| Distributions reinvested | | | 47,438 | | | | 30,599 | |
| Net increase from capital shares transactions | | | 1,795,304 | | | | 2,630,284 | |
| | | | | | | | | |
| Class D | | | | | | | | |
| Proceeds from sales of shares | | | 1,679,563 | | | | 3,072,558 | |
| Distributions reinvested | | | 98,340 | | | | 125,740 | |
| Cost of shares redeemed | | | (154,950 | ) | | | (30,003 | ) |
| Net increase from capital shares transactions | | | 1,622,953 | | | | 3,168,295 | |
| | | | | | | | | |
| Net increase in net assets | | | 55,366,767 | | | | 75,274,021 | |
| | | | | | | | | |
| NET ASSETS | | | | | | | | |
| Beginning of period | | | 140,218,142 | | | | 64,944,121 | |
| End of period* | | $ | 195,584,909 | | | $ | 140,218,142 | |
| | | | | | | | | |
| *Including accumulated net investment income of: | | $ | 159,682 | | | $ | – | |
See Notes to Financial Statements.
| Semi-Annual Report | March 31, 2017 | 15 |
| Resource Real Estate Diversified Income Fund | Statements of Changes in Net Assets (continued) |
| | | For the Six Months Ended March 31, 2017 (Unaudited) | | | For the Year Ended September 30, 2016 | |
| OTHER INFORMATION | | | | | | |
| Capital Shares Transactions | | | | | | |
| Class A | | | | | | |
| Issued | | | 1,761,043 | | | | 2,442,421 | |
| Distributions reinvested | | | 115,283 | | | | 154,823 | |
| Redeemed | | | (221,820 | ) | | | (415,226 | ) |
| Net increase in capital shares | | | 1,654,506 | | | | 2,182,018 | |
| | | | | | | | | |
| Class C | | | | | | | | |
| Issued | | | 1,315,000 | | | | 1,963,693 | |
| Distributions reinvested | | | 73,303 | | | | 89,798 | |
| Redeemed | | | (199,051 | ) | | | (193,223 | ) |
| Net increase in capital shares | | | 1,189,252 | | | | 1,860,268 | |
| | | | | | | | | |
| Class W | | | | | | | | |
| Issued | | | 1,860,089 | | | | 2,238,396 | |
| Distributions reinvested | | | 62,166 | | | | 54,815 | |
| Redeemed | | | (204,919 | ) | | | (455,467 | ) |
| Net increase in capital shares | | | 1,717,336 | | | | 1,837,744 | |
| | | | | | | | | |
| Class I | | | | | | | | |
| Issued | | | 9,461 | | | | – | |
| Distributions reinvested | | | 2 | | | | – | |
| Redeemed | | | – | | | | (4,749 | ) |
| Net increase/(decrease) in capital shares | | | 9,463 | | | | (4,749 | ) |
| | | | | | | | | |
| Class U | | | | | | | | |
| Issued | | | 512,292 | | | | 551,293 | |
| Distributions reinvested | | | 12,129 | | | | 5,375 | |
| Redeemed | | | (7,050 | ) | | | (995 | ) |
| Net increase in capital shares | | | 517,371 | | | | 555,673 | |
| | | | | | | | | |
| Class T | | | | | | | | |
| Issued | | | 172,403 | | | | 262,716 | |
| Distributions reinvested | | | 4,722 | | | | 3,063 | |
| Net increase in capital shares | | | 177,125 | | | | 265,779 | |
| | | | | | | | | |
| Class D | | | | | | | | |
| Issued | | | 163,244 | | | | 314,877 | |
| Distributions reinvested | | | 9,617 | | | | 12,527 | |
| Redeemed | | | (15,000 | ) | | | (3,058 | ) |
| Net increase in capital shares | | | 157,861 | | | | 324,346 | |
See Notes to Financial Statements.
| Resource Real Estate Diversified Income Fund | Statements of Cash Flows |
| | | For the Six Months Ended March 31, 2017 (Unaudited) | |
| Cash Flow from Operating Activities: | | | |
| Net increase in net assets resulting from operations | | $ | 5,387,807 | |
| Adjustments to reconcile net increase in net assets resulting from operations to net cash provided by / (used in) operating activities: | | | | |
| Purchase of investment securities | | | (79,566,075 | ) |
| Proceeds from sale of investment securities | | | 10,460,984 | |
| Purchase of option contracts | | | (4,355,764 | ) |
| Proceeds from sale of option contracts | | | 1,850,407 | |
| Premiums received from written options transactions | | | 3,903,068 | |
Net (purchase) proceeds from short-term investment securities | | | 858,901 | |
| Amortization of premium and accretion of discount on investments | | | 343,087 | |
| Net realized (gain)/loss on: | | | | |
| Investments | | | 2,681,508 | |
| Written options | | | (3,435,268 | ) |
| Net change in unrealized (appreciation)/depreciation on: | | | | |
| Investments | | | 212,580 | |
| Written options | | | 539,599 | |
| Futures Contracts | | | 19,235 | |
| (Increase)/Decrease in assets: | | | | |
| Deposit with broker for futures contracts / collateral | | | 571,610 | |
| Deposit with broker for written option contracts | | | (150,000 | ) |
| Interest on line of credit | | | | |
| Dividends receivable | | | (714,257 | ) |
| Prepaid expenses & other assets | | | (144,670 | ) |
| Increase/(Decrease) in liabilities: | | | 6,953 | |
| Payable to custodian/overdrafts | | | 463,584 | |
| Variation margin payable on futures contracts | | | (9,063 | ) |
| Payable for dealer manager fees | | | (11,595 | ) |
| Payable for shareholder servicing fees | | | (3,469 | ) |
| Payable for distribution fees | | | 8,218 | |
| Payable to advisor / investment advisor | | | 102,830 | |
| Payable for administration fees | | | 23,269 | |
| Payable for custody fees | | | (2,755 | ) |
| Payable for transfer agency fees | | | 30,082 | |
| Accrued expenses and other liabilities | | | 186 | |
| Net cash provided by / (used in) operating activities | | | (60,929,008 | ) |
| | | | | |
| Cash Flows from Financing Activities: | | | | |
| Cash provided by loan: | | | 12,881,164 | |
| Proceeds from sale of shares | | | 58,241,590 | |
| Cost of shares redeemed | | | (6,661,387 | ) |
| Cash distributions paid | | | (3,532,359 | ) |
| Net cash provided by /(used in) financing activities | | | 60,929,008 | |
| | | | | |
| Net Change in Cash & Foreign Rates On Cash & Foreign Currency | | | - | |
| Cash & Foreign Currency, Beginning of Period | | | - | |
| Cash & Foreign Currency, End of Period | | | - | |
| | | | | |
Non-cash financing activities not included herein consist of reinvestment of distributions of: | | $ | 2,802,979 | |
| Cash paid for interest on loan during the period was: | | $ | 524,438 | |
See Notes to Financial Statements.
| Semi-Annual Report | March 31, 2017 | 17 |
| Resource Real Estate Diversified Income Fund – Class A | Financial Highlights |
For a Share Outstanding Throughout the Periods Presented
| | | For the Six Months Ended March 31, 2017 (Unaudited) | | | Year Ended September 30, 2016 | | | For the Period Ended September 30, 2015(a) | | | Year Ended February 28, 2015 | | | For the Period Ended February 28, 2014(b) | |
| NET ASSET VALUE, BEGINNING OF PERIOD | | $ | 10.26 | | | $ | 9.81 | | | $ | 10.52 | | | $ | 9.75 | | | $ | 10.00 | |
| | | | | | | | | | | | | | | | | | | | | |
| INCOME FROM INVESTMENT OPERATIONS | | | | | | | | | | | | | | | | | | | | |
Net investment income(c)(d) | | | 0.33 | | | | 0.34 | | | | 0.21 | | | | 0.33 | | | | 0.24 | |
| Net realized and unrealized gain/(loss) on investments | | | (0.03 | ) | | | 0.71 | | | | (0.47 | ) | | | 1.05 | | | | (0.06 | ) |
| Total income/(loss) from investment operations | | | 0.30 | | | | 1.05 | | | | (0.26 | ) | | | 1.38 | | | | 0.18 | |
| | | | | | | | | | | | | | | | | | | | | |
| DISTRIBUTIONS TO SHAREHOLDERS | | | | | | | | | | | | | | | | | | | | |
| From net investment income | | | (0.30 | ) | | | (0.32 | ) | | | (0.17 | ) | | | (0.48 | ) | | | (0.39 | ) |
| From net realized gain on investments | | | (0.03 | ) | | | – | | | | (0.03 | ) | | | (0.05 | ) | | | (0.00 | )(e) |
| From return of capital | | | – | | | | (0.28 | ) | | | (0.25 | ) | | | (0.08 | ) | | | (0.04 | ) |
| Total distributions | | | (0.33 | ) | | | (0.60 | ) | | | (0.45 | ) | | | (0.61 | ) | | | (0.43 | ) |
| INCREASE/DECREASE IN NET ASSET VALUE | | | (0.03 | ) | | | 0.45 | | | | (0.71 | ) | | | 0.77 | | | | (0.25 | ) |
| NET ASSET VALUE, END OF PERIOD | | $ | 10.23 | | | $ | 10.26 | | | $ | 9.81 | | | $ | 10.52 | | | $ | 9.75 | |
| | | | | | | | | | | | | | | | | | | | | |
TOTAL RETURN(f) | | | 3.02 | % | | | 11.09 | % | | | (2.50 | )%(g) | | | 14.70 | % | | | 2.03 | % |
| | | | | | | | | | | | | | | | | | | | | |
| RATIOS AND SUPPLEMENTAL DATA | | | | | | | | | | | | | | | | | | | | |
| Net assets, end of period (in 000s) | | $ | 78,219 | | | $ | 61,470 | | | $ | 37,399 | | | $ | 27,830 | | | $ | 4,823 | |
| | | | | | | | | | | | | | | | | | | | | |
| RATIOS TO AVERAGE NET ASSETS | | | | | | | | | | | | | | | | | | | | |
Including interest expense:(h) | | | | | | | | | | | | | | | | | | | | |
| Expenses, gross | | | 2.73 | %(i) | | | 2.78 | % | | | 3.30 | %(i) | | | 4.81 | % | | | 24.79 | %(i) |
| Expenses, net of fees waived/expenses reimbursed by investment adviser | | | 2.65 | %(i) | | | 2.39 | % | | | 2.24 | %(i) | | | 2.29 | % | | | 2.32 | %(i) |
Excluding interest expense:(h) | | | | | | | | | | | | | | | | | | | | |
| Expenses, gross | | | 2.07 | %(i) | | | 2.38 | % | | | 3.05 | %(i) | | | 4.51 | % | | | 24.46 | %(i) |
| Expenses, net of fees waived/expenses reimbursed by investment adviser | | | 1.99 | %(i) | | | 1.99 | % | | | 1.99 | %(i) | | | 1.99 | % | | | 1.99 | %(i) |
Net investment income(d) | | | 6.50 | %(i) | | | 3.47 | % | | | 3.57 | %(i) | | | 3.21 | % | | | 2.54 | %(i) |
| | | | | | | | | | | | | | | | | | | | | |
| PORTFOLIO TURNOVER RATE | | | 3 | %(j) | | | 21 | % | | | 5 | %(j) | | | 91 | % | | | 4 | %(j) |
| (a) | With the approval of the Board, effective September 30, 2015, the Fund's fiscal year end was changed from February 28 to September 30 (See Note 1). |
| (b) | The Fund's Class A commenced operations on March 12, 2013. |
| (c) | Per share numbers have been calculated using the average shares method. |
(d) | Recognition of net investment income is affected by timing and declaration of dividends by underlying investment companies. |
| (e) | Amount is less than $(0.005). |
| (f) | Total returns shown are historical in nature and assume changes in share price, reinvestment of dividends and capital gains distribution, if any. Had the Adviser not absorbed a portion of Fund expenses, total returns would have been lower. Total returns for periods less than one year are not annualized. Returns shown exclude applicable sales charges. |
| (g) | Includes adjustments in accordance with accounting principles generally accepted in the United States of America and as such, the net asset values for financial reporting purposes and the returns based upon those net asset values may differ from net asset values and returns for shareholder transactions. |
| (h) | Ratios do not include expenses of underlying investment companies in which the Fund invests. |
See Notes to Financial Statements.
| Resource Real Estate Diversified Income Fund – Class C | Financial Highlights |
For a Share Outstanding Throughout the Periods Presented
| | | For the Six Months Ended March 31, 2017 (Unaudited) | | | Year Ended September 30, 2016 | | | For the Period Ended September 30, 2015(a) | | | For the Period Ended February 28, 2015(b) | |
| NET ASSET VALUE, BEGINNING OF PERIOD | | $ | 10.25 | | | $ | 9.81 | | | $ | 10.50 | | | $ | 10.06 | |
| | | | | | | | | | | | | | | | | |
| INCOME FROM INVESTMENT OPERATIONS | | | | | | | | | | | | | | | | |
Net investment income(c)(d) | | | 0.29 | | | | 0.28 | | | | 0.18 | | | | 0.14 | |
| Net realized and unrealized gain/(loss) on investments | | | (0.03 | ) | | | 0.68 | | | | (0.48 | ) | | | 0.58 | |
| Total income/(loss) from investment operations | | | 0.26 | | | | 0.96 | | | | (0.30 | ) | | | 0.72 | |
| | | | | | | | | | | | | | | | | |
| DISTRIBUTIONS TO SHAREHOLDERS | | | | | | | | | | | | | | | | |
| From net investment income | | | (0.26 | ) | | | (0.27 | ) | | | (0.14 | ) | | | (0.20 | ) |
| From net realized gain on investments | | | (0.03 | ) | | | – | | | | (0.03 | ) | | | (0.05 | ) |
| From return of capital | | | – | | | | (0.25 | ) | | | (0.22 | ) | | | (0.03 | ) |
| Total distributions | | | (0.29 | ) | | | (0.52 | ) | | | (0.39 | ) | | | (0.28 | ) |
| INCREASE/DECREASE IN NET ASSET VALUE | | | (0.03 | ) | | | 0.44 | | | | (0.69 | ) | | | 0.44 | |
| NET ASSET VALUE, END OF PERIOD | | $ | 10.22 | | | $ | 10.25 | | | $ | 9.81 | | | $ | 10.50 | |
| | | | | | | | | | | | | | | | | |
TOTAL RETURN(e) | | | 2.63 | % | | | 10.15 | % | | | (2.86 | )%(f) | | | 7.33 | % |
| | | | | | | | | | | | | | | | | |
| RATIOS AND SUPPLEMENTAL DATA | | | | | | | | | | | | | | | | |
| Net assets, end of period (in 000s) | | $ | 45,180 | | | $ | 33,114 | | | $ | 13,436 | | | $ | 3,732 | |
| | | | | | | | | | | | | | | | | |
| RATIOS TO AVERAGE NET ASSETS | | | | | | | | | | | | | | | | |
Including interest expense:(g) | | | | | | | | | | | | | | | | |
| Expenses, gross | | | 3.48 | %(h) | | | 3.53 | % | | | 4.04 | %(h) | | | 6.37 | %(h) |
| Expenses, net of fees waived/expenses reimbursed by investment adviser | | | 3.40 | %(h) | | | 3.14 | % | | | 2.99 | %(h) | | | 3.04 | %(h) |
Excluding interest expense:(g) | | | | | | | | | | | | | | | | |
| Expenses, gross | | | 2.82 | %(h) | | | 3.13 | % | | | 3.79 | %(h) | | | 6.07 | %(h) |
| Expenses, net of fees waived/expenses reimbursed by investment adviser | | | 2.74 | %(h) | | | 2.74 | % | | | 2.74 | %(h) | | | 2.74 | %(h) |
Net investment income(d) | | | 5.82 | %(h) | | | 2.87 | % | | | 2.97 | %(h) | | | 2.34 | %(h) |
| | | | | | | | | | | | | | | | | |
| PORTFOLIO TURNOVER RATE | | | 3 | %(i) | | | 21 | % | | | 5 | %(i) | | | 91 | %(i) |
(a) | With the approval of the Board, effective September 30, 2015, the Fund's fiscal year end was changed from February 28 to September 30 (See Note 1). |
(b) | The Fund's Class C commenced operations on August 1, 2014. |
(c) | Per share numbers have been calculated using the average shares method. |
(d) | Recognition of net investment income is affected by timing and declaration of dividends by underlying investment companies. |
(e) | Total returns shown are historical in nature and assume changes in share price, reinvestment of dividends and capital gains distribution, if any. Had the Adviser not absorbed a portion of Fund expenses, total returns would have been lower. Total returns for periods less than one year are not annualized. Returns shown exclude applicable sales charges. |
(f) | Includes adjustments in accordance with accounting principles generally accepted in the United States of America and as such, the net asset values for financial reporting purposes and the returns based upon those net asset values may differ from net asset values and returns for shareholder transactions. |
(g) | Ratios do not include expenses of underlying investment companies in which the Fund invests. |
See Notes to Financial Statements.
| Semi-Annual Report | March 31, 2017 | 19 |
| Resource Real Estate Diversified Income Fund – Class W | Financial Highlights |
For a Share Outstanding Throughout the Periods Presented
| | | For the Six Months Ended March 31, 2017 (Unaudited) | | | Year Ended September 30, 2016 | | | For the Period Ended September 30, 2015(a) | | | For the Period Ended February 28, 2015(b) | |
| NET ASSET VALUE, BEGINNING OF PERIOD | | $ | 10.41 | | | $ | 9.96 | | | $ | 10.67 | | | $ | 10.18 | |
| | | | | | | | | | | | | | | | | |
| INCOME FROM INVESTMENT OPERATIONS | | | | | | | | | | | | | | | | |
Net investment income(c)(d) | | | 0.33 | | | | 0.32 | | | | 0.20 | | | | 0.03 | |
| Net realized and unrealized gain/(loss) on investments | | | (0.04 | ) | | | 0.69 | | | | (0.49 | ) | | | 0.46 | |
| Total income/(loss) from investment operations | | | 0.29 | | | | 1.01 | | | | (0.29 | ) | | | 0.49 | |
| | | | | | | | | | | | | | | | | |
| DISTRIBUTIONS TO SHAREHOLDERS | | | | | | | | | | | | | | | | |
| From net investment income | | | (0.29 | ) | | | (0.30 | ) | | | (0.15 | ) | | | – | |
| From net realized gain on investments | | | (0.03 | ) | | | – | | | | (0.03 | ) | | | – | |
| From return of capital | | | – | | | | (0.26 | ) | | | (0.24 | ) | | | – | |
| Total distributions | | | (0.32 | ) | | | (0.56 | ) | | | (0.42 | ) | | | – | |
| INCREASE/DECREASE IN NET ASSET VALUE | | | (0.03 | ) | | | 0.45 | | | | (0.71 | ) | | | 0.49 | |
| NET ASSET VALUE, END OF PERIOD | | $ | 10.38 | | | $ | 10.41 | | | $ | 9.96 | | | $ | 10.67 | |
| | | | | | | | | | | | | | | | | |
TOTAL RETURN(e) | | | 2.89 | % | | | 10.46 | % | | | (2.79 | )%(f) | | | 4.81 | %(f) |
| | | | | | | | | | | | | | | | | |
| RATIOS AND SUPPLEMENTAL DATA | | | | | | | | | | | | | | | | |
| Net assets, end of period (in 000s) | | $ | 48,821 | | | $ | 31,076 | | | $ | 11,421 | | | $ | 1,211 | |
| | | | | | | | | | | | | | | | | |
| RATIOS TO AVERAGE NET ASSETS | | | | | | | | | | | | | | | | |
Including interest expense:(g) | | | | | | | | | | | | | | | | |
| Expenses, gross | | | 2.99 | %(h) | | | 3.30 | % | | | 3.78 | %(h) | | | 11.30 | %(h) |
| Expenses, net of fees waived/expenses reimbursed by investment adviser | | | 2.89 | %(h)(i) | | | 2.89 | % | | | 2.74 | %(h) | | | 2.79 | %(h) |
Excluding interest expense:(g) | | | | | | | | | | | | | | | | |
| Expenses, gross | | | 2.33 | %(h) | | | 2.90 | % | | | 3.53 | %(h) | | | 11.00 | %(h) |
| Expenses, net of fees waived/expenses reimbursed by investment adviser | | | 2.23 | %(h)(i) | | | 2.49 | % | | | 2.49 | %(h) | | | 2.49 | %(h) |
Net investment income(d) | | | 6.41 | %(h) | | | 3.17 | % | | | 3.28 | %(h) | | | 1.31 | %(h) |
| | | | | | | | | | | | | | | | | |
| PORTFOLIO TURNOVER RATE | | | 3 | %(j) | | | 21 | % | | | 5 | %(j) | | | 91 | %(j) |
| (a) | With the approval of the Board, effective September 30, 2015, the Fund's fiscal year end was changed from February 28 to September 30 (See Note 1). |
| (b) | The Fund's Class W commenced operations on November 24, 2014. |
| (c) | Per share numbers have been calculated using the average shares method. |
(d) | Recognition of net investment income is affected by timing and declaration of dividends by underlying investment companies. |
| (e) | Total returns shown are historical in nature and assume changes in share price, reinvestment of dividends and capital gains distribution, if any. Had the Adviser not absorbed a portion of Fund expenses, total returns would have been lower. Total returns for periods less than one year are not annualized. |
| (f) | Includes adjustments in accordance with accounting principles generally accepted in the United States of America and as such, the net asset values for financial reporting purposes and the returns based upon those net asset values may differ from net asset values and returns for shareholder transactions. |
| (g) | Ratios do not include expenses of underlying investment companies in which the Fund invests. |
| (i) | Effective January 5, 2017, the annual expense limitation changed from 3.09% to 2.59%. |
See Notes to Financial Statements.
| Resource Real Estate Diversified Income Fund – Class I | Financial Highlights |
For a Share Outstanding Throughout the Periods Presented
| | | For the Six Months Ended March 31, 2017 (Unaudited) | | | Year Ended September 30, 2016 | | | For the Period Ended September 30, 2015(a) | | | For the Period Ended February 28, 2015(b) | |
| NET ASSET VALUE, BEGINNING OF PERIOD | | $ | 10.74 | | | $ | 10.36 | | | $ | 10.79 | | | $ | 10.06 | |
| | | | | | | | | | | | | | | | | |
| INCOME FROM INVESTMENT OPERATIONS | | | | | | | | | | | | | | | | |
Net investment income(c)(d) | | | 0.57 | | | | 0.04 | | | | 0.27 | | | | 0.14 | |
| Net realized and unrealized gain/(loss) on investments | | | (0.30 | ) | | | 0.97 | | | | (0.54 | ) | | | 0.59 | |
| Total income/(loss) from investment operations | | | 0.27 | | | | 1.01 | | | | (0.27 | ) | | | 0.73 | |
| | | | | | | | | | | | | | | | | |
| DISTRIBUTIONS TO SHAREHOLDERS | | | | | | | | | | | | | | | | |
| From net investment income | | | (0.33 | ) | | | (0.33 | ) | | | (0.04 | ) | | | – | |
| From net realized gain on investments | | | (0.03 | ) | | | – | | | | (0.03 | ) | | | – | |
| From return of capital | | | – | | | | (0.30 | ) | | | (0.09 | ) | | | – | |
| Total distributions | | | (0.36 | ) | | | (0.63 | ) | | | (0.16 | ) | | | – | |
| INCREASE/DECREASE IN NET ASSET VALUE | | | (0.09 | ) | | | 0.38 | | | | (0.43 | ) | | | 0.73 | |
| NET ASSET VALUE, END OF PERIOD | | $ | 10.65 | | | $ | 10.74 | | | $ | 10.36 | | | $ | 10.79 | |
| | | | | | | | | | | | | | | | | |
TOTAL RETURN(e) | | | 2.57 | % | | | 10.12 | % | | | (2.51 | )%(f) | | | 7.26 | % |
| | | | | | | | | | | | | | | | | |
| RATIOS AND SUPPLEMENTAL DATA | | | | | | | | | | | | | | | | |
| Net assets, end of period (in 000s) | | $ | 101 | | | $ | 0 | (g) | | $ | 49 | | | $ | 0 | (g) |
| | | | | | | | | | | | | | | | | |
| RATIOS TO AVERAGE NET ASSETS | | | | | | | | | | | | | | | | |
Including interest expense:(h) | | | | | | | | | | | | | | | | |
| Expenses, gross | | | 2.53 | %(i) | | | 2.49 | % | | | 2.96 | %(i) | | | 3.94 | %(i) |
| Expenses, net of fees waived/expenses reimbursed by investment adviser | | | 2.40 | %(i) | | | 2.14 | % | | | 1.99 | %(i) | | | 2.08 | %(i) |
Excluding interest expense:(h) | | | | | | | | | | | | | | | | |
| Expenses, gross | | | 1.87 | %(i) | | | 2.09 | % | | | 2.71 | %(i) | | | 3.60 | %(i) |
| Expenses, net of fees waived/expenses reimbursed by investment adviser | | | 1.74 | %(i) | | | 1.74 | % | | | 1.74 | %(i) | | | 1.74 | %(i) |
Net investment income(d) | | | 11.10 | %(i) | | | 0.36 | % | | | 4.46 | %(i) | | | 2.36 | %(i) |
| | | | | | | | | | | | | | | | | |
| PORTFOLIO TURNOVER RATE | | | 3 | %(j) | | | 21 | % | | | 5 | %(j) | | | 91 | %(j) |
| (a) | With the approval of the Board, effective September 30, 2015, the Fund's fiscal year end was changed from February 28 to September 30 (See Note 1). |
| (b) | The Fund's Class I commenced operations on August 1, 2014. |
| (c) | Per share numbers have been calculated using the average shares method. |
| (d) | Recognition of net investment income is affected by timing and declaration of dividends by underlying investment companies. |
| (e) | Total returns shown are historical in nature and assume changes in share price, reinvestment of dividends and capital gains distribution, if any. Had the Adviser not absorbed a portion of Fund expenses, total returns would have been lower. Total returns for periods less than one year are not annualized. |
| (f) | Includes adjustments in accordance with accounting principles generally accepted in the United States of America and as such, the net asset values for financial reporting purposes and the returns based upon those net asset values may differ from net asset values and returns for shareholder transactions. |
| (g) | Amount less than $500. See Statement of Assets and Liabilities for actual net assets. |
| (h) | Ratios do not include expenses of underlying investment companies in which the Fund invests. |
See Notes to Financial Statements.
| Semi-Annual Report | March 31, 2017 | 21 |
| Resource Real Estate Diversified Income Fund – Class U | Financial Highlights |
For a Share Outstanding Throughout the Periods Presented
| | | For the Six Months Ended March 31, 2017 (Unaudited) | | | Year Ended September 30, 2016 | | | For the Period Ended September 30, 2015(a) | | | For the Period Ended February 28, 2015(b) | |
| NET ASSET VALUE, BEGINNING OF PERIOD | | $ | 10.26 | | | $ | 9.82 | | | $ | 10.52 | | | $ | 10.57 | |
| | | | | | | | | | | | | | | | | |
| INCOME FROM INVESTMENT OPERATIONS | | | | | | | | | | | | | | | | |
Net investment income(c)(d) | | | 0.34 | | | | 0.50 | | | | 0.27 | | | | 0.00 | (e) |
| Net realized and unrealized gain/(loss) on investments | | | (0.03 | ) | | | 0.54 | | | | (0.52 | ) | | | (0.05 | ) |
| Total income/(loss) from investment operations | | | 0.31 | | | | 1.04 | | | | (0.25 | ) | | | (0.05 | ) |
| | | | | | | | | | | | | | | | | |
| DISTRIBUTIONS TO SHAREHOLDERS | | | | | | | | | | | | | | | | |
| From net investment income | | | (0.30 | ) | | | (0.32 | ) | | | (0.17 | ) | | | – | |
| From net realized gain on investments | | | (0.03 | ) | | | – | | | | (0.03 | ) | | | – | |
| From return of capital | | | – | | | | (0.28 | ) | | | (0.25 | ) | | | – | |
| Total distributions | | | (0.33 | ) | | | (0.60 | ) | | | (0.45 | ) | | | – | |
| INCREASE/DECREASE IN NET ASSET VALUE | | | (0.02 | ) | | | 0.44 | | | | (0.70 | ) | | | (0.05 | ) |
| NET ASSET VALUE, END OF PERIOD | | $ | 10.24 | | | $ | 10.26 | | | $ | 9.82 | | | $ | 10.52 | |
| | | | | | | | | | | | | | | | | |
TOTAL RETURN(f) | | | 3.12 | % | | | 10.98 | % | | | (2.40 | )%(g) | | | (0.47 | )% |
| | | | | | | | | | | | | | | | | |
| RATIOS AND SUPPLEMENTAL DATA | | | | | | | | | | | | | | | | |
| Net assets, end of period (in 000s) | | $ | 11,047 | | | $ | 5,766 | | | $ | 61 | | | $ | 2 | |
| | | | | | | | | | | | | | | | | |
| RATIOS TO AVERAGE NET ASSETS | | | | | | | | | | | | | | | | |
Including interest expense:(h) | | | | | | | | | | | | | | | | |
| Expenses, gross | | | 2.71 | %(i) | | | 2.78 | % | | | 3.42 | %(i) | | | 7.74 | %(i) |
| Expenses, net of fees waived/expenses reimbursed by investment adviser | | | 2.65 | %(i) | | | 2.39 | % | | | 2.24 | %(i) | | | 2.28 | %(i) |
Excluding interest expense:(h) | | | | | | | | | | | | | | | | |
| Expenses, gross | | | 2.05 | %(i) | | | 2.38 | % | | | 3.17 | %(i) | | | 7.45 | %(i) |
| Expenses, net of fees waived/expenses reimbursed by investment adviser | | | 1.99 | %(i) | | | 1.99 | % | | | 1.99 | %(i) | | | 1.99 | %(i) |
Net investment income(d) | | | 6.67 | %(i) | | | 5.00 | % | | | 4.64 | %(i) | | | 0.97 | %(i) |
| | | | | | | | | | | | | | | | | |
| PORTFOLIO TURNOVER RATE | | | 3 | %(j) | | | 21 | % | | | 5 | %(j) | | | 91 | %(j) |
| (a) | With the approval of the Board, effective September 30, 2015, the Fund's fiscal year end was changed from February 28 to September 30 (See Note 1). |
| (b) | The Fund's Class U commenced operations on February 13, 2015. |
| (c) | Per share numbers have been calculated using the average shares method. |
| (d) | Recognition of net investment income is affected by timing and declaration of dividends by underlying investment companies. |
(e) | Amount is less than $0.005. |
| (f) | Total returns shown are historical in nature and assume changes in share price, reinvestment of dividends and capital gains distribution, if any. Had the Adviser not absorbed a portion of Fund expenses, total returns would have been lower. Total returns for periods less than one year are not annualized. Returns shown exclude applicable sales charges. |
| (g) | Includes adjustments in accordance with accounting principles generally accepted in the United States of America and as such, the net asset values for financial reporting purposes and the returns based upon those net asset values may differ from net asset values and returns for shareholder transactions. |
| (h) | Ratios do not include expenses of underlying investment companies in which the Fund invests. |
See Notes to Financial Statements.
| Resource Real Estate Diversified Income Fund – Class T | Financial Highlights |
For a Share Outstanding Throughout the Periods Presented
| | | For the Six Months Ended March 31, 2017 (Unaudited) | | | Year Ended September 30, 2016 | | | For the Period Ended September 30, 2015(a) | | | For the Period Ended February 28, 2015(b) | |
| NET ASSET VALUE, BEGINNING OF PERIOD | | $ | 10.23 | | | $ | 9.80 | | | $ | 10.50 | | | $ | 10.55 | |
| | | | | | | | | | | | | | | | | |
| INCOME FROM INVESTMENT OPERATIONS | | | | | | | | | | | | | | | | |
Net investment income(c)(d) | | | 0.30 | | | | 0.33 | | | | 0.22 | | | | 0.00 | (e) |
| Net realized and unrealized gain/(loss) on investments | | | (0.03 | ) | | | 0.62 | | | | (0.53 | ) | | | (0.05 | ) |
| Total income/(loss) from investment operations | | | 0.27 | | | | 0.95 | | | | (0.31 | ) | | | (0.05 | ) |
| | | | | | | | | | | | | | | | | |
| DISTRIBUTIONS TO SHAREHOLDERS | | | | | | | | | | | | | | | | |
| From net investment income | | | (0.26 | ) | | | (0.27 | ) | | | (0.14 | ) | | | – | |
| From net realized gain on investments | | | (0.03 | ) | | | – | | | | (0.03 | ) | | | – | |
| From return of capital | | | – | | | | (0.25 | ) | | | (0.22 | ) | | | – | |
| Total distributions | | | (0.29 | ) | | | (0.52 | ) | | | (0.39 | ) | | | – | |
| INCREASE/DECREASE IN NET ASSET VALUE | | | (0.02 | ) | | | 0.43 | | | | (0.70 | ) | | | (0.05 | ) |
| NET ASSET VALUE, END OF PERIOD | | $ | 10.21 | | | $ | 10.23 | | | $ | 9.80 | | | $ | 10.50 | |
| | | | | | | | | | | | | | | | | |
TOTAL RETURN(f) | | | 2.73 | % | | | 10.05 | % | | | (2.96 | )%(g) | | | (0.47 | )% |
| | | | | | | | | | | | | | | | | |
| RATIOS AND SUPPLEMENTAL DATA | | | | | | | | | | | | | | | | |
| Net assets, end of period (in 000s) | | $ | 4,986 | | | $ | 3,187 | | | $ | 447 | | | $ | 2 | |
| | | | | | | | | | | | | | | | | |
| RATIOS TO AVERAGE NET ASSETS | | | | | | | | | | | | | | | | |
Including interest expense:(h) | | | | | | | | | | | | | | | | |
| Expenses, gross | | | 3.46 | %(i) | | | 3.51 | % | | | 4.10 | %(i) | | | 8.49 | %(i) |
| Expenses, net of fees waived/expenses reimbursed by investment adviser | | | 3.40 | %(i) | | | 3.14 | % | | | 2.99 | %(i) | | | 3.03 | %(i) |
Excluding interest expense:(h) | | | | | | | | | | | | | | | | |
| Expenses, gross | | | 2.80 | %(i) | | | 3.11 | % | | | 3.85 | %(i) | | | 8.20 | %(i) |
| Expenses, net of fees waived/expenses reimbursed by investment adviser | | | 2.74 | %(i) | | | 2.74 | % | | | 2.74 | %(i) | | | 2.74 | %(i) |
Net investment income(d) | | | 5.90 | %(i) | | | 3.31 | % | | | 3.87 | %(i) | | | 0.22 | %(i) |
| | | | | | | | | | | | | | | | | |
| PORTFOLIO TURNOVER RATE | | | 3 | %(j) | | | 21 | % | | | 5 | %(j) | | | 91 | %(j) |
| (a) | With the approval of the Board, effective September 30, 2015, the Fund's fiscal year end was changed from February 28 to September 30 (See Note 1). |
| (b) | The Fund's Class T commenced operations on February 13, 2015. |
| (c) | Per share numbers have been calculated using the average shares method. |
| (d) | Recognition of net investment income is affected by timing and declaration of dividends by underlying investment companies. |
| (e) | Amount is less than $0.005. |
| (f) | Total returns shown are historical in nature and assume changes in share price, reinvestment of dividends and capital gains distribution, if any. Had the Adviser not absorbed a portion of Fund expenses, total returns would have been lower. Total returns for periods less than one year are not annualized. Returns shown exclude applicable sales charges. |
| (g) | Includes adjustments in accordance with accounting principles generally accepted in the United States of America and as such, the net asset values for financial reporting purposes and the returns based upon those net asset values may differ from net asset values and returns for shareholder transactions. |
| (h) | Ratios do not include expenses of underlying investment companies in which the Fund invests. |
See Notes to Financial Statements.
| Semi-Annual Report | March 31, 2017 | 23 |
| Resource Real Estate Diversified Income Fund – Class D | Financial Highlights |
For a Share Outstanding Throughout the Periods Presented
| | | For the Six Months Ended March 31, 2017 (Unaudited) | | | Year Ended September 30, 2016 | | | For the Period Ended September 30, 2015(a) | | | For the Period Ended February 28, 2015(b) | |
| NET ASSET VALUE, BEGINNING OF PERIOD | | $ | 10.41 | | | $ | 9.97 | | | $ | 10.67 | | | $ | 10.72 | |
| | | | | | | | | | | | | | | | | |
| INCOME FROM INVESTMENT OPERATIONS | | | | | | | | | | | | | | | | |
Net investment income(c)(d) | | | 0.32 | | | | 0.31 | | | | 0.24 | | | | 0.00 | (e) |
| Net realized and unrealized gain/(loss) on investments | | | (0.03 | ) | | | 0.69 | | | | (0.52 | ) | | | (0.05 | ) |
| Total income/(loss) from investment operations | | | 0.29 | | | | 1.00 | | | | (0.28 | ) | | | (0.05 | ) |
| | | | | | | | | | | | | | | | | |
| DISTRIBUTIONS TO SHAREHOLDERS | | | | | | | | | | | | | | | | |
| From net investment income | | | (0.28 | ) | | | (0.30 | ) | | | (0.15 | ) | | | – | |
| From net realized gain on investments | | | (0.03 | ) | | | – | | | | (0.03 | ) | | | – | |
| From return of capital | | | – | | | | (0.26 | ) | | | (0.24 | ) | | | – | |
| Total distributions | | | (0.31 | ) | | | (0.56 | ) | | | (0.42 | ) | | | – | |
| INCREASE/DECREASE IN NET ASSET VALUE | | | (0.02 | ) | | | 0.44 | | | | (0.70 | ) | | | (0.05 | ) |
| NET ASSET VALUE, END OF PERIOD | | $ | 10.39 | | | $ | 10.41 | | | $ | 9.97 | | | $ | 10.67 | |
| | | | | | | | | | | | | | | | | |
TOTAL RETURN(f) | | | 2.86 | % | | | 10.35 | % | | | (2.69 | )%(g) | | | (0.47 | )% |
| | | | | | | | | | | | | | | | | |
| RATIOS AND SUPPLEMENTAL DATA | | | | | | | | | | | | | | | | |
| Net assets, end of period (in 000s) | | $ | 7,230 | | | $ | 5,605 | | | $ | 2,131 | | | $ | 2 | |
| | | | | | | | | | | | | | | | | |
| RATIOS TO AVERAGE NET ASSETS | | | | | | | | | | | | | | | | |
Including interest expense:(h) | | | | | | | | | | | | | | | | |
| Expenses, gross | | | 3.21 | %(i) | | | 3.25 | % | | | 3.85 | %(i) | | | 8.19 | %(i) |
| Expenses, net of fees waived/expenses reimbursed by investment adviser | | | 3.15 | %(i) | | | 2.89 | % | | | 2.74 | %(i) | | | 2.78 | %(i) |
Excluding interest expense:(h) | | | | | | | | | | | | | | | | |
| Expenses, gross | | | 2.55 | %(i) | | | 2.85 | % | | | 3.60 | %(i) | | | 7.90 | %(i) |
| Expenses, net of fees waived/expenses reimbursed by investment adviser | | | 2.49 | %(i) | | | 2.49 | % | | | 2.49 | %(i) | | | 2.49 | %(i) |
Net investment income(d) | | | 6.17 | %(i) | | | 3.12 | % | | | 4.13 | %(i) | | | 0.47 | %(i) |
| | | | | | | | | | | | | | | | | |
| PORTFOLIO TURNOVER RATE | | | 3 | %(j) | | | 21 | % | | | 5 | %(j) | | | 91 | %(j) |
| (a) | With the approval of the Board, effective September 30, 2015, the Fund's fiscal year end was changed from February 28 to September 30 (See Note 1). |
| (b) | The Fund's Class D commenced operations on February 13, 2015. |
| (c) | Per share numbers have been calculated using the average shares method. |
| (d) | Recognition of net investment income is affected by timing and declaration of dividends by underlying investment companies. |
| (e) | Amount is less than $0.005. |
| (f) | Total returns shown are historical in nature and assume changes in share price, reinvestment of dividends and capital gains distribution, if any. Had the Adviser not absorbed a portion of Fund expenses, total returns would have been lower. Total returns for periods less than one year are not annualized. |
| (g) | Includes adjustments in accordance with accounting principles generally accepted in the United States of America and as such, the net asset values for financial reporting purposes and the returns based upon those net asset values may differ from net asset values and returns for shareholder transactions. |
| (h) | Ratios do not include expenses of underlying investment companies in which the Fund invests. |
See Notes to Financial Statements.
| Resource Real Estate Diversified Income Fund | Notes to Financial Statements |
| | March 31, 2017 (Unaudited) |
Resource Real Estate Diversified Income Fund (the “Trust” or the “Fund”) was organized as a Delaware statutory trust on August 1, 2012 and is registered under the Investment Company Act of 1940, as amended (the “1940 Act”), closed‐end management investment company that operates as an interval fund with a continuous offering of Fund shares. The Fund’s investment adviser is Resource Real Estate Inc. (the “Adviser”). The Fund’s primary investment objective is to produce current income, with a secondary objective to achieve a long‐term capital appreciation with low to moderate volatility and low to moderate correlation to the broader equity markets. The Fund is diversified and pursues its investment objectives by investing, under normal circumstances, at least 80% of assets (defined as net assets plus the amount of any borrowing for investment purposes) in real estate and real estate related industry securities, primarily in income producing equity and debt securities.
The Fund currently offers Class A, Class C, Class W, Class I, Class U, Class T and Class D shares. Class A shares commenced operations on March 12, 2013, Class C and Class I shares commenced operations on August 1, 2014, Class W shares commenced operations on November 24, 2014 and Class U, Class T and Class D shares commenced operations on February 13, 2015. Class C, Class W, Class I and Class D shares are offered at net asset value. Class A shares are offered at net asset value plus a maximum sales charge of 5.75% and may also be subject to a 0.50% early withdrawal charge, which will be deducted from repurchase proceeds, for shareholders tendering shares fewer than 365 days after the original purchase date, if (i) the original purchase was for amounts of $1 million or more and (ii) the selling broker received the reallowance of the dealer‐manager fee. Class U shares are offered at net asset value plus a maximum sales charge of 6.50% and may also be subject to a 0.50% early withdrawal charge, which will be deducted from repurchase proceeds, for shareholders tendering shares fewer than 365 days after the original purchase date, if (i) the original purchase was for amounts of $1 million or more and (ii) the selling broker received the reallowance of the dealer‐manager fee. Class T shares are offered at net asset value plus a maximum sales charge of 1.50% and may also be subject to a 1.00% early withdrawal charge, which will be deducted from repurchase proceeds, for shareholders tendering shares fewer than 365 days after the original purchase date. Each class represents an interest in the same assets of the Fund and classes are identical except for differences in their sales charge structures and ongoing service and distribution charges. All classes of shares have equal voting privileges except that each class has exclusive voting rights with respect to its service and/or distribution plans. The Fund’s income, expenses (other than class specific distribution fees) and realized and unrealized gains and losses are allocated proportionately each day based upon the relative net assets of each class.
| 2. | SIGNIFICANT ACCOUNTING POLICIES |
The following is a summary of significant accounting policies followed by the Fund in preparation of its financial statements. These policies are in conformity with accounting principles generally accepted in the United States of America (“GAAP”). The Fund is considered an investment company for financial reporting purposes under GAAP. The preparation of financial statements requires management to make estimates and assumptions that affect the reported amounts of assets and liabilities and disclosure of contingent assets and liabilities at the date of the financial statements and the reported amounts of income and expenses for the period. Actual results could differ from those estimates. The Fund is an investment company and accordingly follows the investment company accounting and reporting guidance of the Financial Accounting Standards Board (FASB) Accounting Standard Codification Topic 946 “Financial Services – Investment Companies” including FASB Accounting Standard Update ASU 2013‐08.
Security Valuation – Securities listed on an exchange are valued at the last reported sale price at the close of the regular trading session of the exchange on the business day the value is being determined, or in the case of securities listed on NASDAQ, at the NASDAQ Official Closing Price (“NOCP”). In the absence of a sale, such securities shall be valued at the last bid price. Futures are valued based on their daily settlement value. Short‐term investments that mature in 60 days or less may be valued at amortized cost, provided such valuations represent fair value.
When price quotations for certain securities are not readily available, or if the available quotations are not believed to be reflective of market value by the Adviser, those securities will be valued at “fair value” as determined in good faith by the Fair Value Committee using procedures adopted by and under the supervision of the Fund’s Board of Trustees (the “Board”). There can be no assurance that the Fund could purchase or sell a portfolio security at the price used to calculate the Fund’s net asset value (“NAV”).
Fair valuation procedures may be used to value a substantial portion of the assets of the Fund. The Fund may use the fair value of a security to calculate its NAV when, for example, (1) a portfolio security is not traded in a public market or the principal market in which the security trades is closed, (2) trading in a portfolio security is suspended and not resumed prior to the normal market close, (3) a portfolio security is not traded in significant volume for a substantial period, or (4) the Adviser determines that the quotation or price for a portfolio security provided by a broker‐dealer or independent pricing service is inaccurate.
The “fair value” of securities may be difficult to determine and thus judgment plays a greater role in the valuation process. The fair valuation methodology may include or consider the following guidelines, as appropriate: (1) evaluation of all relevant factors, including but not limited to, pricing history, current market level, supply and demand of the respective security; (2) comparison to the values and current pricing of securities
| Semi-Annual Report | March 31, 2017 | 25 |
| Resource Real Estate Diversified Income Fund | Notes to Financial Statements |
| | March 31, 2017 (Unaudited) |
that have comparable characteristics; (3) knowledge of historical market information with respect to the security; (4) other factors relevant to the security which would include, but not be limited to, duration, yield, fundamental analytical data, the Treasury yield curve and credit quality.
Valuation of Private REITS – The Fund invests a large portion of its assets in Private Real Estate Investment Trusts (“Private REITs”). The Private REITs measure their investment assets at fair value, and report a NAV per share on a calendar quarter basis. In accordance with Accounting Standards Codification (“ASC”) 820, the Fund has elected to apply the practical expedient and to value its investments in Private REITs at their respective NAVs at each quarter. For non‐calendar quarter days, the Fair Value Committee estimates the fair value of each Private REIT by adjusting the most recent NAV for each REIT, as necessary, by the change in a relevant benchmark that the Fair Value Committee has deemed to be representative of the entire Private REIT market.
Valuation of Public Non‐Traded REITS – The Fund also invests a large portion of its assets in Public Non‐Traded Real Estate Investment Trusts (“Public Non‐Traded REITs”). The Public Non‐Traded REITs do not timely report periodic NAVs and therefore cannot be valued using the practical expedient. The Fair Value Committee determines the fair value of Public Non‐Traded REITs by considering various factors such as the most recent published NAV, the transaction price, secondary market trades, shareholder redemption and dividend reinvestment programs, discounted cash flows and potentially illiquidity discounts.
Valuation of Private Investment Funds – The Fund invests a portion of its assets in private investment funds. Private investment funds measure their investment assets at fair value, and report a NAV per share on a calendar quarter basis. In accordance with ASC 820, the Fund has elected to apply the practical expedient and to value its investments in private investment funds at their respective NAVs at each quarter. For non‐calendar quarter days, the Fair Value Committee estimates the fair value of each private investment fund by adjusting the most recent NAV for each private investment fund, as necessary, by the change in a relevant benchmark that the Fair Value Committee has deemed to be representative of the market.
Fair Value Measurements – A three‐tier hierarchy has been established to classify fair value measurements for disclosure purposes. Inputs refer broadly to the assumptions that market participants would use in pricing the asset or liability, including assumptions about risk. Inputs may be observable or unobservable. Observable inputs are inputs that reflect the assumptions market participants would use in pricing the asset or liability that are developed based on market data obtained from sources independent of the reporting entity. Unobservable inputs are inputs that reflect the reporting entity’s own assumptions about the assumptions market participants would use in pricing the asset or liability that are developed based on the best information available. In accordance with the authoritative guidance on fair value measurements and disclosure under GAAP, the Fund discloses fair value of its investments in a hierarchy that prioritizes the inputs to valuation techniques used to measure the fair value.
Various inputs are used in determining the value of the Fund’s investments as of the reporting period end. These inputs are categorized in the following hierarchy under applicable financial accounting standards:
| Level 1 – | Unadjusted quoted prices in active markets for identical, unrestricted assets or liabilities that the Fund has the ability to access at the measurement date; |
| Level 2 – | Quoted prices which are not active, quoted prices for similar assets or liabilities in active markets or inputs other than quoted prices that are observable (either directly or indirectly) for substantially the full term of the asset or liability at the measurement date; and |
| Level 3 – | Significant unobservable prices or inputs (including the Fund’s own assumptions in determining the fair value of investments) where there is little or no market activity for the asset or liability at the measurement date. |
The availability of observable inputs can vary from security to security and is affected by a wide variety of factors, including, for example, the type of security, whether the security is new and not yet established in the marketplace, the liquidity of markets and other characteristics particular to the security. To the extent that valuation is based on models or inputs that are less observable or unobservable in the market, the determination of fair value requires more judgment. Accordingly, the degree of judgment exercised in determining fair value is greatest for instruments categorized in Level 3.
An investment level within the fair value hierarchy is based on the lowest level input, individually or in the aggregate, that is significant to fair value measurement. The valuation techniques used by the Fund to measure fair value during the period ended March 31, 2017 maximized the use of observable inputs and minimized the use of unobservable inputs.
| Resource Real Estate Diversified Income Fund | Notes to Financial Statements |
| | March 31, 2017 (Unaudited) |
The inputs or methodologies used for valuing securities are not necessarily an indication of the risk or liquidity associated with investing in those securities. The following is a summary of the inputs used in valuing the Fund’s investments as of March 31, 2017:
| Investments in Securities at Value | | Level 1 | | | Level 2 | | | Level 3 | | | Total | |
Bonds & Notes(a) | | $ | – | | | $ | 26,041,748 | | | $ | – | | | $ | 26,041,748 | |
Preferred Stocks(a) | | | 45,905,754 | | | | – | | | | – | | | | 45,905,754 | |
| Real Estate Investment Trusts ‐ Common Stocks | | | | | | | | | | | | | | | | |
| Public Non‐Traded Real Estate Investment Trusts | | $ | 9,236,422 | | | $ | – | | | $ | 6,646,648 | | | $ | 15,883,070 | |
| Private Real Estate Investment Trusts | | | – | | | | – | | | | 190,000 | | | | 190,000 | |
Private Real Estate Investment Trusts (Measured at net asset value)(b) | | | – | | | | – | | | | – | | | | 67,075,391 | |
| Traded Real Estate Investment Trusts | | | 87,531,932 | | | | – | | | | – | | | | 87,531,932 | |
| Private Investment Funds | | | | | | | | | | | | | | | | |
(Measured at net asset value)(b) | | | – | | | | – | | | | – | | | | 2,250,369 | |
| Purchased Options | | | 1,020,000 | | | | – | | | | – | | | | 1,020,000 | |
| TOTAL | | $ | 143,694,108 | | | $ | 26,041,748 | | | $ | 6,836,648 | | | $ | 245,898,264 | |
| Other Financial Instruments | | Level 1 | | | Level 2 | | | Level 3 | | | Total | |
| Liabilities | | | | | | | | | | | | |
| Written Options | | $ | (1,150,000 | ) | | $ | – | | | $ | – | | | $ | (1,150,000 | ) |
| TOTAL | | $ | (1,150,000 | ) | | $ | – | | | $ | – | | | $ | (1,150,000 | ) |
(a) | For detailed descriptions, see the accompanying Portfolio of Investments. |
(b) | In accordance with Subtopic 820-10, certain investments that are measured at fair value using the net asset value per share (or its equivalent) practical expedient have not been classified in the fair value hierarchy. The fair value amounts presented in this table are intended to permit reconciliation of the fair value hierarchy to the amounts presented in the Statement of Assets and Liabilities. |
There were no transfers between Levels 1, 2 and 3 during the period ended March 31, 2017. It is the Fund’s policy to recognize transfers between levels at the end of the reporting period.
The following is a reconciliation of assets in which Level 3 inputs were used in determining value:
| Investments in Securities | Balance as of September 30, 2016 | Accrued discount/ premium | Return of Capital | Realized Gain/(Loss) | Change in Unrealized Appreciation/ (Depreciation) | Purchases | Sales Proceeds | Transfer into Level 3 | Transfer out of Level 3 | Balance as of March 31, 2017 | Net change in unrealized appreciation/ (depreciation)included in the Statements of Operations attributable to Level 3 investments held at March 31, 2017 |
| Resource Real Estate Diversified Income Fund | | | | | | | | | | |
| Real Estate Investment Trusts - Common Stock | 7,038,418 | - | - | - | (201,770) | - | - | - | - | 6,836,648 | (201,770) |
| Total | $7,038,418 | $- | $- | $- | $ (201,770) | $- | $ - | $ - | $- | $6,836,648 | $ (201,770) |
Significant unobservable valuation inputs for material Level 3 investments as of March 31, 2017 are as follows:
| | Fair Value at 3/31/2017 | Valuation Technique | Unobservable Input | Range |
| Private Real Estate | | Net Asset Value | Secondary Market Prices | $4.75 |
| Investment Trusts | $190,000 | | Weighting of Transaction Prices | |
| | | Transaction Data | by Volume(a) | 20% or greater |
| Non‐Traded Real Estate | | | | |
| Investment Trusts | $6,646,648 | Net Asset Value | Secondary Market Prices | $0.35‐$20.20 |
| | | | Weighting of Transaction Prices | |
| | | Transaction Data | by Volume(a) | 20% or greater |
(a) | Represents amounts used when the reporting entity has determined that market participant would use such multiples when pricing the investments. |
| Semi-Annual Report | March 31, 2017 | 27 |
| Resource Real Estate Diversified Income Fund | Notes to Financial Statements |
| | March 31, 2017 (Unaudited) |
A change to the unobservable input may result in a significant change to the value of the investment as follows:
| Unobservable Input | Impact to Value if Input Increases | Impact to Value if Input Decreases |
| Secondary Market Prices | Increase | Decrease |
| Weighting of Transaction Prices by Volume | Increase | Decrease |
Security Transactions and Investment Income – Investment security transactions are accounted for on a trade date basis. Cost is determined and gains and losses are based upon the specific identification method for both financial statement and federal income tax purposes. Dividend income is recorded on the ex‐dividend date and interest income is recorded on the accrual basis. Purchase discounts and premiums on securities are accreted and amortized over the life of the respective securities.
Industry Concentration – If the Fund has significant investments in the securities of issuers within a particular industry, any development affecting that industry will have a greater impact on the value of the net assets of the Fund than would be the case if the Fund did not have significant investments in that industry. In addition, this may increase the risk of loss in the Fund and increase the volatility of the Fund’s net asset value per share. Occasionally, market conditions, regulatory changes or other developments may negatively impact this industry, and therefore the value of the Fund’s portfolio will be adversely affected. As of March 31, 2017, the Fund had 111.87% of the value of its net assets invested within the Real Estate industry.
Concentration of Credit Risk – The Fund places its cash with one banking institution, which is insured by Federal Deposit Insurance Corporation (“FDIC”). The FDIC insurance limit is $250,000 per deposit. At various times throughout the year, the amount on deposit may exceed the FDIC limit and subject the Fund to a credit risk. The Fund does not believe that such deposits are subject to any unusual risk associated with investment activities.
Federal and Other Taxes – No provision for income taxes is included in the accompanying financial statements, as the Fund intends to distribute to shareholders all taxable investment income and realized gains and otherwise comply with Subchapter M of the Internal Revenue Code of 1986, as amended, applicable to regulated investment companies.
The Fund evaluates tax positions taken (or expected to be taken) in the course of preparing the Fund’s tax provisions to determine whether these positions meet a “more‐likely‐than‐not” standard that, based on the technical merits, have a more than fifty percent likelihood of being sustained by a taxing authority upon examination. A tax position that meets the “more‐likely‐than‐not” recognition threshold is measured to determine the amount of benefit to recognize in the financial statements.
As of and during the period ended March 31, 2017, the Fund did not have a liability for any unrecognized tax benefits. The Fund files U.S. federal, state and local tax returns as required. The Fund’s tax returns are subject to examination by the relevant tax authorities until expiration of the applicable statute of limitations which is generally three years after the filing of the tax return for federal purposes and four years for most state returns. Tax returns for open years have incorporated no uncertain tax positions that require a provision for income taxes.
Foreign Currency – The accounting records of the Fund are maintained in U.S. dollars. Investment securities and other assets and liabilities denominated in a foreign currency and income receipts and expense payments are translated into U.S. dollars using the prevailing exchange rate at the London market close. Purchases and sales of securities are translated into U.S. dollars at the contractual currency rates established at the approximate time of the trade. Net realized gains and losses on foreign currency transactions represent net gains and losses from currency realized between the trade and settlement dates on securities transactions and the difference between income accrued versus income received. The effects of changes in foreign currency exchange rates on investments in securities are included with the net realized and unrealized gain or loss on investment securities.
Distributions to Shareholders – Distributions from investment income are declared and paid quarterly. Distributions from net realized capital gains, if any, are declared and paid annually and are recorded on the ex‐dividend date. The character of income and gains to be distributed is determined in accordance with income tax regulations, which may differ from GAAP.
Indemnification – The Trust indemnifies its officers and Trustees for certain liabilities that may arise from the performance of their duties to the Trust. Additionally, in the normal course of business, the Fund enters into contracts that contain a variety of representations and warranties and which provide general indemnities. The Fund’s maximum exposure under these arrangements is unknown, as this would involve future claims that may be made against the Fund that have not yet occurred. However, based on industry experience, the Trust expects the risk of loss due to these warranties and indemnities to be remote.
| Resource Real Estate Diversified Income Fund | Notes to Financial Statements |
| | March 31, 2017 (Unaudited) |
| 3. | ADVISORY FEES AND OTHER RELATED PARTY TRANSACTIONS |
Advisory Fees – Pursuant to an investment advisory agreement (the “Advisory Agreement”), investment advisory services are provided to the Fund by the Adviser. Under the terms of the Advisory Agreement, the Adviser receives monthly fees calculated at an annual rate of 1.25% of the average daily net assets of the Fund. During the period ended March 31, 2017, the Fund accrued $1,007,182 in advisory fees.
The Adviser has contractually agreed to waive all or part of its management fees and/or make payments to limit Fund expenses, (including all organization and offering expenses, but excluding interest, brokerage commissions, acquired fund fees and expenses and extraordinary expenses) at least until September 9, 2018, so that the total annual operating expenses of the Fund do not exceed 1.99% per annum of Class A average daily net assets, 2.74% per annum of Class C average daily net assets, 1.99% per annum of Class W average daily net assets, 1.74% per annum of Class I average daily net assets, 1.99% per annum of Class U and average daily net assets, 2.74% per annum of Class T average daily net assets and 2.49% per annum of Class D average daily net assets. The expense limitation for class W was changed from 3.09% to 2.59 effective January 5, 2017. Fee waivers and expense payments may be recouped by the Adviser from the Fund, to the extent that overall expenses fall below the expense limitation, within three years of when the amounts were waived or reimbursed. During the period ended March 31, 2017, the Adviser waived fees and reimbursed expenses of $67,140.
As of September 30, 2016, the balance of recoupable expenses for the Fund was as follows:
| Fund | | Expires February 28, 2018 | | | Expires September 30, 2018 | | | Expires September 30, 2019 | |
| Resource Real Estate Diversified Income Fund | | $ | 431,960 | | | $ | 307,831 | | | $ | 374,046 | |
Fund Accounting Fees and Expenses – ALPS Fund Services, Inc. (“ALPS”) serves as the Fund’s Administrator and Accounting Agent (the “Administrator”) and receives customary fees from the Fund for such services.
Transfer Agent – DST Systems Inc., an affiliate of ALPS, serves as transfer, dividend paying and shareholder servicing agent for the Fund (“Transfer Agent”).
Distributor – ALPS Distributors, Inc. (the “Distributor”) serves as the Fund’s distributor. There are no fees paid to the Distributor pursuant to the Distribution Agreement. The Board has adopted, on behalf of the Fund, a Shareholder Servicing Plan under which the Fund may compensate financial industry professionals for providing ongoing services in respect of clients with whom they have distributed shares of the Fund. Under the Shareholder Servicing Plan, the Fund’s Class A, Class C, Class W, Class U, Class T and Class D shares are subject to a shareholder servicing fee at an annual rate of 0.25% of the average daily net assets attributable to that share class. For the period ended March 31, 2017, the Fund incurred shareholder servicing fees of $201,413. The Class C and Class T shares also pay to the Distributor a distribution fee, payable under a distribution plan adopted by the board, that accrues at an annual rate equal to 0.75% of the Fund’s average daily net assets attributable to Class C and Class T shares and is payable on a quarterly basis. In addition, Class D shares pay to Resource Securities, Inc. (the “Dealer Manager”), an affiliate of the Adviser, a dealer manager fee, payable under a distribution plan adopted by the board, that accrues at an annual rate equal to 0.50% of the Fund’s average daily net assets attributable to Class D shares and is payable on a quarterly basis. Class A, Class W, Class I and Class U shares are not currently subject to a distribution fee. For the period ended March 31, 2017, the Fund accrued $152,007 in distribution fees and $60,691 in dealer manager fees.
The Distributor acts as the Fund’s principal underwriter in a continuous public offering of the Fund’s shares. The Distributor is an affiliate of ALPS. During the period ended March 31, 2017, no fees were retained by the Distributor.
Trustees – Each Trustee who is not affiliated with the Trust or Adviser receives an annual fee of $10,000, plus $2,000 for attending the annual in‐person meeting of the Board of Trustees, plus $500 for attending each of the remaining telephonic meetings, as well as reimbursement for any reasonable expenses incurred attending the meetings. None of the executive officers receive compensation from the Trust.
| 4. | INVESTMENT TRANSACTIONS |
The cost of purchases and proceeds from the sale of securities, other than short‐term securities, for the period ended March 31, 2017, amounted to $74,092,883 and $6,351,653, respectively.
| Semi-Annual Report | March 31, 2017 | 29 |
| Resource Real Estate Diversified Income Fund | Notes to Financial Statements |
| | March 31, 2017 (Unaudited) |
| 5. | DERIVATIVE TRANSACTIONS |
Derivative Instruments and Hedging Activities – The following discloses the Fund’s use of derivative instruments and hedging activities.
The Fund’s investment objectives not only permit the Fund to purchase investment securities, it also allows the Fund to enter into various types of derivative contracts such as futures. In doing so, the Fund will employ strategies in differing combinations to permit them to increase, decrease, or change the level or types of exposure to market factors. Central to those strategies are features inherent to derivatives that make them more attractive for this purpose than equity or debt securities; they require little or no initial cash investment, they can focus exposure on only certain selected risk factors, and they may not require the ultimate receipt or delivery of the underlying security (or securities) to the contract. This may allow the Fund to pursue its objectives more quickly and efficiently than if it were to make direct purchases or sales of securities capable of effecting a similar response to market factors.
Market Risk Factors – In pursuit of its investment objectives, the Fund may seek to use derivatives to increase or decrease their exposure to the following market risk factors:
Foreign Exchange Rate Risk: Foreign exchange rate risk relates to the change in the U.S. dollar value of a security held that is denominated in a foreign currency. The value of a foreign currency denominated security will decrease as the dollar appreciates against the currency, while the value of the foreign currency denominated security will increase as the dollar depreciates against the currency.
Risk of Investing in Derivatives: The Fund’s use of derivatives can result in losses due to unanticipated changes in the market risk factors and the overall market.
Derivatives may have little or no initial cash investment relative to their market value exposure and therefore can produce significant gains or losses in excess of their cost. This use of embedded leverage allows the Fund to increase its market value exposure relative to its net assets and can substantially increase the volatility of the Fund’s performance.
Additional associated risks from investing in derivatives also exist and potentially could have significant effects on the valuation of the derivative and the Fund. Typically, the associated risks are not the risks that the Fund is attempting to increase or decrease exposure to, per their investment objectives, but are the additional risks from investing in derivatives.
Examples of these associated risks are liquidity risk, which is the risk that the Fund will not be able to sell the derivative in the open market in a timely manner, and counterparty credit risk, which is the risk that the counterparty will not fulfill its obligation to the Fund.
Option Contracts – The Fund may enter into options transactions for hedging purposes and for non‐hedging purposes such as seeking to enhance return. The Fund may write covered put and call options on any stocks or stock indices, currencies traded on domestic and foreign securities exchanges, or futures contracts on stock indices, interest rates and currencies traded on domestic and, to the extent permitted by the CFTC, foreign exchanges. A written call option on an asset by a Fund obligates the Fund to sell the specified asset to the holder (purchaser) at a stated price (the exercise price) if the option is exercised before a specified date (the expiration date). A written put option on an asset by a Fund obligates the Fund to buy the specified asset from the purchaser at the exercise price if the option is exercised before the expiration date. Premiums received when writing options are recorded as liabilities and are subsequently adjusted to the current value of the options written. Premiums received from writing options that expire are treated as realized gains. Premiums received from writing options, which are either exercised or closed, are offset against the proceeds received or amount paid on the transaction to determine realized gains or losses which are recorded on the Statement of Operations.
The Fund had the following transactions in written covered call/put options during the period ended March 31, 2017:
| | Number of Contracts | Premiums Received |
| Options Outstanding, Beginning of Period | (12,400) | 1,040,704 |
| Options written | (54,122) | 3,903,069 |
| Options exercised | 46,522 | (3,435,268) |
| Options Outstanding, End of the Period | (20,000) | 1,508,505 |
| Resource Real Estate Diversified Income Fund | Notes to Financial Statements |
March 31, 2017 (Unaudited)
Futures – The Fund may invest in futures contracts in accordance with its investment objectives. The Fund does so for a variety of reasons, including for cash management, hedging or non‐hedging purposes in an attempt to achieve investment returns consistent with the Fund’s investment objective. A futures contract provides for the future sale by one party and purchase by another party of a specified quantity of the security or other financial instrument at a specified price and time. A futures contract on an index is an agreement pursuant to which two parties agree to take or make delivery of an amount of cash equal to the difference between the value of the index at the close of the last trading day of the contract and the price at which the index contract was originally written. Futures transactions may result in losses in excess of the amount invested in the futures contract. There can be no guarantee that there will be a correlation between price movements in the hedging vehicle and in the portfolio securities being hedged. An incorrect correlation could result in a loss on both the hedged securities in a Fund and the hedging vehicle so that the portfolio return might have been greater had hedging not been attempted. There can be no assurance that a liquid market will exist at a time when a Fund seeks to close out a futures contract or a futures option position. Lack of a liquid market for any reason may prevent the Fund from liquidating an unfavorable position, and the Fund would remain obligated to meet margin requirements until the position is closed. In addition, the Fund could be exposed to risk if the counterparties to the contracts are unable to meet the terms of their contracts. With exchange‐traded futures, there is minimal counterparty credit risk to the Fund since futures are exchange‐traded and the exchange’s clearinghouse, as counterparty to all exchange‐traded futures, guarantees the futures against default.
When a purchase or sale of a futures contract is made by the Fund, the Fund is required to deposit with its custodian (or broker, if legally permitted) a specified amount of liquid assets (“initial margin”). The margin required for a futures contract is set by the exchange on which the contract is traded and may be modified during the term of the contract. The initial margin is in the nature of a performance bond or good faith deposit on the futures contract that is returned to the Fund upon termination of the contract, assuming all contractual obligations have been satisfied. Each day the Fund may pay or receive cash, called “variation margin,” equal to the daily change in value of the futures contract. Such payments or receipts are recorded for financial statement purposes as unrealized gains or losses by the Fund. Variation margin does not represent a borrowing or loan by the Fund but is instead a settlement between the Fund and the broker of the amount one would owe the other if the futures contract expired. When the contract is closed, the Fund records a realized gain or loss equal to the difference between the value of the contract at the time it was opened and the value at the time it was closed.
The location in the Statement of Assets and Liabilities of the Fund’s derivative positions as of March 31, 2017 as follows:
| Risk Exposure | | Statement of Assets and Liabilities Location | | | Value | | | Statement of Assets and Liabilities Location | | | Value | |
| Resource Real Estate Diversified Income Fund | | | | | | | | | | | | |
| Purchased Options (Equity contracts) | | Investments, at value | | | | 1,020,000 | | | N/A | | | | |
| Written Options (Equity contracts) | | N/A | | | | | | | Written options, at value | | | | 1,150,000 | |
| Total | | | | | | $ | 1,020,000 | | | | | | | $ | 1,150,000 | |
The location in the Statement of Operations of the Fund’s derivative positions for the period ended March 31, 2017 are as follows:
| Risk Exposure | Statement of Operations Location | | Realized Gain/(Loss) on Derivatives Recognized in Income | | | Change in Unrealized Gain/(Loss) on Derivatives Recognized in Income | |
| Resource Real Estate Diversified Income Fund | | | | | | | |
| Futures Contracts (Foreign exchange contracts) | Net realized gain on futures contracts/Net change in unrealized depreciation on futures contracts | | $ | 322,214 | | | $ | (19,235 | ) |
| Purchased Options (Equity contracts) | Net realized loss on purchased options/Net change in unrealized depreciation on investments | | | (1,860,401 | ) | | | (368,395 | ) |
| Written Options (Equity contracts) | Net realized gain on written options/Net change in unrealized depreciation on written options | | | 3,435,268 | | | | (539,599 | ) |
| Total | | | $ | 1,897,081 | | | $ | (927,229 | ) |
| Semi-Annual Report | March 31, 2017 | 31 |
| Resource Real Estate Diversified Income Fund | Notes to Financial Statements |
March 31, 2017 (Unaudited)
The average notional value of futures contracts, purchased options, and written options during the period ended March 31, 2017 were $1,369,019, 8,636 contracts, and 8,636 contracts respectively.
6. TAX BASIS INFORMATION
The Fund has substantial investments in real estate investment trusts, or REITs, which are generally not subject to federal income taxes. Distributions that the Fund receives from REITs can be classified as ordinary income, capital gain income or return of capital by the REITs that make these distributions to the Fund. However, it is not possible for the Fund to characterize distributions received from REITs during interim periods because the REIT issuers do not report their tax characterizations until subsequent to year end. Final characterization of the Fund’s 2017 distributions to its common shareholders is also dependent upon the magnitude or timing of the Fund’s securities transactions prior to year‐end. Therefore, it is likely that some portion of the Fund’s 2017 investment income and distributions to its common shareholders will be recharacterized as long term capital gain and return of capital for financial statement and U.S. federal income tax purposes subsequent to year end and reflected accordingly in the Fund’s year end financial statements.
The tax character of distributions paid for the year ended September 30, 2016 was as follows:
| | | Ordinary Income | | | Long-Term Capital Gain | | | Return of Capital | |
| Resource Real Estate Diversified Income Fund | | $ | 3,011,654 | | | $ | – | | | $ | 3,029,043 | |
The following information is computed on a tax basis for each item as of March 31, 2017:
| | | Gross Appreciation (excess of value over tax cost) | | | Gross Depreciation (excess of tax cost over value) | | | Net Unrealized Appreciation | | | Cost of Investments for Income Tax Purposes | |
| Resource Real Estate Diversified Income Fund | | $ | 15,321,849 | | | $ | (8,738,726 | ) | | $ | 6,583,123 | | | $ | 239,315,141 | |
The difference between book basis and tax basis distributable earnings and unrealized appreciation/(depreciation) is primarily attributable to the tax deferral of losses on wash sales, investments in partnerships and certain other investments.
7. REPURCHASE OFFERS
Pursuant to Rule 23c‐3 under the 1940 Act the Fund offers shareholders on a quarterly basis the option of redeeming shares, at net asset value, of up to 5% of its issued and outstanding shares as of the close of regular business hours on the New York Stock Exchange on the Repurchase Pricing Date (defined below). If shareholders tender for repurchase more than 5% of the outstanding shares of the Fund, the Fund may, but is not required to, repurchase up to an additional 2%. If the Fund determines not to repurchase an additional 2%, or if more than 7% of the shares are tendered, then the Fund will repurchase shares on a pro rata basis based upon the number of shares tendered by each shareholder. There can be no assurance that the Fund will be able to repurchase all shares that each shareholder has tendered, even if all the shares in a shareholder's account are tendered. In the event of an oversubscribed offer, you may not be able to tender all shares that you wish to tender and may have to wait until the next quarterly repurchase offer to tender the remaining shares. Subsequent repurchase requests will not be given priority over other shareholder requests.
During the period ended March 31, 2017, the Fund completed two quarterly repurchase offers. In these offers, the Fund offered to repurchase up to 5% of the number of its outstanding shares as of the Repurchase Pricing Dates. The result of those repurchase offers were as follows:
| | Repurchase Offer #1 | Repurchase Offer #2 |
| Commencement Date | September 19, 2016 | December 12, 2016 |
| Repurchase Request Deadline | October 19, 2016 | January 11, 2017 |
| Repurchase Pricing Date | October 19, 2016 | January 11, 2017 |
| Amount Repurchased | $4,646,135 | $2,015,252 |
| Shares Repurchased | 451,121 | 197,491 |
| Resource Real Estate Diversified Income Fund | Notes to Financial Statements |
March 31, 2017 (Unaudited)
8. BANK LINE OF CREDIT
The Fund has a $100,000,000 secured revolving bank line of credit through BNP Paribas Prime Brokerage International, Ltd. (the “Bank”) for purpose of investment purchases subject to the limitations of the 1940 Act for borrowings.
Borrowings under this arrangement bear interest at the Bank’s 3 month LIBOR plus 95 basis points at the time of borrowing. During the period ended March 31, 2017, the Fund incurred $531,391 of interest expense related to the borrowings. Average borrowings and the average interest rate during the six months ended March 31, 2017 were $44,036,077 and 2.37%, respectively. The largest outstanding borrowing during the period ended March 31, 2017 was $55,127,471. As of March 31, 2017, the Fund had $49,702,235 of outstanding borrowings.
As collateral security for the Bank line of credit, the Fund grants the Bank a first position security interest in and lien on all securities of any kind or description held by the Fund in the pledge account. As of March 31, 2017, the Fund had $106,386,583 in securities pledged as collateral for the line of credit.
9. UNFUNDED COMMITMENTS
As of March 31, 2017, in addition to the unfunded commitments for investments currently held as of the reporting date (Refer to Portfolio of Investments footnote disclosures), the Fund had $20,000,000 of unfunded commitments relating to potential future investments not currently held as reported below. The value of unfunded commitments reported as of March 31, 2017 approximates fair value.
| Security | | Unfunded Commitments as of March 31, 2017 | |
| Harrison Street Core Property Fund, LP | | $ | 10,000,000 | |
| Metlife Commercial Mortgage Income Fund, LP | | | 10,000,000 | |
10. SUBSEQUENT EVENTS
Subsequent events after the date of the Statement of Assets and Liabilities have been evaluated through the date the financial statements were issued.
The Fund completed a quarterly repurchase offer on April 20, 2017 which resulted in 633,046 Fund shares being repurchased for $6,588,690.
Management has determined that there were no other subsequent events to report through the issuance of these financial statements.
11. RECENT ACCOUNTING PRONOUNCEMENTS
On October 13, 2016, the Securities and Exchange Commission amended Regulation S‐X, which will require standardized, enhanced disclosure about derivatives in investment company financial statements, as well as other amendments. The compliance date for the amendments to Regulation S‐X is August 1, 2017. Management is evaluating the impact to the financial statements and disclosures.
| Semi-Annual Report | March 31, 2017 | 33 |
| Resource Real Estate Diversified Income Fund | Additional Information |
March 31, 2017 (Unaudited)
1. PROXY VOTING POLICIES AND VOTING RECORD
A description of the policies and procedures that the Fund uses to vote proxies relating to portfolio securities is available without charge upon request by calling toll‐free 855‐747‐9559, or on the Securities and Exchange Commission’s (“SEC”) website at http://www.sec.gov. Information regarding how the Fund voted proxies relating to portfolio securities during the most recent 12‐month period ended June 30th is available without charge upon request by calling toll‐free 855‐747‐9559, or on the SEC’s website at http://www.sec.gov.
2. QUARTERLY PORTFOLIO HOLDINGS
The Fund files a complete listing of portfolio holdings for the Fund with the SEC as of the first and third quarters of each fiscal year on Form N‐Q. The filings are available upon request by calling 855‐747‐9559. Furthermore, you may obtain a copy of the filing on the SEC’s website at http://www.sec.gov. The Fund’s Form N‐Q may also be reviewed and copied at the SEC’s Public Reference Room in Washington, D.C., and information on the operation of the Public Reference Room may be obtained by calling 1‐800‐SEC‐0330.
3. DISTRIBUTABLE CASH FLOW
The information presented below regarding Distributable Cash Flow is supplemental non‐GAAP financial information, which is meaningful to understanding the operating performance of the Fund. Distributable Cash Flow is the functional equivalent of EBITDA for non‐investment companies. Management believes it is an important supplemental measure of performance. This information is supplemental, unaudited, and is not inclusive of required financial disclosures (such as Total Expense Ratio), and should be read in conjunction with our full financial statements.
| | | For the Six Months Ended March 31, 2017 | | | For the Year Ended September 30, 2016 | |
| Dividends and Interest from the Statement of Operations | | $ | 7,432,043 | | | $ | 5,723,726 | |
Add: Tax adjustments attributable to REIT and other investments(1) | | | N/A | | | | 1,462,631 | |
| Dividends and Interest before REIT adjustments | | | 7,432,044 | | | | 7,186,357 | |
| | | | | | | | | |
| Total Expenses | | | 2,414,696 | | | | 2,960,277 | |
| Less Fees Waived | | | (67,140 | ) | | | (374,046 | ) |
| Total Net Expenses | | | 2,347,556 | | | | 2,586,231 | |
| | | | | | | | | |
| Distributable Cash Flow | | | 5,084,487 | | | | 4,600,126 | |
| | | | | | | | | |
| Distribution to Shareholders | | | 5,427,917 | | | | 6,040,697 | |
| | | | | | | | | |
| Distribution Coverage Ratio | | | 94 | % | | | 76 | % |
| | | | | | | | | |
Net Realized Gain/(Loss) from the Statement of Operations(2) | | | 1,074,804 | | | | 35,806 | |
| | | | | | | | | |
| Distribution Coverage Ratio including Net Realized Gain | | | 113 | % | | | 77 | % |
| 1 | Tax adjustments attributable to REIT and other investments are adjustments to reflect the tax character of distributions received from underlying investments. Specifically, a portion of distributions received from REITs are often treated as non-taxable return of capital for book and tax purposes and distributions received from investments structured as partnerships are also treated as return of capital to the extent the distributions received exceed the income reported to the Fund on the Form K-1’s received from the underlying investments. |
| 2 | The Fund is subject to a 4% nondeductible excise tax on certain undistributed amounts of ordinary income and capital gain under a prescribed formula contained in Section 4982 of the Code. The formula requires payment to shareholders during a calendar year of distributions representing at least 98% of the Fund's ordinary income for the calendar year and at least 98.2% of its capital gain net income (i.e., the excess of its capital gains over capital losses) realized during the one-year period ending October 31 during such year plus 100% of any income that was neither distributed nor taxed to the Fund during the preceding calendar year. Under ordinary circumstances, the Fund expects to time its distributions so as to avoid liability for this tax. |
Page Intentionally Left Blank
INVESTMENT ADVISER
Resource Real Estate, Inc.
One Crescent Drive, Suite 203
Philadelphia, Pennsylvania 19112
DISTRIBUTOR
ALPS Distributors, Inc.
1290 Broadway, Suite 1100
Denver, Colorado 80203
LEGAL COUNSEL
Thompson Hine LLP
41 South High Street, Suite 1700
Columbus, Ohio 43215
INDEPENDENT REGISTERED
PUBLIC ACCOUNTING FIRM
BBD, LLP
1835 Market Street, 26th Floor
Philadelphia, Pennsylvania 19103
Must be accompanied or preceded by a Prospectus.
ALPS Distributors, Inc. is the Distributor for Resource Real Estate Diversified Income Fund.
Item 2. Code of Ethics.
Not applicable to this report.
Item 3. Audit Committee Financial Expert.
Not applicable to this report.
Item 4. Principal Accountant Fees and Services.
Not applicable to this report.
Item 5. Audit Committee of Listed Registrants.
Not applicable to the registrant.
Item 6. Investments.
| (a) | The schedule of investments is included as part of the Report to Shareholders filed under Item 1 of this report. |
| (b) | Not applicable to the registrant. |
Item 7. Disclosure of Proxy Voting Policies and Procedures for Closed-End Management Investment Companies.
Not applicable to this report.
Item 8. Portfolio Managers of Closed-End Management Investment Companies.
| (a) | Not applicable to this report. |
| (b) | Not applicable to this report. |
Item 9. Purchases of Equity Securities by Closed-End Management Investment Company and Affiliates Purchasers.
None.
Item 10. Submission of Matters to a Vote of Security Holders.
None.
Item 11. Controls and Procedures.
| (a) | Based on an evaluation of the registrant’s disclosure controls and procedures as of a date within 90 days of the filing date of this report, the registrant’s principal executive officer and principal financial officer have concluded that the disclosure controls and procedures are reasonably designed to ensure that the information required in filings on Form N-CSR is recorded, processed, summarized and reported by the filing date, including that information required to be disclosed is accumulated and communicated to the registrant’s management, including the registrant’s principal executive officer and principal financial officer, as appropriate to allow timely decisions regarding required disclosure. |
| (b) | There were no significant changes in the registrant’s internal control over financial reporting that occurred during the registrant’s last fiscal half-year that have materially affected, or are reasonably likely to materially affect, the registrant’s internal control over financial reporting. |
Item 12. Exhibits.
| (a)(2) | Certifications required by Item 12(a)(2) of Form N-CSR are filed herewith as Exhibit 99.CERT. |
| (b) | Certifications required by Item 12(b) of Form N-CSR are filed herewith as Exhibit 99.906CERT. |
SIGNATURES
Pursuant to the requirements of the Securities Exchange Act of 1934 and the Investment Company Act of 1940, the registrant has duly caused this report to be signed on its behalf by the undersigned, thereunto duly authorized.
RESOURCE REAL ESTATE DIVERSIFIED INCOME FUND
By: | /s/ Alan Feldman | |
| Alan Feldman | |
| Chief Executive Officer (Principal Executive Officer) |
Date: June 7, 2017
Pursuant to the requirements of the Securities Exchange Act of 1934 and the Investment Company Act of 1940, this report has been signed below by the following persons on behalf of the registrant and in the capacities and on the dates indicated.
By: | /s/ Alan Feldman | |
| Alan Feldman | |
| Chief Executive Officer (Principal Executive Officer) |
Date: June 7, 2017
By: | /s/ Steven R. Saltzman | |
| Steven R. Saltzman | |
| Treasurer (Principal Financial Officer) |
Date: June 7, 2017