UNITED STATES
SECURITIES AND EXCHANGE COMMISSION
WASHINGTON, D.C. 20549
FORM N-CSR
CERTIFIED SHAREHOLDER REPORT OF REGISTERED
MANAGEMENT INVESTMENT COMPANIES
811-22749
(Investment Company Act file number)
Resource Real Estate Diversified Income Fund
(Exact name of registrant as specified in charter)
717 Fifth Avenue, 14th Floor
New York, NY 10022
(Address of principal executive offices) (Zip code)
The Corporation Trust Company
Corporation Trust Center, 1209 Orange Street
Wilmington, DE 19801
(Name and address of agent for service)
Copy to:
JoAnn M. Strasser Thompson Hine LLP 41 South High Street, 17th Floor Columbus, OH 43215 (614) 469-3265 | Lawrence S. Block Resource Real Estate Diversified Income Fund 717 Fifth Avenue, 14th Floor New York, NY 10022 (212) 506-3899 |
Registrant's telephone number, including area code:(215) 231-7050
Date of fiscal year end:September 30
Date of reporting period:October 1, 2018 - March 31, 2019
Item 1. Reports to Stockholders.

TABLE OF CONTENTS
| Shareholder Letter | 1 |
| Portfolio Update | 3 |
| Portfolio of Investments | 5 |
| Statement of Assets and Liabilities | 10 |
| Statement of Operations | 12 |
| Statements of Changes in Net Assets | 13 |
| Statement of Cash Flows | 16 |
| Financial Highlights | |
| Class A | 17 |
| Class C | 18 |
| Class W | 19 |
| Class I | 20 |
| Class U | 21 |
| Class T | 22 |
| Class D | 23 |
| Class L | 24 |
| Notes to Financial Statements | 25 |
| Additional Information | 34 |
Beginning in 2021, as permitted by regulations adopted by the Securities and Exchange Commission, paper copies of the Fund’s shareholder reports will no longer be sent by mail, unless you specifically request paper copies of the reports from the Fund or from your financial intermediary, such as a broker-dealer or bank. Instead, the reports will be made available on a website, and you will be notified by mail each time a report is posted and provided with a website link to access the report.
If you already elected to receive shareholder reports electronically, you will not be affected by this change and you need not take any action. You may elect to receive shareholder reports and other communications from the Fund electronically by calling the Fund at 855-747-9559, or submit a signed letter of instruction requesting paperless reports to PO Box 219169, Kansas City, MO 64121. If you own shares through a financial intermediary, you may contact your financial intermediary to request your shareholder reports electronically.
You may elect to receive all future reports in paper free of charge. You can inform the Fund that you wish to continue receiving paper copies of your shareholder reports by calling the Fund at 855-747-9559, or by submitting a signed letter of instruction requesting paper reports to PO Box 219169, Kansas City, MO 64121. If you own shares through a financial intermediary, contact the financial intermediary to request paper copies. Your election to receive reports in paper will apply to all funds held with the fund complex or your financial intermediary.

| Resource Real Estate Diversified Income Fund | Shareholder Letter |
March 31, 2019 (Unaudited)
Dear Shareholders:
We are pleased to present you with the Resource Real Estate Diversified Income Fund (the “Fund”) Semi-Annual Report for the six months ended March 31, 2019 (the “semi-annual period”). As the Fund’s investment adviser, we believe Resource Real Estate, LLC has maintained a consistent and disciplined approach to investing the Fund’s capital throughout changing market conditions and has continued to deliver on its key investment objectives to produce income and achieve capital appreciation with low to moderate volatility and low to moderate correlation to the broader equity markets.
The Fund’s real estate investment universe remains broadly comprised of the following three relatively equally weighted strategies: Public Equity (including equity REITs and floating-rate mortgage REITs); Credit (including private real estate credit funds and preferred REIT equity); and Private Equity (predominantly private real estate equity funds). Each strategy offers distinct advantages in facilitating the Fund’s key investment objectives. For example, investments in Private Equity offer strong capital stability and appreciation potential, investments in Credit offer stronger capital protection and income potential, and investments in Public Equity offer strong liquidity and income potential along with access to unique property types that have, in the adviser’s opinion, attractive risk adjusted return profiles and are not readily available in the private market.
Investment Environment
As was the case for the broader U.S. traded equity markets, publicly traded REIT shares were highly volatile during the semi-annual period. During the fourth quarter of calendar year 2018, concerns relating to a slowdown in economic growth, monetary policy and trade policy contributed to a 6.06% decline in the US NAREIT Index1on a total return basis. As these concerns faded at the beginning of 2019, REIT stocks rallied and the US NAREIT Index generated a total return of 17.17% in the first quarter of calendar year 2019. During the Fund’s semi-annual period, the US NAREIT Index generated a total return of 10.07% compared to -1.73% for the S&P500.
While the public markets were volatile, fundamentals remained supportive of commercial real estate values. In particular, employment growth remained strong, averaging 207,0002 new jobs per month over the last six months. Furthermore, the pace of new supply has remained manageable relative to past cycles. According to real estate independent research and advisory firm Green Street Advisors, LLC, new office supply ticked down to 1.4% in 2018 from 1.5% in 2017, while new apartment supply remained unchanged at 1.9%. Green Street Advisors projects a similarly moderate level of new supply in 2019.3Moreover, real estate property values remain buoyed by strong liquidity. London-based alternative investment research firm Prequin Ltd. estimates that private equity managers had a record high of $211 billion to invest in North American real estate as of March 31, 2019,4 which was a 13% increase from $186 billion as of December 31, 2018.4
Notwithstanding solid fundamentals, we believe the decline in the U.S. 10-Year Treasury Note yield during the Fund’s semi-annual period signaled escalating market concerns around the growth trajectory of the broader economy. As such, we were not surprised that more defensive REIT sectors, such as Net Lease5 (+24.67%) and Healthcare6(+16.48%), outperformed during the period. The Apartment sector7 (+14.11%) also outperformed as REIT earnings results for the fourth quarter of calendar year 2018 allayed concerns of potential over-supply. By contrast, more cyclical sectors, such as Office8 (+4.24%) and Malls9(+0.59%), underperformed.
As the real estate market progresses further into the current cycle, we believe it will be increasingly important to maintain risk-adjusted discipline around opportunistically allocating investments across the capital stack and property types with favorable supply and demand factors.
Investment Positioning
We target an approximately equal weighting in each of our three main strategies but diverge from that balanced approach when we believe we can capture risk-adjusted returns with low to moderate volatility. For example, we added positions to the Fund’s Public Equity strategy as the US NAREIT Index declined in the fourth quarter of calendar year 2018, then exited many of those same positions as the market recovered during the first quarter of calendar year 2019. At March 31, 2019, the Fund was slightly overweight in Credit, which we view as appropriately defensive positioning for a late cycle market.
In view of changing real estate market conditions, we also made refinements within each of the Fund’s three key strategies. Within Public Equity, we increased exposure to healthcare REITs from 8.04% as of September 30, 2018 to 14.46% as of March 31, 2019, in anticipation of improving long-term supply and demand dynamics. We also modestly increased exposure to REIT preferred securities within the Credit strategy because we expected inflation data to remain subdued. Within Private Equity, our expectation for a slowdown in the rate of rent growth for stabilized core assets led us to make additional commitments to funds that focus on value add investment strategies. As relative value between the Fund’s strategies and allocations shifts in the coming year, we will continue to rebalance as warranted.
The Fund seeks broad diversification10 not only at the asset level but also across real estate sectors and the capital stack. Such diversification may protect the Fund’s portfolio as real estate markets continue to adjust to cyclical, fundamental and policy changes. Furthermore, within each strategy, we target investments that complement the Fund’s income, volatility, distribution coverage, liquidity and total return profiles. Our commitment to thorough fundamental research is also intended to enhance our security selection within each strategy.
| Semi-Annual Report | March 31, 2019 | 1 |
| Resource Real Estate Diversified Income Fund | Shareholder Letter |
March 31, 2019 (Unaudited)
Fund Performance
The Fund continued to deliver on its objectives to produce income and achieve capital appreciation with low to moderate volatility and low to moderate correlation to the broader equity markets. Since inception on March 12, 2013 through March 31, 2019, the Fund has paid a consistent distribution for 24 straight quarters, which corresponded to an annualized rate of 5.76%11for the Fund’s Class A shares as of March 31, 2019.
Given the Fund’s allocations to Credit and Private Equity, its performance may lag the public REIT equity markets during periods of sharp share price appreciation, which occurred during the semi-annual period. During the semi-annual period, the Fund’s Class A shares generated a total return of 2.60% as compared to a total return of 10.07% for the US NAREIT Index and 3.19% for the NCREIF Private Commercial Real Estate Property Index during the same period. At the same time, during the semi-annual period, the Fund’s volatility (as measured by standard deviation) was 5.24% compared to 19.80% for the S&P 500 and 17.22% for the US NAREIT Index.
We are proud of the Fund’s consistent distribution and performance track record over the past five years and believe that our approach to asset allocation, security selection and diversification will enable the Fund to continue to deliver on its key investment objectives over the course of the next year and beyond.
Thank you for being a shareholder of the Resource Real Estate Diversified Income Fund.
Sincerely,
Justin Milberg
Portfolio Manager
Resource Real Estate Diversified Income Fund
| 1 | FTSE NAREIT All Equity REITS Total Return Index. |
| 2 | Bloomberg US Employees on Nonfarm Payrolls Total MoM Net Change SA Index (NFP TCH). |
| 3 | Green Street Supply Growth – Property Sector Fundamental & Valuation Data January 2010- April 2019. |
| 4 | Preqin Quarterly Update: Real Estate Q1 2019. |
| 5 | Bloomberg Single Tenant REIT Index (“BBREOUTL”). |
| 6 | Bloomberg Healthcare REIT Index (“BBREHLTH”). |
| 7 | Bloomberg Apartment REIT Index (“BBREAPT”). |
| 8 | Bloomberg Office REIT Index (“BBREOFPY”). |
| 9 | Bloomberg Regional Mall REIT Index (“BBREMALL”). |
| 10 | Diversification does not eliminate the risk of experiencing investment losses. |
| 11 | To calculate the quarterly distribution, the Fund’s management takes the income received from the Fund’s portfolio, subtracts expenses and divides the result by the total number of shares the Fund’s investors own. The annualized distribution represents a single distribution from the Fund and does not represent the total return of the Fund. A portion of the Fund’s distribution has been comprised of a return of capital because certain Fund investments have included preferred and common equity investments, which may include a return of capital. Distributions are not guaranteed. |
| Resource Real Estate Diversified Income Fund | Portfolio Update |
March 31, 2019 (Unaudited)
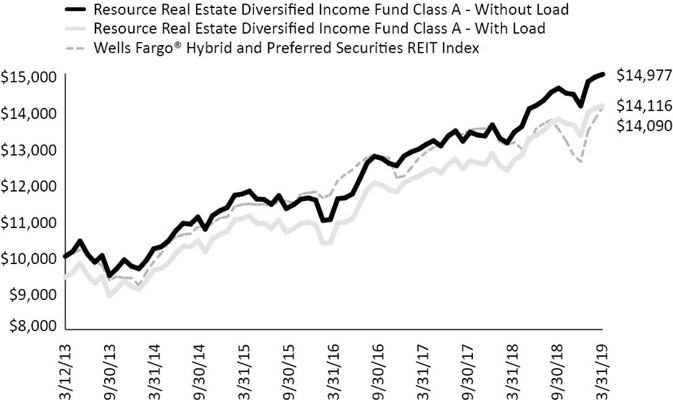
The Fund’s performance figures for the periods ended March 31, 2019,* compared to its benchmark:
| Resource Real Estate Diversified Income Fund | 6 Month | 1 Year | 3 Year | 5 Year | Since Inception | Inception |
| Class A Shares – Without Load | 2.60% | 11.78% | 8.97% | 7.86% | 6.90% | 3/12/2013 |
| Class A Shares – With Load | -3.31% | 5.39% | 6.56% | 6.59% | 5.86% | 3/12/2013 |
| Class C Shares | 2.20% | 11.05% | 8.15% | – | 6.35% | 8/1/2014 |
| Class C Shares – With Load(a) | -0.32% | 8.40% | 7.59% | – | 6.02% | 8/1/2014 |
| Class D Shares3 | 2.24% | 11.23% | 8.41% | – | 6.47% | 2/12/2015 |
| Class I Shares | 2.74% | 12.15% | 8.76% | – | 6.87% | 8/1/2014 |
| Class L Shares – Without Load | 2.37% | 11.50% | – | – | 7.16% | 7/10/2017 |
| Class L Shares – With Load | -2.03% | 6.75% | – | – | 4.51% | 7/10/2017 |
| Class T Shares – Without Load2 | 2.20% | 10.95% | 8.15% | – | 6.31% | 2/12/2015 |
| Class T Shares – With Load | 0.66% | 9.28% | 7.60% | – | 5.97% | 2/12/2015 |
| Class U Shares – Without Load1 | 2.59% | 11.77% | 9.00% | 7.88% | 6.92% | 2/12/2015 |
| Class U Shares – With Load | -4.09% | 4.49% | 6.59% | 6.44% | 5.73% | 2/12/2015 |
| Class W Shares | 2.60% | 11.80% | 8.83% | – | 6.75% | 11/21/2014 |
| Wells Fargo® Hybrid and Preferred Securities REIT Index | 4.57% | 7.44% | 5.28% | 6.94% | 5.83% | 11/21/2014 |
| * | Returns for periods greater than one year are annualized. |
| (a) | Effective as of December 23, 2016, Class C shares no longer have a sales load. |
| 1 | Returns shown prior to 2/12/2015 are based on the returns of Class A Shares. If Class U Shares had been available during periods prior to 2/12/2015, the performance shown may have been different. |
| 2 | Returns shown prior to 2/12/2015 are based on the returns of Class C Shares. If Class T Shares had been available during periods prior to2/12/2015, the performance shown may have been different. |
| 3 | Returns shown prior to 2/12/2015 are based on the returns of Class W Shares. If Class D Shares had been available during periods prior to 2/12/2015, the performance shown may have been different. |
The Wells Fargo® Hybrid and Preferred Securities REIT (“WHPSR”) Index is designed to track the performance of preferred securities issued in the U.S. market by real estate investment trusts. The WHPSR Index is composed exclusively of preferred shares and depositary shares. Investors cannot invest directly in an index.
Past performance is not indicative of future results. The investment return and principal value of an investment will fluctuate. An investor’s shares when redeemed may be worth more or less than the original cost. Total return is calculated assuming reinvestment of all dividends and distributions. Performance figures for periods greater than one year are annualized. As of the Fund’s most recent prospectus dated February 1, 2019, the Fund’s total annual operating expense, including acquired fund fees and expenses, before fee waivers is 2.97% for Class A, 3.73% for Class C, 2.96% for Class W, 2.75% for Class I, 2.95% for Class U, 3.71% for Class T, 3.38% for Class D and 3.22% for Class L shares. After fee waivers, the Fund’s total annual operating expense is 2.76% for Class A, 3.51% for Class C, 2.76% for Class W, 2.49% for Class I, 2.76% for Class U, 3.51% for Class T, 3.27% for Class D and 2.99% for Class L shares. Class A shares are subject to a maximum sales load of 5.75% imposed on purchases. Class U shares are subject to a maximum sales load of 6.50% imposed on purchases. Class T shares are subject to a maximum sales load of 1.50% imposed on purchases. Class L shares are subject to a maximum sales load of 4.25% imposed on purchases. Repurchases of shares within 365 days of the purchase may be assessed an early withdrawal charge of 0.50% for Class A, 1.00% for Class C, 1.00% for Class T and 0.50% for Class U shares. For performance information current to the most recent month-end, please call toll-free 1-855-747-9559.
| Semi-Annual Report | March 31, 2019 | 3 |
| Resource Real Estate Diversified Income Fund | Portfolio Update |
March 31, 2019 (Unaudited)
Comparison of the Change in Value of a $10,000 Investment
Portfolio Composition as of March 31, 2019
| Asset Type | Percent of Net Assets |
| Real Estate Investment Trusts - Common Equity | 98.26% |
| Preferred Stock | 16.49% |
| Purchased Options | 0.42% |
| Bonds & Notes | 0.18% |
| Short Term Investments | 0.13% |
| Total Investments | 115.48% |
| Liabilities in Excess of Other Assets | -15.48% |
| Net Assets | 100.00% |
| Resource Real Estate Diversified Income Fund | Portfolio of Investments |
March 31, 2019 (Unaudited)
| | | Interest /Dividend Rate | | Maturity | | Principal | | Value |
| BONDS & NOTES (0.18%) | | | | | | | | | | | | |
| COMMERCIAL MORTGAGE-BACKED SECURITIES (0.18%) | | | | | | | | | | | | |
| Morgan Stanley Capital I Trust, Class B(a) | | 5.538% | | 02/12/2044 | | $ | 559,675 | | | $ | 559,055 | |
| | | | | | | | | | | | | |
| TOTAL BONDS & NOTES | | | | | | | | | | | | |
| (Cost $554,176) | | | | | | | | | | | 559,055 | |
| | | | | | | Shares | | Value |
| PREFERRED STOCKS (16.49%) | | | | | | | | |
TRADED REAL ESTATE INVESTMENT TRUSTS (16.49%) | | | | | | | | |
| American Homes 4 Rent, Series D(b) | | 6.500% | | | | | 121,489 | | | | 3,219,458 | |
| Annaly Capital, Series F(b) | | 6.950% | | | | | 250,000 | | | | 6,402,500 | |
| ARMOUR Residential REIT, Inc., Series B(b) | | 7.875% | | | | | 107,127 | | | | 2,678,175 | |
| Chimera Investment Corp., Series B(b) | | 8.000% | | | | | 78,447 | | | | 2,025,502 | |
| Chimera Investment Corp., Series D(c) | | 8.000% | | | | | 21,344 | | | | 546,193 | |
| City Office REIT, Inc., Series A(b) | | 6.625% | | | | | 39,717 | | | | 988,953 | |
| Colony Capital, Inc., Series E(b) | | 8.750% | | | | | 75,921 | | | | 1,910,932 | |
| Colony Capital, Inc., Series I(b) | | 7.150% | | | | | 162,500 | | | | 3,677,375 | |
| Dynex Capital, Inc., Series B(b) | | 7.625% | | | | | 200,000 | | | | 4,752,000 | |
| Global Medical REIT, Inc., Series A(b) | | 7.500% | | | | | 98,278 | | | | 2,509,037 | |
| Global Net Lease, Inc., Series A(b) | | 7.250% | | | | | 72,996 | | | | 1,873,807 | |
| Innovative Industrial Properties, Inc., Series A(b) | | 9.000% | | | | | 95,000 | | | | 2,826,250 | |
| Monmouth Real Estate Investment Corp., Series C(b) | | 6.125% | | | | | 99,948 | | | | 2,397,753 | |
| New York Mortgage Trust, Inc., Series C(b) | | 7.875% | | | | | 60,004 | | | | 1,492,299 | |
| Pebblebrook Hotel Trust, Series F(b) | | 6.300% | | | | | 99,945 | | | | 2,488,631 | |
| Sotherly Hotels, Inc., Series B(b) | | 8.000% | | | | | 120,000 | | | | 2,992,800 | |
| Two Harbors Investment Corp., Series A(b) | | 8.125% | | | | | 150,000 | | | | 4,104,000 | |
| Two Harbors Investment Corp., Series C(b) | | 7.250% | | | | | 107,829 | | | | 2,617,010 | |
| UMH Properties, Inc.(b) | | 6.750% | | | | | 30,304 | | | | 775,479 | |
| | | | | | | | | | | | | |
TOTAL PREFERRED STOCKS
(Cost $48,310,059) | | | | | | | | | | | 50,278,154 | |
| | | | | | | | | | | | | |
| REAL ESTATE INVESTMENT TRUSTS - COMMON EQUITY (98.26%) | | | | | | | | | | | | |
| PUBLIC NON-TRADED REAL ESTATE INVESTMENT TRUSTS (0.89%) | | | | | | | | | | | | |
| Cole Credit Property Trust IV, Inc.(c)(d)(e)(f) | | | | | | | 2,431 | | | | 21,027 | |
| InvenTrust Properties Corp.(c)(d)(e)(f) | | | | | | | 446,837 | | | | 1,398,378 | |
| NorthStar Healthcare Income, Inc.(c)(d)(e)(f) | | | | | | | 168,566 | | | | 1,172,324 | |
| Phillips Edison Grocery Center REIT I, Inc.(c)(d)(e)(f) | | | | | | | 11,518 | | | | 127,275 | |
| | | | | | | | | | | | 2,719,004 | |
| PRIVATE REAL ESTATE INVESTMENT TRUSTS & PRIVATE INVESTMENT FUNDS (59.90%) | | | | | | | | | | | | |
| Acres Capital Debt Fund(d)(f) | | | | | | | 5,999,427 | | | | 5,998,827 | |
| Ares Real Estate Enhanced Income Fund(d)(f) | | | | | | | 3,585,696 | | | | 3,622,797 | |
| Ares US Real Estate IX(d)(f) | | | | | | | 3,931,371 | | | | 3,924,295 | |
| Bain Capital Real Estate I-B, LP(d)(f) | | | | | | | 310,498 | | | | 186,516 | |
| Broadstone Net Lease, Inc.(d)(f) | | | | | | | 165,897 | | | | 14,101,224 | |
| Brookfield Real Estate Finance V(d)(f) | | | | | | | 9,938,995 | | | | 7,795,091 | |
| Clarion Lion Industrial Trust(d)(f) | | | | | | | 7,203 | | | | 13,953,757 | |
| Clarion Lion Properties Fund, LP(d)(f) | | | | | | | 10,295 | | | | 15,624,474 | |
| Clarion Partners Debt Investment Fund, LP(d)(f) | | | | | | | 11,121,865 | | | | 5,681,049 | |
| See Notes to Financial Statements. | |
| Semi-Annual Report | March 31, 2019 | 5 |
| Resource Real Estate Diversified Income Fund | Portfolio of Investments |
March 31, 2019 (Unaudited)
| | | Shares | | | Value | |
| PRIVATE REAL ESTATE INVESTMENT TRUSTS & PRIVATE INVESTMENT FUNDS (continued) | | | | | | |
| Clarion Ventures 4, LP(d)(f) | | | 12,526,113 | | | $ | 13,484,360 | |
| GWL U.S. Property Fund, LP(d)(f) | | | 12,550,910 | | | | 13,206,085 | |
| Harrison Street Core Property Fund Private Reit(d)(f) | | | 8,309 | | | | 11,403,542 | |
| Heitman Core Real Estate Debt Income Trust, LP(d)(f) | | | 24,624 | | | | 25,271,528 | |
| Metlife Commercial Mortgage Income Fund, LP(d)(f) | | | 9,801 | | | | 10,063,460 | |
| Och-Ziff Real Estate Credit Fund, LP(d)(f) | | | 4,157,634 | | | | 3,325,276 | |
| PGIM Real Estate US Debt Fund(d)(f) | | | 22,517 | | | | 25,079,054 | |
| Truman 2016 SC5, LLC(d)(f) | | | 2,179,832 | | | | 1,320,760 | |
| UBS Trumbull Property Fund(d)(f) | | | 758 | | | | 8,582,759 | |
| | | | | | | | 182,624,854 | |
| TRADED REAL ESTATE INVESTMENT TRUSTS (37.47%) | | | | | | | | |
| Apollo Commercial Real Estate Finance, Inc.(b) | | | 353,615 | | | | 6,435,793 | |
| Ares Commercial Real Estate Corp.(b) | | | 235,775 | | | | 3,581,422 | |
| Blackstone Mortgage Trust, Inc., Class A(b) | | | 290,000 | | | | 10,022,400 | |
| Brixmor Property Group, Inc.(b) | | | 350,000 | | | | 6,429,500 | |
| City Office REIT, Inc.(b) | | | 375,000 | | | | 4,241,250 | |
| Condor Hospitality Trust, Inc.(b) | | | 332,402 | | | �� | 2,991,618 | |
| EPR Properties(b) | | | 70,000 | | | | 5,383,000 | |
| Granite Point Mortgage Trust, Inc.(b) | | | 415,884 | | | | 7,722,966 | |
| Great Ajax Corp.(b) | | | 278,944 | | | | 3,832,691 | |
| HCP, Inc.(b) | | | 139,598 | | | | 4,369,417 | |
| KKR Real Estate Finance Trust, Inc.(b) | | | 310,000 | | | | 6,206,200 | |
| Ladder Capital Corp., Class A(b) | | | 403,059 | | | | 6,860,064 | |
| Medical Properties Trust, Inc.(b) | | | 250,000 | | | | 4,627,500 | |
| New Residential Investment Corp.(b) | | | 250,000 | | | | 4,227,500 | |
| Spirit Realty Capital, Inc.(b) | | | 175,000 | | | | 6,952,750 | |
| STAG Industrial, Inc.(b) | | | 173,160 | | | | 5,134,194 | |
| Starwood Property Trust, Inc.(b) | | | 275,000 | | | | 6,146,250 | |
| TPG RE Finance Trust, Inc.(b) | | | 310,000 | | | | 6,076,000 | |
| Ventas, Inc.(b) | | | 45,000 | | | | 2,871,450 | |
| Welltower, Inc.(b) | | | 60,000 | | | | 4,656,000 | |
| WP Carey, Inc.(b) | | | 70,000 | | | | 5,483,100 | |
| | | | | | | | 114,251,065 | |
| TOTAL REAL ESTATE INVESTMENT TRUSTS- COMMON EQUITY (Cost $276,158,300) | | | | | | | 299,594,923 | |
| | | Clearing Firm | | Notional Amount | | | Number of Contracts | | | Value | |
| PURCHASED OPTIONS (0.42%) | | | | | | | | | | | |
iShares U.S. Real Estate ETF, Put, Exercise Price $83,
(expiring 06/21/19) | | BNP Paribas | | $ | 113,152,000 | | | | 13,000 | | | | 1,261,000 | |
| | | | | | | | | | | | | | | |
| TOTAL PURCHASED OPTIONS (Cost $1,892,004) | | | | | | | | | | | | | 1,261,000 | |
| See Notes to Financial Statements. | |
| 6 | www.resourcealts.com |
| Resource Real Estate Diversified Income Fund | Portfolio of Investments |
March 31, 2019 (Unaudited)
| | | Shares | | | Value | |
| SHORT TERM INVESTMENTS (0.13%) | | | | | | |
| Dreyfus Treasury Cash Management, Institutional Class, 2.30%(g) | | | 398,329 | | | $ | 398,329 | |
| | | | | | | | | |
| TOTAL SHORT TERM INVESTMENTS (Cost $398,329) | | | | | | | 398,329 | |
| | | | | | | | | |
| INVESTMENTS, AT VALUE (115.48%) (Cost $327,312,868) | | | | | | $ | 352,091,461 | |
| | | | | | | | | |
| LINE OF CREDIT (-15.73%) | | | | | | | (47,948,871 | ) |
| | | | | | | | | |
| Other Assets In Excess Of Liabilities (0.25%) | | | | | | | 750,977 | |
| | | | | | | | | |
| NET ASSETS (100.00%) | | | | | | $ | 304,893,567 | |
| (a) | Variable rate investment. Interest rates reset periodically. Interest rate shown reflects the rate in effect at March 31, 2019. For securities based on a published reference rate and spread, the reference rate and spread are indicated in the description above. Certain variable rate securities are not based on a published reference rate and spread but are determined by the issuer or agent and are based on current market conditions. These securities do not indicate a reference rate and spread in their description above. |
| (b) | All or a portion of each of these securities may be segregated as collateral for written options and the Fund's line of credit. The aggregate market value of those securities was $160,244,063. |
| (c) | Non-income producing security. |
| (d) | Fair value estimated using fair valuation procedures adopted by the Board of Trustees. Total value of such securities is $185,343,858, representing 60.79% of net assets. |
| (e) | As a result of the use of significant unobservable inputs to determine fair value, these investments have been classified as Level 3 assets. |
| (f) | Illiquid/restricted security. See chart below. |
| (g) | Money market fund; interest rate reflects seven-day effective yield on March 31, 2019. |
| See Notes to Financial Statements. | |
| Semi-Annual Report | March 31, 2019 | 7 |
| Resource Real Estate Diversified Income Fund | Portfolio of Investments |
March 31, 2019 (Unaudited)
Securities determined to be illiquid/restricted under the procedures approved by the Fund's Board of Trustees are as follows.
| Date(s) of Purchase | | Security | | Cost | | | Value | | | % of Net Assets | |
| 8/16/18 - 12/27/18 | | Acres Capital Debt Fund | | $ | 6,000,000 | | | $ | 5,998,827 | | | | 1.97 | % |
| 2/22/2019 | | Ares Real Estate Enhanced Income Fund | | | 3,586,917 | | | | 3,622,797 | | | | 1.19 | % |
| 12/14/18 - 3/15/2019 | | Ares US Real Estate IX | | | 3,847,635 | | | | 3,924,295 | | | | 1.29 | % |
| 11/14/18 - 3/25/2019 | | Bain Capital Real Estate I-B, LP | | | 304,156 | | | | 186,516 | | | | 0.06 | % |
| 10/31/16 - 05/31/17 | | Broadstone Net Lease, Inc. | | | 12,204,884 | | | | 14,101,224 | | | | 4.62 | % |
| 06/26/17 - 12/04/18 | | Brookfield Real Estate Finance V | | | 8,033,999 | | | | 7,795,091 | | | | 2.56 | % |
| 01/01/14 - 04/03/17 | | Clarion Lion Industrial Trust | | | 9,871,674 | | | | 13,953,757 | | | | 4.58 | % |
| 01/01/14 - 02/28/2019 | | Clarion Lion Properties Fund, LP | | | 12,879,784 | | | | 15,624,474 | | | | 5.12 | % |
| 02/14/17 - 11/01/18 | | Clarion Partners Debt Investment Fund, LP | | | 5,692,221 | | | | 5,681,049 | | | | 1.86 | % |
| 07/01/16 - 12/14/18 | | Clarion Ventures 4, LP | | | 11,488,783 | | | | 13,484,360 | | | | 4.42 | % |
| 05/22/13 | | Cole Credit Property Trust IV, Inc. | | | 17,615 | | | | 21,027 | | | | 0.01 | % |
| 09/01/16 - 06/30/17 | | GWL U.S. Property Fund, LP | | | 12,618,893 | | | | 13,206,085 | | | | 4.33 | % |
| 01/03/18 | | Harrison Street Core Property Fund Private Reit | | | 11,087,291 | | | | 11,403,542 | | | | 3.74 | % |
| 07/27/17 - 11/13/17 | | Heitman Core Real Estate Debt Income Trust, LP | | | 25,000,000 | | | | 25,271,528 | | | | 8.29 | % |
| 02/06/15 | | InvenTrust Properties Corp. | | | 1,331,728 | | | | 1,398,378 | | | | 0.46 | % |
| 01/02/18 - 04/02/18 | | Metlife Commercial Mortgage Income Fund, LP | | | 10,000,000 | | | | 10,063,460 | | | | 3.30 | % |
| 11/27/13 - 03/12/15 | | NorthStar Healthcare Income, Inc. | | | 1,197,856 | | | | 1,172,324 | | | | 0.38 | % |
| 06/28/17 - 02/11/2019 | | Och-Ziff Real Estate Credit Fund, LP | | | 3,537,552 | | | | 3,325,276 | | | | 1.09 | % |
| 07/31/17 - 03/29/18 | | PGIM Real Estate US Debt Fund | | | 25,000,000 | | | | 25,079,054 | | | | 8.23 | % |
| 08/07/13 - 11/25/13 | | Phillips Edison Grocery Center REIT I, Inc. | | | 77,969 | | | | 127,275 | | | | 0.04 | % |
| 06/24/16 - 03/20/2019 | | Truman 2016 SC5, LLC | | | 877,428 | | | | 1,320,760 | | | | 0.43 | % |
| 01/04/16-10/01/18 | | UBS Trumbull Property Fund | | | 8,200,000 | | | | 8,582,759 | | | | 2.82 | % |
| | | Total | | $ | 172,856,385 | | | $ | 185,343,858 | | | | 60.79 | % |
Additional information on investments in private real estate investment funds:
| Security | | Value | | | Redemption Frequency | | Redemption Notice (Days) | | Unfunded Commitments as of March 31, 2019 | |
| Acres Capital Debt Fund | | $ | 5,998,827 | | | N/A | | N/A | | $ | – | |
| Ares Real Estate Enhanced Income Fund | | | 3,622,797 | | | Quarterly | | 90 | | | 10,413,083 | |
| Ares US Real Estate IX(a) | | | 3,924,295 | | | N/A | | N/A | | | 8,652,365 | |
| Bain Capital Real Estate I-B, LP | | | 186,516 | | | N/A | | N/A | | | 9,886,388 | |
| Broadstone Net Lease, Inc. | | | 14,101,224 | | | Quarterly | | 10 | | | 2,000,000 | |
| Brookfield Real Estate Finance V | | | 7,795,091 | | | N/A | | N/A | | | 16,798,934 | |
| Clarion Lion Industrial Trust | | | 13,953,757 | | | Quarterly | | 90 | | | – | |
| Clarion Lion Properties Fund, LP | | | 15,624,474 | | | Quarterly | | 90 | | | – | |
| Clarion Partners Debt Investment Fund, LP | | | 5,681,049 | | | N/A | | N/A | | | 6,331,972 | |
| Clarion Ventures 4, LP | | | 13,484,360 | | | N/A | | N/A | | | 1,660,211 | |
| GWL U.S. Property Fund, LP | | | 13,206,085 | | | Quarterly | | 90 | | | – | |
| Harrison Street Core Property Fund Private Reit | | | 11,403,542 | | | Quarterly | | 45 | | | 4,000,000 | |
| Heitman Core Real Estate Debt Income Trust, LP(b) | | | 25,271,528 | | | Quarterly | | 90 | | | – | |
| Metlife Commercial Mortgage Income Fund, LP | | | 10,063,460 | | | Quarterly | | 90 | | | 4,000,000 | |
| Och-Ziff Real Estate Credit Fund, LP | | | 3,325,276 | | | N/A | | N/A | | | 17,385,652 | |
| PGIM Real Estate US Debt Fund(c) | | | 25,079,054 | | | Quarterly | | 90 | | | – | |
| Truman 2016 SC5, LLC | | | 1,320,760 | | | N/A | | N/A | | | – | |
| UBS Trumbull Property Fund | | | 8,582,759 | | | Quarterly | | 60 | | | – | |
| (a) | Redemptions are subject to a two-year holding period from the underlying fund's initial capital call on December 17, 2018. |
| (b) | Redemptions are subject to a three-year holding period from the date of the underlying fund's initial close on July 27, 2017. |
| (c) | Redemptions are subject to a two-year holding period from the date of the underlying fund's initial close on July 21, 2017. |
| See Notes to Financial Statements. | |
| 8 | www.resourcealts.com |
| Resource Real Estate Diversified Income Fund | Portfolio of Investments |
March 31, 2019 (Unaudited)
Schedule Of Written Options
At March 31, 2019, the Fund had the following outstanding written options:
| | | Clearing Firm | | Number of Contracts | | | Exercise Price | | | Maturity Date | | Notional Value | | | Value | |
| Call Options | | | | | | | | | | | | | | | | | | | | |
| iShares U.S. Real Estate ETF | | BNP Paribas | | | (13,000 | ) | | $ | 89.00 | | | 6/21/2019 | | $ | (113,152,000 | ) | | $ | (1,469,000 | ) |
| | | | | | | | | | | | | | | | | | | | | |
| Put Options | | | | | | | | | | | | | | | | | | | | |
| iShares U.S. Real Estate ETF | | BNP Paribas | | | (13,000 | ) | | $ | 80.00 | | | 6/21/2019 | | $ | (113,152,000 | ) | | $ | (734,500 | ) |
| | | | | | | | | | | | | | | | | | | | | |
| Total Written Options (Premiums $1,753,991) | | | | | | | | | $ | (226,304,000 | ) | | $ | (2,203,500 | ) |
See Notes to Financial Statements.
| Semi-Annual Report | March 31, 2019 | 9 |
| Resource Real Estate Diversified Income Fund | Statement of Assets and Liabilities |
March 31, 2019 (Unaudited)
| ASSETS | | | |
| Investments, at value (Cost $327,312,868) | | $ | 352,091,461 | |
| Due from broker | | | 112,254 | |
| Dividends and interest receivable | | | 2,818,083 | |
| Receivable for securities sold | | | 3,909,380 | |
| Receivable for Fund shares sold | | | 1,013,531 | |
| Prepaid expenses and other assets | | | 79,948 | |
| Total assets | | | 360,024,657 | |
| | | | | |
| LIABILITIES | | | | |
| Written options, at value (Proceeds $1,753,991) | | | 2,203,500 | |
| Line of credit payable | | | 47,948,871 | |
| Payable to custodian | | | 2,741,309 | |
| Payable for investments purchased | | | 1,276,781 | |
| Payable due to adviser | | | 307,755 | |
| Administration fees payable | | | 52,853 | |
| Custody fees payable | | | 25,259 | |
| Payable for trustee fees and expenses | | | 692 | |
| Payable for compliance services fees | | | 16,394 | |
| Distribution and dealer manager fees payable | | | 49,943 | |
| Shareholder servicing fees payable | | | 56,537 | |
| Payable for transfer agency fees | | | 47,220 | |
| Accrued expenses and other liabilities | | | 403,976 | |
| Total liabilities | | | 55,131,090 | |
| NET ASSETS | | $ | 304,893,567 | |
| | | | | |
| NET ASSETS CONSISTS OF | | | | |
| Paid-in capital | | $ | 282,324,798 | |
| Total distributable earnings | | | 22,568,769 | |
| NET ASSETS | | $ | 304,893,567 | |
| Commitments (Note 9) | | | | |
| See Notes to Financial Statements. | |
| 10 | www.resourcealts.com |
| Resource Real Estate Diversified Income Fund | Statement of Assets and Liabilities |
March 31, 2019 (Unaudited)
| PRICING OF SHARES | | | |
| Class A | | | | |
| Net Assets | | $ | 89,059,655 | |
| Shares of beneficial interest outstanding (unlimited number of shares, no par value common stock authorized) | | | 8,536,640 | |
| Net Asset Value and redemption price per share(a) | | $ | 10.43 | |
| Maximum Offering Price Per Share (Maximum Sales Charge of 5.75%) | | $ | 11.07 | |
| Class C | | | | |
| Net Assets | | $ | 66,040,133 | |
| Shares of beneficial interest outstanding (unlimited number of shares, no par value common stock authorized) | | | 6,332,277 | |
| Net Asset Value, offering and redemption price per share(a) | | $ | 10.43 | |
| Class W | | | | |
| Net Assets | | $ | 85,038,708 | |
| Shares of beneficial interest outstanding (unlimited number of shares, no par value common stock authorized) | | | 8,029,088 | |
| Net Asset Value, offering and redemption price per share | | $ | 10.59 | |
| Class I | | | | |
| Net Assets | | $ | 34,215,823 | |
| Shares of beneficial interest outstanding (unlimited number of shares, no par value common stock authorized) | | | 3,147,558 | |
| Net Asset Value, offering and redemption price per share | | $ | 10.87 | |
| Class U | | | | |
| Net Assets | | $ | 10,777,932 | |
| Shares of beneficial interest outstanding (unlimited number of shares, no par value common stock authorized) | | | 1,032,301 | |
| Net Asset Value and redemption price per share(a) | | $ | 10.44 | |
| Maximum Offering Price Per Share (Maximum Sales Charge of 6.50%) | | $ | 11.17 | |
| Class T | | | | |
| Net Assets | | $ | 6,954,680 | |
| Shares of beneficial interest outstanding (unlimited number of shares, no par value common stock authorized) | | | 667,903 | |
| Net Asset Value and redemption price per share(a) | | $ | 10.41 | |
| Maximum Offering Price Per Share (Maximum Sales Charge of 1.50%) | | $ | 10.57 | |
| Class D | | | | |
| Net Assets | | $ | 6,472,015 | |
| Shares of beneficial interest outstanding (unlimited number of shares, no par value common stock authorized) | | | 610,890 | |
| Net Asset Value, offering and redemption price per share | | $ | 10.59 | |
| Class L | | | | |
| Net Assets | | $ | 6,334,621 | |
| Shares of beneficial interest outstanding (unlimited number of shares, no par value common stock authorized) | | | 607,060 | |
| Net Asset Value and redemption price per share | | $ | 10.43 | |
| Maximum Offering Price Per Share (Maximum Sales Charge of 4.25%) | | $ | 10.89 | |
| (a) | Redemption price varies based on length of time held (Note 1). |
| See Notes to Financial Statements. | |
| Semi-Annual Report | March 31, 2019 | 11 |
| Resource Real Estate Diversified Income Fund | Statementof Operations |
For the Six Months Ended March 31, 2019 (Unaudited)
| INVESTMENT INCOME | | | |
| Dividends | | $ | 9,409,477 | |
| Interest | | | 70,131 | |
| Total investment income | | | 9,479,608 | |
| EXPENSES | | | | |
| Investment advisory fees (Note 3) | | | 1,749,644 | |
| Administrative fees (Note 3) | | | 153,014 | |
| Distribution fees (Note 3): | | | | |
| Class C | | | 237,525 | |
| Class T | | | 20,728 | |
| Class L | | | 6,896 | |
| Shareholder servicing fees (Note 3): | | | | |
| Class A | | | 105,109 | |
| Class C | | | 79,175 | |
| Class W | | | 90,976 | |
| Class U | | | 13,159 | |
| Class T | | | 6,909 | |
| Class D | | | 6,094 | |
| Class L | | | 6,896 | |
| Dealer manager fees (Note 3): | | | | |
| Class D | | | 16,177 | |
| Interest expense (Note 8) | | | 740,473 | |
| Transfer agent fees (Note 3) | | | 180,422 | |
| Audit fees | | | 13,225 | |
| Legal fees | | | 30,151 | |
| Printing expense | | | 118,618 | |
| Registration fees | | | 45,274 | |
| Custody fees | | | 52,339 | |
| Trustee fees and expenses (Note 3) | | | 24,407 | |
| Compliance services fees (Note 3) | | | 99,727 | |
| Networking Fees: | | | | |
| Class A | | | 10,722 | |
| Class C | | | 6,843 | |
| Class W | | | 5,621 | |
| Class I | | | 2,435 | |
| Class L | | | 253 | |
| Other expenses | | | 48,021 | |
| Total expenses | | | 3,870,833 | |
| Less fees waived/expenses reimbursed by investment adviser (Note 3) | | | (96,022 | ) |
| Recoupment of previously waived fees | | | 1,244 | |
| Total net expenses | | | 3,776,055 | |
| NET INVESTMENT INCOME | | | 5,703,553 | |
| REALIZED AND UNREALIZED GAIN/(LOSS) ON INVESTMENTS | | | | |
| Net realized gain on investments | | | 1,573,835 | |
| Net realized loss on written options | | | (1,946,759 | ) |
| Net realized gain on foreign currency transactions | | | 6,715 | |
| Total net realized loss | | | (366,209 | ) |
| Net change in unrealized appreciation on investments | | | 2,758,680 | |
| Net change in unrealized depreciation on written options | | | (642,813 | ) |
| Net change in unrealized appreciation on translation of assets and liabilities in foreign currencies | | | 3 | |
| Total net change in unrealized appreciation | | | 2,115,870 | |
| NET REALIZED AND UNREALIZED GAIN ON INVESTMENTS | | | 1,749,661 | |
| NET INCREASE IN NET ASSETS RESULTING FROM OPERATIONS | | $ | 7,453,214 | |
| See Notes to Financial Statements. | |
| 12 | www.resourcealts.com |
| Resource Real Estate Diversified Income Fund | Statements of Changes in Net Assets |
| | | For the Six Months Ended March 31, 2019 (Unaudited) | | | For the Year Ended September 30, 2018 | |
| OPERATIONS | | | | | | | | |
| Net investment income | | $ | 5,703,553 | | | $ | 6,882,506 | |
| Net realized gain/(loss) | | | (366,209 | ) | | | 1,480,021 | |
| Net change in unrealized appreciation | | | 2,115,870 | | | | 12,998,190 | |
| Net increase in net assets resulting from operations | | | 7,453,214 | | | | 21,360,717 | |
| | | | | | | | | |
| DISTRIBUTIONS TO SHAREHOLDERS | | | | | | | | |
| Total Distributable Earnings | | | | | | | | |
| Class A | | | (2,502,800 | ) | | | (3,174,296 | ) |
| Class C | | | (1,619,171 | ) | | | (1,954,018 | ) |
| Class W | | | (2,302,101 | ) | | | (2,391,342 | ) |
| Class I | | | (906,940 | ) | | | (668,785 | ) |
| Class U | | | (305,571 | ) | | | (437,968 | ) |
| Class T | | | (154,358 | ) | | | (192,158 | ) |
| Class D | | | (170,822 | ) | | | (250,554 | ) |
| Class L | | | (162,993 | ) | | | (116,282 | ) |
| From return of capital: | | | | | | | | |
| Class A | | | – | | | | (1,743,504 | ) |
| Class C | | | – | | | | (1,045,908 | ) |
| Class W | | | – | | | | (1,348,909 | ) |
| Class I | | | – | | | | (449,161 | ) |
| Class U | | | – | | | | (244,700 | ) |
| Class T | | | – | | | | (102,898 | ) |
| Class D | | | – | | | | (132,459 | ) |
| Class L | | | – | | | | (74,212 | ) |
| Net decrease in net assets from distributions | | | (8,124,756 | ) | | | (14,327,154 | ) |
| | | | | | | | | |
| CAPITAL SHARE TRANSACTIONS | | | | | | | | |
| Class A | | | | | | | | |
| Proceeds from sales of shares | | | 6,258,464 | | | | 13,680,821 | |
| Distributions reinvested | | | 1,226,321 | | | | 2,483,378 | |
| Cost of shares redeemed | | | (4,270,065 | ) | | | (11,098,578 | ) |
| Net Transferred in/(out) | | | (853,483 | ) | | | (4,490,045 | ) |
| Net increase from capital shares transactions | | | 2,361,237 | | | | 575,576 | |
| | | | | | | | | |
| Class C | | | | | | | | |
| Proceeds from sales of shares | | | 6,703,759 | | | | 10,074,220 | |
| Distributions reinvested | | | 996,627 | | | | 1,878,771 | |
| Cost of shares redeemed | | | (2,352,710 | ) | | | (8,383,522 | ) |
| Net Transferred in/(out) | | | (1,506,434 | ) | | | (302,336 | ) |
| Net increase from capital shares transactions | | | 3,841,242 | | | | 3,267,133 | |
| | | | | | | | | |
| Class W | | | | | | | | |
| Proceeds from sales of shares | | | 16,583,533 | | | | 22,102,057 | |
| Distributions reinvested | | | 1,421,980 | | | | 2,300,048 | |
| Cost of shares redeemed | | | (2,103,187 | ) | | | (14,081,528 | ) |
| Net Transferred in/(out) | | | (147,641 | ) | | | 896,811 | |
| Net increase from capital shares transactions | | | 15,754,685 | | | | 11,217,388 | |
| | | | | | | | | |
| Class I | | | | | | | | |
| Proceeds from sales of shares | | | 11,320,767 | | | | 9,224,928 | |
| Distributions reinvested | | | 575,959 | | | | 715,396 | |
| Cost of shares redeemed | | | (1,069,848 | ) | | | (5,104,391 | ) |
| Net Transferred in/(out) | | | 1,131,353 | | | | 8,248,092 | |
| Net increase from capital shares transactions | | | 11,958,231 | | | | 13,084,025 | |
| | | | | | | | | |
| Class U | | | | | | | | |
| Distributions reinvested | | | 100,836 | | | | 225,027 | |
| Cost of shares redeemed | | | (921,443 | ) | | | (990,979 | ) |
| Net Transferred in/(out) | | | 222,040 | | | | (98,811 | ) |
| Net decrease from capital shares transactions | | | (598,567 | ) | | | (864,763 | ) |
| See Notes to Financial Statements. | |
| Semi-Annual Report | March 31, 2019 | 13 |
| Resource Real Estate Diversified Income Fund | Statements of Changes in Net Assets (continued) |
| | | For the Six Months Ended March 31, 2019 (Unaudited) | | | For the Year Ended September 30, 2018 | |
| Class T | | | | | | | | |
| Distributions reinvested | | $ | 83,592 | | | $ | 145,760 | |
| Cost of shares redeemed | | | (105,093 | ) | | | (457,499 | ) |
| Net Transferred in/(out) | | | 1,461,285 | | | | (275,588 | ) |
| Net increase/(decrease) from capital shares transactions | | | 1,439,784 | | | | (587,327 | ) |
| | | | | | | | | |
| Class D | | | | | | | | |
| Distributions reinvested | | | 95,265 | | | | 204,540 | |
| Cost of shares redeemed | | | (24,901 | ) | | | (378,814 | ) |
| Net Transferred in/(out) | | | (298,051 | ) | | | (3,910,516 | ) |
| Net decrease from capital shares transactions | | | (227,687 | ) | | | (4,084,790 | ) |
| | | | | | | | | |
| Class L | | | | | | | | |
| Proceeds from sales of shares | | | 1,688,385 | | | | 3,785,619 | |
| Distributions reinvested | | | 74,509 | | | | 89,456 | |
| Cost of shares redeemed | | | (26,352 | ) | | | (176,607 | ) |
| Net Transferred in/(out) | | | (9,069 | ) | | | (67,607 | ) |
| Net increase from capital shares transactions | | | 1,727,473 | | | | 3,630,861 | |
| Net increase in net assets | | | 35,584,856 | | | | 33,271,666 | |
| | | | | | | | | |
| NET ASSETS | | | | | | | | |
| Beginning of period | | | 269,308,711 | | | | 236,037,045 | |
| End of period | | $ | 304,893,567 | | | $ | 269,308,711 | |
| | | | | | | | | |
| OTHER INFORMATION | | | | | | | | |
| Capital Shares Transactions | | | | | | | | |
| Class A | | | | | | | | |
| Issued | | | 605,436 | | | | 1,291,742 | |
| Distributions reinvested | | | 121,283 | | | | 246,168 | |
| Redeemed | | | (411,727 | ) | | | (1,097,733 | ) |
| Net Transferred in/(out) | | | (81,737 | ) | | | (399,459 | ) |
| Net increase in capital shares | | | 233,255 | | | | 40,718 | |
| | | | | | | | | |
| Class C | | | | | | | | |
| Issued | | | 647,202 | | | | 994,254 | |
| Distributions reinvested | | | 98,581 | | | | 186,242 | |
| Redeemed | | | (227,111 | ) | | | (832,571 | ) |
| Net Transferred in/(out) | | | (143,680 | ) | | | (39,336 | ) |
| Net increase in capital shares | | | 374,992 | | | | 308,589 | |
| | | | | | | | | |
| Class W | | | | | | | | |
| Issued | | | 1,577,243 | | | | 2,165,783 | |
| Distributions reinvested | | | 138,414 | | | | 224,371 | |
| Redeemed | | | (199,786 | ) | | | (1,376,110 | ) |
| Net Transferred in/(out) | | | (14,177 | ) | | | 60,818 | |
| Net increase in capital shares | | | 1,501,694 | | | | 1,074,862 | |
| | | | | | | | | |
| Class I | | | | | | | | |
| Issued | | | 1,046,861 | | | | 879,388 | |
| Distributions reinvested | | | 54,595 | | | | 67,976 | |
| Redeemed | | | (99,184 | ) | | | (484,526 | ) |
| Net Transferred in/(out) | | | 104,431 | | | | 788,565 | |
| Net increase in capital shares | | | 1,106,703 | | | | 1,251,403 | |
| See Notes to Financial Statements. | |
| 14 | www.resourcealts.com |
| Resource Real Estate Diversified Income Fund | Statements of Changes
in Net Assets (continued) |
| | | For the Six Months Ended March 31, 2019 (Unaudited) | | | For the Year Ended September 30, 2018 | |
| OTHER INFORMATION | | | | | | |
| Capital Shares Transactions | | | | | | |
| Class U | | | | | | | | |
| Distributions reinvested | | | 9,961 | | | | 22,466 | |
| Redeemed | | | (88,641 | ) | | | (96,573 | ) |
| Net Transferred in/(out) | | | 21,127 | | | | (9,498 | ) |
| Net decrease in capital shares | | | (57,553 | ) | | | (83,605 | ) |
| | | | | | | | | |
| Class T | | | | | | | | |
| Distributions reinvested | | | 8,241 | | | | 14,491 | |
| Redeemed | | | (10,149 | ) | | | (45,546 | ) |
| Net Transferred in/(out) | | | 139,639 | | | | (26,978 | ) |
| Net increase/(decrease) in capital shares | | | 137,731 | | | | (58,033 | ) |
| | | | | | | | | |
| Class D | | | | | | | | |
| Distributions reinvested | | | 9,281 | | | | 19,974 | |
| Redeemed | | | (2,360 | ) | | | (36,792 | ) |
| Net Transferred in/(out) | | | (28,285 | ) | | | (379,137 | ) |
| Net decrease in capital shares | | | (21,364 | ) | | | (395,955 | ) |
| | | | | | | | | |
| Class L | | | | | | | | |
| Issued | | | 162,723 | | | | 361,637 | |
| Distributions reinvested | | | 7,361 | | | | 8,819 | |
| Redeemed | | | (2,549 | ) | | | (17,031 | ) |
| Net Transferred in/(out) | | | (875 | ) | | | 5,025 | |
| Net increase in capital shares | | | 166,660 | | | | 358,450 | |
| See Notes to Financial Statements. | |
| Semi-Annual Report | March 31, 2019 | 15 |
| Resource Real Estate Diversified Income Fund | Statement of Cash Flows |
For the Six Months Ended March 31, 2019 (Unaudited)
| CASH FLOWS FROM OPERATING ACTIVITIES: | | | |
| Net increase in net assets from operations | | $ | 7,453,214 | |
| Adjustments to reconcile net increase/(decrease) in net assets resulting from operations to net cash used by operating activities: | | | | |
| Purchase of investment securities | | | (198,470,637 | ) |
| Proceeds from sale of investment securities | | | 166,756,513 | |
| Purchase of option contracts | | | (3,634,655 | ) |
| Proceeds from sale of option contracts | | | 202,247 | |
| Premiums received from written options transactions | | | 3,007,738 | |
| Premiums paid from closing written options transactions | | | (4,091,165 | ) |
| Net (purchase) proceeds from short-term investment securities | | | 52,815 | |
| Amortization of discount and accretion of discount on investments | | | (73 | ) |
| Net realized (gain)/loss on: | | | | |
| Investments | | | (1,573,835 | ) |
| Written options | | | 1,946,759 | |
| Net change in unrealized (appreciation)/depreciation on: | | | | |
| Investments | | | (2,758,680 | ) |
| Written options | | | 642,813 | |
| (Increase)/Decrease in assets: | | | | |
| Dividends and interest receivable | | | 310,364 | |
| Prepaid expenses and other assets | | | (54,811 | ) |
| Increase/(Decrease) in liabilities: | | | | |
| Interest on line of credit payable | | | (28,736 | ) |
| Payable due to adviser | | | 72,990 | |
| Administration fees payable | | | 504 | |
| Custody fees payable | | | (1,197 | ) |
| Shareholder servicing fees payable | | | (65,952 | ) |
| Payable for trustee fees and expenses | | | 692 | |
| Payable for compliance services fees | | | (273 | ) |
| Distribution and dealer manager fees payable | | | 5,378 | |
| Payable for transfer agency fees | | | (6,826 | ) |
| Accrued expenses and other liabilities | | | (24,319 | ) |
| Net cash used by operating activities | | | (30,259,132 | ) |
| | | | | |
| CASH FLOWS FROM FINANCING ACTIVITIES: | | | | |
| Payments on line of credit | | | (155,525 | ) |
| Proceeds from sale of shares | | | 42,032,589 | |
| Cost of shares redeemed | | | (10,873,599 | ) |
| Increase in payable to custodian | | | 2,741,309 | |
| Cash distributions paid | | | (3,549,667 | ) |
| Net cash provided by financing activities | | | 30,195,107 | |
| | | | | |
| Net Change in cash & cash equivalents | | | (64,025 | ) |
| | | | | |
| Restricted and unrestricted cash and foreign currency, beginning of period | | $ | 176,279 | |
| Restricted and unrestricted cash and foreign currency, end of period | | $ | 112,254 | |
| | | | | |
| SUPPLEMENTAL DISCLOSURE OF CASH FLOW INFORMATION: | | | | |
| Non-cash financing activities not included herin consist of reinvestment of distributions of: | | $ | 4,575,089 | |
| Cash paid for interest on line of credit during the period was: | | $ | 769,209 | |
| RECONCILIATION OF RESTRICTED AND UNRESTRICTED CASH AT THE BEGINNING OF PERIOD TO THE STATEMENT OF ASSETS AND LIABILITIES | | | | |
| Cash | | $ | 64,920 | |
| Due from broker | | | | |
| Written options | | $ | 111,359 | |
| RECONCILIATION OF RESTRICTED AND UNRESTRICTED CASH AT THE END OF PERIOD TO THE STATEMENT OF ASSETS AND LIABILITIES | | | | |
| Cash | | $ | – | |
| Due from broker | | | | |
| Written options | | $ | 112,254 | |
| See Notes to Financial Statements. | |
| 16 | www.resourcealts.com |
| Resource Real Estate Diversified Income Fund – Class A | Financial Highlights |
For a Share Outstanding Throughout the Periods Presented
| | | For the Six Months Ended March 31, 2019 (Unaudited) | | | Year Ended September 30, 2018 | | | Year Ended September 30, 2017 | | | Year Ended September 30, 2016 | | | For the PeriodEnded September 30, 2015(a) | | | Year Ended February 28, 2015 | | | For the Period Ended February 28, 2014(b) | |
| NET ASSET VALUE, BEGINNING OF PERIOD | | $ | 10.47 | | | $ | 10.19 | | | $ | 10.26 | | | $ | 9.81 | | | $ | 10.52 | | | $ | 9.75 | | | $ | 10.00 | |
| | | | | | | | | | | | | | | | | | | | | | | | | | | | | |
| INCOME FROM INVESTMENT OPERATIONS | | | | | | | | | | | | | | | | | | | | | | | | | | | | |
| Net investment income(c)(d) | | | 0.22 | | | | 0.30 | | | | 0.39 | | | | 0.34 | | | | 0.21 | | | | 0.33 | | | | 0.24 | |
| Net realized and unrealized gain/(loss) on investments | | | 0.04 | | | | 0.58 | | | | 0.17 | | | | 0.71 | | | | (0.47 | ) | | | 1.05 | | | | (0.06 | ) |
| Total income/(loss) from investment operations | | | 0.26 | | | | 0.88 | | | | 0.56 | | | | 1.05 | | | | (0.26 | ) | | | 1.38 | | | | 0.18 | |
| DISTRIBUTIONS TO SHAREHOLDERS | | | | | | | | | | | | | | | | | | | | | | | | | | | | |
| From net investment income | | | (0.30 | ) | | | (0.24 | ) | | | (0.31 | ) | | | (0.32 | ) | | | (0.17 | ) | | | (0.48 | ) | | | (0.39 | ) |
| From net realized gain on investments | | | – | | | | (0.15 | ) | | | (0.12 | ) | | | – | | | | (0.03 | ) | | | (0.05 | ) | | | (0.00 | )(e) |
| From return of capital | | | – | | | | (0.21 | ) | | | (0.20 | ) | | | (0.28 | ) | | | (0.25 | ) | | | (0.08 | ) | | | (0.04 | ) |
| Total distributions | | | (0.30 | ) | | | (0.60 | ) | | | (0.63 | ) | | | (0.60 | ) | | | (0.45 | ) | | | (0.61 | ) | | | (0.43 | ) |
| INCREASE/DECREASE IN NET ASSET VALUE | | | (0.04 | ) | | | 0.28 | | | | (0.07 | ) | | | 0.45 | | | | (0.71 | ) | | | 0.77 | | | | (0.25 | ) |
| NET ASSET VALUE, END OF PERIOD | | $ | 10.43 | | | $ | 10.47 | | | $ | 10.19 | | | $ | 10.26 | | | $ | 9.81 | | | $ | 10.52 | | | $ | 9.75 | |
| TOTAL RETURN(f)(g) | | | 2.60 | % | | | 9.00 | % | | | 5.67 | % | | | 11.09 | % | | | (2.50 | )% | | | 14.70 | % | | | 2.03 | % |
| RATIOS AND SUPPLEMENTAL DATA | | | | | | | | | | | | | | | | | | | | | | | | | | | | |
| Net assets, end of period (in 000s) | | $ | 89,060 | | | $ | 86,965 | | | $ | 84,231 | | | $ | 61,470 | | | $ | 37,399 | | | $ | 27,830 | | | $ | 4,823 | |
| RATIOS TO AVERAGE NET ASSETS | | | | | | | | | | | | | | | | | | | | | | | | | | | | |
| Including interest expense:(h) | | | | | | | | | | | | | | | | | | | | | | | | | | | | |
| Expenses, gross | | | 2.60 | %(i) | | | 2.97 | % | | | 2.90 | % | | | 2.78 | % | | | 3.30 | %(i) | | | 4.81 | % | | | 24.79 | %(i) |
| Expenses, net of fees waived/expenses reimbursed by investment adviser | | | 2.52 | %(i) | | | 2.76 | % | | | 2.69 | % | | | 2.39 | % | | | 2.24 | %(i) | | | 2.29 | % | | | 2.32 | %(i) |
| Excluding interest expense:(h) | | | | | | | | | | | | | | | | | | | | | | | | | | | | |
| Expenses, gross | | | 2.07 | %(i) | | | 2.20 | % | | | 2.20 | % | | | 2.38 | % | | | 3.05 | %(i) | | | 4.51 | % | | | 24.46 | %(i) |
| Expenses, net of fees waived/expenses reimbursed by investment adviser | | | 1.99 | %(i) | | | 1.99 | % | | | 1.99 | % | | | 1.99 | % | | | 1.99 | %(i) | | | 1.99 | % | | | 1.99 | %(i) |
| Net investment income(d)(h) | | | 4.21 | %(i) | | | 2.97 | % | | | 3.81 | % | | | 3.47 | % | | | 3.57 | %(i) | | | 3.21 | % | | | 2.54 | %(i) |
| | | | | | | | | | | | | | | | | | | | | | | | | | | | | |
| PORTFOLIO TURNOVER RATE | | | 52 | %(j) | | | 78 | % | | | 11 | % | | | 21 | % | | | 5 | %(j) | | | 91 | % | | | 4 | %(j) |
| | | | | | | | | | | | | | | | | | | | | | | | | | | | | |
| BORROWINGS AT END OF PERIOD | | | | | | | | | | | | | | | | | | | | | | | | | | | | |
| Aggregate amount outstanding (000s) | | $ | 47,949 | | | $ | 48 | | | $ | 60 | | | $ | 37 | | | $ | 12 | | | $ | 5 | | | $ | 0 | |
| Asset coverage per $1,000 (000s) | | $ | 7,359 | | | $ | 6,515 | | | $ | 4,912 | | | $ | 4,808 | | | $ | 6,249 | | | $ | 7,319 | | | $ | 76,226 | |
| (a) | With the approval of the Board of Trustees, effective September 30, 2015, the Fund's fiscal year end was changed from February 28 to September 30. |
| (b) | The Fund's Class A commenced operations on March 12, 2013. |
| (c) | Per share numbers have been calculated using the average shares method. |
| (d) | Recognition of net investment income is affected by timing and declaration of dividends by underlying REITs and private investment funds. |
| (e) | Amount is less than $(0.005). |
| (f) | Total returns shown are historical in nature and assume changes in share price, reinvestment of dividends and capital gains distribution, if any. Had the Adviser not absorbed a portion of Fund expenses, total returns would have been lower. Total returns for periods less than one year are not annualized. Returns shown exclude applicable sales charges. |
| (g) | Includes adjustments in accordance with accounting principles generally accepted in the United States of America and, as such, the net asset values for financial reporting purposes and the returns based upon those net asset values may differ from net asset values and returns for shareholder transactions. |
| (h) | Ratios do not include expenses of underlying investment companies and private investment funds in which the Fund invests. |
| See Notes to Financial Statements. | |
| Semi-Annual Report | March 31, 2019 | 17 |
| Resource Real Estate Diversified Income Fund – Class C | Financial Highlights |
For a Share Outstanding Throughout the Periods Presented
| | | For the Six Months Ended March 31, 2019 (Unaudited) | | | Year Ended September 30, 2018 | | | Year Ended September 30, 2017 | | | Year Ended September 30, 2016 | | | For the Period Ended September 30, 2015(a) | | | For the Period Ended February 28, 2015(b) | |
| NET ASSET VALUE, BEGINNING OF PERIOD | | $ | 10.47 | | | $ | 10.19 | | | $ | 10.25 | | | $ | 9.81 | | | $ | 10.50 | | | $ | 10.06 | |
| | | | | | | | | | | | | | | | | | | | | | | | | |
| INCOME FROM INVESTMENT OPERATIONS | | | | | | | | | | | | | | | | | | | | | | | | |
| Net investment income(c)(d) | | | 0.18 | | | | 0.23 | | | | 0.32 | | | | 0.28 | | | | 0.18 | | | | 0.14 | |
| Net realized and unrealized gain/(loss) on investments | | | 0.04 | | | | 0.57 | | | | 0.18 | | | | 0.68 | | | | (0.48 | ) | | | 0.58 | |
| Total income/(loss) from investment operations | | | 0.22 | | | | 0.80 | | | | 0.50 | | | | 0.96 | | | | (0.30 | ) | | | 0.72 | |
| | | | | | | | | | | | | | | | | | | | | | | | | |
| DISTRIBUTIONS TO SHAREHOLDERS | | | | | | | | | | | | | | | | | | | | | | | | |
| From net investment income | | | (0.26 | ) | | | (0.20 | ) | | | (0.27 | ) | | | (0.27 | ) | | | (0.14 | ) | | | (0.20 | ) |
| From net realized gain on investments | | | – | | | | (0.14 | ) | | | (0.12 | ) | | | – | | | | (0.03 | ) | | | (0.05 | ) |
| From return of capital | | | – | | | | (0.18 | ) | | | (0.17 | ) | | | (0.25 | ) | | | (0.22 | ) | | | (0.03 | ) |
| Total distributions | | | (0.26 | ) | | | (0.52 | ) | | | (0.56 | ) | | | (0.52 | ) | | | (0.39 | ) | | | (0.28 | ) |
| INCREASE/DECREASE IN NET ASSET VALUE | | | (0.04 | ) | | | 0.28 | | | | (0.06 | ) | | | 0.44 | | | | (0.69 | ) | | | 0.44 | |
| NET ASSET VALUE, END OF PERIOD | | $ | 10.43 | | | $ | 10.47 | | | $ | 10.19 | | | $ | 10.25 | | | $ | 9.81 | | | $ | 10.50 | |
| | | | | | | | | | | | | | | | | | | | | | | | | |
| TOTAL RETURN(e)(f) | | | 2.20 | % | | | 8.17 | % | | | 4.97 | % | | | 10.15 | % | | | (2.86 | )% | | | 7.33 | % |
| | | | | | | | | | | | | | | | | | | | | | | | | |
| RATIOS AND SUPPLEMENTAL DATA | | | | | | | | | | | | | | | | | | | | | | | | |
| Net assets, end of period (in 000s) | | $ | 66,040 | | | $ | 62,367 | | | $ | 57,559 | | | $ | 33,114 | | | $ | 13,436 | | | $ | 3,732 | |
| | | | | | | | | | | | | | | | | | | | | | | | | |
| RATIOS TO AVERAGE NET ASSETS | | | | | | | | | | | | | | | | | | | | | | | | |
| Including interest expense:(g) | | | | | | | | | | | | | | | | | | | | | | | | |
| Expenses, gross | | | 3.35 | %(h) | | | 3.73 | % | | | 3.71 | % | | | 3.53 | % | | | 4.04 | %(h) | | | 6.37 | %(h) |
| Expenses, net of fees waived/expenses reimbursed by investment adviser | | | 3.27 | %(h) | | | 3.51 | % | | | 3.47 | % | | | 3.14 | % | | | 2.99 | %(h) | | | 3.04 | %(h) |
| Excluding interest expense:(g) | | | | | | | | | | | | | | | | | | | | | | | | |
| Expenses, gross | | | 2.82 | %(h) | | | 2.96 | % | | | 2.98 | % | | | 3.13 | % | | | 3.79 | %(h) | | | 6.07 | %(h) |
| Expenses, net of fees waived/expenses reimbursed by investment adviser | | | 2.74 | %(h) | | | 2.74 | % | | | 2.74 | % | | | 2.74 | % | | | 2.74 | %(h) | | | 2.74 | %(h) |
| Net investment income(d)(g) | | | 3.46 | %(h) | | | 2.24 | % | | | 3.11 | % | | | 2.87 | % | | | 2.97 | %(h) | | | 2.34 | %(h) |
| | | | | | | | | | | | | | | | | | | | | | | | | |
| PORTFOLIO TURNOVER RATE | | | 52 | %(i) | | | 78 | % | | | 11 | % | | | 21 | % | | | 5 | %(i) | | | 91 | %(i) |
| | | | | | | | | | | | | | | | | | | | | | | | | |
| BORROWINGS AT END OF PERIOD | | | | | | | | | | | | | | | | | | | | | | | | |
| Aggregate amount outstanding (000s) | | $ | 47,949 | | | $ | 48,104 | | | $ | 60,415 | | | $ | 36,821 | | | $ | 12,373 | | | $ | 5,188 | |
| Asset coverage per $1,000 (000s) | | $ | 7,359 | | | $ | 6,515 | | | $ | 4,912 | | | $ | 4,808 | | | $ | 6,249 | | | $ | 7,319 | |
| (a) | With the approval of the Board of Trustees, effective September 30, 2015, the Fund's fiscal year end was changed from February 28 to September 30. |
| (b) | The Fund's Class C commenced operations on August 1, 2014. |
| (c) | Per share numbers have been calculated using the average shares method. |
| (d) | Recognition of net investment income is affected by timing and declaration of dividends by underlying REITs and private investment funds. |
| (e) | Total returns shown are historical in nature and assume changes in share price, reinvestment of dividends and capital gains distribution, if any. Had the Adviser not absorbed a portion of Fund expenses, total returns would have been lower. Total returns for periods less than one year are not annualized. |
| (f) | Includes adjustments in accordance with accounting principles generally accepted in the United States of America and, as such, the net asset values for financial reporting purposes and the returns based upon those net asset values may differ from net asset values and returns for shareholder transactions. |
| (g) | Ratios do not include expenses of underlying investment companies and private investment funds in which the Fund invests. |
| See Notes to Financial Statements. | |
| 18 | www.resourcealts.com |
| Resource Real Estate Diversified Income Fund – Class W | Financial Highlights |
For a Share Outstanding Throughout the Periods Presented
| | | For the Six Months Ended March 31, 2019 (Unaudited) | | | Year Ended September 30, 2018 | | | Year Ended September 30, 2017 | | | Year Ended September 30, 2016 | | | For the Period Ended September 30, 2015(a) | | | For the Period Ended February 28, 2015(b) | |
| NET ASSET VALUE, BEGINNING OF PERIOD | | $ | 10.63 | | | $ | 10.35 | | | $ | 10.41 | | | $ | 9.96 | | | $ | 10.67 | | | $ | 10.18 | |
| | | | | | | | | | | | | | | | | | | | | | | | | |
| INCOME FROM INVESTMENT OPERATIONS | | | | | | | | | | | | | | | | | | | | | | | | |
| Net investment income(c)(d) | | | 0.22 | | | | 0.31 | | | | 0.39 | | | | 0.32 | | | | 0.20 | | | | 0.03 | |
| Net realized and unrealized gain/(loss) on investments | | | 0.04 | | | | 0.58 | | | | 0.17 | | | | 0.69 | | | | (0.49 | ) | | | 0.46 | |
| Total income/(loss) from investment operations | | | 0.26 | | | | 0.89 | | | | 0.56 | | | | 1.01 | | | | (0.29 | ) | | | 0.49 | |
| | | | | | | | | | | | | | | | | | | | | | | | | |
| DISTRIBUTIONS TO SHAREHOLDERS | | | | | | | | | | | | | | | | | | | | | | | | |
| From net investment income | | | (0.30 | ) | | | (0.23 | ) | | | (0.30 | ) | | | (0.30 | ) | | | (0.15 | ) | | | – | |
| From net realized gain on investments | | | – | | | | (0.16 | ) | | | (0.12 | ) | | | – | | | | (0.03 | ) | | | – | |
| From return of capital | | | – | | | | (0.22 | ) | | | (0.20 | ) | | | (0.26 | ) | | | (0.24 | ) | | | – | |
| Total distributions | | | (0.30 | ) | | | (0.61 | ) | | | (0.62 | ) | | | (0.56 | ) | | | (0.42 | ) | | | – | |
| INCREASE/DECREASE IN NET ASSET VALUE | | | (0.04 | ) | | | 0.28 | | | | (0.06 | ) | | | 0.45 | | | | (0.71 | ) | | | 0.49 | |
| NET ASSET VALUE, END OF PERIOD | | $ | 10.59 | | | $ | 10.63 | | | $ | 10.35 | | | $ | 10.41 | | | $ | 9.96 | | | $ | 10.67 | |
| | | | | | | | | | | | | | | | | | | | | | | | | |
| TOTAL RETURN(e)(f) | | | 2.60 | % | | | 8.95 | % | | | 5.64 | % | | | 10.46 | % | | | (2.79 | )% | | | 4.81 | % |
| | | | | | | | | | | | | | | | | | | | | | | | | |
| RATIOS AND SUPPLEMENTAL DATA | | | | | | | | | | | | | | | | | | | | | | | | |
| Net assets, end of period (in 000s) | | $ | 85,039 | | | $ | 69,400 | | | $ | 56,427 | | | $ | 31,076 | | | $ | 11,421 | | | $ | 1,211 | |
| | | | | | | | | | | | | | | | | | | | | | | | | |
| RATIOS TO AVERAGE NET ASSETS | | | | | | | | | | | | | | | | | | | | | | | | |
| Including interest expense:(g) | | | | | | | | | | | | | | | | | | | | | | | | |
| Expenses, gross | | | 2.58 | %(h) | | | 2.96 | % | | | 3.06 | % | | | 3.30 | % | | | 3.78 | %(h) | | | 11.30 | %(h) |
| Expenses, net of fees waived/expenses reimbursed by investment adviser | | | 2.52 | %(h) | | | 2.76 | % | | | 2.83 | %(i) | | | 2.89 | % | | | 2.74 | %(h) | | | 2.79 | %(h) |
| Excluding interest expense:(g) | | | | | | | | | | | | | | | | | | | | | | | | |
| Expenses, gross | | | 2.05 | %(h) | | | 2.19 | % | | | 2.32 | % | | | 2.90 | % | | | 3.53 | %(h) | | | 11.00 | %(h) |
| Expenses, net of fees waived/expenses reimbursed by investment adviser | | | 1.99 | %(h) | | | 1.99 | % | | | 2.09 | %(i) | | | 2.49 | % | | | 2.49 | %(h) | | | 2.49 | %(h) |
| Net investment income(d)(g) | | | 4.29 | %(h) | | | 3.01 | % | | | 3.79 | % | | | 3.17 | % | | | 3.28 | %(h) | | | 1.31 | %(h) |
| | | | | | | | | | | | | | | | | | | | | | | | | |
| PORTFOLIO TURNOVER RATE | | | 52 | %(j) | | | 78 | % | | | 11 | % | | | 21 | % | | | 5 | %(j) | | | 91 | %(j) |
| | | | | | | | | | | | | | | | | | | | | | | | | |
| BORROWINGS AT END OF PERIOD | | | | | | | | | | | | | | | | | | | | | | | | |
| Aggregate amount outstanding (000s) | | $ | 47,949 | | | $ | 48,104 | | | $ | 60,415 | | | $ | 36,821 | | | $ | 12,373 | | | $ | 5,188 | |
| Asset coverage per $1,000 (000s) | | $ | 7,359 | | | $ | 6,515 | | | $ | 4,912 | | | $ | 4,808 | | | $ | 6,249 | | | $ | 7,319 | |
| (a) | With the approval of the Board of Trustees, effective September 30, 2015, the Fund's fiscal year end was changed from February 28 to September 30. |
| (b) | The Fund's Class W commenced operations on November 24, 2014. |
| (c) | Per share numbers have been calculated using the average shares method. |
| (d) | Recognition of net investment income is affected by timing and declaration of dividends by underlying REITs and private investment funds. |
| (e) | Total returns shown are historical in nature and assume changes in share price, reinvestment of dividends and capital gains distribution, if any. Had the Adviser not absorbed a portion of Fund expenses, total returns would have been lower. Total returns for periods less than one year are not annualized. |
| (f) | Includes adjustments in accordance with accounting principles generally accepted in the United States of America and, as such, the net asset values for financial reporting purposes and the returns based upon those net asset values may differ from net asset values and returns for shareholder transactions. |
| (g) | Ratios do not include expenses of underlying investment companies and private investment funds in which the Fund invests. |
| (h) | Annualized. |
| (i) | Effective January 5, 2017, the annual expense limitation changed from 2.49% to 1.99%. |
| (j) | Not annualized. |
See Notes to Financial Statements.
| Semi-Annual Report | March 31, 2019 | 19 |
| Resource Real Estate Diversified Income Fund – Class I | Financial Highlights |
For a Share Outstanding Throughout the Periods Presented
| | | For the Six Months Ended March 31, 2019 (Unaudited) | | | Year Ended September 30, 2018 | | | Year Ended September 30, 2017 | | | Year Ended September 30, 2016 | | | For the Period Ended September 30, 2015(a) | | | For the Period Ended February 28, 2015(b) | |
| NET ASSET VALUE, BEGINNING OF PERIOD | | $ | 10.91 | | | $ | 10.62 | | | $ | 10.74 | | | $ | 10.36 | | | $ | 10.79 | | | $ | 10.06 | |
| | | | | | | | | | | | | | | | | | | | | | | | | |
| INCOME FROM INVESTMENT OPERATIONS | | | | | | | | | | | | | | | | | | | | | | | | |
| Net investment income(c)(d) | | | 0.25 | | | | 0.36 | | | | 0.48 | | | | 0.04 | | | | 0.27 | | | | 0.14 | |
| Net realized and unrealized gain/(loss) on investments | | | 0.04 | | | | 0.59 | | | | 0.09 | | | | 0.97 | | | | (0.54 | ) | | | 0.59 | |
| Total income/(loss) from investment operations | | | 0.29 | | | | 0.95 | | | | 0.57 | | | | 1.01 | | | | (0.27 | ) | | | 0.73 | |
| | | | | | | | | | | | | | | | | | | | | | | | | |
| DISTRIBUTIONS TO SHAREHOLDERS | | | | | | | | | | | | | | | | | | | | | | | | |
| From net investment income | | | (0.33 | ) | | | (0.26 | ) | | | (0.34 | ) | | | (0.33 | ) | | | (0.04 | ) | | | – | |
| From net realized gain on investments | | | – | | | | (0.16 | ) | | | (0.12 | ) | | | – | | | | (0.03 | ) | | | – | |
| From return of capital | | | – | | | | (0.24 | ) | | | (0.23 | ) | | | (0.30 | ) | | | (0.09 | ) | | | – | |
| Total distributions | | | (0.33 | ) | | | (0.66 | ) | | | (0.69 | ) | | | (0.63 | ) | | | (0.16 | ) | | | – | |
| INCREASE/DECREASE IN NET ASSET VALUE | | | (0.04 | ) | | | 0.29 | | | | (0.12 | ) | | | 0.38 | | | | (0.43 | ) | | | 0.73 | |
| NET ASSET VALUE, END OF PERIOD | | $ | 10.87 | | | $ | 10.91 | | | $ | 10.62 | | | $ | 10.74 | | | $ | 10.36 | | | $ | 10.79 | |
| | | | | | | | | | | | | | | | | | | | | | | | | |
| TOTAL RETURN(e)(f) | | | 2.74 | % | | | 9.25 | % | | | 5.45 | % | | | 10.12 | % | | | (2.51 | )% | | | 7.26 | % |
| | | | | | | | | | | | | | | | | | | | | | | | | |
| RATIOS AND SUPPLEMENTAL DATA | | | | | | | | | | | | | | | | | | | | | | | | |
| Net assets, end of period (in 000s) | | $ | 34,216 | | | $ | 22,273 | | | $ | 8,385 | | | $ | 0 | (g) | | $ | 49 | | | $ | 0 | (g) |
| | | | | | | | | | | | | | | | | | | | | | | | | |
| RATIOS TO AVERAGE NET ASSETS | | | | | | | | | | | | | | | | | | | | | | | | |
| Including interest expense:(h) | | | | | | | | | | | | | | | | | | | | | | | | |
| Expenses, gross | | | 2.34 | %(i) | | | 2.75 | % | | | 3.23 | % | | | 2.49 | % | | | 2.96 | %(i) | | | 3.94 | %(i) |
| Expenses, net of fees waived/expenses reimbursed by investment adviser | | | 2.27 | %(i) | | | 2.49 | % | | | 2.56 | % | | | 2.14 | % | | | 1.99 | %(i) | | | 2.08 | %(i) |
| Excluding interest expense:(h) | | | | | | | | | | | | | | | | | | | | | | | | |
| Expenses, gross | | | 1.81 | %(i) | | | 2.00 | % | | | 2.41 | % | | | 2.09 | % | | | 2.71 | %(i) | | | 3.60 | %(i) |
| Expenses, net of fees waived/expenses reimbursed by investment adviser | | | 1.74 | %(i) | | | 1.74 | % | | | 1.74 | % | | | 1.74 | % | | | 1.74 | %(i) | | | 1.74 | %(i) |
| Net investment income(d)(h) | | | 4.61 | %(i) | | | 3.35 | % | | | 4.48 | % | | | 0.36 | % | | | 4.46 | %(i) | | | 2.36 | %(i) |
| | | | | | | | | | | | | | | | | | | | | | | | | |
| PORTFOLIO TURNOVER RATE | | | 52 | %(j) | | | 78 | % | | | 11 | % | | | 21 | % | | | 5 | %(j) | | | 91 | %(j) |
| | | | | | | | | | | | | | | | | | | | | | | | | |
| BORROWINGS AT END OF PERIOD | | | | | | | | | | | | | | | | | | | | | | | | |
| Aggregate amount outstanding (000s) | | $ | 47,949 | | | $ | 48,104 | | | $ | 60,415 | | | $ | 36,821 | | | $ | 12,373 | | | $ | 5,188 | |
| Asset coverage per $1,000 (000s) | | $ | 7,359 | | | $ | 6,515 | | | $ | 4,912 | | | $ | 4,808 | | | $ | 6,249 | | | $ | 7,319 | |
| (a) | With the approval of the Board of Trustees, effective September 30, 2015, the Fund's fiscal year end was changed from February 28 to September 30. |
| (b) | The Fund's Class I commenced operations on August 1, 2014. |
| (c) | Per share numbers have been calculated using the average shares method. |
| (d) | Recognition of net investment income is affected by timing and declaration of dividends by underlying REITs and private investment funds. |
| (e) | Total returns shown are historical in nature and assume changes in share price, reinvestment of dividends and capital gains distribution, if any. Had the Adviser not absorbed a portion of Fund expenses, total returns would have been lower. Total returns for periods less than one year are not annualized. |
| (f) | Includes adjustments in accordance with accounting principles generally accepted in the United States of America and, as such, the net asset values for financial reporting purposes and the returns based upon those net asset values may differ from net asset values and returns for shareholder transactions. |
| (g) | Amount less than $500. |
| (h) | Ratios do not include expenses of underlying investment companies and private investment funds in which the Fund invests. |
| (i) | Annualized. |
| (j) | Not annualized. |
See Notes to Financial Statements.
| Resource Real Estate Diversified Income Fund – Class U | Financial Highlights |
For a Share Outstanding Throughout the Periods Presented
| | | For the Six Months Ended March 31, 2019 (Unaudited) | | | Year Ended September 30, 2018 | | | Year Ended September 30, 2017 | | | Year Ended September 30, 2016 | | | For the Period Ended September 30, 2015(a) | | | For the Period Ended February 28, 2015(b) | |
| NET ASSET VALUE, BEGINNING OF PERIOD | | $ | 10.48 | | | $ | 10.20 | | | $ | 10.26 | | | $ | 9.82 | | | $ | 10.52 | | | $ | 10.57 | |
| | | | | | | | | | | | | | | | | | | | | | | | | |
| INCOME FROM INVESTMENT OPERATIONS | | | | | | | | | | | | | | | | | | | | | | | | |
| Net investment income(c)(d) | | | 0.22 | | | | 0.30 | | | | 0.39 | | | | 0.50 | | | | 0.27 | | | | 0.00 | (e) |
| Net realized and unrealized gain/(loss) on investments | | | 0.04 | | | | 0.58 | | | | 0.18 | | | | 0.54 | | | | (0.52 | ) | | | (0.05 | ) |
| Total income/(loss) from investment operations | | | 0.26 | | | | 0.88 | | | | 0.57 | | | | 1.04 | | | | (0.25 | ) | | | (0.05 | ) |
| | | | | | | | | | | | | | | | | | | | | | | | | |
| DISTRIBUTIONS TO SHAREHOLDERS | | | | | | | | | | | | | | | | | | | | | | | | |
| From net investment income | | | (0.30 | ) | | | (0.24 | ) | | | (0.31 | ) | | | (0.32 | ) | | | (0.17 | ) | | | – | |
| From net realized gain on investments | | | – | | | | (0.15 | ) | | | (0.12 | ) | | | – | | | | (0.03 | ) | | | – | |
| From return of capital | | | – | | | | (0.21 | ) | | | (0.20 | ) | | | (0.28 | ) | | | (0.25 | ) | | | – | |
| Total distributions | | | (0.30 | ) | | | (0.60 | ) | | | (0.63 | ) | | | (0.60 | ) | | | (0.45 | ) | | | – | |
| EARLY WITHDRAWAL CHARGE ADDED TO PAID-IN CAPITAL | | | 0.00 | | | | 0.00 | | | | 0.00 | (e) | | | 0.00 | | | | 0.00 | | | | 0.00 | |
| INCREASE/DECREASE IN NET ASSET VALUE | | | (0.04 | ) | | | 0.28 | | | | (0.06 | ) | | | 0.44 | | | | (0.70 | ) | | | (0.05 | ) |
| NET ASSET VALUE, END OF PERIOD | | $ | 10.44 | | | $ | 10.48 | | | $ | 10.20 | | | $ | 10.26 | | | $ | 9.82 | | | $ | 10.52 | |
| | | | | | | | | | | | | | | | | | | | | | | | | |
| TOTAL RETURN(f)(g) | | | 2.59 | % | | | 8.99 | % | | | 5.76 | % | | | 10.98 | % | | | (2.40 | )% | | | (0.47 | )% |
| | | | | | | | | | | | | | | | | | | | | | | | | |
| RATIOS AND SUPPLEMENTAL DATA | | | | | | | | | | | | | | | | | | | | | | | | |
| Net assets, end of period (in 000s) | | $ | 10,778 | | | $ | 11,424 | | | $ | 11,971 | | | $ | 5,766 | | | $ | 61 | | | $ | 2 | |
| | | | | | | | | | | | | | | | | | | | | | | | | |
| RATIOS TO AVERAGE NET ASSETS | | | | | | | | | | | | | | | | | | | | | | | | |
| Including interest expense:(h) | | | | | | | | | | | | | | | | | | | | | | | | |
| Expenses, gross | | | 2.58 | %(i) | | | 2.95 | % | | | 2.93 | % | | | 2.78 | % | | | 3.42 | %(i) | | | 7.74 | %(i) |
| Expenses, net of fees waived/expenses reimbursed by investment adviser | | | 2.52 | %(i) | | | 2.76 | % | | | 2.73 | % | | | 2.39 | % | | | 2.24 | %(i) | | | 2.28 | %(i) |
| Excluding interest expense:(h) | | | | | | | | | | | | | | | | | | | | | | | | |
| Expenses, gross | | | 2.05 | %(i) | | | 2.18 | % | | | 2.19 | % | | | 2.38 | % | | | 3.17 | %(i) | | | 7.45 | %(i) |
| Expenses, net of fees waived/expenses reimbursed by investment adviser | | | 1.99 | %(i) | | | 1.99 | % | | | 1.99 | % | | | 1.99 | % | | | 1.99 | %(i) | | | 1.99 | %(i) |
| Net investment income(d)(h) | | | 4.19 | %(i) | | | 2.95 | % | | | 3.82 | % | | | 5.00 | % | | | 4.64 | %(i) | | | 0.97 | %(i) |
| | | | | | | | | | | | | | | | | | | | | | | | | |
| PORTFOLIO TURNOVER RATE | | | 52 | %(j) | | | 78 | % | | | 11 | % | | | 21 | % | | | 5 | %(j) | | | 91 | %(j) |
| | | | | | | | | | | | | | | | | | | | | | | | | |
| BORROWINGS AT END OF PERIOD | | | | | | | | | | | | | | | | | | | | | | | | |
| Aggregate amount outstanding (000s) | | $ | 47,949 | | | $ | 48,104 | | | $ | 60,415 | | | $ | 36,821 | | | $ | 12,373 | | | $ | 5,188 | |
| Asset coverage per $1,000 (000s) | | $ | 7,359 | | | $ | 6,515 | | | $ | 4,912 | | | $ | 4,808 | | | $ | 6,249 | | | $ | 7,319 | |
| (a) | With the approval of the Board of Trustees, effective September 30, 2015, the Fund's fiscal year end was changed from February 28 to September 30. |
| (b) | The Fund's Class U commenced operations on February 13, 2015. |
| (c) | Per share numbers have been calculated using the average shares method. |
| (d) | Recognition of net investment income is affected by timing and declaration of dividends by underlying REITs and private investment funds. |
| (e) | Amount is less than $0.005. |
| (f) | Total returns shown are historical in nature and assume changes in share price, reinvestment of dividends and capital gains distribution, if any. Had the Adviser not absorbed a portion of Fund expenses, total returns would have been lower. Total returns for periods less than one year are not annualized. Returns shown exclude applicable sales charges. |
| (g) | Includes adjustments in accordance with accounting principles generally accepted in the United States of America and, as such, the net asset values for financial reporting purposes and the returns based upon those net asset values may differ from net asset values and returns for shareholder transactions. |
| (h) | Ratios do not include expenses of underlying investment companies and private investment funds in which the Fund invests. |
| (i) | Annualized. |
| (j) | Not annualized. |
See Notes to Financial Statements.
| Semi-Annual Report | March 31, 2019 | 21 |
| Resource Real Estate Diversified Income Fund – Class T | Financial Highlights |
For a Share Outstanding Throughout the Periods Presented
| | | For the Six Months Ended March 31, 2019 (Unaudited) | | | Year Ended September 30, 2018 | | | Year Ended September 30, 2017 | | | Year Ended September 30, 2016 | | | For the Period Ended September 30, 2015(a) | | | For the Period Ended February 28, 2015(b) | |
| NET ASSET VALUE, BEGINNING OF PERIOD | | $ | 10.45 | | | $ | 10.17 | | | $ | 10.23 | | | $ | 9.80 | | | $ | 10.50 | | | $ | 10.55 | |
| | | | | | | | | | | | | | | | | | | | | | | | | |
| INCOME FROM INVESTMENT OPERATIONS | | | | | | | | | | | | | | | | | | | | | | | | |
| Net investment income(c)(d) | | | 0.19 | | | | 0.22 | | | | 0.31 | | | | 0.33 | | | | 0.22 | | | | 0.00 | (e) |
| Net realized and unrealized gain/(loss) on investments | | | 0.03 | | | | 0.58 | | | | 0.19 | | | | 0.62 | | | | (0.53 | ) | | | (0.05 | ) |
| Total income/(loss) from investment operations | | | 0.22 | | | | 0.80 | | | | 0.50 | | | | 0.95 | | | | (0.31 | ) | | | (0.05 | ) |
| | | | | | | | | | | | | | | | | | | | | | | | | |
| DISTRIBUTIONS TO SHAREHOLDERS | | | | | | | | | | | | | | | | | | | | | | | | |
| From net investment income | | | (0.26 | ) | | | (0.20 | ) | | | (0.27 | ) | | | (0.27 | ) | | | (0.14 | ) | | | – | |
| From net realized gain on investments | | | – | | | | (0.14 | ) | | | (0.12 | ) | | | – | | | | (0.03 | ) | | | – | |
| From return of capital | | | – | | | | (0.18 | ) | | | (0.17 | ) | | | (0.25 | ) | | | (0.22 | ) | | | – | |
| Total distributions | | | (0.26 | ) | | | (0.52 | ) | | | (0.56 | ) | | | (0.52 | ) | | | (0.39 | ) | | | – | |
| EARLY WITHDRAWAL CHARGE ADDED TO PAID-IN CAPITAL | | | 0.00 | | | | 0.00 | | | | 0.00 | (e) | | | 0.00 | | | | 0.00 | | | | 0.00 | |
| INCREASE/DECREASE IN NET ASSET VALUE | | | (0.04 | ) | | | 0.28 | | | | (0.06 | ) | | | 0.43 | | | | (0.70 | ) | | | (0.05 | ) |
| NET ASSET VALUE, END OF PERIOD | | $ | 10.41 | | | $ | 10.45 | | | $ | 10.17 | | | $ | 10.23 | | | $ | 9.80 | | | $ | 10.50 | |
| | | | | | | | | | | | | | | | | | | | | | | | | |
| TOTAL RETURN(f)(g) | | | 2.20 | % | | | 8.18 | % | | | 4.97 | % | | | 10.05 | % | | | (2.96 | )% | | | (0.47 | )% |
| | | | | | | | | | | | | | | | | | | | | | | | | |
| RATIOS AND SUPPLEMENTAL DATA | | | | | | | | | | | | | | | | | | | | | | | | |
| Net assets, end of period (in 000s) | | $ | 6,955 | | | $ | 5,542 | | | $ | 5,983 | | | $ | 3,187 | | | $ | 447 | | | $ | 2 | |
| | | | | | | | | | | | | | | | | | | | | | | | | |
| RATIOS TO AVERAGE NET ASSETS | | | | | | | | | | | | | | | | | | | | | | | | |
| Including interest expense:(h) | | | | | | | | | | | | | | | | | | | | | | | | |
| Expenses, gross | | | 3.33 | %(i) | | | 3.71 | % | | | 3.69 | % | | | 3.51 | % | | | 4.10 | %(i) | | | 8.49 | %(i) |
| Expenses, net of fees waived/expenses reimbursed by investment adviser | | | 3.27 | %(i) | | | 3.51 | % | | | 3.48 | % | | | 3.14 | % | | | 2.99 | %(i) | | | 3.03 | %(i) |
| Excluding interest expense:(h) | | | | | | | | | | | | | | | | | | | | | | | | |
| Expenses, gross | | | 2.80 | %(i) | | | 2.94 | % | | | 2.95 | % | | | 3.11 | % | | | 3.85 | %(i) | | | 8.20 | %(i) |
| Expenses, net of fees waived/expenses reimbursed by investment adviser | | | 2.74 | %(i) | | | 2.74 | % | | | 2.74 | % | | | 2.74 | % | | | 2.74 | %(i) | | | 2.74 | %(i) |
| Net investment income(d)(h) | | | 3.64 | %(i) | | | 2.19 | % | | | 3.07 | % | | | 3.31 | % | | | 3.87 | %(i) | | | 0.22 | %(i) |
| | | | | | | | | | | | | | | | | | | | | | | | | |
| PORTFOLIO TURNOVER RATE | | | 52 | %(j) | | | 78 | % | | | 11 | % | | | 21 | % | | | 5 | %(j) | | | 91 | %(j) |
| | | | | | | | | | | | | | | | | | | | | | | | | |
| BORROWINGS AT END OF PERIOD | | | | | | | | | | | | | | | | | | | | | | | | |
| Aggregate amount outstanding (000s) | | $ | 47,949 | | | $ | 48,104 | | | $ | 60,415 | | | $ | 36,821 | | | $ | 12,373 | | | $ | 5,188 | |
| Asset coverage per $1,000 (000s) | | $ | 7,359 | | | $ | 6,515 | | | $ | 4,912 | | | $ | 4,808 | | | $ | 6,249 | | | $ | 7,319 | |
| (a) | With the approval of the Board of Trustees, effective September 30, 2015, the Fund's fiscal year end was changed from February 28 to September 30. |
| (b) | The Fund's Class T commenced operations on February 13, 2015. |
| (c) | Per share numbers have been calculated using the average shares method. |
| (d) | Recognition of net investment income is affected by timing and declaration of dividends by underlying REITs and private investment funds. |
| (e) | Amount is less than $0.005. |
| (f) | Total returns shown are historical in nature and assume changes in share price, reinvestment of dividends and capital gains distribution, if any. Had the Adviser not absorbed a portion of Fund expenses, total returns would have been lower. Total returns for periods less than one year are not annualized. Returns shown exclude applicable sales charges. |
| (g) | Includes adjustments in accordance with accounting principles generally accepted in the United States of America and, as such, the net asset values for financial reporting purposes and the returns based upon those net asset values may differ from net asset values and returns for shareholder transactions. |
| (h) | Ratios do not include expenses of underlying investment companies and private investment funds in which the Fund invests. |
| (i) | Annualized. |
| (j) | Not annualized. |
See Notes to Financial Statements.
| Resource Real Estate Diversified Income Fund – Class D | Financial Highlights |
For a Share Outstanding Throughout the Periods Presented
| | | For the Six Months Ended March 31, 2019 (Unaudited) | | | Year Ended September 30, 2018 | | | Year Ended September 30, 2017 | | | Year Ended September 30, 2016 | | | For the Period Ended September 30, 2015(a) | | | For the Period Ended February 28, 2015(b) | |
| NET ASSET VALUE, BEGINNING OF PERIOD | | $ | 10.64 | | | $ | 10.35 | | | $ | 10.41 | | | $ | 9.97 | | | $ | 10.67 | | | $ | 10.72 | |
| | | | | | | | | | | | | | | | | | | | | | | | | |
| INCOME FROM INVESTMENT OPERATIONS | | | | | | | | | | | | | | | | | | | | | | | | |
| Net investment income(c)(d) | | | 0.19 | | | | 0.24 | | | | 0.35 | | | | 0.31 | | | | 0.24 | | | | 0.00 | (e) |
| Net realized and unrealized gain/(loss) on investments | | | 0.04 | | | | 0.61 | | | | 0.17 | | | | 0.69 | | | | (0.52 | ) | | | (0.05 | ) |
| Total income/(loss) from investment operations | | | 0.23 | | | | 0.85 | | | | 0.52 | | | | 1.00 | | | | (0.28 | ) | | | (0.05 | ) |
| | | | | | | | | | | | | | | | | | | | | | | | | |
| DISTRIBUTIONS TO SHAREHOLDERS | | | | | | | | | | | | | | | | | | | | | | | | |
| From net investment income | | | (0.28 | ) | | | (0.21 | ) | | | (0.28 | ) | | | (0.30 | ) | | | (0.15 | ) | | | – | |
| From net realized gain on investments | | | – | | | | (0.15 | ) | | | (0.12 | ) | | | – | | | | (0.03 | ) | | | – | |
| From return of capital | | | – | | | | (0.20 | ) | | | (0.18 | ) | | | (0.26 | ) | | | (0.24 | ) | | | – | |
| Total distributions | | | (0.28 | ) | | | (0.56 | ) | | | (0.58 | ) | | | (0.56 | ) | | | (0.42 | ) | | | – | |
| INCREASE/DECREASE IN NET ASSET VALUE | | | (0.05 | ) | | | 0.29 | | | | (0.06 | ) | | | 0.44 | | | | (0.70 | ) | | | (0.05 | ) |
| NET ASSET VALUE, END OF PERIOD | | $ | 10.59 | | | $ | 10.64 | | | $ | 10.35 | | | $ | 10.41 | | | $ | 9.97 | | | $ | 10.67 | |
| | | | | | | | | | | | | | | | | | | | | | | | | |
| TOTAL RETURN(f)(g) | | | 2.24 | % | | | 8.50 | % | | | 5.24 | % | | | 10.35 | % | | | (2.69 | )% | | | (0.47 | )% |
| | | | | | | | | | | | | | | | | | | | | | | | | |
| RATIOS AND SUPPLEMENTAL DATA | | | | | | | | | | | | | | | | | | | | | | | | |
| Net assets, end of period (in 000s) | | $ | 6,472 | | | $ | 6,725 | | | $ | 10,645 | | | $ | 5,605 | | | $ | 2,131 | | | $ | 2 | |
| | | | | | | | | | | | | | | | | | | | | | | | | |
| RATIOS TO AVERAGE NET ASSETS | | | | | | | | | | | | | | | | | | | | | | | | |
| Including interest expense:(h) | | | | | | | | | | | | | | | | | | | | | | | | |
| Expenses, gross | | | 3.02 | %(i) | | | 3.38 | % | | | 3.45 | % | | | 3.25 | % | | | 3.85 | %(i) | | | 8.19 | %(i) |
| Expenses, net of fees waived/expenses reimbursed by investment adviser | | | 3.01 | %(i) | | | 3.27 | % | | | 3.23 | % | | | 2.89 | % | | | 2.74 | %(i) | | | 2.78 | %(i) |
| Excluding interest expense:(h) | | | | | | | | | | | | | | | | | | | | | | | | |
| Expenses, gross | | | 2.49 | %(i) | | | 2.60 | % | | | 2.71 | % | | | 2.85 | % | | | 3.60 | %(i) | | | 7.90 | %(i) |
| Expenses, net of fees waived/expenses reimbursed by investment adviser | | | 2.48 | %(i) | | | 2.49 | % | | | 2.49 | % | | | 2.49 | % | | | 2.49 | %(i) | | | 2.49 | %(i) |
| Net investment income(d)(h) | | | 3.67 | %(i) | | | 2.35 | % | | | 3.40 | % | | | 3.12 | % | | | 4.13 | %(i) | | | 0.47 | %(i) |
| | | | | | | | | | | | | | | | | | | | | | | | | |
| PORTFOLIO TURNOVER RATE | | | 52 | %(j) | | | 78 | % | | | 11 | % | | | 21 | % | | | 5 | %(j) | | | 91 | %(j) |
| | | | | | | | | | | | | | | | | | | | | | | | | |
| BORROWINGS AT END OF PERIOD | | | | | | | | | | | | | | | | | | | | | | | | |
| Aggregate amount outstanding (000s) | | $ | 47,949 | | | $ | 48,104 | | | $ | 60,415 | | | $ | 36,821 | | | $ | 12,373 | | | $ | 5,188 | |
| Asset coverage per $1,000 (000s) | | $ | 7,359 | | | $ | 6,515 | | | $ | 4,912 | | | $ | 4,808 | | | $ | 6,249 | | | $ | 7,319 | |
| (a) | With the approval of the Board of Trustees, effective September 30, 2015, the Fund's fiscal year end was changed from February 28 to September 30. |
| (b) | The Fund's Class D commenced operations on February 13, 2015. |
| (c) | Per share numbers have been calculated using the average shares method. |
| (d) | Recognition of net investment income is affected by timing and declaration of dividends by underlying REITs and private investment funds. |
| (e) | Amount is less than $0.005. |
| (f) | Total returns shown are historical in nature and assume changes in share price, reinvestment of dividends and capital gains distribution, if any. Had the Adviser not absorbed a portion of Fund expenses, total returns would have been lower. Total returns for periods less than one year are not annualized. |
| (g) | Includes adjustments in accordance with accounting principles generally accepted in the United States of America and, as such, the net asset values for financial reporting purposes and the returns based upon those net asset values may differ from net asset values and returns for shareholder transactions. |
| (h) | Ratios do not include expenses of underlying investment companies and private investment funds in which the Fund invests. |
| (i) | Annualized. |
| (j) | Not annualized. |
See Notes to Financial Statements.
| Semi-Annual Report | March 31, 2019 | 23 |
| Resource Real Estate Diversified Income Fund – Class L | Financial Highlights |
For a Share Outstanding Throughout the Periods Presented
| | | For the Six Months Ended March 31, 2019 (Unaudited) | | | For the Year Ended September 30, 2018 | | | For the Period Ended September 30, 2017(a) | |
| NET ASSET VALUE, BEGINNING OF PERIOD | | $ | 10.48 | | | $ | 10.20 | | | $ | 10.22 | |
| | | | | | | | | | | | | |
| INCOME/(LOSS) FROM INVESTMENT OPERATIONS | | | | | | | | | | | | |
| Net investment income(b)(c) | | | 0.21 | | | | 0.30 | | | | 0.26 | |
| Net realized and unrealized gain/(loss) on investments | | | 0.03 | | | | 0.55 | | | | (0.14 | )(d) |
| Total income from investment operations | | | 0.24 | | | | 0.85 | | | | 0.12 | |
| | | | | | | | | | | | | |
| DISTRIBUTIONS TO SHAREHOLDERS | | | | | | | | | | | | |
| From net investment income | | | (0.29 | ) | | | (0.22 | ) | | | (0.05 | ) |
| From net realized gain on investments | | | – | | | | (0.15 | ) | | | (0.02 | ) |
| From return of capital | | | – | | | | (0.20 | ) | | | (0.07 | ) |
| Total distributions | | | (0.29 | ) | | | (0.57 | ) | | | (0.14 | ) |
| INCREASE/(DECREASE) IN NET ASSET VALUE | | | (0.05 | ) | | | 0.28 | | | | (0.02 | ) |
| NET ASSET VALUE, END OF PERIOD | | $ | 10.43 | | | $ | 10.48 | | | $ | 10.20 | |
| | | | | | | | | | | | | |
| TOTAL RETURN(e)(f) | | | 2.37 | % | | | 8.72 | % | | | 1.22 | % |
| | | | | | | | | | | | | |
| RATIOS AND SUPPLEMENTAL DATA | | | | | | | | | | | | |
| Net assets, end of period (in 000s) | | $ | 6,335 | | | $ | 4,613 | | | $ | 836 | |
| | | | | | | | | | | | | |
| RATIOS TO AVERAGE NET ASSETS | | | | | | | | | | | | |
| Including interest expense:(g) | | | | | | | | | | | | |
| Expenses, gross | | | 2.83 | %(h) | | | 3.22 | % | | | 3.83 | %(h) |
| Expenses, net of fees waived/expenses reimbursed by investment advisor | | | 2.77 | %(h) | | | 2.99 | % | | | 3.07 | %(h) |
| Excluding interest expense:(g) | | | | | | | | | | | | |
| Expenses, gross | | | 2.30 | %(h) | | | 2.47 | % | | | 3.00 | %(h) |
| Expenses, net of fees waived/expenses reimbursed by investment advisor | | | 2.24 | %(h) | | | 2.24 | % | | | 2.24 | %(h) |
| Net investment income(c)(g) | | | 4.03 | %(h) | | | 2.91 | % | | | 11.62 | %(h) |
| | | | | | | | | | | | | |
| PORTFOLIO TURNOVER RATE | | | 52 | %(i) | | | 78 | % | | | 11 | %(i)(j) |
| | | | | | | | | | | | | |
| BORROWINGS AT END OF PERIOD | | | | | | | | | | | | |
| Aggregate amount outstanding (000s) | | $ | 47,949 | | | $ | 48,104 | | | $ | 60,415 | |
| Asset coverage per $1,000 (000s) | | $ | 7,359 | | | $ | 6,515 | | | $ | 4,912 | |
| (a) | The Fund's Class L commenced operations on July 10, 2017. |
| (b) | Per share numbers have been calculated using the average shares method. |
| (c) | Recognition of net investment income is affected by timing and declaration of dividends by underlying REITs and private investment funds. |
| (d) | Realized and unrealized losses per share do not correlate to the aggregate of the net realized and unrealized gains on the Statement of Operations for the year ended September 30, 2017, primarily due to the timing of sales and repurchases of the Fund's shares in relation to fluctuating market values for the Fund's portfolio. |
| (e) | Total returns shown are historical in nature and assume changes in share price, reinvestment of dividends and capital gains distribution, if any. Had the Adviser not absorbed a portion of Fund expenses, total returns would have been lower. Total returns for periods less than one year are not annualized. Returns shown exclude applicable sales charges. |
| (f) | Includes adjustments in accordance with accounting principles generally accepted in the United States of America and, as such, the net asset values for financial reporting purposes and the returns based upon those net asset values may differ from net asset values and returns for shareholder transactions. |
| (g) | Ratios do not include expenses of underlying investment companies and private investment funds in which the Fund invests. |
| (h) | Annualized. |
| (i) | Not annualized. |
| (j) | Portfolio turnover rate is calculated at the Fund level and represents the year ended September 30, 2017. |
See Notes to Financial Statements.
| Resource Real Estate Diversified Income Fund | Notes to Financial Statements |
March 31, 2019 (Unaudited)
1. ORGANIZATION
Resource Real Estate Diversified Income Fund (the “Trust” or the “Fund”) was organized as a Delaware statutory trust on August 1, 2012 and is registered under the Investment Company Act of 1940, as amended (the “1940 Act”), as a closed-end management investment company that operates as an interval fund with a continuous offering of Fund shares. The Fund’s investment adviser is Resource Real Estate, LLC (the “Adviser”). The Fund’s investment objectives are to produce income and to achieve capital appreciation with low to moderate volatility and low to moderate correlation to the broader equity markets. The Fund is diversified and pursues its investment objectives by investing, under normal circumstances, at least 80% of assets (defined as net assets plus the amount of any borrowing for investment purposes) in real estate and real estate related industry securities, primarily in income producing equity and debt securities.
The Fund currently offers Class A, Class C, Class W, Class I, Class U, Class T, Class D and Class L shares. Class A shares commenced operations on March 12, 2013; Class C and Class I shares commenced operations on August 1, 2014; Class W shares commenced operations on November 24, 2014; Class U, Class T and Class D shares commenced operations on February 13, 2015; and Class L shares commenced operations on July 10, 2017. Class C, Class W, Class I and Class D shares are offered at net asset value (“NAV”). Class A shares are offered at NAV plus a maximum sales charge of 5.75% and may also be subject to a 0.50% early withdrawal charge, which will be deducted from repurchase proceeds, for shareholders tendering shares fewer than 365 days after the original purchase date, if (i) the original purchase was for amounts of $1 million or more and (ii) the selling broker received the reallowance of the dealer-manager fee. Class U shares are offered at NAV plus a maximum sales charge of 6.50% and may also be subject to a 0.50% early withdrawal charge, which will be deducted from repurchase proceeds, for shareholders tendering shares fewer than 365 days after the original purchase date, if (i) the original purchase was for amounts of $1 million or more and (ii) the selling broker received the reallowance of the dealer-manager fee. Class T shares are offered at NAV plus a maximum sales charge of 1.50% and may also be subject to a 1.00% early withdrawal charge, which will be deducted from repurchase proceeds, for shareholders tendering shares fewer than 365 days after the original purchase date. Class C Shares are subject to a 1.00% early withdrawal charge. Class L shares are offered at NAV plus a maximum sales charge of 4.25%. Each class represents an interest in the same assets of the Fund and classes are identical except for differences in their sales charge structures, ongoing service and distribution charges and early withdrawal fees. All classes of shares have equal voting privileges except that each class has exclusive voting rights with respect to its service and/or distribution plans. The Fund’s income, expenses (other than class-specific distribution fees) and realized and unrealized gains and losses are allocated proportionately each day based upon the relative net assets of each class.
2. SIGNIFICANT ACCOUNTING POLICIES
The following is a summary of significant accounting policies followed by the Fund in preparation of its financial statements. These policies are in conformity with accounting principles generally accepted in the United States of America (“GAAP”). The Fund is considered an investment company for financial reporting purposes under GAAP. The Fund follows the investment company accounting and reporting guidance of the Financial Accounting Standards Board (“FASB”) Accounting Standard Codification (“ASC”) Topic 946 “Financial Services – Investment Companies”, including FASB Accounting Standards Update (“ASU”) 2013-08. The preparation of financial statements requires management to make estimates and assumptions that affect the reported amounts of assets and liabilities and disclosure of contingent assets and liabilities at the date of the financial statements and the reported amounts of income and expenses for the period. Actual results could differ from those estimates.
Securities Valuation– Securities listed on an exchange are valued at the last reported sale price at the close of the regular trading session of the exchange on the business day the value is being determined, or in the case of securities listed on NASDAQ, at the NASDAQ Official Closing Price. In the absence of a sale, such securities shall be valued at the last bid price. Futures are valued based on their daily settlement value. Short-term investments that mature in 60 days or less may be valued at amortized cost, provided such valuations represent fair value.
When price quotations for certain securities are not readily available, or if the available quotations are not believed to be reflective of market value by the Adviser, those securities will be valued at “fair value” as determined in good faith by the Fund’s Fair Value Committee (the “Valuation Committee”) using procedures adopted by and under the supervision of the Fund’s Board of Trustees (the “Board”). There can be no assurance that the Fund could purchase or sell a portfolio security at the price used to calculate the Fund’s NAV.
Fair valuation procedures may be used to value a substantial portion of the assets of the Fund. The Fund may use the fair value of a security to calculate its NAV when, for example, (1) a portfolio security is not traded in a public market or the principal market in which the security trades is closed, (2) trading in a portfolio security is suspended and not resumed prior to the normal market close, (3) a portfolio security is not traded in significant volume for a substantial period, or (4) the Adviser determines that the quotation or price for a portfolio security provided by a broker-dealer or independent pricing service is inaccurate.
The “fair value” of securities may be difficult to determine and thus judgment plays a greater role in the valuation process. The fair valuation methodology may include or consider the following guidelines, as appropriate: (1) evaluation of all relevant factors, including but not limited to, pricing history, current market level, supply and demand of the respective security; (2) comparison to the values and current pricing of securities that have comparable characteristics; (3) knowledge of historical market information with respect to the security; and (4) other factors relevant to the security which would include, but not be limited to, duration, yield, fundamental analytical data, the Treasury yield curve, and credit quality.
| Semi-Annual Report | March 31, 2019 | 25 |
| Resource Real Estate Diversified Income Fund | Notes to Financial Statements |
March 31, 2019 (Unaudited)
Valuation of Private REITs– The Fund invests a portion of its assets in Private Real Estate Investment Trusts (“Private REITs”). Private REITs report their investment assets at fair value, and report a NAV per share on a calendar quarter basis. In accordance with ASC 820, the Fund has elected to apply the practical expedient and to value its investments in Private REITs at their respective NAVs at each quarter. For non-calendar quarter days, the Valuation Committee estimates the fair value of each Private REIT by adjusting the most recent NAV for each Private REIT, as necessary, by the change in a relevant benchmark that the Valuation Committee has deemed to be representative of the entire Private REIT market.
Valuation of Public Non-Traded REITs– The Fund invests a portion of its assets in Public Non-Traded Real Estate Investment Trusts (“Public Non-Traded REITs”). Public Non-Traded REITs do not timely report periodic NAVs and therefore cannot be valued using the practical expedient. The Valuation Committee determines the fair value of Public Non-Traded REITs by considering various factors such as the most recent published NAV, the transaction price, secondary market trades, shareholder redemption and dividend reinvestment programs, discounted cash flows and potential illiquidity discounts.
Valuation of Private Investment Funds– The Fund invests a portion of its assets in Private Investment Funds. Private Investment Funds measure their investment assets at fair value, and report a NAV per share on a calendar quarter basis. In accordance with ASC 820, the Fund has elected to apply the practical expedient and to value its investments in Private Investment Funds at their respective NAVs at each quarter. For non- calendar quarter days, the Valuation Committee determines the fair value of each Private Investment Fund by adjusting the most recent NAV for each Private Investment Fund, as necessary, by the change in a relevant benchmark that the Valuation Committee has deemed to be representative of the market.
Fair Value Measurements– A three-tier hierarchy has been established to classify fair value measurements for disclosure purposes. Inputs refer broadly to the assumptions that market participants would use in pricing the asset or liability, including assumptions about risk. Inputs may be observable or unobservable. Observable inputs are inputs that reflect the assumptions market participants would use in pricing the asset or liability that are developed based on market data obtained from sources independent of the reporting entity. Unobservable inputs are inputs that reflect the reporting entity’s own assumptions about the assumptions market participants would use in pricing the asset or liability that are developed based on the best information available. In accordance with the authoritative guidance on fair value measurements and disclosure under GAAP, the Fund discloses the fair value of its investments in a hierarchy that prioritizes the inputs to valuation techniques used to measure the fair value.
Various inputs are used in determining the value of the Fund’s investments as of the reporting period end. These inputs are categorized in the following hierarchy under applicable financial accounting standards:
| Level 1 – | Unadjusted quoted prices in active markets for identical, unrestricted assets or liabilities that the Fund has the ability to access at the measurement date; |
| Level 2 – | Observable inputs other than quoted prices included in level 1 that are observable for the asset or liability, either directly or indirectly. These inputs may include quoted prices for the identical instrument on an inactive market, prices for similar instruments, interest rates, prepayment speeds, credit risk, yield curves, default rates and similar data. |
| Level 3 – | Unobservable inputs for the asset or liability, to the extent relevant observable inputs are not available, representing the Fund’s own assumptions about the assumptions a market participate would use in valuing the asset or liability, and would be based on the best information available. |
The availability of observable inputs can vary from security to security and is affected by a wide variety of factors, including, for example, the type of security, whether the security is new and not yet established in the marketplace, the liquidity of markets and other characteristics particular to the security. To the extent that valuation is based on models or inputs that are less observable or unobservable in the market, the determination of fair value requires more judgment. Accordingly, the degree of judgment exercised in determining fair value is greatest for instruments categorized in Level 3.
An investment level within the fair value hierarchy is based on the lowest level input, individually or in the aggregate, that is significant to fair value measurement. The valuation techniques used by the Fund to measure fair value during the six months ended March 31, 2019 maximized the use of observable inputs and minimized the use of unobservable inputs.
| Resource Real Estate Diversified Income Fund | Notes to Financial Statements |
March 31, 2019 (Unaudited)
The inputs or methodologies used for valuing securities are not necessarily an indication of the risk or liquidity associated with investing in those securities. The following is a summary of the fair values according to the inputs used in valuing the Fund's investments as of March 31, 2019:
Resource Real Estate Diversified Income Fund
| Investments in Securities at Value | | Level 1 | | | Level 2 | | | Level 3 | | | Other | | | Total | |
| Bonds & Notes(a) | | $ | – | | | $ | 559,055 | | | $ | – | | | $ | – | | | $ | 559,055 | |
| Preferred Stocks(a) | | | 50,278,154 | | | | – | | | | – | | | | – | | | | 50,278,154 | |
| Real Estate Investment Trusts - Common Equity(a) | | | | | | | | | | | | | | | | | | | | |
| Public Non-Traded Real Estate Investment Trusts | | | – | | | | – | | | | 2,719,004 | | | | – | | | | 2,719,004 | |
| Private Real Estate Investment Trusts & Private Investment Funds (Measured at net asset value)(b) | | | – | | | | – | | | | – | | | | 182,624,854 | | | | 182,624,854 | |
| Traded Real Estate Investment Trusts | | | 114,251,065 | | | | – | | | | – | | | | – | | | | 114,251,065 | |
| Purchased Options | | | 1,261,000 | | | | – | | | | – | | | | – | | | | 1,261,000 | |
| Short Term Investments | | | 398,329 | | | | – | | | | – | | | | – | | | | 398,329 | |
| TOTAL | | $ | 166,188,548 | | | $ | 559,055 | | | $ | 2,719,004 | | | $ | 182,624,854 | | | $ | 352,091,461 | |
| | | | | | | | | | | | | | | | |
| Other Financial Instruments | | Level 1 | | | Level 2 | | | Level 3 | | | Other | | | Total | |
| Liabilities | | | | | | | | | | | | | | | |
| Securities Sold Short Written Options | | $ | (2,203,500 | ) | | $ | – | | | $ | – | | | $ | – | | | $ | (2,203,500 | ) |
| TOTAL | | $ | (2,203,500 | ) | | $ | – | | | $ | – | | | $ | – | | | $ | (2,203,500 | ) |
| (a) | For detailed descriptions, see the accompanying Portfolio of Investments. |
| (b) | In accordance with ASC 820-10, certain investments that are measured at fair value using the net asset value per share (or its equivalent) practical expedient have not been classified in the fair value hierarchy. The fair value amounts presented in this table are intended to permit reconciliation of the fair value hierarchy to the amounts presented in the Statement of Assets and Liabilities. |
The following is a reconciliation of assets in which Level 3 inputs were used in determining value:
| Asset Type | | Balance as of September 30, 2018 | | | Accrued Discount/ premium | | | Return of Capital | | | Realized Gain/(Loss) | | | Change in Unrealized Appreciation/ Depreciation | | | Purchases | | | Sales Proceeds | | | Transfer into Level 3 | | | Transfer Out of Level 3 | | | Balance as of March 31, 2019 | | | Net change in unrealized appreciation/
(depreciation) included in the Statements of Operations attributable to Level 3 investments held at March 31, 2019 | |
| | | | | | | | | | | | | | | | | | | | | | | | | | | | | | | | | | |
| Commercial Mortgage Backed Securities | | $ | 1,290,367 | | | $ | – | | | $ | – | | | $ | (748,203 | ) | | $ | 245,092 | | | $ | – | | | $ | (787,256 | ) | | $ | – | | | $ | – | | | $ | – | | | $ | – | |
| Public Non-Traded Real Estate Investment Trusts | | | 2,992,370 | | | | – | | | | – | | | | (101 | ) | | | (266,999 | ) | | | – | | | | (6,266 | ) | | | – | | | | – | | | | 2,719,004 | | | | (262,308 | ) |
| | | $ | 4,282,737 | | | $ | – | | | $ | – | | | $ | (748,304 | ) | | $ | (21,907 | ) | | $ | – | | | $ | (793,522 | ) | | $ | – | | | $ | – | | | $ | 2,719,004 | | | $ | (262,308 | ) |
Significant unobservable valuation inputs for material Level 3 investments as of March 31, 2019 are as follows:
| | Fair Value at 3/31/2019 | Valuation Technique | Unobservable Input | Range |
| Public Non-Traded Real Estate Investment Trusts | $ 2,719,004 | Net Asset Value | Proprietary Benchmark | $99.88 – $100.59 |
A change to the unobservable input may result in a significant change to the value of the investment as follows:
| Unobservable Input | Impact to Value if Input Increases | Impact to Value if Input Decreases |
| Proprietary Benchmark | Increase | Decrease |
Securities Transactions and Investment Income– Investment security transactions are accounted for on a trade date basis. Cost is determined and gains and losses are based upon the specific identification method for both financial statement and federal income tax purposes. Dividend income is recorded on the ex-dividend date and interest income is recorded on the accrual basis. Purchase discounts and premiums on securities are accreted and amortized over the life of the respective securities. Note that distributions received from REITs may be classified as dividends, capital gains and/or return of capital. The Fund does not estimate how much of the distributions from REITs is considered net investment income, capital gains, and/or return of capital at the time distributions are received; instead, the Fund completes this classification based on estimates at the end of each semi-annual period and at the end of each fiscal year. The Fund also makes interim estimates as appropriate to complete other financial reporting.
| Semi-Annual Report | March 31, 2019 | 27 |
| Resource Real Estate Diversified Income Fund | Notes to Financial Statements |
March 31, 2019 (Unaudited)
Industry Concentration– As of March 31, 2019, the Fund had 115% of its net assets invested within the real estate industry. Any development affecting that industry will have a greater impact on the value of the net assets of the Fund than would be the case if the Fund did not have significant investments in that industry. This may increase the risk of loss in the Fund and increase the volatility of the Fund’s NAV per share. Occasionally, market conditions, regulatory changes or other developments may negatively impact this industry, and therefore the value of the Fund’s portfolio will be adversely affected.
Concentration of Credit Risk– The Fund places its cash with one banking institution, which is insured by the Federal Deposit Insurance Corporation (“FDIC”). The FDIC insurance limit is $250,000 per deposit. At various times throughout the year, the amount on deposit may exceed the FDIC limit and subject the Fund to credit risk.
Federal and Other Taxes– No provision for income taxes is included in the accompanying financial statements, as the Fund intends to distribute to shareholders all taxable investment income and realized gains and otherwise comply with Subchapter M of the Internal Revenue Code of 1986, as amended (the “Code”), applicable to regulated investment companies.
The Fund evaluates tax positions taken (or expected to be taken) in the course of preparing the Fund’s tax provisions to determine whether these positions meet a “more-likely-than-not” standard that, based on the technical merits, have a more than fifty percent likelihood of being sustained by a taxing authority upon examination. A tax position that meets the “more-likely-than-not” recognition threshold is measured to determine the amount of benefit to recognize in the financial statements.
As of and during the six months ended March 31, 2019, the Fund did not have a liability for any unrecognized tax benefits. The Fund files U.S. federal, state and local tax returns as required. The Fund’s tax returns are subject to examination by the relevant tax authorities until expiration of the applicable statute of limitations, which is generally three years after the filing of the tax return for federal purposes and four years for most state returns. Tax returns for open years have incorporated no uncertain tax positions that require a provision for income taxes.
Foreign Currency– The accounting records of the Fund are maintained in U.S. dollars. Investment securities and other assets and liabilities denominated in a foreign currency and income receipts and expense payments are translated into U.S. dollars using the prevailing exchange rate at the London market close. Purchases and sales of securities are translated into U.S. dollars at the contractual currency rates established at the approximate time of the trade. Net realized gains and losses on foreign currency transactions represent net gains and losses from currency realized between the trade and settlement dates on securities transactions and the difference between income accrued versus income received. The effects of changes in foreign currency exchange rates on investments in securities are included with the net realized and unrealized gain or loss on investment securities.
Distributions to Shareholders– Distributions from investment income are declared and paid quarterly. Distributions from net realized capital gains, if any, are declared and paid annually and are recorded on the ex-dividend date. The character of income and gains to be distributed is determined in accordance with income tax regulations, which may differ from GAAP.
Early Withdrawal Charge–Selling brokers, or other financial intermediaries that have entered into distribution agreements with the Distributor (as defined in Note 3 below), will receive a commission of up to 1.00% of the purchase price of Class C and T shares and up to 0.50% on the purchase of Class A and Class U shares of $1 million or more. Shareholders who tender for repurchase of such shareholder's Class C and T shares fewer than 365 days after the original purchase date will be subject to an early withdrawal charge of 1.00% of the original purchase price. Shareholders tendering Class A and U shares fewer than 365 days after the original purchase date may be subject to an early withdrawal charge of 0.50% of the original purchase price, which will be deducted from repurchase proceeds, if (i) the original purchase was for amounts of $1 million or more and (ii) the selling broker received the reallowance of the dealer-manager fee. The Distributor may waive the imposition of the early withdrawal charge in in the event of shareholder death or shareholder disability. Any such waiver does not imply that the early withdrawal charge will be waived at any time in the future or that such early withdrawal charge will be waived for any other shareholder. Class W, Class I, Class D and Class L shares will not be subject to an early withdrawal charge.
Indemnification– The Trust indemnifies its officers and trustees for certain liabilities that may arise from the performance of their duties to the Trust. Additionally, in the normal course of business, the Fund enters into contracts that contain a variety of representations and warranties and which provide general indemnities. The Fund’s maximum exposure under these arrangements is unknown, as this would involve future claims that may be made against the Fund that have not yet occurred. However, based on industry experience, the Trust expects the risk of loss due to these warranties and indemnities to be remote.
| Resource Real Estate Diversified Income Fund | Notes to Financial Statements |
March 31, 2019 (Unaudited)
3. ADVISORY FEES AND OTHER RELATED PARTY TRANSACTIONS
Advisory Fees –Pursuant to an investment advisory agreement (the “Advisory Agreement”), investment advisory services are provided to the Fund by the Adviser. Under the terms of the Advisory Agreement, the Adviser receives monthly fees calculated at an annual rate of 1.25% of the average daily net assets of the Fund. During the six months ended March 31, 2019, the Fund accrued $1,749,644 in advisory fees.
The Adviser has contractually agreed to waive all or part of its advisory fees and/or make payments to limit Fund expenses (including all organization and offering expenses, but excluding interest, brokerage commissions, acquired fund fees and expenses and extraordinary expenses) at least until January 31, 2021, such that the total annual operating expenses of the Fund do not exceed 1.99% per annum of Class A average daily net assets, 2.74% per annum of Class C average daily net assets, 1.99% per annum of Class W average daily net assets, 1.74% per annum of Class I average daily net assets, 1.99% per annum of Class U average daily net assets, 2.74% per annum of Class T average daily net assets, 2.49% per annum of Class D average daily net assets and 2.24% per annum of Class L average daily net assets. The expense limitation for Class W was changed from 2.49% to 1.99% effective January 6, 2017. Fee waivers and expense payments may be recouped by the Adviser from the Fund within three years of when the amounts were waived or reimbursed, to the extent that overall expenses fall below the expense limitation. During the six months ended March 31, 2019, the Adviser waived fees and reimbursed expenses of $96,022 pursuant to its contractual agreement.
As of March 31, 2019, the following amounts were available for recoupment by the Adviser based upon their potential expiration dates:
| Fund | 2019 | 2020 | 2021 | 2022 |
| Resource Real Estate Diversified Income Fund | $215,231* | $426,265 | $513,660 | $96,022 |
| * | $1,244 was recouped in the current year. |
CCO/Compliance Services –For the period October 1, 2017 through February 28, 2018, the Fund reimbursed the Adviser for a portion of the costs (including compensation and benefits) related to the Fund’s Chief Compliance Officer.
Effective March 1, 2018, pursuant to a Compliance Services Agreement between the Fund and Resource America, Inc. (acting together with the Adviser and certain other affiliates (collectively, “Resource”)), dated March 1, 2018 (the “CSA”), Resource provides compliance services to the Fund. The services under the CSA are designed to ensure compliance by the Fund with its investment objectives, policies and restrictions, as disclosed in the Fund’s Prospectuses and Statement of Additional Information.
The CSA also covers, among other items, services associated with monitoring the Fund’s compliance with its policies and procedures and applicable federal, state and foreign securities laws and the rules and regulations thereunder. The initial term of the CSA is two years and will remain in full force from year to year thereafter, subject to annual approval by Resource and the Board.
In return for the services provided under the CSA, the Fund pays Resource a flat, annual fee of $200,000, payable monthly in twelve (12) equal installments (the “Flat Fee”), provided that each such monthly installment of the Flat Fee shall not exceed a monthly fee calculated at an annual rate of 0.10% of the Fund’s average daily net assets (the “Asset-Based Fee”). For purposes of determining whether the Fund will pay the Asset- Based Fee in any given month, Resource compares the amount of the Flat Fee and Asset-Based Fee that would be due for the given month and charges the Fund the applicable Asset-Based Fee only if such Asset-Based Fee is lower than the monthly installment of the Flat Fee, which is $16,666.66 (1/12 of $200,000).
For the six months ended March 31, 2019, the Fund incurred $99,727 with respect to costs associated with the Fund’s Chief Compliance Officer and fees associated with compliance services under the CSA.
Fund Accounting Fees and Expenses– ALPS Fund Services, Inc. (“ALPS”) serves as the Fund’s administrator and accounting agent (the “Administrator”) and receives customary fees from the Fund for such services.
Transfer Agent– DST Systems Inc. (the “Transfer Agent”), an affiliate of ALPS, serves as transfer, dividend paying and shareholder servicing agent for the Fund and receives customary fees from the Fund for such services.
| Semi-Annual Report | March 31, 2019 | 29 |
| Resource Real Estate Diversified Income Fund | Notes to Financial Statements |
March 31, 2019 (Unaudited)
Distributor– ALPS Distributors, Inc. (the “Distributor”), an affiliate of ALPS, serves as the Fund’s distributor. There are no fees paid to the Distributor pursuant to the distribution agreement. The Board has adopted, on behalf of the Fund, a shareholder servicing plan under which the Fund may compensate financial industry professionals for providing ongoing services in respect of clients with whom they have distributed shares of the Fund. Under the shareholder servicing plan, the Fund’s Class A, Class C, Class W, Class U, Class T, Class D and Class L shares are subject to a shareholder servicing fee at an annual rate of 0.25% of the average daily net assets attributable to that share class. For the six months ended March 31, 2019, the Fund incurred shareholder servicing fees of $308,318. The Class C, Class T and Class L shares also pay to the Distributor a distribution fee, payable under a distribution plan adopted by the Board, that accrues at an annual rate equal to 0.75%, 0.75% and 0.25%, respectively, of the Fund’s average daily net assets attributable to Class C, Class T and Class L shares, respectively, and is payable on a quarterly basis. In addition, Class D shares pay to Resource Securities LLC (the “Dealer Manager”), an affiliate of the Adviser, a dealer manager fee, payable under a distribution plan adopted by the Board, that accrues at an annual rate equal to 0.50% of the Fund’s average daily net assets attributable to Class D shares and is payable on a quarterly basis. Class A, Class W, Class I and Class U shares are not currently subject to a distribution fee. For the six months ended March 31, 2019, the Fund accrued $265,149 in distribution fees and $16,177 in dealer manager fees.
The Distributor acts as the Fund’s principal underwriter in a continuous public offering of the Fund’s shares. During the year ended September 30, 2018, no fees were retained by the Distributor.
Trustees– Each trustee who is not affiliated with the Trust or the Adviser receives an annual fee of $10,000, $2,000 for attending the annual in-person meeting of the Board, and $500 for attending each of the remaining telephonic meetings, as well as reimbursement for any reasonable expenses incurred attending the meetings. None of the interested Trustees or executive officers receive compensation from the Trust, except as noted above with respect to the Fund’s Chief Compliance Officer for the period October 1, 2017 through February 28, 2018.
4. INVESTMENT TRANSACTIONS
The cost of purchases and proceeds from the sale of securities, other than short-term securities, for the six months ended March 31, 2019 amounted to $200,439,676 and $167,994,208, respectively.
5. DERIVATIVE TRANSACTIONS
Derivative Instruments and Hedging Activities– The following discloses the Fund’s use of derivative instruments and hedging activities:
The Fund’s investment objectives permit the Fund to enter into various types of derivative contracts, such as options. In doing so, the Adviser may employ strategies in differing combinations to permit the Fund to increase, decrease, or change the level or types of exposure to market factors. Central to those strategies are features inherent to derivatives that make them more attractive for this purpose than equity or debt securities; they require little or no initial cash investment, they can focus exposure on only certain selected risk factors, and they may not require the ultimate receipt or delivery of the underlying security (or securities) to the contract. This may allow the Fund to pursue its objectives more quickly and efficiently than if it were to make direct purchases or sales of securities capable of effecting a similar response to market factors.
Market Risk Factors– In pursuit of its investment objectives, the Adviser may seek to use derivatives to increase or decrease the Fund’s exposure to the following market risk factors:
Foreign Exchange Rate Risk:Foreign exchange rate risk relates to the change in the U.S. dollar value of a security held that is denominated in a foreign currency. The value of a foreign currency denominated security will decrease as the dollar appreciates against the currency, while the value of the foreign currency denominated security will increase as the dollar depreciates against the currency.
Risk of Investing in Derivatives:The Fund’s use of derivatives can result in losses due to unanticipated changes in the market risk factors and the overall market.
Derivatives may have little or no initial cash investment relative to their market value exposure and therefore can produce significant gains or losses in excess of their cost. This use of embedded leverage allows the Fund to increase its market value exposure relative to its net assets and can substantially increase the volatility of the Fund’s performance.
Additional associated risks from investing in derivatives also exist and potentially could have significant effects on the valuation of the derivative and the Fund. Typically, the associated risks are not the risks to which the Fund is attempting to increase or decrease exposure, per its investment objectives, but are the additional risks from investing in derivatives.
| Resource Real Estate Diversified Income Fund | Notes to Financial Statements |
March 31, 2019 (Unaudited)
Examples of these associated risks are liquidity risk, which is the risk that the Fund will not be able to sell the derivative in the open market in a timely manner, and counterparty credit risk, which is the risk that the counterparty will not fulfill its obligation to the Fund.
Option Contracts– The Fund may enter into options transactions for hedging purposes and for non-hedging purposes, such as seeking to enhance return. The Fund may write covered put and call options on any stocks or stock indices, currencies traded on domestic and foreign securities exchanges, or futures contracts on stock indices, interest rates and currencies traded on domestic and, to the extent permitted by the CFTC and foreign exchanges. A written call option obligates the Fund to sell the specified asset to the holder (purchaser) at a stated price (the exercise price) if the option is exercised before a specified date (the expiration date). A written put option obligates the Fund to buy the specified asset from the purchaser at the exercise price if the option is exercised before the expiration date. Premiums received when writing options are recorded as liabilities and are subsequently adjusted to the current value of the options written. Premiums received from writing options that expire are treated as realized gains. Premiums received from writing options, which are either exercised or closed, are offset against the proceeds received or amount paid on the transaction to determine realized gains or losses which are recorded on the Statement of Operations.
The location in the Statement of Assets and Liabilities of the Fund’s derivative positions as of March 31, 2019 are as follows:
| Risk Exposure | | Statement of Assets and Liabilities Assets | | Value | | | Statement of Assets and Liabilities Liabilities | | Value | |
| Resource Real Estate Diversified Income Fund | | | | | | | | | | | | |
| Purchased Options (Equity contracts) | | Investments, at value | | $ | 1,261,000 | | | N/A | | | | |
| Written Options (Equity contracts) | | N/A | | | | | | Written options, at value | | $ | 2,203,500 | |
| Total | | | | $ | 1,261,000 | | | | | $ | 2,203,500 | |
The location in the Statement of Operations of the Fund’s derivative activity for the six months ended March 31, 2019 are as follows:
| Risk Exposure | | Statement of Operations Location | | Realized Gain/(Loss) on Derivatives Recognized in Income | | | Change in Unrealized Gain/(Loss) on Derivatives Recognized in Income | |
| Resource Real Estate Diversified Income Fund | | | | | | | | | | |
| Purchased Options (Equity contracts) | | Net realized gain on investments/Net change in unrealized appreciation on investments | | $ | (1,505,686 | ) | | $ | (1,126,380 | ) |
| | | | | | | | | | | |
| Written Options (Equity contracts) | | Net realized loss on written options/Net change in unrealized depreciation on written options | | | (1,946,759 | ) | | | (642,813 | ) |
| Total | | | | $ | (3,452,445 | ) | | $ | (1,769,193 | ) |
During the six months ended March 31, 2019, the average purchased and written option contracts volume was 10,700 and 22,000 contracts, respectively.
6. TAX BASIS INFORMATION
The Fund has substantial investments in real estate investment trusts, or REITs, which are generally not subject to federal income taxes. Distributions that the Fund receives from REITs can be classified as ordinary income, capital gain income or return of capital by the REITs that make these distributions to the Fund. However, it is not possible for the Fund to characterize distributions received from REITs during interim periods because the REIT issuers do not report their tax characterizations until subsequent to year end. Final characterization of the Fund’s 2018 distributions to its common shareholders is also dependent upon the magnitude or timing of the Fund’s securities transactions prior to year-end. Therefore, it is likely that some portion of the Fund’s 2018 investment income and distributions to its common shareholders will be recharacterized as long term capital gain and return of capital for financial statement and U.S. federal income tax purposes subsequent to year end and reflected accordingly in the Fund’s year end financial statements.
| Semi-Annual Report | March 31, 2019 | 31 |
| Resource Real Estate Diversified Income Fund | Notes to Financial Statements |
March 31, 2019 (Unaudited)
The tax character of distributions paid for the year ended September 30, 2018:
| September 30, 2018 | | Ordinary Income | | | Long-Term Capital Gain | | | Return of Capital | |
| Resource Real Estate Diversified Income Fund | | $ | 7,918,027 | | | $ | 1,267,376 | | | $ | 5,141,751 | |
The following information is computed on a tax basis for each item as of March 31, 2019:
| | | Gross Appreciation (excess of value over tax cost) | | | Gross Depreciation (excess of tax cost over value) | | | Net Unrealized Appreciation | | | Cost of Investments for Income Tax Purposes | |
| Resource Real Estate Diversified Income Fund | | $ | 35,682,328 | | | $ | (4,649,428 | ) | | $ | 31,032,900 | | | $ | 320,609,052 | |
The difference between book basis and tax basis distributable earnings and unrealized appreciation/(depreciation) is primarily attributable to the tax deferral of losses on wash sales, investments in partnerships and certain other investments.
7. REPURCHASE OFFERS
Pursuant to Rule 23c-3 under the 1940 Act, the Fund offers shareholders on a quarterly basis the option of redeeming shares, at NAV, of up to 5% of the Fund’s issued and outstanding shares as of the close of regular business hours on the New York Stock Exchange on the Repurchase Pricing Date (defined below). If shareholders tender for repurchase more than 5% of the outstanding shares of the Fund, the Fund may, but is not required to, repurchase up to an additional 2% of the outstanding shares of the Fund. If the Fund determines not to repurchase an additional 2% of the outstanding shares of the Fund, or if more than 7% of the outstanding shares of the Fund are tendered, then the Fund will repurchase shares on a pro rata basis based upon the number of shares tendered by each shareholder. There can be no assurance that the Fund will be able to repurchase all shares that each shareholder has tendered, even if all of the shares in a shareholder's account are tendered. In the event of an oversubscribed offer, you may not be able to tender all shares that you wish to tender and you may have to wait until the next quarterly repurchase offer to tender the remaining shares. Subsequent repurchase requests will not be given priority over other shareholder requests.
During the six months ended March 31, 2019, the Fund completed two quarterly repurchase offers. In these offers, the Fund offered to repurchase up to 5% of the number of its outstanding shares as of the Repurchase Pricing Dates. For the six months ended March 31, 2019, none of the quarterly repurchase offers were oversubscribed. The result of those repurchase offers were as follows:
| | Repurchase Offer #1 | Repurchase Offer #2 |
| Commencement Date | September 17, 2018 | December 17, 2018 |
| Repurchase Request Deadline | October 17, 2018 | January 16, 2019 |
| Repurchase Pricing Date | October 17, 2018 | January 16, 2019 |
| Amount Repurchased | $6,260,041 | $4,613,558 |
| Shares Repurchased | 600,312 | 441,195 |
8. BANK LINE OF CREDIT
The Fund has a $100,000,000 secured revolving bank line of credit through BNP Paribas Prime Brokerage International, Ltd. (the “Bank”) for purpose of investment purchases subject to the limitations of the 1940 Act for borrowings.
Borrowings under this arrangement bear interest at the Bank’s 1 month LIBOR plus 90 basis points at the time of borrowing. During the six months ended March 31, 2019, the Fund incurred $740,473 of interest expense related to the borrowings. Average borrowings and the average interest rate during the six months ended March 31, 2019 were $44,529,976 and 3.33%, respectively. The largest outstanding borrowing during the six months ended March 31, 2019 was $51,915,140. As of March 31, 2019, the Fund had $45,309,871 of outstanding borrowings.
As collateral security for the Bank line of credit, the Fund grants the Bank a first position security interest in and lien on all securities of any kind or description held by the Fund in the pledge account. As of March 31, 2019, the Fund had $160,244,063 in securities pledged as collateral for the line of credit and written options.
| Resource Real Estate Diversified Income Fund | Notes to Financial Statements |
March 31, 2019 (Unaudited)
9. UNFUNDED COMMITMENTS
As of March 31, 2019, in addition to the unfunded commitments for investments currently held as of the reporting date (Refer to Portfolio of Investments footnote disclosures), the Fund had $38,000,000 of unfunded commitments relating to potential future investments not currently held as reported below. The value of unfunded commitments reported as of March 31, 2019 approximates fair value.
| Security | Unfunded Commitments as of March 31, 2019 |
| Brookfield Premier Real Estate Partners | $14,000,000 |
| Carlyle Property Investors | $14,000,000 |
| Nuveen U.S. Core-Plus Real Estate Debt Fund | $10,000,000 |
10. SUBSEQUENT EVENTS
Subsequent events after the date of the Statement of Assets and Liabilities have been evaluated through the date the financial statements were issued.
The Fund completed a quarterly repurchase offer on April 17, 2019, which resulted in 472,849 Fund shares being repurchased for $4,960,549.
Management has determined that there were no other subsequent events to report through the issuance of these financial statements.
| Semi-Annual Report | March 31, 2019 | 33 |
| Resource Real Estate Diversified Income Fund | Additional Information |
March 31, 2019 (Unaudited)
1. PROXY VOTING POLICIES AND VOTING RECORD
A description of the policies and procedures that the Fund uses to vote proxies relating to portfolio securities is available without charge upon request by calling toll-free 855-747-9559, or on the Securities and Exchange Commission’s (“SEC”) website at http://www.sec.gov. Information regarding how the Fund voted proxies relating to portfolio securities during the most recent 12-month period ended June 30this available without charge upon request by calling toll-free 855-747-9559, or on the SEC’s website at http://www.sec.gov.
2. QUARTERLY PORTFOLIO HOLDINGS
The Fund files a complete listing of portfolio holdings for the Fund with the SEC as of the first and third quarters of each fiscal year on Form N-Q. The filings are available upon request by calling 855-747-9559. Furthermore, you may obtain a copy of the filing on the SEC’s website at http://www.sec.gov. The Fund’s Form N-Q may also be reviewed and copied at the SEC’s Public Reference Room in Washington, D.C., and information on the operation of the Public Reference Room may be obtained by calling 1-800-SEC-0330.
3. ANNUAL RENEWAL OF INVESTMENT ADVISORY AGREEMENT
At a meeting on November 9, 2018, the Board of Trustees (the “Board” or “Trustees”) of Resource Real Estate Diversified Income Fund (the “Fund” or the “Trust”), including a majority of the independent Trustees, approved the continuance of the investment advisory agreement (the “Advisory Agreement”) between the Trust and Resource Real Estate, LLC (“Resource Real Estate” or the “Adviser”). In considering the approval of the Advisory Agreement, the Trustees received materials specifically relating to the Adviser and the Advisory Agreement.
The Trustees considered the following material factors during their deliberations: (1) the nature, extent and quality of services to be provided by the Adviser; (2) the investment performance of the Fund and the Adviser; (3) the cost of services to be provided and the profits to be realized by the Adviser and its affiliates; (4) the extent to which economies of scale will be realized as the Fund grows; and (5) whether the fee levels reflect these economies of scale for the benefit of investors. The Trustees relied upon the advice of counsel and their own business judgment in determining the before-mentioned material factors to be considered in evaluating the Advisory Agreement and the weight to be given to each factor considered. The conclusions reached by the Trustees were based on a comprehensive evaluation of all of the information provided and were not the result of any one factor. Moreover, each Trustee may have afforded different weight to the various factors in reaching his conclusions with respect to the approval of the Advisory Agreement.
Nature, Extent and Quality of Service.The Board examined the nature, extent and quality of the services provided by Resource Real Estate to the Fund. They noted that the Board receives a significant level of input and quality materials from Resource Real Estate and provides professional managerial and operational teams to run and support the Fund. They further noted that Resource Real Estate continues to invest in high quality professional personnel to support the Fund. Resource Real Estate reported that its parent company has extensive experience sponsoring investment funds.
The Trustees discussed the nature of Resource Real Estate’s operations, the quality of Resource Real Estate’s compliance infrastructure and the experience and background of all key personnel of its fund management team. The Trustees confirmed that they saw a clear focus from the Adviser’s management team on compliance and efforts to use additional technology to automate compliance functions and remove human error. The Board additionally commented that they appreciated their access to the portfolio management team and senior firm managers with Resource Real Estate, the continued strong communication to the Board by Resource Real Estate, and high-level of service to benefit the Fund’s shareholders. The Board considered the support provided by C-III Capital Partners LLC across all functions of the Adviser. The Trustees further considered the key risks associated with the Fund’s investment strategy and the policies and procedures adopted by Resource Real Estate to mitigate those risks. They also discussed Resource Real Estate’s practices for monitoring compliance with the Fund’s investment limitations as well as Resource Real Estate’s broker-dealer selection practices. The Trustees concluded that Resource Real Estate had sufficient quality and depth of personnel, resources, investment methods and compliance policies and procedures essential to the continued performance of its duties under the Advisory Agreement and that the nature, overall quality and extent of the management services provided by Resource Real Estate to the Fund were satisfactory.
Performance.The Trustees considered the performance of the Fund. They noted that over the one-year period, the Fund outperformed its peer group average, Morningstar category average and RMZ NAREIT Index and benchmark index, the Wells Fargo Hybrid and Preferred Securities REIT Index (“REIT Index”). The Trustees recognized the limited benefits of comparing the Fund’s performance to its Morningstar category due to disparate grouping of a range of strategies that seek different objectives within the category. The Trustees also noted that the Fund outperformed the REIT Index (consisting of equal parts Global Developed REIT Equities, Direct Real Estate, and Real Estate Credit) since inception. The Trustees expressed their appreciation for the strong performance and the careful, thoughtful and professional manner in which Resource Real Estate implemented the strategy. The Trustees reasoned that Resource Real Estate was managing the Fund’s portfolio in accordance with prospectus guidelines and concluded that the Fund’s performance was satisfactory.
Fees and Expenses.The Trustees noted that the Fund charges a 1.25% management fee and that the fee was below the average of the Fund’s Morningstar category and slightly higher than the average, but reasonably within the range of its peer group. They further noted that the Fund’s net expense ratio was above the averages of the Morningstar category and the peer group. The Trustees further noted the expense cap in place, and after further discussion, concluded that the Fund’s fees and expenses were not unreasonable.
| Resource Real Estate Diversified Income Fund | Additional Information |
March 31, 2019 (Unaudited)
Economies of Scale.The Trustees considered whether there will be economies of scale with respect to the management of the Fund. They considered that Resource Real Estate reported that it had not yet received material benefits related to economies of scale, but that such economies may be realized as the Fund grows. After further discussion, the Trustees concluded that the absence of breakpoints at this time was acceptable, but that economies of scale would be revisited in the future should the Fund grow materially in size.
Profitability and Indirect Benefits.The Trustees reviewed the profitability analysis provided by Resource Real Estate related to its work for the Fund. The Trustees acknowledged indirect benefits received by the Adviser related to compensation paid to its affiliates for compliance and distribution services provided. The Board agreed that such compensation was appropriate for the services received. The Board further acknowledged that the Adviser was not making a profit on the Fund and accordingly, excess profits were not an issue at this time.
Conclusion.Having requested and received such information from Resource Real Estate as the Board believed to be reasonably necessary to evaluate the terms of the Advisory Agreement, and as assisted by the advice of counsel, the Board concluded that the advisory fee is reasonable and that renewal of the Advisory Agreement is in the best interests of the shareholders of the Fund.
4. DISTRIBUTABLE CASH FLOW
The information presented below regarding Distributable Cash Flow is supplemental non-GAAP financial information, which is meaningful to understanding the operating performance of the Fund. Distributable Cash Flow is the functional equivalent of EBITDA for non-investment companies. Management believes it is an important supplemental measure of performance. This information is supplemental, unaudited, and is not inclusive of required financial disclosures (such as Total Expense Ratio), and should be read in conjunction with our full financial statements.
| | | For the Six Months Ended March 31, 2019 | | | For the Year Ended September 30, 2018 | |
| Dividends and Interest from the Statement of Operations | | $ | 9,479,608 | | | $ | 14,157,108 | |
| Add: Tax adjustments attributable to REIT and other investments(1) | | | 1,057,076 | | | | 6,504,693 | |
| Dividends and Interest before REIT adjustments | | | 10,536,684 | | | | 20,661,801 | |
| | | | | | | | | |
| Total Expenses | | | 3,870,833 | | | | 7,785,344 | |
| Less Fees (Waived)/Recouped | | | (94,778 | ) | | | (510,742 | ) |
| Total Net Expenses | | | 3,776,055 | | | | 7,274,602 | |
| | | | | | | | | |
| Distributable Cash Flow | | | 6,760,629 | | | | 13,387,199 | |
| | | | | | | | | |
| Distribution to Shareholders | | | 8,124,756 | | | | 14,327,154 | |
| | | | | | | | | |
| Distribution Coverage Ratio | | | 83 | % | | | 93 | % |
| | | | | | | | | |
| Net Realized Gain from the Statement of Operations(2) | | | Not Applicable | | | | 1,480,021 | |
| | | | | | | | | |
| Distribution Coverage Ratio including Net Realized Gain | | | Not Applicable | | | | 104 | % |
| 1 | Tax adjustments attributable to REITs and other investments are adjustments to reflect the tax character of distributions received from underlying investments. Specifically, a portion of distributions received from REITs are often treated as non-taxable return of capital for book and tax purposes and distributions received from investments structured as partnerships are also treated as return of capital to the extent the distributions received exceed the income reported to the Fund on the Forms K-1 received from the underlying investments. |
| 2 | The Fund is subject to a 4% nondeductible excise tax on certain undistributed amounts of ordinary income and capital gain under a prescribed formula contained in Section 4982 of the Code. The formula requires payment to shareholders during a calendar year of distributions representing at least 98% of the Fund's ordinary income for the calendar year and at least 98.2% of its capital gain net income (i.e., the excess of its capital gains over capital losses) realized during the one-year period ending October 31 during such year plus 100% of any income that was neither distributed nor taxed to the Fund during the preceding calendar year. Under ordinary circumstances, the Fund expects to time its distributions so as to avoid liability for this tax. |
| Semi-Annual Report | March 31, 2019 | 35 |

Item 2. Code of Ethics.
Not applicable to this report.
Item 3. Audit Committee Financial Expert.
Not applicable to this report.
Item 4. Principal Accountant Fees and Services.
Not applicable to this report.
Item 5. Audit Committee of Listed Registrants.
Not applicable to the Registrant.
Item 6. Investments.
| (a) | The schedule of investments is included as part of the Report to Shareholders filed under Item 1 of this report. |
| (b) | Not applicable to the Registrant. |
Item 7. Disclosure of Proxy Voting Policies and Procedures for Closed-End Management Investment Companies.
Not applicable to this report.
Item 8. Portfolio Managers of Closed-End Management Investment Companies.
| (a) | Not applicable to this report. |
| (b) | Not applicable to this report. |
Item 9. Purchases of Equity Securities by Closed-End Management Investment Company and Affiliates Purchasers.
None.
Item 10. Submission of Matters to a Vote of Security Holders.
None.
Item 11. Controls and Procedures.
| (a) | Based on an evaluation of the Registrant’s disclosure controls and procedures as of a date within 90 days of the filing date of this report, the Registrant’s principal executive officer and principal financial officer have concluded that the disclosure controls and procedures are reasonably designed to ensure that the information required in filings on Form N-CSR is recorded, processed, summarized and reported by the filing date, including that information required to be disclosed is accumulated and communicated to the Registrant’s management, including the Registrant’s principal executive officer and principal financial officer, as appropriate to allow timely decisions regarding required disclosure. |
| (b) | There were no significant changes in the Registrant’s internal control over financial reporting that occurred during the Registrant’s last fiscal half-year that have materially affected, or are reasonably likely to materially affect, the Registrant’s internal control over financial reporting. |
Item 12. Disclosure of Securities Lending Activities for Closed-End Management Investment Companies.
None.
Item 13. Exhibits.
| (a)(2) | Certifications required by Item 12(a)(2) of Form N-CSR are filed herewith as Exhibit 99.CERT. |
SIGNATURES
Pursuant to the requirements of the Securities Exchange Act of 1934 and the Investment Company Act of 1940, the Registrant has duly caused this report to be signed on its behalf by the undersigned, thereunto duly authorized.
| RESOURCE REAL ESTATE DIVERSIFIED INCOME FUND | |
| | | |
| By: | /s/ Alan Feldman | |
| | Alan Feldman | |
| | Chief Executive Officer (Principal Executive Officer) | |
Date: June 6, 2019
Pursuant to the requirements of the Securities Exchange Act of 1934 and the Investment Company Act of 1940, this report has been signed below by the following persons on behalf of the Registrant and in the capacities and on the dates indicated.
| By: | /s/Alan Feldman | |
| | Alan Feldman | |
| | Chief Executive Officer (Principal Executive Officer) | |
Date: June 6, 2019
| By: | /s/ Steven R. Saltzman | |
| | Steven R. Saltzman | |
| | Treasurer (Principal Financial Officer) | |
Date: June 6, 2019