As filed with the Securities and Exchange Commission on January 30, 2014
UNITED STATES
SECURITIES AND EXCHANGE COMMISSION
Washington, D.C. 20549
FORM N-CSR
CERTIFIED SHAREHOLDER REPORT OF REGISTERED
MANAGEMENT INVESTMENT COMPANIES
Investment Company Act file number 811-22748
YCG Funds
(Exact name of registrant as specified in charter)
11701 Bee Cave Road, Suite 217
Austin, TX 78738
(Address of principal executive offices) (Zip code)
Will Kruger
YCG Funds
11701 Bee Cave Road, Suite 217
Austin, TX 78738
(Name and address of agent for service)
Registrant's telephone number, including area code: (512) 505-2347
Date of fiscal year end: November 30
Date of reporting period: November 30, 2013
Item 1. Reports to Stockholders.
 | YCG ENHANCED FUND |
| a series of the YCG Funds |
| |
| |
| |
| |
| |
| |
| Annual Report | |
| November 30, 2013 | Ticker Symbol: YCGEX |
MESSAGE TO SHAREHOLDERS
Dear Fellow Shareholder:
For the fiscal year ending November 30, 2013, the YCG Enhanced Fund achieved a total return of 25.7%. During the same time period, the S&P 500 Index had a total return of 31.3%. We are quite happy with these results as they are largely representative of what we would anticipate from our fund during bullish time periods such as the one we are currently experiencing, with this year providing the exclamation point to an amazing five year resurgence of U.S. stock prices.
In our view, as the market continues to advance, rising portfolio values lull many investors into complacency. The trouble is that stock returns, especially in speculative and cyclical issues, have been racing ahead while sustainable business earnings, in aggregate, have barely budged. In other words, returns this past year can largely be explained by price to earnings (P/E) multiple expansion, which is particularly concerning when profit margins are also near record highs. We believe that over the long term, regardless of what many short-term stock charts imply, business values cannot grow faster than their underlying cash flows. Thus, our priority is to identify businesses that we believe can swim against a possible tide of declining margins and/or stagnant or declining price-to-earnings ratios, while still swimming well with the tide if these risks never come to fruition.
We believe we have constructed a portfolio full of these types of companies and are pleased that it has delivered solid results despite what we believe to be its high quality, defensive nature. While we realize that owning a portfolio with a large overweighting of consumer defensive companies such as Procter & Gamble, Coca-Cola, Unilever, PepsiCo, and Colgate increases the probability that our portfolio will lag during strong bull markets (as it did during this past year), we believe it reduces risk and enhances return by increasing the possibility that our portfolio will outperform during sideways or downward markets, enabling us to go on the offensive during periods of investor apathy or distressed selling. Today’s market is decidedly not one of those periods, so we’re content to hold these stocks, since we believe they are still priced to deliver attractive returns over the long term.
Some question why we remain bullish on these types of holdings when their P/E ratios appear high. First, we believe this is because investors tend to underestimate the value of consistent cash flow. Consider a business we will call “Steady Eddie” that earns $1/year and can be purchased for $20, or 20 times earnings. Suppose this business does not grow, but it consistently earns $1/year for 4 years and consistently trades at a P/E multiple of 20. Now, compare this to another business we will call “Cyclical Cyclone” that also trades at $20/share. In the first year, it also makes $1/share, so it appears to also have a P/E ratio of 20. However, suppose it earns $2 in year two, then loses -$2 in year three, and earns $1 again in year 4. Over the ensuing
4 years it averaged $0.50/year, implying that, in year one, you did not really pay 20 times earnings for “Cyclical Cyclone,” but rather 40 times earnings! Oftentimes investors pay irrationally high multiples during periods of peak earnings as they extrapolate future expectations from the peak, and pay irrationally low multiples during trough earnings.
Second, we believe investors tend to underestimate the value of a company having the ability to convert a high percentage of their earnings to cash for shareholders. Just because a business earns money does not mean you get to see it as a shareholder! Some businesses are “hungrier” than others and may reabsorb more than 50% of their supposed free cash flow in order to protect and grow their business. For example, suppose you can purchase “Cash Gusher” for 20 times earnings or “Money Muncher” for 10 times earnings, and both businesses are growing at the same rate. Why would anyone in their right mind pay twice as much for Cash Gusher? Well, suppose Cash Gusher can pay out 100% of its earnings to you while Money Muncher is so capital intensive it can only pay out 25% of its earnings in order to maintain its business and make acquisitions to protect its franchise. This implies you did not pay 10 times earnings like you thought, but rather 40 times earnings! Thus, when you purchased Money Muncher for what you thought was 50% off, it turned out it was actually twice as expensive as Cash Gusher.
These two principles demonstrate that not all P/E multiples are created equally. In our view, this explains why a business such as Procter & Gamble (P&G) traded at an average trailing P/E ratio above 20 for the last couple decades and still produced compound returns at over 11% annually. Many investors believe that a high growth rate is required to achieve a healthy return if a stock is purchased at a high multiple, but P&G and other “Cash Gushers” have consistently and resoundingly disproved this assumption. During the period in question, P&G only grew around 5% annualized. Instead, the combination of the two principles discussed above – consistent earnings and P&G’s ability to convert nearly all of its earnings to cash for shareholders in the form of dividends and share repurchases – led to outsized returns despite the relatively higher price tag.
We tend to view the world in terms of probability distributions. Our analysis suggests that, in the current environment, these “narrow bell-curve” (higher quality) stocks oftentimes have higher expected returns than “wide bell-curve” (lower quality) stocks. In other words, the expected returns in these businesses are especially attractive when one considers the consistency of these businesses and their ability to return cash to shareholders. We want to be clear to communicate, however, that this defensive portfolio will likely not always be the case. We are willing to invest a portion of our portfolio in cyclical high quality businesses, and even in lower quality stocks, but only if we are convinced that we are being compensated to take on the additional risk.
As significant investors in the YCG Enhanced Fund, our interests are strongly aligned with yours. Additionally, we realize that many of you, including a number of our family members and friends, have entrusted to us a high percentage of your savings. We do not take this responsibility lightly. As such, we will continue to relentlessly pursue the best risk-adjusted returns.
We thank you for your trust and loyalty and wish you a happy, healthy, and prosperous 2014!
Sincerely,
The YCG Team
Past performance does not guarantee future results.
The fund is non-diversified, meaning it may concentrate its assets in fewer individual holdings than a diversified fund. Therefore, the Fund is more exposed to individual stock volatility than a diversified fund. The Fund invests primarily in equity securities without regard to market capitalization, thus investments will be made in mid and smaller capitalization companies, which involve additional risks such as limited liquidity and greater volatility. The Fund may also write put options and covered call options on a substantial portion of the Fund’s long equity portfolio, which have the risks of early option contract assignment forcing the Fund to purchase the underlying stock at the exercise price which may be the cause of significant losses due to the failure of correctly predicting the direction of securities prices, interest rates and currency exchange rates. The investment in options is not suitable for all investors. Covered call writing may limit the upside of an underlying security. The Fund may also invest in foreign securities which involve political, economic and currency risks, greater volatility, and differences in accounting methods. Investments in debt securities typically decrease in value when interest rates rise. This risk is usually greater for longer-term debt securities. Investment in lower-rated, non-rated and distressed securities presents a greater risk of loss to principal and interest than higher-rated securities.
Fund holdings and sector allocations are subject to change at any time and should not be considered recommendations to buy or sell any security. Please see the Schedule of Investments in this report for a complete list of fund holdings.
The definition of free ‘cash flow’ is the cash flow from operations that is left over after spending on maintenance capital expenditures and acquisitions that are required to protect the business. In other words, it’s the cash flow from operations that is free and clear to be distributed to shareholders in the form of dividends and share repurchases, and/or to be allocated towards ways to grow the existing business through means such as “growth” acquisitions or new capital expenditures, or simply pay down debt. Typically, we calculate this by looking at a normalized view of net income plus depreciation and amortization minus the maintenance capital expenditures and acquisitions that are required to protect the business, adjusted for often overlooked items such as pensions, stock option expenses, and leases.
The Price to Earnings (P/E) Ratio reflects the multiple of earnings at which a stock sells.
The S&P 500 is a stock market index based on the market capitalizations of 500 leading companies publicly traded in the U.S. stock market. It is not possible to invest directly in an index.
YCG Enhanced Funds
EXPENSE EXAMPLE
For the six months ended November 30, 2013 (Unaudited)
As a shareholder of the YCG Enhanced Fund (the “Fund”), you incur ongoing costs, including management fees and other Fund expenses. If you invest through a financial intermediary, you may also incur additional costs such as a transaction fee charged on the purchase or sale of the Fund or an asset-based management fee. This example is intended to help you understand your ongoing costs (in dollars) of investing in the Fund and to compare these costs with the ongoing costs of investing in other mutual funds.
The Example is based on an investment of $1,000 invested at the beginning of the period and held for the entire period from June 1, 2013 to November 30, 2013.
Actual Expenses
The first line of the table on the next page provides information about actual account values and actual expenses. You may use the information provided in this line, together with the amount you invested, to estimate the expenses that you paid over the period. Simply divide your account value by $1,000 (for example, an $8,600 ending account value divided by $1,000 = 8.6), then multiply the result by the number in the first line under the heading entitled “Expenses Paid During the Period” to estimate the expenses you paid on your account during the period.
Hypothetical Example for Comparison Purposes
The second line of the table on the next page provides information about hypothetical account values and hypothetical expenses based on the Fund’s actual expense ratio and an assumed rate of return of 5% per year before expenses, which is not the Fund’s actual return. The hypothetical account values and expenses may not be used to estimate the actual ending account balance or expenses you paid for the period. You may use this information to compare the ongoing costs of investing in the Fund and other funds. To do so, compare this 5% hypothetical example with the 5% hypothetical examples that appear in the shareholder reports of the other funds.
EXPENSE EXAMPLE (continued)
For the six months ended November 30, 2013 (Unaudited)
Please note that the expenses shown in the table are meant to highlight your ongoing costs only and do not reflect any costs that may be associated with investing in the Fund through a financial intermediary. Therefore, the second line of the table is useful in comparing the ongoing costs only, and will not help you determine the relative total costs of owning different funds. In addition, if any costs associated with investing through a financial intermediary were included, your costs would have been higher.
| | | | Expenses Paid |
| | Beginning | Ending | During Period(1) |
| | Account Value | Account Value | 06/01/2013 – |
| | 06/01/2013 | 11/30/2013 | 11/30/2013 |
| Actual | $1,000.00 | $1,108.50 | $7.35 |
| Hypothetical (5% return | | | |
| before expenses) | 1,000.00 | 1,018.10 | 7.03 |
| (1) | Expenses are equal to the Fund’s annualized expense ratio of 1.390%, multiplied by the average account value over the period, multiplied by 183/365 to reflect the period. |
GROWTH OF $10,000 INVESTMENT
The chart assumes an initial gross investment of $10,000 made on 12/28/12.
| | Cumulative |
| | Since Inception |
| | (12/28/12) |
| Annual Returns | |
| YCG Enhanced Fund | 25.70% |
| S&P 500 Index | 31.31% |
TOP TEN EQUITY HOLDINGS
November 30, 2013 (Unaudited)
| | | Percentage of |
| | | Net Assets |
| Procter & Gamble Co. | | | 9.88 | % | |
| Unilever NV – ADR | | | 7.63 | % | |
| Aon Plc | | | 7.23 | % | |
| Coca-Cola Co. | | | 6.98 | % | |
| PepsiCo., Inc. | | | 6.47 | % | |
| MSCI, Inc. | | | 4.98 | % | |
| Colgate-Palmolive Co. | | | 4.88 | % | |
| Sysco Corp. | | | 3.72 | % | |
| C.R. Bard, Inc. | | | 3.29 | % | |
| Mastercard, Inc. | | | 3.09 | % | |
| Total | | | 58.15 | % | |
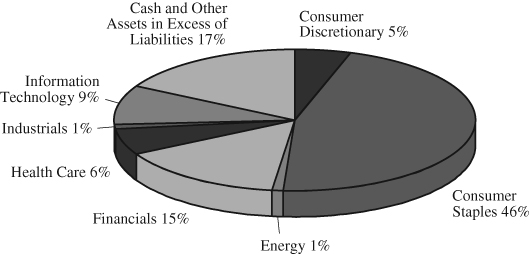
ALLOCATION OF PORTFOLIO HOLDINGS (as a % of net assets)
November 30, 2013 (Unaudited)
SCHEDULE OF INVESTMENTS
| | | Shares | | | Value | |
| COMMON STOCKS – 82.85% | | | | | | |
| | | | | | | |
| Beverages – 13.45% | | | | | | |
| Coca-Cola Co. | | | 87,568 | | | $ | 3,519,358 | |
| PepsiCo., Inc. | | | 38,623 | | | | 3,262,098 | |
| | | | | | | | 6,781,456 | |
| | | | | | | | | |
| Commercial Banks – 1.99% | | | | | | | | |
| Wells Fargo & Co. | | | 22,821 | | | | 1,004,580 | |
| | | | | | | | | |
| Communications Equipment – 0.78% | | | | | | | | |
| Cisco Systems, Inc. | | | 18,566 | | | | 394,528 | |
| | | | | | | | | |
| Consumer Finance – 1.17% | | | | | | | | |
| Nicholas Financial, Inc. | | | 36,906 | | | | 590,865 | |
| | | | | | | | | |
| Diversified Financial Services – 4.98% | | | | | | | | |
| MSCI, Inc. (a) | | | 56,529 | | | | 2,509,322 | |
| | | | | | | | | |
| Energy Equipment & Services – 0.74% | | | | | | | | |
| Ensco Plc | | | 6,300 | | | | 372,204 | |
| | | | | | | | | |
| Food & Staples Retailing – 7.66% | | | | | | | | |
| CVS Caremark Corp. | | | 6,693 | | | | 448,163 | |
| Sysco Corp. | | | 55,762 | | | | 1,875,276 | |
| Tesco Plc – ADR | | | 89,558 | | | | 1,537,711 | |
| | | | | | | | 3,861,150 | |
| | | | | | | | | |
| Food Products – 7.63% | | | | | | | | |
| Unilever NV – ADR | | | 97,968 | | | | 3,846,224 | |
| | | | | | | | | |
| Health Care Equipment & Supplies – 4.68% | | | | | | | | |
| Becton, Dickinson & Co. | | | 6,447 | | | | 700,080 | |
| C.R. Bard, Inc. | | | 11,966 | | | | 1,661,838 | |
| | | | | | | | 2,361,918 | |
| | | | | | | | | |
| Health Care Providers & Services – 1.72% | | | | | | | | |
| WellPoint, Inc. (a) | | | 9,369 | | | | 870,193 | |
| | | | | | | | | |
| Household Products – 16.73% | | | | | | | | |
| Clorox Co. | | | 10,671 | | | | 994,217 | |
| Colgate-Palmolive Co. | | | 37,371 | | | | 2,459,385 | |
| Procter & Gamble Co. (b) | | | 59,194 | | | | 4,985,319 | |
| | | | | | | | 8,438,921 | |
See notes to financial statements.
SCHEDULE OF INVESTMENTS (continued)
| | | Shares | | | Value | |
| COMMON STOCKS (continued) | | | | | | |
| | | | | | | |
| Insurance – 7.23% | | | | | | |
| Aon Plc | | | 44,670 | | | $ | 3,646,859 | |
| | | | | | | | | |
| Internet Software & Services – 0.97% | | | | | | | | |
| Google, Inc. (a) | | | 463 | | | | 490,590 | |
| | | | | | | | | |
| IT Services – 3.09% | | | | | | | | |
| Mastercard, Inc. | | | 2,048 | | | | 1,558,139 | |
| | | | | | | | | |
| Media – 5.40% | | | | | | | | |
| DIRECTV (a) | | | 18,902 | | | | 1,249,611 | |
| News Corp. (a) | | | 9,688 | | | | 173,997 | |
| Twenty-First Century Fox, Inc. | | | 38,755 | | | | 1,297,905 | |
| | | | | | | | 2,721,513 | |
| | | | | | | | | |
| Software – 3.61% | | | | | | | | |
| Microsoft Corp. | | | 30,296 | | | | 1,155,186 | |
| Oracle Corp. | | | 18,900 | | | | 666,981 | |
| | | | | | | | 1,822,167 | |
| | | | | | | | | |
| Trading Companies & Distributors – 1.02% | | | | | | | | |
| MFC Industrial Ltd. | | | 67,000 | | | | 512,550 | |
| TOTAL COMMON STOCKS | | | | | | | | |
| (Cost $34,166,356) | | | | | | | 41,783,179 | |
| Total Investments (Cost $34,166,356) – 82.85% | | | | | | | 41,783,179 | |
| Other Assets in Excess of Liabilities – 17.15% | | | | | | | 8,649,473 | |
| TOTAL NET ASSETS – 100.00% | | | | | | $ | 50,432,652 | |
Percentages are stated as a percent of net assets.
| ADR | American Depositary Receipt |
| Plc | Public Limited Company |
| (a) | Non-income producing security. |
| (b) | A portion of this security is pledged as collateral on written options. As of November 30, 2013, the value of collateral is $2,105,500. |
The Global Industry Classification Standard (GICS) was developed by and/or is the exclusive property of MSCI, Inc. and Standard & Poor Financial Services LLC (“S&P”). GICS is a service mark of MSCI and S&P and has been licensed for use by U.S. Bancorp Fund Services, LLC.
See notes to financial statements.
SCHEDULE OF OPTIONS WRITTEN
| | | Contracts | | | Value | |
| CALL OPTIONS | | | | | | |
| C.R. Bard, Inc. | | | | | | |
| Expiration: January 2014; Exercise Price: $120.00 | | | 67 | | | $ | 127,635 | |
| Expiration: January 2014; Exercise Price: $140.00 | | | 52 | | | | 13,390 | |
| | | | | | | | | |
| PUT OPTIONS | | | | | | | | |
| Aon Plc | | | | | | | | |
| Expiration: January 2014; Exercise Price: $72.50 | | | 17 | | | | 425 | |
| Expiration: January 2014; Exercise Price: $80.00 | | | 16 | | | | 2,240 | |
| Expiration: January 2014; Exercise Price: $82.50 | | | 20 | | | | 4,900 | |
| C.H. Robinson Worldwide, Inc. | | | | | | | | |
| Expiration: January 2014; Exercise Price: $60.00 | | | 13 | | | | 2,925 | |
| Expiration: February 2014; Exercise Price: $60.00 | | | 74 | | | | 25,160 | |
| Cisco Systems, Inc. | | | | | | | | |
| Expiration: February 2014; Exercise Price: $22.00 | | | 61 | | | | 9,028 | |
| Coca-Cola Co. | | | | | | | | |
| Expiration: December 2013; Exercise Price: $38.00 | | | 50 | | | | 250 | |
| Expiration: December 2013; Exercise Price: $39.00 | | | 85 | | | | 850 | |
| CVS Caremark Corp. | | | | | | | | |
| Expiration: January 2014; Exercise Price: $62.50 | | | 26 | | | | 1,014 | |
| Expiration: January 2014; Exercise Price: $67.50 | | | 122 | | | | 23,058 | |
| DIRECTV | | | | | | | | |
| Expiration: December 2013; Exercise Price: $60.00 | | | 17 | | | | 178 | |
| Expiration: December 2013; Exercise Price: $65.00 | | | 58 | | | | 4,756 | |
| Expiration: January 2014; Exercise Price: $62.50 | | | 30 | | | | 2,610 | |
| eBay, Inc. | | | | | | | | |
| Expiration: January 2014; Exercise Price: $52.50 | | | 40 | | | | 14,000 | |
| Expiration: January 2014; Exercise Price: $55.00 | | | 94 | | | | 49,820 | |
| Expiration: February 2014; Exercise Price: $50.00 | | | 33 | | | | 8,811 | |
| Ensco Plc | | | | | | | | |
| Expiration: December 2013; Exercise Price: $55.00 | | | 30 | | | | 600 | |
| Mastercard, Inc. | | | | | | | | |
| Expiration: January 2014; Exercise Price: $710.00 | | | 16 | | | | 8,080 | |
| Expiration: January 2014; Exercise Price: $725.00 | | | 1 | | | | 805 | |
| Expiration: January 2014; Exercise Price: $730.00 | | | 2 | | | | 1,808 | |
| Microsoft Corp. | | | | | | | | |
| Expiration: January 2014; Exercise Price: $35.00 | | | 162 | | | | 5,022 | |
| Expiration: February 2014; Exercise Price: $38.00 | | | 23 | | | | 4,232 | |
See notes to financial statements.
SCHEDULE OF OPTIONS WRITTEN (continued)
| | | Contracts | | | Value | |
| PUT OPTIONS (continued) | | | | | | |
| Oracle Corp. | | | | | | |
| Expiration: December 2013; Exercise Price: $34.00 | | | 302 | | | $ | 10,872 | |
| Expiration: January 2014; Exercise Price: $33.00 | | | 59 | | | | 2,301 | |
| Expiration: January 2014; Exercise Price: $35.00 | | | 47 | | | | 4,512 | |
| Twenty-First Century Fox, Inc. | | | | | | | | |
| Expiration: January 2014; Exercise Price: $34.00 | | | 73 | | | | 9,125 | |
| WellPoint, Inc. | | | | | | | | |
| Expiration: December 2013; Exercise Price: $82.50 | | | 7 | | | | 95 | |
| Wells Fargo & Co. | | | | | | | | |
| Expiration: January 2014; Exercise Price: $43.00 | | | 69 | | | | 4,761 | |
| Total Options Written (Premiums received $431,041) | | | | | | $ | 343,263 | |
See notes to financial statements.
STATEMENT OF ASSETS AND LIABILITIES
| ASSETS: | | | |
| Investments, at value (Cost $34,166,356) | | $ | 41,783,179 | |
| Cash | | | 7,164,681 | |
| Receivable for Fund shares sold | | | 45,000 | |
| Dividends and interest receivable | | | 80,951 | |
| Deposits with brokers for options written | | | 2,330,717 | |
| Prepaid expenses | | | 37,529 | |
| Total Assets | | | 51,442,057 | |
| | | | | |
| LIABILITIES: | | | | |
| Options written, at value (Premiums received $431,041) | | | 343,263 | |
| Payable for investments purchased | | | 581,238 | |
| Accrued investment advisory fees, net of waiver | | | 38,843 | |
| Other accrued expenses | | | 46,061 | |
| Total Liabilities | | | 1,009,405 | |
| NET ASSETS | | $ | 50,432,652 | |
| | | | | |
| NET ASSETS CONSIST OF: | | | | |
| Capital stock | | $ | 41,830,064 | |
| Undistributed net investment income | | | 207,887 | |
| Undistributed accumulated net realized gain | | | 690,100 | |
| Net unrealized appreciation | | | | |
| Investments | | | 7,616,823 | |
| Written options | | | 87,778 | |
| Total Net Assets | | $ | 50,432,652 | |
| Shares outstanding (unlimited shares of no par value authorized) | | | 4,010,937 | |
| | | | | |
| NET ASSET VALUE, OFFERING AND | | | | |
REDEMPTION PRICE PER SHARE(1) | | $ | 12.57 | |
| (1) | A redemption fee of 2.00% is assessed against shares redeemed within 90 days of purchase. See Note 2h. |
See notes to financial statements.
STATEMENT OF OPERATIONS
For the Period December 28, 2012(1) through November 30, 2013
| | | | |
| | | | |
| | | | |
| INVESTMENT INCOME: | | | |
Dividend income(2) | | $ | 702,426 | |
| Interest income | | | 207 | |
| Total investment income | | | 702,633 | |
| EXPENSES: | | | | |
| Investment advisory fees | | | 355,537 | |
| Offering costs | | | 40,862 | |
| Federal and state registration fees | | | 36,357 | |
| Compliance fees | | | 33,812 | |
| Transfer agent fees and expenses | | | 29,010 | |
| Administration fees | | | 28,606 | |
| Accounting fees | | | 27,470 | |
| Audit and tax fees | | | 20,005 | |
| Insurance fees | | | 8,161 | |
| Reports to shareholders | | | 7,706 | |
| Custody fees | | | 5,165 | |
| Trustee fees and expenses | | | 4,500 | |
| Shareholder service fees | | | 3,596 | |
| Collateral interest expense | | | 548 | |
| Miscellaneous expenses | | | 3,040 | |
| Total expenses before reimbursements | | | 604,375 | |
| Expense reimbursement by investment adviser (See Note 6) | | | (109,629 | ) |
| Net Expenses | | | 494,746 | |
| NET INVESTMENT INCOME | | | 207,887 | |
| REALIZED AND UNREALIZED GAIN: | | | | |
| Net realized gain on | | | | |
| Investments | | | 253,106 | |
| Written options | | | 436,994 | |
| Total | | | 690,100 | |
| Net change in unrealized appreciation on | | | | |
| Investments | | | 7,616,823 | |
| Written options | | | 87,778 | |
| Total | | | 7,704,601 | |
| Net realized and unrealized gain on investments | | | 8,394,701 | |
| NET INCREASE IN NET ASSETS RESULTING | | | | |
| FROM OPERATIONS | | $ | 8,602,588 | |
| (2) | Net of $22,934 in foreign withholding taxes. |
See notes to financial statements.
STATEMENT OF CHANGES IN NET ASSETS
| | | December 28, 2012(1) | |
| | | through | |
| | | November 30, 2013 | |
| OPERATIONS: | | | |
| Net investment income | | $ | 207,887 | |
| Net realized gain on investments and written options | | | 690,100 | |
| Net change in unrealized appreciation | | | | |
| on investments and written options | | | 7,704,601 | |
| Net increase in net assets resulting | | | | |
| from operations | | | 8,602,588 | |
| | | | | |
| CAPITAL SHARE TRANSACTIONS: | | | | |
| Proceeds from shares sold | | | 42,396,169 | |
| Proceeds from reinvestment of distributions | | | — | |
| Redemption fees | | | 1,900 | |
| | | | 42,398,069 | |
| Payments for shares redeemed | | | (668,005 | ) |
| Net increase | | | 41,730,064 | |
| TOTAL INCREASE IN NET ASSETS | | | 50,332,652 | |
| | | | | |
| NET ASSETS: | | | | |
| Beginning of period | | | 100,000 | |
| | | | | |
| End of year (including undistributed | | | | |
| net investment income of $207,887) | | $ | 50,432,652 | |
| | | | | |
| CHANGES IN SHARES OUTSTANDING: | | | | |
| Shares sold | | | 4,057,558 | |
| Issued in reinvestment of distributions | | | — | |
| Shares redeemed | | | (56,621 | ) |
| Net increase | | | 4,000,937 | |
| | | | | |
See notes to financial statements.
FINANCIAL HIGHLIGHTS
| For a Fund share outstanding throughout the period | | December 28, 2012(1) |
| | | through |
| | | November 30, 2013 |
| NET ASSET VALUE: | | | |
| Beginning of period | | $ | 10.00 | |
| | | | | |
| OPERATIONS: | | | | |
| Net investment income | | | 0.05 | |
| Net realized and unrealized gain on investment securities | | | 2.52 | |
| Total from operations | | | 2.57 | |
| Redemption fee proceeds | | | — | (2) |
| | | | | |
| NET ASSET VALUE: | | | | |
| End of period | | $ | 12.57 | |
| | | | | |
| TOTAL RETURN | | | 25.70 | %(3) |
| | | | | |
| SUPPLEMENTAL DATA AND RATIOS: | | | | |
| Net assets; end of period (000’s) | | $ | 50,433 | |
| Ratio of expenses to average net assets: | | | | |
| Expenses including reimbursement/waiver | | | 1.39 | %(4) |
| Expenses excluding reimbursement/waiver | | | 1.70 | %(4) |
| Net investment income including reimbursement/waiver | | | 0.59 | %(4) |
| Net investment income excluding reimbursement/waiver | | | 0.28 | %(4) |
| Portfolio turnover rate | | | 9.21 | %(3) |
| (2) | Amount represents less than $0.01 per share. |
See notes to financial statements.
NOTES TO FINANCIAL STATEMENTS
1.ORGANIZATION
YCG Funds (the “Trust”) is a Delaware statutory trust organized under Declarations of Trust dated September 4, 2012. The Trust is an open-end management investment company, as defined in the Investment Company Act of 1940 (the “1940 Act”), as amended. The Trust consists of one series, YCG Enhanced Fund (the “Fund”). The Fund is classified and operates as a non-diversified fund under the 1940 Act. The Fund commenced operations on December 28, 2012. The Fund’s investment adviser is YCG, LLC (the “Adviser”). There are an unlimited number of authorized shares. The investment objective of the Fund is to maximize long-term appreciation with reasonable investment risk.
2.SUMMARY OF SIGNIFICANT ACCOUNTING POLICIES
The following is a summary of significant accounting policies consistently followed by the Fund in the preparation of its financial statements. The financial statements have been prepared in conformity with accounting principles generally accepted in the United States of America (“GAAP”).
a) Subsequent Events Evaluation – In preparing these financial statements, the Fund has evaluated events and transactions for potential recognition or disclosure resulting from subsequent events through the date the financial statements were issued. This evaluation did not result in any subsequent events that necessitated disclosures and/or adjustments other than the event listed below.
On December 30, 2013, the Trust declared and paid distributions from ordinary income and net realized capital gains to shareholders of record as of December 27, 2013, as follows:
| | Ordinary Income | Short-Term Capital Gain |
| YCG Enhanced Fund | $306,410 | $690,125 |
b) Investment Valuation – Securities which are traded on a national stock exchange are valued at the last sale price on the securities exchange on which such securities are primarily traded. Securities that are traded on The Nasdaq OMX Group, Inc., referred to as NASDAQ are valued at the Nasdaq Official Closing Price. Exchange-traded securities for which there were no transactions are valued at the current bid prices. Securities traded on only over-the-counter markets are valued on the basis of closing over-the-counter bid prices. Short-term debt instruments maturing within 60 days are valued by the amortized cost method, which approximates fair value. Debt securities (other than short-term instruments) are valued at the mean price furnished by a national pricing service, subject to review by the Adviser and determination of the appropriate price whenever a furnished price is significantly different from the
NOTES TO FINANCIAL STATEMENTS (continued)
previous day’s furnished price. Options written or purchased by the Fund are valued at the last sales price. If there are no trades for an option on a given day, options are valued at the mean between the current bid and asked prices. Any securities for which there are no readily available market quotations and other assets will be valued at their fair value as determined in good faith by the Adviser pursuant to procedures established by and under the supervision of the Board of Trustees.
Valuation Measurements
The Fund has adopted authoritative fair valuation accounting standards which establish an authoritative definition of fair value and set out a hierarchy for measuring fair value. These standards require additional disclosures about the various inputs and valuation techniques used to develop the measurements of fair value and a discussion in changes in valuation techniques and related inputs, if any, during the period. In addition, these standards require expanded disclosure for each major category of assets. These inputs are summarized in the three broad levels listed below:
| Level 1 – | Quoted prices in active markets for identical securities. |
| Level 2 – | Other significant observable inputs (including quoted prices for similar securities, interest rates, prepayment speeds, credit risk, etc.) |
| Level 3 – | Significant unobservable inputs (including the Fund’s own assumptions in determining the fair value of investments). In addition to the fair-valued securities, the other securities designated as level 3 included securities where prices are obtained from a broker quote in an illiquid market. |
The inputs or methodology used for valuing securities are not an indication of the risk associated with investing in those securities. The following is a summary of the inputs used to value the Fund’s net assets as of November 30, 2013:
| | | Level 1 | | | Level 2 | | | Level 3 | | | Total | |
| Assets | | | | | | | | | | | | |
| Common Stocks* | | $ | 41,783,179 | | | $ | — | | | $ | — | | | $ | 41,783,179 | |
| Liabilities | | | | | | | | | | | | | | | | |
| Other Financial | | | | | | | | | | | | | | | | |
| Instruments** | | | | | | | | | | | | | | | | |
| Options Written | | $ | 343,263 | | | $ | — | | | $ | — | | | $ | 343,263 | |
| * | Please refer to the schedule of investments to view securities by industry type. |
| ** | Other Financial Instruments are derivative instruments not reflected in the Schedule of Investments, such as written options, which are reflected at value. |
The Fund did not invest in any Level 3 investments during the period. There were no transfers into or out of Levels 1 or 2 during the period. It is the Fund’s policy to consider transfers into or out of Level 1 and Level 2 as of the end of the reporting period.
NOTES TO FINANCIAL STATEMENTS (continued)
c) Option Writing – The Fund may write covered call options and put options on a substantial portion of the Fund’s long equity portfolio as a means to generate additional income and to tax-efficiently enter and exit positions. The Fund will not use this strategy as a means of generating implicit leverage. In other words, if all put options were to be exercised, the Fund will generally have enough cash on hand to purchase the assigned shares. When the Fund writes an option, an amount equal to the premium received by the Fund is recorded as a liability and is subsequently adjusted to the current fair value of the option written. Premiums received from writing options that expire unexercised are treated by the Fund on the expiration date as realized gains from written options. The difference between the premium and the amount paid on effecting a closing purchase transaction, including brokerage commissions, is also treated as a realized gain, or, if the premium is less than the amount paid for the closing purchase transaction, as a realized loss. If a call option is exercised, the premium is added to the proceeds from the sale of the underlying security in determining whether the Fund has realized a gain or loss. If a put option is exercised, the premium reduces the cost basis of the securities purchased by the Fund. The Fund, as a writer of an option, bears the market risk of an unfavorable change in the price of the security underlying the written option. Upon writing an option, the Fund is required to pledge an amount of cash or securities, as determined by the broker, as collateral. As of November 30, 2013, the Fund held securities with a value of $2,105,500 and cash of $2,330,717 as collateral for written options. During the period, the Fund used written covered call and put options in a manner consistent with the strategy described above.
Statement of Assets and Liabilities – Values of Derivative Instruments as of November 30, 2013
| | Liability Derivatives | |
| Derivatives not | | | | |
| accounted for as | | | | |
| hedging instruments | Location | | Value | |
| Equity Contracts – | Options written, | | | |
| Options | at value | | $ | 343,263 | |
| Total | | | $ | 343,263 | |
NOTES TO FINANCIAL STATEMENTS (continued)
The effect of Derivative Instruments on the Statement of Operations for the period ended November 30, 2013
| Amount of Realized Gain on | | Change in Unrealized Appreciation | |
| Derivatives Recognized in Income | | on Derivatives Recognized in Income | |
| Derivatives not | | | | Derivatives not | | | |
| accounted for | | | | accounted for | | | |
| as hedging | | Written | | as hedging | | Written | |
| instruments | | Options | | instruments | | Options | |
| Equity Contracts | | $ | 436,994 | | Equity Contracts | | $ | 87,778 | |
| Total | | $ | 436,994 | | Total | | $ | 87,778 | |
The average monthly value of written options during the period ended November 30, 2013 was $177,762.
See Note 4 for additional disclosure related to transactions in written options during the year.
Derivative Risks
The risks of using the various types of derivatives in which the Fund may engage include the risk that movements in the value of the derivative may not fully offset or complement instruments currently held in the Fund in the manner intended by the Adviser, the risk that the counterparty to a derivative contract may fail to comply with its obligations to the Fund, the risk that there may not be a liquid secondary market for the derivative at a time when the Fund would look to disengage the position, the risk that additional capital from the Fund may be called upon to fulfill the conditions of the derivative contract, the risk that the use of derivatives may induce leverage in the Fund, and the risk that the cost of the derivative may reduce the overall returns experience by the Fund.
d) Federal Income Taxes – The Fund intends to qualify as a “regulated investment company” under Subchapter M of the Internal Revenue Code of 1986, as amended. If so qualified, the Fund will not be subject to federal income tax to the extent it distributes substantially all of its net investment income and capital gains to shareholders. Therefore, no federal income tax provision is required.
The Fund has adopted financial reporting rules regarding recognition and measurement of tax positions taken or expected to be taken on a tax return. The Fund recognizes interest and penalties, if any, related to unrecognized tax benefits as income tax expense in the Statement of Operations. During the period, the Fund did not incur any interest or penalties. As of and during the period ended November 30, 2013, the Fund did not have any liabilities for unrecognized tax benefits. The Fund
NOTES TO FINANCIAL STATEMENTS (continued)
is subject to examination by U.S. taxing authorities for open tax periods since the commencement of operations.
e) Distributions to Shareholders – The Fund will declare and distribute any net investment income and any net realized long or short-term capital gains annually. Distributions to shareholders are recorded on the ex-dividend date. The character of distributions made during the year from net investment income or net realized gains may differ from the characterization for federal income tax purposes due to differences in the recognition of income, expense and gain items for financial statement and tax purposes. Where appropriate, reclassifications between capital accounts are made for such differences that are permanent in nature.
f) Use of Estimates – The preparation of the financial statements in conformity with GAAP requires management to make estimates and assumptions that affect the reported amounts of assets and liabilities and disclosure of contingent assets and liabilities at the date of the financial statements and the reported amounts of increases and decreases in net assets from operations during the reporting period. Actual results could differ from those estimates.
g) Guarantees and Indemnifications – In the normal course of business, the Fund enters into contracts with service providers that contain general indemnification clauses. The Fund’s maximum exposure under these arrangements is unknown as this would involve future claims against the Fund that have not yet occurred. Based on experience, the Fund expects the risk of loss to be remote.
h) Redemption Fee – Those who buy and sell the Fund within 90 calendar days will incur a 2% redemption fee, retained for the benefit of long-term shareholders, and recorded as additional capital in the Statement of Changes in Net Assets.
i) Beneficial Ownership – The beneficial ownership, either directly or indirectly, of more than 25% of the voting securities of a fund creates a presumption of control of the Fund, under Section 2(a)(9) of the 1940 Act. At November 30, 2013, a shareholder related to an officer and trustee of the Fund held 42.08% of the outstanding shares of the Fund.
j) Other – Investment transactions and shareholder transactions are accounted for on the trade date. Net realized gains and losses on securities are computed on the basis of highest amortized cost. Dividend income is recognized on the ex-dividend date and interest income is recognized on an accrual basis. Discounts and premiums on securities purchased are accreted and amortized over the lives of the respective securities. Withholding taxes on foreign dividends have been provided for in accordance with the Fund’s understanding of the applicable country’s tax rules and regulations.
NOTES TO FINANCIAL STATEMENTS (continued)
3.INVESTMENT TRANSACTIONS
For the period ended November 30, 2013, the aggregate purchases and sales of securities, excluding short-term securities, were $36,226,426 and $3,097,652 for the Fund. For the period ended November 30, 2013, there were no long-term purchases or sales of U.S. Government securities for the Fund.
4.OPTION CONTRACTS WRITTEN
The premium amount and number of option contracts written during the period ended November 30, 2013, in the Fund were as follows:
| | | Amount of | | | Number of | |
| | | Premiums | | | Contracts | |
| Outstanding at 12/28/12 | | $ | — | | | | — | |
| Options written | | | 1,093,291 | | | | 5,195 | |
| Options exercised | | | (163,229 | ) | | | (1,188 | ) |
| Options expired | | | (404,589 | ) | | | (1,681 | ) |
| Options closed | | | (94,432 | ) | | | (660 | ) |
| Outstanding at 11/30/13 | | $ | 431,041 | | | | 1,666 | |
See Note 2 for additional disclosure related to transactions in written options during the period.
5.NEW ACCOUNTING PRONOUNCEMENTS
In December 2011, Financial Accounting Standards Board (“FASB”) issued Accounting Standards Updates (“ASU”) No. 2011-11 related to disclosures about offsetting assets and liabilities. The amendments in this ASU require an entity to disclose information about offsetting and related arrangements to enable users of its financial statements to understand the effect of those arrangements of its financial position. The ASU is effective for annual reporting periods beginning on or after January 1, 2013, and interim periods within those annual periods. The guidance requires retrospective applications for all comparative periods presented. Management is currently evaluating the impact ASU 2011-11 will have on the financial statements disclosure.
6.INVESTMENT ADVISORY AGREEMENT
The Adviser acts as the investment adviser to the Fund pursuant to an investment advisory agreement (the “Advisory Agreement”) which has been approved by the Board (including a majority of the Trustees who are not parties to the Advisory Agreement, or interested persons of any such party). Under the terms of the Advisory Agreement between the Fund and the Adviser, the Adviser conducts
NOTES TO FINANCIAL STATEMENTS (continued)
investment research and management for the Fund and is responsible for the purchase and sale of securities for the Fund’s investment portfolio. The Adviser provides the Fund with investment advice, supervises the management and investment programs and provides investment advisory facilities and executive and supervisory personnel for managing the investments and effectuating portfolio transactions. The Adviser also furnishes, at its own expense, all necessary administrative services, office space, equipment and clerical personnel for servicing the investments of the Fund. In addition, the Adviser pays the salaries and fees of all officers of the Fund who are affiliated with the Adviser. Under the Advisory Agreement, the monthly compensation paid to the Adviser is accrued daily at an annual rate of 1.00% on the average daily net assets of the Fund.
In the interest of limiting the expenses of the Fund, the Adviser has entered into a contractual expense limitation agreement with the Fund. Pursuant to the Expense Limitation Agreement, the Adviser (for the lifetime of the Fund) has agreed to waive or limit its fees and assume other expenses of the Fund (excluding interest, taxes, brokerage commissions and dividend expenses on securities sold short and extraordinary expenses not incurred in the ordinary course of business) so that the Fund’s ratio of total annual operating expenses is limited to 1.39%. The Adviser is entitled to the reimbursement of fees waived or reimbursed by the Adviser to the Fund subject to the limitations that (1) the reimbursement of expenses classified as “organizational” or “offering” related to the initial registration and offering of the Fund is made only for those expenses incurred not more than one year prior to the date of reimbursement (2) the reimbursement is made only for fees and expenses incurred not more than three years prior to the date of reimbursement, and (3) the reimbursement may not be made if it would cause the Fund’s annual expense limitation to be exceeded. The reimbursement amount may not include any additional charges or fees, such as interest accruable on the reimbursement account. As of November 30, 2013, expenses of $61,753 and $68,767 are subject to recoupment by the Adviser, expiring during the year ended November 30, 2014 and November 30, 2016, respectively.
Certain trustees, officers and shareholders of the Fund are also owners or employees of the Adviser.
7.SERVICE AND CUSTODY AGREEMENTS
The Fund has entered into Service Agreements with U.S. Bancorp Fund Services, LLC (“USBFS”) and a Custody Agreement with U.S. Bank, N.A., an affiliate of USBFS. Under these agreements, USBFS and U.S. Bank, N.A. provide certain transfer agency, administrative, accounting and custody services.
NOTES TO FINANCIAL STATEMENTS (continued)
8.NON-DIVERSIFICATION RISK
The Fund is non-diversified. A non-diversified fund may invest more of its assets in fewer companies than if it were a diversified fund. The Fund may be more exposed to the risks of loss and volatility than a fund that invests more broadly.
9.FEDERAL TAX INFORMATION
As of November 30, 2013, the components of the tax basis cost of investments and net unrealized appreciation were as follows:
| | | YCG Enhanced Fund | |
| Tax cost of investments | | $ | 34,166,489 | |
| Gross unrealized appreciation | | | 7,794,727 | |
| Gross unrealized depreciation | | | (178,037 | ) |
| Net tax unrealized appreciation (depreciation) | | | 7,616,690 | |
| Undistributed ordinary income | | | 996,643 | |
| Undistributed long-term capital gains | | | — | |
| Accumulated earnings | | | 996,643 | |
| Other accumulated gains (losses) | | | (10,745 | ) |
| Total accumulated earnings | | $ | 8,602,588 | |
The tax basis of investments for tax and financial reporting purposes differs, principally due to the deferral of losses on wash sales and the recognition of gains on certain foreign investments.
REPORT OF INDEPENDENT REGISTERED PUBLIC ACCOUNTING FIRM
To the Shareholders and Board of Trustees of
YCG Enhanced Fund
We have audited the accompanying statement of assets and liabilities, including the schedules of investments and options written, of YCG Enhanced Fund (the “Fund”), a series of the YCG Funds, as of November 30, 2013, and the related statements of operations and changes in net assets, and financial highlights for the period December 28, 2012 (commencement of operations) through November 30, 2013. These financial statements and financial highlights are the responsibility of the Fund’s management. Our responsibility is to express an opinion on these financial statements and financial highlights based on our audit.
We conducted our audit in accordance with the standards of the Public Company Accounting Oversight Board (United States). Those standards require that we plan and perform the audit to obtain reasonable assurance about whether the financial statements and financial highlights are free of material misstatement. An audit includes examining, on a test basis, evidence supporting the amounts and disclosures in the financial statements. Our procedures included confirmation of securities owned as of November 30, 2013, by correspondence with the custodian and brokers. An audit also includes assessing the accounting principles used and significant estimates made by management, as well as evaluating the overall financial statement presentation. We believe that our audit provides a reasonable basis for our opinion.
In our opinion, the financial statements and financial highlights referred to above present fairly, in all material respects, the financial position of YCG Enhanced Fund as of November 30, 2013, and the results of its operations, the changes in its net assets, and the financial highlights for the period December 28, 2012 (commencement of operations) through November 30, 2013, in conformity with accounting principles generally accepted in the United States of America.
COHEN FUND AUDIT SERVICES, LTD.
Cleveland, Ohio
January 21, 2014
ADDITIONAL INFORMATION
1.SHAREHOLDER NOTIFICATION OF FEDERAL TAX STATUS
For the period ended November 30, 3013, 73% of the dividends paid from net investment income, including short-term capital gains, for the YCG Enhanced Fund qualify for the dividends received deduction available to corporate shareholders.
For the period ended November 30, 2013, 73% of the dividends paid from net investment income, including short-term capital gains, for the YCG Enhanced Fund are designated as qualified dividend income.
2.COMPENSATION OF TRUSTEES
During the fiscal year, each Trustee who is not an “interested person” of the Trust (i.e. an “Independent Trustee”) receives $500 per meeting attended, as well as reimbursement for expenses incurred in connection with attendance at such meetings.
3.PROXY VOTING POLICIES AND PROCEDURES
For a description of the policies and procedures that the Fund uses to determine how to vote proxies relating to portfolio securities, please call 1-855-444-9243 and request a Statement of Additional Information. One will be mailed to you free of charge. The Statement of Additional Information is also available on the web site of the Securities and Exchange Commission at http:www.sec.gov. Information on how the Fund voted proxies relating to portfolio securities during the period ended June 30, 2013 is available without charge, upon request, by calling 1-855-444-9243 or by accessing the web site of the Securities and Exchange Commission.
4.DISCLOSURE OF PORTFOLIO HOLDINGS
The Fund files a complete schedule of portfolio holdings with the Securities and Exchange Commission for the first and third quarters of each fiscal year on Form N-Q. The Fund’s Form N-Q is available on the web site of the Securities and Exchange Commission at http://www.sec.gov.
TRUSTEES AND OFFICERS
The business of the Fund is managed under the direction of the Board. The Board formulates the general policies of the Fund and meets periodically to review the Fund’s performance, monitor investment activities and practices, and discuss other matters affecting the Fund. The Trustees are fiduciaries for the Fund’s shareholders and are governed by the laws of the State of Delaware in this regard. The names and addresses of the Trustees and officers of the Trust are listed below along with a description of their principal occupations over at least the last five years. Trustees who are “interested persons”, as defined by the 1940 Act, are indicated by asterisk. The Fund’s Statement of Additional Information includes additional information about the Trustees and is available upon request by calling toll free 1-855-444-9243.
| | | | | Other |
| | | | | directorships |
| | | Number | | held and |
| | Position held | of funds | | number of |
| | with the | in the | | funds in |
| Name, address | Trust | Trust | Principal occupation(s) | complex during |
| and year born | and tenure | overseen | during the past five years | the past five years |
| | | | | |
| Brian Yacktman* | Trustee & | 1 | Manager, Principal and | None. |
| 11701 Bee Cave Road, | President | | Chief Investment | |
| Suite 217 | since | | Officer, YCG, LLC, | |
| Austin, TX 78738 | December | | investment adviser to | |
| (1979) | 2012 | | the Fund, since 2007. | |
| | | | Associate, Yacktman | |
| | | | Asset Management, | |
| | | | 2004–2007. BS from | |
| | | | Brigham Young | |
| | | | University, 2002. | |
| | | | MBA from Brigham | |
| | | | Young University, 2004. | |
| | | | | |
| William D. Kruger* | Chairman, | 1 | Manager, Principal and | None. |
| 11701 Bee Cave Road, | Vice | | CEO, YCG, LLC, | |
| Suite 217 | President, | | investment adviser to | |
| Austin, TX 78738 | Treasurer, | | the Fund, since 2008. | |
| (1979) | Trustee, | | Financial Analyst with | |
| | since | | Merrill Lynch Pierce | |
| | December | | Fenner & Smith, | |
| | 2012 | | 2005–2008. BS from | |
| | | | Brigham Young | |
| | | | University, 2005. | |
TRUSTEES AND OFFICERS (continued)
| | | | | Other |
| | | | | directorships |
| | | Number | | held and |
| | Position held | of funds | | number of |
| | with the | in the | | funds in |
| Name, address | Trust | Trust | Principal occupation(s) | complex during |
| and year born | and tenure | overseen | during the past five years | the past five years |
| | | | | |
| Non-Interested Trustees: | | | | |
| | | | | |
| Travis E.Oliphant | Trustee | 1 | Scientific and Technical | None. |
| 11701 Bee Cave Road, | since | | software developer. | |
| Suite 217 | December | | CEO of Continuum | |
| Austin, TX 78738 | 2012 | | Analytics since January 2012. | |
| (1971) | | | President of Enthought, | |
| | | | 2007–December, 2011. | |
| | | | Assistant Professor, | |
| | | | Brigham Young University, | |
| | | | 2000–August 2007. | |
| | | | BS from Brigham Young | |
| | | | University, 1995. | |
| | | | MS from Brigham Young | |
| | | | University, 1996. | |
| | | | PhD from Mayo Graduate | |
| | | | School, 2001. | |
| | | | | |
| Rory M. McDonald | Trustee | 1 | Assistant Professor of | None. |
| 11701 Bee Cave Road, | since | | Business Adminstration | |
| Suite 217 | December | | in the Technology and | |
| Austin, TX 78738 | 2012 | | Operations Management | |
| (1978) | | | Unit at Harvard Business | |
| | | | School, 2013–Present. | |
| | | | Assistant Professor of | |
| | | | Management, University of | |
| | | | Texas at Austin, McCombs | |
| | | | School of Business, | |
| | | | 2011–2013. Co-founder of | |
| | | | Adaptive Hearing Solutions, | |
| | | | 2005–2007. Associate at | |
| | | | Cornerstone Research, 2006. | |
| | | | BS from University of South | |
| | | | Florida, 2004. MS from | |
| | | | University of South Florida, | |
| | | | 2004. MBA from Stanford | |
| | | | University, 2006. MA from | |
| | | | Stanford University, 2009. | |
| | | | PhD From Stanford | |
| | | | University, 2011. | |
TRUSTEES AND OFFICERS (continued)
| | | | | Other |
| | | | | directorships |
| | | Number | | held and |
| | Position held | of funds | | number of |
| | with the | in the | | funds in |
| Name, address | Trust | Trust | Principal occupation(s) | complex during |
| and year born | and tenure | overseen | during the past five years | the past five years |
| | | | | |
| Jeffrey R. Harbach | Trustee | 1 | Owner, franchisee of 7-11 | None. |
| 11701 Bee Cave Road, | since | | Stores, 2002–Present. | |
| Suite 217 | December | | Former President and CEO | |
| Austin, TX 78738 | 2012 | | of David Gabriel Co. | |
| (1979) | | | BS from Brigham Young | |
| | | | University, 2002. | |
| | | | MBA from University of | |
| | | | Texas at Austin, 2011. | |
| | | | | |
| Officers who are not Trustees: | | | | |
| | | | | |
| Elliott Savage | Vice | N/A | Manager, Principal and | None. |
| 11701 Bee Cave Road, | President, | | Portfolio Manager, YCG, | |
| Suite 217 | Assistant | | LLC, investment adviser | |
| Austin, TX 78738 | Treasurer | | to the Fund, since 2012. | |
| (1980) | | | Senior Analyst, Highside | |
| | | | Capital Management, 2003– | |
| | | | 2012. Investment Banking | |
| | | | Analyst, Salomon Smith | |
| | | | Barney, 2002–2003. BA from | |
| | | | University of Virginia, 2002. | |
| | | | | |
| David D. Jones, Esq. | Secretary, | N/A | Co-founder and | None. |
| 422 Fleming Street, | Chief | | Managing Member of | |
| Suite 7 | Compliance | | Drake Compliance LLC | |
| Key West, FL 33040 | Officer; | | (compliance consulting), | |
| (1957) | Anti-Money | | since 2004. Founder and | |
| | Laundering | | controlling shareholder of | |
| | Officer | | David Jones & Associates | |
| | | | P.C. (law firm), since 1998. | |
| | | | BA in Economics, University | |
| | | | of Texas at Austin, 1983. | |
| | | | JD with honors, St. Mary’s | |
| | | | University School of Law, 1994. | |
| * | Brian Yacktman and William Kruger are considered to be an “interested persons” of the Trust, a term that is defined in the 1940 Act. Mr. Yacktman and Mr. Kruger are interested persons because: (1) each is an officer of the Trust; and (2) each is the owner of the investment adviser to the Fund. |
Each trustee holds office for an indefinite term and until the earlier of: the Trust’s next meeting of shareholders and the election and qualification of his successor; or until the date a trustee dies, resigns or is removed in accordance with the Trust’s Declaration of Trust and By-laws. Each officer holds office at the pleasure of the Board and serves for a period of one year, or until his successor is duly elected and qualified.
| FACTS | WHAT DOES YCG FUNDS DO WITH YOUR PERSONAL INFORMATION? |
| | |
| WHY? | Financial companies choose how they share your personal information. Federal law gives consumers the right to limit some, but not all information sharing. Federal law also requires us to tell you how we collect, share, and protect your personal information. Please read this Notice carefully to understand what we do. |
| | |
| WHAT? | The types of information we collect and share depend on the product or service you have with us. This information can include: |
| | • Social Security Number |
| | • Assets |
| | • Retirement Assets |
| | • Transaction History |
| | • Checking Account History |
| | • Purchase History |
| | • Account Balances |
| | • Account Transactions |
| | • Wire Transfer Instructions |
| | When you are no longer our customer, we continue to share your information as described in this Notice. |
| | |
| HOW? | All financial companies need to share your personal information to run their everyday business. In the section below, we list the reasons financial companies can share their customers’ personal information; the reasons YCG Funds chooses to share; and whether you can limit this sharing. |
| Reasons we can share your personal information. | Does YCG Funds | Can you limit |
| | Trust share? | this sharing? |
| For our everyday business purposes— | | |
| Such as to process your transactions, maintain | | |
| your account(s), respond to court orders and | Yes | No |
| legal investigations, or report to credit bureaus. | | |
| For our marketing purposes— | | |
| to offer our products and services to you. | No | We don’t share |
| For joint marketing with other financial | | |
| companies | No | We don’t share |
| For our affiliates’ everyday business purposes— | | |
| information about your transactions and experiences. | Yes | No |
| For our affiliates’ everyday business purposes— | No | We don’t share |
| information about your creditworthiness | | |
| For non-affiliates to market to you | No | We don’t share |
| Questions? | Call 855-444-YCGF (9243) |
Privacy Notice (continued)
| Who we are | |
| Who is providing | YCG Funds |
| this Notice? | YCG, LLC (investment adviser to the Trust) |
| | US Bancorp Fund Services, LLC (administrator to the Fund) |
| | |
| What we do | |
| How does | To protect your personal information from unauthorized |
| YCGFunds | access and use, we use security measures that comply |
| protect | with federal law. These measures include computer safeguards |
| your personal | and secured files and buildings. |
| information? | |
| | Our service providers are held accountable for adhering to strict |
| | policies and procedures to prevent any misuse or your nonpublic |
| | personal information. |
| | |
| How does | We collect your personal information, for example, when you |
| YCG Funds | • Open an account |
| collect your | • Provide account information |
| personal | • Give us your contact information |
| information? | • Make deposits or withdrawals from your account |
| | • Make a wire transfer |
| | • Tell us where to send the money |
| | • Tell us who receives the money |
| | • Show your government-issued ID |
| | • Show your drivers’ license |
| | We also collect your personal information from other companies. |
| Why can’t I | Federal law gives you the right to limit only: |
| limit all sharing? | • Sharing for affiliates’ everyday business purposes—information about your creditworthiness. |
| | • Affiliates from using your information to market to you. |
| | • Sharing for non-affiliates to market to you |
| | State laws and individual companies may give you additional rights to limit sharing. |
| | |
| Definitions | |
| Affiliates | Companies related by common ownership or control. They can be financial and nonfinancial companies. |
| | |
| | YCG, LLC, is an affiliate of YCG Funds. |
| Nonaffiliates | Companies not related by common ownership or control. They can be financial and non-financial companies. |
| | |
| | • YCG Funds does not share with non-affiliates so they can market to you. |
| Joint marketing | A formal agreement between non-affiliated financial companies that together market financial products to you. |
| | |
| | • YCG Funds does not jointly market. |
For Fund information and shareholder services, call
1-855-444-9243
web site: www.ycgfunds.com
YCG Funds
c/o U.S. Bancorp Fund Services, LLC
P.O. Box 701
Milwaukee, WI 53201-0701
Investment Adviser
YCG, LLC
11701 Bee Cave Road, Suite 217
Austin, TX 78738
Chief Compliance Officer
Drake Compliance, LLC
422 Fleming Street, Suite 7
Key West, FL 33040
Legal Counsel
Kaplan, Voekler, Cunningham and Frank PLC
7 East 2nd Street
Richmond, VA 23224
Independent Registered Public Accounting Firm
Cohen Fund Audit Services, Ltd.
1350 Euclid Avenue, Suite 800
Cleveland, OH 44115
Transfer Agent, Fund Accountant, and Fund Administrator
U.S. Bancorp Fund Services, LLC
615 East Michigan Street
Milwaukee, WI 53202
Custodian
U.S. Bank, N.A.
1555 North RiverCenter Drive, Suite 302
Milwaukee, WI 53212
Distributor
Quasar Distributors, LLC
615 East Michigan Street
Milwaukee, WI 53202
This report is submitted for the general information of shareholders of the
YCG Enhanced Fund. It is not authorized for distribution to prospective investors unless accompanied or preceded by an effective Prospectus for the Fund, which contains more information concerning the Fund’s investment policies, as well as fees and expenses and other pertinent information. Read the Prospectus carefully.
Item 2. Code of Ethics.
The registrant has adopted a code of ethics that applies to the registrant’s principal executive officer and principal financial officer. The registrant has not made any amendments to its code of ethics during the period covered by this report. The registrant has not granted any waivers from any provisions of the code of ethics during the period covered by this report.
A copy of the registrant’s Code of Ethics is filed herewith.
Item 3. Audit Committee Financial Expert.
The registrant’s board of trustees has determined that it does not have an audit committee financial expert serving on its audit committee. At this time, the registrant believes that the experience provided by each member of the audit committee together offers the registrant adequate oversight for the registrant’s level of financial complexity.
Item 4. Principal Accountant Fees and Services.
The registrant has engaged its principal accountant to perform audit services, audit-related services, tax services and other services during the past fiscal year. “Audit services” refer to performing an audit of the registrant's annual financial statements or services that are normally provided by the accountant in connection with statutory and regulatory filings or engagements for those fiscal years. “Audit-related services” refer to the assurance and related services by the principal accountant that are reasonably related to the performance of the audit. “Tax services” refer to professional services rendered by the principal accountant for tax compliance, tax advice, and tax planning. The following table details the aggregate fees billed or expected to be billed for the last fiscal year for audit fees, audit-related fees, tax fees and other fees by the principal accountant.
| | FYE 11/30/2012 | FYE 11/30/2013 |
| Audit Fees | N/A | $13,000 |
| Audit-Related Fees | N/A | $0 |
| Tax Fees | N/A | $2,500 |
| All Other Fees | N/A | $0 |
The audit committee has adopted pre-approval policies and procedures that require the audit committee to pre-approve all audit and non-audit services of the registrant, including services provided to any entity affiliated with the registrant.
There were no services that were approved applicable to non-audit services pursuant to waiver of pre-approval requirement.
Item 5. Audit Committee of Listed Registrants.
Not applicable to registrants who are not listed issuers (as defined in Rule 10A-3 under the Securities Exchange Act of 1934).
Item 6. Investments.
Schedule of Investments is included as part of the report to shareholders filed under Item 1 of this Form.
Item 7. Disclosure of Proxy Voting Policies and Procedures for Closed-End Management Investment Companies.
Not applicable to open-end investment companies.
Item 8. Portfolio Managers of Closed-End Management Investment Companies.
Not applicable to open-end investment companies.
Item 9. Purchases of Equity Securities by Closed-End Management Investment Company and Affiliated Purchasers.
Not applicable to open-end investment companies.
Item 10. Submission of Matters to a Vote of Security Holders.
Not Applicable.
Item 11. Controls and Procedures.
| (a) | The Registrant’s President and Treasurer have reviewed the Registrant's disclosure controls and procedures (as defined in Rule 30a-3(c) under the Investment Company Act of 1940 (the “Act”)) as of a date within 90 days of the filing of this report, as required by Rule 30a-3(b) under the Act and Rules 13a-15(b) or 15d-15(b) under the Securities Exchange Act of 1934. Based on their review, such officers have concluded that the disclosure controls and procedures are effective in ensuring that information required to be disclosed in this report is appropriately recorded, processed, summarized and reported and made known to them by others within the Registrant and by the Registrant’s service provider. |
| (b) | There were no changes in the Registrant's internal control over financial reporting (as defined in Rule 30a-3(d) under the Act) that occurred during the second fiscal quarter of the period covered by this report that has materially affected, or is reasonably likely to materially affect, the Registrant's internal control over financial reporting. |
Item 12. Exhibits.
| (a) | (1) Any code of ethics or amendment thereto, that is the subject of the disclosure required by Item 2, to the extent that the registrant intends to satisfy Item 2 requirements through filing an exhibit. Filed herewith. |
(2) A separate certification for each principal executive and principal financial officer pursuant to Section 302 of the Sarbanes-Oxley Act of 2002. Filed herewith.
(3) Any written solicitation to purchase securities under Rule 23c-1 under the Act sent or given during the period covered by the report by or on behalf of the registrant to 10 or more persons. Not applicable to open-end investment companies.
| (b) | Certifications pursuant to Section 906 of the Sarbanes-Oxley Act of 2002. Furnished herewith. |
SIGNATURES
Pursuant to the requirements of the Securities Exchange Act of 1934 and the Investment Company Act of 1940, the registrant has duly caused this report to be signed on its behalf by the undersigned, thereunto duly authorized.
(Registrant) YCG Funds
By (Signature and Title)*/s/ Brian A. Yacktman
Brian A. Yacktman, President
Date 01/24/2014
Pursuant to the requirements of the Securities Exchange Act of 1934 and the Investment Company Act of 1940, this report has been signed below by the following persons on behalf of the registrant and in the capacities and on the dates indicated.
By (Signature and Title)*/s/ Brian A. Yacktman
Brian A. Yacktman, President
Date 01/24/2014
By (Signature and Title)* /s/ Will D. Kruger
Will D. Kruger, Treasurer
* Print the name and title of each signing officer under his or her signature.