| | Annual Report | |
| | November 30, 2016 | Ticker Symbol: YCGEX |
YCG Enhanced Fund
MESSAGE TO SHAREHOLDERS
(Unaudited)
Dear Fellow Shareholder:
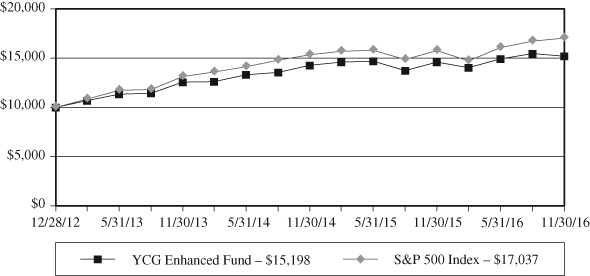
From its inception on 12/28/2012 to 11/30/2016, the YCG Enhanced Fund achieved an annualized total net return of 11.26% versus a 14.55% return for the S&P 500 Index.
Performance data quoted represents past performance and does not guarantee future results. Investment returns and principal value will fluctuate, and when sold, may be worth more or less than their original cost. The Fund imposes a 2.00% redemption fee on shares held less than 90 calendar days. Performance data current to the most recent month end may be obtained by calling 1-855-444-9243. The Gross Expense Ratio is currently 1.35%.
For the fiscal year ending November 30, 2016, the YCG Enhanced Fund achieved a total net return of 4.11%. During the same time period, the S&P 500 Index had a total return of 8.06%. The Fund’s top five equity winners and top five equity losers during this period were as follows:
| TOP FIVE EQUITY | TOP FIVE EQUITY |
| WINNERS | LOSERS |
| Aon PLC | Nestle SA – ADR |
| Procter & Gamble Co. | Unilever NV – ADR |
| The Hershey Co. | Nike, Inc. – Class B |
| The Charles Schwab Corp. | CVS Health Corp. |
| MSCI, Inc. | Express Scripts Holding Co |
The top 5 equity winners and equity losers are determined based on a ranking of the dollar gains and losses of all the equity securities owned in the portfolio over the period specified above. This calculation excludes the portfolio’s options positions, which may have experienced a gain or a loss during the period specified. Additionally, the fund seeks to maximize long term capital appreciation with reasonable investment risk. We believe that one year is too short a period to accurately assess the soundness of our investment strategy, and, thus, we try not to draw too many conclusions from the chart above. Instead, we evaluate ourselves by the fund’s performance over a full economic cycle, which we define as a period that includes both a recession and an economic expansion.
During the last fiscal year, despite a uniquely dysfunctional election season, the S&P 500 generated a solid 8.06% gain. While the randomness of short-term market movements clearly could have yielded a different result, we are nevertheless amused by the apt metaphor that this turn of events offers up. In the face of considerable uncertainty and numerous problems in both the world and the United States, the collective efforts of humanity to better their circumstances moved society’s wealth forward. Taking a longer-term view, this pattern is even clearer, with the average human living a far better life than at any time in the history of the world despite our
YCG Enhanced Fund
civilization having encountered wars, famines, plagues, genocides, and natural disasters along the way to today’s exalted position.
But perhaps this trend is at an end. In many ways, today’s problems are some of the gravest we’ve ever faced. Forget about the election. The risks of nuclear terrorism and climate change are commonly seen as both devastating and completely intractable. And if we survive these dual threats, antibiotic resistant super-bacteria and animal-hopping viruses are waiting in the wings to decimate us. Assuming we somehow dodge every one of these potential catastrophes, humankind will still face inevitable decreases in standard of living as our once-in-history discovery of fossil fuels burns away over time. So, is all lost? Should we just accept that our best days are behind us, as 56% of Americans resolutely believe?1 Before we get too far into our planning process, investment and otherwise, for this new reality, let’s take a trip through time to England around the turn of the 19th century, when a learned man of that age was wrestling with a similar problem.
Malthusian Catastrophe?
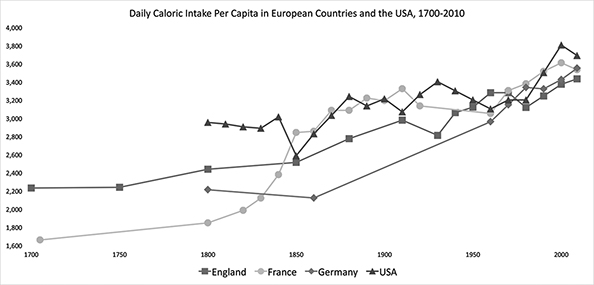
Thomas Malthus was an English cleric and scholar who had graduated with honors from Cambridge with a degree in mathematics. A brilliant man, Malthus also excelled in English declamation, Latin, and Greek and was eventually admitted to the most prestigious scientific organization in the world, The Royal Society, members of which have included Isaac Newton, Robert Hooke, and Stephen Hawking. Wanting to put his talents to good use and noticing the improved standard of living of his time, he set about analyzing the sustainability of this improvement in the face of England’s growing population. In 1798, using his impressive mathematical skills and substantial analytical rigor, Thomas Malthus wrote “An Essay on the Principle of Population,” in which he argued that population grows geometrically and food arithmetically. Therefore, he asserted, both the country’s and the world’s populations would soon outstrip their food supplies, leading to mass starvation and abject poverty. Like today’s dire prognostications, Malthus’s argument was quite convincing to many of his contemporaries. Fortunately for us, it ultimately proved spectacularly incorrect.
As you can see in the chart below, daily caloric intake per capita in Germany, France, England, and the United States is up by an average of roughly 50% since Malthus’s prediction despite dramatic increases in the populations2 of these countries.
_______________
1 | See http://money.cnn.com/2016/01/28/news/economy/donald-trump-bernie-sanders-us-economy/. |
2 | The USA’s population rose from 5 million in 1800 to 324 million today. Over the same time period, England, Malthus’s country of origin, increased its population from 8 million to 55 million, Germany increased its population from 22 million to 81 million, and France increased its population from 30 million to 65 million. See https://en.wikipedia.org/wiki/Demography_of_the_United_States, http://ukpopulation2016.com/england, https://en.wikipedia.org/wiki/Demography_of_England, http://www.populstat.info/Europe/germanyc.htm, http://www.worldometers.info/world-population/germany-population/, and https://en.wikipedia.org/wiki/Demographics_of_France. |
YCG Enhanced Fund
Source: https://ourworldindata.org/food-per-person/
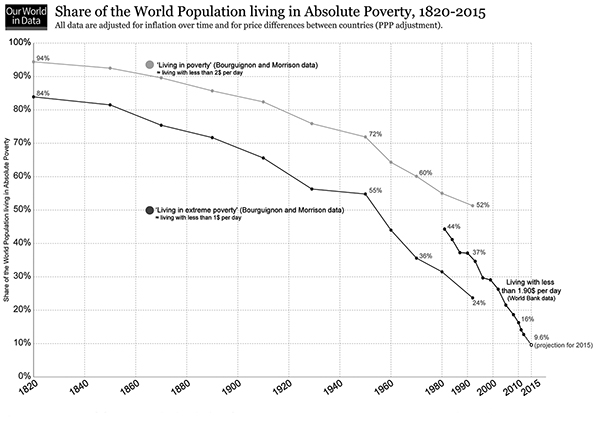
Worldwide, the picture is even more mind-blowing:
Data sources: Up to 2015 OurWorldInData series based on UN and HYDE. Projections for 2015 to 2100: UN Population Division (2015) – Medium Variant. The data visualization is taken from OurWorldinData.org. There you find the raw data and more visualizations on this topic.
Licensed under CC-BY-SA by the author Max Roser.
YCG Enhanced Fund
Data sources: 1820-1992 Bourguignon and Morrison (2002) – Inequality among World Citizens, In The American Economic Review; 1981-2015 World Bank (PovcalNet). The interactive data visualisation is available at OurWorldinData.org. There you find the raw data and more visualisations on this topic.
Licensed under CC-BY-SA by the author Max Roser.
In what is clearly one of the world’s greatest achievements, while the world population has grown from one billion to seven billion since Malthus wrote his essay, absolute poverty levels (defined as living with less than a $1.90 a day) have decreased from roughly 90% of the world population to roughly 10% today.
What Malthus Missed
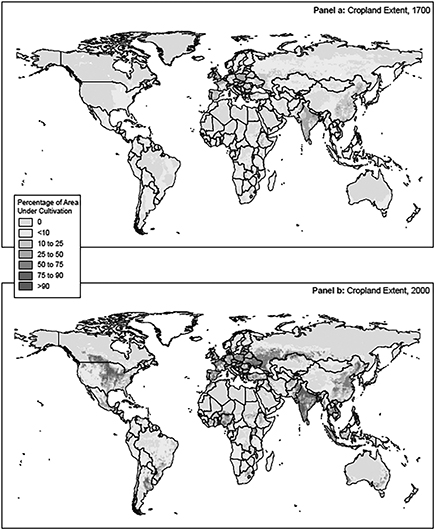
How could Thomas Malthus have gotten this prediction so wrong? He was clearly correct about population growing geometrically, though, contrary to his expectations, the growth rate has slowed over time as many families have freely chosen to have fewer children. However, he completely misjudged humanity’s ability, through innovation, to increase food production, which also has gone up geometrically, but at a much faster rate than population. This rapid increase in food production is a result of 1) huge improvements in yield per acre of cropland and 2) increases in total cropland.
YCG Enhanced Fund
YCG Enhanced Fund
Putting numbers to this point using the charts above, we estimate that, while population has increased seven-fold since 1800, food production has increased by a staggering twenty-fold, made up of a ten-fold improvement in yield per acre and a two-fold improvement in the amount of cropland.3 In other words, food production has grown at a roughly three times faster rate than population.
Can Innovation Solve Today’s Problems?
While this story is certainly a hopeful one, should this example really assuage our concerns about today’s problems? Aren’t today’s problems much more complex? Won’t they require even more rapid innovation and knowledge accumulation than we achieved in the past? While it is true that the problems of today are more complex than ever, we think modern Malthusians are vastly underestimating both the duration and the magnitude of humanity’s ability to improving its living standards. In our view, they’ve fundamentally misunderstood 1) the total amount of energy and resources available to us if we just have the knowledge to tap into them and 2) the rate at which new knowledge grows relative to the population.
Total Amount of Energy and Resources Available to Us
The first potential constraint on humanity’s ability to improve its living standards is the total amount of energy and resources available. We believe the available amount is far greater than most people realize, as can be seen by looking at the energy potential of the sun, the water resources at our disposal, and the percentage of the earth’s landmass that humans currently inhabit.
Energy is the most important problem that humanity must solve. The discovery of fossil fuels powered our industrial revolution and was a major factor in lifting all but 10% of the world out of poverty. However, fossil fuels are a nonrenewable, scarce resource and, if an alternative power source is not found, will deplete to zero over time. Fortunately, the sun can provide a readily available energy alternative with vastly greater potential than fossil fuels have ever possessed. Just how much greater? Well, to put it in perspective, the earth absorbs more energy from the sun in an hour than all of humanity uses in a year.4 And the bonus is that it’s clean and will last for at least another 5 billion years.5
Once we unlock the power of the sun, all our other resource problems become much more manageable since energy is the key to making other resources available and useful to us. For example, many areas of the world have potable water shortages. However, this problem is not due to a lack of water on planet Earth. Three-quarters
_______________
3 | Yield per acre and cropland charts are reproduced from The Infinite Resource by Ramez Naam and https://ourworldindata.org/land-use-in-agriculture/, respectively. |
4 | See https://en.wikipedia.org/wiki/Solar_energy and https://en.wikipedia.org/wiki/World_energy_consumption. |
5 | See http://www.bbc.com/earth/story/20150323-how-long-will-life-on-earth-last. |
YCG Enhanced Fund
of the earth’s surface is covered with water.6 However, less than 2.75% is fresh water and less than 0.75% is fresh groundwater.7 We already know how to desalinate and treat water to make it potable, but the process is currently too expensive because of the amount of energy it requires. Therefore, cheap and abundant energy fixes our potable water problem, even without further innovations in the desalination process. Since all elements can be made into all other elements with enough energy, every resource follows this same logic. Cheap and abundant energy, combined with the knowledge of how to transform common elements into uncommon ones, fixes our resource problems.
What about the much more basic problem of humans just running out of room? Well, because most people prefer to live in cities, only 10% of the world’s land surface holds 95% of the world’s population.8 In the countries where more people live in rural areas, the inhabitants generally exhibit the same preference as the rest of the world and are quickly urbanizing. Thus, humanity has plenty of room in which to expand if needed. Moreover, even cities have the potential to house significantly larger populations since a huge percentage of these cities’ land is devoted to parking spaces and streets (about fifty percent on average and sometimes as much as two-thirds).9 Given that today’s cars are parked 95% of the time,10 autonomous driving and ridesharing could drastically reduce the need for automobile-related land.
Rate at which New Knowledge Grows Relative to the Population
The second potential constraint on humanity’s ability to improve its living standards is the rate at which new knowledge grows relative to the population. We believe knowledge growth is extremely likely to outstrip population growth and that knowledge’s advantage could continue virtually indefinitely. To understand why, let’s compare their growth functions. Population growth is a function of the number of people born and the number of people who die. Knowledge growth, by contrast, is a function of innovation (i.e. the creation and mixing of ideas), which, in turn, is a function of the number of humans, their idea generating capabilities, and their connections with one another. While it may not yet be apparent, the key difference between these growth functions is the “connections” variable. A concrete example will hopefully illuminate this difference.
For simplicity’s sake, let’s assume a society in which each person can come up with one idea and each person can mix their idea with another’s to create a new idea. So, in a society of 1 person, the number of ideas is 1 + 0 mixings, which equals 1 total
_______________
6 | See http://water.usgs.gov/edu/earthhowmuch.html. |
7 | See https://en.wikipedia.org/wiki/Fresh_water. |
8 | See https://www.quora.com/Philosophy-of-Everyday-Life-What-percentage-of-the-worlds-land-is-populated-by-humans. |
9 | See http://www.planetizen.com/node/72454/land-vehicles-or-people, http://oldurbanist.blogspot.com/2011/12/we-are-25-looking-at-street-area.html, and http://www.vtpi.org/land.pdf. |
10 | See http://fortune.com/2016/03/13/cars-parked-95-percent-of-time/. |
YCG Enhanced Fund
idea. In a society of 2 people, the number of ideas is 2 + 1 mixing, which equals 3 total ideas. In a society of 3 people, the number of ideas is 3 + 3 mixings, which equals 6 ideas, and, in a society of 4 people, the number of ideas is 4 + 6 mixings, which equals 10 total ideas. As you can see, the rate of growth of people is fast, but the rate of growth of ideas is faster. And that is because of rapid growth in mixing possibilities as the population gets larger. Even though the number of ideas per person (1) didn’t change and thus the total number of non-mixed ideas grew in line with the population, the number of mixing possibilities rapidly balloons to much greater than the population.
Scientists have studied this phenomenon and come up with a formula called Metcalfe’s law11 that allows us to figure out how many mixings are possible as the population gets larger. The numbers become large very quickly. At 100 people, the number of ideas in the society would be 100 (1 per person) plus 4,950 mixing possibilities, which equals 5,050 total ideas. In a world of 7 billion people (the current number on planet Earth today), the number of idea possibilities is mind-blowing at 2.45^19. Basically, the mixing possibilities grow so exponentially that we’ve gone from a scenario of 1 person in the world in which there is 1 idea per person to a society of 100 people in which there are 50.5 ideas per person to a society of 7 billion people in which there are 3.5 billion ideas per person. Not all these ideas are good, of course, but the good ones almost always spread since knowledge really is power. Thus, it should be no surprise that humanity’s standard of living has improved over time since the number of ideas per person, which include everything from ideas about how to cheaply feed, clothe, and shelter ourselves to ideas about how to govern ourselves to ideas about how to achieve joy, has also been rapidly increasing.
What’s perhaps most amazing about this exercise is that it’s extremely conservative in its assessment of society’s idea generation capability because it doesn’t assume any mixing of mixed ideas (i.e. remixing). But, in the real world, we CAN remix ideas. Thus, in the society of 100 people that we mentioned earlier, they created 4,950 ideas by mixing their 100 ideas. In a world with remixing capabilities, they can mix those new 4,950 ideas with each other and with the 100 original ideas. And then, they can take the resulting ideas from those mixtures and remix them, leading to an unlimited combinatorial potential of ideas, which is why the information age has been so powerful. As more and more people get educated12 and connected13 and as more and more computers are built to scour the world for ideas and to remix them, the number of ideas in the world is exploding. In the next section of this letter, we’ll look at the investing implications of this idea explosion.
_______________
11 | See https://en.wikipedia.org/wiki/Metcalfe%27s_law. |
12 | See https://ourworldindata.org/global-rise-of-education. |
13 | See https://ourworldindata.org/internet. |
YCG Enhanced Fund
Investing Implications
First, the standard of living of the average person has gotten massively better over the course of history, and innovation is the driving force behind this change. Because of the total resources and energy available to us, the unlimited combinatorial power of ideas, and the increasing population, education, and connectivity of the world, we believe growth in worldwide wealth per capita is very likely to continue to increase for a long time and potentially at a faster and faster rate. Thus, we believe that the rewards from owning reasonably-priced businesses that can benefit from long term worldwide wealth per capita growth are likely to be quite substantial.
Second, and paradoxically, the difficulty of figuring out which businesses will potentially benefit from this growth has probably never been higher. The average lifespan of an S&P 500 company has already dropped from 67 years in the 1920s to 15 years today,14 and today’s rapid acceleration in idea generation may lead to even faster and more profound changes in our economy than we saw over the last one hundred years. Thus, we as investors need to put more and more emphasis on investing in businesses whose economics are least likely to change for the worse in the face of this rapid technological progress, and our study of the history of innovation can help us to identify these businesses.
Innovation and Declining Prices
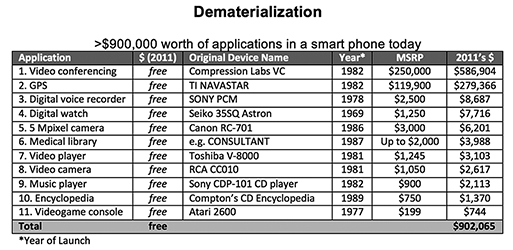
Warren Buffett was once quoted as saying, “The single most important decision in evaluating a business is pricing power. If you’ve got the power to raise prices without losing business to a competitor, you’ve got a very good business. And if you have to have a prayer session before raising the price by 10 percent, then you’ve got a terrible business.”15 We largely agree with this sentiment. What’s interesting about innovation is that it works directly contrary to these goals. As we saw in our analysis of food production per acre at the beginning of this letter, new ideas enable us to get more and more stuff out of the same amount of resources. The inverse of this statement is that the same amount of stuff costs us less in resources (money, time, labor). Thus, almost everything we buy is getting cheaper to produce over time. Furthermore, if idea generation is speeding up, then everything is probably getting cheaper to produce at an accelerating rate. Peter Diamandis, the founder of the X Prize Foundation and Singularity University, recently wrote an article16 that describes this process as demonetization. He begins with a fascinating chart (reproduced below) that outlines how many formerly expensive products are now essentially free on your smartphone.
_______________
14 | See http://www.bbc.com/news/business-16611040. |
15 | See http://www.businessinsider.com/warren-buffett-pricing-power-beats-good-management-berkshire-hathaway-2011-2. |
16 | See http://singularityhub.com/2016/07/18/why-the-cost-of-living-is-poised-to-plummet-in-the-next-20-years/. |
YCG Enhanced Fund
While some of the businesses that sold these products have been able to innovate fast enough to replace the revenues lost as a result of these price declines, many others are far less profitable than they once were and, in some cases, are bankrupt. Unfortunately, it’s very difficult to predict which companies will be the successful innovators in advance.
In the remainder of Diamandis’s article, he predicts that future demonetization could wreak havoc on many large industries such as energy, transportation, media, and healthcare. Based on our study of innovation, we agree.
For instance, while our discussion earlier in the letter about using sunlight to power human civilization may have seemed hopeful but ultimately unrealistic, the data suggests not only that cheap and abundant solar power is possible, but that it’s possible now. In fact, the cheapest solar plants are now cheaper than all other energy plants, and not by a little. They’re so inexpensive that the cheapest solar plant, which includes all the property, equipment and people required to run the plant, is now cheaper than traditional power plants’ fossil fuel cost alone.17 If costs keep falling, which we have every reason to expect they will, solar could dramatically disrupt the utility industry. Additionally, electric vehicles, which are basically batteries on wheels, are already a reality and their costs are declining so rapidly that they may be cheaper than the cheapest new internal combustion vehicle by 2030.18 This change alone could be quite damaging to the profit models of the automobile, auto parts, trucking, and auto insurance industries. However, combined with autonomous cars and ridesharing, it could be absolutely devastating. Finally, the digitalization of media is leading to far more videos, articles, and songs being produced than our finite attention could ever consume, and most of this media is free, having been
_______________
17 | See http://rameznaam.com/2016/09/21/new-record-low-solar-price-in-abu-dhabi-costs-plunging-faster-than-expected/. |
18 | See https://www.youtube.com/watch?v=EECxyL4gCEY. Tony Seba, a Stanford University instructor, is even more optimistic about electric vehicle costs, as can be seen here: https://www.youtube.com/watch?v=Kxryv2XrnqM. |
YCG Enhanced Fund
generated by users not for money, but for fun. All these changes are arguably happening now, but, in the future, the disruption could be even more extreme. Significantly improved artificial intelligence, virtual reality, and 3-D printing could transform society to a far greater degree than even the case we’ve laid out here.
So, in a world in which wealth per capita is increasing at the same time that information and stuff are becoming ever cheaper and more abundant, which businesses are likely to pass Warren Buffett’s pricing power test? As has always been the case, people are willing to pay for the scarce and desired resource. Increasingly, this scarce resource is our time. There are only so many hours in a day to allocate and the ways to allocate these hours are endless and growing exponentially.
Thus, we think one category of business models whose economics are likely to stay the same or improve is businesses focused on value-added filtering, which we define as those selling filtering products that are cheap relative to a person’s or business’s disposable income and relative to the value the filter provides. We can already see the shift in economic value added in areas like media. Newspapers, magazines, and movie studios are finding it increasingly difficult to monetize video and word content, but filters such a Facebook and Google have been generating huge profits because, at the cost of a couple of ads or a few dollars, they allow us to efficiently and quickly find content relevant to us. In a world with an increasingly diverse and complex set of companies and risks, brokers such as Aon, Goldman Sachs, and Schwab perform this same filtering function for buyers and sellers of insurance and financial products. Additionally, many cheap, disposable, one-hundred-year-old products like Colgate toothpaste, Frito-Lay chips, Nestle chocolates, and Clorox cleaning products should continue to thrive because, for only a few cents, they serve as time-saving safety and efficacy filters. National banks such as Wells Fargo and JP Morgan save customers time with superior technology, vast branch networks, broad product offerings, and reputations for financial soundness. Mastercard and Visa serve as low-cost fraud and convenience filters to seamlessly conduct transactions. Finally, in a world of increasing globalization and an expanding circle of human connections, many people use luxury goods as a filter to identify desirable business and life partners. Unlike other products, however, luxury goods have the unique and favorable property that their value is positively correlated with their price. Thus, in a world of increasing wealth per capita, they will only continue to serve as useful filters if their prices increase as well, meeting Warren Buffett’s pricing power test in spades.
Another category that we believe possesses pricing power is businesses that sell unique and hard-to-replicate but widely desired experiences. One of the clearest examples of this transition from stuff to experiences is the music industry. It is much more difficult for artists and businesses to generate revenue from selling songs, but artists and companies like Live Nation can still make a lot of money on concerts. Additionally, the average movie’s profitability appears to be declining over time, whereas theme parks where beloved characters come alive continue to successfully
YCG Enhanced Fund
raise prices over time. This experiential halo effect even ends up benefiting the beloved characters’ movies. The movies that have experienced the least pricing pressure appear to be the ones connected to characters with long cultural histories, with opportunities through toys and collectibles to integrate them into a fan’s life, and with experiences where the characters come alive. Likewise, many branded consumer goods, such as cola, alcohol, chocolate, coffee, shoes, and clothes, connect people to their tribe in a way that makes them loyal to the products. These loyalties can sometimes be quite fierce and have proved remarkably persistent over time because of their connection with social status, which leads us to luxury goods. Besides serving as filters, luxury goods connect their owners to culturally significant places and people while also invoking pride in a very satisfying way. These attributes add to pricing power and enable them to charge far more than other products without these associations. Shoes are cheap and abundant, but, for many people, feeling connected to a favorite basketball player or team is worth a hefty price premium. There are many affordable jewelry options, but Cartier jewelry connects its owners with Paris from 1850 to the present and with Grace Kelly and other royalty. Additionally, many people who receive these brands as gifts are deeply moved since they see them as costly and thus hard-to-fake signals of the esteem in which they are held by the gift-giver.
Before proceeding to our concluding remarks, we’d like to offer a few caveats to this pricing power analysis. First, the list of businesses above is certainly not exhaustive. There are many other business models that will survive and prosper in the future, some of whose competitive advantages we will be able to understand and some of whose we won’t. Second, we occasionally invest in businesses with more future uncertainty provided they are sufficiently inexpensive relative to other investment alternatives. After all, our goal is to generate positive risk-adjusted returns, and the price paid for a business is clearly one of the most important factors in achieving this objective. These few caveats aside, we nevertheless believe that accelerating technological change is making it increasingly difficult to achieve attractive investment returns by investing in businesses with declining or questionable pricing power, and we hope our analysis of innovation and its investing implications provides a clearer picture of the types of business that we believe meet our pricing power test.
Concluding Remarks
Because the salacious, the sadistic, and the scary tap into deep primal needs and fears, they are more attention-demanding than their opposites. Media coverage further exacerbates the mindshare that these events commandeer. Since our worldviews and “risk maps” are strongly correlated with mindshare, it’s no wonder most of us are negative on the future of the world.19 There is no doubt that the world has problems. Many of these problems are more complex, alarming, and seemingly
_______________
19 | See http://money.cnn.com/2016/01/28/news/economy/donald-trump-bernie-sanders-us-economy/. |
YCG Enhanced Fund
intractable than ever. However, in focusing so much on our problems, we’re missing the enormous progress that the world has made over time. More importantly, we’re missing that the underlying cause of this progress, the number of new ideas created and put into practice, is far from running out of steam. In fact, innovation is stronger than it’s ever been. Thus, in our view, not only is the world likely to get better in the future, it’s never been more likely to get better. Moreover, we believe it’s more likely than not to get better and better at a faster and faster rate. Finally, while there are risks to today’s businesses from the rapid technological change that this idea explosion drives, there are many opportunities as well. We believe we’ve constructed a portfolio of reasonably priced businesses that are robust to this technological change, and we are working to improve this robustness every day.
As always, please feel free to call us with any questions or concerns, and we thank you for your trust.
Sincerely,
The YCG Team
Past performance does not guarantee future results.
Mutual fund investing involves risk. Principal loss is possible. The Fund is non-diversified, meaning it may concentrate its assets in fewer individual holdings than a diversified fund. Therefore, the Fund is more exposed to individual stock volatility than a diversified fund. The Fund invests primarily in equity securities without regard to market capitalization, thus investments will be made in mid and smaller capitalization companies, which involve additional risks such as limited liquidity and greater volatility. The Fund may also write put options and covered call options on a substantial portion of the Fund’s long equity portfolio, which have the risks of early option contract assignment forcing the Fund to purchase the underlying stock at the exercise price which may be the cause of significant losses due to the failure of correctly predicting the direction of securities prices, interest rates and currency exchange rates. The investment in options is not suitable for all investors. Covered call writing may limit the upside of an underlying security. The Fund may also invest in foreign securities which involve political, economic and currency risks, greater volatility, and differences in accounting methods. Investments in debt securities typically decrease in value when interest rates rise. This risk is usually greater for longer-term debt securities. Investment in lower-rated, non-rated and distressed securities presents a greater risk of loss to principal and interest than higher-rated securities.
Fund holdings and sector allocations are subject to change at any time and should not be considered recommendations to buy or sell any security. Please see the Schedule of Investments in this report for a complete list of Fund holdings.
The S&P 500 Index is a stock market index based on the market capitalizations of 500 leading companies publicly traded in the U.S. stock market. It is not possible to invest directly in an index.
YCG Enhanced Fund
EXPENSE EXAMPLE
For the six months ended November 30, 2016 (Unaudited)
As a shareholder of the YCG Enhanced Fund (the “Fund”), you incur ongoing costs, including management fees and other Fund expenses. If you invest through a financial intermediary, you may also incur additional costs such as a transaction fee charged on the purchase or sale of the Fund or an asset-based management fee. This example is intended to help you understand your ongoing costs (in dollars) of investing in the Fund and to compare these costs with the ongoing costs of investing in other mutual funds.
The Example is based on an investment of $1,000 invested at the beginning of the period and held for the entire period from June 1, 2016 to November 30, 2016.
Actual Expenses
The first line of the table on the next page provides information about actual account values and actual expenses. You may use the information provided in this line, together with the amount you invested, to estimate the expenses that you paid over the period. Simply divide your account value by $1,000 (for example, an $8,600 ending account value divided by $1,000 = 8.6), then multiply the result by the number in the first line under the heading entitled “Expenses Paid During the Period” to estimate the expenses you paid on your account during the period.
Hypothetical Example for Comparison Purposes
The second line of the table on the next page provides information about hypothetical account values and hypothetical expenses based on the Fund’s actual expense ratio and an assumed rate of return of 5% per year before expenses, which is not the Fund’s actual return. The hypothetical account values and expenses may not be used to estimate the actual ending account balance or expenses you paid for the period. You may use this information to compare the ongoing costs of investing in the Fund and other funds. To do so, compare this 5% hypothetical example with the 5% hypothetical examples that appear in the shareholder reports of the other funds.
YCG Enhanced Fund
EXPENSE EXAMPLE (continued)
For the six months ended November 30, 2016 (Unaudited)
Please note that the expenses shown in the table are meant to highlight your ongoing costs only and do not reflect any costs that may be associated with investing in the Fund through a financial intermediary. Therefore, the second line of the table is useful in comparing the ongoing costs only, and will not help you determine the relative total costs of owning different funds. In addition, if any costs associated with investing through a financial intermediary were included, your costs would have been higher.
| | | | Expenses Paid |
| | Beginning | Ending | During Period(1) |
| | Account Value | Account Value | 06/01/16 – |
| | 06/01/2016 | 11/30/16 | 11/30/16 |
| Actual | $1,000.00 | $1,018.20 | $6.00 |
| Hypothetical (5% return | | | |
| before expenses) | 1,000.00 | 1,019.05 | 6.01 |
(1) | Expenses are equal to the Fund’s annualized expense ratio of 1.19%, multiplied by the average account value over the period, multiplied by 183/366 to reflect the period. |
YCG Enhanced Fund
GROWTH OF $10,000 INVESTMENT
(Unaudited)
This chart assumes an initial gross investment of $10,000 made on December 28, 2012 (commencement of the Fund’s operations). Returns shown include the reinvestment of all dividends. Returns shown do not reflect the deductions of taxes that a shareholder would pay on Fund distributions or the redemption of Fund shares. In the absence of fee waivers and reimbursements, when they are necessary to keep expenses at the expense cap, total return would be reduced. Past performance is not predictive of future performance. Investment return and principal value will fluctuate so that your shares, when redeemed, may be worth more or less than original cost. Index returns do not reflect the effects of fees or expenses. It is not possible to invest directly in an index.
| | | | Since Inception |
| | One Year | Three Year | (12/28/2012) |
| Annual Returns | | | |
| YCG Enhanced Fund | 4.11% | 6.53% | 11.26% |
| S&P 500 Index | 8.06% | 9.07% | 14.55% |
| | | | |
YCG Enhanced Fund
TOP TEN EQUITY HOLDINGS
November 30, 2016 (Unaudited)
| | | Percentage of |
| | | Net Assets |
| Colgate-Palmolive Co. | | | 6.92 | % | |
| PepsiCo., Inc. | | | 6.89 | % | |
| Nestle SA – ADR | | | 6.66 | % | |
| Wells Fargo & Co. | | | 5.90 | % | |
| Aon PLC | | | 5.79 | % | |
| MasterCard, Inc. – Class A | | | 5.76 | % | |
| Cie Financiere Richemont SA – ADR | | | 4.82 | % | |
| Unilever NV – ADR | | | 4.36 | % | |
| Procter & Gamble Co. | | | 4.35 | % | |
| MSCI, Inc. | | | 4.14 | % | |
| Total | | | 55.59 | % | |
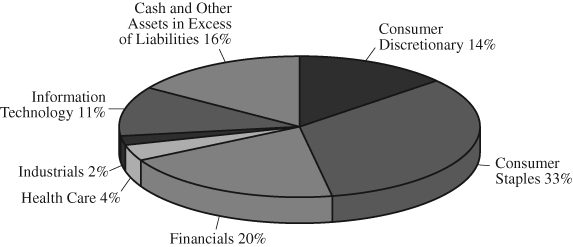
ALLOCATION OF PORTFOLIO HOLDINGS (as a % of net assets)
November 30, 2016 (Unaudited)
For presentation purposes, the Fund has grouped some of the industry categories. For purpose of categorizing securities with Section (8)(b)(1) of the Investment Company Act of 1940, as amended, the Fund uses more specific classifications.
YCG Enhanced Fund
SCHEDULE OF INVESTMENTS
November 30, 2016
| | | Shares | | | Value | |
| COMMON STOCKS – 84.29% | | | | | | |
| | | | | | | |
| Banks – 5.90% | | | | | | |
| Wells Fargo & Co. | | | 122,181 | | | $ | 6,465,819 | |
| | | | | | | | | |
| Beverages – 8.66% | | | | | | | | |
| Coca-Cola Co. | | | 48,319 | | | | 1,949,672 | |
| PepsiCo., Inc. | | | 75,379 | | | | 7,545,438 | |
| | | | | | | | 9,495,110 | |
| | | | | | | | | |
| Capital Markets – 7.26% | | | | | | | | |
| MSCI, Inc. | | | 57,630 | | | | 4,541,244 | |
| The Charles Schwab Corp. | | | 88,200 | | | | 3,409,812 | |
| | | | | | | | 7,951,056 | |
| | | | | | | | | |
| Diversified Financial Services – 1.10% | | | | | | | | |
| Berkshire Hathaway, Inc. – Class B (a) | | | 7,640 | | | | 1,202,842 | |
| | | | | | | | | |
| Food & Staples Retailing – 1.25% | | | | | | | | |
| CVS Health Corp. | | | 17,855 | | | | 1,372,871 | |
| | | | | | | | | |
| Food Products – 7.86% | | | | | | | | |
| Nestle SA – ADR | | | 108,464 | | | | 7,299,627 | |
| The Hershey Co. | | | 13,552 | | | | 1,309,665 | |
| | | | | | | | 8,609,292 | |
| | | | | | | | | |
| Health Care Providers & Services – 3.74% | | | | | | | | |
| Anthem, Inc. | | | 12,969 | | | | 1,848,471 | |
| Express Scripts Holding Co. (a) | | | 29,651 | | | | 2,249,918 | |
| | | | | | | | 4,098,389 | |
| | | | | | | | | |
| Household Products – 11.28% | | | | | | | | |
| Colgate-Palmolive Co. | | | 116,295 | | | | 7,585,923 | |
| Procter & Gamble Co. (b) | | | 57,834 | | | | 4,768,991 | |
| | | | | | | | 12,354,914 | |
| | | | | | | | | |
| Insurance – 5.79% | | | | | | | | |
| Aon PLC | | | 55,570 | | | | 6,340,537 | |
See notes to financial statements.
YCG Enhanced Fund
SCHEDULE OF INVESTMENTS (continued)
November 30, 2016
| | | Shares | | | Value | |
| COMMON STOCKS – 84.29% (continued) | | | | | | |
| | | | | | | |
| IT Services – 9.09% | | | | | | |
| MasterCard, Inc. – Class A | | | 61,780 | | | $ | 6,313,916 | |
| Western Union Co. | | | 173,342 | | | | 3,645,382 | |
| | | | | | | | 9,959,298 | |
| | | | | | | | | |
| Media – 6.08% | | | | | | | | |
| Discovery Communications, Inc. – Class C (a) | | | 112,609 | | | | 2,977,382 | |
| The Walt Disney Co. | | | 14,382 | | | | 1,425,544 | |
| Twenty-First Century Fox, Inc. – Class A | | | 80,555 | | | | 2,264,401 | |
| | | | | | | | 6,667,327 | |
| | | | | | | | | |
| Personal Products – 4.36% | | | | | | | | |
| Unilever NV – ADR | | | 119,899 | | | | 4,775,577 | |
| | | | | | | | | |
| Professional Services – 2.06% | | | | | | | | |
| Verisk Analytics, Inc. (a) | | | 27,234 | | | | 2,262,601 | |
| | | | | | | | | |
| Software – 2.27% | | | | | | | | |
| Microsoft Corp. | | | 41,213 | | | | 2,483,495 | |
| | | | | | | | | |
| Textiles, Apparel & Luxury Goods – 7.59% | | | | | | | | |
| Cie Financiere Richemont SA – ADR | | | 818,239 | | | | 5,277,642 | |
| NIKE, Inc. – Class B | | | 60,701 | | | | 3,039,299 | |
| | | | | | | | 8,316,941 | |
| TOTAL COMMON STOCKS (Cost $78,662,856) | | | | | | | 92,356,069 | |
| Total Investments (Cost $78,662,856) – 84.29% | | | | | | | 92,356,069 | |
| Other Assets in Excess of Liabilities – 15.71% | | | | | | | 17,212,250 | |
| TOTAL NET ASSETS – 100.00% | | | | | | $ | 109,568,319 | |
Percentages are stated as a percent of net assets.
| ADR | American Depositary Receipt |
| (a) | Non-Income Producing. |
| (b) | A portion of this security is pledged as collateral on options written. As of November 30, 2016, the value of this collateral is $2,473,800. |
The Global Industry Classification Standard (GICS) was developed by and/or is the exclusive property of MSCI, Inc. and Standard & Poor Financial Services LLC (“S&P”). GICS is a service mark of MSCI and S&P and has been licensed for use by U.S. Bancorp Fund Services, LLC.
See notes to financial statements.
YCG Enhanced Fund
SCHEDULE OF OPTIONS WRITTEN
November 30, 2016
| | | Contracts | | | Value | |
| CALL OPTIONS | | | | | | |
| Berkshire Hathaway, Inc. – Class B | | | | | | |
| Expiration: March 2017; Exercise Price: $155.00 | | | 76 | | | $ | 55,290 | |
| Discovery Communications, Inc. – Class C | | | | | | | | |
| Expiration: December 2016; Exercise Price: $25.00 | | | 146 | | | | 24,455 | |
| Expiration: December 2016; Exercise Price: $30.00 | | | 142 | | | | 1,775 | |
| Microsoft Corp. | | | | | | | | |
| Expiration: January 2017; Exercise Price: $60.00 | | | 27 | | | | 4,968 | |
| Expiration: February 2017; Exercise Price: $60.00 | | | 20 | | | | 5,500 | |
| PUT OPTIONS | | | | | | | | |
| Anthem, Inc. | | | | | | | | |
| Expiration: December 2016; Exercise Price: $125.00 | | | 46 | | | | 874 | |
| Expiration: January 2017; Exercise Price: $125.00 | | | 4 | | | | 434 | |
| Aon PLC | | | | | | | | |
| Expiration: January 2017; Exercise Price: $110.00 | | | 41 | | | | 6,355 | |
| CVS Health Corp. | | | | | | | | |
| Expiration: February 2017; Exercise Price: $75.00 | | | 116 | | | | 29,000 | |
| Express Scripts Holding Co. | | | | | | | | |
| Expiration: February 2017; Exercise Price: $75.00 | | | 195 | | | | 59,475 | |
| MasterCard, Inc. – Class A | | | | | | | | |
| Expiration: January 2017; Exercise Price: $105.00 | | | 8 | | | | 3,640 | |
| Moody’s Corp. | | | | | | | | |
| Expiration: February 2017; Exercise Price: $105.00 | | | 112 | | | | 72,240 | |
| NIKE, Inc. – Class B | | | | | | | | |
| Expiration: December 2016; Exercise Price: $52.50 | | | 335 | | | | 86,430 | |
| Expiration: December 2016; Exercise Price: $55.00 | | | 131 | | | | 64,583 | |
| Expiration: January 2017; Exercise Price: $50.00 | | | 20 | | | | 3,360 | |
| Expiration: January 2017; Exercise Price: $52.50 | | | 327 | | | | 98,100 | |
| Priceline Group, Inc. | | | | | | | | |
| Expiration: January 2017; Exercise Price: $1,525.00 | | | 8 | | | | 43,200 | |
| The Charles Schwab Corp. | | | | | | | | |
| Expiration: December 2016; Exercise Price: $31.00 | | | 566 | | | | 4,245 | |
| The Walt Disney Co. | | | | | | | | |
| Expiration: December 2016; Exercise Price: $92.50 | | | 16 | | | | 208 | |
| Expiration: January 2017; Exercise Price: $92.50 | | | 81 | | | | 4,455 | |
See notes to financial statements.
YCG Enhanced Fund
SCHEDULE OF OPTIONS WRITTEN (continued)
November 30, 2016
| | | Contracts | | | Value | |
| PUT OPTIONS (continued) | | | | | | |
| Twenty-First Century Fox, Inc. – Class A | | | | | | |
| Expiration: January 2017; Exercise Price: $25.00 | | | 933 | | | $ | 13,995 | |
| Expiration: January 2017; Exercise Price: $26.00 | | | 22 | | | | 605 | |
| Verisk Analytics, Inc. | | | | | | | | |
| Expiration: December 2016; Exercise Price: $80.00 | | | 283 | | | | 10,754 | |
| Total Options Written (Premiums received $853,185) | | | | | | $ | 593,941 | |
See notes to financial statements.
YCG Enhanced Fund
STATEMENT OF ASSETS AND LIABILITIES
November 30, 2016
| ASSETS: | | | |
| Investments, at value (Cost $78,662,856) | | $ | 92,356,069 | |
| Cash | | | 13,295,001 | |
| Cash held as collateral for options written | | | 20,085 | |
| Receivable for Fund shares sold | | | 2,846 | |
| Dividends and interest receivable | | | 257,819 | |
| Deposits with brokers for options written | | | 4,356,422 | |
| Prepaid expenses | | | 33,792 | |
| Total Assets | | | 110,322,034 | |
| | | | | |
| LIABILITIES: | | | | |
| Options written, at value (Premiums received $853,185) | | | 593,941 | |
| Payable for Fund shares redeemed | | | 41,900 | |
| Payable to investment adviser | | | 41,498 | |
| Other accrued expenses | | | 76,376 | |
| Total Liabilities | | | 753,715 | |
| NET ASSETS | | $ | 109,568,319 | |
| | | | | |
| NET ASSETS CONSIST OF: | | | | |
| Capital stock | | $ | 92,068,252 | |
| Accumulated undistributed net investment income | | | 603,540 | |
| Accumulated undistributed net realized gain | | | 2,944,070 | |
| Net unrealized appreciation | | | | |
| Investments | | | 13,693,213 | |
| Written options | | | 259,244 | |
| Total Net Assets | | $ | 109,568,319 | |
| Shares outstanding (unlimited shares of no par value authorized) | | | 7,824,633 | |
| | | | | |
| NET ASSET VALUE, OFFERING AND | | | | |
REDEMPTION PRICE PER SHARE(1) | | $ | 14.00 | |
(1) | A redemption fee of 2.00% is assessed against shares redeemed within 90 days of purchase. See Note 2h. |
See notes to financial statements.
YCG Enhanced Fund
STATEMENT OF OPERATIONS
For the year ended November 30, 2016
| INVESTMENT INCOME: | | | |
Dividend income(1) | | $ | 1,896,166 | |
| Total investment income | | | 1,896,166 | |
| EXPENSES: | | | | |
| Investment advisory fees | | | 1,038,118 | |
| Shareholder Service fees | | | 65,457 | |
| Legal fees | | | 52,083 | |
| Administration fees | | | 50,310 | |
| Compliance fees | | | 49,172 | |
| Transfer agent fees and expenses | | | 34,960 | |
| Federal and state registration fees | | | 33,046 | |
| Accounting fees | | | 28,125 | |
| Audit and tax fees | | | 15,994 | |
| Trustee fees and expenses | | | 15,899 | |
| Custody fees | | | 11,725 | |
| Insurance fees | | | 10,719 | |
| Reports to shareholders | | | 9,605 | |
| Miscellaneous expenses | | | 885 | |
| Total expenses before reimbursements/recoupments | | | 1,416,098 | |
| Expense reimbursement by investment adviser (See Note 5) | | | (123,472 | ) |
| Net Expenses | | | 1,292,626 | |
| NET INVESTMENT INCOME | | | 603,540 | |
| REALIZED AND UNREALIZED GAIN: | | | | |
| Net realized gain on | | | | |
| Payment from affiliate | | | 4,743 | |
| Investments | | | 1,382,508 | |
| Options written | | | 1,557,495 | |
| Total | | | 2,944,746 | |
| Net change in unrealized appreciation on | | | | |
| Investments | | | 858,938 | |
| Options written | | | 49,123 | |
| Total | | | 908,061 | |
| Net realized and unrealized gain on investments | | | 3,852,807 | |
| NET INCREASE IN NET ASSETS | | | | |
| RESULTING FROM OPERATIONS | | $ | 4,456,347 | |
| | | | | |
(1) | Net of $80,267 in foreign withholding taxes. |
See notes to financial statements.
YCG Enhanced Fund
STATEMENTS OF CHANGES IN NET ASSETS
| | | Year Ended | | | Year Ended | |
| | | November 30, 2016 | | | November 30, 2015 | |
| OPERATIONS: | | | | | | |
| Net investment income | | $ | 603,540 | | | $ | 381,885 | |
| Net realized gain on investments | | | | | | | | |
| and options written | | | 2,944,746 | | | | 1,584,959 | |
| Net change in unrealized | | | | | | | | |
| appreciation (depreciation) on | | | | | | | | |
| investments and options written | | | 908,061 | | | | (102,042 | ) |
| Net increase in net assets | | | | | | | | |
| resulting from operations | | | 4,456,347 | | | | 1,864,802 | |
| | | | | | | | | |
| CAPITAL SHARE TRANSACTIONS: | | | | | | | | |
| Proceeds from shares sold | | | 22,418,615 | | | | 13,734,345 | |
| Proceeds from reinvestment of distributions | | | 1,865,833 | | | | 3,414,124 | |
| Redemption fees | | | 2,619 | | | | 2,586 | |
| | | | 24,287,067 | | | | 17,151,055 | |
| Payments for shares redeemed | | | (6,747,857 | ) | | | (10,164,365 | ) |
| Net increase | | | 17,539,210 | | | | 6,986,690 | |
| | | | | | | | | |
| DISTRIBUTIONS TO | | | | | | | | |
| SHAREHOLDERS PAID FROM: | | | | | | | | |
| Net investment income | | | (381,885 | ) | | | (357,083 | ) |
| From net realized gains | | | (1,584,932 | ) | | | (3,066,482 | ) |
| Total dividends and distributions | | | (1,966,817 | ) | | | (3,423,565 | ) |
| | | | | | | | | |
| TOTAL INCREASE IN NET ASSETS | | | 20,028,740 | | | | 5,427,927 | |
| | | | | | | | | |
| NET ASSETS: | | | | | | | | |
| Beginning of year | | | 89,539,579 | | | | 84,111,652 | |
| End of year (including undistributed | | | | | | | | |
| net investment income of | | | | | | | | |
| $603,540 and $381,885) | | $ | 109,568,319 | | | $ | 89,539,579 | |
| | | | | | | | | |
| CHANGES IN SHARES OUTSTANDING: | | | | | | | | |
| Shares sold | | | 1,654,593 | | | | 1,025,463 | |
| Issued in reinvestment of distributions | | | 137,395 | | | | 255,932 | |
| Shares redeemed | | | (490,659 | ) | | | (767,653 | ) |
| Net increase | | | 1,301,329 | | | | 513,742 | |
See notes to financial statements.
YCG Enhanced Fund
FINANCIAL HIGHLIGHTS
For a Fund share outstanding throughout the period
| | | | | | | | | | | | December 28, | |
| | | | | | | | | | | | 2012(1) | |
| | | | | | | | | | | | through | |
| | | Year Ended November 30, | | | November 30, | |
| | | 2016 | | | 2015 | | | 2014 | | | 2013 | |
| NET ASSET VALUE: | | | | | | | | | | | | |
| Beginning of period | | $ | 13.73 | | | $ | 14.00 | | | $ | 12.57 | | | $ | 10.00 | |
| | | | | | | | | | | | | | | | | |
| OPERATIONS: | | | | | | | | | | | | | | | | |
| Net investment income | | | 0.08 | | | | 0.06 | | | | 0.07 | | | | 0.05 | |
| Net realized and unrealized gain | | | | | | | | | | | | | | | | |
| on investment securities | | | 0.48 | | | | 0.24 | | | | 1.61 | | | | 2.52 | |
| Total from investment operations | | | 0.56 | | | | 0.30 | | | | 1.68 | | | | 2.57 | |
| Redemption fee proceeds | | | — | (2) | | | — | (2) | | | — | (2) | | | — | (2) |
| Dividends from net | | | | | | | | | | | | | | | | |
| investment income | | | (0.06 | ) | | | (0.06 | ) | | | (0.08 | ) | | | — | |
| Dividends from net realized gains | | | (0.23 | ) | | | (0.51 | ) | | | (0.17 | ) | | | — | |
| Total distributions | | | (0.29 | ) | | | (0.57 | ) | | | (0.25 | ) | | | — | |
| | | | | | | | | | | | | | | | | |
| NET ASSET VALUE: | | | | | | | | | | | | | | | | |
| End of period | | $ | 14.00 | | | $ | 13.73 | | | $ | 14.00 | | | $ | 12.57 | |
| | | | | | | | | | | | | | | | | |
| TOTAL RETURN | | | 4.11 | % | | | 2.25 | % | | | 13.58 | % | | | 25.70 | %(3) |
| | | | | | | | | | | | | | | | | |
| SUPPLEMENTAL DATA AND RATIOS: | | | | | | | | | | | | | | | | |
| Net assets; end of period (000’s) | | $ | 109,568 | | | $ | 89,540 | | | $ | 84,112 | | | $ | 50,433 | |
| Ratio of expenses to | | | | | | | | | | | | | | | | |
| average net assets: | | | | | | | | | | | | | | | | |
| Expenses including | | | | | | | | | | | | | | | | |
| reimbursement (recapture) | | | 1.24 | %(5) | | | 1.39 | % | | | 1.39 | % | | | 1.39 | %(4) |
| Expenses excluding | | | | | | | | | | | | | | | | |
| reimbursement (recapture) | | | 1.36 | % | | | 1.32 | % | | | 1.38 | % | | | 1.70 | %(4) |
| Net investment income including | | | | | | | | | | | | | | | | |
| reimbursement (recapture) | | | 0.58 | % | | | 0.43 | % | | | 0.55 | % | | | 0.59 | %(4) |
| Net investment income excluding | | | | | | | | | | | | | | | | |
| reimbursement (recapture) | | | 0.46 | % | | | 0.50 | % | | | 0.56 | % | | | 0.28 | %(4) |
| Portfolio turnover rate | | | 23.76 | % | | | 18.49 | % | | | 25.46 | % | | | 9.21 | %(3) |
(1) | Date of inception. |
(2) | Amount represents less than $0.01 per share. |
(3) | Not Annualized. |
(4) | Annualized. |
(5) | See Note 5 for change in expense limitation during the year. |
See notes to financial statements.
YCG Enhanced Fund
NOTES TO FINANCIAL STATEMENTS
November 30, 2016
YCG Funds (the “Trust”) is a Delaware statutory trust organized under an Agreement and Declaration of Trust dated September 4, 2012. The Trust is an open-end management investment company, as defined in the Investment Company Act of 1940 (the “1940 Act”), as amended. The Trust consists of one series, YCG Enhanced Fund (the “Fund”). The Fund is classified and operates as a non-diversified fund under the 1940 Act. The Fund commenced operations on December 28, 2012. The Fund’s investment adviser is YCG, LLC (the “Adviser”). There are an unlimited number of authorized shares. The investment objective of the Fund is to maximize long-term appreciation with reasonable investment risk.
| 2. | SUMMARY OF SIGNIFICANT ACCOUNTING POLICIES |
The following is a summary of significant accounting policies consistently followed by the Fund in the preparation of its financial statements. The financial statements have been prepared in conformity with accounting principles generally accepted in the United States of America (“GAAP”). The Fund is an investment company and accordingly follows the investment company accounting and reporting guidance of the Financial Accounting Standards Board (“FASB”) Accounting Standards Codification Topic 946 Financial Services – Investment Companies.
(a) Subsequent Events Evaluation – In preparing these financial statements, the Fund has evaluated events and transactions for potential recognition or disclosure resulting from subsequent events through the date the financial statements were issued. This evaluation did not result in any subsequent events that necessitated disclosures and/or adjustments other than the event listed below.
On December 29, 2016, the Trust declared and paid distributions from ordinary income and net realized capital gains to shareholders of record as of December 28, 2016, as follows:
| | Ordinary | Short-Term | Long-Term |
| | Income | Capital Gain | Capital Gain |
| Distribution Paid | $603,540 | $1,604,406 | $1,376,317 |
| Distribution Paid Per Share | $0.07835007 | $0.20828 | $0.17867 |
(b) Investment Valuation – Securities which are traded on a national stock exchange are valued at the last sale price on the securities exchange on which such securities are primarily traded. Securities that are traded on The Nasdaq OMX Group, Inc., referred to as NASDAQ are valued at the Nasdaq Official Closing Price. Exchange-traded securities for which there were no transactions are valued at the current bid prices. Securities traded on only over-the-counter markets are valued on the basis of
YCG Enhanced Fund
NOTES TO FINANCIAL STATEMENTS (continued)
November 30, 2016
closing over-the-counter bid prices. Short-term debt instruments maturing within 60 days are valued by the amortized cost method, which approximates fair value. Debt securities (other than short-term instruments) are valued at the mean price furnished by a national pricing service, subject to review by the Adviser and determination of the appropriate price whenever a furnished price is significantly different from the previous day’s furnished price. Options written or purchased by the Fund are valued at the last sales price. If there are no trades for an option on a given day, options are valued at the mean between the current bid and asked prices. Any securities for which there are no readily available market quotations and other assets will be valued at their fair value as determined in good faith by the Adviser pursuant to procedures established by and under the supervision of the Board of Trustees.
Valuation Measurements
The Fund has adopted authoritative fair valuation accounting standards which establish an authoritative definition of fair value and set out a hierarchy for measuring fair value. These standards require additional disclosures about the various inputs and valuation techniques used to develop the measurements of fair value and a discussion of changes in valuation techniques and related inputs, if any, during the period. In addition, these standards require expanded disclosure for each major category of assets. These inputs are summarized in the three broad levels listed below:
| Level 1 – | Quoted prices in active markets for identical securities. |
| Level 2 – | Other significant observable inputs (including quoted prices for similar securities, interest rates, prepayment speeds, credit risk, etc.) |
| Level 3 – | Significant unobservable inputs (including the Fund’s own assumptions in determining the fair value of investments). |
The inputs or methodology used for valuing securities are not an indication of the risk associated with investing in those securities. The following is a summary of the inputs used to value the Fund’s net assets as of November 30, 2016:
| | | Level 1 | | | Level 2 | | | Level 3 | | | Total | |
Assets | | | | | | | | | | | | |
| Common Stocks* | | $ | 92,356,069 | | | $ | — | | | $ | — | | | $ | 92,356,069 | |
Liabilities | | | | | | | | | | | | | | | | |
| Other Financial | | | | | | | | | | | | | | | | |
| Instruments** | | | | | | | | | | | | | | | | |
| Options Written | | $ | 587,921 | | | $ | 6,020 | | | $ | — | | | $ | 593,941 | |
| * | | Please refer to the schedule of investments to view securities by industry type. |
| ** | | Other Financial Instruments are derivative instruments not reflected in the Schedule of Investments, such as options written, which are reflected at value. |
YCG Enhanced Fund
NOTES TO FINANCIAL STATEMENTS (continued)
November 30, 2016
The Fund did not invest in any Level 3 investments during the year. There were no transfers between levels during the year.
It is the Fund’s policy to consider transfers between levels as of the end of the reporting period.
c) Option Writing – The Fund may write covered call options and put options on a substantial portion of the Fund’s long equity portfolio as a means to generate additional income and to tax-efficiently enter and exit positions. The Fund will not use this strategy as a means of generating implicit leverage. In other words, if all put options were to be exercised, the Fund will generally have enough cash on hand to purchase the assigned shares. When the Fund writes an option, an amount equal to the premium received by the Fund is recorded as a liability and is subsequently adjusted to the current fair value of the option written. Premiums received from writing options that expire unexercised are treated by the Fund on the expiration date as realized gains from options written. The difference between the premium and the amount paid on effecting a closing purchase transaction, including brokerage commissions, is also treated as a realized gain, or, if the premium is less than the amount paid for the closing purchase transaction, as a realized loss. If a call option is exercised, the premium is added to the proceeds from the sale of the underlying security in determining whether the Fund has realized a gain or loss. If a put option is exercised, the premium reduces the cost basis of the securities purchased by the Fund. The Fund, as a writer of an option, bears the market risk of an unfavorable change in the price of the security underlying the written option. Upon writing an option, the Fund is required to pledge an amount of cash or securities, as determined by the broker, as collateral. As of November 30, 2016, the Fund held securities with a value of $2,473,800 and cash of $4,376,507 as collateral for options written. During the period, the Fund used written covered call and put options in a manner consistent with the strategy described above.
The value of Derivative Instruments on the Statement of Assets and Liabilities as of November 30, 2016, are as follows:
| | Liability Derivatives |
| Derivatives not | | |
| accounted for | | |
| as hedging | | |
| instruments | Location | Value |
| Equity Contracts – Options | Options written, at value | $593,941 |
YCG Enhanced Fund
NOTES TO FINANCIAL STATEMENTS (continued)
November 30, 2016
The effect of Derivative Instruments on the Statement of Operations for the year ended November 30, 2016, are as follows:
| Amount of Realized Gain on | Change in Unrealized Appreciation |
| Derivatives Recognized in Income | on Derivatives Recognized in Income |
| Derivatives not | | Derivatives not | |
| accounted for | | accounted for | |
| as hedging | Options | as hedging | Options |
| instruments | Written | instruments | Written |
| Equity Contracts | $1,557,495 | Equity Contracts | $49,123 |
The average monthly value of options written during the year ended November 30, 2016, was $754,030.
See Note 4 for additional disclosure related to transactions in options written during the year.
Derivative Risks
The risks of using the various types of derivatives in which the Fund may engage include the risk that movements in the value of the derivative may not fully offset or complement instruments currently held in the Fund in the manner intended by the Adviser, the risk that the counterparty to a derivative contract may fail to comply with its obligations to the Fund, the risk that there may not be a liquid secondary market for the derivative at a time when the Fund would look to disengage the position, the risk that additional capital from the Fund may be called upon to fulfill the conditions of the derivative contract, the risk that the use of derivatives may induce leverage in the Fund, and the risk that the cost of the derivative may reduce the overall returns experience by the Fund.
Offsetting Assets and Liabilities
The Fund is subject to various Master Netting Arrangements, which govern the terms of certain transactions with select counterparties. The Master Netting Arrangements allow the Fund to close out and net its total exposure to a counterparty in the event of a default with respect to all the transactions governed under a single agreement with a counterparty. The Master Netting Arrangements also specify collateral posting arrangements at pre-arranged exposure levels. Under the Master Netting Arrangements, collateral is routinely transferred if the total net exposure to certain transactions (net of existing collateral already in place) governed under the relevant Master Netting Arrangement with a counterparty in a given account exceeds a specified threshold depending on the counterparty and the type of Master Netting Arrangement.
YCG Enhanced Fund
NOTES TO FINANCIAL STATEMENTS (continued)
November 30, 2016
The following is a summary of the Assets and Liabilities subject to offsetting in the Fund as of November 30, 2016:
| Liabilities | | | | Gross Amounts Not | |
| | | | | Offset in the Statement | |
| | | | | of Assets and Liabilities | |
| | | Gross | Net | | | |
| | | Amounts | Amounts | | | |
| | | Offset | Presented | | | |
| | Gross | in the | in the | | | |
| | Amounts | Statement | Statement | | | |
| | of | of Assets | of Assets | | | |
| Description / | Recognized | and | and | Financial | Collateral | Net |
| Counterparty | Liabilities | Liabilities | Liabilities | Instruments | Pledged | Amount |
| Options Written | | | | | | |
| Interactive Brokers | $593,941 | $ — | $593,941 | $ — | $593,941 | $ — |
In some instances, the collateral amounts disclosed in the tables were adjusted due to the requirement to limit the collateral amounts to avoid the effect of overcollateralization. Actual collateral received/pledged may be more than the amounts disclosed herein.
d) Federal Income Taxes – The Fund intends to qualify as a “regulated investment company” under Subchapter M of the Internal Revenue Code of 1986, as amended. If so qualified, the Fund will not be subject to federal income tax to the extent it distributes substantially all of its net investment income and capital gains to shareholders. Therefore, no federal income tax provision is required.
The Fund has adopted financial reporting rules regarding recognition and measurement of tax positions taken or expected to be taken on a tax return. The Fund recognizes interest and penalties, if any, related to unrecognized tax benefits as income tax expense in the Statement of Operations. During the year, the Fund did not incur any interest or penalties. As of and during the year ended November 30, 2016, the Fund did not have any liabilities for unrecognized tax benefits.
e) Distributions to Shareholders – The Fund will declare and distribute any net investment income and any net realized long or short-term capital gains annually. Distributions to shareholders are recorded on the ex-dividend date. The character of distributions made during the year from net investment income or net realized gains may differ from the characterization for federal income tax purposes due to differences in the recognition of income, expense and gain items for financial statement and tax purposes. Where appropriate, reclassifications between capital accounts are made for such differences that are permanent in nature.
YCG Enhanced Fund
NOTES TO FINANCIAL STATEMENTS (continued)
November 30, 2016
f) Use of Estimates – The preparation of the financial statements in conformity with GAAP requires management to make estimates and assumptions that affect the reported amounts of assets and liabilities and disclosure of contingent assets and liabilities at the date of the financial statements and the reported amounts of increases and decreases in net assets from operations during the reporting period. Actual results could differ from those estimates.
g) Guarantees and Indemnifications – Under the Fund’s organizational documents, its officers and trustees are indemnified by the Fund against certain liabilities arising out of the performance of their duties to the Fund. Additionally, in the normal course of business, the Fund enters into contracts with service providers that contain general indemnification clauses. The Fund’s maximum exposure under these arrangements is unknown as this would involve future claims that may be made against the Fund that have not yet occurred. Currently, the Fund expects the risk of loss to be remote.
h) Redemption Fee – Those who buy and sell the Fund within 90 calendar days will incur a 2% redemption fee, retained for the benefit of long-term shareholders, recorded as additional capital in the Statement of Changes in Net Assets.
i) Beneficial Ownership – The beneficial ownership, either directly or indirectly, of more than 25% of the voting securities of a fund creates a presumption of control of the Fund, under Section 2(a)(9) of the 1940 Act. At November 30, 2016, Charles Schwab & Co., Inc. for the benefit of its customers, held 28.67% of the outstanding shares of the Fund.
j) Other – Investment transactions and shareholder transactions are accounted for on the trade date. Net realized gains and losses on securities are computed on the basis of highest amortized cost. Dividend income is recognized on the ex-dividend date and interest income is recognized on an accrual basis. Discounts and premiums on securities purchased are accreted and amortized over the lives of the respective securities. Withholding taxes on foreign dividends have been provided for in accordance with the Fund’s understanding of the applicable country’s tax rules and regulations.
| 3. | INVESTMENT TRANSACTIONS |
For the year ended November 30, 2016, the aggregate purchases and sales of securities, excluding short-term securities, were $31,587,682 and $21,074,808, respectively for the Fund. For the year ended November 30, 2016, there were no long-term purchases or sales of U.S. Government securities for the Fund.
During the fiscal year ended November 30, 2016, the Fund had a trade error. This resulted in a loss to the Fund of $4,743, which an affiliate subsequently reimbursed to the Fund. The payment from affiliate was less than $0.01 per share and had no impact to performance.
YCG Enhanced Fund
NOTES TO FINANCIAL STATEMENTS (continued)
November 30, 2016
| 4. | OPTION CONTRACTS WRITTEN |
The premium amount and number of option contracts written during the year ended November 30, 2016, in the Fund were as follows:
| | | Amount of | | | Number of | |
| | | Premiums | | | Contracts | |
| Outstanding at 11/30/15 | | $ | 585,117 | | | | 2,450 | |
| Options written | | | 3,868,176 | | | | 16,055 | |
| Options exercised | | | (415,936 | ) | | | (1,509 | ) |
| Options expired | | | (2,026,767 | ) | | | (8,426 | ) |
| Options closed | | | (1,157,405 | ) | | | (4,915 | ) |
| Outstanding at 11/30/16 | | $ | 853,185 | | | | 3,655 | |
See Note 2 for additional disclosure related to transactions in options written during the year.
| 5. | INVESTMENT ADVISORY AGREEMENT |
The Adviser acts as the investment adviser to the Fund pursuant to an investment advisory agreement (the “Advisory Agreement”) which has been approved by the Board (including a majority of the Trustees who are not parties to the Advisory Agreement, or interested persons of any such party). Under the terms of the Advisory Agreement between the Fund and the Adviser, the Adviser conducts investment research and management for the Fund and is responsible for the purchase and sale of securities for the Fund’s investment portfolio. The Adviser provides the Fund with investment advice, supervises the management and investment programs and provides investment advisory facilities and executive and supervisory personnel for managing the investments and effectuating portfolio transactions. The Adviser also furnishes, at its own expense, all necessary administrative services, office space, equipment and clerical personnel for servicing the investments of the Fund. In addition, the Adviser pays the salaries and fees of all officers of the Fund who are affiliated with the Adviser. Under the Advisory Agreement, the monthly compensation paid to the Adviser is accrued daily at an annual rate of 1.00% on the average daily net assets of the Fund.
In the interest of limiting the expenses of the Fund, the Adviser has entered into a contractual expense limitation agreement with the Fund. Pursuant to the Expense Limitation Agreement, the Adviser (for the lifetime of the Fund) has agreed to waive or limit its fees and assume other expenses of the Fund (excluding interest, taxes, brokerage commissions and dividend expenses on securities sold short and extraordinary expenses not incurred in the ordinary course of business) so that the
YCG Enhanced Fund
NOTES TO FINANCIAL STATEMENTS (continued)
November 30, 2016
Fund’s ratio of total annual operating expenses is limited to 1.39%. In addition, to the lifetime limit, effective April 1, 2016, the Adviser has agreed to reimburse the Fund to the extent necessary to ensure that total annual Fund operating expenses to do not exceed 1.19% at least through April 1, 2017. The Adviser is entitled to the reimbursement of fees waived or reimbursed by the Adviser to the Fund subject to the limitations that (1) the reimbursement is made only for fees and expenses incurred not more than three years prior to the date of reimbursement, and (2) the reimbursement may not be made if it would cause the Fund’s annual expense limitation to be exceeded. The reimbursement amount may not include any additional charges or fees, such as interest accruable on the reimbursement account. During the year ended November 30, 2016, the Fund reimbursed $15,866 of previously waived expenses to the Adviser. As of November 30, 2016, expenses of $139,338 are subject to recoupment by the Adviser, expiring during the year ended November 30, 2019.
Certain officers, trustees and shareholders of the Fund are also owners or employees of the Adviser. Such officers receive no compensation from the Fund for serving in their respective roles.
| 6. | SERVICE AND CUSTODY AGREEMENTS |
The Fund has entered into Service Agreements with U.S. Bancorp Fund Services, LLC (“USBFS”) and a Custody Agreement with U.S. Bank, N.A., an affiliate of USBFS. Under these agreements, USBFS and U.S. Bank, N.A. provide certain transfer agency, administrative, accounting and custody services.
| 7. | NON-DIVERSIFICATION RISK |
The Fund is non-diversified. A non-diversified fund may invest more of its assets in fewer companies than if it were a diversified fund. The Fund may be more exposed to the risks of loss and volatility than a fund that invests more broadly.
| 8. | FEDERAL TAX INFORMATION |
A. Tax Basis of Distributions to Shareholders: The tax character of the distributions paid by the Fund were as follows:
| | | For the Year Ended | | | For the Year Ended | |
| | | November 30, 2016 | | | November 30, 2015 | |
| Ordinary Income | | $ | 1,329,278 | | | $ | 1,587,964 | |
| Long-Term Capital Gains | | | 637,539 | | | | 1,835,601 | |
| Total | | $ | 1,966,817 | | | $ | 3,423,565 | |
YCG Enhanced Fund
NOTES TO FINANCIAL STATEMENTS (continued)
November 30, 2016
Reclassifications: The tax components of distributable earnings are determined in accordance with income tax regulations which may differ from the compositions of net assets reported under accounting principles generally accepted in the United States. For the year ended November 30, 2016, there were no differences reclassified.
B. Tax Basis of Investments
As of November 30, 2016, the components of the tax basis cost of investments and net unrealized appreciation were as follows:
| | | YCG Enhanced Fund | |
| Tax cost of investments | | $ | 78,698,883 | |
| Gross unrealized appreciation | | | 16,405,132 | |
| Gross unrealized depreciation | | | (2,747,946 | ) |
| Net tax unrealized appreciation (depreciation) | | | 13,657,186 | |
| Undistributed ordinary income | | | 2,207,869 | |
| Undistributed long-term capital gains | | | 1,376,242 | |
| Accumulated earnings | | | 3,584,111 | |
| Other accumulated gains (losses) | | | 258,770 | |
| Total accumulated earnings | | $ | 17,500,067 | |
The tax basis of investments for tax and financial reporting purposes differs, principally due to the deferral of losses on wash sales and the recognition of gains on certain foreign investments.
Net capital losses incurred after October 31, and within the taxable year are deemed to arise on the first business day of the Fund’s next taxable year. Qualified late-year ordinary losses are the excess of the sum of the specified loss attributable to the portion of the taxable year after October 31st, and the late-year losses attributable to the portion of the taxable year after December 31st, over the sum of the specified gains attributable to the portion of the taxable year after October 31st, and other ordinary income attributable to the portion of the taxable year after December 31st. For the fiscal year ended November 30, 2016, there were no post-October or late-year losses.
YCG Enhanced Fund
REPORT OF INDEPENDENT REGISTEREDPUBLIC ACCOUNTING FIRM
To the Shareholders of YCG Enhanced Fund and
Board of Trustees of YCG Funds
We have audited the accompanying statement of assets and liabilities, including the schedules of investments and options written, of YCG Enhanced Fund (the “Fund”), a series of YCG Funds, as of November 30, 2016, and the related statement of operations for the year then ended, the statements of changes in net assets for each of the two years in the period then ended, and the financial highlights for each of the four periods in the period then ended. These financial statements and financial highlights are the responsibility of the Fund’s management. Our responsibility is to express an opinion on these financial statements and financial highlights based on our audits.
We conducted our audits in accordance with the standards of the Public Company Accounting Oversight Board (United States). Those standards require that we plan and perform the audit to obtain reasonable assurance about whether the financial statements and financial highlights are free of material misstatement. An audit includes examining, on a test basis, evidence supporting the amounts and disclosures in the financial statements. Our procedures included confirmation of securities owned as of November 30, 2016, by correspondence with the custodian and brokers. An audit also includes assessing the accounting principles used and significant estimates made by management, as well as evaluating the overall financial statement presentation. We believe that our audits provide a reasonable basis for our opinion.
In our opinion, the financial statements and financial highlights referred to above present fairly, in all material respects, the financial position of YCG Enhanced Fund as of November 30, 2016, the results of its operations for the year then ended, the changes in its net assets for each of the two years in the period then ended, and the financial highlights for each of the four periods in the period then ended, in conformity with accounting principles generally accepted in the United States of America.
COHEN & COMPANY, LTD.
Cleveland, Ohio
January 24, 2017
YCG Enhanced Fund
ADDITIONAL INFORMATION
(Unaudited)
| 1. | SHAREHOLDER NOTIFICATION OF FEDERAL TAX STATUS |
For the year ended November 30, 2016, 100% of the dividends paid from net investment income, including short-term capital gains, for the YCG Enhanced Fund qualify for the dividends received deduction available to corporate shareholders.
For the year ended November 30, 2016, 100% of the dividends paid from net investment income, including short-term capital gains, for the YCG Enhanced Fund are designated as qualified dividend income.
| 2. | COMPENSATION OF TRUSTEES |
During the fiscal year, each Trustee who is not an “interested person” of the Trust (i.e. an “Independent Trustee”) received $1,000 per meeting attended, as well as reimbursement for expenses incurred in connection with attendance at such meetings. The Fund’s Statement of Additional Information includes additional information about the Trustees and is available upon request by calling toll free 1-855-444-9243.
| 3. | PROXY VOTING POLICIES AND PROCEDURES |
For a description of the policies and procedures that the Fund uses to determine how to vote proxies relating to portfolio securities, please call 1-855-444-9243 and request a Statement of Additional Information. One will be mailed to you free of charge. The Statement of Additional Information is also available on the web site of the Securities and Exchange Commission at http:www.sec.gov. Information on how the Fund voted proxies relating to portfolio securities during the year ended June 30, 2016 is available without charge, upon request, by calling 1-855-444-9243 or by accessing the website of the Securities and Exchange Commission at http://www.sec.gov.
| 4. | DISCLOSURE OF PORTFOLIO HOLDINGS |
The Fund files a complete schedule of portfolio holdings with the Securities and Exchange Commission for the first and third quarters of each fiscal year on Form N-Q. The Fund’s Form N-Q is available on the website of the Securities and Exchange Commission at http://www.sec.gov. The Fund’s Forms N-Q may be reviewed and copied at the Securities and Exchange Commission’s Public Reference Room in Washington, D.C. Information on the operation of the Public Reference Room may be obtained by calling 1-800-SEC-0330.
| 5. | BOARD ANNUAL RENEWAL OF INVESTMENT ADVISORY AGREEMENT |
On October 20, 2016, the Board of Trustees of YCG Funds (the “Trustees”) approved the continuation of the investment advisory agreement for the YCG Enhanced Fund (the “Fund”) with the investment adviser to the Fund, YCG, LLC (the “Adviser”). As part of the process of approving the continuation of the advisory agreement, the Trustees reviewed the fiduciary duties of the Trustees with respect to approving the
YCG Enhanced Fund
ADDITIONAL INFORMATION (continued)
(Unaudited)
advisory agreement and the relevant factors for the Trustees to consider, and the members of the Board of Trustees who are not deemed “interested persons” (as that term is defined by the Investment Company Act of 1940) of the Fund (the “Independent Trustees”) met in executive session to discuss the approval of the advisory agreement.
In advance of the meeting, the Adviser sent detailed information to the Trustees to assist them in their evaluation of the investment advisory agreement. This information included, but was not limited to, a memorandum from Fund counsel that summarized the legal standards applicable to the Trustees’ consideration of the advisory agreement; comparative information relating to the Fund’s management fees and other expenses of the Fund; information regarding fees paid and other payments; information on the Adviser’s profitability; information about brokerage commissions; comparative information relating to the Fund’s performance; information about sales and redemptions of the Fund; information about the Fund’s compliance program; and other information the Trustees believed was useful in evaluating the approval of advisory agreement.
All of the factors discussed by the Trustees were considered as a whole, and were considered separately by the Independent Trustees, meeting in executive session. The factors were viewed in their totality by the Trustees, with no single factor being the principal or determinative factor in the Trustees’ determination of whether to approve the continuation of the investment advisory agreement. The Trustees recognized that the management and fee arrangements for the Fund are the result of years of review and discussion between the Independent Trustees and the Adviser, that certain aspects of such arrangements may receive greater scrutiny in some years than in others and that the Trustees’ conclusions may be based, in part, on their consideration of these same arrangements and information received during the course of the year and in prior years.
Prior to approving the continuation of the investment advisory agreement, the Trustees and the Independent Trustees in executive session considered, among other items:
| | • | The nature and quality of the investment advisory services provided by the Adviser. |
| | | |
| | • | A comparison of the fees and expenses of the Fund to other similar funds. |
| | | |
| | • | A comparison of the fee structures of other accounts managed by the Adviser. |
| | | |
| | • | Whether economies of scale are recognized by the Fund. |
| | | |
| | • | The costs and profitability of the Fund to the Adviser. |
| | | |
| | • | The performance of the Fund. |
| | | |
| | • | The other benefits to the Adviser from serving as investment adviser to the Fund (in addition to the advisory fee). |
YCG Enhanced Fund
ADDITIONAL INFORMATION (continued)
(Unaudited)
The material considerations and determinations of the Board of Trustees, including all of the Independent Trustees, are as follows:
Nature, Extent and Quality of Investment Advisory Services
The Trustees noted that the Adviser supervises the investment portfolio of the Fund, directing the day-to-day management of the Fund’s portfolio, including the purchase and sale of investment securities. They then discussed with management the nature of the investment process employed by the portfolio managers of the Fund, which is research intensive, and discussed staffing at the Adviser. Namely, in making its investment decisions, the Adviser uses a “bottom-up” approach focused on individual companies, which is dependent on independent, in-house, fundamental research to analyze each company considered for investment. The Trustees concluded that the Adviser is well staffed to conduct the research needed to meet the investment objectives of the Fund.
In addition to the nature of the Adviser’s investment process, the Trustees considered the background and experience of the Adviser’s senior management and expertise of, and the amount of attention given to the Fund by investment personnel of the Adviser. In addition, the Trustees considered the quality of the material service providers to the Fund, who provide administrative and distribution services on behalf of the Fund and are overseen by the Adviser, and the overall reputation and capabilities of the Adviser. Based on this review, the Trustees believe that the Adviser provides high quality services to the Fund, as the Adviser’s personnel are focused primarily on servicing the Fund.
The Trustees also noted that the Adviser actively oversees the service providers to the Fund, and makes adjustments as advisable to ensure that the Fund is well served. For example, the Adviser identified the need to enhance its compliance program, and quickly acted to deploy resources to make enhancements.
In light of the Trustees’ discussions and considerations regard the Adviser, the Trustees concluded that they were satisfied with the nature, extent and quality of the investment advisory services provided to the Fund by the Adviser, and that the nature and extent of the services provided by the Adviser are appropriate to assure that each Fund’s operations are conducted in compliance with applicable laws, rules and regulations.
Comparative Fees and Expenses
The Trustees then discussed with management the variables, in addition to the management fees, such as administrative and transaction fees, that impact costs to the shareholders of the Fund. Management reviewed with the Trustees the comparison of the Fund’s expense ratios to other similar funds. As part of the discussion with management, the Trustees ensured that they understood and were comfortable with the criteria used by the Adviser to determine the mutual funds that make up the peer groups identified and discussed below.
YCG Enhanced Fund
ADDITIONAL INFORMATION (continued)
(Unaudited)
In the materials provided to the Trustees, there was a report comparing the Fund to two peer groups. The first peer group was a comparison versus the Morningstar Large Cap Blend Category peers, and the second peer group was a comparison versus custom “stockpicking” and “option” peers. In discussing and evaluating the report, the Trustees noted the following:
| | • | While the Fund had higher than average advisory and net expenses compared to the Morningstar Large Cap Blend category peers, the Fund’s return over the last three years is in the top third of the funds in the category. The Trustees also noted that unlike most peers in the category, the Fund utilizes an option enhancement strategy. |
| | | |
| | • | The Fund’s expense ratio is very favorable compared to option peers, which is important because the Trustees believe that the Fund’s option enhancement strategy is a unique strategy that sets the Fund apart from its competitors. As noted above, other funds in the Morningstar Large Cap Blend Category generally do not utilize an option strategy. |
| | | |
| | • | The Fund outperformed all the option peer group funds on a since inception and one year basis. |
| | | |
| | • | The Fund performed extremely well against many of the stockpicking and large cap blend category peer group funds. |
| | | |
| | • | The Fund is still relatively small in assets under management, and the Adviser is subsidizing the expenses of the Fund to remain competitive with other funds. |
After reviewing and discussing the comparison of the Fund’s expense ratios to other similar funds, as noted above, the Trustee’s concluded that the expense ratio of the Fund is within the range of comparable mutual funds, particularly funds that have an option strategy, and that the Fund’s fees are reasonable.
Comparison of Fee Structures of Other Accounts
The Trustees then inquired of management regarding the distinction between the services performed by the Adviser for separate accounts and those performed by the Adviser for the Fund. The Adviser noted that the management of the Fund involves comprehensive and substantive duties. Specifically, the Adviser noted the following:
| | • | The Adviser provides tailored investment advisory services to the Fund in order to accommodate the cash flow volatility presented by the purchases and redemptions of shareholders. |
| | | |
| | • | With regard to the Fund, the Adviser attempts to serve the needs of hundreds of accounts, ranging from direct accounts holding a few thousand dollars to the large omnibus accounts of intermediaries who in turn service thousands of large and small accounts. |
YCG Enhanced Fund
ADDITIONAL INFORMATION (continued)
(Unaudited)
| | • | The Adviser maintains a robust shareholder communication effort for the Fund to reach shareholders through direct contact, through intermediaries, or via the financial press, and has contributed significant financial resources to marketing efforts for the Fund. |
| | | |
| | • | The Adviser focuses marketing the Fund, and has found that the most effective way is through one-on-one meetings, which require significant amounts of time and resources to attract investors. |
| | | |
| | • | The Adviser coordinates with the Fund’s Chief Compliance Officer and other service providers to insure compliance with regulatory regimens imposed by Federal law and the Internal Revenue Code. |
The Trustees concluded that the services performed by the Adviser for the Fund require a high level of service and oversight. On the other hand, they noted that the Adviser has found that the client servicing of separately managed accounts can be very resource intensive, and they noted that the fees charged to such separate accounts are generally higher than the fees charged to the Fund. As the management of the Fund and the separately managed accounts is distinct, the Trustees concluded that the differential in advisory fees between the Fund and the separate accounts is reasonable, and concluded that the fee rate charged to the Fund in comparison to those charged to the Adviser’s other clients is reasonable.
Performance
The Trustees reviewed the Adviser’s quality of investment management, management history and ability to successfully market the Fund. The Trustees noted that at each quarterly meeting, the Trustees review reports regarding the investment performance of the Fund. Based on the information provided at this meeting and the information and quarterly discussions regarding the Fund’s investment performance, the Trustees believe that the Adviser manages the Fund in a manner that is materially consistent with their stated investment objective and style.
In assessing the performance of the Fund, which is positive, the Trustees noted the following:
| | • | The Fund’s return over the last three years is in the top third of the funds in the Morningstar Large Cap Blend category. |
| | | |
| | • | The Fund outperformed all the option peer group funds on a since inception and one year basis. |
| | | |
| | • | The Fund performed extremely well against many of the stockpicking and large cap blend category peer group funds. |
The Trustees concluded that the performance of the Fund, adjusting for risk, has been satisfactory on a relative basis and more than satisfactory on an absolute basis. They
YCG Enhanced Fund
ADDITIONAL INFORMATION (continued)
(Unaudited)
continue to believe that the Adviser’s discipline will lead to more favorable results in the long-term, and concluded that renewal of the existing advisory agreement was in the best interest of the Fund’s shareholders.
Costs and Profitability
The Trustees considered the cost of services provided and the profits realized by the Adviser. They also considered the Fund’s overall expense ratios compared to peer group funds. The Trustees concluded that given the size of the Fund and the niche strategy of the Fund, that the Fund’s fee structure is appropriate and reasonable.
The Trustees discussed in detail the profitability of the Adviser as it relates to the Fund, and they discussed the impact of the intermediary service fees on the profitability. The Trustees also considered the resources and revenues that the Adviser has put into managing and distributing the Fund, and concluded that the level of profitability realized by the Adviser from its provision of services to the Fund is reasonable, and that the overall expense ratios and investment advisory fees were fair and within the range of industry averages.
Economies of Scale
The Trustees then discussed with management whether economies of scale are recognized by the Fund. They noted that as Fund assets grow, certain fixed costs are spread over the larger asset base, which may lead to some economies of scale. On the other hand, the Trustees noted that many of the Fund’s expense are subject to diseconomies of scale. For example, the intermediary service fees increase as the Fund’s assets grow.
Given the size of the Fund, the Trustees determined that the Fund has not realized economies of scale. They noted that the expenses for the Fund are currently capped and any excess is paid by the Adviser. The Trustees concluded that the current fees were appropriate at foreseeable asset levels.
Fall-Out Benefits
The Trustees then considered other benefits to the Adviser from serving as Adviser to the Fund (in addition to the advisory fee). The Trustees noted that the Adviser does not derive ancillary benefits from its association with the Fund in the form of proprietary and third party research products and services, as the Adviser does not receive any research or other services from the broker-dealers that the Fund trades with.
It was noted that managing the Fund has provided more visibility for the Adviser in the financial media and industry in general, as the Fund has been highlighted in publications, including national publications. However, the primary focus of these articles has been the Fund.
YCG Enhanced Fund
ADDITIONAL INFORMATION (continued)
(Unaudited)
Based on the Trustees’ discussion and analysis, the Trustees concluded that the other benefits realized by the Adviser from its relationship with the Fund were reasonable.
Conclusion
After reviewing the materials provided at the meeting, management’s presentation, as well as other information regularly provided at the Board’s quarterly meetings throughout the year regarding the quality of services provided by the Adviser, the performance of the Fund, expense information, regulatory compliance issues, trading information and related matters and other factors deemed relevant by the Board, the Trustees, including all of the Independent Trustees, approved the continuation of the investment advisory agreement.
YCG Enhanced Fund
TRUSTEES AND OFFICERS
(Unaudited)
The business of the Fund is managed under the direction of the Board. The Board formulates the general policies of the Fund and meets periodically to review the Fund’s performance, monitor investment activities and practices, and discuss other matters affecting the Fund. The Trustees are fiduciaries for the Fund’s shareholders and are governed by the laws of the State of Delaware in this regard. The names and addresses of the Trustees and officers of the Trust are listed below along with a description of their principal occupations over at least the last five years. Trustees who are “interested persons”, as defined by the 1940 Act, are indicated by asterisk. The Fund’s Statement of Additional Information includes additional information about the Trustees and is available upon request by calling toll free 1-855-444-9243. Information in table as of January 18, 2017.
| | | Term of | | | |
| | | Office | Number of | | |
| | | and | Portfolios | Principle | Other |
| | Position(s) | Length | in Fund | Occupation(s) | Directorships |
| Name, address | Held with | of Time | Complex | During Past | Held by |
| and year born | the Fund | Served | Overseen | Five Years | Trustee |
| | | | | | |
| Brian Yacktman* | Trustee | Indefinite, | 1 | Manager, Principal | None. |
| 3207 Ranch Road | | Trustee | | and Chief | |
| 620 South, Suite 200 | | since 2012 | | Investment Officer, | |
| Austin, TX 78738 | President | One year | | YCG, LLC, | |
| Age: 37 | | term, | | investment adviser | |
| | | President | | to the Fund, | |
| | | since 2012 | | since 2007. | |
| | | | | | |
| William D. Kruger* | Chairman | Indefinite, | 1 | Manager, Principal | None. |
| 3207 Ranch Road | and | Trustee | | and CEO, YCG, | |
| 620 South, Suite 200 | Trustee | since 2012 | | LLC, investment | |
| Austin, TX 78738 | Vice | One year | | adviser to the Fund, | |
| Age: 37 | President | term, Vice | | since 2008. | |
| | and | President | | | |
| | | since 2012 | | | |
| | Treasurer | One year | | | |
| | | term, | | | |
| | | Treasurer | | | |
| | | since 2012 | | | |
YCG Enhanced Fund
TRUSTEES AND OFFICERS (continued)
(Unaudited)
| | | Term of | | | |
| | | Office | Number of | | |
| | | and | Portfolios | Principle | Other |
| | Position(s) | Length | in Fund | Occupation(s) | Directorships |
| Name, address | Held with | of Time | Complex | During Past | Held by |
| and year born | the Fund | Served | Overseen | Five Years | Trustee |
| | | | | | |
| Independent Trustees: | | | | | |
| | | | | | |
| Travis E. Oliphant | Trustee | Indefinite, | 1 | Scientific and | None. |
| 3207 Ranch Road | | Trustee | | Technical software | |
| 620 South, Suite 200 | | since 2012 | | developer. CEO | |
| Austin, TX 78738 | | | | of Continuum | |
| Age: 45 | | | | Analytics since | |
| | | | | January 2012. | |
| | | | | President of | |
| | | | | Enthought | |
| | | | | from 2007 – | |
| | | | | December 2011. | |
| | | | | | |
| Rory M. McDonald | Trustee | Indefinite, | 1 | Assistant Professor | None. |
| 3207 Ranch Road | | Trustee | | of Business | |
| 620 South, Suite 200 | | since 2012 | | Administration in | |
| Austin, TX 78738 | | | | the Technology | |
| Age: 38 | | | | and Operations | |
| | | | | Management Unit | |
| | | | | at Harvard | |
| | | | | Business School, | |
| | | | | 2013 – Present. | |
| | | | | Assistant Professor | |
| | | | | of Management, | |
| | | | | University of Texas | |
| | | | | at Austin, McCombs | |
| | | | | School of Business, | |
| | | | | 2011 – 2013. | |
| | | | | | |
| C. James Speirs | Trustee | Indefinite, | 1 | Retired; Global | None. |
| 3207 Ranch Road | | Trustee | | Vice President | |
| 620 South, Suite 200 | | since 2017 | | of Procurement | |
| Austin, TX 78738 | | | | at Whole | |
| Age: 61 | | | | Foods Market, | |
| | | | | 1992 – 2016. | |
YCG Enhanced Fund
TRUSTEES AND OFFICERS (continued)
(Unaudited)
| | | Term of | | | |
| | | Office | Number of | | |
| | | and | Portfolios | Principle | Other |
| | Position(s) | Length | in Fund | Occupation(s) | Directorships |
| Name, address | Held with | of Time | Complex | During Past | Held by |
| and year born | the Fund | Served | Overseen | Five Years | Trustee |
| | | | | | |
| Officers who are not Trustees: |
| | | | | | |
| Elliott Savage | Vice | One year | N/A | Manager, | None. |
| 3207 Ranch Road | President | term, | | Principal and | |
| 620 South, Suite 200 | | Vice | | Portfolio manager, | |
| Austin, TX 78738 | | President | | YCG, LLC, | |
| Age: 36 | | since | | investment adviser | |
| | | December | | to the Fund, | |
| | | 2012 | | since 2012. | |
| | Secretary | One year | | Senior Analyst, | |
| | | term, | | Highside Capital | |
| | | Secretary | | Management, | |
| | | since | | 2003 – 2012. | |
| | | February | | | |
| | | 2016 | | | |
| | Assistant | One year | | | |
| | Treasurer | term, | | | |
| | | Assistant | | | |
| | | Treasurer | | | |
| | | since | | | |
| | | December | | | |
| | | 2012 | | | |
| | | | | | |
| Lelia Long | Chief | One year | N/A | Investment | None. |
| 3207 Ranch Road | Compliance | term, | | Management | |
| 620 South, Suite 200 | Officer | Chief | | & Compliance | |
| Austin, TX 78738 | | Compliance | | Consultant, | |
| Age: 54 | | Officer since | | Vigilant | |
| | | March 2016 | | Compliance LLC, | |
| | | | | (2009 – Present). | |
| | | | | Treasurer, New | |
| | | | | Ireland Fund, Inc. | |
| | | | | (2002 – Present). | |
| * | Brian Yacktman and William Kruger are considered to be “interested persons” of the Trust, a term that is defined in the 1940 Act. Mr. Yacktman and Mr. Kruger are interested persons because: (1) each is an officer of the Trust; and (2) each is the owner of the investment adviser to the Fund. |
Each trustee holds office for an indefinite term and until the earlier of: the Trust’s next meeting of shareholders and the election and qualification of his successor; or until the date a trustee dies, resigns or is removed in accordance with the Trust’s Declaration of Trust and By-laws. Each officer holds office at the pleasure of the Board and serves for a period of one year, or until his successor is duly elected and qualified.
Privacy Notice
| FACTS | WHAT DOES YCG FUNDS DO WITH YOUR PERSONAL INFORMATION? |
| | |
| WHY? | Financial companies choose how they share your personal information. Federal law gives consumers the right to limit some, but not all information sharing. Federal law also requires us to tell you how we collect, share, and protect your personal information. Please read this Notice carefully to understand what we do. |
| | |
| WHAT? | The types of information we collect and share depend on the product or service you have with us. This information can include: |
| | • Social Security Number |
| | • Assets |
| | • Retirement Assets |
| | • Transaction History |
| | • Checking Account History |
| | • Purchase History |
| | • Account Balances |
| | • Account Transactions |
| | • Wire Transfer Instructions |
| | When you are no longer our customer, we continue to share your information as described in this Notice. |
| | |
| HOW? | All financial companies need to share your personal information to run their everyday business. In the section below, we list the reasons financial companies can share their customers’ personal information; the reasons YCG Funds chooses to share; and whether you can limit this sharing. |
| Reasons we can share your personal information. | Does YCG Funds | Can you limit |
| | Trust share? | this sharing? |
| For our everyday business purposes— | | |
| Such as to process your transactions, maintain | | |
| your account(s), respond to court orders and | Yes | No |
| legal investigations, or report to credit bureaus. | | |
| For our marketing purposes— | | |
| to offer our products and services to you. | No | We don’t share |
| For joint marketing with other financial | | |
| companies | No | We don’t share |
| For our affiliates’ everyday business purposes— | | |
| information about your transactions and experiences. | Yes | No |
| For our affiliates’ everyday business purposes— | | |
| information about your creditworthiness | No | We don’t share |
| For non-affiliates to market to you | No | We don’t share |
| Questions? | Call 855-444-YCGF (9243) |
Privacy Notice (continued)
| Who we are | |
| Who is providing | YCG Funds |
| this Notice? | YCG, LLC (investment adviser to the Trust) |
| | US Bancorp Fund Services, LLC (administrator to the Trust) |
| | |
| What we do | |
| How does | To protect your personal information from unauthorized |
| YCG Funds | access and use, we use security measures that comply |
| protect | with federal law. These measures include computer safeguards |
| your personal | and secured files and buildings. |
| information? | Our service providers are held accountable for adhering to strict policies and procedures to prevent |
| | any misuse or your nonpublic personal information. |
| | |
| How does | We collect your personal information, for example, when you |
| YCG Funds | • Open an account |
| collect your | • Provide account information |
| personal | • Give us your contact information |
| information? | • Make deposits or withdrawals from your account |
| | • Make a wire transfer |
| | • Tell us where to send the money |
| | • Tell us who receives the money |
| | • Show your government-issued ID |
| | • Show your drivers’ license |
| | We also collect your personal information from other companies. |
| | |
| Why can’t I | Federal law gives you the right to limit only: |
| limit all sharing? | • Sharing for affiliates’ everyday business purposes—information about your creditworthiness. |
| | • Affiliates from using your information to market to you. |
| | • Sharing for non-affiliates to market to you. |
| | State laws and individual companies may give you additional rights to limit sharing. |
| | |
| Definitions | |
| Affiliates | Companies related by common ownership or control. They can be financial and non-financial companies. |
| | |
| | YCG, LLC, is an affiliate of YCG Funds |
| Non-affiliates | Companies not related by common ownership or control. They can be financial and non-financial companies. |
| | |
| | • YCG Funds does not share with non-affiliates so they can market to you. |
| Joint marketing | A formal agreement between non-affiliated financial companies that together market financial products to you. |
| | |
| | • YCG Funds does not jointly market. |
(This Page Intentionally Left Blank.)
For Fund information and shareholder services, call
1-855-444-9243
web site: www.ycgfunds.com
YCG Funds
c/o U.S. Bancorp Fund Services, LLC
P.O. Box 701
Milwaukee, WI 53201-0701
Investment Adviser
YCG, LLC
3207 Ranch Road 620 South, Suite 200
Austin, TX 78738
Chief Compliance Officer
Vigilant Compliance, LLC
Gateway Corporate Center
223 Wilmington West Chester Pike, Suite 216
Chadds Ford, PA 19317
Legal Counsel
Foley & Lardner LLP
777 East Wisconsin Avenue
Milwaukee, WI 53202
Independent Registered Public Accounting Firm
Cohen & Company, Ltd.
1350 Euclid Avenue, Suite 800
Cleveland, OH 44115
Transfer Agent, Fund Accountant, and Fund Administrator
U.S. Bancorp Fund Services, LLC
615 East Michigan Street
Milwaukee, WI 53202
Custodian
U.S. Bank, N.A.
1555 North RiverCenter Drive, Suite 302
Milwaukee, WI 53212
Distributor
Quasar Distributors, LLC
615 East Michigan Street
Milwaukee, WI 53202
This report is submitted for the general information of shareholders of the
YCG Enhanced Fund. It is not authorized for distribution to prospective investors unless accompanied or preceded by an effective Prospectus for the Fund, which contains more information concerning the Fund’s investment policies, as well as fees and expenses and other pertinent information. Read the Prospectus carefully.
Item 2. Code of Ethics.
The registrant has adopted a code of ethics that applies to the registrant’s principal executive officer and principal financial officer. The registrant has not made any substantive amendments to its code of ethics during the period covered by this report. The registrant has not granted any waivers from any provisions of the code of ethics during the period covered by this report.
A copy of the registrant’s Code of Ethics is filed herewith.
Item 3. Audit Committee Financial Expert.
The registrant’s board of trustees has determined that there is at least one audit committee financial expert serving on its audit committee. Travis E. Oliphant is the “audit committee financial expert” and is considered to be “independent” as each term is defined in Item 3 of Form N‑CSR.
Item 4. Principal Accountant Fees and Services.
The registrant has engaged its principal accountant to perform audit services, audit-related services, tax services and other services during the past two fiscal years. “Audit services” refer to performing an audit of the registrant's annual financial statements or services that are normally provided by the accountant in connection with statutory and regulatory filings or engagements for those fiscal years. “Audit-related services” refer to the assurance and related services by the principal accountant that are reasonably related to the performance of the audit. “Tax services” refer to professional services rendered by the principal accountant for tax compliance, tax advice, and tax planning. The following table details the aggregate fees billed or expected to be billed for each of the last two fiscal years for audit fees, audit-related fees, tax fees and other fees by the principal accountant.
| | FYE 11/30/2016 | FYE 11/30/2015 |
| Audit Fees | $13,000 | $13,000 |
| Audit-Related Fees | $0 | $0 |
| Tax Fees | $3,000 | $2,500 |
| All Other Fees | $0 | $0 |
The audit committee has adopted pre-approval policies and procedures that require the audit committee to pre‑approve all audit and non‑audit services of the registrant, including services provided to any entity affiliated with the registrant.
The percentage of fees billed by Cohen & Company, Ltd. applicable to non-audit services pursuant to waiver of pre-approval requirement were as follows:
| | FYE 11/30/2016 | FYE 11/30/2015 |
| Audit-Related Fees | 0% | 0% |
| Tax Fees | 0% | 0% |
| All Other Fees | 0% | 0% |
All of the principal accountant’s hours spent on auditing the registrant’s financial statements were attributed to work performed by full‑time permanent employees of the principal accountant. (If more than 50 percent of the accountant’s hours were spent to audit the registrant's financial statements for the most recent fiscal year, state how many hours were attributed to work performed by persons other than the principal accountant's full-time, permanent employees.)
The following table indicates the non-audit fees billed or expected to be billed by the registrant’s accountant for services to the registrant and to the registrant’s investment adviser (and any other controlling entity, etc.—not sub-adviser) for the last two years. The audit committee of the board of trustees/directors has considered whether the provision of non-audit services that were rendered to the registrant's investment adviser is compatible with maintaining the principal accountant's independence and has concluded that the provision of such non-audit services by the accountant has not compromised the accountant’s independence.
| Non-Audit Related Fees | FYE 11/30/2016 | FYE 11/30/2015 |
| Registrant | $0 | $0 |
| Registrant’s Investment Adviser | $0 | $0 |
Item 5. Audit Committee of Listed Registrants.
Not applicable to registrants who are not listed issuers (as defined in Rule 10A-3 under the Securities Exchange Act of 1934).
Item 6. Investments.
Schedule of Investments is included as part of the report to shareholders filed under Item 1 of this Form.
Item 7. Disclosure of Proxy Voting Policies and Procedures for Closed-End Management Investment Companies.
Not applicable to open-end investment companies.
Item 8. Portfolio Managers of Closed-End Management Investment Companies.
Not applicable to open-end investment companies.
Item 9. Purchases of Equity Securities by Closed‑End Management Investment Company and Affiliated Purchasers.
Not applicable to open-end investment companies.
Item 10. Submission of Matters to a Vote of Security Holders.
Not Applicable.
Item 11. Controls and Procedures.
| (a) | The Registrant’s [President/Principal Executive Officer] and [Treasurer/Principal Financial Officer] have reviewed the Registrant's disclosure controls and procedures (as defined in Rule 30a-3(c) under the Investment Company Act of 1940 (the “Act”)) as of a date within 90 days of the filing of this report, as required by Rule 30a-3(b) under the Act and Rules 13a-15(b) or 15d‑15(b) under the Securities Exchange Act of 1934. Based on their review, such officers have concluded that the disclosure controls and procedures are effective in ensuring that information required to be disclosed in this report is appropriately recorded, processed, summarized and reported and made known to them by others within the Registrant and by the Registrant’s service provider. |
| (b) | There were no changes in the Registrant's internal control over financial reporting (as defined in Rule 30a-3(d) under the Act) that occurred during the second fiscal quarter of the period covered by this report that has materially affected, or is reasonably likely to materially affect, the Registrant's internal control over financial reporting. |
Item 12. Exhibits.
| (a) | (1) Any code of ethics or amendment thereto, that is the subject of the disclosure required by Item 2, to the extent that the registrant intends to satisfy Item 2 requirements through filing an exhibit. Filed herewith |
(2) A separate certification for each principal executive officer and principal financial officer pursuant to Section 302 of the Sarbanes-Oxley Act of 2002. Filed herewith.
(3) Any written solicitation to purchase securities under Rule 23c‑1 under the Act sent or given during the period covered by the report by or on behalf of the registrant to 10 or more persons. Not applicable to open-end investment companies.
| (b) | Certifications pursuant to Section 906 of the Sarbanes‑Oxley Act of 2002. Furnished herewith. |
SIGNATURES
Pursuant to the requirements of the Securities Exchange Act of 1934 and the Investment Company Act of 1940, the registrant has duly caused this report to be signed on its behalf by the undersigned, thereunto duly authorized.
(Registrant) YCG Funds
By (Signature and Title)* /s/ Brian A. Yacktman
Brian A. Yacktman, President (Principal Executive Officer)
Date 01/19/2017
Pursuant to the requirements of the Securities Exchange Act of 1934 and the Investment Company Act of 1940, this report has been signed below by the following persons on behalf of the registrant and in the capacities and on the dates indicated.
By (Signature and Title)* /s/ Brian A. Yacktman
Brian A. Yacktman, President (Principal Executive Officer)
Date 01/19/2017
By (Signature and Title)* /s/ William D. Kruger
William D. Kruger, Treasurer (Principal Financial Officer)
Date 01/19/2017
* Print the name and title of each signing officer under his or her signature.