| YCG ENHANCED FUND |
a series of the YCG Funds |
|
| |
| |
| |
| |
| |
| |
| |
| |
| |
| |
| Annual Report | |
| November 30, 2017 | Ticker Symbol: YCGEX |
YCG Enhanced Fund
MESSAGE TO SHAREHOLDERS
(Unaudited)
Dear Fellow Shareholder:
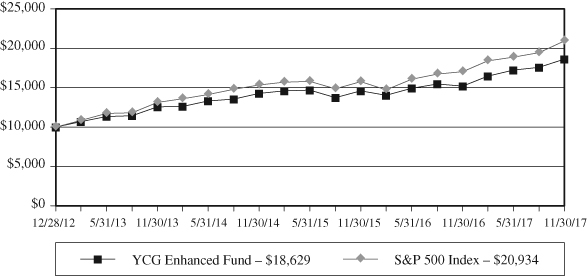
From its inception on 12/28/2012 to 11/30/2017, the YCG Enhanced Fund (the “Fund”) achieved an average annual total net return of 13.47% versus a 16.19% return for the S&P 500 Index.
Performance data quoted represents past performance and does not guarantee future results. Investment returns and principal value will fluctuate, and when sold, may be worth more or less than their original cost. The Fund imposes a 2.00% redemption fee on shares held less than 30 calendar days. Performance data current to the most recent month end may be obtained by calling 1-855-444-9243. The Gross Expense Ratio is 1.36% as disclosed in the most recent Prospectus.
For the fiscal year ended November 30, 2017, the YCG Enhanced Fund achieved a total net return of 22.58%. During the same time period, the S&P 500 Index had a total return of 22.87%. The Fund’s top five equity winners and top five equity losers during this period were as follows:
| TOP FIVE EQUITY | TOP FIVE EQUITY |
| WINNERS | LOSERS |
| MasterCard, Inc. – Class A | Discovery Communications, Inc. – Class C |
| Unilever NV – ADR | Express Scripts Holding Co. |
| MSCI, Inc. | Western Union Co. |
| Nestle SA – ADR | Berkshire Hathaway, Inc. – Class B |
| Cie Financiere Richemont SA – ADR | CVS Health Corp. |
The top 5 equity winners and equity losers are determined based on a ranking of the dollar gains and losses of all the equity securities owned in the portfolio over the period specified above. This calculation excludes the portfolio’s options positions, which may have experienced a gain or a loss during the period specified. Additionally, the Fund seeks to maximize long term capital appreciation with reasonable investment risk. We believe that one year is too short a period to accurately assess the soundness of our investment strategy, and, thus, we try not to draw too many conclusions from the chart above. Instead, we evaluate ourselves by the Fund’s performance over a full economic cycle, which we define as a period that includes both a recession and an economic expansion.
At the time of this writing, the Fund has just celebrated its five-year anniversary. As we reflect back on the last five years, we are struck (as we often have been during our two decades of investing) by the truth in Warren Buffett’s remark that investing is simple but not easy. Charlie Munger put it even more bluntly, “It’s not supposed to be easy. Anyone who finds it easy is stupid.” While the key principles of investing can be absorbed in a weekend, the successful practice of investing requires a lifelong commitment. In order to achieve attractive long-term risk-adjusted returns, an
YCG Enhanced Fund
investor must accumulate a wide breadth of knowledge about the world, develop mental models that accurately explain the workings of the world, and continuously test these mental models against the constant flow of new evidence as the future becomes the present and then the past. In some cases, this new evidence leads to small modifications of these models. In others, it leads to the wholesale scrapping of existing models and the creation of brand new ones.
At first glance, the investment challenge we’ve described appears hopelessly complex. However, because we’ve chosen a strategy that doesn’t force us to make a buy or sell decision on every single one of the tens of thousands of stocks available, we can focus our time and effort on identifying the small subset of investment opportunities that align with the mental models about which we are most confident. These high-confidence mental models include our belief that pricing power is derived from goods that reliably confer status and/or cost a small amount relative to both the value they provide and the purchaser’s disposable income. They also include our belief that investors’ overconfidence, avarice, and impatience lead them to generally overprice risky stocks and underprice boring, conservative ones. . . except, of course, in crashes, when their loss aversion trumps all other factors. Finally, they include our belief that investors overestimate their ability to profitably time their entry into and exit out of the market and, for that matter, specific stocks as well. Therefore, despite the rapidly changing world, our core investment strategy is unlikely to change. We continue to 1) focus mainly on high market share, conservatively levered, stable businesses with enduring pricing power and compelling long-term growth opportunities; 2) attempt to acquire these businesses at reasonable valuations when they are experiencing or when investors fear they will soon experience short-term macroeconomic and/or operational problems; and 3) stay fully invested in most market environments.
We believe our recent purchase of CBRE Group serves as a great example of our strategy in action. As you will see in the below rationale, the purchase required us to determine whether the business met our quality criteria, to assess whether investor fears about industry weakness had caused a mispricing, and to overcome a behavioral bias against buying a cyclical business more than eight years into a bull market.
CBRE Group
CBRE Group is the largest commercial real estate brokerage in the world. We believe it is a great business because 1) the commercial real estate market has favorable long-term growth tailwinds; 2) the brokerage business model is excellent; 3) CBRE has unique scale, dominance, and expertise in the industry; and 4) CBRE management is aligned with shareholders and executing a strategy that we believe is likely to increase business value over time.
The first reason that CBRE is a great business, in our opinion, is that it operates in an industry with favorable long-term growth tailwinds. The most important component
YCG Enhanced Fund
of this growth is aggregate commercial real estate’s historical inflation protection.1 In other words, commercial real estate has exhibited pricing power. Interestingly, despite its seemingly more direct connection to economic activity, commercial real estate is not a special case, as aggregate residential real estate prices have also grown at rates roughly equal to inflation.2 We believe real estate derives this ability to raise prices from its positional characteristics. Like beauty, another classic positional good, real estate derives its value much less from some absolute standard of livability than from its positioning relative to other people. In beauty’s case, all else equal, the more attractive you are relative to other people, the more successful you’ll be in competing for mates and economic resources. In real estate’s case, all else equal, the more proximate you are to other people, the more wealth you’ll generate and people you’ll meet, which, in turn, enhances your and your family’s survival and reproduction chances.2 There are other factors that create value in real estate, such as the value of the economic resources underlying it in the case of oil-rich land or the status-signaling value of owning an island, but the vast majority of the long-term value of real estate derives from its proximity to other people.
What explains this linkage in real estate value and population density, and will it continue into the indefinite future? Ultimately, the fundamental reason for this linkage is the positive-sum nature of cooperation, in which cooperation between individuals leads to greater gains in wealth than can be achieved by those same individuals if they act independently. For example, a group of hunters are far more likely to survive over time if they team up to hunt food and then share it amongst themselves than if they each try to capture their own prey, many examples of which are larger and fiercer than any individual human. Over human history, this positive-sum nature of cooperation has led to an increased frequency, scale, and intimacy of cooperation through a positively reinforcing cycle of increased human sociality, first through the genes as the more social among us were the ones who were more likely to survive and reproduce and then through culture as various societal innovations like government monopoly of the legitimate use of physical force, capitalism, property rights, and democracy served to incentivize prosocial (positive-sum) behavior like cooperation and disincentivize anti-social (negative or zero sum) behavior like murder. Additionally, many of our modern technologies such as farming, electricity, air-conditioning, infrastructure, the internet, and medicine have accelerated our increasing proximity by reducing many of the resource constraints and other negative externalities that limit population density.
Therefore, as in other arms races, because population density is correlated with wealth creation, and status is correlated with wealth, we believe humans, on average, will
_______________
1 | See https://dspace.mit.edu/bitstream/handle/1721.1/63255/100yearsofcommer00whea.pdf?sequence=1. |
2 | Evidence that proximity generates more wealth includes economic studies on population density’s relationship to growth as well as the current distributions of real estate value and wealth between urban and rural areas. See https://www.ideals.illinois.edu/bitstream/handle/2142/26678/relationshipbetw538simo.pdf?sequence=1 and http://www.savills.com/_news/article/105347/198559-0/1/2016/world-real-estate-accounts-for-60--of-all-mainstream-assets. |
YCG Enhanced Fund
contribute a constant or rising share of their income to real estate over time since not doing so would mean losing status and economic opportunity relative to those who do. We believe this dynamic should enable long-term real estate spending to grow at least as fast as global GDP, with this increased spending being divided between existing real estate (through higher aggregate prices) and new real estate (driven by population growth and perhaps increased commercial and residential square footage per capita as wealth per capita grows).3 Importantly, CBRE is over-indexed to urban areas, which should experience faster growth than the commercial real estate market overall because of the continued migration from villages to cities, particularly in developing countries. By 2030, roughly 1 billion more people are expected to live in cities while rural populations are expected to remain flat, increasing the global proportion of city-dwellers to over 60%. By 2050, 70% of the world’s population will be urban.4
The second reason that we believe CBRE is a great business is that the brokerage business model possesses many wonderful attributes, including network effects, brand value, and low capital intensity. First, like many other networks, brokerages connect buyers and sellers of various goods and services. This connection is value-added if it lowers the transaction costs of the buyer and/or the seller of these services. In many cases, it lowers these transaction costs dramatically. To understand how this reduction in cost occurs, let’s examine CBRE’s industry, commercial real estate. Most businesses need real estate for their offices, their stores, and their factories, but, for many of these businesses, transacting in real estate is neither their core competency nor a frequent activity. Thus, it would be a bad investment for them to maintain the necessary knowledge, staff, and relationships with other real estate participants. Instead, it is much cheaper and more efficient for an intermediary such as CBRE to form relationships with the various business and real estate owners. By aggregating these relationships, it can amortize its costs against far more transactions than any of the individual businesses can on their own, reducing the real estate costs of all participants while increasing its own economic profits. Additionally, because CBRE’s value to buyers increases with the number of sellers in its network and its value to sellers increases with the number of buyers in its network, CBRE’s competitive advantages strengthen as it scales. Furthermore, as it becomes one of the first commercial real estate brokerages to globalize, we believe CBRE is experiencing a step-change in its competitive advantages since the regulatory, cultural, and legal complexity of cross-border activity requires a much larger investment that prices out many smaller players.
_______________
3 | See https://www.eia.gov/consumption/commercial/reports/2012/buildstock/ and http://www.aei.org/publication/new-us-homes-today-are-1000-square-feet-larger-than-in-1973-and-living-space-per-person-has-nearly-doubled/. |
4 | See http://www.prb.org/Publications/Lesson-Plans/HumanPopulation/Urbanization.aspx, http://www.un.org/en/development/desa/population/publications/pdf/urbanization/the_worlds_cities_in_2016_data_booklet.pdf, and https://www.fastcodesign.com/1669244/by-2050-70-of-the-worlds-population-will-be-urban-is-that-a-good-thing. |
YCG Enhanced Fund
The second favorable attribute of the brokerage business model is brand value. Brands such as CBRE command pricing power if they lower customers’ search costs and/or enhance their status. Google, Amazon, Facebook, and a host of other companies are eroding the first of these advantages by lowering search costs for consumers. When combined with the big technology firms’ success in lowering start-up/distribution costs for new competitors, this reduction in search costs has caused increased market fragmentation in many branded industries as niche brands with varied value propositions can often better serve disparate consumers than one-size-fits-all solutions. Nevertheless, we believe high relative mindshare will continue to confer an advantage on many well-known brands, especially when the due diligence of a good, service, or experience is time-intensive and complex, as is the case in commercial real estate brokerage. In contrast to search costs, we believe status-enhancement, the second source of brand pricing power, may be increasing in importance over time. Increasing urbanization and globalization create more interactions with strangers, making universal signals of status more valuable. Additionally, social media appears to be adept at both tuning up status-signaling desires and providing more opportunities to fulfill these impulses. Status-signaling generally breaks down into two categories: 1) advertising one’s loyalty to a tribe, and 2) advertising one’s positioning within a tribe. One effective way to advertise one’s positioning within a tribe is to associate with other high-status members. In a business setting, market leaders and other types of high-achieving firms are high-status. Thus, for example, getting Goldman Sachs to perform your IPO or working with CBRE on your real estate sale can raise your status as a businessperson, making it worthwhile to pay slightly more to attach your company to the desirable brand. Furthermore, in some business situations, such as in principal-agent relationships, the purchaser uses the brand more as a tool to maintain status than to gain it. In these cases, agents (employees) are acting on behalf of a principal (the owner) to select service providers. Agents generally prefer the easiest and safest decisions on service provider choices such as commercial real estate brokerage because the upside to the agent’s career from a good unconventional choice rarely compensates for the downside to his/her career from a poor one. Thus, from the agent’s perspective, the unconventional choice is not worth the extra effort and risk, even in cases where the conventional choice is more expensive. This common principal-agent problem birthed the popular aphorism, “You never get fired for choosing IBM.” Increasingly, large pensions and endowments, which are even more susceptible to the brand effects discussed above, are investing in commercial real estate.5 We believe this trend will support and perhaps increase the value of CBRE’s brand.
One interesting implication of brokerage network effects and brand value is that, contrary to many other businesses, we believe brokerages generally add value by consolidating. Since commercial real estate brokerage has a large relationship
_______________
5 | See slide 11 in September 2017 CBRE presentation at http://ir.cbre.com/phoenix.zhtml%3Fc%3D176560%26p%3Dirol-presentations. |
YCG Enhanced Fund
component to it, the main reason for CBRE to buy a smaller brokerage is to gain access to the brokers and their existing customer relationships. This benefits CBRE greatly because of the geometric effects of increasing its network of relationships. Additionally, the acquisition likely increases the productivity of the individual brokers since they can leverage CBRE’s superior brand and resources to more easily acquire new customers. We believe these positive effects outweigh the traditional negatives of acquisitions such as CEOs’ incentives to empire-build and the difficulties of integrating separate organizational cultures.
Finally, brokerages are capital-lite since a substantial piece of their value is in the brokers they hire. This characteristic enables brokerages to return high percentages of earnings to shareholders even as they grow. Also, because people are a significant portion of the cost structure, they can generally continue to produce cash even in bad downturns since they can pay their people less or downsize. Finally, they don’t take meaningful capital risk on the properties they broker and service, which generally require significant leverage to generate attractive returns and thus force investors to risk bankruptcy in bad downturns. Brokerages, on the other hand, because of the favorable characteristics already mentioned, don’t require leverage to generate attractive returns but can safely support moderate amounts of it.
While we believe the brokerage business model has many positive characteristics, no business is completely future-proof. We think there are three main risks to the long-term economics of the brokerage business model, all of which we believe are low probability in CBRE’s case given the dynamics of the commercial real estate market.
First, the brokerage’s end market could shrink. As an example, this risk may soon befall the auto insurance industry. The widespread adoption of autonomous vehicles would dramatically reduce the need for personal auto insurance, severely impairing the value of brokerages focused on selling this product. In contrast, because of the already-discussed causal relationship between population density and wealth creation, we believe the commercial real estate market will continue to grow over time.
Another risk to brokerages is customers or suppliers becoming much more concentrated, as currently appears to be occurring in the advertising industry. The advertising agencies began as intermediaries between businesses looking to purchase advertising and the newspaper industry, which supplied the attention of millions of consumers. Instead of each company forming relationships with the thousands of newspapers in the country, it made sense for the companies and newspapers to go through a middleman. Now, with Google and Facebook taking more and more share of the advertising market and possessing a virtual duopoly in the digital space, advertising agencies’ value proposition is declining. We believe the commercial real estate market is at low risk of owner, buyer, or lessor concentration given both the size of the industry and the variety of interested parties.
The final potential risk to the brokerage model would be a disintermediation of the brokering function. We believe this risk declines the more consequential, expensive to
YCG Enhanced Fund
reverse, complex/bespoke, and infrequent the transaction. Commercial real estate purchases are consequential (large dollar transactions), difficult and expensive to reverse (illiquidity + substantial brokerage fees), and complex/bespoke given the wide variety of zoning, demographic, regulatory, tax, topographical, and local supply/demand considerations. They are also quite infrequent, with many buildings and/or leases turning over on the timescale of years or decades. All these factors make it hard to generate an efficiently-priced and liquid market in each property, increasing the purchaser’s need for outside expertise. We believe these factors lead to few scalable solutions that could disrupt the business. Contrast this situation with the travel agency, where Priceline and other competitors are clearly disintermediating the traditional brokerage model. In the travel industry, each individual hotel, airline, and rental car purchase is generally of low consequence in terms of money, importance to overall life, and even experience of the trip since the city, business meeting, or social event is often the main attraction, not the hotel. Additionally, travel purchases are relatively cheap and easy to reverse because they are short-term rentals that automatically expire after the reservation period ends and because high turnover of rooms, seats, and cars enables providers to offer 24-hour cancellation policies, seamless online or telephone cancellation, and fees for cancellation that, while annoying relative to the total cost of the flight or hotel, are still relatively small compared to a person’s or business’s annual income. Furthermore, the contract terms on these purchases are generally standard and simple. Finally, the high turnover of rooms, seats, and cars generates efficient markets with transparent pricing as well as high numbers of online reviews that enable customers to easily research the differences between the various options available to them. In summary, using the above framework, we think commercial real estate brokerage has low risk of technological disintermediation.
The third reason we believe CBRE is a great business is that it has unique scale, dominance, and expertise in commercial real estate brokerage. In addition to its brokerage business (which includes property sales as well as appraisal & valuation), CBRE services leases and provides facilities management outsourcing, both of which are complementary to the brokerage business while also serving to reduce CBRE’s cyclicality. In all four of these businesses, CBRE is the market share leader.6 Additionally, it generated 2016 revenues of $13.1 billion in global revenue versus its next biggest competitor, Jones Lang LaSalle, at $6.3 billion. Similarly, it has the most offices worldwide with 448 compared to only 286 at Jones Lang LaSalle.7 This global network, which includes 201 offices in the Americas, 163 in Europe, the Middle East, and Africa (“EMEA”), and 84 in Asia and the Pacific, reduces CBRE’s dependence on any one geographic region and also provides ample future growth opportunity as many of these markets are underdeveloped with only 12% of revenue
_______________
6 | See slide 1 in CBRE September 2017 investor presentation at http://ir.cbre.com/phoenix.zhtml%3Fc%3D176560%26p%3Dirol-presentations. Also, see https://www.cbre.com/about/media-center/rca-rankings-2016. |
7 | As of December 31, 2016. |
YCG Enhanced Fund
coming from Asia-Pacific and 31% coming from EMEA despite 19% and 36%, respectively, of offices being located in these regions. Furthermore, the industry research firm Lipsey has named CBRE the number 1 commercial real estate brand in each of the last 16 years, and it’s been Euromoney’s Global Real Estate Advisor of the Year five years in a row. Finally, like insurance brokerage, another of our favorite brokerage categories, there are only a limited number of players with global scale in commercial real estate, which leads to a somewhat oligopolistic industry structure and thus more pricing power since a multinational corporation or institution has few global one-stop-shop choices. This structure creates a positive-feedback situation. As more and more multi-nationals choose CBRE, the company widens its lead over smaller global and regional players, leading to even more multi-nationals choosing them in the future.
The fourth and final reason we believe CBRE is a great business is that management’s interests and current strategy are aligned with long-term value creation. With over $25 million of stock as well as accountability to ValueAct (which owns 8.5% of the outstanding shares, possesses a board seat, and is one of the few long-term oriented activists), we believe CBRE’s CEO, Bob Sulentic, is properly incentivized. His strategic decisions since he became CEO in 2012 reinforce this view. Over the last decade, by intentionally increasing CBRE’s recurring revenue sources from 61% of total fee revenue in 2006 to 73% in Q2 2017, he and his predecessor have significantly decreased the cyclicality of CBRE’s revenue and profit streams.8 The main driver of this recurring revenue share gain is CBRE’s increased investment, both organically and through acquisitions, in facilities management outsourcing. Besides providing a more stable revenue stream, CBRE’s focus on facilities management outsourcing business has increased its ability to manage all aspects of a customer’s real estate needs, boosting client retention and cross-selling opportunities. Additionally, recognizing the inherent network effects of brokerage and still-significant fragmentation of the commercial real estate brokerage industry, Sulentic is growing the size and scale of the core brokerage business through organic office growth as well as tuck-in acquisitions. Finally, despite the reduced cyclicality of its revenue streams, CBRE’s management team has kept its Debt/EBITDA and interest coverage metrics at lower, safer levels than CBRE maintained during the years leading up to the global credit crisis of 2008.
If CBRE’s future is so bright, why are investors fearful about the stock? As with many of the opportunities we’ve discussed in our past letters, we believe investors are overly focused on two short-to medium- term issues that they believe they can time their entry and exit around.
_______________
8 | See slide 5 in CBRE September 2017 investor presentation at http://ir.cbre.com/phoenix.zhtml%3Fc%3D176560%26p%3Dirol-presentations. |
| | |
YCG Enhanced Fund
The first issue is related to the commercial real estate cycle. Like most other assets, persistently low interest rates have driven up commercial real estate prices, perhaps to unsustainable levels. Additionally, because of the length of the bull market and the loosening of credit standards by some market participants, many believe we are quite late in the credit cycle. While these arguments have merit, we believe there are counterarguments that are also reasonable. For instance, the global economic recovery since the credit and real estate crisis of 2008 has been very anemic relative to historical recoveries. Thus, we may not have built up the excesses necessary for a recession yet. Furthermore, people generally overestimate the risk of an event when a similar one has occurred recently and is particularly salient, and we believe the global financial crisis of 2008 checks both these boxes. Moreover, this overestimation may be further exacerbated by the fact that, unlike independent events such as the flipping of coins, financial crises generally result in the participants changing their behavior, at least for a time. In the case of the global financial crisis of 2008, these behavioral changes have included more regulation, less financial leverage, stricter underwriting standards, cost-cuts, an increase in non-cyclical business mix, and a less torrid pace of real estate development, all of which may have further reduced the odds of a real estate or credit crisis reoccurrence. As we detailed above, CBRE itself has taken many of these steps. In the end, as we have historically emphasized, we believe trying to predict the short-to medium- term prospects of the economy or markets is a fool’s errand, and we view significant market fear about the macro-economic environment as more likely to result in the underpricing of a great business than the overpricing of one.
The second issue that concerns investors is the health of U.S. retail, which comprises 17% of total U.S. commercial real estate,9 because of its high retail square footage per capita combined with explosive online sales growth.10 While these are certainly potential issues, we would note a couple of less publicized facts that contradict this narrative. First, retail commercial real estate square footage growth has increased at a much slower pace than sales growth over the last 8 years.11 In contrast to draconian predictions of massive retail store contraction, this data suggests that the more likely path to fixing capacity issues is a muddle-through scenario in which very slow retail square footage growth combines with steadily rising retail sales to gradually fill up any excess retail space.
_______________
9 | See https://www.eia.gov/consumption/commercial/data/2012/bc/cfm/b1.php. For the purposes of the referenced calculation, we are defining total retail square footage as the total mercantile category plus food sales and services. |
10 | See slide 6 at http://investor.ggp.com/sites/ggp.investorhq.businesswire.com/files/doc_library/ file/Investor_Presentation_March_2017.pdf. |
11 | See http://www2.census.gov/retail/releases/current/arts/ecommerce.xls, pages 3,4, and 5 in http://www.us.jll.com/united-states/en-us/Research/US-Retail-Outlook-Q4-2016-JLL.pdf, and http://kk.org/extrapolations/files/2016/08/ICSC-shopping-center-growth-1975-2014.png. |
YCG Enhanced Fund
Secondly, many subsectors of retail are performing quite well, with expected net store growth of 4,080 in 2017 and 5,500 in 2018 as well as revenue growth of $121.5 billion through the first seven months of 2017.12 This growth leads us to question whether the U.S. even has a retail capacity issue. Indeed, while it’s possible that U.S. retail is massively overstored, we think it’s more likely that investors are making a classic error of overweighting high profile large losses and underweighting low profile but more numerous, and larger in aggregate, small gains. In other words, they are overweighting the sales woes and store closures of the high-profile failures (with just 16 chains accounting for 48.5% of the total number of stores closing and five of these 16 representing 28.1% of the total closings13) and underweighting the sales growth and store openings of the many smaller, newer retail concepts. The same sort of logic applies to globalization and the industrial revolution and their effects on wealth and jobs. While globalization has resulted in some high-profile job losses in certain sectors of the economy, most notably manufacturing, most economists and investors acknowledge the incredibly diffuse but, in aggregate, larger gains in wealth that the population has experienced in the form of cheaper goods and services. Most economists argue that this increased wealth has also resulted in more job opportunities since this new purchasing power increases the entrepreneur’s incentives to produce more existing or create new desirable goods or services. Similarly, despite destroying almost all farming jobs, the industrial revolution dramatically increased food production, countries’ populations, median and average wealth per capita, and job opportunities.
Moreover, don’t forget that online retailers need distribution centers and potentially brick-and-mortar stores as well. In fact, the winners in retail will probably be the ones that can master the all-channel solution, as Amazon itself has potentially foreshadowed through its Whole Foods acquisition. In our view, humanity’s increasing wealth will likely result, as it has historically, in more variety of services, goods, and experiences over time, not less, and we believe future job opportunities and retail shopping/store choices are no exception. In any case, even if we’re wrong about U.S. retail’s aggregate pricing and square footage growth, we believe that its size relative to total U.S. commercial real estate square footage combined with CBRE’s vast global growth opportunities make its cloudy future relatively unimportant to the long-term value of CBRE.
The logical next question to ask, when analyzing CBRE, is whether the concerns surrounding the health of the commercial real estate cycle and U.S. retail are properly discounted in the price. In contrast to the market participants who are trying to time their short-term entry and exit based on short-to medium- term macroeconomic and
_______________
12 | See http://www.centromarca.pt/folder/conteudo/1700_7_Debunking-the-Retail-Apocalypse-Final-Enterprise.pdf and pages 7 and 8 in http://www.us.jll.com/united-states/en-us/Research/US-Retail-Outlook-Q4-2016-JLL.pdf. |
13 | See https://www.chainstoreage.com/article/report-debunks-so-called-retail-apocalypse-more-stores-opening-closing/. |
YCG Enhanced Fund
cyclical factors, we are focused on buying assets for less than what we believe they are worth and on holding them for a long time. Thus, our approach to these risks is to attempt to assess whether 1) the business is likely to be making significantly more money ten years from now under the vast majority of likely scenarios, 2) the return from owning the stock is likely to be good relative to our other stocks on a risk-adjusted basis, and 3) the combination of the company’s financial and operational leverage is conservative enough that we are very likely to make it through even a very bad economic environment with our ownership stake intact. Since we recognize that we can’t predict whether a cheap asset will become cheaper, if the stock meets these three criteria, we buy it. If the stock declines more and these three criteria continue to remain, we buy more.
In CBRE’s case, based on our view of its competitive advantages and growth opportunities, we ran various scenarios including a correction equal to 2008 occurring next year, in 5 years, and so on. Based on this scenario analysis, we believed the business was highly likely to be bigger and more profitable ten years hence. Additionally, based also on its very discounted valuation of less than 15x our estimate of recurring cash earnings (versus the mid-twenties multiple of earnings that many of our other portfolio companies commanded), we believed we were likely to get adequate long-term returns in almost all these scenarios. Thus, while CBRE has a broader probability distribution of future cash flows than our other holdings given its cyclical risks, we believed our forward expected rate of return was higher than in our average holding, compensating us for this additional risk and making CBRE’s risk-adjusted return comparable to our other investments. Finally, we think it’s very hard to construct a scenario where the company is forced to dilute our ownership given the change in the mix of recurring revenue combined with the lower leverage, making the probability of a catastrophic loss extremely low, in our view. Since CBRE passed all three tests (and, as an added bonus, diversified our portfolio cash flows), we bought it. If it turns out that we’re wrong about the probability of an imminent down-cycle in commercial real estate but that we still believe we’re correct in our assessment of the company’s competitive advantages, then we’ll buy more (unless, of course, an even more attractive opportunity presents itself).
Concluding Remarks
One common theme among the high confidence mental models that we described at the outset of this letter is that institutional and behavioral biases act in a variety of ways to irrationally shorten the investment time frames of most market participants. As our CBRE analysis demonstrates, our investment strategy attempts to exploit this short-termism and the mispricings it creates. Our ability to implement this strategy is in no small part due to you, our equally long-term-oriented clients. We thank you for partnering with us during the first five years of the Fund, and we will continue to work diligently on your behalf to generate the best long-term risk-adjusted returns we can, hopefully for decades to come.
YCG Enhanced Fund
As always, please feel free to call us with any questions or concerns. We are here to help.
Sincerely,
The YCG Team
Past performance does not guarantee future results.
Mutual fund investing involves risk. Principal loss is possible. The Fund is non-diversified, meaning it may concentrate its assets in fewer individual holdings than a diversified fund. Therefore, the Fund is more exposed to individual stock volatility than a diversified fund. The Fund invests primarily in equity securities without regard to market capitalization, thus investments will be made in mid and smaller capitalization companies, which involve additional risks such as limited liquidity and greater volatility. The Fund may also write put options and covered call options on a substantial portion of the Fund’s long equity portfolio, which have the risks of early option contract assignment forcing the Fund to purchase the underlying stock at the exercise price which may be the cause of significant losses due to the failure of correctly predicting the direction of securities prices, interest rates and currency exchange rates. The investment in options is not suitable for all investors. Covered call writing may limit the upside of an underlying security. The Fund may also invest in foreign securities which involve political, economic and currency risks, greater volatility, and differences in accounting methods. Investments in debt securities typically decrease in value when interest rates rise. This risk is usually greater for longer-term debt securities. Investment in lower-rated, non-rated and distressed securities presents a greater risk of loss to principal and interest than higher-rated securities.
Diversification does not guarantee a profit or protect from loss in a declining market.
Fund holdings and sector allocations are subject to change at any time and should not be considered recommendations to buy or sell any security. Please see the Schedule of Investments in this report for a complete list of Fund holdings.
The S&P 500 Index is a stock market index based on the market capitalizations of 500 leading companies publicly traded in the U.S. stock market. It is not possible to invest directly in an index.
Debt/EBITDA is a widely used leverage metric. It is the ratio of a company’s debt to its earnings before interest, taxes, depreciation, and amortization.
Cash flow is a measure of changes in a company’s cash account during an accounting period, specifically its cash income minus the cash payments it makes. All else being equal, we greatly prefer companies that have high “free cash flows,” which we define as the cash flow from operations that is left over after spending on maintenance capital expenditures and acquisitions that are required to protect the business. In other words, it’s the cash flow from operations that is free and clear to be distributed to shareholders in the form of dividends and share repurchases, and/or to be allocated towards ways to grow the existing business through means such as “growth” acquisitions or new capital expenditures, or simply pay down debt. Typically, we calculate this by looking at a normalized view of net income plus depreciation and amortization minus the maintenance capital expenditures and acquisitions that are required to protect the business, adjusted for often overlooked items such as pensions, stock option expenses, and leases.
The forward expected rate of return of a stock is our probability-weighted estimate of the compound average annual return we believe we are likely to achieve by owning the stock. Using our methodology, the forward expected rate of return is the sum total of the free cash flow per share of the company divided by its price (its “Free Cash Flow Yield”) and the long-term rate at which we expect these free cash flows to grow (the “Growth Rate of Free Cash Flow”).
YCG Enhanced Fund
EXPENSE EXAMPLE
For the six months ended November 30, 2017 (Unaudited)
As a shareholder of the YCG Enhanced Fund (the “Fund”), you incur ongoing costs, including management fees and other Fund expenses. If you invest through a financial intermediary, you may also incur additional costs such as a transaction fee charged on the purchase or sale of the Fund or an asset-based management fee. This example is intended to help you understand your ongoing costs (in dollars) of investing in the Fund and to compare these costs with the ongoing costs of investing in other mutual funds.
The Example is based on an investment of $1,000 invested at the beginning of the period and held for the entire period from June 1, 2017 to November 30, 2017.
Actual Expenses
The first line of the table on the next page provides information about actual account values and actual expenses. You may use the information provided in this line, together with the amount you invested, to estimate the expenses that you paid over the period. Simply divide your account value by $1,000 (for example, an $8,600 ending account value divided by $1,000 = 8.6), then multiply the result by the number in the first line under the heading entitled “Expenses Paid During Period” to estimate the expenses you paid on your account during the period.
Hypothetical Example for Comparison Purposes
The second line of the table on the next page provides information about hypothetical account values and hypothetical expenses based on the Fund’s actual expense ratio and an assumed rate of return of 5% per year before expenses, which is not the Fund’s actual return. The hypothetical account values and expenses may not be used to estimate the actual ending account balance or expenses you paid for the period. You may use this information to compare the ongoing costs of investing in the Fund and other funds. To do so, compare this 5% hypothetical example with the 5% hypothetical examples that appear in the shareholder reports of the other funds.
YCG Enhanced Fund
EXPENSE EXAMPLE (continued)
For the six months ended November 30, 2017 (Unaudited)
Please note that the expenses shown in the table are meant to highlight your ongoing costs only and do not reflect any costs that may be associated with investing in the Fund through a financial intermediary. Therefore, the second line of the table is useful in comparing the ongoing costs only, and will not help you determine the relative total costs of owning different funds. In addition, if any costs associated with investing through a financial intermediary were included, your costs would have been higher.
| | | | Expenses Paid |
| | Beginning | Ending | During Period(1) |
| | Account Value | Account Value | 06/01/17 – |
| | 06/01/17 | 11/30/17 | 11/30/17 |
| Actual | $1,000.00 | $1,080.70 | $6.21 |
| Hypothetical (5% return | | | |
| before expenses) | 1,000.00 | 1,019.10 | 6.02 |
(1) | Expenses are equal to the Fund’s annualized expense ratio of 1.19%, multiplied by the average account value over the period, multiplied by 183/365 to reflect the period. |
YCG Enhanced Fund
GROWTH OF $10,000 INVESTMENT
(Unaudited)
This chart assumes an initial gross investment of $10,000 made on December 28, 2012 (commencement of the Fund’s operations). Returns shown include the reinvestment of all dividends. Returns shown do not reflect the deductions of taxes that a shareholder would pay on Fund distributions or the redemption of Fund shares. In the absence of fee waivers and reimbursements, when they are necessary to keep expenses at the expense cap, total return would be reduced. Past performance is not predictive of future performance. Investment return and principal value will fluctuate so that your shares, when redeemed, may be worth more or less than original cost. Index returns do not reflect the effects of fees or expenses. It is not possible to invest directly in an index.
| | | | Since Inception |
| | One Year | Three Year | (12/28/2012) |
| Annual Returns | | | |
| YCG Enhanced Fund | 22.58% | 9.28% | 13.47% |
| S&P 500 Index | 22.87% | 10.91% | 16.19% |
YCG Enhanced Fund
TOP TEN EQUITY HOLDINGS
November 30, 2017 (Unaudited)
| | | Percentage of |
| | | Net Assets |
| Colgate-Palmolive Co. | | | 6.59 | % |
| MasterCard, Inc. – Class A | | | 6.54 | % |
| PepsiCo., Inc. | | | 6.18 | % |
| MSCI, Inc. | | | 5.22 | % |
| Wells Fargo & Co. | | | 5.17 | % |
| L’Oreal SA – ADR | | | 5.00 | % |
| Aon PLC | | | 4.69 | % |
| Nestle SA – ADR | | | 4.68 | % |
| NIKE, Inc. – Class B | | | 4.64 | % |
| Procter & Gamble Co. | | | 3.66 | % |
| Total | | | 52.37 | % |
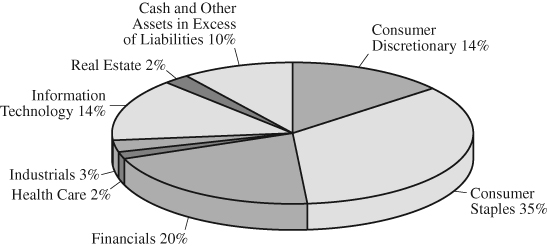
ALLOCATION OF PORTFOLIO HOLDINGS (as a % of net assets)
November 30, 2017 (Unaudited)
For presentation purposes, the Fund has grouped some of the industry categories. For purpose of categorizing securities with Section (8)(b)(1) of the Investment Company Act of 1940, as amended, the Fund uses more specific classifications.
YCG Enhanced Fund
SCHEDULE OF INVESTMENTS
November 30, 2017
| | | Shares | | | Value | |
| COMMON STOCKS – 89.96% | | | | | | |
| | | | | | | |
| Banks – 5.17% | | | | | | |
| Wells Fargo & Co. | | | 130,159 | | | $ | 7,350,079 | |
| | | | | | | | | |
| Beverages – 7.50% | | | | | | | | |
| Coca-Cola Co. | | | 41,047 | | | | 1,878,721 | |
| PepsiCo., Inc. | | | 75,379 | | | | 8,783,161 | |
| | | | | | | | 10,661,882 | |
| | | | | | | | | |
| Capital Markets – 10.55% | | | | | | | | |
| Moody’s Corp. | | | 21,500 | | | | 3,264,130 | |
| MSCI, Inc. | | | 57,630 | | | | 7,416,981 | |
| The Charles Schwab Corp. | | | 88,200 | | | | 4,303,278 | |
| | | | | | | | 14,984,389 | |
| | | | | | | | | |
| Food & Staples Retailing – 1.63% | | | | | | | | |
| CVS Health Corp. | | | 30,155 | | | | 2,309,873 | |
| | | | | | | | | |
| Food Products – 5.74% | | | | | | | | |
| Nestle SA – ADR | | | 77,826 | | | | 6,647,119 | |
| The Hershey Co. | | | 13,552 | | | | 1,503,323 | |
| | | | | | | | 8,150,442 | |
| | | | | | | | | |
| Health Care Providers & Services – 1.57% | | | | | | | | |
| Express Scripts Holding Co. (a) | | | 34,228 | | | | 2,230,981 | |
| | | | | | | | | |
| Household Products – 10.25% | | | | | | | | |
| Colgate-Palmolive Co. | | | 129,207 | | | | 9,361,047 | |
| Procter & Gamble Co. (b) | | | 57,834 | | | | 5,204,482 | |
| | | | | | | | 14,565,529 | |
| | | | | | | | | |
| Insurance – 4.69% | | | | | | | | |
| Aon PLC | | | 47,508 | | | | 6,661,572 | |
| | | | | | | | | |
| Internet & Direct Marketing Retail – 2.55% | | | | | | | | |
| The Priceline Group, Inc. (a) | | | 2,079 | | | | 3,616,857 | |
| | | | | | | | | |
| Internet Software & Services – 3.17% | | | | | | | | |
| Alphabet, Inc. – Class C (a) | | | 4,414 | | | | 4,508,504 | |
See notes to financial statements.
YCG Enhanced Fund
SCHEDULE OF INVESTMENTS (continued)
November 30, 2017
| | | Shares | | | Value | |
| COMMON STOCKS – 89.96% (continued) | | | | | | |
| | | | | | | |
| IT Services – 8.94% | | | | | | |
| MasterCard, Inc. – Class A | | | 61,780 | | | $ | 9,296,036 | |
| Western Union Co. | | | 173,342 | | | | 3,413,104 | |
| | | | | | | | 12,709,140 | |
| | | | | | | | | |
| Media – 3.42% | | | | | | | | |
| Discovery Communications, Inc. – Class C (a) | | | 108,509 | | | | 1,961,843 | |
| The Walt Disney Co. | | | 13,380 | | | | 1,402,491 | |
| Twenty-First Century Fox, Inc. – Class A | | | 46,953 | | | | 1,499,679 | |
| | | | | | | | 4,864,013 | |
| | | | | | | | | |
| | | | | | | | | |
| Personal Products – 9.49% | | | | | | | | |
| L’Oreal SA – ADR | | | 160,545 | | | | 7,109,896 | |
| The Estee Lauder Companies, Inc. | | | 14,593 | | | | 1,821,644 | |
| Unilever NV – ADR | | | 78,885 | | | | 4,554,820 | |
| | | | | | | | 13,486,360 | |
| | | | | | | | | |
| Professional Services – 2.66% | | | | | | | | |
| Verisk Analytics, Inc. (a) | | | 39,234 | | | | 3,782,942 | |
| | | | | | | | | |
| Real Estate Management & Development – 2.31% | | | | | | | | |
| CBRE Group, Inc. – Class A (a) | | | 75,724 | | | | 3,283,393 | |
| | | | | | | | | |
| Software – 2.16% | | | | | | | | |
| Microsoft Corp. | | | 36,513 | | | | 3,073,299 | |
| | | | | | | | | |
| Textiles, Apparel & Luxury Goods – 8.16% | | | | | | | | |
| Cie Financiere Richemont SA – ADR | | | 584,760 | | | | 5,003,791 | |
| NIKE, Inc. – Class B | | | 109,101 | | | | 6,591,883 | |
| | | | | | | | 11,595,674 | |
| TOTAL COMMON STOCKS | | | | | | | | |
| (Cost $94,034,603) | | | | | | | 127,834,929 | |
See notes to financial statements.
YCG Enhanced Fund
SCHEDULE OF INVESTMENTS (continued)
November 30, 2017
| | | Principal | | | | |
| | | Amount | | | Value | |
| SHORT-TERM INVESTMENTS – 7.61% | | | | | | |
| U.S. Treasury Bills – 7.61% | | | | | | |
| United States Treasury Bill | | | | | | |
| 0.000%, 02/01/2018 (a) | | $ | 2,000 | | | $ | 1,996 | |
| 0.000%, 02/08/2018 (a) | | | 4,208,000 | | | | 4,198,513 | |
| 0.000%, 02/22/2018 (a) | | | 3,620,000 | | | | 3,610,256 | |
| 0.000%, 03/01/2018 (a) | | | 103,000 | | | | 102,680 | |
| 0.000%, 03/08/2018 (a) | | | 800,000 | | | | 797,307 | |
| 0.000%, 03/22/2018 (a) | | | 582,000 | | | | 579,748 | |
| 0.000%, 04/05/2018 (a) | | | 868,000 | | | | 864,127 | |
| 0.000%, 04/12/2018 (a) | | | 114,000 | | | | 113,460 | |
| 0.000%, 04/19/2018 (a) | | | 214,000 | | | | 212,938 | |
| 0.000%, 04/26/2018 (a) | | | 99,000 | | | | 98,488 | |
| 0.000%, 05/03/2018 (a) | | | 25,000 | | | | 24,861 | |
| 0.000%, 05/10/2018 (a) | | | 96,000 | | | | 95,426 | |
| 0.000%, 05/17/2018 (a) | | | 27,000 | | | | 26,829 | |
| 0.000%, 05/24/2018 (a) | | | 78,000 | | | | 77,475 | |
| TOTAL SHORT-TERM INVESTMENTS | | | | | | | | |
| (Cost $10,807,419) | | | | | | | 10,804,104 | |
| Total Investments (Cost $104,842,022) – 97.57% | | | | | | | 138,639,033 | |
| Other Assets in Excess of Liabilities – 2.43% | | | | | | | 3,459,817 | |
| TOTAL NET ASSETS – 100.00% | | | | | | $ | 142,098,850 | |
Percentages are stated as a percent of net assets.
| ADR | American Depositary Receipt |
| (a) | Non-Income Producing. |
| (b) | A portion of this security is pledged as collateral on options written. As of November 30, 2017, the value of collateral is $2,699,700. |
The Global Industry Classification Standard (“GICS”) was developed by and/or is the exclusive property of MSCI, Inc. (“MSCI”) and Standard & Poor Financial Services LLC (“S&P”). GICS is a service mark of MSCI and S&P and has been licensed for use by U.S. Bancorp Fund Services, LLC.
See notes to financial statements.
YCG Enhanced Fund
SCHEDULE OF OPTIONS WRITTEN
November 30, 2017
| | | | | | Notional | | | | |
| | | Contracts | | | Amount | | | Value | |
| PUT OPTIONS (a) | | | | | | | | | |
| Alphabet, Inc. – Class C | | | | | | | | | |
| Expiration: February 2018; Exercise Price: $1,020.00 | | | 25 | | | $ | 2,550,000 | | | $ | 98,150 | |
| Expiration: February 2018; Exercise Price: $1,030.00 | | | 14 | | | | 1,442,000 | | | | 63,000 | |
| CBRE Group, Inc. – Class A | | | | | | | | | | | | |
| Expiration: December 2017; Exercise Price: $42.00 | | | 463 | | | | 1,944,600 | | | | 11,112 | |
| Expiration: December 2017; Exercise Price: $43.00 | | | 270 | | | | 1,161,000 | | | | 13,500 | |
| Expiration: January 2018; Exercise Price: $43.00 | | | 179 | | | | 769,700 | | | | 16,558 | |
| Moody’s Corp. | | | | | | | | | | | | |
| Expiration: January 2018; Exercise Price: $145.00 | | | 51 | | | | 739,500 | | | | 9,486 | |
| NIKE, Inc. – Class B | | | | | | | | | | | | |
| Expiration: January 2018; Exercise Price: $52.50 | | | 334 | | | | 1,753,500 | | | | 8,016 | |
| The Charles Schwab Corp. | | | | | | | | | | | | |
| Expiration: January 2018; Exercise Price: $45.00 | | | 376 | | | | 1,692,000 | | | | 19,552 | |
| The Priceline Group, Inc. | | | | | | | | | | | | |
| Expiration: January 2018; Exercise Price: $1,695.00 | | | 8 | | | | 1,356,000 | | | | 19,040 | |
| Expiration: January 2018; Exercise Price: $1,730.00 | | | 4 | | | | 692,000 | | | | 14,472 | |
| Total Options Written (Premiums received $491,720) | | | | | | | | | | $ | 272,886 | |
See notes to financial statements.
YCG Enhanced Fund
STATEMENT OF ASSETS AND LIABILITIES
November 30, 2017
| ASSETS: | | | |
| Investments, at value (Cost $104,842,022) | | $ | 138,639,033 | |
| Cash | | | 15,999 | |
| Cash held as collateral for options written | | | 20,688 | |
| Deposits with brokers for options written | | | 3,530,175 | |
| Receivable for Fund shares sold | | | 12,187 | |
| Dividends and interest receivable | | | 291,711 | |
| Prepaid expenses | | | 34,096 | |
| Total Assets | | | 142,543,889 | |
| | | | | |
| LIABILITIES: | | | | |
| Options written, at value (Premiums received $491,720) | | | 272,886 | |
| Payable to investment advisor | | | 101,008 | |
| Other accrued expenses | | | 71,145 | |
| Total Liabilities | | | 445,039 | |
| NET ASSETS | | $ | 142,098,850 | |
| | | | | |
| NET ASSETS CONSIST OF: | | | | |
| Capital stock | | $ | 103,024,441 | |
| Undistributed net investment income | | | 588,492 | |
| Undistributed accumulated net realized gain | | | 4,470,072 | |
| Net unrealized appreciation | | | | |
| Investments | | | 33,797,011 | |
| Written options | | | 218,834 | |
| Total Net Assets | | $ | 142,098,850 | |
| Shares outstanding (unlimited shares of no par value authorized) | | | 8,560,789 | |
| | | | | |
| NET ASSET VALUE, OFFERING AND | | | | |
REDEMPTION PRICE PER SHARE(1) | | $ | 16.60 | |
(1) | A redemption fee of 2.00% is assessed against shares redeemed within 30 days of purchase. See Note 2h. |
See notes to financial statements.
YCG Enhanced Fund
STATEMENT OF OPERATIONS
For the year ended November 30, 2017
| INVESTMENT INCOME: | | | |
Dividend income(1) | | $ | 2,000,933 | |
| Interest income | | | 74,101 | |
| Total investment income | | | 2,075,034 | |
| EXPENSES: | | | | |
| Investment advisory fees | | | 1,249,195 | |
| Shareholder Service fees | | | 84,762 | |
| Legal fees | | | 58,988 | |
| Administration fees | | | 56,281 | |
| Compliance fees | | | 55,353 | |
| Accounting fees | | | 33,968 | |
| Federal and state registration fees | | | 33,961 | |
| Transfer agent fees and expenses | | | 33,894 | |
| Audit and tax fees | | | 15,999 | |
| Custody fees | | | 13,975 | |
| Trustee fees and expenses | | | 12,000 | |
| Insurance fees | | | 11,781 | |
| Reports to shareholders | | | 10,628 | |
| Miscellaneous expenses | | | 5,355 | |
| Total expenses before reimbursements | | | 1,676,140 | |
| Expense reimbursement by investment advisor (See Note 4) | | | (189,598 | ) |
| Net Expenses | | | 1,486,542 | |
| NET INVESTMENT INCOME | | | 588,492 | |
| REALIZED AND UNREALIZED GAIN: | | | | |
| Net realized gain on | | | | |
| Investments | | | 2,640,973 | |
| Options written | | | 1,865,751 | |
| Total | | | 4,506,724 | |
| Net change in unrealized appreciation (depreciation) on | | | | |
| Investments | | | 20,103,798 | |
| Options written | | | (40,410 | ) |
| Total | | | 20,063,388 | |
| Net realized and unrealized gain on investments | | | 24,570,112 | |
| NET INCREASE IN NET ASSETS | | | | |
| RESULTING FROM OPERATIONS | | $ | 25,158,604 | |
(1) | Net of $86,740 in foreign withholding taxes. |
See notes to financial statements.
YCG Enhanced Fund
STATEMENTS OF CHANGES IN NET ASSETS
| | | Year Ended | | | Year Ended | |
| | | November 30, 2017 | | | November 30, 2016 | |
| OPERATIONS: | | | | | | |
| Net investment income | | $ | 588,492 | | | $ | 603,540 | |
| Net realized gain on investments | | | | | | | | |
| and options written | | | 4,506,724 | | | | 2,944,746 | |
| Net change in unrealized appreciation | | | | | | | | |
| (depreciation) on investments | | | | | | | | |
| and options written | | | 20,063,388 | | | | 908,061 | |
| Net increase in net assets | | | | | | | | |
| resulting from operations | | | 25,158,604 | | | | 4,456,347 | |
| | | | | | | | | |
| CAPITAL SHARE TRANSACTIONS: | | | | | | | | |
| Proceeds from shares sold | | | 19,279,437 | | | | 22,418,615 | |
| Proceeds from reinvestment of distributions | | | 3,410,493 | | | | 1,865,833 | |
| Redemption fees | | | 590 | | | | 2,619 | |
| | | | 22,690,520 | | | | 24,287,067 | |
| Payments for shares redeemed | | | (11,734,331 | ) | | | (6,747,857 | ) |
| Net increase | | | 10,956,189 | | | | 17,539,210 | |
| | | | | | | | | |
| DISTRIBUTIONS PAID FROM: | | | | | | | | |
| Net investment income | | | (603,540 | ) | | | (381,885 | ) |
| From net realized gains | | | (2,980,722 | ) | | | (1,584,932 | ) |
| Total dividends and distributions | | | (3,584,262 | ) | | | (1,966,817 | ) |
| | | | | | | | | |
| TOTAL INCREASE IN NET ASSETS | | | 32,530,531 | | | | 20,028,740 | |
| | | | | | | | | |
| NET ASSETS: | | | | | | | | |
| Beginning of year | | | 109,568,319 | | | | 89,539,579 | |
| End of year (including undistributed | | | | | | | | |
| net investment income of | | | | | | | | |
| $588,492 and $603,540) | | $ | 142,098,850 | | | $ | 109,568,319 | |
| | | | | | | | | |
| CHANGES IN SHARES OUTSTANDING: | | | | | | | | |
| Shares sold | | | 1,271,121 | | | | 1,654,593 | |
| Issued in reinvestment of distributions | | | 247,496 | | | | 137,395 | |
| Shares redeemed | | | (782,461 | ) | | | (490,659 | ) |
| Net increase | | | 736,156 | | | | 1,301,329 | |
See notes to financial statements.
YCG Enhanced Fund
FINANCIAL HIGHLIGHTS
For a Fund share outstanding throughout the period
| | | | | | | | | | | | | | | December 28, | |
| | | | | | | | | | | | | | | 2012(1) | |
| | | | | | | | | | | | | | | through | |
| | | Year Ended November 30, | | | November 30, | |
| | | 2017 | | | 2016 | | | 2015 | | | 2014 | | | 2013 | |
| NET ASSET VALUE: | | | | | | | | | | | | | | | |
| Beginning of period | | $ | 14.00 | | | $ | 13.73 | | | $ | 14.00 | | | $ | 12.57 | | | $ | 10.00 | |
| | | | | | | | | | | | | | | | | | | | | |
| OPERATIONS: | | | | | | | | | | | | | | | | | | | | |
| Net investment income | | | 0.07 | | | | 0.08 | | | | 0.06 | | | | 0.07 | | | | 0.05 | |
| Net realized and unrealized | | | | | | | | | | | | | | | | | | | | |
| gain on investment securities | | | 3.00 | | | | 0.48 | | | | 0.24 | | | | 1.61 | | | | 2.52 | |
| Total from investment operations | | | 3.07 | | | | 0.56 | | | | 0.30 | | | | 1.68 | | | | 2.57 | |
| Redemption fee proceeds | | | — | (2) | | | — | (2) | | | — | (2) | | | — | (2) | | | — | (2) |
| Dividends from | | | | | | | | | | | | | | | | | | | | |
| net investment income | | | (0.08 | ) | | | (0.06 | ) | | | (0.06 | ) | | | (0.08 | ) | | | — | |
| Dividends from net realized gains | | | (0.39 | ) | | | (0.23 | ) | | | (0.51 | ) | | | (0.17 | ) | | | — | |
| Total distributions | | | (0.47 | ) | | | (0.29 | ) | | | (0.57 | ) | | | (0.25 | ) | | | — | |
| | | | | | | | | | | | | | | | | | | | | |
| NET ASSET VALUE: | | | | | | | | | | | | | | | | | | | | |
| End of period | | $ | 16.60 | | | $ | 14.00 | | | $ | 13.73 | | | $ | 14.00 | | | $ | 12.57 | |
| | | | | | | | | | | | | | | | | | | | | |
| TOTAL RETURN | | | 22.58 | % | | | 4.11 | % | | | 2.25 | % | | | 13.58 | % | | | 25.70 | %(3) |
| | | | | | | | | | | | | | | | | | | | | |
| SUPPLEMENTAL DATA | | | | | | | | | | | | | | | | | | | | |
| AND RATIOS: | | | | | | | | | | | | | | | | | | | | |
| Net assets; end of period (000’s) | | $ | 142,099 | | | $ | 109,568 | | | $ | 89,540 | | | $ | 84,112 | | | $ | 50,433 | |
| Ratio of expenses to | | | | | | | | | | | | | | | | | | | | |
| average net assets: | | | | | | | | | | | | | | | | | | | | |
| Expenses including | | | | | | | | | | | | | | | | | | | | |
| reimbursement (recapture) | | | 1.19 | % | | | 1.24 | %(5) | | | 1.39 | % | | | 1.39 | % | | | 1.39 | %(4) |
| Expenses excluding | | | | | | | | | | | | | | | | | | | | |
| reimbursement (recapture) | | | 1.34 | % | | | 1.36 | % | | | 1.32 | % | | | 1.38 | % | | | 1.70 | %(4) |
| Net investment income including | | | | | | | | | | | | | | | | | | | | |
| reimbursement (recapture) | | | 0.47 | % | | | 0.58 | % | | | 0.43 | % | | | 0.55 | % | | | 0.59 | %(4) |
| Net investment income excluding | | | | | | | | | | | | | | | | | | | | |
| reimbursement (recapture) | | | 0.32 | % | | | 0.46 | % | | | 0.50 | % | | | 0.56 | % | | | 0.28 | %(4) |
| Portfolio turnover rate | | | 15.98 | % | | | 23.76 | % | | | 18.49 | % | | | 25.46 | % | | | 9.21 | %(3) |
(1) | Date of inception. |
(2) | Amount represents less than $0.01 per share. |
(3) | Not Annualized. |
(4) | Annualized. |
(5) | See Note 4 for change in expense limitation during the year. |
See notes to financial statements.
YCG Enhanced Fund
NOTES TO FINANCIAL STATEMENTS
November 30, 2017
1. ORGANIZATION
YCG Funds (the “Trust”) is a Delaware statutory trust organized under an Agreement and Declaration of Trust dated September 4, 2012. The Trust is an open-end management investment company, as defined in the Investment Company Act of 1940 (the “1940 Act”), as amended. The Trust consists of one series, YCG Enhanced Fund (the “Fund”). The Fund is classified and operates as a non-diversified fund under the 1940 Act. The Fund commenced operations on December 28, 2012. The Fund’s investment adviser is YCG, LLC (the “Adviser”). There are an unlimited number of authorized shares. The investment objective of the Fund is to maximize long-term appreciation consistent with reasonable investment risk.
2. SUMMARY OF SIGNIFICANT ACCOUNTING POLICIES
The following is a summary of significant accounting policies consistently followed by the Fund in the preparation of its financial statements. The financial statements have been prepared in conformity with accounting principles generally accepted in the United States of America (“GAAP”). The Fund is an investment company and accordingly follows the investment company accounting and reporting guidance of the Financial Accounting Standards Board (“FASB”) Accounting Standards Codification (“ASC”) Topic 946 Financial Services – Investment Companies.
a) Subsequent Events Evaluation – In preparing these financial statements, the Fund has evaluated events and transactions for potential recognition or disclosure resulting from subsequent events through the date the financial statements were issued. This evaluation did not result in any subsequent events that necessitated disclosures and/or adjustments other than the event listed below.
On December 21, 2017, the Trust declared and paid distributions from ordinary income and net realized capital gains to shareholders of record as of December 20, 2017, as follows:
| | Ordinary | Short-Term | Long-Term |
| | Income | Capital Gain | Capital Gain |
| Distribution Paid | $588,492 | $1,693,518 | $2,813,080 |
| Distribution Paid Per Share | $0.06892253 | $0.19834 | $0.32946 |
b) Investment Valuation – Securities which are traded on a national stock exchange are valued at the last sale price on the securities exchange on which such securities are primarily traded. Securities that are traded on The Nasdaq OMX Group, Inc., referred to as Nasdaq, are valued at the Nasdaq Official Closing Price. Exchange-traded securities for which there were no transactions are valued at the current bid prices. Securities traded on only over-the-counter markets are valued on the basis of closing over-the-counter bid prices. Short-term debt instruments maturing within 60 days are valued by the amortized cost method, which approximates fair value.
YCG Enhanced Fund
NOTES TO FINANCIAL STATEMENTS (continued)
November 30, 2017
Debt securities (other than short-term instruments) are valued at the mean price furnished by a national pricing service, subject to review by the Adviser and determination of the appropriate price whenever a furnished price is significantly different from the previous day’s furnished price. Options written or purchased by the Fund are valued at the last sales price. If there are no trades for an option on a given day, options are valued at the mean between the current bid and asked prices. Any securities for which there are no readily available market quotations and other assets will be valued at their fair value as determined in good faith by the Adviser pursuant to procedures established by and under the supervision of the Board of Trustees.
Valuation Measurements
The Fund has adopted authoritative fair valuation accounting standards which establish an authoritative definition of fair value and set out a hierarchy for measuring fair value. These standards require additional disclosures about the various inputs and valuation techniques used to develop the measurements of fair value and a discussion of changes in valuation techniques and related inputs, if any, during the period. In addition, these standards require expanded disclosure for each major category of assets. These inputs are summarized in the three broad levels listed below:
| Level 1 – | Quoted prices in active markets for identical securities. |
| | |
| Level 2 – | Other significant observable inputs (including quoted prices for similar securities, interest rates, prepayment speeds, credit risk, etc.) |
| | |
| Level 3 – | Significant unobservable inputs (including the Fund’s own assumptions in determining the fair value of investments). |
The inputs or methodology used for valuing securities are not an indication of the risk associated with investing in those securities. The following is a summary of the inputs used to value the Fund’s net assets as of November 30, 2017:
| | | Level 1 | | | Level 2 | | | Level 3 | | | Total | |
Assets | | | | | | | | | | | | |
| Common Stocks* | | $ | 127,834,929 | | | $ | — | | | $ | — | | | $ | 127,834,929 | |
| Short-Term Investments | | | — | | | | 10,804,104 | | | | — | | | | 10,804,104 | |
| Total Investments | | | | | | | | | | | | | | | | |
| in Securities | | $ | 127,834,929 | | | | 10,804,104 | | | $ | — | | | $ | 138,639,033 | |
Liabilities | | | | | | | | | | | | | | | | |
| Other Financial | | | | | | | | | | | | | | | | |
| Instruments** | | | | | | | | | | | | | | | | |
| Options Written | | $ | 272,886 | | | $ | — | | | $ | — | | | $ | 272,886 | |
| * | | Please refer to the Schedule of Investments to view securities by industry type. |
| ** | | Other Financial Instruments are derivative instruments not reflected in the Schedule of Investments, such as options written, which are reflected at value. |
YCG Enhanced Fund
NOTES TO FINANCIAL STATEMENTS (continued)
November 30, 2017
The Fund did not invest in any Level 3 investments during the year. There were no transfers between levels during the year.
It is the Fund’s policy to consider transfers between levels as of the end of the reporting period.
c) Option Writing – The Fund may write covered call options and put options on a substantial portion of the Fund’s long equity portfolio as a means to generate additional income and to tax-efficiently enter and exit positions. The Fund will not use this strategy as a means of generating implicit leverage. In other words, if all put options were to be exercised, the Fund will generally have enough cash on hand to purchase the assigned shares. When the Fund writes an option, an amount equal to the premium received by the Fund is recorded as a liability and is subsequently adjusted to the current fair value of the option written. Premiums received from writing options that expire unexercised are treated by the Fund on the expiration date as realized gains from options written. The difference between the premium and the amount paid on effecting a closing purchase transaction, including brokerage commissions, is also treated as a realized gain, or, if the premium is less than the amount paid for the closing purchase transaction, as a realized loss. If a call option is exercised, the premium is added to the proceeds from the sale of the underlying security in determining whether the Fund has realized a gain or loss. If a put option is exercised, the premium reduces the cost basis of the securities purchased by the Fund. The Fund, as a writer of an option, bears the market risk of an unfavorable change in the price of the security underlying the written option. Upon writing an option, the Fund is required to pledge an amount of cash or securities, as determined by the broker, as collateral. As of November 30, 2017, the Fund held securities with a value of $2,699,700 and cash of $3,550,863 as collateral for options written. During the year, the Fund used written covered call and put options in a manner consistent with the strategy described above.
The value of Derivative Instruments on the Statement of Assets and Liabilities as of November 30, 2017, are as follows:
| | Liability Derivatives |
| Derivatives not | | |
| accounted for | | |
| as hedging | | |
| instruments | Location | Value |
| Equity Contracts – Options | Options written, at value | $272,886 |
YCG Enhanced Fund
NOTES TO FINANCIAL STATEMENTS (continued)
November 30, 2017
The effect of Derivative Instruments on the Statement of Operations for the year ended November 30, 2017, are as follows:
| Amount of Realized Gain on | Change in Unrealized Depreciation |
| Derivatives Recognized in Income | on Derivatives Recognized in Income |
| Derivatives not | | Derivatives not | |
| accounted for | | accounted for | |
| as hedging | Options | as hedging | Options |
| instruments | Written | instruments | Written |
| Equity Contracts | $1,865,751 | Equity Contracts | $(40,410) |
The average monthly value of options written during the year ended November 30, 2017, was $387,367.
Derivative Risks
The risks of using the various types of derivatives in which the Fund may engage include the risk that movements in the value of the derivative may not fully offset or complement instruments currently held in the Fund in the manner intended by the Adviser, the risk that the counterparty to a derivative contract may fail to comply with its obligations to the Fund, the risk that there may not be a liquid secondary market for the derivative at a time when the Fund would look to disengage the position, the risk that additional capital from the Fund may be called upon to fulfill the conditions of the derivative contract, the risk that the use of derivatives may induce leverage in the Fund, and the risk that the cost of the derivative may reduce the overall returns experience by the Fund.
Offsetting Assets and Liabilities
The Fund is subject to various Master Netting Arrangements, which govern the terms of certain transactions with select counterparties. The Master Netting Arrangements allow the Fund to close out and net its total exposure to a counterparty in the event of a default with respect to all the transactions governed under a single agreement with a counterparty. The Master Netting Arrangements also specify collateral posting arrangements at pre-arranged exposure levels. Under the Master Netting Arrangements, collateral is routinely transferred if the total net exposure to certain transactions (net of existing collateral already in place) governed under the relevant Master Netting Arrangement with a counterparty in a given account exceeds a specified threshold depending on the counterparty and the type of Master Netting Arrangement.
YCG Enhanced Fund
NOTES TO FINANCIAL STATEMENTS (continued)
November 30, 2017
The following is a summary of the Assets and Liabilities subject to offsetting in the Fund as of November 30, 2017:
| Liabilities | | | | Gross Amounts Not |
| | | | | Offset in the Statement |
| | | | | of Assets and Liabilities |
| | | Gross | Net | | | |
| | | Amounts | Amounts | | | |
| | | Offset | Presented | | | |
| | Gross | in the | in the | | | |
| | Amounts | Statement | Statement | | | |
| | of | of Assets | of Assets | | | |
| Description / | Recognized | and | and | Financial | Collateral | Net |
| Counterparty | Liabilities | Liabilities | Liabilities | Instruments | Pledged | Amount |
| Options Written | | | | | | |
| Interactive Brokers | $272,886 | $ — | $272,886 | $ — | $272,886 | $ — |
In some instances, the collateral amounts disclosed in the tables were adjusted due to the requirement to limit the collateral amounts to avoid the effect of overcollateralization. Actual collateral received/pledged may be more than the amounts disclosed herein.
d) Federal Income Taxes – The Fund intends to qualify as a “regulated investment company” under Subchapter M of the Internal Revenue Code of 1986, as amended. If so qualified, the Fund will not be subject to federal income tax to the extent it distributes substantially all of its net investment income and capital gains to shareholders. Therefore, no federal income tax provision is required.
The Fund has adopted financial reporting rules regarding recognition and measurement of tax positions taken or expected to be taken on a tax return. The Fund recognizes interest and penalties, if any, related to unrecognized tax benefits as income tax expense in the Statement of Operations. During the year, the Fund did not incur any interest or penalties. As of and during the year ended November 30, 2017, the Fund did not have any liabilities for unrecognized tax benefits.
e) Distributions to Shareholders – The Fund will declare and distribute any net investment income and any net realized long or short-term capital gains annually. Distributions to shareholders are recorded on the ex-dividend date. The character of distributions made during the year from net investment income or net realized gains may differ from the characterization for federal income tax purposes due to differences in the recognition of income, expense and gain items for financial statement and tax purposes. Where appropriate, reclassifications between capital accounts are made for such differences that are permanent in nature.
YCG Enhanced Fund
NOTES TO FINANCIAL STATEMENTS (continued)
November 30, 2017
f) Use of Estimates – The preparation of the financial statements in conformity with GAAP requires management to make estimates and assumptions that affect the reported amounts of assets and liabilities and disclosure of contingent assets and liabilities at the date of the financial statements and the reported amounts of increases and decreases in net assets from operations during the reporting period. Actual results could differ from those estimates.
g) Guarantees and Indemnifications – Under the Fund’s organizational documents, its officers and trustees are indemnified by the Fund against certain liabilities arising out of the performance of their duties to the Fund. Additionally, in the normal course of business, the Fund enters into contracts with service providers that contain general indemnification clauses. The Fund’s maximum exposure under these arrangements is unknown as this would involve future claims against the Fund that have not yet occurred. Currently, the Fund expects the risk of loss to be remote.
h) Redemption Fee – Those who buy and sell the Fund within 30 calendar days will incur a 2% redemption fee, retained for the benefit of long-term shareholders, recorded as additional capital in the Statement of Changes in Net Assets.
i) Beneficial Ownership – The beneficial ownership, either directly or indirectly, of more than 25% of the voting securities of a fund creates a presumption of control of the Fund, under Section 2(a)(9) of the 1940 Act. At November 30, 2017, no shareholder held more than 25% of the outstanding shares of the Fund.
j) Other – Investment transactions and shareholder transactions are accounted for on the trade date. Net realized gains and losses on securities are computed on the basis of specific identification. Dividend income is recognized on the ex-dividend date and interest income is recognized on an accrual basis. Discounts and premiums on securities purchased are accreted and amortized over the lives of the respective securities using the effective yield method. Withholding taxes on foreign dividends have been provided for in accordance with the Fund’s understanding of the applicable country’s tax rules and regulations.
3. INVESTMENT TRANSACTIONS
For the year ended November 30, 2017, the aggregate purchases and sales of securities, excluding short-term securities, were $31,080,319 and $17,897,965 respectively for the Fund. For the year ended November 30, 2017, there were no long-term purchases or sales of U.S. Government securities for the Fund.
4. COMMITMENTS AND OTHER RELATED PARTY TRANSACTIONS
The Adviser acts as the investment adviser to the Fund pursuant to an investment advisory agreement (the “Advisory Agreement”) which has been approved by the Board (including a majority of the Trustees who are not parties to the Advisory Agreement, or interested persons of any such party). Under the terms of the
YCG Enhanced Fund
NOTES TO FINANCIAL STATEMENTS (continued)
November 30, 2017
Advisory Agreement between the Fund and the Adviser, the Adviser conducts investment research and management for the Fund and is responsible for the purchase and sale of securities for the Fund’s investment portfolio. The Adviser provides the Fund with investment advice, supervises the management and investment programs and provides investment advisory facilities and executive and supervisory personnel for managing the investments and effectuating portfolio transactions. The Adviser also furnishes, at its own expense, all necessary administrative services, office space, equipment and clerical personnel for servicing the investments of the Fund. In addition, the Adviser pays the salaries and fees of all officers of the Fund who are affiliated with the Adviser. Under the Advisory Agreement, the monthly compensation paid to the Adviser is accrued daily at an annual rate of 1.00% on the average daily net assets of the Fund.
In the interest of limiting the expenses of the Fund, the Adviser has entered into a contractual expense limitation agreement with the Fund. Pursuant to the Expense Limitation Agreement, the Adviser (for the lifetime of the Fund) has agreed to waive or limit its fees and assume other expenses of the Fund (excluding interest, taxes, brokerage commissions and dividend expenses on securities sold short and extraordinary expenses not incurred in the ordinary course of business) so that the Fund’s ratio of total annual operating expenses is limited to 1.39%. In addition to the lifetime limit, effective April 1, 2017, the Adviser has agreed to reimburse the Fund to the extent necessary to ensure that total annual Fund operating expenses do not exceed 1.19% at least through April 1, 2018. The Adviser is entitled to the reimbursement of fees waived or reimbursed by the Adviser to the Fund subject to the limitations that (1) the reimbursement is made only for fees and expenses incurred not more than three years prior to the date of reimbursement, and (2) the reimbursement may not be made if it would cause the Fund’s annual expense limitation to be exceeded. The reimbursement amount may not include any additional charges or fees, such as interest accruable on the reimbursement account. As of November 30, 2017, expenses of $139,338 and $189,598 are subject to recoupment by the Adviser, expiring during the period ended November 30, 2019 and November 30, 2020, respectively.
Certain officers, trustees and shareholders of the Fund are also owners or employees of the Adviser. Such officers receive no compensation from the Fund for serving in their respective roles.
Quasar Distributors, LLC, (the “Distributor”) acts as the Fund’s principal underwriter.
The Fund has entered into Service Agreements with U.S. Bancorp Fund Services, LLC (“USBFS”) and a Custody Agreement with U.S. Bank, N.A., both affiliates of the Distributor. Under these agreements, USBFS and U.S. Bank, N.A. provide certain transfer agency, administrative, accounting and custody services.
YCG Enhanced Fund
NOTES TO FINANCIAL STATEMENTS (continued)
November 30, 2017
For the year ended November 30, 2017, the Fund paid U.S Bank, N.A., an affiliate of the Distributor, $11,632 for brokerage commissions.
5. NON-DIVERSIFICATION RISK
The Fund is non-diversified. A non-diversified fund may invest more of its assets in fewer companies than if it were a diversified fund. The Fund may be more exposed to the risks of loss and volatility than a fund that invests more broadly.
6. FEDERAL TAX INFORMATION
A. Tax Basis of Distributions to Shareholders: The tax character of the distributions paid by the Fund were as follows:
| | | For the Year Ended | | | For the Year Ended | |
| | | November 30, 2017 | | | November 30, 2016 | |
| Ordinary Income | | $ | 2,207,946 | | | $ | 1,329,278 | |
| Long-Term Capital Gains | | | 1,376,316 | | | | 637,539 | |
| Total | | $ | 3,584,262 | | | $ | 1,966,817 | |
Reclassifications: The tax components of distributable earnings are determined in accordance with income tax regulations which may differ from the compositions of net assets reported under GAAP. For the year ended November 30, 2017, there were no differences reclassified.
B. Tax Distributable Earnings
As of November 30, 2017, the components of the tax basis cost of investments and net unrealized appreciation were as follows:
| | | YCG Enhanced Fund | |
| Tax cost of investments | | $ | 104,878,049 | |
| Gross unrealized appreciation* | | | 35,129,346 | |
| Gross unrealized depreciation* | | | (1,149,528 | ) |
| Net tax unrealized appreciation (depreciation)* | | | 33,979,818 | |
| Undistributed ordinary income | | | 2,282,003 | |
| Undistributed long-term capital gains | | | 2,813,062 | |
| Accumulated earnings | | | 5,095,065 | |
| Other accumulated gains (losses) | | | (474 | ) |
| Total accumulated earnings | | $ | 39,074,409 | |
| * | Represents aggregated amounts of Fund’s investments and written options. |
YCG Enhanced Fund
NOTES TO FINANCIAL STATEMENTS (continued)
November 30, 2017
The tax basis of investments for tax and financial reporting purposes differs, principally due to the deferral of losses on wash sales and the recognition of gains on certain foreign investments.
Net capital losses incurred after October 31, and within the taxable year are deemed to arise on the first business day of the Fund’s next taxable year. Qualified late-year ordinary losses are the excess of the sum of the specified loss attributable to the portion of the taxable year after October 31st, and the late-year losses attributable to the portion of the taxable year after December 31st, over the sum of the specified gains attributable to the portion of the taxable year after October 31st, and other ordinary income attributable to the portion of the taxable year after December 31st. For the fiscal year ended November 30, 2017, there were no post-October or late-year losses.
7. NEW ACCOUNTING PRONOUNCEMENTS
On December 14, 2016, the FASB issued Accounting Standards Update (“ASU”) 2016-19, Technical Corrections and Improvements that made technical changes to various sections of the ASC, including Topic 820, Fair Value Measurement. The changes to Topic 820 are intended to clarify the difference between a valuation approach and a valuation technique. A reporting entity should disclose, for Level 2 and Level 3 fair value measurements, a change in either or both a valuation approach and a valuation technique and the reason(s) for the change. The changes to Topic 820 are effective for fiscal years, and interim periods within those fiscal years, beginning after December 15, 2016. At this time, management is evaluating the implications of this ASU and its impact on the financial statements.
YCG Enhanced Fund
REPORT OF INDEPENDENT REGISTERED PUBLIC ACCOUNTING FIRM
To the Shareholders of YCG Enhanced Fund and
Board of Trustees of YCG Funds
We have audited the accompanying statement of assets and liabilities, including the schedules of investments and options written, of YCG Enhanced Fund (the “Fund”), a series of YCG Funds, as of November 30, 2017, and the related statement of operations for the year then ended, the statements of changes in net assets for each of the two years in the period then ended, and the financial highlights for each of the five periods in the period then ended. These financial statements and financial highlights are the responsibility of the Fund’s management. Our responsibility is to express an opinion on these financial statements and financial highlights based on our audits.
We conducted our audits in accordance with the standards of the Public Company Accounting Oversight Board (United States). Those standards require that we plan and perform the audit to obtain reasonable assurance about whether the financial statements and financial highlights are free of material misstatement. An audit includes examining, on a test basis, evidence supporting the amounts and disclosures in the financial statements. Our procedures included confirmation of securities owned as of November 30, 2017, by correspondence with the custodian and brokers. An audit also includes assessing the accounting principles used and significant estimates made by management, as well as evaluating the overall financial statement presentation. We believe that our audits provide a reasonable basis for our opinion.
In our opinion, the financial statements and financial highlights referred to above present fairly, in all material respects, the financial position of YCG Enhanced Fund as of November 30, 2017, the results of its operations for the year then ended, the changes in its net assets for each of the two years in the period then ended, and the financial highlights for each of the five periods in the period then ended, in conformity with accounting principles generally accepted in the United States of America.
COHEN & COMPANY, LTD.
Cleveland, Ohio
January 25, 2018
YCG Enhanced Fund
ADDITIONAL INFORMATION
(Unaudited)
1. SHAREHOLDER NOTIFICATION OF FEDERAL TAX STATUS
For the year ended November 30, 2017, 62.64% of the dividends paid from net investment income, including short-term capital gains, for the YCG Enhanced Fund qualify for the dividends received deduction available to corporate shareholders.
For the year ended November 30, 2017, 90.10% of the dividends paid from net investment income, including short-term capital gains, for the YCG Enhanced Fund are designated as qualified dividend income.
2. COMPENSATION OF TRUSTEES
During the fiscal year, each Trustee who is not an “interested person” of the Trust (i.e. an “Independent Trustee”) received $1,000 per meeting attended, as well as reimbursement for expenses incurred in connection with attendance at such meetings.
3. PROXY VOTING POLICIES AND PROCEDURES
For a description of the policies and procedures that the Fund uses to determine how to vote proxies relating to portfolio securities, please call 1-855-444-9243 and request a Statement of Additional Information. One will be mailed to you free of charge. The Statement of Additional Information is also available on the web site of the Securities and Exchange Commission at http://www.sec.gov. Information on how the Fund voted proxies relating to portfolio securities during the year ended June 30, 2017 is available without charge, upon request, by calling 1-855-444-9243 or by accessing the website of the Securities and Exchange Commission.
4. DISCLOSURE OF PORTFOLIO HOLDINGS
The Fund files a complete schedule of portfolio holdings with the Securities and Exchange Commission for the first and third quarters of each fiscal year on Form N-Q. The Fund’s Forms N-Q are available on the website of the Securities and Exchange Commission at http://www.sec.gov. The Fund’s Forms N-Q may be reviewed and copied at the Securities and Exchange Commission’s Public Reference Room in Washington, D.C. Information on the operation of the Public Reference Room may be obtained by calling 1-800-SEC-0330.
5. BOARD ANNUAL RENEWAL OF INVESTMENT ADVISORY AGREEMENT
YCG, LLC (the “Adviser”) is responsible for management of the investment portfolio of the YCG Enhanced Fund, and for overall management of the Fund’s business and affairs pursuant to an investment advisory agreement between YCG Funds, on behalf of the Fund, and the Adviser. The Trustees of the Fund held an in-person meeting of the Board of Trustees on October 20, 2017 at which meeting the Trustees, including a majority of the Independent Trustees, gave consideration to information bearing on the continuation of the investment advisory agreement for the
YCG Enhanced Fund
ADDITIONAL INFORMATION (continued)
(Unaudited)
Fund, and unanimously approved the continuation of the investment advisory agreement. At this meeting, the Trustees had ample opportunity to consider matters they deemed relevant in considering the approval of the investment advisory agreement, and to request any additional information they considered reasonably necessary to their deliberations, without undue time constraints. In addition to the materials requested by the Trustees in connection with their consideration of the continuation of the investment advisory agreement, the Trustees received materials in advance of each regular quarterly meeting of the Board of Trustees that provided information relating to the services provided by the Adviser.
In advance of the meeting, the Adviser sent detailed information to the Trustees to assist them in their evaluation of the investment advisory agreement. This information included, but was not limited to, a memorandum that summarized the legal standards applicable to the Trustees’ consideration of the investment advisory agreement, which was provided by the counsel to the members of the Board of Trustees who are not deemed “interested persons” (as that term is defined by the Investment Company Act of 1940) of the YCG Enhanced Fund (the “Independent Trustees”); information regarding the Adviser’s personnel and investment process; detailed comparative information relating to the Fund’s management fees and other expenses of the Fund; information regarding fees paid and other payments; information on the Adviser’s profitability; financial information about the Adviser; information about brokerage commissions; detailed comparative information relating to the Fund’s performance; information about sales and redemptions of the Fund; information about amounts paid to financial intermediaries; information about the Fund’s compliance program; and other information the Trustees believed was useful in evaluating the approval of the investment advisory agreement.
As part of the process of approving the continuation of the investment advisory agreement, the Trustees reviewed the fiduciary duties of the Trustees with respect to approving the investment advisory agreement and the relevant factors for the Trustees to consider. The Independent Trustees were assisted in their evaluation of the investment advisory agreement and the factors that they deemed to be material, including those factors described below, by independent legal counsel, from whom they received separate legal advice and with whom they met separately in executive session.
All of the factors discussed by the Trustees were considered as a whole, and were considered separately by the Independent Trustees, meeting in executive session. The factors were viewed in their totality by the Trustees, with no single factor being the principal or determinative factor in the Trustees’ determination of whether to approve the continuation of the investment advisory agreement. The Trustees recognized that the management and fee arrangements for the YCG Enhanced Fund are the result of years of review and discussion between the Independent Trustees
YCG Enhanced Fund
ADDITIONAL INFORMATION (continued)
(Unaudited)
and the Adviser, that certain aspects of such arrangements may receive greater scrutiny in some years than in others and that the Trustees’ conclusions may be based, in part, on their consideration of these same arrangements and information received during the course of the year and in prior years.
Prior to approving the continuation of the investment advisory agreement, the Trustees, including the Independent Trustees meeting in executive session, considered, among other items:
| | • | The nature and quality of the investment advisory services provided by the Adviser, including the Adviser’s organization and operations, financial condition and stability and ownership structure; and the terms of the investment advisory agreement and how the services performed by the Adviser under the investment advisory agreement differ from those performed for other accounts. |
| | | |
| | • | A comparison of the fees and expenses of the YCG Enhanced Fund to other similar funds, including a comparison of the Fund’s total expenses and the total expense ratios. |
| | | |
| | • | A comparison of the fee structures of other accounts managed by the Adviser. |
| | | |
| | • | Whether economies of scale are recognized by the Fund, and whether breakpoints are appropriate. |
| | | |
| | • | The costs and profitability of the Fund to the Adviser. |
| | | |
| | • | The independence, expertise, care, and conscientiousness of the Board of Trustees. |
| | | |
| | • | Short-term and long-term investment performance of the Fund. |
| | | |
| | • | The other benefits to the Adviser from serving as investment adviser to the Fund (in addition to the advisory fee). |
The material determinations of the Board of Trustees, including all of the Independent Trustees, are described below:
Nature and Quality of Investment Advisory Services
The Trustees concluded that the nature, extent and quality of the investment advisory services provided to the YCG Enhanced Fund by the Adviser are good, and that the nature and extent of the services provided by the Adviser are appropriate to assure that the Fund’s operations are conducted in compliance with applicable laws, rules and regulations. They believe that the following factors, among others, support these conclusions:
| | • | The Adviser maintains sufficient staff and resources to support its research intensive investment process, which allows the Adviser to meet the investment objectives of the Fund. |
YCG Enhanced Fund
ADDITIONAL INFORMATION (continued)
(Unaudited)
| | • | The investment personnel of the Adviser that service the Fund have strong backgrounds and experiences in managing securities to meet investment objectives like those of the Fund. |
| | | |
| | • | The Adviser has engaged service providers to the Fund, who provide administrative and distribution services on behalf of the Fund and are overseen by the Adviser, that have strong backgrounds and experience in the mutual fund industry. |
| | | |
| | • | Past actions of the Adviser demonstrate the Adviser’s active oversight of service providers to the Fund, as it has taken actions to ensure that such service providers are performing well, and has, when necessary, replaced service providers who do not perform well. |
Comparative Fees and Expenses
The Trustees concluded that the expense ratio of the YCG Enhanced Fund is within the range of comparable mutual funds, particularly funds that have an option strategy, and that the Fund’s fees are reasonable. They believe that the following factors, among others, support these conclusions:
| | • | While the Fund had higher than average advisory and net expenses compared to the Morningstar Large Cap Blend category peers, the Fund’s return over the last three years is in the top third of the funds in the category. The Trustees also noted that unlike most peers in the category, the Fund utilizes an option enhancement strategy, and this option enhancement strategy requires the expenditure of more resources. |
| | | |
| | • | The Fund’s expense ratio is very favorable compared to option peers, which is important because the Trustees believe that the Fund’s option enhancement strategy is a unique strategy that sets the Fund apart from its competitors. |
| | | |
| | • | The Fund performed well when compared to many of the stockpicking and large cap blend category peer group funds. |
| | | |
| | • | The Fund is still relatively small in assets under management, and the Adviser is subsidizing the expenses of the Fund to ensure the Fund remains competitive with other funds. |
Comparison of Fee Structures of Other Accounts
The Trustees concluded that the differential in advisory fees between the Fund and the separate accounts managed by the Adviser is reasonable, and concluded that the fee rate charged to the Fund in comparison to those charged to the Adviser’s other clients is reasonable. They believe that the following factors, among others, support these conclusions:
YCG Enhanced Fund
ADDITIONAL INFORMATION (continued)
(Unaudited)
| | • | The services performed by the Adviser for the Fund generally require a higher level of service and compliance oversight than the services performed for the separate accounts. |
| | | |
| | • | The Adviser provides tailored investment advisory services to the Fund in order to accommodate the cash flow volatility presented by the purchases and redemptions of shareholders. |
| | | |
| | • | The Adviser maintains a robust shareholder communication effort for the Fund to reach shareholders through direct contact, through intermediaries, or via the financial press, and has contributed significant financial resources to marketing efforts for the Fund. |
| | | |
| | • | Increasingly investors in the Fund invest through brokerage platforms (intermediaries), with fewer investors going directly to the Fund’s transfer agent, and the Adviser absorbs a significant portion of the costs associated with these intermediaries. As result, the cost of obtaining, retaining and servicing shareholders for the Fund is significantly higher than the costs for separately managed accounts. |
Performance
The Trustees concluded that the performance of the YCG Enhanced Fund, adjusting for risk, has been satisfactory on a relative basis and more than satisfactory on an absolute basis. They continue to believe that the Adviser’s discipline should lead to more favorable results in the long-term, and concluded that renewal of the existing advisory agreement was in the best interest of the Fund’s shareholders. They believe that the following factors, among others, support these conclusions:
| | • | The Adviser manages the Fund in a manner that is materially consistent with its stated investment objective and style. |
| | | |
| | • | The Fund’s return over the last three years is in the top third of the funds in the Morningstar Large Cap Blend category. |
| | | |
| | • | The Fund performed when compared to many of the stockpicking and large cap blend category peer group funds. |
Costs and Profitability
The Trustees recognized that it is difficult to make comparisons of profitability from investment advisory contracts. This is because comparative information is not generally publicly available and is affected by numerous factors, including the structure of the particular adviser, the type of clients it advises, its business mix, and numerous assumptions regarding allocations and the adviser’s capital structure and cost of capital. The Trustees concluded that the level of profitability realized by the Adviser from its provision of services to the YCG Enhanced Fund is reasonable, and that the overall expense ratios and investment advisory fees were fair and within the
YCG Enhanced Fund
ADDITIONAL INFORMATION (continued)
(Unaudited)
range of industry averages. They believe that the following factors, among others, support these conclusions:
| | • | Taking into account the intermediary fees that the Adviser pays in connection with managing the Fund, the cost of obtaining, retaining and servicing shareholders for the Fund is significantly higher than the costs for separately managed accounts. |
| | | |
| | • | The Adviser expends significant resources and revenue to manage and distribute the Fund. |
| | | |
| | • | Based on the comparisons provided at the meeting, the overall expense ratios and investment advisory fees of the Fund were within the range of industry averages. |
| | | |
| | • | The Fund’s expense ratio is very favorable compared to option peers, which is important because the Trustees believe that the Fund’s option enhancement strategy is a unique strategy that sets the Fund apart from its competitors. |
| | | |
| | • | The expenses for the Fund are currently capped and any excess is paid by the Adviser. |
Economies of Scale
The Trustees concluded that the current fees were appropriate at foreseeable asset levels without the need for breakpoints. They believe that the following factors, among others, support these conclusions:
| | • | Based on the materials reviewed at the meeting and the size of the YCG Enhanced Fund, the Fund has not realized economies of scale. |
| | | |
| | • | Many of the Fund’s expense increase as the Fund’s assets grow, such as the intermediary service fees and the costs of conducting research to explore additional investments. |
Fall-Out Benefits
The Trustees concluded that the other benefits realized by the Adviser from its relationship with the YCG Enhanced Fund were reasonable. They believe that the following factors, among others, support this conclusion:
| | • | The Adviser does not derive ancillary benefits from its association with the Fund in the form of proprietary and third party research products and services, as the Adviser does not receive any research or other services from the broker-dealers that the Fund trades with. |
| | | |
| | • | Managing the Fund has provided more visibility for the Adviser in the financial media and industry in general, but the primary focus of this visibility has been the Fund, and has been beneficial to the Fund. |
YCG Enhanced Fund
ADDITIONAL INFORMATION (continued)
(Unaudited)
Conclusion
After reviewing the material provided for the meeting, management’s presentation, as well as other information regularly provided at the Board’s quarterly meetings throughout the year regarding the quality of services provided by the Adviser, the performance of the YCG Enhanced Fund, expense information, regulatory compliance issues, trading information and related matters and other factors deemed relevant by the Board, the Trustees, including all of the Independent Trustees, concluded that the investment advisory arrangement between the Fund and the Adviser were fair and reasonable and that the approval of the investment advisory agreement would be in the best interest of the Fund and its shareholders. Accordingly, the Trustees, including the Independent Trustees voting separately, approved the continuation of the investment advisory agreement.
YCG Enhanced Fund
TRUSTEES AND OFFICERS
(Unaudited)
The business of the Fund is managed under the direction of the Board. The Board formulates the general policies of the Fund and meets periodically to review the Fund’s performance, monitor investment activities and practices, and discuss other matters affecting the Fund. The Trustees are fiduciaries for the Fund’s shareholders and are governed by the laws of the State of Delaware in this regard. The names and addresses of the Trustees and officers of the Trust are listed below along with a description of their principal occupations over at least the last five years. Trustees who are “interested persons”, as defined by the 1940 Act, are indicated by asterisk. The Fund’s Statement of Additional Information includes additional information about the Trustees and is available, without charge, upon request by (1) calling toll free 1-855-444-9243; (2) on the Fund’s website located at http://www.ycgfunds.com; or (3) on the SEC’s website http://www.sec.gov.
| | | Term of | | | |
| | | Office | Number of | | |
| | | and | Portfolios | Principle | Other |
| | Position(s) | Length | in Fund | Occupation(s) | Directorships |
| Name, address | Held with | of Time | Complex | During Past | Held by |
| and age | the Fund | Served | Overseen | Five Years | Trustee |
| | | | | | |
| Brian Yacktman* | Trustee | Indefinite, | 1 | Manager, Principal | None. |
| 3207 Ranch Road | | Trustee | | and Chief | |
| 620 South, Suite 200 | | since 2012 | | Investment Officer, | |
| Austin, TX 78738 | President | One year | | YCG, LLC, | |
| Age: 38 | | term, | | 2007 – Present. | |
| | | | | | |
| William D. Kruger* | Chairman | Indefinite, | 1 | Manager, Principal | None. |
| 3207 Ranch Road | and | Trustee | | and CEO, YCG, | |
| 620 South, Suite 200 | Trustee | since 2012 | | LLC, 2008 – | |
| Austin, TX 78738 | Vice | One year | | Present. | |
| Age: 38 | President | term, Vice | | | |
| | and | President | | | |
| | | since 2012 | | | |
| | Treasurer | One year | | | |
| | | term, | | | |
| | | Treasurer | | | |
| | | since 2012 | | | |
YCG Enhanced Fund
TRUSTEES AND OFFICERS (continued)
(Unaudited)
| | | Term of | | | |
| | | Office | Number of | | |
| | | and | Portfolios | Principle | Other |
| | Position(s) | Length | in Fund | Occupation(s) | Directorships |
| Name, address | Held with | of Time | Complex | During Past | Held by |
| and age | the Fund | Served | Overseen | Five Years | Trustee |
| | | | | | |
| Independent Trustees: | | | | | |
| | | | | | |
| Travis E.Oliphant | Trustee | Indefinite, | 1 | Scientific and | Director of |
| 3207 Ranch Road | | Trustee | | Technical Software | Anaconda |
| 620 South, Suite 200 | | since 2012 | | Manager and | (Continuum |
| Austin, TX 78738 | | | | Executive. | Analytics), |
| Age: 46 | | | | Founder and | 2012 – Present. |
| | | | | CEO of Anaconda | |
| | | | | (Continuum | |
| | | | | Analytics), | |
| | | | | January 2012 – | |
| | | | | 2017. Founder and | |
| | | | | CEO of Quansight, | |
| | | | | 2018 – Present. | |
| | | | | | |
| Rory M. McDonald | Trustee | Indefinite, | 1 | Assistant Professor | None. |
| 3207 Ranch Road | | Trustee | | of Business | |
| 620 South, Suite 200 | | since 2012 | | Administration in | |
| Austin, TX 78738 | | | | the Technology | |
| Age: 39 | | | | and Operations | |
| | | | | Management Unit | |
| | | | | at Harvard | |
| | | | | Business School, | |
| | | | | 2013 – Present. | |
| | | | | Assistant Professor | |
| | | | | of Management, | |
| | | | | University of Texas | |
| | | | | at Austin, McCombs | |
| | | | | School of Business, | |
| | | | | 2011 – 2013. | |
| | | | | | |
| Cyril James Speirs | Trustee | Indefinite, | 1 | Retired, Previously, | None. |
| 3207 Ranch Road | | Trustee | | Global Vice President | |
| 620 South, Suite 200 | | since 2017 | | Procurement for Whole | |
| Austin, TX 78738 | | | | Foods Market, Inc., | |
| Age: 62 | | | | 2005 – 2016. | |
YCG Enhanced Fund
TRUSTEES AND OFFICERS (continued)
(Unaudited)
| | | Term of | | | |
| | | Office | Number of | | |
| | | and | Portfolios | Principle | Other |
| | Position(s) | Length | in Fund | Occupation(s) | Directorships |
| Name, address | Held with | of Time | Complex | During Past | Held by |
| and age | the Fund | Served | Overseen | Five Years | Trustee |
| | | | | | |
| Officers who are not Trustees: | | | | | |
| | | | | | |
| Elliott Savage | Vice | One year | N/A | Manager, | None. |
| 3207 Ranch Road | President | term, Vice | | Principal and | |
| 620 South, Suite 200 | | President | | Portfolio manager, | |
| Austin, TX 78738 | | since | | YCG, LLC, | |
| Age: 37 | | December | | 2012 – Present. | |
| | | 2012 | | Senior Analyst, | |
| | Secretary | One year | | Highside Capital | |
| | | term, | | Management, | |
| | | Secretary | | 2003 – 2012. | |
| | | since | | | |
| | | February | | | |
| | | 2016 | | | |
| | Assistant | One year | | | |
| | Treasurer | term, | | | |
| | | Assistant | | | |
| | | Treasurer | | | |
| | | since | | | |
| | | December | | | |
| | | 2012 | | | |
| | | | | | |
| Lelia Long | Chief | One year | N/A | Investment | None. |
| 3207 Ranch Road | Compliance | term, Chief | | Management | |
| 620 South, Suite 200 | Officer | Compliance | | & Compliance | |
| Austin, TX 78738 | | Officer | | Consultant, | |
| Age: 55 | | since | | Vigilant Compliance | |
| | | March 2016 | | LLC, 2009 – | |
| | | | | present. Treasurer, | |
| | | | | New Ireland Fund, Inc., | |
| | | | | 2002 – Present; | |
| | | | | Chief Compliance | |
| | | | | Officer, YCG, LLC, | |
| | | | | 2016 – Present. | |
| * | Brian Yacktman and William Kruger are considered to be “interested persons” of the Trust, a term that is defined in the 1940 Act. Mr. Yacktman and Mr. Kruger are interested persons because: (1) each is an officer of the Trust; and (2) each is the owner of the investment adviser to the Fund. |
| |
Each trustee holds office for an indefinite term and until the earlier of: the Trust’s next meeting of shareholders and the election and qualification of his successor; or until the date a trustee dies, resigns or is removed in accordance with the Trust’s Declaration of Trust and By-laws. Each officer holds office at the pleasure of the Board and serves for a period of one year, or until his successor is duly elected and qualified.
Privacy Notice
| FACTS | WHAT DOES YCG FUNDS DO WITH YOUR PERSONAL INFORMATION? |
| | |
| WHY? | Financial companies choose how they share your personal information. Federal law gives consumers the right to limit some, but not all information sharing. Federal law also requires us to tell you how we collect, share, and protect your personal information. Please read this Notice carefully to understand what we do. |
| | |
| WHAT? | The types of information we collect and share depend on the product or service you have with us. This information can include: |
| | • Social Security Number |
| | • Assets |
| | • Retirement Assets |
| | • Transaction History |
| | • Checking Account History |
| | • Purchase History |
| | • Account Balances |
| | • Account Transactions |
| | • Wire Transfer Instructions |
| | When you are no longer our customer, we continue to share your information as described in this Notice. |
| | |
| HOW? | All financial companies need to share your personal information to run their everyday business. In the section below, we list the reasons financial companies can share their customers’ personal information; the reasons YCG Funds chooses to share; and whether you can limit this sharing. |
| Reasons we can share your personal information. | Does YCG Funds | Can you limit |
| | Trust share? | this sharing? |
| For our everyday business purposes— | | |
| Such as to process your transactions, maintain | | |
| your account(s), respond to court orders and | Yes | No |
| legal investigations, or report to credit bureaus. | | |
| For our marketing purposes— | | |
| to offer our products and services to you. | No | We don’t share |
| For joint marketing with other financial | | |
| companies | No | We don’t share |
| For our affiliates’ everyday business purposes— | | |
| information about your transactions and experiences. | Yes | No |
| For our affiliates’ everyday business purposes— | | |
| information about your creditworthiness | No | We don’t share |
| For non-affiliates to market to you | No | We don’t share |
| Questions? | Call 855-444-YCGF (9243) |
Privacy Notice (continued)
| Who we are | |
| Who is providing | YCG Funds |
| this Notice? | YCG, LLC (investment adviser to the Trust) |
| | US Bancorp Fund Services, LLC (administrator to the Trust) |
| What we do | |
| How does | To protect your personal information from unauthorized |
| YCG Funds | access and use, we use security measures that comply |
| protect | with federal law. These measures include computer safeguards |
| your personal | and secured files and buildings. |
| information? | Our service providers are held accountable for adhering to strict policies and procedures to prevent any misuse or your nonpublic personal information. |
| How does | We collect your personal information, for example, when you |
| YCG Funds | • Open an account |
| collect your | • Provide account information |
| personal | • Give us your contact information |
| information? | • Make deposits or withdrawals from your account |
| | • Make a wire transfer |
| | • Tell us where to send the money |
| | • Tell us who receives the money |
| | • Show your government-issued ID |
| | • Show your drivers’ license |
| | We also collect your personal information from other companies. |
| Why can’t I | Federal law gives you the right to limit only: |
| limit all sharing? | • Sharing for affiliates’ everyday business purposes—information about your creditworthiness. |
| | • Affiliates from using your information to market to you. |
| | • Sharing for non-affiliates to market to you. |
| | State laws and individual companies may give you additional rights to limit sharing. |
| Definitions | |
| Affiliates | Companies related by common ownership or control. They can be financial and non-financial companies. |
| | |
| | YCG, LLC, is an affiliate of YCG Funds |
| Non-affiliates | Companies not related by common ownership or control. They can be financial and non-financial companies. |
| | |
| | • YCG Funds does not share with non-affiliates so they can market to you. |
| Joint marketing | A formal agreement between non-affiliated financial companies that together market financial products to you. |
| | |
| | • YCG Funds does not jointly market. |
For Fund information and shareholder services, call
1-855-444-9243
web site: www.ycgfunds.com
YCG Funds
c/o U.S. Bancorp Fund Services, LLC
P.O. Box 701
Milwaukee, WI 53201-0701
Investment Adviser
YCG, LLC
3207 Ranch Road 620 South, Suite 200
Austin, TX 78738
Chief Compliance Officer
Vigilant Compliance, LLC
Gateway Corporate Center
223 Wilmington West Chester Pike, Suite 216
Chadds Ford, PA 19317
Legal Counsel
Foley & Lardner LLP
777 East Wisconsin Avenue
Milwaukee, WI 53202
Independent Registered Public Accounting Firm
Cohen & Company, Ltd.
1350 Euclid Avenue, Suite 800
Cleveland, OH 44115
Transfer Agent, Fund Accountant, and Fund Administrator
U.S. Bancorp Fund Services, LLC
615 East Michigan Street
Milwaukee, WI 53202
Custodian
U.S. Bank, N.A.
1555 North RiverCenter Drive, Suite 302
Milwaukee, WI 53212
Distributor
Quasar Distributors, LLC
777 East Wisconsin Avenue
Milwaukee, WI 53202
This report is submitted for the general information of shareholders of the YCG Enhanced Fund. It is not authorized for distribution to prospective investors unless accompanied or preceded by an effective Prospectus for the Fund, which contains more information concerning the Fund’s investment policies, as well as fees and expenses and other pertinent information. Read the Prospectus carefully.
The registrant has adopted a code of ethics that applies to the registrant’s principal executive officer and principal financial officer. The registrant has not made any substantive amendments to its code of ethics during the period covered by this report. The registrant has not granted any waivers from any provisions of the code of ethics during the period covered by this report.
A copy of the registrant’s Code of Ethics is filed herewith.
The registrant’s board of trustees has determined that there is at least one audit committee financial expert serving on its audit committee. Travis E. Oliphant is the “audit committee financial expert” and is considered to be “independent” as each term is defined in Item 3 of Form N‑CSR.
The registrant has engaged its principal accountant to perform audit services, audit-related services, tax services and other services during the past two fiscal years. “Audit services” refer to performing an audit of the registrant's annual financial statements or services that are normally provided by the accountant in connection with statutory and regulatory filings or engagements for those fiscal years. “Audit-related services” refer to the assurance and related services by the principal accountant that are reasonably related to the performance of the audit. “Tax services” refer to professional services rendered by the principal accountant for tax compliance, tax advice, and tax planning. The following table details the aggregate fees billed or expected to be billed for each of the last two fiscal years for audit fees, audit-related fees, tax fees and other fees by the principal accountant.
The audit committee has adopted pre-approval policies and procedures that require the audit committee to pre‑approve all audit and non‑audit services of the registrant, including services provided to any entity affiliated with the registrant.
All of the principal accountant’s hours spent on auditing the registrant’s financial statements were attributed to work performed by full‑time permanent employees of the principal accountant. (If more than 50 percent of the accountant’s hours were spent to audit the registrant's financial statements for the most recent fiscal year, state how many hours were attributed to work performed by persons other than the principal accountant's full-time, permanent employees.) The following table indicates the non-audit fees billed or expected to be billed by the registrant’s accountant for services to the registrant and to the registrant’s investment adviser (and any other controlling entity, etc.—not sub-adviser) for the last two years. The audit committee of the board of trustees/directors has considered whether the provision of non-audit services that were rendered to the registrant's investment adviser is compatible with maintaining the principal accountant's independence and has concluded that the provision of such non-audit services by the accountant has not compromised the accountant’s independence.
Not applicable to registrants who are not listed issuers (as defined in Rule 10A-3 under the Securities Exchange Act of 1934).
Schedule of Investments is included as part of the report to shareholders filed under Item 1 of this Form.
Not applicable to open-end investment companies.
Not applicable to open-end investment companies.
Not applicable to open-end investment companies.
Not Applicable.
Not applicable to open-end investment companies.
Pursuant to the requirements of the Securities Exchange Act of 1934 and the Investment Company Act of 1940, the registrant has duly caused this report to be signed on its behalf by the undersigned, thereunto duly authorized.
Brian A. Yacktman, President (Principal Executive Officer)
Pursuant to the requirements of the Securities Exchange Act of 1934 and the Investment Company Act of 1940, this report has been signed below by the following persons on behalf of the registrant and in the capacities and on the dates indicated.
Brian A. Yacktman, President (Principal Executive Officer)
William D. Kruger, Treasurer (Principal Financial Officer)
* Print the name and title of each signing officer under his or her signature.