As filed with the U.S. Securities and Exchange Commission on January 31, 2019
UNITED STATES
SECURITIES AND EXCHANGE COMMISSION
Washington, D.C. 20549
FORM N-CSR
CERTIFIED SHAREHOLDER REPORT OF REGISTERED
MANAGEMENT INVESTMENT COMPANIES
Investment Company Act file number 811-22748
YCG Funds
(Exact name of registrant as specified in charter)
3207 Ranch Road 620 South, Suite 200
Austin, TX 78738
(Address of principal executive offices) (Zip code)
William Kruger
YCG Funds
3207 Ranch Road 620 South, Suite 200
Austin, TX 78738
(Name and address of agent for service)
(512) 505-2347
Registrant's telephone number, including area code
Date of fiscal year end: November 30
Date of reporting period: December 1, 2017 to November 30, 2018
Item 1. Reports to Stockholders.
| YCG ENHANCED FUND |
a series of the YCG Funds |
|
| |
| |
| |
| |
| |
| |
| |
| |
| | Annual Report | | |
| | November 30, 2018 | Ticker Symbol: YCGEX | |
Beginning on January 1, 2021, as permitted by regulations adopted by the SEC, paper copies of the Fund’s shareholder reports will no longer be sent by mail, unless you specifically request paper copies of the reports from the Fund (defined herein) or from your financial intermediary, such as a broker-dealer or bank. Instead, the reports will be made available on the Fund’s website (www.ycgfunds.com), and you will be notified by mail each time a report is posted and provided with a website link to access the report.
If you already elected to receive shareholder reports electronically, you will not be affected by this change and you need not take any action. You may elect to receive shareholder reports and other communications from the Fund by contacting your financial intermediary (such as a broker-dealer or bank) or, if you are a direct investor, by calling 855-444-YCGF (855-444-9243) or by sending an e-mail request to info@ycgfunds.com.
You may elect to receive all future reports in paper free of charge. If you invest through a financial intermediary, you can contact your financial intermediary to request that you continue to receive paper copies of your shareholder reports. If you invest directly with the Fund, you can call 855-444-YCGF (855-444-9243) or send an e-mail request to info@ycgfunds.com to let the Fund know you wish to continue receiving paper copies of your shareholder reports. Your election to receive reports in paper will apply to all funds held in your account if you invest through your financial intermediary.
YCG Enhanced Fund
MESSAGE TO SHAREHOLDERS(Unaudited)
Dear Fellow Shareholder:
For the fiscal year ended November 30, 2018, the YCG Enhanced Fund achieved a total net return of 6.08%. During the same time period, the S&P 500 Index had a total return of 6.27%, and the S&P Global Broad Market Index had a total return of -1.06%. The Fund’s top five equity winners and top five equity losers during this period were as follows:
| TOP FIVE EQUITY | TOP FIVE EQUITY |
| WINNERS | LOSERS |
| MasterCard, Inc. – Class A | Cie Financiere Richemont SA – ADR |
| Nike, Inc. – Class B | Facebook, Inc. |
| Aon PLC – Class A | Colgate-Palmolive Co. |
| MSCI, Inc. | The Charles Schwab Corp. |
| Verisk Analytics, Inc. | Hermes International – ADR |
The top 5 equity winners and equity losers are determined based on a ranking of the dollar gains and losses of all the equity securities owned in the portfolio over the period specified above. This calculation excludes the portfolio’s options positions, which may have experienced a gain or a loss during the period specified. Additionally, the Fund seeks to maximize long term capital appreciation with reasonable investment risk. We believe that one year is too short a period to accurately assess the soundness of our investment strategy, and, thus, we try not to draw too many conclusions from the chart above. Instead, we evaluate ourselves by the Fund’s performance over a full economic cycle, which we define as a period that includes both a recession and an economic expansion.
In our view, an investment manager’s most important job is to develop and diligently execute a sensible, easy-to-understand investment process. The “sensible” part makes the strategy potentially effective at producing high risk-adjusted returns and the “easy-to-understand” part helps the manager’s clients stick with the strategy through good times and bad. At YCG, LLC (“YCG”), our investment process essentially consists of two steps. First, we narrow the investment universe down to businesses we feel confident possess enduring pricing power and significant volume growth opportunities. Second, we attempt to construct a portfolio that is robust to both unexpected competitive disruption and volatile macroeconomic cycles. We believe this investment process meets both the “sensible” and the “easy-to-understand” criteria.
However, as all investors eventually discover, “easy-to-understand” is not the same as “easy-to-execute.” The real world is messy and complex, and, because of innovation’s relentless pace and the market economy’s myriad moving parts, no business is completely immune to the threats of disruption and recession. On the other hand, every business does exhibit unique strengths and weaknesses with respect to these two risks. Thus, the job of constructing a portfolio is to weigh all these elements and assemble a variety of businesses that, as a group, effectively combat these risks.
YCG Enhanced Fund
While we believe our existing portfolio accomplishes this risk mitigation objective, we always remain vigilant for opportunities to improve the portfolio’s robustness even further. In the last six months, we believe the market gave us one such opportunity by overreacting to an earnings miss by Copart, Inc. (CPRT), a company we’ve admiringly followed for a long time. In the pages that follow, we’ll explain why we believe Copart is a great business, why we believe investors overreacted, and why we believe its addition to our portfolio is an enhancement.
Copart
Copart is the largest auto salvage company in the United States. We believe it is a great business because 1) its network-driven, recession-resistant business model creates high barriers-to-entry and attractive, stable returns on capital; 2) auto salvage has favorable growth tailwinds and reinvestment opportunities both domestically and internationally; and 3) Copart’s culture, management, and ownership structure are aligned with long-term value creation.
The first reason we believe Copart is a great business is because its network-driven, recession-resistant business model creates high barriers-to-entry and attractive, stable returns on capital. To understand why, a quick overview of the auto salvage industry is necessary. In 2016, over seven million crashes were reported in the United States,1 causing damage to over eleven million vehicles.2 Of these, about 18%3 (roughly two million) were deemed total losses. Including the totaled vehicles from the millions of unreported crashes that also occurred in 20164 as well as some portion of the millions of vehicles that were scrapped due to mechanical failure, the total number of salvageable vehicles was likely around 3 million that year. This number has steadily grown over time and is now over 3.5 million per year.5 The purpose of auto salvage is to sell these vehicles, mostly on behalf of insurance companies, to vehicle dismantlers, rebuilders, repair licensees, used vehicle dealers, exporters, and the general public. Because both the seller-base and buyer-base are quite fragmented, with hundreds of sellers and more than 750,000 buyers in over 170 countries, the most effective sales process is an online auction. An auction is a classic example of a two-sided network. As we have discussed before, the key attribute of two-sided networks is that they are more valuable to sellers the bigger the customer base and more valuable to buyers the bigger the seller base. These increasing returns to scale generally result in mature two-sided network industries being dominated by a small number of large platforms. The auto salvage industry is no different, with Copart and IAA each commanding roughly 40% of the salvage market and a large number
_______________
1 | See page 2 of https://crashstats.nhtsa.dot.gov/Api/Public/ViewPublication/812580. |
2 | See pages 19 and 20 of https://crashstats.nhtsa.dot.gov/Api/Public/ViewPublication/812554. |
3 | See pages 85 and 87 of https://www.cccis.com/crash-course-2018/. |
4 | Surveys suggest that anywhere from 30% to 47% of crashes go unreported. See https://crashstats.nhtsa.dot.gov/Api/Public/ViewPublication/812183. |
5 | See https://www.iaai.com/about/aboutiaaiview.aspx. |
YCG Enhanced Fund
of smaller competitors each possessing a mere fraction of this amount. Besides this auction network effect, Copart also possesses a distribution network effect. Similar to other retailers and distributors, Copart’s network of over 200 salvage yards in 11 countries benefits from increasing economies of scale, with increasing location density resulting in reduced costs per vehicle for both Copart and its customers over time. Finally, Copart is protected from additional competition by a phenomenon called Not In My Back Yard (NIMBY). Because salvage yards contain many hazardous materials and chemicals from totaled cars, residents of neighboring communities fight hard to prevent new ones from being approved.6 Thus, in order to compete against Copart and IAA, new entrants must fight expensive, lengthy battles to acquire new sites for salvage yards. In many cases, these battles can seem especially futile because 1) the choicest locations are often already taken by the big two and 2) communities can argue that salvage is already well-served by the existing yards. All these factors combine to result in high barriers to entry and returns on capital for the two largest auto salvage players.
Importantly, auto salvage is also quite recession-resistant, as an analysis of Copart’s two main revenue drivers demonstrates. The first of these drivers, the number of cars Copart salvages each year, varies over time according to a simple formula: total miles driven x accidents per mile driven x vehicles per accident x salvage rate x Copart’s market share. In a recession, total miles driven decreases, but not by much. Even in the 2008-2009 recession, total miles driven only fell by 3%.7 Neither accidents per mile driven nor vehicles per accident is much affected by recessions. The salvage rate, all other things equal, actually increases in a recession because repair costs as a percentage of pre-accident values go up as used car prices go down. Copart’s market share also tends to increase during recessions as some weaker players go out of business or sell to Copart. The net result is that the number of cars salvaged tends to rise even in most recessions. The second of Copart’s revenue drivers, revenue per car, is more negatively impacted by recessionary environments. Revenue per car is tied to the auction value of the vehicle, the number of services consumed, the pricing of these services, and international exchange rates. Auction value generally decreases during recessions because consumers typically defer big-ticket purchases, pressuring new and used car prices. In the 2008-2009 recession, used car prices decreased by roughly 15%.8 Amazingly, Copart was able to completely offset this price decline through some combination of increased services per car and increased price per service, leading to marginal growth in revenue per car in local currencies. However, the strengthening of the U.S. dollar relative to international currencies resulted in lower U.S. dollar revenue per car. Combining the increase in cars salvaged with the
_______________
6 | See https://toxicsaction.org/issues/waste/illegal-junkyards/. |
7 | See https://money.cnn.com/2015/10/26/news/economy/americans-driving-all-time-high/index.html. |
8 | See https://publish.manheim.com/content/dam/consulting/ManheimUsedVehicleValueIndex-LineGraph.png. |
YCG Enhanced Fund
decrease in revenue per car, Copart’s service revenues proved remarkably resilient in the 2008-2009 recession, decreasing by less than one percent. Even total revenues, which included a vehicle sales business acquired in connection with a UK acquisition that requires Copart to take ownership of certain totaled cars and then resell them, only decreased by 5% from 2008 to 2009.9 Because of Copart’s high operating margins and strong cost control, operating profits were also only down by 5%. In the deep recession of 2008-2009, this result was far better than average.
The second reason we believe Copart is a great business is because auto salvage has favorable growth tailwinds and reinvestment opportunities both domestically and internationally. On the domestic side, the best way to evaluate this growth potential is to return to Copart’s revenue equation: total miles driven x accidents per mile driven x vehicles per accident x salvage rate x Copart market share x fee per vehicle, with the fee per vehicle being driven, at least in part, by the auction value of the vehicle. We believe the two most predictable of these drivers are total miles driven and growth in the auction value per car over time. We believe total miles driven will continue to grow at roughly the same rate as population at 0.5% to 1.5% per year. We believe auction values are likely to grow by 1.5% per year in real terms and 3.5% to 4.5% in nominal terms, which is similar to historical used car pricing growth, as measured by the Manheim index,10 and new car pricing growth, as measured by the U.S Bureau of Economic Analysis.11 In recent years, revenue growth has been accelerated by numerous other factors that we believe are likely to continue in the intermediate term. First, through scale advantages and bolt-on acquisitions, we believe Copart and IAA will continue supplementing underlying market growth with market share gains from competitors. Second, we believe salvage rates, which have risen over the last few years, will continue to increase. Vehicles are increasing in complexity with more and more electronics and safety features, causing the cost of repair to increase as a percentage of pre-accident vehicle values. Additionally, body shops are consolidating, further increasing repair costs. Moreover, the total stock of cars on the road is getting older as cars last longer. All of these trends put upward pressure on salvage rates over time. Third, while all of the new safety features in cars should, all things equal, help decrease accidents per miles driven over time, they are currently being more than offset by adverse changes in driver behavior such as increased texting while driving, meaning accident rates are also edging up, benefitting revenues. Lastly, because of the network-driven increasing returns to scale of Copart’s business, this revenue growth has bolstered domestic margins over time and may continue to do so, further adding to profit growth.
_______________
9 | This vehicle sales business represented 21% of total sales in 2008 versus only 12.5% in 2018, so we believe total sales and profits would be impacted by an even smaller amount in a comparably deep future recession. |
10 | See https://publish.manheim.com/content/dam/consulting/ManheimUsedVehicleValueIndex-LineGraph.png. |
11 | See https://blog.chron.com/carsandtrucks/2016/04/cost-of-a-car-in-the-year-you-were-born/. |
YCG Enhanced Fund
Internationally, we believe Copart’s growth opportunity is even more exciting. In contrast to the United States, many international insurers reimburse their policyholder for the difference in value between the pre-damaged car and the damaged car and then the policyholder has to sell the damaged vehicle to recover the rest of the value. Copart’s model is a win for policyholders and insurers because they get higher, faster, and more predictable value for the salvaged vehicle and a win for buyers because they get a steadier supply of inventory. This state of affairs, in which markets are relatively nascent, auto salvage services are highly desired by customers, and the competitive field is open with no strong incumbents, makes Copart’s international division a promising place for investment. Even better, because Copart’s U.S. online auctions draw so many international bidders (over 21% of the total in recent auctions),12 Copart possesses a built-in buyer base that gives them an advantage over competitors and increases management’s (and our) confidence in the return on incremental international investment. Because of these advantages and opportunities, Copart now has operations in the UK, UAE, Bahrain, Oman, Brazil, Spain, India, Ireland, and Germany, representing 17% of sales and 12% of operating profits. Copart’s UK operations provide tantalizing indications of international’s revenue and profit potential, with economics that are already comparable to Copart’s North American business despite being both newer and much smaller in size.13 Accordingly, as the international markets mature, we believe they may be able to achieve similar operating margins to the US at 34.5% versus current margins of 22%.
Summing these growth drivers (growth in miles driven + growth in used car values + growth in accidents per mile + growth in salvage rates + organic market share gains + bolt-on acquisitions + international growth), we believe Copart can compound revenues by a high-single-digit percentage over the medium term, which, amazingly, would actually be a deceleration from the torrid 11% compound annual revenue growth they’ve generated over the last 12 years. As we cited earlier, because of increasing returns to scale, Copart may be able to grow operating profits even faster, though investments in new markets may end up offsetting the increasing returns of mature markets. Given the promise of many of these new markets, we’d actually prefer this more aggressive reinvestment scenario.
The third and final reason we believe Copart is a great business is because Copart’s culture, management, and ownership structure are aligned with long-term value creation. Evidence for Copart’s strong culture abounds. The company has invested more in technology than its main competitor, IAA, and now has fully online auctions. Additionally, the company has invested more aggressively in its international operations. Despite these margin-pressuring investments, Copart possesses higher
_______________
12 | See page 2 of https://www.sec.gov/Archives/edgar/data/900075/000090007518000048/cprt07312018-10k.htm. |
13 | See page 19 of https://www.copart.com/Content/US/EN/PDFs/IR-SEC-Copart-Informational Supplement-2016April.pdf. |
YCG Enhanced Fund
operating margins than IAA, suggesting better cost discipline. The company’s culture of ownership also shines through in its decision to own its salvage yards versus IAA choosing to lease them, its conservative capital structure with virtually no net debt (0.16x net debt/EBITDA), and, finally, its superlative capital allocation decisions. On that last point, Copart has raised debt and bought back big blocks of shares when management has judged the stock as cheap and bought back no stock at other times when buying back stock has appeared less attractive than business reinvestment. These decisions have proven very prescient over time, with the stock purchases generally occurring at low historical valuations and before big growth spurts. Given the high inside ownership of the company, with the founder and management combining to own 16.4% of shares outstanding, we believe this corporate excellence is both no surprise and quite likely to continue well into the future.
As you can probably tell from our discussion of Copart, we love this business. In our view, there are very few near-term risks to the business and many exciting opportunities. However, before moving on to our discussion of its valuation and the price decline that allowed us to take a position, we must deal with the key long-term risk to Copart’s business model: vastly improved safety technologies and/or fully autonomous driving.
While safety technologies are currently being offset by driver behavior such as texting-while-driving, in the long run, we believe continued innovation will eventually cause declining accidents per mile. We believe slow declines are likely manageable given Copart’s numerous growth drivers and the fact that new technologies that reduce accident frequencies also tend to increase repair costs and thus salvage rates. However, rapid deployment of fully-autonomous vehicles could cause accident rates to plummet, likely significantly impairing Copart’s business model. While, as citizens, we are hoping for this future, we believe there are a number of factors that will delay, probably by decades, full autonomy.
We believe full autonomy faces numerous technical and cultural challenges that many investors and commentators underestimate. First, while humans can be outclassed by computers in many narrow domains, driving is a very general-purpose task with a large number of edge cases such as traffic lights outages, strange behavior from other drivers and pedestrians, and weird weather conditions. It is unclear how long it will take for autonomy to supersede humans on these issues. The eventual solution may require car-to-car and car-to-infrastructure networked solutions, leading to the next issue with full autonomy. Even if fully functioning autonomous driving capabilities were available today, the deployment of these technologies would require massive investment by both governments and individuals. In some envisioned scenarios, governments would have to embed an untold number of chips in roads and individuals would have to choose to replace the stock of over 288 million cars currently registered in the United States.14 Given that new car sales typically
_______________
14 | See page 8 of https://crashstats.nhtsa.dot.gov/Api/Public/ViewPublication/812554. |
YCG Enhanced Fund
oscillate between 15 and 18 million cars per year,15 car upgrades alone would likely take at least 15 years. Furthermore, while autonomy solves some problems, it also creates new ones, such as computer viruses and bugs. These will likely occur both accidentally and through premeditated, coordinated attacks. This new source of accidents could prove to be a source of more frequent small accidents than people currently anticipate, and it may also increase the risk of much larger and potentially more disastrous ones. Autonomy could also create new problems that we currently can’t even imagine. After all, we’ve already seen an example of new solutions creating unanticipated new problems with increased safety technologies coinciding with the rise of the mobile phone, leading to higher accident rates.
Full autonomy must also deal with numerous cultural challenges. Many people enjoy driving and/or feel resistant to ceding full control of their safety to their car’s computer either because of overconfidence or anxiety related to the black box nature of complex technology. Additionally, the algorithms that drive autonomous cars all possess an implicit or explicit ethical framework. Through a regulatory framework, society must decide what this framework should look like. Should the autonomous car preference the driver’s life, the passenger’s life, or the pedestrian’s? What if there are three pedestrians? What if one of the pedestrians is a child? This conundrum, commonly referred to as the Trolley Problem, has confounded philosophers since it was first introduced in 1905.16 It will likely take society and its politicians years to decide on and institute a framework. Even if a significant portion of the population agrees on the answers, many individuals may fight for the right to opt out and choose their own ethical framework. Understandably, many would probably want their car to preference their own or their child’s life.
Finally, when considering the risk of autonomous driving, we take comfort in two additional facts. First, because Copart’s founder and top executives own such substantial stakes in the company, they are heavily incentivized to proactively react to autonomous driving developments in ways that will protect shareholder value, whether that means exiting or evolving or running-down the business if and when autonomy takes crashes down to levels that irreparably hurt the salvage industry’s economics. Second, we own Google, which is the clear leader in autonomous driving technologies, so, if we’re wrong on the timing of driverless car deployment, we’re at least somewhat hedged through our ownership in Google.
Now that we’ve provided our thoughts on autonomous driving, let’s finish up with a discussion of Copart’s valuation and the opportunity the market gave us to purchase the stock. As we often mention, once we classify a business as great, we evaluate the forward risk-adjusted rate of return relative to the other stocks we own. If we decide the spread is not large enough to warrant a portfolio change, we put the business to
_______________
15 | See https://www.statista.com/statistics/199983/us-vehicle-sales-since-1951/. |
16 | See https://en.wikipedia.org/wiki/Trolley_problem. |
YCG Enhanced Fund
the side and remain vigilant for spread-widening opportunities. The most common spread-widening opportunity occurs when the sidelined business experiences temporary problems, which we believe generally causes investors to overly discount the stock in a failed effort to market-time these problems. In our view, Copart’s most recent earnings release provides a great example of this phenomenon. Copart reported higher costs than expected related to Hurricane Harvey, promptly causing a more than 20% sell-off and enabling us to purchase the stock at 23x next twelve months earnings. For a business that we believe can grow revenues at high single digits and earnings at low double digits over the medium term with low cyclical risk, we believe this valuation is attractive on an absolute basis and relative to a number of the stocks in our portfolio.
Concluding thoughts
While public equity investing is messy and complex, it’s also incredibly rewarding. It provides a rich array of lessons on history, decision-making, organizational dynamics, and innovation that increase wisdom over time, and it also provides the opportunity to grow wealth at a pace that we believe few other asset classes can match, especially when adjusting for risk. We believe this opportunity is best captured by patiently owning a collection of great businesses, and we hope our discussions of investment process and our analyses of the businesses we own, such as the Copart review in this letter, help you understand why.
Thank you for your trust, know that we are invested right alongside you, and please let us know if you have any questions or concerns. We are here to help.
Sincerely,
The YCG Team
Past performance does not guarantee future results.
Mutual fund investing involves risk. Principal loss is possible. The Fund is non-diversified, meaning it may concentrate its assets in fewer individual holdings than a diversified fund. Therefore, the Fund is more exposed to individual stock volatility than a diversified fund. The Fund invests primarily in equity securities without regard to market capitalization, thus investments will be made in mid and smaller capitalization companies, which involve additional risks such as limited liquidity and greater volatility. The Fund may also write put options and covered call options on a substantial portion of the Fund’s long equity portfolio, which have the risks of early option contract assignment forcing the Fund to purchase the underlying stock at the exercise price which may be the cause of significant losses due to the failure of correctly predicting the direction of securities prices, interest rates and currency exchange rates. The investment in options is not suitable for all investors. Covered call writing may limit the upside of an underlying security. The Fund may also invest in foreign securities which involve political, economic and currency risks, greater volatility, and differences in accounting methods. Investments in debt securities typically decrease in value when interest rates rise. This risk is usually greater for longer-term debt securities. Investment in lower-rated, non-rated and distressed securities presents a greater risk of loss to principal and interest than higher-rated securities.
YCG Enhanced Fund
Diversification does not guarantee a profit or protect from loss in a declining market.
Fund holdings and sector allocations are subject to change at any time and should not be considered recommendations to buy or sell any security. Please see the Schedule of Investments in this report for a complete list of Fund holdings.
The S&P 500 Index is a stock market index based on the market capitalizations of 500 leading companies publicly traded in the U.S. stock market. It is not possible to invest directly in an index.
The S&P Global Broad Market Index is a market capitalization-weighted index that provides a broad measure of the global equities markets and includes approximately 11,000 companies in more than 52 countries covering both developed and emerging markets.
EBITDA stands for Earnings Before Interest, Tax, Depreciation, and Amortization and is a way to measure a company’s operating performance independent of its financing decisions, accounting decisions, and tax environment.
Cash flow is a measure of changes in a company’s cash account during an accounting period, specifically its cash income minus the cash payments it makes. All else being equal, we greatly prefer companies that have high “free cash flows,” which we define as the cash flow from operations that is left over after spending on maintenance capital expenditures and acquisitions that are required to protect the business. In other words, it’s the cash flow from operations that is free and clear to be distributed to shareholders in the form of dividends and share repurchases, and/or to be allocated towards ways to grow the existing business through means such as “growth” acquisitions or new capital expenditures, or simply pay down debt. Typically, we calculate this by looking at a normalized view of net income plus depreciation and amortization minus the maintenance capital expenditures and acquisitions that are required to protect the business, adjusted for often overlooked items such as pensions, stock option expenses, and leases.
The forward risk-adjusted rate of return of a stock is our probability- and risk-weighted estimate of the compound annualized return we believe we are likely to achieve by owning the stock. Using our methodology, the forward risk-adjusted rate of return is calculated by taking the sum total of the free cash flow per share of the company divided by its price (its “Free Cash Flow Yield”) and the long-term rate at which we expect these free cash flows to grow (the “Growth Rate of Free Cash Flow”) and then adjusting this number up or down based on the risk inherent in the stock (i.e. how wide the potential distribution of expected returns are in the various possible future scenarios).
YCG Enhanced Fund
EXPENSE EXAMPLE
For the six months ended November 30, 2018 (Unaudited)
As a shareholder of the YCG Enhanced Fund (the “Fund”), you incur ongoing costs, including management fees and other Fund expenses. If you invest through a financial intermediary, you may also incur additional costs such as a transaction fee charged on the purchase or sale of the Fund or an asset-based management fee. This example is intended to help you understand your ongoing costs (in dollars) of investing in the Fund and to compare these costs with the ongoing costs of investing in other mutual funds.
The Example is based on an investment of $1,000 invested at the beginning of the period and held for the entire period from June 1, 2018 to November 30, 2018.
Actual Expenses
The first line of the table on the next page provides information about actual account values and actual expenses. You may use the information provided in this line, together with the amount you invested, to estimate the expenses that you paid over the period. Simply divide your account value by $1,000 (for example, an $8,600 ending account value divided by $1,000 = 8.6), then multiply the result by the number in the first line under the heading entitled “Expenses Paid During the Period” to estimate the expenses you paid on your account during the period.
Hypothetical Example for Comparison Purposes
The second line of the table on the next page provides information about hypothetical account values and hypothetical expenses based on the Fund’s actual expense ratio and an assumed rate of return of 5% per year before expenses, which is not the Fund’s actual return. The hypothetical account values and expenses may not be used to estimate the actual ending account balance or expenses you paid for the period. You may use this information to compare the ongoing costs of investing in the Fund and other funds. To do so, compare this 5% hypothetical example with the 5% hypothetical examples that appear in the shareholder reports of the other funds.
YCG Enhanced Fund
EXPENSE EXAMPLE (continued)
For the six months ended November 30, 2018 (Unaudited)
Please note that the expenses shown in the table are meant to highlight your ongoing costs only and do not reflect any costs that may be associated with investing in the Fund through a financial intermediary. Therefore, the second line of the table is useful in comparing the ongoing costs only, and will not help you determine the relative total costs of owning different funds. In addition, if any costs associated with investing through a financial intermediary were included, your costs would have been higher.
| | | | Expenses Paid |
| | Beginning | Ending | During Period(1) |
| | Account Value | Account Value | 6/1/18 – |
| | 6/1/18 | 11/30/18 | 11/30/18 |
| Actual | $1,000.00 | $1,003.00 | $5.98 |
| Hypothetical (5% return | | | |
| before expenses) | 1,000.00 | 1,019.10 | 6.02 |
(1) | Expenses are equal to the Fund’s annualized expense ratio of 1.19%, multiplied by the average account value over the period, multiplied by 183/365 to reflect the period. |
YCG Enhanced Fund
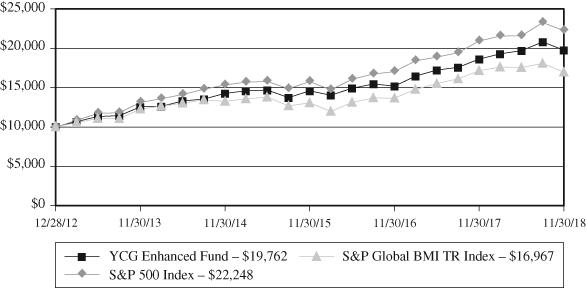
GROWTH OF $10,000 INVESTMENT
(Unaudited)
This chart assumes an initial gross investment of $10,000 made on December 28, 2012 (commencement of the Fund’s operations). Returns shown include the reinvestment of all dividends. Returns shown do not reflect the deductions of taxes that a shareholder would pay on Fund distributions or the redemption of Fund shares. In the absence of fee waivers and reimbursements, when they are necessary to keep expenses at the expense cap, total return would be reduced. Past performance is not predictive of future performance. Investment return and principal value will fluctuate so that your shares, when redeemed, may be worth more or less than original cost. Index returns do not reflect the effects of fees or expenses. It is not possible to invest directly in an index.
| | | | | Since Inception |
| | One Year | Three Year | Five Year | (12/28/2012) |
| Average Annual Returns | | | | |
| YCG Enhanced Fund | 6.08% | 10.62% | 9.47% | 12.19% |
| S&P 500 Index | 6.27% | 12.16% | 11.12% | 14.45% |
| S&P Global BMI TR Index | -1.06% | 9.06% | 6.67% | 9.34% |
YCG Enhanced Fund
TOP TEN EQUITY HOLDINGS
November 30, 2018 (Unaudited)
| | | Percentage of |
| | | Net Assets |
| MasterCard, Inc. – Class A | | | 6.16 | % |
| Moody’s Corp. | | | 5.59 | % |
| Alphabet, Inc. – Class C | | | 5.57 | % |
| Aon PLC | | | 5.54 | % |
| Colgate-Palmolive Co. | | | 5.09 | % |
| Wells Fargo & Co. | | | 4.94 | % |
| CBRE Group, Inc. – Class A | | | 4.78 | % |
| MSCI, Inc. | | | 4.49 | % |
| The Charles Schwab Corp. | | | 4.40 | % |
| Marsh & McLennan Cos, Inc. | | | 4.30 | % |
| Total | | | 50.86 | % |
ALLOCATION OF PORTFOLIO HOLDINGS (as a % of net assets)
November 30, 2018 (Unaudited)
For presentation purposes, the Fund has grouped some of the industry categories. For purpose of categorizing securities for compliance with Section 8(b)(1) of the Investment Company Act of 1940, as amended, the Fund uses more specific industry classifications.
YCG Enhanced Fund
SCHEDULE OF INVESTMENTSNovember 30, 2018
| | | Shares | | | Value | |
| COMMON STOCKS – 95.00% | | | | | | |
| | | | | | | |
| Banks – 4.94% | | | | | | |
| Wells Fargo & Co. | | | 183,637 | | | $ | 9,967,816 | |
| | | | | | | | | |
| Beverages – 3.06% | | | | | | | | |
| Coca-Cola Co. | | | 40,680 | | | | 2,050,272 | |
| PepsiCo., Inc. | | | 33,731 | | | | 4,113,158 | |
| | | | | | | | 6,163,430 | |
| | | | | | | | | |
| Capital Markets – 15.84% | | | | | | | | |
| Moody’s Corp. (c) | | | 70,774 | | | | 11,258,020 | |
| MSCI, Inc. | | | 57,630 | | | | 9,053,097 | |
| TD Ameritrade Holding Corp. (c) | | | 51,198 | | | | 2,754,964 | |
| The Charles Schwab Corp. (c) | | | 197,918 | | | | 8,866,727 | |
| | | | | | | | 31,932,808 | |
| | | | | | | | | |
| Commercial Services & Supplies – 2.16% | | | | | | | | |
| Copart, Inc. (a) (c) | | | 84,915 | | | | 4,345,950 | |
| | | | | | | | | |
| Entertainment – 0.91% | | | | | | | | |
| The Walt Disney Co. | | | 15,880 | | | | 1,833,981 | |
| | | | | | | | | |
| Food Products – 1.84% | | | | | | | | |
| Nestle SA – ADR | | | 43,625 | | | | 3,717,723 | |
| | | | | | | | | |
| Household Products – 7.13% | | | | | | | | |
| Colgate-Palmolive Co. | | | 161,672 | | | | 10,269,406 | |
| Procter & Gamble Co. (b) | | | 43,330 | | | | 4,095,118 | |
| | | | | | | | 14,364,524 | |
| | | | | | | | | |
| Insurance – 9.84% | | | | | | | | |
| Aon PLC (b) | | | 67,682 | | | | 11,174,975 | |
| Marsh & McLennan Cos, Inc. | | | 97,608 | | | | 8,657,830 | |
| | | | | | | | 19,832,805 | |
| | | | | | | | | |
| Interactive Media & Services – 8.82% | | | | | | | | |
| Alphabet, Inc. – Class C (a) (c) | | | 10,251 | | | | 11,219,002 | |
| Facebook, Inc. (a) (c) | | | 46,709 | | | | 6,567,752 | |
| | | | | | | | 17,786,754 | |
See notes to financial statements.
YCG Enhanced Fund
SCHEDULE OF INVESTMENTS (continued)
November 30, 2018
| | | Shares | | | Value | |
| COMMON STOCKS – 95.00% (continued) | | | | | | |
| | | | | | | |
| Internet & Direct Marketing Retail – 2.89% | | | | | | |
| Booking Holdings, Inc. (a) | | | 3,079 | | | $ | 5,825,099 | |
| | | | | | | | | |
| IT Services – 6.27% | | | | | | | | |
| MasterCard, Inc. – Class A | | | 61,780 | | | | 12,422,104 | |
| Visa, Inc. | | | 1,490 | | | | 211,148 | |
| | | | | | | | 12,633,252 | |
| | | | | | | | | |
| Personal Products – 9.65% | | | | | | | | |
| L’Oreal SA – ADR | | | 174,739 | | | | 8,244,186 | |
| The Estee Lauder Companies, Inc. (c) | | | 37,097 | | | | 5,292,258 | |
| Unilever NV – ADR | | | 106,583 | | | | 5,916,422 | |
| | | | | | | | 19,452,866 | |
| | | | | | | | | |
| Professional Services – 4.03% | | | | | | | | |
| Verisk Analytics, Inc. (a) | | | 65,915 | | | | 8,128,638 | |
| | | | | | | | | |
| Real Estate Management & Development – 4.78% | | | | | | | | |
| CBRE Group, Inc. – Class A (a) (c) | | | 220,762 | | | | 9,642,884 | |
| | | | | | | | | |
| Software – 2.01% | | | | | | | | |
| Microsoft Corp. | | | 36,513 | | | | 4,048,927 | |
| | | | | | | | | |
| Textiles, Apparel & Luxury Goods – 10.83% | | | | | | | | |
| Adidas AG – ADR | | | 29,089 | | | | 3,220,734 | |
| Cie Financiere Richemont SA – ADR | | | 1,101,628 | | | | 7,105,500 | |
| Hermes International – ADR | | | 17,705 | | | | 956,867 | |
| Kering SA – ADR | | | 16,738 | | | | 729,442 | |
| LVMH Moet Hennessy Louis Vuitton SE – ADR | | | 20,834 | | | | 1,184,017 | |
| NIKE, Inc. – Class B | | | 114,831 | | | | 8,626,105 | |
| | | | | | | | 21,822,665 | |
| TOTAL COMMON STOCKS | | | | | | | | |
| (Cost $153,916,650) | | | | | | | 191,500,122 | |
| | | | | | | | | |
See notes to financial statements.
YCG Enhanced Fund
SCHEDULE OF INVESTMENTS (continued)
November 30, 2018
| | | Principal | | | | |
| | | Amount | | | Value | |
| SHORT-TERM INVESTMENTS – 3.31% | | | | | | |
| | | | | | | |
| U.S. Treasury Bills – 3.31% | | | | | | |
| 0.000%, 03/28/2019 (a) | | $ | 3,194,000 | | | $ | 3,169,921 | |
| 0.000%, 04/18/2019 (a) | | | 531,000 | | | | 526,125 | |
| 0.000%, 04/25/2019 (a) | | | 648,000 | | | | 641,732 | |
| 0.000%, 05/02/2019 (a) | | | 2,239,000 | | | | 2,216,237 | |
| 0.000%, 05/16/2019 (a) | | | 110,000 | | | | 108,773 | |
| TOTAL SHORT-TERM INVESTMENTS | | | | | | | | |
| (Cost $6,663,903) | | | | | | | 6,662,788 | |
| Total Investments (Cost $160,580,553) – 98.31% | | | | | | | 198,162,910 | |
| Other Assets in Excess of Liabilities – 1.69% | | | | | | | 3,413,485 | |
| TOTAL NET ASSETS – 100.00% | | | | | | $ | 201,576,395 | |
Percentages are stated as a percent of net assets.
| ADR | American Depositary Receipt |
| (a) | Non-Income Producing |
| (b) | A portion of this security is pledged as collateral on options written. As of November 30, 2018, the value of collateral is $4,727,985. |
| (c) | Security held in connection with options written. |
The Global Industry Classification Standard (“GICS”) was developed by and/or is the exclusive property of MSCI, Inc. (“MSCI”) and Standard & Poor Financial Services LLC (“S&P”). GICS is a service mark of MSCI and S&P and has been licensed for use by U.S. Bancorp Fund Services, LLC.
See notes to financial statements.
YCG Enhanced Fund
SCHEDULE OF OPTIONS WRITTEN
November 30, 2018
| | | | | | Notional | | | | |
| | | Contracts | | | Amount | | | Value | |
PUT OPTIONS(a) | | | | | | | | | |
| Alphabet, Inc. – Class C | | | | | | | | | |
| Expiration: January 2019; Exercise Price: $1,060.00 | | | 1 | | | $ | 106,000 | | | $ | 3,003 | |
| CBRE Group, Inc. – Class A | | | | | | | | | | | | |
| Expiration: December 2018; Exercise Price: $40.00 | | | 110 | | | | 440,000 | | | | 1,650 | |
| Expiration: December 2018; Exercise Price: $45.00 | | | 580 | | | | 2,610,000 | | | | 113,680 | |
| Expiration: December 2018; Exercise Price: $50.00 | | | 1 | | | | 5,000 | | | | 620 | |
| Copart, Inc. | | | | | | | | | | | | |
| Expiration: December 2018; Exercise Price: $50.00 | | | 537 | | | | 2,685,000 | | | | 53,700 | |
| The Estee Lauder Companies, Inc. | | | | | | | | | | | | |
| Expiration: January 2019; Exercise Price: $125.00 | | | 101 | | | | 1,262,500 | | | | 9,090 | |
| Facebook, Inc. | | | | | | | | | | | | |
| Expiration: January 2019; Exercise Price: $145.00 | | | 14 | | | | 203,000 | | | | 11,620 | |
| Expiration: January 2019; Exercise Price: $155.00 | | | 46 | | | | 713,000 | | | | 70,288 | |
| Moody’s Corp. | | | | | | | | | | | | |
| Expiration: December 2018; Exercise Price: $140.00 | | | 75 | | | | 1,050,000 | | | | 3,037 | |
| Expiration: February 2019; Exercise Price: $145.00 | | | 30 | | | | 435,000 | | | | 8,400 | |
| Expiration: February 2019; Exercise Price: $150.00 | | | 9 | | | | 135,000 | | | | 3,083 | |
| TD Ameritrade Holding Corp. | | | | | | | | | | | | |
| Expiration: February 2019; Exercise Price: $50.00 | | | 22 | | | | 110,000 | | | | 2,926 | |
| Expiration: February 2019; Exercise Price: $55.00 | | | 21 | | | | 115,500 | | | | 6,720 | |
| The Charles Schwab Corp. | | | | | | | | | | | | |
| Expiration: December 2018; Exercise Price: $55.00 | | | 63 | | | | 346,500 | | | | 65,520 | |
| Total Options Written | | | | | | | | | | | | |
| (Premiums received $471,631) | | | | | | | | | | $ | 353,337 | |
See notes to financial statements.
YCG Enhanced Fund
STATEMENT OF ASSETS AND LIABILITIES
November 30, 2018
| ASSETS: | | | |
| Investments, at value (Cost $160,580,553) | | $ | 198,162,910 | |
| Cash | | | 2,863 | |
| Deposits with brokers for options written | | | 3,613,640 | |
| Receivable for Fund shares sold | | | 10,429 | |
| Dividends and interest receivable | | | 371,853 | |
| Prepaid expenses | | | 22,247 | |
| Total Assets | | | 202,183,942 | |
| | | | | |
| LIABILITIES: | | | | |
| Options written, at value (Premiums received $471,631) | | | 353,337 | |
| Payable for investment securities purchased | | | 17,000 | |
| Payable to investment adviser | | | 152,672 | |
| Payable to custodian | | | 4,097 | |
| Other accrued expenses | | | 80,441 | |
| Total Liabilities | | | 607,547 | |
| NET ASSETS | | $ | 201,576,395 | |
| | | | | |
| NET ASSETS CONSIST OF: | | | | |
| Capital stock | | $ | 157,545,909 | |
| Total distributable earnings | | | 44,030,486 | |
| Total Net Assets | | $ | 201,576,395 | |
| Shares outstanding (unlimited shares of no par value authorized) | | | 11,863,197 | |
| | | | | |
| NET ASSET VALUE, OFFERING AND | | | | |
REDEMPTION PRICE PER SHARE(1) | | $ | 16.99 | |
(1) | A redemption fee of 2.00% is assessed against shares redeemed within 30 days of purchase. See Note 2(h). |
See notes to financial statements.
YCG Enhanced Fund
STATEMENT OF OPERATIONS
For the year ended November 30, 2018
| INVESTMENT INCOME: | | | |
Dividend income(1) | | $ | 2,660,499 | |
| Interest income | | | 321,838 | |
| Total investment income | | | 2,982,337 | |
| | | | | |
| EXPENSES: | | | | |
| Investment advisory fees | | | 1,906,599 | |
| Shareholder Service fees | | | 83,964 | |
| Administration fees | | | 82,222 | |
| Accounting fees | | | 52,349 | |
| Federal and state registration fees | | | 47,601 | |
| Compliance fees | | | 47,318 | |
| Transfer agent fees and expenses | | | 35,938 | |
| Legal fees | | | 35,676 | |
| Custody fees | | | 22,061 | |
| Audit and tax fees | | | 16,005 | |
| Trustee fees and expenses | | | 12,006 | |
| Insurance fees | | | 11,820 | |
| Reports to shareholders | | | 10,733 | |
| Miscellaneous expenses | | | 6,147 | |
| Total expenses before reimbursements | | | 2,370,439 | |
| Expense reimbursement by investment advisor (See Note 4) | | | (101,586 | ) |
| Net Expenses | | | 2,268,853 | |
| NET INVESTMENT INCOME | | | 713,484 | |
| REALIZED AND UNREALIZED GAIN: | | | | |
| Net realized gain on | | | | |
| Investments | | | 3,441,634 | |
| Options written | | | 2,211,242 | |
| Total | | | 5,652,876 | |
| Net change in unrealized appreciation (depreciation) on | | | | |
| Investments | | | 3,785,346 | |
| Options written | | | (100,540 | ) |
| Total | | | 3,684,806 | |
| Net realized and unrealized gain on investments | | | 9,337,682 | |
| NET INCREASE IN NET ASSETS | | | | |
| RESULTING FROM OPERATIONS | | $ | 10,051,166 | |
(1) | Net of $170,267 in foreign withholding taxes and fees. |
See notes to financial statements.
YCG Enhanced Fund
STATEMENTS OF CHANGES IN NET ASSETS
| | | | | | | |
| | | Year Ended | | | Year Ended | |
| | | November 30, 2018 | | | November 30, 2017 | |
| OPERATIONS: | | | | | | |
| Net investment income | | $ | 713,484 | | | $ | 588,492 | |
| Net realized gain on investments | | | | | | | | |
| and options written | | | 5,652,876 | | | | 4,506,724 | |
| Net change in unrealized appreciation | | | | | | | | |
| on investments and options written | | | 3,684,806 | | | | 20,063,388 | |
| Net increase in net assets | | | | | | | | |
| resulting from operations | | | 10,051,166 | | | | 25,158,604 | |
| | | | | | | | | |
| CAPITAL SHARE TRANSACTIONS: | | | | | | | | |
| Proceeds from shares sold | | | 74,514,324 | | | | 19,279,437 | |
| Proceeds from reinvestment of distributions | | | 4,828,456 | | | | 3,410,493 | |
| Redemption fees | | | 345 | | | | 590 | |
| | | | 79,343,125 | | | | 22,690,520 | |
| Payments for shares redeemed | | | (24,821,657 | ) | | | (11,734,331 | ) |
| Net increase | | | 54,521,468 | | | | 10,956,189 | |
| | | | | | | | | |
| DISTRIBUTIONS TO SHAREHOLDERS: | | | | | | | | |
| Distributions to Shareholders | | | (5,095,089 | ) | | | (3,584,262 | )(1) |
| | | | | | | | | |
| TOTAL INCREASE IN NET ASSETS | | | 59,477,545 | | | | 32,530,531 | |
| | | | | | | | | |
| NET ASSETS: | | | | | | | | |
| Beginning of year | | | 142,098,850 | | | | 109,568,319 | |
| End of year | | $ | 201,576,395 | | | $ | 142,098,850 | (2) |
| | | | | | | | | |
| CHANGES IN SHARES OUTSTANDING: | | | | | | | | |
| Shares sold | | | 4,467,005 | | | | 1,271,121 | |
| Issued in reinvestment of distributions | | | 295,137 | | | | 247,496 | |
| Shares redeemed | | | (1,459,734 | ) | | | (782,461 | ) |
| Net increase | | | 3,302,408 | | | | 736,156 | |
(1) | Includes net investment income distributions of $603,540 and net realized gains distributions of $2,980,722. |
(2) | Includes accumulated undistributed net investment income of $588,492. |
See notes to financial statements.
YCG Enhanced Fund
FINANCIAL HIGHLIGHTS
For a Fund share outstanding throughout the year
| | | Year Ended November 30, | |
| | | 2018 | | | 2017 | | | 2016 | | | 2015 | | | 2014 | |
| NET ASSET VALUE: | | | | | | | | | | | | | | | |
| Beginning of year | | $ | 16.60 | | | $ | 14.00 | | | $ | 13.73 | | | $ | 14.00 | | | $ | 12.57 | |
| | | | | | | | | | | | | | | | | | | | | |
| OPERATIONS: | | | | | | | | | | | | | | | | | | | | |
| Net investment income | | | 0.06 | | | | 0.07 | | | | 0.08 | | | | 0.06 | | | | 0.07 | |
| Net realized and | | | | | | | | | | | | | | | | | | | | |
| unrealized gain on | | | | | | | | | | | | | | | | | | | | |
| investment securities | | | 0.93 | | | | 3.00 | | | | 0.48 | | | | 0.24 | | | | 1.61 | |
| Total from | | | | | | | | | | | | | | | | | | | | |
| investment operations | | | 0.99 | | | | 3.07 | | | | 0.56 | | | | 0.30 | | | | 1.68 | |
| Redemption fee proceeds | | | — | (1) | | | — | (1) | | | — | (1) | | | — | (1) | | | — | (1) |
| Dividends from net | | | | | | | | | | | | | | | | | | | | |
| investment income | | | (0.07 | ) | | | (0.08 | ) | | | (0.06 | ) | | | (0.06 | ) | | | (0.08 | ) |
| Dividends from | | | | | | | | | | | | | | | | | | | | |
| net realized gains | | | (0.53 | ) | | | (0.39 | ) | | | (0.23 | ) | | | (0.51 | ) | | | (0.17 | ) |
| Total distributions | | | (0.60 | ) | | | (0.47 | ) | | | (0.29 | ) | | | (0.57 | ) | | | (0.25 | ) |
| | | | | | | | | | | | | | | | | | | | | |
| NET ASSET VALUE: | | | | | | | | | | | | | | | | | | | | |
| End of year | | $ | 16.99 | | | $ | 16.60 | | | $ | 14.00 | | | $ | 13.73 | | | $ | 14.00 | |
| | | | | | | | | | | | | | | | | | | | | |
| TOTAL RETURN | | | 6.08 | % | | | 22.58 | % | | | 4.11 | % | | | 2.25 | % | | | 13.58 | % |
| | | | | | | | | | | | | | | | | | | | | |
| SUPPLEMENTAL DATA | | | | | | | | | | | | | | | | | | | | |
| AND RATIOS: | | | | | | | | | | | | | | | | | | | | |
| Net assets; | | | | | | | | | | | | | | | | | | | | |
| end of year (000’s) | | $ | 201,576 | | | $ | 142,099 | | | $ | 109,568 | | | $ | 89,540 | | | $ | 84,112 | |
| Ratio of expenses to | | | | | | | | | | | | | | | | | | | | |
| average net assets: | | | | | | | | | | | | | | | | | | | | |
| Expenses including | | | | | | | | | | | | | | | | | | | | |
| reimbursement (recapture) | | | 1.19 | % | | | 1.19 | % | | | 1.24 | %(2) | | | 1.39 | % | | | 1.39 | % |
| Expenses excluding | | | | | | | | | | | | | | | | | | | | |
| reimbursement (recapture) | | | 1.24 | % | | | 1.34 | % | | | 1.36 | % | | | 1.32 | % | | | 1.38 | % |
| Net investment income | | | | | | | | | | | | | | | | | | | | |
| including reimbursement | | | | | | | | | | | | | | | | | | | | |
| (recapture) | | | 0.37 | % | | | 0.47 | % | | | 0.58 | % | | | 0.43 | % | | | 0.55 | % |
| Net investment income | | | | | | | | | | | | | | | | | | | | |
| excluding reimbursement | | | | | | | | | | | | | | | | | | | | |
| (recapture) | | | 0.32 | % | | | 0.32 | % | | | 0.46 | % | | | 0.50 | % | | | 0.56 | % |
| Portfolio turnover rate | | | 21.15 | % | | | 15.98 | % | | | 23.76 | % | | | 18.49 | % | | | 25.46 | % |
(1) | Amount represents less than $0.01 per share. |
(2) | See Note 4. |
See notes to financial statements.
YCG Enhanced Fund
NOTES TO FINANCIAL STATEMENTSNovember 30, 2018
1. ORGANIZATION
YCG Funds (the “Trust”) is a Delaware statutory trust organized under an Agreement and Declaration of Trust dated September 4, 2012. The Trust is an open-end management investment company, as defined in the Investment Company Act of 1940 as amended (the “1940 Act”). The Trust consists of one series, YCG Enhanced Fund (the “Fund”). The Fund is classified and operates as a non-diversified fund under the 1940 Act. The Fund commenced operations on December 28, 2012. The Fund’s investment adviser is YCG, LLC (the “Adviser”). There are an unlimited number of authorized shares. The investment objective of the Fund is to maximize long-term capital appreciation with reasonable investment risk.
2. SUMMARY OF SIGNIFICANT ACCOUNTING POLICIES
The following is a summary of significant accounting policies consistently followed by the Fund in the preparation of its financial statements. The financial statements have been prepared in conformity with accounting principles generally accepted in the United States of America (“GAAP”). The Fund is an investment company and accordingly follows the investment company accounting and reporting guidance of the Financial Accounting Standards Board (“FASB”) Accounting Standards Codification Topic 946 Financial Services – Investment Companies.
a) Subsequent Events Evaluation – In preparing these financial statements, management has evaluated events and transactions for potential recognition or disclosure resulting from subsequent events through the date the financial statements were issued. This evaluation did not result in any subsequent events that necessitated disclosures and/or adjustments other than the event listed below.
On December 20, 2018, the Trust declared and paid distributions from ordinary income and net realized capital gains to shareholders of record as of December 19, 2018, as follows:
| | Ordinary | Short-Term | Long-Term |
| | Income | Capital Gain | Capital Gain |
| Distribution Paid | $713,484 | $2,880,110 | $2,772,782 |
| Distribution Paid Per Share | $0.06029454 | $0.24339000 | $0.23432000 |
b) Investment Valuation – Securities which are traded on a national stock exchange are valued at the last sale price on the securities exchange on which such securities are primarily traded. Securities that are traded on The Nasdaq OMX Group, Inc., referred to as Nasdaq, are valued at the Nasdaq Official Closing Price. Exchange-traded securities for which there were no transactions are valued at the current bid prices. Securities traded on only over-the-counter markets are valued on the basis of closing over-the-counter bid prices. Short-term debt instruments maturing within 60 days are valued by the amortized cost method, which approximates fair value. Amortized cost is not used if its use would be inappropriate due to credit or other impairments of the
YCG Enhanced Fund
NOTES TO FINANCIAL STATEMENTS (continued)
November 30, 2018
issuer, in which case the security’s fair value would be determined, as described below. Debt securities (other than those valued using the amortized cost method) are valued at the market price furnished by a national pricing service, if available, and otherwise at the most recent bid quotation or evaluated price, subject to review by the Adviser and determination of the appropriate price whenever a furnished price is significantly different from the previous day’s furnished price. Options written or purchased by the Fund are valued at the last sales price. If there are no trades for an option on a given day, options are valued at the mean between the current bid and asked prices. Any securities for which there are no readily available market quotations and other assets will be valued at their fair value as determined in good faith by the Adviser pursuant to procedures established by and under the supervision of the Board of Trustees.
Valuation Measurements
The Fund has adopted authoritative fair valuation accounting standards which establish an authoritative definition of fair value and set out a hierarchy for measuring fair value. These standards require additional disclosures about the various inputs and valuation techniques used to develop the measurements of fair value and a discussion of changes in valuation techniques and related inputs, if any, during the period. In addition, these standards require expanded disclosure for each major category of assets. These inputs are summarized in the three broad levels listed below:
| Level 1 – | Quoted prices in active markets for identical securities. |
| | |
| Level 2 – | Other significant observable inputs (including quoted prices for similar securities, interest rates, prepayment speeds, credit risk, etc.) |
| | |
| Level 3 – | Significant unobservable inputs (including the Fund’s own assumptions in determining the fair value of investments). |
The inputs or methodology used for valuing securities are not an indication of the risk associated with investing in those securities. The following is a summary of the inputs used to value the Fund’s net assets as of November 30, 2018:
| | | Level 1 | | | Level 2 | | | Level 3 | | | Total | |
Assets | | | | | | | | | | | | |
| Common Stocks* | | $ | 191,500,122 | | | $ | — | | | $ | — | | | $ | 191,500,122 | |
| Short-Term Investments | | | — | | | | 6,662,788 | | | | — | | | | 6,662,788 | |
| Total Investments | | | | | | | | | | | | | | | | |
| in Securities | | $ | 191,500,122 | | | | 6,662,788 | | | $ | — | | | $ | 198,162,910 | |
Liabilities | | | | | | | | | | | | | | | | |
| Other Financial | | | | | | | | | | | | | | | | |
| Instruments** | | | | | | | | | | | | | | | | |
| Options Written | | $ | 353,337 | | | $ | — | | | $ | — | | | $ | 353,337 | |
| * | | Please refer to the Schedule of Investments to view securities by industry type. |
| ** | | Other Financial Instruments are derivative instruments not reflected in the Schedule of Investments, such as options written, which are reflected at value. |
YCG Enhanced Fund
NOTES TO FINANCIAL STATEMENTS (continued)
November 30, 2018
The Fund did not invest in any Level 3 investments during the year.
c) Option Writing – The Fund may write covered call options and put options on a substantial portion of the Fund’s long equity portfolio as a means to generate additional income and to tax-efficiently enter and exit positions. The Fund will not use this strategy as a means of generating implicit leverage. In other words, if all put options were to be exercised, the Fund will generally have enough cash on hand to purchase the assigned shares. When the Fund writes an option, an amount equal to the premium received by the Fund is recorded as a liability and is subsequently adjusted to the current fair value of the option written. Premiums received from writing options that expire unexercised are treated by the Fund on the expiration date as realized gains from options written. The difference between the premium and the amount paid on effecting a closing purchase transaction, including brokerage commissions, is also treated as a realized gain, or, if the premium is less than the amount paid for the closing purchase transaction, as a realized loss. If a call option is exercised, the premium is added to the proceeds from the sale of the underlying security in determining whether the Fund has realized a gain or loss. If a put option is exercised, the premium reduces the cost basis of the securities purchased by the Fund. The Fund, as a writer of an option, bears the market risk of an unfavorable change in the price of the security underlying the written option. Upon writing an option, the Fund is required to pledge an amount of cash or securities, as determined by the broker, as collateral. As of November 30, 2018, the Fund held securities with a value of $4,727,985 and cash of $3,613,640 as collateral for options written. During the year, the Fund used written covered call and put options in a manner consistent with the strategy described above.
The value of Derivative Instruments on the Statement of Assets and Liabilities as of November 30, 2018, are as follows:
| | Liability Derivatives |
| Derivatives not | | |
| accounted for | | |
| as hedging | | |
| instruments | Location | Value |
| Equity Contracts – Options | Options written, at value | $353,337 |
| | | |
YCG Enhanced Fund
NOTES TO FINANCIAL STATEMENTS (continued)
November 30, 2018
The effect of Derivative Instruments on the Statement of Operations for the year ended November 30, 2018, are as follows:
| Amount of Realized Gain on | Change in Unrealized Depreciation |
| Derivatives Recognized in Income | on Derivatives Recognized in Income |
| Derivatives not | | Derivatives not | |
| accounted for | | accounted for | |
| as hedging | Options | as hedging | Options |
| instruments | Written | instruments | Written |
| Equity Contracts | $2,211,242 | Equity Contracts | ($100,540) |
The average monthly value of options written during the year ended November 30, 2018 was $795,156.
Derivative Risks
The risks of using the various types of derivatives in which the Fund may engage include the risk that movements in the value of the derivative may not fully offset or complement instruments currently held in the Fund in the manner intended by the Adviser, the risk that the counterparty to a derivative contract may fail to comply with its obligations to the Fund, the risk that there may not be a liquid secondary market for the derivative at a time when the Fund would look to disengage the position, the risk that additional capital from the Fund may be called upon to fulfill the conditions of the derivative contract, the risk that the use of derivatives may induce leverage in the Fund, and the risk that the cost of the derivative may reduce the overall returns experience by the Fund.
Offsetting Assets and Liabilities
The Fund is subject to various Master Netting Arrangements, which govern the terms of certain transactions with select counterparties. The Master Netting Arrangements allow the Fund to close out and net its total exposure to a counterparty in the event of a default with respect to all the transactions governed under a single agreement with a counterparty. The Master Netting Arrangements also specify collateral posting arrangements at pre-arranged exposure levels. Under the Master Netting Arrangements, collateral is routinely transferred if the total net exposure to certain transactions (net of existing collateral already in place) governed under the relevant Master Netting Arrangement with a counterparty in a given account exceeds a specified threshold depending on the counterparty and the type of Master Netting Arrangement.
YCG Enhanced Fund
NOTES TO FINANCIAL STATEMENTS (continued)
November 30, 2018
The following is a summary of the Assets and Liabilities subject to offsetting in the Fund as of November 30, 2018:
| Liabilities | | | | Gross Amounts Not | |
| | | | | Offset in the Statement | |
| | | | | of Assets and Liabilities | |
| | | Gross | Net | | | |
| | | Amounts | Amounts | | | |
| | | Offset | Presented | | | |
| | Gross | in the | in the | | | |
| | Amounts | Statement | Statement | | | |
| | of | of Assets | of Assets | | | |
| Description / | Recognized | and | and | Financial | Collateral | Net |
| Counterparty | Liabilities | Liabilities | Liabilities | Instruments | Pledged | Amount |
| Options Written | | | | | | |
| Interactive Brokers | $353,337 | $— | $353,337 | $— | $353,337 | $— |
In some instances, the collateral amounts disclosed in the tables were adjusted due to the requirement to limit the collateral amounts to avoid the effect of overcollateralization. Actual collateral received/pledged may be more than the amounts disclosed herein.
d) Federal Income Taxes – The Fund intends to qualify as a “regulated investment company” under Subchapter M of the Internal Revenue Code of 1986, as amended. If so qualified, the Fund will not be subject to federal income tax to the extent it distributes substantially all of its net investment income and capital gains to shareholders. Therefore, no federal income tax provision is required.
The Fund has adopted financial reporting rules regarding recognition and measurement of tax positions taken or expected to be taken on a tax return. The Fund recognizes interest and penalties, if any, related to unrecognized tax benefits as income tax expense in the Statement of Operations. During the year, the Fund did not incur any interest or penalties. As of and during the year ended November 30, 2018, the Fund did not have any liabilities for unrecognized tax benefits. The Fund is not subject to examination by U.S. tax authorities for tax years prior to the period ended November 30, 2015.
e) Distributions to Shareholders – The Fund will declare and distribute any net investment income and any net realized long or short-term capital gains annually. Distributions to shareholders are recorded on the ex-dividend date. The character of distributions made during the year from net investment income or net realized gains may differ from the characterization for federal income tax purposes due to differences in the recognition of income, expense and gain items for financial statement and tax purposes. Where appropriate, reclassifications between capital accounts are made for such differences that are permanent in nature.
YCG Enhanced Fund
NOTES TO FINANCIAL STATEMENTS (continued)
November 30, 2018
f) Use of Estimates – The preparation of the financial statements in conformity with GAAP requires management to make estimates and assumptions that affect the reported amounts of assets and liabilities and disclosure of contingent assets and liabilities at the date of the financial statements and the reported amounts of increases and decreases in net assets from operations during the reporting period. Actual results could differ from those estimates.
g) Guarantees and Indemnifications – Under the Fund’s organizational documents, its officers and trustees are indemnified by the Fund against certain liabilities arising out of the performance of their duties to the Fund. Additionally, in the normal course of business, the Fund enters into contracts with service providers that contain general indemnification clauses. The Fund’s maximum exposure under these arrangements is unknown as this would involve future claims against the Fund that have not yet occurred. Currently, the Fund expects the risk of loss to be remote.
h) Redemption Fee – Those who buy and sell the Fund within 30 calendar days will incur a 2% redemption fee, retained for the benefit of long-term shareholders, recorded as additional capital in the Statements of Changes in Net Assets.
i) Beneficial Ownership – The beneficial ownership, either directly or indirectly, of more than 25% of the voting securities of a fund creates a presumption of control of the Fund, under Section 2(a)(9) of the 1940 Act. At November 30, 2018, no shareholder held beneficially more than 25% of the outstanding shares of the YCG Enhanced Fund.
j) Other – Investment transactions and shareholder transactions are accounted for on the trade date. Net realized gains and losses on securities are computed on the basis of highest amortized cost. Dividend income is recognized on the ex-dividend date and interest income is recognized on an accrual basis. Discounts and premiums on securities purchased are accreted and amortized over the lives of the respective securities. Withholding taxes on foreign dividends have been provided for in accordance with the Fund’s understanding of the applicable country’s tax rules and regulations.
3. INVESTMENT TRANSACTIONS
For the year ended November 30, 2018, the aggregate purchases and sales of securities, excluding short-term securities, were $93,309,939 and $35,855,849 respectively for the Fund. For the year ended November 30, 2018, there were no long-term purchases or sales of U.S. Government securities for the Fund.
4. COMMITMENTS AND OTHER RELATED PARTY TRANSACTIONS
The Adviser acts as the investment adviser to the Fund pursuant to an investment advisory agreement (the “Advisory Agreement”) which has been approved by the Board of Trustees (including a majority of the Trustees who are not parties to the Advisory Agreement, or interested persons of any such party). Under the terms of the Advisory
YCG Enhanced Fund
NOTES TO FINANCIAL STATEMENTS (continued)
November 30, 2018
Agreement between the Fund and the Adviser, the Adviser conducts investment research and management for the Fund and is responsible for the purchase and sale of securities for the Fund’s investment portfolio. The Adviser provides the Fund with investment advice, supervises the management and investment programs and provides investment advisory facilities and executive and supervisory personnel for managing the investments and effectuating portfolio transactions. The Adviser also furnishes, at its own expense, all necessary administrative services, office space, equipment and clerical personnel for servicing the investments of the Fund. In addition, the Adviser pays the salaries and fees of all officers of the Fund who are affiliated with the Adviser. Under the Advisory Agreement, the monthly compensation paid to the Adviser is accrued daily at an annual rate of 1.00% on the average daily net assets of the Fund.
In the interest of limiting the expenses of the Fund, the Adviser has entered into a contractual expense limitation agreement with the Fund. Pursuant to the Expense Limitation Agreement, the Adviser (for the lifetime of the Fund) has agreed to waive or limit its fees and assume other expenses of the Fund (excluding interest, taxes, brokerage commissions and dividend expenses on securities sold short and extraordinary expenses not incurred in the ordinary course of business) so that the Fund’s ratio of total annual operating expenses is limited to 1.39%. In addition to the lifetime limit, effective April 1, 2017, the Adviser has agreed to reimburse the Fund to the extent necessary to ensure that total annual fund operating expenses to do not exceed 1.19% at least through April 1, 2019. The Adviser is entitled to the reimbursement of fees waived or reimbursed by the Adviser to the Fund subject to the limitations that (1) the reimbursement is made only for fees and expenses incurred not more than thirty-six months following the month in which the reimbursement occurred, and (2) the reimbursement may not be made if it would cause the Fund’s annual expense limitation to be exceeded. The reimbursement amount may not include any additional charges or fees, such as interest accruable on the reimbursement account. As of November 30, 2018, expenses of $139,338, $189,598 and $101,586 are subject to recoupment by the Adviser, expiring during the year ended November 30, 2019, November 30, 2020, and November 30, 2021, respectively.
Certain officers, trustees and shareholders of the Fund are also owners or employees of the Adviser. Such officers receive no compensation from the Fund for serving in their respective roles.
Quasar Distributors, LLC, (the “Distributor”) acts as the Fund’s principal underwriter in a continuous public offering of the Fund’s shares.
The Fund has entered into Service Agreements with U.S. Bancorp Fund Services, LLC, doing business as U.S. Bank Global Fund Services (“Fund Services”), and a Custody Agreement with U.S. Bank, N.A., both affiliates of the Distributor. Under these agreements, Fund Services and U.S. Bank, N.A. provide certain transfer agency, administrative, accounting and custody services.
YCG Enhanced Fund
NOTES TO FINANCIAL STATEMENTS (continued)
November 30, 2018
For the year ended November 30, 2018, the Fund paid U.S Bank, N.A., an affiliate of the Distributor, $18,047 for brokerage commissions.
5. NON-DIVERSIFICATION AND SECTOR RISK
The Fund is non-diversified. A non-diversified fund may invest more of its assets in fewer companies than if it were a diversified fund. The Fund may be more exposed to the risks of loss and volatility than a fund that invests more broadly.
As of November 30, 2018, the Fund had a significant portion of its assets invested in the financials sector. Companies in this sector may be more sensitive to short product cycles, competition and aggressive pricing than the overall market.
6. FEDERAL TAX INFORMATION
A. Tax Basis of Distributions to Shareholders: The tax character of the distributions paid by the Fund were as follows:
| | | For the Year Ended | | | For the Year Ended | |
| | | November 30, 2018 | | | November 30, 2017 | |
| Ordinary Income | | $ | 2,282,009 | | | $ | 2,207,946 | |
| Long-Term Capital Gains | | | 2,813,080 | | | | 1,376,316 | |
| Total | | $ | 5,095,089 | | | $ | 3,584,262 | |
Reclassifications: The tax components of distributable earnings are determined in accordance with income tax regulations which may differ from the compositions of net assets reported under GAAP. For the year ended November 30, 2018, there were no differences reclassified.
B. Tax Basis of Investments
As of November 30, 2018, the components of the tax basis cost of investments and net unrealized appreciation were as follows:
| | | YCG Enhanced Fund | |
| Tax cost of investments | | $ | 160,616,614 | |
| Gross unrealized appreciation | | $ | 43,159,976 | |
| Gross unrealized depreciation | | | (5,495,386 | ) |
| Net tax unrealized appreciation (depreciation) | | | 37,664,590 | |
| Undistributed ordinary income | | | 3,593,569 | |
| Undistributed long-term capital gains | | | 2,772,752 | |
| Accumulated earnings | | | 6,366,321 | |
| Other accumulated gains (losses) | | | (425 | ) |
| Total accumulated earnings | | $ | 44,030,486 | |
YCG Enhanced Fund
NOTES TO FINANCIAL STATEMENTS (continued)
November 30, 2018
The tax basis of investments for tax and financial reporting purposes differs, principally due to the deferral of losses on wash sales.
Net capital losses incurred after October 31, and within the taxable year are deemed to arise on the first business day of the Fund’s next taxable year. Qualified late-year ordinary losses are the excess of the sum of the specified loss attributable to the portion of the taxable year after October 31, and the late-year losses attributable to the portion of the taxable year after December 31, over the sum of the specified gains attributable to the portion of the taxable year after October 31, and other ordinary income attributable to the portion of the taxable year after December 31. For the fiscal year ended November 30, 2018, there were no post-October or late-year losses.
YCG Enhanced Fund
REPORT OF INDEPENDENT REGISTERED PUBLIC ACCOUNTING FIRM
To the Shareholders of YCG Enhanced Fund and
Board of Trustees of YCG Funds
Opinion on the Financial Statements
We have audited the accompanying statement of assets and liabilities, including the schedules of investments and options written, of YCG Enhanced Fund (the “Fund”), a series of YCG Funds, as of November 30, 2018, and the related statement of operations for the year then ended, the statements of changes in net assets for each of the two years in the period then ended, including the related notes, and the financial highlights for each of the five years in the period then ended (collectively referred to as the “financial statements”). In our opinion, the financial statements present fairly, in all material respects, the financial position of the Fund as of November 30, 2018, the results of its operations for the year then ended, the changes in its net assets for each of the two years in the period then ended, and the financial highlights for each of the five years in the period then ended, are in conformity with accounting principles generally accepted in the United States of America.
Basis for Opinion
These financial statements are the responsibility of the Fund’s management. Our responsibility is to express an opinion on the Fund’s financial statements based on our audits. We are a public accounting firm registered with the Public Company Accounting Oversight Board (United States) (“PCAOB”) and are required to be independent with respect to the Fund in accordance with the U.S. federal securities laws and the applicable rules and regulations of the Securities and Exchange Commission and the PCAOB.
We conducted our audits in accordance with the standards of the PCAOB. Those standards require that we plan and perform the audit to obtain reasonable assurance about whether the financial statements are free of material misstatement, whether due to error or fraud.
Our audits included performing procedures to assess the risks of material misstatement of the financial statements, whether due to error or fraud, and performing procedures that respond to those risks. Such procedures included examining, on a test basis, evidence regarding the amounts and disclosures in the financial statements. Our procedures included confirmation of securities owned as of November 30, 2018, by correspondence with the custodian and brokers. Our audits also included evaluating the accounting principles used and significant estimates made by management, as well as evaluating the overall presentation of the financial statements. We believe that our audits provide a reasonable basis for our opinion.
We have served as the Fund’s auditor since 2012.
COHEN & COMPANY, LTD.
Milwaukee, Wisconsin
January 24, 2019
YCG Enhanced Fund
ADDITIONAL INFORMATION
(Unaudited)
1. SHAREHOLDER NOTIFICATION OF FEDERAL TAX STATUS
For the year ended November 30, 2018, 63.31% of the dividends paid from net investment income, including short-term capital gains, for the YCG Enhanced Fund qualify for the dividends received deduction available to corporate shareholders.
For the year ended November 30, 2018, 91.47% of the dividends paid from net investment income, including short-term capital gains, for the YCG Enhanced Fund are designated as qualified dividend income.
2. COMPENSATION OF TRUSTEES
During the fiscal year, each Trustee who is not an “interested person” of the Trust (i.e. an “Independent Trustee”) received $1,000 per meeting attended, as well as reimbursement for expenses incurred in connection with attendance at such meetings. The Fund’s Statement of Additional Information includes additional information about the Trustees and is available upon request by calling toll free 1-855-444-9243 or by accessing the Fund’s website at www.ycgfunds.com.
3. PROXY VOTING POLICIES AND PROCEDURES
For a description of the policies and procedures that the Fund uses to determine how to vote proxies relating to portfolio securities, please call 1-855-444-9243 and request a Statement of Additional Information. One will be mailed to you free of charge. The Statement of Additional Information is also available on the Fund’s website at www.ycgfunds.com or on the web site of the Securities and Exchange Commission at http:www.sec.gov. Information on how the Fund voted proxies relating to portfolio securities during the year ended June 30, 2018 is available without charge, upon request, by calling 1-855-444-9243 or by accessing the website of the Securities and Exchange Commission.
4. DISCLOSURE OF PORTFOLIO HOLDINGS
The Fund files a complete schedule of portfolio holdings with the Securities and Exchange Commission for the first and third quarters of each fiscal year on Form N-Q. The Fund’s Form N-Q is available on the website of the Securities and Exchange Commission at http://www.sec.gov. The Fund’s Forms N-Q may be reviewed and copied at the Securities and Exchange Commission’s Public Reference Room in Washington, D.C. Information on the operation of the Public Reference Room may be obtained by calling 1-800-SEC-0330.
5. BOARD ANNUAL RENEWAL OF INVESTMENT ADVISORY AGREEMENT
On November 2, 2018, the Board of Trustees of YCG Funds (the “Trust”) met to, among other things, approve the continuation of the investment advisory agreement
YCG Enhanced Fund
ADDITIONAL INFORMATION (continued)
(Unaudited)
for the YCG Enhanced Fund (the “Fund”). As part of the process for approving the continuation of the investment advisory agreement, the Trustees reviewed their fiduciary duties and the relevant factors for the Trustees to consider, and the Trustees who are not “interested persons” (as defined in the Investment Company Act of 1940) of the Fund (the “Independent Trustees”) met in executive session to discuss the approval of the continuation of the investment advisory agreement.
In advance of the meeting, the investment adviser to the Fund, YCG, LLC (the “Adviser”), sent detailed information to the Trustees to assist them in their evaluation of the investment advisory agreement. This information included, but was not limited to, a memorandum from Fund counsel that summarized the legal standards applicable to the Trustees’ consideration of the advisory agreement; comparative information relating to the Fund’s management fees and other expenses of the Fund; information regarding fees paid and other payments; information on the Adviser’s profitability; information about brokerage commissions; comparative information relating to the Fund’s performance; information about sales and redemptions of the Fund; information about the Fund’s compliance program and the compliance program of the Adviser; and other information the Trustees believed was useful in evaluating the approval of advisory agreement. Counsel to the Independent Trustees met with them in executive session to assist in the evaluation of the materials.
All of the factors discussed by the Trustees were considered as a whole, and were considered separately by the Independent Trustees, meeting in executive session. The factors were viewed in their totality by the Trustees, with no single factor being the principal or determinative factor in the Trustees’ determination of whether to approve the continuation of the investment advisory agreement. The Trustees recognized that the management and fee arrangements for the Fund are the result of years of review and discussion between the Independent Trustees and the Adviser, that certain aspects of such arrangements may receive greater scrutiny in some years than in others and that the Trustees’ conclusions may be based, in part, on their consideration of these same arrangements and information received during the course of the year and in prior years.
Among the specific factors considered by the Trustees, including the Independent Trustees in executive session, were the following:
| | • | The nature and quality of the investment advisory services provided by the Adviser. |
| | | |
| | • | A comparison of the fees and expenses of the Fund to other similar funds. |
| | | |
| | • | A comparison of the fee structures of other accounts managed by the Adviser. |
| | | |
| | • | Whether economies of scale are recognized by the Fund. |
| | | |
| | • | The costs and profitability of the Fund to the Adviser. |
YCG Enhanced Fund
ADDITIONAL INFORMATION (continued)
(Unaudited)
| | • | The performance of the Fund. |
| | | |
| | • | The other benefits to the Adviser from serving as investment adviser to the Fund (in addition to the advisory fee). |
The material determinations and conclusions of the Board, including all of the Independent Trustees, are as follows:
Nature, Extent and Quality of Investment Advisory Services
The Trustees concluded that the Adviser is well staffed to conduct the research needed to meet the investment objectives of the Fund. They made this determination after discussing with management the nature of the investment process employed by the portfolio managers of the Fund, which is research intensive, and the staffing at the Adviser, confirming that they believe the Adviser has sufficient resources and staff to conduct the research. The Trustees believe that the staff of the Adviser are well equipped to conduct the research needed to meet the investment objectives of the Fund.
In addition to the nature of the Adviser’s investment process, the Trustees considered the background and experience of the Adviser’s senior management and expertise of, and the amount of attention given to the Fund by investment personnel of the Adviser. In addition, the Trustees considered the quality of the material service providers to the Fund, who provide administrative and distribution services on behalf of the Fund and are overseen by the Adviser, and the overall reputation and capabilities of the Adviser. Based on this review, the Trustees believe that the Adviser provides high quality services to the Fund, as the Adviser’s personnel are focused on servicing the Fund and overseeing the other service providers.
In light of the Trustees’ discussions and considerations regarding the Adviser, the Trustees concluded that they were satisfied with the nature, extent and quality of the investment advisory services provided to the Fund by the Adviser, and that the nature and extent of the services provided by the Adviser are appropriate to assure that the Fund’s operations are conducted in compliance with applicable laws, rules and regulations.
Comparative Fees and Expenses
After reviewing and discussing the comparison of the Fund’s expense ratios to other similar funds, as noted below, the Trustee’s concluded that the expense ratio of the Fund is within the range of comparable mutual funds, particularly funds that have an option strategy like the Fund, and that the Fund’s fees are reasonable.
In determining that the fees are reasonable, the Trustees discussed with management the variables, in addition to the management fees, such as administrative and transaction fees, which impact costs to the shareholders of the Fund. As part of the
YCG Enhanced Fund
ADDITIONAL INFORMATION (continued)
(Unaudited)
discussion with management, the Trustees ensured that they understood and were comfortable with the criteria used by the Adviser to determine the mutual funds that make up the peer groups of the Fund discussed at the meeting.
With regard to the Fund’s comparison to the peer groups, the noted the following as support that the Fund’s fees are reasonable:
| | • | While the Fund had higher than average advisory and net expenses compared to the Morningstar Large Cap Blend category peers, the Fund’s return over the last three years is in the top half of the funds in the category. The Trustees also noted that unlike most peers in the category, the Fund utilizes an option enhancement strategy, which is more resource intensive. |
| | | |
| | • | The Fund’s expense ratio is very favorable compared to option peers, which is important because the Trustees believe that the Fund’s option enhancement strategy is a unique strategy that sets the Fund apart from its competitors. As noted above, other funds in the Morningstar Large Cap Blend Category generally do not utilize an option strategy. |
| | | |
| | • | The Fund outperformed all the option peer group funds on a since inception and three-year basis. |
| | | |
| | • | The Fund performed extremely well against many of the stock-picking and large cap blend category peer group funds. |
| | | |
| | • | The Fund is still relatively small in assets under management, and the Adviser is subsidizing the expenses of the Fund to remain competitive with other funds. |
Comparison of Fee Structures of Other Accounts
The Trustees concluded that the differential in advisory fees between the Fund and the separate accounts managed by the Adviser is reasonable, and concluded that the fee rate charged to the Fund in comparison to those charged to the Adviser’s other clients is reasonable. In making this determination, the Trustees inquired of management regarding the distinction between the services performed by the Adviser for separate accounts and those performed by the Adviser for the Fund. Based on this discussion, the Trustees determined that the management of the Fund involves more comprehensive and substantive duties, noting the following, among other things, as support for this determination:
| | • | The Adviser provides tailored investment advisory services to the Fund in order to accommodate the cash flow volatility presented by the purchases and redemptions of shareholders. |
| | | |
| | • | With regard to the Fund, the Adviser attempts to serve the needs of hundreds of accounts, ranging from direct accounts holding a few thousand dollars to the large omnibus accounts of intermediaries. |
YCG Enhanced Fund
ADDITIONAL INFORMATION (continued)
(Unaudited)
| | • | The Adviser maintains a robust shareholder communication effort for the Fund to reach shareholders through direct contact, through intermediaries, or via the financial press, and has contributed significant financial resources to marketing efforts for the Fund. |
| | | |
| | • | The Adviser focuses on marketing the Fund, and has found that the most effective way is through one-on-one meetings with RIA’s, which require significant amounts of time and resources to attract investors. |
| | | |
| | • | The Adviser coordinates with the Fund’s Chief Compliance Officer and other service providers to insure compliance with regulatory regimens imposed by Federal law and the Internal Revenue Code on the Fund, which are not imposed on the separate accounts. |
Performance
The Trustees concluded that the performance of the Fund, adjusting for risk, has been satisfactory on a relative basis and more than satisfactory on an absolute basis. They continue to believe that the Adviser’s discipline should lead to more favorable results in the long-term, and concluded that renewal of the existing advisory agreement was in the best interest of the Fund’s shareholders. In assessing the performance of the Fund, which is positive, the Trustees noted the following, among other things, as support for their conclusion:
| | • | The Fund’s return over the last three years is in the top half of the funds in the Morningstar Large Cap Blend category. |
| | | |
| | • | The Fund outperformed all the option peer group funds on a since inception and three-year basis. |
| | | |
| | • | The Fund performed extremely well against many of the stock-picking and large cap blend category peer group funds. |
Costs and Profitability
The Trustees concluded that the level of profitability realized by the Adviser from its provision of services to the Fund is reasonable, and that the overall expense ratios and investment advisory fees were fair and within the range of industry averages. In making this determination, the Trustees noted the following, among other things, as support for their conclusion:
| | • | They considered the Fund’s overall expense ratios compared to peer group funds, and believe that given the size of the Fund and the niche strategy of the Fund, that the Fund’s fee structure is appropriate and reasonable. |
| | | |
| | • | The resources and revenues that the Adviser has put into managing and distributing the Fund are significant. |
| | | |
| | • | The Adviser has put in place an expense limitation agreement for the Fund. |
YCG Enhanced Fund
ADDITIONAL INFORMATION (continued)
(Unaudited)
Economies of Scale
Given the size of the Fund, the Trustees determined that the Fund has not realized economies of scale. They noted that the expenses for the Fund are currently capped and any excess is paid by the Adviser. The Trustees concluded that the current fees were appropriate at foreseeable asset levels.
Fall-Out Benefits
Based on the Trustees’ discussion and analysis, the Trustees concluded that the other benefits realized by the Adviser from its relationship with the Fund were reasonable. In making this determination, the Trustees noted the following, among other things, as support for their conclusion:
| | • | The Adviser does not derive ancillary benefits from its association with the Fund in the form of proprietary and third-party research products and services, as the Adviser does not receive any research or other services from the broker-dealers that the Fund trades with. |
| | | |
| | • | While managing the Fund has provided more visibility for the Adviser in the financial media and industry in general, as the Fund has been highlighted in publications, including national publications, the primary focus of these articles has been the Fund. |
Conclusion
After reviewing the materials provided at the meeting, management’s presentation, as well as other information regularly provided at the Board’s quarterly meetings throughout the year regarding the quality of services provided by the Adviser, the performance of the Fund, expense information, regulatory compliance issues, trading information and related matters and other factors deemed relevant by the Board, the Trustees, including all of the Independent Trustees, approved the continuation of the investment advisory agreement.
YCG Enhanced Fund
TRUSTEES AND OFFICERS
(Unaudited)
The business of the Fund is managed under the direction of the Board. The Board formulates the general policies of the Fund and meets periodically to review the Fund’s performance, monitor investment activities and practices, and discuss other matters affecting the Fund. The Trustees are fiduciaries for the Fund’s shareholders and are governed by the laws of the State of Delaware in this regard. The names and addresses of the Trustees and Officers of the Trust are listed below along with a description of their principal occupations over at least the last five years. Trustees who are “interested persons”, as defined by the 1940 Act, are indicated by asterisk. The Fund’s Statement of Additional Information includes additional information about the Trustees and is available, without charge, upon request by (1) calling toll free 1-855-444-9243; (2) on the Fund’s website located at http://www.ycgfunds.com; or (3) on the SEC’s website http://www.sec.gov.
| | | Term of | | | |
| | | Office | Number of | | |
| | | and | Portfolios | Principle | Other |
| | Position(s) | Length | in Fund | Occupation(s) | Directorships |
| Name, address | Held with | of Time | Complex | During Past | Held by |
| and age | the Fund | Served | Overseen | Five Years | Trustee |
| Brian Yacktman* | Trustee | Indefinite, | 1 | Manager, Principal | None. |
| 3207 Ranch Road | | Trustee | | and Chief | |
| 620 South, Suite 200 | | since 2012 | | Investment Officer, | |
| Austin, TX 78738 | President | One year | | YCG, LLC, | |
| Age: 39 | | term, | | investment adviser | |
| | | President | | to the Fund, | |
| | | since 2012 | | since 2007. | |
| | | | | | |
| William D. Kruger* | Chairman | Indefinite, | 1 | Manager, Principal | None. |
| 3207 Ranch Road | and | Trustee | | and CEO, YCG, | |
| 620 South, Suite 200 | Trustee | since 2012 | | LLC, investment | |
| Austin, TX 78738 | Vice | One year | | adviser to the Fund, | |
| Age: 39 | President | term, Vice | | since 2008. | |
| | and | President | | | |
| | | since 2012 | | | |
| | Treasurer | One year | | | |
| | | term, | | | |
| | | Treasurer | | | |
| | | since 2012 | | | |
YCG Enhanced Fund
TRUSTEES AND OFFICERS (continued)
(Unaudited)
| | | Term of | | | |
| | | Office | Number of | | |
| | | and | Portfolios | Principle | Other |
| | Position(s) | Length | in Fund | Occupation(s) | Directorships |
| Name, address | Held with | of Time | Complex | During Past | Held by |
| and age | the Fund | Served | Overseen | Five Years | Trustee |
| Independent Trustees: | | | | | |
| Travis E.Oliphant | Trustee | Indefinite, | 1 | Scientific and | None. |
| 3207 Ranch Road | | Trustee | | Technical Software | |
| 620 South, Suite 200 | | since 2012 | | Manager and | |
| Austin, TX 78738 | | | | Executive. Founder | |
| Age: 47 | | | | and CEO of Anaconda | |
| | | | | (Continuum Analytics), | |
| | | | | January 2012 – 2017. | |
| | | | | Founder and | |
| | | | | CEO of Quansight, | |
| | | | | 2018 – Present. | |
| | | | | | |
| Rory M. McDonald | Trustee | Indefinite, | 1 | Assistant Professor | None. |
| 3207 Ranch Road | | Trustee | | of Business | |
| 620 South, Suite 200 | | since 2012 | | Administration in | |
| Austin, TX 78738 | | | | the Technology | |
| Age: 39 | | | | and Operations | |
| | | | | Management Unit | |
| | | | | at Harvard Business | |
| | | | | School, 2013 – Present. | |
| | | | | Assistant Professor | |
| | | | | of Management, | |
| | | | | University of | |
| | | | | Texas at Austin, | |
| | | | | McCombs School | |
| | | | | of Business, | |
| | | | | 2011 – 2013. | |
| | | | | | |
| Cyril James Speirs | Trustee | Indefinite, | 1 | Retired, Previously, | None. |
| 3207 Ranch Road | | Trustee | | Global Vice President | |
| 620 South, Suite 200 | | since 2017 | | Procurement for Whole | |
| Austin, TX 78738 | | | | Foods Market, Inc., | |
| Age: 63 | | | | 2005 – 2016. | |
YCG Enhanced Fund
TRUSTEES AND OFFICERS (continued)
(Unaudited)
| | | Term of | | | |
| | | Office | Number of | | |
| | | and | Portfolios | Principle | Other |
| | Position(s) | Length | in Fund | Occupation(s) | Directorships |
| Name, address | Held with | of Time | Complex | During Past | Held by |
| and age | the Fund | Served | Overseen | Five Years | Trustee |
| | | | | | |
| Officers who are not Trustees: | | | | | |
| | | | | | |
| Elliott Savage | Vice | One year | N/A | Manager, | None. |
| 3207 Ranch Road | President | term, Vice | | Principal and | |
| 620 South, Suite 200 | | President | | Portfolio manager, | |
| Austin, TX 78738 | | since | | YCG, LLC, | |
| Age: 38 | | December | | investment adviser | |
| | | 2012 | | to the Fund, | |
| | Secretary | One year | | since 2012. | |
| | | term, | | | |
| | | Secretary | | | |
| | | since | | | |
| | | February | | | |
| | | 2016 | | | |
| | Assistant | One year | | | |
| | Treasurer | term, | | | |
| | | Assistant | | | |
| | | Treasurer | | | |
| | | since | | | |
| | | December | | | |
| | | 2012 | | | |
| | | | | | |
| Lelia Long | Chief | One year | N/A | Investment | None. |
| 3207 Ranch Road | Compliance | term, | | Management | |
| 620 South, Suite 200 | Officer | Chief | | & Compliance | |
| Austin, TX 78738 | | Compliance | | Consultant, | |
| Age: 56 | | Officer since | | Vigilant | |
| | | March 2016 | | Compliance LLC, | |
| | | 2009 – Present. | | | |
| | | Treasurer, New | | | |
| | | Ireland Fund, Inc., | | | |
| | | 2002 – Present. | | | |
| * | Brian Yacktman and William Kruger are considered to be “interested persons” of the Trust, a term that is defined in the 1940 Act. Mr. Yacktman and Mr. Kruger are interested persons because: (1) each is an officer of the Trust; and (2) each is the owner of the investment adviser to the Fund. |
Each trustee holds office for an indefinite term and until the earlier of: the Trust’s next meeting of shareholders and the election and qualification of his successor; or until the date a trustee dies, resigns or is removed in accordance with the Trust’s Declaration of Trust and By-laws. Each officer holds office at the pleasure of the Board and serves for a period of one year, or until his successor is duly elected and qualified.
Privacy Notice
| FACTS | WHAT DOES YCG FUNDS DO WITH YOUR PERSONAL INFORMATION? |
| | |
| WHY? | Financial companies choose how they share your personal information. Federal law gives consumers the right to limit some, but not all information sharing. Federal law also requires us to tell you how we collect, share, and protect your personal information. Please read this Notice carefully to understand what we do. |
| | |
| WHAT? | The types of information we collect and share depend on the product or service you have with us. This information can include: |
| | • Social Security Number |
| | • Assets |
| | • Retirement Assets |
| | • Transaction History |
| | • Checking Account History |
| | • Purchase History |
| | • Account Balances |
| | • Account Transactions |
| | • Wire Transfer Instructions |
| | When you are no longer our customer, we continue to share your information as described in this Notice. |
| | |
| HOW? | All financial companies need to share your personal information to run their everyday business. In the section below, we list the reasons financial companies can share their customers’ personal information; the reasons YCG Funds chooses to share; and whether you can limit this sharing. |
| Reasons we can share your personal information. | Does YCG Funds | Can you limit |
| | Trust share? | this sharing? |
| For our everyday business purposes— | | |
| Such as to process your transactions, maintain | | |
| your account(s), respond to court orders and | Yes | No |
| legal investigations, or report to credit bureaus. | | |
| For our marketing purposes— | | |
| to offer our products and services to you. | No | We don’t share |
| For joint marketing with other financial | | |
| companies | No | We don’t share |
| For our affiliates’ everyday business purposes— | | |
| information about your transactions and experiences. | Yes | No |
| For our affiliates’ everyday business purposes— | | |
| information about your creditworthiness | No | We don’t share |
| For non-affiliates to market to you | No | We don’t share |
| Questions? | Call 855-444-YCGF (9243) |
Privacy Notice (continued)
| Who we are | |
| Who is providing | YCG Funds |
| this Notice? | YCG, LLC (investment adviser to the Trust) |
| | US Bancorp Fund Services, LLC (administrator to the Trust) |
| | |
| What we do | |
| How does | To protect your personal information from unauthorized |
| YCG Funds | access and use, we use security measures that comply |
| protect | with federal law. These measures include computer safeguards |
| your personal | and secured files and buildings. |
| information? | |
| | Our service providers are held accountable for adhering to strict policies and procedures to prevent any misuse or your nonpublic personal information. |
| How does | We collect your personal information, for example, when you |
| YCG Funds | • Open an account |
| collect your | • Provide account information |
| personal | • Give us your contact information |
| information? | • Make deposits or withdrawals from your account |
| | • Make a wire transfer |
| | • Tell us where to send the money |
| | • Tell us who receives the money |
| | • Show your government-issued ID |
| | • Show your drivers’ license |
| | We also collect your personal information from other companies. |
| Why can’t I | Federal law gives you the right to limit only: |
| limit all sharing? | • Sharing for affiliates’ everyday business purposes—information about your creditworthiness. |
| | • Affiliates from using your information to market to you. |
| | • Sharing for non-affiliates to market to you. |
| | State laws and individual companies may give you additional rights to limit sharing. |
| | |
| Definitions | |
| Affiliates | Companies related by common ownership or control. They can be financial and non-financial companies. |
| | YCG, LLC, is an affiliate of YCG Funds |
| Non-affiliates | Companies not related by common ownership or control. They can be financial and non-financial companies. |
| | • YCG Funds does not share with non-affiliates so they can market to you. |
| Joint marketing | A formal agreement between non-affiliated financial companies that together market financial products to you. |
| | • YCG Funds does not jointly market. |
For Fund information and shareholder services, call
1-855-444-9243
web site: www.ycgfunds.com
YCG Funds
c/o U.S. Bancorp Fund Services, LLC
P.O. Box 701
Milwaukee, WI 53201-0701
Investment Adviser
YCG, LLC
3207 Ranch Road 620 South, Suite 200
Austin, TX 78738
Chief Compliance Officer
Vigilant Compliance, LLC
Gateway Corporate Center
223 Wilmington West Chester Pike, Suite 216
Chadds Ford, PA 19317
Legal Counsel
Foley & Lardner LLP
777 East Wisconsin Avenue
Milwaukee, WI 53202
Independent Registered Public Accounting Firm
Cohen & Company, Ltd.
342 North Water Street, Suite 830
Milwaukee, WI 53202
Transfer Agent, Fund Accountant, and Fund Administrator
U.S. Bancorp Fund Services, LLC
615 East Michigan Street
Milwaukee, WI 53202
Custodian
U.S. Bank, N.A.
1555 North RiverCenter Drive, Suite 302
Milwaukee, WI 53212
Distributor
Quasar Distributors, LLC
777 East Wisconsin Avenue
Milwaukee, WI 53202
This report is submitted for the general information of shareholders of the YCG Enhanced Fund. It is not authorized for distribution to prospective investors unless accompanied or preceded by an effective Prospectus for the Fund, which contains more information concerning the Fund’s investment policies, as well as fees and expenses and other pertinent information. Read the Prospectus carefully.
Item 2. Code of Ethics.
The registrant has adopted a code of ethics that applies to the registrant’s principal executive officer and principal financial officer. The registrant has not made any substantive amendments to its code of ethics during the period covered by this report. The registrant has not granted any waivers from any provisions of the code of ethics during the period covered by this report.
A copy of the registrant’s Code of Ethics is filed herewith.
Item 3. Audit Committee Financial Expert.
The registrant’s board of trustees has determined that there is at least one audit committee financial expert serving on its audit committee. Travis E. Oliphant is the “audit committee financial expert” and is considered to be “independent” as each term is defined in Item 3 of Form N‑CSR.
Item 4. Principal Accountant Fees and Services.
The registrant has engaged its principal accountant to perform audit services, audit-related services, tax services and other services during the past two fiscal years. “Audit services” refer to performing an audit of the registrant's annual financial statements or services that are normally provided by the accountant in connection with statutory and regulatory filings or engagements for those fiscal years. “Audit-related services” refer to the assurance and related services by the principal accountant that are reasonably related to the performance of the audit. “Tax services” refer to professional services rendered by the principal accountant for tax compliance, tax advice, and tax planning. The following table details the aggregate fees billed or expected to be billed for each of the last two fiscal years for audit fees, audit-related fees, tax fees and other fees by the principal accountant.
| | FYE 11/30/2018 | FYE 11/30/2017 |
| Audit Fees | $13,000 | $13,000 |
| Audit-Related Fees | $0 | $0 |
| Tax Fees | $3,000 | $3,000 |
| All Other Fees | $0 | $0 |
The audit committee has adopted pre-approval policies and procedures that require the audit committee to pre‑approve all audit and non‑audit services of the registrant, including services provided to any entity affiliated with the registrant.
The percentage of fees billed by Cohen & Company, Ltd. applicable to non-audit services pursuant to waiver of pre-approval requirement were as follows:
| | FYE 11/30/2018 | FYE 11/30/2017 |
| Audit-Related Fees | 0% | 0% |
| Tax Fees | 0% | 0% |
| All Other Fees | 0% | 0% |
All of the principal accountant’s hours spent on auditing the registrant’s financial statements were attributed to work performed by full‑time permanent employees of the principal accountant. (If more than 50 percent of the accountant’s hours were spent to audit the registrant's financial statements for the most recent fiscal year, state how many hours were attributed to work performed by persons other than the principal accountant's full-time, permanent employees.)
The following table indicates the non-audit fees billed or expected to be billed by the registrant’s accountant for services to the registrant and to the registrant’s investment adviser (and any other controlling entity, etc.—not sub-adviser) for the last two years. The audit committee of the board of trustees/directors has considered whether the provision of non-audit services that were rendered to the registrant's investment adviser is compatible with maintaining the principal accountant's independence and has concluded that the provision of such non-audit services by the accountant has not compromised the accountant’s independence.
| Non-Audit Related Fees | FYE 11/30/2018 | FYE 11/30/2017 |
| Registrant | $0 | $0 |
| Registrant’s Investment Adviser | $0 | $0 |
Item 5. Audit Committee of Listed Registrants.
Not applicable to registrants who are not listed issuers (as defined in Rule 10A-3 under the Securities Exchange Act of 1934).
Item 6. Investments.
Schedule of Investments is included as part of the report to shareholders filed under Item 1 of this Form.
Item 7. Disclosure of Proxy Voting Policies and Procedures for Closed-End Management Investment Companies.
Not applicable to open-end investment companies.
Item 8. Portfolio Managers of Closed-End Management Investment Companies.
Not applicable to open-end investment companies.
Item 9. Purchases of Equity Securities by Closed‑End Management Investment Company and Affiliated Purchasers.
Not applicable to open-end investment companies.
Item 10. Submission of Matters to a Vote of Security Holders.
Not Applicable.
Item 11. Controls and Procedures.
| (a) | The Registrant’s President/Principal Executive Officer and Treasurer/Principal Financial Officer have reviewed the Registrant's disclosure controls and procedures (as defined in Rule 30a-3(c) under the Investment Company Act of 1940 (the “Act”)) as of a date within 90 days of the filing of this report, as required by Rule 30a-3(b) under the Act and Rules 13a-15(b) or 15d‑15(b) under the Securities Exchange Act of 1934. Based on their review, such officers have concluded that the disclosure controls and procedures are effective in ensuring that information required to be disclosed in this report is appropriately recorded, processed, summarized and reported and made known to them by others within the Registrant and by the Registrant’s service provider. |
| (b) | There were no changes in the Registrant's internal control over financial reporting (as defined in Rule 30a-3(d) under the Act) that occurred during the second fiscal quarter of the period covered by this report that have materially affected, or are reasonably likely to materially affect, the Registrant's internal control over financial reporting. |
Item 12. Disclosure of Securities Lending Activities for Closed-End Management Investment Companies
Not applicable to open-end investment companies.
Item 13. Exhibits.
| (a) | (1) Any code of ethics or amendment thereto, that is the subject of the disclosure required by Item 2, to the extent that the registrant intends to satisfy Item 2 requirements through filing an exhibit. Filed herewith. |
(2) A separate certification for each principal executive officer and principal financial officer pursuant to Section 302 of the Sarbanes-Oxley Act of 2002. Filed herewith.
(3) Any written solicitation to purchase securities under Rule 23c‑1 under the Act sent or given during the period covered by the report by or on behalf of the registrant to 10 or more persons. Not applicable to open-end investment companies.
| (1) | Change in the registrant’s independent public accountant. There was no change in the registrant’s independent public accountant for the period covered by this report. |
| (b) | Certifications pursuant to Section 906 of the Sarbanes‑Oxley Act of 2002. Furnished herewith. |
SIGNATURES
Pursuant to the requirements of the Securities Exchange Act of 1934 and the Investment Company Act of 1940, the registrant has duly caused this report to be signed on its behalf by the undersigned, thereunto duly authorized.
(Registrant) YCG Funds
By (Signature and Title)*/s/ Brian A. Yacktman
Brian A. Yacktman, President (Principal Executive Officer)
Date 1/23/19
Pursuant to the requirements of the Securities Exchange Act of 1934 and the Investment Company Act of 1940, this report has been signed below by the following persons on behalf of the registrant and in the capacities and on the dates indicated.
By (Signature and Title)* /s/ Brian A. Yacktman
Brian A. Yacktman, President (Principal Executive Officer)
Date 1/23/19
By (Signature and Title)* /s/ William D. Kruger
William D. Kruger, Treasurer (Principal Financial Officer)
Date 1/23/19
* Print the name and title of each signing officer under his or her signature.