| YCG ENHANCED FUND |
| a series of the YCG Funds |
| |
| |
| |
| |
| |
| |
| |
| |
| |
| |
| |
| |
| |
| |
| Annual Report | |
| November 30, 2015 | Ticker Symbol: YCGEX |
YCG Enhanced Fund
MESSAGE TO SHAREHOLDERS
(Unaudited)
Dear Fellow Shareholder:
From its inception on 12/28/2012 to 11/30/2015, the YCG Enhanced Fund achieved an annualized total return of 13.82% versus a 16.85% return for the S&P 500 Index.
Performance data quoted represents past performance and does not guarantee future results. Investment returns and principal value will fluctuate, and when sold, may be worth more or less than their original cost. The Fund imposes a 2.00% redemption fee on shares held less than 90 calendar days. Performance data current to the most recent month end may be obtained by calling 1-855-444-9243. The Gross Expense Ratio is currently 1.38%.
For the fiscal year ending November 30, 2015, the YCG Enhanced Fund achieved a total return of 2.25%. During the same time period, the S&P 500 Index had a total return of 2.75%. The fund’s top five winners and top five losers during this period were as follows:
| WINNERS | LOSERS |
| MSCI | Procter & Gamble |
| Unilever | Hershey |
| Microsoft | Coca-Cola |
| Mastercard | Nestle |
| Charles Schwab | Colgate-Palmolive |
The fund seeks to maximize long term capital appreciation with reasonable investment risk. We believe that one year is too short a period to accurately assess the soundness of our investment strategy, and, thus, we try not to draw too many conclusions from the chart above. Instead, we evaluate ourselves by the fund’s performance over a full economic cycle, which we define as a period that includes both a recession and an economic expansion.
While the aggregate returns of both the YCG Enhanced Fund and the S&P 500 index over the last twelve months are clearly not inspiring, some areas of the market have actually experienced precipitous (and perhaps permanent) losses during this time period. Most consequentially, the commodities supercycle, a long period of rising commodity prices driven primarily by China’s insatiable desire to (over) build, appears to have come to an end as China’s economy has weakened more rapidly than many predicted. This turn of events has had far reaching consequences and has resulted in carnage in many areas of the market. In stark contrast to the positive 2.75% return registered by the S&P 500 Index over the last year, the S&P Metals and Mining Select Industry Index is down by 51.55%, the S&P 500 Equal Weight Energy Index is down by 21.02%, and Brazil, a key emerging market that supplies
YCG Enhanced Fund
commodities to China, is down by a whopping 44.44%1. Many of the smaller Asian countries that have benefited from China’s rise are also down sharply, ranging from a 21.36% decline in Thailand to a 25.66% decline in Indonesia.2
We have largely avoided many of these minefields because of our longstanding aversion to the scary combination of leverage and cyclicality that many commodities businesses possess. However, there is an even more fundamental reason to avoid commodities businesses, even those that are very cheaply priced and conservatively capitalized. To understand why, consider the chart below:3
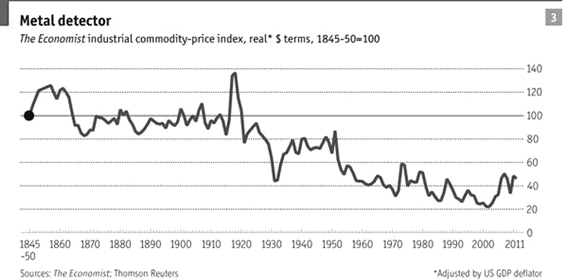
The above graph charts the real (inflation-adjusted) price of a basket of industrial commodities. As you can see, the real price has declined dramatically over time. Why is this? It’s because human innovation has caused positive pressure on industrial commodities' supply by lowering the cost of extraction while simultaneously causing negative pressure on demand by creating more substitutes, by increasing recyclability, and by improving production recipes so that they require less of each industrial commodity. The same thing is likely occurring with carbon-based energy sources today as solar and other renewables get cheaper. No useful commodities are immune from this crushing long-term deflationary pressure. Thus, we believe even conservatively capitalized businesses in this industry are likely to generate subpar risk-adjusted returns over time.
_______________
1 | The MSCI Brazil 25/50 Index (USD) was used for Brazil’s stock market return. |
2 | The MSCI Thailand IMI 25/50 Index (USD) and MSCI Indonesia Investable Market Index (USD) were used for Thailand’s and Malaysia’s stock market returns respectively. |
3 | See http://www.economist.com/node/21528986 |
YCG Enhanced Fund
By avoiding commodities and sticking to our strategy of primarily owning what we believe to be some of the best businesses in the world, with characteristics such as high returns on capital, conservative leverage, steady growth, pricing power, and geographic diversification, we have been able to navigate through this rocky period mostly unscathed, even though many of our businesses have very significant exposure to a number of the most negatively impacted emerging markets. At this point, you might reasonably ask, “But what makes our companies different? Why are the companies we own able to generate such attractive economic characteristics even during these difficult times, and what gives us confidence that they will be able to maintain these advantages over the coming decades?” Below, we’ll lay out our answer to these questions and look at one of our favorite businesses, Colgate, in this context. In doing so, we hope you will gain 1) a better understanding of our analytical framework, including the filters we use to narrow down our investment universe to a select group of world class companies, and 2) more comfort that the companies you own have enduring business models that have the potential to thrive for decades to come, even in our fast changing and volatile world.
The Characteristics of the Best Businesses in the World
At their core, we believe the best businesses in the world, those with meaningful pricing power and durably superior economics, have four characteristics:
1) They provide an essential, non-fashion oriented, short repurchase cycle consumable or service. The non-fashion element makes the business more enduring, and the essential nature and short repurchase cycle make its return on capital robust to a variety of economic conditions.
2) The cost of the good the business sells is a small percentage of a person’s or business’s total purchases but with much higher value-add. This element is hugely important because the time and energy cost to the purchaser of negotiating the best deal or searching for substitute brands or products will likely be significantly higher than the cost of almost blindly accepting price increases. When this condition is present, it enables businesses to hedge against input cost variability and also to expand their margins over time through consistent price increases.
3) The good’s or service’s pricing is resistant to the deflationary impact of innovation because, in addition to whatever absolute advantage it provides to the customer, it also confers a relative advantage. The best way to illustrate this principle is by comparing goods whose primary value is absolute, such as virtually all of the hardware in our computers, with goods whose primary value is relative, such as goods that enhance social status. Because almost all of the value we derive from the hardware in our computers is performance-related, innovation relentlessly decreases the amount of our disposable income we have to spend on this hardware, even as its performance vastly improves. Goods that enhance social status are different. Social status is a
YCG Enhanced Fund
fundamentally relative good, and so the more time and money each person spends to enhance his or her social status, the more everyone else needs to spend to keep up. In a world of innovation, in which the percentage of disposable income required for necessities is going down, we all will have more and more money available to spend on social status. Because of the high value ascribed to this good, many will spend more, leading others to spend more. So, goods that promote social status will likely not only be able to keep up with inflation but actually exceed it over time. However, not all goods that confer social status have durable pricing power. Some are fashion-oriented, such as popular cars like Tesla and many luxury clothing brands. Others confer social status based on their scarcity, and their value erodes as technology makes them more abundant, such as food or electricity. Many are enduring, such as goods that enhance universal cues of youth, health, and beauty like smooth skin, firm muscle tone, clear eyes, lustrous hair, white teeth, and high energy levels.
4) Product penetration is still low worldwide. This characteristic enables the business to reinvest its capital at attractive rates for many years to come.
Colgate
Let’s look at Colgate in terms of these four characteristics. Colgate’s main product is toothpaste, an essential, non-fashion oriented, short repurchase cycle consumable. Additionally, the cost of toothpaste is a small percentage of a person’s total yearly purchases (probably less than twenty dollars a year) but with much higher value-add (prevents potentially thousands of dollars of dental work and all of the time and pain associated with fixing tooth decay). Thirdly, toothpaste is resistant to the deflationary impact of innovation because, in addition to the absolute benefits already discussed, spending more money than others on teeth whitening and other appearance-enhancing oral products confers a universally-recognized relative attractiveness advantage on the spender. It’s no coincidence that Brazil and the U.S. (number one and number two in per capita toothpaste consumption) are also among the highest per capita spenders on plastic surgery. So, to sum up, Colgate sells a product with such favorable characteristics that it appears likely to be able to grow revenue, margins, and profits for a long time to come, even in a mature market like the U.S.
What makes Colgate really exciting, however, is its huge international growth opportunity. There are approximately 1 billion people in the developed world and 6 billion in the developing world and, of those 7 billion people, there are currently over 5 billion people suffering from tooth decay. As wealth spreads to the rest of the developing world, it would be logical to assume that these people will desire to improve the health of their mouths. Furthermore, demographics suggest by 2100 there will be about 11 billion people globally (with most of that population growth estimated to come out of Africa), which means there are an additional 4 billion people yet to be born who are potential customers. Colgate is incredibly well positioned to
YCG Enhanced Fund
capitalize on all of this growth. Currently, revenues and profits are 80% international and over 50% emerging markets, and Colgate is the clear toothpaste market leader with a commanding 45% market share worldwide, three times the share of its next biggest competitor. However, even these numbers understate Colgate’s true international dominance. In the U.S., Colgate’s market share is roughly equal to Crest’s at a little over 35%, meaning Colgate’s market share internationally is much higher (over 55% in many markets). Bottom line, in our opinion, Colgate is one of the best businesses in the world, with clear dominance in a market large enough to enable the company to grow to many multiples of its current size.
Though Colgate effortlessly passed through our business quality filters, our work is not quite done. In order to determine whether Colgate is a good investment, we must evaluate one last item: the attractiveness of its forward rate of return. When we run the numbers, we believe the stock is priced to deliver a very high expected return relative both to its business quality and to the returns we expect in the overall stock market. Specifically, as of 11/30/2015, Colgate is on offer for a 3.7% shareholder yield with 5-6% revenue growth potential for decades to come. Also, over the last 25 years, operating margins have expanded from 10% to over 20%, and we think they can continue to expand, boosting growth further. Compared to all other investment alternatives currently available, we believe this combination of yield plus growth plus quality will be very hard to beat.
Concluding Remarks
We live in a truly amazing world. Humanity’s ability to innovate has led to exponential improvements in our standard of living by making material goods vastly cheaper and more plentiful, increasing life expectancy, reducing poverty, and reducing disease burdens. While this innovation is good for society as a whole, it leads to a tremendous amount of change that can wreak havoc on individual industries, companies, or people that are not properly positioned to benefit from these changes. As stewards of your and our families’ capital, we will continue to search for and, as long as they are reasonably priced, invest in those companies that possess enduring, timeless attributes that are not just built to last in this fast changing world, but to thrive.
Sincerely,
The YCG Team
Past performance does not guarantee future results.
The fund is non-diversified, meaning it may concentrate its assets in fewer individual holdings than a diversified fund. Therefore, the Fund is more exposed to individual stock volatility than a diversified fund. The Fund invests primarily in equity securities without regard to market capitalization, thus investments will be made in mid and smaller capitalization companies, which
YCG Enhanced Fund
involve additional risks such as limited liquidity and greater volatility. The Fund may also write put options and covered call options on a substantial portion of the Fund’s long equity portfolio, which have the risks of early option contract assignment forcing the Fund to purchase the underlying stock at the exercise price which may be the cause of significant losses due to the failure of correctly predicting the direction of securities prices, interest rates and currency exchange rates. The investment in options is not suitable for all investors. Covered call writing may limit the upside of an underlying security. The Fund may also invest in foreign securities which involve political, economic and currency risks, greater volatility, and differences in accounting methods. Investments in debt securities typically decrease in value when interest rates rise. This risk is usually greater for longer-term debt securities. Investment in lower-rated, non-rated and distressed securities presents a greater risk of loss to principal and interest than higher-rated securities.
Fund holdings and sector allocations are subject to change at any time and should not be considered recommendations to buy or sell any security. Please see the Schedule of Investments in this report for a complete list of fund holdings.
The S&P 500 Index is a stock market index based on the market capitalizations of 500 leading companies publicly traded in the U.S. stock market. It is not possible to invest directly in an index.
The S&P Metals and Mining Select Industry Index is a stock market index that comprises stocks in the S&P Total Market Index that are classified in the GICS metals and mining sub-industry.
The S&P 500 Equal Weight Energy Index is a stock market index that imposes equal weights on the index constituents included in the S&P 500 that are classified in the GICS energy sector.
The MSCI Brazil 25/50 Index (USD) is a stock market index designed to measure the performance of the large and mid-cap segments of the Brazilian market. It applies certain investment limits that are imposed on regulated investment companies, or RICs, under the current US Internal Revenue Code. With 66 constituents, the index covers approximately 85% of the free float-adjusted market capitalization in Brazil based on the market capitalizations of 500 leading companies publicly traded in the U.S. stock market. Returns are measured in U.S. dollars.
The MSCI Thailand IMI 25/50 Index (USD) is a stock market index designed to measure the performance of the large, mid and small cap segments of the Thailand market. It applies certain investment limits that are imposed on regulated investment companies, or RICs, under the current US Internal Revenue Code. With 130 constituents, the index covers approximately 99% of the free float-adjusted market capitalization in Thailand. Returns are measured in U.S. dollars.
The Economist industrial commodity-price index is an index made up of 25 commodities, excluding oil and precious metals.
The MSCI Indonesia Investable Market Index (USD) is a stock market index designed to measure the performance of the large, mid and small cap segments of the Indonesian market. With 97 constituents, the index covers approximately 99% of the free float-adjusted market capitalization in Indonesia. Returns are measured in U.S. dollars.
The definition of “shareholder yield” is the cash flow from operations that is left over after spending on maintenance capital expenditures and acquisitions that are required to protect the business. In other words, it’s the cash flow from operations that is free and clear to be distributed to shareholders in the form of dividends and share repurchases, and/or to be allocated towards ways to grow the existing business through means such as “growth” acquisitions or new capital expenditures, or simply pay down debt. Typically, we calculate this by looking at a normalized view of net income plus depreciation and amortization minus the maintenance capital expenditures and acquisitions that are required to protect the business, adjusted for often overlooked items such as pensions, stock option expenses, and leases.
YCG Enhanced Fund
EXPENSE EXAMPLE
For the six months ended November 30, 2015 (Unaudited)
As a shareholder of the YCG Enhanced Fund (the “Fund”), you incur ongoing costs, including management fees and other Fund expenses. If you invest through a financial intermediary, you may also incur additional costs such as a transaction fee charged on the purchase or sale of the Fund or an asset-based management fee. This example is intended to help you understand your ongoing costs (in dollars) of investing in the Fund and to compare these costs with the ongoing costs of investing in other mutual funds.
The Example is based on an investment of $1,000 invested at the beginning of the period and held for the entire period from June 1, 2015 to November 30, 2015.
Actual Expenses
The first line of the table on the next page provides information about actual account values and actual expenses. You may use the information provided in this line, together with the amount you invested, to estimate the expenses that you paid over the period. Simply divide your account value by $1,000 (for example, an $8,600 ending account value divided by $1,000 = 8.6), then multiply the result by the number in the first line under the heading entitled “Expenses Paid During the Period” to estimate the expenses you paid on your account during the period.
Hypothetical Example for Comparison Purposes
The second line of the table on the next page provides information about hypothetical account values and hypothetical expenses based on the Fund’s actual expense ratio and an assumed rate of return of 5% per year before expenses, which is not the Fund’s actual return. The hypothetical account values and expenses may not be used to estimate the actual ending account balance or expenses you paid for the period. You may use this information to compare the ongoing costs of investing in the Fund and other funds. To do so, compare this 5% hypothetical example with the 5% hypothetical examples that appear in the shareholder reports of the other funds.
YCG Enhanced Fund
EXPENSE EXAMPLE (continued)For the six months ended November 30, 2015 (Unaudited)
Please note that the expenses shown in the table are meant to highlight your ongoing costs only and do not reflect any costs that may be associated with investing in the Fund through a financial intermediary. Therefore, the second line of the table is useful in comparing the ongoing costs only, and will not help you determine the relative total costs of owning different funds. In addition, if any costs associated with investing through a financial intermediary were included, your costs would have been higher.
| | | | Expenses Paid |
| | Beginning | Ending | During Period(1) |
| | Account Value | Account Value | 06/01/2015 – |
| | 06/01/2015 | 11/30/2015 | 11/30/2015 |
| Actual | $1,000.00 | $ 993.50 | $6.95 |
| | | | |
| Hypothetical (5% return | | | |
| before expenses) | 1,000.00 | 1,018.10 | 7.03 |
(1) | Expenses are equal to the Fund’s annualized expense ratio of 1.39%, multiplied by the average account value over the period, multiplied by 183/365 to reflect the period. |
YCG Enhanced Fund
GROWTH OF $10,000 INVESTMENT
(Unaudited)
This chart assumes an initial gross investment of $10,000 made on December 28, 2012 (commencement of the Fund’s operations). Returns shown include the reinvestment of all dividends. Returns shown do not reflect the deductions of taxes that a shareholder would pay on Fund distributions or the redemption of Fund shares. In the absence of fee waivers and reimbursements, when they are necessary to keep expenses at the expense cap, total return would be reduced. Past performance is not predictive of future performance. Investment return and principal value will fluctuate so that your shares, when redeemed, may be worth more or less than original cost. Index returns do not reflect the effects of fees or expenses. It is not possible to invest directly in an index.
| | | Since Inception |
| | One Year | (12/28/2012) |
| Annual Returns | | |
| YCG Enhanced Fund | 2.25% | 13.82% |
| S&P 500 Index | 2.75% | 16.85% |
YCG Enhanced Fund
TOP TEN EQUITY HOLDINGS
November 30, 2015 (Unaudited)
| | | Percentage of |
| | | Net Assets |
| Colgate-Palmolive Co. | | | 8.01 | % |
| Procter & Gamble Co. | | | 7.83 | % |
| PepsiCo., Inc. | | | 7.22 | % |
| MSCI, Inc. | | | 6.37 | % |
| Nestle SA – ADR | | | 6.00 | % |
| Aon PLC | | | 5.61 | % |
| Mastercard, Inc. | | | 5.00 | % |
| Microsoft Corp. | | | 4.36 | % |
| Wells Fargo & Co. | | | 4.15 | % |
| Verizon Communications, Inc. | | | 4.09 | % |
| Total | | | 58.64 | % |
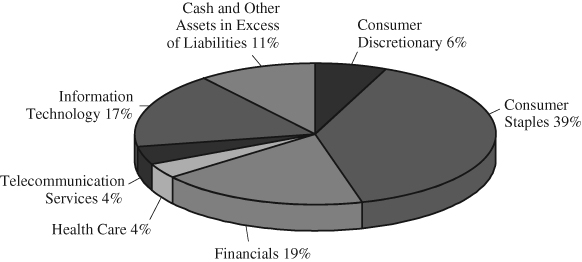
ALLOCATION OF PORTFOLIO HOLDINGS (as a % of net assets)
November 30, 2015 (Unaudited)
YCG Enhanced Fund
SCHEDULE OF INVESTMENTS
November 30, 2015
| | | Shares | | | Value | |
| COMMON STOCKS – 89.37% | | | | | | |
| | | | | | | |
| Beverages – 9.17% | | | | | | |
| Coca-Cola Co. | | | 41,047 | | | $ | 1,749,423 | |
| PepsiCo., Inc. | | | 64,505 | | | | 6,460,821 | |
| | | | | | | | 8,210,244 | |
| | | | | | | | | |
| Capital Markets – 2.58% | | | | | | | | |
| The Charles Schwab Corp. | | | 68,500 | | | | 2,309,135 | |
| | | | | | | | | |
| Commercial Banks – 4.15% | | | | | | | | |
| Wells Fargo & Co. | | | 67,418 | | | | 3,714,732 | |
| | | | | | | | | |
| Diversified Financial Services – 6.37% | | | | | | | | |
| MSCI, Inc. | | | 81,286 | | | | 5,699,774 | |
| | | | | | | | | |
| Diversified Telecommunication Services – 4.09% | | | | | | | | |
| Verizon Communications, Inc. | | | 80,575 | | | | 3,662,134 | |
| | | | | | | | | |
| Food & Staples Retailing – 1.88% | | | | | | | | |
| CVS Health Corp. | | | 17,855 | | | | 1,679,977 | |
| | | | | | | | | |
| Food Products – 9.02% | | | | | | | | |
| Nestle SA – ADR | | | 72,717 | | | | 5,376,695 | |
| The Hershey Co. | | | 31,258 | | | | 2,697,878 | |
| | | | | | | | 8,074,573 | |
| | | | | | | | | |
| Health Care Providers & Services – 3.51% | | | | | | | | |
| Anthem, Inc. | | | 9,369 | | | | 1,221,530 | |
| Express Scripts Holding Co. (a) | | | 22,451 | | | | 1,919,112 | |
| | | | | | | | 3,140,642 | |
| | | | | | | | | |
| Household Products – 15.84% | | | | | | | | |
| Colgate-Palmolive Co. | | | 109,184 | | | | 7,171,205 | |
| Procter & Gamble Co. (b) | | | 93,730 | | | | 7,014,753 | |
| | | | | | | | 14,185,958 | |
| | | | | | | | | |
| Insurance – 5.61% | | | | | | | | |
| Aon PLC | | | 53,070 | | | | 5,027,852 | |
| | | | | | | | | |
| Internet Software & Services – 0.51% | | | | | | | | |
| Alphabet, Inc. – Class C (a) | | | 200 | | | | 148,520 | |
| eBay, Inc. (a) | | | 10,500 | | | | 310,695 | |
| | | | | | | | 459,215 | |
See notes to financial statements.
YCG Enhanced Fund
SCHEDULE OF INVESTMENTS (continued)
November 30, 2015
| | | Shares | | | Value | |
| COMMON STOCKS – 89.37% (continued) | | | | | | |
| | | | | | | |
| IT Services – 8.89% | | | | | | |
| Mastercard, Inc. | | | 45,680 | | | $ | 4,472,986 | |
| PayPal Holdings, Inc. (a) | | | 6,100 | | | | 215,086 | |
| Western Union Co. | | | 173,342 | | | | 3,269,230 | |
| | | | | | | | 7,957,302 | |
| | | | | | | | | |
| Media – 4.43% | | | | | | | | |
| Discovery Communications, Inc. (a) | | | 84,076 | | | | 2,486,968 | |
| Twenty-First Century Fox, Inc. | | | 50,255 | | | | 1,483,025 | |
| | | | | | | | 3,969,993 | |
| | | | | | | | | |
| Personal Products – 3.46% | | | | | | | | |
| Unilever NV – ADR | | | 70,918 | | | | 3,101,953 | |
| | | | | | | | | |
| Software – 7.89% | | | | | | | | |
| Microsoft Corp. | | | 71,813 | | | | 3,903,037 | |
| Oracle Corp. | | | 81,100 | | | | 3,160,467 | |
| | | | | | | | 7,063,504 | |
| | | | | | | | | |
| Textiles, Apparel & Luxury Goods – 1.97% | | | | | | | | |
| Cie Financiere Richemont SA – ADR | | | 236,978 | | | | 1,760,746 | |
| TOTAL COMMON STOCKS | | | | | | | | |
| (Cost $67,183,459) | | | | | | | 80,017,734 | |
| Total Investments (Cost $67,183,459) – 89.37% | | | | | | | 80,017,734 | |
| Other Assets in Excess of Liabilities – 10.63% | | | | | | | 9,521,845 | |
| TOTAL NET ASSETS – 100.00% | | | | | | $ | 89,539,579 | |
Percentages are stated as a percent of net assets.
| ADR | American Depositary Receipt |
| PLC | Public Limited Company |
| (a) | Non-Income Producing Security. |
| (b) | A portion of this security is pledged as collateral on options written. As of November 30, 2015, the value of collateral is $2,245,200. |
The Global Industry Classification Standard (GICS) was developed by and/or is the exclusive property of MSCI, Inc. and Standard & Poor Financial Services LLC (“S&P”). GICS is a service mark of MSCI and S&P and has been licensed for use by U.S. Bancorp Fund Services, LLC.
See notes to financial statements.
YCG Enhanced Fund
SCHEDULE OF OPTIONS WRITTEN
November 30, 2015
| | | Contracts | | | Value | |
| CALL OPTIONS | | | | | | |
| Alphabet, Inc. – Class C | | | | | | |
| Expiration: January 2016; Exercise Price: $650.00 | | | 1 | | | $ | 9,516 | |
| Expiration: March 2016; Exercise Price: $650.00 | | | 1 | | | | 10,474 | |
| eBay, Inc. | | | | | | | | |
| Expiration: January 2016; Exercise Price: $27.50 | | | 105 | | | | 26,250 | |
| Microsoft Corp. | | | | | | | | |
| Expiration: January 2016; Exercise Price: $52.50 | | | 130 | | | | 36,400 | |
| PayPal Holdings, Inc. | | | | | | | | |
| Expiration: January 2016; Exercise Price: $40.00 | | | 61 | | | | 1,769 | |
| | | | | | | | | |
| PUT OPTIONS | | | | | | | | |
| Anthem, Inc. | | | | | | | | |
| Expiration: December 2015; Exercise Price: $150.00 | | | 21 | | | | 40,897 | |
| Expiration: January 2016; Exercise Price: $135.00 | | | 18 | | | | 13,590 | |
| Aon PLC | | | | | | | | |
| Expiration: January 2016; Exercise Price: $90.00 | | | 14 | | | | 1,120 | |
| Expiration: January 2016; Exercise Price: $92.50 | | | 74 | | | | 10,360 | |
| CVS Health Corp. | | | | | | | | |
| Expiration: January 2016; Exercise Price: $95.00 | | | 27 | | | | 7,695 | |
| Expiration: February 2016; Exercise Price: $95.00 | | | 40 | | | | 17,200 | |
| Express Scripts Holding Co. | | | | | | | | |
| Expiration: February 2016; Exercise Price: $85.00 | | | 212 | | | | 70,490 | |
| Mastercard, Inc. | | | | | | | | |
| Expiration: January 2016; Exercise Price: $97.00 | | | 125 | | | | 26,750 | |
| Expiration: January 2016; Exercise Price: $99.00 | | | 9 | | | | 2,754 | |
| Microsoft Corp. | | | | | | | | |
| Expiration: January 2016; Exercise Price: $48.00 | | | 64 | | | | 1,088 | |
| The Charles Schwab Corp. | | | | | | | | |
| Expiration: December 2015; Exercise Price: $28.00 | | | 98 | | | | 735 | |
| Expiration: December 2015; Exercise Price: $29.00 | | | 441 | | | | 5,513 | |
| Expiration: December 2015; Exercise Price: $31.00 | | | 40 | | | | 1,000 | |
| Expiration: January 2016; Exercise Price: $29.00 | | | 54 | | | | 1,620 | |
| Twenty-First Century Fox, Inc. | | | | | | | | |
| Expiration: January 2016; Exercise Price: $29.00 | | | 420 | | | | 29,400 | |
| Expiration: January 2016; Exercise Price: $30.00 | | | 420 | | | | 52,500 | |
| Western Union Co. | | | | | | | | |
| Expiration: February 2016; Exercise Price: $19.00 | | | 75 | | | | 7,875 | |
| Total Options Written (Premiums received $585,117) | | | | | | $ | 374,996 | |
See notes to financial statements.
YCG Enhanced Fund
STATEMENT OF ASSETS AND LIABILITIES
November 30, 2015
| ASSETS: | | | |
| Investments, at value (Cost $67,183,459) | | $ | 80,017,734 | |
| Cash | | | 7,863,102 | |
| Receivable for Fund shares sold | | | 8,348 | |
| Dividends and interest receivable | | | 102,455 | |
| Deposits with brokers for options written | | | 2,064,933 | |
| Prepaid expenses | | | 28,832 | |
| Total Assets | | | 90,085,404 | |
| | | | | |
| LIABILITIES: | | | | |
| Options written, at value (Premiums received $585,117) | | | 374,996 | |
| Payable for Fund shares redeemed | | | 40,098 | |
| Payable to investment advisor | | | 87,148 | |
| Other accrued expenses | | | 43,583 | |
| Total Liabilities | | | 545,825 | |
| NET ASSETS | | $ | 89,539,579 | |
| | | | | |
| NET ASSETS CONSIST OF: | | | | |
| Capital stock | | $ | 74,529,042 | |
| Undistributed net investment income | | | 381,885 | |
| Undistributed accumulated net realized gain | | | 1,584,256 | |
| Net unrealized appreciation | | | | |
| Investments | | | 12,834,275 | |
| Written options | | | 210,121 | |
| Total Net Assets | | $ | 89,539,579 | |
| Shares outstanding (unlimited shares of no par value authorized) | | | 6,523,304 | |
| | | | | |
| NET ASSET VALUE, OFFERING AND | | | | |
REDEMPTION PRICE PER SHARE(1) | | $ | 13.73 | |
(1) | A redemption fee of 2.00% is assessed against shares redeemed within 90 days of purchase. See |
| | Note 2h. |
See notes to financial statements.
YCG Enhanced Fund
STATEMENT OF OPERATIONS
For the year ended November 30, 2015
| INVESTMENT INCOME: | | | |
Dividend income(1) | | $ | 1,609,732 | |
| Total investment income | | | 1,609,732 | |
| EXPENSES: | | | | |
| Investment advisory fees | | | 883,335 | |
| Shareholder Service fees | | | 51,204 | |
| Administration fees | | | 44,171 | |
| Compliance fees | | | 38,278 | |
| Federal and state registration fees | | | 31,816 | |
| Transfer agent fees and expenses | | | 30,715 | |
| Accounting fees | | | 24,647 | |
| Audit and tax fees | | | 15,507 | |
| Trustee fees and expenses | | | 11,001 | |
| Insurance fees | | | 10,921 | |
| Custody fees | | | 9,531 | |
| Reports to shareholders | | | 8,782 | |
| Interest expense | | | 12 | |
| Miscellaneous expenses | | | 3,000 | |
| Total expenses before reimbursements/recoupments | | | 1,162,920 | |
| Expense recoupment by investment adviser (See Note 5) | | | 64,927 | |
| Net Expenses | | | 1,227,847 | |
| NET INVESTMENT INCOME | | | 381,885 | |
| REALIZED AND UNREALIZED GAIN: | | | | |
| Net realized gain on | | | | |
| Investments | | | 233,416 | |
| Options written | | | 1,351,543 | |
| Total | | | 1,584,959 | |
| Net change in unrealized appreciation (depreciation) on | | | | |
| Investments | | | 133,351 | |
| Options written | | | (235,393 | ) |
| Total | | | (102,042 | ) |
| Net realized and unrealized gain on investments | | | 1,482,917 | |
| NET INCREASE IN NET ASSETS | | | | |
| RESULTING FROM OPERATIONS | | $ | 1,864,802 | |
(1) | Net of $28,929 in foreign withholding taxes. |
See notes to financial statements.
YCG Enhanced Fund
STATEMENTS OF CHANGES IN NET ASSETS
| | | Year Ended | | | Year Ended | |
| | | November 30, 2015 | | | November 30, 2014 | |
| OPERATIONS: | | | | | | |
| Net investment income | | $ | 381,885 | | | $ | 361,537 | |
| Net realized gain on investments | | | | | | | | |
| and options written | | | 1,584,959 | | | | 3,159,981 | |
| Net change in unrealized | | | | | | | | |
| appreciation (depreciation) on | | | | | | | | |
| investments and options written | | | (102,042 | ) | | | 5,441,837 | |
| Net increase in net assets | | | | | | | | |
| resulting from operations | | | 1,864,802 | | | | 8,963,355 | |
| | | | | | | | | |
| CAPITAL SHARE TRANSACTIONS: | | | | | | | | |
| Proceeds from shares sold | | | 13,734,345 | | | | 26,726,438 | |
| Proceeds from reinvestment of distributions | | | 3,414,124 | | | | 993,867 | |
| Redemption fees | | | 2,586 | | | | 3,560 | |
| | | | 17,151,055 | | | | 27,723,865 | |
| Payments for shares redeemed | | | (10,164,365 | ) | | | (2,011,685 | ) |
| Net increase | | | 6,986,690 | | | | 25,712,180 | |
| | | | | | | | | |
| DISTRIBUTIONS PAID FROM: | | | | | | | | |
| Net investment income | | | (357,083 | ) | | | (306,410 | ) |
| From net realized gains | | | (3,066,482 | ) | | | (690,125 | ) |
| Total dividends and distributions | | | (3,423,565 | ) | | | (996,535 | ) |
| | | | | | | | | |
| TOTAL INCREASE IN NET ASSETS | | | 5,427,927 | | | | 33,679,000 | |
| | | | | | | | | |
| NET ASSETS: | | | | | | | | |
| Beginning of year | | | 84,111,652 | | | | 50,432,652 | |
| End of year (including | | | | | | | | |
| undistributed net investment income | | | | | | | | |
| of $381,885 and $357,083) | | $ | 89,539,579 | | | $ | 84,111,652 | |
| | | | | | | | | |
| CHANGES IN SHARES OUTSTANDING: | | | | | | | | |
| Shares sold | | | 1,025,463 | | | | 2,074,704 | |
| Issued in reinvestment of distributions | | | 255,932 | | | | 79,573 | |
| Shares redeemed | | | (767,653 | ) | | | (155,652 | ) |
| Net increase | | | 513,742 | | | | 1,998,625 | |
See notes to financial statements.
YCG Enhanced Fund
FINANCIAL HIGHLIGHTS
For a Fund share outstanding throughout the period
| | | | | | | | | December 28, 2012(1) | |
| | | Year Ended | | | Year Ended | | | through | |
| | | November 30, 2015 | | | November 30, 2014 | | | November 30, 2013 | |
| NET ASSET VALUE: | | | | | | | | | |
| Beginning of year | | $ | 14.00 | | | $ | 12.57 | | | $ | 10.00 | |
| | | | | | | | | | | | | |
| OPERATIONS: | | | | | | | | | | | | |
| Net investment income | | | 0.06 | | | | 0.07 | | | | 0.05 | |
| Net realized and unrealized | | | | | | | | | | | | |
| gain on investment securities | | | 0.24 | | | | 1.61 | | | | 2.52 | |
| Total from investment operations | | | 0.30 | | | | 1.68 | | | | 2.57 | |
| Redemption fee proceeds | | | — | (2) | | | — | (2) | | | — | (2) |
| Dividends from net | | | | | | | | | | | | |
| investment income | | | (0.06 | ) | | | (0.08 | ) | | | — | |
| Dividends from net realized gains | | | (0.51 | ) | | | (0.17 | ) | | | — | |
| Total distributions | | | (0.57 | ) | | | (0.25 | ) | | | — | |
| | | | | | | | | | | | | |
| NET ASSET VALUE: | | | | | | | | | | | | |
| End of year | | $ | 13.73 | | | $ | 14.00 | | | $ | 12.57 | |
| | | | | | | | | | | | | |
| TOTAL RETURN | | | 2.25 | % | | | 13.58 | % | | | 25.70 | %(3) |
| | | | | | | | | | | | | |
| SUPPLEMENTAL DATA AND RATIOS: | | | | | | | | | | | | |
| Net assets; end of year (000’s) | | $ | 89,540 | | | $ | 84,112 | | | $ | 50,433 | |
| Ratio of expenses to | | | | | | | | | | | | |
| average net assets: | | | | | | | | | | | | |
| Expenses including | | | | | | | | | | | | |
| reimbursement (recapture) | | | 1.39 | % | | | 1.39 | % | | | 1.39 | %(4) |
| Expenses excluding | | | | | | | | | | | | |
| reimbursement (recapture) | | | 1.32 | % | | | 1.38 | % | | | 1.70 | %(4) |
| Net investment income including | | | | | | | | | | | | |
| reimbursement (recapture) | | | 0.43 | % | | | 0.55 | % | | | 0.59 | %(4) |
| Net investment income excluding | | | | | | | | | | | | |
| reimbursement (recapture) | | | 0.50 | % | | | 0.56 | % | | | 0.28 | %(4) |
| Portfolio turnover rate | | | 18.49 | % | | | 25.46 | % | | | 9.21 | %(3) |
(1) | Date of inception. |
(2) | Amount represents less than $0.01 per share. |
(3) | Not annualized. |
(4) | Annualized. |
See notes to financial statements.
YCG Enhanced Fund
NOTES TO FINANCIAL STATEMENTS
November 30, 2015
YCG Funds (the “Trust”) is a Delaware statutory trust organized under Declarations of Trust dated September 4, 2012. The Trust is an open-end management investment company, as defined in the Investment Company Act of 1940 (the “1940 Act”), as amended. The Trust consists of one series, YCG Enhanced Fund (the “Fund”). The Fund is classified and operates as a non-diversified fund under the 1940 Act. The Fund commenced operations on December 28, 2012. The Fund’s investment adviser is YCG, LLC (the “Adviser”). There are an unlimited number of authorized shares. The investment objective of the Fund is to maximize long-term appreciation with reasonable investment risk.
| 2. | SUMMARY OF SIGNIFICANT ACCOUNTING POLICIES |
The following is a summary of significant accounting policies consistently followed by the Fund in the preparation of its financial statements. The financial statements have been prepared in conformity with accounting principles generally accepted in the United States of America (“GAAP”). The Fund is an investment company and accordingly follows the investment company accounting and reporting guidance of the Financial Accounting Standards Board (“FASB”) Accounting Standards Codification Topic 946 Financial Services – Investment Companies.
(a) Subsequent Events Evaluation – In preparing these financial statements, the Fund has evaluated events and transactions for potential recognition or disclosure resulting from subsequent events through the date the financial statements were issued. This evaluation did not result in any subsequent events that necessitated disclosures and/or adjustments other than the event listed below.
On December 30, 2015, the Trust declared and paid distributions from ordinary income and net realized capital gains to shareholders of record as of December 29, 2015, as follows:
| | Ordinary | Short-Term | Long-Term |
| | Income | Capital Gain | Capital Gain |
| Distribution Paid | $381,885 | $947,393 | $637,539 |
| Distribution Paid Per Share | $0.05547330 | $0.13762 | $0.09261 |
(b) Investment Valuation – Securities which are traded on a national stock exchange are valued at the last sale price on the securities exchange on which such securities are primarily traded. Securities that are traded on The Nasdaq OMX Group, Inc., referred to as NASDAQ are valued at the Nasdaq Official Closing Price. Exchange-traded securities for which there were no transactions are valued at the current bid prices. Securities traded on only over-the-counter markets are valued on the basis of closing over-the-counter bid prices. Short-term debt instruments maturing within 60
YCG Enhanced Fund
NOTES TO FINANCIAL STATEMENTS (continued)
November 30, 2015
days are valued by the amortized cost method, which approximates fair value. Debt securities (other than short-term instruments) are valued at the mean price furnished by a national pricing service, subject to review by the Adviser and determination of the appropriate price whenever a furnished price is significantly different from the previous day’s furnished price. Options written or purchased by the Fund are valued at the last sales price. If there are no trades for an option on a given day, options are valued at the mean between the current bid and asked prices. Any securities for which there are no readily available market quotations and other assets will be valued at their fair value as determined in good faith by the Adviser pursuant to procedures established by and under the supervision of the Board of Trustees.
Valuation Measurements
The Fund has adopted authoritative fair valuation accounting standards which establish an authoritative definition of fair value and set out a hierarchy for measuring fair value. These standards require additional disclosures about the various inputs and valuation techniques used to develop the measurements of fair value and a discussion in changes in valuation techniques and related inputs, if any, during the period. In addition, these standards require expanded disclosure for each major category of assets. These inputs are summarized in the three broad levels listed below:
| Level 1 – | Quoted prices in active markets for identical securities. |
| | |
| Level 2 – | Other significant observable inputs (including quoted prices for similar securities, interest rates, prepayment speeds, credit risk, etc.) |
| | |
| Level 3 – | Significant unobservable inputs (including the Fund’s own assumptions in determining the fair value of investments). |
The inputs or methodology used for valuing securities are not an indication of the risk associated with investing in those securities. The following is a summary of the inputs used to value the Fund’s net assets as of November 30, 2015:
| | | Level 1 | | | Level 2 | | | Level 3 | | | Total | |
Assets | | | | | | | | | | | | |
| Common Stocks* | | $ | 80,017,734 | | | $ | — | | | $ | — | | | $ | 80,017,734 | |
Liabilities | | | | | | | | | | | | | | | | |
| Other Financial | | | | | | | | | | | | | | | | |
| Instruments** | | | | | | | | | | | | | | | | |
| Options Written | | $ | 374,996 | | | $ | — | | | $ | — | | | $ | 374,996 | |
| * | Please refer to the Schedule of Investments to view securities by industry type. |
| ** | Other Financial Instruments are derivative instruments not reflected in the Schedule of Investments, such as options written, which are reflected at value. |
YCG Enhanced Fund
NOTES TO FINANCIAL STATEMENTS (continued)
November 30, 2015
The Fund did not invest in any Level 3 investments during the year. There were no transfers between levels during the year.
It is the Fund’s policy to consider transfers between levels as of the end of the reporting period.
(c) Option Writing – The Fund may write covered call options and put options on a substantial portion of the Fund’s long equity portfolio as a means to generate additional income and to tax-efficiently enter and exit positions. The Fund will not use this strategy as a means of generating implicit leverage. In other words, if all put options were to be exercised, the Fund will generally have enough cash on hand to purchase the assigned shares. When the Fund writes an option, an amount equal to the premium received by the Fund is recorded as a liability and is subsequently adjusted to the current fair value of the option written. Premiums received from writing options that expire unexercised are treated by the Fund on the expiration date as realized gains from options written. The difference between the premium and the amount paid on effecting a closing purchase transaction, including brokerage commissions, is also treated as a realized gain, or, if the premium is less than the amount paid for the closing purchase transaction, as a realized loss. If a call option is exercised, the premium is added to the proceeds from the sale of the underlying security in determining whether the Fund has realized a gain or loss. If a put option is exercised, the premium reduces the cost basis of the securities purchased by the Fund. The Fund, as a writer of an option, bears the market risk of an unfavorable change in the price of the security underlying the written option. Upon writing an option, the Fund is required to pledge an amount of cash or securities, as determined by the broker, as collateral. As of November 30, 2015, the Fund held securities with a value of $2,245,200 and cash of $2,064,933 as collateral for options written. During the year, the Fund used written covered call and put options in a manner consistent with the strategy described above.
Statement of Assets and Liabilities – Values of Derivative Instruments as of November 30, 2015
| | Liability Derivatives | |
| Derivatives not | | | |
| accounted for | | | |
| as hedging | | | |
| instruments | Location | Value | |
| Equity Contracts – Options | Options written, at value | $374,996 | |
YCG Enhanced Fund
NOTES TO FINANCIAL STATEMENTS (continued)
November 30, 2015
The effect of Derivative Instruments on the Statement of Operations for the year ended November 30, 2015
| Amount of Realized Gain on | Change in Unrealized Appreciation |
| Derivatives Recognized in Income | on Derivatives Recognized in Income |
| Derivatives not | | Derivatives not | |
| accounted for | | accounted for | |
| as hedging | Options | as hedging | Options |
| instruments | Written | instruments | Written |
| Equity Contracts | $1,351,543 | Equity Contracts | ($235,393) |
The average monthly value of options written during the year ended November 30, 2015, was $496,475.
See Note 4 for additional disclosure related to transactions in options written during the year.
Derivative Risks
The risks of using the various types of derivatives in which the Fund may engage include the risk that movements in the value of the derivative may not fully offset or complement instruments currently held in the Fund in the manner intended by the Adviser, the risk that the counterparty to a derivative contract may fail to comply with its obligations to the Fund, the risk that there may not be a liquid secondary market for the derivative at a time when the Fund would look to disengage the position, the risk that additional capital from the Fund may be called upon to fulfill the conditions of the derivative contract, the risk that the use of derivatives may induce leverage in the Fund, and the risk that the cost of the derivative may reduce the overall returns experience by the Fund.
Offsetting Assets and Liabilities
The Fund is subject to various Master Netting Arrangements, which govern the terms of certain transactions with select counterparties. The Master Netting Arrangements allow the Fund to close out and net its total exposure to a counterparty in the event of a default with respect to all the transactions governed under a single agreement with a counterparty. The Master Netting Arrangements also specify collateral posting arrangements at pre-arranged exposure levels. Under the Master Netting Arrangements, collateral is routinely transferred if the total net exposure to certain transactions (net of existing collateral already in place) governed under the relevant Master Netting Arrangement with a counterparty in a given account exceeds a specified threshold depending on the counterparty and the type of Master Netting Arrangement.
YCG Enhanced Fund
NOTES TO FINANCIAL STATEMENTS (continued)
November 30, 2015
The following is a summary of the Assets and Liabilities subject to offsetting in the Fund as of November 30, 2015:
| Liabilities | | | | Gross Amounts Not |
| | | | | Offset in the Statement |
| | | | | of Assets and Liabilities |
| | | Gross | Net | | | |
| | | Amounts | Amounts | | | |
| | | Offset | Presented | | | |
| | Gross | in the | in the | | | |
| | Amounts | Statement | Statement | | | |
| | of | of Assets | of Assets | | | |
| Description / | Recognized | and | and | Financial | Collateral | Net |
| Counterparty | Liabilities | Liabilities | Liabilities | Instruments | Pledged | Amount |
| Options Written | | | | | | |
| Interactive Brokers | $374,996 | $ — | $374,996 | $ — | $374,996 | $ — |
In some instances, the collateral amounts disclosed in the tables were adjusted due to the requirement to limit the collateral amounts to avoid the effect of overcollateralization. Actual collateral received/pledged may be more than the amounts disclosed herein.
(d) Federal Income Taxes – The Fund intends to qualify as a “regulated investment company” under Subchapter M of the Internal Revenue Code of 1986, as amended. If so qualified, the Fund will not be subject to federal income tax to the extent it distributes substantially all of its net investment income and capital gains to shareholders. Therefore, no federal income tax provision is required.
The Fund has adopted financial reporting rules regarding recognition and measurement of tax positions taken or expected to be taken on a tax return. The Fund recognizes interest and penalties, if any, related to unrecognized tax benefits as income tax expense in the Statement of Operations. During the year, the Fund did not incur any interest or penalties. As of and during the year ended November 30, 2015, the Fund did not have any liabilities for unrecognized tax benefits.
(e) Distributions to Shareholders – The Fund will declare and distribute any net investment income and any net realized long or short-term capital gains annually. Distributions to shareholders are recorded on the ex-dividend date. The character of distributions made during the year from net investment income or net realized gains may differ from the characterization for federal income tax purposes due to differences in the recognition of income, expense and gain items for financial statement and tax purposes. Where appropriate, reclassifications between capital accounts are made for such differences that are permanent in nature.
YCG Enhanced Fund
NOTES TO FINANCIAL STATEMENTS (continued)
November 30, 2015
(f) Use of Estimates – The preparation of the financial statements in conformity with GAAP requires management to make estimates and assumptions that affect the reported amounts of assets and liabilities and disclosure of contingent assets and liabilities at the date of the financial statements and the reported amounts of increases and decreases in net assets from operations during the reporting period. Actual results could differ from those estimates.
(g) Guarantees and Indemnifications – In the normal course of business, the Fund enters into contracts with service providers that contain general indemnification clauses. The Fund’s maximum exposure under these arrangements is unknown as this would involve future claims against the Fund that have not yet occurred. Based on experience, the Fund expects the risk of loss to be remote.
(h) Redemption Fee – Those who buy and sell the Fund within 90 calendar days will incur a 2% redemption fee, retained for the benefit of long-term shareholders, recorded as additional capital in the Statement of Changes in Net Assets.
(i) Beneficial Ownership – The beneficial ownership, either directly or indirectly, of more than 25% of the voting securities of a fund creates a presumption of control of the Fund, under Section 2(a)(9) of the 1940 Act. At November 30, 2015, no shareholder held more than 25% of the outstanding shares of the Fund.
(j) Other – Investment transactions and shareholder transactions are accounted for on the trade date. Net realized gains and losses on securities are computed on the basis of highest amortized cost. Dividend income is recognized on the ex-dividend date and interest income is recognized on an accrual basis. Discounts and premiums on securities purchased are accreted and amortized over the lives of the respective securities. Withholding taxes on foreign dividends have been provided for in accordance with the Fund’s understanding of the applicable country’s tax rules and regulations.
| 3. | INVESTMENT TRANSACTIONS |
For the year ended November 30, 2015, the aggregate purchases and sales of securities, excluding short-term securities, were $24,005,042 and $14,113,052 for the Fund. For the year ended November 30, 2015, there were no long-term purchases or sales of U.S. Government securities for the Fund.
YCG Enhanced Fund
NOTES TO FINANCIAL STATEMENTS (continued)
November 30, 2015
| 4. | OPTION CONTRACTS WRITTEN |
The premium amount and number of option contracts written during the year ended November 30, 2015, in the Fund were as follows:
| | | Amount of | | | Number of | |
| | | Premiums | | | Contracts | |
| Outstanding at 11/30/14 | | $ | 625,174 | | | | 2,402 | |
| Options written | | | 2,940,467 | | | | 10,566 | |
| Options exercised | | | (180,907 | ) | | | (1,095 | ) |
| Options expired | | | (1,230,767 | ) | | | (4,298 | ) |
| Options closed | | | (1,568,850 | ) | | | (5,125 | ) |
| Outstanding at 11/30/15 | | $ | 585,117 | | | | 2,450 | |
See Note 2 for additional disclosure related to transactions in options written during the year.
| 5. | INVESTMENT ADVISORY AGREEMENT |
The Adviser acts as the investment adviser to the Fund pursuant to an investment advisory agreement (the “Advisory Agreement”) which has been approved by the Board (including a majority of the Trustees who are not parties to the Advisory Agreement, or interested persons of any such party). Under the terms of the Advisory Agreement between the Fund and the Adviser, the Adviser conducts investment research and management for the Fund and is responsible for the purchase and sale of securities for the Fund’s investment portfolio. The Adviser provides the Fund with investment advice, supervises the management and investment programs and provides investment advisory facilities and executive and supervisory personnel for managing the investments and effectuating portfolio transactions. The Adviser also furnishes, at its own expense, all necessary administrative services, office space, equipment and clerical personnel for servicing the investments of the Fund. In addition, the Adviser pays the salaries and fees of all officers of the Fund who are affiliated with the Adviser. Under the Advisory Agreement, the monthly compensation paid to the Adviser is accrued daily at an annual rate of 1.00% on the average daily net assets of the Fund.
In the interest of limiting the expenses of the Fund, the Adviser has entered into a contractual expense limitation agreement with the Fund. Pursuant to the Expense Limitation Agreement, the Adviser (for the lifetime of the Fund) has agreed to waive or limit its fees and assume other expenses of the Fund (excluding interest, taxes, brokerage commissions and dividend expenses on securities sold short and extraordinary expenses not incurred in the ordinary course of business) so that the
YCG Enhanced Fund
NOTES TO FINANCIAL STATEMENTS (continued)
November 30, 2015
Fund’s ratio of total annual operating expenses is limited to 1.39%. The Adviser is entitled to the reimbursement of fees waived or reimbursed by the Adviser to the Fund subject to the limitations that (1) the reimbursement of expenses classified as “organizational” or “offering” related to the initial registration and offering of the Fund is made only for those expenses incurred not more than one year prior to the date of reimbursement (2) the reimbursement is made only for fees and expenses incurred not more than three years prior to the date of reimbursement, and (3) the reimbursement may not be made if it would cause the Fund’s annual expense limitation to be exceeded. The reimbursement amount may not include any additional charges or fees, such as interest accruable on the reimbursement account. During the year ended November 30, 2015, the Fund reimbursed $64,927 of previously waived expenses to the Adviser. As of November 30, 2015, expenses of $12,026 and $3,840 are subject to recoupment by the Adviser, expiring during the year ended November 30, 2017 and November 30, 2016, respectively.
Certain officers, trustees and shareholders of the Fund are also owners or employees of the Adviser.
| 6. | SERVICE AND CUSTODY AGREEMENTS |
The Fund has entered into Service Agreements with U.S. Bancorp Fund Services, LLC (“USBFS”) and a Custody Agreement with U.S. Bank, N.A., an affiliate of USBFS. Under these agreements, USBFS and U.S. Bank, N.A. provide certain transfer agency, administrative, accounting and custody services.
| 7. | NON-DIVERSIFICATION RISK |
The Fund is non-diversified. A non-diversified fund may invest more of its assets in fewer companies than if it were a diversified fund. The Fund may be more exposed to the risks of loss and volatility than a fund that invests more broadly.
| 8. | NEW ACCOUNTING PRONOUNCEMENTS |
In June 2014, FASB issued ASU No. 2014-11 “Repurchase-to-Maturity Transactions, Repurchase Financings, and Disclosures.” ASU No. 2014-11 makes limited changes to the accounting for repurchase agreements, clarifies when repurchase agreements and securities lending transactions should be accounted for as secured borrowings, and requires additional disclosures regarding these types of transactions. The guidance is effective for fiscal years beginning on or after December 15, 2014, and for interim periods within those fiscal years. Management is currently evaluating the impact, if any, these changes will have on the Fund’s financial statement disclosures.
YCG Enhanced Fund
NOTES TO FINANCIAL STATEMENTS (continued)
November 30, 2015
| 9. | FEDERAL TAX INFORMATION |
A. Tax Basis of Distributions to Shareholders: The tax character of the distributions paid by the Fund were as follows:
| | | For the Year Ended | | | For the Year Ended | |
| | | November 30, 2015 | | | November 30, 2014 | |
| Ordinary Income | | $ | 1,587,964 | | | $ | 996,535 | |
| Long-Term Capital Gains | | | 1,835,601 | | | | — | |
| Total | | $ | 3,423,565 | | | $ | 996,535 | |
Reclassifications: The tax components of distributable earnings are determined in accordance with income tax regulations which may differ from the compositions of net assets reported under accounting principles generally accepted in the United States. Accordingly, for the year ended November 30, 2015, certain differences were reclassified. These differences were due to net operating losses reclassified to reduce short term capital gains; the amounts reclassified did not affect net assets. The reclassifications were as follows:
| Increase/(Decrease) Capital stock | | $ | 108 | |
| Increase/(Decrease) Undistributed | | | | |
| accumulated net realized gain | | $ | (108 | ) |
B. Tax Basis of Investments: As of November 30, 2015, the components of the tax basis cost of investments and net unrealized appreciation were as follows:
| YCG Enhanced Fund | |
| Tax cost of investments | | $ | 67,183,592 | |
| Gross unrealized appreciation | | | 14,319,573 | |
| Gross unrealized depreciation | | | (1,485,431 | ) |
| Net tax unrealized appreciation (depreciation) | | | 12,834,142 | |
| Undistributed ordinary income | | | 1,329,211 | |
| Undistributed long-term capital gains | | | 637,488 | |
| Accumulated earnings | | | 1,966,699 | |
| Other accumulated gains (losses) | | | 209,696 | |
| Total accumulated earnings | | $ | 15,010,537 | |
The tax basis of investments for tax and financial reporting purposes differs, principally due to the deferral of losses on wash sales and the recognition of gains on certain foreign investments.
Net capital losses incurred after October 31, and within the taxable year are deemed to arise on the first business day of the Fund’s next taxable year. Qualified late-year
YCG Enhanced Fund
NOTES TO FINANCIAL STATEMENTS (continued)
November 30, 2015
ordinary losses are the excess of the sum of the specified loss attributable to the portion of the taxable year after October 31st, and the late-year losses attributable to the portion of the taxable year after December 31st, over the sum of the specified gains attributable to the portion of the taxable year after October 31st, and other ordinary income attributable to the portion of the taxable year after December 31st. For the fiscal year ended November 30, 2015, there were no post-October or late-year losses.
YCG Enhanced Fund
REPORT OF INDEPENDENT REGISTERED PUBLIC ACCOUNTING FIRM
To the Shareholders of YCG Enhanced Fund and
Board of Trustees of YCG Funds
We have audited the accompanying statement of assets and liabilities, including the schedules of investments and options written, of YCG Enhanced Fund (the “Fund”), a series of YCG Funds, as of November 30, 2015, and the related statement of operations for the year then ended, the statements of changes in net assets for each of the two years in the period then ended, and financial highlights for each of the three periods in the period then ended. These financial statements and financial highlights are the responsibility of the Fund’s management. Our responsibility is to express an opinion on these financial statements and financial highlights based on our audits.
We conducted our audits in accordance with the standards of the Public Company Accounting Oversight Board (United States). Those standards require that we plan and perform the audit to obtain reasonable assurance about whether the financial statements and financial highlights are free of material misstatement. An audit includes examining, on a test basis, evidence supporting the amounts and disclosures in the financial statements. Our procedures included confirmation of securities owned as of November 30, 2015, by correspondence with the custodian and brokers. An audit also includes assessing the accounting principles used and significant estimates made by management, as well as evaluating the overall financial statement presentation. We believe that our audits provide a reasonable basis for our opinion.
In our opinion, the financial statements and financial highlights referred to above present fairly, in all material respects, the financial position of YCG Enhanced Fund as of November 30, 2015, the results of its operations for the year then ended, the changes in net assets for each of the two years in the period then ended, and financial highlights for each of the three periods in the period then ended, in conformity with accounting principles generally accepted in the United States of America.
COHEN FUND AUDIT SERVICES, LTD.
Cleveland, Ohio
January 28, 2016
YCG Enhanced Fund
ADDITIONAL INFORMATION
(Unaudited)
| 1. | SHAREHOLDER NOTIFICATION OF FEDERAL TAX STATUS |
For the year ended November 30, 2015, 59% of the dividends paid from net investment income, including short-term capital gains, for the YCG Enhanced Fund qualify for the dividends received deduction available to corporate shareholders.
For the year ended November 30, 2015, 83% of the dividends paid from net investment income, including short-term capital gains, for the YCG Enhanced Fund are designated as qualified dividend income.
| 2. | COMPENSATION OF TRUSTEES |
During the fiscal year, each Trustee who is not an “interested person” of the Trust (i.e. an “Independent Trustee”) received $1,000 per meeting attended, as well as reimbursement for expenses incurred in connection with attendance at such meetings. The Fund’s Statement of Additional Information includes additional information about the Trustees and is available upon request by calling toll free 1-855-444-9243.
| 3. | PROXY VOTING POLICIES AND PROCEDURES |
For a description of the policies and procedures that the Fund uses to determine how to vote proxies relating to portfolio securities, please call 1-855-444-9243 and request a Statement of Additional Information. One will be mailed to you free of charge. The Statement of Additional Information is also available on the web site of the Securities and Exchange Commission at http:www.sec.gov. Information on how the Fund voted proxies relating to portfolio securities during the period ended June 30, 2015 is available without charge, upon request, by calling 1-855-444-9243 or by accessing the website of the Securities and Exchange Commission.
| 4. | DISCLOSURE OF PORTFOLIO HOLDINGS |
The Fund files a complete schedule of portfolio holdings with the Securities and Exchange Commission for the first and third quarters of each fiscal year on Form N-Q. The Fund’s Form N-Q is available on the website of the Securities and Exchange Commission at http://www.sec.gov.
| 5. | BOARD ANNUAL RENEWAL OF INVESTMENT ADVISORY AGREEMENT |
The continuance of the Investment Advisory Agreement (the “IA Agreement”) between the Trust and YCG, LLC (“YCG”), on behalf of the YCG Enhanced Fund (the “Fund”), was last approved by the Board of Trustees (“the Board”), including a majority of the Trustees who are not interested persons of the Trust or any person
YCG Enhanced Fund
ADDITIONAL INFORMATION (continued)
(Unaudited)
who is a party to the Agreement, at an in-person meeting held on October 29, 2015. The Trust’s Board considered the factors described below prior to approving the Agreement.
To assist the Board in making its determination as to whether the IA Agreement should be renewed, the Board requested and received the following information: a description of YCG’s business and any personnel changes, a description of the compensation received by YCG from the Fund and its other clients, information relating to the Advisor’s compliance and operational policies and procedures, and a description of any material legal proceedings or securities enforcement proceedings regarding YCG or its personnel (there were none of either). In addition, the Board requested and received certain financial information relating to the operations of YCG for its fiscal year ended December 31, 2014 and fiscal year-to-date for 2015.
The Board also received a report from YCG relating to the fees charged by YCG, both as an aggregate and in relation to fees charged by other advisors to similar funds. Except for YCG’s financial materials, which were distributed at the Meeting, the materials prepared by YCG were provided to the Board in advance of the meeting. The Board considered the fees charged by YCG in light of the services provided to the Fund by YCG. After full and careful consideration, the Board, with the independent trustees separately concurring, agreed that the fees charged by YCG were fair and reasonable in light of the services provided to the Funds.
The Board also discussed the nature, extent and quality of YCG’s services to the Fund. In particular, the Board noted with approval YCG’s commitment to maintaining certain targeted expense ratios for the Funds, its success in achieving respectable investment returns for the Fund, and its adherence to its stated investment mandate. The Board also discussed YCG’s current fee structure and whether such structure would allow the Fund to realize economies of scale as it grows. The Board next considered the investment performance of the Fund. The Board generally approved of the Fund’s performance, noting that the Fund invested in a manner that did not rely exclusively on investment performance. Further, the Board noted with approval that the Adviser did not succumb to “style drift” in its management of the Fund’s assets, and that the Fund was committed to maintain its investment mandate, even if that meant under performance during periods when that style was out of favor. The Board noted with approval the Advisor’s ongoing efforts to maintain such consistent investment discipline. The Board also noted that the Advisor’s business was not devoted exclusively to serving the Funds, but it did not appear that the Advisor was realizing any improper ancillary benefits or profits deriving from its relationship with the Fund. The Board further noted with approval the Advisor’s past activities on behalf of the Fund and the promptness and efficiency with which
YCG Enhanced Fund
ADDITIONAL INFORMATION (continued)
(Unaudited)
problems were brought to the Board’s attention and responsible remedies offered and executed. After careful discussion and consideration, the Board, including the separate concurrence of the independent Trustees, unanimously cast an affirmative vote, and determined that the renewal of the IA Agreement for another one-year period would be in the best interests of the Fund’s shareholders. In approving the renewal of the IA Agreement for an additional one year period, the Board did not place specific emphasis on any one factor discussed above, but considered all factors in equal light. Further, the Board had available and availed itself of the assistance of legal counsel at all times during its consideration of the IA Agreement renewal.
YCG Enhanced Fund
TRUSTEES AND OFFICERS
(Unaudited)
The business of the Fund is managed under the direction of the Board. The Board formulates the general policies of the Fund and meets periodically to review the Fund’s performance, monitor investment activities and practices, and discuss other matters affecting the Fund. The Trustees are fiduciaries for the Fund’s shareholders and are governed by the laws of the State of Delaware in this regard. The names and addresses of the Trustees and officers of the Trust are listed below along with a description of their principal occupations over at least the last five years. Trustees who are “interested persons”, as defined by the 1940 Act, are indicated by asterisk. The Fund’s Statement of Additional Information includes additional information about the Trustees and is available upon request by calling toll free 1-855-444-9243.
| | | | | Other |
| | | | | directorships |
| | Position | Number | | held and |
| | held | of funds | | number of |
| | with the | in the | | funds in |
| Name, address | Trust | Trust | Principal occupation(s) | complex during |
| and year born | and tenure | overseen | during the past five years | the past five years |
| | | | | |
| Brian Yacktman* | Trustee & | 1 | Manager, Principal and | None. |
| 3207 Ranch Road | President | | Chief Investment | |
| 620 South, Suite 200 | since | | Officer, YCG, LLC, | |
| Austin, TX 78738 | December | | investment adviser to | |
| (1979) | 2012 | | the Fund, since 2007. | |
| | | | Associate, Yacktman | |
| | | | Asset Management, | |
| | | | 2004–2007. BS from | |
| | | | Brigham Young | |
| | | | University, 2002. | |
| | | | MBA from Brigham | |
| | | | Young University, 2004. | |
| | | | | |
| William D. Kruger* | Chairman, | 1 | Manager, Principal and | None |
| 3207 Ranch Road | Vice | | CEO, YCG, LLC, | |
| 620 South, Suite 200 | President, | | investment adviser to | |
| Austin, TX 78738 | Treasurer, | | the Fund, since 2008. | |
| (1979) | Trustee, | | Financial Analyst with | |
| | since | | Merrill Lynch Pierce | |
| | December | | Fenner & Smith from | |
| | 2012 | | 2005–2008. BS from | |
| | | | Brigham Young | |
| | | | University, 2005. | |
YCG Enhanced Fund
TRUSTEES AND OFFICERS (continued)
(Unaudited)
| | Position | Number | | Other |
| | held | of funds | | directorships |
| | with the | in the | | held and |
| Name, address | Trust | Trust | Principal occupation(s) | number of |
| and year born | and tenure | overseen | during the past five years | funds in complex |
| | | | | |
| Non-Interested Trustees: | | | | |
| | | | | |
| Travis E.Oliphant | Trustee | 1 | Scientific and Technical | None |
| 3207 Ranch Road | since | | software developer. | |
| 620 South, Suite 200 | December | | CEO of Continuum | |
| Austin, TX 78738 | 2012 | | Analytics since January 2012. | |
| (1971) | | | President of Enthought | |
| | | | 2007–December, 2011. | |
| | | | Assistant Professor, | |
| | | | Brigham Young University, | |
| | | | 2000–August 2007. | |
| | | | BS from Brigham Young | |
| | | | University, 1995. | |
| | | | MS from Brigham Young | |
| | | | University, 1996. | |
| | | | PhD from Mayo Graduate | |
| | | | School, 2001. | |
| | | | | |
| Rory M. McDonald | Trustee | 1 | Assistant Professor of | None |
| 3207 Ranch Road | since | | Business Administration | |
| 620 South, Suite 200 | December | | in the Technology and | |
| Austin, TX 78738 | 2012 | | Operations Management | |
| (1978) | | | Unit at Harvard Business | |
| | | | School, 2013–Present. | |
| | | | Assistant Professor of | |
| | | | Management, University of | |
| | | | Texas at Austin, McCombs | |
| | | | School of Business, | |
| | | | 2011–2013. Co-founder | |
| | | | of Adaptive Hearing Solutions, | |
| | | | 2005–2007. Associate at | |
| | | | Cornerstone Research, 2006. | |
| | | | BS From University of South | |
| | | | Florida, 2004. MS from | |
| | | | University of South Florida, | |
| | | | 2004. MBA from Stanford | |
| | | | University, 2006. MA from | |
| | | | Stanford University, 2009. | |
| | | | PhD From Stanford | |
| | | | University, 2011. | |
YCG Enhanced Fund
TRUSTEES AND OFFICERS (continued)
(Unaudited)
| | Position | Number | | Other |
| | held | of funds | | directorships |
| | with the | in the | | held and |
| Name, address | Trust | Trust | Principal occupation(s) | number of |
| and year born | and tenure | overseen | during the past five years | funds in complex |
| | | | | |
| Jeffrey R. Harbach | Trustee | 1 | Owner, franchisee of 7-11 | None |
| 3207 Ranch Road | since | | Stores, 2002–Present. | |
| 620 South, Suite 200 | December | | Former President and CEO | |
| Austin, TX 78738 | 2012 | | of David Gabriel Co. | |
| (1979) | | | BS from Brigham Young | |
| | | | University, 2002. | |
| | | | MBA from University of | |
| | | | Texas at Austin, 2011. | |
| | | | | |
| Officers who are not Trustees: | | | | |
| | | | | |
| Elliott Savage | Vice | N/A | Manager, Principal and | None |
| 3207 Ranch Road | President, | | Portfolio manager, YCG, | |
| 620 South, Suite 200 | Assistant | | LLC, investment adviser | |
| Austin, TX 78738 | Treasurer | | to the Fund, since 2012. | |
| (1980) | | | Senior Analyst, Highside | |
| | | | Capital Management, 2003– | |
| | | | 2012. Investment Banking | |
| | | | Analyst, Salomon Smith | |
| | | | Barney, 2002–2003. BA from | |
| | | | University of Virginia, 2002. | |
| | | | | |
| David D. Jones, Esq. | Secretary, | N/A | Co-founder and | None |
| 422 Fleming Street, | Chief | | Managing Member of | |
| Suite 7 | Compliance | | Drake Compliance LLC | |
| Key West, FL 33040 | Officer; | | (compliance consulting), | |
| (1957) | Anti-Money | | since 2004. Founder and | |
| | Laundering | | controlling shareholder of | |
| | Officer | | David Jones & Associates | |
| | | | P.C. (law firm) since 1998. | |
| | | | BA in Economics, University | |
| | | | of Texas at Austin, 1983. | |
| | | | JD with honors, St. Mary’s | |
| | | | University School of Law, 1994. | |
| * | Brian Yacktman and William Kruger are considered to be “interested persons” of the Trust, a term that is defined in the 1940 Act. Mr. Yacktman and Mr. Kruger are interested persons because: (1) each is an officer of the Trust; and (2) each is the owner of the investment adviser to the Fund. |
Each trustee holds office for an indefinite term and until the earlier of: the Trust’s next meeting of shareholders and the election and qualification of his successor; or until the date a trustee dies, resigns or is removed in accordance with the Trust’s Declaration of Trust and By-laws. Each officer holds office at the pleasure of the Board and serves for a period of one year, or until his successor is duly elected and qualified.
Privacy Notice
| FACTS | WHAT DOES YCG FUNDS DO WITH YOUR PERSONAL INFORMATION? |
| | |
| WHY? | Financial companies choose how they share your personal information. Federal law gives consumers the right to limit some, but not all information sharing. Federal law also requires us to tell you how we collect, share, and protect your personal information. Please read this Notice carefully to understand what we do. |
| | |
| WHAT? | The types of information we collect and share depend on the product or service you have with us. This information can include: |
| | • Social Security Number |
| | • Assets |
| | • Retirement Assets |
| | • Transaction History |
| | • Checking Account History |
| | • Purchase History |
| | • Account Balances |
| | • Account Transactions |
| | • Wire Transfer Instructions |
| | When you are no longer our customer, we continue to share your information as described in this Notice. |
| | |
| HOW? | All financial companies need to share your personal information to run their everyday business. In the section below, we list the reasons financial companies can share their customers’ personal information; the reasons YCG Funds chooses to share; and whether you can limit this sharing. |
| Reasons we can share your personal information. | Does YCG Funds | Can you limit |
| Trust share? | this sharing? |
| For our everyday business purposes— | | |
| Such as to process your transactions, maintain | | |
| your account(s), respond to court orders and | Yes | No |
| legal investigations, or report to credit bureaus. | | |
| For our marketing purposes— | | |
| to offer our products and services to you. | No | We don’t share |
| For joint marketing with other financial | | |
| companies | No | We don’t share |
| For our affiliates’ everyday business purposes— | | |
| information about your transactions and experiences. | Yes | No |
| For our affiliates’ everyday business purposes— | | |
| information about your creditworthiness | No | We don’t share |
| For non-affiliates to market to you | No | We don’t share |
| Questions? | Call 855-444-YCGF (9243) |
Privacy Notice (continued)
| Who we are | |
| Who is providing | YCG Funds |
| this Notice? | YCG, LLC (investment adviser to the Trust) |
| | US Bancorp Fund Services, LLC (administrator to the Trust) |
| What we do | |
| How does | To protect your personal information from unauthorized |
| YCG Funds | access and use, we use security measures that comply |
| protect | with federal law. These measures include computer safeguards |
| your personal | and secured files and buildings. |
| information? | Our service providers are held accountable for adhering to strict policies and procedures to prevent any misuse or your nonpublic personal information. |
| How does | We collect your personal information, for example, when you |
| YCG Funds | • Open an account |
| collect your | • Provide account information |
| personal | • Give us your contact information |
| information? | • Make deposits or withdrawals from your account |
| | • Make a wire transfer |
| | • Tell us where to send the money |
| | • Tell us who receives the money |
| | • Show your government-issued ID |
| | • Show your drivers’ license |
| | We also collect your personal information from other companies. |
| Why can’t I | Federal law gives you the right to limit only: |
| limit all sharing? | • Sharing for affiliates’ everyday business purposes—information about your creditworthiness. |
| | • Affiliates from using your information to market to you. |
| | • Sharing for non-affiliates to market to you |
| | State laws and individual companies may give you additional rights to limit sharing. |
| Definitions | |
| Affiliates | Companies related by common ownership or control. They can be financial and non-financial companies. |
| | YCG, LLC, is an affiliate of YCG Funds |
| Non-affiliates | Companies not related by common ownership or control. They can be financial and non-financial companies. |
| | • YCG Funds does not share with non-affiliates so they can market to you. |
| Joint marketing | A formal agreement between non-affiliated financial companies that together market financial products to you. |
| | • YCG Funds does not jointly market. |
(This Page Intentionally Left Blank.)
For Fund information and shareholder services, call
1-855-444-9243
web site: www.ycgfunds.com
YCG Funds
c/o U.S. Bancorp Fund Services, LLC
P.O. Box 701
Milwaukee, WI 53201-0701
Investment Adviser
YCG, LLC
3207 Ranch Road 620 South, Suite 200
Austin, TX 78738
Chief Compliance Officer
Drake Compliance, LLC
422 Fleming Street, Suite 7
Key West, FL 33040
Legal Counsel
David Jones, Esq.
395 Sawdust Road #2137
Woodlands, TX 77380
Independent Registered Public Accounting Firm
Cohen Fund Audit Services, Ltd.
1350 Euclid Avenue, Suite 800
Cleveland, OH 44115
Transfer Agent, Fund Accountant, and Fund Administrator
U.S. Bancorp Fund Services, LLC
615 East Michigan Street
Milwaukee, WI 53202
Custodian
U.S. Bank, N.A.
1555 North RiverCenter Drive, Suite 302
Milwaukee, WI 53212
Distributor
Quasar Distributors, LLC
615 East Michigan Street
Milwaukee, WI 53202
This report is submitted for the general information of shareholders of the YCG Enhanced Fund. It is not authorized for distribution to prospective investors unless accompanied or preceded by an effective Prospectus for the Fund, which contains more information concerning the Fund’s investment policies, as well as fees and expenses and other pertinent information. Read the Prospectus carefully.
Item 2. Code of Ethics.
The registrant has adopted a code of ethics that applies to the registrant’s principal executive officer and principal financial officer. The registrant has not made any substantive amendments to its code of ethics during the period covered by this report. The registrant has not granted any waivers from any provisions of the code of ethics during the period covered by this report.
A copy of the registrant’s Code of Ethics is filed herewith.
Item 3. Audit Committee Financial Expert.
The registrant’s board of trustees has determined that there is at least one audit committee financial expert serving on its audit committee. Travis E. Oliphant is the “audit committee financial expert” and is considered to be “independent” as each term is defined in Item 3 of Form N‑CSR.
Item 4. Principal Accountant Fees and Services.
The registrant has engaged its principal accountant to perform audit services, audit-related services, tax services and other services during the past two fiscal years. “Audit services” refer to performing an audit of the registrant's annual financial statements or services that are normally provided by the accountant in connection with statutory and regulatory filings or engagements for those fiscal years. “Audit-related services” refer to the assurance and related services by the principal accountant that are reasonably related to the performance of the audit. “Tax services” refer to professional services rendered by the principal accountant for tax compliance, tax advice, and tax planning. The following table details the aggregate fees billed or expected to be billed for each of the last two fiscal years for audit fees, audit-related fees, tax fees and other fees by the principal accountant.
| | FYE 11/30/2015 | FYE 11/30/2014 |
| Audit Fees | $13,000 | $13,000 |
| Audit-Related Fees | $0 | $0 |
| Tax Fees | $2,500 | $2,500 |
| All Other Fees | $0 | $0 |
The audit committee has adopted pre-approval policies and procedures that require the audit committee to pre‑approve all audit and non‑audit services of the registrant, including services provided to any entity affiliated with the registrant.
The percentage of fees billed by Cohen Fund Audit Services applicable to non-audit services pursuant to waiver of pre-approval requirement were as follows:
| | FYE 11/30/2015 | FYE 11/30/2014 |
| Audit-Related Fees | 0% | 0% |
| Tax Fees | 0% | 0% |
| All Other Fees | 0% | 0% |
All of the principal accountant’s hours spent on auditing the registrant’s financial statements were attributed to work performed by full‑time permanent employees of the principal accountant. (If more than 50 percent of the accountant’s hours were spent to audit the registrant's financial statements for the most recent fiscal year, state how many hours were attributed to work performed by persons other than the principal accountant's full-time, permanent employees.)
The following table indicates the non-audit fees billed or expected to be billed by the registrant’s accountant for services to the registrant and to the registrant’s investment adviser (and any other controlling entity, etc.—not sub-adviser) for the last two years. The audit committee of the board of trustees/directors has considered whether the provision of non-audit services that were rendered to the registrant's investment adviser is compatible with maintaining the principal accountant's independence and has concluded that the provision of such non-audit services by the accountant has not compromised the accountant’s independence.
| Non-Audit Related Fees | FYE 11/30/2015 | FYE 11/30/2014 |
| Registrant | $0 | $0 |
| Registrant’s Investment Adviser | $0 | $0 |
Item 5. Audit Committee of Listed Registrants.
Not applicable to registrants who are not listed issuers (as defined in Rule 10A-3 under the Securities Exchange Act of 1934).
Item 6. Investments.
Schedule of Investments is included as part of the report to shareholders filed under Item 1 of this Form.
Item 7. Disclosure of Proxy Voting Policies and Procedures for Closed-End Management Investment Companies.
Not applicable to open-end investment companies.
Item 8. Portfolio Managers of Closed-End Management Investment Companies.
Not applicable to open-end investment companies.
Item 9. Purchases of Equity Securities by Closed‑End Management Investment Company and Affiliated Purchasers.
Not applicable to open-end investment companies.
Item 10. Submission of Matters to a Vote of Security Holders.
Not Applicable.
Item 11. Controls and Procedures.
| (a) | The Registrant’s President and Treasurer have reviewed the Registrant's disclosure controls and procedures (as defined in Rule 30a-3(c) under the Investment Company Act of 1940 (the “Act”)) as of a date within 90 days of the filing of this report, as required by Rule 30a-3(b) under the Act and Rules 13a-15(b) or 15d‑15(b) under the Securities Exchange Act of 1934. Based on their review, such officers have concluded that the disclosure controls and procedures are effective in ensuring that information required to be disclosed in this report is appropriately recorded, processed, summarized and reported and made known to them by others within the Registrant and by the Registrant’s service provider. |
| (b) | There were no changes in the Registrant's internal control over financial reporting (as defined in Rule 30a-3(d) under the Act) that occurred during the second fiscal quarter of the period covered by this report that has materially affected, or is reasonably likely to materially affect, the Registrant's internal control over financial reporting. |
Item 12. Exhibits.
| (a) | (1) Any code of ethics or amendment thereto, that is the subject of the disclosure required by Item 2, to the extent that the registrant intends to satisfy Item 2 requirements through filing an exhibit. Filed herewith |
(2) A separate certification for each principal executive officer and principal financial officer pursuant to Section 302 of the Sarbanes-Oxley Act of 2002. Filed herewith.
(3) Any written solicitation to purchase securities under Rule 23c‑1 under the Act sent or given during the period covered by the report by or on behalf of the registrant to 10 or more persons. Not applicable to open-end investment companies.
| (b) | Certifications pursuant to Section 906 of the Sarbanes‑Oxley Act of 2002. Furnished herewith. |
SIGNATURES
Pursuant to the requirements of the Securities Exchange Act of 1934 and the Investment Company Act of 1940, the registrant has duly caused this report to be signed on its behalf by the undersigned, thereunto duly authorized.
(Registrant) YCG Funds
By (Signature and Title)* /s/Brian A. Yacktman
Brian A. Yacktman, President
Date February 3, 2016
Pursuant to the requirements of the Securities Exchange Act of 1934 and the Investment Company Act of 1940, this report has been signed below by the following persons on behalf of the registrant and in the capacities and on the dates indicated.
By (Signature and Title)* /s/Brian A. Yacktman
Brian A. Yacktman, President
Date February 3, 2016
By (Signature and Title)* /s/William D. Kruger
William D. Kruger, Treasurer
Date February 3, 2016
* Print the name and title of each signing officer under his or her signature.