 | YCG ENHANCED FUND |
| a series of the YCG Funds |
| |
| |
| |
| |
| |
| |
| Semi-Annual Report | |
| May 31, 2021 | Ticker Symbol: YCGEX |
YCG Enhanced Fund
MESSAGE TO SHAREHOLDERS
(Unaudited)
Dear Fellow Shareholder:
For the six-month period ending May 31, 2021, the YCG Enhanced Fund (the “Fund”) achieved a total net return of 18.03%. During the same time period, the S&P 500 Index had a total return of 16.95%, and the S&P Global BMI Total Return Index had a total return of 17.07%. The Fund’s top five equity winners and top five equity losers during this period were as follows:
| TOP FIVE EQUITY | TOP FIVE EQUITY |
| WINNERS | LOSERS |
| CBRE Group, Inc. – Class A | Verisk Analytics, Inc. |
| Wells Fargo & Co. | CoStar Group, Inc. |
| Alphabet, Inc. Class C | Apple, Inc. |
| The Charles Schwab Corp. | The Procter & Gamble Co. |
| Moody’s Corp. | Colgate-Palmolive Co. |
The top 5 equity winners and equity losers are determined based on a ranking of the dollar gains and losses of all the equity securities owned in the portfolio over the period specified above. This calculation excludes the portfolio’s options positions, which may have experienced a gain or a loss during the period specified. Additionally, the Fund seeks to maximize long term capital appreciation with reasonable investment risk. We believe that six months is too short a period to accurately assess the soundness of our investment strategy, and, thus, we try not to draw too many conclusions from the chart above. Instead, we evaluate ourselves by the Fund’s performance over a full economic cycle, which we define as a period that includes both a recession and an economic expansion.
As we write this letter, it’s been a little over a year since the COVID-19 pandemic started. So much has changed since then, but hindsight and recency biases have a way of distorting our memories and softening the contrast between then and now. They also make it seem like the events of the intervening months were more predictable than they actually were. As a result, we think it’s worth taking a stroll through the headlines of a year ago. In this way, we can get a much better sense of both what actually happened in the past as well as what most commentators and investors were thinking at the time. So, without further ado . . .
What did the economic news and commentary look like at the time?
How Bad Might It Get? Think the Great Depression: The coronavirus collapse has the ingredients to surpass the disaster of the 1930s. (Bloomberg – April 22, 2020)1
____________
1 | See https://www.bloomberg.com/opinion/articles/2020-04-22/the-coronavirus-recession-will-rival-the-great-depression. |
YCG Enhanced Fund
Who Will Thrive in the Coming Deflation? (Treasury and Risk – April 28, 2020)2
Terminal Deflation is Coming (Foreign Policy – April 29, 2020)3
Great Depression 2020? The unofficial U.S. jobless rate is at least 20%–or worse (Marketwatch – May 11, 2020)4
Will a Global Depression Trigger Another World War? (Foreign Policy – May 13, 2020)5
Second-quarter GDP plunged by worst-ever 32.9% amid virus-induced shutdown (CNBC – July 30, 2020)6
Let’s call it what it is. We’re in a Pandemic Depression. (Washington Post – August 9, 2020)7
How did financial markets respond and what were commentators writing about them?
Over $26 billion wiped off cryptocurrency market in 24 hours after massive oil price plunge (CNBC – March 8, 2020)8
A Hellish Week for Markets Isn’t Over Yet: History suggests there’s worse to come before stocks recover. (Bloomberg – March 13, 2020)9
Credit Markets signal the US risks heading towards a financial crisis (CNBC – March 17, 2020)10
This was the fastest 30% sell-off ever, exceeding the pace of declines during the Great Depression (CNBC – March 23, 2020)11
____________
2 | See https://www.treasuryandrisk.com/2020/04/28/who-will-thrive-in-the-coming-deflation/?slreturn=20210224172143. |
3 | See https://foreignpolicy.com/2020/04/29/federal-reserve-global-economy-coronavirus-pandemic-inflation-terminal-deflation-is-coming/. |
4 | See https://www.marketwatch.com/story/great-depression-2020-the-unofficial-us-jobless-rate-is-at-least-20or-worse-2020-05-08#:~:text=%E2%80%9CThe%20unemployment%20rate%20’only’, economics%20at%20Macro%20Renaissance%20Research.&text=The%20rate%20of%20joblessness%20is,of%20the%20decadelong%20Great%20Depression. |
5 | See https://foreignpolicy.com/2020/05/13/coronavirus-pandemic-depression-economy-world-war/. |
6 | See https://www.cnbc.com/2020/07/30/us-gdp-q2-2020-first-reading.html. |
7 | See https://www.washingtonpost.com/opinions/lets-call-it-what-it-is-were-in-a-pandemic-depression/2020/08/09/3904faf4-d8e5-11ea-aff6-220dd3a14741_story.html. |
8 | See https://www.cnbc.com/2020/03/09/bitcoin-btc-and-other-cryptocurrency-prices-plunge-after-oil-drop.html. |
9 | See https://www.bloomberg.com/opinion/articles/2020-03-13/history-suggests-stock-market-crash-has-further-to-run. |
10 | See https://www.cnbc.com/2020/03/17/credit-markets-signal-the-us-could-be-heading-towards-financial-crisis.html. |
11 | See https://www.cnbc.com/2020/03/23/this-was-the-fastest-30percent-stock-market-decline-ever.html. |
YCG Enhanced Fund
Data Reveals the Stock Market Crash Is Far From Over (Traders Magazine – April 2, 2020)12
Fed Is Seizing Control of the Entire U.S. Bond Market (Bloomberg – April 9, 2020)13
Free-Falling: Oil Prices Keep Diving As Demand Disappears (NPR – April 20, 2020)14
‘Unreal’: Oil prices go negative for the first time in history (Fortune – April 20, 2020)15
What were experts saying about the prospects for a vaccine?
What happens if a coronavirus vaccine is never developed? It has happened before (CNN – May 4, 2020)16
Why we might not get a coronavirus vaccine: Politicians have become more cautious about immunisation prospects. They are right to be (The Guardian – May 22, 2020)17
There may never be a ‘silver bullet’ for COVID-19, WHO warns (NBC News – August 3, 2020)18
Given this backdrop, what were some of the smartest and most successful investors of our generation saying at the time?
Ray Dalio predicts a coronavirus depression: ‘This is bigger than what happened in 2008’ (CNBC – April 9, 2020)19
Buffett on why he hasn’t made any big investments: ‘We don’t see anything that attractive’ (CNBC – May 2, 2020)20
David Tepper says this is the second-most overvalued stock market he’s ever seen, behind only ‘99 (CNBC – May 13, 2020)21
Druckenmiller Says Risk-Reward in Stocks Is Worst He’s Seen (Bloomberg – May 12, 2020)22
____________
12 | See https://www.tradersmagazine.com/departments/equities/data-reveals-the-stock-market-crash-is-far-from-over/. |
13 | See https://www.bloomberg.com/opinion/articles/2020-04-09/coronavirus-fed-is-seizing-control-of-entire-u-s-bond-market. |
14 | See https://www.kuow.org/stories/free-falling-oil-prices-keep-diving-as-demand-disappears. |
15 | See https://fortune.com/2020/04/20/oil-prices-negative-crash-price-crude-market/. |
16 | See https://www.cnn.com/2020/05/03/health/coronavirus-vaccine-never-developed-intl/index.html. |
17 | See https://www.theguardian.com/world/2020/may/22/why-we-might-not-get-a-coronavirus-vaccine. |
18 | See https://www.nbcnews.com/health/health-news/there-may-never-be-silver-bullet-covid-19-who-warns-n1235618. |
19 | See https://www.cnbc.com/2020/04/09/ray-dalio-predicts-coronavirus-depression-this-is-bigger-than-2008.html. |
20 | See https://www.cnbc.com/2020/05/02/buffett-on-why-he-hasnt-made-any-big-investments-we-dont-see-anything-that-attractive.html. |
21 | See https://www.cnbc.com/2020/05/13/david-tepper-says-this-is-the-second-most-overvalued-stock-market-hes-ever-seen-behind-only-99.html. |
22 | See https://www.bloomberg.com/news/articles/2020-05-12/druckenmiller-says-v-shaped-recovery-for-u-s-is-a-fantasy#:~:text=Stan%20Druckenmiller%20said%20the%20risk,overcome%20real%20world%20economic%20problems.&text=But%20those%20programs%20aren’t,future%20economic%20growth%2C%20Druckenmiller%20said. |
YCG Enhanced Fund
Okay, let’s fast forward. What does economic news and commentary look like today?
Inflation is Coming. That Might Even Be a Problem. (Bloomberg – January 13, 2021)23
Forecast predicts another Roaring ‘20s (University of Miami News – January 22, 2021)24
Inflation Is Coming For Your Wealth. Here’s What Investors Can Do About It (Forbes – February 26, 2021)25
10% GDP growth? The U.S. economy is on fire, and is about to get stoked even more (CNBC – March 2, 2021)26
Unemployment falls to 6.2%, US adds 379,000 jobs and economic optimism grows (Chicago Tribune – March 5, 2021)27
Goldman Sachs forecasts a jobs boom, says unemployment rate could fall to 4.1% by the end of 2021 (CNBC – March 8, 2021)28
How are the financial markets doing, and what are commentators saying?
Pandemic-induced options trading craze shows no signs of slowing down (CNBC – December 4, 2020)29
Goldman says the SPAC boom will continue and found a way to spot ones that may outperform (CNBC – December 14, 2020)30
Larry Berman: Speculation in call volume hits all-time extremes (BNN Bloomberg – January 11, 2021)31
Commodity prices are surging: Is a new supercycle beginning? (The Economist – January 12, 2021)32
____________
23 | See https://www.bloomberg.com/opinion/articles/2021-01-13/inflation-is-coming-to-the-u-s-and-the-fed-could-be-in-a-bind. |
24 | See https://news.miami.edu/stories/2021/01/forecast-predicts-another-roaring-20s.html. |
25 | See https://www.forbes.com/sites/greatspeculations/2021/02/26/inflation-is-coming-for-your-wealth-heres-what-investors-can-do-about-it/?sh=6b072bb4b145. |
26 | See https://www.cnbc.com/2021/03/02/10percent-gdp-growth-the-us-economy-is-on-fire-and-is-about-to-get-stoked-even-more.html. |
27 | See https://www.chicagotribune.com/business/ct-biz-february-unemployment-rate-20210305-v4ettj77ozerxdontyp4ma55va-story.html. |
28 | See https://www.cnbc.com/2021/03/08/goldman-sachs-forecasts-a-jobs-boom-says-unemployment-rate-could-fall-to-4point1percent-by-the-end-of-2021.html. |
29 | See https://www.cnbc.com/2020/12/04/pandemic-induced-options-trading-craze-shows-no-signs-of-slowing-down.html. |
30 | See https://www.cnbc.com/2020/12/14/goldman-says-the-spac-boom-will-continue-and-found-a-way-to-spot-ones-that-may-outperform.html. |
31 | See https://www.bnnbloomberg.ca/larry-berman-speculation-in-call-volume-hits-all-time-extremes-1.1546842. |
32 | See https://www.economist.com/finance-and-economics/2021/01/12/commodity-prices-are-surging. |
YCG Enhanced Fund
The SPAC Boom Rolls on Into 2021: In January, an average of 5 new SPACs has been launched every business day (Morning Brew – January 24, 2021)33
Russell 2000 Hits New Record as Small Cap Leadership Continues (StockCharts – February 5, 2021)34
Junk Bonds With Low Yields? Here’s Why They’re Hot (Bloomberg – February 24, 2021)35
Oil is up nearly 70% since the election, a record in the modern era (CNN – February 26, 2021)36
Investors are taking on record amounts of debt to buy stocks, and it’s a bullish sign for the market, BofA says (Business Insider – March 2, 2021)37
Dow Hits Record High on Swashbuckling Stimulus-Led Rally in Cyclicals (Yahoo Finance – March 8, 2021)38
Inflation fears pump bitcoin prices above $56,000 (CNBC – March 11, 2021)39
The Booming IPO Market Shows No Signs of Slowing (Barron’s – March 12, 2021)40
Many Americans using their stimulus checks to dabble in the stock market: ‘Whatever. I’ll give it a shot’ (Baltimore Sun – March 21, 2021)41
A Return to Wall Street’s Low Rent District: Penny Stocks are Back. Critics are Worried. (New York Times – March 22, 2021)42
Stock Market Today: Dow, S&P 500 Surge Late, Set New Highs (Kiplinger – March 26, 2021)43
And it’s not just the financial markets. Let’s look at what’s going on in housing.
Toll Brothers Says the Housing Market Is the Hottest in 30 Years (Barron’s – December 8, 2020)44
____________
33 | See https://www.morningbrew.com/daily/stories/2021/01/25/spac-boom-rolls-2021. |
34 | See https://stockcharts.com/articles/chartwatchers/2021/02/russell-2000-hits-new-record-a-541.html. |
35 | See https://www.bloomberg.com/news/articles/2021-02-25/junk-bonds-with-low-yields-here-s-why-they-re-hot-quicktake. |
36 | See https://www.cnn.com/2021/02/26/investing/oil-prices-gas-biden-election/index.html. |
37 | See https://markets.businessinsider.com/news/stocks/stock-market-outlook-record-margin-debt-bullish-sign-bofa-2021-3-1030141618. |
38 | See https://in.news.yahoo.com/dow-hits-record-high-swashbuckling-132824335.html. |
39 | See https://www.cnbc.com/video/2021/03/11/inflation-fears-pump-bitcoin-prices-above-56000.html. |
40 | See https://www.barrons.com/articles/the-booming-ipo-market-shows-no-signs-of-slowing-what-investors-need-to-know-51615546800. |
41 | See https://www.baltimoresun.com/coronavirus/ct-aud-nw-nyt-stimulus-checks-stock-market-20210321-r5jhwdreivehbazsd4j4sfansi-story.html. |
42 | See https://www.nytimes.com/2021/03/18/business/dealbook/penny-stocks-mania.html. |
43 | See https://www.kiplinger.com/investing/stocks/602510/stock-market-today-032621-dow-sp-500-surge-late-new-highs. |
44 | See https://www.barrons.com/articles/toll-brothers-says-the-housing-market-is-the-hottest-in-30-years-51607449669. |
YCG Enhanced Fund
It has been the frothiest market I’ve ever seen: Redfin CEO on housing market (CNBC – January 26, 2021)45
‘It’s crazy. There is no inventory.’ Housing industry veteran marvels at real estate boom (CNN – March 26, 2021)46
Even the collectibles market is experiencing surging prices, as the headlines below demonstrate.
9 collectibles soaring in value during the pandemic (WCPO Cincinnati – February 18, 2021)47
NBA fans are spending thousands on the latest digital collectible craze (NewsNation – February 25, 2021)48
How NFTs are fueling a digital art boom (CNN – March 10, 2021)49
JPG File Sells for $69 Million, as ‘NFT Mania’ Gathers Pace (New York Times – March 11, 2021)50
Increasing Interest In High-End Collectibles Causes Auction Prices To Skyrocket (WBUR – March 18, 2021)51
Okay, now that we’ve shown you the headlines, are there any lessons we can take away from them? We certainly think so.
First, what an unbelievable contrast! We don’t ever remember a time when the narrative changed so much so fast.
Second, what short memories investors have! Just one year ago, many of us, including many of the most successful investors and economists of our generation, were very worried about a Great Depression. Now, many investors are bingeing on the riskiest financial products, most of which trade at very high valuations relative to history, and using a bunch of leverage to do it! If this doesn’t validate our claims about hindsight and recency bias and their distorting effects on our emotional and intellectual memories, we don’t know what will!
____________
45 | See https://www.msn.com/en-us/money/smallbusiness/it-has-been-the-frothiest-market-ive-ever-seen-redfin-ceo-on-housing-market/vi-BB1d7gMQ. |
46 | See https://www.cnn.com/2021/03/26/business/housing-market-shortage/index.html. |
47 | See https://www.wcpo.com/money/consumer/dont-waste-your-money/9-collectibles-soaring-in-value-during-the-pandemic. |
48 | See https://www.newsnationnow.com/sports/nba-fans-are-spending-thousands-on-the-latest-digital-collectible-craze/. |
49 | See https://www.cnn.com/style/article/nft-digital-art-boom/index.html. |
50 | See https://www.nytimes.com/2021/03/11/arts/design/nft-auction-christies-beeple.html. |
51 | See https://www.wbur.org/hereandnow/2021/03/18/auction-prices-soar. |
YCG Enhanced Fund
Third, we think this exercise in headline-reading should put to rest the idea that the future is predictable. Importantly, this isn’t to say that the investors we quoted were wrong to be cautious a year ago. Perhaps the stock market was a bad risk-reward bet at the time, especially given the uncertainty around the timing and efficacy of a vaccine. Perhaps it’s a good risk-reward today, even at these much higher prices. We don’t know what will happen, especially over the short- to medium- term. As we hope this juxtaposition shows, no one else does either.
Fourth, if the future is unpredictable and things can change so fast and unexpectedly, both positively and negatively, then one needs a robust and methodical plan of action to deal with this unpredictability. In designing this plan, we think it’s important to recognize that inflation has massively eroded the value of cash in almost every society for a simple reason that we believe is unlikely to change in the future: devaluing money is the most politically expedient way to pay for government spending. Therefore, though cash is the safest asset for short-term spending needs, we believe the risk of inflation makes it a suboptimal solution for long-term spending needs. In our view, productive assets that have the potential to maintain or grow your purchasing power are much better than cash for long-term spending needs. Furthermore, for reasons we’ve detailed in the past, including the astounding fact that 1 dollar invested in the stock market in 1900 grew to 69,754 dollars by the end of 2020,52 our favorite productive assets are publicly-traded equity ownership stakes in businesses (stocks).
However, psychologists have shown that people, on average, experience about two times as much pain for every dollar of loss as they do pleasure for every dollar of gain,53 and, unfortunately, stock markets occasionally lose 50% or more of their value and many individual stocks experience permanent losses of this magnitude. Given the psychological pain of loss, we do our best to construct portfolios that can avoid scenarios of catastrophic permanent decline, which can occur if 1) a large percentage of the Fund’s equity ownership stakes experience severe and permanent economically- or competitively-driven impairment or 2) the Fund or the Fund’s shareholders panic-sell out of a substantial portion of our portfolio in response to declines that later prove to be temporary. In our view, the best way to reduce the likelihood of these types of permanent impairment is to invest in a diverse collection of global champions with enduring pricing power and long-term volume growth opportunities run by ownership-minded management teams who run their businesses with conservative capital structures (so conservative, in fact, that they will get criticized in good times for this conservatism).
____________
52 | In nominal terms. In real terms, 1 dollar grew to 2,291 dollars, meaning an investor had, almost inconceivably, multiplied their purchasing power by 2,291 times over this 120-year period despite numerous world wars, depressions, and pandemics! See page 14 of the Credit Suisse Global Investment Returns Yearbook 2021, which can be found here: https://www.credit-suisse.com/about-us-news/en/articles/media-releases/credit-suisse-global-investment-returns-yearbook-2021-202103.html. |
53 | See https://www.behavioraleconomics.com/resources/mini-encyclopedia-of-be/loss-aversion/. |
YCG Enhanced Fund
Furthermore, because of the psychological reality of loss aversion and that fact that either severe economic distress or disruptive change could occur, completely unpredictably (see COVID-19 pandemic above), at any moment, we would manage the portfolio this way even if it meant somewhat below-average gains. However, academic research suggests that, historically, because people have a desire to “get rich quick” and are overconfident in their abilities to do so, owning the largest, highest-quality, most conservatively-financed businesses in industries retaining or growing their global relevancy has resulted in better-than-average returns54—and, because we believe these businesses are less risky, much-better-than-average risk-adjusted returns. Whether this effect will continue into the future is anyone’s guess, but we will continue to give preference to safety even if this historical return premium disappears.
Additionally, we will continue to rebalance into these great businesses (if it makes sense from a tax perspective) when they experience macroeconomic or operational worries or setbacks, as we believe investors tend to overly penalize stock prices in these cases. As we think back, almost all of today’s best businesses have experienced crises of confidence that led to big stock price declines and cheap valuation multiples: Mastercard and Visa with the Durbin Amendment which capped debit card interchange fees; Moody’s and S&P Global with their role in the 2008 financial crisis; Apple with fears related to the company’s reliance of mobile phone sales; PayPal with fears of new payments competitors; MSCI with their large customer Vanguard leaving; Schwab and the banks with interest rate fears; Nike with the rejuvenation of Adidas; Adobe, Microsoft, and Intuit with worries about their decreased relevancy in a mobile phone world as well as worries surrounding their software-as-a-service business model transformations; luxury stocks with fears of a corruption crackdown in China; CBRE with fears of a pandemic-driven commercial real estate collapse; Verisk with overpayment and competitive fears surrounding their Wood Mackenzie acquisition; Copart and Progressive with fears of driverless cars, and Estee Lauder with fears of department store collapse. We could go on and on, but this long list gives a flavor for the almost inevitable nature of these crises of confidence. Unfortunately, because of the unpredictability of the future, we can’t know which business is next up on the list and which threats will turn out to be truly injurious to the businesses. However, we feel confident that these crises of confidence are, on average, great buying opportunities, and we’ll likely rebalance into these situations when they occur in the future, though we will limit the maximum amount we’re willing to risk, especially for levered and/or mostly domestic businesses which have fewer degrees of freedom to solve their problems than global, diversified businesses with large cash balances and low or no debt.
____________
54 | See http://rnm.simon.rochester.edu/research/QDoVI.pdf. |
YCG Enhanced Fund
Lastly, we’ll pay attention to the investment environment more generally. In today’s environment, with buoyant stock markets (especially in so-called “cyclical recovery plays” and small- to mid-capitalization “disruptors/innovators”), surging IPO and SPAC listings, record stock market leverage in the form of margin debt and call-buying, and numerous collectibles crazes, we think it’s even more important to preference large, dominant global champions with pricing power, net cash, and lower-than-average cyclicality.
Conclusion
Because of hindsight and recency bias, many people believe the future is predictable. It is not, and the events over the last year, when viewed through the lens of the headlines then and now, should thoroughly disabuse us of this notion. However, even though the future is unpredictable, we’re not helpless. We can devise and methodically execute a plan that increases the number of potential futures in which we can survive and thrive. In our view, the plan that makes the most sense, both empirically and psychologically, is to own a diverse group of global champions with enduring pricing power and conservative capital structures and to rebalance among these businesses when investors become too focused on short-term business drivers.
As always, thank you for your trust, know that we are invested right alongside you, and please reach out if you have any questions or concerns. We are here to help.
Sincerely,
The YCG Team
Past performance does not guarantee future results.
Mutual fund investing involves risk. Principal loss is possible. The Fund is non-diversified, meaning it may concentrate its assets in fewer individual holdings than a diversified fund. Therefore, the Fund is more exposed to individual stock volatility than a diversified fund. The Fund invests primarily in equity securities without regard to market capitalization, thus investments will be made in mid and smaller capitalization companies, which involve additional risks such as limited liquidity and greater volatility. The Fund may also write put options and covered call options on a substantial portion of the Fund’s long equity portfolio, which have the risks of early option contract assignment forcing the Fund to purchase the underlying stock at the exercise price which may be the cause of significant losses due to the failure of correctly predicting the direction of securities prices, interest rates and currency exchange rates. The investment in options is not suitable for all investors. Covered call writing may limit the upside of an underlying security. The Fund may also invest in foreign securities which involve political, economic and currency risks, greater volatility, and differences in accounting methods. Investments in debt securities typically decrease in value when interest rates rise. This risk is usually greater for longer-term debt securities. Investment in lower-rated, non-rated and distressed securities presents a greater risk of loss to principal and interest than higher-rated securities.
YCG Enhanced Fund
Diversification does not guarantee a profit or protect from loss in a declining market.
Various mutual funds, hedge funds, and other investment products have different risk profiles, which should be considered when investing. All investments contain risk and may lose value.
Fund holdings and sector allocations are subject to change at any time and should not be considered recommendations to buy or sell any security. Please see the Schedule of Investments in this report for a complete list of Fund holdings.
The S&P 500 Index is a stock market index based on the market capitalizations of 500 leading companies publicly traded in the U.S. stock market. It is not possible to invest directly in an index.
The S&P Global BMI Total Return Index is a market capitalization-weighted index that provides a broad measure of the global equities markets and includes approximately 11,000 companies in more than 52 countries covering both developed and emerging markets.
YCG Enhanced Fund
EXPENSE EXAMPLE
For the six months ended May 31, 2021 (Unaudited)
As a shareholder of the YCG Enhanced Fund (the “Fund”), you incur ongoing costs, including management fees and other Fund expenses. If you invest through a financial intermediary, you may also incur additional costs such as a transaction fee charged on the purchase or sale of the Fund or an asset-based management fee. This example is intended to help you understand your ongoing costs (in dollars) of investing in the Fund and to compare these costs with the ongoing costs of investing in other mutual funds.
The Example is based on an investment of $1,000 invested at the beginning of the period and held for the entire period from December 1, 2020 to May 31, 2021.
Actual Expenses
The first line of the table on the next page provides information about actual account values and actual expenses. You may use the information provided in this line, together with the amount you invested, to estimate the expenses that you paid over the period. Simply divide your account value by $1,000 (for example, an $8,600 ending account value divided by $1,000 = 8.6), then multiply the result by the number in the first line under the heading entitled “Expenses Paid During the Period” to estimate the expenses you paid on your account during the period.
Hypothetical Example for Comparison Purposes
The second line of the table on the next page provides information about hypothetical account values and hypothetical expenses based on the Fund’s actual expense ratio and an assumed rate of return of 5% per year before expenses, which is not the Fund’s actual return. The hypothetical account values and expenses may not be used to estimate the actual ending account balance or expenses you paid for the period. You may use this information to compare the ongoing costs of investing in the Fund and other funds. To do so, compare this 5% hypothetical example with the 5% hypothetical examples that appear in the shareholder reports of the other funds.
YCG Enhanced Fund
EXPENSE EXAMPLE (continued)
For the six months ended May 31, 2021 (Unaudited)
Please note that the expenses shown in the table are meant to highlight your ongoing costs only and do not reflect any costs that may be associated with investing in the Fund through a financial intermediary. Therefore, the second line of the table is useful in comparing the ongoing costs only, and will not help you determine the relative total costs of owning different funds. In addition, if any costs associated with investing through a financial intermediary were included, your costs would have been higher.
| | | | Expenses Paid |
| | Beginning | Ending | During Period(1) |
| | Account Value | Account Value | 12/1/20 – |
| | 12/1/20 | 5/31/21 | 5/31/21 |
| Actual | $1,000.00 | $1,180.30 | $6.47 |
| Hypothetical (5% return | | | |
| before expenses) | 1,000.00 | 1,019.00 | 5.99 |
(1) | Expenses are equal to the Fund’s annualized expense ratio of 1.19%, multiplied by the average account value over the period, multiplied by 182/365 to reflect the period. |
YCG Enhanced Fund
GROWTH OF $10,000 INVESTMENT
(Unaudited)
This chart assumes an initial gross investment of $10,000 made on December 28, 2012 (commencement of the Fund’s operations). Returns shown include the reinvestment of all dividends. Returns shown do not reflect the deductions of taxes that a shareholder would pay on Fund distributions or the redemption of Fund shares. In the absence of fee waivers and reimbursements, when they are necessary to keep expenses at the expense cap, total return would be reduced. Past performance is not predictive of future performance. Investment return and principal value will fluctuate so that your shares, when redeemed, may be worth more or less than original cost. Index returns do not reflect the effects of fees or expenses. It is not possible to invest directly in an index.
| | | | | Since Inception |
| | One Year | Three Year | Five Year | (12/28/2012) |
| Average Annual Returns | | | | |
| YCG Enhanced Fund | 42.46% | 20.07% | 17.97% | 15.68% |
| S&P 500 Index | 40.32% | 18.00% | 17.16% | 16.23% |
| S&P Global BMI | | | | |
| Total Return Index | 44.27% | 13.98% | 14.62% | 12.01% |
YCG Enhanced Fund
TOP TEN EQUITY HOLDINGS
May 31, 2021 (Unaudited)
| | | Percentage of |
| | | Net Assets |
| MSCI, Inc. | | | 5.60 | % |
| Moody’s Corp. | | | 4.84 | % |
| Microsoft Corp. | | | 4.56 | % |
| MasterCard, Inc. – Class A | | | 4.32 | % |
| Alphabet, Inc. – Class C | | | 4.21 | % |
| CBRE Group, Inc. – Class A | | | 4.03 | % |
| Marsh & McLennan Cos, Inc. | | | 3.64 | % |
| Aon PLC – Class A | | | 3.63 | % |
| Progressive Corp. | | | 3.48 | % |
| NIKE, Inc. – Class B | | | 3.45 | % |
| Total | | | 41.76 | % |
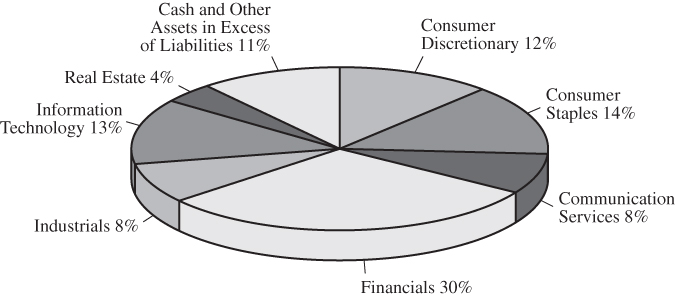
ALLOCATION OF PORTFOLIO HOLDINGS (as a % of net assets)
May 31, 2021 (Unaudited)
For Fund compliance purposes, the Fund’s industry classifications refer to any one or more of the industry sub-classifications used by one or more widely recognized market indexes or ratings group indexes, and/or they may be defined by Fund management. This definition does not apply for all purposes of this report, which may combine sub-classifications for reporting ease. Categories are shown as a percentage of net assets.
YCG Enhanced Fund
SCHEDULE OF INVESTMENTS
May 31, 2021 (Unaudited)
| | | Shares | | | Value | |
| COMMON STOCKS – 89.12% | | | | | | |
| | | | | | | |
| Automobiles – 0.87% | | | | | | |
| Ferrari NV | | | 19,774 | | | $ | 4,170,534 | |
| | | | | | | | | |
| Banks – 6.23% | | | | | | | | |
| Bank of America Corp. | | | 127,297 | | | | 5,396,120 | |
| HDFC Bank Ltd. – ADR (b) | | | 69,216 | | | | 5,297,100 | |
| JPMorgan Chase & Co. | | | 35,532 | | | | 5,835,776 | |
| Wells Fargo & Co. | | | 288,656 | | | | 13,486,008 | |
| | | | | | | | 30,015,004 | |
| | | | | | | | | |
| Beverages – 1.75% | | | | | | | | |
| PepsiCo., Inc. | | | 56,870 | | | | 8,413,348 | |
| | | | | | | | | |
| Capital Markets – 13.37% | | | | | | | | |
| Moody’s Corp. (c) | | | 69,508 | | | | 23,309,508 | |
| MSCI, Inc. | | | 57,630 | | | | 26,978,332 | |
| S&P Global, Inc. (c) | | | 11,256 | | | | 4,271,314 | |
| The Charles Schwab Corp. | | | 132,456 | | | | 9,781,876 | |
| | | | | | | | 64,341,030 | |
| | | | | | | | | |
| Commercial Services & Supplies – 3.23% | | | | | | | | |
| Copart, Inc. (b)(c) | | | 120,695 | | | | 15,570,862 | |
| | | | | | | | | |
| Hotels, Restaurants & Leisure – 1.62% | | | | | | | | |
| Booking Holdings, Inc. (b) | | | 3,294 | | | | 7,778,946 | |
| | | | | | | | | |
| Household Products – 3.43% | | | | | | | | |
| Colgate-Palmolive Co. | | | 99,311 | | | | 8,320,276 | |
| The Procter & Gamble Co. (d) | | | 60,754 | | | | 8,192,677 | |
| | | | | | | | 16,512,953 | |
| | | | | | | | | |
| Insurance – 10.75% | | | | | | | | |
| Aon PLC – Class A (d) | | | 68,979 | | | | 17,477,209 | |
| Marsh & McLennan Cos, Inc. | | | 126,768 | | | | 17,538,353 | |
| The Progressive Corp. | | | 168,897 | | | | 16,734,315 | |
| | | | | | | | 51,749,877 | |
| | | | | | | | | |
| Interactive Media & Services – 7.64% | | | | | | | | |
| Alphabet, Inc. – Class C (b) | | | 8,401 | | | | 20,259,515 | |
| Facebook, Inc. – Class A (b)(c) | | | 50,331 | | | | 16,545,310 | |
| | | | | | | | 36,804,825 | |
See notes to financial statements.
YCG Enhanced Fund
SCHEDULE OF INVESTMENTS (continued)
May 31, 2021 (Unaudited)
| | | Shares | | | Value | |
| COMMON STOCKS – 89.12% (continued) | | | | | | |
| | | | | | | |
| IT Services – 4.98% | | | | | | |
| MasterCard, Inc. – Class A | | | 57,685 | | | $ | 20,800,057 | |
| Visa, Inc. – Class A (c) | | | 13,925 | | | | 3,165,153 | |
| | | | | | | | 23,965,210 | |
| | | | | | | | | |
| Personal Products – 8.84% | | | | | | | | |
| L’Oreal SA (a) | | | 38,547 | | | | 17,465,170 | |
| The Estee Lauder Companies, Inc. – Class A | | | 53,853 | | | | 16,507,021 | |
| Unilever PLC – ADR | | | 143,369 | | | | 8,597,839 | |
| | | | | | | | 42,570,030 | |
| | | | | | | | | |
| Professional Services – 4.69% | | | | | | | | |
| CoStar Group, Inc. (b)(c) | | | 9,089 | | | | 7,762,006 | |
| Verisk Analytics, Inc. (c) | | | 85,668 | | | | 14,806,000 | |
| | | | | | | | 22,568,006 | |
| | | | | | | | | |
| Real Estate Management & Development – 4.03% | | | | | | | | |
| CBRE Group, Inc. – Class A (b) | | | 220,838 | | | | 19,385,160 | |
| | | | | | | | | |
| Software – 7.53% | | | | | | | | |
| Adobe, Inc. (b)(c) | | | 12,828 | | | | 6,472,752 | |
| Intuit, Inc. (c) | | | 17,911 | | | | 7,864,541 | |
| Microsoft Corp. (c) | | | 87,856 | | | | 21,935,886 | |
| | | | | | | | 36,273,179 | |
| | | | | | | | | |
| Technology Hardware, Storage & Peripherals – 1.08% | | | | | | | | |
| Apple, Inc. (c) | | | 41,807 | | | | 5,209,570 | |
| | | | | | | | | |
| Textiles, Apparel & Luxury Goods – 9.08% | | | | | | | | |
| Adidas AG (a) | | | 18,342 | | | | 6,695,622 | |
| Hermes International (a) | | | 7,496 | | | | 10,457,324 | |
| LVMH Moet Hennessy Louis Vuitton SE (a) | | | 12,432 | | | | 9,942,083 | |
| NIKE, Inc. – Class B | | | 121,659 | | | | 16,601,587 | |
| | | | | | | | 43,696,616 | |
| TOTAL COMMON STOCKS (Cost $218,846,125) | | | | | | | 429,025,150 | |
See notes to financial statements.
YCG Enhanced Fund
SCHEDULE OF INVESTMENTS (continued)
May 31, 2021 (Unaudited)
| | | Principal | | | | |
| | | Amount | | | Value | |
| SHORT-TERM INVESTMENTS – 8.44% | | | | | | |
| U.S. Treasury Bills – 8.44% | | | | | | |
| 0.007%, 06/24/2021 (e) | | $ | 198,000 | | | $ | 197,994 | |
| 0.008%, 07/08/2021 (e) | | | 1,706,000 | | | | 1,705,934 | |
| 0.004%, 07/29/2021 (e) | | | 527,000 | | | | 526,996 | |
| 0.012%, 08/05/2021 (e) | | | 18,408,000 | | | | 18,407,751 | |
| 0.012%, 08/12/2021 (e) | | | 314,000 | | | | 313,994 | |
| 0.011%, 08/19/2021 (e) | | | 1,354,000 | | | | 1,353,985 | |
| 0.015%, 08/26/2021 (e) | | | 324,000 | | | | 323,994 | |
| 0.015%, 09/02/2021 (e) | | | 444,000 | | | | 443,991 | |
| 0.008%, 09/16/2021 (e) | | | 621,000 | | | | 620,991 | |
| 0.009%, 09/30/2021 (e) | | | 9,302,000 | | | | 9,301,609 | |
| 0.013%, 10/07/2021 (e) | | | 3,253,000 | | | | 3,252,870 | |
| 0.012%, 10/14/2021 (e) | | | 1,026,000 | | | | 1,025,952 | |
| 0.009%, 10/21/2021 (e) | | | 138,000 | | | | 137,993 | |
| 0.013%, 10/28/2021 (e) | | | 498,000 | | | | 497,974 | |
| 0.012%, 11/04/2021 (e) | | | 1,022,000 | | | | 1,021,934 | |
| 0.005%, 11/12/2021 (e) | | | 1,442,000 | | | | 1,441,901 | |
| 0.010%, 11/18/2021 (e) | | | 30,000 | | | | 29,997 | |
| 0.001%, 11/26/2021 (e) | | | 7,000 | | | | 7,000 | |
| TOTAL SHORT-TERM INVESTMENTS (Cost $40,612,018) | | | | | | | 40,612,860 | |
| Total Investments (Cost $259,458,143) – 97.56% | | | | | | | 469,638,010 | |
| Other Assets in Excess of Liabilities – 2.44% | | | | | | | 11,737,136 | |
| TOTAL NET ASSETS – 100.00% | | | | | | $ | 481,375,146 | |
Percentages are stated as a percent of net assets.
| ADR | American Depositary Receipt |
| PLC | Public Limited Company |
| (a) | Foreign issued security. |
| (b) | Non-income producing. |
| (c) | Security held in connection with options written. |
| (d) | A portion of this security is pledged as collateral on options written. As of May 31, 2021, the value of collateral is $10,500,394. |
| (e) | Reflects the annualized yield on the date of purchase for discounted investments. |
The Global Industry Classification Standard (GICS®) was developed by and/or is the exclusive property of MSCI, Inc. (“MSCI”) and Standard & Poor Financial Services LLC (“S&P”). GICS is a service mark of MSCI and S&P and has been licensed for use by U.S. Bank Global Fund Services.
See notes to financial statements.
YCG Enhanced Fund
SCHEDULE OF OPTIONS WRITTEN
May 31, 2021 (Unaudited)
| | | | | | Notional | | | | |
| | | Contracts | | | Amount | | | Value | |
PUT OPTIONS(a) | | | | | | | | | |
| Adobe, Inc. | | | | | | | | | |
| Expiration: July 2021; | | | | | | | | | |
| Exercise Price: $520.00 | | | 30 | | | $ | 1,560,000 | | | $ | 76,950 | |
| Expiration: July 2021; | | | | | | | | | | | | |
| Exercise Price: $525.00 | | | 120 | | | | 6,300,000 | | | | 344,880 | |
| Expiration: August 2021; | | | | | | | | | | | | |
| Exercise Price: $480.00 | | | 20 | | | | 960,000 | | | | 28,800 | |
| Apple, Inc. | | | | | | | | | | | | |
| Expiration: July 2021; | | | | | | | | | | | | |
| Exercise Price: $135.00 | | | 435 | | | | 5,872,500 | | | | 476,325 | |
| Copart, Inc. | | | | | | | | | | | | |
| Expiration: August 2021; | | | | | | | | | | | | |
| Exercise Price: $130.00 | | | 340 | | | | 4,420,000 | | | | 217,600 | |
| CoStar Group, Inc. | | | | | | | | | | | | |
| Expiration: July 2021; | | | | | | | | | | | | |
| Exercise Price: $820.00 | | | 3 | | | | 246,000 | | | | 4,575 | |
| Expiration: July 2021; | | | | | | | | | | | | |
| Exercise Price: $850.00 | | | 4 | | | | 340,000 | | | | 10,400 | |
| Expiration: July 2021; | | | | | | | | | | | | |
| Exercise Price: $900.00 | | | 16 | | | | 1,440,000 | | | | 90,400 | |
| Facebook, Inc. | | | | | | | | | | | | |
| Expiration: June 2021; | | | | | | | | | | | | |
| Exercise Price: $295.00 | | | 27 | | | | 796,500 | | | | 1,971 | |
| Intuit, Inc. | | | | | | | | | | | | |
| Expiration: July 2021; | | | | | | | | | | | | |
| Exercise Price: $420.00 | | | 170 | | | | 7,140,000 | | | | 132,600 | |
| Microsoft Corp. | | | | | | | | | | | | |
| Expiration: June 2021; | | | | | | | | | | | | |
| Exercise Price: $235.00 | | | 235 | | | | 5,522,500 | | | | 21,150 | |
| Moody’s Corp. | | | | | | | | | | | | |
| Expiration: June 2021; | | | | | | | | | | | | |
| Exercise Price: $330.00 | | | 24 | | | | 792,000 | | | | 8,040 | |
See notes to financial statements.
YCG Enhanced Fund
SCHEDULE OF OPTIONS WRITTEN (continued)
May 31, 2021 (Unaudited)
| | | | | | Notional | | | | |
| | | Contracts | | | Amount | | | Value | |
PUT OPTIONS(a) (continued) | | | | | | | | | |
| S&P Global, Inc. | | | | | | | | | |
| Expiration: June 2021; | | | | | | | | | |
| Exercise Price: $350.00 | | | 10 | | | $ | 350,000 | | | $ | 650 | |
| Expiration: July 2021; | | | | | | | | | | | | |
| Exercise Price: $390.00 | | | 208 | | | | 8,112,000 | | | | 350,480 | |
| Verisk Analytics, Inc. | | | | | | | | | | | | |
| Expiration: August 2021; | | | | | | | | | | | | |
| Exercise Price: $175.00 | | | 180 | | | | 3,150,000 | | | | 147,600 | |
| Visa, Inc. – Class A | | | | | | | | | | | | |
| Expiration: June 2021; | | | | | | | | | | | | |
| Exercise Price: $215.00 | | | 350 | | | | 7,525,000 | | | | 33,600 | |
| Total Options Written | | | | | | | | | | | | |
| (Premiums received $3,152,037) | | | | | | | | | | $ | 1,946,021 | |
See notes to financial statements.
YCG Enhanced Fund
STATEMENT OF ASSETS AND LIABILITIES
May 31, 2021 (Unaudited)
| ASSETS: | | | |
| Investments, at value (Cost $259,458,143) | | $ | 469,638,010 | |
| Foreign currency, at value (Cost $1,996,184) | | | 2,152,741 | |
| Cash | | | 1,341 | |
| Deposits with brokers for options written | | | 11,579,302 | |
| Receivable for Fund shares sold | | | 90,235 | |
| Dividends and interest receivable | | | 391,123 | |
| Prepaid expenses | | | 31,720 | |
| Total Assets | | | 483,884,472 | |
| | | | | |
| LIABILITIES: | | | | |
| Options written, at value (Premiums received $3,152,037) | | | 1,946,021 | |
| Payable for Fund shares redeemed | | | 54,776 | |
| Payable to investment advisor | | | 405,839 | |
| Payable to custodian | | | 5,250 | |
| Other accrued expenses | | | 97,440 | |
| Total Liabilities | | | 2,509,326 | |
| NET ASSETS | | $ | 481,375,146 | |
| | | | | |
| NET ASSETS CONSIST OF: | | | | |
| Capital stock | | $ | 254,725,424 | |
| Total distributable earnings (accumulated deficit) | | | 226,649,722 | |
| Total Net Assets | | $ | 481,375,146 | |
| Shares outstanding (unlimited shares of no par value authorized) | | | 17,100,897 | |
| | | | | |
| NET ASSET VALUE, OFFERING AND | | | | |
REDEMPTION PRICE PER SHARE(a) | | $ | 28.15 | |
(a) | A redemption fee of 2.00% is assessed against shares redeemed within 30 days of purchase. See Note 2(i). |
See notes to financial statements.
YCG Enhanced Fund
STATEMENT OF OPERATIONS
For the six-months ended May 31, 2021 (Unaudited)
| INVESTMENT INCOME: | | | |
Dividend income(a) | | $ | 2,606,243 | |
| Interest income | | | 6,030 | |
| Total Investment Income | | | 2,612,273 | |
| EXPENSES: | | | | |
| Investment advisory fees | | | 2,206,403 | |
| Administration fees | | | 82,532 | |
| Shareholder service fees | | | 80,754 | |
| Transfer agent fees and expenses | | | 58,704 | |
| Accounting fees | | | 48,586 | |
| Federal and state registration fees | | | 35,412 | |
| Legal fees | | | 34,688 | |
| Compliance fees | | | 29,916 | |
| Custody fees | | | 17,372 | |
| Trustees fees and expenses | | | 10,374 | |
| Audit and tax fees | | | 8,398 | |
| Insurance fees | | | 5,830 | |
| Reports to Shareholders | | | 5,560 | |
| Miscellaneous expenses | | | 644 | |
| Total expenses before reimbursements/recoupments | | | 2,625,173 | |
| Expense recoupment (reimbursement) | | | | |
| by investment advisor (see Note 4) | | | 446 | |
| Net Expenses | | | 2,625,619 | |
| NET INVESTMENT INCOME (LOSS) | | | (13,346 | ) |
| REALIZED AND UNREALIZED GAIN (LOSS): | | | | |
| Net realized gain (loss) on | | | | |
| Investments | | | 9,979,102 | |
| Options written | | | 5,520,255 | |
| Foreign currency transactions | | | 20,391 | |
| Net change in unrealized appreciation (depreciation) on | | | | |
| Investments | | | 58,298,892 | |
| Options written | | | (72,683 | ) |
| Foreign currency transactions | | | 114,984 | |
| Net realized and unrealized gain (loss) on investments | | | 73,860,941 | |
| NET INCREASE (DECREASE) IN NET ASSETS | | | | |
| RESULTING FROM OPERATIONS | | $ | 73,847,595 | |
(a) | Net of $(59,273) in foreign withholding taxes and fees. |
See notes to financial statements.
YCG Enhanced Fund
STATEMENTS OF CHANGES IN NET ASSETS
| | | Six-Months Ended | | | | |
| | | May 31, 2021 | | | Year Ended | |
| | | (Unaudited) | | | November 30, 2020 | |
| OPERATIONS: | | | | | | |
| Net investment income (loss) | | $ | (13,346 | ) | | $ | (505,939 | ) |
| Net realized gain (loss) on investments | | | | | | | | |
| and options written | | | 15,519,748 | | | | (19,540 | ) |
| Net change in unrealized appreciation | | | | | | | | |
| (depreciation) on investments | | | | | | | | |
| and options written | | | 58,341,193 | | | | 57,390,754 | |
| Net increase (decrease) in net assets | | | | | | | | |
| resulting from operations | | | 73,847,595 | | | | 56,865,275 | |
| | | | | | | | | |
| CAPITAL SHARE TRANSACTIONS: | | | | | | | | |
| Proceeds from shares sold | | | 21,200,985 | | | | 146,143,174 | |
| Proceeds from reinvestment of distributions | | | — | | | | 1,689,631 | |
| Redemption fees | | | 2,137 | | | | 45,166 | |
| Payment for shares redeemed | | | (27,229,044 | ) | | | (106,820,398 | ) |
| Net increase (decrease) | | | (6,025,922 | ) | | | 41,057,573 | |
| | | | | | | | | |
| DISTRIBUTIONS TO SHAREHOLDERS: | | | | | | | | |
| Distributions to shareholders | | | — | | | | (1,852,171 | ) |
| | | | | | | | | |
| TOTAL INCREASE (DECREASE) | | | | | | | | |
| IN NET ASSETS | | | 67,821,673 | | | | 96,070,677 | |
| | | | | | | | | |
| NET ASSETS: | | | | | | | | |
| Beginning of period | | | 413,553,473 | | | | 317,482,796 | |
| End of period | | $ | 481,375,146 | | | $ | 413,553,473 | |
| | | | | | | | | |
| CHANGE IN SHARES OUTSTANDING: | | | | | | | | |
| Shares sold | | | 832,302 | | | | 7,576,427 | |
| Issued in reinvestment of distributions | | | — | | | | 79,625 | |
| Shares redeemed | | | (1,072,267 | ) | | | (5,471,065 | ) |
| Net increase (decrease) | | | (239,965 | ) | | | 2,184,987 | |
See notes to financial statements.
YCG Enhanced Fund
FINANCIAL HIGHLIGHTS
For a Fund share outstanding throughout the period
| | | Six-Months | | | | | | | | | | | | | | | | |
| | | Ended | | | | | | | | | | | | | | | | |
| | | May 31, 2021 | | | Year Ended November 30, | |
| | | (Unaudited) | | | 2020 | | | 2019 | | | 2018 | | | 2017 | | | 2016 | |
| NET ASSET VALUE: | | | | | | | | | | | | | | | | | | |
| Beginning of period | | $ | 23.85 | | | $ | 20.95 | | | $ | 16.99 | | | $ | 16.60 | | | $ | 14.00 | | | $ | 13.73 | |
| | | | | | | | | | | | | | | | | | | | | | | | | |
| OPERATIONS: | | | | | | | | | | | | | | | | | | | | | | | | |
| Net investment | | | | | | | | | | | | | | | | | | | | | | | | |
| income (loss) | | | — | (a) | | | (0.03 | ) | | | 0.02 | | | | 0.06 | | | | 0.07 | | | | 0.08 | |
| Net realized and | | | | | | | | | | | | | | | | | | | | | | | | |
| unrealized gain (loss) | | | | | | | | | | | | | | | | | | | | | | | | |
| on investment securities | | | 4.30 | | | | 3.05 | | | | 4.48 | | | | 0.93 | | | | 3.00 | | | | 0.48 | |
| Total from | | | | | | | | | | | | | | | | | | | | | | | | |
| investment operations | | | 4.30 | | | | 3.02 | | | | 4.50 | | | | 0.99 | | | | 3.07 | | | | 0.56 | |
| Redemption fee proceeds | | | — | (a) | | | — | (a) | | | — | (a) | | | — | (a) | | | — | (a) | | | — | (a) |
| Dividends from net | | | | | | | | | | | | | | | | | | | | | | | | |
| investment income | | | — | | | | (0.01 | ) | | | (0.06 | ) | | | (0.07 | ) | | | (0.08 | ) | | | (0.06 | ) |
| Dividends from | | | | | | | | | | | | | | | | | | | | | | | | |
| net realized gains | | | — | | | | (0.11 | ) | | | (0.48 | ) | | | (0.53 | ) | | | (0.39 | ) | | | (0.23 | ) |
| Total distributions | | | — | | | | (0.12 | ) | | | (0.54 | ) | | | (0.60 | ) | | | (0.47 | ) | | | (0.29 | ) |
| NET ASSET VALUE: | | | | | | | | | | | | | | | | | | | | | | | | |
| End of period | | $ | 28.15 | | | $ | 23.85 | | | $ | 20.95 | | | $ | 16.99 | | | $ | 16.60 | | | $ | 14.00 | |
| | | | | | | | | | | | | | | | | | | | | | | | | |
| TOTAL RETURN | | | 18.03 | %(b) | | | 14.49 | % | | | 27.74 | % | | | 6.08 | % | | | 22.58 | % | | | 4.11 | % |
| | | | | | | | | | | | | | | | | | | | | | | | | |
| SUPPLEMENTAL | | | | | | | | | | | | | | | | | | | | | | | | |
| DATA AND RATIOS: | | | | | | | | | | | | | | | | | | | | | | | | |
| Net assets; | | | | | | | | | | | | | | | | | | | | | | | | |
| end of period (000’s) | | $ | 481,375 | | | $ | 413,553 | | | $ | 317,483 | | | $ | 201,576 | | | $ | 142,099 | | | $ | 109,568 | |
| Ratio of expenses to | | | | | | | | | | | | | | | | | | | | | | | | |
| average net assets: | | | | | | | | | | | | | | | | | | | | | | | | |
| Expenses including | | | | | | | | | | | | | | | | | | | | | | | | |
| reimbursement (recapture) | | | 1.19 | %(c) | | | 1.19 | % | | | 1.19 | % | | | 1.19 | % | | | 1.19 | % | | | 1.24 | %(d) |
| Expenses excluding | | | | | | | | | | | | | | | | | | | | | | | | |
| reimbursement (recapture) | | | 1.19 | %(c) | | | 1.19 | % | | | 1.20 | % | | | 1.24 | % | | | 1.34 | % | | | 1.36 | % |
| Net investment income | | | | | | | | | | | | | | | | | | | | | | | | |
| (loss) including | | | | | | | | | | | | | | | | | | | | | | | | |
| reimbursement (recapture) | | | (0.01 | )%(c) | | | (0.14 | )% | | | 0.09 | % | | | 0.37 | % | | | 0.47 | % | | | 0.58 | % |
| Net investment income | | | | | | | | | | | | | | | | | | | | | | | | |
| (loss) excluding | | | | | | | | | | | | | | | | | | | | | | | | |
| reimbursement (recapture) | | | (0.01 | )%(c) | | | (0.14 | )% | | | 0.08 | % | | | 0.32 | % | | | 0.32 | % | | | 0.46 | % |
| Portfolio turnover rate | | | 5 | %(b) | | | 44 | % | | | 6 | % | | | 21 | % | | | 16 | % | | | 24 | % |
(a) | Amount represents less than $0.01 per share. |
(b) | Not Annualized. |
(c) | Annualized. |
(d) | See Note 4. |
See notes to financial statements.
YCG Enhanced Fund
NOTES TO FINANCIAL STATEMENTS
May 31, 2021 (Unaudited)
YCG Funds (the “Trust”) is a Delaware statutory trust organized under an Agreement and Declarations of Trust dated September 4, 2012. The Trust is an open-end management investment company, as defined in the Investment Company Act of 1940 (the “1940 Act”), as amended. The Trust consists of one series, YCG Enhanced Fund (the “Fund”). The Fund is classified and operates as a non-diversified fund under the 1940 Act. The Fund commenced operations on December 28, 2012. The Fund’s investment adviser is YCG, LLC (the “Adviser”). There are an unlimited number of authorized shares. The investment objective of the Fund is to maximize long-term capital appreciation with reasonable investment risk.
| 2. | SUMMARY OF SIGNIFICANT ACCOUNTING POLICIES |
The following is a summary of significant accounting policies consistently followed by the Fund in the preparation of its financial statements. The financial statements have been prepared in conformity with accounting principles generally accepted in the United States of America (“GAAP”). The Fund is an investment company and accordingly follows the investment company accounting and reporting guidance of the Financial Accounting Standards Board (“FASB”) Accounting Standards Codification (“ASC”) Topic 946 Financial Services – Investment Companies.
a) Subsequent Events Evaluation – In preparing these financial statements, the Fund has evaluated events and transactions for potential recognition or disclosure resulting from subsequent events through the date the financial statements were issued. This evaluation did not result in any subsequent events that necessitated disclosures and/or adjustments other than noted below.
b) Foreign Currency – Investment securities and other assets and liabilities denominated in foreign currencies are translated into U.S. dollar amounts at the date of valuation. Purchases and sales of investment securities and income and expense items denominated in foreign currencies are translated into U.S. dollar amounts on the respective dates of such transactions. The Fund does not isolate that portion of the results of operations resulting from changes in foreign exchange rates on investments and currency gains or losses realized between the trade and settlement dates on securities transactions from the fluctuations arising from changes in market prices of securities held. Such fluctuations are included with the net realized and unrealized gain or loss from investments. Reported net realized foreign exchange gains or losses that arise from sales of foreign currencies, currency gains or losses realized between the trade and settlement dates on foreign currency transactions, and the difference between the amounts of dividends, interest, and foreign withholding taxes recorded on the Fund’s books and the U.S. dollar equivalent of the amounts
YCG Enhanced Fund
NOTES TO FINANCIAL STATEMENTS (continued)
May 31, 2021 (Unaudited)
actually received or paid. Net unrealized foreign exchange gains and losses arise from changes in the values of assets and liabilities, other than investments in securities at fiscal period end, resulting from changes in exchange rates.
c) Investment Valuation – The Fund’s investments are valued at fair value. Fair value as used for determining the Fund’s net asset value is in contrast to the use of the term “fair value” for making valuation measurements in connection with preparing the Fund’s financial statements, as discussed below under “Valuation Measurements.” FASB Accounting Standard Codification Topic 820: Fair Value Measurement uses the term “fair value” to refer generally to the value of an asset or liability, regardless of whether that value is based on readily available market quotations or on other inputs.
Securities which are traded on a national stock exchange are valued at the last sale price on the securities exchange on which such securities are primarily traded. Securities that are traded on The Nasdaq OMX Group, Inc., referred to as Nasdaq, are valued at the Nasdaq Official Closing Price. Exchange-traded securities for which there were no transactions are valued at the current bid prices. Securities traded on only over-the-counter markets are valued on the basis of closing over-the-counter bid prices. Short-term debt instruments maturing within 60 days are valued by the amortized cost method, which approximates fair value. Amortized cost is not used if its use would be inappropriate due to credit or other impairments of the issuer, in which case the security’s fair value would be determined, as described below. Debt securities (other than those valued using the amortized cost method) are valued at the market price furnished by a national pricing service, if available, and otherwise at the most recent bid quotation or evaluated price, subject to review by the Adviser and determination of the appropriate price whenever a furnished price is significantly different from the previous day’s furnished price. Options written or purchased by the Fund are valued at the last sales price. If there are no trades for an option on a given day, options are valued at the mean between the current bid and asked prices. If market quotations are not readily available for a security or if a security’s value has been materially affected by events occurring after the close of the exchange or market on which the security is principally traded, then that security may be valued by another method that the Board of Trustees believes accurately reflects fair value. A security’s valuation may differ depending on the method used for determining fair value. Fair value in this context is the value of securities for which no readily available market quotations exist, as determined in good faith by the Adviser pursuant to procedures established by and under the supervision of the Board.
YCG Enhanced Fund
NOTES TO FINANCIAL STATEMENTS (continued)
May 31, 2021 (Unaudited)
Valuation Measurements
The Fund has adopted authoritative fair valuation accounting standards which establish an authoritative definition of fair value and set out a hierarchy for measuring fair value. These standards require additional disclosures about the various inputs and valuation techniques used to develop the measurements of fair value and a discussion of changes in valuation techniques and related inputs, if any, during the period. In addition, these standards require expanded disclosure for each major category of assets. These inputs are summarized in the three broad levels listed below:
| Level 1 – | Quoted prices in active markets for identical securities. |
| | |
| Level 2 – | Other significant observable inputs (including quoted prices for similar securities, interest rates, prepayment speeds, credit risk, etc.) |
| | |
| Level 3 – | Significant unobservable inputs (including the Fund’s own assumptions in determining the fair value of investments). |
The inputs or methodology used for valuing securities are not an indication of the risk associated with investing in those securities. The following is a summary of the inputs used to value the Fund’s investments as of May 31, 2021:
| | | Level 1 | | | Level 2 | | | Level 3 | | | Total | |
Assets | | | | | | | | | | | | |
| Common Stocks* | | $ | 413,481,978 | | | $ | 15,543,172 | | | $ | — | | | $ | 429,025,150 | |
| Short-Term Investments | | | — | | | | 40,612,860 | | | | — | | | | 40,612,860 | |
| Total Investments | | | | | | | | | | | | | | | | |
| in Securities | | $ | 413,481,978 | | | $ | 56,156,032 | | | $ | — | | | $ | 469,638,010 | |
Liabilities | | | | | | | | | | | | | | | | |
| Other Financial | | | | | | | | | | | | | | | | |
| Instruments** | | | | | | | | | | | | | | | | |
| Options Written | | $ | 1,482,126 | | | $ | 463,895 | | | $ | — | | | $ | 1,946,021 | |
| * | | Please refer to the schedule of investments to view securities by industry type. |
| ** | | Other Financial Instruments are derivative instruments not reflected in the Schedule of Investments, such as options written, which are reflected at value. |
The Fund did not invest in any Level 3 investments during the year.
d) Option Writing – The Fund may write covered call options and put options on a substantial portion of the Fund’s long equity portfolio as a means to generate additional income and to tax-efficiently enter and exit positions. The Fund will not use this strategy as a means of generating implicit leverage. In other words, if all put options were to be exercised, the Fund will generally have enough cash on hand to purchase the assigned shares. When the Fund writes an option, an amount equal to the premium received by the Fund is recorded as a liability and is subsequently adjusted to the current fair value of the option written. Premiums received from writing options that expire unexercised are treated by the Fund on the expiration date
YCG Enhanced Fund
NOTES TO FINANCIAL STATEMENTS (continued)
May 31, 2021 (Unaudited)
as realized gains from options written. The difference between the premium and the amount paid on effecting a closing purchase transaction, including brokerage commissions, is also treated as a realized gain, or, if the premium is less than the amount paid for the closing purchase transaction, as a realized loss. If a call option is exercised, the premium is added to the proceeds from the sale of the underlying security in determining whether the Fund has realized a gain or loss. If a put option is exercised, the premium reduces the cost basis of the securities purchased by the Fund. The Fund, as a writer of an option, bears the market risk of an unfavorable change in the price of the security underlying the written option. Upon writing an option, the Fund is required to pledge an amount of cash or securities, as determined by the broker, as collateral. As of May 31, 2021, the Fund held securities with a value of $10,500,394 and cash of $11,579,302 as collateral for options written. During the period, the Fund used written covered call and put options in a manner consistent with the strategy described above.
The value of Derivative Instruments on the Statement of Assets and Liabilities as of May 31, 2021, are as follows:
| | Liability Derivatives | |
| Derivatives not | | | |
| accounted for as | | | |
| hedging instruments | Location | Value | |
| Equity Contracts – Options | Options written, at value | $1,946,021 | |
The effect of Derivative Instruments on the Statement of Operations for the period ended May 31, 2021, are as follows:
| Amount of Realized Gain on | Change in Unrealized Depreciation |
| Derivatives Recognized in Income | on Derivatives Recognized in Income |
Derivatives not | | Derivatives not | |
accounted for as | Options | accounted for as | Options |
hedging instruments | Written | hedging instruments | Written |
Equity Contracts | $5,520,255 | Equity Contracts | $72,683 |
The average monthly value of options written during the period ended May 31, 2021 was $1,835,823.
Derivative Risks
The risks of using the various types of derivatives in which the Fund may engage include the risk that movements in the value of the derivative may not fully offset or complement instruments currently held in the Fund in the manner intended by the Adviser, the risk that the counterparty to a derivative contract may fail to comply with its obligations to the Fund, the risk that there may not be a liquid secondary market for the derivative at a time when the Fund would look to disengage the
YCG Enhanced Fund
NOTES TO FINANCIAL STATEMENTS (continued)
May 31, 2021 (Unaudited)
position, the risk that additional capital from the Fund may be called upon to fulfill the conditions of the derivative contract, the risk that the use of derivatives may induce leverage in the Fund, and the risk that the cost of the derivative may reduce the overall returns experience by the Fund.
Offsetting Assets and Liabilities
The Fund is subject to various Master Netting Arrangements, which govern the terms of certain transactions with select counterparties. The Master Netting Arrangements allow the Fund to close out and net its total exposure to a counterparty in the event of a default with respect to all the transactions governed under a single agreement with a counterparty. The Master Netting Arrangements also specify collateral posting arrangements at pre-arranged exposure levels. Under the Master Netting Arrangements, collateral is routinely transferred if the total net exposure to certain transactions (net of existing collateral already in place) governed under the relevant Master Netting Arrangement with a counterparty in a given account exceeds a specified threshold depending on the counterparty and the type of Master Netting Arrangement.
The following is a summary of the Assets and Liabilities subject to offsetting in the Fund as of May 31, 2021:
| Liabilities | | | | Gross Amounts Not | |
| | | | | Offset in the Statement | |
| | | | | of Assets and Liabilities | |
| | | Gross | Net | | | |
| | | Amounts | Amounts | | | |
| | | Offset | Presented | | | |
| | Gross | in the | in the | | | |
| | Amounts | Statement | Statement | | | |
| | of | of Assets | of Assets | | | |
| Description / | Recognized | and | and | Financial | Collateral | Net |
| Counterparty | Liabilities | Liabilities | Liabilities | Instruments | Pledged | Amount |
Options Written | | | | | | |
Interactive Brokers | $1,946,021 | $— | $1,946,021 | $— | $1,946,021 | $— |
In some instances, the collateral amounts disclosed in the tables were adjusted due to the requirement to limit the collateral amounts to avoid the effect of overcollateralization. Actual collateral received/pledged may be more than the amounts disclosed herein.
e) Federal Income Taxes – The Fund intends to qualify as a “regulated investment company” under Subchapter M of the Internal Revenue Code of 1986, as amended. If so qualified, the Fund will not be subject to federal income tax to the extent it distributes substantially all of its net investment income and capital gains to shareholders. Therefore, no federal income tax provision is required.
The Fund has adopted financial reporting rules regarding recognition and measurement of tax positions taken or expected to be taken on a tax return. The
YCG Enhanced Fund
NOTES TO FINANCIAL STATEMENTS (continued)
May 31, 2021 (Unaudited)
Fund recognizes interest and penalties, if any, related to unrecognized tax benefits as income tax expense in the Statement of Operations. During the year, the Fund did not incur any interest or penalties. As of and during the six months ended May 31, 2021, the Fund did not have any liabilities for unrecognized tax benefits.
The Fund is not subject to examination by U.S. tax authorities for tax years prior to the period ended November 30, 2017.
f) Distributions to Shareholders – The Fund will declare and distribute any net investment income and any net realized long or short-term capital gains annually. Distributions to shareholders are recorded on the ex-dividend date. The character of distributions made during the year from net investment income or net realized gains may differ from the characterization for federal income tax purposes due to differences in the recognition of income, expense and gain items for financial statement and tax purposes. Where appropriate, reclassifications between capital accounts are made for such differences that are permanent in nature.
g) Use of Estimates – The preparation of the financial statements in conformity with GAAP requires management to make estimates and assumptions that affect the reported amounts of assets and liabilities and disclosure of contingent assets and liabilities at the date of the financial statements and the reported amounts of increases and decreases in net assets from operations during the reporting period. Actual results could differ from those estimates.
h) Guarantees and Indemnifications – Under the Fund’s organizational documents, its officers and trustees are indemnified by the Fund against certain liabilities arising out of the performance of their duties to the Fund. Additionally, in the normal course of business, the Fund enters into contracts with service providers that contain general indemnification clauses. The Fund’s maximum exposure under these arrangements is unknown as this would involve future claims against the Fund that have not yet occurred. Currently, the Fund expects the risk of loss to be remote.
i) Redemption Fee – Those who buy and sell the Fund within 30 calendar days will incur a 2% redemption fee, retained for the benefit of long-term shareholders, recorded as additional capital in the Statement of Changes in Net Assets.
j) Beneficial Ownership – The beneficial ownership, either directly or indirectly, of more than 25% of the voting securities of a fund creates a presumption of control of the Fund, under Section 2(a)(9) of the 1940 Act. At May 31, 2021, no shareholder held more than 25% of the outstanding shares of the YCG Enhanced Fund.
k) Other – Investment transactions and shareholder transactions are accounted for on the trade date. Net realized gains and losses on securities are computed on the basis of specific identification. Dividend income is recognized on the ex-dividend date and interest income is recognized on an accrual basis. Discounts and premiums on securities purchased are accreted and amortized over the lives of the respective securities.
YCG Enhanced Fund
NOTES TO FINANCIAL STATEMENTS (continued)
May 31, 2021 (Unaudited)
Withholding taxes on foreign dividends have been provided for in accordance with the Fund’s understanding of the applicable country’s tax rules and regulations.
| 3. | INVESTMENT TRANSACTIONS |
For the period ended May 31, 2021, the aggregate purchases and sales of securities, excluding short-term securities, were $18,971,950 and $26,708,610 respectively for the Fund. For the period ended May 31, 2021, there were no long-term purchases or sales of U.S. Government securities for the Fund.
| 4. | COMMITMENTS AND OTHER RELATED PARTY TRANSACTIONS |
The Adviser acts as the investment adviser to the Fund pursuant to an investment advisory agreement (the “Advisory Agreement”) which has been approved by the Board (including a majority of the Trustees who are not parties to the Advisory Agreement, or interested persons of any such party). Under the terms of the Advisory Agreement between the Fund and the Adviser, the Adviser conducts investment research and management for the Fund and is responsible for the purchase and sale of securities for the Fund’s investment portfolio. The Adviser provides the Fund with investment advice, supervises the management and investment programs and provides investment advisory facilities and executive and supervisory personnel for managing the investments and effectuating portfolio transactions. The Adviser also furnishes, at its own expense, all necessary administrative services, office space, equipment and clerical personnel for servicing the investments of the Fund. With the exception of the Chief Compliance Officer, who became an employee of the Advisor in March 2020, such officers receive no compensation from the Fund for serving in their respective roles. The Fund makes reimbursement payments to the Advisor for the salary and benefits associated with the office of the Chief Compliance Officer. The compliance fees expensed by the Fund during the period ended May 31, 2021, are included in the Statement of Operations. Under the Advisory Agreement, the monthly compensation paid to the Adviser is accrued daily at an annual rate of 1.00% on the average daily net assets of the Fund.
In the interest of limiting the expenses of the Fund, the Adviser has entered into a contractual expense limitation agreement with the Fund. Pursuant to the Expense Limitation Agreement, the Adviser (for the lifetime of the Fund) has agreed to waive or limit its fees and assume other expenses of the Fund (excluding interest, taxes, brokerage commissions and dividend expenses on securities sold short and extraordinary expenses not incurred in the ordinary course of business) so that the Fund’s ratio of total annual operating expenses is limited to 1.39%. In addition to the lifetime limit, the Adviser has agreed to reimburse the Fund to the extent necessary to ensure that total annual fund operating expenses to do not exceed 1.19% at least through April 1, 2022. The Adviser is entitled to the reimbursement of fees waived or reimbursed by the Adviser to the Fund subject to the limitations that (1) the
YCG Enhanced Fund
NOTES TO FINANCIAL STATEMENTS (continued)
May 31, 2021 (Unaudited)
reimbursement is made only for fees and expenses incurred not more than thirty-six months following the month in which the reimbursement occurred, and (2) the reimbursement may not be made if it would cause the Fund’s annual expense limitation to be exceeded. The reimbursement amount may not include any additional charges or fees, such as interest accruable on the reimbursement account. During the period ended May 31, 2021, the Fund reimbursed $4,436 of previously waived expenses but also waived $3,990 to the Adviser. As of May 31, 2021, the following expenses are subject to recoupment by the Adviser:
| | Year Ending | Year Ending | Year Ending | Year Ending | |
| | November 30, 2021 | November 30, 2022 | November 30, 2023 | November 30, 2024 | Total |
YCG | $55,289 | $41,779 | $74,305 | $3,990 | $175,363 |
Certain officers, trustees and shareholders of the Fund are also owners or employees of the Adviser.
Vigilant Distributors, LLC, previously Herald Investment Marketing, LLC, acted as the Fund’s principal underwriter in a continuous public offering of the Fund’s shares during the period from January 4, 2021 through May 31, 2021. Prior to January 4, 2021, Quasar Distributors, LLC, (“Quasar”) acted as the Fund's principal underwriter.
The Fund has entered into Service Agreements with U.S. Bancorp Fund Services, LLC doing business as U.S. Bank Global Fund Services (“Fund Services”), and a Custody Agreement with U.S. Bank, N.A. Under these agreements, Fund Services and U.S. Bank, N.A. provide certain transfer agency, administrative, accounting and custody services.
Non-Diversification Risk: The Fund is non-diversified. A non-diversified fund may invest more of its assets in fewer companies than if it were a diversified fund. The Fund may be more exposed to the risks of loss and volatility than a fund that invests more broadly.
COVID-19 Risk: The global outbreak of COVID-19 (commonly referred to as “coronavirus”) has disrupted economic markets and the prolonged economic impact is uncertain. The ultimate economic fallout from the pandemic, and the long-term impact on economies, markets, industries and individual issuers, are not known. The operational and financial performance of the issuers of securities in which the Funds invest depends on future developments, including the duration and spread of the outbreak, and such uncertainty may in turn adversely affect the value and liquidity of the Funds’ investments, impair the Funds’ ability to satisfy redemption requests, and negatively impact the Funds’ performance.
The above are only two of the principal risks of the Fund. The other principal risks are discussed in the Fund’s most recent Prospectus.
YCG Enhanced Fund
NOTES TO FINANCIAL STATEMENTS (continued)
May 31, 2021 (Unaudited)
| 6. | FEDERAL TAX INFORMATION |
A. Tax Basis of Distributions to Shareholders: The tax character of the distributions paid by the Fund were as follows:
| | | For the Year Ended | | | For the Year Ended | |
| | | November 30, 2020 | | | November 30, 2019 | |
| Ordinary Income | | $ | 978,705 | | | $ | 3,593,594 | |
| Long-Term Capital Gains | | | 873,466 | | | | 2,772,781 | |
| Total | | $ | 1,852,171 | | | $ | 6,366,375 | |
Reclassifications: The tax components of distributable earnings are determined in accordance with income tax regulations which may differ from the compositions of net assets reported under GAAP. Accordingly, for the year ended November 30, 2020, certain differences were reclassified. The reclassifications were as follows:
| Decrease Total Distributable Earnings | | $ | (157,170 | ) |
| Increase Paid-in Capital | | $ | 157,170 | |
These differences are primarily due to the differing book and tax treatments of income related to currency, net operating losses and equalization.
B. Tax Basis of Investments
As of November 30, 2020, the components of the tax basis cost of investments and net unrealized appreciation were as follows:
| | YCG Enhanced Fund |
| | | | | | Written | | | Foreign | |
| | | Investments | | | Options | | | Currencies | |
| Tax cost of investments | | $ | 249,995,961 | | | $ | 1,866,923 | | | $ | 1,990,731 | |
| Gross unrealized appreciation | | | 152,262,150 | | | | 1,278,699 | | | | 41,021 | |
| Gross unrealized depreciation | | | (414,973 | ) | | | — | | | | — | |
| Net tax unrealized | | | | | | | | | | | | |
| appreciation (depreciation) | | | 151,847,177 | | | | 1,278,699 | | | | 41,021 | |
| Undistributed ordinary income | | | — | | | | — | | | | — | |
| Undistributed long-term capital gains | | | — | | | | — | | | | — | |
| Accumulated earnings | | | — | | | | — | | | | — | |
| Other accumulated gains (losses) | | | (364,770 | ) | | | — | | | | — | |
| Total accumulated earnings | | $ | 151,482,407 | | | $ | 1,278,699 | | | $ | 41,021 | |
The tax basis of investments for tax and financial reporting purposes differs, principally due to the deferral of losses on wash sales.
YCG Enhanced Fund
NOTES TO FINANCIAL STATEMENTS (continued)
May 31, 2021 (Unaudited)
At November 30, 2020 the Fund had the following capital loss carryforwards:
| | Short-Term | Long-Term | Expires | |
| | $— | $279 | Indefinite | |
Net capital losses incurred after October 31, and within the taxable year are deemed to arise on the first business day of the Fund’s next taxable year. Qualified late-year ordinary losses are the excess of the sum of the specified loss attributable to the portion of the taxable year after October 31, and the late-year losses attributable to the portion of the taxable year after December 31, over the sum of the specified gains attributable to the portion of the taxable year after October 31, and other ordinary income attributable to the portion of the taxable year after December 31. For the fiscal year ended November 30, 2020, there were late year losses deferred of $369,464.
In October 2020, the SEC adopted new regulations governing the use of derivatives by registered investment companies (“Rule 18f-4”). Rule 18f-4 will impose limits on the amount of derivatives a fund can enter into, and require a fund whose use of derivatives is greater than a limited specified amount to establish and maintain a comprehensive derivatives risk management program and appoint a derivatives risk manager. Funds will be required to comply with Rule 18f-4 by August 19, 2022. It is not currently clear what impact, if any, Rule 18f-4 will have on the availability, liquidity or performance of derivatives. Management is currently evaluating the potential impact of Rule 18f-4 on the Fund. When fully implemented, Rule 18f-4 may require changes in how the Fund uses derivatives, adversely affect the Fund’s performance and increase costs related to the Fund’s use of derivatives.
In December 2020, the SEC adopted a new rule providing a framework for fund valuation practices (“Rule 2a-5”). Rule 2a-5 establishes requirements for determining fair value in good faith for purposes of the 1940 Act. Rule 2a-5 will permit fund boards to designate certain parties to perform fair value determinations, subject to board oversight and certain other conditions. Rule 2a-5 also defines when market quotations are “readily available” for purposes of the 1940 Act and the threshold for determining whether a fund must fair value a security. In connection with Rule 2a-5, the SEC also adopted related recordkeeping requirements and is rescinding previously issued guidance, including with respect to the role of a board in determining fair value and the accounting and auditing of fund investments. The Fund will be required to comply with the rules by September 8, 2022. Management is currently assessing the potential impact of the new rules on the Fund’s financial statements.
YCG Enhanced Fund
ADDITIONAL INFORMATION
(Unaudited)
| 1. | SHAREHOLDER NOTIFICATION OF FEDERAL TAX STATUS |
For the year ended November 30, 2020, 100% of the dividends paid from net investment income, including short-term capital gains, for the YCG Enhanced Fund qualify for the dividends received deduction available to corporate shareholders.
For the year ended November 30, 2020, 100% of the dividends paid from net investment income, including short-term capital gains, for the YCG Enhanced Fund are designated as qualified dividend income.
| 2. | COMPENSATION OF TRUSTEES |
Each Trustee who is not an “interested person” of the Trust (i.e. an “Independent Trustee”) receives an annual retainer of $4,000, paid quarterly, as well as $1,000 per meeting attended. In addition, Independent Trustees are eligible for reimbursement of out-of-pocket expenses incurred in connection with attendance at such meetings. The Fund’s Statement of Additional Information includes additional information about the Trustees and is available upon request by calling toll free 1-855-444-9243 or by accessing the Fund’s website at www.ycgfunds.com. (Note for clarification: The information on our website is not incorporated by reference into this report.)
| 3. | PROXY VOTING POLICIES AND PROCEDURES |
For a description of the policies and procedures that the Fund uses to determine how to vote proxies relating to portfolio securities, please call 1-855-444-9243 and request a Statement of Additional Information. One will be mailed to you free of charge. The Statement of Additional Information is also available on the Fund’s website at www.ycgfunds.com or on the web site of the Securities and Exchange Commission at http://www.sec.gov. Information on how the Fund voted proxies relating to portfolio securities during the most recent 12-month period ended June 30 is available without charge, upon request, by calling 1-855-444-9243 or by accessing the website of the Securities and Exchange Commission at http://www.sec.gov.
| 4. | DISCLOSURE OF PORTFOLIO HOLDINGS |
The Fund files a complete schedule of portfolio holdings with the Securities and Exchange Commission for the first and third quarters of each fiscal year as an exhibit to its reports on Form N-PORT. The Fund’s Form N-PORT reports are available on the website of the Securities and Exchange Commission at http://www.sec.gov or on request by calling 1-800-SEC-0330.
| 5. | LIQUIDITY RISK MANAGEMENT |
On January 21, 2021, the Trustees of YCG Enhanced Fund, the sole series of YCG Funds, reviewed and considered a written report prepared by the program administrator of the Fund’s Liquidity Risk Management Program (the “Program”),
YCG Enhanced Fund
ADDITIONAL INFORMATION (continued)
(Unaudited)
the Fund’s Liquidity Risk Management Committee (the “Program Administrator”), which addressed the operation of the Program and assessed the Program’s adequacy and effectiveness of implementation. In considering the report, the Trustees noted that the Program Administrator has determined that the Fund primarily holds assets that are highly liquid investments, and thus relies on the exclusion from the requirements to determine and review a highly liquid investment minimum and to adopt shortfall policies and procedures. They then confirmed with the Program Administrator that no material changes were made to the Program, and reviewed all of the material features of the Program to ensure that they understand how the Program is designed to assess and manage the risk that the Fund could not meet requests to redeem shares issued by the Fund without significant dilution of remaining investors in the Fund. Following this review and discussion, the Trustees determined that they believe the disclosures in the report, taken as a whole, provide the information necessary for the Trustees to effectively assess the Program and its implementation, and that they are comfortable with the report’s conclusion that the Program is reasonably designed to assess and manage the Fund’s liquidity risk, and that the Program has operated as intended during the past year.
YCG Enhanced Fund
TRUSTEES AND OFFICERS
(Unaudited)
The business of the Fund is managed under the direction of the Board. The Board formulates the general policies of the Fund and meets periodically to review the Fund’s performance, monitor investment activities and practices, and discuss other matters affecting the Fund. The Trustees are fiduciaries for the Fund’s shareholders and are governed by the laws of the State of Delaware in this regard. The names and addresses of the Trustees and Officers of the Trust are listed below along with a description of their principal occupations over at least the last five years. Trustees who are “interested persons”, as defined by the 1940 Act, are indicated by asterisk. The Fund’s Statement of Additional Information includes additional information about the Trustees and is available, without charge, upon request by (1) calling toll free 1-855-444-9243; (2) on the Fund’s website located at http://www.ycgfunds.com; or (3) on the SEC’s website http://www.sec.gov.
| | | Term of | | | |
| | | Office | Number of | | |
| | | and | Portfolios | Principal | Other |
| | Position(s) | Length | in Fund | Occupation(s) | Directorships |
| Name, address | Held with | of Time | Complex | During Past | Held by |
| and age | the Fund | Served | Overseen | Five Years | Trustee |
| | | | | | |
Brian Yacktman* | Trustee | Indefinite, | 1 | Manager, Founding | None. |
3207 Ranch Road | | Trustee | | Partner and Chief | |
620 South, Suite 200 | | since 2012 | | Investment Officer, | |
Austin, TX 78738 | President | One year | | YCG, LLC, | |
Age: 42 | | term, | | investment adviser | |
| | | President | | to the Fund, | |
| | | since 2012 | | since 2007. | |
| | | | | | |
William D. Kruger* | Chairman | Indefinite, | 1 | Manager, Partner | None. |
3207 Ranch Road | and | Trustee | | and CEO, YCG, | |
620 South, Suite 200 | Trustee | since 2012 | | LLC, investment | |
Austin, TX 78738 | Vice | One year | | adviser to the Fund, | |
Age: 42 | President | term, Vice | | since 2008. | |
| | and | President | | | |
| | | since 2012 | | | |
| | Treasurer | One year | | | |
| | | term, | | | |
| | | Treasurer | | | |
| | | since 2012 | | | |
YCG Enhanced Fund
TRUSTEES AND OFFICERS (continued)
(Unaudited)
| | | Term of | | | |
| | | Office | Number of | | |
| | | and | Portfolios | Principal | Other |
| | Position(s) | Length | in Fund | Occupation(s) | Directorships |
| Name, address | Held with | of Time | Complex | During Past | Held by |
| and age | the Fund | Served | Overseen | Five Years | Trustee |
| Independent Trustees: | | | | | |
| | | | | | |
Travis E. Oliphant | Trustee | Indefinite, | 1 | Scientific and | None. |
3207 Ranch Road | | Trustee | | Technical Software | |
620 South, Suite 200 | | since 2012 | | Manager and | |
Austin, TX 78738 | | | | Executive. | |
Age: 49 | | | | Founder and CEO | |
| | | | | of Anaconda | |
| | | | | (Continuum Analytics), | |
| | | | | January 2012 – 2017. | |
| | | | | Founder and CEO | |
| | | | | of Quansight, | |
| | | | | 2018 – Present. | |
| | | | | | |
Rory M. McDonald | Trustee | Indefinite, | 1 | Assistant Professor | None. |
3207 Ranch Road | | Trustee | | of Business | |
620 South, Suite 200 | | since 2012 | | Administration in | |
Austin, TX 78738 | | | | the Technology | |
Age: 42 | | | | and Operations | |
| | | | | Management Unit | |
| | | | | at Harvard Business | |
| | | | | School, 2013 – Present. | |
| | | | | | |
Cyril James Speirs | Trustee | Indefinite, | 1 | Retired, Previously, | None. |
3207 Ranch Road | | Trustee | | Global Vice President | |
620 South, Suite 200 | | since 2017 | | Procurement for Whole | |
Austin, TX 78738 | | | | Foods Market, Inc., | |
Age: 65 | | | | 2005 – 2016. | |
YCG Enhanced Fund
TRUSTEES AND OFFICERS (continued)
(Unaudited)
| | | Term of | | | |
| | | Office | Number of | | |
| | | and | Portfolios | Principal | Other |
| | Position(s) | Length | in Fund | Occupation(s) | Directorships |
| Name, address | Held with | of Time | Complex | During Past | Held by |
| and age | the Fund | Served | Overseen | Five Years | Trustee |
| Officers who are not Trustees: | | | | | |
| | | | | | |
Elliott Savage | Vice | One year | N/A | Manager, | None. |
3207 Ranch Road | President | term, Vice | | Partner and | |
620 South, Suite 200 | | President | | Portfolio manager, | |
Austin, TX 78738 | | since | | YCG, LLC, | |
Age: 41 | | December | | investment adviser | |
| | | 2012 | | to the Fund, | |
| | Secretary | One year | | since 2012. | |
| | | term, | | | |
| | | Secretary | | | |
| | | since | | | |
| | | February | | | |
| | | 2016 | | | |
| | Assistant | One year | | | |
| | Treasurer | term, | | | |
| | | Assistant | | | |
| | | Treasurer | | | |
| | | since | | | |
| | | December | | | |
| | | 2012 | | | |
| | | | | | |
Lelia Long | Chief | One year | N/A | Chief Compliance | None. |
3207 Ranch Road | Compliance | term, Chief | | Officer, YCG, LLC | |
620 South, Suite 200 | Officer | Compliance | | 2016 – Present, | |
Austin, TX 78738 | | Officer | | Investment | |
Age: 58 | | since | | Management & | |
| | | March 2016 | | Compliance | |
| | | | | Consultant, Vigilant | |
| | | | | Compliance LLC, | |
| | | | | 2009 – 2020. | |
| | | | | Treasurer, New | |
| | | | | Ireland Fund, Inc., | |
| | | | | 2002 – 2020. | |
| * | Brian Yacktman and William Kruger are considered to be “interested persons” of the Trust, a term that is defined in the 1940 Act. Mr. Yacktman and Mr. Kruger are interested persons because: (1) each is an officer of the Trust; and (2) each is the owner of the investment adviser to the Fund. |
Each trustee holds office for an indefinite term and until the earlier of: the Trust’s next meeting of shareholders and the election and qualification of his successor; or until the date a trustee dies, resigns or is removed in accordance with the Trust’s Declaration of Trust and By-laws. Each officer holds office at the pleasure of the Board and serves for a period of one year, or until his successor is duly elected and qualified.
For Fund information and shareholder services, call
1-855-444-9243
web site: www.ycgfunds.com
YCG Funds
c/o U.S. Bancorp Fund Services, LLC
P.O. Box 701
Milwaukee, WI 53201-0701
Investment Adviser
YCG, LLC
3207 Ranch Road 620 South, Suite 200
Austin, TX 78738
Legal Counsel
Foley & Lardner LLP
777 East Wisconsin Avenue
Milwaukee, WI 53202
Independent Registered Public Accounting Firm
Cohen & Company, Ltd.
151 North Franklin Street, Suite 575
Chicago, IL 60606
Transfer Agent, Fund Accountant, and Fund Administrator
U.S. Bancorp Fund Services, LLC
615 East Michigan Street
Milwaukee, WI 53202
Custodian
U.S. Bank, N.A.
1555 North RiverCenter Drive, Suite 302
Milwaukee, WI 53212
Distributor
Vigilant Distributors, LLC
Gateway Corporate Center, Suite 216
223 Wilmington West Chester Pike
Chadds Ford, PA 19317
This report is submitted for the general information of shareholders of the YCG Enhanced Fund. It is not authorized for distribution to prospective investors unless accompanied or preceded by an effective Prospectus for the Fund, which contains more information concerning the Fund’s investment policies, as well as fees and expenses and other pertinent information. Read the Prospectus carefully.
Item 2. Code of Ethics.
Not applicable for semi-annual reports.
Item 3. Audit Committee Financial Expert.
Not applicable for semi-annual reports.
Item 4. Principal Accountant Fees and Services.
Not applicable for semi-annual reports.
Item 5. Audit Committee of Listed Registrants.
Not applicable to registrants who are not listed issuers (as defined in Rule 10A-3 under the Securities Exchange Act of 1934).
Item 6. Investments.
Schedule of Investments is included as part of the report to shareholders filed under Item 1 of this Form.
Item 7. Disclosure of Proxy Voting Policies and Procedures for Closed-End Management Investment Companies.
Not applicable to open-end investment companies.
Item 8. Portfolio Managers of Closed-End Management Investment Companies.
Not applicable to open-end investment companies.
Item 9. Purchases of Equity Securities by Closed‑End Management Investment Company and Affiliated Purchasers.
Not applicable to open-end investment companies.
Item 10. Submission of Matters to a Vote of Security Holders.
Not Applicable.
Item 11. Controls and Procedures.
(a) | The Registrant’s President/Principal Executive Officer and Treasurer/Principal Financial Officer have reviewed the Registrant's disclosure controls and procedures (as defined in Rule 30a-3(c) under the Investment Company Act of 1940 (the “Act”)) as of a date within 90 days of the filing of this report, as required by Rule 30a-3(b) under the Act and Rules 13a-15(b) or 15d‑15(b) under the Securities Exchange Act of 1934. Based on their review, such officers have concluded that the disclosure controls and procedures are effective in ensuring that information required to be disclosed in this report is appropriately recorded, processed, summarized and reported and made known to them by others within the Registrant and by the Registrant’s service provider. |
(b) | There were no changes in the Registrant's internal control over financial reporting (as defined in Rule 30a-3(d) under the Act) that occurred during the period covered by this report that have materially affected, or are reasonably likely to materially affect, the Registrant's internal control over financial reporting. |
Item 12. Disclosure of Securities Lending Activities for Closed-End Management Investment Companies
Not applicable to open-end investment companies.
Item 13. Exhibits.
(a) | (1) Any code of ethics or amendment thereto, that is the subject of the disclosure required by Item 2, to the extent that the registrant intends to satisfy Item 2 requirements through filing an exhibit. |
(3) Any written solicitation to purchase securities under Rule 23c‑1 under the Act sent or given during the period covered by the report by or on behalf of the registrant to 10 or more persons. Not applicable to open-end investment companies.
(4) Change in the registrant’s independent public accountant. There was no change in the registrant’s independent public accountant for the period covered by this report.
SIGNATURES
Pursuant to the requirements of the Securities Exchange Act of 1934 and the Investment Company Act of 1940, the registrant has duly caused this report to be signed on its behalf by the undersigned, thereunto duly authorized.
(Registrant) YCG Funds
By (Signature and Title)* /s/Brian A. Yacktman
Brian A. Yacktman, President (Principal Executive Officer)
Date July 30, 2021
Pursuant to the requirements of the Securities Exchange Act of 1934 and the Investment Company Act of 1940, this report has been signed below by the following persons on behalf of the registrant and in the capacities and on the dates indicated.
By (Signature and Title)* /s/Brian A. Yacktman
Brian A. Yacktman, President (Principal Executive Officer)
Date July 30, 2021
By (Signature and Title)* /s/William D. Kruger
William D. Kruger, Treasurer (Principal Financial Officer)
Date July 30, 2021
* Print the name and title of each signing officer under his or her signature.