| Semi-Annual Report | | |
| May 31, 2023 | Ticker Symbol: YCGEX | |
YCG Enhanced Fund
MESSAGE TO SHAREHOLDERS
(Unaudited)
Dear Fellow Shareholder:
For the six-month period ending May 31, 2023, the YCG Enhanced Fund (the “Fund”) had a total net return of 9.66%. During the same time period, the S&P 500 Index had a total return of 3.33%, and the S&P Global Broad Market Index had a total return of 3.11%. The Fund’s top five equity winners and top five equity losers during this period were as follows:
| TOP 5 WINNERS | TOP 5 LOSERS |
| Microsoft Corp. | The Estee Lauder Companies, Inc. – Class A |
| Meta Platforms, Inc. – Class A | The Charles Schwab Corp. |
| Amazon.com, Inc. | MSCI, Inc. |
| Copart, Inc. | CBRE Group, Inc. – Class A |
| Alphabet, Inc. – Class C | Waste Management, Inc. |
The top 5 equity winners and equity losers are determined based on a ranking of the dollar gains and losses of all the equity securities owned in the portfolio over the period specified above. This calculation excludes the portfolio’s options positions, which may have experienced a gain or a loss during the period specified. Additionally, the Fund seeks to maximize long term capital appreciation with reasonable investment risk. We believe that six months is too short a period to accurately assess the soundness of our investment strategy, and, thus, we try not to draw too many conclusions from the chart above. Instead, we evaluate ourselves by the Fund’s performance over a full economic cycle, which we define as a period that includes both a recession and an economic expansion.
During the last six months, most of the Fund’s tech stocks dramatically outperformed the rest of the market. They also outperformed leading waste management, railroad, and financial exchange businesses that we’ve come to believe have more pricing power, less cyclicality, and more certain long-term prospects than some of the Fund’s tech businesses. As a result, we sold the technology businesses about which we were less certain (Meta Platforms Inc., Booking Holdings Inc.) and bought these new stocks instead.
Additionally, we grew increasingly concerned about the Fund’s small positions in Chinese tech stocks Tencent Holdings Ltd and Alibaba Group. We believe we underestimated both the risk of competitive disruption and the risk of the Fund’s equity interest in these businesses eventually getting diluted or invalidated by economic warfare between the U.S. and China. Therefore, we sold the Fund’s interests in these two businesses and used some of the proceeds to buy more of the new businesses mentioned above and some to increase the Fund’s position in Estee Lauder, a business that’s experienced recent share price weakness and is also China-exposed but that, in our opinion, has much lower competitive disruption and equity dilution risk.
YCG Enhanced Fund
Lastly, we believe the new businesses we’ve added are more consistent with the Fund’s strategy than the bank stocks the Fund has historically owned while serving as better hedges in a scenario of inflation and deglobalization. Thus, we mostly exited the Fund’s banking investments and replaced them with these new businesses.
In the remainder of this letter, we’ll explain why we find the long-term prospects of Waste Management Inc., Republic Services Inc., Canadian Pacific Kansas City Limited, Canadian National Railways Co., and CME Group Inc. to be so attractive. Then, we’ll discuss in more detail why we believe the waste management companies and railroads are better hedges for inflation and deglobalization than the banks.
Waste Management and Republic Services
Waste Management is the largest waste management company in North America with 29% market share of landfill volume in the United States. Republic Services is the second largest with 19% share of U.S. landfill volume.1 Both maintain extensive operations in Canada as well, but the revenue contribution is much smaller at less than 5% for Waste Management and, though it’s undisclosed, likely a similar percentage for Republic Services. Waste Management benefits from physical network effects as a result of its nearly unrivaled network of 254 landfills, 337 transfer facilities, 135 landfill gas to energy facilities, 97 materials recovery facilities, 497 hauling operations, and 15,200 collection routes.2 Republic Services also benefits from physical network effects as a result of its extensive network of 206 landfills, 240 transfer stations, 73 landfill gas and renewable energy projects, 72 recycling centers, 356 collection operations, and 5 million average daily pickups that is second only to Waste Management’s in size and scope.3 The waste management companies also benefit from a not-in-my-backyard (“NIMBY”) dynamic that makes it extremely difficult for new supply of landfills and other waste management facilities to enter the market. In fact, because of NIMBY and industry consolidation, the number of U.S. landfills has fallen from 7,683 in 1986 to 1,733 today.4 When combined with steadily rising demand for waste management, this supply-side rationalization has resulted in tipping fees, or the price landfills charge trucks to drop off trash, rising over time. In fact, from 1982 to 2021, U.S. municipal solid waste landfill tipping fees increased from $8.07 per ton to $58.2 per ton,5 a compound annual growth rate of 5.2% per year compared to inflation’s compound annual growth rate of only 2.7% per year. Going forward, with waste management demand
____________
1 | See https://www.wasteinfo.com/diratlas.htm. |
2 | See https://investors.wm.com/static-files/ad3eab93-1f46-4150-8844-de02ebf9b18b. |
3 | See https://investor.republicservices.com/static-files/80ed742a-dffc-4640-9407-7c04edb8afab. |
4 | See https://www.wasteinfo.com/diratlas.htm and https://en.wikipedia.org/wiki/Landfills_in_the_ |
| | United_States. |
5 | See https://www.youtube.com/watch?v=uUmtJIBibMM&t=291s, https://www.wastedive.com/news/us-waste-recycling-market-waste-business-journal-2023/650693/, and https://www.bls.gov/data/inflation_calculator.htm. |
YCG Enhanced Fund
projected to continue increasing over time,6 NIMBY and regulatory costs continuing to rise, and the network value of the largest industry participants continuing to increase more quickly than smaller competitors through consolidation and market share gains, we believe industry leaders Waste Management and Republic Services will continue to grow their pricing, revenue, and profits faster than inflation for years to come.
In summary, we think Waste Management and Republic Services are dominant networks with enduring pricing power that essentially serve as toll collectors on U.S. and Canadian consumption, thereby making them a great way to participate in the long-term growth of North America.
Canadian Pacific Kansas City Limited and Canadian National Railway
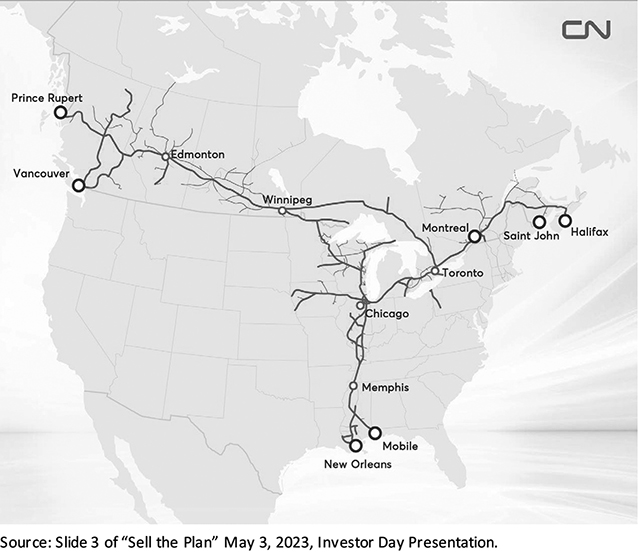
Canadian Pacific Kansas City Limited and Canadian National Railway are two of six class 1 railroads in North America, each of which is essentially one half of a duopoly with two railroads serving the eastern United States, two railroads serving the western United States, and two railroads serving Canada by extending coast-to-coast and then down in a T-shape through the middle of the United States down to the Gulf of Mexico and, in the case of Canadian Pacific Kansas City Limited, down into Mexico as well.
Canadian Pacific Kansas City Limited benefits from physical network effects because of its virtually unrivaled 20,000-mile rail network connecting Canada, the United States, and Mexico.7
____________
6 | See https://www.statista.com/statistics/1266862/projected-waste-management-market-size-north-america/. |
7 | See https://investor.cpkcr.com/news/press-release-details/2023/CPKC-adds-1000-reefers-to-expanding-MMX-service/default.aspx. |
YCG Enhanced Fund
Canadian National Railway benefits from physical network effects as a result of its virtually unrivaled 18,600-mile rail network connecting Canada and the United States.8
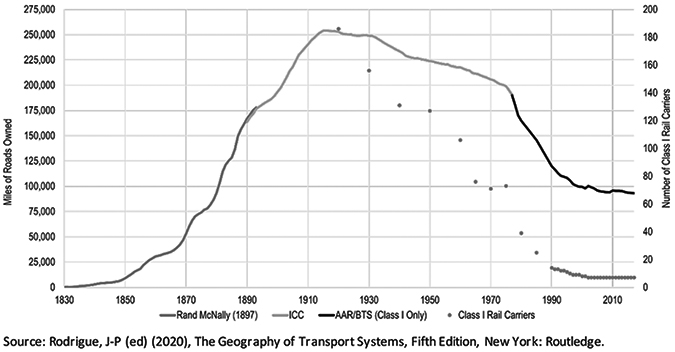
The railroads also benefit from a not-in-my-backyard (“NIMBY”) dynamic that makes it almost impossible to construct a new, competing railroad. In fact, because of NIMBY, transportation deregulation that accelerated following the Stagger’s Act of 1980, and industry consolidation, the number of North American railroad miles has fallen from a peak of 250,000 in the early 1900s to less than 100,000 today and the number of North American class 1 railroads has plummeted from over 180 to just 6 today.9
____________
8 | See https://www.cn.ca/en/news/2023/04/cn-updating-2023-guidance-following-strong-first-quarter-perform/. |
9 | See https://transportgeography.org/contents/chapter5/rail-transportation-pipelines/rail-track-mileage-united-states/. |
YCG Enhanced Fund
When combined with steadily rising freight demand, this supply-side rationalization has dramatically changed the pricing dynamic in the railroad industry. In the early 2000s, long-term, inflation-adjusted pricing trends inflected from consistent declines to a now almost 20-year period of consistent increases.10
____________
10 | See https://www.aar.org/issue/staggers-act/. |
YCG Enhanced Fund
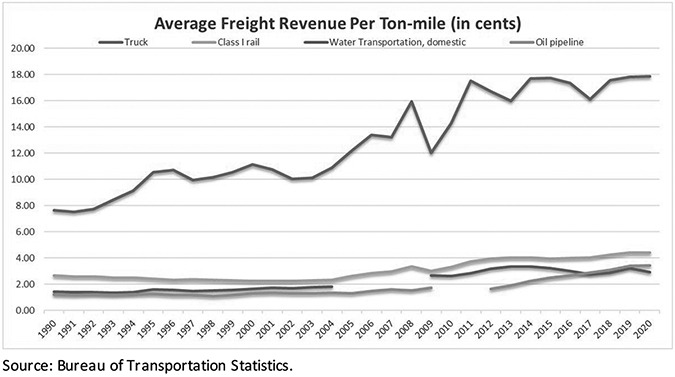
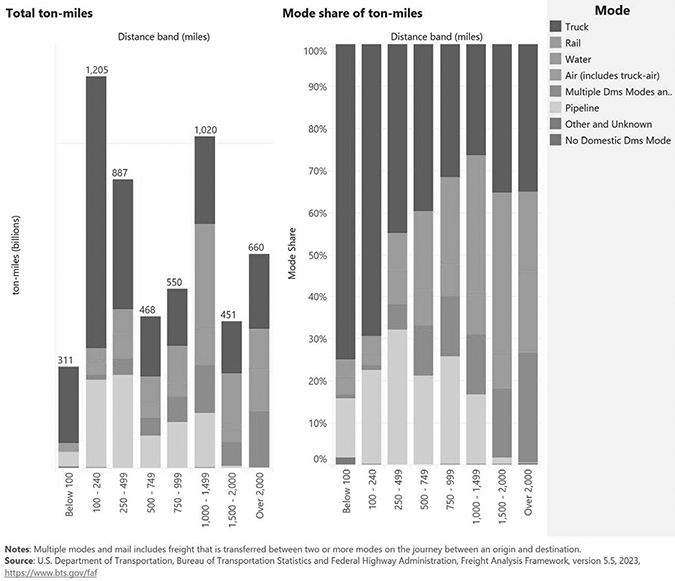
And given the continued projected growth in freight demand,11 the now oligopolistic structure of the railroad industry, and the much lower pricing railroads can profitably offer (see first chart12 below) as a result of their massive energy and labor efficiency relative to trucking, making them especially dominant on long-haul routes (see second chart13 below), we believe the six North American class 1 railroads will continue to grow their pricing, revenue, and profits faster than inflation for years to come.
____________
11 | See https://www.bts.gov/newsroom/freight-activity-us-expected-grow-fifty-percent-2050. |
12 | See https://www.bts.gov/content/average-freight-revenue-ton-mile. |
13 | See https://data.bts.gov/stories/s/Moving-Goods-in-the-United-States/bcyt-rqmu. |
YCG Enhanced Fund
While we believe all the North American class 1 railroads are attractive long-term investments, we’ve chosen to invest in the Canadian rails because we believe they can grow faster and have less regulatory risk than the U.S. rails. We believe they can grow faster than U.S. rails because their volume growth benefits from less exposure to secularly declining coal as well as a long-term trend of Canadian ports taking share from U.S. ports because of greater government investment.14 Furthermore, we believe they have less regulatory risk than U.S. rails because Canadians have historically been more comfortable than Americans with oligopolistic industry structures, as can be seen most clearly by differences in their banking system approval ratings. Canadians overwhelming approve of their oligopolistic banking
____________
14 | See https://www.porttechnology.org/news/study-finds-canadian-ports-receive-double-the-amount-of-funding-than-west-coast-ports/#:~:text=A%20study%20commissioned%20by%20ports%20in% |
| | 20Washington%20and,of%20federal%20funding%20than%20US%20West%20Coast%20ports. |
YCG Enhanced Fund
system,15 in which the top five banks have over 85% market share,16 whereas Americans distrust their banking system and, in particular, the big banks,17 despite the fact that the top five banks in the United States have only 25% market share.18
In summary, we think the Canadian rails are dominant networks with enduring pricing power that essentially serve as toll collectors on both North American and global industrial production, thereby making them a great way to participate in the long-term growth of these important categories.
CME Group
CME Group owns the Chicago Mercantile Exchange, the Chicago Board of Trade, the New York Mercantile Exchange, and the Commodity Exchange, making it the world’s leading futures and options exchange operator. Its three largest futures and options categories are 1) interest rates, where it possesses 95% market share in U.S. interest rate futures trading;19 2) equity indexes, where, largely because of its 27% ownership stake in S&P Dow Jones Indices,20 it has exclusive licenses to issue futures contracts on the S&P 500, Russell 2000, and Nasdaq indexes; and 3) energy, where it has a dominant position in WTI oil futures trading. The company benefits from two network effects. The first occurs at the exchanges themselves, which are global, two-sided networks that connect buyers and sellers of futures and options contracts and provide them with unrivaled liquidity. This two-sided network effect is further strengthened by the nature of the futures contracts traded on the exchanges. For most assets, traders have no restrictions on where they can buy and sell them. For instance, if a trader buys Microsoft stock on the NASDAQ, he or she can subsequently sell it on any number of exchanges or on increasingly popular alternative trading systems (ATS) such as dark pools and electronic communication networks (ECN). In fact, ATS platforms have become so popular that, as of April 2019, traders chose to execute nearly 39% of all their U.S. stock trades on them.21 Futures contracts are different. Futures contracts opened on one exchange cannot be closed at another exchange, making it much harder for competitors to successfully develop alternative sources of liquidity for futures buyers and sellers.
____________
15 | See https://reviewlution.ca/resources/canadian-banking-statistics/#:~:text=As%20of%20December% |
| | 202020%2C%20the%20big%20five,banks%20in%20Canada%20market%20share%20is%20over%2085%25. |
16 | See https://reviewlution.ca/resources/canadian-banking-statistics/#:~:text=As%20of%20December% |
| | 202020%2C%20the%20big%20five,banks%20in%20Canada%20market%20share%20is%20over%2085%25. |
17 | See https://fivethirtyeight.com/features/its-not-just-silicon-valley-bank-americans-havent-trusted-banks-for-years/#:~:text=But%20Americans%20haven%E2%80%99t%20had%20much%20confidence%20in%20banks,%E2%80%94%20including%20banks%20%E2%80%94%20since%20before%20the%201980s. |
18 | See https://www.statista.com/statistics/727548/market-share-top-banks-thrifts-usa-by-assets/. |
19 | See https://www.morningstar.com/stocks/xnas/cme/analysis. |
20 | See https://www.sec.gov/ix?doc=/Archives/edgar/data/1156375/000115637523000020/cme-20221231.htm. |
21 | See https://www.wsj.com/articles/dark-pools-draw-more-trading-amid-low-volatility-11556886916. |
YCG Enhanced Fund
CME Group also owns the clearinghouse that validates and finalizes all the futures transactions that occur on its exchange, further enhancing its competitive position through a second, overlapping network effect. Clearinghouses, which serve as third-party intermediaries to ensure that both buyers and sellers honor their contractual obligations, benefit from network effects due to something called position netting. Position netting occurs when a customer places two or more trades through the same clearinghouse and these trades either fully or partially offset each other. When this situation occurs, the clearinghouse requires the customer to put up only enough money to cover the net position, which allows the customer to earn the same dollar return on its trades but with less capital invested than if the positions weren’t netted, raising the customer’s return on investment. For example, if a trader bought $100 worth of Microsoft stock that posted at one clearinghouse and sold $90 short that posted at another clearinghouse and each clearinghouse required the trader to post an amount equal to 100% of the capital at risk, then he or she would have to post $190. However, if the trader bought $100 of Microsoft and sold short $90 dollars of Microsoft through the same clearinghouse, he or she would only be required to post $10 dollars as collateral. As you can see, this netting effect creates a huge incentive for customers to use as few clearinghouses as possible. Importantly, the fact that CME Group owns both the exchanges and their clearinghouse is a huge advantage that is relatively uncommon. For instance, most stock and bond transactions in the United States are cleared through the Depository Trust & Clearing Corporation, a private company jointly owned by its member banks and brokers, making it easier for alternative sources of liquidity to crop up and steal market share from the stock exchanges like the NYSE and Nasdaq.
Lastly, we believe CME operates in an attractive industry. The capital markets have historically grown faster than GDP over time, and we believe this trend will continue in the future because of the nature of economic development. In the early stages of development, governments and banks typically provide most of the funding for businesses and consumers. However, as economies develop, governments gradually allow more international investment and the countries’ citizens and businesses also build up excess wealth that they can use for investment, seeding the early formation of capital markets. As these capital markets develop, they eventually become more distributed and efficient investor networks than the banks, and, therefore, cheaper and more reliable sources of capital for businesses and governments.
In summary, we believe the combination of the unrivaled liquidity of CME’s futures exchanges, the nature of futures contracts where they must be opened and closed on the same exchange, and the reinforcing network effects of clearinghouse position netting make it highly likely that CME Group will continue to earn attractive returns on capital by serving as a mission-critical and hard-to-disrupt toll collector on the global capital markets.
YCG Enhanced Fund
Banks vs. Railroads and Waste Collection as Hedges Against Inflation and Deglobalization
One of the functions we believe banks served in the Fund’s portfolio was as a hedge against prolonged inflation and deglobalization. Many of the other businesses in the Fund’s portfolio, in recognition of their quality and durability, have higher valuation multiples than the average U.S. stock. Furthermore, most of the businesses in the Fund’s portfolio are more global than the average U.S. stock. As a result, we believe their businesses and valuations could be more impacted in a world where inflation stays stubbornly high and/or one where governments increasingly favor homegrown, resilient solutions over maximally efficient solutions.
Banks, on the other hand, could potentially benefit from this type of environment. The nearshoring and reshoring of manufacturing could lead to strong wage gains that reinvigorate and broaden the middle class. If this scenario were to occur, we believe this increased middle class buying power and the higher rates needed to control inflation could lead to expanded net interest margins, more loan demand, and contained credit losses. However, the problem with the U.S.’s fragmented banking system is that it merges a highly levered business model with a viciously competitive market in which many banks are price-takers. Therefore, sufficiently large deflationary or inflationary surprises oftentimes result in major banking problems, as we saw in the Global Financial Crisis of 2008 and the stagflationary 1970s. We’ve recently witnessed similar problems with the failures of Silicon Valley Bank, Signature Bank, and First Republic. Even the strongest and best run banks can’t avoid these tail risks completely, as Jamie Dimon has demonstrated at various points over the last few years by halting J.P. Morgan’s share repurchases and building up cash to prepare for a financial storm.
That’s why we became increasingly excited as we did more research on the waste management and rail industries. We believe that they serve as similarly effective hedges in a scenario of high inflation and/or deglobalization while being much less exposed to economic and operational tail risks. For instance, in a scenario of deglobalization that leads to more nearshoring and reshoring and to a financially stronger middle class, railroads have the potential to get a volume tailwind from both more North American industrial production and more consumer goods purchases. Similarly, waste management companies could get a volume tailwind from more industrial waste and more consumer waste.
Furthermore, in the case of railroads, they require far less labor and fuel than their main competitor, the trucking industry. This difference allows them to charge less than 25% of what the trucking industry does (4.4 cents per ton-mile vs. 17.9 cents per ton-mile) yet earn almost 40% operating margins compared to a trucking industry that likely earns less than 5% operating margins.22 In an inflationary environment,
____________
22 | See https://www.freightwaves.com/news/solving-the-trucking-profitability-paradox. |
YCG Enhanced Fund
trucks may have to increase their prices just to stay profitable. Since the rails charge so much less and make so much more margin, an equivalent price increase will result in a bigger percentage increase in revenue and an even faster increase in profits. Additionally, unlike the banks, which are subject to numerous tail risks but few tail opportunities, the railroads could disproportionately benefit if the U.S. eventually decides to tax trucks for the much larger negative externalities they cause, including public highway damage, accident risk, traffic congestion, and higher carbon emissions. A study published in 2015 by the Congressional Budget Office calculated the external costs of railroads at 0.5 cents per ton-mile and of trucks at 4.0 cents per ton mile, making railroads even more cost effective on a look through basis.23
Lastly, the leading waste management companies and railroads have characteristics that are much more consistent with the other stocks in the Fund’s portfolio. They are oligopolistic, dominant networks with NIMBY dynamics that make it very tough to add new supply, resulting in more secure enduring pricing power, in our opinion, than the Fund gets with the leading banks, which operate in an industry with less consolidation and weaker network effects and, therefore, face aggressive competition that drives the returns on many of their business lines down to their cost of capital.
Concluding Thoughts
In summary, we believe the portfolio changes we’ve made over the last quarter (replacing Meta, Booking, the Chinese tech stocks, and most of the banks with leading players in waste management, railroads, and financial exchanges) have significantly upgraded the quality of the Fund’s portfolio. The businesses we bought have, in our opinion, stronger, more dominant network effects with much higher switching costs than the businesses we sold, giving us greater confidence that their pricing power will prove enduring.
Additionally, the ownership structures of Meta (where Mark Zuckerberg has super-voting shares) and the Chinese tech stocks (where the Fund’s ownership is not direct but, rather, through variable interest entities) as well as the tail risks of the banks (which could result in the dilution or wipeout of the Fund’s equity ownership in a sufficiently bad crisis) have always been worrisome to us. In contrast, Waste Management, Republic Services, Canadian Pacific Kansas City Limited, Canadian National Railway, and Chicago Mercantile Exchange have much stronger minority shareholder protections and, in our opinion, much lower tail risks. Additionally, most of these companies have large shareholders who have a history of holding management accountable and of driving long-term value creation.
____________
23 | See https://www.cbo.gov/sites/default/files/114th-congress-2015-2016/presentation/51105-pricing-freight-transport-account-external-costs.pdf. |
YCG Enhanced Fund
Lastly, we believe the waste management companies and Canadian railroads we bought serve as better hedges against a scenario of rising deglobalization and persistent inflation than the banks we sold. If such a scenario were to occur, the waste management companies and railroads could, like the banks, experience both volume and pricing tailwinds, but, unlike the banks, we believe they are subject to far fewer tail risks. Moreover, our higher confidence in their business models allows the Fund to own larger positions in them than we felt comfortable owning in the banks, resulting in a portfolio that we believe is more balanced and, therefore, more capable of surviving and thriving in the wide range of geopolitical and economic environments that the future may bring.
As always, thank you so much for your trust, know that we continue to be invested right alongside you, and please always reach out to us if you have any questions or concerns. We’re here to help!
Sincerely,
The YCG Team
Past performance does not guarantee future results.
Mutual fund investing involves risk. Principal loss is possible. The Fund is non-diversified, meaning it may concentrate its assets in fewer individual holdings than a diversified fund. Therefore, the Fund is more exposed to individual stock volatility than a diversified fund. The Fund invests primarily in equity securities without regard to market capitalization, thus investments will be made in mid and smaller capitalization companies, which involve additional risks such as limited liquidity and greater volatility. The Fund may also write put options and covered call options on a substantial portion of the Fund’s long equity portfolio, which have the risks of early option contract assignment forcing the Fund to purchase the underlying stock at the exercise price which may be the cause of significant losses due to the failure of correctly predicting the direction of securities prices, interest rates and currency exchange rates. The investment in options is not suitable for all investors. Covered call writing may limit the upside of an underlying security. The Fund may also invest in foreign securities which involve political, economic and currency risks, greater volatility, and differences in accounting methods. Investments in debt securities typically decrease in value when interest rates rise. This risk is usually greater for longer-term debt securities. Investment in lower-rated, non-rated and distressed securities presents a greater risk of loss to principal and interest than higher-rated securities.
Diversification does not guarantee a profit or protect from loss in a declining market.
Various mutual funds, hedge funds, and other investment products have different risk profiles, which should be considered when investing. All investments contain risk and may lose value.
Fund holdings and sector allocations are subject to change at any time and should not be considered recommendations to buy or sell any security. Please see the Schedule of Investments in this report for a complete list of Fund holdings.
The S&P 500 Index is a stock market index based on the market capitalizations of 500 leading companies publicly traded in the U.S. stock market. It is not possible to invest directly in an index.
The S&P Global Broad Market Index is a market capitalization-weighted index that provides a broad measure of the global equities markets and includes approximately 11,000 companies in more than 52 countries covering both developed and emerging markets.
YCG Enhanced Fund
EXPENSE EXAMPLE
For the six months ended May 31, 2023 (Unaudited)
As a shareholder of the YCG Enhanced Fund (the “Fund”), you incur ongoing costs, including management fees and other Fund expenses. If you invest through a financial intermediary, you may also incur additional costs such as a transaction fee charged on the purchase or sale of the Fund or an asset-based management fee. This example is intended to help you understand your ongoing costs (in dollars) of investing in the Fund and to compare these costs with the ongoing costs of investing in other mutual funds.
The Example is based on an investment of $1,000 invested at the beginning of the period and held for the entire period from December 1, 2022 to May 31, 2023.
Actual Expenses
The first line of the table on the next page provides information about actual account values and actual expenses. You may use the information provided in this line, together with the amount you invested, to estimate the expenses that you paid over the period. Simply divide your account value by $1,000 (for example, an $8,600 ending account value divided by $1,000 = 8.6), then multiply the result by the number in the first line under the heading entitled “Expenses Paid During the Period” to estimate the expenses you paid on your account during the period.
Hypothetical Example for Comparison Purposes
The second line of the table on the next page provides information about hypothetical account values and hypothetical expenses based on the Fund’s actual expense ratio and an assumed rate of return of 5% per year before expenses, which is not the Fund’s actual return. The hypothetical account values and expenses may not be used to estimate the actual ending account balance or expenses you paid for the period. You may use this information to compare the ongoing costs of investing in the Fund and other funds. To do so, compare this 5% hypothetical example with the 5% hypothetical examples that appear in the shareholder reports of the other funds.
YCG Enhanced Fund
EXPENSE EXAMPLE (continued)
For the six months ended May 31, 2023 (Unaudited)
Please note that the expenses shown in the table are meant to highlight your ongoing costs only and do not reflect any costs that may be associated with investing in the Fund through a financial intermediary. Therefore, the second line of the table is useful in comparing the ongoing costs only, and will not help you determine the relative total costs of owning different funds. In addition, if any costs associated with investing through a financial intermediary were included, your costs would have been higher.
| | | | Expenses Paid |
| | Beginning | Ending | During Period(a) |
| | Account Value | Account Value | 12/1/22 – |
| | 12/1/22 | 5/31/23 | 5/31/23 |
| Actual | $1,000.00 | $1,096.60 | $6.22 |
| | | | |
| Hypothetical (5% return | | | |
| before expenses) | $1,000.00 | $1,019.00 | $5.99 |
(a) | Expenses are equal to the Fund’s annualized expense ratio of 1.19%, the average account value over the period, multiplied by 182/365 to reflect the period. |
YCG Enhanced Fund
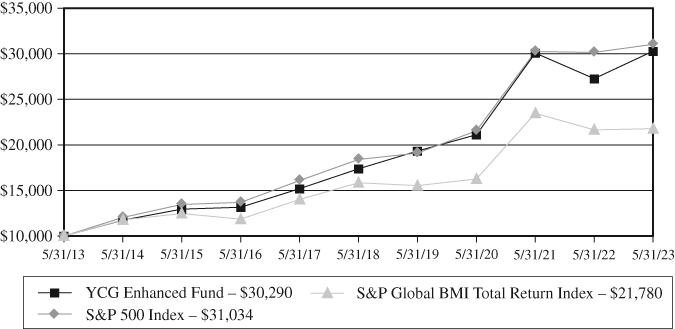
GROWTH OF $10,000 INVESTMENT
(Unaudited)
This chart assumes an initial gross investment of $10,000 made on May 31, 2013. Returns shown include the reinvestment of all dividends. Returns shown do not reflect the deductions of taxes that a shareholder would pay on Fund distributions or the redemption of Fund shares. In the absence of fee waivers and reimbursements, when they are necessary to keep expenses at the expense cap, total return would be reduced. Past performance is not predictive of future performance. Investment return and principal value will fluctuate so that your shares, when redeemed, may be worth more or less than original cost. Index returns do not reflect the effects of fees or expenses. It is not possible to invest directly in an index.
| | One | Three | Five | Ten | Since Inception |
| | Year | Year | Year | Year | (12/28/2012) |
| Average Annual Returns | | | | | |
| YCG Enhanced Fund | 11.07% | 12.78% | 11.76% | 11.72% | 12.57% |
| S&P 500 Index | 2.92% | 12.92% | 11.01% | 11.99% | 13.20% |
| S&P Global BMI | | | | | |
| Total Return Index | 0.58% | 10.22% | 6.57% | 8.10% | 8.82% |
YCG Enhanced Fund
TOP TEN EQUITY HOLDINGS
May 31, 2023 (Unaudited)
| | | Percentage of |
| | | Net Assets |
| Microsoft Corp. | | | 6.83 | % |
| Amazon.com, Inc. | | | 6.30 | % |
| MasterCard, Inc. – Class A | | | 5.40 | % |
| Alphabet, Inc. – Class C | | | 5.18 | % |
| Moody’s Corp. | | | 5.10 | % |
| Copart, Inc. | | | 4.54 | % |
| MSCI, Inc. | | | 4.23 | % |
| Aon PLC – Class A | | | 4.05 | % |
| Verisk Analytics, Inc. | | | 4.03 | % |
| Marsh & McLennan Cos, Inc. | | | 3.65 | % |
| Total | | | 49.31 | % |
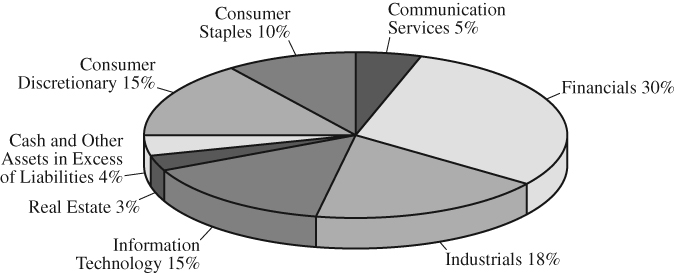
ALLOCATION OF PORTFOLIO HOLDINGS (as a % of net assets)
May 31, 2023 (Unaudited)
For Fund compliance purposes, the Fund’s industry classifications refer to any one or more of the industry sub-classifications used by one or more widely recognized market indexes or ratings group indexes, and/or they may be defined by Fund management. This definition does not apply for all purposes of this report, which may combine sub-classifications for reporting ease. Categories are shown as a percentage of net assets.
YCG Enhanced Fund
SCHEDULE OF INVESTMENTS
May 31, 2023 (Unaudited)
| | | Shares | | | Value | |
| COMMON STOCKS – 95.98% | | | | | | |
| | | | | | | |
| Automobiles – 1.41% | | | | | | |
| Ferrari NV (a) | | | 22,928 | | | $ | 6,572,770 | |
| | | | | | | | | |
| Beverages – 1.37% | | | | | | | | |
| PepsiCo., Inc. | | | 35,114 | | | | 6,403,038 | |
| | | | | | | | | |
| Broadline Retail – 6.30% | | | | | | | | |
| Amazon.com, Inc. (b) | | | 243,138 | | | | 29,317,580 | |
| | | | | | | | | |
| Capital Markets – 13.62% | | | | | | | | |
| CME Group, Inc. | | | 25,940 | | | | 4,636,775 | |
| Moody’s Corp. | | | 74,848 | | | | 23,717,834 | |
| MSCI, Inc. (c) | | | 41,877 | | | | 19,704,385 | |
| S&P Global, Inc. (c) | | | 34,240 | | | | 12,580,803 | |
| The Charles Schwab Corp. | | | 52,639 | | | | 2,773,549 | |
| | | | | | | | 63,413,346 | |
| | | | | | | | | |
| Commercial Services & Supplies – 8.99% | | | | | | | | |
| Copart, Inc. (b) | | | 241,390 | | | | 21,143,350 | |
| Republic Services, Inc. (c) | | | 49,197 | | | | 6,967,771 | |
| Waste Management, Inc. | | | 84,843 | | | | 13,737,779 | |
| | | | | | | | 41,848,900 | |
| | | | | | | | | |
| Financial Services – 6.30% | | | | | | | | |
| MasterCard, Inc. – Class A | | | 68,896 | | | | 25,148,418 | |
| Visa, Inc. – Class A | | | 18,925 | | | | 4,182,993 | |
| | | | | | | | 29,331,411 | |
| | | | | | | | | |
| Ground Transportation – 1.90% | | | | | | | | |
| Canadian National Railway Co. (a)(c) | | | 39,731 | | | | 4,478,876 | |
| Canadian Pacific Kansas City Ltd. (a)(c) | | | 57,620 | | | | 4,390,644 | |
| | | | | | | | 8,869,520 | |
| | | | | | | | | |
| Household Products – 2.62% | | | | | | | | |
| Colgate-Palmolive Co. | | | 82,613 | | | | 6,144,755 | |
| The Procter & Gamble Co. (d) | | | 42,509 | | | | 6,057,532 | |
| | | | | | | | 12,202,287 | |
See notes to financial statements.
YCG Enhanced Fund
SCHEDULE OF INVESTMENTS (continued)
May 31, 2023 (Unaudited)
| | | Shares | | | Value | |
| COMMON STOCKS – 95.98% (continued) | | | | | | |
| | | | | | | |
| Insurance – 9.74% | | | | | | |
| Aon PLC – Class A (a)(d) | | | 61,133 | | | $ | 18,846,693 | |
| Marsh & McLennan Cos, Inc. | | | 98,033 | | | | 16,977,355 | |
| The Progressive Corp. | | | 74,363 | | | | 9,511,771 | |
| | | | | | | | 45,335,819 | |
| | | | | | | | | |
| Interactive Media & Services – 5.21% | | | | | | | | |
| Alphabet, Inc. – Class C (b) | | | 195,520 | | | | 24,121,302 | |
| Meta Platforms, Inc. – Class A (b)(c) | | | 500 | | | | 132,360 | |
| | | | | | | | 24,253,662 | |
| | | | | | | | | |
| Personal Care Products – 6.34% | | | | | | | | |
| L’Oreal SA (a)(e) | | | 31,022 | | | | 13,230,624 | |
| The Estee Lauder Companies, Inc. – Class A (c) | | | 53,949 | | | | 9,928,234 | |
| Unilever PLC – ADR (a) | | | 127,082 | | | | 6,346,475 | |
| | | | | | | | 29,505,333 | |
| | | | | | | | | |
| Professional Services – 7.50% | | | | | | | | |
| CoStar Group, Inc. (b) | | | 203,109 | | | | 16,126,855 | |
| Verisk Analytics, Inc. | | | 85,668 | | | | 18,770,715 | |
| | | | | | | | 34,897,570 | |
| | | | | | | | | |
| Real Estate Management & Development – 2.66% | | | | | | | | |
| CBRE Group, Inc. – Class A (b) | | | 165,570 | | | | 12,404,504 | |
| Software – 12.65% | | | | | | | | |
| Adobe, Inc. (b)(c) | | | 38,187 | | | | 15,954,147 | |
| Intuit, Inc. (c) | | | 26,583 | | | | 11,141,467 | |
| Microsoft Corp. (c) | | | 96,885 | | | | 31,816,065 | |
| | | | | | | | 58,911,679 | |
| | | | | | | | | |
| Technology Hardware, Storage & Peripherals – 2.51% | | | | | | | | |
| Apple, Inc. (c) | | | 65,807 | | | | 11,664,291 | |
| | | | | | | | | |
| Textiles, Apparel & Luxury Goods – 6.86% | | | | | | | | |
| Hermes International (a) | | | 4,871 | | | | 9,901,947 | |
| LVMH Moet Hennessy Louis Vuitton SE (a) | | | 10,207 | | | | 8,879,874 | |
| NIKE, Inc. – Class B (c) | | | 125,059 | | | | 13,163,711 | |
| | | | | | | | 31,945,532 | |
| TOTAL COMMON STOCKS (Cost $275,417,119) | | | | | | $ | 446,877,242 | |
See notes to financial statements.
YCG Enhanced Fund
SCHEDULE OF INVESTMENTS (continued)
May 31, 2023 (Unaudited)
| | | Principal | | | | |
| | | Amount | | | Value | |
| SHORT-TERM INVESTMENTS – 3.02% | | | | | | |
| | | | | | | |
| U.S. Treasury Bills – 3.02% | | | | | | |
| 0.180%, 06/08/2023 (f) | | $ | 3,673,000 | | | $ | 3,669,779 | |
| 1.447%, 07/27/2023 (f) | | | 38,000 | | | | 37,729 | |
| 1.673%, 08/03/2023 (f) | | | 607,000 | | | | 601,526 | |
| 1.880%, 08/10/2023 (f) | | | 1,046,000 | | | | 1,035,562 | |
| 2.487%, 09/07/2023 (f) | | | 3,254,000 | | | | 3,209,302 | |
| 2.866%, 09/14/2023 (f) | | | 823,000 | | | | 810,809 | |
| 2.986%, 09/21/2023 (f) | | | 1,158,000 | | | | 1,139,644 | |
| 3.900%, 10/19/2023 (f) | | | 716,000 | | | | 701,407 | |
| 4.038%, 10/26/2023 (f) | | | 201,000 | | | | 196,691 | |
| 4.246%, 11/02/2023 (f) | | | 2,078,000 | | | | 2,031,798 | |
| 4.549%, 11/09/2023 (f) | | | 234,000 | | | | 228,471 | |
| 5.012%, 11/16/2023 (f) | | | 393,000 | | | | 383,474 | |
| TOTAL SHORT-TERM INVESTMENTS (Cost $14,063,407) | | | | | | $ | 14,046,192 | |
| Total Investments (Cost $289,480,526) – 99.00% | | | | | | $ | 460,923,434 | |
| Other Assets in Excess of Liabilities – 1.00% | | | | | | | 4,639,891 | |
| TOTAL NET ASSETS – 100.00% | | | | | | $ | 465,563,325 | |
Percentages are stated as a percent of net assets.
| ADR | American Depositary Receipt |
| PLC | Public Limited Company |
| (a) | Foreign issued security. |
| (b) | Non-income producing. |
| (c) | Security held in connection with options written. |
| (d) | A portion of this security is pledged as collateral on options written. As of May 31, 2023, the value of collateral is $11,902,263. |
| (e) | This security is split between Registered shares (2,217) and Loyalty shares (28,805). They are both valued the same. The Loyalty shares may take longer to settle when traded. |
| (f) | Reflects the annualized yield on the date of purchase for discounted investments. |
| |
|
The Global Industry Classification Standard (GICS®) was developed by and/or is the exclusive property of MSCI, Inc. (“MSCI”) and Standard & Poor Financial Services LLC (“S&P”). GICS is a service mark of MSCI and S&P and has been licensed for use by U.S. Bank Global Fund Services.
See notes to financial statements.
YCG Enhanced Fund
SCHEDULE OF OPTIONS WRITTEN
May 31, 2023 (Unaudited)
| | | | | | Notional | | | | |
| | | Contracts | | | Amount | | | Value | |
CALL OPTIONS(a) | | | | | | | | | |
| Meta Platforms, Inc. | | | | | | | | | |
| Expiration: June 2023; | | | | | | | | | |
| Exercise Price: $235.00 | | | 5 | | | $ | 117,500 | | | $ | 14,450 | |
| NIKE, Inc. | | | | | | | | | | | | |
| Expiration: October 2023; | | | | | | | | | | | | |
| Exercise Price: $125.00 | | | 34 | | | | 425,000 | | | | 7,820 | |
| Total Call Options Written | | | | | | | | | | | | |
| (Premiums received $40,201) | | | | | | | | | | | 22,270 | |
| | | | | | | | | | | | | |
PUT OPTIONS(a) | | | | | | | | | | | | |
| Adobe, Inc. | | | | | | | | | | | | |
| Expiration: June 2023; | | | | | | | | | | | | |
| Exercise Price: $360.00 | | | 15 | | | | 540,000 | | | | 2,325 | |
| Apple, Inc. | | | | | | | | | | | | |
| Expiration: August 2023; | | | | | | | | | | | | |
| Exercise Price: $175.00 | | | 177 | | | | 3,097,500 | | | | 109,740 | |
| Canadian National Railway Co. | | | | | | | | | | | | |
| Expiration: July 2023; | | | | | | | | | | | | |
| Exercise Price: $120.00 | | | 107 | | | | 1,284,000 | | | | 87,954 | |
| Canadian Pacific Kansas City Ltd. | | | | | | | | | | | | |
| Expiration: September 2023; | | | | | | | | | | | | |
| Exercise Price: $82.50 | | | 155 | | | | 1,278,750 | | | | 110,825 | |
| Intuit, Inc. | | | | | | | | | | | | |
| Expiration: June 2023; | | | | | | | | | | | | |
| Exercise Price: $410.00 | | | 15 | | | | 615,000 | | | | 12,300 | |
| Expiration: July 2023; | | | | | | | | | | | | |
| Exercise Price: $450.00 | | | 8 | | | | 360,000 | | | | 29,400 | |
| Microsoft Corp. | | | | | | | | | | | | |
| Expiration: July 2023; | | | | | | | | | | | | |
| Exercise Price: $285.00 | | | 53 | | | | 1,510,500 | | | | 7,791 | |
| MSCI, Inc. | | | | | | | | | | | | |
| Expiration: September 2023; | | | | | | | | | | | | |
| Exercise Price: $470.00 | | | 40 | | | | 1,880,000 | | | | 111,000 | |
| Republic Services, Inc. | | | | | | | | | | | | |
| Expiration: July 2023; | | | | | | | | | | | | |
| Exercise Price: $150.00 | | | 161 | | | | 2,415,000 | | | | 140,875 | |
See notes to financial statements.
YCG Enhanced Fund
SCHEDULE OF OPTIONS WRITTEN (continued)
May 31, 2023 (Unaudited)
| | | | | | Notional | | | | |
| | | Contracts | | | Amount | | | Value | |
PUT OPTIONS(a) (continued) | | | | | | | | | |
| S&P Global, Inc. | | | | | | | | | |
| Expiration: June 2023; | | | | | | | | | |
| Exercise Price: $340.00 | | | 50 | | | $ | 1,700,000 | | | $ | 4,875 | |
| The Estee Lauder Companies, Inc. | | | | | | | | | | | | |
| Expiration: July 2023; | | | | | | | | | | | | |
| Exercise Price: $200.00 | | | 50 | | | | 1,000,000 | | | | 86,000 | |
| Expiration: July 2023; | | | | | | | | | | | | |
| Exercise Price: $210.00 | | | 137 | | | | 2,877,000 | | | | 363,050 | |
| Total Put Options Written | | | | | | | | | | | | |
| (Premiums received $966,562) | | | | | | | | | | | 1,066,135 | |
| Total Options Written | | | | | | | | | | | | |
| (Premiums received $1,006,763) | | | | | | | | | | $ | 1,088,405 | |
See notes to financial statements.
YCG Enhanced Fund
STATEMENT OF ASSETS AND LIABILITIES
May 31, 2023 (Unaudited)
| ASSETS: | | | |
| Investments, at value (Cost $289,480,526) | | $ | 460,923,434 | |
| Foreign currency, at value (Cost $1,974,215) | | | 1,886,984 | |
| Cash | | | 3,870 | |
| Deposits with brokers for options written | | | 4,777,871 | |
| Receivable for Fund shares sold | | | 336,127 | |
| Dividends and interest receivable | | | 350,633 | |
| Prepaid expenses | | | 23,743 | |
| Total Assets | | | 468,302,662 | |
| LIABILITIES: | | | | |
| Options written, at value (Premiums received $1,006,763) | | | 1,088,405 | |
| Payable for Fund shares redeemed | | | 161,880 | |
| Payable to investment adviser | | | 399,924 | |
| Payable for investments purchased | | | 960,000 | |
| Payable to custodian | | | 5,609 | |
| Other accrued expenses | | | 123,519 | |
| Total Liabilities | | | 2,739,337 | |
| NET ASSETS | | $ | 465,563,325 | |
| | | | | |
| NET ASSETS CONSIST OF: | | | | |
| Paid-in capital | | $ | 288,301,468 | |
| Total distributable earnings (accumulated deficit) | | | 177,261,857 | |
| Total Net Assets | | $ | 465,563,325 | |
| Shares outstanding (unlimited shares of no par value authorized) | | | 17,988,030 | |
| | | | | |
| NET ASSET VALUE, OFFERING AND | | | | |
REDEMPTION PRICE PER SHARE(a) | | $ | 25.88 | |
(a) | A redemption fee of 2.00% is assessed against shares redeemed within 30 days of purchase. See Note 2(i). |
See notes to financial statements.
YCG Enhanced Fund
STATEMENT OF OPERATIONS
For the six-months ended May 31, 2023 (Unaudited)
| INVESTMENT INCOME: | | | |
Dividend income(a) | | $ | 1,853,790 | |
| Interest income | | | 391,781 | |
| Total Investment Income | | | 2,245,571 | |
| EXPENSES: | | | | |
| Investment advisory fees | | | 2,211,657 | |
| Administration fees | | | 92,405 | |
| Shareholder service fees | | | 81,935 | |
| Accounting fees | | | 54,343 | |
| Transfer agent fees and expenses | | | 47,784 | |
| Compliance fees | | | 40,097 | |
| Legal fees | | | 34,309 | |
| Federal and state registration fees | | | 18,223 | |
| Custody fees | | | 17,157 | |
| Trustees fees and expenses | | | 11,928 | |
| Audit and tax fees | | | 9,527 | |
| Insurance fees | | | 5,992 | |
| Reports to Shareholders | | | 5,337 | |
| Miscellaneous expenses | | | 546 | |
| Total expenses before reimbursement/recoupment | | | 2,631,240 | |
| Expense recoupment by investment adviser (see Note 4) | | | 5,850 | |
| Expense reimbursement by investment adviser (see Note 4) | | | (5,218 | ) |
| Net Expenses | | | 2,631,872 | |
| NET INVESTMENT INCOME (LOSS) | | | (386,301 | ) |
| REALIZED AND UNREALIZED GAIN (LOSS): | | | | |
| Net realized gain (loss) on | | | | |
| Investments | | | 9,392,547 | |
| Options written | | | 2,773,374 | |
| Foreign currency transactions | | | 3,904 | |
| Net change in unrealized appreciation (depreciation) on | | | | |
| Investments | | | 29,711,918 | |
| Options written | | | (442,442 | ) |
| Foreign currency transactions | | | 53,172 | |
| Net realized and unrealized gain (loss) on investments | | | 41,492,473 | |
| NET INCREASE (DECREASE) IN NET ASSETS | | | | |
| RESULTING FROM OPERATIONS | | $ | 41,106,172 | |
(a) | Net of 77,714 in foreign withholding taxes and fees. |
See notes to financial statements.
YCG Enhanced Fund
STATEMENT OF CHANGES IN NET ASSETS
| | | Six-Months Ended | | | | |
| | | May 31, 2023 | | | Year Ended | |
| | | (Unaudited) | | | November 30, 2022 | |
| OPERATIONS: | | | | | | |
| Net investment income (loss) | | $ | (386,301 | ) | | $ | (1,733,180 | ) |
| Net realized gain (loss) on | | | | | | | | |
| investments and options written | | | 12,169,825 | | | | (4,206,164 | ) |
| Net change in unrealized | | | | | | | | |
| appreciation (depreciation) on | | | | | | | | |
| investments and options written | | | 29,322,648 | | | | (83,885,985 | ) |
| Net increase (decrease) in net assets | | | | | | | | |
| resulting from operations | | | 41,106,172 | | | | (89,825,329 | ) |
| | | | | | | | | |
| CAPITAL SHARE TRANSACTIONS: | | | | | | | | |
| Proceeds from shares sold | | | 8,737,113 | | | | 18,163,767 | |
| Proceeds from reinvestment of distributions | | | — | | | | 44,406,183 | |
| Redemption fees | | | 2,076 | | | | 2,609 | |
| Payment for shares redeemed | | | (20,002,667 | ) | | | (33,916,098 | ) |
| Net increase (decrease) | | | (11,263,478 | ) | | | 28,656,461 | |
| | | | | | | | | |
| DISTRIBUTIONS TO SHAREHOLDERS: | | | | | | | | |
| Distributions to shareholders | | | — | | | | (48,633,155 | ) |
| | | | | | | | | |
| TOTAL INCREASE (DECREASE) | | | | | | | | |
| IN NET ASSETS | | $ | 29,842,694 | | | $ | (109,802,023 | ) |
| | | | | | | | | |
| NET ASSETS: | | | | | | | | |
| Beginning of year or period | | $ | 435,720,631 | | | $ | 545,522,654 | |
| End of year or period | | $ | 465,563,325 | | | $ | 435,720,631 | |
| | | | | | | | | |
| CHANGE IN SHARES OUTSTANDING: | | | | | | | | |
| Shares sold | | | 352,754 | | | | 701,994 | |
| Issued in reinvestment of distributions | | | — | | | | 1,532,833 | |
| Shares redeemed | | | (829,946 | ) | | | (1,379,582 | ) |
| Net increase (decrease) | | | (477,192 | ) | | | 855,245 | |
See notes to financial statements.
YCG Enhanced Fund
FINANCIAL HIGHLIGHTS
For a Fund share outstanding throughout the year or period.
| | | Six-Months | | | | | | | | | | | | | | | | |
| | | Ended | | | | | | | | | | | | | | | | |
| | | May 31, 2023 | | | Year Ended November 30, | |
| | | (Unaudited) | | | 2022 | | | 2021 | | | 2020 | | | 2019 | | | 2018 | |
| NET ASSET VALUE: | | | | | | | | | | | | | | | | | | |
| Beginning of year or period | | $ | 23.60 | | | $ | 30.98 | | | $ | 23.85 | | | $ | 20.95 | | | $ | 16.99 | | | $ | 16.60 | |
| | | | | | | | | | | | | | | | | | | | | | | | | |
| OPERATIONS: | | | | | | | | | | | | | | | | | | | | | | | | |
| Net investment income (loss) | | | (0.02 | )(a) | | | (0.09 | )(a) | | | (0.09 | )(a) | | | (0.03 | ) | | | 0.02 | | | | 0.06 | |
| Net realized and unrealized | | | | | | | | | | | | | | | | | | | | | | | | |
| gain (loss) on | | | | | | | | | | | | | | | | | | | | | | | | |
| investment securities | | | 2.30 | | | | (4.53 | ) | | | 7.22 | | | | 3.05 | | | | 4.48 | | | | 0.93 | |
| Total from | | | | | | | | | | | | | | | | | | | | | | | | |
| investment operations | | | 2.28 | | | | (4.62 | ) | | | 7.13 | | | | 3.02 | | | | 4.50 | | | | 0.99 | |
| Redemption fee proceeds | | | — | (b) | | | — | (b) | | | — | (b) | | | — | (b) | | | — | (b) | | | — | (b) |
| Dividends from | | | | | | | | | | | | | | | | | | | | | | | | |
| net investment income | | | — | | | | — | | | | — | | | | (0.01 | ) | | | (0.06 | ) | | | (0.07 | ) |
| Dividends from | | | | | | | | | | | | | | | | | | | | | | | | |
| net realized gains | | | — | | | | (2.76 | ) | | | — | | | | (0.11 | ) | | | (0.48 | ) | | | (0.53 | ) |
| Total distributions | | | — | | | | (2.76 | ) | | | — | | | | (0.12 | ) | | | (0.54 | ) | | | (0.60 | ) |
| NET ASSET VALUE: | | | | | | | | | | | | | | | | | | | | | | | | |
| End of year or period | | $ | 25.88 | | | $ | 23.60 | | | $ | 30.98 | | | $ | 23.85 | | | $ | 20.95 | | | $ | 16.99 | |
| | | | | | | | | | | | | | | | | | | | | | | | | |
TOTAL RETURN(c) | | | 9.66 | % | | | (16.56 | %) | | | 29.90 | % | | | 14.49 | % | | | 27.74 | % | | | 6.08 | % |
| | | | | | | | | | | | | | | | | | | | | | | | | |
| SUPPLEMENTAL DATA AND RATIOS: | | | | | | | | | | | | | | | | | | | | | | | | |
| Net assets; end of | | | | | | | | | | | | | | | | | | | | | | | | |
| year or period (000’s) | | $ | 465,563 | | | $ | 435,721 | | | $ | 545,523 | | | $ | 413,553 | | | $ | 317,483 | | | $ | 201,576 | |
| Ratio of expenses to | | | | | | | | | | | | | | | | | | | | | | | | |
| average net assets: | | | | | | | | | | | | | | | | | | | | | | | | |
| Expenses including | | | | | | | | | | | | | | | | | | | | | | | | |
| reimbursement/ | | | | | | | | | | | | | | | | | | | | | | | | |
recoupment(d) | | | 1.19 | % | | | 1.19 | % | | | 1.19 | % | | | 1.19 | % | | | 1.19 | % | | | 1.19 | % |
| Expenses excluding | | | | | | | | | | | | | | | | | | | | | | | | |
| reimbursement/ | | | | | | | | | | | | | | | | | | | | | | | | |
recoupment(d) | | | 1.19 | % | | | 1.19 | % | | | 1.18 | % | | | 1.19 | % | | | 1.20 | % | | | 1.24 | % |
| Net investment income | | | | | | | | | | | | | | | | | | | | | | | | |
| (loss) including | | | | | | | | | | | | | | | | | | | | | | | | |
| reimbursement/ | | | | | | | | | | | | | | | | | | | | | | | | |
recoupment(d) | | | (0.17 | %) | | | (0.38 | %) | | | (0.34 | %) | | | (0.14 | %) | | | 0.09 | % | | | 0.37 | % |
| Net investment income | | | | | | | | | | | | | | | | | | | | | | | | |
| (loss) excluding | | | | | | | | | | | | | | | | | | | | | | | | |
| reimbursement/ | | | | | | | | | | | | | | | | | | | | | | | | |
recoupment(d) | | | (0.17 | %) | | | (0.38 | %) | | | (0.33 | %) | | | (0.14 | %) | | | 0.08 | % | | | 0.32 | % |
Portfolio turnover rate(c) | | | 11 | % | | | 5 | % | | | 18 | % | | | 44 | % | | | 6 | % | | | 21 | % |
(a) | Net investment income (loss) per share has been calculated based on average shares outstanding during the year or period. |
(b) | Amount represents less than $0.01 per share. |
(c) | Not annualized for periods less than one year. |
(d) | Annualized for periods less than one year. |
See notes to financial statements.
YCG Enhanced Fund
NOTES TO FINANCIAL STATEMENTS
May 31, 2023 (Unaudited)
YCG Funds (the “Trust”) is a Delaware statutory trust organized under an Agreement and Declaration of Trust dated September 4, 2012. The Trust is an open-end management investment company, as defined in the Investment Company Act of 1940 (the “1940 Act”), as amended. The Trust consists of one series, YCG Enhanced Fund (the “Fund”). The Fund is classified and operates as a non-diversified fund under the 1940 Act. The Fund commenced operations on December 28, 2012. The Fund’s investment adviser is YCG, LLC (the “Adviser”). There are an unlimited number of authorized shares. The investment objective of the Fund is to maximize long-term capital appreciation with reasonable investment risk.
| 2. | SUMMARY OF SIGNIFICANT ACCOUNTING POLICIES |
The following is a summary of significant accounting policies consistently followed by the Fund in the preparation of its financial statements. The financial statements have been prepared in conformity with accounting principles generally accepted in the United States of America (“GAAP”). The Fund is an investment company and accordingly follows the investment company accounting and reporting guidance of the Financial Accounting Standards Board (“FASB”) Accounting Standards Codification (“ASC”) Topic 946, Financial Services – Investment Companies.
a) Subsequent Events Evaluation – In preparing these financial statements, the Fund has evaluated events and transactions for potential recognition or disclosure resulting from subsequent events through the date the financial statements were issued. This evaluation did not result in any subsequent events that necessitated disclosures and/or adjustments.
b) Foreign Currency – Investment securities and other assets and liabilities denominated in foreign currencies are translated into U.S. dollar amounts at the date of valuation. Purchases and sales of investment securities and income and expense items denominated in foreign currencies are translated into U.S. dollar amounts on the respective dates of such transactions. The Fund does not isolate that portion of the results of operations resulting from changes in foreign exchange rates on investments and currency gains or losses realized between the trade and settlement dates on securities transactions from the fluctuations arising from changes in market prices of securities held. Such fluctuations are included with the net realized and unrealized gain or loss from investments. Reported net realized foreign exchange gains or losses that arise from sales of foreign currencies, currency gains or losses realized between the trade and settlement dates on foreign currency transactions, and the difference between the amounts of dividends, interest, and foreign withholding taxes recorded on the Fund’s books and the U.S. dollar equivalent of the amounts actually received or paid. Net unrealized foreign exchange gains and losses arise
YCG Enhanced Fund
NOTES TO FINANCIAL STATEMENTS (continued)
May 31, 2023 (Unaudited)
from changes in the values of assets and liabilities, other than investments in securities at fiscal period end, resulting from changes in exchange rates.
c) Investment Valuation – The Fund’s investments are valued at fair value. Fair value as used for determining the Fund’s net asset value is in contrast to the use of the term “fair value” for making valuation measurements in connection with preparing the Fund’s financial statements, as discussed below under “Valuation Measurements.” FASB Accounting Standard Codification Topic 820, Fair Value Measurement uses the term “fair value” to refer generally to the value of an asset or liability, regardless of whether that value is based on readily available market quotations or on other inputs.
Securities which are traded on a national stock exchange are valued at the last sale price on the securities exchange on which such securities are primarily traded. Securities that are traded on The Nasdaq OMX Group, Inc., referred to as Nasdaq, are valued at the Nasdaq Official Closing Price. Exchange-traded securities for which there were no transactions are valued at the current bid prices. Securities traded on only over-the-counter markets are valued on the basis of closing over-the-counter bid prices. Short-term debt instruments maturing within 60 days are valued by the amortized cost method, which approximates fair value. Amortized cost is not used if its use would be inappropriate due to credit or other impairments of the issuer, in which case the security’s fair value would be determined, as described below. Debt securities (other than short-term instruments) are valued at the mean price furnished by a national pricing service, subject to review by the Valuation Designee and determination of the appropriate price whenever a furnished price is significantly different from the previous day’s furnished price. Options written or purchased by the Fund are valued at the last sales price. If there are no trades for an option on a given day, options are valued at the mean between the current bid and asked prices. If market quotations are not readily available for a security or if a security’s value has been materially affected by events occurring after the close of the exchange or market on which the security is principally traded, then that security may be valued by another method that the Valuation Designee believes accurately reflects fair value. A security’s valuation may differ depending on the method used for determining fair value. Fair value in this context is the value of securities for which no readily available market quotations exist, as determined in good faith by the Adviser pursuant to fair value methodologies established by the Adviser as the Valuation Designee.
Valuation Measurements
The Fund has adopted authoritative fair valuation accounting standards which establish an authoritative definition of fair value and set out a hierarchy for measuring fair value. These standards require additional disclosures about the various inputs and valuation techniques used to develop the measurements of fair value and a discussion
YCG Enhanced Fund
NOTES TO FINANCIAL STATEMENTS (continued)
May 31, 2023 (Unaudited)
of changes in valuation techniques and related inputs, if any, during the period. In addition, these standards require expanded disclosure for each major category of assets. These inputs are summarized in the three broad levels listed below:
| Level 1 – | Quoted prices in active markets for identical securities. |
| | |
| Level 2 – | Other significant observable inputs (including quoted prices for similar securities, interest rates, prepayment speeds, credit risk, etc.) |
| | |
| Level 3 – | Significant unobservable inputs (including the Fund’s own assumptions in determining the fair value of investments). |
The inputs or methodology used for valuing securities are not an indication of the risk associated with investing in those securities. The following is a summary of the inputs used to value the Fund’s investments as of May 31, 2023:
| | | Level 1 | | | Level 2 | | | Level 3 | | | Total | |
Assets | | | | | | | | | | | | |
| Common Stocks* | | $ | 434,592,150 | | | $ | 12,285,092 | | | $ | — | | | $ | 446,877,242 | |
| Short-Term Investments | | | — | | | | 14,046,192 | | | | — | | | | 14,046,192 | |
| Total Investments | | | | | | | | | | | | | | | | |
| in Securities | | $ | 434,592,150 | | | $ | 26,331,284 | | | $ | — | | | $ | 460,923,434 | |
Liabilities | | | | | | | | | | | | | | | | |
| Other Financial | | | | | | | | | | | | | | | | |
| Instruments** | | | | | | | | | | | | | | | | |
| Options Written | | $ | 691,430 | | | $ | 396,975 | | | $ | — | | | $ | 1,088,405 | |
| * | | Please refer to the schedule of investments to view securities by industry type. |
| ** | | Other Financial Instruments are derivative instruments not reflected in the Schedule of Investments, such as options written, which are reflected at value. |
The Fund did not invest in any Level 3 investments during the period.
d) Option Writing – The Fund may write covered call options and put options on a substantial portion of the Fund’s long equity portfolio as a means to generate additional income and to tax-efficiently enter and exit positions. The Fund will not use this strategy as a means of generating implicit leverage. In other words, if all put options were to be exercised, the Fund will generally have enough cash on hand to purchase the assigned shares. When the Fund writes an option, an amount equal to the premium received by the Fund is recorded as a liability and is subsequently adjusted to the current fair value of the option written. Premiums received from writing options that expire unexercised are treated by the Fund on the expiration date as realized gains from options written. The difference between the premium and the amount paid on effecting a closing purchase transaction, including brokerage commissions, is also treated as a realized gain, or, if the premium is less than the amount paid for the closing purchase transaction, as a realized loss. If a call option is exercised, the premium is added to the proceeds from the sale of the underlying
YCG Enhanced Fund
NOTES TO FINANCIAL STATEMENTS (continued)
May 31, 2023 (Unaudited)
security in determining whether the Fund has realized a gain or loss. If a put option is exercised, the premium reduces the cost basis of the securities purchased by the Fund. The Fund, as a writer of an option, bears the market risk of an unfavorable change in the price of the security underlying the written option. Upon writing an option, the Fund is required to pledge an amount of cash or securities, as determined by the broker, as collateral. As of May 31, 2023, the Fund held securities with a value of $11,902,263 and cash of $4,777,871 as collateral for options written. During the period, the Fund used written covered call and put options in a manner consistent with the strategy described above.
The value of Derivative Instruments on the Statement of Assets and Liabilities as of May 31, 2023, are as follows:
| | Liability Derivatives | |
| Derivatives not | | | |
| accounted for as | | | |
| hedging instruments | Location | Value | |
| Equity Contracts – Options | Options written, at value | $1,088,405 | |
The effect of Derivative Instruments on the Statement of Operations for the period ended May 31, 2023, are as follows:
| | | | Change in Unrealized |
| Amount of Realized Gain (Loss) on | | Appreciation (Depreciation) on |
| Derivatives Recognized in Income | | Derivatives Recognized in Income |
| Derivatives not | | | Derivatives not | |
| accounted for as | Options | | accounted for as | Options |
| hedging instruments | Written | | hedging instruments | Written |
| Equity Contracts | $2,773,374 | | Equity Contracts | ($442,442) |
The average monthly value of options written during the period ended May 31, 2023, was $900,964.
Derivative Risks
The risks of using the various types of derivatives in which the Fund may engage include the risk that movements in the value of the derivative may not fully offset or complement instruments currently held in the Fund in the manner intended by the Adviser, the risk that the counterparty to a derivative contract may fail to comply with its obligations to the Fund, the risk that there may not be a liquid secondary market for the derivative at a time when the Fund would look to disengage the position, the risk that additional capital from the Fund may be called upon to fulfill the conditions of the derivative contract, the risk that the use of derivatives may induce leverage in the Fund, and the risk that the cost of the derivative may reduce the overall returns experienced by the Fund.
YCG Enhanced Fund
NOTES TO FINANCIAL STATEMENTS (continued)
May 31, 2023 (Unaudited)
In October 2020, the SEC adopted new regulations governing the use of derivatives by registered investment companies (“Rule 18f-4”). The Fund has adopted new policies and procedures to comply with Rule 18f-4.
Offsetting Assets and Liabilities
The Fund is subject to various Master Netting Arrangements, which govern the terms of certain transactions with select counterparties. The Master Netting Arrangements allow the Fund to close out and net its total exposure to a counterparty in the event of a default with respect to all the transactions governed under a single agreement with a counterparty. The Master Netting Arrangements also specify collateral posting arrangements at pre-arranged exposure levels. Under the Master Netting Arrangements, collateral is routinely transferred if the total net exposure to certain transactions (net of existing collateral already in place) governed under the relevant Master Netting Arrangement with a counterparty in a given account exceeds a specified threshold depending on the counterparty and the type of Master Netting Arrangement.
The following is a summary of the Assets and Liabilities subject to offsetting in the Fund as of May 31, 2023:
| | | | | Gross Amounts not | |
| | | | | offset in the Statement | |
| | | | | of Assets and Liabilities | |
| | | Gross | Net | | | |
| | | Amounts | Amounts | | | |
| | | Offset | Presented | | | |
| | Gross | in the | in the | | | |
| | Amounts | Statement | Statement | | | |
| | of | of Assets | of Assets | | | |
| Description / | Recognized | and | and | Financial | Collateral | Net |
| Counterparty | Liabilities | Liabilities | Liabilities | Instruments | Pledged | Amount |
| Options Written | | | | | | |
| Interactive Brokers | $1,088,405 | $— | $1,088,405 | $— | $1,088,405 | $— |
In some instances, the collateral amounts disclosed in the tables were adjusted due to the requirement to limit the collateral amounts to avoid the effect of overcollateralization. Actual collateral received/pledged may be more than the amounts disclosed herein.
e) Federal Income Taxes – The Fund intends to qualify as a “regulated investment company” under Subchapter M of the Internal Revenue Code of 1986, as amended. If so qualified, the Fund will not be subject to federal income tax to the extent it distributes substantially all of its net investment income and capital gains to shareholders. Therefore, no federal income tax provision is required.
The Fund has adopted financial reporting rules regarding recognition and measurement of tax positions taken or expected to be taken on a tax return. The
YCG Enhanced Fund
NOTES TO FINANCIAL STATEMENTS (continued)
May 31, 2023 (Unaudited)
Fund recognizes interest and penalties, if any, related to unrecognized tax benefits as income tax expense in the Statement of Operations. As of and during the year ended November 30, 2022, the Fund did not incur any interest or penalties and did not have any liabilities for unrecognized tax benefits.
The Fund is not subject to examination by U.S. tax authorities for tax years prior to the year ended November 30, 2019.
f) Distributions to Shareholders – The Fund will declare and distribute any net investment income and any net realized long or short-term capital gains annually. Distributions to shareholders are recorded on the ex-dividend date. The character of distributions made during the year from net investment income or net realized gains may differ from the characterization for federal income tax purposes due to differences in the recognition of income, expense and gain items for financial statement and tax purposes. Where appropriate, reclassifications between capital accounts are made for such differences that are permanent in nature.
g) Use of Estimates – The preparation of the financial statements in conformity with GAAP requires management to make estimates and assumptions that affect the reported amounts of assets and liabilities and disclosure of contingent assets and liabilities at the date of the financial statements and the reported amounts of increases and decreases in net assets from operations during the reporting period. Actual results could differ from those estimates.
h) Guarantees and Indemnifications – Under the Fund’s organizational documents, its officers and trustees are indemnified by the Fund against certain liabilities arising out of the performance of their duties to the Fund. Additionally, in the normal course of business, the Fund enters into contracts with service providers that contain general indemnification clauses. The Fund’s maximum exposure under these arrangements is unknown as this would involve future claims against the Fund that have not yet occurred. Currently, the Fund expects the risk of loss to be remote.
i) Redemption Fee – Those who buy and sell the Fund within 30 calendar days will incur a 2% redemption fee, retained for the benefit of long-term shareholders, recorded as additional capital in the Statement of Changes in Net Assets.
j) Beneficial Ownership – The beneficial ownership, either directly or indirectly, of more than 25% of the voting securities of the Fund creates a presumption of control of the Fund, under Section 2(a)(9) of the 1940 Act. At May 31, 2023, no shareholder held more than 25% of the outstanding shares of the YCG Enhanced Fund.
k) Other – Investment transactions and shareholder transactions are accounted for on the trade date. Net realized gains and losses on securities are computed on the basis of specific identification. Dividend income is recognized on the ex-dividend date and interest income is recognized on an accrual basis. Discounts and premiums on securities
YCG Enhanced Fund
NOTES TO FINANCIAL STATEMENTS (continued)
May 31, 2023 (Unaudited)
purchased are accreted and amortized over the lives of the respective securities. Withholding taxes on foreign dividends have been provided for in accordance with the Fund’s understanding of the applicable country’s tax rules and regulations.
| 3. | INVESTMENT TRANSACTIONS |
For the period ended May 31, 2023, the aggregate purchases and sales of securities, excluding short-term securities, were $45,516,137 and $65,947,689 respectively for the Fund. For the period ended May 31, 2023, there were no long-term purchases or sales of U.S. Government securities for the Fund.
| 4. | FEES AND OTHER RELATED PARTY TRANSACTIONS |
The Adviser acts as the investment adviser to the Fund pursuant to an investment advisory agreement (the “Advisory Agreement”) which has been approved by the Fund’s Board of Trustees (including a majority of the Trustees who are not parties to the Advisory Agreement, or interested persons of any such party). Under the terms of the Advisory Agreement between the Fund and the Adviser, the Adviser conducts investment research and management for the Fund and is responsible for the purchase and sale of securities for the Fund’s investment portfolio. The Adviser provides the Fund with investment advice, supervises the management and investment programs and provides investment advisory facilities and executive and supervisory personnel for managing the investments and effectuating portfolio transactions. The Adviser also furnishes, at its own expense, all necessary administrative services, office space, equipment and clerical personnel for servicing the investments of the Fund. With the exception of the Chief Compliance Officer, who is an employee of the Adviser, such officers receive no compensation from the Fund for serving in their respective roles. The Fund makes reimbursement payments to the Adviser for the salary and benefits associated with the office of the Chief Compliance Officer. The compliance fees expensed by the Fund during the period ended May 31, 2023, are included in the Statement of Operations. Under the Advisory Agreement, the monthly compensation paid to the Adviser is accrued daily at an annual rate of 1.00% on the average daily net assets of the Fund.
In the interest of limiting the expenses of the Fund, the Adviser has entered into a contractual expense limitation agreement with the Fund. Pursuant to the Expense Limitation Agreement, the Adviser (for the lifetime of the Fund) has agreed to waive or limit its fees and assume other expenses of the Fund (excluding interest, taxes, brokerage commissions and dividend expenses on securities sold short and extraordinary expenses not incurred in the ordinary course of business) so that the Fund’s ratio of total annual operating expenses is limited to 1.39%. In addition to the lifetime limit, the Adviser has agreed to reimburse the Fund to the extent necessary to ensure that total annual fund operating expenses to do not exceed 1.19% at least
YCG Enhanced Fund
NOTES TO FINANCIAL STATEMENTS (continued)
May 31, 2023 (Unaudited)
through April 1, 2024. The Adviser is entitled to the reimbursement of fees waived or reimbursed by the Adviser to the Fund subject to the limitations that (1) the reimbursement is made only for fees and expenses incurred not more than thirty-six months following the month in which the reimbursement occurred, and (2) the reimbursement may not be made if it would cause the Fund’s annual expense limitation to be exceeded. The reimbursement amount may not include any additional charges or fees, such as interest accruable on the reimbursement account. During the period ended May 31, 2023, the Fund reimbursed $5,850 of previously waived expenses, waived $5,218 and let $10,444 fees subject to recoupment expire. As of May 31, 2023, the following expenses are subject to recoupment by the Adviser:
| Year Ending | Year Ending | Year Ending | Year Ending | |
| November 30, | November 30, | November 30, | November 30, | |
| 2023 | 2024 | 2025 | 2026 | Total |
| $58,011 | $9,068 | $30,283 | $5,218 | $102,580 |
Certain officers, trustees and shareholders of the Fund are also owners or employees of the Adviser.
Non-Diversification Risk: The Fund is non-diversified. A non-diversified fund may invest more of its assets in fewer companies than if it were a diversified fund. The Fund may be more exposed to the risks of loss and volatility than a fund that invests more broadly.
Recent Market Conditions: General economic, political and public health conditions may have a significant adverse effect on the Fund’s investment operations and profitability. For example, the global outbreak of COVID-19 (commonly referred to as “coronavirus”) has disrupted economic markets worldwide, as well as the economies of individual countries. The long-term fallout from COVID-19 and its impact on economies, markets, industries and individual issuers, is not known. The operational and financial performance of the issuers of securities in which the Fund invests depends on future developments and such uncertainty may in turn adversely affect the value and liquidity of the Fund’s investments, impair the Fund’s ability to satisfy redemption requests, and negatively impact the Fund’s performance. Additionally, on February 24, 2022, Russia commenced a military attack on Ukraine which has led to various countries, including the US, imposing economic sanctions on certain Russian individuals and entities. The current political and financial uncertainty regarding the Russia-Ukraine conflict may have adverse effects on market volatility and global economic growth as well as the markets for certain securities and commodities, such as oil and natural gas, among other sectors. The duration of the conflict, potential for escalation and ultimate effects on the Fund cannot currently be predicted.
YCG Enhanced Fund
NOTES TO FINANCIAL STATEMENTS (continued)
May 31, 2023 (Unaudited)
The above are only a few of the principal risks of the Fund. The other principal risks are discussed in the Fund’s most recent Prospectus.
| 6. | FEDERAL TAX INFORMATION |
A. Tax Basis of Distributions to Shareholders: The tax character of the distributions paid by the Fund were as follows:
| | | For the Year Ended | | | For the Year Ended | |
| | | November 30, 2022 | | | November 30, 2021 | |
| Ordinary Income | | $ | 10,010,993 | | | $ | — | |
| Long-Term Capital Gains | | | 38,622,162 | | | | — | |
| Total | | $ | 48,633,155 | | | $ | — | |
Reclassifications: The tax components of distributable earnings are determined in accordance with income tax regulations which may differ from the compositions of net assets reported under GAAP. Accordingly, for the year ended November 30, 2022, certain differences were reclassified. The reclassifications were as follows:
| Paid-in Capital | | | ($180,038 | ) |
| Distributable earnings (accumulated deficit) | |
| $180,038 | |
These differences are primarily due to net operating loss lost.
YCG Enhanced Fund
NOTES TO FINANCIAL STATEMENTS (continued)
May 31, 2023 (Unaudited)
B. Tax Basis of Investments
As of November 30, 2022, the components of the tax basis cost of investments and net unrealized appreciation (depreciation) were as follows:
| | | YCG Enhanced Fund | |
| | | | | | Written | | | Foreign | |
| | | Investments | | | Options | | | Currencies | |
| Tax cost of investments | | $ | 290,133,594 | | | $ | 253,515 | | | $ | 1,964,092 | |
| Gross unrealized appreciation | | | 170,386,632 | | | | 360,800 | | | | (134,817 | ) |
| Gross unrealized depreciation | | | (28,713,120 | ) | | | — | | | | — | |
| Net tax unrealized | | | | | | | | | | | | |
| appreciation (depreciation) | | | 141,673,512 | | | | 360,800 | | | | (134,817 | ) |
| Undistributed ordinary income | | | — | | | | — | | | | — | |
| Undistributed long-term | | | | | | | | | | | | |
| capital gains (loss) | | | — | | | | — | | | | — | |
| Accumulated gain (loss) | | | — | | | | — | | | | — | |
| Other accumulated gain (loss) | | | (5,743,810 | ) | | | — | | | | — | |
| Distributable earnings | | | | | | | | | | | | |
| (accumulated deficit) | | $ | 135,929,702 | | | $ | 360,800 | | | $ | (134,817 | ) |
The tax basis of investments for tax and financial reporting purposes differs, principally due to the deferral of losses on wash sales.
At November 30, 2022 the Fund had the following capital loss carryforwards:
| | Short-Term | Long-Term | Expires | |
| | $4,166,709 | $— | Indefinite | |
Net capital losses incurred after October 31, and within the taxable year are deemed to arise on the first business day of the Fund’s next taxable year. Qualified late-year ordinary losses are the excess of the sum of the specified loss attributable to the portion of the taxable year after October 31, and the late-year losses attributable to the portion of the taxable year after December 31, over the sum of the specified gains attributable to the portion of the taxable year after October 31, and other ordinary income attributable to the portion of the taxable year after December 31. For the fiscal year ended November 30, 2022, there were late year losses deferred of $1,576,676.
YCG Enhanced Fund
ADDITIONAL INFORMATION
(Unaudited)
| 1. | SHAREHOLDER NOTIFICATION OF FEDERAL TAX STATUS |
For the year ended November 30, 2022, 29.64% of the dividends paid from net investment income, including short-term capital gains, for the Fund qualify for the dividends received deduction available to corporate shareholders.
For the year ended November 30, 2022, 36.37% of the dividends paid from net investment income, including short-term capital gains, for the Fund are designated as qualified dividend income.
| 2. | COMPENSATION OF TRUSTEES |
Each Trustee who is not an “interested person” of the Trust (i.e. an “Independent Trustee”) receives an annual retainer of $4,000, paid quarterly, as well as $1,000 per meeting attended. In addition, Independent Trustees are eligible for reimbursement of out-of-pocket expenses incurred in connection with attendance at such meetings. The Fund’s Statement of Additional Information includes additional information about the Trustees and is available upon request by calling toll free 1-855-444-9243 or by accessing the Fund’s website at www.ycgfunds.com. (Note for clarification: The information on our website is not incorporated by reference into this report.)
| 3. | PROXY VOTING POLICIES AND PROCEDURES |
For a description of the policies and procedures that the Fund uses to determine how to vote proxies relating to portfolio securities, please call 1-855-444-9243 and request a Statement of Additional Information. One will be mailed to you free of charge. The Statement of Additional Information is also available on the Fund’s website at www.ycgfunds.com or on the website of the Securities and Exchange Commission at http://www.sec.gov. Information on how the Fund voted proxies relating to portfolio securities during the most recent 12-month period ended June 30 is available without charge, upon request, by calling 1-855-444-9243 or by accessing the website of the Securities and Exchange Commission at http://www.sec.gov.
| 4. | DISCLOSURE OF PORTFOLIO HOLDINGS |
The Fund files a complete schedule of portfolio holdings with the Securities and Exchange Commission for the first and third quarters of each fiscal year as an exhibit to its reports on Form N-PORT. The Fund’s Form N-PORT reports are available on the website of the Securities and Exchange Commission at http://www.sec.gov or on request by calling 1-800-SEC-0330.
YCG Enhanced Fund
ADDITIONAL INFORMATION (continued)
(Unaudited)
| 5. | LIQUIDITY RISK MANAGEMENT |
On January 24, 2023, the Trustees of YCG Enhanced Fund, the sole series of YCG Funds, reviewed and considered a written report prepared by the program administrator of the Fund’s Liquidity Risk Management Program (the “Program”), the Fund’s Liquidity Risk Management Committee (the “Program Administrator”), which addressed the operation of the Program and assessed the Program’s adequacy and effectiveness of implementation. In considering the report, the Trustees noted that the Program Administrator has determined that the Fund primarily holds assets that are highly liquid investments, and thus relies on the exclusion from the requirements to determine and review a highly liquid investment minimum and to adopt shortfall policies and procedures. They then confirmed with the Program Administrator that no material changes were made to the Program, and reviewed all of the material features of the Program to ensure that they understand how the Program is designed to assess and manage the risk that the Fund could not meet requests to redeem shares issued by the Fund without significant dilution of remaining investors in the Fund. Following this review and discussion, the Trustees determined that they believe the disclosures in the report, taken as a whole, provide the information necessary for the Trustees to effectively assess the Program and its implementation, and that they are comfortable with the report’s conclusion that the Program is reasonably designed to assess and manage the Fund’s liquidity risk, and that the Program has operated as intended during the past year.
YCG Enhanced Fund
TRUSTEES AND OFFICERS
(Unaudited)
The business of the Fund is managed under the direction of the Board. The Board formulates the general policies of the Fund and meets periodically to review the Fund’s performance, monitor investment activities and practices, and discuss other matters affecting the Fund. The Trustees are fiduciaries for the Fund’s shareholders and are governed by the laws of the State of Delaware in this regard. The names and addresses of the Trustees and Officers of the Trust are listed below along with a description of their principal occupations over at least the last five years. Trustees who are “interested persons”, as defined by the 1940 Act, are indicated by asterisk. The Fund’s Statement of Additional Information includes additional information about the Trustees and is available, without charge, upon request by (1) calling toll free 1-855-444-9243; (2) on the Fund’s website located at http://www.ycgfunds.com; or (3) on the SEC’s website http://www.sec.gov.
| | | Term of | | | |
| | | Office | Number of | | |
| | | and | Portfolios | Principal | Other |
| | Position(s) | Length | in Fund | Occupation(s) | Directorships |
| Name, address | Held with | of Time | Complex | During Past | Held by |
and age | the Fund | Served | Overseen | Five Years | Trustee |
| | | | | | |
| Brian Yacktman* | Trustee | Indefinite, | 1 | Manager, Founding | None. |
| 3207 Ranch Road | | Trustee | | Partner and Chief | |
| 620 South, Suite 200 | | since 2012 | | Investment Officer, | |
| Austin, TX 78738 | President | One year | | YCG, LLC | |
| Age: 43 | | term, | | since 2007, | |
| | | President | | and investment | |
| | | since 2012 | | adviser to the | |
| | | | | Fund, since 2012. | |
| | | | | | |
| William D. Kruger* | Chairman | Indefinite, | 1 | Manager, Partner | None. |
| 3207 Ranch Road | and | Trustee | | and CEO, YCG, | |
| 620 South, Suite 200 | Trustee | since 2012 | | LLC since 2008, | |
| Austin, TX 78738 | Vice | One year | | and investment | |
| Age: 43 | President | term, Vice | | adviser to the | |
| | and | President | | Fund, since 2012. | |
| | | since 2012 | | | |
| | Treasurer | One year | | | |
| | | term, | | | |
| | | Treasurer | | | |
| | | since 2012 | | | |
| | | | | | |
YCG Enhanced Fund
TRUSTEES AND OFFICERS (continued)
(Unaudited)
| | | Term of | | | |
| | | Office | Number of | | |
| | | and | Portfolios | Principal | Other |
| | Position(s) | Length | in Fund | Occupation(s) | Directorships |
| Name, address | Held with | of Time | Complex | During Past | Held by |
and age | the Fund | Served | Overseen | Five Years | Trustee |
| | | | | | |
| Independent Trustees: | | | | | |
| | | | | | |
| Travis E. Oliphant, PhD. | Trustee | Indefinite, | 1 | Software Executive | None. |
| 3207 Ranch Road | | Trustee | | and Venture | |
| 620 South, Suite 200 | | since 2012 | | Investor. CEO | |
| Austin, TX 78738 | |
| | Quansight | |
| Age: 51 | |
| | (2018 – Present). | |
| | |
| | CEO OpenTeams | |
| | |
| | (2020 – Present). | |
| | | | | | |
| Rory M. McDonald | Trustee | Indefinite, | 1 | Associate Professor | None. |
| 3207 Ranch Road | | Trustee | | of Business | |
| 620 South, Suite 200 | | since 2012 | | Administration in | |
| Austin, TX 78738 | |
| | the Technology | |
| Age: 44 | |
| | and Operations | |
| | |
| | Management Unit | |
| | |
| | at Harvard Business | |
| | |
| | School, 2013 – Present. | |
| | | | | | |
| Cyril James Speirs | Trustee | Indefinite, | 1 | Retired. | None. |
| 3207 Ranch Road | | Trustee | | | |
| 620 South, Suite 200 | | since 2017 | | | |
| Austin, TX 78738 | | | | | |
| Age: 67 | | | | | |
YCG Enhanced Fund
TRUSTEES AND OFFICERS (continued)
(Unaudited)
| | | Term of | | | |
| | | Office | Number of | | |
| | | and | Portfolios | Principal | Other |
| | Position(s) | Length | in Fund | Occupation(s) | Directorships |
| Name, address | Held with | of Time | Complex | During Past | Held by |
and age | the Fund | Served | Overseen | Five Years | Trustee |
| | | | | | |
| Officers who are not Trustees: |
| | | | | | |
| Elliott Savage | Vice | One year | N/A | Manager, | N/A |
| 3207 Ranch Road | President | term, Vice | | Partner and | |
| 620 South, Suite 200 | | President | | Portfolio Manager, | |
| Austin, TX 78738 | | since | | YCG, LLC, | |
| Age: 42 | | December | | investment adviser | |
| | | 2012 | | to the Fund, | |
| | Secretary | One year | | since 2012. | |
| | | term, | | | |
| | | Secretary | | | |
| | | since | | | |
| | | February | | | |
| | | 2016 | | | |
| | Assistant | One year | | | |
| | Treasurer | term, | | | |
| | | Assistant | | | |
| | | Treasurer | | | |
| | | since | | | |
| | | December | | | |
| | | 2012 | | | |
| | | | | | |
| Lelia Long | Chief | One year | N/A | Chief Compliance | N/A |
| 3207 Ranch Road | Compliance | term, Chief | | Officer, YCG, LLC | |
| 620 South, Suite 200 | Officer | Compliance | | (2017 – present), | |
| Austin, TX 78738 |
| Officer | | Investment | |
| Age: 60 |
| since | | Management & | |
| |
| March 2016 | | Compliance | |
| | |
| | Consultant, Vigilant | |
| | |
| | Compliance LLC, | |
| | |
| | (2009 – 2020). | |
| | |
| | Treasurer, New | |
| | |
| | Ireland Fund, Inc. | |
| | |
| | (2002 – 2020). | |
| * | Brian Yacktman and William Kruger are considered to be “interested persons” of the Trust, a term that is defined in the 1940 Act. Mr. Yacktman and Mr. Kruger are interested persons because: (1) each is an officer of the Trust; and (2) each is the owner of the investment adviser to the Fund. |
Each Trustee holds office for an indefinite term and until the earlier of: the Trust’s next meeting of shareholders and the election and qualification of his successor; or until the date a trustee dies, resigns or is removed in accordance with the Trust’s Declaration of Trust and By-laws. Each officer holds office at the pleasure of the Board and serves for a period of one year, or until his successor is duly elected and qualified.
(This Page Intentionally Left Blank.)
For Fund information and shareholder services, call
1-855-444-9243
web site: www.ycgfunds.com
YCG Funds
c/o U.S. Bancorp Fund Services, LLC
P.O. Box 701
Milwaukee, WI 53201-0701
Investment Adviser
YCG, LLC
3207 Ranch Road 620 South, Suite 200
Austin, TX 78738
Legal Counsel
Foley & Lardner LLP
777 East Wisconsin Avenue
Milwaukee, WI 53202
Independent Registered Public Accounting Firm
Cohen & Company, Ltd.
151 North Franklin Street, Suite 575
Chicago, IL 60606
Transfer Agent, Fund Accountant, and Fund Administrator
U.S. Bancorp Fund Services, LLC
615 East Michigan Street
Milwaukee, WI 53202
Custodian
U.S. Bank, N.A.
1555 North RiverCenter Drive, Suite 302
Milwaukee, WI 53212
Distributor
Vigilant Distributors, LLC
Gateway Corporate Center, Suite 216
223 Wilmington West Chester Pike
Chadds Ford, PA 19317
This report is submitted for the general information of shareholders of the YCG Enhanced Fund. It is not authorized for distribution to prospective investors unless accompanied or preceded by an effective Prospectus for the Fund, which contains more information concerning the Fund’s investment policies, as well as fees and expenses and other pertinent information. Read the Prospectus carefully.
SAR-YCG
Item 2. Code of Ethics.
Not applicable for semi-annual reports.
Item 3. Audit Committee Financial Expert.
Not applicable for semi-annual reports.
Item 4. Principal Accountant Fees and Services.
Not applicable for semi-annual reports.
Item 5. Audit Committee of Listed Registrants.
Not applicable to registrants who are not listed issuers (as defined in Rule 10A-3 under the Securities Exchange Act of 1934).
Item 6. Investments.
Schedule of Investments is included as part of the report to shareholders filed under Item 1 of this Form.
Item 7. Disclosure of Proxy Voting Policies and Procedures for Closed-End Management Investment Companies.
Not applicable to open-end investment companies.
Item 8. Portfolio Managers of Closed-End Management Investment Companies.
Not applicable to open-end investment companies.
Item 9. Purchases of Equity Securities by Closed-End Management Investment Company and Affiliated Purchasers.
Not applicable to open-end investment companies.
Item 10. Submission of Matters to a Vote of Security Holders.
Not Applicable.
Item 11. Controls and Procedures.
| (a) | The Registrant’s Principal Executive Officer and Principal Financial Officer have reviewed the Registrant's disclosure controls and procedures (as defined in Rule 30a-3(c) under the Investment Company Act of 1940 (the “Act”)) as of a date within 90 days of the filing of this report, as required by Rule 30a-3(b) under the Act and Rules 13a-15(b) or 15d-15(b) under the Securities Exchange Act of 1934. Based on their review, such officers have concluded that the disclosure controls and procedures are effective in ensuring that information required to be disclosed in this report is appropriately recorded, processed, summarized and reported and made known to them by others within the Registrant and by the Registrant’s service provider. |
| (b) | There were no changes in the Registrant's internal control over financial reporting (as defined in Rule 30a-3(d) under the Act) that occurred during the period covered by this report that have materially affected, or are reasonably likely to materially affect, the Registrant's internal control over financial reporting. |
Item 12. Disclosure of Securities Lending Activities for Closed-End Management Investment Companies
Not applicable to open-end investment companies.
Item 13. Exhibits.
| (a) | (1) Any code of ethics or amendment thereto, that is the subject of the disclosure required by Item 2, to the extent that the registrant intends to satisfy Item 2 requirements through filing an exhibit. Not Applicable. |
(3) Any written solicitation to purchase securities under Rule 23c-1 under the Act sent or given during the period covered by the report by or on behalf of the registrant to 10 or more persons. Not applicable to open-end investment companies.
(4) Change in the registrant’s independent public accountant. There was no change in the registrant’s independent public accountant for the period covered by this report.
SIGNATURES
Pursuant to the requirements of the Securities Exchange Act of 1934 and the Investment Company Act of 1940, the registrant has duly caused this report to be signed on its behalf by the undersigned, thereunto duly authorized.
(Registrant) YCG Funds
By (Signature and Title)* /s/Brian A. Yacktman
Brian A. Yacktman, President (Principal Executive Officer)
Pursuant to the requirements of the Securities Exchange Act of 1934 and the Investment Company Act of 1940, this report has been signed below by the following persons on behalf of the registrant and in the capacities and on the dates indicated.
By (Signature and Title)* /s/Brian A. Yacktman
Brian A. Yacktman, President (Principal Executive Officer)
By (Signature and Title)* /s/William D. Kruger
William D. Kruger, Treasurer (Principal Financial Officer)
* Print the name and title of each signing officer under his or her signature.