As filed with the Securities and Exchange Commission on 8/6/2019
UNITED STATES
SECURITIES AND EXCHANGE COMMISSION
Washington, D.C. 20549
FORMN-CSR
CERTIFIED SHAREHOLDER REPORT OF REGISTERED
MANAGEMENT INVESTMENT COMPANIES
Investment Company Act file number811-22761
Stone Ridge Trust
(Exact name of registrant as specified in charter)
510 Madison Avenue, 21st Floor
New York, NY 10022
(Address of principal executive offices) (Zip code)
Stone Ridge Asset Management LLC
510 Madison Avenue, 21st Floor
New York, NY 10022
(Name and address of agent for service)
(855)609-3680
Registrant’s telephone number, including area code
Date of fiscal year end: May 31, 2019
Date of reporting period: May 31, 2019
Item 1. Reports to Stockholders.
Annual Report
May 31, 2019

Elements U.S. Portfolio
Elements U.S. Small Cap Portfolio
Elements International Portfolio
Elements International Small Cap Portfolio
Elements Emerging Markets Portfolio
Beginning on January 1, 2021, as permitted by regulations adopted by the Commission, paper copies of the Portfolios’ shareholder reports will no longer be sent by mail, unless you specifically request paper copies of the reports from your financial intermediary or, if you invest directly through the Portfolios’ transfer agent, U.S. Bancorp Fund Services, LLC (the “Transfer Agent”), from the Transfer Agent. Instead, the reports will be made available on a website, and you will be notified by mail each time a report is posted and provided with a website link to access the report.
If you already elected to receive shareholder reports electronically, you will not be affected by this change and you need not take any action. You may elect to receive shareholder reports and other communications electronically by contacting your financial intermediary.
You may elect to receive all future reports in paper free of charge by contacting your financial intermediary or, if you invest directly through the Transfer Agent, by contacting the Transfer Agent at (855) 609-3680. Your election to receive reports in paper will apply to all funds held in your account if you invest through a financial intermediary or all funds within the fund complex if you invest directly through the Transfer Agent.
Shareholder Letter
The shareholder letter below is reprinted from the Annual Report of the Stone Ridge Funds for the year ended October 31, 2018. The letter is dated December 2018 and speaks only as of its date. No updates have been made to, and no undertaking has been made to update, any data or other information contained in the letter.
“The high volatility of stock returns is common knowledge, but many professional investors seem unaware of its implications.”
- Eugene Fama (2018),Volatility Lessons
“It’s not supposed to be this easy to make so much money, especially with such remarkable consistency.”
- Foreword toReducing the Risk of Black Swans(December 2017), referring to the S&P 500
“It’s possible to go forward with no 60/40 at all. In fact, it may even be necessary.”
- Stone Ridge 2017 Shareholder Letter
“Don’t tell me what you ‘think,’ just tell me what’s in your portfolio.”
- Nassim Taleb (2018),Skin in the Game
December 2018
Dear Fellow Shareholder:
We just passed the 10th anniversary of the discovery that Bernie Madoff was running a Ponzi scheme,1 a sobering reminder of how easy it is for any of us to believe things we want to be true. I was given an opportunity to invest in Madoff in 1998. At the time, I was running a fund with lots of excess cash and Madoff was pitched to me as a cash management tool, given its (lack of) volatility and positive mean. After seeing the cumulative return chart, I passed – due solely, and thankfully, to my training in the finance department at the University of Chicago. We just don’t get 45 degree lines in finance. In trigonometry maybe, but not in finance.
All along, there was one Madoff “game over” diligence question, hiding in plain sight. Madoff was supposedly too big for the listed options markets, which was the given reason why his trades never showed up on the tape.
So if Madoff did all of his “trading”over-the-counter (OTC), the only necessary diligence question would have been“Who are the OTC counterparties?”Just one name would have sufficed. And we wouldn’t even have needed to ask the OTC counterpartywhatMadoff trades orhowhe trades, justthathe trades.
Of course, there would have been no name because there were no trades, OTC or listed, ever. Tragically, no one asked this simple question. We should never underestimate the power of believing things we want to be true.
| 1 | For a riveting podcast on the Madoff scandal, check out The Alpha Exchange, with host Dean Curnutt interviewing Harry Markopolos, to whom I attribute the content of this section. |
| | | | | | | | | | | | | | | | |
| | Elements Portfolios | | | | | | Annual Report | | | | | | May 31, 2019 | | |
| | | | |
1
Shareholder Letter
Is the Equity Risk Premium Positive?
“The disease is spread by contagion. For example, consider the introduction of scurvy into French military hospitals by veterans returning from war, or the rapid spread of scurvy from one sailor to another in naval vessels.”
-Dr. Jean-Antoine Villemin, member of the prestigious Paris Academy of Medicine, and the first to demonstrate that tuberculosis was an infectious disease, speaking in 1874 and echoing the near universal view of scurvy at the time and since themid-1500s
“It ain’t what you don’t know that gets you into trouble. It’s what you know for sure that just ain’t so.”
- maybe Mark Twain
From themid-1500s until about 1900, scurvy plagued the shipping industry. Generations of medical researchers frantically searched for a cure. Back then, most of the world was as convinced about how scurvy “spread” as we are today about the theory of gravity: scurvy was a communicable,germ-spread disease passed sailor to sailor over long journeys in close quarters. Unfortunately, this was also the era ofhero-making scientific breakthroughs ingerm-detection processes, which blinded thegerm-focused researchers to the truth for centuries.
Thegerm-spread theory turned out to be false. We know today that scurvy is a disease caused solely by lack of vitamin C in the diet. Germs have nothing to do with it. Tragically, even in the beginning of the last century, after thediet-based “cure” for scurvy became widely accepted, many prominent infectious disease researchers kept bacteria hunting. They so strongly believed what they wanted to be true.
The story of scurvy is only one of innumerable examples throughout history in which the world was utterly convinced of something important that turned out to be false (e.g., the earth is flat, the sun revolves around the earth, smoking is not bad for you).
Today, the world is convinced that the stock market has a positive risk premium – because for 90+ years it has. The world is equally convinced that every time the stock market goes down, no matter how far or for how long, it always comes back – because for 90 years it has.
Let’s be careful with what we know for sure, that maybe just ain’t so.
First, let’s dimension uncertainty about the mean
In recent work, Nobel Prize winner Eugene Fama rigorously quantifiesthe substantial role luck will play in the future realized equity risk premium.2 Despite utilizing the heftyhistorical equity risk premium to anchor his analysis, Fama shows that negativefuturerealized equity premiums should still occur in 1 in 4five-year periods, 1 in 9twenty-year periods, and 1 in 12thirty-year periods. 1 in 12 is not low.
While Fama’s conclusion about the important role chance plays in markets is nothing new, he warns us “many professional investors seem unaware of its implications.” Let’s try the following thought experiment: how much of our future quality of life is riding on the performance of our stock portfolios over the next 30 years? What would have to change if it’s cumulatively negative?
| 2 | Eugene Fama (2018), Volatility lessons, working paper, University of Chicago Booth School of Business. |
| | | | | | | | | | | | | | | | |
| | Elements Portfolios | | | | | | Annual Report | | | | | | May 31, 2019 | | |
| | | | |
2
Shareholder Letter
It’s a fiduciary’s responsibility to wonder if the equity risk premium, like all risk premiums, will be the same going forward as it’s been in the past.
Price-insensitive buying
Consider the buying behavior of just one market participant, Vanguard. Over the last five years, Vanguard – with a ~50% market share of the index fund market – averaged about $300 million of net buying of U.S. stocks per day, every day, from just their two largest mutual funds and two largest ETFs.3 This doesn’t include the role of State Street, iShares, and others who, together, represent the other ~50% of the index fund market. Let’s conservatively assume that there’s been at least $500 million of net buying of U.S. stocks per day during this period from index players. Now consider the implications of theprice-insensitive nature of index fund behavior. In what other industry do the largest customers say to their merchants, “I’m going to buy at least $500 million of your product per day, every day ok? You’re asking if I want a great deal for giving you that kind of volume. Well, I appreciate you asking, but no, actually, I don’t. I’m going to show up to buy from you at your offer price, every day, no matter what your offer price is.”
While there are many factors that drive stock returns, years of unprecedented index fund net buying of the same names unquestionably helped. The market largely went straight up with bursts of “epic quiet” volatility, fueled by index funds mechanically buying every dip. Index funds provided “Corporate QE” (QE = quantitative easing), with an impact on stocks likely on par with what global Central Bank QE provided for bonds. Systemic risk lurks when theprice-insensitive net buying becomesprice-insensitive net selling.4
The combined effect of global Central Bank money printing, zero percent interest rates, and price-insensitive net buying from equity index funds makes it difficult to support the view that the future equity risk premium will be higher than it’s been in the past. Perhaps it’s the same, but common sense suggests it will be lower. Using a more conservative, but still positive, estimate for the future equity risk premium – that is, just shifting Fama’s starting point for the equity risk premium in his analysis from the historical level to something smaller – Fama’s methodology could easily show there is really a 1 in 5 chance, not 1 in 12, that the equity risk premium will be negative for futurethirty-year periods. It’s prudent tore-underwrite whether we would take that kind of risk with so much of our life savings.
Unfortunately, the news for stocks gets worse.
What has really caused wealth creation in the stock market?
Since 1926, when the CRSP5database began, there have been approximately 26,000 U.S. public companies that, collectively, have delivered about $35 trillion of wealth creation for their shareholders. So it might seem absurd to question whether the equity risk premium is positive. But let’s be precise in our use of “is” versus “was” and be extra careful about believing things we want to be true.
The evidence that stock returns exceed therisk-free return in the long term is based on broadly diversified portfolios. That is, “the market.” And, on this topic the science is, indeed, settled, if only historically. The stock market as a whole has soundly beaten Treasury bills(T-bills) since 1926. However, if instead we focus on individual stock returns, the story is more nuanced, and what the data tells us is remarkable.
| 4 | To highlight the fragility just below the surface, consider that this month the most liquid tool for hedging market risk, S&P 500E-mini futures, has volume available on the best bid and offer between 2/5th and 1/20th of what was available 12 months ago. |
| 5 | Center for Research in Security Prices at the University of Chicago. |
| | | | | | | | | | | | | | | | |
| | Elements Portfolios | | | | | | Annual Report | | | | | | May 31, 2019 | | |
| | | | |
3
Shareholder Letter
In groundbreaking new work, Hendrik Bessembinder shows us that, even during the golden age of public equities these last ~90 years, the majority of individual stocks have returned less thanT-bills. And this holds at every time horizon: monthly, quarterly, annually, and all the way out to cumulative lifetime returns.6 Taken together with the substantially positive historical equity risk premium, we’re forced to conclude that the entire premium itself has been driven by relatively few stocks.
How few?Bessembinder shows that, astonishingly, only 4% of stocks explain all stock market-driven wealth creation since 1926. The other 96% are a push. Further, the majority of stocks have negative lifetime returns. And the single most common return for a public company?-100%. Let’s pause,re-read this paragraph, and begin to consider its implications.
Perhaps there are no implications, and the results should be met with a shrug. Who really cares if all the gains are concentrated in a few stocks as long as one holds the entire market?i
What do we want to be true about the sign of the equity risk premium?
“The singular goal is to invest in those very few mega deals that deliver crushing returns. Anything less simply won’t move the needle.”
- Joe Dwyer, Founder Equity blog (2014), on the importance of the right tail in venture capital investing
If wedouble-click on Bessembinder’s 4% and look even more narrowly at only the top 25 wealth generating stocks since 1926, including names like Amazon and Microsoft, we see that those 25 – less than 1 in 1000 stocks ever to exist – account for ~30% of all stockmarket-driven wealth creation. We also see that theinflation-adjusted current market cap of those stocks is, on average, about 400 times larger now compared to when each first appeared in CRSP. Amazon’s and Microsoft’s ratios are about 1000x and 400x, respectively. These firms clearly achieved venturecapital-style returns via public markets and those returns were available to public market investors because those companies went public with relatively modest first day market caps of $696 million and $1.9 billion, respectively.
Now, let’s examine twowell-known private companies considering 2019 IPOs: Peloton and Uber. Capital markets professionals believe that the initial public market IPO valuation of each company could be $10 billion and $120 billion, respectively. Applying the 400x standard above would imply that someday Peloton would have to be a $4 trillion company and someday Uber would have to be a $48 trillion company. Both numbers are preposterous. I don’t know anyone at Uber, but I do at Peloton as I’m a shareholder, and I think Peloton is one of the best run companies in the world today. However, with all due respect to Peloton’s phenomenal executives, there is no way it’s going to be a $4 trillion company.
If we look under the hood of each firm, wewill find investors whodid earn more than 400x on their investments. They were the early stage investors, either via venture funds or via direct stock purchases.
So400x returns remain available, but they have moved to the private markets. Onerous regulations, primarilySarbanes-Oxley, but also many others, disproportionately hit small stocks, and may have contributed to the trend of the best companies, like Peloton, staying private longer – and, critically for public market investors, until they are no longer small.
An IPO is just a method of financing, period. Nothing fundamental changes overnight,post-IPO, about the quality of a firm’s products or about its relationship with its customers.
| 6 | Hendrik Bessembinder (2018), Do stocks outperform treasury bills? Forthcoming in the Journal of Financial Economics. |
| | | | | | | | | | | | | | | | |
| | Elements Portfolios | | | | | | Annual Report | | | | | | May 31, 2019 | | |
| | | | |
4
Shareholder Letter
So who would go public? Only companies that have to, where “have to” is defined as a) needing the money, or b) needing to create liquidity for their early investors and/or employees who own shares.
The growth in private markets has created adverse selection in the quality of companies that go public small. Essentially, what the private markets – with a far higher bar for return on invested capital – have told small IPO companies is: “We won’t fund your growth any more, and we certainly won’t fund your early investors and/or employees cashing out. If you don’t want to go away, go public where the questions are easier and the bar for funding is much lower.”
Taken together, in my view, Bessembinder’s work, combined with the explosion in private markets and the resulting elimination of the “right tail” (i.e., 400x) for individual stock public market returns –the entire source of the historical equity risk premium – drives a stake through the heart of public equities as an asset class.
Too good to be true?
While the empirical analysis is compelling, it’s unnecessary. We can combine the parable of “The Emperor’s New Clothes” with the lessons from Madoff and briefly review certain aspects of the public equity market:
We get to make on average4-6% annualized excess return in a tradeeveryone knows about, with limitless capacity andtax-free compounding, and we get the exposure permanently for free with a single mouse click? And we can invest without fear because if our positions go down, regardless of how much, all we have to do is be patient and they willalways come back?
Perhaps what’s above should start with “Once upon a time…”? It sounds like a magic money tree more fitting a Hans Christian Andersen story than as the prime driver of folks’ future ability to retire and stay retired with dignity. Public equities are the most crowded trade in capital markets today, with an unrelenting gusher of price-insensitive money rushing in (for now). Is there another asset class whose owners feel a stronger sense of entitlement to positive,long-term returns?
Public equities no longer pass the smell test because a free and limitlessreturn-generating mechanism that delivers a4-6% annual risk premium means that it’s too easy to make too much money with no work. Nothing in life that good is that easy.When the4-6%7equity risk premium was available, it wasn’t clear that was the size of the premium. Realized risk premiums are only obvious in hindsight.
Let’s see what happens in the coming decades. For investors with substantial public equity allocations, it’s appropriate tore-assess the retirement lifestyle impact if what they currently believe about the public equity risk premium turns out not to be true.
I interpret Bessembinder’s work to suggest that the likely sign of the equity risk premium is not statistically positive going forward and, at best, the equity risk premium is much smaller now than it has been historically. As a practical matter, in light of the substantial uncertainty around the estimate of the true mean excess return of the overall market, a 50% public equities allocation – common in the wealth
| 7 | Equity risk premium estimate from Damodaran, A., “Equity Risk Premiums (ERP): Determinants, Estimation and Implications – The 2018 Edition,” Stern School of Business, working paper. |
| | | | | | | | | | | | | | | | |
| | Elements Portfolios | | | | | | Annual Report | | | | | | May 31, 2019 | | |
| | | | |
5
Shareholder Letter
management industry – is too high.8Prudent risk management requires that the more uncertain we are about future expected excess return of any asset class, the more conservative (i.e., truly diversified) of an allocation we should have. Simply put, let’s not keep 50% of our eggs in one basket, if our future depends on those eggs.
In light of the unmeasurable model uncertainty inherent in all areas of the capital markets, my personal investing rule is that nothing – literally nothing no matter what – deserves more than a 10% allocation. For my own life savings I find anything more concentrated too risky.
Skin in the Game at Stone Ridge
The profound, and unavoidable, implications of model uncertainty surface an important motivational element of what caused me to start Stone Ridge in the first place: to help our investors and our employees (including me) truly diversify and thereforede-risk the path to and through retirement. We take the “buy the market” philosophy of a firm like Vanguard, marry it with the patient “m choose n” execution innovation of a firm like Dimensional Fund Advisors (DFA), and apply it to what we believe to be valuable and diversifying asset classes where it hasn’t been applied before.
However,our core original innovation is to create funds that systematically tap into the business profits and losses, not capital market returns, of globally important risk transfer services.
At the firm’s inception, we contrasted the equity risk premium with the reinsurance risk premium as proxied by the Swiss Re Index (SRI) of catastrophe (“cat”) bonds. Back in 2012, fund returns data suggested to us that it would be very easy to replicate the S&P 500 and very hard, but potentially extremely valuable, if we could replicate the SRI. In practice, to match the SRI one would have to obtain and maintain the benchmark exposures to each bond, each with extremely limited capacity, especially in the primary issuance market, which is when the index “buys” its bonds. And building a cat bond portfolio is only possible bond by bond, not with a click.
Fast forward to the July2013-November 2018 period, the fully invested timeframe of our first fund – the Stone Ridge High Yield Reinsurance Risk Premium Fund (ticker: SHRIX) – designed to track the SRI net of its fees. During this 5+ year period, theno-fee,no-transaction cost,non-investable Swiss Re index was valuable indeed, “returning” 29.3% with no correlation to anything (note: this compares to the Barclays Agg’s return of 11.5%). Of the eight Eurekahedge ILS index reinsurance funds with “cat bond” in their name, the median cumulative net return has been 15.5%, and the 75th percentile fund returned 19.4%. During this same period, SHRIX returned 29.9% net. The reinsurance risk premium, and particularly the Stone Ridge approach, which uniquely accesses the limited market in catastrophe bonds via maniacal focus on primary issuance – sharply limiting its capacity – passes the smell test.9
Since we launched that first Stone Ridge fund, we’ve tirelessly sought innovation, though the vast majority of our collective work just isn’t good enough and ends up on the cutting room floor. Having said that, additional alternative franchises – a whopping two in the subsequent five years – have met our standards
| 8 | “Don’t tell me what you think, tell me what’s in your portfolio”: I have zero net market exposure to public equities. Having said that, based on our best available shareholder information, I am by far the largest end investor of the Elements funds, which I beta hedge to zero net market exposure. In the realm of public equities, I only wantlong-term exposure to the “Elements” (i.e., the factors). For those who do want net long public equities exposure, I believe systematically tilting towards the riskier names and paying zero management fees should benon-negotiables. |
| 9 | Relatedly, in proprietary research available on request, a mimicking portfolio of quota shares returned ~1.5%/year over cat bonds due to higher levels of diversification which facilitate higher levels of structural leverage inherent in a reinsurer’s business model, and therefore a quota share. In addition, quota shares, especially with the globally leading reinsurers (i.e., the best underwriters with the lowest loss ratios) are far harder to source, structure, evaluate, and risk manage than cat bonds. |
| | | | | | | | | | | | | | | | |
| | Elements Portfolios | | | | | | Annual Report | | | | | | May 31, 2019 | | |
| | | | |
6
Shareholder Letter
asanti-fad, possessing what we believe to be a materially positive risk premium, truly diversifying to each other and, critically, to stocks and bonds. We are honored to now be responsible for $14 billion of our investors’ and our employees’ life savings.
Inspired by Taleb’s “Don’t tell me what you ‘think,’ just tell me what’s in your portfolio” morality, the team at Stone Ridge has skin in the game. In 2018, I personally shouldered the largest losses in SRRIX and AVRPX of any Stone Ridge fund investor (and the largest gains in LENDX). In my view, if you give an opinion and someone follows it, you must be exposed to its consequences. And it has to be real exposure, not window dressing.
At Stone Ridge, our code is symmetry with our investors, having a share of the harm, and paying a material financial penalty if something goes wrong, regardless of the cause (the opposite of Wall Street executives during the credit crisis). And although nothing “went wrong” in 2018 in the intellectual sense that successful risk premium investingrequires occasional rough years –which must be unpredictable else there would be no risk premium in the first place– something certainly “went wrong” in the actual sense, the only sense that matters: we lost money.
I lead from the front and share the pain as a matter of justice and honor. Alongside me, with locked arms,every Stone Ridge employee invests in every strategy at full fees. Skin in the game keeps hubris in check.
The Law of Practice
While nothing in investing is easy or obvious, when you source priced risks, returns are reliably positive on average, but unpredictable over any particular interval.Some years are great, others can hurt – it is simply a function of when the intentional risk bearing pays off. Yet many investors try to time the market, an expensive and dangerous pursuit.
Why is succumbing to market timing prevalent among so many (but certainly far from all) investors? Perhaps because it’s in our nature to think we’re exceptional. It’s hard wired in our brains as a component of evolutionary survival. 90% of us think we’re above average drivers and 25% of us think we’re in the top 1%. And we especially don’t like to think of ourselves as passive or static when something is not going as we hoped. Instead, we want to “do something!” Unfortunately,in investing, confusing strategy with outcome is hazardous to our wealth.
Getting the sign and magnitude of the risk premium right and thenstaying in the trade – patiently and at times uncomfortably – is, in our view, the right thing forlong-term wealth creation andthe only way to earn the average.
We don’t generally associate inactivity with practice, but maintaining a target asset allocation each year is active and itdoesrequire practice. Every decision is an active decision, including a decision not to change. Practice is such a powerful thing that it doesn’t have the ability to discriminate between what is good for you and what is not. If you practice negative habits that are not conducive to your growth, you will become really good at those negative habits. If you practice positive habits that are conducive to your growth you will become really good at those positive habits.
Whatever it is you practice is that which you become good at. That’s the immutable Law of Practice.
However, just because something is simple doesn’t mean it’s easy. Staying in the trade and seeking to earn the average requires patience, discipline, and an ability to mentally manage substantial uncertainty –
| | | | | | | | | | | | | | | | |
| | Elements Portfolios | | | | | | Annual Report | | | | | | May 31, 2019 | | |
| | | | |
7
Shareholder Letter
for an uncertain period of time. While not everyone can do that, the motivation to develop this practice is clear, as the ability to handle uncertainty is directly proportional to the quality of thelong-term outcome that can be generated (i.e., the quality of your life). There are no shortcuts or magic pills.
People and societies that can delay gratification – and manage the associated uncertainty along the way – end up controlling the vast majority of capital accumulation and enjoying the vast majority of health and prosperity. It’s the most powerful source of life inequality.
The Stone Ridge Network
We have enoughhumility at Stone Ridge to avoid the need for complexity in product development and enoughfocus to say no to almost 100% of the opportunities that come our way. Ourkindness has attracted the Stone Ridge Network who, like us, prefer the path of simple things properly done.
Comprised of 100+ of the leading RIAs in the U.S. who each invest across multiple Stone Ridge products, the RIAs in the Stone Ridge Network create value for each other... he most recent example: Flourish Cash.iiFlourish Cash currently offers a 2.3% annual percentage yield (APY)iiion cash held at its program banks, with that cash eligible for up to $6 million of FDIC insurance pertwo-person household.ivSince launch earlier this month, it’s averaged 40% growth,per day, an utterly unsustainable pace, but one I believe will stay brisk.
What made Flourish Cash possible was an observation about the “CAC” (customer acquisition cost) of retail deposits at banks: it costs a bank$1500-$2000 to acquire a retail depositor and far more to acquire a high net worth retail depositor.10
In contrast, the Flourish Cash team, powered by the Stone Ridge Network,can provide a single source of thousands of high net worth retail depositors for each of the Flourish Cash program banks,CAC-free. TheseCAC-free deposits from Flourish Cash customers are so valuable that the banks offer those customers a higher yield. These banks are notnon-profits. It’s all about their CAC, and not paying it, which is all about the Stone Ridge Network.
I’m old enough to remember when cash was an asset class, as it is again today. RIAs who win the future will be as forward thinking about their cash management practices as they are today about their alternative asset management practices. Basically anything that’s not stocks and bonds will be needed as a critical enhancement to the RIA arsenal. Cash is now just another uncorrelated alternative.
Business is a Listening Contest
Some things need to be believed to be seen – Flourish Cash was one of those things. At Stone Ridge, we think from the future, close our eyes and imagine our vision is realized. Then, together, we relentlessly iterate so that what we believe will ultimately be seen. Working quietly out of view, we ignore the impulses of others to seek recognition. And we don’t believe that those out there in the limelight are getting the better end of the deal. We’re too busy loving our work to do anything else.
New opportunities arrive ceaselessly, as long as we’re each willing to learn.Business is a learning contest, and our ability to innovate as an organization depends on each of us entering every conversation as if we have something to learn. Because we do. True listening requires a setting aside of oneself. When done expertly, the person across the table senses this. They open up their inner recesses, and share their
| 10 | https://tearsheet.co/data/why-customer-acquisition-is-so-difficult-for-financial-startups/ |
| | | | | | | | | | | | | | | | |
| | Elements Portfolios | | | | | | Annual Report | | | | | | May 31, 2019 | | |
| | | | |
8
Shareholder Letter
deepest creativity. Conversations are not promotional opportunities. In a real conversation, you’re in it together.And because business is a learning contest, it’s actually a listening contest.
The most sustainable fountainhead of innovation at Stone Ridge will flow from each of us developing and maintaining world class listening skills. Not excellent. World class. The average person can talk at about 200 words per minute, but can listen at about 500 words per minute. The problem is that when we only hear 200 words per minute in a conversation, it’s easy to fill in the gaps with distracting thoughts. It takes real energy and focus to appropriately pay attention to someone, but if you can’t do that, you’re not in a conversation and you’re not learning. Check yourself on this. Do you listen with the intent to understand, or do you listen with the intent to reply?
Folks who talk too much feel in control and the center of attention. Talking means they don’t have to hear anything they’re not interested in, including new ideas that might tweak their perspective or expand their world. In contrast, consider Randy Cohen, my brilliant and blind old friend andco-author, with Josh Zwick, in the Illuminating the Path Forward series. Randy didn’t used to be blind, but now he is so instead of reading, he listens to books and emails. Through deliberate practice over many years, he can listen up to 750 words per minute. 750 words! No wonder he’s one of the most creative and interesting people I’ve ever met.
My Mom
As some of you know, my mother passed earlier this year. This is my first New Year’s without her. It stinks. A parent passing is something we each process differently and my father passing over six years ago was the animating spark that caused me to start Stone Ridge. However, when my mom passed this year there was no such spark. For me, a second parent passing was another thing altogether and I unfortunately learned that a second parent passing for an only child comes with its own set of trials. While I now feel mostly back to myself, I still really miss my mom.
In honor of my mom this holiday season, I’d like to share something she told me just a few weeks before she passed. She said,“Whenever you talk to someone, be prepared to be amazed.I am, and I’m never disappointed. You can do the same thing. Whether it’s a teammate, a client, a child, a parent or a spouse: listen and be prepared to be amazed.”
Is it any wonder I’m endlessly grateful for my mom?
So over this holiday season, please put down that piece of plastic and glass you are addicted to stroking.Technology is a wonderful thing, but only ifyouare in charge ofit.Give your family your undivided attention. In conversation today, do not think about what you are going to say next. Just listen. Listening equals love. And be prepared to be amazed.
On behalf of Stone Ridge, I offer my deepest gratitude to you for sharing responsibility for your wealth with us this year. We look forward to serving you again in 2019.
Warmly,
Ross L. Stevens
Founder, CEO
| | | | | | | | | | | | | | | | |
| | Elements Portfolios | | | | | | Annual Report | | | | | | May 31, 2019 | | |
| | | | |
9
Shareholder Letter
ENDNOTES
iBessembinder’s work also has profound implications for active management of equities. The 4% result means that a bet on any particular active manager reduces to a bet that manager can identify enough of the 4%wealth-creating stocks in advance, because the market portfolio, by definition, contains them. The bar, then, is not “beat the market,” rather it’s “don’t miss too many of the 4%.” How important are the 4%? Consider that a) missing only the top 25 wealth generating stocks out of the ~26,000 U.S. stocks to ever exist (so less than 1 in 1000), and b) not holding those 25 since their inception in CRSP (an impossible task without time travel), would have incurred an opportunity cost of almost a third of the cumulative wealth generated by owning the entire U.S. stock market the last 90 years.
How likely is it that an active manager will own enough of the 4%? Or the 25? Consider the fact that the typical active mutual fund manager holds 65 stocks and decide (Kacperczyk, M., Sialm C., Zheng L., (2006).On the industry concentration of actively managed equity mutual funds.Journal of Finance 60 1983–2011).
Some market observers suggest that individual stock return dispersion is needed for active managers to outperform, and that some market environments are “better” for active management than others. Bessembinder shows this is nonsense. The pool active managers need to fish in, the 4% or the 25, is vanishingly small, likely impossible to identify in advance, and almost certainly institutionally impossible to stick with through the inevitable drawdowns along the way.
But the news gets worse for active management, because the percentage of stocks beatingT-bills has been dropping. Precipitously. In the first five decades of the last ~90 years, the average decade saw 70% of public equities beatingT-bills, while in the average decade of the last 40 years 38% of stocks beatT-bills – andin none of the last four decades did the typical stock beatT-bills.
However, the final stake through the heart of active management is not a comparison of stocks toT-bills. It’s a comparison of stocks to the overall market.In each of the last four decades, only a quarter of stocks beat the market on average, ranging from a low per decade of 21% to a high of 33%.Bessembinder shows us that the active management fishing pool is way too tiny. It’s unrealistic to think that any manager,especially one identifiable in advance,is skilled enough to own enough of the 25% market beating stocks over a decade vs. the losing 75%. No wonder active management underperforms: it’s hopeless. The data supports what we know intuitively: alpha and luck are synonyms.
Disclosures relating to Flourish Cash
IiFlourish Cash is a service offered by Stone Ridge Securities LLC, a registeredbroker-dealer and FINRA member firm. Flourish Cash is currently available via invitation only and is currently available only in certain states, and this letter is not an invitation or solicitation to open an account. Stone Ridge Securities LLC is an affiliate of Stone Ridge Asset Management LLC. Stone Ridge Asset Management LLC does not provide any services, including investment advisory services, in connection with Flourish Cash and does not provide any guarantees or financial support to Flourish Cash accounts. The cash balance in a Flourish Cash account is swept from a brokerage account at Stone Ridge Securities LLC to deposit account(s) at one or morethird-party banks that have agreed to accept deposits from customers of Stone Ridge Securities LLC (“program banks”). The accounts at program banks pay a variable rate of interest.
Iii the Annual Percentage Yield (APY) displayed here is effective as of 12/27/2018. This APY is variable and may change at any time. The current APY for Flourish Cash is available at www.flourish.com.
| | | | | | | | | | | | | | | | |
| | Elements Portfolios | | | | | | Annual Report | | | | | | May 31, 2019 | | |
| | | | |
10
Shareholder Letter
ivThe cash balance in a Flourish Cash account that is swept to one or more Program Banks is eligible for Federal Deposit Insurance Corporation (“FDIC”) insurance, subject to FDIC rules, including FDIC aggregate insurance coverage limits. FDIC insurance will not be provided until the funds arrive at the program bank. There are currently 6 program banks available to accept deposits, making customers eligible for up to $1,500,000 of FDIC insurance for individual accounts ($250,000 for each of the 6 program banks) and up to $3,000,000 of FDIC insurance for joint accounts with two owners ($500,000 for each of the 6 program banks). The total FDIC coverage for atwo-person household is calculated assuming that each household member has an individual account and that both household members share a joint account. Although Flourish Cash is offered through a brokerage account and cash held in brokerage accounts often has the benefit of SIPC protection, until such time as Stone Ridge Securities LLC offers securities products, customers likely will not have the benefit of SIPC protection for cash held in their Flourish Cash account. Further, SIPC protection is not available for any cash held at the program banks. The investment Funds described in this letter are separate from Flourish Cash, and such Funds are (i) not insured by the FDIC; (ii) not deposits or other obligations of anyFDIC-insured financial institution and are not guaranteed by anyFDIC-insured financial institution and are not guaranteed by anyFDIC-insured financial institution; and (iii) subject to investment risks, including possible loss of the principal invested.
RISK DISCLOSURES
The Stone Ridge High Yield Reinsurance Risk Premium Fund (the “High Yield Reinsurance Fund”), the Stone Ridge Reinsurance Risk Premium Interval Fund (“SRRIX” and, together with the High Yield Reinsurance Fund, the “Reinsurance Funds”), the Stone Ridge U.S. Large Cap Variance Risk Premium Fund (the “U.S. Large Cap VRP Fund”), the Stone Ridge U.S. Small Cap Variance Risk Premium Fund (the “U.S. Small Cap VRP Fund”), the Stone Ridge U.S. Variance Risk Premium Master Fund (the “U.S. VRP Master Fund” and, together with the U.S. Large Cap VRP Fund and the U.S. Small Cap VRP Fund, the “U.S. VRP Funds”), the Stone Ridge International Developed Markets Variance Risk Premium Fund (the “Developed Markets VRP Fund”), the Stone Ridge Global Equity Variance Risk Premium Master Fund (the “Global VRP Master Fund” and, together with the Developed Markets VRP Fund, the “International VRP Funds”), the Stone Ridge All Asset Variance Risk Premium Fund (“AVRPX” and, together with the U.S. VRP Funds and the International VRP Funds, the “VRP Funds”) and the Stone Ridge Alternative Lending Risk Premium Fund (“LENDX” and, together with the Reinsurance Funds and the VRP Funds, the “Funds”), and the Elements U.S. Portfolio (“ELUSX”), Elements U.S. Small Cap Portfolio (“ELSMX”), Elements International Portfolio (“ELINX”), Elements International Small Cap Portfolio (“ELISX”), and Elements Emerging Markets Portfolio (“ELMMX”) (collectively, the “Portfolios,” and each a “Portfolio” are generally sold to (i) institutional investors, including registered investment advisers (“RIAs”), that meet certain qualifications and have completed an educational program provided by Stone Ridge Asset Management LLC (the “Adviser”); (ii) clients of such institutional investors; and (iii) certain other eligible investors (as described in the relevant prospectus). Investors should carefully consider the Funds’ and the Portfolios’ risks and investment objectives, as an investment in the Funds and/or the Portfolios may not be appropriate for all investors and the Funds and the Portfolios are not designed to be a complete investment program. There can be no assurance that the Funds and/or the Portfolios will achieve their investment objectives. An investment in the Funds and/or the Portfolios involves a high degree of risk. It is possible that investing in a Fund and/or a Portfolio may result in a loss of some or all of the amount invested. Before making an investment/allocation decision, investors should (i) consider the suitability of this investment with respect to an investor’s or a client’s investment objectives and individual situation and (ii) consider factors such as an investor’s or a client’s net worth, income, age and risk tolerance. Investment should be avoided where an investor/client has a short-term investing horizon and/or cannot bear the loss of some or all of the investment. Before investing in a Fund and/or a Portfolio, an investor should read the discussion of the risks of investing in the Fund and/or a Portfolio in the relevant prospectus.
As of 7/22/2019, ELUSX holds positions in Amazon and Microsoft, which represent 1.92% and 0.22%, respectively, of ELUSX’s total assets. Holdings and sector allocations are subject to change and are not a recommendation to buy or sell any security.
Investing in funds involves risks. Principal loss is possible.
The VRP Funds may invest in a variety of derivatives, including put and call options, futures contracts, options on futures contracts, swaps, swaptions, and other exchange-traded andover-the-counter derivatives contracts. The VRP Funds may invest in derivatives to generate income from premiums, for investment purposes, and for hedging and risk management purposes. A VRP Fund’s use of derivatives as part of its principal investment strategy to sell protection against the volatility of various underlying references involves the risk that, if the volatility of the underlying references is greater than expected, the VRP Fund will bear losses to the extent of its obligations under the relevant derivative contracts, which may not be outweighed by the amount of any premiums received for the sale of such derivative instruments. The use of derivatives involves risks that are in addition to, and potentially greater than, the risks of investing directly in securities and other more traditional assets. Derivatives also present other risks, including market risk, illiquidity risk, currency risk, and credit risk.
| | | | | | | | | | | | | | | | |
| | Elements Portfolios | | | | | | Annual Report | | | | | | May 31, 2019 | | |
| | | | |
11
Shareholder Letter
The equity securities of smaller, less seasoned companies are generally subject to greater price fluctuations, limited liquidity, higher transaction costs and higher investment risk. The equity securities of large-capitalization companies can perform differently from other segments of the equity market or the equity market as a whole and they may be less flexible in evolving markets or unable to implement changes as quickly as their smaller counterparts. Direct or indirect investments in securities of foreign issuers involve risks not ordinarily associated with exposure to securities and instruments of U.S. issuers, including differences in accounting, auditing and financial standards; less government supervision and regulation; currency risk; risks of expropriation, confiscatory taxation, political or social instability or diplomatic developments; less publicly available information; less volume in foreign markets; and increased costs of transacting in foreign markets. These risks are heightened in emerging markets.
The reinsurance industry relies on risk modeling to analyze potential risks in a single transaction and in a portfolio of transactions. The models are based on probabilistic simulations that generate thousands or millions of potential events based on historical data, scientific and meteorological principles and extensive data on current insured properties. Sponsors of reinsurance-related securities typically provide risk analytics and statistics at the time of issuance that typically include model results.
Event-linked bonds, catastrophe bonds and other reinsurance-related securities carry large uncertainties and major risk exposures to adverse conditions. If a trigger event, as defined within the terms of the bond, involves losses or other metrics exceeding a specific magnitude in the geographic region and time period specified therein, a Fund may lose a portion or all of its investment in such security. Such losses may be substantial. The reinsurance-related securities in which the Funds invest are considered “high yield” or “junk bonds.”
SHRIX and SRRIX may invest in reinsurance-related securities issued by foreign sovereigns and foreign entities that are corporations, partnerships, trusts or other types of business entities. Because the majority of reinsurance-related security issuers are domiciled outside the United States, each of SHRIX and SRRIX will normally invest significant amounts of its assets innon-U.S. entities. Accordingly, each of them may invest without limitation in securities issued bynon-U.S. entities, including those in emerging market countries. Foreign issuers could be affected by factors not present in the U.S., including expropriation, confiscatory taxation, lack of uniform accounting and auditing standards, less publicly available financial and other information, potential difficulties in enforcing contractual obligations, and increased costs to enforce applicable contractual obligations outside the U.S. These risks are greater in emerging markets.
The value of LENDX’s investments in whole loans and other alternative lending-related securities, such as shares, certificates, notes or other securities representing an interest in and the right to receive principal and interest payments due on whole loans or fractions of whole loans, is entirely dependent on the borrowers’ continued and timely payments. If a borrower is unable or fails to make payments on a loan for any reason, LENDX may be greatly limited in its ability to recover any outstanding principal or interest due, as (among other reasons) LENDX may not have direct recourse against the borrower or may otherwise be limited in its ability to directly enforce its rights under the loan, whether through the borrower or the platform through which such loan was originated, the loan may be unsecured or under-collateralized and/or it may be impracticable to commence a legal proceeding against the defaulting borrower. LENDX generally will need to rely on the efforts of the platforms, servicers or their designated collection agencies to collect on defaulted loans and there is no guarantee that such parties will be successful in their efforts to collect on loans. Even if a loan in which LENDX has investment exposure is secured, there can be no assurance that the collateral will, when recovered and liquidated, generate sufficient (or any) funds to offset any losses associated with the defaulting loan. Although LENDX conducts diligence on the platforms, LENDX generally does not have the ability to independently verify, and will not independently diligence or confirm the truthfulness of, the information provided by the platforms, other than payment information regarding loans and other alternative lending-related securities owned by LENDX, which LENDX will observe directly as payments are received. The default history for alternative lending borrowing arrangements is limited and future defaults may be higher than historical defaults.
In general, the value of a debt security is likely to fall as interest rates rise. LENDX may invest in below-investment grade securities, which are often referred to as “junk,” or in securities that are unrated but that have similar characteristics to junk bonds. Such instruments have predominantly speculative characteristics with respect to the issuer’s capacity to pay interest and repay principal. They may also be difficult to value and illiquid. LENDX’s investments in securitization vehicles or other special purpose entities that hold alternative lending-related securities (asset-backed securities) may involve risks that differ from or are greater than risks associated with other types of investments. The risks and returns for investors like LENDX in asset-backed securities depend on the tranche in which the investor holds an interest, and the value of an investment in LENDX may be more volatile and other risks tend to be compounded if and to the extent that LENDX is exposed to asset-backed securities directly or indirectly.
LENDX may invest directly or indirectly in the alternative lending-related securities of foreign issuers. Such investments may involve risks not ordinarily associated with exposure to alternative lending-related securities of U.S. issuers. The foreign alternative lending industry may be subject to less governmental supervision and regulation than exists in the U.S.; conversely, foreign regulatory regimes applicable to the alternative lending industry may be more complex and more restrictive than those in the U.S., resulting in higher costs associated with such investments, and such regulatory regimes may be subject to interpretation or change without prior notice to investors, such as LENDX. Foreign platforms may not be subject to accounting, auditing, and financial reporting standards and practices comparable to those in the U.S. Due to difference in legal systems, there may be difficulty in obtaining or enforcing a court judgment outside the U.S.
| | | | | | | | | | | | | | | | |
| | Elements Portfolios | | | | | | Annual Report | | | | | | May 31, 2019 | | |
| | | | |
12
Shareholder Letter
A Fund (or its subsidiaries) may obtain financing to make investments and may obtain leverage through derivative instruments that afford the Fund economic leverage. Therefore, the Funds are subject to leverage risk. Leverage magnifies a Fund’s exposure to declines in the value of one or more underlying reference instruments or creates investment risk with respect to a larger pool of assets than the Fund would otherwise have and may be considered a speculative technique. The value of an investment in a Fund will be more volatile and other risks tend to be compounded if and to the extent the Fund borrows or uses derivatives or other investments that have embedded leverage. This risk is enhanced for SHRIX and SRRIX because they invest substantially all their assets in reinsurance-related securities. Reinsurance-related securities can quickly lose all or much of their value if a triggering event occurs. Thus, to the extent assets subject to a triggering event are leveraged, the losses could substantially outweigh SHRIX’s or SRRIX’s investment and result in significant losses to the relevant Fund.
Economic, political, and issuer-specific events will cause the value of securities, and the Portfolio that owns them, to rise or fall. Because the value of your investment in a Portfolio will fluctuate, you may lose money, even over the long term. Securities of smaller companies are often less liquid than those of larger companies, and smaller companies are generally more vulnerable to adverse business or economic developments and may have more limited resources. Foreign securities prices may decline or fluctuate because of economic or political actions of foreign governments and/or less regulated or liquid securities markets and may give rise to foreign currency risk. Securities of companies that exhibit other factors such as value, momentum or quality may be riskier than securities of companies that do not exhibit those factors, and may perform differently from the market as a whole. If a Portfolio uses derivatives, such Portfolio will be directly exposed to the risks of that derivative, including the risk that the counterparty is unable or unwilling to perform its obligations. Derivatives are subject to a number of additional risks, including risks associated with liquidity, interest rates, market movements and valuation. Securities lending and similar transactions involve the risk that the counterparty may fail to return the securities in a timely manner or at all and that the value of collateral securing a securities loan or similar transaction falls.
The Funds and the Portfolios may invest in illiquid or restricted securities, which may be difficult or impossible to sell at a time that a Fund or a Portfolio would like, at the price that a Fund or a Portfolio believes the security is currently worth, or without significantly changing the market value of the security.
Each Fund and each Portfolio intends to qualify for treatment as a regulated investment company (“RIC”) under the Internal Revenue Code. A Fund’s and a Portfolio’s investment strategy will potentially be limited by its intention to qualify for treatment as a RIC. The tax treatment of certain of the Funds’ and certain of the Portfolios’ investments under one or more of the qualification or distribution tests applicable to RICs is not certain. An adverse determination or future guidance by the IRS might affect a Fund’s and a Portfolio’s ability to qualify for such treatment.
If, in any year, a Fund or a Portfolio were to fail to qualify for treatment as a RIC under the Internal Revenue Code for any reason, and were unable to cure such failure, the Fund or the Portfolio would be subject to tax on its taxable income at corporate rates, and all distributions from earnings and profits, including any distributions of nettax-exempt income and net long-term capital gains, would be taxable to shareholders as ordinary income.
For additional risks, please refer to the relevant prospectus and statement of additional information.
Each of SHRIX and LENDX, and each of the Portfolios, is classified asnon-diversified under the 1940 Act. Accordingly, each such Fund and Portfolio may invest a greater portion of its assets in the securities of a single issuer than if it were a diversified fund, which may subject such Fund or Portfolio to a higher degree of risk associated with and developments affecting that issuer than a fund that invests more widely.
Each of the High Yield Reinsurance Fund, the U.S. VRP Funds, the International VRP Funds and the Portfolios is anopen-end management investment company. Each of SRRIX, AVRPX and LENDX is aclosed-end management investment company.
Diversification does not assure a profit or protect against a loss in a declining market.
Each of AVRPX, SRRIX and LENDX has an interval fund structure pursuant to which each Fund, subject to applicable law, conducts quarterly repurchase offers of the Fund’s outstanding shares at net asset value (“NAV”), subject to approval of the Board of Trustees. In all cases, such repurchases will be for at least 5% and not more than 25% of the relevant Fund’s outstanding shares. Repurchase offers are currently expected to be 5% for SRRIX and LENDX and 25% for AVRPX. In connection with any given repurchase offer, it is possible that a Fund may offer to repurchase only the minimum amount of 5% of its outstanding shares. It is possible that a repurchase offer may be oversubscribed, with the result that shareholders may only be able to have a portion of their shares repurchased. There is no assurance that you will be able to tender your Shares when or in the amount that you desire. The Funds’ shares are not listed, and the Funds do not currently intend to list their shares for trading on any national securities exchange; the shares are, therefore, not marketable, and you should consider the shares to be illiquid.
Performance data quoted represents past performance; past performance does not guarantee future results. The investment return and principal value of an investment will fluctuate so that an investor’s shares, when redeemed, may be worth more or less than their original cost. Current performance of a Fund or Portfolio may be lower or higher than the performance quoted. Performance data current to the most recent month end may be obtained by calling855-609-3680.
| | | | | | | | | | | | | | | | |
| | Elements Portfolios | | | | | | Annual Report | | | | | | May 31, 2019 | | |
| | | | |
13
Shareholder Letter
Standardized returns as of most recentquarter-end (6/30/19): VRLIX 1Yr=4.87%, 5Yr=5.10%, since inception (5/1/2013)=6.57%; for VRSIX 1Yr=0.80%, 5Yr=4.15%, since inception (5/1/2013)=5.40%; for VRFIX 1Yr=2.00%, 5Yr=2.56%, since inception (2/11/14)=2.95%; for VRGIX 1Yr=2.42%, since inception (11/14/2014)=3.37%; for VRPIX 1Yr=3.17%, 5Yr=4.63%, since inception (5/22/2013)=5.83%; for SHRIX 1Yr=0.81%, 5Yr=3.63%, since inception (2/1/2013)=4.36%; for SRRIX1Yr=-8.16%, 5Yr=0.39%, since inception (12/9/2013)=0.88%; for AVRPX1Yr=-3.74%, since inception (4/2/2015)=2.61%; for LENDX 1Yr=4.51%, since inception (6/1/2016)=7.26%; for ELUSX 1Yr=8.17%, since inception (3/31/17)=10.94%; for ELSMX1Yr=-5.33%, since inception (3/31/17)=4.72%; for ELINX1Yr=-2.62%, since inception (4/28/17)=3.29%; for ELISX1Yr=-8.66%, since inception (4/28/17)=1.68%; for ELMMX 1Yr=1.50%, since inception (5/31/17)=4.42%. As of 6/30/19,30-day SEC yield: SHRIX 4.90% (net), 4.61% (gross of subsidized expenses); SRRIX 0.00% (net), 0.00% (gross of subsidized expenses); LENDX 10.93% (net), 11.05% (gross of subsidized expenses). Results for the Funds and the Portfolios are annualized; all Fund and Portfolio returns reflect the reinvestment of dividends and other earnings and are net of fees and expenses. As a result of economic incentives received from platforms that may not be repeated, early LENDX performance was unusually strong and should not be extrapolated to future periods. Results for the Elements Portfolios reflect waivers of all of the Portfolios’ investment management fees and partial reimbursement of expenses by the Adviser. The Adviser has contractually agreed to waive its management fee entirely through September 30, 2021 and to pay or otherwise bear operating expenses as necessary to limit total annualized expenses, other than certain excluded expenses, of the Portfolios to 0.15% (for ELUSX and ELSMX) or 0.20% (for ELINX, ELISX and ELMMX) for the period from September 28, 2018 through September 30, 2019. Fee waiver and expense reimbursement may be discontinued in whole or in part after such dates. In the absence of fee waivers and reimbursements, returns for the Portfolios would have been lower.
Total Annual Fund Operating Expenses as disclosed in the most recent prospectus: for SRRIX, 2.45%; for VRPIX, 3.78%; for ELUSX, 0.52%; for ELSMX, 0.77%; for ELINX, 0.78%; for ELISX, 1.13%; for ELMMX, 1.03%. Total Annual Fund Operating Expenses before fee waiver and/or expense reimbursement/(recoupment) as disclosed in the most recent prospectus: for SHRIX, 1.72%; for VRLIX, 2.03%; for VRSIX, 2.71%; for VRFIX, 4.76%; for VRGIX, 3.46%; for AVRPX, 2.62%; for LENDX, 4.89%. Total Annual Fund Operating Expenses after fee waiver and/or expense reimbursement/(recoupment) as disclosed in the most recent prospectus: for SHRIX, 1.67%; for VRLIX, 1.75%; for VRSIX, 1.75%; for VRFIX, 2.87%; for VRGIX, 3.09%; for AVRPX, 2.62%; for LENDX, 4.97%. Please see the financial highlights section of each Fund’s and each Portfolio’s shareholder report for more recent Fund Operating Expenses.
Information furnished by others, upon which all or portions of the information contained herein is based, is from sources believed to be reliable. Stone Ridge makes no representation as to the accuracy, adequacy or completeness of such information and it has accepted the information without further verification.
The information provided herein should not be construed in any way as tax, capital, accounting, legal or regulatory advice. Investors should seek independent legal and financial advice, including advice as to tax consequences, before making any investment decision. Opinions expressed are subject to change at any time and are not guaranteed and should not be considered investment advice.
The Funds’ and Portfolios’ investment objectives, risks, charges and expenses must be considered carefully before investing. The relevant prospectus contains this and other important information about the investment company. You can obtain an additional copy of the Funds’ and the Portfolios’ most recent periodic reports and certain other regulatory filings by calling855-609-3680 or visiting www.stoneridgefunds.com for the Funds and www.elementsfunds.com for the Portfolios. The Funds’ and the Portfolios’ prospectuses, which include a statement of additional information, can be found by visiting:
Stone Ridge High Yield Reinsurance Risk Premium Fund1: Prospectus and SAI
Stone Ridge Reinsurance Risk Premium Interval Fund2: Prospectus and SAI
Stone Ridge Post-Event Reinsurance Fund2: Prospectus and SAI
Stone Ridge U.S. Large Cap Variance Risk Premium Fund, Stone Ridge U.S. Small Cap Variance Risk Premium Fund, Stone Ridge U.S. Variance Risk Premium Master Fund, Stone Ridge International Developed Markets Variance Risk Premium Fund, and Stone Ridge Global Equity Variance Risk Premium Master Fund1: Prospectus and SAI
Stone Ridge All Asset Variance Risk Premium Fund2: Prospectus and SAI
Stone Ridge Alternative Lending Risk Premium Fund2: Prospectus and SAI
Elements Portfolios1: Prospectus and SAI
1Open-end fund,2Closed-end interval fund
The prospectuses should be read carefully before investing.
Past performance is no guarantee of future results.
The Stone Ridge Funds and the Elements Portfolios are distributed by ALPS Distributors, Inc. SRG000902. Exp
| | | | | | | | | | | | | | | | |
| | Elements Portfolios | | | | | | Annual Report | | | | | | May 31, 2019 | | |
| | | | |
14
|
|
| PERFORMANCE DATA (Unaudited) |
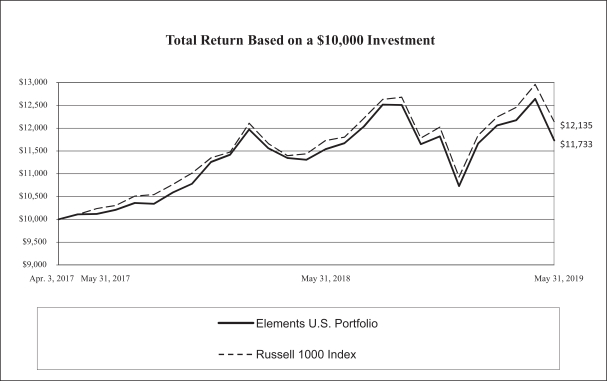
This chart assumes an initial gross investment of $10,000 made on April 3, 2017 (commencement of operations). Returns shown reflect the reinvestment of all dividends, and are net of fees and expenses, and reflect waivers of all of the Portfolio’s investment management fee and partial reimbursement of the Portfolio’s expenses by Stone Ridge Asset Management LLC (“Stone Ridge”). Stone Ridge has contractually agreed to waive its management fee entirely through September 30, 2021 and to pay or otherwise bear expenses as necessary to limit total annualized expenses, other than certain excluded expenses, of the applicable share class of the Portfolio, for the period from September 28, 2018 through September 30, 2019, to 0.15% for Class M shares and 0.05% for Class Y shares, in each case of the average daily net assets attributable to such class. Fee waivers and expense reimbursement may be discontinued after that date. Returns shown do not reflect the deduction of taxes that a shareholder would pay on fund distributions or the redemption of fund shares. In the absence of fee waivers and reimbursements, returns for the Portfolio would have been lower. Past performance is not predictive of future performance. Investment return and principal value will fluctuate, so that your shares, when redeemed, may be worth more or less than the original cost.
TheRussell 1000 Index is an unmanaged index that measures the performance of the stocks of the large-capitalization segment of the U.S. equity universe. Index figures do not reflect any deduction of fees, taxes or expenses, and are not available for investment. Returns shown for the index include reinvestment of all dividends.
| | | | | | | | |
|
| AVERAGE ANNUAL TOTAL RETURNS (FOR PERIODS ENDED MAY 31, 2019) | |
| | | 1-year
period
ended
5/31/19 | | | Since
Commencement of
Operations | |
| | |
Elements U.S. Portfolio — Class M (commencement of operations 4/3/17) | | | 1.68% | | | | 7.67% | |
| | |
Elements U.S. Portfolio — Class Y (commencement of operations 4/1/19) | | | N/A | | | | -4.82% | |
| | |
Russell 1000 Index | | | 3.47% | | | | 9.37% | |
| | | | | | | | | | | | | | | | |
| | Elements Portfolios | | | | | | Annual Report | | | | | | May 31, 2019 | | |
| | | | |
15
| | | | |
| ELEMENTS U.S. SMALL CAP PORTFOLIO | | | | |
|
|
| PERFORMANCE DATA (Unaudited) |
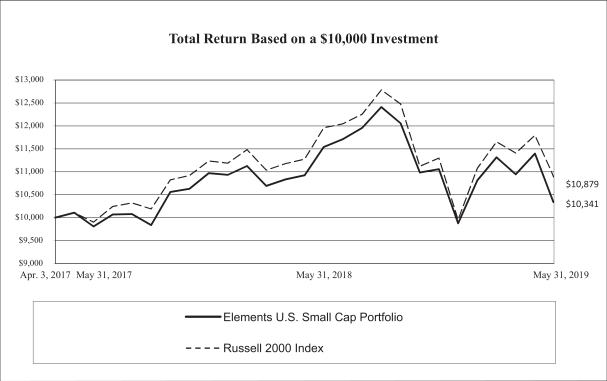
This chart assumes an initial gross investment of $10,000 made on April 3, 2017 (commencement of operations). Returns shown reflect the reinvestment of all dividends, and are net of fees and expenses, and reflect waivers of all of the Portfolio’s investment management fee and partial reimbursement of the Portfolio’s expenses by Stone Ridge. Stone Ridge has contractually agreed to waive its management fee entirely through September 30, 2021 and to pay or otherwise bear expenses as necessary to limit total annualized expenses, other than certain excluded expenses, of the applicable share class of the Portfolio, for the period from September 28, 2018 through September 30, 2019, to 0.15% for Class M shares and 0.05% for Class Y shares, in each case of the average daily net assets attributable to such class. Fee waivers and expense reimbursement may be discontinued after that date. Returns shown do not reflect the deduction of taxes that a shareholder would pay on fund distributions or the redemption of fund shares. In the absence of fee waivers and reimbursements, returns for the Portfolio would have been lower. Past performance is not predictive of future performance. Investment return and principal value will fluctuate, so that your shares, when redeemed, may be worth more or less than the original cost.
TheRussell 2000 Index is an unmanaged index that measures the performance of the small-capitalization segment of the U.S. equity universe. Index figures do not reflect any deduction of fees, taxes or expenses, and are not available for investment. Returns shown for the index include reinvestment of all dividends.
| | | | | | | | |
|
| AVERAGE ANNUAL TOTAL RETURNS (FOR PERIODS ENDED MAY 31, 2019) | |
| | | 1-year
period
ended
5/31/19 | | | Since
Commencement of
Operations | |
| | |
Elements U.S. Small Cap Portfolio — Class M
(commencement of operations 4/3/17) | | | -10.41% | | | | 1.56% | |
| | |
Elements U.S. Small Cap Portfolio — Class Y
(commencement of operations 4/1/19) | | | N/A | | | | -6.58% | |
| | |
Russell 2000 Index | | | -9.04% | | | | 3.97% | |
| | | | | | | | | | | | | | | | |
| | Elements Portfolios | | | | | | Annual Report | | | | | | May 31, 2019 | | |
| | | | |
16
| | | | |
| ELEMENTS INTERNATIONAL PORTFOLIO | | | | |
|
|
| PERFORMANCE DATA (Unaudited) |
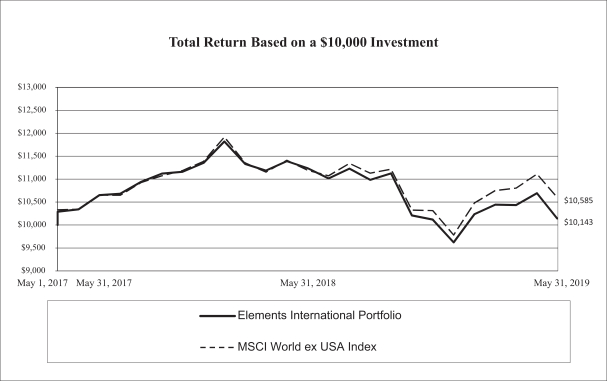
This chart assumes an initial gross investment of $10,000 made on May 1, 2017 (commencement of operations). Returns shown reflect the reinvestment of all dividends, and are net of fees and expenses, and reflect waivers of all of the Portfolio’s investment management fee and partial reimbursement of the Portfolio’s expenses by Stone Ridge. Stone Ridge has contractually agreed to waive its management fee entirely through September 30, 2021 and to pay or otherwise bear expenses as necessary to limit total annualized expenses, other than certain excluded expenses, of the applicable share class of the Portfolio, for the period from September 28, 2018 through September 30, 2019, to 0.20% for Class M shares and 0.10% for Class Y shares, in each case of the average daily net assets attributable to such class. Fee waivers and expense reimbursement may be discontinued after that date. Returns shown do not reflect the deduction of taxes that a shareholder would pay on fund distributions or the redemption of fund shares. In the absence of fee waivers and reimbursements, returns for the Portfolio would have been lower. Past performance is not predictive of future performance. Investment return and principal value will fluctuate, so that your shares, when redeemed, may be worth more or less than the original cost.
TheMSCI World ex USA Index is a free-float adjusted index which captures large- andmid-cap representation across 22 of 23 developed market countries, as determined by MSCI, excluding the United States. Index figures do not reflect any deduction of fees, taxes or expenses, and are not available for investment. Returns shown for the index include reinvestment of all dividends net of withholding tax.
| | | | | | | | |
|
| AVERAGE ANNUAL TOTAL RETURNS (FOR PERIODS ENDED MAY 31, 2019) | |
| | | 1-year
period
ended
5/31/19 | | | Since
Commencement of
Operations | |
| | |
Elements International Portfolio — Class M
(commencement of operations 5/1/17) | | | -9.75% | | | | 0.68% | |
| | |
Elements International Portfolio — Class Y
(commencement of operations 4/1/19) | | | N/A | | | | -3.85% | |
| | |
MSCI World ex USA Index | | | -5.44% | | | | 2.76% | |
| | | | | | | | | | | | | | | | |
| | Elements Portfolios | | | | | | Annual Report | | | | | | May 31, 2019 | | |
| | | | |
17
| | | | |
| ELEMENTS INTERNATIONAL SMALL CAP PORTFOLIO | | | | |
|
|
| PERFORMANCE DATA (Unaudited) |
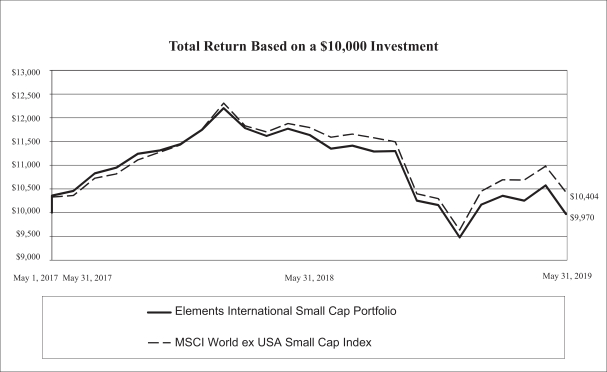
This chart assumes an initial gross investment of $10,000 made on May 1, 2017 (commencement of operations). Returns shown reflect the reinvestment of all dividends, and are net of fees and expenses, and reflect waivers of all of the Portfolio’s investment management fee and partial reimbursement of the Portfolio’s expenses by Stone Ridge. Stone Ridge has contractually agreed to waive its management fee entirely through September 30, 2021 and to pay or otherwise bear expenses as necessary to limit total annualized expenses, other than certain excluded expenses, of the applicable share class of the Portfolio, for the period from September 28, 2018 through September 30, 2019, to 0.20% for Class M shares and 0.10% for Class Y shares, in each case of the average daily net assets attributable to such class. Fee waivers and expense reimbursement may be discontinued after that date. Returns shown do not reflect the deduction of taxes that a shareholder would pay on fund distributions or the redemption of fund shares. In the absence of fee waivers and reimbursements, returns for the Portfolio would have been lower. Past performance is not predictive of future performance. Investment return and principal value will fluctuate, so that your shares, when redeemed, may be worth more or less than the original cost.
TheMSCI World ex USA Small Cap Index is a free-float adjusted index which capturessmall-cap representation across 22 or 23 developed market countries, as determined by MSCI, excluding the United States. Index figures do not reflect any deduction of fees, taxes or expenses, and are not available for investment. Returns shown for the index include reinvestment of all dividends net of withholding tax.
| | | | | | | | |
|
| AVERAGE ANNUAL TOTAL RETURNS (FOR PERIODS ENDED MAY 31, 2019) | |
| | | 1-year
period
ended
5/31/19 | | | Since
Commencement of
Operations | |
| | |
Elements International Small Cap Portfolio — Class M
(commencement of operations 5/1/17) | | | -14.33% | | | | -0.14% | |
| | |
Elements International Small Cap Portfolio — Class Y
(commencement of operations 4/1/19) | | | N/A | | | | -4.12% | |
| | |
MSCI World ex USA Small Cap Index | | | -11.80% | | | | 1.92% | |
| | | | | | | | | | | | | | | | |
| | Elements Portfolios | | | | | | Annual Report | | | | | | May 31, 2019 | | |
| | | | |
18
| | | | |
| ELEMENTS EMERGING MARKETS PORTFOLIO | | | | |
|
|
| PERFORMANCE DATA (Unaudited) |
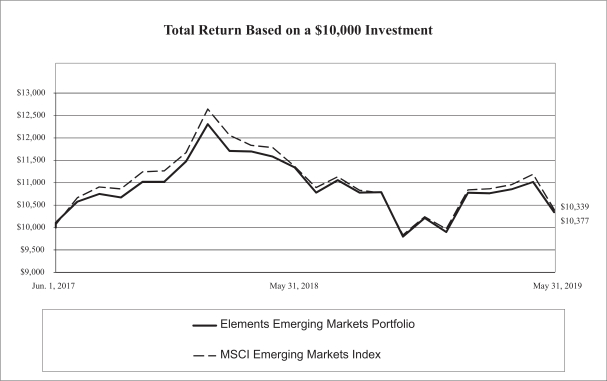
This chart assumes an initial gross investment of $10,000 made on June 1, 2017 (commencement of operations). Returns shown reflect the reinvestment of all dividends, and are net of fees and expenses, and reflect waivers of all of the Portfolio’s investment management fee and partial reimbursement of the Portfolio’s expenses by Stone Ridge. Stone Ridge has contractually agreed to waive its management fee entirely through September 30, 2021 and to pay or otherwise bear expenses as necessary to limit total annualized expenses, other than certain excluded expenses, of the applicable share class of the Portfolio, for the period from September 28, 2018 through September 30, 2019, to 0.20% for Class M shares and 0.10% for Class Y shares, in each case of the average daily net assets attributable to such class. Fee waivers and expense reimbursement may be discontinued after that date. Returns shown do not reflect the deduction of taxes that a shareholder would pay on fund distributions or the redemption of fund shares. In the absence of fee waivers and reimbursements, returns for the Portfolio would have been lower. Past performance is not predictive of future performance. Investment return and principal value will fluctuate, so that your shares, when redeemed, may be worth more or less than the original cost.
TheMSCI Emerging Markets Index is a free-float weighted equity index which captures large andmid-cap representation across Emerging Markets countries, as determined by MSCI. The Index covers approximately 85% of the free float-adjusted market capitalization in each country. Index figures do not reflect any deduction of fees, taxes or expenses, and are not available for investment. Returns shown for the index include reinvestment of all dividends net of withholding tax.
| | | | | | | | |
|
| TOTAL RETURNS (FOR PERIOD ENDED MAY 31, 2019) | |
| | | 1-year
period
ended
5/31/19 | | | Since
Commencement of
Operations | |
| | |
Elements Emerging Markets Portfolio — Class M
(commencement of operations 6/1/17) | | | -8.87% | | | | 1.69% | |
| | |
Elements Emerging Markets Portfolio — Class Y
(commencement of operations 4/1/19) | | | N/A | | | | -6.06% | |
| | |
MSCI Emerging Markets Index | | | -8.70% | | | | 1.87% | |
| | | | | | | | | | | | | | | | |
| | Elements Portfolios | | | | | | Annual Report | | | | | | May 31, 2019 | | |
| | | | |
19
| | |
| Management’s Discussion of Fund Performance | | |
The Elements U.S. Portfolio seeks to capture the equity risk premium by investing in a broad and diverse group of securities or derivatives on U.S. companies, with a focus on intuitive risk factors such as size, value, momentum, and quality that the Adviser believes may contribute to a positive equity risk premium.1 For the 12 months ended May 31, 2019, total returns were 1.68% for the Portfolio and 3.47% for the Russell 1000 Index.2 Periods of positive performance for the Portfolio, such as the most recently completed fiscal year, correspond to periods when the equity risk premium or factors emphasized are positive for U.S. companies. The performance of the Portfolio was primarily driven by the broad trend of the market for U.S. companies as illustrated by the Russell 1000 Index. Differences in Portfolio performance relative to the index were primarily driven by the factors, which contributed negatively in this period. There can be no assurance that the equity risk premium will be positive for the Portfolio’s investments at any time or on average and over time.
The Elements U.S. Small Cap Portfolio seeks to capture the equity risk premium by investing in a broad and diverse group of securities or derivatives on small capitalization U.S. companies, with a focus on intuitive risk factors such as size, value, momentum, and quality that the Adviser believes may contribute to a positive equity risk premium.1 For the 12 months ended May 31, 2019, total returns were-10.41% for the Portfolio and-9.04% for the Russell 2000 Index.3 Periods of negative performance for the Portfolio, such as the most recently completed fiscal year, correspond to periods when the equity risk premium or factors emphasized are negative for U.S. small capitalization companies. The performance of the Portfolio was primarily driven by the broad trend of the market for small capitalization U.S. companies as illustrated by the Russell 2000 Index. Differences in Portfolio performance relative to the index were primarily driven by the factors, which contributed negatively in this period. There can be no assurance that the equity risk premium will be positive for the Portfolio’s investments at any time or on average and over time.
The Elements International Portfolio seeks to capture the equity risk premium by investing in a broad and diverse group of securities or derivatives on companies associated with countries with developed markets, with a focus on intuitive risk factors such as size, value, momentum, and quality that the Adviser believes may contribute to a positive equity risk premium.1 For the 12 months ended May 31, 2019, total returns were-9.75% for the Portfolio and-5.44% for the MSCI World ex USA Index4 (net dividends). Periods of negative performance for the Portfolio, such as the most recently completed fiscal year, correspond to periods when the equity risk premium, factors emphasized, or relevant currencies’ performances versus the U.S. dollar are negative for developed markets companies. The performance of the Portfolio was primarily driven by the broad trend of the market for developed markets companies as illustrated by the MSCI World ex USA Index. Differences in Portfolio performance relative to the index were primarily driven by the factors, which contributed negatively in this period. There can be no assurance that the equity risk premium will be positive for the Portfolio’s investments at any time or on average and over time.
The Elements International Small Cap Portfolio seeks to capture the equity risk premium by investing in a broad and diverse group of securities or derivatives on small capitalization companies associated with countries with developed markets, with a focus on intuitive risk factors such as size, value, momentum, and quality that the Adviser believes may contribute to a positive equity risk premium.1 For the 12 months ended May 31, 2019, total returns were-14.33% for the Portfolio and-11.80% for the MSCI World ex USA Small Cap Index5 (net dividends). Periods of negative performance for the Portfolio, such as the most recently completed fiscal year, correspond to periods when the equity risk premium, factors emphasized, or relevant currencies’ performances versus the U.S. dollar are negative for small capitalization developed markets companies. The performance of the Portfolio was primarily driven by the broad trend of the market for small capitalization developed markets companies as illustrated by the MSCI World ex USA Small Cap Index. Differences in Portfolio performance relative to the index were primarily driven by the factors, which contributed negatively in this period. There can be no assurance that the equity risk premium will be positive for the Portfolio’s investments at any time or on average and over time.
The Elements Emerging Markets Portfolio seeks to capture the equity risk premium by investing in a broad and diverse group of securities or derivatives associated with countries with emerging markets, with a focus on intuitive risk factors such as size, value, momentum, and quality that the Adviser believes may contribute to a positive equity risk premium.1 For the 12 months ended May 31, 2019, total returns were-8.87% for the Portfolio and-8.70% for the MSCI Emerging Markets Index6 (net dividends). Periods of negative performance for the Portfolio, such as the most recently completed fiscal year, correspond to periods when the equity risk premium, factors emphasized, or relevant currencies’ performances versus the
Past performance does not guarantee future results. Indices are not investable and do not reflect any fees or transaction costs.
| | | | | | | | | | | | | | | | |
| | Elements Portfolios | | | | | | Annual Report | | | | | | May 31, 2019 | | |
| | | | |
20
| | |
| Management’s Discussion of Fund Performance | | |
U.S. dollar are negative for emerging markets companies. The performance of the Portfolio was primarily driven by the broad trend of the market for emerging markets companies as illustrated by the MSCI Emerging Markets Index. Differences in Portfolio performance relative to the index were primarily driven by the factors, which contributed negatively in this period. There can be no assurance that the equity risk premium will be positive for the Portfolio’s investments at any time or on average and over time.
Investors should carefully consider the risks and investment objectives of the Elements U.S. Portfolio, Elements U.S. Small Cap Portfolio, Elements International Portfolio, Elements International Small Cap Portfolio and Elements Emerging Markets Portfolio (each, a “Portfolio”, and collectively, the “Portfolios”), as an investment in a Portfolio may not be appropriate for all investors and the Portfolios are not designed to be a complete investment program.An investment in a Portfolio involves a high degree of risk. It is possible that investing in a Portfolio may result in a loss of some or all of the amount invested. Before making an investment/allocation decision, investors should (i) consider the suitability of this investment with respect to an investor’s or a client’s investment objectives and individual situation and (ii) consider factors such as an investor’s or a client’s net worth, income, age and risk tolerance. Investment should be avoided where an investor/client has a short-term investing horizon and/or cannot bear the loss of some or all of the investment. Before investing in a Portfolio, an investor should read the discussion of the risks of investing in the Portfolio in the prospectus.
Mutual fund investing involves risk. Principal loss is possible.
Economic, political, and issuer-specific events will cause the value of securities, and the Portfolio that owns them, to rise or fall. Because the value of your investment in a Portfolio will fluctuate, you may lose money, even over the long term. Securities of smaller companies are often less liquid than those of larger companies, and smaller companies are generally more vulnerable to adverse business or economic developments and may have more limited resources. Foreign securities prices may decline or fluctuate because of economic or political actions of foreign governments and/or less regulated or liquid securities markets and may give rise to foreign currency risk. Securities of companies that exhibit other factors such as value, momentum or quality may be riskier than securities of companies that do not exhibit those factors, and may perform differently from the market as a whole. If a Portfolio uses derivatives, such Portfolio will be directly exposed to the risks of that derivative, including the risk that the counterparty is unable or unwilling to perform its obligations. Derivatives are subject to a number of additional risks, including risks associated with liquidity, interest rates, market movements and valuation. Securities lending and similar transactions involve the risk that the counterparty may fail to return the securities in a timely manner or at all and that the value of collateral securing a securities loan or similar transaction falls. Please see the prospectus for a complete list of risks.
Each Portfolio is classified asnon-diversified under the 1940 Act. Each Portfolio is anopen-end management investment company.
The Portfolios’ investment objectives, risks, charges and expenses must be considered carefully before investing. The prospectus contains this and other important information about the Portfolios. You can obtain an additional copy of the Portfolios’ most recent periodic reports, prospectus, which includes a statement of additional information, and certain other regulatory filings by calling855-609-3680 or visiting www.elementsfunds.com. The prospectus should be read carefully before investing.
| The | Elements Portfolios are distributed by ALPS Distributors, Inc. SRG000974 |
| 1 | The “equity risk premium” is positive if investment returns for equity securities exceed the risk-free rate, on average and over time. The “risk-free rate” is the rate of return that can be earned on high quality, short-term government debt securities. |
| 2 | The Russell 1000 Index consists of the largest 1000 companies in the Russell 3000 Index. |
| 3 | The Russell 2000 Index is comprised of the smallest 2000 companies in the Russell 3000 Index. |
| 4 | The MSCI World ex USA Index captures large and mid cap representation across 22 of 23 Developed Markets countries – excluding the United States. |
| 5 | The MSCI World ex USA Small Cap Index captures small cap representation across 22 of 23 Developed Markets countries – excluding the United States. |
| 6 | The MSCI Emerging Markets Index captures large and mid cap representation across 26 Emerging Markets countries. |
Past performance does not guarantee future results. Indices are not investable and do not reflect any fees or transaction costs.
| | | | | | | | | | | | | | | | |
| | Elements Portfolios | | | | | | Annual Report | | | | | | May 31, 2019 | | |
| | | | |
21
| | | | |
| ALLOCATION OF PORTFOLIO HOLDINGS AT MAY 31, 2019 | | | | |
| | | | | | | | |
ELEMENTS U.S. PORTFOLIO PORTFOLIO ALLOCATION BY SECTOR | |
| | |
| Information Technology | | | $175,239,601 | | | | 18.4% | |
| | |
| Consumer Discretionary | | | 172,616,030 | | | | 18.1% | |
| | |
| Consumer Staples | | | 128,872,192 | | | | 13.5% | |
| | |
| Industrials | | | 107,189,751 | | | | 11.2% | |
| | |
| Financials | | | 103,647,790 | | | | 10.9% | |
| | |
| Communication Services | | | 91,777,518 | | | | 9.6% | |
| | |
| Health Care | | | 79,523,044 | | | | 8.3% | |
| | |
| Materials | | | 32,972,511 | | | | 3.5% | |
| | |
| Energy | | | 30,907,709 | | | | 3.2% | |
| | |
| Utilities | | | 4,576,008 | | | | 0.5% | |
| | |
| Real Estate | | | 8,850 | | | | 0.0% | |
| | |
| Other(1) | | | 26,353,562 | | | | 2.8% | |
| | | $953,684,566 | | | | | |
| | | | | | | | |
ELEMENTS INTERNATIONAL PORTFOLIO PORTFOLIO ALLOCATION BY SECTOR | |
| | |
| Industrials | | | $109,073,573 | | | | 18.2% | |
| | |
| Consumer Staples | | | 91,360,142 | | | | 15.2% | |
| | |
| Consumer Discretionary | | | 85,072,725 | | | | 14.2% | |
| | |
| Financials | | | 60,368,415 | | | | 10.1% | |
| | |
| Health Care | | | 55,743,728 | | | | 9.3% | |
| | |
| Information Technology | | | 54,286,822 | | | | 9.1% | |
| | |
| Materials | | | 39,302,090 | | | | 6.6% | |
| | |
| Communication Services | | | 31,528,380 | | | | 5.3% | |
| | |
| Energy | | | 30,714,633 | | | | 5.1% | |
| | |
| Real Estate | | | 15,995,919 | | | | 2.7% | |
| | |
| Utilities | | | 7,719,787 | | | | 1.3% | |
| | |
| Other(1) | | | 17,242,943 | | | | 2.9% | |
| | | $598,409,157 | | | | | |
| | | | | | | | |
ELEMENTS U.S. SMALL CAP PORTFOLIO PORTFOLIO ALLOCATION BY SECTOR | |
| | |
| Consumer Discretionary | | | $78,941,852 | | | | 22.2% | |
| | |
| Industrials | | | 77,708,447 | | | | 21.9% | |
| | |
| Information Technology | | | 54,196,232 | | | | 15.2% | |
| | |
| Financials | | | 45,142,155 | | | | 12.7% | |
| | |
| Health Care | | | 26,827,928 | | | | 7.5% | |
| | |
| Consumer Staples | | | 17,131,292 | | | | 4.8% | |
| | |
| Communication Services | | | 14,269,826 | | | | 4.0% | |
| | |
| Materials | | | 11,790,405 | | | | 3.3% | |
| | |
| Energy | | | 11,108,600 | | | | 3.1% | |
| | |
| Real Estate | | | 7,237,605 | | | | 2.0% | |
| | |
| Utilities | | | 2,778,738 | | | | 0.8% | |
| | |
| Other(1) | | | 8,824,302 | | | | 2.5% | |
| | | $355,957,382 | | | | | |
| | | | | | | | |
ELEMENTS INTERNATIONAL SMALL CAP PORTFOLIO PORTFOLIO ALLOCATION BY SECTOR | |
| | |
| Industrials | | | $ 60,665,816 | | | | 20.0% | |
| | |
| Consumer Discretionary | | | 51,342,420 | | | | 17.0% | |
| | |
| Consumer Staples | | | 34,196,470 | | | | 11.3% | |
| | |
| Information Technology | | | 27,282,565 | | | | 9.0% | |
| | |
| Financials | | | 26,067,412 | | | | 8.6% | |
| | |
| Materials | | | 25,318,148 | | | | 8.3% | |
| | |
| Energy | | | 20,909,140 | | | | 6.9% | |
| | |
| Communication Services | | | 15,007,951 | | | | 4.9% | |
| | |
| Health Care | | | 11,553,642 | | | | 3.8% | |
| | |
| Utilities | | | 11,479,798 | | | | 3.8% | |
| | |
| Real Estate | | | 3,754,793 | | | | 1.2% | |
| | |
| Other(1) | | | 15,698,254 | | | | 5.2% | |
| | | $303,276,409 | | | | | |
| | | | |
| | The accompanying Notes to the Financial Statements are an integral part of these Financial Statements. | | (Continued) |
| | | | | | | | | | | | | | | | |
| | Elements Portfolios | | | | | | Annual Report | | | | | | May 31, 2019 | | |
| | | | |
22
| | | | |
| ALLOCATION OF PORTFOLIO HOLDINGS AT MAY 31, 2019 | | | | |
| | | | | | | | |
ELEMENTS EMERGING MARKETS PORTFOLIO PORTFOLIO ALLOCATION BY SECTOR | |
| | |
| Energy | | | $44,396,275 | | | | 12.3% | |
| | |
| Financials | | | 39,640,590 | | | | 10.9% | |
| | |
| Consumer Staples | | | 34,993,211 | | | | 9.7% | |
| | |
| Materials | | | 31,298,179 | | | | 8.7% | |
| | |
| Health Care | | | 31,041,105 | | | | 8.6% | |
| | |
| Information Technology | | | 30,043,950 | | | | 8.3% | |
| | |
| Communication Services | | | 29,478,825 | | | | 8.2% | |
| | |
| Consumer Discretionary | | | 28,462,988 | | | | 7.9% | |
| | |
| Industrials | | | 28,272,635 | | | | 7.8% | |
| | |
| Real Estate | | | 26,274,067 | | | | 7.3% | |
| | |
| Utilities | | | 6,192,239 | | | | 1.7% | |
| | |
| Other(1) | | | 31,199,036 | | | | 8.6% | |
| | | $361,293,100 | | | | | |
| (1) | Cash, cash equivalents, short-term investments and other assets less liabilities. |
The Global Industry Classification Standard (GICS®) was developed by and/or is the exclusive property of MSCI, Inc. (“MSCI”) and Standard & Poor’s Financial Services LLC (“S&P”). GICS is a service mark of MSCI and S&P and has been licensed for use by U.S. Bancorp Fund Services, LLC.
| | | | |
| | The accompanying Notes to the Financial Statements are an integral part of these Financial Statements. | | |
| | | | | | | | | | | | | | | | |
| | Elements Portfolios | | | | | | Annual Report | | | | | | May 31, 2019 | | |
| | | | |
23
| | |
| Schedule of Investments | | as of May 31, 2019 |
| | | | | | | | |
| | | SHARES | | | FAIR
VALUE | |
COMMON STOCKS - 97.3% | | | | | | | | |
| Automobiles & Components - 1.5% | | | | | | |
Adient PLC - ADR | | | 57,636 | | | $ | 994,797 | |
BorgWarner, Inc. | | | 34,099 | | | | 1,209,832 | |
Ford Motor Co. | | | 283,353 | | | | 2,697,521 | |
Gentex Corp. | | | 166,828 | | | | 3,563,446 | |
Goodyear Tire & Rubber Co. | | | 70,038 | | | | 939,210 | |
Lear Corp. | | | 11,563 | | | | 1,376,344 | |
Thor Industries, Inc. (a) | | | 59,268 | | | | 3,060,599 | |
Visteon Corp. (b) | | | 200 | | | | 8,902 | |
| | | | | | | | |
| | | | | | | 13,850,651 | |
| | | | | | | | |
| Banks - 3.4% | | | | | | |
Associated Banc-Corp. | | | 28,408 | | | | 562,763 | |
Bank of America Corp. | | | 47,844 | | | | 1,272,650 | |
Bank of Hawaii Corp. | | | 9,118 | | | | 689,868 | |
Bank OZK (a) | | | 35,702 | | | | 1,031,788 | |
BankUnited, Inc. | | | 1,100 | | | | 35,728 | |
Citigroup, Inc. | | | 7,110 | | | | 441,887 | |
Citizens Financial Group, Inc. | | | 1,000 | | | | 32,580 | |
Comerica, Inc. | | | 300 | | | | 20,646 | |
Commerce Bancshares, Inc. | | | 3,298 | | | | 189,074 | |
Cullen/Frost Bankers, Inc. | | | 2,141 | | | | 195,409 | |
East West Bancorp, Inc. | | | 37,303 | | | | 1,593,584 | |
Fifth Third Bancorp | | | 2,629 | | | | 69,669 | |
First Citizens BancShares, Inc. - Class A | | | 3,912 | | | | 1,643,431 | |
First Horizon National Corp. | | | 39 | | | | 523 | |
First Republic Bank/CA | | | 600 | | | | 58,212 | |
Huntington Bancshares, Inc. | | | 130,996 | | | | 1,657,099 | |
KeyCorp | | | 145,628 | | | | 2,325,679 | |
PacWest Bancorp | | | 100 | | | | 3,634 | |
PNC Financial Services Group Inc/The | | | 200 | | | | 25,452 | |
Popular, Inc. (c) | | | 32,243 | | | | 1,683,407 | |
Regions Financial Corp. | | | 42,414 | | | | 586,586 | |
SunTrust Banks, Inc. | | | 158 | | | | 9,482 | |
Synovus Financial Corp. | | | 291 | | | | 9,300 | |
TCF Financial Corp. | | | 86,054 | | | | 1,640,189 | |
Umpqua Holdings Corp. | | | 159,615 | | | | 2,549,052 | |
Webster Financial Corp. | | | 3,697 | | | | 163,703 | |
Wells Fargo & Co. | | | 306,247 | | | | 13,588,179 | |
Western Alliance Bancorp (b) | | | 13,583 | | | | 558,940 | |
Wintrust Financial Corp. | | | 2,177 | | | | 147,470 | |
| | | | | | | | |
| | | | | | | 32,785,984 | |
| | | | | | | | |
| Capital Goods - 8.4% | | | | | | |
3M Co. | | | 5,530 | | | | 883,418 | |
Acuity Brands, Inc. | | | 8,589 | | | | 1,062,202 | |
AECOM (b) | | | 9,976 | | | | 318,234 | |
AGCO Corp. | | | 29,889 | | | | 1,989,412 | |
Air Lease Corp. | | | 659 | | | | 23,724 | |
Allegion PLC (c) | | | 1,047 | | | | 101,611 | |
Allison Transmission Holdings, Inc. | | | 17,829 | | | | 737,942 | |
AMETEK, Inc. | | | 13,652 | | | | 1,117,962 | |
AO Smith Corp. | | | 63,219 | | | | 2,560,370 | |
Arcosa, Inc. | | | 45,853 | | | | 1,553,958 | |
Armstrong World Industries, Inc. | | | 6,989 | | | | 619,924 | |
Boeing Co. | | | 14,806 | | | | 5,057,878 | |
Carlisle Cos., Inc. | | | 5,300 | | | | 706,543 | |
Caterpillar, Inc. | | | 378 | | | | 45,288 | |
| | | | | | | | |
| | | SHARES | | | FAIR
VALUE | |
| Capital Goods - 8.4% (continued) | | | | | | |
Colfax Corp. (b) | | | 35,939 | | | $ | 902,069 | |
Crane Co. | | | 3,287 | | | | 251,324 | |
Cummins, Inc. | | | 15,917 | | | | 2,399,647 | |
Curtiss-Wright Corp. | | | 4,032 | | | | 449,528 | |
Donaldson Co., Inc. | | | 16,640 | | | | 789,568 | |
Dover Corp. | | | 9,947 | | | | 889,361 | |
Eaton Corp. PLC (c) | | | 2,323 | | | | 173,040 | |
Fastenal Co. | | | 6,594 | | | | 201,710 | |
Flowserve Corp. | | | 700 | | | | 32,515 | |
Fluor Corp. | | | 1,517 | | | | 42,051 | |
Fortive Corp. | | | 7,645 | | | | 582,167 | |
Fortune Brands Home & Security, Inc. | | | 30,337 | | | | 1,457,996 | |
Gardner Denver Holdings, Inc. (b) | | | 49,599 | | | | 1,684,878 | |
Gates Industrial Corp. PLC (b)(c) | | | 44,337 | | | | 500,121 | |
General Electric Co. | | | 84,500 | | | | 797,680 | |
Graco, Inc. | | | 39,174 | | | | 1,849,796 | |
GrafTech International Ltd. (a) | | | 24,328 | | | | 241,091 | |
Harris Corp. | | | 5,950 | | | | 1,113,781 | |
HD Supply Holdings, Inc. (b) | | | 34,584 | | | | 1,434,890 | |
HEICO Corp. | | | 35,615 | | | | 4,330,428 | |
HEICO Corp. - Class A | | | 40,896 | | | | 4,018,441 | |
Hexcel Corp. | | | 18,818 | | | | 1,369,762 | |
Honeywell International, Inc. | | | 3,609 | | | | 592,995 | |
Hubbell, Inc. | | | 2,157 | | | | 247,063 | |
Huntington Ingalls Industries, Inc. | | | 2,804 | | | | 575,157 | |
IDEX Corp. | | | 8,069 | | | | 1,232,217 | |
Illinois Tool Works, Inc. | | | 443 | | | | 61,861 | |
Ingersoll-Rand PLC (c) | | | 409 | | | | 48,401 | |
ITT, Inc. | | | 36,416 | | | | 2,098,290 | |
Jacobs Engineering Group, Inc. | | | 22,451 | | | | 1,690,336 | |
Johnson Controls International PLC (c) | | | 3,870 | | | | 149,072 | |
Lennox International, Inc. (a) | | | 8,339 | | | | 2,202,413 | |
Lincoln Electric Holdings, Inc. | | | 12,373 | | | | 939,606 | |
Lockheed Martin Corp. | | | 4,325 | | | | 1,464,186 | |
Masco Corp. | | | 1,466 | | | | 51,193 | |
MSC Industrial Direct Co., Inc. | | | 12,216 | | | | 863,183 | |
nVent Electric PLC (c) | | | 44,653 | | | | 1,029,698 | |
Oshkosh Corp. | | | 24,511 | | | | 1,744,938 | |
Owens Corning | | | 1,855 | | | | 89,912 | |
Parker-Hannifin Corp. | | | 2,050 | | | | 312,256 | |
Pentair PLC (c) | | | 30,214 | | | | 1,052,051 | |
Quanta Services, Inc. | | | 408 | | | | 14,182 | |
Raytheon Co. | | | 23,886 | | | | 4,168,107 | |
Regal Beloit Corp. | | | 11,625 | | | | 845,138 | |
Resideo Technologies, Inc. (b) | | | 90,560 | | | | 1,782,221 | |
Rockwell Automation, Inc. | | | 5,126 | | | | 763,005 | |
Sensata Technologies Holding PLC (b)(c) | | | 39 | | | | 1,665 | |
Snap-on, Inc. | | | 370 | | | | 57,690 | |
Spirit AeroSystems Holdings, Inc. | | | 30,184 | | | | 2,446,111 | |
Teledyne Technologies, Inc. (b) | | | 3,510 | | | | 827,658 | |
Terex Corp. | | | 148 | | | | 3,962 | |
Textron, Inc. | | | 8,710 | | | | 394,563 | |
Toro Co. | | | 26,873 | | | | 1,751,045 | |
Univar, Inc. (b) | | | 86,080 | | | | 1,722,461 | |
Valmont Industries, Inc. | | | 3,885 | | | | 439,432 | |
WABCO Holdings, Inc. (b) | | | 2,422 | | | | 317,064 | |
Wabtec Corp. | | | 292 | | | | 18,215 | |
| | | | |
| | The accompanying Notes to the Financial Statements are an integral part of these Financial Statements. | | (Continued) |
| | | | | | | | | | | | | | | | |
| | Elements Portfolios | | | | | | Annual Report | | | | | | May 31, 2019 | | |
| | | | |
24
| | |
| Schedule of Investments | | as of May 31, 2019 |
| | | | | | | | |
| | | SHARES | | | FAIR
VALUE | |
| Capital Goods - 8.4% (continued) | | | | | | |
Watsco, Inc. | | | 7,506 | | | $ | 1,181,369 | |
Welbilt, Inc. (b) | | | 100 | | | | 1,543 | |
WESCO International, Inc. (b) | | | 50,658 | | | | 2,372,314 | |
WW Grainger, Inc. | | | 5,058 | | | | 1,323,628 | |
Xylem, Inc. | | | 11,352 | | | | 842,545 | |
| | | | | | | | |
| | | | | | | 80,009,056 | |
| | | | | | | | |
| Commercial & Professional Services - 1.1% | |
Cintas Corp. | | | 5,512 | | | | 1,222,727 | |
Clean Harbors, Inc. (b) | | | 17,581 | | | | 1,127,294 | |
Copart, Inc. (b) | | | 19,963 | | | | 1,426,955 | |
Equifax, Inc. | | | 180 | | | | 21,762 | |
IHS Markit Ltd. (b)(c) | | | 3,700 | | | | 212,343 | |
KAR Auction Services, Inc. | | | 15,937 | | | | 895,978 | |
ManpowerGroup, Inc. | | | 34,349 | | | | 2,937,526 | |
Republic Services, Inc. | | | 7,341 | | | | 620,975 | |
Robert Half International, Inc. | | | 19,121 | | | | 1,026,033 | |
Rollins, Inc. | | | 14,470 | | | | 543,638 | |
Verisk Analytics, Inc. | | | 1,674 | | | | 234,360 | |
Waste Management, Inc. | | | 996 | | | | 108,913 | |
| | | | | | | | |
| | | | | | | 10,378,504 | |
| | | | | | | | |
| Consumer Durables & Apparel - 4.1% | | | | | | |
Brunswick Corp. | | | 1 | | | | 41 | |
Capri Holdings Ltd. (b)(c) | | | 5,271 | | | | 171,202 | |
Carter’s, Inc. | | | 1,652 | | | | 138,950 | |
Columbia Sportswear Co. | | | 31,599 | | | | 2,963,354 | |
Garmin Ltd. (c) | | | 21,954 | | | | 1,679,042 | |
Hanesbrands, Inc. | | | 5,646 | | | | 83,843 | |
Hasbro, Inc. | | | 5,535 | | | | 526,600 | |
Kontoor Brands, Inc. (a)(b) | | | 3,934 | | | | 115,270 | |
Lennar Corp. - A Shares | | | 17,892 | | | | 888,517 | |
Lennar Corp. - B Shares | | | 879 | | | | 34,729 | |
Lululemon Athletica, Inc. (b) | | | 13,376 | | | | 2,214,932 | |
Newell Brands, Inc. | | | 60,854 | | | | 816,661 | |
NIKE, Inc. | | | 125,305 | | | | 9,666,028 | |
NVR, Inc. (b) | | | 1,078 | | | | 3,451,292 | |
PulteGroup, Inc. | | | 76,204 | | | | 2,362,324 | |
PVH Corp. | | | 4,215 | | | | 359,076 | |
Ralph Lauren Corp. | | | 34,059 | | | | 3,580,623 | |
Skechers U.S.A., Inc. (a)(b) | | | 76,831 | | | | 2,145,890 | |
Tapestry, Inc. | | | 72,616 | | | | 2,073,913 | |
Tempur Sealy International, Inc. (b) | | | 430 | | | | 27,438 | |
Toll Brothers, Inc. | | | 21,883 | | | | 760,872 | |
Under Armour, Inc. - Class A (a)(b) | | | 50,787 | | | | 1,157,944 | |
Under Armour, Inc. - Class C (b) | | | 98,791 | | | | 1,998,542 | |
VF Corp. | | | 27,539 | | | | 2,254,893 | |
Whirlpool Corp. | | | 700 | | | | 80,416 | |
| | | | | | | | |
| | | | | | | 39,552,392 | |
| | | | | | | | |
| Consumer Services - 2.4% | | | | | | |
Aramark | | | 7,908 | | | | 275,119 | |
Bright Horizons Family Solutions, Inc. (b) | | | 404 | | | | 55,372 | |
Chipotle Mexican Grill, Inc. (b) | | | 2,986 | | | | 1,970,670 | |
Choice Hotels International, Inc. | | | 11,892 | | | | 978,593 | |
Darden Restaurants, Inc. | | | 3,432 | | | | 399,210 | |
Domino’s Pizza, Inc. | | | 1,494 | | | | 417,573 | |
Extended Stay America, Inc. | | | 33,775 | | | | 578,904 | |
| | | | | | | | |
| | | SHARES | | | FAIR
VALUE | |
| Consumer Services - 2.4% (continued) | | | | | | |
Frontdoor, Inc. (b) | | | 42,840 | | | $ | 1,722,596 | |
Graham Holdings Co. | | | 2,519 | | | | 1,714,280 | |
Grand Canyon Education, Inc. (b) | | | 2,000 | | | | 239,720 | |
H&R Block, Inc. | | | 3,399 | | | | 89,224 | |
Hilton Grand Vacations, Inc. (b) | | | 610 | | | | 15,506 | |
Hilton Worldwide Holdings, Inc. | | | 5,500 | | | | 491,920 | |
Hyatt Hotels Corp. | | | 25,923 | | | | 1,872,678 | |
McDonald’s Corp. | | | 16,859 | | | | 3,342,634 | |
Service Corp International | | | 2,610 | | | | 114,501 | |
ServiceMaster Global Holdings, Inc. (b) | | | 23,404 | | | | 1,263,816 | |
Starbucks Corp. | | | 52,252 | | | | 3,974,287 | |
Wyndham Destinations, Inc. | | | 13,632 | | | | 542,281 | |
Yum China Holdings, Inc. | | | 61,873 | | | | 2,475,539 | |
Yum! Brands, Inc. | | | 2,414 | | | | 247,073 | |
| | | | | | | | |
| | | | | | | 22,781,496 | |
| | | | | | | | |
| Diversified Financials - 2.6% | | | | | | |
Affiliated Managers Group, Inc. | | | 692 | | | | 58,003 | |
Ally Financial, Inc. | | | 23,371 | | | | 674,721 | |
American Express Co. | | | 14,489 | | | | 1,662,033 | |
Berkshire Hathaway, Inc. (b) | | | 33,069 | | | | 6,528,482 | |
BGC Partners, Inc. | | | 72,200 | | | | 339,340 | |
BlackRock, Inc. | | | 493 | | | | 204,871 | |
Cboe Global Markets, Inc. | | | 10,385 | | | | 1,127,188 | |
Charles Schwab Corp. | | | 800 | | | | 33,288 | |
Credit Acceptance Corp. (b) | | | 165 | | | | 75,304 | |
E*TRADE Financial Corp. | | | 30,461 | | | | 1,364,653 | |
Evercore, Inc. | | | 16,437 | | | | 1,269,429 | |
FactSet Research Systems, Inc. | | | 1,519 | | | | 422,586 | |
Franklin Resources, Inc. | | | 2,644 | | | | 84,132 | |
Goldman Sachs Group, Inc. | | | 3,300 | | | | 602,217 | |
Invesco Ltd. (c) | | | 1,500 | | | | 29,310 | |
Janus Henderson Group PLC (c) | | | 5,700 | | | | 115,824 | |
Lazard Ltd. (c) | | | 1,636 | | | | 50,978 | |
Legg Mason, Inc. | | | 24,867 | | | | 885,763 | |
LPL Financial Holdings, Inc. | | | 5,253 | | | | 421,396 | |
Morgan Stanley | | | 7,500 | | | | 305,175 | |
Morningstar, Inc. | | | 14,569 | | | | 2,040,243 | |
MSCI, Inc. | | | 1,199 | | | | 263,792 | |
Nasdaq, Inc. | | | 200 | | | | 18,128 | |
Northern Trust Corp. | | | 1,700 | | | | 145,384 | |
OneMain Holdings, Inc. | | | 5,012 | | | | 149,708 | |
Raymond James Financial, Inc. | | | 8,431 | | | | 696,232 | |
S&P Global, Inc. | | | 506 | | | | 108,223 | |
SEI Investments Co. | | | 50,216 | | | | 2,523,354 | |
State Street Corp. | | | 500 | | | | 27,625 | |
Synchrony Financial | | | 35,709 | | | | 1,200,894 | |
T. Rowe Price Group, Inc. | | | 2,000 | | | | 202,280 | |
Voya Financial, Inc. | | | 17,233 | | | | 877,677 | |
| | | | | | | | |
| | | | | | | 24,508,233 | |
| | | | | | | | |
| Energy - 3.2% | | | | | | |
Apache Corp. | | | 1,300 | | | | 33,891 | |
Apergy Corp. (b) | | | 27,350 | | | | 848,123 | |
Baker Hughes a GE Co. | | | 25,114 | | | | 537,691 | |
Cabot Oil & Gas Corp. | | | 40,601 | | | | 1,015,837 | |
Chevron Corp. | | | 64,568 | | | | 7,351,067 | |
ConocoPhillips | | | 20,096 | | | | 1,184,860 | |
| | | | |
| | The accompanying Notes to the Financial Statements are an integral part of these Financial Statements. | | (Continued) |
| | | | | | | | | | | | | | | | |
| | Elements Portfolios | | | | | | Annual Report | | | | | | May 31, 2019 | | |
| | | | |
25
| | |
| Schedule of Investments | | as of May 31, 2019 |
| | | | | | | | |
| | | SHARES | | | FAIR
VALUE | |
| Energy - 3.2% (continued) | | | | | | |
Devon Energy Corp. | | | 5,310 | | | $ | 133,600 | |
Exxon Mobil Corp. | | | 172,364 | | | | 12,198,200 | |
Halliburton Co. | | | 58,085 | | | | 1,236,630 | |
HollyFrontier Corp. | | | 11,300 | | | | 429,174 | |
Kosmos Energy Ltd. | | | 810 | | | | 4,990 | |
Marathon Oil Corp. | | | 26,793 | | | | 352,328 | |
Marathon Petroleum Corp. | | | 5,129 | | | | 235,883 | |
Occidental Petroleum Corp. | | | 300 | | | | 14,931 | |
ONEOK, Inc. | | | 425 | | | | 27,038 | |
PBF Energy, Inc. | | | 21,788 | | | | 575,203 | |
Phillips 66 | | | 2,500 | | | | 202,000 | |
RPC, Inc. (a) | | | 79,192 | | | | 589,188 | |
Schlumberger Ltd. (c) | | | 51,765 | | | | 1,795,728 | |
SM Energy Co. | | | 1,300 | | | | 15,119 | |
Valero Energy Corp. | | | 29,929 | | | | 2,107,002 | |
Whiting Petroleum Corp. (b) | | | 759 | | | | 13,950 | |
Williams Cos., Inc. | | | 200 | | | | 5,276 | |
| | | | | | | | |
| | | | | | | 30,907,709 | |
| | | | | | | | |
| Food & Staples Retailing - 6.3% | | | | | | |
Casey’s General Stores, Inc. (a) | | | 6,636 | | | | 856,575 | |
Costco Wholesale Corp. | | | 36,670 | | | | 8,785,398 | |
Kroger Co. | | | 154,858 | | | | 3,532,311 | |
Sprouts Farmers Market, Inc. (b) | | | 51,259 | | | | 1,027,743 | |
Sysco Corp. | | | 40,811 | | | | 2,808,613 | |
U.S. Foods Holding Corp. (b) | | | 108,991 | | | | 3,766,729 | |
Walgreens Boots Alliance, Inc. | | | 121,570 | | | | 5,998,264 | |
Walmart, Inc. | | | 324,841 | | | | 32,951,871 | |
| | | | | | | | |
| | | | | | | 59,727,504 | |
| | | | | | | | |
| Food, Beverage & Tobacco - 4.4% | | | | | | |
Altria Group, Inc. | | | 9,580 | | | | 469,995 | |
Brown-Forman Corp. - Class A | | | 7,428 | | | | 365,532 | |
Brown-Forman Corp. - Class B | | | 22,739 | | | | 1,136,495 | |
Bunge Ltd. (c) | | | 14,030 | | | | 733,629 | |
Coca-Cola Co. | | | 25,526 | | | | 1,254,092 | |
Flowers Foods, Inc. | | | 56,140 | | | | 1,255,852 | |
General Mills, Inc. | | | 37,096 | | | | 1,834,026 | |
Hain Celestial Group, Inc. (a)(b) | | | 55,125 | | | | 1,123,999 | |
Hershey Co. | | | 17,374 | | | | 2,292,673 | |
Hormel Foods Corp. (a) | | | 63,566 | | | | 2,510,221 | |
Ingredion, Inc. | | | 4,585 | | | | 349,194 | |
Keurig Dr. Pepper, Inc. | | | 21,539 | | | | 607,184 | |
Kraft Heinz Co. | | | 24,604 | | | | 680,301 | |
Lamb Weston Holdings, Inc. | | | 2,604 | | | | 154,287 | |
McCormick & Co., Inc. | | | 10,371 | | | | 1,618,291 | |
Molson Coors Brewing Co. | | | 7,957 | | | | 437,476 | |
Mondelez International, Inc. | | | 48,625 | | | | 2,472,581 | |
Monster Beverage Corp. (b) | | | 19,488 | | | | 1,205,528 | |
PepsiCo., Inc. | | | 58,056 | | | | 7,431,168 | |
Philip Morris International, Inc. | | | 100,957 | | | | 7,786,813 | |
Pilgrim’s Pride Corp. (b) | | | 80,578 | | | | 2,060,379 | |
Post Holdings, Inc. (b) | | | 3,775 | | | | 396,753 | |
TreeHouse Foods, Inc. (a)(b) | | | 17,396 | | | | 906,853 | |
Tyson Foods, Inc. | | | 35,850 | | | | 2,720,657 | |
| | | | | | | | |
| | | | | | | 41,803,979 | |
| | | | | | | | |
| | | | | | | | |
| | | SHARES | | | FAIR
VALUE | |
| Health Care Equipment & Services - 5.3% | |
Acadia Healthcare Co., Inc. (b) | | | 100 | | | $ | 3,222 | |
Align Technology, Inc. (b) | | | 1,854 | | | | 527,185 | |
Anthem, Inc. | | | 16,660 | | | | 4,631,147 | |
Baxter International, Inc. | | | 30,353 | | | | 2,229,124 | |
Cantel Medical Corp. | | | 239 | | | | 16,429 | |
Cardinal Health, Inc. | | | 17,804 | | | | 749,014 | |
Centene Corp. (b) | | | 22,422 | | | | 1,294,871 | |
Chemed Corp. | | | 4,311 | | | | 1,413,749 | |
Cigna Corp. | | | 4,000 | | | | 592,080 | |
Cooper Cos., Inc. | | | 243 | | | | 72,363 | |
Covetrus, Inc. (b) | | | 25,940 | | | | 639,680 | |
CVS Health Corp. | | | 25,670 | | | | 1,344,338 | |
Danaher Corp. | | | 6,372 | | | | 841,168 | |
DENTSPLY SIRONA, Inc. | | | 16,726 | | | | 901,030 | |
Edwards Lifesciences Corp. (b) | | | 5,620 | | | | 959,334 | |
Encompass Health Corp. | | | 4,384 | | | | 258,305 | |
HCA Healthcare, Inc. | | | 652 | | | | 78,866 | |
Henry Schein, Inc. (b) | | | 3,549 | | | | 228,769 | |
Hill-Rom Holdings, Inc. | | | 13,613 | | | | 1,308,890 | |
Humana, Inc. | | | 7,151 | | | | 1,750,994 | |
ICU Medical, Inc. (b) | | | 3,858 | | | | 820,982 | |
IDEXX Laboratories, Inc. (b) | | | 6,125 | | | | 1,529,841 | |
Integra LifeSciences Holdings Corp. (b) | | | 19,248 | | | | 896,957 | |
Laboratory Corp of America Holdings (b) | | | 1,700 | | | | 276,437 | |
Masimo Corp. (b) | | | 18,481 | | | | 2,416,206 | |
MEDNAX, Inc. (b) | | | 75,334 | | | | 1,857,736 | |
Medtronic PLC (c) | | | 1,600 | | | | 148,128 | |
Molina Healthcare, Inc. (b) | | | 4,670 | | | | 664,354 | |
Premier, Inc. (b) | | | 72,837 | | | | 2,676,760 | |
Quest Diagnostics, Inc. | | | 13,878 | | | | 1,331,039 | |
ResMed, Inc. | | | 3,754 | | | | 428,407 | |
Steris PLC (c) | | | 14,327 | | | | 1,915,233 | |
UnitedHealth Group, Inc. | | | 38,511 | | | | 9,311,960 | |
Universal Health Services, Inc. | | | 2,947 | | | | 352,314 | |
Varian Medical Systems, Inc. (b) | | | 14,470 | | | | 1,826,982 | |
Veeva Systems, Inc. (b) | | | 1,300 | | | | 200,577 | |
WellCare Health Plans, Inc. (b) | | | 13,110 | | | | 3,620,851 | |
West Pharmaceutical Services, Inc. | | | 5,994 | | | | 686,912 | |
| | | | | | | | |
| | | | | | | 50,802,234 | |
| | | | | | | | |
| Household & Personal Products - 2.9% | | | | | | |
Church & Dwight Co., Inc. | | | 20,042 | | | | 1,491,325 | |
Clorox Co. | | | 5,866 | | | | 872,920 | |
Colgate-Palmolive Co. | | | 100,150 | | | | 6,972,443 | |
Coty, Inc. (a) | | | 8,205 | | | | 101,250 | |
Estee Lauder Cos., Inc. | | | 18,336 | | | | 2,952,646 | |
Herbalife Nutrition Ltd. (b)(c) | | | 14,633 | | | | 611,367 | |
Kimberly-Clark Corp. | | | 22,861 | | | | 2,923,693 | |
Nu Skin Enterprises, Inc. | | | 40,542 | | | | 1,892,906 | |
Procter & Gamble Co. | | | 92,529 | | | | 9,522,159 | |
| | | | | | | | |
| | | | | | | 27,340,709 | |
| | | | | | | | |
| Insurance - 4.9% | | | | | | |
Aflac, Inc. | | | 48,016 | | | | 2,463,221 | |
Allstate Corp. | | | 19,717 | | | | 1,883,171 | |
American Financial Group, Inc. | | | 14,572 | | | | 1,430,970 | |
American National Insurance Co. | | | 3,899 | | | | 442,030 | |
Arthur J Gallagher & Co. | | | 9,903 | | | | 833,833 | |
| | | | |
| | The accompanying Notes to the Financial Statements are an integral part of these Financial Statements. | | (Continued) |
| | | | | | | | | | | | | | | | |
| | Elements Portfolios | | | | | | Annual Report | | | | | | May 31, 2019 | | |
| | | | |
26
| | |
| Schedule of Investments | | as of May 31, 2019 |
| | | | | | | | |
| | | SHARES | | | FAIR
VALUE | |
| Insurance - 4.9% (continued) | | | | | | |
Assurant, Inc. | | | 4,097 | | | $ | 409,536 | |
Assured Guaranty Ltd. (c) | | | 17,435 | | | | 712,568 | |
Brown & Brown, Inc. | | | 57,352 | | | | 1,810,603 | |
Cincinnati Financial Corp. | | | 17,197 | | | | 1,689,433 | |
CNA Financial Corp. | | | 46,301 | | | | 2,081,693 | |
Erie Indemnity Co. | | | 1,697 | | | | 360,901 | |
Fidelity National Financial, Inc. | | | 53,263 | | | | 2,053,289 | |
First American Financial Corp. | | | 49,990 | | | | 2,581,983 | |
Hanover Insurance Group, Inc. | | | 16,283 | | | | 1,989,131 | |
Hartford Financial Services Group, Inc. | | | 46,355 | | | | 2,441,054 | |
Loews Corp. | | | 32,955 | | | | 1,692,569 | |
Marsh & McLennan Cos., Inc. | | | 3,639 | | | | 347,888 | |
Mercury General Corp. (a) | | | 10,695 | | | | 616,567 | |
MetLife, Inc. | | | 69,957 | | | | 3,232,713 | |
Old Republic International Corp. | | | 126,119 | | | | 2,780,924 | |
Principal Financial Group, Inc. | | | 33,181 | | | | 1,711,144 | |
Progressive Corp. | | | 53,327 | | | | 4,227,765 | |
Reinsurance Group of America, Inc. | | | 12,587 | | | | 1,863,631 | |
RenaissanceRe Holdings Ltd. (c) | | | 5,571 | | | | 971,805 | |
Travelers Cos., Inc. | | | 14,026 | | | | 2,041,765 | |
Unum Group | | | 42,449 | | | | 1,336,719 | |
Willis Towers Watson PLC (c) | | | 1,400 | | | | 245,700 | |
WR Berkley Corp. | | | 33,384 | | | | 2,076,485 | |
| | | | | | | | |
| | | | | | | 46,329,091 | |
| | | | | | | | |
| Materials - 3.5% | | | | | | |
Air Products & Chemicals, Inc. | | | 160 | | | | 32,574 | |
AptarGroup, Inc. | | | 12,461 | | | | 1,411,458 | |
Ardagh Group SA (c) | | | 9,527 | | | | 136,331 | |
Ashland Global Holdings, Inc. | | | 9,148 | | | | 684,911 | |
Avery Dennison Corp. | | | 21,461 | | | | 2,233,232 | |
Axalta Coating Systems Ltd. (b)(c) | | | 54,023 | | | | 1,270,081 | |
Ball Corp. | | | 209 | | | | 12,831 | |
Bemis Co., Inc. | | | 57,811 | | | | 3,373,272 | |
Berry Global Group, Inc. (b) | | | 4,428 | | | | 208,205 | |
Cabot Corp. | | | 15,776 | | | | 630,093 | |
Celanese Corp. | | | 2,526 | | | | 239,793 | |
CF Industries Holdings, Inc. | | | 650 | | | | 26,156 | |
Domtar Corp. | | | 50,663 | | | | 2,130,379 | |
Dow, Inc. | | | 3,700 | | | | 173,012 | |
Ecolab, Inc. | | | 900 | | | | 165,681 | |
Freeport-McMoRan, Inc. | | | 89,696 | | | | 870,948 | |
Huntsman Corp. | | | 33,519 | | | | 582,225 | |
International Paper Co. | | | 3,448 | | | | 142,989 | |
Linde PLC (c) | | | 3,991 | | | | 720,575 | |
LyondellBasell Industries N.V. (c) | | | 13,573 | | | | 1,007,795 | |
Mosaic Co. | | | 13,720 | | | | 294,568 | |
Newmont Mining Corp. | | | 51,646 | | | | 1,708,966 | |
Nucor Corp. | | | 42,153 | | | | 2,023,344 | |
Olin Corp. | | | 53,350 | | | | 1,046,194 | |
Packaging Corp of America | | | 19,602 | | | | 1,746,146 | |
Reliance Steel & Aluminum Co. | | | 20,683 | | | | 1,722,273 | |
Royal Gold, Inc. | | | 5,205 | | | | 457,988 | |
RPM International, Inc. | | | 18,031 | | | | 965,019 | |
Sealed Air Corp. | | | 37 | | | | 1,550 | |
Sherwin-Williams Co. | | | 872 | | | | 365,760 | |
Silgan Holdings, Inc. | | | 16,562 | | | | 480,132 | |
Sonoco Products Co. | | | 35,202 | | | | 2,176,540 | |
| | | | | | | | |
| | | SHARES | | | FAIR
VALUE | |
| Materials - 3.5% (continued) | | | | | | |
Steel Dynamics, Inc. | | | 59,246 | | | $ | 1,490,037 | |
United States Steel Corp. | | | 5,134 | | | | 60,684 | |
Valvoline, Inc. | | | 21,554 | | | | 376,117 | |
Westlake Chemical Corp. | | | 16,352 | | | | 936,806 | |
Westrock Co. | | | 32,756 | | | | 1,067,846 | |
| | | | | | | | |
| | | | | | | 32,972,511 | |
| | | | | | | | |
| Media & Entertainment - 8.3% | | | | | | |
Activision Blizzard, Inc. | | | 56,017 | | | | 2,429,457 | |
Alphabet, Inc. - Class A (b) | | | 10,360 | | | | 11,463,340 | |
Alphabet, Inc. - Class C (b) | | | 8,695 | | | | 9,596,063 | |
AMC Networks, Inc. (b) | | | 8,911 | | | | 470,233 | |
Cable One, Inc. | | | 275 | | | | 307,189 | |
CBS Corp. | | | 8,099 | | | | 391,020 | |
Comcast Corp. | | | 3,535 | | | | 144,935 | |
Discovery Communications, Inc. - Class A (b) | | | 6,533 | | | | 178,090 | |
Discovery Communications, Inc. - Class C (b) | | | 5,868 | | | | 150,456 | |
Electronic Arts, Inc. (b) | | | 28,153 | | | | 2,620,481 | |
Facebook, Inc. (b) | | | 80,172 | | | | 14,228,125 | |
Fox Corp. - Class A | | | 13,172 | | | | 464,050 | |
Fox Corp. - Class B | | | 15,022 | | | | 521,414 | |
IAC InterActive Corp. (b) | | | 11,551 | | | | 2,551,038 | |
John Wiley & Sons, Inc. | | | 71,219 | | | | 2,975,530 | |
Liberty Media Corp. - Liberty SiriusXM - Class A (b) | | | 60,609 | | | | 2,183,136 | |
Liberty Media Corp. - Liberty SiriusXM - Class B (b) | | | 323 | | | | 11,673 | |
Liberty Media Corp. - Liberty Formula One (a)(b) | | | 5,192 | | | | 189,093 | |
Lions Gate Entertainment Corp. - Class A (c) | | | 93,137 | | | | 1,375,633 | |
Lions Gate Entertainment Corp. - Class B (c) | | | 110,555 | | | | 1,521,237 | |
Madison Square Garden Co. (b) | | | 3,747 | | | | 1,108,512 | |
Match Group, Inc. (a) | | | 53,190 | | | | 3,651,493 | |
News Corp. - Class A | | | 78,395 | | | | 892,919 | |
News Corp. - Class B | | | 26,068 | | | | 303,692 | |
Take-Two Interactive Software, Inc. (b) | | | 4,092 | | | | 442,550 | |
Tribune Media Co. | | | 19,795 | | | | 916,508 | |
TripAdvisor, Inc. (b) | | | 3,869 | | | | 163,543 | |
Twitter, Inc. (b) | | | 23,413 | | | | 853,170 | |
Viacom, Inc. - Class B | | | 127,972 | | | | 3,715,027 | |
Walt Disney Co. | | | 88,088 | | | | 11,631,140 | |
Zillow Group, Inc. - Class A (b) | | | 212 | | | | 8,974 | |
Zynga, Inc. (b) | | | 245,105 | | | | 1,541,710 | |
| | | | | | | | |
| | | | | | | 79,001,431 | |
| | | | | | | | |
| Pharmaceuticals, Biotechnology & Life Sciences - 3.0% | |
Agilent Technologies, Inc. | | | 5,843 | | | | 391,773 | |
Allergan PLC (c) | | | 17,807 | | | | 2,170,851 | |
Bio-Rad Laboratories, Inc. (b) | | | 1,707 | | | | 489,790 | |
Bio-Techne Corp. | | | 150 | | | | 29,708 | |
Bristol-Myers Squibb Co. | | | 131,685 | | | | 5,974,548 | |
Bruker Corp. | | | 68,182 | | | | 2,847,962 | |
Charles River Laboratories International, Inc. (b) | | | 2,740 | | | | 343,733 | |
| | | | |
| | The accompanying Notes to the Financial Statements are an integral part of these Financial Statements. | | (Continued) |
| | | | | | | | | | | | | | | | |
| | Elements Portfolios | | | | | | Annual Report | | | | | | May 31, 2019 | | |
| | | | |
27
| | |
| Schedule of Investments | | as of May 31, 2019 |
| | | | | | | | |
| | | SHARES | | | FAIR
VALUE | |
| Pharmaceuticals, Biotechnology & Life Sciences - 3.0% (continued) | |
Eli Lilly & Co. | | | 13,099 | | | $ | 1,518,698 | |
Illumina, Inc. (b) | | | 2,088 | | | | 640,828 | |
IQVIA Holdings, Inc. (b) | | | 1,021 | | | | 138,703 | |
Johnson & Johnson | | | 73,503 | | | | 9,639,918 | |
Merck & Co., Inc. | | | 8,712 | | | | 690,078 | |
Mettler-Toledo International, Inc. (b) | | | 100 | | | | 72,309 | |
Mylan N.V. (b)(c) | | | 1,891 | | | | 31,769 | |
PerkinElmer, Inc. | | | 17,189 | | | | 1,484,098 | |
Pfizer, Inc. | | | 22,312 | | | | 926,394 | |
PRA Health Sciences, Inc. (b) | | | 251 | | | | 21,769 | |
QIAGEN NV (b)(c) | | | 16,495 | | | | 628,130 | |
Waters Corp. (b) | | | 3,135 | | | | 629,226 | |
Zoetis, Inc. | | | 500 | | | | 50,525 | |
| | | | | | | | |
| | | | | | | 28,720,810 | |
| | | | | | | | |
| Real Estate - 0.0% (d) | | | | | | |
Newmark Group, Inc. | | | 1,109 | | | | 8,850 | |
| | | | | | | | |
| | | | | | | | |
| Retailing - 10.1% | | | | | | |
Advance Auto Parts, Inc. | | | 10,827 | | | | 1,678,185 | |
Amazon.com, Inc. (b) | | | 11,017 | | | | 19,555,946 | |
AutoNation, Inc. (b) | | | 12,154 | | | | 479,718 | |
AutoZone, Inc. (b) | | | 2,764 | | | | 2,838,932 | |
Best Buy Co., Inc. | | | 47,471 | | | | 2,975,008 | |
Booking Holdings, Inc. (b) | | | 663 | | | | 1,098,074 | |
Burlington Stores, Inc. (b) | | | 12,019 | | | | 1,881,935 | |
Dick’s Sporting Goods, Inc. | | | 40,500 | | | | 1,397,655 | |
Dollar General Corp. | | | 26,420 | | | | 3,362,738 | |
Dollar Tree, Inc. (b) | | | 4,789 | | | | 486,515 | |
eBay, Inc. | | | 93,941 | | | | 3,375,300 | |
Expedia Group, Inc. | | | 6,509 | | | | 748,535 | |
Foot Locker, Inc. | | | 21,323 | | | | 839,060 | |
Gap, Inc. | | | 159,000 | | | | 2,970,120 | |
Genuine Parts Co. | | | 19,955 | | | | 1,973,549 | |
Home Depot, Inc. | | | 43,570 | | | | 8,271,764 | |
Kohl’s Corp. | | | 39,577 | | | | 1,951,938 | |
L Brands, Inc. | | | 109,454 | | | | 2,458,337 | |
LKQ Corp. (b) | | | 34,555 | | | | 886,336 | |
Lowe’s Cos., Inc. | | | 71,372 | | | | 6,657,580 | |
Macy’s, Inc. | | | 154,388 | | | | 3,175,761 | |
Michaels Cos., Inc. (b) | | | 188,254 | | | | 1,714,994 | |
Nordstrom, Inc. (a) | | | 41,805 | | | | 1,308,496 | |
O’Reilly Automotive, Inc. (b) | | | 3,615 | | | | 1,342,503 | |
Penske Automotive Group, Inc. | | | 15,622 | | | | 667,372 | |
Pool Corp. | | | 8,892 | | | | 1,598,604 | |
Qurate Retail, Inc. (b) | | | 52,323 | | | | 655,607 | |
Ross Stores, Inc. | | | 31,630 | | | | 2,941,274 | |
Target Corp. | | | 51,856 | | | | 4,171,815 | |
Tiffany & Co. | | | 9,549 | | | | 850,911 | |
TJX Cos., Inc. | | | 76,228 | | | | 3,833,506 | |
Tractor Supply Co. | | | 39,238 | | | | 3,954,406 | |
Ulta Beauty, Inc. (b) | | | 3,134 | | | | 1,044,813 | |
Urban Outfitters, Inc. (b) | | | 56,145 | | | | 1,261,578 | |
Wayfair, Inc. (a)(b) | | | 1,533 | | | | 220,767 | |
Williams-Sonoma, Inc. (a) | | | 30,801 | | | | 1,801,859 | |
| | | | | | | | |
| | | | | | | 96,431,491 | |
| | | | | | | | |
| | | | | | | | |
| | | SHARES | | | FAIR
VALUE | |
| Semiconductors & Semiconductor Equipment - 4.0% | |
Advanced Micro Devices, Inc. (b) | | | 39,079 | | | $ | 1,071,155 | |
Applied Materials, Inc. | | | 184,456 | | | | 7,136,603 | |
Cypress Semiconductor Corp. | | | 99,685 | | | | 1,776,387 | |
First Solar, Inc. (b) | | | 3,722 | | | | 216,025 | |
Intel Corp. | | | 110,086 | | | | 4,848,187 | |
KLA-Tencor Corp. | | | 886 | | | | 91,320 | |
Lam Research Corp. | | | 28,383 | | | | 4,955,955 | |
Marvell Technology Group Ltd. (c) | | | 28,146 | | | | 627,656 | |
Maxim Integrated Products, Inc. | | | 2,935 | | | | 154,352 | |
Micron Technology, Inc. (b) | | | 170,811 | | | | 5,570,147 | |
MKS Instruments, Inc. | | | 10,181 | | | | 727,534 | |
Monolithic Power Systems, Inc. | | | 1,135 | | | | 132,171 | |
NVIDIA Corp. | | | 9,085 | | | | 1,230,654 | |
ON Semiconductor Corp. (b) | | | 22,174 | | | | 393,810 | |
Qorvo, Inc. (b) | | | 1,978 | | | | 121,014 | |
QUALCOMM, Inc. | | | 56,400 | | | | 3,768,648 | |
Skyworks Solutions, Inc. | | | 13,646 | | | | 909,233 | |
Teradyne, Inc. | | | 5,165 | | | | 217,653 | |
Texas Instruments, Inc. | | | 11,417 | | | | 1,190,907 | |
Universal Display Corp. | | | 160 | | | | 23,509 | |
Xilinx, Inc. | | | 29,625 | | | | 3,030,934 | |
| | | | | | | | |
| | | | | | | 38,193,854 | |
| | | | | | | | |
| Software & Services - 6.7% | | | | | | |
Accenture PLC (c) | | | 17,064 | | | | 3,038,586 | |
Adobe, Inc. (b) | | | 100 | | | | 27,090 | |
Akamai Technologies, Inc. (b) | | | 3,227 | | | | 243,187 | |
Amdocs Ltd. (c) | | | 41,686 | | | | 2,476,982 | |
ANSYS, Inc. (b) | | | 9,580 | | | | 1,719,610 | |
Autodesk, Inc. (b) | | | 100 | | | | 16,091 | |
Automatic Data Processing, Inc. | | | 1,344 | | | | 215,201 | |
Black Knight, Inc. (b) | | | 23,783 | | | | 1,348,258 | |
Booz Allen Hamilton Holding Corp. | | | 27,913 | | | | 1,763,264 | |
Broadridge Financial Solutions, Inc. | | | 15,419 | | | | 1,925,371 | |
Cadence Design Systems, Inc. (b) | | | 30,278 | | | | 1,924,772 | |
CDK Global, Inc. | | | 22,687 | | | | 1,098,051 | |
Citrix Systems, Inc. | | | 1,039 | | | | 97,791 | |
Cognizant Technology Solutions Corp. | | | 21,791 | | | | 1,349,517 | |
Conduent, Inc. (b) | | | 110,047 | | | | 979,418 | |
CoreLogic, Inc. (b) | | | 8,135 | | | | 318,811 | |
DXC Technology Co. | | | 14,508 | | | | 689,710 | |
EPAM Systems, Inc. (b) | | | 4,265 | | | | 736,096 | |
Euronet Worldwide, Inc. (b) | | | 9,909 | | | | 1,536,291 | |
Fair Isaac Corp. (b) | | | 1,340 | | | | 396,506 | |
Fidelity National Information Services, Inc. | | | 3,504 | | | | 421,531 | |
FireEye, Inc. (b) | | | 3,540 | | | | 51,649 | |
First Data Corp. (b) | | | 41,818 | | | | 1,063,014 | |
Fiserv, Inc. (b) | | | 5,717 | | | | 490,862 | |
Gartner, Inc. (b) | | | 1,681 | | | | 254,335 | |
Genpact Ltd. (c) | | | 74,082 | | | | 2,678,064 | |
GoDaddy, Inc. (b) | | | 307 | | | | 22,841 | |
Guidewire Software, Inc. (b) | | | 2,003 | | | | 201,342 | |
International Business Machines Corp. | | | 39,674 | | | | 5,038,201 | |
Intuit, Inc. | | | 4,605 | | | | 1,127,534 | |
Jack Henry & Associates, Inc. | | | 3,264 | | | | 428,302 | |
Leidos Holdings, Inc. | | | 13,188 | | | | 993,452 | |
LogMeIn, Inc. | | | 23,385 | | | | 1,679,745 | |
Manhattan Associates, Inc. (b) | | | 16,933 | | | | 1,108,604 | |
| | | | |
| | The accompanying Notes to the Financial Statements are an integral part of these Financial Statements. | | (Continued) |
| | | | | | | | | | | | | | | | |
| | Elements Portfolios | | | | | | Annual Report | | | | | | May 31, 2019 | | |
| | | | |
28
| | |
| Schedule of Investments | | as of May 31, 2019 |
| | | | | | | | |
| | | SHARES | | | FAIR
VALUE | |
| Software & Services - 6.7% (continued) | | | | | | |
Mastercard, Inc. | | | 15,043 | | | $ | 3,783,164 | |
Microsoft Corp. | | | 17,440 | | | | 2,156,979 | |
Nuance Communications, Inc. (b) | | | 29,137 | | | | 500,282 | |
Okta, Inc. (b) | | | 1,730 | | | | 195,871 | |
Oracle Corp. | | | 3,200 | | | | 161,920 | |
PayPal Holdings, Inc. (b) | | | 8,549 | | | | 938,253 | |
Pegasystems, Inc. | | | 2,843 | | | | 205,094 | |
Proofpoint, Inc. (b) | | | 6,053 | | | | 680,115 | |
PTC, Inc. (b) | | | 5,169 | | | | 434,506 | |
Red Hat, Inc. (b) | | | 873 | | | | 160,894 | |
RingCentral, Inc. (b) | | | 2,337 | | | | 280,089 | |
Sabre Corp. | | | 15,489 | | | | 314,117 | |
Salesforce.com, Inc. (b) | | | 300 | | | | 45,423 | |
SS&C Technologies Holdings, Inc. | | | 13,019 | | | | 724,507 | |
Symantec Corp. | | | 117,109 | | | | 2,193,452 | |
Synopsys, Inc. (b) | | | 23,474 | | | | 2,733,313 | |
Tableau Software, Inc. (b) | | | 5,469 | | | | 615,098 | |
Teradata Corp. (b) | | | 63,141 | | | | 2,168,262 | |
Total System Services, Inc. | | | 22,083 | | | | 2,727,913 | |
Tyler Technologies, Inc. (b) | | | 4,361 | | | | 930,419 | |
VeriSign, Inc. (b) | | | 432 | | | | 84,231 | |
Visa, Inc. | | | 17,676 | | | | 2,851,669 | |
VMware, Inc. | | | 2,260 | | | | 399,975 | |
Western Union Co. | | | 26,854 | | | | 520,968 | |
Worldpay, Inc. (b) | | | 5,855 | | | | 712,202 | |
| | | | | | | | |
| | | | | | | 63,978,795 | |
| | | | | | | | |
| Technology Hardware & Equipment - 7.6% | |
Amphenol Corp. | | | 8,134 | | | | 707,658 | |
Apple, Inc. | | | 173,526 | | | | 30,379,197 | |
Arrow Electronics, Inc. (b) | | | 8,644 | | | | 541,633 | |
Avnet, Inc. | | | 47,823 | | | | 1,953,091 | |
CDW Corp. | | | 21,870 | | | | 2,152,883 | |
Cisco Systems, Inc. | | | 84,208 | | | | 4,381,342 | |
Cognex Corp. | | | 11,195 | | | | 454,517 | |
Coherent, Inc. (b) | | | 673 | | | | 74,050 | |
CommScope Holding Co., Inc. (b) | | | 44,895 | | | | 725,054 | |
Corning, Inc. | | | 34,301 | | | | 989,241 | |
Dell Technologies, Inc. (b) | | | 5,931 | | | | 353,191 | |
Dolby Laboratories, Inc. | | | 53,541 | | | | 3,317,936 | |
EchoStar Corp. (b) | | | 23,980 | | | | 1,025,864 | |
F5 Networks, Inc. (b) | | | 9,955 | | | | 1,314,856 | |
FLIR Systems, Inc. | | | 43,825 | | | | 2,118,062 | |
Hewlett Packard Enterprise Co. | | | 31,392 | | | | 430,698 | |
HP, Inc. | | | 290,828 | | | | 5,432,667 | |
Jabil, Inc. | | | 16,195 | | | | 398,235 | |
Juniper Networks, Inc. | | | 37,067 | | | | 912,219 | |
Keysight Technologies, Inc. (b) | | | 23,411 | | | | 1,758,869 | |
Motorola Solutions, Inc. | | | 7,797 | | | | 1,169,160 | |
National Instruments Corp. | | | 27,429 | | | | 1,058,485 | |
NCR Corp. (b) | | | 470 | | | | 14,382 | |
NetApp, Inc. | | | 39,448 | | | | 2,335,322 | |
Ubiquiti Networks, Inc. | | | 990 | | | | 119,107 | |
Western Digital Corp. | | | 78,444 | | | | 2,919,686 | |
Xerox Corp. | | | 165,352 | | | | 5,061,425 | |
Zebra Technologies Corp. (b) | | | 5,647 | | | | 968,122 | |
| | | | | | | | |
| | | | | | | 73,066,952 | |
| | | | | | | | |
| | | | | | | | |
| | | SHARES | | | FAIR
VALUE | |
| Telecommunication Services - 1.3% | | | | | | |
AT&T, Inc. | | | 194,237 | | | $ | 5,939,767 | |
CenturyLink, Inc. | | | 77,380 | | | | 808,621 | |
Telephone & Data Systems, Inc. | | | 75,370 | | | | 2,171,410 | |
T-Mobile US, Inc. (b) | | | 13,199 | | | | 969,335 | |
United States Cellular Corp. (b) | | | 47,698 | | | | 2,077,248 | |
Verizon Communications, Inc. | | | 14,898 | | | | 809,706 | |
| | | | | | | | |
| | | | | | | 12,776,087 | |
| | | | | | | | |
| Transportation - 1.8% | | | | | | |
Alaska Air Group, Inc. | | | 12,729 | | | | 740,828 | |
CH Robinson Worldwide, Inc. | | | 12,171 | | | | 969,177 | |
Copa Holdings SA (c) | | | 7,118 | | | | 637,844 | |
Delta Air Lines, Inc. | | | 5,666 | | | | 291,799 | |
Expeditors International of Washington, Inc. | | | 27,481 | | | | 1,912,403 | |
FedEx Corp. | | | 1,200 | | | | 185,136 | |
J.B. Hunt Transport Services, Inc. | | | 1,407 | | | | 119,792 | |
JetBlue Airways Corp. (b) | | | 28,549 | | | | 491,899 | |
Kirby Corp. (b) | | | 1,293 | | | | 100,052 | |
Knight-Swift Transportation Holdings, Inc. (a) | | | 20,262 | | | | 560,042 | |
Landstar System, Inc. | | | 31,553 | | | | 3,036,976 | |
Macquarie Infrastructure Corp. | | | 18,222 | | | | 726,511 | |
Old Dominion Freight Line, Inc. | | | 7,877 | | | | 1,043,230 | |
Schneider National, Inc. | | | 113,798 | | | | 1,911,806 | |
Southwest Airlines Co. | | | 77,206 | | | | 3,675,006 | |
Union Pacific Corp. | | | 700 | | | | 116,746 | |
United Continental Holdings, Inc. (b) | | | 1,575 | | | | 122,299 | |
XPO Logistics, Inc. (b) | | | 3,084 | | | | 160,645 | |
| | | | | | | | |
| | | | | | | 16,802,191 | |
| | | | | | | | |
| Utilities - 0.5% | | | | | | |
Avangrid, Inc. | | | 18,869 | | | | 944,582 | |
CMS Energy Corp. | | | 2,442 | | | | 137,021 | |
DTE Energy Co. | | | 200 | | | | 25,094 | |
Eversource Energy | | | 1,888 | | | | 139,410 | |
Hawaiian Electric Industries, Inc. | | | 5,221 | | | | 216,880 | |
MDU Resources Group, Inc. | | | 200 | | | | 4,936 | |
NRG Energy, Inc. | | | 25,765 | | | | 877,041 | |
OGE Energy Corp. | | | 1,446 | | | | 60,096 | |
Pinnacle West Capital Corp. | | | 1,309 | | | | 122,928 | |
UGI Corp. | | | 23,837 | | | | 1,230,227 | |
Vistra Energy Corp. | | | 3,600 | | | | 84,816 | |
Xcel Energy, Inc. | | | 12,783 | | | | 732,977 | |
| | | | | | | | |
| | | | | | | 4,576,008 | |
| | | | | | | | |
TOTAL COMMON STOCKS
(Cost $818,332,743) | | | | | | | 927,306,522 | |
| | | | | | | | |
| | | | | | | | |
REAL ESTATE INVESTMENT TRUSTS - 0.0% (d) | |
Chimera Investment Corp. | | | 1,089 | | | | 19,864 | |
MFA Financial, Inc. | | | 656 | | | | 4,618 | |
| | | | | | | | |
TOTAL REAL ESTATE INVESTMENT TRUSTS
(Cost $24,498) | | | | | | | 24,482 | |
| | | | | | | | |
| | | | | | | | |
SHORT-TERM INVESTMENTS - 2.5% | | | | | | | | |
| Money Market Funds - 0.4% | | | | | | |
Fidelity Investments Money Market Funds - Government Portfolio, 2.27% (e) | | | 799,079 | | | | 799,079 | |
| | | | |
| | The accompanying Notes to the Financial Statements are an integral part of these Financial Statements. | | (Continued) |
| | | | | | | | | | | | | | | | |
| | Elements Portfolios | | | | | | Annual Report | | | | | | May 31, 2019 | | |
| | | | |
29
| | |
| Schedule of Investments | | as of May 31, 2019 |
| | | | | | | | |
| | | SHARES | | | FAIR
VALUE | |
| Money Market Funds - 0.4% (continued) | |
First American Government Obligations Fund, 2.32% (e) | | | 799,079 | | | $ | 799,079 | |
First American Treasury Obligations Fund, 2.31% (e) | | | 799,079 | | | | 799,079 | |
Morgan Stanley Institutional Liquidity Funds - Government Portfolio - Institutional Class, 2.29% (e) | | | 799,079 | | | | 799,079 | |
Short-Term Investments Trust - Treasury Portfolio - Institutional Class, 2.27% (e) | | | 799,079 | | | | 799,079 | |
| | | | | | | | |
| | | | | | | 3,995,395 | |
| | | | | | | | |
| | |
| | | PRINCIPAL
AMOUNT | | | FAIR
VALUE | |
| U.S. Treasury Bills - 2.1% | | | | | | |
2.314%, 06/18/2019 (f) | | $ | 16,000,000 | | | | 15,982,358 | |
2.385%, 06/13/2019 (f)(g) | | | 4,000,000 | | | | 3,996,820 | |
| | | | | | | | |
| | | | | | | 19,979,178 | |
| | | | | | | | |
TOTAL SHORT-TERM INVESTMENTS
(Cost $23,974,573) | | | | | | | 23,974,573 | |
| | | | | | | | |
| | |
| | | SHARES | | | FAIR
VALUE | |
INVESTMENTS PURCHASED WITH THE CASH PROCEEDS FROM SECURITIES LENDING - 1.5% | |
BlackRock Liquidity Funds FedFund Portfolio, 2.30% (e) | | | 1,311,897 | | | | 1,311,897 | |
| | | | | | | | |
| | |
| | | SHARES | | | FAIR
VALUE | |
INVESTMENTS PURCHASED WITH THE CASH PROCEEDS FROM SECURITIES LENDING - 1.5% (continued) | |
Morgan Stanley Institutional Liquidity Funds - Prime Portfolio, 2.49% (e) | | | 13,451,599 | | | $ | 13,459,375 | |
| | | | | | | | |
TOTAL INVESTMENTS PURCHASED WITH THE CASH PROCEEDS FROM SECURITIES LENDING
(Cost $14,771,272) | | | | | | | 14,771,272 | |
| | | | | | | | |
TOTAL INVESTMENTS
(Cost $857,103,086) - 101.3% | | | | | | | 966,076,849 | |
| | | | | | | | |
LIABILITIES IN EXCESS OF OTHER ASSETS - (1.3)% | | | | | | | (12,392,283) | |
| | | | | | | | |
| TOTAL NET ASSETS - 100.0% | | | | | $953,684,566 | |
| | | | | | | | |
Percentages are stated as a percent of net assets.
ADR - American Depository Receipt
PLC - Public Limited Company
| (a) | This security or a portion of this security was out on loan as of May 31, 2019. Total loaned securities had a market value of $14,448,186 as of May 31, 2019. |
| (b) | Non-income producing security. |
| (c) | Foreign issued security. Total foreign securities are $32,453,457 which represents 3.4% of net assets. |
| (e) | Rate shown is the7-day effective yield. |
| (f) | Rate shown is the effective yield based on purchase price. The calculation assumes the security is held to maturity. |
| (g) | This security or a portion of this security was held as collateral for derivative contracts as of May 31, 2019. |
The Global Industry Classification Standard (GICS®) was developed by and/or is the exclusive property of Morgan Stanley Capital International, Inc. (“MSCI”) and Standard & Poor’s Financial Services LLC (“S&P”). GICS is a service mark of MSCI and S&P and has been licensed for use by U.S. Bancorp Fund Services, LLC.
Open Futures Contracts
| | | | | | | | | | | | |
| | | |
| DESCRIPTION | | NUMBER OF
CONTRACTS
PURCHASED | | | NOTIONAL
VALUE | | | VALUE/
UNREALIZED
DEPRECIATION | |
FUTURES CONTRACTS PURCHASED | | | | | | | | | | | | |
S&P 500E-mini Index, June 2019 Settlement | | | 140 | | | $ | 19,268,200 | | | $ | (824,278 | ) |
| | | | | | | | | | | | |
TOTAL FUTURES CONTRACTS PURCHASED | | | | | | $ | 19,268,200 | | | $ | (824,278 | ) |
| | | | | | | | | | | | |
| | | | |
| | The accompanying Notes to the Financial Statements are an integral part of these Financial Statements. | | |
| | | | | | | | | | | | | | | | |
| | Elements Portfolios | | | | | | Annual Report | | | | | | May 31, 2019 | | |
| | | | |
30
| | |
| Schedule of Investments | | as of May 31, 2019 |
| | | | |
| ELEMENTS U.S. SMALL CAP PORTFOLIO | | | | |
| | | | | | | | |
| | | SHARES | | | FAIR
VALUE | |
COMMON STOCKS - 96.1% | | | | | | | | |
| Automobiles & Components - 1.2% | | | | | | |
American Axle & Manufacturing Holdings, Inc. (a) | | | 900 | | | $ | 9,099 | |
Cooper Tire & Rubber Co. | | | 9,806 | | | | 270,449 | |
Cooper-Standard Holdings, Inc. (a) | | | 175 | | | | 6,766 | |
Dana, Inc. | | | 20,287 | | | | 295,987 | |
Dorman Products, Inc. (a) | | | 3,358 | | | | 274,214 | |
Fox Factory Holding Corp. (a) | | | 9,985 | | | | 669,195 | |
Gentherm, Inc. (a) | | | 4,991 | | | | 186,564 | |
LCI Industries | | | 400 | | | | 33,148 | |
Modine Manufacturing Co. (a) | | | 12,407 | | | | 159,430 | |
Shiloh Industries, Inc. (a) | | | 276 | | | | 1,115 | |
Standard Motor Products, Inc. | | | 13,813 | | | | 585,395 | |
Stoneridge, Inc. (a) | | | 31,580 | | | | 822,027 | |
Strattec Security Corp. | | | 6,029 | | | | 148,555 | |
Superior Industries International, Inc. | | | 52,656 | | | | 194,301 | |
Tower International, Inc. | | | 13,739 | | | | 239,471 | |
Unique Fabricating, Inc. | | | 600 | | | | 1,740 | |
Winnebago Industries, Inc. | | | 14,067 | | | | 452,113 | |
| | | | | | | | |
| | | | | | | 4,349,569 | |
| | | | | | | | |
| Banks - 5.8% | | | | | | |
1st Source Corp. | | | 853 | | | | 37,327 | |
ACNB Corp. | | | 243 | | | | 8,675 | |
American National Bankshares, Inc. | | | 500 | | | | 17,440 | |
Ames National Corp. | | | 206 | | | | 5,418 | |
Arrow Financial Corp. | | | 2,162 | | | | 69,552 | |
Atlantic Capital Bancshares, Inc. (a) | | | 5,152 | | | | 84,287 | |
Atlantic Union Bankshares Corp. | | | 909 | | | | 29,361 | |
Banc of California, Inc. | | | 700 | | | | 9,261 | |
BancFirst Corp. | | | 4,218 | | | | 220,306 | |
Bank of Commerce Holdings | | | 2,556 | | | | 26,327 | |
Bank of Marin Bancorp | | | 6,464 | | | | 261,857 | |
Bank of N.T. Butterfield & Son Ltd. (b) | | | 11,161 | | | | 368,536 | |
BankFinancial Corp. | | | 15,006 | | | | 208,583 | |
BCB Bancorp, Inc. | | | 1,400 | | | | 17,136 | |
Berkshire Hills Bancorp, Inc. | | | 336 | | | | 9,808 | |
BOK Financial Corp. | | | 2,494 | | | | 186,875 | |
Boston Private Financial Holdings, Inc. | | | 15,896 | | | | 162,934 | |
Bridge Bancorp, Inc. | | | 200 | | | | 5,566 | |
Brookline Bancorp, Inc. | | | 1,600 | | | | 22,960 | |
Bryn Mawr Bank Corp. | | | 49 | | | | 1,791 | |
Byline Bancorp, Inc. (a) | | | 600 | | | | 11,196 | |
C&F Financial Corp. | | | 1,353 | | | | 65,025 | |
Cadence Bancorp | | | 2,863 | | | | 52,965 | |
Capital City Bank Group, Inc. | | | 15,283 | | | | 357,775 | |
Cathay General Bancorp | | | 3,523 | | | | 118,514 | |
CenterState Bank Corp. | | | 5,613 | | | | 122,869 | |
Central Pacific Financial Corp. | | | 2,355 | | | | 65,445 | |
Central Valley Community Bancorp | | | 423 | | | | 8,299 | |
Century Bancorp, Inc. - Class A | | | 696 | | | | 62,369 | |
Chemung Financial Corp. | | | 4,690 | | | | 210,112 | |
Citizens & Northern Corp. | | | 9,145 | | | | 252,402 | |
Civista Bancshares, Inc. | | | 401 | | | | 8,702 | |
Codorus Valley Bancorp, Inc. | | | 271 | | | | 5,696 | |
Columbia Banking System, Inc. | | | 22 | | | | 734 | |
Community Bankers Trust Corp. | | | 700 | | | | 5,096 | |
Community Trust Bancorp, Inc. | | | 2,292 | | | | 90,740 | |
| | | | | | | | |
| | | SHARES | | | FAIR
VALUE | |
| Banks - 5.8% (continued) | | | | | | |
ConnectOne Bancorp, Inc. | | | 700 | | | $ | 14,707 | |
County Bancorp, Inc. | | | 204 | | | | 3,513 | |
Customers Bancorp, Inc. (a) | | | 11,546 | | | | 227,687 | |
CVB Financial Corp. | | | 1,448 | | | | 29,756 | |
Entegra Financial Corp. (a) | | | 100 | | | | 2,965 | |
Enterprise Bancorp, Inc. | | | 200 | | | | 5,608 | |
Enterprise Financial Services Corp. | | | 123 | | | | 4,820 | |
Essent Group Ltd. (a)(b) | | | 25,296 | | | | 1,187,647 | |
Farmers National Banc Corp. | | | 1,437 | | | | 19,328 | |
FB Financial Corp. | | | 700 | | | | 24,353 | |
Federal Agricultural Mortgage Corp. | | | 2,183 | | | | 149,383 | |
Fidelity Southern Corp. (c) | | | 13,425 | | | | 378,182 | |
Fifth Third Bancorp | | | 43,022 | | | | 1,140,083 | |
Financial Institutions, Inc. | | | 1,360 | | | | 36,761 | |
First Bancorp NC | | | 3,606 | | | | 127,688 | |
First Bancorp Puerto Rico (b) | | | 77,177 | | | | 768,683 | |
First Bancorp, Inc. | | | 254 | | | | 6,421 | |
First Bank/Hamilton NJ | | | 400 | | | | 4,480 | |
First Busey Corp. | | | 17,039 | | | | 421,034 | |
First Business Financial Services, Inc. | | | 391 | | | | 8,946 | |
First Commonwealth Financial Corp. | | | 21,387 | | | | 268,835 | |
First Community Bankshares, Inc. | | | 7,966 | | | | 260,966 | |
First Defiance Financial Corp. | | | 1,401 | | | | 37,967 | |
First Financial Bankshares, Inc. | | | 1,907 | | | | 108,051 | |
First Financial Northwest, Inc. | | | 427 | | | | 6,473 | |
First Foundation, Inc. | | | 200 | | | | 2,622 | |
First Guaranty Bancshares, Inc. | | | 110 | | | | 2,266 | |
First Internet Bancorp | | | 500 | | | | 10,165 | |
First Interstate BancSystem, Inc. | | | 7,829 | | | | 288,968 | |
First Midwest Bancorp, Inc. | | | 9,108 | | | | 177,515 | |
Flagstar Bancorp, Inc. | | | 384 | | | | 12,088 | |
Flushing Financial Corp. | | | 191 | | | | 4,017 | |
FNCB Bancorp, Inc. | | | 1,973 | | | | 14,502 | |
Fulton Financial Corp. | | | 5,857 | | | | 92,306 | |
Glacier Bancorp, Inc. | | | 11,359 | | | | 447,658 | |
Great Western Bancorp, Inc. | | | 7,499 | | | | 232,994 | |
Hancock Whitney Corp. | | | 1,808 | | | | 68,668 | |
Hanmi Financial Corp. | | | 6,909 | | | | 142,464 | |
HarborOne Bancorp, Inc. (a) | | | 778 | | | | 13,957 | |
Heartland Financial USA, Inc. | | | 4,402 | | | | 181,759 | |
Heritage Commerce Corp. | | | 6,800 | | | | 80,988 | |
Heritage Financial Corp. | | | 3,361 | | | | 94,444 | |
Hilltop Holdings, Inc. | | | 20,987 | | | | 422,468 | |
Home BancShares, Inc. | | | 12,786 | | | | 224,011 | |
HomeStreet, Inc. (a) | | | 10,500 | | | | 298,725 | |
HomeTrust Bancshares, Inc. | | | 900 | | | | 22,032 | |
Hope Bancorp, Inc. | | | 14,061 | | | | 180,965 | |
Horizon Bancorp | | | 1 | | | | 16 | |
Independent Bank Corp. - Massachusetts | | | 1,073 | | | | 74,413 | |
Independent Bank Corp. - Michigan | | | 2,001 | | | | 42,321 | |
Independent Bank Group, Inc. | | | 135 | | | | 6,971 | |
International Bancshares Corp. | | | 1,300 | | | | 47,398 | |
Investar Holding Corp. | | | 100 | | | | 2,389 | |
Investors Bancorp, Inc. | | | 3,196 | | | | 33,270 | |
Lakeland Bancorp, Inc. | | | 3,201 | | | | 49,327 | |
LCNB Corp. | | | 300 | | | | 5,091 | |
MBT Financial Corp. | | | 1,985 | | | | 18,143 | |
| | | | |
| | The accompanying Notes to the Financial Statements are an integral part of these Financial Statements. | | (Continued) |
| | | | | | | | | | | | | | | | |
| | Elements Portfolios | | | | | | Annual Report | | | | | | May 31, 2019 | | |
| | | | |
31
| | |
| Schedule of Investments | | as of May 31, 2019 |
| | | | |
| ELEMENTS U.S. SMALL CAP PORTFOLIO | | | | |
| | | | | | | | |
| | | SHARES | | | FAIR
VALUE | |
| Banks - 5.8% (continued) | | | | | | |
Mercantile Bank Corp. | | | 500 | | | $ | 15,425 | |
Meta Financial Group, Inc. | | | 13,130 | | | | 343,612 | |
MGIC Investment Corp. (a) | | | 123,498 | | | | 1,673,398 | |
Midland States Bancorp, Inc. | | | 400 | | | | 9,800 | |
MidSouth Bancorp, Inc. | | | 3,306 | | | | 37,226 | |
MidWestOne Financial Group, Inc. | | | 301 | | | | 8,380 | |
MutualFirst Financial, Inc. | | | 200 | | | | 5,976 | |
National Bank Holdings Corp. | | | 201 | | | | 7,053 | |
NBT Bancorp, Inc. | | | 100 | | | | 3,595 | |
NMI Holdings, Inc. (a) | | | 18,091 | | | | 493,161 | |
Northeast Bank | | | 1,900 | | | | 39,254 | |
Northrim BanCorp, Inc. | | | 7,208 | | | | 240,963 | |
Northwest Bancshares, Inc. | | | 4,504 | | | | 75,532 | |
Ocwen Financial Corp. (a) | | | 1,760 | | | | 2,728 | |
OFG Bancorp (b) | | | 34,364 | | | | 645,356 | |
Old National Bancorp/IN | | | 662 | | | | 10,552 | |
Old Second Bancorp, Inc. | | | 9,764 | | | | 119,121 | |
Opus Bank | | | 10,428 | | | | 209,290 | |
Pacific City Financial Corp. | | | 422 | | | | 7,204 | |
Pacific Mercantile Bancorp (a) | | | 500 | | | | 3,885 | |
Pacific Premier Bancorp, Inc. | | | 400 | | | | 11,320 | |
Park National Corp. | | | 1,393 | | | | 131,625 | |
PCSB Financial Corp. | | | 1,079 | | | | 21,192 | |
Peapack Gladstone Financial Corp. | | | 5,250 | | | | 141,960 | |
Penns Woods Bancorp, Inc. | | | 100 | | | | 4,184 | |
PennyMac Financial Services, Inc. | | | 13,776 | | | | 292,189 | |
Peoples Bancorp, Inc. | | | 2,109 | | | | 65,189 | |
People’s Utah Bancorp | | | 2,927 | | | | 81,956 | |
Preferred Bank | | | 1,000 | | | | 43,770 | |
Premier Financial Bancorp, Inc. | | | 6,748 | | | | 105,336 | |
Provident Financial Services, Inc. | | | 734 | | | | 17,499 | |
QCR Holdings, Inc. | | | 886 | | | | 28,423 | |
Radian Group, Inc. | | | 11,017 | | | | 247,332 | |
Republic Bancorp, Inc. - Class A | | | 4,460 | | | | 204,446 | |
Republic First Bancorp, Inc. (a) | | | 1,261 | | | | 6,103 | |
Riverview Bancorp, Inc. | | | 842 | | | | 6,525 | |
S&T Bancorp, Inc. | | | 699 | | | | 26,352 | |
Sandy Spring Bancorp, Inc. | | | 300 | | | | 9,645 | |
Simmons First National Corp. | | | 2,496 | | | | 56,934 | |
South State Corp. | | | 2,400 | | | | 158,136 | |
Southern First Bancshares, Inc. (a) | | | 100 | | | | 3,563 | |
Southern Missouri Bancorp, Inc. | | | 100 | | | | 3,258 | |
Southern National Bancorp of Virginia, Inc. | | | 1,599 | | | | 22,082 | |
Southside Bancshares, Inc. | | | 800 | | | | 26,056 | |
Stock Yards Bancorp, Inc. | | | 500 | | | | 16,665 | |
Territorial Bancorp, Inc. | | | 100 | | | | 2,690 | |
The Bancorp, Inc. (a) | | | 18,513 | | | | 164,766 | |
Towne Bank | | | 2,600 | | | | 65,936 | |
TriCo Bancshares | | | 2,001 | | | | 74,637 | |
TrustCo Bank Corp NY | | | 58,115 | | | | 428,889 | |
Trustmark Corp. | | | 22,997 | | | | 730,615 | |
United Bankshares, Inc. | | | 192 | | | | 6,870 | |
United Community Banks, Inc. | | | 21,302 | | | | 564,716 | |
United Community Financial Corp. | | | 2,092 | | | | 19,163 | |
United Financial Bancorp, Inc. | | | 17,776 | | | | 231,799 | |
Unity Bancorp, Inc. | | | 300 | | | | 6,045 | |
Univest Financial Corp. | | | 8,990 | | | | 214,681 | |
| | | | | | | | |
| | | SHARES | | | FAIR
VALUE | |
| Banks - 5.8% (continued) | | | | | | |
Walker & Dunlop, Inc. | | | 6,079 | | | $ | 305,591 | |
Waterstone Financial, Inc. | | | 2,998 | | | | 49,497 | |
WesBanco, Inc. | | | 1,100 | | | | 39,083 | |
West Bancorporation, Inc. | | | 255 | | | | 5,304 | |
Western New England Bancorp, Inc. | | | 502 | | | | 4,598 | |
WSFS Financial Corp. | | | 3,715 | | | | 147,448 | |
| | | | | | | | |
| | | | | | | 20,476,776 | |
| | | | | | | | |
| Capital Goods - 11.6% | | | | | | |
AAON, Inc. | | | 3,228 | | | | 146,519 | |
AAR Corp. | | | 9,510 | | | | 286,156 | |
Actuant Corp. | | | 5,200 | | | | 115,128 | |
Advanced Drainage Systems, Inc. | | | 31,367 | | | | 899,606 | |
Aegion Corp. (a) | | | 400 | | | | 5,760 | |
Aerojet Rocketdyne Holdings, Inc. (a) | | | 17,097 | | | | 659,602 | |
Aerovironment, Inc. (a) | | | 2,200 | | | | 142,450 | |
Alamo Group, Inc. | | | 5,823 | | | | 552,777 | |
Albany International Corp. | | | 1,200 | | | | 84,084 | |
Allied Motion Technologies, Inc. | | | 10,124 | | | | 328,726 | |
Altra Industrial Motion Corp. | | | 6,734 | | | | 211,246 | |
American Superconductor Corp. (a) | | | 11,806 | | | | 114,872 | |
American Woodmark Corp. (a) | | | 1,100 | | | | 79,739 | |
Apogee Enterprises, Inc. | | | 8,542 | | | | 309,648 | |
Applied Industrial Technologies, Inc. | | | 5,077 | | | | 275,833 | |
Argan, Inc. | | | 700 | | | | 32,151 | |
Armstrong Flooring, Inc. (a) | | | 15,273 | | | | 160,977 | |
Astronics Corp. (a) | | | 6,811 | | | | 277,003 | |
Atkore International Group, Inc. (a) | | | 3,147 | | | | 73,608 | |
Axon Enterprise, Inc. (a) | | | 5,221 | | | | 348,658 | |
AZZ, Inc. | | | 7,280 | | | | 306,342 | |
Barnes Group, Inc. | | | 3,464 | | | | 179,158 | |
Beacon Roofing Supply, Inc. (a) | | | 2,426 | | | | 83,843 | |
Blue Bird Corp. (a) | | | 13,814 | | | | 259,979 | |
BMC Stock Holdings, Inc. (a) | | | 49,725 | | | | 995,992 | |
Builders FirstSource, Inc. (a) | | | 65,542 | | | | 922,831 | |
Caesarstone Ltd. (b) | | | 7,414 | | | | 102,832 | |
Chart Industries, Inc. (a) | | | 3,156 | | | | 241,844 | |
Columbus McKinnon Corp. | | | 20,120 | | | | 729,551 | |
Comfort Systems USA, Inc. | | | 20,005 | | | | 943,836 | |
Commercial Vehicle Group, Inc. (a) | | | 40,201 | | | | 249,648 | |
Continental Building Products, Inc. (a) | | | 3,088 | | | | 70,468 | |
CSW Industrials, Inc. | | | 8,208 | | | | 524,737 | |
Cubic Corp. | | | 7,703 | | | | 434,603 | |
Ducommun, Inc. (a) | | | 14,982 | | | | 676,138 | |
DXP Enterprises, Inc. (a) | | | 593 | | | | 19,106 | |
EMCOR Group, Inc. | | | 32,665 | | | | 2,631,492 | |
Encore Wire Corp. | | | 14,113 | | | | 704,380 | |
Energy Recovery, Inc. (a) | | | 500 | | | | 4,725 | |
EnPro Industries, Inc. | | | 2,094 | | | | 116,196 | |
ESCO Technologies, Inc. | | | 4,194 | | | | 293,119 | |
EVI Industries, Inc. (c) | | | 1,300 | | | | 47,385 | |
Evoqua Water Technologies Corp. (a) | | | 1,740 | | | | 20,480 | |
Federal Signal Corp. | | | 31,615 | | | | 755,282 | |
Foundation Building Materials, Inc. (a) | | | 37,453 | | | | 568,162 | |
Franklin Electric Co., Inc. | | | 9,060 | | | | 397,100 | |
Gencor Industries, Inc. (a) | | | 444 | | | | 4,920 | |
Generac Holdings, Inc. (a) | | | 7,807 | | | | 430,556 | |
Gibraltar Industries, Inc. (a) | | | 5,652 | | | | 201,776 | |
| | | | |
| | The accompanying Notes to the Financial Statements are an integral part of these Financial Statements. | | (Continued) |
| | | | | | | | | | | | | | | | |
| | Elements Portfolios | | | | | | Annual Report | | | | | | May 31, 2019 | | |
| | | | |
32
| | |
| Schedule of Investments | | as of May 31, 2019 |
| | | | |
| ELEMENTS U.S. SMALL CAP PORTFOLIO | | | | |
| | | | | | | | |
| | | SHARES | | | FAIR
VALUE | |
| Capital Goods - 11.6% (continued) | | | | | | |
Global Brass & Copper Holdings, Inc. | | | 7,000 | | | $ | 305,410 | |
GMS, Inc. (a) | | | 18,151 | | | | 305,663 | |
Graham Corp. | | | 5,278 | | | | 107,724 | |
Great Lakes Dredge & Dock Corp. (a) | | | 50,690 | | | | 539,342 | |
Griffon Corp. | | | 298 | | | | 4,285 | |
Harsco Corp. (a) | | | 35,710 | | | | 892,750 | |
Hillenbrand, Inc. | | | 30,506 | | | | 1,135,738 | |
Hurco Cos., Inc. | | | 9,234 | | | | 323,744 | |
Hyster-Yale Materials Handling, Inc. | | | 3,962 | | | | 174,249 | |
IES Holdings, Inc. (a) | | | 3,220 | | | | 57,702 | |
Insteel Industries, Inc. | | | 13,745 | | | | 251,259 | |
JELD-WEN Holding, Inc. (a) | | | 1,233 | | | | 23,291 | |
John Bean Technologies Corp. | | | 100 | | | | 10,255 | |
Kadant, Inc. | | | 8,557 | | | | 694,657 | |
Kaman Corp. | | | 20,196 | | | | 1,123,100 | |
Kennametal, Inc. | | | 19,897 | | | | 611,833 | |
Lawson Products, Inc. (a) | | | 16,573 | | | | 607,898 | |
LB Foster Co. (a) | | | 2,661 | | | | 64,316 | |
Luxfer Holdings PLC (b) | | | 3,300 | | | | 79,101 | |
Manitex International, Inc. (a) | | | 1,699 | | | | 10,143 | |
Masonite International Corp. (a)(b) | | | 5,300 | | | | 252,015 | |
Meritor, Inc. (a) | | | 14,965 | | | | 301,694 | |
Milacron Holdings Corp. (a) | | | 33,443 | | | | 383,926 | |
Miller Industries, Inc. | | | 16,116 | | | | 427,880 | |
Moog, Inc. | | | 9,755 | | | | 804,007 | |
MRC Global, Inc. (a) | | | 600 | | | | 8,880 | |
Mueller Industries, Inc. | | | 19,821 | | | | 534,176 | |
Mueller Water Products, Inc. | | | 19,678 | | | | 181,825 | |
MYR Group, Inc. (a) | | | 4,083 | | | | 131,840 | |
National Presto Industries, Inc. (c) | | | 2,666 | | | | 260,975 | |
Northrop Grumman Corp. | | | 241 | | | | 73,083 | |
Northwest Pipe Co. (a) | | | 1,000 | | | | 23,240 | |
NOW, Inc. (a) | | | 24,484 | | | | 319,027 | |
NV5 Global, Inc. (a) | | | 2,738 | | | | 212,880 | |
Omega Flex, Inc. | | | 976 | | | | 83,370 | |
Patrick Industries, Inc. (a) | | | 9,811 | | | | 400,191 | |
PGT Innovations, Inc. (a) | | | 10,111 | | | | 151,261 | |
Powell Industries, Inc. | | | 200 | | | | 6,884 | |
Preformed Line Products Co. | | | 800 | | | | 37,608 | |
Primoris Services Corp. | | | 4,600 | | | | 83,904 | |
Proto Labs, Inc. (a) | | | 3,792 | | | | 380,527 | |
Quanex Building Products Corp. | | | 29,286 | | | | 454,226 | |
Raven Industries, Inc. | | | 9,404 | | | | 307,981 | |
RBC Bearings, Inc. (a) | | | 900 | | | | 128,070 | |
Rexnord Corp. (a) | | | 6,098 | | | | 160,438 | |
Rush Enterprises, Inc. | | | 5,022 | | | | 180,390 | |
Rush Enterprises, Inc. - Class A | | | 7,231 | | | | 255,037 | |
Simpson Manufacturing Co., Inc. | | | 20,839 | | | | 1,267,845 | |
SiteOne Landscape Supply, Inc. (a) | | | 710 | | | | 46,058 | |
Spartan Motors, Inc. | | | 80,820 | | | | 697,477 | |
SPX Corp. (a) | | | 2,200 | | | | 65,428 | |
SPX FLOW, Inc. (a) | | | 1,500 | | | | 53,550 | |
Sterling Construction Co., Inc. (a) | | | 31,632 | | | | 377,686 | |
Systemax, Inc. | | | 54,530 | | | | 1,122,773 | |
Tennant Co. | | | 3,985 | | | | 229,576 | |
The Gorman-Rupp Co. | | | 19,800 | | | | 587,466 | |
Thermon Group Holdings, Inc. (a) | | | 10,444 | | | | 229,559 | |
| | | | | | | | |
| | | SHARES | | | FAIR
VALUE | |
| Capital Goods - 11.6% (continued) | | | | | | |
Titan Machinery, Inc. (a) | | | 8,600 | | | $ | 143,792 | |
TPI Composites, Inc. (a) | | | 1,823 | | | | 38,010 | |
Trex Co., Inc. (a) | | | 6,446 | | | | 385,600 | |
TriMas Corp. (a) | | | 21,504 | | | | 616,090 | |
Tutor Perini Corp. (a) | | | 1,592 | | | | 23,148 | |
Twin Disc, Inc. (a) | | | 301 | | | | 4,340 | |
Univar, Inc. (a) | | | 13,225 | | | | 264,632 | |
Universal Forest Products, Inc. | | | 19,595 | | | | 631,939 | |
Vectrus, Inc. (a) | | | 20,067 | | | | 708,164 | |
Veritiv Corp. (a) | | | 15,087 | | | | 266,436 | |
Vicor Corp. (a) | | | 16,479 | | | | 499,479 | |
Wabash National Corp. | | | 29,694 | | | | 401,166 | |
Watts Water Technologies, Inc. | | | 5,504 | | | | 447,971 | |
Wesco Aircraft Holdings, Inc. (a) | | | 446 | | | | 4,380 | |
Woodward, Inc. | | | 1,236 | | | | 134,625 | |
| | | | | | | | |
| | | | | | | 41,136,009 | |
| | | | | | | | |
| Commercial & ProfessionalServices - 9.3% | |
ABM Industries, Inc. (c) | | | 11,296 | | | | 409,480 | |
Acacia Research Corp. (a) | | | 4,397 | | | | 13,719 | |
ACCO Brands Corp. | | | 70,859 | | | | 520,814 | |
Advanced Disposal Services, Inc. (a) | | | 8,553 | | | | 274,893 | |
ASGN, Inc. (a) | | | 17,249 | | | | 875,042 | |
Barrett Business Services, Inc. | | | 3,764 | | | | 271,083 | |
BG Staffing, Inc. | | | 792 | | | | 13,480 | |
Brady Corp. | | | 32,525 | | | | 1,505,907 | |
BrightView Holdings, Inc. (a) | | | 11,830 | | | | 197,679 | |
Casella Waste Systems, Inc. (a) | | | 11,426 | | | | 442,415 | |
CBIZ, Inc. (a) | | | 51,064 | | | | 1,011,067 | |
CECO Environmental Corp. (a) | | | 21,777 | | | | 192,726 | |
Cimpress, N.V. (a)(b) | | | 544 | | | | 47,600 | |
CompX International, Inc. | | | 100 | | | | 1,534 | |
CRA International, Inc. | | | 9,742 | | | | 364,740 | |
Deluxe Corp. | | | 28,051 | | | | 1,043,497 | |
Ennis, Inc. | | | 33,960 | | | | 628,939 | |
Exponent, Inc. | | | 12,616 | | | | 707,127 | |
Forrester Research, Inc. | | | 4,554 | | | | 207,344 | |
Franklin Covey Co. (a) | | | 18,672 | | | | 580,699 | |
FTI Consulting, Inc. (a) | | | 11,167 | | | | 937,135 | |
GP Strategies Corp. (a) | | | 7,038 | | | | 95,998 | |
Healthcare Services Group, Inc. (c) | | | 3,633 | | | | 114,839 | |
Heidrick & Struggles International, Inc. | | | 33,642 | | | | 1,021,371 | |
Heritage-Crystal Clean, Inc. (a) | | | 25,678 | | | | 641,950 | |
Herman Miller, Inc. | | | 38,459 | | | | 1,364,910 | |
HNI Corp. | | | 22,200 | | | | 736,152 | |
Huron Consulting Group, Inc. (a) | | | 5,535 | | | | 272,488 | |
ICF International, Inc. | | | 18,025 | | | | 1,313,842 | |
InnerWorkings, Inc. (a) | | | 74,688 | | | | 253,192 | |
Insperity, Inc. | | | 18,068 | | | | 2,057,945 | |
Interface, Inc. | | | 1,200 | | | | 17,364 | |
Kelly Services, Inc. | | | 32,072 | | | | 753,692 | |
Kforce, Inc. | | | 38,394 | | | | 1,334,191 | |
Kimball International, Inc. | | | 21,064 | | | | 325,228 | |
Knoll, Inc. | | | 29,097 | | | | 571,465 | |
Korn Ferry | | | 22,719 | | | | 978,735 | |
Matthews International Corp. | | | 4,101 | | | | 139,557 | |
McGrath RentCorp | | | 13,545 | | | | 761,635 | |
| | | | |
| | The accompanying Notes to the Financial Statements are an integral part of these Financial Statements. | | (Continued) |
| | | | | | | | | | | | | | | | |
| | Elements Portfolios | | | | | | Annual Report | | | | | | May 31, 2019 | | |
| | | | |
33
| | |
| Schedule of Investments | | as of May 31, 2019 |
| | | | |
| ELEMENTS U.S. SMALL CAP PORTFOLIO | | | | |
| | | | | | | | |
| | | SHARES | | | FAIR
VALUE | |
| Commercial & Professional Services - 9.3% (continued) | |
Mistras Group, Inc. (a) | | | 24,147 | | | $ | 333,712 | |
MSA Safety, Inc. (c) | | | 12,710 | | | | 1,263,120 | |
Multi-Color Corp. | | | 400 | | | | 19,896 | |
Navigant Consulting, Inc. | | | 33,287 | | | | 732,314 | |
NL Industries, Inc. (a) | | | 441 | | | | 1,442 | |
PICO Holdings, Inc. (a) | | | 1,967 | | | | 20,713 | |
Pitney Bowes, Inc. | | | 26,581 | | | | 97,021 | |
Resources Connection, Inc. | | | 40,853 | | | | 627,094 | |
RR Donnelley & Sons Co. | | | 58,519 | | | | 129,912 | |
SP Plus Corp. (a) | | | 8,762 | | | | 271,885 | |
Steelcase, Inc. | | | 58,465 | | | | 937,779 | |
Team, Inc. (a) | | | 4,600 | | | | 66,792 | |
Tetra Tech, Inc. | | | 17,913 | | | | 1,209,486 | |
The Brink’s Co. | | | 9,703 | | | | 747,131 | |
TriNet Group, Inc. (a) | | | 16,243 | | | | 1,029,481 | |
TrueBlue, Inc. (a) | | | 30,970 | | | | 657,803 | |
UniFirst Corp. | | | 5,218 | | | | 828,514 | |
US Ecology, Inc. | | | 1,408 | | | | 83,804 | |
Viad Corp. | | | 7,482 | | | | 470,169 | |
WageWorks, Inc. (a) | | | 6,407 | | | | 320,158 | |
Willdan Group, Inc. (a) | | | 4,288 | | | | 133,443 | |
| | | | | | | | |
| | | | | | | 32,983,143 | |
| | | | | | | | |
| Consumer Durables & Apparel - 6.5% | | | | | | |
Acushnet Holdings Corp. | | | 41,852 | | | | 983,103 | |
American Outdoor Brands Corp. (a) | | | 44,444 | | | | 372,885 | |
Beazer Homes USA, Inc. (a) | | | 1 | | | | 9 | |
Callaway Golf Co. | | | 59,569 | | | | 875,664 | |
Cavco Industries, Inc. (a) | | | 1,717 | | | | 246,561 | |
Clarus Corp. | | | 17,819 | | | | 227,192 | |
Crocs, Inc. (a) | | | 72,746 | | | | 1,405,453 | |
Culp, Inc. | | | 400 | | | | 6,892 | |
Deckers Outdoor Corp. (a) | | | 16,817 | | | | 2,557,866 | |
Escalade, Inc. | | | 399 | | | | 4,441 | |
Ethan Allen Interiors, Inc. | | | 41,477 | | | | 880,142 | |
Flexsteel Industries, Inc. | | | 197 | | | | 3,379 | |
Fossil Group, Inc. (a) | | | 2,262 | | | | 22,145 | |
G-III Apparel Group Ltd. (a) | | | 23,767 | | | | 611,525 | |
GoPro, Inc. (a) | | | 4,250 | | | | 26,775 | |
Green Brick Partners, Inc. (a) | | | 9,113 | | | | 79,192 | |
Helen of Troy Ltd. (a)(b) | | | 12,547 | | | | 1,676,405 | |
Hooker Furniture Corp. | | | 4,943 | | | | 132,621 | |
Installed Building Products, Inc. (a) | | | 500 | | | | 25,720 | |
iRobot Corp. (a)(c) | | | 4,793 | | | | 417,518 | |
Johnson Outdoors, Inc. | | | 14,799 | | | | 1,092,314 | |
KB Home | | | 14,614 | | | | 367,250 | |
La-Z-Boy, Inc. | | | 16,743 | | | | 538,957 | |
Lifetime Brands, Inc. | | | 300 | | | | 2,340 | |
M/I Homes, Inc. (a) | | | 3,418 | | | | 93,585 | |
Malibu Boats, Inc. (a) | | | 20,584 | | | | 738,966 | |
Marine Products Corp. (c) | | | 9,126 | | | | 126,304 | |
MasterCraft Boat Holdings, Inc. (a) | | | 23,331 | | | | 463,354 | |
Meritage Homes Corp. (a) | | | 12,995 | | | | 651,050 | |
Movado Group, Inc. | | | 25,831 | | | | 665,407 | |
Nautilus, Inc. (a) | | | 55,427 | | | | 149,099 | |
Oxford Industries, Inc. | | | 9,777 | | | | 696,513 | |
Rocky Brands, Inc. | | | 3,442 | | | | 84,191 | |
Roku, Inc. (a) | | | 600 | | | | 54,240 | |
| | | | | | | | |
| | | SHARES | | | FAIR
VALUE | |
| Consumer Durables & Apparel - 6.5% (continued) | |
Skyline Champion Corp. | | | 300 | | | $ | 7,017 | |
Sonos, Inc. (a) | | | 2,000 | | | | 20,300 | |
Steven Madden Ltd. | | | 46,674 | | | | 1,412,355 | |
Sturm Ruger & Co., Inc. | | | 11,594 | | | | 576,338 | |
Superior Group of Cos, Inc. | | | 300 | | | | 4,803 | |
Taylor Morrison Home Corp. (a) | | | 20,961 | | | | 418,591 | |
The Lovesac Co. (a) | | | 900 | | | | 32,445 | |
TRI Pointe Group, Inc. (a) | | | 48,130 | | | | 591,999 | |
Tupperware Brands Corp. | | | 21,276 | | | | 396,159 | |
Turtle Beach Corp. (a)(c) | | | 19,342 | | | | 160,925 | |
Universal Electronics, Inc. (a) | | | 5,865 | | | | 231,022 | |
Vera Bradley, Inc. (a) | | | 98,759 | | | | 1,081,411 | |
Vista Outdoor, Inc. (a) | | | 43,490 | | | | 333,568 | |
Wolverine World Wide, Inc. | | | 41,222 | | | | 1,151,743 | |
YETI Holdings, Inc. (a) | | | 6,264 | | | | 149,835 | |
ZAGG, Inc. (a) | | | 48,399 | | | | 322,337 | |
| | | | | | | | |
| | | | | | | 23,169,906 | |
| | | | | | | | |
| Consumer Services - 4.4% | | | | | | |
Adtalem Global Education, Inc. (a) | | | 27,215 | | | | 1,196,371 | |
American Public Education, Inc. (a) | | | 21,158 | | | | 592,001 | |
BBX Capital Corp. | | | 1,900 | | | | 7,771 | |
Biglari Holdings, Inc. (a) | | | 270 | | | | 24,462 | |
BJ’s Restaurants, Inc. | | | 7,256 | | | | 303,954 | |
Bloomin’ Brands, Inc. | | | 30,327 | | | | 585,614 | |
Brinker International, Inc. | | | 15,015 | | | | 564,114 | |
Career Education Corp. (a) | | | 58,223 | | | | 1,092,846 | |
Carriage Services, Inc. | | | 10,011 | | | | 182,400 | |
Carrols Restaurant Group, Inc. (a) | | | 9,000 | | | | 76,680 | |
Century Casinos, Inc. (a) | | | 2,980 | | | | 26,045 | |
Chegg, Inc. (a) | | | 400 | | | | 14,984 | |
Churchill Downs, Inc. | | | 2,370 | | | | 233,635 | |
Chuy’s Holdings, Inc. (a) | | | 3,768 | | | | 83,348 | |
Collectors Universe, Inc. | | | 2,908 | | | | 61,184 | |
Cracker Barrel Old Country Store, Inc. | | | 3,520 | | | | 552,957 | |
Dave & Buster’s Entertainment, Inc. | | | 100 | | | | 4,974 | |
Del Taco Restaurants, Inc. (a) | | | 2,708 | | | | 29,301 | |
Denny’s Corp. (a) | | | 34,219 | | | | 673,430 | |
Dine Brands Global, Inc. | | | 400 | | | | 37,768 | |
El Pollo Loco Holdings, Inc. (a) | | | 4,867 | | | | 51,006 | |
Eldorado Resorts, Inc. (a) | | | 3,706 | | | | 182,224 | |
Everi Holdings, Inc. (a) | | | 8,200 | | | | 91,348 | |
Fiesta Restaurant Group, Inc. (a) | | | 21,040 | | | | 298,347 | |
Houghton Mifflin Harcourt Co. (a) | | | 46,028 | | | | 259,598 | |
International Speedway Corp. | | | 9,115 | | | | 407,987 | |
J Alexander’s Holdings, Inc. (a) | | | 24,984 | | | | 262,832 | |
K12, Inc. (a) | | | 55,330 | | | | 1,691,438 | |
Laureate Education, Inc. (a) | | | 20,100 | | | | 322,806 | |
Luby’s, Inc. (a) | | | 3,220 | | | | 4,218 | |
Monarch Casino & Resort, Inc. (a) | | | 7,357 | | | | 316,572 | |
Noodles & Co. (a) | | | 2,266 | | | | 16,383 | |
Papa John’s International, Inc. | | | 395 | | | | 19,146 | |
Penn National Gaming, Inc. (a) | | | 18,478 | | | | 348,310 | |
Potbelly Corp. (a) | | | 57,059 | | | | 287,007 | |
Red Lion Hotels Corp. (a) | | | 2,850 | | | | 21,603 | |
Red Robin Gourmet Burgers, Inc. (a) | | | 14,900 | | | | 381,142 | |
Regis Corp. (a) | | | 68,830 | | | | 1,282,991 | |
Ruth’s Hospitality Group, Inc. | | | 17,491 | | | | 400,019 | |
| | | | |
| | The accompanying Notes to the Financial Statements are an integral part of these Financial Statements. | | (Continued) |
| | | | | | | | | | | | | | | | |
| | Elements Portfolios | | | | | | Annual Report | | | | | | May 31, 2019 | | |
| | | | |
34
| | |
| Schedule of Investments | | as of May 31, 2019 |
| | | | |
| ELEMENTS U.S. SMALL CAP PORTFOLIO | | | | |
| | | | | | | | |
| | | SHARES | | | FAIR
VALUE | |
| Consumer Services - 4.4% (continued) | | | | | | |
Speedway Motorsports, Inc. | | | 7,278 | | | $ | 132,168 | |
Strategic Education, Inc. | | | 4,517 | | | | 794,947 | |
Texas Roadhouse, Inc. | | | 9,368 | | | | 480,204 | |
The Cheesecake Factory, Inc. (c) | | | 14,946 | | | | 646,415 | |
The Habit Restaurants, Inc. - Class A (a) | | | 12,094 | | | | 123,359 | |
Weight Watchers International, Inc. (a)(c) | | | 20,893 | | | | 361,240 | |
Wingstop, Inc. | | | 200 | | | | 15,936 | |
Zovio, Inc. (a) | | | 5,531 | | | | 22,677 | |
| | | | | | | | |
| | | | | | | 15,565,762 | |
| | | | | | | | |
| Diversified Financials - 3.2% | | | | | | |
Artisan Partners Asset Management, Inc. | | | 31,718 | | | | 750,131 | |
Blucora, Inc. (a) | | | 15,370 | | | | 476,009 | |
BrightSphere Investment Group PLC (b) | | | 17,892 | | | | 192,160 | |
Cannae Holdings, Inc. (a) | | | 35,789 | | | | 910,114 | |
Cohen & Steers, Inc. | | | 2,617 | | | | 134,043 | |
Curo Group Holdings Corp. (a) | | | 4,421 | | | | 41,425 | |
Donnelley Financial Solutions, Inc. (a) | | | 22,323 | | | | 275,243 | |
Elevate Credit, Inc. (a) | | | 28,750 | | | | 122,475 | |
Enova International, Inc. (a) | | | 24,055 | | | | 513,574 | |
EZCORP, Inc. (a)(c) | | | 29,860 | | | | 262,171 | |
Federated Investors, Inc. | | | 32,275 | | | | 985,356 | |
FGL Holdings (b) | | | 3,300 | | | | 26,235 | |
FirstCash, Inc. | | | 6,053 | | | | 573,340 | |
Green Dot Corp. (a) | | | 16,063 | | | | 745,484 | |
Greenhill & Co., Inc. | | | 2,551 | | | | 38,189 | |
Hamilton Lane, Inc. | | | 9,263 | | | | 455,369 | |
Hennessy Advisors, Inc. | | | 484 | | | | 4,443 | |
Houlihan Lokey, Inc. | | | 19,579 | | | | 885,167 | |
Ladenburg Thalmann Financial Services, Inc. | | | 49,922 | | | | 159,750 | |
Manning & Napier, Inc. | | | 552 | | | | 1,087 | |
Marlin Business Services Corp. | | | 242 | | | | 5,397 | |
Moelis & Co. | | | 22,949 | | | | 729,319 | |
NewStar Financial, Inc. (a)(d) | | | 4,220 | | | | 1,097 | |
On Deck Capital, Inc. (a)(c) | | | 15,001 | | | | 60,304 | |
Oppenheimer Holdings, Inc. | | | 15,855 | | | | 390,667 | |
Piper Jaffray Cos. | | | 7,010 | | | | 496,448 | |
PJT Partners, Inc. | | | 1,830 | | | | 67,527 | |
Pzena Investment Management, Inc. | | | 63,485 | | | | 561,207 | |
Regional Management Corp. (a) | | | 4,828 | | | | 119,107 | |
Silvercrest Asset Management Group, Inc. | | | 5,641 | | | | 75,307 | |
Waddell & Reed Financial, Inc. | | | 49,157 | | | | 793,886 | |
Westwood Holdings Group, Inc. | | | 10,982 | | | | 321,443 | |
World Acceptance Corp. (a) | | | 2,041 | | | | 270,004 | |
| | | | | | | | |
| | | | | | | 11,443,478 | |
| | | | | | | | |
| Energy - 3.1% | | | | | | |
Adams Resources & Energy, Inc. | | | 3,516 | | | | 119,720 | |
Anadarko Petroleum Corp. | | | 5,412 | | | | 380,842 | |
Arch Coal, Inc. | | | 5,907 | | | | 520,702 | |
C&J Energy Services, Inc. (a) | | | 16,623 | | | | 196,816 | |
Cactus, Inc. (a) | | | 2,100 | | | | 68,355 | |
Clean Energy Fuels Corp. (a) | | | 4,300 | | | | 11,481 | |
Cloud Peak Energy, Inc. (a)(c) | | | 48,132 | | | | 4,327 | |
CONSOL Energy, Inc. (a) | | | 6,736 | | | | 176,618 | |
Covia Holdings Corp. (a) | | | 340 | | | | 989 | |
CVR Energy, Inc. | | | 24,712 | | | | 1,049,519 | |
| | | | | | | | |
| | | SHARES | | | FAIR
VALUE | |
| Energy - 3.1% (continued) | | | | | | |
Delek US Holdings, Inc. | | | 28,275 | | | $ | 865,498 | |
Diamond Offshore Drilling, Inc. (a) | | | 100 | | | | 787 | |
DMC Global, Inc. | | | 23,700 | | | | 1,603,068 | |
Dorian LPG Ltd. (a)(b) | | | 200 | | | | 1,412 | |
Dril-Quip, Inc. (a) | | | 5,026 | | | | 207,323 | |
Era Group, Inc. (a) | | | 12,672 | | | | 93,139 | |
Evolution Petroleum Corp. | | | 19,646 | | | | 120,037 | |
Exterran Corp. (a) | | | 3,065 | | | | 42,297 | |
FTS International, Inc. (a) | | | 39,117 | | | | 240,570 | |
Green Plains, Inc. | | | 2,100 | | | | 27,405 | |
Hallador Energy Co. | | | 3,594 | | | | 20,342 | |
Halliburton Co. | | | 7,481 | | | | 159,270 | |
Keane Group, Inc. (a) | | | 29,390 | | | | 215,723 | |
KLX Energy Services Holdings, Inc. (a) | | | 3,479 | | | | 68,536 | |
Liberty Oilfield Services, Inc. (c) | | | 27,724 | | | | 353,481 | |
Mammoth Energy Services, Inc. (c) | | | 23,473 | | | | 246,467 | |
Matrix Service Co. (a) | | | 44,153 | | | | 799,169 | |
Midstates Petroleum Co., Inc. (a) | | | 10,169 | | | | 68,031 | |
NACCO Industries, Inc. | | | 6,747 | | | | 337,080 | |
NCS Multistage Holdings, Inc. (a) | | | 4,554 | | | | 12,159 | |
Newpark Resources, Inc. (a) | | | 8,814 | | | | 61,610 | |
Overseas Shipholding Group, Inc. (a) | | | 80,516 | | | | 120,774 | |
Par Pacific Holdings, Inc. (a) | | | 10,000 | | | | 196,000 | |
Peabody Energy Corp. | | | 32,322 | | | | 760,213 | |
Penn Virginia Corp. (a) | | | 100 | | | | 3,050 | |
Profire Energy, Inc. (a) | | | 606 | | | | 909 | |
Renewable Energy Group, Inc. (a) | | | 48,516 | | | | 758,790 | |
REX American Resources Corp. (a) | | | 201 | | | | 13,562 | |
RigNet, Inc. (a) | | | 456 | | | | 3,803 | |
Roan Resources, Inc. (a) | | | 9,089 | | | | 18,996 | |
SandRidge Energy, Inc. (a) | | | 11,385 | | | | 78,443 | |
Select Energy Services, Inc. (a) | | | 16,000 | | | | 171,200 | |
Tellurian, Inc. (a)(c) | | | 400 | | | | 3,076 | |
TETRA Technologies, Inc. (a) | | | 1,021 | | | | 1,572 | |
VAALCO Energy, Inc. (a) | | | 770 | | | | 1,224 | |
W&T Offshore, Inc. (a) | | | 6,300 | | | | 26,460 | |
World Fuel Services Corp. | | | 30,122 | | | | 877,755 | |
| | | | | | | | |
| | | | | | | 11,108,600 | |
| | | | | | | | |
| Food & Staples Retailing - 2.1% | | | | | | |
BJ’s Wholesale Club Holdings, Inc. (a) | | | 54,041 | | | | 1,349,944 | |
Ingles Markets, Inc. | | | 12,842 | | | | 382,820 | |
Natural Grocers by Vitamin Cottage, Inc. (a) | | | 52,383 | | | | 537,973 | |
Performance Food Group Co. (a) | | | 68,167 | | | | 2,682,372 | |
PriceSmart, Inc. | | | 9,920 | | | | 482,112 | |
Rite Aid Corp. (a) | | | 155 | | | | 1,187 | |
Smart & Final Stores, Inc. (a) | | | 40,737 | | | | 265,198 | |
SpartanNash Co. | | | 37,785 | | | | 436,039 | |
The Chefs’ Warehouse, Inc. (a) | | | 33,012 | | | | 1,045,490 | |
United Natural Foods, Inc. (a) | | | 10,602 | | | | 107,610 | |
Village Super Market, Inc. | | | 113 | | | | 2,992 | |
Weis Markets, Inc. | | | 3,287 | | | | 124,249 | |
| | | | | | | | |
| | | | | | | 7,417,986 | |
| | | | | | | | |
| Food, Beverage & Tobacco - 1.9% | | | | | | |
Altria Group, Inc. | | | 10,102 | | | | 495,604 | |
B&G Foods, Inc. (c) | | | 7,100 | | | | 155,845 | |
| | | | |
| | The accompanying Notes to the Financial Statements are an integral part of these Financial Statements. | | (Continued) |
| | | | | | | | | | | | | | | | |
| | Elements Portfolios | | | | | | Annual Report | | | | | | May 31, 2019 | | |
| | | | |
35
| | |
| Schedule of Investments | | as of May 31, 2019 |
| | | | |
| ELEMENTS U.S. SMALL CAP PORTFOLIO | | | | |
| | | | | | | | |
| | | SHARES | | | FAIR
VALUE | |
| Food, Beverage & Tobacco - 1.9% (continued) | |
Boston Beer Company, Inc. - Class A (a) | | | 1,455 | | | $ | 457,307 | |
Calavo Growers, Inc. | | | 789 | | | | 68,998 | |
Cal-Maine Foods, Inc. | | | 8,996 | | | | 333,032 | |
Coca-Cola Consolidated, Inc. | | | 1,978 | | | | 597,376 | |
Craft Brew Alliance, Inc. (a) | | | 3,080 | | | | 42,535 | |
Darling Ingredients, Inc. (a) | | | 42,568 | | | | 804,535 | |
Dean Foods Co. (c) | | | 12,253 | | | | 13,478 | |
Fresh Del Monte Produce, Inc. (b) | | | 19,904 | | | | 497,998 | |
Freshpet, Inc. (a) | | | 1,281 | | | | 59,528 | |
J&J Snack Foods Corp. | | | 1,298 | | | | 208,783 | |
John B Sanfilippo & Son, Inc. | | | 863 | | | | 66,149 | |
Lancaster Colony Corp. | | | 5,591 | | | | 804,154 | |
Landec Corp. (a) | | | 1,000 | | | | 9,920 | |
Lifeway Foods, Inc. (a) | | | 2,494 | | | | 5,312 | |
MGP Ingredients, Inc. | | | 100 | | | | 6,021 | |
National Beverage Corp. (c) | | | 6,687 | | | | 301,918 | |
Sanderson Farms, Inc. (c) | | | 2,789 | | | | 381,284 | |
The Simply Good Foods Co. (a) | | | 3,248 | | | | 69,800 | |
Tootsie Roll Industries, Inc. (c) | | | 17,178 | | | | 652,077 | |
Turning Point Brands, Inc. | | | 1,600 | | | | 78,768 | |
Universal Corp. | | | 6,000 | | | | 339,120 | |
Vector Group Ltd. | | | 23,373 | | | | 209,188 | |
| | | | | | | | |
| | | | | | | 6,658,730 | |
| | | | | | | | |
| Health Care Equipment & Services - 6.6% | |
Accuray, Inc. (a) | | | 5,768 | | | | 21,399 | |
Addus HomeCare Corp. (a) | | | 4,233 | | | | 289,453 | |
Allscripts Healthcare Solutions, Inc. (a) | | | 10,500 | | | | 102,165 | |
Amedisys, Inc. (a) | | | 12,287 | | | | 1,379,953 | |
American Renal Associates Holdings, Inc. (a) | | | 8,689 | | | | 56,392 | |
AMN Healthcare Services, Inc. (a) | | | 17,393 | | | | 842,517 | |
AngioDynamics, Inc. (a) | | | 38,408 | | | | 721,686 | |
Apyx Medical Corp. (a) | | | 13,000 | | | | 78,390 | |
AtriCure, Inc. (a) | | | 1,100 | | | | 32,230 | |
Atrion Corp. | | | 430 | | | | 379,780 | |
Avanos Medical, Inc. (a) | | | 2,197 | | | | 82,783 | |
AxoGen, Inc. (a) | | | 480 | | | | 10,046 | |
BioLife Solutions, Inc. (a) | | | 400 | | | | 7,092 | |
BioScrip, Inc. (a) | | | 100 | | | | 207 | |
BioTelemetry, Inc. (a) | | | 1,014 | | | | 48,530 | |
Cardiovascular Systems, Inc. (a) | | | 2,300 | | | | 89,585 | |
Computer Programs & Systems, Inc. | | | 1,862 | | | | 48,058 | |
CONMED Corp. | | | 5,550 | | | | 446,664 | |
CorVel Corp. (a) | | | 9,728 | | | | 719,677 | |
Cross Country Healthcare, Inc. (a) | | | 49,938 | | | | 355,059 | |
CryoLife, Inc. (a) | | | 4,050 | | | | 116,437 | |
Cutera, Inc. (a) | | | 12,351 | | | | 208,114 | |
Diplomat Pharmacy, Inc. (a) | | | 45,437 | | | | 209,919 | |
Enzo Biochem, Inc. (a) | | | 1,592 | | | | 5,126 | |
Genesis Healthcare, Inc. (a) | | | 26,489 | | | | 29,933 | |
Glaukos Corp. (a) | | | 5,471 | | | | 352,770 | |
Globus Medical, Inc. (a) | | | 26,852 | | | | 1,055,284 | |
Haemonetics Corp. (a) | | | 15,117 | | | | 1,466,198 | |
Hanger, Inc. (a) | | | 3,700 | | | | 69,042 | |
HCA Healthcare, Inc. | | | 2,141 | | | | 258,975 | |
HealthEquity, Inc. (a) | | | 2,193 | | | | 143,334 | |
HealthStream, Inc. (a) | | | 13,229 | | | | 330,725 | |
| | | | | | | | |
| | | SHARES | | | FAIR
VALUE | |
| Health Care Equipment & Services - 6.6% (continued) | |
HMS Holdings Corp. (a) | | | 11,691 | | | $ | 355,757 | |
Inogen, Inc. (a) | | | 1,320 | | | | 85,100 | |
Invacare Corp. | | | 8,043 | | | | 47,695 | |
iRadimed Corp. (a)(c) | | | 26,141 | | | | 545,563 | |
Lantheus Holdings, Inc. (a) | | | 2,000 | | | | 47,980 | |
LeMaitre Vascular, Inc. | | | 2,001 | | | | 51,646 | |
LHC Group, Inc. (a) | | | 14,636 | | | | 1,657,966 | |
LivaNova PLC (a)(b) | | | 5,205 | | | | 374,240 | |
Magellan Health, Inc. (a) | | | 4,490 | | | | 296,475 | |
Medidata Solutions, Inc. (a) | | | 1,152 | | | | 105,005 | |
Meridian Bioscience, Inc. | | | 36,557 | | | | 413,094 | |
Merit Medical Systems, Inc. (a) | | | 1,200 | | | | 61,956 | |
National HealthCare Corp. | | | 6,683 | | | | 519,069 | |
National Research Corp. | | | 15,594 | | | | 795,138 | |
Natus Medical, Inc. (a) | | | 8,731 | | | | 217,402 | |
Neogen Corp. (a) | | | 2,630 | | | | 148,200 | |
NextGen Healthcare, Inc. (a) | | | 30,863 | | | | 594,113 | |
NuVasive, Inc. (a) | | | 2,800 | | | | 162,288 | |
Omnicell, Inc. (a) | | | 5,046 | | | | 400,905 | |
OraSure Technologies, Inc. (a) | | | 27,715 | | | | 230,034 | |
Orthofix Medical, Inc. (a) | | | 10,205 | | | | 503,413 | |
Owens & Minor, Inc. | | | 9,011 | | | | 24,240 | |
Oxford Immunotec Global PLC (a)(b) | | | 506 | | | | 7,398 | |
Patterson Cos., Inc. | | | 34,914 | | | | 733,892 | |
PetIQ, Inc. (a) | | | 700 | | | | 18,361 | |
R1 RCM, Inc. (a) | | | 4,900 | | | | 57,526 | |
RadNet, Inc. (a) | | | 26,131 | | | | 315,662 | |
RTI Surgical Holdings, Inc. (a) | | | 9,169 | | | | 38,785 | |
SeaSpine Holdings Corp. (a) | | | 5,188 | | | | 70,712 | |
Select Medical Holdings Corp. (a) | | | 15,378 | | | | 216,061 | |
Simulations Plus, Inc. | | | 3,384 | | | | 84,837 | |
STAAR Surgical Co. (a) | | | 9,776 | | | | 226,510 | |
Surgery Partners, Inc. (a) | | | 700 | | | | 5,999 | |
Surmodics, Inc. (a) | | | 6,325 | | | | 256,542 | |
Tabula Rasa HealthCare, Inc. (a)(c) | | | 15,450 | | | | 697,876 | |
Tactile Systems Technology, Inc. (a) | | | 5,258 | | | | 252,542 | |
The Ensign Group, Inc. | | | 23,450 | | | | 1,248,947 | |
The Joint Corp. (a)(c) | | | 9,055 | | | | 144,880 | |
The Providence Service Corp. (a) | | | 8,251 | | | | 533,675 | |
Tivity Health, Inc. (a) | | | 14,169 | | | | 259,293 | |
Triple-S Management Corp. -
Class B (a)(b) | | | 2,600 | | | | 63,700 | |
US Physical Therapy, Inc. | | | 2,501 | | | | 279,387 | |
Utah Medical Products, Inc. | | | 2,100 | | | | 167,475 | |
Varex Imaging Corp. (a) | | | 10,979 | | | | 292,920 | |
| | | | | | | | |
| | | | | | | 23,567,782 | |
| | | | | | | | |
| Household & Personal Products - 0.9% | | | | | | |
Central Garden & Pet Co. (a) | | | 214 | | | | 6,024 | |
Central Garden & Pet Co. - Class A (a) | | | 22,934 | | | | 586,422 | |
Edgewell Personal Care Co. (a) | | | 10,777 | | | | 307,576 | |
elf Beauty, Inc. (a)(c) | | | 4,669 | | | | 47,577 | |
Inter Parfums, Inc. | | | 18,855 | | | | 1,221,427 | |
Lifevantage Corp. (a) | | | 9,919 | | | | 111,291 | |
Medifast, Inc. | | | 1,618 | | | | 208,641 | |
Natural Health Trends Corp. (c) | | | 10,397 | | | | 105,841 | |
Nature’s Sunshine Products, Inc. (a) | | | 552 | | | | 5,316 | |
Oil-Dri Corp of America | | | 190 | | | | 5,584 | |
| | | | |
| | The accompanying Notes to the Financial Statements are an integral part of these Financial Statements. | | (Continued) |
| | | | | | | | | | | | | | | | |
| | Elements Portfolios | | | | | | Annual Report | | | | | | May 31, 2019 | | |
| | | | |
36
| | |
| Schedule of Investments | | as of May 31, 2019 |
| | | | |
| ELEMENTS U.S. SMALL CAP PORTFOLIO | | | | |
| | | | | | | | |
| | | SHARES | | | FAIR
VALUE | |
| Household & Personal Products - 0.9% (continued) | |
USANA Health Sciences, Inc. (a) | | | 3,782 | | | $ | 267,690 | |
WD-4Co. | | | 1,159 | | | | 181,187 | |
| | | | | | | | |
| | | | | | | 3,054,576 | |
| | | | | | | | |
| Insurance - 3.7% | | | | | | |
American Equity Investment Life Holding Co. | | | 22,355 | | | | 632,870 | |
AMERISAFE, Inc. | | | 3,158 | | | | 188,122 | |
Citizens, Inc. (a) | | | 5,795 | | | | 37,146 | |
CNO Financial Group, Inc. | | | 3,760 | | | | 59,070 | |
Crawford & Co. | | | 146 | | | | 1,215 | |
Donegal Group, Inc. | | | 1,937 | | | | 27,990 | |
eHealth, Inc. (a) | | | 19,644 | | | | 1,386,081 | |
EMC Insurance Group, Inc. | | | 11,677 | | | | 421,306 | |
Employers Holdings, Inc. | | | 11,373 | | | | 472,434 | |
FBL Financial Group, Inc. | | | 2,780 | | | | 171,137 | |
FedNat Holding Co. | | | 2,962 | | | | 40,046 | |
Hallmark Financial Services, Inc. (a) | | | 8,420 | | | | 99,272 | |
Health Insurance Innovations, Inc. (a)(c) | | | 4,047 | | | | 104,372 | |
Heritage Insurance Holdings, Inc. | | | 45,612 | | | | 667,304 | |
Horace Mann Educators Corp. | | | 3,400 | | | | 137,734 | |
Independence Holding Co. | | | 800 | | | | 29,864 | |
Investors Title Co. | | | 136 | | | | 21,000 | |
James River Group Holdings Ltd. (b) | | | 1,900 | | | | 84,740 | |
Kemper Corp. | | | 19,873 | | | | 1,649,260 | |
Kingstone Cos., Inc. | | | 925 | | | | 8,251 | |
Kinsale Capital Group, Inc. | | | 11,157 | | | | 934,845 | |
National General Holdings Corp. | | | 13,749 | | | | 312,377 | |
NI Holdings, Inc. (a) | | | 400 | | | | 6,776 | |
Primerica, Inc. | | | 1,106 | | | | 127,035 | |
ProAssurance Corp. (c) | | | 13,868 | | | | 520,327 | |
RLI Corp. | | | 9,396 | | | | 806,929 | |
Safety Insurance Group, Inc. | | | 11,311 | | | | 1,030,771 | |
Selective Insurance Group, Inc. | | | 11,364 | | | | 814,231 | |
State Auto Financial Corp. | | | 4,202 | | | | 143,666 | |
Stewart Information Services Corp. | | | 18,819 | | | | 774,025 | |
Third Point Reinsurance Ltd. (a)(b) | | | 27,139 | | | | 275,732 | |
Tiptree, Inc. | | | 1,914 | | | | 11,580 | |
United Fire Group, Inc. | | | 13,703 | | | | 643,219 | |
Universal Insurance Holdings, Inc. | | | 19,783 | | | | 574,498 | |
| | | | | | | | |
| | | | | | | 13,215,225 | |
| | | | | | | | |
| Materials - 3.3% | | | | | | |
AdvanSix, Inc. (a) | | | 7,583 | | | | 184,873 | |
AgroFresh Solutions, Inc. (a) | | | 1,827 | | | | 4,403 | |
Balchem Corp. | | | 300 | | | | 27,207 | |
Boise Cascade Co. | | | 36,214 | | | | 803,951 | |
Carpenter Technology Corp. | | | 2,293 | | | | 93,004 | |
Ferro Corp. (a) | | | 3,000 | | | | 40,620 | |
Flotek Industries, Inc. (a) | | | 1,900 | | | | 5,776 | |
FutureFuel Corp. | | | 66,541 | | | | 690,696 | |
Gold Resource Corp. | | | 66,064 | | | | 187,622 | |
Greif, Inc. - Class A | | | 13,010 | | | | 461,074 | |
Greif, Inc. - Class B | | | 100 | | | | 4,405 | |
Haynes International, Inc. | | | 700 | | | | 20,391 | |
Ingevity Corp. (a) | | | 800 | | | | 70,160 | |
Innospec, Inc. | | | 2,581 | | | | 208,312 | |
Intrepid Potash, Inc. (a) | | | 17,479 | | | | 55,234 | |
| | | | | | | | |
| | | SHARES | | | FAIR
VALUE | |
| Materials - 3.3% (continued) | | | | | | |
Kaiser Aluminum Corp. | | | 1,512 | | | $ | 134,749 | |
Kraton Corp. (a) | | | 1,131 | | | | 27,676 | |
Kronos Worldwide, Inc. | | | 1,901 | | | | 23,972 | |
Louisiana-Pacific Corp. | | | 43,251 | | | | 986,988 | |
LyondellBasell Industries N.V. (b) | | | 2,333 | | | | 173,225 | |
Materion Corp. | | | 19,671 | | | | 1,189,112 | |
Minerals Technologies, Inc. | | | 1,600 | | | | 83,168 | |
Myers Industries, Inc. | | | 54,717 | | | | 925,812 | |
Neenah, Inc. | | | 1,522 | | | | 86,997 | |
Olympic Steel, Inc. | | | 120 | | | | 1,486 | |
OMNOVA Solutions, Inc. (a) | | | 63,314 | | | | 358,990 | |
PH Glatfelter Co. | | | 17,867 | | | | 260,501 | |
PolyOne Corp. | | | 8,104 | | | | 203,653 | |
Quaker Chemical Corp. | | | 2,600 | | | | 470,236 | |
Ryerson Holding Corp. (a) | | | 5,206 | | | | 40,190 | |
Schnitzer Steel Industries, Inc. | | | 24,377 | | | | 514,598 | |
Schweitzer-Mauduit International, Inc. | | | 8,133 | | | | 254,482 | |
Stepan Co. | | | 6,956 | | | | 590,286 | |
SunCoke Energy, Inc. (a) | | | 1,895 | | | | 13,909 | |
Trecora Resources (a) | | | 3,438 | | | | 32,592 | |
Tredegar Corp. | | | 20,332 | | | | 316,976 | |
Trinseo S.A. (b) | | | 12,325 | | | | 454,053 | |
UFP Technologies, Inc. (a) | | | 6,265 | | | | 231,304 | |
United States Lime & Minerals, Inc. | | | 1,691 | | | | 138,087 | |
Valhi, Inc. | | | 59,531 | | | | 119,062 | |
Verso Corp. (a) | | | 29,694 | | | | 511,331 | |
Warrior Met Coal, Inc. | | | 20,407 | | | | 526,705 | |
Worthington Industries, Inc. | | | 7,690 | | | | 262,537 | |
| | | | | | | | |
| | | | | | | 11,790,405 | |
| | | | | | | | |
| Media & Entertainment - 3.5% | | | | | | |
Care.com, Inc. (a) | | | 28,109 | | | | 401,678 | |
Cargurus, Inc. (a) | | | 2,259 | | | | 77,167 | |
Central European Media Enterprises Ltd. (a)(b) | | | 2,500 | | | | 9,175 | |
DHI Group, Inc. (a) | | | 19,696 | | | | 67,754 | |
Emerald Expositions Events, Inc. | | | 6,471 | | | | 75,711 | |
Entravision Communications Corp. | | | 42,359 | | | | 124,536 | |
Eros International PLC (a)(b) | | | 173 | | | | 1,337 | |
Fluent, Inc. (a) | | | 25,333 | | | | 123,625 | |
Gannett Co., Inc. | | | 98,697 | | | | 775,758 | |
Glu Mobile, Inc. (a) | | | 49,814 | | | | 397,516 | |
Gray Television, Inc. (a) | | | 1,000 | | | | 17,230 | |
Hemisphere Media Group, Inc. (a) | | | 13,182 | | | | 177,957 | |
IMAX Corp. (a)(b) | | | 10,473 | | | | 227,893 | |
Lee Enterprises, Inc. (a) | | | 23,227 | | | | 58,532 | |
Liberty Media Corp. - Class A (a) | | | 1,800 | | | | 47,772 | |
Liberty Media Corp. - Class C (a) | | | 3,400 | | | | 90,474 | |
Liberty TripAdvisor Holdings, Inc. (a) | | | 50,315 | | | | 535,855 | |
Marchex, Inc. - Class B (a) | | | 15,397 | | | | 67,131 | |
MSG Networks, Inc. (a) | | | 12,282 | | | | 259,273 | |
National CineMedia, Inc. | | | 5,329 | | | | 34,905 | |
New Media Investment Group, Inc. | | | 57,235 | | | | 528,279 | |
Nexstar Media Group, Inc. | | | 1,400 | | | | 140,210 | |
QuinStreet, Inc. (a) | | | 94,698 | | | | 1,451,720 | |
Rosetta Stone, Inc. (a) | | | 33,741 | | | | 832,053 | |
Saga Communications, Inc. | | | 135 | | | | 3,929 | |
Scholastic Corp. | | | 10,134 | | | | 335,334 | |
| | | | |
| | The accompanying Notes to the Financial Statements are an integral part of these Financial Statements. | | (Continued) |
| | | | | | | | | | | | | | | | |
| | Elements Portfolios | | | | | | Annual Report | | | | | | May 31, 2019 | | |
| | | | |
37
| | |
| Schedule of Investments | | as of May 31, 2019 |
| | | | |
| ELEMENTS U.S. SMALL CAP PORTFOLIO | | | | |
| | | | | | | | |
| | | SHARES | | | FAIR
VALUE | |
| Media & Entertainment - 3.5% (continued) | |
Sinclair Broadcast Group, Inc. | | | 19,230 | | | $ | 1,032,266 | |
TechTarget, Inc. (a) | | | 22,469 | | | | 424,664 | |
TEGNA, Inc. | | | 41,046 | | | | 621,436 | |
The EW Scripps Co. - Class A | | | 4,800 | | | | 73,056 | |
The Marcus Corp. | | | 8,100 | | | | 283,176 | |
The Meet Group, Inc. (a) | | | 1,000 | | | | 3,870 | |
The New York Times Co. - Class A (c) | | | 78,029 | | | | 2,482,883 | |
Travelzoo (a) | | | 26 | | | | 442 | |
Tribune Publishing Co. (a) | | | 14,019 | | | | 137,667 | |
TrueCar, Inc. (a) | | | 3,700 | | | | 24,124 | |
World Wrestling Entertainment, Inc. (c) | | | 5,695 | | | | 414,254 | |
Yelp, Inc. (a) | | | 6,888 | | | | 211,668 | |
| | | | | | | | |
| | | | | | | 12,572,310 | |
| | | | | | | | |
| Pharmaceuticals, Biotechnology & Life Sciences - 0.9% | |
Amphastar Pharmaceuticals, Inc. (a) | | | 4,618 | | | | 88,896 | |
Assertio Therapeutics, Inc. (a) | | | 11,521 | | | | 33,757 | |
Codexis, Inc. (a) | | | 400 | | | | 7,240 | |
Collegium Pharmaceutical, Inc. (a) | | | 13,900 | | | | 159,989 | |
Corcept Therapeutics, Inc. (a) | | | 22,304 | | | | 218,133 | |
Harrow Health, Inc. (a) | | | 14,874 | | | | 90,285 | |
Horizon Therapeutics PLC (a)(b) | | | 6,300 | | | | 150,129 | |
Innoviva, Inc. (a)(c) | | | 15,260 | | | | 208,604 | |
Intersect ENT, Inc. (a) | | | 2,554 | | | | 60,223 | |
Luminex Corp. | | | 22,358 | | | | 471,754 | |
Medpace Holdings, Inc. (a) | | | 9,273 | | | | 500,557 | |
NeoGenomics, Inc. (a) | | | 33,867 | | | | 735,253 | |
Phibro Animal Health Corp. | | | 11,309 | | | | 334,520 | |
SIGA Technologies, Inc. (a)(c) | | | 37,604 | | | | 200,805 | |
| | | | | | | | |
| | | | | | | 3,260,145 | |
| | | | | | | | |
| Real Estate - 0.6% | | | | | | |
Altisource Portfolio Solutions, S.A. (a)(b) | | | 2,605 | | | | 52,439 | |
eXp World Holdings, Inc. (a)(c) | | | 1,800 | | | | 18,360 | |
Forestar Group, Inc. (a) | | | 3,362 | | | | 60,213 | |
HFF, Inc. | | | 19,285 | | | | 832,726 | |
Marcus & Millichap, Inc. (a) | | | 26,445 | | | | 807,630 | |
Maui Land & Pineapple Co., Inc. (a) | | | 217 | | | | 2,240 | |
RE/MAX Holdings, Inc. | | | 2,866 | | | | 84,891 | |
The RMR Group, Inc. - Class A | | | 7,946 | | | | 383,156 | |
| | | | | | | | |
| | | | | | | 2,241,655 | |
| | | | | | | | |
| Retailing - 10.0% | | | | | | |
1-800-Flowers.com, Inc. (a) | | | 92,687 | | | | 1,692,465 | |
Aaron’s, Inc. | | | 37,493 | | | | 1,996,877 | |
Abercrombie & Fitch Co. (c) | | | 84,822 | | | | 1,467,421 | |
American Eagle Outfitters, Inc. | | | 134,816 | | | | 2,345,798 | |
America’sCar-Mart, Inc. (a) | | | 14,733 | | | | 1,268,511 | |
Asbury Automotive Group, Inc. (a) | | | 5,730 | | | | 425,109 | |
Ascena Retail Group, Inc. (a) | | | 255,293 | | | | 268,058 | |
Barnes & Noble Education, Inc. (a) | | | 42,152 | | | | 133,622 | |
Barnes & Noble, Inc. | | | 88,365 | | | | 387,922 | |
Bed Bath & Beyond, Inc. (c) | | | 35,272 | | | | 447,602 | |
Big Lots, Inc. | | | 19,461 | | | | 537,124 | |
Boot Barn Holdings, Inc. (a) | | | 9,754 | | | | 254,872 | |
Caleres, Inc. | | | 18,504 | | | | 348,985 | |
Chico’s FAS, Inc. | | | 75,802 | | | | 255,453 | |
Citi Trends, Inc. | | | 18,401 | | | | 251,726 | |
| | | | | | | | |
| | | SHARES | | | FAIR
VALUE | |
| Retailing - 10.0% (continued) | | | | | | |
Conn’s, Inc. (a) | | | 10,700 | | | $ | 192,065 | |
Core-Mark Holding Co., Inc. | | | 43,908 | | | | 1,619,327 | |
Designer Brands, Inc. | | | 59,136 | | | | 1,069,770 | |
Destination XL Group, Inc. (a) | | | 5,944 | | | | 9,986 | |
Dillard’s, Inc. (c) | | | 14,717 | | | | 833,865 | |
Duluth Holdings, Inc. (a) | | | 131 | | | | 1,958 | |
Express, Inc. (a) | | | 179,729 | | | | 540,984 | |
Five Below, Inc. (a) | | | 8,205 | | | | 1,056,230 | |
Francesca’s Holdings Corp. (a)(c) | | | 89,563 | | | | 42,677 | |
Funko, Inc. (a)(c) | | | 1,600 | | | | 33,216 | |
GameStop Corp. (c) | | | 4,806 | | | | 36,429 | |
Genesco, Inc. (a) | | | 18,812 | | | | 846,164 | |
GNC Holdings, Inc. (a)(c) | | | 102,291 | | | | 143,207 | |
Group 1 Automotive, Inc. | | | 1,274 | | | | 91,970 | |
Groupon, Inc. (a) | | | 262,881 | | | | 927,970 | |
Guess?, Inc. (c) | | | 33,379 | | | | 539,738 | |
Haverty Furniture Cos., Inc. | | | 11,287 | | | | 196,507 | |
Hibbett Sports, Inc. (a) | | | 22,896 | | | | 506,459 | |
Hudson Ltd. (a)(b) | | | 58,051 | | | | 788,333 | |
J. Jill, Inc. | | | 55,807 | | | | 82,594 | |
Kirkland’s, Inc. (a) | | | 30,640 | | | | 123,479 | |
Lands’ End, Inc. (a) | | | 12,717 | | | | 157,309 | |
Liquidity Services, Inc. (a) | | | 34,198 | | | | 192,193 | |
Lithia Motors, Inc. | | | 4,734 | | | | 540,386 | |
Lumber Liquidators Holdings, Inc. (a)(c) | | | 2,144 | | | | 20,561 | |
MarineMax, Inc. (a) | | | 15,817 | | | | 246,429 | |
Monro, Inc. | | | 16,464 | | | | 1,312,345 | |
Murphy USA, Inc. (a) | | | 13,296 | | | | 1,067,137 | |
Office Depot, Inc. | | | 95,900 | | | | 187,964 | |
Ollie’s Bargain Outlet Holdings, Inc. (a) | | | 8,021 | | | | 791,833 | |
Overstock.com, Inc. (a)(c) | | | 1,554 | | | | 14,841 | |
PetMed Express, Inc. (c) | | | 23,139 | | | | 404,238 | |
Rent-A-Center, Inc. (a) | | | 61,740 | | | | 1,473,116 | |
RH (a)(c) | | | 5,259 | | | | 447,804 | |
RTW RetailWinds, Inc. (a) | | | 4,235 | | | | 8,089 | |
Sally Beauty Holdings, Inc. (a) | | | 52,676 | | | | 799,622 | |
Sears Hometown and Outlet Stores, Inc. (a)(c) | | | 2,218 | | | | 4,835 | |
Shoe Carnival, Inc. (c) | | | 34,944 | | | | 897,711 | |
Shutterfly, Inc. (a) | | | 1,300 | | | | 61,724 | |
Shutterstock, Inc. | | | 4,632 | | | | 176,294 | |
Signet Jewelers Ltd. (b) | | | 1,453 | | | | 27,404 | |
Sleep Number Corp. (a) | | | 14,699 | | | | 511,672 | |
Sonic Automotive, Inc. | | | 3,909 | | | | 68,134 | |
Sportsman’s Warehouse Holdings, Inc. (a) | | | 37,334 | | | | 137,389 | |
Stamps.com, Inc. (a)(c) | | | 4,479 | | | | 150,226 | |
Stein Mart, Inc. (a)(c) | | | 3,679 | | | | 2,889 | |
Stitch Fix, Inc. (a)(c) | | | 9,600 | | | | 222,336 | |
Tailored Brands, Inc. (c) | | | 47,028 | | | | 247,367 | |
The Buckle, Inc. (c) | | | 39,951 | | | | 601,262 | |
The Cato Corp. - Class A | | | 49,056 | | | | 607,804 | |
The Children’s Place, Inc. | | | 5,158 | | | | 477,940 | |
The Container Store Group, Inc. (a)(c) | | | 71,588 | | | | 503,264 | |
The Rubicon Project, Inc. (a) | | | 8,900 | | | | 48,950 | |
Tile Shop Holdings, Inc. | | | 272 | | | | 1,137 | |
Tilly’s, Inc. | | | 51,270 | | | | 399,906 | |
Vitamin Shoppe, Inc. (a) | | | 21,855 | | | | 81,738 | |
| | | | |
| | The accompanying Notes to the Financial Statements are an integral part of these Financial Statements. | | (Continued) |
| | | | | | | | | | | | | | | | |
| | Elements Portfolios | | | | | | Annual Report | | | | | | May 31, 2019 | | |
| | | | |
38
| | |
| Schedule of Investments | | as of May 31, 2019 |
| | | | |
| ELEMENTS U.S. SMALL CAP PORTFOLIO | | | | |
| | | | | | | | |
| | | SHARES | | | FAIR
VALUE | |
| Retailing - 10.0% (continued) | | | | | | |
Weyco Group, Inc. | | | 11,886 | | | $ | 297,388 | |
Winmark Corp. | | | 840 | | | | 138,466 | |
Zumiez, Inc. (a)(c) | | | 38,546 | | | | 762,440 | |
| | | | | | | | |
| | | | | | | 35,856,616 | |
| | | | | | | | |
| Semiconductors & Semiconductor Equipment - 2.4% | |
Advanced Energy Industries, Inc. (a) | | | 10,860 | | | | 544,846 | |
Amkor Technology, Inc. (a) | | | 27,700 | | | | 179,496 | |
Aquantia Corp. (a) | | | 11,869 | | | | 155,959 | |
Axcelis Technologies, Inc. (a) | | | 785 | | | | 11,641 | |
Brooks Automation, Inc. | | | 30,991 | | | | 1,099,870 | |
Cabot Microelectronics Corp. | | | 10,675 | | | | 1,040,492 | |
CEVA, Inc. (a) | | | 201 | | | | 4,589 | |
Cirrus Logic, Inc. (a) | | | 24,310 | | | | 908,465 | |
Cree, Inc. (a) | | | 4,500 | | | | 248,130 | |
Diodes, Inc. (a) | | | 21,103 | | | | 652,716 | |
DSP Group, Inc. (a) | | | 1,339 | | | | 18,706 | |
Entegris, Inc. | | | 32,456 | | | | 1,114,539 | |
FormFactor, Inc. (a) | | | 14,111 | | | | 202,634 | |
GSI Technology, Inc. (a) | | | 500 | | | | 4,160 | |
Ichor Holdings Ltd. (a)(b) | | | 1,869 | | | | 39,436 | |
Lattice Semiconductor Corp. (a) | | | 18,928 | | | | 242,278 | |
MaxLinear, Inc. (a) | | | 3,882 | | | | 82,182 | |
Nanometrics, Inc. (a) | | | 19,378 | | | | 551,304 | |
NVE Corp. | | | 249 | | | | 18,167 | |
PDF Solutions, Inc. (a) | | | 7,675 | | | | 93,251 | |
Photronics, Inc. (a) | | | 24,592 | | | | 199,441 | |
Pixelworks, Inc. (a) | | | 14,669 | | | | 43,714 | |
Power Integrations, Inc. | | | 173 | | | | 11,273 | |
Rambus, Inc. (a) | | | 3,958 | | | | 44,963 | |
Rudolph Technologies, Inc. (a) | | | 24,386 | | | | 562,585 | |
Semtech Corp. (a) | | | 3,456 | | | | 137,652 | |
Sigma Designs, Inc. (c) | | | 44,767 | | | | 7,297 | |
Silicon Laboratories, Inc. (a) | | | 524 | | | | 49,031 | |
SMART Global Holdings, Inc. (a)(b) | | | 3,508 | | | | 59,741 | |
Synaptics, Inc. (a) | | | 2,986 | | | | 78,980 | |
Xperi Corp. | | | 4,174 | | | | 87,696 | |
| | | | | | | | |
| | | | | | | 8,495,234 | |
| | | | | | | | |
| Software & Services - 7.1% | |
8x8, Inc. (a)(c) | | | 14,282 | | | | 344,625 | |
A1Networks, Inc. (a) | | | 42,228 | | | | 257,168 | |
Actua Corp. (a)(d) | | | 5,440 | | | | 3,482 | |
Agilysys, Inc. (a) | | | 32,420 | | | | 706,756 | |
Altair Engineering, Inc. (a) | | | 2,400 | | | | 91,464 | |
Alteryx, Inc. (a) | | | 4,200 | | | | 364,812 | |
Amber Road, Inc. (a) | | | 800 | | | | 10,384 | |
American Software, Inc. - Class A | | | 44,082 | | | | 558,519 | |
Appfolio, Inc. (a)(c) | | | 8,962 | | | | 863,937 | |
Avaya Holdings Corp. (a) | | | 2,900 | | | | 36,482 | |
Blackline, Inc. (a) | | | 2,307 | | | | 118,603 | |
Bottomline Technologies de, Inc. (a) | | | 3,081 | | | | 134,578 | |
Brightcove, Inc. (a) | | | 38,611 | | | | 385,338 | |
CACI International, Inc. (a) | | | 11,309 | | | | 2,301,608 | |
Carbonite, Inc. (a) | | | 13,368 | | | | 316,421 | |
Cardtronics PLC - Class A (a)(b) | | | 3,900 | | | | 117,780 | |
ChannelAdvisor Corp. (a) | | | 27,356 | | | | 251,675 | |
CommVault Systems, Inc. (a) | | | 8,225 | | | | 378,761 | |
| | | | | | | | |
| | | SHARES | | | FAIR
VALUE | |
| Software & Services - 7.1% (continued) | |
Cornerstone OnDemand, Inc. (a) | | | 500 | | | $ | 26,615 | |
CSG Systems International, Inc. | | | 983 | | | | 44,087 | |
Digital Turbine, Inc. (a) | | | 27,200 | | | | 102,544 | |
Endurance International Group Holdings, Inc. (a) | | | 14,988 | | | | 66,697 | |
Everbridge, Inc. (a) | | | 4,796 | | | | 377,157 | |
EVERTEC, Inc. (b) | | | 18,104 | | | | 518,861 | |
ExlService Holdings, Inc. (a) | | | 5,393 | | | | 319,589 | |
ForeScout Technologies, Inc. (a) | | | 800 | | | | 25,696 | |
I3 Verticals, Inc. (a) | | | 4,017 | | | | 102,715 | |
Information Services Group, Inc. (a) | | | 859 | | | | 2,671 | |
Instructure, Inc. (a)(c) | | | 2,201 | | | | 91,518 | |
J2 Global, Inc. | | | 185 | | | | 15,594 | |
Leidos Holdings, Inc. | | | 19,000 | | | | 1,431,270 | |
Limelight Networks, Inc. (a) | | | 111,684 | | | | 343,987 | |
LivePerson, Inc. (a) | | | 8,527 | | | | 237,306 | |
LiveRamp Holdings, Inc. (a) | | | 2,578 | | | | 132,458 | |
Majesco (a) | | | 583 | | | | 5,206 | |
ManTech International Corp. - Class A | | | 23,980 | | | | 1,471,653 | |
MAXIMUS, Inc. | | | 33,517 | | | | 2,388,086 | |
MicroStrategy, Inc. (a) | | | 2,968 | | | | 394,477 | |
Mitek Systems, Inc. (a) | | | 448 | | | | 4,570 | |
MobileIron, Inc. (a) | | | 35,031 | | | | 195,823 | |
Model N, Inc. (a) | | | 5,765 | | | | 103,885 | |
Monotype Imaging Holdings, Inc. | | | 13,177 | | | | 214,653 | |
New Relic, Inc. (a) | | | 200 | | | | 20,064 | |
NIC, Inc. | | | 35,738 | | | | 570,378 | |
OneSpan, Inc. (a) | | | 8,015 | | | | 111,809 | |
Paylocity Holding Corp. (a) | | | 100 | | | | 10,022 | |
Perficient, Inc. (a) | | | 37,273 | | | | 1,134,217 | |
Perspecta, Inc. | | | 5,628 | | | | 122,184 | |
Presidio, Inc. | | | 800 | | | | 10,600 | |
PRGX Global, Inc. (a) | | | 4,418 | | | | 28,849 | |
Progress Software Corp. | | | 23,567 | | | | 965,304 | |
Q2 Holdings, Inc. (a) | | | 500 | | | | 36,620 | |
QAD, Inc. | | | 16,258 | | | | 702,346 | |
Rapid7, Inc. (a) | | | 400 | | | | 20,900 | |
Rimini Street, Inc. (a) | | | 500 | | | | 2,420 | |
SailPoint Technologies Holding, Inc. (a) | | | 9,378 | | | | 164,771 | |
Science Applications International Corp. | | | 3,316 | | | | 254,470 | |
SecureWorks Corp. (a)(c) | | | 38,018 | | | | 555,443 | |
SPS Commerce, Inc. (a) | | | 1,500 | | | | 152,895 | |
StarTek, Inc. (a) | | | 1,177 | | | | 9,557 | |
Sykes Enterprises, Inc. (a) | | | 21,209 | | | | 525,135 | |
Synchronoss Technologies, Inc. (a) | | | 9,910 | | | | 63,226 | |
Telaria, Inc. (a) | | | 16,930 | | | | 126,975 | |
Telenav, Inc. (a) | | | 11,398 | | | | 85,029 | |
The Hackett Group, Inc. | | | 26,735 | | | | 430,166 | |
The Trade Desk, Inc. - Class A (a) | | | 3,339 | | | | 663,827 | |
Total System Services, Inc. | | | 986 | | | | 121,801 | |
TTEC Holdings, Inc. | | | 5,773 | | | | 229,073 | |
Tucows, Inc. (a) | | | 151 | | | | 8,947 | |
Unisys Corp. (a)(c) | | | 4,819 | | | | 46,744 | |
Varonis Systems, Inc. (a) | | | 1,886 | | | | 117,950 | |
Virtusa Corp. (a) | | | 15,910 | | | | 674,584 | |
Workiva, Inc. (a) | | | 10,242 | | | | 569,865 | |
Yext, Inc. (a) | | | 3,600 | | | | 66,096 | |
| | | | |
| | The accompanying Notes to the Financial Statements are an integral part of these Financial Statements. | | (Continued) |
| | | | | | | | | | | | | | | | |
| | Elements Portfolios | | | | | | Annual Report | | | | | | May 31, 2019 | | |
| | | | |
39
| | |
| Schedule of Investments | | as of May 31, 2019 |
| | | | |
| ELEMENTS U.S. SMALL CAP PORTFOLIO | | | | |
| | | | | | | | |
| | | SHARES | | | FAIR
VALUE | |
| Software & Services - 7.1% (continued) | |
Zix Corp. (a) | | | 87,352 | | | $ | 782,674 | |
Zscaler, Inc. (a) | | | 1,000 | | | | 68,630 | |
| | | | | | | | |
| | | | | | | 25,313,082 | |
| | | | | | | | |
| Technology Hardware & Equipment - 5.7% | |
Acacia Communications, Inc. (a) | | | 800 | | | | 37,280 | |
ADTRAN, Inc. | | | 22,635 | | | | 354,917 | |
Aerohive Networks, Inc. (a) | | | 110,707 | | | | 376,404 | |
Airgain, Inc. (a) | | | 2,858 | | | | 36,640 | |
Anixter International, Inc. (a) | | | 9,737 | | | | 519,566 | |
Arlo Technologies, Inc. (a) | | | 3,798 | | | | 13,027 | |
AstroNova, Inc. | | | 1,300 | | | | 33,293 | |
Avid Technology, Inc. (a) | | | 27,930 | | | | 216,458 | |
AVX Corp. | | | 76,006 | | | | 1,124,129 | |
Badger Meter, Inc. | | | 12,842 | | | | 678,058 | |
Bel Fuse, Inc. | | | 3,166 | | | | 54,709 | |
Belden, Inc. | | | 374 | | | | 19,149 | |
Benchmark Electronics, Inc. | | | 28,477 | | | | 629,057 | |
Calix, Inc. (a) | | | 44,630 | | | | 270,012 | |
Casa Systems, Inc. (a)(c) | | | 9,798 | | | | 55,065 | |
Ciena Corp. (a) | | | 14,495 | | | | 506,455 | |
Clearfield, Inc. (a) | | | 300 | | | | 3,987 | |
Comtech Telecommunications Corp. | | | 19,634 | | | | 415,259 | |
Control4 Corp. (a) | | | 15,212 | | | | 359,916 | |
Corning, Inc. | | | 3,849 | | | | 111,005 | |
Cray, Inc. (a) | | | 5,500 | | | | 192,555 | |
CTS Corp. | | | 26,922 | | | | 712,356 | |
Daktronics, Inc. | | | 92,502 | | | | 574,437 | |
Digi International, Inc. (a) | | | 52,925 | | | | 576,353 | |
Electronics For Imaging, Inc. (a) | | | 6,689 | | | | 245,152 | |
ePlus, Inc. (a) | | | 7,466 | | | | 527,548 | |
Extreme Networks, Inc. (a) | | | 54,941 | | | | 309,318 | |
Fabrinet (a)(b) | | | 19,390 | | | | 826,790 | |
FARO Technologies, Inc. (a) | | | 3,700 | | | | 163,170 | |
Fitbit, Inc. (a) | | | 42,583 | | | | 197,159 | |
Immersion Corp. (a) | | | 51,640 | | | | 389,366 | |
Insight Enterprises, Inc. (a) | | | 25,451 | | | | 1,310,217 | |
Intevac, Inc. (a) | | | 281 | | | | 1,489 | |
Iteris, Inc. (a) | | | 810 | | | | 4,325 | |
KEMET Corp. | | | 2,348 | | | | 37,333 | |
Kimball Electronics, Inc. (a) | | | 22,122 | | | | 315,239 | |
Knowles Corp. (a) | | | 1,059 | | | | 16,658 | |
KVH Industries, Inc. (a) | | | 37,230 | | | | 345,867 | |
Lumentum Holdings, Inc. (a) | | | 1,226 | | | | 49,616 | |
Methode Electronics, Inc. | | | 6,218 | | | | 153,149 | |
MTS Systems Corp. | | | 900 | | | | 48,834 | |
Napco Security Technologies, Inc. (a) | | | 10,213 | | | | 272,891 | |
NETGEAR, Inc. (a) | | | 8,255 | | | | 208,026 | |
NetScout Systems, Inc. (a) | | | 2,320 | | | | 56,863 | |
Novanta, Inc. (a)(b) | | | 15,942 | | | | 1,275,679 | |
OSI Systems, Inc. (a) | | | 1,804 | | | | 186,876 | |
PAR Technology Corp. (a)(c) | | | 1,012 | | | | 28,447 | |
Park Electrochemical Corp. | | | 24,582 | | | | 367,255 | |
PC Connection, Inc. | | | 40,606 | | | | 1,288,834 | |
PCM, Inc. (a) | | | 10,680 | | | | 272,874 | |
Plantronics, Inc. | | | 566 | | | | 23,246 | |
Plexus Corp. (a) | | | 1,700 | | | | 84,201 | |
Quantenna Communications, Inc. (a) | | | 27,621 | | | | 670,085 | |
Ribbon Communications, Inc. (a) | | | 19,290 | | | | 82,368 | |
| | | | | | | | |
| | | SHARES | | | FAIR
VALUE | |
| Technology Hardware & Equipment - 5.7% (continued) | |
Rogers Corp. (a) | | | 1,335 | | | $ | 184,217 | |
Sanmina Corp. (a) | | | 2,361 | | | | 62,779 | |
ScanSource, Inc. (a) | | | 15,203 | | | | 444,080 | |
SYNNEX Corp. | | | 648 | | | | 56,188 | |
Tech Data Corp. (a) | | | 10,357 | | | | 938,862 | |
TTM Technologies, Inc. (a) | | | 121 | | | | 1,032 | |
Vishay Intertechnology, Inc. | | | 21,764 | | | | 331,683 | |
Vishay Precision Group, Inc. (a) | | | 20,662 | | | | 740,113 | |
| | | | | | | | |
| | | | | | | 20,387,916 | |
| | | | | | | | |
| Telecommunication Services - 0.5% | | | | | | |
ATN International, Inc. | | | 100 | | | | 5,850 | |
Bandwidth, Inc. (a) | | | 4,500 | | | | 326,565 | |
Boingo Wireless, Inc. (a)(c) | | | 2,731 | | | | 51,616 | |
Consolidated Communications Holdings, Inc. | | | 11,584 | | | | 46,336 | |
Frontier Communications Corp. (a)(c) | | | 3,000 | | | | 5,640 | |
IDT Corp. - Class B | | | 7,085 | | | | 45,769 | |
Ooma, Inc. (a) | | | 10,100 | | | | 116,655 | |
Shenandoah Telecommunications Co. | | | 285 | | | | 11,460 | |
Spok Holdings, Inc. | | | 18,643 | | | | 288,034 | |
Vonage Holdings Corp. (a)(c) | | | 67,533 | | | | 799,591 | |
| | | | | | | | |
| | | | | | | 1,697,516 | |
| | | | | | | | |
| Transportation - 1.0% | | | | | | |
ArcBest Corp. | | | 6,911 | | | | 173,259 | |
Costamare, Inc. (b) | | | 3,281 | | | | 16,799 | |
Covenant Transportation Group, Inc. (a) | | | 7,072 | | | | 106,221 | |
Daseke, Inc. (a) | | | 300 | | | | 1,296 | |
Echo Global Logistics, Inc. (a) | | | 16,572 | | | | 325,971 | |
Forward Air Corp. | | | 11,242 | | | | 627,641 | |
Heartland Express, Inc. | | | 14,394 | | | | 257,365 | |
Hub Group, Inc. (a) | | | 14,189 | | | | 552,803 | |
Marten Transport Ltd. | | | 20,692 | | | | 364,593 | |
Radiant Logistics, Inc. (a) | | | 93,441 | | | | 594,285 | |
Safe Bulkers, Inc. (a)(b) | | | 28,200 | | | | 39,762 | |
Saia, Inc. (a) | | | 2,434 | | | | 143,606 | |
Universal Logistics Holdings, Inc. | | | 5,188 | | | | 97,898 | |
US Xpress Enterprises, Inc. (a) | | | 24,703 | | | | 133,890 | |
Werner Enterprises, Inc. | | | 4,879 | | | | 136,027 | |
YRC Worldwide, Inc. (a) | | | 4,197 | | | | 17,879 | |
| | | | | | | | |
| | | | | | | 3,589,295 | |
| | | | | | | | |
| Utilities - 0.8% | | | | | | |
ALLETE, Inc. | | | 999 | | | | 81,808 | |
American States Water Co. | | | 3,390 | | | | 247,267 | |
Atlantic Power Corp. (a)(b) | | | 51,714 | | | | 120,494 | |
Black Hills Corp. | | | 980 | | | | 74,676 | |
California Water Service Group | | | 128 | | | | 6,300 | |
Clearway Energy, Inc. - Class A | | | 29,963 | | | | 429,370 | |
Clearway Energy, Inc. - Class C | | | 11,653 | | | | 174,795 | |
Consolidated Water Co., Ltd. (b) | | | 23,890 | | | | 323,709 | |
El Paso Electric Co. | | | 200 | | | | 11,640 | |
Genie Energy Ltd. - Class B | | | 18,928 | | | | 176,787 | |
New Jersey Resources Corp. | | | 1,247 | | | | 59,170 | |
NorthWestern Corp. | | | 170 | | | | 12,060 | |
ONE Gas, Inc. | | | 550 | | | | 48,158 | |
Otter Tail Corp. | | | 4,877 | | | | 242,241 | |
| | | | |
| | The accompanying Notes to the Financial Statements are an integral part of these Financial Statements. | | (Continued) |
| | | | | | | | | | | | | | | | |
| | Elements Portfolios | | | | | | Annual Report | | | | | | May 31, 2019 | | |
| | | | |
40
| | |
| Schedule of Investments | | as of May 31, 2019 |
| | | | |
| ELEMENTS U.S. SMALL CAP PORTFOLIO | | | | |
| | | | | | | | |
| | | SHARES | | | FAIR
VALUE | |
| Utilities - 0.8% (continued) | | | | | | |
Portland General Electric Co. | | | 11,120 | | | $ | 587,803 | |
PPL Corp. | | | 5,364 | | | | 159,633 | |
Pure Cycle Corp. (a) | | | 100 | | | | 942 | |
Spark Energy, Inc. (c) | | | 1,383 | | | | 13,553 | |
Spire, Inc. | | | 100 | | | | 8,332 | |
| | | | | | | | |
| | | | | | | 2,778,738 | |
| | | | | | | | |
TOTAL COMMON STOCKS
(Cost $289,366,001) | | | | | | | 342,130,454 | |
| | | | | | | | |
| | | | | | | | |
| REAL ESTATE INVESTMENT TRUSTS - 1.4% | |
| Diversified Financials - 0.0% (e) | | | | | | |
Annaly Capital Management, Inc. | | | 137 | | | | 1,207 | |
Capstead Mortgage Corp. | | | 117 | | | | 925 | |
Cherry Hill Mortgage Investment Corp. | | | 100 | | | | 1,630 | |
Ready Capital Corp. | | | 200 | | | | 2,914 | |
| | | | | | | | |
| | | | | | | 6,676 | |
| | | | | | | | |
| Real Estate - 1.4% | | | | | | |
Equinix, Inc. | | | 3,550 | | | | 1,724,555 | |
Equity Commonwealth | | | 32,000 | | | | 1,042,240 | |
Federal Realty Investment Trust | | | 938 | | | | 122,625 | |
First Industrial Realty Trust, Inc. | | | 30,000 | | | | 1,041,300 | |
Healthcare Trust of America, Inc. | | | 37,000 | | | | 1,065,230 | |
| | | | | | | | |
| | | | | | | 4,995,950 | |
| | | | | | | | |
TOTAL REAL ESTATE INVESTMENT TRUSTS
(Cost $4,898,865) | | | | 5,002,626 | |
| | | | | | | | |
| | | | | | | | |
RIGHTS - 0.0% (e) | | | | | | | | |
A Schulman, Inc. - Contingent Value
Right (a)(d) | | | 8,996 | | | | 6,927 | |
| | | | | | | | |
TOTAL RIGHTS
(Cost $0) | | | | | | | 6,927 | |
| | | | | | | | |
| | | | | | | | |
SHORT-TERM INVESTMENTS - 2.2% | | | | | | | | |
| Money Market Funds - 0.7% | | | | | | |
Fidelity Investments Money Market Funds - Government Portfolio, 2.27% (f) | | | 472,622 | | | | 472,622 | |
First American Government Obligations Fund, 2.32% (f) | | | 472,622 | | | | 472,622 | |
First American Treasury Obligations Fund, 2.31% (f) | | | 472,622 | | | | 472,622 | |
Morgan Stanley Institutional Liquidity Funds - Government Portfolio - Institutional Class, 2.29% (f) | | | 472,622 | | | | 472,622 | |
Short-Term Investments Trust - Treasury Portfolio - Institutional Class, 2.27% (f) | | | 472,622 | | | | 472,622 | |
| | | | | | | | |
| | | | | | | 2,363,110 | |
| | | | | | | | |
| | | | | | | | |
| | | PRINCIPAL
AMOUNT | | | FAIR
VALUE | |
| U.S. Treasury Bills - 1.5% | | | | | | |
2.270%, 06/25/2019 (g) | | $ | 4,000,000 | | | $ | 3,993,865 | |
2.314%, 06/18/2019 (g)(h) | | | 1,500,000 | | | | 1,498,346 | |
| | | | | | | | |
| | | | | | | 5,492,211 | |
| | | | | | | | |
TOTAL SHORT-TERM INVESTMENTS
(Cost $7,855,321) | | | | | | | 7,855,321 | |
| | | | | | | | |
| | |
| | | SHARES | | | FAIR
VALUE | |
INVESTMENTS PURCHASED WITH THE CASH PROCEEDS FROM SECURITIES LENDING - 4.5% | |
BlackRock Liquidity Funds FedFund Portfolio, 2.30% (f) | | | 1,400,711 | | | | 1,400,711 | |
Morgan Stanley Institutional Liquidity Funds - Prime Portfolio, 2.49% (f) | | | 14,576,750 | | | | 14,583,077 | |
| | | | | | | | |
TOTAL INVESTMENTS PURCHASED WITH THE CASH PROCEEDS FROM SECURITIES LENDING
(Cost $15,983,788) | | | | | | | 15,983,788 | |
| | | | | | | | |
TOTAL INVESTMENTS
(Cost $318,103,975) - 104.2% | | | | | | | 370,979,116 | |
| | | | | | | | |
LIABILITIES IN EXCESS OF OTHER ASSETS - (4.2)% | | | | | | | (15,021,734) | |
| | | | | | | | |
TOTAL NET ASSETS - 100.0% | | | | | | $ | 355,957,382 | |
| | | | | | | | |
Percentages are stated as a percent of net assets.
PLC - Public Limited Company
| (a) | Non-income producing security. |
| (b) | Foreign issued security. Total foreign securities are $11,874,829 which represents 3.3% of net assets. |
| (c) | This security or a portion of this security was out on loan as of May 31, 2019. Total loaned securities had a market value of $15,262,927 as of May 31, 2019. |
| (d) | Value determined using significant unobservable inputs. |
| (f) | Rate shown is the7-day effective yield. |
| (g) | Rate shown is the effective yield based on purchase price. The calculation assumes the security is held to maturity. |
| (h) | This security or a portion of this security was held as collateral for derivative contracts as of May 31, 2019. |
The Global Industry Classification Standard (GICS®) was developed by and/or is the exclusive property of Morgan Stanley Capital International, Inc. (“MSCI”) and Standard & Poor’s Financial Services LLC (“S&P”). GICS is a service mark of MSCI and S&P and has been licensed for use by U.S. Bancorp Fund Services, LLC.
| | | | |
| | The accompanying Notes to the Financial Statements are an integral part of these Financial Statements. | | (Continued) |
| | | | | | | | | | | | | | | | |
| | Elements Portfolios | | | | | | Annual Report | | | | | | May 31, 2019 | | |
| | | | |
41
| | |
| Schedule of Investments | | as of May 31, 2019 |
| | | | |
| ELEMENTS U.S. SMALL CAP PORTFOLIO | | | | |
Open Futures Contracts
| | | | | | | | | | | | |
| | | |
| DESCRIPTION | | NUMBER OF
CONTRACTS
PURCHASED | | | NOTIONAL
VALUE | | | VALUE/
UNREALIZED
DEPRECIATION | |
| FUTURES CONTRACTS PURCHASED | | | | | | | | | | | | |
Russell 2000 E-mini Index, June 2019 Settlement | | | 215 | | | $ | 15,764,875 | | | $ | (932,801 | ) |
| | | | | | | | | | | | |
TOTAL FUTURES CONTRACTS PURCHASED | | | | | | $ | 15,764,875 | | | $ | (932,801 | ) |
| | | | | | | | | | | | |
Total Return Swaps
| | | | | | | | | | | | | | | | | | | | | | | | | | |
| | | | | | | | |
| COUNTERPARTY (a) | | REFERENCE ENTITY | | PAY/RECEIVE
TOTAL
RETURN ON
REFERENCE
ENTITY | | BASE FINANCING
RATE (b) | | TERMINATION
DATE | | | PAYMENT
FREQUENCY | | | NOTIONAL
VALUE | | | NUMBER
OF UNITS | | | UNREALIZED
DEPRECIATION | |
| A | | Altria Group Inc. | | Pay | | 1-Month LIBOR USD | | | 4/2/2029 | | | | Term | | | $ | 495,604 | | | | 10,102 | | | $ | — | |
| A | | Anadarko Petroleum Corp. | | Pay | | 1-Month LIBOR USD | | | 4/2/2029 | | | | Term | | | | 380,842 | | | | 5,412 | | | | — | |
| A | | Corning Inc. | | Pay | | 1-Month LIBOR USD | | | 4/2/2029 | | | | Term | | | | 111,005 | | | | 3,849 | | | | — | |
| A | | Equinix Inc. | | Pay | | 1-Month LIBOR USD | | | 4/2/2029 | | | | Term | | | | 1,724,555 | | | | 3,550 | | | | — | |
| A | | Equity Commonwealth | | Pay | | 1-Month LIBOR USD | | | 4/2/2029 | | | | Term | | | | 1,002,240 | | | | 32,000 | | | | (36,957 | ) |
| A | | Federal Realty Investment Trust | | Pay | | 1-Month LIBOR USD | | | 4/2/2029 | | | | Term | | | | 122,625 | | | | 938 | | | | — | |
| A | | First Industrial Realty Trust | | Pay | | 1-Month LIBOR USD | | | 4/2/2029 | | | | Term | | | | 1,036,200 | | | | 30,000 | | | | (1,954 | ) |
| A | | Halliburton Co. | | Pay | | 1-Month LIBOR USD | | | 4/2/2029 | | | | Term | | | | 159,270 | | | | 7,481 | | | | — | |
| A | | HCA Healthcare Inc. | | Pay | | 1-Month LIBOR USD | | | 4/2/2029 | | | | Term | | | | 258,975 | | | | 2,141 | | | | — | |
| A | | Healthcare Trust of America — Class A | | Pay | | 1-Month LIBOR USD | | | 4/2/2029 | | | | Term | | | | 1,006,030 | | | | 37,000 | | | | (56,145 | ) |
| A | | Leidos Holdings Inc. | | Pay | | 1-Month LIBOR USD | | | 4/2/2029 | | | | Term | | | | 1,236,900 | | | | 19,000 | | | | (190,614 | ) |
| A | | Lyondellbasell Industries — Class A | | Pay | | 1-Month LIBOR USD | | | 4/2/2029 | | | | Term | | | | 173,225 | | | | 2,333 | | | | — | |
| A | | Northrop Grumman Corp. | | Pay | | 1-Month LIBOR USD | | | 4/2/2029 | | | | Term | | | | 73,083 | | | | 241 | | | | — | |
| A | | PPL Corp. | | Pay | | 1-Month LIBOR USD | | | 4/2/2029 | | | | Term | | | | 159,633 | | | | 5,364 | | | | — | |
| A | | Total System Services Inc. | | Pay | | 1-Month LIBOR USD | | | 4/2/2029 | | | | Term | | | | 121,801 | | | | 986 | | | | — | |
| | | | | | | | | | | | | | | | | | | | | | | | | | |
| | | | | | | | | | | | | | | | $ | 8,061,988 | | | | | | | $ | (285,670 | ) |
| | | | | | | | | | | | | | | | | | | | | | | | | | |
(a) See Note 2.
(b) The swaps accrue financing fees according to the relevant base financing rate which resets periodically, plus a fixed spread.
| | | | |
| | The accompanying Notes to the Financial Statements are an integral part of these Financial Statements. | | |
| | | | | | | | | | | | | | | | |
| | Elements Portfolios | | | | | | Annual Report | | | | | | May 31, 2019 | | |
| | | | |
42
| | |
| Schedule of Investments | | as of May 31, 2019 |
| | | | |
| ELEMENTS INTERNATIONAL PORTFOLIO | | | | |
| | | | | | | | |
| | | SHARES | | | FAIR
VALUE | |
COMMON STOCKS - 93.5% | | | | | | | | |
| Australia - 1.9% | | | | | | |
BHP Group Ltd. | | | 29,275 | | | $ | 766,830 | |
Caltex Australia Ltd. | | | 26,724 | | | | 489,228 | |
CIMIC Group Ltd. | | | 28,084 | | | | 879,798 | |
Cochlear Ltd. | | | 597 | | | | 82,881 | |
Flight Centre Travel Group Ltd. | | | 25,779 | | | | 779,513 | |
Harvey Norman Holdings Ltd. | | | 18,846 | | | | 54,385 | |
Macquarie Group Ltd. | | | 1,976 | | | | 164,915 | |
Medibank Private Ltd. | | | 407,998 | | | | 936,820 | |
Origin Energy Ltd. | | | 20,862 | | | | 103,908 | |
Rio Tinto Ltd. | | | 25,246 | | | | 1,756,563 | |
Sonic Healthcare Ltd. | | | 5,689 | | | | 103,200 | |
South32 Ltd. | | | 121,405 | | | | 279,605 | |
Tabcorp Holdings Ltd. | | | 70,209 | | | | 219,654 | |
TPG Telecom Ltd. | | | 5,564 | | | | 24,278 | |
Wesfarmers Ltd. | | | 78,759 | | | | 2,024,225 | |
Woolworths Group Ltd. | | | 136,206 | | | | 2,964,019 | |
| | | | | | | | |
| | | | | | | 11,629,822 | |
| | | | | | | | |
| Austria - 0.3% | | | | | | |
Andritz AG | | | 3,081 | | | | 110,831 | |
OMV AG | | | 14,502 | | | | 681,900 | |
Raiffeisen Bank International AG | | | 13,297 | | | | 309,277 | |
Verbund AG | | | 2,823 | | | | 141,287 | |
voestalpine AG | | | 14,600 | | | | 381,176 | |
| | | | | | | | |
| | | | | | | 1,624,471 | |
| | | | | | | | |
| Belgium - 0.6% | | | | | | |
Colruyt S.A. | | | 779 | | | | 57,890 | |
KBC Group N.V. | | | 1,059 | | | | 69,635 | |
Proximus SADP | | | 27,598 | | | | 800,072 | |
Solvay S.A. - Class A | | | 9,102 | | | | 854,955 | |
UCB S.A. | | | 17,166 | | | | 1,313,248 | |
Umicore S.A. | | | 7,524 | | | | 224,426 | |
| | | | | | | | |
| | | | | | | 3,320,226 | |
| | | | | | | | |
| Bermuda - 0.3% | | | | | | |
Dairy Farm International Holdings Ltd. | | | 174,400 | | | | 1,334,160 | |
Jardine Matheson Holdings Ltd. | | | 9,700 | | | | 622,546 | |
Jardine Strategic Holdings Ltd. | | | 1,700 | | | | 63,478 | |
| | | | | | | | |
| | | | | | | 2,020,184 | |
| | | | | | | | |
| Canada - 5.4% | | | | | | |
Alimentation Couche-Tard, Inc. (a) | | | 63,776 | | | | 3,914,042 | |
Bank of Montreal (a) | | | 19,209 | | | | 1,394,486 | |
Bausch Health Cos., Inc. (a) | | | 3,524 | | | | 73,160 | |
BCE, Inc. | | | 2,100 | | | | 94,559 | |
Cameco Corp. (a) | | | 6,861 | | | | 69,239 | |
Canadian Imperial Bank of Commerce (a) | | | 1,089 | | | | 82,577 | |
Canadian Natural Resources Ltd. (a) | | | 900 | | | | 24,311 | |
Canadian Tire Corp Ltd. | | | 301 | | | | 30,109 | |
Cenovus Energy, Inc. (a) | | | 3,873 | | | | 31,750 | |
CGI, Inc. (a) | | | 22,372 | | | | 1,630,726 | |
CI Financial Corp. (a) | | | 19,218 | | | | 288,498 | |
Empire Co Ltd. (a) | | | 119,165 | | | | 2,747,249 | |
Fairfax Financial Holdings Ltd. (a) | | | 100 | | | | 45,872 | |
George Weston Ltd. (a) | | | 16,878 | | | | 1,260,855 | |
Gildan Activewear, Inc. (a) | | | 25,434 | | | | 917,739 | |
| | | | | | | | |
| | | SHARES | | | FAIR
VALUE | |
| Canada - 5.4% (continued) | | | | | | |
Great-West Lifeco, Inc. | | | 29,513 | | | $ | 668,169 | |
IA Financial Corp, Inc. (a) | | | 2,493 | | | | 93,552 | |
Imperial Oil Ltd. (a) | | | 64,311 | | | | 1,719,115 | |
Intact Financial Corp. (a) | | | 1,900 | | | | 163,361 | |
Kirkland Lake Gold Ltd. (a) | | | 19,061 | | | | 659,294 | |
Loblaw Cos., Ltd. (a) | | | 64,144 | | | | 3,291,675 | |
Magna International, Inc. (a) | | | 48,896 | | | | 2,094,251 | |
Manulife Financial Corp. (a) | | | 85,946 | | | | 1,442,184 | |
Methanex Corp. (a) | | | 12,410 | | | | 516,563 | |
Metro, Inc. (a) | | | 331 | | | | 12,081 | |
National Bank of Canada (a) | | | 788 | | | | 35,395 | |
Power Corp of Canada | | | 35,300 | | | | 744,079 | |
Power Financial Corp. | | | 29,171 | | | | 644,024 | |
Quebecor, Inc. (a) | | | 13,395 | | | | 316,144 | |
Royal Bank of Canada (a) | | | 43,054 | | | | 3,235,739 | |
Saputo, Inc. (a) | | | 11,789 | | | | 392,327 | |
Sun Life Financial, Inc. (a) | | | 29,533 | | | | 1,146,272 | |
Suncor Energy, Inc. (a) | | | 6,544 | | | | 201,656 | |
Teck Resources Ltd. (a) | | | 15,408 | | | | 313,153 | |
TELUS Corp. | | | 3,341 | | | | 123,396 | |
Thomson Reuters Corp. (a) | | | 1,900 | | | | 120,753 | |
West Fraser Timber Co., Ltd. (a) | | | 30,383 | | | | 1,184,434 | |
WSP Global, Inc. (a) | | | 6,571 | | | | 346,587 | |
| | | | | | | | |
| | | | | | | 32,069,376 | |
| | | | | | | | |
| Cayman Islands - 0.4% | | | | | | |
CK Hutchison Holdings Ltd. | | | 15,000 | | | | 141,685 | |
Melco Resorts & Entertainment Ltd. - ADR (b) | | | 5,954 | | | | 114,912 | |
Sands China Ltd. | | | 214,400 | | | | 970,872 | |
WH Group Ltd. (c) (Cost: $1,162,483; Original Acquisition Date: 05/25/2017) | | | 1,523,000 | | | | 1,371,556 | |
| | | | | | | | |
| | | | | | | 2,599,025 | |
| | | | | | | | |
| Denmark - 2.5% | | | | | | |
A.P. Moller - Maersk - Class A | | | 393 | | | | 401,248 | |
A.P. Moller - Maersk - Class B | | | 489 | | | | 525,232 | |
Carlsberg A/S | | | 16,469 | | | | 2,169,522 | |
Coloplast A/S | | | 9,718 | | | | 1,035,955 | |
Danske Bank A/S | | | 364 | | | | 5,990 | |
Demant A/S (a) | | | 8,078 | | | | 270,568 | |
DSV A/S | | | 21,393 | | | | 1,911,855 | |
H. Lundbeck A/S | | | 22,390 | | | | 898,990 | |
ISS A/S | | | 78,789 | | | | 2,217,624 | |
Novo Nordisk A/S | | | 74,623 | | | | 3,513,076 | |
Novozymes A/S | | | 1,403 | | | | 66,029 | |
Pandora A/S | | | 37,773 | | | | 1,403,060 | |
Tryg A/S | | | 7,094 | | | | 222,221 | |
Vestas Wind Systems A/S | | | 2,695 | | | | 220,931 | |
| | | | | | | | |
| | | | | | | 14,862,301 | |
| | | | | | | | |
| Finland - 1.4% | | | | | | |
Elisa OYJ | | | 2,769 | | | | 123,489 | |
Kone OYJ | | | 34,652 | | | | 1,889,518 | |
Metso OYJ | | | 11,890 | | | | 384,542 | |
Neste OYJ | | | 90,387 | | | | 3,055,546 | |
Nokian Renkaat OYJ | | | 22,913 | | | | 655,037 | |
Orion OYJ - Class B | | | 33,250 | | | | 1,087,619 | |
| | | | |
| | The accompanying Notes to the Financial Statements are an integral part of these Financial Statements. | | (Continued) |
| | | | | | | | | | | | | | | | |
| | Elements Portfolios | | | | | | Annual Report | | | | | | May 31, 2019 | | |
| | | | |
43
| | |
| Schedule of Investments | | as of May 31, 2019 |
| | | | |
| ELEMENTS INTERNATIONAL PORTFOLIO | | | | |
| | | | | | | | |
| | | SHARES | | | FAIR
VALUE | |
| Finland - 1.4% (continued) | | | | | | |
Stora Enso OYJ | | | 41,825 | | | $ | 442,113 | |
UPM-Kymmene OYJ | | | 28,722 | | | | 719,390 | |
| | | | | | | | |
| | | | | | | 8,357,254 | |
| | | | | | | | |
| Germany - 6.7% | | | | | | |
adidas AG | | | 12,535 | | | | 3,587,710 | |
Allianz SE | | | 15,393 | | | | 3,419,673 | |
BASF SE | | | 20,855 | | | | 1,375,997 | |
Bayer AG | | | 622 | | | | 36,703 | |
Beiersdorf AG | | | 10,389 | | | | 1,196,012 | |
Brenntag AG | | | 10,002 | | | | 464,606 | |
Carl Zeiss Meditec AG | | | 770 | | | | 72,473 | |
Commerzbank AG | | | 83,473 | | | | 587,676 | |
Continental AG | | | 11,213 | | | | 1,525,749 | |
Covestro AG (c) (Cost: $2,350,276; Original Acquisition Date: 05/26/2017) | | | 38,413 | | | | 1,683,490 | |
Deutsche Boerse AG | | | 1,014 | | | | 140,184 | |
Deutsche Lufthansa AG | | | 24,902 | | | | 474,321 | |
Deutsche Post AG | | | 11,578 | | | | 341,210 | |
Deutsche Telekom AG | | | 227,789 | | | | 3,845,131 | |
E.ON SE | | | 14,445 | | | | 150,868 | |
Evonik Industries AG | | | 28,111 | | | | 738,631 | |
Fresenius SE & Co KGaA | | | 4,654 | | | | 236,098 | |
HeidelbergCement AG | | | 16,283 | | | | 1,210,770 | |
Henkel AG & Co KGaA | | | 34,291 | | | | 2,972,732 | |
Hochtief AG | | | 13,306 | | | | 1,584,596 | |
Hugo Boss AG | | | 22,540 | | | | 1,311,914 | |
Infineon Technologies AG | | | 400 | | | | 7,187 | |
Innogy SE - Class B | | | 8,851 | | | | 367,337 | |
Innogy SE (c) (Cost: $47,713; Original Acquisition Date: 07/27/2018) | | | 1,100 | | | | 49,868 | |
KION Group AG | | | 1,538 | | | | 83,916 | |
Merck KGaA | | | 21,521 | | | | 2,078,699 | |
Metro AG | | | 143,902 | | | | 2,268,338 | |
MTU Aero Engines AG | | | 177 | | | | 38,282 | |
Puma SE | | | 3,089 | | | | 1,796,191 | |
RWE AG | | | 47,468 | | | | 1,185,732 | |
SAP SE | | | 2,000 | | | | 246,713 | |
Siemens AG | | | 16,535 | | | | 1,873,818 | |
Siemens Healthineers AG (c) (Cost: $191,982; Original Acquisition Date: 02/15/2019) | | | 4,678 | | | | 182,128 | |
Telefonica Deutschland Holding AG | | | 420,210 | | | | 1,178,764 | |
Uniper SE | | | 36,616 | | | | 1,027,144 | |
Volkswagen AG | | | 793 | | | | 125,887 | |
Zalando SE (a)(c) (Cost: $606,980; Original Acquisition Date: 09/25/2018) | | | 17,914 | | | | 711,253 | |
| | | | | | | | |
| | | | | | | 40,177,801 | |
| | | | | | | | |
| Hong Kong - 1.5% | | | | | | |
ASM Pacific Technology Ltd. | | | 67,300 | | | | 652,865 | |
BOC Hong Kong Holdings Ltd. | | | 41,500 | | | | 159,340 | |
CLP Holdings Ltd. | | | 67,500 | | | | 763,293 | |
First Pacific Co., Ltd. | | | 2,000 | | | | 811 | |
Galaxy Entertainment Group Ltd. | | | 77,000 | | | | 465,562 | |
HK Electric Investments Ltd. | | | 267,500 | | | | 261,715 | |
HKT Trust & HKT Ltd. | | | 805,000 | | | | 1,269,180 | |
Hong Kong & China Gas Co., Ltd. | | | 108,240 | | | | 239,136 | |
| | | | | | | | |
| | | SHARES | | | FAIR
VALUE | |
| Hong Kong - 1.5% (continued) | | | | | | |
I-CABLE Communications Ltd. (a) | | | 9,655 | | | $ | 120 | |
Kerry Properties Ltd. | | | 262,500 | | | | 996,151 | |
NWS Holdings Ltd. | | | 52,000 | | | | 102,547 | |
PCCW Ltd. | | | 227,000 | | | | 129,143 | |
SJM Holdings Ltd. | | | 26,000 | | | | 28,787 | |
Swire Pacific Ltd. | | | 82,500 | | | | 976,587 | |
Techtronic Industries Co., Ltd. | | | 173,500 | | | | 1,106,569 | |
The Bank of East Asia Ltd | | | 57,000 | | | | 177,408 | |
Vitasoy International Holdings Ltd. (b) | | | 128,000 | | | | 686,570 | |
Yue Yuen Industrial Holdings Ltd. | | | 290,000 | | | | 811,973 | |
| | | | | | | | |
| | | | | | | 8,827,757 | |
| | | | | | | | |
| Israel - 0.3% | | | | | | |
Bank Hapoalim B.M. | | | 94,057 | | | | 682,900 | |
Check Point Software Technologies Ltd. (a) | | | 3,136 | | | | 345,838 | |
Israel Chemicals Ltd. | | | 50,400 | | | | 254,843 | |
Mizrahi Tefahot Bank Ltd. (a) | | | 25,486 | | | | 561,591 | |
Nice Ltd. (a) | | | 1,749 | | | | 242,586 | |
| | | | | | | | |
| | | | | | | 2,087,758 | |
| | | | | | | | |
| Italy - 1.5% | | | | | | |
Assicurazioni Generali S.p.A. | | | 160,965 | | | | 2,825,919 | |
Enel S.p.A. | | | 51,849 | | | | 322,634 | |
Eni S.p.A. | | | 62,125 | | | | 942,497 | |
EXOR N.V. | | | 16,927 | | | | 1,063,126 | |
Intesa Sanpaolo S.p.A. (b) | | | 80,289 | | | | 164,483 | |
Leonardo S.p.A. | | | 120,032 | | | | 1,333,167 | |
Poste Italiane S.p.A. (c) (Cost: $308,893; Original Acquisition Date: 05/19/2017) | | | 31,915 | | | | 310,190 | |
Recordati S.p.A. | | | 6,566 | | | | 271,404 | |
Telecom Italia S.p.A. (a) | | | 1,372,388 | | | | 674,289 | |
Telecom Italia S.p.A. RNC | | | 2,401,356 | | | | 1,122,706 | |
| | | | | | | | |
| | | | | | | 9,030,415 | |
| | | | | | | | |
| Japan - 31.4% | | | | | | |
ABC-Mart, Inc. | | | 16,300 | | | | 1,019,831 | |
Advantest Corp. | | | 2,000 | | | | 47,082 | |
Aeon Co., Ltd. | | | 72,300 | | | | 1,252,648 | |
AGC Inc. | | | 1,800 | | | | 58,054 | |
Air Water, Inc. | | | 28,900 | | | | 431,507 | |
Aisin Seiki Co., Ltd. | | | 23,400 | | | | 778,453 | |
Ajinomoto Co., Inc. | | | 39,900 | | | | 680,065 | |
Alfresa Holdings Corp. | | | 69,500 | | | | 1,754,095 | |
Alps Alpine Co., Ltd. | | | 34,000 | | | | 564,758 | |
Amada Holdings Co., Ltd. | | | 55,900 | | | | 577,751 | |
ANA Holdings, Inc. | | | 14,700 | | | | 493,233 | |
Aozora Bank Ltd. | | | 18,500 | | | | 450,528 | |
Asahi Group Holdings Ltd. | | | 9,500 | | | | 418,784 | |
Asahi Intecc Co., Ltd. | | | 2,200 | | | | 112,878 | |
Asahi Kasei Corp. | | | 119,000 | | | | 1,228,819 | |
Astellas Pharma, Inc. | | | 168,500 | | | | 2,274,085 | |
Bandai Namco Holdings, Inc. | | | 39,700 | | | | 1,956,333 | |
Benesse Holdings, Inc. | | | 35,900 | | | | 837,496 | |
Bridgestone Corp. | | | 56,700 | | | | 2,123,797 | |
Brother Industries Ltd. | | | 87,700 | | | | 1,507,729 | |
Calbee, Inc. | | | 31,600 | | | | 898,150 | |
Canon, Inc. | | | 87,000 | | | | 2,460,712 | |
| | | | |
| | The accompanying Notes to the Financial Statements are an integral part of these Financial Statements. | | (Continued) |
| | | | | | | | | | | | | | | | |
| | Elements Portfolios | | | | | | Annual Report | | | | | | May 31, 2019 | | |
| | | | |
44
| | |
| Schedule of Investments | | as of May 31, 2019 |
| | | | |
| ELEMENTS INTERNATIONAL PORTFOLIO | | | | |
| | | | | | | | |
| | | SHARES | | | FAIR
VALUE | |
| Japan - 31.4% (continued) | | | | | | |
Casio Computer Co., Ltd. | | | 40,200 | | | $ | 449,243 | |
Chugai Pharmaceutical Co., Ltd. | | | 10,700 | | | | 714,880 | |
Coca-Cola Bottlers Japan, Inc. | | | 30,900 | | | | 703,744 | |
CyberAgent, Inc. | | | 3,400 | | | | 131,149 | |
Dai Nippon Printing Co., Ltd. | | | 44,400 | | | | 964,906 | |
Daicel Corp. | | | 55,800 | | | | 476,307 | |
Dai-ichi Life Holdings, Inc. | | | 20,900 | | | | 303,572 | |
Daiichi Sankyo Co., Ltd. | | | 31,100 | | | | 1,508,149 | |
Daikin Industries Ltd. | | | 7,900 | | | | 964,490 | |
Daito Trust Construction Co., Ltd. | | | 6,600 | | | | 860,896 | |
Daiwa House Industry Co., Ltd. | | | 16,900 | | | | 507,008 | |
Denso Corp. | | | 43,700 | | | | 1,694,527 | |
Disco Corp. | | | 2,900 | | | | 405,970 | |
East Japan Railway Co. | | | 100 | | | | 9,514 | |
Eisai Co., Ltd. | | | 17,000 | | | | 1,001,347 | |
FamilyMart UNY Holdings Co., Ltd. | | | 42,400 | | | | 1,023,563 | |
Fast Retailing Co., Ltd. | | | 3,000 | | | | 1,737,738 | |
Fuji Electric Co., Ltd. | | | 19,700 | | | | 659,909 | |
Fujifilm Holdings Corp. | | | 51,000 | | | | 2,446,814 | |
Fujitsu Ltd. | | | 15,200 | | | | 1,031,662 | |
Fukuoka Financial Group, Inc. | | | 21,200 | | | | 364,077 | |
Hakuhodo DY Holdings, Inc. | | | 65,300 | | | | 1,029,229 | |
Hamamatsu Photonics KK | | | 12,100 | | | | 435,473 | |
Hikari Tsushin, Inc. | | | 4,700 | | | | 955,050 | |
Hino Motors Ltd. | | | 69,800 | | | | 554,587 | |
Hirose Electric Co., Ltd. | | | 1,870 | | | | 205,352 | |
Hisamitsu Pharmaceutical Co., Inc. | | | 13,000 | | | | 523,047 | |
Hitachi Chemical Co., Ltd. | | | 36,200 | | | | 970,767 | |
Hitachi Construction Machinery Co., Ltd. | | | 27,000 | | | | 630,619 | |
Hitachi High-Technologies Corp. | | | 32,300 | | | | 1,378,559 | |
Hitachi Ltd. | | | 95,000 | | | | 3,231,394 | |
Hoshizaki Corp. | | | 9,500 | | | | 720,620 | |
Hoya Corp. | | | 5,100 | | | | 355,703 | |
Idemitsu Kosan Co., Ltd. | | | 32,579 | | | | 924,472 | |
Iida Group Holdings Co., Ltd. | | | 59,900 | | | | 951,855 | |
Isetan Mitsukoshi Holdings Ltd. | | | 108,300 | | | | 897,461 | |
Isuzu Motors Ltd. | | | 57,700 | | | | 638,952 | |
Itochu Corp. | | | 69,600 | | | | 1,283,905 | |
J. Front Retailing Co., Ltd. | | | 800 | | | | 8,379 | |
Japan Airlines Co., Ltd. | | | 27,900 | | | | 878,722 | |
Japan Tobacco, Inc. | | | 29,500 | | | | 678,528 | |
JFE Holdings, Inc. | | | 31,600 | | | | 439,743 | |
JSR Corp. | | | 15,300 | | | | 218,138 | |
JTEKT Corp. | | | 40,600 | | | | 431,608 | |
JXTG Holdings, Inc. | | | 142,600 | | | | 682,306 | |
Kajima Corp. | | | 81,200 | | | | 1,115,737 | |
Kamigumi Co., Ltd. | | | 42,700 | | | | 1,010,315 | |
Kaneka Corp. | | | 11,900 | | | | 411,803 | |
Kansai Electric Power Co., Inc. | | | 100 | | | | 1,168 | |
Kansai Paint Co., Ltd. | | | 8,900 | | | | 168,941 | |
Kao Corp. | | | 12,800 | | | | 1,001,652 | |
Kawasaki Heavy Industries Ltd. | | | 34,300 | | | | 770,100 | |
KDDI Corp. | | | 116,200 | | | | 2,990,114 | |
Keio Corp. | | | 700 | | | | 46,768 | |
Keyence Corp. | | | 400 | | | | 227,047 | |
Kikkoman Corp. | | | 23,900 | | | | 993,582 | |
Kirin Holdings Co., Ltd. | | | 62,200 | | | | 1,351,737 | |
| | | | | | | | |
| | | SHARES | | | FAIR
VALUE | |
| Japan - 31.4% (continued) | | | | | | |
Kobayashi Pharmaceutical Co., Ltd. | | | 3,500 | | | $ | 260,970 | |
Kobe Steel Ltd. | | | 22,700 | | | | 140,978 | |
Koito Manufacturing Co., Ltd. | | | 8,300 | | | | 386,029 | |
Komatsu Ltd. | | | 1,400 | | | | 31,220 | |
Konami Holdings Corp. | | | 11,400 | | | | 538,624 | |
Konica Minolta, Inc. | | | 160,200 | | | | 1,416,247 | |
Kose Corp. | | | 5,600 | | | | 887,298 | |
Kurita Water Industries Ltd. | | | 20,400 | | | | 491,151 | |
Kyocera Corp. | | | 19,600 | | | | 1,198,084 | |
Kyowa Hakko Kirin Co., Ltd. | | | 15,000 | | | | 283,763 | |
Kyushu Railway Co. | | | 9,200 | | | | 275,070 | |
Lawson, Inc. | | | 6,800 | | | | 318,147 | |
Lion Corp. | | | 45,600 | | | | 885,363 | |
LIXIL Group Corp. | | | 23,500 | | | | 301,869 | |
M3, Inc. | | | 19,400 | | | | 367,358 | |
Makita Corp. | | | 15,800 | | | | 555,511 | |
Marubeni Corp. | | | 185,200 | | | | 1,167,957 | |
Maruichi Steel Tube Ltd. | | | 13,800 | | | | 362,303 | |
Mazda Motor Corp. | | | 87,100 | | | | 853,197 | |
McDonald’s Holdings Co., Japan Ltd. | | | 11,200 | | | | 510,571 | |
Medipal Holdings Corp. | | | 70,900 | | | | 1,538,189 | |
MEIJI Holdings Co., Ltd. | | | 12,600 | | | | 884,843 | |
Minebea Mitsumi, Inc. | | | 2,500 | | | | 36,820 | |
MISUMI Group, Inc. | | | 36,800 | | | | 869,698 | |
Mitsubishi Chemical Holdings Corp. | | | 196,700 | | | | 1,291,125 | |
Mitsubishi Corp. | | | 82,100 | | | | 2,146,351 | |
Mitsubishi Electric Corp. | | | 78,100 | | | | 980,529 | |
Mitsubishi Gas Chemical Co., Inc. | | | 55,500 | | | | 693,974 | |
Mitsubishi Heavy Industries Ltd. | | | 37,700 | | | | 1,657,040 | |
Mitsubishi Motors Corp. | | | 107,800 | | | | 509,331 | |
Mitsubishi Tanabe Pharma Corp. | | | 58,500 | | | | 692,618 | |
Mitsubishi UFJ Financial Group, Inc. | | | 538,500 | | | | 2,490,125 | |
Mitsui & Co., Ltd. | | | 12,800 | | | | 198,145 | |
Mitsui Chemicals, Inc. | | | 4,000 | | | | 88,110 | |
Mizuho Financial Group, Inc. | | | 135,900 | | | | 192,754 | |
MonotaRO Co., Ltd. | | | 7,500 | | | | 160,638 | |
Nabtesco Corp. | | | 23,100 | | | | 585,147 | |
NEC Corp. | | | 14,100 | | | | 523,716 | |
Nexon Co., Ltd. (a) | | | 29,900 | | | | 446,162 | |
NGK Spark Plug Co., Ltd. | | | 9,900 | | | | 174,585 | |
NH Foods Ltd. | | | 31,500 | | | | 1,276,104 | |
Nikon Corp. | | | 105,100 | | | | 1,441,227 | |
Nintendo Co., Ltd. | | | 500 | | | | 178,563 | |
Nippon Electric Glass Co., Ltd. | | | 4,800 | | | | 115,786 | |
Nippon Express Co., Ltd. | | | 10,400 | | | | 555,678 | |
Nippon Paint Holdings Co., Ltd. | | | 10,800 | | | | 428,552 | |
Nippon Telegraph & Telephone Corp. | | | 63,100 | | | | 2,833,430 | |
Nissan Chemical Corp. | | | 16,600 | | | | 706,187 | |
Nissan Motor Co., Ltd. | | | 263,700 | | | | 1,787,607 | |
Nisshin Seifun Group, Inc. | | | 55,200 | | | | 1,285,699 | |
Nissin Foods Holdings Co., Ltd. | | | 6,500 | | | | 394,685 | |
Nitori Holdings Co., Ltd. | | | 7,400 | | | | 882,619 | |
Nitto Denko Corp. | | | 21,300 | | | | 933,650 | |
Nomura Research Institute Ltd. | | | 14,100 | | | | 690,915 | |
NSK Ltd. | | | 68,000 | | | | 547,815 | |
NTT Data Corp. | | | 58,900 | | | | 706,593 | |
NTT DOCOMO, Inc. | | | 229,600 | | | | 5,287,379 | |
| | | | |
| | The accompanying Notes to the Financial Statements are an integral part of these Financial Statements. | | (Continued) |
| | | | | | | | | | | | | | | | |
| | Elements Portfolios | | | | | | Annual Report | | | | | | May 31, 2019 | | |
| | | | |
45
| | |
| Schedule of Investments | | as of May 31, 2019 |
| | | | |
| ELEMENTS INTERNATIONAL PORTFOLIO | | | | |
| | | | | | | | |
| | | SHARES | | | FAIR
VALUE | |
| Japan - 31.4% (continued) | | | | | | |
Obayashi Corp. | | | 60,600 | | | $ | 558,103 | |
Obic Co., Ltd. | | | 300 | | | | 36,349 | |
Oji Holdings Corp. | | | 80,800 | | | | 420,534 | |
Olympus Corp. | | | 22,800 | | | | 270,364 | |
Omron Corp. | | | 24,600 | | | | 1,171,375 | |
Ono Pharmaceutical Co., Ltd. | | | 1,900 | | | | 33,664 | |
Oracle Corp. | | | 3,500 | | | | 245,144 | |
Oriental Land Co., Ltd. | | | 1,300 | | | | 158,954 | |
Osaka Gas Co., Ltd. | | | 13,200 | | | | 234,729 | |
Otsuka Corp. | | | 42,100 | | | | 1,637,535 | |
Otsuka Holdings Co., Ltd. | | | 16,400 | | | | 551,787 | |
Pan Pacific International Holdings Corp. | | | 300 | | | | 18,604 | |
Panasonic Corp. | | | 107,400 | | | | 857,099 | |
Park24 Co., Ltd. | | | 19,200 | | | | 361,445 | |
Persol Holdings Co., Ltd. | | | 46,800 | | | | 998,492 | |
Pigeon Corp. | | | 8,800 | | | | 335,791 | |
Pola Orbis Holdings, Inc. | | | 6,900 | | | | 191,339 | |
Rakuten, Inc. | | | 54,300 | | | | 568,731 | |
Recruit Holdings Co., Ltd. | | | 53,700 | | | | 1,718,559 | |
Renesas Electronics Corp. (a) | | | 136,200 | | | | 622,147 | |
Resona Holdings, Inc. | | | 34,000 | | | | 144,296 | |
Ricoh Co., Ltd. | | | 119,600 | | | | 1,163,276 | |
Rinnai Corp. | | | 14,900 | | | | 978,988 | |
Rohm Co., Ltd. | | | 4,900 | | | | 304,766 | |
Sankyo Co., Ltd. | | | 14,600 | | | | 559,129 | |
Santen Pharmaceutical Co., Ltd. | | | 13,000 | | | | 187,505 | |
SBI Holdings Inc/Japan | | | 500 | | | | 11,586 | |
Secom Co., Ltd. | | | 12,700 | | | | 1,088,638 | |
Sega Sammy Holdings, Inc. | | | 56,200 | | | | 667,980 | |
Seiko Epson Corp. | | | 52,000 | | | | 767,776 | |
Sekisui Chemical Co., Ltd. | | | 26,500 | | | | 390,537 | |
Sekisui House Ltd. | | | 44,900 | | | | 721,574 | |
Seven & i Holdings Co., Ltd. | | | 35,500 | | | | 1,200,969 | |
SG Holdings Co., Ltd. | | | 14,400 | | | | 390,813 | |
Shimadzu Corp. | | | 22,800 | | | | 572,499 | |
Shimamura Co., Ltd. | | | 20,300 | | | | 1,554,838 | |
Shimano, Inc. | | | 6,300 | | | | 967,397 | |
Shimizu Corp. | | | 2,800 | | | | 22,867 | |
Shin-Etsu Chemical Co., Ltd. | | | 10,900 | | | | 910,001 | |
Shionogi & Co., Ltd. | | | 11,400 | | | | 624,888 | |
Shiseido Co., Ltd. | | | 13,000 | | | | 939,685 | |
Shizuoka Bank Ltd. | | | 9,100 | | | | 72,219 | |
Showa Denko K.K. | | | 10,300 | | | | 283,912 | |
SMC Corp. | | | 1,600 | | | | 528,141 | |
Sohgo Security Services Co., Ltd. | | | 13,800 | | | | 668,574 | |
Sompo Holdings, Inc. | | | 40,900 | | | | 1,551,985 | |
Sony Corp. | | | 26,900 | | | | 1,304,972 | |
Sony Financial Holdings, Inc. | | | 17,000 | | | | 377,760 | |
Stanley Electric Co., Ltd. | | | 21,400 | | | | 490,937 | |
Subaru Corp. | | | 59,900 | | | | 1,394,065 | |
SUMCO Corp. | | | 15,300 | | | | 169,851 | |
Sumitomo Chemical Co., Ltd. | | | 119,200 | | | | 516,994 | |
Sumitomo Corp. | | | 56,300 | | | | 814,899 | |
Sumitomo Dainippon Pharma Co., Ltd. | | | 60,000 | | | | 1,234,162 | |
Sumitomo Electric Industries Ltd. | | | 92,200 | | | | 1,115,861 | |
Sumitomo Heavy Industries Ltd. | | | 29,500 | | | | 937,826 | |
Sumitomo Metal Mining Co., Ltd. | | | 3,500 | | | | 92,438 | |
| | | | | | | | |
| | | SHARES | | | FAIR
VALUE | |
| Japan - 31.4% (continued) | | | | | | |
Sumitomo Mitsui Financial Group, Inc. | | | 11,300 | | | $ | 394,481 | |
Sumitomo Mitsui Trust Holdings, Inc. | | | 22,300 | | | | 820,057 | |
Sumitomo Rubber Industries Ltd. | | | 25,900 | | | | 287,765 | |
Sundrug Co., Ltd. | | | 47,000 | | | | 1,180,584 | |
Suntory Beverage & Food Ltd. | | | 11,100 | | | | 462,479 | |
Suzuken Co., Ltd. | | | 42,200 | | | | 2,605,251 | |
Suzuki Motor Corp. | | | 53,900 | | | | 2,565,553 | |
Sysmex Corp. | | | 11,400 | | | | 792,051 | |
Taiheiyo Cement Corp. | | | 12,800 | | | | 379,163 | |
Taisei Corp. | | | 23,400 | | | | 856,190 | |
Taisho Pharmaceutical Holdings Co., Ltd. | | | 4,700 | | | | 385,577 | |
Taiyo Nippon Sanso Corp. | | | 16,800 | | | | 315,644 | |
Takeda Pharmaceutical Co Ltd. | | | 4,400 | | | | 148,974 | |
Teijin Ltd. | | | 400 | | | | 6,545 | |
Terumo Corp. | | | 9,900 | | | | 282,113 | |
The Bank of Kyoto Ltd. | | | 3,800 | | | | 149,033 | |
THK Co., Ltd. | | | 13,700 | | | | 281,548 | |
Toho Co., Ltd. | | | 15,700 | | | | 675,144 | |
Toho Gas Co., Ltd. | | | 27,700 | | | | 1,081,262 | |
Tokyo Electric Power Co Holdings, Inc. (a) | | | 40,100 | | | | 206,485 | |
Tokyo Electron Ltd. | | | 12,800 | | | | 1,746,985 | |
Tokyo Gas Co., Ltd. | | | 12,700 | | | | 316,138 | |
Toppan Printing Co., Ltd. | | | 49,300 | | | | 721,541 | |
Toray Industries, Inc. | | | 6,100 | | | | 42,044 | |
Toshiba Corp. | | | 44,900 | | | | 1,429,474 | |
Tosoh Corp. | | | 50,200 | | | | 638,357 | |
TOTO Ltd. | | | 24,700 | | | | 921,991 | |
Toyo Seikan Group Holdings Ltd. | | | 43,900 | | | | 832,911 | |
Toyo Suisan Kaisha Ltd. | | | 18,300 | | | | 716,024 | |
Toyoda Gosei Co., Ltd. | | | 34,600 | | | | 606,334 | |
Toyota Industries Corp. | | | 900 | | | | 46,426 | |
Toyota Motor Corp. | | | 35,000 | | | | 2,061,920 | |
Toyota Tsusho Corp. | | | 35,600 | | | | 1,029,908 | |
Trend Micro, Inc. | | | 8,600 | | | | 386,887 | |
Tsuruha Holdings, Inc. | | | 12,400 | | | | 996,669 | |
Unicharm Corp. | | | 30,700 | | | | 923,281 | |
USS Co., Ltd. | | | 17,700 | | | | 336,964 | |
Welcia Holdings Co., Ltd. | | | 28,600 | | | | 1,005,546 | |
Yahoo Japan Corp. | | | 3,800 | | | | 10,976 | |
Yakult Honsha Co., Ltd. | | | 3,600 | | | | 205,306 | |
Yamada Denki Co., Ltd. (b) | | | 213,600 | | | | 1,001,327 | |
Yamaha Corp. | | | 12,200 | | | | 549,965 | |
Yamaha Motor Co., Ltd. | | | 48,700 | | | | 837,245 | |
Yamato Holdings Co., Ltd. | | | 19,200 | | | | 389,971 | |
Yamazaki Baking Co., Ltd. | | | 87,200 | | | | 1,312,446 | |
Yaskawa Electric Corp. | | | 13,900 | | | | 404,051 | |
Yokogawa Electric Corp. | | | 49,400 | | | | 963,246 | |
Yokohama Rubber Co., Ltd. | | | 23,600 | | | | 395,057 | |
ZOZO, Inc. | | | 18,200 | | | | 313,732 | |
| | | | | | | | |
| | | | | | | 188,177,755 | |
| | | | | | | | |
| Luxembourg - 0.3% | | | | | | |
Millicom International Cellular S.A. | | | 4,394 | | | | 246,648 | |
RTL Group S.A. | | | 36,534 | | | | 1,750,112 | |
| | | | | | | | |
| | | | | | | 1,996,760 | |
| | | | | | | | |
| | | | |
| | The accompanying Notes to the Financial Statements are an integral part of these Financial Statements. | | (Continued) |
| | | | | | | | | | | | | | | | |
| | Elements Portfolios | | | | | | Annual Report | | | | | | May 31, 2019 | | |
| | | | |
46
| | |
| Schedule of Investments | | as of May 31, 2019 |
| | | | |
| ELEMENTS INTERNATIONAL PORTFOLIO | | | | |
| | | | | | | | |
| | | SHARES | | | FAIR
VALUE | |
| Netherlands - 3.0% | | | | | | |
Akzo Nobel N.V. | | | 789 | | | $ | 66,566 | |
Altice Europe N.V. - Class B (a) | | | 1,534 | | | | 4,704 | |
ArcelorMittal | | | 5,266 | | | | 78,008 | |
ASML Holding N.V. | | | 192 | | | | 36,314 | |
CNH Industrial N.V. | | | 206,531 | | | | 1,799,212 | |
Heineken Holding N.V. | | | 19,144 | | | | 1,894,874 | |
Heineken N.V. | | | 4,930 | | | | 517,823 | |
Koninklijke Ahold Delhaize N.V. | | | 152,793 | | | | 3,436,916 | |
Koninklijke DSM N.V. | | | 171 | | | | 19,256 | |
Koninklijke KPN N.V. | | | 194,711 | | | | 595,577 | |
Koninklijke Philips N.V. | | | 27,919 | | | | 1,105,681 | |
LyondellBasell Industries N.V. | | | 36,522 | | | | 2,711,759 | |
Randstad Holding N.V. | | | 63,636 | | | | 3,284,420 | |
Unilever N.V. | | | 16,597 | | | | 1,001,238 | |
Wolters Kluwer N.V. | | | 18,370 | | | | 1,283,456 | |
| | | | | | | | |
| | | | | | | 17,835,804 | |
| | | | | | | | |
| Norway - 1.5% | | | | | | |
Adevinta ASA (a) | | | 4,077 | | | | 45,239 | |
Aker BP ASA | | | 14,077 | | | | 380,246 | |
DNB ASA | | | 3,949 | | | | 66,962 | |
Equinor ASA | | | 196,054 | | | | 3,756,785 | |
Mowi ASA (b) | | | 49,965 | | | | 1,158,963 | |
Norsk Hydro ASA | | | 100,520 | | | | 351,694 | |
Orkla ASA | | | 24,132 | | | | 208,901 | |
Schibsted ASA | | | 11,056 | | | | 279,189 | |
Telenor ASA | | | 142,703 | | | | 2,935,034 | |
| | | | | | | | |
| | | | | | | 9,183,013 | |
| | | | | | | | |
| Portugal - 0.3% | | | | | | |
EDP - Energias de Portugal S.A. | | | 13,266 | | | | 48,299 | |
Galp Energia SGPS S.A. | | | 50,833 | | | | 765,508 | |
Jeronimo Martins SGPS S.A. | | | 46,191 | | | | 703,085 | |
| | | | | | | | |
| | | | | | | 1,516,892 | |
| | | | | | | | |
| Puerto Rico - 0.1% | | | | | | |
Popular, Inc. | | | 13,100 | | | | 683,951 | |
| | | | | | | | |
| | | | | | | | |
| Singapore - 1.4% | | | | | | |
CapitaLand Ltd. | | | 259,300 | | | | 607,808 | |
ComfortDelGro Corp Ltd. | | | 1,079,700 | | | | 1,933,510 | |
Jardine Cycle & Carriage Ltd. | | | 45,300 | | | | 1,113,621 | |
Oversea-Chinese Banking Corp Ltd. | | | 29,200 | | | | 224,681 | |
SATS Ltd. | | | 66,100 | | | | 243,960 | |
Singapore Technologies Engineering Ltd. | | | 387,500 | | | | 1,102,952 | |
Venture Corp., Ltd. | | | 133,700 | | | | 1,470,632 | |
Yangzijiang Shipbuilding Holdings Ltd. | | | 1,660,900 | | | | 1,656,426 | |
| | | | | | | | |
| | | | | | | 8,353,590 | |
| | | | | | | | |
| Spain - 2.6% | | | | | | |
ACS Actividades de Construccion y Servicios, S.A. | | | 57,616 | | | | 2,375,108 | |
Banco de Sabadell S.A. | | | 653,404 | | | | 724,991 | |
Banco Santander S.A. | | | 136,154 | | | | 601,120 | |
CaixaBank S.A. | | | 165,709 | | | | 510,569 | |
Enagas S.A. | | | 5,514 | | | | 150,920 | |
Endesa S.A. | | | 25,082 | | | | 625,138 | |
Ferrovial S.A. | | | 53,022 | | | | 1,267,012 | |
Iberdrola S.A. | | | 37,483 | | | | 348,143 | |
| | | | | | | | |
| | | SHARES | | | FAIR
VALUE | |
| Spain - 2.6% (continued) | | | | | | |
Industria de Diseno Textil, S.A. | | | 72,834 | | | $ | 1,956,875 | |
Mapfre S.A. | | | 731,470 | | | | 2,147,513 | |
Naturgy Energy Group S.A. | | | 12,251 | | | | 349,411 | |
Repsol S.A. | | | 164,799 | | | | 2,662,176 | |
Siemens Gamesa Renewable Energy S.A. | | | 27,471 | | | | 428,117 | |
Telefonica S.A. | | | 173,339 | | | | 1,389,996 | |
| | | | | | | | |
| | | | | | | 15,537,089 | |
| | | | | | | | |
| Sweden - 4.1% | | | | | | |
Alfa Laval AB | | | 28,399 | | | | 583,613 | |
Assa Abloy AB | | | 43,200 | | | | 843,380 | |
Atlas Copco AB - Class A | | | 82,266 | | | | 2,219,163 | |
Atlas Copco AB - Class B | | | 113,838 | | | | 2,763,629 | |
Boliden AB | | | 40,571 | | | | 925,062 | |
Boliden AB (a) | | | 40,571 | | | | 18,144 | |
Electrolux AB | | | 26,443 | | | | 575,054 | |
Epiroc AB - Class A | | | 51,501 | | | | 480,243 | |
Epiroc AB - Class B | | | 172,353 | | | | 1,562,485 | |
Essity AB | | | 4,830 | | | | 141,798 | |
Getinge AB | | | 1,004 | | | | 13,626 | |
Hennes & Mauritz AB - Class B | | | 160,156 | | | | 2,397,343 | |
Husqvarna AB | | | 14,335 | | | | 119,861 | |
ICA Gruppen AB | | | 55,235 | | | | 2,202,669 | |
Industrivarden AB | | | 20,230 | | | | 408,805 | |
Sandvik AB | | | 64,950 | | | | 1,003,376 | |
Securitas AB - Class B | | | 92,669 | | | | 1,536,115 | |
Skanska AB | | | 77,088 | | | | 1,263,618 | |
SKF AB | | | 56,668 | | | | 881,107 | |
Swedish Match AB | | | 9,558 | | | | 432,439 | |
Tele2 AB | | | 17,154 | | | | 237,064 | |
Telefonaktiebolaget LM Ericsson | | | 319,850 | | | | 3,084,403 | |
Volvo AB | | | 42,248 | | | | 591,207 | |
| | | | | | | | |
| | | | | | | 24,284,204 | |
| | | | | | | | |
| Switzerland - 7.6% | | | | | | |
ABB Ltd. | | | 6,225 | | | | 114,242 | |
Adecco Group AG | | | 64,552 | | | | 3,480,167 | |
Alcon, Inc. (a) | | | 2,225 | | | | 129,400 | |
Barry Callebaut AG | | | 251 | | | | 493,101 | |
Chocoladefabriken Lindt & Spruengli AG | | | 10 | | | | 749,064 | |
Chocoladefabriken, Lindt & Spruengli AG | | | 198 | | | | 1,297,258 | |
Clariant AG | | | 10,946 | | | | 199,460 | |
Dufry AG | | | 28,782 | | | | 2,357,752 | |
EMS-Chemie Holding AG | | | 1,721 | | | | 1,031,311 | |
Geberit AG | | | 1,090 | | | | 481,070 | |
Kuehne + Nagel International AG | | | 15,692 | | | | 2,086,781 | |
Nestle S.A. | | | 39,473 | | | | 3,924,631 | |
Novartis AG | | | 28,003 | | | | 2,408,048 | |
Pargesa Holding S.A. | | | 9,669 | | | | 716,061 | |
Roche Holding AG | | | 31,361 | | | | 8,240,778 | |
Schindler Holding AG - Registered Shares | | | 13,743 | | | | 2,898,898 | |
Schindler Holding AG - Participation Shares | | | 7,602 | | | | 1,562,538 | |
SGS S.A. | | | 282 | | | | 713,977 | |
Sika AG | | | 7,380 | | | | 1,097,510 | |
Sonova Holding AG | | | 5,151 | | | | 1,147,753 | |
Swatch Group AG | | | 53,224 | | | | 2,570,699 | |
Swatch Group AG - Class B (b) | | | 7,654 | | | | 1,924,107 | |
| | | | |
| | The accompanying Notes to the Financial Statements are an integral part of these Financial Statements. | | (Continued) |
| | | | | | | | | | | | | | | | |
| | Elements Portfolios | | | | | | Annual Report | | | | | | May 31, 2019 | | |
| | | | |
47
| | |
| Schedule of Investments | | as of May 31, 2019 |
| | | | |
| ELEMENTS INTERNATIONAL PORTFOLIO | | | | |
| | | | | | | | |
| | | SHARES | | | FAIR
VALUE | |
| Switzerland - 7.6% (continued) | | | | | | |
Swiss Re AG | | | 2,524 | | | $ | 239,481 | |
Swisscom AG | | | 488 | | | | 233,752 | |
TE Connectivity Ltd. | | | 49,900 | | | | 4,203,077 | |
UBS Group AG | | | 99,110 | | | | 1,143,291 | |
| | | | | | | | |
| | | | | | | 45,444,207 | |
| | | | | | | | |
| United Kingdom - 0.5% | | | | | | |
Coca-Cola European Partners PLC | | | 56,938 | | | | 3,154,365 | |
| | | | | | | | |
| | | | | | | | |
| United States - 17.9% | | | | | | |
Acacia Communications, Inc. (a) | | | 13,400 | | | | 624,440 | |
Altria Group, Inc. | | | 158,136 | | | | 7,758,152 | |
Amgen, Inc. | | | 16,000 | | | | 2,667,200 | |
Anadarko Petroleum Corp. | | | 84,716 | | | | 5,961,465 | |
Celgene Corp. (a)(d) | | | 85,055 | | | | 7,977,309 | |
Cisco Systems, Inc. | | | 57,500 | | | | 2,991,725 | |
Clorox Co. (b) | | | 19,374 | | | | 2,883,045 | |
ConocoPhillips (d) | | | 97,000 | | | | 5,719,120 | |
Corning, Inc. | | | 60,242 | | | | 1,737,379 | |
Deluxe Corp. | | | 14,700 | | | | 546,840 | |
DowDuPont, Inc. (d) | | | 144,000 | | | | 4,394,880 | |
Exxon Mobil Corp. (d) | | | 41,000 | | | | 2,901,570 | |
First American Financial Corp. | | | 24,600 | | | | 1,270,590 | |
Halliburton Co. | | | 117,096 | | | | 2,492,974 | |
HCA Healthcare, Inc. | | | 33,510 | | | | 4,053,370 | |
Home Depot, Inc. (d) | | | 27,000 | | | | 5,125,950 | |
Northrop Grumman Corp. | | | 3,765 | | | | 1,141,736 | |
Oracle Corp. (d) | | | 117,659 | | | | 5,953,545 | |
PACCAR, Inc. | | | 29,297 | | | | 1,928,329 | |
Raytheon Co. (d) | | | 43,000 | | | | 7,503,500 | |
Spirit AeroSystems Holdings, Inc. | | | 29,297 | | | | 2,374,229 | |
SunTrust Banks, Inc. | | | 104,000 | | | | 6,241,040 | |
The PNC Financial Services Group Inc. | | | 47,253 | | | | 6,013,417 | |
Total System Services, Inc. | | | 15,437 | | | | 1,906,933 | |
WABCO Holdings, Inc. (a) | | | 14,176 | | | | 1,855,780 | |
Walgreens Boots Alliance, Inc. (b)(d) | | | 59,500 | | | | 2,935,730 | |
Watts Water Technologies, Inc. (b) | | | 7,300 | | | | 594,147 | |
Wells Fargo & Co. (d) | | | 141,285 | | | | 6,268,815 | |
World Fuel Services Corp. | | | 25,900 | | | | 754,726 | |
Yum China Holdings, Inc. | | | 58,121 | | | | 2,325,421 | |
| | | | | | | | |
| | | | | | | 106,903,357 | |
| | | | | | | | |
| | | | | | | | |
TOTAL COMMON STOCKS
(Cost $560,562,708) | | | | | | | 559,677,377 | |
| | | | | | | | |
| | | | | | | | |
PREFERRED STOCKS - 0.9% | | | | | | | | |
| Germany - 0.9% | | | | | | |
Bayerische Motoren Werke AG | | | 3,649 | | | | 216,055 | |
Fuchs Petrolub SE | | | 38,788 | | | | 1,514,029 | |
Henkel AG & Co KGaA - Preferred | | | 34,338 | | | | 3,137,155 | |
Volkswagen AG - Preferred | | | 3,695 | | | | 575,841 | |
| | | | | | | | |
TOTAL PREFERRED STOCKS
(Cost $6,222,391) | | | | | | | 5,443,080 | |
| | | | | | | | |
| | | | | | | | |
REAL ESTATE INVESTMENTTRUSTS - 2.7% | |
| United States - 2.7% | | | | | | |
Annaly Capital Management, Inc. | | | 269,800 | | | | 2,376,938 | |
Equinix, Inc. | | | 3,012 | | | | 1,463,199 | |
Federal Realty Investment Trust | | | 14,684 | | | | 1,919,639 | |
New Residential Investment Corp. | | | 106,318 | | | | 1,621,349 | |
Physicians Realty Trust (b) | | | 58,000 | | | | 1,061,980 | |
Realty Income Corp. (b) | | | 37,329 | | | | 2,616,017 | |
| | | | | | | | |
| | | SHARES | | | FAIR
VALUE | |
| United States - 2.7% (continued) | | | | | | |
Tanger Factory Outlet Centers, Inc. (b) | | | 59,300 | | | $ | 1,005,729 | |
VEREIT, Inc. | | | 171,300 | | | | 1,521,144 | |
VICI Properties, Inc. | | | 110,900 | | | | 2,459,762 | |
| | | | | | | | |
TOTAL REAL ESTATE INVESTMENT TRUSTS
(Cost $16,373,542) | | | | | | | 16,045,757 | |
| | | | | | | | |
| | | | | | | | |
RIGHTS - 0.0% (e) | | | | | | | | |
| Spain - 0.0% (e) | | | | | | |
Ferrovial S.A. (f) | | | 52,233 | | | | 18,089 | |
| | | | | | | | |
TOTAL RIGHTS
(Cost $18,207) | | | | | | | 18,089 | |
| | | | | | | | |
| | |
| | | PRINCIPAL
AMOUNT | | | FAIR
VALUE | |
U.S. TREASURY BILLS - 2.0% | | | | | | | | |
2.314%, 06/18/2019 (g) | | $ | 12,000,000 | | | | 11,986,768 | |
| | | | | | | | |
TOTAL U.S. TREASURY BILLS
(Cost $11,986,768) | | | | | | | 11,986,768 | |
| | | | | | | | |
| | |
| | | SHARES | | | FAIR
VALUE | |
INVESTMENTS PURCHASED WITH THE CASH PROCEEDS FROM SECURITIES LENDING - 3.6% | |
BlackRock Liquidity Funds FedFund Portfolio, 2.30% (h) | | | 2,141,622 | | | | 2,141,622 | |
Morgan Stanley Institutional Liquidity Funds - Prime Portfolio, 2.49% (h) | | | 19,274,593 | | | | 19,274,593 | |
| | | | | | | | |
TOTAL INVESTMENTS PURCHASED WITH THE CASH PROCEEDS FROM SECURITIES LENDING
(Cost $21,416,215) | | | | | | | 21,416,215 | |
| | | | | | | | |
TOTAL INVESTMENTS
(Cost $616,579,831) - 102.7% | | | | | | | 614,587,286 | |
| | | | | | | | |
LIABILITIES IN EXCESS OF OTHER ASSETS - (2.7)% | | | | | | | (16,178,129) | |
| | | | | | | | |
TOTAL NET ASSETS - 100.0% | | | | | | $ | 598,409,157 | |
| | | | | | | | |
Percentages are stated as a percent of net assets.
ADR - American Depository Receipt
PLC - Public Limited Company
| (a) | Non-income producing security. |
| (b) | This security or a portion of this security was out on loan as of May 31, 2019. Total loaned securities had a market value of $13,118,025 as of May 31, 2019. |
| (c) | Although security is restricted as to resale, the Portfolio’s Adviser has determined this security to be liquid based upon procedures approved by the Board of Trustees. The aggregate value of these securities at May 31, 2019 was $4,308,485, which represents 0.7% of net assets. |
| (d) | This security or a portion of this security was held as collateral for derivative contracts as of May 31, 2019. |
| (f) | Value determined using significant unobservable inputs. |
| (g) | Rate shown is the effective yield based on purchase price. The calculation assumes the security is held to maturity. |
| (h) | Rate shown is the7-day effective yield. |
| | | | |
| | The accompanying Notes to the Financial Statements are an integral part of these Financial Statements. | | (Continued) |
| | | | | | | | | | | | | | | | |
| | Elements Portfolios | | | | | | Annual Report | | | | | | May 31, 2019 | | |
| | | | |
48
| | |
| Schedule of Investments | | as of May 31, 2019 |
| | | | |
| ELEMENTS INTERNATIONAL PORTFOLIO | | | | |
Open Futures Contracts
| | | | | | | | | | | �� | |
| | | |
| DESCRIPTION | | NUMBER OF
CONTRACTS
PURCHASED | | | NOTIONAL
VALUE | | | VALUE/
UNREALIZED
DEPRECIATION | |
| FUTURES CONTRACTS PURCHASED | | | | | | | | | |
Australian Dollar, June 2019 Settlement | | | 211 | | | $ | 14,649,730 | | | $ | (312,594 | ) |
British Pound, June 2019 Settlement | | | 990 | | | | 78,228,563 | | | | (3,849,881 | ) |
Euro FX, June 2019 Settlement | | | 425 | | | | 59,430,938 | | | | (1,107,649 | ) |
Mini MSCI EAFE Index, June 2019 Settlement | | | 92 | | | | 8,362,340 | | | | (447,978 | ) |
| | | | | | | | | | | | |
TOTAL FUTURES CONTRACTS PURCHASED | | | | | | $ | 160,671,571 | | | $ | (5,718,102 | ) |
| | | | | | | | | | | | |
Total Return Swaps
| | | | | | | | | | | | | | | | | | | | | | | | | | |
| | | | | | | | |
| COUNTERPARTY (a) | | REFERENCE ENTITY | | PAY/RECEIVE
TOTAL
RETURN ON
REFERENCE
ENTITY | | BASE FINANCING
RATE (b) | | TERMINATION
DATE | | | PAYMENT
FREQUENCY | | | NOTIONAL
VALUE | | | NUMBER OF
UNITS | | | UNREALIZED
APPRECIATION
(DEPRECIATION) | |
| | | | | | | | | | | | | | | | | | | | | | |
| A | | Acacia Communications, Inc. | | Pay | | 1-Month LIBOR USD | | | 4/2/2029 | | | | Term | | | $ | 642,530 | | | | 13,400 | | | $ | 18,513 | |
| C | | Accor S.A. | | Receive | | 1-Month LIBOR EUR | | | 9/20/2021 | | | | Term | | | | 131,798 | | | | 3,880 | | | | (17,425 | ) |
| A | | AGL Energy Ltd. | | Receive | | 1-Month Bank Bill Swap Rate | | | 6/28/2024 | | | | Term | | | | 2,368,439 | | | | 87,720 | | | | 131,466 | |
| C | | AIB Group PLC | | Receive | | 1-Month LIBOR EUR | | | 9/20/2021 | | | | Term | | | | 53,695 | | | | 14,555 | | | | (7,150 | ) |
| C | | Air Liquide S.A. | | Receive | | 1-Month LIBOR EUR | | | 9/20/2021 | | | | Term | | | | 1,102,420 | | | | 11,476 | | | | 82,331 | |
| B | | Air Liquide S.A. | | Receive | | 1-Month LIBOR EUR | | | 3/18/2026 | | | | Term | | | | 228,128 | | | | 2,265 | | | | 3,017 | |
| C | | Alstom | | Receive | | 1-Month LIBOR EUR | | | 9/20/2021 | | | | Term | | | | 19,043 | | | | 580 | | | | 2,718 | |
| A | | Altria Group, Inc. | | Pay | | 1-Month LIBOR USD | | | 4/2/2029 | | | | Term | | | | 7,758,152 | | | | 158,136 | | | | — | |
| A | | Amcor Limited | | Receive | | 1-Month Bank Bill Swap Rate | | | 6/28/2024 | | | | Term | | | | 227,273 | | | | 10,241 | | | | 8,912 | |
| A | | Amgen, Inc. | | Pay | | 1-Month LIBOR USD | | | 4/2/2029 | | | | Term | | | | 2,919,520 | | | | 16,000 | | | | 237,985 | |
| C | | Amundi S.A. | | Receive | | 1-Month LIBOR EUR | | | 9/20/2021 | | | | Term | | | | 13,519 | | | | 300 | | | | 3,424 | |
| A | | Anadarko Petroleum Corp. | | Pay | | 1-Month LIBOR USD | | | 4/2/2029 | | | | Term | | | | 5,961,465 | | | | 84,716 | | | | — | |
| C | | Anglo American PLC | | Receive | | 1-Month LIBOR GBP | | | 9/20/2021 | | | | Term | | | | 32,460 | | | | 2,048 | | | | (2,515 | ) |
| B | | Anglo American PLC | | Receive | | 1-Month LIBOR GBP | | | 3/18/2026 | | | | Term | | | | 972,540 | | | | 62,114 | | | | (70,385 | ) |
| A | | Annaly Capital Management, Inc. | | Pay | | 1-Month LIBOR USD | | | 4/2/2029 | | | | Term | | | | 2,509,140 | | | | 269,800 | | | | 135,106 | |
| C | | Arkema S.A. | | Receive | | 1-Month LIBOR EUR | | | 9/20/2021 | | | | Term | | | | 174,673 | | | | 2,494 | | | | (2,805 | ) |
| B | | Arkema S.A. | | Receive | | 1-Month LIBOR EUR | | | 3/18/2026 | | | | Term | | | | 498,910 | | | | 6,196 | | | | (88,207 | ) |
| C | | Associated British Foods PLC | | Receive | | 1-Month LIBOR GBP | | | 9/20/2021 | | | | Term | | | | 648,569 | | | | 35,109 | | | | 55,718 | |
| C | | Atos SE | | Receive | | 1-Month LIBOR EUR | | | 9/20/2021 | | | | Term | | | | 493,184 | | | | 9,625 | | | | 118,016 | |
| B | | Atos SE | | Receive | | 1-Month LIBOR EUR | | | 3/18/2026 | | | | Term | | | | 371,358 | | | | 6,324 | | | | 18,430 | |
| A | | Aurizon Holdings Ltd. | | Receive | | 1-Month Bank Bill Swap Rate | | | 6/28/2024 | | | | Term | | | | 13,359 | | | | 2,037 | | | | 878 | |
| B | | AXA S.A. | | Receive | | 1-Month LIBOR EUR | | | 3/18/2026 | | | | Term | | | | 1,197,347 | | | | 58,658 | | | | 26,658 | |
| C | | BAE Systems PLC | | Receive | | 1-Month LIBOR GBP | | | 9/20/2021 | | | | Term | | | | 18,538 | | | | 4,705 | | | | (2,368 | ) |
| C | | Bank of Ireland Group PLC | | Receive | | 1-Month LIBOR EUR | | | 9/20/2021 | | | | Term | | | | 79,126 | | | | 15,796 | | | | (11,529 | ) |
| C | | Barclays PLC | | Receive | | 1-Month LIBOR GBP | | | 9/20/2021 | | | | Term | | | | 166,240 | | | | 136,559 | | | | (4,020 | ) |
| C | | Barratt Developments PLC | | Receive | | 1-Month LIBOR GBP | | | 9/20/2021 | | | | Term | | | | 539,034 | | | | 120,648 | | | | 1,492 | |
| B | | Barratt Developments PLC | | Receive | | 1-Month LIBOR GBP | | | 3/18/2026 | | | | Term | | | | 706,620 | | | | 145,665 | | | | (87,074 | ) |
| | | | |
| | The accompanying Notes to the Financial Statements are an integral part of these Financial Statements. | | (Continued) |
| | | | | | | | | | | | | | | | |
| | Elements Portfolios | | | | | | Annual Report | | | | | | May 31, 2019 | | |
| | | | |
49
| | |
| Schedule of Investments | | as of May 31, 2019 |
| | | | |
| ELEMENTS INTERNATIONAL PORTFOLIO | | | | |
| | | | | | | | | | | | | | | | | | | | | | | | | | |
| | | | | | | | |
| COUNTERPARTY (a) | | REFERENCE ENTITY | | PAY/RECEIVE
TOTAL
RETURN ON
REFERENCE
ENTITY | | BASE FINANCING
RATE (b) | | TERMINATION
DATE | | | PAYMENT
FREQUENCY | | | NOTIONAL
VALUE | | | NUMBER OF
UNITS | | | UNREALIZED
APPRECIATION
(DEPRECIATION) | |
| | | | | | | | | | | | | | | | | | | | | | |
| A | | Bendigo and Adelaide Bank | | Receive | | 1-Month Bank Bill Swap Rate | | | 6/28/2024 | | | | Term | | | $ | 461,501 | | | | 32,379 | | | $ | 36,822 | |
| A | | BHP Billiton Ltd. | | Receive | | 1-Month Bank Bill Swap Rate | | | 6/28/2024 | | | | Term | | | | 3,869,215 | | | | 77,234 | | | | 252,074 | |
| C | | BHP Billiton PLC | | Receive | | 1-Month LIBOR GBP | | | 9/20/2021 | | | | Term | | | | 427,014 | | | | 34,418 | | | | 141,933 | |
| B | | BHP Billiton PLC | | Receive | | 1-Month LIBOR GBP | | | 3/18/2026 | | | | Term | | | | 797,554 | | | | 57,010 | | | | 8,179 | |
| C | | BioMerieux | | Receive | | 1-Month LIBOR EUR | | | 9/20/2021 | | | | Term | | | | 69,458 | | | | 1,274 | | | | 17,415 | |
| A | | Bluescope Steel Ltd. | | Receive | | 1-Month Bank Bill Swap Rate | | | 6/28/2024 | | | | Term | | | | 3,108,100 | | | | 148,475 | | | | (425,836 | ) |
| C | | BNP Paribas | | Receive | | 1-Month LIBOR EUR | | | 9/20/2021 | | | | Term | | | | 43,076 | | | | 1,187 | | | | 3,839 | |
| C | | Bollore | | Receive | | 1-Month LIBOR EUR | | | 9/20/2021 | | | | Term | | | | 1,340,148 | | | | 401,289 | | | | 139,278 | |
| B | | Bollore | | Receive | | 1-Month LIBOR EUR | | | 3/18/2026 | | | | Term | | | | 306,247 | | | | 87,800 | | | | 14,116 | |
| C | | Bouygues S.A. | | Receive | | 1-Month LIBOR EUR | | | 9/20/2021 | | | | Term | | | | 897,944 | | | | 31,419 | | | | 22,611 | |
| B | | Bouygues S.A. | | Receive | | 1-Month LIBOR EUR | | | 3/18/2026 | | | | Term | | | | 1,189,002 | | | | 40,515 | | | | (1,020 | ) |
| C | | BP PLC | | Receive | | 1-Month LIBOR GBP | | | 9/20/2021 | | | | Term | | | | 1,764,979 | | | | 433,823 | | | | 230,859 | |
| A | | Brambles Ltd. | | Receive | | 1-Month Bank Bill Swap Rate | | | 6/28/2024 | | | | Term | | | | 15,958 | | | | 913 | | | | (12 | ) |
| C | | British American Tobacco PLC | | Receive | | 1-Month LIBOR GBP | | | 9/20/2021 | | | | Term | | | | 49,157 | | | | 2,020 | | | | (7,658 | ) |
| C | | Bunzl PLC | | Receive | | 1-Month LIBOR GBP | | | 9/20/2021 | | | | Term | | | | 410,631 | | | | 21,843 | | | | (64,060 | ) |
| C | | Burberry Group PLC | | Receive | | 1-Month LIBOR GBP | | | 9/20/2021 | | | | Term | | | | 876,812 | | | | 59,606 | | | | (127,578 | ) |
| A | | Caltex Australia Ltd. | | Receive | | 1-Month Bank Bill Swap Rate | | | 6/28/2024 | | | | Term | | | | 1,769,034 | | | | 42,989 | | | | (50,295 | ) |
| C | | Capgemini SE | | Receive | | 1-Month LIBOR EUR | | | 9/20/2021 | | | | Term | | | | 38,648 | | | | 470 | | | | 4,318 | |
| C | | Carnival PLC | | Receive | | 1-Month LIBOR GBP | | | 9/20/2021 | | | | Term | | | | 351,137 | | | | 10,894 | | | | (16,784 | ) |
| C | | Carrefour S.A. | | Receive | | 1-Month LIBOR EUR | | | 9/20/2021 | | | | Term | | | | 1,186,078 | | | | 83,676 | | | | 93,713 | |
| B | | Carrefour S.A. | | Receive | | 1-Month LIBOR EUR | | | 3/18/2026 | | | | Term | | | | 1,609,076 | | | | 105,910 | | | | (16,456 | ) |
| C | | Casino Guichard Perrachon | | Receive | | 1-Month LIBOR EUR | | | 9/20/2021 | | | | Term | | | | 131,596 | | | | 4,112 | | | | 25 | |
| A | | Celgene Corp. | | Pay | | 1-Month LIBOR USD | | | 4/2/2029 | | | | Term | | | | 8,023,238 | | | | 85,055 | | | | 75,703 | |
| B | | Christian Dior SE | | Receive | | 1-Month LIBOR EUR | | | 3/18/2026 | | | | Term | | | | 2,214,796 | | | | 6,025 | | | | 147,946 | |
| A | | Cimic Group Ltd. | | Receive | | 1-Month Bank Bill Swap Rate | | | 6/28/2024 | | | | Term | | | | 3,319,187 | | | | 50,228 | | | | (30,985 | ) |
| A | | Cisco Systems, Inc. | | Pay | | 1-Month LIBOR USD | | | 4/2/2029 | | | | Term | | | | 3,237,825 | | | | 57,500 | | | | 255,932 | |
| A | | Clorox Co. | | Pay | | 1-Month LIBOR USD | | | 4/2/2029 | | | | Term | | | | 2,979,527 | | | | 19,374 | | | | 88,940 | |
| A | | Coca-Cola Amatil Ltd. | | Receive | | 1-Month Bank Bill Swap Rate | | | 6/28/2024 | | | | Term | | | | 166,808 | | | | 13,985 | | | | 13,940 | |
| C | | Coca-Cola HBC AG | | Receive | | 1-Month LIBOR GBP | | | 9/20/2021 | | | | Term | | | | 60,226 | | | | 3,119 | | | | 15,749 | |
| B | | Coca-Cola HBC AG | | Receive | | 1-Month LIBOR GBP | | | 3/18/2026 | | | | Term | | | | 409,836 | | | | 19,631 | | | | 51,067 | |
| A | | Coles Group Ltd. | | Receive | | 1-Month Bank Bill Swap Rate | | | 6/28/2024 | | | | Term | | | | 1,982,634 | | | | 109,866 | | | | (7,284 | ) |
| C | | Compagnie De Saint Gobain | | Receive | | 1-Month LIBOR EUR | | | 9/20/2021 | | | | Term | | | | 387,455 | | | | 13,924 | | | | 20,610 | |
| C | | Compass Group Plc | | Receive | | 1-Month LIBOR GBP | | | 9/20/2021 | | | | Term | | | | 103,500 | | | | 7,802 | | | | 11,637 | |
| A | | ConocoPhillips | | Pay | | 1-Month LIBOR USD | | | 4/2/2029 | | | | Term | | | | 6,380,660 | | | | 97,000 | | | | 651,330 | |
| A | | Corning, Inc. | | Pay | | 1-Month LIBOR USD | | | 4/2/2029 | | | | Term | | | | 1,737,379 | | | | 60,242 | | | | — | |
| A | | Crown Resorts Ltd. | | Receive | | 1-Month Bank Bill Swap Rate | | | 6/28/2024 | | | | Term | | | | 166,026 | | | | 9,784 | | | | 6,384 | |
| C | | Danone | | Receive | | 1-Month LIBOR EUR | | | 9/20/2021 | | | | Term | | | | 2,063,532 | | | | 35,648 | | | | 332,248 | |
| C | | Dassault Aviation S.A. | | Receive | | 1-Month LIBOR EUR | | | 9/20/2021 | | | | Term | | | | 436,669 | | | | 371 | | | | (74,596 | ) |
| B | | Dassault Aviation S.A. | | Receive | | 1-Month LIBOR EUR | | | 3/18/2026 | | | | Term | | | | 597,501 | | | | 474 | | | | (144,951 | ) |
| C | | Dassault Systemes S.A. | | Receive | | 1-Month LIBOR EUR | | | 9/20/2021 | | | | Term | | | | 58,754 | | | | 604 | | | | 16,678 | |
| A | | Deluxe Corp. | | Pay | | 1-Month LIBOR USD | | | 4/2/2029 | | | | Term | | | | 591,969 | | | | 14,700 | | | | 45,518 | |
| | | | |
| | The accompanying Notes to the Financial Statements are an integral part of these Financial Statements. | | (Continued) |
| | | | | | | | | | | | | | | | |
| | Elements Portfolios | | | | | | Annual Report | | | | | | May 31, 2019 | | |
| | | | |
50
| | |
| Schedule of Investments | | as of May 31, 2019 |
| | | | |
| ELEMENTS INTERNATIONAL PORTFOLIO | | | | |
| | | | | | | | | | | | | | | | | | | | | | | | | | |
| | | | | | | | |
| COUNTERPARTY (a) | | REFERENCE ENTITY | | PAY/RECEIVE
TOTAL
RETURN ON
REFERENCE
ENTITY | | BASE FINANCING
RATE (b) | | TERMINATION
DATE | | | PAYMENT
FREQUENCY | | | NOTIONAL
VALUE | | | NUMBER OF
UNITS | | | UNREALIZED
APPRECIATION
(DEPRECIATION) | |
| | | | | | | | | | | | | | | | | | | | | | |
| C | | Diageo PLC | | Receive | | 1-Month LIBOR GBP | | | 9/20/2021 | | | | Term | | | $ | 48,701 | | | | 2,261 | | | $ | 17,665 | |
| C | | Direct Line Insurance Group PLC | | Receive | | 1-Month LIBOR GBP | | | 9/20/2021 | | | | Term | | | | 446,329 | | | | 174,942 | | | | 27,379 | |
| B | | Direct Line Insurance Group PLC | | Receive | | 1-Month LIBOR GBP | | | 3/18/2026 | | | | Term | | | | 219,717 | | | | 76,197 | | | | (25,721 | ) |
| A | | DowDuPont, Inc. | | Pay | | 1-Month LIBOR USD | | | 4/2/2029 | | | | Term | | | | 5,644,800 | | | | 144,000 | | | | 1,246,901 | |
| C | | Eiffage S.A. | | Receive | | 1-Month LIBOR EUR | | | 9/20/2021 | | | | Term | | | | 821,293 | | | | 10,598 | | | | 12,287 | |
| B | | Eiffage S.A. | | Receive | | 1-Month LIBOR EUR | | | 3/18/2026 | | | | Term | | | | 1,495,359 | | | | 19,054 | | | | (1,850 | ) |
| C | | Engie S.A. | | Receive | | 1-Month LIBOR EUR | | | 9/20/2021 | | | | Term | | | | 762,773 | | | | 69,243 | | | | 63,626 | |
| B | | Engie S.A. | | Receive | | 1-Month LIBOR EUR | | | 3/18/2026 | | | | Term | | | | 441,668 | | | | 36,543 | | | | (17,135 | ) |
| A | | Equinix, Inc. | | Pay | | 1-Month LIBOR USD | | | 4/2/2029 | | | | Term | | | | 1,463,199 | | | | 3,012 | | | | — | |
| C | | Evraz PLC | | Receive | | 1-Month LIBOR GBP | | | 9/20/2021 | | | | Term | | | | 773,075 | | | | 160,617 | | | | (43,060 | ) |
| A | | Exxon Mobil Corp. | | Pay | | 1-Month LIBOR USD | | | 4/2/2029 | | | | Term | | | | 3,338,630 | | | | 41,000 | | | | 413,753 | |
| C | | Faurecia | | Receive | | 1-Month LIBOR EUR | | | 9/20/2021 | | | | Term | | | | 1,348,825 | | | | 39,809 | | | | (165,568 | ) |
| A | | Federal Realty Investment Trust | | Pay | | 1-Month LIBOR USD | | | 4/2/2029 | | | | Term | | | | 1,919,639 | | | | 14,684 | | | | — | |
| C | | Ferguson PLC | | Receive | | 1-Month LIBOR GBP | | | 9/20/2021 | | | | Term | | | | 991,194 | | | | 23,935 | | | | (24,689 | ) |
| B | | Ferguson PLC | | Receive | | 1-Month LIBOR GBP | | | 3/18/2026 | | | | Term | | | | 614,553 | | | | 14,553 | | | | (33,216 | ) |
| A | | First American Financial Corp. | | Pay | | 1-Month LIBOR USD | | | 4/2/2029 | | | | Term | | | | 1,362,348 | | | | 24,600 | | | | 92,654 | |
| A | | Flight Centre Travel Group Ltd. | | Receive | | 1-Month Bank Bill Swap Rate | | | 6/28/2024 | | | | Term | | | | 819,991 | | | | 13,112 | | | | 16,829 | |
| A | | Fortescue Metals Group Ltd. | | Receive | | 1-Month Bank Bill Swap Rate | | | 6/28/2024 | | | | Term | | | | 367,666 | | | | 71,682 | | | | 278,810 | |
| C | | G4S PLC | | Receive | | 1-Month LIBOR GBP | | | 9/20/2021 | | | | Term | | | | 237,134 | | | | 147,959 | | | | 22,291 | |
| B | | G4S PLC | | Receive | | 1-Month LIBOR GBP | | | 3/18/2026 | | | | Term | | | | 18,158 | | | | 11,798 | | | | 3,032 | |
| C | | Glaxosmithkline PLC | | Receive | | 1-Month LIBOR GBP | | | 9/20/2021 | | | | Term | | | | 305,644 | | | | 25,590 | | | | 10,430 | |
| B | | Glaxosmithkline PLC | | Receive | | 1-Month LIBOR GBP | | | 3/18/2026 | | | | Term | | | | 80,843 | | | | 6,756 | | | | 2,498 | |
| C | | Glencore PLC | | Receive | | 1-Month LIBOR GBP | | | 9/20/2021 | | | | Term | | | | 1,235,038 | | | | 505,694 | | | | (307,333 | ) |
| A | | Halliburton Co. | | Pay | | 1-Month LIBOR USD | | | 4/2/2029 | | | | Term | | | | 2,492,974 | | | | 117,096 | | | | — | |
| C | | Hargreaves Lansdown PLC | | Receive | | 1-Month LIBOR GBP | | | 9/20/2021 | | | | Term | | | | 8,898 | | | | 670 | | | | 4,927 | |
| B | | Hargreaves Lansdown PLC | | Receive | | 1-Month LIBOR GBP | | | 3/18/2026 | | | | Term | | | | 34,375 | | | | 2,400 | | | | 13,670 | |
| A | | Harvey Norman Holdings Ltd. | | Receive | | 1-Month Bank Bill Swap Rate | | | 6/28/2024 | | | | Term | | | | 90,656 | | | | 19,896 | | | | 15,114 | |
| A | | HCA Healthcare, Inc. | | Pay | | 1-Month LIBOR USD | | | 4/2/2029 | | | | Term | | | | 4,053,370 | | | | 33,510 | | | | — | |
| C | | Hermes International | | Receive | | 1-Month LIBOR EUR | | | 9/20/2021 | | | | Term | | | | 661,144 | | | | 1,430 | | | | 126,921 | |
| B | | Hermes International | | Receive | | 1-Month LIBOR EUR | | | 3/18/2026 | | | | Term | | | | 817,009 | | | | 1,568 | | | | 21,876 | |
| A | | Home Depot, Inc. | | Pay | | 1-Month LIBOR USD | | | 4/2/2029 | | | | Term | | | | 5,576,850 | | | | 27,000 | | | | 467,834 | |
| C | | Imerys S.A. | | Receive | | 1-Month LIBOR EUR | | | 9/20/2021 | | | | Term | | | | 412,819 | | | | 9,977 | | | | (61,992 | ) |
| B | | Imerys S.A. | | Receive | | 1-Month LIBOR EUR | | | 3/18/2026 | | | | Term | | | | 99,683 | | | | 2,234 | | | | (22,959 | ) |
| C | | Imperial Brands PLC | | Receive | | 1-Month LIBOR GBP | | | 9/20/2021 | | | | Term | | | | 165,745 | | | | 8,991 | | | | (11,888 | ) |
| A | | Incitec Pivot Ltd. | | Receive | | 1-Month Bank Bill Swap Rate | | | 6/28/2024 | | | | Term | | | | 36,919 | | | | 7,778 | | | | (136 | ) |
| C | | Ipsen | | Receive | | 1-Month LIBOR EUR | | | 9/20/2021 | | | | Term | | | | 292,850 | | | | 2,988 | | | | (5,837 | ) |
| C | | ITV PLC | | Receive | | 1-Month LIBOR GBP | | | 9/20/2021 | | | | Term | | | | 108,932 | | | | 108,396 | | | | (20,843 | ) |
| C | | Jcdecaux S.A. | | Receive | | 1-Month LIBOR EUR | | | 9/20/2021 | | | | Term | | | | 42,577 | | | | 1,857 | | | | (256 | ) |
| | | | |
| | The accompanying Notes to the Financial Statements are an integral part of these Financial Statements. | | (Continued) |
| | | | | | | | | | | | | | | | |
| | Elements Portfolios | | | | | | Annual Report | | | | | | May 31, 2019 | | |
| | | | |
51
| | |
| Schedule of Investments | | as of May 31, 2019 |
| | | | |
| ELEMENTS INTERNATIONAL PORTFOLIO | | | | |
| | | | | | | | | | | | | | | | | | | | | | | | | | |
| | | | | | | | |
| COUNTERPARTY (a) | | REFERENCE ENTITY | | PAY/RECEIVE
TOTAL
RETURN ON
REFERENCE
ENTITY | | BASE FINANCING
RATE (b) | | TERMINATION
DATE | | | PAYMENT
FREQUENCY | | | NOTIONAL
VALUE | | | NUMBER OF
UNITS | | | UNREALIZED
APPRECIATION
(DEPRECIATION) | |
| | | | | | | | | | | | | | | | | | | | | | |
| C | | John Wood Group PLC | | Receive | | 1-Month LIBOR GBP | | | 9/20/2021 | | | | Term | | | $ | 467,439 | | | | 119,037 | | | $ | (143,727 | ) |
| C | | Johnson Matthey PLC | | Receive | | 1-Month LIBOR GBP | | | 9/20/2021 | | | | Term | | | | 55,078 | | | | 2,399 | | | | 5,621 | |
| B | | Johnson Matthey PLC | | Receive | | 1-Month LIBOR GBP | | | 3/18/2026 | | | | Term | | | | 35,264 | | | | 1,400 | | | | (1,748 | ) |
| C | | Kering | | Receive | | 1-Month LIBOR EUR | | | 9/20/2021 | | | | Term | | | | 590,825 | | | | 1,266 | | | | (72,934 | ) |
| C | | Kingfisher PLC | | Receive | | 1-Month LIBOR GBP | | | 9/20/2021 | | | | Term | | | | 613,017 | | | | 326,773 | | | | (99,075 | ) |
| B | | Kingfisher PLC | | Receive | | 1-Month LIBOR GBP | | | 3/18/2026 | | | | Term | | | | 503,311 | | | | 260,853 | | | | (101,142 | ) |
| C | | Legrand S.A. | | Receive | | 1-Month LIBOR EUR | | | 9/20/2021 | | | | Term | | | | 384,292 | | | | 8,546 | | | | 94,495 | |
| C | | L’Oreal S.A. | | Receive | | 1-Month LIBOR EUR | | | 9/20/2021 | | | | Term | | | | 810,953 | | | | 4,583 | | | | 232,069 | |
| B | | L’Oreal S.A. | | Receive | | 1-Month LIBOR EUR | | | 3/18/2026 | | | | Term | | | | 1,111,385 | | | | 5,278 | | | | 49,215 | |
| C | | LVMH Moët Hennessy Louis Vuitton SE | | Receive | | 1-Month LIBOR EUR | | | 9/20/2021 | | | | Term | | | | 413,797 | | | | 1,612 | | | | 99,407 | |
| B | | LVMH Moët Hennessy Louis Vuitton SE | | Receive | | 1-Month LIBOR EUR | | | 3/18/2026 | | | | Term | | | | 344,132 | | | | 1,212 | | | | 33,417 | |
| A | | LyondellBasell Industries N.V. | | Pay | | 1-Month LIBOR USD | | | 4/2/2029 | | | | Term | | | | 2,711,759 | | | | 36,522 | | | | — | |
| A | | Macquarie Group Ltd. | | Receive | | 1-Month Bank Bill Swap Rate | | | 6/28/2024 | | | | Term | | | | 53,041 | | | | 281 | | | | (1,404 | ) |
| C | | Marks & Spencer Group PLC | | Receive | | 1-Month LIBOR GBP | | | 9/20/2021 | | | | Term | | | | 74,944 | | | | 36,797 | | | | (12,048 | ) |
| C | | Marks & Spencer Group PLC — Rights | | Receive | | N/A | | | 6/12/2019 | | | | Term | | | | 3,415 | | | | 7,359 | | | | (1,845 | ) |
| A | | Medibank Private Ltd. | | Receive | | 1-Month Bank Bill Swap Rate | | | 6/28/2024 | | | | Term | | | | 975,312 | | | | 265,719 | | | | 147,631 | |
| C | | Meggitt PLC | | Receive | | 1-Month LIBOR GBP | | | 9/20/2021 | | | | Term | | | | 42,853 | | | | 11,346 | | | | 3,160 | |
| C | | Merlin Entertainment | | Receive | | 1-Month LIBOR GBP | | | 9/20/2021 | | | | Term | | | | 2,268 | | | | 779 | | | | 107 | |
| C | | Michelin | | Receive | | 1-Month LIBOR EUR | | | 9/20/2021 | | | | Term | | | | 408,901 | | | | 5,008 | | | | 83,161 | |
| B | | Michelin | | Receive | | 1-Month LIBOR EUR | | | 3/18/2026 | | | | Term | | | | 17,460 | | | | 186 | | | | 247 | |
| C | | Micro Focus International | | Receive | | 1-Month LIBOR GBP | | | 9/20/2021 | | | | Term | | | | 1,595 | | | | 111 | | | | 140 | |
| C | | Mondi PLC | | Receive | | 1-Month LIBOR GBP | | | 9/20/2021 | | | | Term | | | | 291,339 | | | | 21,099 | | | | (19,825 | ) |
| B | | Mondi PLC | | Receive | | 1-Month LIBOR GBP | | | 3/18/2026 | | | | Term | | | | 183,421 | | | | 13,215 | | | | (11,881 | ) |
| C | | Natixis | | Receive | | 1-Month LIBOR EUR | | | 9/20/2021 | | | | Term | | | | 246,755 | | | | 64,562 | | | | 36,184 | |
| B | | Nedbank Group Ltd. | | Receive | | South African Benchmark Overnight Rate | | | 3/18/2026 | | | | Term | | | | 145,961 | | | | 3,833 | | | | 69,872 | |
| A | | New Residential Investment Corp. | | Pay | | 1-Month LIBOR USD | | | 4/2/2029 | | | | Term | | | | 1,765,942 | | | | 106,318 | | | | 151,146 | |
| C | | Next PLC | | Receive | | 1-Month LIBOR GBP | | | 9/20/2021 | | | | Term | | | | 116,404 | | | | 3,523 | | | | 69,717 | |
| B | | Next PLC | | Receive | | 1-Month LIBOR GBP | | | 3/18/2026 | | | | Term | | | | 711,437 | | | | 17,013 | | | | 99,262 | |
| A | | Northrop Grumman Corp. | | Pay | | 1-Month LIBOR USD | | | 4/2/2029 | | | | Term | | | | 1,141,736 | | | | 3,765 | | | | — | |
| B | | Old Mutual Ltd. | | Receive | | 1-Month LIBOR GBP | | | 3/18/2026 | | | | Term | | | | 44,006 | | | | 48,329 | | | | 1,275 | |
| A | | Oracle Corp. | | Pay | | 1-Month LIBOR USD | | | 4/2/2029 | | | | Term | | | | 6,350,056 | | | | 117,659 | | | | 420,075 | |
| C | | Orange | | Receive | | 1-Month LIBOR EUR | | | 9/20/2021 | | | | Term | | | | 15,637 | | | | 1,311 | | | | 1,045 | |
| A | | Orica Ltd. | | Receive | | 1-Month Bank Bill Swap Rate | | | 6/28/2024 | | | | Term | | | | 351,778 | | | | 14,042 | | | | 32,090 | |
| A | | Origin Energy Ltd. | | Receive | | 1-Month Bank Bill Swap Rate | | | 6/28/2024 | | | | Term | | | | 104,408 | | | | 9,946 | | | | (724 | ) |
| A | | PACCAR, Inc. | | Pay | | 1-Month LIBOR USD | | | 4/2/2029 | | | | Term | | | | 2,015,048 | | | | 29,297 | | | | 84,822 | |
| C | | Pearson PLC | | Receive | | 1-Month LIBOR GBP | | | 9/20/2021 | | | | Term | | | | 297,443 | | | | 46,155 | | | | (12,030 | ) |
| | | | |
| | The accompanying Notes to the Financial Statements are an integral part of these Financial Statements. | | (Continued) |
| | | | | | | | | | | | | | | | |
| | Elements Portfolios | | | | | | Annual Report | | | | | | May 31, 2019 | | |
| | | | |
52
| | |
| Schedule of Investments | | as of May 31, 2019 |
| | | | |
| ELEMENTS INTERNATIONAL PORTFOLIO | | | | |
| | | | | | | | | | | | | | | | | | | | | | | | | | |
| | | | | | | | |
| COUNTERPARTY (a) | | REFERENCE ENTITY | | PAY/RECEIVE
TOTAL
RETURN ON
REFERENCE
ENTITY | | BASE FINANCING
RATE (b) | | TERMINATION
DATE | | | PAYMENT
FREQUENCY | | | NOTIONAL
VALUE | | | NUMBER OF
UNITS | | | UNREALIZED
APPRECIATION
(DEPRECIATION) | |
| | | | | | | | | | | | | | | | | | | | | | |
| B | | Pearson PLC | | Receive | | 1-Month LIBOR GBP | | | 3/18/2026 | | | | Term | | | $ | 401,393 | | | | 61,353 | | | $ | (22,703 | ) |
| C | | Pernod Ricard S.A. | | Receive | | 1-Month LIBOR EUR | | | 9/20/2021 | | | | Term | | | | 79,755 | | | | 662 | | | | 17,880 | |
| C | | Persimmon PLC | | Receive | | 1-Month LIBOR GBP | | | 9/20/2021 | | | | Term | | | | 546,254 | | | | 32,590 | | | | (26,319 | ) |
| B | | Persimmon PLC | | Receive | | 1-Month LIBOR GBP | | | 3/18/2026 | | | | Term | | | | 476,650 | | | | 26,380 | | | | (107,813 | ) |
| A | | Physicians Realty Trust | | Pay | | 1-Month LIBOR USD | | | 4/2/2029 | | | | Term | | | | 1,020,800 | | | | 58,000 | | | | (38,080 | ) |
| A | | Popular Inc. | | Pay | | 1-Month LIBOR USD | | | 4/2/2029 | | | | Term | | | | 724,430 | | | | 13,100 | | | | 37,171 | |
| C | | Publicis Groupe | | Receive | | 1-Month LIBOR EUR | | | 9/20/2021 | | | | Term | | | | 295,859 | | | | 6,825 | | | | 3,570 | |
| B | | Publicis Groupe | | Receive | | 1-Month LIBOR EUR | | | 3/18/2026 | | | | Term | | | | 227,324 | | | | 5,032 | | | | (8,921 | ) |
| A | | Raytheon Co. | | Pay | | 1-Month LIBOR USD | | | 4/2/2029 | | | | Term | | | | 7,679,800 | | | | 43,000 | | | | 204,799 | |
| A | | REA Group Ltd. | | Receive | | 1-Month Bank Bill Swap Rate | | | 6/28/2024 | | | | Term | | | | 307,710 | | | | 2,732 | | | | 20,547 | |
| A | | Realty Income Corp. | | Pay | | 1-Month LIBOR USD | | | 4/2/2029 | | | | Term | | | | 2,678,729 | | | | 37,329 | | | | 55,780 | |
| C | | Reckitt Benckiser Group PLC | | Receive | | 1-Month LIBOR GBP | | | 9/20/2021 | | | | Term | | | | 11,550 | | | | 239 | | | | 705 | |
| A | | Rio Tinto Ltd. | | Receive | | 1-Month Bank Bill Swap Rate | | | 6/28/2024 | | | | Term | | | | 3,051,430 | | | | 28,888 | | | | 660,980 | |
| C | | Rio Tinto PLC | | Receive | | 1-Month LIBOR GBP | | | 9/20/2021 | | | | Term | | | | 854,265 | | | | 28,674 | | | | 376,391 | |
| B | | Rio Tinto PLC | | Receive | | 1-Month LIBOR GBP | | | 3/18/2026 | | | | Term | | | | 1,097,138 | | | | 32,502 | | | | 105,929 | |
| C | | Rolls-Royce Holdings PLC | | Receive | | 1-Month LIBOR GBP | | | 9/20/2021 | | | | Term | | | | 79,052 | | | | 12,211 | | | | 6,896 | |
| C | | Royal Bank of Scotland Group | | Receive | | 1-Month LIBOR GBP | | | 9/20/2021 | | | | Term | | | | 940,734 | | | | 556,595 | | | | 70,246 | |
| C | | Royal Dutch Shell PLC — A Shares | | Receive | | 1-Month LIBOR GBP | | | 9/20/2021 | | | | Term | | | | 3,454,200 | | | | 184,024 | | | | 341,250 | |
| B | | Royal Dutch Shell PLC — A Shares | | Receive | | 1-Month LIBOR GBP | | | 3/18/2026 | | | | Term | | | | 4,389,734 | | | | 229,532 | | | | 214,864 | |
| C | | Royal Dutch Shell PLC — B Shares | | Receive | | 1-Month LIBOR GBP | | | 9/20/2021 | | | | Term | | | | 3,014,617 | | | | 160,362 | | | | 331,156 | |
| B | | Royal Dutch Shell PLC — B Shares | | Receive | | 1-Month LIBOR GBP | | | 3/18/2026 | | | | Term | | | | 3,906,486 | | | | 203,213 | | | | 190,139 | |
| C | | RSA Insurance Group PLC | | Receive | | 1-Month LIBOR GBP | | | 9/20/2021 | | | | Term | | | | 40,153 | | | | 10,076 | | | | 7,635 | |
| C | | Sanofi | | Receive | | 1-Month LIBOR EUR | | | 9/20/2021 | | | | Term | | | | 116,946 | | | | 1,696 | | | | (4,348 | ) |
| B | | Sanofi | | Receive | | 1-Month LIBOR EUR | | | 3/18/2026 | | | | Term | | | | 709,239 | | | | 10,000 | | | | (49,299 | ) |
| A | | Santos Ltd. | | Receive | | 1-Month Bank Bill Swap Rate | | | 6/28/2024 | | | | Term | | | | 14,644 | | | | 1,488 | | | | (105 | ) |
| C | | Schneider Electric SE | | Receive | | 1-Month LIBOR EUR | | | 9/20/2021 | | | | Term | | | | 559,673 | | | | 9,514 | | | | 74,850 | |
| C | | Schroders PLC | | Receive | | 1-Month LIBOR GBP | | | 9/20/2021 | | | | Term | | | | 15,584 | | | | 686 | | | | 368 | |
| B | | Scor SE | | Receive | | 1-Month LIBOR EUR | | | 3/18/2026 | | | | Term | | | | 822,448 | | | | 22,909 | | | | (46,169 | ) |
| C | | Smith & Nephew PLC | | Receive | | 1-Month LIBOR GBP | | | 9/20/2021 | | | | Term | | | | 313,916 | | | | 28,064 | | | | 91,330 | |
| B | | Smith & Nephew PLC | | Receive | | 1-Month LIBOR GBP | | | 3/18/2026 | | | | Term | | | | 86,081 | | | | 7,325 | | | | 17,764 | |
| C | | Smiths Group PLC | | Receive | | 1-Month LIBOR GBP | | | 9/20/2021 | | | | Term | | | | 123,658 | | | | 11,465 | | | | 12,917 | |
| C | | Smurfit Kappa Group PLC | | Receive | | 1-Month LIBOR EUR | | | 9/20/2021 | | | | Term | | | | 211,317 | | | | 7,610 | | | | (45,912 | ) |
| C | | Societe BIC S.A. | | Receive | | 1-Month LIBOR EUR | | | 9/20/2021 | | | | Term | | | | 516,257 | | | | 7,527 | | | | (56,670 | ) |
| B | | Societe BIC S.A. | | Receive | | 1-Month LIBOR EUR | | | 3/18/2026 | | | | Term | | | | 1,880 | | | | 26 | | | | (316 | ) |
| C | | Societe Generale S.A. | | Receive | | 1-Month LIBOR EUR | | | 9/20/2021 | | | | Term | | | | 66,230 | | | | 2,952 | | | | (2,430 | ) |
| B | | Societe Generale S.A. | | Receive | | 1-Month LIBOR EUR | | | 3/18/2026 | | | | Term | | | | 113,310 | | | | 4,525 | | | | (18,476 | ) |
| C | | Sodexo S.A. | | Receive | | 1-Month LIBOR EUR | | | 9/20/2021 | | | | Term | | | | 217,982 | | | | 2,556 | | | | 25,325 | |
| B | | Sodexo S.A. | | Receive | | 1-Month LIBOR EUR | | | 3/18/2026 | | | | Term | | | | 786,571 | | | | 8,777 | | | | 27,910 | |
| | | | |
| | The accompanying Notes to the Financial Statements are an integral part of these Financial Statements. | | (Continued) |
| | | | | | | | | | | | | | | | |
| | Elements Portfolios | | | | | | Annual Report | | | | | | May 31, 2019 | | |
| | | | |
53
| | |
| Schedule of Investments | | as of May 31, 2019 |
| | | | |
| ELEMENTS INTERNATIONAL PORTFOLIO | | | | |
| | | | | | | | | | | | | | | | | | | | | | | | | | |
| | | | | | | | |
| COUNTERPARTY (a) | | REFERENCE ENTITY | | PAY/RECEIVE
TOTAL
RETURN ON
REFERENCE
ENTITY | | BASE FINANCING
RATE (b) | | TERMINATION
DATE | | | PAYMENT
FREQUENCY | | | NOTIONAL
VALUE | | | NUMBER OF
UNITS | | | UNREALIZED
APPRECIATION
(DEPRECIATION) | |
| | | | | | | | | | | | | | | | | | | | | | |
| A | | Sonic Healthcare Ltd. | | Receive | | 1-Month Bank Bill Swap Rate | | | 6/28/2024 | | | | Term | | | $ | 280,543 | | | | 8,783 | | | $ | 24,334 | |
| A | | South32 Ltd. | | Receive | | 1-Month Bank Bill Swap Rate | | | 6/28/2024 | | | | Term | | | | 315,547 | | | | 58,468 | | | | (16,158 | ) |
| A | | Spirit AeroSystems Holdings, Inc. | | Pay | | 1-Month LIBOR USD | | | 4/2/2029 | | | | Term | | | | 2,484,093 | | | | 29,297 | | | | 119,082 | |
| C | | Standard Chartered PLC | | Receive | | 1-Month LIBOR GBP | | | 9/20/2021 | | | | Term | | | | 380,742 | | | | 83,441 | | | | 124,708 | |
| C | | STMicroelectronics N.V. | | Receive | | 1-Month LIBOR EUR | | | 9/20/2021 | | | | Term | | | | 190,462 | | | | 16,637 | | | | 17,880 | |
| C | | Suez | | Receive | | 1-Month LIBOR EUR | | | 9/20/2021 | | | | Term | | | | 541,125 | | | | 52,075 | | | | 53,386 | |
| B | | Suez | | Receive | | 1-Month LIBOR EUR | | | 3/18/2026 | | | | Term | | | | 713,793 | | | | 67,310 | | | | 50,844 | |
| A | | SunTrust Banks, Inc. | | Pay | | 1-Month LIBOR USD | | | 4/2/2029 | | | | Term | | | | 6,544,720 | | | | 104,000 | | | | 255,984 | |
| A | | Tanger Factory Outlet Centers, Inc. | | Pay | | 1-Month LIBOR USD | | | 4/2/2029 | | | | Term | | | | 1,074,516 | | | | 59,300 | | | | 69,495 | |
| C | | Taylor Wimpey PLC | | Receive | | 1-Month LIBOR GBP | | | 9/20/2021 | | | | Term | | | | 640,636 | | | | 506,387 | | | | 52,816 | |
| B | | Taylor Wimpey PLC | | Receive | | 1-Month LIBOR GBP | | | 3/18/2026 | | | | Term | | | | 127,536 | | | | 87,927 | | | | (16,455 | ) |
| A | | TE Connectivity Ltd. | | Pay | | 1-Month LIBOR USD | | | 4/2/2029 | | | | Term | | | | 4,454,573 | | | | 49,900 | | | | 231,472 | |
| C | | Teleperformance | | Receive | | 1-Month LIBOR EUR | | | 9/20/2021 | | | | Term | | | | 179,727 | | | | 1,384 | | | | 44,089 | |
| A | | Telstra Corp Ltd. | | Receive | | 1-Month Bank Bill Swap Rate | | | 6/28/2024 | | | | Term | | | | 2,719,402 | | | | 654,308 | | | | 402,046 | |
| C | | Tesco PLC | | Receive | | 1-Month LIBOR GBP | | | 9/20/2021 | | | | Term | | | | 418,006 | | | | 239,381 | | | | 26,379 | |
| C | | The Berkeley Group Holdings | | Receive | | 1-Month LIBOR GBP | | | 9/20/2021 | | | | Term | | | | 427,163 | | | | 15,249 | | | | (11,972 | ) |
| B | | The Berkeley Group Holdings | | Receive | | 1-Month LIBOR GBP | | | 3/18/2026 | | | | Term | | | | 391,831 | | | | 12,552 | | | | (73,128 | ) |
| A | | The PNC Financial Services Group Inc. | | Pay | | 1-Month LIBOR USD | | | 4/2/2029 | | | | Term | | | | 6,014,834 | | | | 47,253 | | | | (21,152 | ) |
| C | | The Sage Group PLC | | Receive | | 1-Month LIBOR GBP | | | 9/20/2021 | | | | Term | | | | 279,642 | | | | 55,371 | | | | 82,003 | |
| C | | Total S.A. | | Receive | | 1-Month LIBOR EUR | | | 9/20/2021 | | | | Term | | | | 2,128,112 | | | | 49,319 | | | | (85,521 | ) |
| B | | Total S.A. | | Receive | | 1-Month LIBOR EUR | | | 3/18/2026 | | | | Term | | | | 2,979,418 | | | | 63,668 | | | | (363,742 | ) |
| A | | Total System Services, Inc. | | Pay | | 1-Month LIBOR USD | | | 4/2/2029 | | | | Term | | | | 1,906,933 | | | | 15,437 | | | | — | |
| A | | Transurban Group | | Receive | | 1-Month Bank Bill Swap Rate | | | 6/28/2024 | | | | Term | | | | 223,516 | | | | 13,146 | | | | 20,582 | |
| C | | Unilever PLC | | Receive | | 1-Month LIBOR GBP | | | 9/20/2021 | | | | Term | | | | 835,838 | | | | 26,036 | | | | 277,623 | |
| C | | Valeo S.A. | | Receive | | 1-Month LIBOR EUR | | | 9/20/2021 | | | | Term | | | | 848,408 | | | | 36,754 | | | | (43,041 | ) |
| B | | Valeo S.A. | | Receive | | 1-Month LIBOR EUR | | | 3/18/2026 | | | | Term | | | | 181,748 | | | | 7,469 | | | | (20,460 | ) |
| C | | Veolia Environnement | | Receive | | 1-Month LIBOR EUR | | | 9/20/2021 | | | | Term | | | | 1,184,672 | | | | 72,051 | | | | 251,235 | |
| B | | Veolia Environnement | | Receive | | 1-Month LIBOR EUR | | | 3/18/2026 | | | | Term | | | | 301,339 | | | | 16,729 | | | | 25,440 | |
| A | | VEREIT, Inc. | | Pay | | 1-Month LIBOR USD | | | 4/2/2029 | | | | Term | | | | 1,464,615 | | | | 171,300 | | | | (55,566 | ) |
| A | | VICI Properties, Inc. | | Pay | | 1-Month LIBOR USD | | | 4/2/2029 | | | | Term | | | | 2,480,833 | | | | 110,900 | | | | 22,703 | |
| C | | Vinci S.A. | | Receive | | 1-Month LIBOR EUR | | | 9/20/2021 | | | | Term | | | | 77,123 | | | | 1,016 | | | | 5,312 | |
| C | | Vivendi | | Receive | | 1-Month LIBOR EUR | | | 9/20/2021 | | | | Term | | | | 2,744 | | | | 124 | | | | (82 | ) |
| C | | Vodafone Group PLC | | Receive | | 1-Month LIBOR GBP | | | 9/20/2021 | | | | Term | | | | 218,888 | | | | 199,205 | | | | (24,851 | ) |
| A | | WABCO Holdings, Inc. (a) | | Pay | | 1-Month LIBOR USD | | | 4/2/2029 | | | | Term | | | | 1,889,094 | | | | 14,176 | | | | 40,324 | |
| A | | Walgreens Boots Alliance, Inc. (b) | | Pay | | 1-Month LIBOR USD | | | 4/2/2029 | | | | Term | | | | 3,280,830 | | | | 59,500 | | | | 328,882 | |
| A | | Washington H. Soul Pattinson | | Receive | | 1-Month Bank Bill Swap Rate | | | 6/28/2024 | | | | Term | | | | 7,837 | | | | 237 | | | | (107 | ) |
| | | | |
| | The accompanying Notes to the Financial Statements are an integral part of these Financial Statements. | | (Continued) |
| | | | | | | | | | | | | | | | |
| | Elements Portfolios | | | | | | Annual Report | | | | | | May 31, 2019 | | |
| | | | |
54
| | |
| Schedule of Investments | | as of May 31, 2019 |
| | | | |
| ELEMENTS INTERNATIONAL PORTFOLIO | | | | |
| | | | | | | | | | | | | | | | | | | | | | | | | | |
| | | | | | | | |
| COUNTERPARTY (a) | | REFERENCE ENTITY | | PAY/RECEIVE
TOTAL
RETURN ON
REFERENCE
ENTITY | | BASE FINANCING
RATE (b) | | TERMINATION
DATE | | | PAYMENT
FREQUENCY | | | NOTIONAL
VALUE | | | NUMBER OF
UNITS | | | UNREALIZED
APPRECIATION
(DEPRECIATION) | |
| | | | | | | | | | | | | | | | | | | | | | |
| A | | Watts Water Technologies, Inc. (b) | | Pay | | 1-Month LIBOR USD | | | 4/2/2029 | | | | Term | | | $ | 608,382 | | | | 7,300 | | | $ | 12,956 | |
| A | | Wells Fargo & Co. | | Pay | | 1-Month LIBOR USD | | | 4/2/2029 | | | | Term | | | | 6,752,010 | | | | 141,285 | | | | 444,672 | |
| C | | Wendel | | Receive | | 1-Month LIBOR EUR | | | 9/20/2021 | | | | Term | | | | 442,644 | | | | 4,666 | | | | 54,160 | |
| B | | Wendel | | Receive | | 1-Month LIBOR EUR | | | 3/18/2026 | | | | Term | | | | 224,040 | | | | 2,199 | | | | 6,189 | |
| A | | Wesfarmers Ltd. | | Receive | | 1-Month Bank Bill Swap Rate | | | 6/28/2024 | | | | Term | | | | 3,200,686 | | | | 67,013 | | | | 276,943 | |
| C | | Whitbread PLC | | Receive | | 1-Month LIBOR GBP | | | 9/20/2021 | | | | Term | | | | 24,417 | | | | 706 | | | | 2,896 | |
| C | | WM Morrison Supermarkets PLC | | Receive | | 1-Month LIBOR GBP | | | 9/20/2021 | | | | Term | | | | 511,340 | | | | 283,545 | | | | (81,487 | ) |
| B | | WM Morrison Supermarkets PLC | | Receive | | 1-Month LIBOR GBP | | | 3/18/2026 | | | | Term | | | | 469,453 | | | | 263,626 | | | | (67,050 | ) |
| A | | Woolworths Group Ltd. | | Receive | | 1-Month Bank Bill Swap Rate | | | 6/28/2024 | | | | Term | | | | 1,880,229 | | | | 46,196 | | | | 123,859 | |
| A | | World Fuel Services Corp. | | Pay | | 1-Month LIBOR USD | | | 4/2/2029 | | | | Term | | | | 794,871 | | | | 25,900 | | | | 40,668 | |
| C | | Worldline S.A. | | Receive | | 1-Month LIBOR EUR | | | 9/20/2021 | | | | Term | | | | 169,179 | | | | 3,850 | | | | 20,679 | |
| B | | Worldline S.A. | | Receive | | 1-Month LIBOR EUR | | | 3/18/2026 | | | | Term | | | | 126,413 | | | | 2,529 | | | | (5,508 | ) |
| C | | WPP PLC | | Receive | | 1-Month LIBOR GBP | | | 9/20/2021 | | | | Term | | | | 431,957 | | | | 63,704 | | | | 66,088 | |
| A | | Yum China Holdings, Inc. | | Pay | | 1-Month LIBOR USD | | | 4/2/2029 | | | | Term | | | | 2,534,076 | | | | 58,121 | | | | 211,084 | |
| | | | | | | | | | | | | | | | | | | | | | | | | | |
| | | | | | | | | | | | | | | $254,845,092 | | | | | | $11,003,698 | |
| | | | | | | | | | | | | | | | | | | | | | | | | | |
| | | | | | | |
| Swaps on Futures | | | | | | | | | | | | | | | | | | | | | | | | |
| | | | | | | | |
| COUNTERPARTY (a) | | REFERENCE ENTITY | | PAY/RECEIVE
TOTAL
RETURN ON
REFERENCE
ENTITY | | BASE FINANCING
RATE | | TERMINATION
DATE | | | PAYMENT
FREQUENCY | | | NOTIONAL
VALUE | | | NUMBER OF
UNITS | | | UNREALIZED
APPRECIATION | |
| A | | Total S.A. Dividend Future — December 2019 Expiration | | Receive | | N/A | | | 12/20/2019 | | | | Term | | | $ | 77,742 | | | | 45 | | | $ | 251 | |
| A | | Total S.A. Dividend Future — December 2021 Expiration | | Receive | | N/A | | | 12/17/2021 | | | | Term | | | | 78,324 | | | | 35 | | | | 196 | |
| | | | | | | | | | | | | | | | | | | | | | | | | | |
| | | | | | | | | | | | | | | $ 156,066 | | | | | | $ 447 | |
| | | | | | | | | | | | | | | | | | | | | | | | | | |
| | | | | | | | | | | | | | | | | | | | | $ 11,004,145 | |
| | | | | | | | | | | | | | | | | | | | | | | | | | |
| (b) | The swaps accrue financing fees according to the relevant base financing rate which resets periodically, plus a fixed spread. |
| | | | |
| | The accompanying Notes to the Financial Statements are an integral part of these Financial Statements. | | |
| | | | | | | | | | | | | | | | |
| | Elements Portfolios | | | | | | Annual Report | | | | | | May 31, 2019 | | |
| | | | |
55
| | |
| Schedule of Investments | | as of May 31, 2019 |
| | | | |
| ELEMENTS INTERNATIONAL SMALL CAP PORTFOLIO | | | | |
| | | | | | | | |
| | | SHARES | | | FAIR
VALUE | |
COMMON STOCKS - 93.4% | | | | | | | | |
| Australia - 1.3% | | | | | | |
A2B Australia Ltd. | | | 27,634 | | | $ | 34,122 | |
Accent Group Ltd. | | | 125,886 | | | | 129,680 | |
ALS Ltd. | | | 2,515 | | | | 12,387 | |
Altium Ltd. | | | 3,549 | | | | 76,148 | |
ARB Corp. Ltd. | | | 4,164 | | | | 53,814 | |
Bapcor Ltd. | | | 1,614 | | | | 6,673 | |
Breville Group Ltd. | | | 11,280 | | | | 132,085 | |
Cleanaway Waste Management Ltd. | | | 15,072 | | | | 23,316 | |
Collins Foods Ltd. | | | 850 | | | | 4,688 | |
Costa Group Holdings Ltd. | | | 26,796 | | | | 73,424 | |
CSR Ltd. | | | 71,576 | | | | 198,112 | |
Downer EDI Ltd. | | | 23,158 | | | | 114,541 | |
DuluxGroup Ltd. | | | 14,404 | | | | 97,222 | |
FlexiGroup Ltd. | | | 56,330 | | | | 70,728 | |
GDI Property Group | | | 471 | | | | 433 | |
GrainCorp Ltd. | | | 13,600 | | | | 72,833 | |
GUD Holdings Ltd. | | | 1,090 | | | | 7,894 | |
GWA Group Ltd. | | | 37,245 | | | | 90,429 | |
IDP Education Ltd. | | | 6,652 | | | | 78,861 | |
Inghams Group Ltd. | | | 15,009 | | | | 43,729 | |
JBHi-Fi Ltd. (a) | | | 7,946 | | | | 155,001 | |
Magellan Financial Group Ltd. (a) | | | 1,791 | | | | 53,958 | |
McMillan Shakespeare Ltd. | | | 14 | | | | 126 | |
Metcash Ltd. (a) | | | 196,427 | | | | 401,970 | |
Michael Hill International Ltd. | | | 9,267 | | | | 3,487 | |
Mineral Resources Ltd. | | | 21,059 | | | | 219,421 | |
Monadelphous Group Ltd. | | | 24,198 | | | | 320,111 | |
Nanosonics Ltd. (b) | | | 10,625 | | | | 33,167 | |
Northern Star Resources Ltd. | | | 3,965 | | | | 26,707 | |
Orora Ltd. | | | 23,329 | | | | 50,815 | |
OZ Minerals Ltd. | | | 22,528 | | | | 140,961 | |
Platinum Asset Management Ltd. | | | 22,866 | | | | 72,490 | |
Regis Resources Ltd. | | | 26,745 | | | | 82,561 | |
Sandfire Resources N.L. | | | 30,820 | | | | 131,486 | |
Southern Cross Media Group, Ltd. | | | 93,111 | | | | 80,416 | |
St. Barbara, Ltd. | | | 98,707 | | | | 175,290 | |
Super Retail Group Ltd. | | | 46,468 | | | �� | 298,171 | |
Vita Group Ltd. | | | 77,254 | | | | 89,497 | |
Whitehaven Coal Ltd. | | | 71,113 | | | | 193,871 | |
WiseTech Global Ltd. | | | 8,382 | | | | 141,643 | |
| | | | | | | | |
| | | | | | | 3,992,268 | |
| | | | | | | | |
| Austria - 1.5% | | | | | | |
Agrana Beteiligungs AG | | | 8,560 | | | | 182,268 | |
AT&S Austria Technologie & Systemtechnik AG | | | 10,140 | | | | 173,884 | |
DO & CO AG | | | 1,169 | | | | 98,861 | |
EVN AG | | | 9,511 | | | | 137,491 | |
FACC AG | | | 2,600 | | | | 36,830 | |
Kapsch TrafficCom AG | | | 2,200 | | | | 88,233 | |
Oesterreichische Post AG | | | 22,687 | | | | 760,348 | |
Porr AG (a) | | | 3,538 | | | | 83,002 | |
S&T AG | | | 5,105 | | | | 112,978 | |
Telekom Austria AG | | | 78,813 | | | | 599,596 | |
UNIQA Insurance Group AG | | | 33,332 | | | | 297,338 | |
Vienna Insurance Group AG Wiener Versicherung Gruppe | | | 41,270 | | | | 1,009,700 | |
| | | | | | | | |
| | | SHARES | | | FAIR
VALUE | |
| Austria - 1.5% (continued) | | | | | | |
Wienerberger AG | | | 41,242 | | | $ | 890,145 | |
Zumtobel Group AG (b) | | | 10,919 | | | | 72,579 | |
| | | | | | | | |
| | | | | | | 4,543,253 | |
| | | | | | | | |
| Belgium - 1.7% | | | | | | |
AGFA-Gevaert N.V. (b) | | | 57,595 | | | | 233,821 | |
Balta Group S.A. (b)(c) (Cost: $30,606; Original Acquisition Date: 01/22/2018) | | | 4,040 | | | | 13,247 | |
Barco N.V. | | | 3,995 | | | | 778,354 | |
Bekaert, S.A. | | | 13,224 | | | | 324,421 | |
Bpost, S.A. (a) | | | 55,654 | | | | 547,009 | |
Cie d’Entreprises CFE | | | 108 | | | | 9,857 | |
D’ieteren, S.A. | | | 33,925 | | | | 1,468,607 | |
Euronav N.V. | | | 1,619 | | | | 13,719 | |
Fagron | | | 6,200 | | | | 118,441 | |
Ion Beam Applications, S.A. (b) | | | 412 | | | | 6,669 | |
KBC Ancora | | | 7,099 | | | | 340,385 | |
Kinepolis Group N.V. | | | 283 | | | | 15,618 | |
Orange Belgium, S.A. | | | 28,326 | | | | 539,223 | |
Recticel, S.A. | | | 45,491 | | | | 390,302 | |
Sioen Industries N.V. | | | 677 | | | | 19,097 | |
Sofina, S.A. | | | 2,035 | | | | 393,755 | |
Tessenderlo Group, S.A. (b) | | | 198 | | | | 6,437 | |
Van de Velde N.V. | | | 561 | | | | 15,699 | |
| | | | | | | | |
| | | | | | 5,234,661 | |
| | | | | | | | |
| Bermuda - 0.4% | | | | | | |
BW LPG Ltd. (b)(c) (Cost: $86,059; Original Acquisition Date: 02/08/2019) | | | 24,205 | | | | 101,503 | |
Emperor International Holdings Ltd. | | | 26,000 | | | | 6,965 | |
Esprit Holdings Ltd. (b) | | | 463,700 | | | | 92,864 | |
Golden Ocean Group Ltd. | | | 6,451 | | | | 29,470 | |
G-Resources Group Ltd. (b) | | | 2,235,000 | | | | 17,106 | |
Johnson Electric Holdings Ltd. | | | 32,000 | | | | 60,820 | |
NewOcean Energy Holdings Ltd. (b) | | | 108,000 | | | | 25,762 | |
VTech Holdings Ltd. | | | 94,000 | | | | 779,382 | |
| | | | | | | | |
| | | | | | 1,113,872 | |
| | | | | | | | |
| Canada - 4.6% | | | | | | |
Aecon Group, Inc. (b) | | | 10,142 | | | | 131,240 | |
AGF Management Ltd. (b) | | | 26,306 | | | | 98,871 | |
Aimia, Inc. (b) | | | 18,297 | | | | 47,381 | |
Aritzia, Inc. (b) | | | 28,976 | | | | 380,530 | |
ATS Automation Tooling Systems, Inc. (b) | | | 7,974 | | | | 120,117 | |
Badger Daylighting Ltd. (a)(b) | | | 2,200 | | | | 77,820 | |
BRP, Inc. (b) | | | 16,797 | | | | 502,568 | |
Calfrac Well Services Ltd. (b) | | | 10,200 | | | | 16,150 | |
Callidus Capital Corp. (a)(b) | | | 650 | | | | 298 | |
Canaccord Genuity Group, Inc. (b) | | | 43,877 | | | | 161,666 | |
Canadian Western Bank (b) | | | 1,386 | | | | 29,051 | |
Canfor Corp. (b) | | | 61,045 | | | | 397,452 | |
Canfor Pulp Products, Inc. (b) | | | 82,173 | | | | 679,101 | |
Cascades, Inc. (b) | | | 4,300 | | | | 28,060 | |
Celestica, Inc. (b) | | | 5,700 | | | | 35,846 | |
Cogeco Communications, Inc. (b) | | | 900 | | | | 61,727 | |
Cogeco, Inc. (b) | | | 2,556 | | | | 159,741 | |
Colliers International Group, Inc. (b) | | | 1,100 | | | | 67,761 | |
Computer Modelling Group Ltd. (b) | | | 19,496 | | | | 101,836 | |
| | | | |
| | The accompanying Notes to the Financial Statements are an integral part of these Financial Statements. | | (Continued) |
| | | | | | | | | | | | | | | | |
| | Elements Portfolios | | | | | | Annual Report | | | | | | May 31, 2019 | | |
| | | | |
56
| | |
| Schedule of Investments | | as of May 31, 2019 |
| | | | |
| ELEMENTS INTERNATIONAL SMALL CAP PORTFOLIO | | | | |
| | | | | | | | |
| | | SHARES | | | FAIR
VALUE | |
| Canada - 4.6% (continued) | | | | | | |
Corby Spirit and Wine Ltd. (b) | | | 300 | | | $ | 4,049 | |
Corus Entertainment, Inc. (b) | | | 48,410 | | | | 231,018 | |
Cott Corp. (b) | | | 1,200 | | | | 15,617 | |
Descartes Systems Group, Inc. (b) | | | 2,600 | | | | 104,281 | |
DIRTT Environmental Solutions (b) | | | 11,485 | | | | 64,325 | |
Dorel Industries, Inc. (b) | | | 38,911 | | | | 309,768 | |
Dundee Corp. (b) | | | 1,800 | | | | 1,252 | |
Endeavour Mining Corp. (b) | | | 2,821 | | | | 42,119 | |
Enerflex Ltd. (b) | | | 5,300 | | | | 64,191 | |
Enghouse Systems Ltd. (b) | | | 11,876 | | | | 295,846 | |
Equitable Group, Inc. (b) | | | 7,209 | | | | 359,010 | |
Evertz Technologies Ltd. (b) | | | 10,900 | | | | 140,161 | |
Exco Technologies Ltd. (b) | | | 30,411 | | | | 184,500 | |
First National Financial Corp. (b) | | | 200 | | | | 4,513 | |
FirstService Corp. (b) | | | 1,000 | | | | 90,626 | |
Fortuna Silver Mines, Inc. (b) | | | 11,500 | | | | 29,694 | |
Genworth MI Canada, Inc. (a)(b) | | | 6,498 | | | | 197,834 | |
Gibson Energy Inc. (b) | | | 20,000 | | | | 326,428 | |
Great Canadian Gaming Corp. (b) | | | 3,300 | | | | 103,497 | |
Home Capital Group, Inc. | | | 307 | | | | 4,084 | |
Hudbay Minerals, Inc. (b) | | | 38,952 | | | | 191,359 | |
Interfor Corp. (b) | | | 39,184 | | | | 330,206 | |
Just Energy Group, Inc. (a)(b) | | | 3,474 | | | | 11,412 | |
Kirkland Lake Gold Ltd. (b) | | | 8,300 | | | | 287,086 | |
Labrodor Iron Ore Royalty Corp. (b) | | | 2,290 | | | | 53,404 | |
Largo Resources Ltd. (a)(b) | | | 286,781 | | | | 352,217 | |
Linamar Corp. (b) | | | 800 | | | | 25,516 | |
Lucara Diamond Corp. (b) | | | 1,500 | | | | 1,687 | |
Magellan Aerospace Corp. (b) | | | 13,700 | | | | 173,024 | |
Medical Facilities Corp. (a)(b) | | | 28,989 | | | | 258,233 | |
Morneau Shepell, Inc. (b) | | | 900 | | | | 19,956 | |
NFI Group, Inc. (b) | | | 2,800 | | | | 69,710 | |
Norbord, Inc. | | | 27,945 | | | | 545,833 | |
North West Co., Inc. (b) | | | 13,935 | | | | 306,104 | |
Northland Power, Inc. (b) | | | 4,500 | | | | 83,101 | |
OceanaGold Corp. (b) | | | 70,180 | | | | 193,675 | |
Parex Resources, Inc. (b) | | | 4,600 | | | | 69,599 | |
Parkland Fuel Corp. (b) | | | 9,603 | | | | 294,854 | |
Pason Systems, Inc. (b) | | | 6,868 | | | | 98,172 | |
Peyto Exploration & Development Corp. (a)(b) | | | 20,100 | | | | 70,044 | |
Pretium Resources, Inc. (b) | | | 900 | | | | 7,671 | |
Quebecor, Inc. (b) | | | 5,100 | | | | 120,368 | |
Recipe Unlimited Corp. (b) | | | 13,399 | | | | 264,490 | |
Rogers Sugar, Inc. (b) | | | 5,100 | | | | 22,074 | |
Russel Metals, Inc. (b) | | | 3,799 | | | | 60,009 | |
Sierra Wireless, Inc. (a)(b) | | | 29,557 | | | | 356,451 | |
Silvercorp Metals, Inc. (b) | | | 110,000 | | | | 240,900 | |
Spin Master Corp. (b)(c) (Cost: $975,252; Original Acquisition Date: 05/05/2017) | | | 29,356 | | | | 887,239 | |
Sprott, Inc. (b) | | | 29,719 | | | | 67,283 | |
SSR Mining, Inc. (b) | | | 4,100 | | | | 47,868 | |
Stelco Holdings, Inc. (a)(b) | | | 3,600 | | | | 41,364 | |
Superior Plus Corp. (b) | | | 3,400 | | | | 30,866 | |
Taseko Mines Ltd. (b) | | | 7,450 | | | | 3,528 | |
TFI International, Inc. (b) | | | 10,192 | | | | 310,677 | |
Timbercreek Financial Corp. (b) | | | 1,100 | | | | 7,544 | |
TMX Group Ltd. (b) | | | 1,000 | | | | 66,713 | |
| | | | | | | | |
| | | SHARES | | | FAIR
VALUE | |
| Canada - 4.6% (continued) | | | | | | |
Torex Gold Resources, Inc. (b) | | | 5,800 | | | $ | 53,211 | |
Toromont Industries Ltd. (b) | | | 12,296 | | | | 540,475 | |
Total Energy Services, Inc. (b) | | | 7,700 | | | | 52,811 | |
TransAlta Corp. (b) | | | 51,325 | | | | 339,483 | |
Transcontinental, Inc. (b) | | | 10,778 | | | | 113,952 | |
Trican Well Service Ltd. (a) | | | 131,564 | | | | 123,621 | |
Uni-Select, Inc. (b) | | | 50,956 | | | | 455,799 | |
Western Forest Products, Inc. (a)(b) | | | 69,380 | | | | 78,024 | |
WestJet Airlines Ltd. (b) | | | 11,674 | | | | 260,756 | |
Westshore Terminals Investment Corp. (b) | | | 2,700 | | | | 44,288 | |
WHITECAP RESOURCES, Inc. (b) | | | 4,000 | | | | 13,377 | |
Winpak Ltd. (b) | | | 6,263 | | | | 202,913 | |
WSP Global, Inc. (b) | | | 2,021 | | | | 106,597 | |
| | | | | | | | |
| | | | | | | 14,025,573 | |
| | | | | | | | |
| Cayman Islands - 0.3% | | | | | | |
Bright Smart Securities & Commodities Group Ltd. | | | 118,000 | | | | 22,277 | |
Hutchison Telecommunications Hong Kong Holdings Ltd. | | | 1,812,000 | | | | 425,290 | |
Sapiens International Corp., N.V. | | | 1,518 | | | | 21,494 | |
SITC International Holdings Co., Ltd. | | | 351,000 | | | | 357,736 | |
| | | | | | | | |
| | | | | | | 826,797 | |
| | | | | | | | |
| Denmark - 1.8% | | | | | | |
Alm Brand A/S | | | 16,219 | | | | 139,754 | |
Ambu A/S | | | 500 | | | | 7,768 | |
Bang & Olufsen A/S (b) | | | 14,870 | | | | 115,673 | |
D/S Norden A/S | | | 1,433 | | | | 20,033 | |
FLSmidth & Co. A/S | | | 600 | | | | 23,669 | |
GN Store Nord A/S | | | 11,599 | | | | 546,227 | |
Matas A/S | | | 32,903 | | | | 347,995 | |
Nilfisk Holding A/S (b) | | | 587 | | | | 18,441 | |
NKT A/S (b) | | | 122 | | | | 1,860 | |
NNIT A/S (c) (Cost: $5,876; Original Acquisition Date: 05/22/2017) | | | 189 | | | | 3,585 | |
Per Aarsleff Holding A/S | | | 16,400 | | | | 591,261 | |
Rockwool International A/S | | | 4,770 | | | | 1,218,777 | |
Royal Unibrew A/S | | | 2,502 | | | | 178,161 | |
Scandinavian Tobacco Group A/S (c) (Cost: $374,825; Original Acquisition Date: 05/22/2017) | | | 24,298 | | | | 295,878 | |
SimCorp A/S | | | 3,201 | | | | 312,213 | |
Sydbank A/S | | | 13,435 | | | | 252,634 | |
Topdanmark A/S | | | 23,027 | | | | 1,236,659 | |
| | | | | | | | |
| | | | | | | 5,310,588 | |
| | | | | | | | |
| Faroe Islands - 0.1% | | | | | | |
Bakkafrost P/F | | | 4,049 | | | | 214,671 | |
| | | | | | | | |
| Finland - 1.7% | | | | | | |
Aktia Bank OYJ | | | 1,171 | | | | 10,976 | |
Caverion OYJ (a) | | | 52,252 | | | | 350,242 | |
Cramo OYJ | | | 844 | | | | 16,915 | |
DNA OYJ | | | 9,484 | | | | 221,862 | |
Finnair OYJ | | | 4,342 | | | | 31,020 | |
F-Secure OYJ (b) | | | 5,175 | | | | 13,731 | |
Kesko OYJ | | | 19,505 | | | | 1,024,790 | |
Konecranes OYJ | | | 3,865 | | | | 132,816 | |
| | | | |
| | The accompanying Notes to the Financial Statements are an integral part of these Financial Statements. | | (Continued) |
| | | | | | | | | | | | | | | | |
| | Elements Portfolios | | | | | | Annual Report | | | | | | May 31, 2019 | | |
| | | | |
57
| | |
| Schedule of Investments | | as of May 31, 2019 |
| | | | |
| ELEMENTS INTERNATIONAL SMALL CAP PORTFOLIO | | | | |
| | | | | | | | |
| | | SHARES | | | FAIR
VALUE | |
| Finland - 1.7% (continued) | | | | | | |
Lehto Group OYJ (a) | | | 11,397 | | | $ | 28,495 | |
Metsa Board OYJ | | | 17,214 | | | | 78,308 | |
Oriola OYJ - Class B | | | 7,650 | | | | 16,836 | |
Outokumpu OYJ | | | 9,200 | | | | 27,051 | |
Outotec OYJ (b) | | | 62,058 | | | | 227,120 | |
Ponsse OYJ | | | 891 | | | | 29,215 | |
Ramirent OYJ | | | 2,400 | | | | 13,902 | |
Rovio Entertainment OYJ (c) (Cost: $55,402; Original Acquisition Date: 05/14/2019) | | | 7,006 | | | | 56,940 | |
Sanoma OYJ | | | 63,609 | | | | 574,530 | |
Tieto OYJ | | | 16,488 | | | | 464,176 | |
Tokmanni Group Corp. | | | 51,349 | | | | 424,500 | |
Uponor OYJ | | | 4,315 | | | | 42,613 | |
Valmet OYJ | | | 32,948 | | | | 760,455 | |
YIT OYJ | | | 133,950 | | | | 742,230 | |
| | | | | | | | |
| | | | | | | 5,288,723 | |
| | | | | | | | |
| Germany - 3.7% | | | | | | |
ADVA Optical Networking SE (b) | | | 39,272 | | | | 298,775 | |
Amadeus Fire AG | | | 337 | | | | 43,295 | |
AURELIUS Equity Opportunities SE & Co., KGaA | | | 5,116 | | | | 230,787 | |
Aurubis AG | | | 3,266 | | | | 143,063 | |
BayWa AG | | | 315 | | | | 8,921 | |
Bechtle AG | | | 2,953 | | | | 331,876 | |
bet-at-home.com AG | | | 5,344 | | | | 363,876 | |
Bilfinger SE | | | 6,486 | | | | 197,088 | |
Borussia Dortmund GmbH & Co. KGaA | | | 119,653 | | | | 1,142,219 | |
CANCOM SE | | | 12,645 | | | | 613,935 | |
Carl Zeiss Meditec AG | | | 2,178 | | | | 204,994 | |
Ceconomy AG (b) | | | 70,236 | | | | 397,031 | |
CENTROTEC Sustainable AG | | | 1,043 | | | | 14,495 | |
CEWE Stiftung & Co. KGaA | | | 4,605 | | | | 424,422 | |
comdirect bank AG | | | 193 | | | | 2,130 | |
CTS Eventim AG & Co KGaA | | | 1,611 | | | | 72,277 | |
Deutsche Pfandbriefbank AG (c) (Cost: $173,955; Original Acquisition Date: 04/24/2019) | | | 12,650 | | | | 174,389 | |
Deutz AG | | | 13,334 | | | | 110,381 | |
Draegerwerk AG & Co. KGaA | | | 392 | | | | 17,167 | |
Duerr AG | | | 1,212 | | | | 41,094 | |
Freenet AG | | | 12,759 | | | | 247,588 | |
Gesco AG | | | 1,026 | | | | 27,795 | |
H&R GmbH & Co. KGaA (b) | | | 1,576 | | | | 11,990 | |
Hamburger Hafen und Logistik AG | | | 10,804 | | | | 256,603 | |
HelloFresh SE (b) | | | 10,812 | | | | 111,124 | |
Hornbach Baumarkt AG | | | 2,572 | | | | 44,537 | |
Hornbach Holding AG & Co KGaA | | | 1,729 | | | | 85,665 | |
Hypoport AG (b) | | | 191 | | | | 40,499 | |
Indus Holding AG | | | 141 | | | | 6,230 | |
Jenoptik AG | | | 2,733 | | | | 85,031 | |
JOST Werke AG (c) (Cost: $121,790; Original Acquisition Date: 10/15/2018) | | | 3,422 | | | | 113,349 | |
Koenig & Bauer AG | | | 10,020 | | | | 390,443 | |
Krones AG | | | 10,756 | | | | 842,331 | |
Manz AG (b) | | | 214 | | | | 6,299 | |
MLP SE | | | 23,937 | | | | 105,495 | |
| | | | | | | | |
| | | SHARES | | | FAIR
VALUE | |
| Germany - 3.7% (continued) | | | | | | |
Nemetschek SE | | | 357 | | | $ | 54,759 | |
Nordex SE (b) | | | 22,263 | | | | 316,362 | |
OHB SE | | | 3,295 | | | | 117,241 | |
Rational AG | | | 371 | | | | 236,038 | |
Rhoen Klinikum AG | | | 299 | | | | 8,501 | |
Salzgitter AG | | | 43,139 | | | | 1,121,451 | |
Siltronic AG | | | 8,739 | | | | 597,680 | |
SIXT LEASING SE | | | 91 | | | | 1,220 | |
SMA Solar Technology AG (b) | | | 582 | | | | 16,242 | |
Software AG | | | 4,147 | | | | 135,742 | |
Stroeer SE & Co., KGaA | | | 568 | | | | 38,009 | |
Suedzucker AG | | | 13,953 | | | | 216,513 | |
Surteco Group SE | | | 1,568 | | | | 47,208 | |
Takkt AG | | | 28,143 | | | | 395,517 | |
Varta AG (b) | | | 815 | | | | 42,975 | |
VERBIO Vereinigte BioEnergie AG | | | 12,000 | | | | 99,606 | |
Vossloh AG | | | 280 | | | | 10,776 | |
Wacker Neuson SE | | | 3,564 | | | | 82,816 | |
Washtec AG | | | 561 | | | | 38,920 | |
Zooplus AG (b) | | | 3,877 | | | | 413,198 | |
| | | | | | | | |
| | | | | | | 11,197,968 | |
| | | | | | | | |
| Hong Kong - 1.8% | | | | | | |
Agritrade Resources Ltd. | | | 230,000 | | | | 31,685 | |
Cafe de Coral Holdings Ltd. | | | 206,000 | | | | 506,095 | |
Chinese Estates Holdings Ltd. | | | 19,500 | | | | 17,859 | |
Chong Hing Bank Ltd. | | | 4,000 | | | | 6,970 | |
Chow Sang Sang Holdings International Ltd. | | | 251,000 | | | | 369,478 | |
CITIC Telecom International Holdings Ltd. | | | 1,277,000 | | | | 469,129 | |
Dah Sing Banking Group Ltd. | | | 35,600 | | | | 61,668 | |
Fairwood Holdings Ltd. | | | 45,500 | | | | 158,447 | |
First Pacific Co., Ltd. | | | 368,000 | | | | 149,274 | |
Giordano International Ltd. | | | 546,000 | | | | 245,853 | |
Global Brands Group Holding Ltd. (b) | | | 36,600 | | | | 3,221 | |
Good Resources Holdings Ltd. (b) | | | 220,000 | | | | 3,648 | |
Health & Happiness H&H International Holdings Ltd. | | | 4,500 | | | | 24,568 | |
Leyou Technologies Holdings Ltd. (b) | | | 810,000 | | | | 244,874 | |
Li & Fung Ltd. | | | 4,472,000 | | | | 656,007 | |
Luk Fook Holdings International Ltd. | | | 45,000 | | | | 144,364 | |
Melco International Development Ltd. | | | 262,000 | | | | 524,698 | |
Pacific Textiles Holdings Ltd. | | | 252,000 | | | | 204,762 | |
Regal Hotels International Holdings Ltd. | | | 32,000 | | | | 19,675 | |
Sa Sa International Holdings Ltd. | | | 342,000 | | | | 95,975 | |
SmarTone Telecommunications Holdings Ltd. | | | 639,000 | | | | 627,625 | |
Sun Hung Kai & Co., Ltd. | | | 115,000 | | | | 55,009 | |
Texwinca Holdings Ltd. | | | 200,000 | | | | 63,524 | |
The United Laboratories International Holdings Ltd. | | | 100,000 | | | | 56,508 | |
Value Partners Group Ltd. | | | 808,000 | | | | 527,704 | |
VSTECS Holdings Ltd. | | | 128,000 | | | | 70,045 | |
Xinyi Glass Holdings Ltd. | | | 86,000 | | | | 86,115 | |
| | | | | | | | |
| | | | | | | 5,424,780 | |
| | | | | | | | |
| Israel - 1.5% | | | | | | |
Caesarstone Ltd. | | | 6,669 | | | | 92,499 | |
| | | | |
| | The accompanying Notes to the Financial Statements are an integral part of these Financial Statements. | | (Continued) |
| | | | | | | | | | | | | | | | |
| | Elements Portfolios | | | | | | Annual Report | | | | | | May 31, 2019 | | |
| | | | |
58
| | |
| Schedule of Investments | | as of May 31, 2019 |
| | | | |
| ELEMENTS INTERNATIONAL SMALL CAP PORTFOLIO | | | | |
| | | | | | | | |
| | | SHARES | | | FAIR
VALUE | |
| Israel - 1.5% (continued) | | | | | | |
Delek Automotive Systems Ltd. | | | 3,236 | | | $ | 13,836 | |
Delek Group Ltd. | | | 100 | | | | 17,765 | |
Delta Galil Industries Ltd. | | | 1,108 | | | | 32,032 | |
Equital Ltd. (b) | | | 4,771 | | | | 152,273 | |
First International Bank Of Israel Ltd. | | | 19,873 | | | | 480,228 | |
Formula Systems 1985 Ltd. | | | 236 | | | | 11,119 | |
Hadera Paper Ltd. | | | 318 | | | | 18,825 | |
Harel Insurance Investments & Financial Services Ltd. | | | 3,322 | | | | 25,265 | |
Hilan Ltd. | | | 411 | | | | 12,868 | |
IDI Insurance Co., Ltd. | | | 1,209 | | | | 45,090 | |
Israel Corp. Ltd. (b) | | | 1,213 | | | | 269,396 | |
Ituran Location and Control Ltd. | | | 5,558 | | | | 172,909 | |
Matrix IT Ltd. | | | 20,895 | | | | 308,546 | |
Naphtha Israel Petroleum Corp. Ltd. | | | 4,129 | | | | 26,277 | |
Nova Measuring Instruments Ltd. (b) | | | 1,588 | | | | 40,858 | |
Oil Refineries Ltd. (b) | | | 1,204,048 | | | | 592,873 | |
Partner Communications Co., Ltd. (b) | | | 52,803 | | | | 241,066 | |
Paz Oil Co., Ltd. | | | 2,953 | | | | 411,372 | |
Radware Ltd. (b) | | | 5,417 | | | | 126,324 | |
Rami Levy Chain Stores Ltd. | | | 8,214 | | | | 420,772 | |
Shikun & Binui Ltd. (b) | | | 4,387 | | | | 12,453 | |
Shufersal Ltd. | | | 78,954 | | | | 527,507 | |
Strauss Group Ltd. | | | 11,871 | | | | 315,678 | |
Tower Semiconductor Ltd. (b) | | | 3,191 | | | | 48,458 | |
| | | | | | | | |
| | | | | | 4,416,289 | |
| | | | | | | | |
| Italy - 3.9% | | | | | | |
A2A S.p.A. | | | 449,847 | | | | 733,471 | |
ACEA S.p.A. | | | 2,476 | | | | 46,027 | |
Anima Holding S.p.A. (c) (Cost: $32,396; Original Acquisition Date: 02/19/2019) | | | 7,877 | | | | 23,848 | |
Aquafil S.p.A. | | | 1,756 | | | | 16,439 | |
Arnoldo Mondadori Editore S.p.A. (b) | | | 175,212 | | | | 283,430 | |
Ascopiave S.p.A. | | | 40,463 | | | | 164,767 | |
ASTM S.p.A. | | | 16,053 | | | | 436,506 | |
Autogrill S.p.A. | | | 967 | | | | 9,831 | |
Banca Generali S.p.A. | | | 23,597 | | | | 594,189 | |
Banca Popolare di Sondrio SCPA | | | 206,629 | | | | 479,217 | |
Biesse S.p.A. | | | 28,708 | | | | 465,034 | |
Brembo S.p.A. | | | 24,600 | | | | 264,102 | |
Brunello Cucinelli S.p.A. | | | 1,516 | | | | 47,692 | |
Buzzi Unicem S.p.A. | | | 32,047 | | | | 438,210 | |
Cairo Communication S.p.A. | | | 95,559 | | | | 286,635 | |
Cementir Holding S.p.A. | | | 1,968 | | | | 13,059 | |
Credito Valtellinese S.p.A. (b) | | | 207,266 | | | | 13,847 | |
Danieli & C Officine Meccaniche S.p.A. | | | 8,551 | | | | 146,158 | |
Danieli & C Officine Meccaniche S.p.A. - Risparmio | | | 894 | | | | 10,906 | |
Datalogic S.p.A. | | | 5,040 | | | | 96,957 | |
DeA Capital S.p.A. | | | 13,194 | | | | 18,660 | |
DiaSorin S.p.A. | | | 1,649 | | | | 168,653 | |
El.En. S.p.A. | | | 1,843 | | | | 33,169 | |
Enav S.p.A. (c) (Cost: $388,737; Original Acquisition Date: 05/08/2017) | | | 83,792 | | | | 454,002 | |
ERG S.p.A. | | | 3,065 | | | | 59,613 | |
Fincantieri S.p.A. | | | 246,253 | | | | 253,370 | |
GEDI Gruppo Editoriale S.p.A. (b) | | | 7,287 | | | | 2,369 | |
| | | | | | | | |
| | | SHARES | | | FAIR
VALUE | |
| Italy - 3.9% (continued) | | | | | | |
GEOX S.p.A. | | | 362,529 | | | $ | 478,712 | |
Gima TT S.p.A. (c) (Cost: $306,390; Original Acquisition Date: 10/17/2018) | | | 35,527 | | | | 285,365 | |
Hera S.p.A. | | | 138,843 | | | | 504,105 | |
Industria Macchine Automatiche S.p.A. | | | 209 | | | | 16,227 | |
Interpump Group S.p.A. | | | 100 | | | | 2,922 | |
Iren S.p.A. | | | 163,410 | | | | 404,541 | |
Italgas S.p.A. | | | 18,673 | | | | 118,238 | |
Italimobiliare S.p.A. | | | 933 | | | | 20,450 | |
Juventus Football Club S.p.A. (a)(b) | | | 57,635 | | | | 98,641 | |
La Doria S.p.A. | | | 2,513 | | | | 22,291 | |
Maire Tecnimont S.p.A. | | | 63,309 | | | | 182,615 | |
MARR S.p.A. | | | 2,390 | | | | 54,068 | |
Mediaset S.p.A. (a)(b) | | | 466,924 | | | | 1,366,141 | |
Moncler S.p.A. | | | 502 | | | | 18,507 | |
OVS S.p.A. (b)(c) (Cost: $324,883; Original Acquisition Date: 10/29/2018) | | | 254,213 | | | | 425,141 | |
Piaggio & C. S.p.A. | | | 198,299 | | | | 572,436 | |
Rai Way S.p.A. (c) (Cost: $28,364; Original Acquisition Date: 05/30/2017) | | | 5,629 | | | | 28,550 | |
Reply S.p.A. | | | 688 | | | | 44,310 | |
Saipem S.p.A. (b) | | | 176,753 | | | | 756,867 | |
Saras S.p.A. | | | 306,889 | | | | 441,925 | |
Societa Cattolica di Assicurazioni SC | | | 3,834 | | | | 31,032 | |
Societa Iniziative Autostradali e Servizi S.p.A. | | | 4,430 | | | | 77,105 | |
Sogefi S.p.A. (b) | | | 14,542 | | | | 18,520 | |
Technogym S.p.A. (c) (Cost: $155,692; Original Acquisition Date: 05/08/2017) | | | 18,036 | | | | 206,931 | |
Tinexta Spa | | | 3,007 | | | | 43,939 | |
Tod’s SpA | | | 300 | | | | 14,599 | |
Zignago Vetro S.p.A. | | | 1,294 | | | | 14,456 | |
| | | | | | | | |
| | | | | | | 11,808,795 | |
| | | | | | | | |
| Japan - 30.9% | | | | | | |
Achilles Corp. | | | 6,000 | | | | 108,356 | |
Adastria Co., Ltd. | | | 16,800 | | | | 413,934 | |
ADEKA Corp. | | | 2,000 | | | | 28,035 | |
Aeon Delight Co., Ltd. | | | 9,700 | | | | 280,621 | |
Aeon Fantasy Co., Ltd. | | | 100 | | | | 2,098 | |
Ai Holdings Corp. | | | 5,300 | | | | 82,949 | |
Aica Kogyo Co., Ltd. | | | 5,000 | | | | 165,875 | |
Aichi Corp. | | | 7,100 | | | | 42,719 | |
Aichi Steel Corp. | | | 600 | | | | 17,579 | |
Aida Engineering Ltd. | | | 9,200 | | | | 61,381 | |
Ain Holdings, Inc. | | | 5,100 | | | | 390,624 | |
Aisan Industry Co., Ltd. | | | 13,700 | | | | 85,084 | |
Alpen Co., Ltd. | | | 15,900 | | | | 237,550 | |
Alps Alpine Co., Ltd. | | | 60 | | | | 997 | |
Altech Corp. | | | 8,300 | | | | 140,472 | |
Amano Corp. | | | 6,100 | | | | 158,741 | |
Amuse, Inc. | | | 5,400 | | | | 128,615 | |
Anest Iwata Corp. | | | 6,300 | | | | 55,404 | |
Anicom Holdings, Inc. | | | 1,700 | | | | 55,456 | |
Anritsu Corp. (a) | | | 5,900 | | | | 94,627 | |
AOKI Holdings, Inc. | | | 22,600 | | | | 213,977 | |
Aoyama Trading Co., Ltd. | | | 5,800 | | | | 112,130 | |
Arata Corp. | | | 9,500 | | | | 329,627 | |
| | | | |
| | The accompanying Notes to the Financial Statements are an integral part of these Financial Statements. | | (Continued) |
| | | | | | | | | | | | | | | | |
| | Elements Portfolios | | | | | | Annual Report | | | | | | May 31, 2019 | | |
| | | | |
59
| | |
| Schedule of Investments | | as of May 31, 2019 |
| | | | |
| ELEMENTS INTERNATIONAL SMALL CAP PORTFOLIO | | | | |
| | | | | | | | |
| | | SHARES | | | FAIR
VALUE | |
| Japan - 30.9% (continued) | | | | | | |
Arcland Sakamoto Co., Ltd. | | | 13,400 | | | $ | 164,339 | |
Arcland Service Holdings Co., Ltd. | | | 5,100 | | | | 90,220 | |
Arcs Co., Ltd. | | | 20,500 | | | | 400,863 | |
Argo Graphics, Inc. | | | 5,100 | | | | 108,575 | |
As One Corp. | | | 1,400 | | | | 125,963 | |
Asahi Co., Ltd. | | | 15,900 | | | | 192,798 | |
Asahi Diamond Industrial Co., Ltd. | | | 17,200 | | | | 102,694 | |
Asahi Holdings, Inc. | | | 2,700 | | | | 52,398 | |
ASKUL Corp. | | | 12,800 | | | | 318,450 | |
Ateam, Inc. | | | 18,400 | | | | 255,714 | |
Atom Corp. | | | 16,200 | | | | 142,319 | |
Autobacs Seven Co., Ltd. | | | 18,800 | | | | 292,847 | |
Avex, Inc. | | | 11,200 | | | | 138,805 | |
Awa Bank Ltd. | | | 8,900 | | | | 218,465 | |
Axial Retailing, Inc. | | | 7,700 | | | | 282,448 | |
Azbil Corp. | | | 11,100 | | | | 261,405 | |
Bando Chemical Industries Ltd. | | | 14,400 | | | | 121,456 | |
Bank of Iwate Ltd. | | | 200 | | | | 5,402 | |
Belc Co., Ltd. | | | 4,000 | | | | 190,098 | |
Benefit One, Inc. | | | 7,200 | | | | 137,402 | |
Bengo4.com, Inc. (b) | | | 2,900 | | | | 141,033 | |
Bic Camera, Inc. | | | 31,800 | | | | 332,188 | |
BML, Inc. | | | 9,100 | | | | 258,225 | |
Broadleaf Co., Ltd. | | | 15,400 | | | | 79,015 | |
BRONCO BILLY Co., Ltd. | | | 5,900 | | | | 119,998 | |
Bunka Shutter Co., Ltd. | | | 18,100 | | | | 137,631 | |
Canon Electronics, Inc. | | | 7,200 | | | | 115,676 | |
Canon Marketing Japan, Inc. | | | 32,700 | | | | 699,777 | |
Capcom Co., Ltd. | | | 5,600 | | | | 115,447 | |
Cawachi Ltd. | | | 11,100 | | | | 188,781 | |
Central Glass Co., Ltd. | | | 2,700 | | | | 59,574 | |
Central Security Patrols Co Ltd. | | | 1,800 | | | | 92,188 | |
Change, Inc. (a)(b) | | | 600 | | | | 14,451 | |
Chiyoda Co., Ltd. | | | 18,800 | | | | 281,918 | |
Chiyoda Corp. (a)(b) | | | 81,500 | | | | 218,105 | |
Chiyoda Integre Co., Ltd. | | | 8,300 | | | | 153,875 | |
Chori Co., Ltd. | | | 11,000 | | | | 160,079 | |
Chubu Shiryo Co., Ltd. | | | 17,400 | | | | 183,209 | |
Chudenko Corp. | | | 6,800 | | | | 138,554 | |
Chugoku Marine Paints Ltd. | | | 8,400 | | | | 72,555 | |
CI Takiron Corp. | | | 33,100 | | | | 193,349 | |
Citizen Watch Co., Ltd. | | | 39,600 | | | | 183,081 | |
Cleanup Corp. | | | 19,640 | | | | 96,782 | |
CMIC Holdings Co., Ltd. | | | 700 | | | | 12,984 | |
CMK Corp. | | | 200 | | | | 1,192 | |
Coco Kara Fine, Inc. | | | 8,700 | | | | 337,997 | |
Colopl, Inc. | | | 10,200 | | | | 70,877 | |
Colowide Co., Ltd. | | | 3,800 | | | | 73,500 | |
Computer Engineering & Consulting Ltd. | | | 4,300 | | | | 76,584 | |
COMSYS Holdings Corp. | | | 4,400 | | | | 105,935 | |
Comture Corp. | | | 800 | | | | 32,224 | |
CONEXIO Corp. | | | 9,300 | | | | 110,280 | |
COOKPAD, Inc. (b) | | | 9,300 | | | | 26,605 | |
Corona Corp. | | | 5,300 | | | | 48,615 | |
Cosel Co., Ltd. | | | 3,100 | | | | 29,551 | |
Cosmos Pharmaceutical Corp. (a) | | | 2,400 | | | | 380,049 | |
Create Restaurants Holdings, Inc. (a) | | | 13,100 | | | | 171,661 | |
Create SD Holdings Co., Ltd. | | | 14,300 | | | | 310,241 | |
| | | | | | | | |
| | | SHARES | | | FAIR
VALUE | |
| Japan - 30.9% (continued) | | | | | | |
CROOZ, Inc. (b) | | | 200 | | | $ | 2,154 | |
CyberAgent, Inc. | | | 100 | | | | 3,857 | |
Cybozu, Inc. | | | 1,400 | | | | 15,284 | |
Dai-Dan Co., Ltd. | | | 6,700 | | | | 132,559 | |
Daihen Corp. | | | 500 | | | | 13,095 | |
Daiho Corp. | | | 9,000 | | | | 228,561 | |
Daiichi Jitsugyo Co., Ltd. | | | 10,100 | | | | 304,310 | |
Daiichikosho Co Ltd. | | | 2,100 | | | | 96,798 | |
Daiken Corp. | | | 4,300 | | | | 87,179 | |
Daikokutenbussan Co., Ltd. | | | 4,300 | | | | 136,898 | |
Daikyonishikawa Corp. | | | 6,200 | | | | 46,286 | |
Dainichiseika Color & Chemicals Manufacturing Co., Ltd. | | | 1,100 | | | | 29,032 | |
Daiseki Co., Ltd. | | | 2,300 | | | | 57,306 | |
Daisyo Corp. | | | 8,900 | | | | 126,726 | |
Daiwa Industries Ltd. | | | 700 | | | | 7,719 | |
Daiwabo Holdings Co., Ltd. | | | 5,600 | | | | 235,390 | |
DCM Holdings Co., Ltd. | | | 23,400 | | | | 233,860 | |
Denka Co., Ltd. | | | 1,400 | | | | 40,179 | |
Denki Kogyo Co., Ltd. | | | 2,600 | | | | 61,902 | |
Denyo Co., Ltd. | | | 10,800 | | | | 132,253 | |
Descente Ltd. | | | 7,800 | | | | 131,937 | |
DIC Corp. | | | 4,300 | | | | 104,955 | |
Digital Arts, Inc. | | | 700 | | | | 57,426 | |
Digital Hearts Holdings Co Ltd. | | | 6,500 | | | | 60,702 | |
Dip Corp. | | | 1,300 | | | | 19,650 | |
DMG Mori Co., Ltd. | | | 4,400 | | | | 54,896 | |
Doshisha Co., Ltd. | | | 11,300 | | | | 177,584 | |
Doutor Nichires Holdings Co., Ltd. | | | 2,900 | | | | 56,012 | |
DTS Corp. | | | 5,100 | | | | 207,784 | |
Duskin Co., Ltd. | | | 8,200 | | | | 214,979 | |
DyDo Group Holdings, Inc. | | | 5,600 | | | | 232,547 | |
Eagle Industry Co., Ltd. | | | 9,300 | | | | 86,679 | |
Earth Corp. | | | 2,800 | | | | 128,805 | |
Ebara Corp. | | | 10,600 | | | | 271,542 | |
EDION Corp. | | | 42,200 | | | | 368,396 | |
Ehime Bank Ltd. | | | 1,400 | | | | 14,056 | |
Eiken Chemical Co., Ltd. | | | 2,800 | | | | 49,481 | |
Eizo Corp. | | | 1,100 | | | | 40,248 | |
Elan Corp. | | | 1,600 | | | | 27,404 | |
Elecom Co., Ltd. | | | 7,000 | | | | 227,380 | |
Elematec Corp. | | | 20,800 | | | | 187,145 | |
EM Systems Co Ltd. | | | 600 | | | | 8,150 | |
Enigmo, Inc. (b) | | | 900 | | | | 26,452 | |
En-Japan, Inc. | | | 3,400 | | | | 120,639 | |
Enplas Corp. | | | 2,700 | | | | 75,495 | |
EPS Holdings, Inc. | | | 6,100 | | | | 100,142 | |
ESPEC Corp. | | | 4,100 | | | | 84,524 | |
Exedy Corp. | | | 4,900 | | | | 96,630 | |
Ezaki Glico Co., Ltd. | | | 5,700 | | | | 271,416 | |
F@N Communications, Inc. | | | 16,400 | | | | 79,151 | |
Fancl Corp. | | | 8,600 | | | | 233,005 | |
FCC Co., Ltd. | | | 11,200 | | | | 225,829 | |
Feed One Co., Ltd. | | | 81,000 | | | | 133,050 | |
Fields Corp. | | | 4,960 | | | | 24,488 | |
Foster Electric Co., Ltd. | | | 8,500 | | | | 120,011 | |
France Bed Holdings Co., Ltd. | | | 14,200 | | | | 128,942 | |
Fudo Tetra Corp. | | | 2,676 | | | | 32,745 | |
| | | | |
| | The accompanying Notes to the Financial Statements are an integral part of these Financial Statements. | | (Continued) |
| | | | | | | | | | | | | | | | |
| | Elements Portfolios | | | | | | Annual Report | | | | | | May 31, 2019 | | |
| | | | |
60
| | |
| Schedule of Investments | | as of May 31, 2019 |
| | | | |
| ELEMENTS INTERNATIONAL SMALL CAP PORTFOLIO | | | | |
| | | | | | | | |
| | | SHARES | | | FAIR
VALUE | |
| Japan - 30.9% (continued) | | | | | | |
Fuji Co., Ltd. | | | 18,700 | | | $ | 303,197 | |
Fuji Machine Manufacturing Co., Ltd. | | | 6,600 | | | | 72,660 | |
Fuji Oil Holdings, Inc. | | | 6,200 | | | | 188,234 | |
Fuji Pharma Co., Ltd. | | | 4,000 | | | | 53,080 | |
Fuji Seal International, Inc. | | | 1,500 | | | | 52,254 | |
Fuji Soft, Inc. | | | 3,800 | | | | 162,534 | |
Fujibo Holdings, Inc. | | | 1,100 | | | | 23,154 | |
Fujicco Co., Ltd. | | | 5,600 | | | | 110,589 | |
Fujikura Ltd. | | | 38,500 | | | | 127,191 | |
Fujimi, Inc. | | | 2,800 | | | | 52,943 | |
Fujimori Kogyo Co., Ltd. | | | 6,200 | | | | 158,712 | |
Fujio Food System Co Ltd. | | | 1,500 | | | | 39,491 | |
Fujitec Co., Ltd. | | | 18,700 | | | | 244,697 | |
Fujitsu General Ltd. | | | 16,300 | | | | 231,944 | |
Fujiya Co., Ltd. | | | 12,700 | | | | 227,010 | |
Fukuda Corp. | | | 4,200 | | | | 164,140 | |
Fukui Computer Holdings, Inc. | | | 4,700 | | | | 105,047 | |
Fukushima Industries Corp. | | | 4,600 | | | | 150,694 | |
Fullcast Holdings Co., Ltd. | | | 5,000 | | | | 96,526 | |
Funai Soken Holdings, Inc. | | | 2,250 | | | | 54,483 | |
Furukawa Electric Co., Ltd. | | | 7,100 | | | | 190,268 | |
Fuso Chemical Co., Ltd. | | | 1,600 | | | | 29,072 | |
Futaba Corp. | | | 13,500 | | | | 171,794 | |
Futaba Industrial Co., Ltd. | | | 3,900 | | | | 19,326 | |
Future Corp. | | | 8,200 | | | | 145,968 | |
Gecoss Corp. | | | 13,000 | | | | 113,727 | |
Genki Sushi Co., Ltd. | | | 5,900 | | | | 205,260 | |
Genky DrugStores Co., Ltd. | | | 1,500 | | | | 36,100 | |
Geo Holdings Corp. | | | 12,700 | | | | 160,208 | |
Giken Ltd. | | | 900 | | | | 26,660 | |
Glory Ltd. | | | 3,500 | | | | 86,689 | |
GMO Cloud KK | | | 500 | | | | 14,926 | |
Godo Steel Ltd. | | | 6,800 | | | | 127,384 | |
Goldwin, Inc. | | | 1,000 | | | | 127,717 | |
Gree, Inc. | | | 56,500 | | | | 256,522 | |
GS Yuasa Corp. | | | 3,400 | | | | 60,900 | |
G-Tekt Corp. | | | 4,900 | | | | 66,741 | |
GungHo Online Entertainment, Inc. | | | 67,500 | | | | 209,293 | |
Gunosy, Inc. (a)(b) | | | 1,900 | | | | 33,541 | |
Gunze Ltd. | | | 1,600 | | | | 67,107 | |
Gurunavi, Inc. | | | 23,100 | | | | 115,964 | |
H2O Retailing Corp. | | | 19,900 | | | | 215,775 | |
Halows Co., Ltd. | | | 4,100 | | | | 82,670 | |
Hamakyorex Co., Ltd. | | | 3,700 | | | | 123,430 | |
Hanwa Co., Ltd. | | | 2,200 | | | | 55,952 | |
Harmonic Drive Systems, Inc. | | | 100 | | | | 3,317 | |
Haseko Corp. | | | 14,400 | | | | 143,914 | |
Hazama Ando Corp. | | | 25,200 | | | | 165,341 | |
Heiwado Co., Ltd. | | | 21,100 | | | | 372,095 | |
Hibiya Engineering Ltd. | | | 4,900 | | | | 83,652 | |
Hiday Hidaka Corp. | | | 10,120 | | | | 188,644 | |
Hinokiya Group Co., Ltd. | | | 3,800 | | | | 70,168 | |
Hioki EE Corp. | | | 2,000 | | | | 64,781 | |
Hiramatsu, Inc. | | | 1,200 | | | | 3,721 | |
HIS Co., Ltd. | | | 3,600 | | | | 105,643 | |
Hisaka Works Ltd. | | | 2,100 | | | | 17,480 | |
Hitachi Transport System Ltd. | | | 2,100 | | | | 62,497 | |
Hitachi Zosen Corp. | | | 21,400 | | | | 70,501 | |
| | | | | | | | |
| | | SHARES | | | FAIR
VALUE | |
| Japan - 30.9% (continued) | | | | | | |
Hochiki Corp. | | | 16,000 | | | $ | 168,025 | |
Hodogaya Chemical Co., Ltd. | | | 3,400 | | | | 80,007 | |
Hogy Medical Co., Ltd. | | | 600 | | | | 19,019 | |
Horiba Ltd. | | | 1,600 | | | | 74,858 | |
Hosiden Corp. | | | 28,400 | | | | 288,285 | |
Hosokawa Micron Corp. | | | 2,300 | | | | 98,694 | |
House Foods Group, Inc. | | | 6,300 | | | | 257,256 | |
Hyakugo Bank Ltd. | | | 300 | | | | 897 | |
Ichibanya Co., Ltd. | | | 4,400 | | | | 184,137 | |
Ichikoh Industries Ltd. | | | 11,400 | | | | 60,069 | |
Ichiyoshi Securities Co., Ltd. | | | 13,600 | | | | 97,515 | |
Icom, Inc. | | | 10,100 | | | | 204,582 | |
Idec Corp. | | | 1,400 | | | | 24,676 | |
IDOM, Inc. | | | 21,500 | | | | 53,767 | |
Inaba Denki Sangyo Co., Ltd. | | | 9,000 | | | | 357,957 | |
Inabata & Co., Ltd. | | | 18,000 | | | | 224,076 | |
Ines Corp. | | | 7,500 | | | | 81,945 | |
Infocom Corp. | | | 10,200 | | | | 222,326 | |
Infomart Corp. | | | 100 | | | | 1,530 | |
Information Services International-Dentsu Ltd. | | | 3,400 | | | | 106,363 | |
Internet Initiative Japan, Inc. | | | 10,000 | | | | 192,221 | |
Iriso Electronics Co., Ltd. | | | 600 | | | | 27,352 | |
Ishihara Sangyo Kaisha Ltd. | | | 600 | | | | 5,609 | |
Ito En Ltd. | | | 9,700 | | | | 460,093 | |
Itochu Enex Co., Ltd. | | | 15,800 | | | | 122,329 | |
Itochu-Shokuhin Co., Ltd. | | | 3,600 | | | | 145,674 | |
Itoham Yonekyu Holdings, Inc. | | | 50,800 | | | | 309,399 | |
Itoki Corp. | | | 16,940 | | | | 64,249 | |
Iwatani Corp. | | | 9,000 | | | | 295,252 | |
Iyo Bank Ltd. | | | 44,900 | | | | 231,616 | |
Izumi Co., Ltd. | | | 4,600 | | | | 196,964 | |
JAC Recruitment Co., Ltd. | | | 4,000 | | | | 95,308 | |
Jafco Co., Ltd. | | | 500 | | | | 17,902 | |
Japan Aviation Electronics Industry Ltd. | | | 14,300 | | | | 200,317 | |
Japan Cash Machine Co., Ltd. | | | 10,400 | | | | 104,322 | |
Japan Elevator Service Holdings Co Ltd. | | | 4,300 | | | | 87,020 | |
Japan Lifeline Co., Ltd. | | | 800 | | | | 12,801 | |
Japan Material Co., Ltd. | | | 900 | | | | 11,362 | |
Japan Meat Co Ltd. | | | 15,800 | | | | 246,408 | |
Japan Pulp & Paper Co., Ltd. | | | 1,800 | | | | 62,954 | |
JCR Pharmaceuticals Co., Ltd. | | | 600 | | | | 37,650 | |
JCU Corp. | | | 3,900 | | | | 71,259 | |
Jeol Ltd. | | | 1,000 | | | | 21,363 | |
JINS, Inc. | | | 3,800 | | | | 226,531 | |
J-Oil Mills, Inc. | | | 4,900 | | | | 179,288 | |
Joshin Denki Co., Ltd. | | | 9,900 | | | | 200,074 | |
Joyful Honda Co., Ltd. | | | 4,100 | | | | 46,651 | |
JSP Corp. | | | 300 | | | | 5,445 | |
Justsystems Corp. | | | 2,100 | | | | 65,888 | |
JVC Kenwood Corp. | | | 76,600 | | | | 163,287 | |
K&O Energy Group, Inc. | | | 7,300 | | | | 108,660 | |
Kadokawa Dwango Corp. | | | 7,900 | | | | 105,124 | |
Kaga Electronics Co., Ltd. | | | 11,600 | | | | 169,774 | |
Kagome Co., Ltd. | | | 6,900 | | | | 161,667 | |
Kaken Pharmaceutical Co., Ltd. | | | 1,600 | | | | 75,892 | |
Kameda Seika Co., Ltd. | | | 2,700 | | | | 119,720 | |
Kamei Corp. | | | 11,300 | | | | 118,563 | |
| | | | |
| | The accompanying Notes to the Financial Statements are an integral part of these Financial Statements. | | (Continued) |
| | | | | | | | | | | | | | | | |
| | Elements Portfolios | | | | | | Annual Report | | | | | | May 31, 2019 | | |
| | | | |
61
| | |
| Schedule of Investments | | as of May 31, 2019 |
| | | | |
| ELEMENTS INTERNATIONAL SMALL CAP PORTFOLIO | | | | |
| | | | | | | | |
| | | SHARES | | | FAIR
VALUE | |
| Japan - 30.9% (continued) | | | | | | |
Kanamoto Co., Ltd. | | | 12,800 | | | $ | 284,786 | |
Kandenko Co., Ltd. | | | 29,200 | | | | 237,125 | |
Kanematsu Corp. | | | 9,200 | | | | 104,085 | |
Kanematsu Electronics Ltd. | | | 4,300 | | | | 123,804 | |
Kansai Super Market Ltd. | | | 8,600 | | | | 82,615 | |
Kanto Denka Kogyo Co., Ltd. | | | 600 | | | | 3,898 | |
Kappa Create Co., Ltd. | | | 14,100 | | | | 178,779 | |
Kasai Kogyo Co., Ltd. | | | 18,500 | | | | 127,357 | |
Katakura Industries Co., Ltd. | | | 600 | | | | 6,650 | |
Kato Sangyo Co., Ltd. | | | 11,600 | | | | 361,279 | |
Kawasaki Kisen Kaisha Ltd. (a)(b) | | | 5,500 | | | | 62,276 | |
Keihin Corp. | | | 9,600 | | | | 125,000 | |
Keiyo Co., Ltd. | | | 300 | | | | 1,373 | |
Kenko Mayonnaise Co., Ltd. | | | 700 | | | | 15,316 | |
Kewpie Corp. | | | 8,800 | | | | 197,414 | |
Key Coffee, Inc. | | | 10,300 | | | | 199,318 | |
KH Neochem Co., Ltd. | | | 300 | | | | 8,051 | |
Kinden Corp. | | | 26,700 | | | | 411,470 | |
Kintetsu Department Store Co., Ltd. | | | 5,800 | | | | 176,625 | |
Kintetsu World Express, Inc. | | | 23,900 | | | | 312,300 | |
Kisoji Co., Ltd. | | | 5,700 | | | | 132,079 | |
Kissei Pharmaceutical Co., Ltd. | | | 3,000 | | | | 70,456 | |
KLab, Inc. (b) | | | 6,300 | | | | 47,091 | |
KNT-CT Holdings Co., Ltd. (b) | | | 25,900 | | | | 349,906 | |
Koa Corp. | | | 1,800 | | | | 20,946 | |
Koatsu Gas Kogyo Co., Ltd. | | | 23,900 | | | | 178,205 | |
Kobayashi Pharmaceutical Co., Ltd. | | | 1,800 | | | | 134,213 | |
Kobe Bussan Co., Ltd. | | | 2,900 | | | | 133,673 | |
Kohnan Shoji Co., Ltd. | | | 6,400 | | | | 131,939 | |
Kokuyo Co., Ltd. | | | 23,800 | | | | 314,288 | |
Komeri Co., Ltd. | | | 9,000 | | | | 177,317 | |
Komori Corp. | | | 13,700 | | | | 140,963 | |
Konishi Co., Ltd. | | | 14,700 | | | | 213,110 | |
Konoike Transport Co., Ltd. | | | 6,700 | | | | 102,573 | |
Koshidaka Holdings Co., Ltd. | | | 6,000 | | | | 78,845 | |
Kotobuki Spirits Co., Ltd. | | | 4,000 | | | | 207,447 | |
Kourakuen Holdings Corp. | | | 1,200 | | | | 32,313 | |
Krosaki Harima Corp. | | | 1,900 | | | | 105,551 | |
K’s Holdings Corp. | | | 46,600 | | | | 444,219 | |
Kumagai Gumi Co., Ltd. | | | 6,700 | | | | 178,250 | |
Kumiai Chemical Industry Co., Ltd. | | | 13,500 | | | | 92,438 | |
Kura Corp. | | | 5,300 | | | | 206,640 | |
Kurabo Industries Ltd. | | | 12,000 | | | | 211,065 | |
Kureha Corp. | | | 700 | | | | 44,572 | |
Kusuri no Aoki Holdings Co., Ltd. | | | 2,000 | | | | 127,717 | |
KYB Corp. (b) | | | 2,200 | | | | 56,926 | |
Kyodo Printing Co., Ltd. | | | 100 | | | | 2,506 | |
Kyokuto Kaihatsu Kogyo Co., Ltd. | | | 20,400 | | | | 247,741 | |
Kyokuto Securities Co., Ltd. | | | 600 | | | | 5,066 | |
KYORIN Holdings, Inc. | | | 10,900 | | | | 190,812 | |
Kyowa Exeo Corp. | | | 5,000 | | | | 117,796 | |
Kyudenko Corp. | | | 2,200 | | | | 62,529 | |
Lasertec Corp. | | | 700 | | | | 24,547 | |
Life Corp. | | | 15,300 | | | | 324,877 | |
Lifull Co., Ltd. | | | 15,500 | | | | 85,249 | |
Link And Motivation, Inc. | | | 900 | | | | 5,008 | |
Lintec Corp. | | | 16,500 | | | | 327,061 | |
Lixil Viva Corp. | | | 11,400 | | | | 127,818 | |
| | | | | | | | |
| | | SHARES | | | FAIR
VALUE | |
| Japan - 30.9% (continued) | | | | | | |
Mabuchi Motor Co., Ltd. | | | 1,500 | | | $ | 50,247 | |
Macnica Fuji Electronics Holdings, Inc. | | | 18,400 | | | | 216,321 | |
Maeda Corp. | | | 33,700 | | | | 274,601 | |
Maeda Kosen Co., Ltd. | | | 5,100 | | | | 89,702 | |
Maeda Road Construction Co., Ltd. | | | 12,200 | | | | 245,993 | |
Makino Milling Machine Co., Ltd. | | | 1,900 | | | | 65,925 | |
Mandom Corp. | | | 8,200 | | | | 201,585 | |
Mani, Inc. | | | 1,400 | | | | 87,593 | |
Mars Group Holdings Corp. | | | 3,100 | | | | 58,959 | |
Marudai Food Co., Ltd. | | | 11,300 | | | | 199,899 | |
Maruha Nichiro Corp. | | | 6,700 | | | | 204,342 | |
Marusan Securities Co., Ltd. | | | 500 | | | | 2,602 | |
Maruwa Co., Ltd. | | | 1,600 | | | | 74,120 | |
Maruzen Showa Unyu Co., Ltd. | | | 3,000 | | | | 91,081 | |
Marvelous, Inc. | | | 9,200 | | | | 68,258 | |
Matsuda Sangyo Co., Ltd. | | | 14,000 | | | | 187,330 | |
Matsumotokiyoshi Holdings Co., Ltd. | | | 14,000 | | | | 414,064 | |
Matsuya Co., Ltd. | | | 5,500 | | | | 45,983 | |
Matsuyafoods Holdings Co., Ltd. | | | 5,200 | | | | 159,313 | |
Max Co., Ltd. | | | 12,200 | | | | 168,536 | |
Maxell Holdings Ltd. | | | 5,500 | | | | 91,815 | |
MCJ Co., Ltd. | | | 27,900 | | | | 175,332 | |
Medical Data Vision Co., Ltd. (b) | | | 2,700 | | | | 36,178 | |
Megmilk Snow Brand Co., Ltd. | | | 15,300 | | | | 304,546 | |
Meidensha Corp. | | | 5,500 | | | | 76,538 | |
Meiko Network Japan Co., Ltd. | | | 7,500 | | | | 66,304 | |
Meitec Corp. | | | 2,100 | | | | 100,189 | |
Melco Holdings, Inc. | | | 3,100 | | | | 87,394 | |
Menicon Co., Ltd. | | | 4,300 | | | | 146,025 | |
Metawater Co., Ltd. | | | 2,700 | | | | 80,976 | |
Micronics Japan Co., Ltd. | | | 6,900 | | | | 57,625 | |
Milbon Co., Ltd. | | | 2,500 | | | | 118,581 | |
Ministop Co., Ltd. | | | 20,200 | | | | 301,047 | |
Mirait Holdings Corp. | | | 8,300 | | | | 130,361 | |
Misawa Homes Co., Ltd. | | | 20,400 | | | | 182,605 | |
Mitsuba Corp. | | | 11,100 | | | | 53,367 | |
Mitsubishi Logisnext Co Ltd. | | | 11,800 | | | | 124,789 | |
Mitsubishi Pencil Co., Ltd. | | | 4,400 | | | | 78,527 | |
Mitsubishi Research Institute, Inc. | | | 4,400 | | | | 131,352 | |
Mitsubishi Shokuhin Co., Ltd. | | | 18,700 | | | | 490,084 | |
Mitsubishi Steel Manufacturing Co., Ltd. | | | 40 | | | | 413 | |
Mitsuboshi Belting Ltd. | | | 6,300 | | | | 114,646 | |
Mitsui Mining & Smelting Co., Ltd. | | | 200 | | | | 4,245 | |
Mitsui Sugar Co., Ltd. | | | 1,100 | | | | 23,225 | |
Mitsui-Soko Holdings Co., Ltd. | | | 1,200 | | | | 17,873 | |
Miura Co., Ltd. | | | 3,900 | | | | 121,464 | |
Mixi, Inc. | | | 17,600 | | | | 372,253 | |
Miyazaki Bank Ltd. | | | 1,100 | | | | 26,281 | |
Mizuno Corp. | | | 10,800 | | | | 239,291 | |
Mochida Pharmaceutical Co., Ltd. | | | 4,500 | | | | 205,971 | |
Modec, Inc. | | | 100 | | | | 2,525 | |
Morinaga & Co., Ltd. | | | 5,800 | | | | 262,797 | |
Morinaga Milk Industry Co., Ltd. | | | 6,700 | | | | 243,912 | |
Morita Holdings Corp. | | | 1,700 | | | | 29,791 | |
MOS Food Services, Inc. | | | 6,500 | | | | 142,578 | |
MTI Ltd. | | | 600 | | | | 3,671 | |
Musashi Seimitsu Industry Co., Ltd. | | | 200 | | | | 2,479 | |
Nachi-Fujikoshi Corp. | | | 100 | | | | 3,820 | |
| | | | |
| | The accompanying Notes to the Financial Statements are an integral part of these Financial Statements. | | (Continued) |
| | | | | | | | | | | | | | | | |
| | Elements Portfolios | | | | | | Annual Report | | | | | | May 31, 2019 | | |
| | | | |
62
| | |
| Schedule of Investments | | as of May 31, 2019 |
| | | | |
| ELEMENTS INTERNATIONAL SMALL CAP PORTFOLIO | | | | |
| | | | | | | | |
| | | SHARES | | | FAIR
VALUE | |
| Japan - 30.9% (continued) | | | | | | |
Nagaileben Co., Ltd. | | | 100 | | | $ | 2,211 | |
Nagase & Co., Ltd. | | | 15,600 | | | | 228,317 | |
Nagatanien Holdings Co., Ltd. | | | 2,600 | | | | 51,417 | |
Nakanishi, Inc. | | | 2,700 | | | | 50,131 | |
Nakayama Steel Works Ltd. | | | 26,300 | | | | 114,796 | |
NEC Networks & System Integration Corp. | | | 11,100 | | | | 279,843 | |
NET One Systems Co., Ltd. | | | 13,800 | | | | 370,963 | |
Neturen Co., Ltd. | | | 5,500 | | | | 41,568 | |
Nextage Co., Ltd. | | | 7,600 | | | | 77,708 | |
NHK Spring Co., Ltd. | | | 19,400 | | | | 142,862 | |
Nichias Corp. | | | 1,000 | | | | 16,795 | |
Nichiban Co., Ltd. | | | 1,800 | | | | 38,769 | |
Nichiden Corp. | | | 13,700 | | | | 209,612 | |
Nichiha Corp. | | | 2,800 | | | | 73,666 | |
NichiiGakkan Co., Ltd. | | | 14,700 | | | | 190,728 | |
Nichi-iko Pharmaceutical Co., Ltd. | | | 5,300 | | | | 60,109 | |
Nichirei Corp. | | | 9,700 | | | | 237,566 | |
Nifco, Inc. | | | 2,200 | | | | 55,322 | |
Nihon Chouzai Co., Ltd. | | | 5,700 | | | | 186,467 | |
Nihon Kohden Corp. | | | 6,300 | | | | 181,678 | |
Nihon M&A Center, Inc. | | | 200 | | | | 4,989 | |
Nihon Nohyaku Co Ltd. | | | 4,800 | | | | 17,984 | |
Nihon Parkerizing Co., Ltd. | | | 3,700 | | | | 41,041 | |
Nihon Trim Co., Ltd. | | | 2,100 | | | | 99,220 | |
Nihon Unisys Ltd. | | | 18,700 | | | | 611,743 | |
Nippo Corp. | | | 12,100 | | | | 236,607 | |
Nippon Beet Sugar Manufacturing Co., Ltd. | | | 6,900 | | | | 119,388 | |
Nippon Ceramic Co., Ltd. | | | 300 | | | | 7,929 | |
NipponChemi-Con Corp. | | | 2,600 | | | | 37,525 | |
Nippon Densetsu Kogyo Co., Ltd. | | | 5,100 | | | | 107,916 | |
Nippon Flour Mills Co., Ltd. | | | 15,400 | | | | 253,102 | |
Nippon Gas Co., Ltd. | | | 2,000 | | | | 47,580 | |
Nippon Kanzai Co., Ltd. | | | 8,100 | | | | 135,891 | |
Nippon Kayaku Co., Ltd. | | | 6,700 | | | | 77,409 | |
Nippon Light Metal Holdings Co., Ltd. | | | 66,800 | | | | 141,780 | |
Nippon Parking Development Co., Ltd. | | | 3,800 | | | | 6,067 | |
Nippon Seiki Co., Ltd. | | | 14,200 | | | | 231,021 | |
Nippon Shinyaku Co., Ltd. | | | 1,800 | | | | 124,911 | |
Nippon Shokubai Co., Ltd. | | | 500 | | | | 30,084 | |
Nippon Soda Co., Ltd. | | | 2,600 | | | | 62,382 | |
Nippon Steel & Sumikin Bussan Corp. | | | 7,100 | | | | 274,198 | |
Nippon Suisan Kaisha Ltd. | | | 60,800 | | | | 370,304 | |
Nishimatsu Construction Co., Ltd. | | | 3,100 | | | | 59,445 | |
Nishimatsuya Chain Co., Ltd. | | | 42,000 | | | | 337,581 | |
Nishimoto Co., Ltd. | | | 7,500 | | | | 276,496 | |
Nishio Rent All Co., Ltd. | | | 200 | | | | 5,199 | |
Nissan Shatai Co., Ltd. | | | 20,300 | | | | 184,520 | |
Nissha Co., Ltd. | | | 4,300 | | | | 40,197 | |
Nisshinbo Holdings, Inc. | | | 5,500 | | | | 38,269 | |
Nissin Corp. | | | 9,100 | | | | 146,873 | |
Nissin Electric Co., Ltd. | | | 6,700 | | | | 65,043 | |
Nissin Kogyo Co., Ltd. | | | 20,300 | | | | 254,581 | |
Nitta Corp. | | | 3,200 | | | | 89,623 | |
Nittetsu Mining Co., Ltd. | | | 5,900 | | | | 232,755 | |
Nitto Kogyo Corp. | | | 8,800 | | | | 150,883 | |
Nitto Kohki Co., Ltd. | | | 5,700 | | | | 109,461 | |
Noevir Holdings Co., Ltd. | | | 2,300 | | | | 120,131 | |
| | | | | | | | |
| | | SHARES | | | FAIR
VALUE | |
| Japan - 30.9% (continued) | | | | | | |
NOF Corp. | | | 7,700 | | | $ | 278,185 | |
Nohmi Bosai Ltd. | | | 7,600 | | | | 144,194 | |
Nojima Corp. | | | 19,800 | | | | 334,370 | |
NOK Corp. | | | 22,500 | | | | 289,646 | |
Nomura Co., Ltd. | | | 11,800 | | | | 149,508 | |
Noritake Co., Ltd. | | | 2,100 | | | | 88,756 | |
Noritz Corp. | | | 20,300 | | | | 257,017 | |
NS Solutions Corp. | | | 6,600 | | | | 206,164 | |
NS United Kaiun Kaisha Ltd. | | | 11,000 | | | | 230,120 | |
NSD Co., Ltd. | | | 6,200 | | | | 173,073 | |
Obara Group, Inc. | | | 100 | | | | 3,281 | |
Ohsho Food Service Corp. | | | 1,700 | | | | 104,166 | |
Oiles Corp. | | | 3,100 | | | | 41,938 | |
Oisix ra daichi, Inc. (b) | | | 12,100 | | | | 158,557 | |
Okabe Co., Ltd. | | | 8,400 | | | | 74,570 | |
Okamura Corp. | | | 18,300 | | | | 179,850 | |
Oki Electric Industry Co., Ltd. | | | 15,500 | | | | 191,238 | |
OKUMA Corp. | | | 4,300 | | | | 210,705 | |
Okumura Corp. | | | 5,600 | | | | 171,827 | |
Okuwa Co., Ltd. | | | 26,300 | | | | 257,018 | |
Onward Holdings Co., Ltd. | | | 15,500 | | | | 81,816 | |
Open Door, Inc. (b) | | | 300 | | | | 8,361 | |
OPT Holding, Inc. (a) | | | 7,300 | | | | 93,098 | |
Optex Group Co., Ltd. | | | 2,900 | | | | 34,603 | |
Optim Corp. (a)(b) | | | 800 | | | | 19,143 | |
Optorun Co., Ltd. | | | 1,100 | | | | 23,641 | |
Organo Corp. | | | 5,400 | | | | 161,703 | |
Oro Co., Ltd. (a) | | | 800 | | | | 21,173 | |
Osaka Soda Co., Ltd. | | | 4,300 | | | | 103,527 | |
Osaki Electric Co., Ltd. | | | 32,700 | | | | 191,918 | |
OSG Corp. | | | 4,400 | | | | 83,440 | |
OSJB Holdings Corp. | | | 43,500 | | | | 111,194 | |
Oyo Corp. | | | 22,200 | | | | 216,336 | |
Pacific Industrial Co., Ltd. | | | 2,000 | | | | 26,319 | |
PAL Group Holdings Co., Ltd. | | | 9,600 | | | | 291,459 | |
PALTAC Corp. | | | 1,900 | | | | 98,187 | |
Paramount Bed Holdings Co., Ltd. | | | 1,300 | | | | 49,665 | |
Pasona Group, Inc. | | | 18,300 | | | | 282,526 | |
PC Depot Corp. | | | 35,480 | | | | 128,018 | |
Penta-Ocean Construction Co., Ltd. | | | 43,900 | | | | 195,669 | |
PIA Corp. | | | 2,800 | | | | 124,930 | |
Pilot Corp. | | | 2,200 | | | | 82,527 | |
Piolax, Inc. | | | 5,700 | | | | 93,996 | |
Plenus Co., Ltd. | | | 15,100 | | | | 255,557 | |
Press Kogyo Co., Ltd. | | | 44,700 | | | | 191,398 | |
Prestige International, Inc. | | | 7,400 | | | | 102,568 | |
Prima Meat Packers Ltd. | | | 10,300 | | | | 201,694 | |
Proto Corp. | | | 15,000 | | | | 248,327 | |
Qol Holdings Co Ltd. | | | 5,800 | | | | 77,126 | |
Raito Kogyo Co., Ltd. | | | 11,900 | | | | 146,382 | |
Rakus Co., Ltd. | | | 2,900 | | | | 68,482 | |
Relia, Inc. | | | 32,500 | | | | 352,097 | |
Relo Group, Inc. | | | 3,100 | | | | 83,247 | |
Rengo Co., Ltd. | | | 1,400 | | | | 11,188 | |
Restar Holdings Corp. | | | 7,600 | | | | 104,779 | |
Retail Partners Co., Ltd. | | | 5,000 | | | | 52,923 | |
Rheon Automatic Machinery Co., Ltd. | | | 2,700 | | | | 39,417 | |
Right On Co., Ltd. | | | 400 | | | | 2,595 | |
| | | | |
| | The accompanying Notes to the Financial Statements are an integral part of these Financial Statements. | | (Continued) |
| | | | | | | | | | | | | | | | |
| | Elements Portfolios | | | | | | Annual Report | | | | | | May 31, 2019 | | |
| | | | |
63
| | |
| Schedule of Investments | | as of May 31, 2019 |
| | | | |
| ELEMENTS INTERNATIONAL SMALL CAP PORTFOLIO | | | | |
| | | | | | | | |
| | | SHARES | | | FAIR
VALUE | |
| Japan - 30.9% (continued) | | | | | | |
Riken Corp. | | | 1,900 | | | $ | 75,569 | |
Riken Keiki Co., Ltd. | | | 2,500 | | | | 44,387 | |
Riken Vitamin Co., Ltd. | | | 1,300 | | | | 41,628 | |
Ringer Hut Co., Ltd. | | | 6,200 | | | | 134,339 | |
Riso Kagaku Corp. | | | 8,900 | | | | 143,645 | |
Riso Kyoiku Co., Ltd. | | | 18,000 | | | | 72,588 | |
Rock Field Co., Ltd. | | | 2,700 | | | | 39,467 | |
Rohto Pharmaceutical Co., Ltd. | | | 6,900 | | | | 188,474 | |
Rokko Butter Co., Ltd. | | | 100 | | | | 1,852 | |
Roland DG Corp. | | | 7,800 | | | | 174,909 | |
Rorze Corp. | | | 1,200 | | | | 23,587 | |
Royal Holdings Co., Ltd. | | | 9,700 | | | | 241,236 | |
Ryobi Ltd. | | | 2,400 | | | | 43,940 | |
Ryosan Co., Ltd. | | | 4,900 | | | | 115,305 | |
Ryoyo Electro Corp. | | | 9,200 | | | | 141,695 | |
S Foods, Inc. | | | 5,900 | | | | 198,726 | |
Sac’s Bar Holdings, Inc. | | | 18,300 | | | | 168,705 | |
Saint Marc Holdings Co., Ltd. | | | 9,500 | | | | 206,981 | |
Saizeriya Co., Ltd. | | | 14,600 | | | | 326,855 | |
Sakai Chemical Industry Co., Ltd. | | | 3,800 | | | | 87,000 | |
Sakai Moving Service Co., Ltd. | | | 2,400 | | | | 142,408 | |
Sakata INX Corp. | | | 6,000 | | | | 52,821 | |
Sakata Seed Corp. | | | 1,600 | | | | 48,724 | |
San ju San Financial Group, Inc. | | | 400 | | | | 5,319 | |
San-A Co., Ltd. | | | 4,400 | | | | 170,941 | |
San-Ai Oil Co., Ltd. | | | 41,300 | | | | 360,158 | |
Sangetsu Corp. | | | 5,100 | | | | 97,703 | |
Sanki Engineering Co., Ltd. | | | 13,500 | | | | 152,235 | |
Sankyo Tateyama, Inc. | | | 6,600 | | | | 69,371 | |
Sankyu, Inc. | | | 6,800 | | | | 345,130 | |
Sanrio Co., Ltd. | | | 6,100 | | | | 136,112 | |
Sanshin Electronics Co., Ltd. | | | 4,300 | | | | 70,235 | |
Sanwa Holdings Corp. | | | 7,100 | | | | 71,088 | |
Sanyo Chemical Industries Ltd. | | | 1,400 | | | | 72,090 | |
Sanyo Denki Co., Ltd. | | | 900 | | | | 31,560 | |
Sapporo Holdings Ltd. | | | 6,500 | | | | 135,440 | |
Sato Holdings Corp. | | | 7,100 | | | | 177,557 | |
Sawai Pharmaceutical Co., Ltd. | | | 2,900 | | | | 149,596 | |
SCSK Corp. | | | 4,700 | | | | 227,703 | |
Seiko Holdings Corp. | | | 1,800 | | | | 33,587 | |
Seino Holdings Co., Ltd. | | | 28,400 | | | | 362,191 | |
Seiren Co., Ltd. | | | 5,200 | | | | 66,029 | |
Sekisui Jushi Corp. | | | 6,000 | | | | 112,896 | |
Sekisui Plastics Co., Ltd. | | | 8,000 | | | | 52,120 | |
Senko Group Holdings Co., Ltd. | | | 11,100 | | | | 89,832 | |
Senshu Ikeda Holdings, Inc. | | | 700 | | | | 1,376 | |
Seria Co., Ltd. | | | 8,500 | | | | 211,784 | |
Shibuya Corp. | | | 700 | | | | 18,643 | |
Shikoku Bank Ltd. | | | 400 | | | | 3,536 | |
Shikoku Chemicals Corp. | | | 4,200 | | | | 39,068 | |
Shikoku Electric Power Co., Inc. | | | 300 | | | | 2,738 | |
Shima Seiki Manufacturing Ltd. | | | 600 | | | | 16,566 | |
Shimachu Co., Ltd. | | | 4,600 | | | | 104,213 | |
Shindengen Eletric Manufacturing Co., Ltd. | | | 800 | | | | 25,469 | |
Shin-Etsu Polymer Co., Ltd. | | | 23,600 | | | | 161,377 | |
Shinko Electric Industries Co., Ltd. | | | 13,600 | | | | 109,438 | |
Shinko Plantech Co., Ltd. | | | 14,300 | | | | 159,145 | |
| | | | | | | | |
| | | SHARES | | | FAIR
VALUE | |
| Japan - 30.9% (continued) | | | | | | |
Shinmaywa Industries Ltd. | | | 17,900 | | | $ | 214,242 | |
Shinnihon Corp. | | | 24,200 | | | | 196,744 | |
Ship Healthcare Holdings, Inc. | | | 4,600 | | | | 196,115 | |
Shizuoka Gas Co., Ltd. | | | 36,500 | | | | 277,207 | |
Shoei Co., Ltd. | | | 800 | | | | 31,855 | |
Shoei Foods Corp. | | | 100 | | | | 2,801 | |
Showa Corp. | | | 9,300 | | | | 114,228 | |
Showa Denko K.K. | | | 5,600 | | | | 154,360 | |
Showa Sangyo Co., Ltd. | | | 9,500 | | | | 266,068 | |
Siix Corp. | | | 7,600 | | | | 83,459 | |
Sinanen Holdings Co., Ltd. | | | 7,300 | | | | 124,490 | |
Sinko Industries Ltd. | | | 4,400 | | | | 64,844 | |
Sintokogio Ltd. | | | 12,800 | | | | 108,079 | |
SKY Perfect JSAT Holdings, Inc. | | | 800 | | | | 3,049 | |
Skylark Co., Ltd. | | | 38,100 | | | | 674,349 | |
Sodick Co., Ltd. | | | 200 | | | | 1,733 | |
Softbank Technology Corp. | | | 6,300 | | | | 136,040 | |
Sogo Medical Holdings Co., Ltd. | | | 3,200 | | | | 51,382 | |
Sojitz Corp. | | | 77,700 | | | | 250,240 | |
Solasto Corp. | | | 1,200 | | | | 10,631 | |
Square Enix Holdings Co., Ltd. | | | 5,700 | | | | 201,195 | |
ST Corp. | | | 5,400 | | | | 85,511 | |
Star Micronics Co., Ltd. | | | 1,600 | | | | 19,549 | |
Starzen Co., Ltd. | | | 3,200 | | | | 118,858 | |
Studio Alice Co., Ltd. | | | 5,300 | | | | 98,991 | |
Sugi Holdings Co., Ltd. | | | 10,500 | | | | 478,176 | |
Sumitomo Bakelite Co., Ltd. | | | 4,600 | | | | 158,335 | |
Sumitomo Densetsu Co., Ltd. | | | 12,700 | | | | 191,968 | |
Sumitomo Mitsui Construction Co., Ltd. | | | 31,460 | | | | 178,834 | |
Sumitomo Riko Co., Ltd. | | | 15,800 | | | | 113,289 | |
Sumitomo Seika Chemicals Co., Ltd. | | | 3,600 | | | | 111,457 | |
Sumitomo Warehouse Co., Ltd. | | | 500 | | | | 6,354 | |
Sushiro Global Holdings Ltd. | | | 3,300 | | | | 229,917 | |
Systena Corp. | | | 10,000 | | | | 145,250 | |
T. Hasegawa Co., Ltd. | | | 5,100 | | | | 84,525 | |
Tachi-S Co., Ltd. | | | 21,800 | | | | 259,914 | |
Tadano Ltd. | | | 4,800 | | | | 46,598 | |
Taihei Dengyo Kaisha Ltd. | | | 1,300 | | | | 24,365 | |
Taiho Kogyo Co., Ltd. | | | 10,400 | | | | 76,682 | |
Taikisha Ltd. | | | 1,500 | | | | 44,848 | |
Taiyo Yuden Co., Ltd. | | | 300 | | | | 5,526 | |
Takamatsu Construction Group Co., Ltd. | | | 8,600 | | | | 184,595 | |
Takara Holdings, Inc. | | | 13,100 | | | | 142,043 | |
Takara Standard Co., Ltd. | | | 12,700 | | | | 191,616 | |
Takasago International Corp. | | | 100 | | | | 2,842 | |
Takasago Thermal Engineering Co., Ltd. | | | 9,400 | | | | 145,036 | |
Takeuchi Manufacturing Co., Ltd. | | | 3,100 | | | | 51,264 | |
Takuma Co., Ltd. | | | 19,900 | | | | 260,767 | |
Tamron Co., Ltd. | | | 14,300 | | | | 290,051 | |
Tanseisha Co., Ltd. | | | 11,800 | | | | 122,394 | |
Tatsuta Electric Wire and Cable Co., Ltd. | | | 17,100 | | | | 68,959 | |
Tayca Corp. | | | 3,000 | | | | 62,649 | |
TechnoPro Holdings, Inc. | | | 1,700 | | | | 87,537 | |
TeikokuSen-I Co., Ltd. | | | 1,900 | | | | 38,749 | |
Tekken Corp. | | | 4,400 | | | | 119,780 | |
Tenma Corp. | | | 7,100 | | | | 116,952 | |
T-Gaia Corp. | | | 25,200 | | | | 407,888 | |
The Japan Steel Works Ltd. | | | 1,900 | | | | 28,930 | |
| | | | |
| | The accompanying Notes to the Financial Statements are an integral part of these Financial Statements. | | (Continued) |
| | | | | | | | | | | | | | | | |
| | Elements Portfolios | | | | | | Annual Report | | | | | | May 31, 2019 | | |
| | | | |
64
| | |
| Schedule of Investments | | as of May 31, 2019 |
| | | | |
| ELEMENTS INTERNATIONAL SMALL CAP PORTFOLIO | | | | |
| | | | | | | | |
| | | SHARES | | | FAIR
VALUE | |
| Japan - 30.9% (continued) | | | | | | |
The Japan Wool Textile Co., Ltd. | | | 7,900 | | | $ | 60,509 | |
The Monogatari Corp. | | | 1,200 | | | | 95,787 | |
The Nippon Road Co., Ltd. | | | 2,000 | | | | 112,398 | |
The Nisshin Oillio Group Ltd. | | | 7,300 | | | | 213,210 | |
The Pack Corp. | | | 5,000 | | | | 143,727 | |
The Shiga Bank Ltd. | | | 3,900 | | | | 92,457 | |
TIS, Inc. | | | 5,500 | | | | 274,074 | |
TKC Corp. | | | 4,600 | | | | 186,988 | |
Toa Corp. | | | 10,300 | | | | 141,243 | |
Toagosei Co., Ltd. | | | 14,100 | | | | 152,496 | |
Tocalo Co., Ltd. | | | 400 | | | | 2,617 | |
Toda Corp. | | | 7,100 | | | | 39,246 | |
Toei Animation Co., Ltd. | | | 700 | | | | 34,882 | |
Toei Co., Ltd. | | | 800 | | | | 107,784 | |
Toenec Corp. | | | 1,300 | | | | 35,774 | |
Toho Holdings Co., Ltd. | | | 15,700 | | | | 351,915 | |
Toho Zinc Co., Ltd. | | | 200 | | | | 4,293 | |
Tokai Carbon Co., Ltd. | | | 4,600 | | | | 44,274 | |
Tokai Corp. | | | 7,500 | | | | 166,036 | |
Tokai Holdings Corp. | | | 8,900 | | | | 72,685 | |
Tokai Rika Co., Ltd. | | | 16,900 | | | | 258,572 | |
Tokuyama Corp. | | | 7,400 | | | | 165,256 | |
Tokyo Base Co., Ltd. (b) | | | 2,800 | | | | 21,007 | |
Tokyo Broadcasting System Holdings, Inc. | | | 13,300 | | | | 221,656 | |
Tokyo Seimitsu Co., Ltd. | | | 5,100 | | | | 118,223 | |
Tokyo Steel Manufacturing Co., Ltd. | | | 18,300 | | | | 140,334 | |
Tokyu Construction Co., Ltd. | | | 27,500 | | | | 194,643 | |
Tomy Co., Ltd. | | | 12,000 | | | | 143,404 | |
Tonami Holdings Co Ltd. | | | 500 | | | | 26,023 | |
Toppan Forms Co., Ltd. | | | 41,700 | | | | 336,324 | |
Topre Corp. | | | 3,300 | | | | 52,439 | |
Toridoll Holdings Corp. | | | 100 | | | | 1,731 | |
Torii Pharmaceutical Co., Ltd. | | | 10,100 | | | | 220,053 | |
Toshiba Machine Co., Ltd. | | | 4,900 | | | | 103,232 | |
Toshiba Plant Systems & Services Corp. | | | 8,900 | | | | 156,622 | |
Toshiba TEC Corp. | | | 15,500 | | | | 383,334 | |
Tosho Printing Co., Ltd. | | | 9,500 | | | | 110,548 | |
Totetsu Kogyo Co., Ltd. | | | 2,500 | | | | 68,934 | |
Towa Bank Ltd. | | | 8,400 | | | | 56,277 | |
Toyo Construction Co., Ltd. | | | 56,300 | | | | 208,336 | |
Toyo Corp. | | | 200 | | | | 1,659 | |
Toyo Ink SC Holdings Co., Ltd. | | | 4,100 | | | | 85,583 | |
Toyo Tanso Co., Ltd. | | | 4,100 | | | | 76,200 | |
Toyo Tire Corp. | | | 2,800 | | | | 35,011 | |
Toyota Boshoku Corp. | | | 26,600 | | | | 326,962 | |
TPR Co., Ltd. | | | 7,600 | | | | 123,926 | |
Trancom Co., Ltd. | | | 3,100 | | | | 187,662 | |
Transcosmos, Inc. | | | 10,800 | | | | 238,693 | |
Trusco Nakayama Corp. | | | 3,100 | | | | 68,943 | |
Trust Tech, Inc. | | | 1,800 | | | | 52,240 | |
TS Tech Co., Ltd. | | | 12,400 | | | | 304,035 | |
TSI Holdings Co., Ltd. | | | 11,100 | | | | 63,610 | |
Tsubakimoto Chain Co. | | | 1,600 | | | | 48,134 | |
Tsugami Corp. | | | 10,100 | | | | 80,528 | |
Tsukishima Kikai Co., Ltd. | | | 3,500 | | | | 42,311 | |
Tsukui Corp. | | | 7,000 | | | | 34,172 | |
Tsurumi Manufacturing Co., Ltd. | | | 3,500 | | | | 61,883 | |
Tsutsumi Jewelry Co., Ltd. | | | 400 | | | | 7,386 | |
| | | | | | | | |
| | | SHARES | | | FAIR
VALUE | |
| Japan - 30.9% (continued) | | | | | | |
TV Asahi Holdings Corp. | | | 15,900 | | | $ | 254,570 | |
Ube Industries Ltd. | | | 9,300 | | | | 178,594 | |
Ulvac, Inc. | | | 1,400 | | | | 40,244 | |
Union Tool Co. | | | 200 | | | | 4,872 | |
Unipres Corp. | | | 19,300 | | | | 305,267 | |
United Arrows Ltd. | | | 4,600 | | | | 153,029 | |
United Super Markets Holdings, Inc. | | | 49,700 | | | | 427,907 | |
United, Inc. | | | 300 | | | | 3,920 | |
Ushio, Inc. | | | 11,100 | | | | 139,717 | |
UT Group Co., Ltd. | | | 3,300 | | | | 76,223 | |
Valor Holdings Co., Ltd. | | | 14,900 | | | | 303,184 | |
Valqua Ltd. | | | 2,900 | | | | 55,128 | |
ValueCommerce Co., Ltd. | | | 1,400 | | | | 33,048 | |
Vector, Inc. (b) | | | 200 | | | | 2,058 | |
VISION, Inc. (b) | | | 2,400 | | | | 124,690 | |
Vital KSK Holdings, Inc. | | | 31,700 | | | | 304,231 | |
VT Holdings Co., Ltd. | | | 18,000 | | | | 75,246 | |
Wacoal Holdings Corp. | | | 13,900 | | | | 346,586 | |
Wacom Co., Ltd. | | | 100 | | | | 309 | |
Wakita & Co., Ltd. | | | 21,600 | | | | 200,921 | |
Warabeya Nichiyo Holdings Co., Ltd. | | | 16,400 | | | | 248,047 | |
Watami Co., Ltd. | | | 16,200 | | | | 214,226 | |
WDB Holdings Co., Ltd. | | | 2,600 | | | | 63,989 | |
World Co Ltd. | | | 3,700 | | | | 75,287 | |
World Holdings Co., Ltd. | | | 7,800 | | | | 114,590 | |
Wowow, Inc. | | | 3,400 | | | | 82,894 | |
Xebio Holdings Co., Ltd. | | | 27,800 | | | | 309,901 | |
Yahagi Construction Co., Ltd. | | | 12,100 | | | | 80,283 | |
Yakuodo Co., Ltd. | | | 700 | | | | 14,192 | |
YAMABIKO Corp. | | | 8,500 | | | | 72,085 | |
YAMADA Consulting Group Co., Ltd. | | | 400 | | | | 7,729 | |
YA-MAN Ltd. (a) | | | 6,400 | | | | 56,284 | |
Yamato Kogyo Co., Ltd. | | | 7,700 | | | | 212,245 | |
Yamazen Corp. | | | 38,100 | | | | 354,754 | |
Yaoko Co., Ltd. | | | 5,100 | | | | 244,728 | |
Yellow Hat Ltd. | | | 18,900 | | | | 243,128 | |
Yodogawa Steel Works Ltd. | | | 9,100 | | | | 164,592 | |
Yokogawa Bridge Holdings Corp. | | | 6,600 | | | | 94,647 | |
Yondoshi Holdings, Inc. | | | 4,300 | | | | 95,154 | |
Yonex Co., Ltd. | | | 15,400 | | | | 91,662 | |
Yorozu Corp. | | | 3,500 | | | | 41,826 | |
Yoshinoya Holdings Co., Ltd. | | | 12,300 | | | | 203,628 | |
Yuasa Trading Co., Ltd. | | | 8,300 | | | | 225,873 | |
Yumeshin Holdings Co., Ltd. | | | 500 | | | | 3,271 | |
Yurtec Corp. | | | 23,600 | | | | 156,803 | |
Yushin Precision Equipment Co., Ltd. | | | 6,100 | | | | 59,500 | |
Zenkoku Hosho Co., Ltd. | | | 100 | | | | 3,839 | |
Zenrin Co., Ltd. | | | 1,350 | | | | 25,576 | |
Zensho Holdings Co., Ltd. | | | 10,400 | | | | 216,417 | |
Zeon Corp. | | | 23,800 | | | | 225,338 | |
ZERIA Pharmaceutical Co., Ltd. | | | 3,900 | | | | 72,987 | |
ZIGExN Co., Ltd. | | | 200 | | | | 1,312 | |
Zojirushi Corp. | | | 12,900 | | | | 136,898 | |
| | | | | | | | |
| | | | | | | 93,909,595 | |
| | | | | | | | |
| Liechtenstein - 0.0% (d) | | | | | | |
Liechtensteinische Landesbank AG | | | 1,035 | | | | 66,881 | |
| | | | | | | | |
| | | | | | | | |
| | | | |
| | The accompanying Notes to the Financial Statements are an integral part of these Financial Statements. | | (Continued) |
| | | | | | | | | | | | | | | | |
| | Elements Portfolios | | | | | | Annual Report | | | | | | May 31, 2019 | | |
| | | | |
65
| | |
| Schedule of Investments | | as of May 31, 2019 |
| | | | |
| ELEMENTS INTERNATIONAL SMALL CAP PORTFOLIO | | | | |
| | | | | | | | |
| | | SHARES | | | FAIR
VALUE | |
| Luxembourg - 0.2% | | | | | | |
Aperam, S.A. | | | 20,555 | | | $ | 484,752 | |
CORESTATE CAPHLDG | | | 365 | | | | 11,825 | |
eDreams ODIGEO SA (b) | | | 4,554 | | | | 15,771 | |
Senvion, S.A. (b) | | | 2,327 | | | | 2,080 | |
Stabilus S.A. | | | 394 | | | | 16,682 | |
| | | | | | | | |
| | | | | | | 531,110 | |
| | | | | | | | |
| Malta - 0.2% | | | | | | |
Kindred Group PLC | | | 80,477 | | | | 627,772 | |
| | | | | | | | |
| | | | | | | | |
| Netherlands - 2.7% | | | | | | |
Aalberts Industries N.V. | | | 11,889 | | | | 391,948 | |
Accell Group N.V. | | | 6,284 | | | | 170,942 | |
Altice N.V. - Class A (b) | | | 104,190 | | | | 320,905 | |
Arcadis N.V. (a) | | | 46,419 | | | | 861,868 | |
ASR Nederland N.V. | | | 21,482 | | | | 814,998 | |
Brunel International N.V. | | | 27,794 | | | | 415,452 | |
Constellium N.V. (b) | | | 15,341 | | | | 125,336 | |
Corbion N.V. | | | 342 | | | | 10,492 | |
Flow Traders (c) (Cost: $28,828; Original Acquisition Date: 05/30/2019) | | | 1,044 | | | | 29,438 | |
ForFarmers N.V. | | | 72,755 | | | | 576,266 | |
IMCD N.V. | | | 691 | | | | 56,391 | |
Kendrion N.V. | | | 5,218 | | | | 105,977 | |
Koninklijke Volkerwessels N.V. | | | 17,138 | | | | 311,311 | |
LyondellBasell Industries N.V. | | | 17,429 | | | | 1,294,103 | |
Rhi Magnesita N.V. | | | 4,818 | | | | 293,344 | |
SBM Offshore N.V. | | | 26,869 | | | | 475,317 | |
SIF Holding N.V. (a) | | | 4,388 | | | | 53,041 | |
Signify N.V. (a)(c) (Cost: $1,343,271; Original Acquisition Date: 05/22/2018) | | | 50,453 | | | | 1,350,479 | |
TKH Group N.V. | | | 1,919 | | | | 89,783 | |
TomTom N.V. | | | 11,880 | | | | 103,188 | |
Wessanen | | | 27,415 | | | | 347,921 | |
| | | | | | | | |
| | | | | | | 8,198,500 | |
| | | | | | | | |
| Norway - 1.7% | | | | | | |
Aker ASA | | | 329 | | | | 18,890 | |
Aker BP ASA | | | 4,799 | | | | 129,630 | |
Aker Solutions ASA (b) | | | 46,290 | | | | 183,960 | |
Atea ASA | | | 52,051 | | | | 717,272 | |
Austevoll Seafood ASA | | | 39,395 | | | | 413,455 | |
B2Holding ASA | | | 123,405 | | | | 149,749 | |
DNO ASA | | | 59,973 | | | | 104,127 | |
Elkem ASA (c) (Cost: $406,655; Original Acquisition Date: 01/22/2019) | | | 135,614 | | | | 414,356 | |
Europris ASA (c) (Cost: $261,130; Original Acquisition Date: 05/22/2018) | | | 96,052 | | | | 269,113 | |
Grieg Seafood ASA | | | 14,655 | | | | 207,977 | |
Kongsberg Automotive ASA (b) | | | 105,616 | | | | 74,701 | |
Kvaerner ASA | | | 7,915 | | | | 11,377 | |
Leroy Seafood Group ASA (a) | | | 12,050 | | | | 82,612 | |
Nordic Semiconductor ASA (b) | | | 3,001 | | | | 12,262 | |
Norway Royal Salmon ASA | | | 10,320 | | | | 233,717 | |
PGS ASA (b) | | | 141,118 | | | | 236,145 | |
Salmar ASA | | | 15,177 | | | | 693,671 | |
Stolt-Nielsen Ltd. | | | 1,596 | | | | 18,054 | |
Storebrand ASA | | | 13,454 | | | | 97,403 | |
| | | | | | | | |
| | | SHARES | | | FAIR
VALUE | |
| Norway - 1.7% (continued) | | | | | | |
TGS-Nopec Geophysical Co. ASA | | | 14,581 | | | $ | 365,371 | |
Tomra Systems ASA | | | 5,528 | | | | 166,250 | |
Veidekke ASA | | | 9,886 | | | | 94,435 | |
Wallenius Wilhelmsen ASA | | | 12,418 | | | | 34,792 | |
XXL ASA (a)(c) (Cost: $406,887; Original Acquisition Date: 10/17/2018) | | | 117,008 | | | | 278,626 | |
| | | | | | | | |
| | | | | | | 5,007,945 | |
| | | | | | | | |
| Portugal - 0.7% | | | | | | |
Altri, SGPS, S.A. | | | 38,099 | | | | 258,355 | |
Banco Comercial Portugues, S.A. - Class R | | | 189,768 | | | | 53,424 | |
Corticeira Amorim SGPS, S.A. | | | 2,954 | | | | 33,991 | |
CTT-Correios de Portugal, S.A. | | | 1,583 | | | | 4,103 | |
Mota-Engil SGPS, S.A. (b) | | | 207,451 | | | | 490,857 | |
Nos SGPS, S.A. | | | 145,861 | | | | 921,479 | |
REN Redes Energeticas Nacionais SGPS, S.A. | | | 90,416 | | | | 245,956 | |
Semapa-Sociedade de Investimento e Gestao | | | 5,401 | | | | 75,060 | |
Sonae SGPS, S.A. | | | 84,888 | | | | 84,402 | |
The Navigator Company, S.A. | | | 5,994 | | | | 21,428 | |
| | | | | | | | |
| | | | | | | 2,189,055 | |
| | | | | | | | |
| Singapore - 0.4% | | | | | | |
Best World International Ltd. (f) | | | 393,700 | | | | 389,774 | |
Bumitama Agri Ltd. | | | 46,700 | | | | 22,777 | |
China Aviation Oil Singapore Corp Ltd. | | | 28,600 | | | | 26,025 | |
Indofood Agri Resources Ltd. | | | 73,800 | | | | 14,774 | |
Japfa Ltd. | | | 252,800 | | | | 100,296 | |
NetLink NBN Trust | | | 100 | | | | 60 | |
Sheng Siong Group Ltd. | | | 310,100 | | | | 246,057 | |
SIA Engineering Co Ltd. | | | 132,600 | | | | 233,597 | |
Silverlake Axis Ltd. | | | 149,900 | | | | 57,834 | |
| | | | | | | | |
| | | | | | | 1,091,194 | |
| | | | | | | | |
| Spain - 4.6% | | | | | | |
Acciona SA | | | 20,105 | | | | 2,152,832 | |
Acerinox S.A. | | | 57,919 | | | | 547,659 | |
Applus Services, S.A. | | | 19,510 | | | | 248,471 | |
Atresmedia Corp de Medios de Comunicacion S.A. (a) | | | 109,816 | | | | 536,119 | |
Cia de Distribucion Integral Logista Holdings S.A. | | | 68,287 | | | | 1,509,725 | |
CIE Automotive, S.A. | | | 9,335 | | | | 225,885 | |
Construcciones y Auxiliar de Ferrocarriles, S.A. | | | 22,515 | | | | 952,032 | |
Corp Financiera Alba, S.A. | | | 238 | | | | 13,108 | |
Ebro Foods, S.A. | | | 34,768 | | | | 730,993 | |
Ence Energia y Celulosa, S.A. | | | 10,612 | | | | 44,457 | |
Ercros SA | | | 69,952 | | | | 173,331 | |
EUSKALTEL S.A (c) (Cost: $51,177; Original Acquisition Date: 12/17/2018) | | | 6,446 | | | | 54,513 | |
Faes Farma, S.A. | | | 120,169 | | | | 525,579 | |
Fomento de Construcciones y Contratas, S.p.A. | | | 72,284 | | | | 935,114 | |
Global Dominion Access, S.A. (b)(c) (Cost: $260,217; Original Acquisition Date: 05/09/2017) | | | 49,322 | | | | 245,748 | |
| | | | |
| | The accompanying Notes to the Financial Statements are an integral part of these Financial Statements. | | (Continued) |
| | | | | | | | | | | | | | | | |
| | Elements Portfolios | | | | | | Annual Report | | | | | | May 31, 2019 | | |
| | | | |
66
| | |
| Schedule of Investments | | as of May 31, 2019 |
| | | | |
| ELEMENTS INTERNATIONAL SMALL CAP PORTFOLIO | | | | |
| | | | | | | | |
| | | SHARES | | | FAIR
VALUE | |
| Spain - 4.6% (continued) | | | | | | |
Grupo Catalana Occidente, S.A. | | | 24,983 | | | $ | 870,789 | |
Grupo Empresarial San Jose SA (b) | | | 5,472 | | | | 44,259 | |
Indra Sistemas, S.A. (b) | | | 12,658 | | | | 133,349 | |
Liberbank, S.A. | | | 6,464 | | | | 2,951 | |
Mediaset Espana Comunicacion, S.A. | | | 149,946 | | | | 1,078,784 | |
Melia Hotels International, S.A. | | | 25,436 | | | | 232,016 | |
Miquel y Costas & Miquel, S.A. | | | 6,867 | | | | 118,141 | |
NH Hotel Group, S.A. | | | 22,659 | | | | 110,772 | |
Promotora de Informaciones, S.A. - Class A (b) | | | 103,895 | | | | 171,779 | |
Prosegur Cia de Seguridad SA | | | 16,418 | | | | 70,028 | |
Sacyr, S.A. | | | 81,697 | | | | 186,370 | |
Talgo SA (b)(c) (Cost: $463,337; Original Acquisition Date: 09/20/2018) | | | 80,133 | | | | 504,004 | |
Tecnicas Reunidas, S.A. | | | 26,228 | | | | 658,681 | |
Telepizza Group S.A. (c) (Cost: $192,205; Original Acquisition Date: 01/19/2018) | | | 32,321 | | | | 217,007 | |
Tubacex, S.A. | | | 35,894 | | | | 108,468 | |
Unicaja Banco S.A. (c) (Cost: $370,594; Original Acquisition Date: 10/15/2018) | | | 296,858 | | | | 289,519 | |
Viscofan, S.A. | | | 4,503 | | | | 233,921 | |
Zardoya Otis, S.A. | | | 1,073 | | | | 8,181 | |
| | | | | | | | |
| | | | | | | 13,934,585 | |
| | | | | | | | |
| Sweden - 3.8% | | | | | | |
AAK AB | | | 20,441 | | | | 353,167 | |
AcadeMedia AB (b)(c) (Cost: $135,899; Original Acquisition Date: 05/10/2017) | | | 24,865 | | | | 131,056 | |
Ahlsell AB (b)(c)(f) (Cost: $14,781; Original Acquisition Date: 02/25/2019) | | | 2,502 | | | | 14,506 | |
Arjo AB | | | 72,504 | | | | 298,533 | |
Attendo AB (c) (Cost: $363,315; Original Acquisition Date: 03/25/2019) | | | 66,896 | | | | 353,999 | |
Axfood AB | | | 83,871 | | | | 1,614,400 | |
Bergman & Beving AB | | | 10,106 | | | | 108,449 | |
Betsson AB - Class B (b) | | | 91,179 | | | | 576,693 | |
Betsson AB - Redemption Shares Class B (b) | | | 91,179 | | | | 37,341 | |
Bilia AB | | | 68,274 | | | | 576,843 | |
BillerudKorsnas AB | | | 500 | | | | 6,003 | |
BioGaia AB | | | 1,103 | | | | 49,299 | |
Biotage AB | | | 3,381 | | | | 39,989 | |
Bossard Holding AG | | | 569 | | | | 84,221 | |
Bravida Holding AB (c) (Cost: $242,505; Original Acquisition Date: 05/30/2017) | | | 32,952 | | | | 269,899 | |
Bufab AB | | | 267 | | | | 2,747 | |
Camurus AB (b) | | | 895 | | | | 6,755 | |
Clas Ohlson AB | | | 46,282 | | | | 409,573 | |
Cloetta AB | | | 7,520 | | | | 23,686 | |
Dustin Group AB (c) (Cost: $149,873; Original Acquisition Date: 05/10/2017) | | | 18,041 | | | | 154,709 | |
Elekta AB | | | 1,850 | | | | 24,065 | |
Fortnox AB | | | 1,589 | | | | 20,737 | |
Getinge AB | | | 25,197 | | | | 341,975 | |
Granges AB | | | 25,391 | | | | 238,616 | |
Gunnebo AB | | | 4,211 | | | | 12,407 | |
Haldex AB | | | 1,984 | | | | 13,343 | |
Holmen AB | | | 11,413 | | | | 221,730 | |
| | | | | | | | |
| | | SHARES | | | FAIR
VALUE | |
| Sweden - 3.8% (continued) | | | | | | |
Humana AB | | | 4,817 | | | $ | 26,658 | |
Indutrade AB | | | 4,955 | | | | 144,685 | |
Intrum AB (a) | | | 6,830 | | | | 157,459 | |
Inwido AB | | | 12,331 | | | | 74,027 | |
KappAhl AB | | | 8,251 | | | | 14,638 | |
LeoVegas AB (a)(c) (Cost: $306,929; Original Acquisition Date: 06/21/2017) | | | 83,594 | | | | 267,620 | |
Lifco AB - B Shares | | | 2,463 | | | | 119,847 | |
Lindab International AB | | | 27,987 | | | | 289,417 | |
Modern Times Group MTG AB (b) | | | 19,495 | | | | 226,261 | |
Momentum Group AB | | | 1,782 | | | | 21,302 | |
Mycronic AB | | | 16,929 | | | | 204,867 | |
New Wave Group AB | | | 28,233 | | | | 184,522 | |
Nobia AB | | | 47,918 | | | | 259,128 | |
Nobina AB (c) (Cost: $269,714; Original Acquisition Date: 05/10/2017) | | | 42,718 | | | | 238,888 | |
Nolato AB | | | 1,645 | | | | 78,414 | |
Nordic Entertainment Group AB | | | 3,889 | | | | 91,830 | |
Paradox Interactive AB | | | 4,768 | | | | 71,522 | |
Radisson Hospitality AB (a)(b)(f) | | | 20,468 | | | | 91,699 | |
Ratos AB | | | 146,334 | | | | 397,674 | |
RaySearch Laboratories AB (b) | | | 1,250 | | | | 15,812 | |
Sagax AB | | | 13,884 | | | | 51,225 | |
SAS AB (b) | | | 78,605 | | | | 110,122 | |
Scandi Standard AB | | | 19,614 | | | | 126,537 | |
Scandic Hotels Group AB (c) (Cost: $15,686; Original Acquisition Date: 05/10/2017) | | | 1,318 | | | | 10,629 | |
SSAB AB | | | 301,622 | | | | 832,716 | |
Svenska Cellulosa AB SCA | | | 112,297 | | | | 859,653 | |
Sweco AB | | | 10,427 | | | | 268,633 | |
Tele2 AB | | | 1,268 | | | | 17,524 | |
Thule Group AB (c) (Cost: $9,331; Original Acquisition Date: 08/24/2017) | | | 485 | | | | 11,064 | |
Trelleborg AB | | | 9,500 | | | | 126,581 | |
Vitrolife AB | | | 542 | | | | 11,564 | |
Volati AB | | | 4,204 | | | | 19,942 | |
| | | | | | | | |
| | | | | | | 11,407,201 | |
| | | | | | | | |
| Switzerland - 4.4% | | | | | | |
ALSO Holding AG | | | 4,930 | | | | 640,100 | |
APG SGA, S.A. | | | 49 | | | | 12,798 | |
Aryzta AG (b) | | | 2,258 | | | | 2,884 | |
Ascom Holding AG | | | 1,731 | | | | 22,233 | |
Autoneum Holding AG | | | 158 | | | | 19,741 | |
Banque Cantonale Vaudoise | | | 122 | | | | 91,264 | |
Bell Food Group AG | | | 227 | | | | 66,881 | |
BKW AG | | | 2,562 | | | | 169,393 | |
Bobst Group, S.A. | | | 1,065 | | | | 67,011 | |
Bucher Industries AG | | | 1,451 | | | | 453,016 | |
Burckhardt Compression Holding AG | | | 104 | | | | 27,370 | |
Burkhalter Holding AG | | | 279 | | | | 21,818 | |
Comet Holding AG | | | 128 | | | | 12,151 | |
Conzzeta AG | | | 505 | | | | 418,122 | |
DKSH Holding AG | | | 6,885 | | | | 420,836 | |
dormakaba Holding AG | | | 887 | | | | 613,924 | |
EDAG Engineering Group AG | | | 4,093 | | | | 59,260 | |
EFG International AG | | | 1,717 | | | | 11,352 | |
| | | | |
| | The accompanying Notes to the Financial Statements are an integral part of these Financial Statements. | | (Continued) |
| | | | | | | | | | | | | | | | |
| | Elements Portfolios | | | | | | Annual Report | | | | | | May 31, 2019 | | |
| | | | |
67
| | |
| Schedule of Investments | | as of May 31, 2019 |
| | | | |
| ELEMENTS INTERNATIONAL SMALL CAP PORTFOLIO | | | | |
| | | | | | | | |
| | | SHARES | | | FAIR
VALUE | |
| Switzerland - 4.4% (continued) | | | | | | |
Emmi AG | | | 820 | | | $ | 756,734 | |
Feintool International Holding AG | | | 130 | | | | 8,439 | |
Forbo Holding AG | | | 212 | | | | 343,011 | |
Galenica AG (c) (Cost: $350,524; Original Acquisition Date: 10/16/2018) | | | 6,929 | | | | 333,838 | |
GAM Holding AG (b) | | | 149,390 | | | | 617,106 | |
Georg Fischer AG | | | 1,251 | | | | 1,060,773 | |
Helvetia Holding AG | | | 4,025 | | | | 495,261 | |
Huber + Suhner AG | | | 6,213 | | | | 478,424 | |
Implenia AG | | | 16,576 | | | | 484,739 | |
Inficon Holding AG | | | 318 | | | | 180,081 | |
Interroll Holding AG | | | 149 | | | | 316,230 | |
Kardex AG | | | 1,193 | | | | 184,208 | |
Kudelski, S.A. (a) | | | 2,600 | | | | 17,684 | |
Landis & Gyr Group AG | | | 2,368 | | | | 171,347 | |
Logitech International, S.A. | | | 11,366 | | | | 415,249 | |
Meier Tobler Group AG (b) | | | 742 | | | | 11,783 | |
Mobilezone Holding AG | | | 21,695 | | | | 210,829 | |
OC Oerlikon Corp. AG | | | 1,652 | | | | 18,067 | |
Oriflame Holding AG | | | 33,349 | | | | 782,892 | |
Orior AG | | | 4,322 | | | | 329,357 | |
Panalpina Welttransport Holding AG (b) | | | 5,436 | | | | 1,156,422 | |
Rieter Holding AG | | | 916 | | | | 126,891 | |
Schmolz + Bickenbach AG (b) | | | 40,510 | | | | 18,571 | |
Schweiter Technologies AG | | | 222 | | | | 202,655 | |
SFS Group AG | | | 2,232 | | | | 177,668 | |
Siegfried Holding AG | | | 129 | | | | 46,189 | |
St Galler Kantonalbank AG | | | 100 | | | | 44,594 | |
Sunrise Communications Group AG (c) (Cost: $121,575; Original Acquisition Date: 05/30/2017) | | | 1,478 | | | | 102,667 | |
Swissquote Group Holding, S.A. | | | 386 | | | | 13,879 | |
Tecan Group AG | | | 531 | | | | 127,387 | |
u-blox Holding AG | | | 916 | | | | 67,699 | |
Valiant Holding AG | | | 157 | | | | 16,778 | |
Valora Holding AG | | | 2,845 | | | | 718,886 | |
VP Bank AG | | | 464 | | | | 72,850 | |
Zehnder Group AG | | | 2,280 | | | | 76,399 | |
Zur Rose Group AG (b) | | | 109 | | | | 10,603 | |
| | | | | | | | |
| | | | | | | 13,326,344 | |
| | | | | | | | |
| United Kingdom - 0.3% | | | | | | |
Dialog Semiconductor PLC (b) | | | 28,331 | | | | 902,029 | |
Torm PLC (b) | | | 1,000 | | | | 8,452 | |
| | | | | | | | |
| | | | | | | 910,481 | |
| | | | | | | | |
| United States - 19.2% | | | | | | |
AES Corp. (e) | | | 127,000 | | | | 2,006,600 | |
Altria Group, Inc. | | | 75,467 | | | | 3,702,411 | |
Anadarko Petroleum Corp. | | | 40,429 | | | | 2,844,989 | |
Assurant, Inc. | | | 43,000 | | | | 4,298,280 | |
B Communications Ltd. (b) | | | 225 | | | | 282 | |
Celgene Corp. (b) | | | 14,672 | | | | 1,376,087 | |
Cellcom Israel Ltd. (b) | | | 19,662 | | | | 74,307 | |
Clorox Co. (a) | | | 3,342 | | | | 497,323 | |
ConocoPhillips (e) | | | 95,000 | | | | 5,601,200 | |
Corning, Inc. | | | 28,749 | | | | 829,121 | |
Dave & Buster’s Entertainment, Inc. (a) | | | 24,000 | | | | 1,193,760 | |
| | | | | | | | |
| | | SHARES | | | FAIR
VALUE | |
| United States - 19.2% (continued) | | | | | | |
DowDuPont, Inc. (e) | | | 144,000 | | | $ | 4,394,880 | |
Halliburton Co. | | | 186,423 | | | | 3,968,946 | |
HCA Healthcare, Inc. | | | 15,992 | | | | 1,934,392 | |
Home Depot, Inc. (e) | | | 25,000 | | | | 4,746,250 | |
Kenon Holdings Ltd. | | | 7,582 | | | | 144,525 | |
KLA-Tencor Corp. | | | 1,904 | | | | 196,245 | |
New Relic, Inc. (b) | | | 14,000 | | | | 1,404,480 | |
Northrop Grumman Corp. | | | 1,797 | | | | 544,940 | |
PACCAR, Inc. | | | 5,054 | | | | 332,654 | |
PNC Financial Services Group Inc/The | | | 8,151 | | | | 1,037,296 | |
PPL Corp. | | | 124,032 | | | | 3,691,192 | |
Raytheon Co. (e) | | | 7,417 | | | | 1,294,266 | |
Southwestern Energy Co. (a)(b) | | | 316,000 | | | | 1,134,440 | |
Spirit AeroSystems Holdings, Inc. (e) | | | 5,054 | | | | 409,576 | |
SunTrust Banks, Inc. | | | 103,000 | | | | 6,181,030 | |
Total System Services, Inc. | | | 24,577 | | | | 3,035,997 | |
WABCO Holdings, Inc. (b) | | | 2,445 | | | | 320,075 | |
Wells Fargo & Co. | | | 24,371 | | | | 1,081,341 | |
Yum China Holdings, Inc. | | | 10,026 | | | | 401,140 | |
| | | | | | | | |
| | | | | | | 58,678,025 | |
| | | | | | | | |
TOTAL COMMON STOCKS
(Cost $293,704,401) | | | | | | | 283,276,926 | |
| | | | | | | | |
PREFERRED STOCKS - 0.2% | | | | | | | | |
| Germany - 0.2% | | | | | | |
Draegerwerk AG & Co., KGaA - Preferred | | | 5,509 | | | | 297,628 | |
Jungheinrich AG | | | 3,308 | | | | 93,349 | |
Sartorius AG | | | 606 | | | | 115,089 | |
| | | | | | | | |
TOTAL PREFERRED STOCKS
(Cost $474,362) | | | | | | | 506,066 | |
| | | | | | | | |
REAL ESTATE INVESTMENT TRUST - 1.2% | |
| Australia - 0.0% (d) | | | | | | |
Growthpoint Properties Australia Ltd. | | | 10,417 | | | | 30,350 | |
| | | | | | | | |
| Singapore - 0.1% | | | | | | |
Yanlord Land Group Ltd. | | | 322,400 | | | | 279,287 | |
| | | | | | | | |
| United States - 1.1% | | | | | | |
Equinix, Inc. | | | 1,437 | | | | 698,080 | |
Federal Realty Investment Trust | | | 7,008 | | | | 916,156 | |
Highwoods Properties, Inc. | | | 26,000 | | | | 1,140,360 | |
New Residential Investment Corp. | | | 18,340 | | | | 279,685 | |
Realty Income Corp. (a) | | | 6,439 | | | | 451,245 | |
| | | | | | | | |
| | | | | | | 3,485,526 | |
| | | | | | | | |
TOTAL REAL ESTATE INVESTMENT TRUST
(Cost $3,885,279) | | | | | | | 3,795,163 | |
| | | | | | | | |
RIGHTS - 0.0% (d) | | | | | | | | |
| Australia - 0.0% | | | | | | |
St. Barbara, Ltd. (f) | | | 31,840 | | | | — | |
| | | | | | | | |
| Spain - 0.0% (d) | | | | | | |
Fomento de Construcciones y Contratas S.A. (f) | | | 73,472 | | | | 33,653 | |
| | | | | | | | |
TOTAL RIGHTS
(Cost $40,067) | | | | | | | 33,653 | |
| | | | | | | | |
| | | | |
| | The accompanying Notes to the Financial Statements are an integral part of these Financial Statements. | | (Continued) |
| | | | | | | | | | | | | | | | |
| | Elements Portfolios | | | | | | Annual Report | | | | | | May 31, 2019 | | |
| | | | |
68
| | |
| Schedule of Investments | | as of May 31, 2019 |
| | | | |
| ELEMENTS INTERNATIONAL SMALL CAP PORTFOLIO | | | | |
| | | | | | | | |
| | | SHARES | | | FAIR
VALUE | |
SHORT-TERM INVESTMENTS - 2.7% | | | | | | | | |
| Money Market Funds - 0.5% | | | | | | |
Fidelity Investments Money Market Funds - Government Portfolio, 2.27% (g) | | | 345,733 | | | $ | 345,733 | |
Morgan Stanley Institutional Liquidity Funds - Government Portfolio - Institutional Class, 2.29% (g) | | | 345,733 | | | | 345,733 | |
Morgan Stanley Institutional Liquidity Funds - Treasury Portfolio, 2.27% (g) | | | 345,733 | | | | 345,733 | |
Short-Term Investments Trust - Treasury Portfolio - Institutional Class, 2.29% (g) | | | 345,733 | | | | 345,733 | |
STIT-Government & Agency Portfolio, 2.31% (g) | | | 345,733 | | | | 345,733 | |
| | | | | | | | |
| | | | | | | 1,728,665 | |
| | | | | | | | |
| | |
| | | PRINCIPAL
AMOUNT | | | FAIR
VALUE | |
| U.S. Treasury Bills - 2.2% | | | | | | |
2.314%, 06/18/2019 (h) | | $ | 3,600,000 | | | | 3,596,031 | |
2.270%, 06/25/2019 (h) | | | 3,000,000 | | | | 2,995,399 | |
| | | | | | | | |
| | | | | | | 6,591,430 | |
| | | | | | | | |
TOTAL SHORT-TERM INVESTMENTS
(Cost $8,320,095) | | | | | | | 8,320,095 | |
| | | | | | | | |
| | |
| | | SHARES | | | FAIR
VALUE | |
INVESTMENTS PURCHASED WITH THE CASH PROCEEDS FROM SECURITIES LENDING - 5.0% | |
BlackRock Liquidity Funds FedFund Portfolio, 2.30% (g) | | | 1,505,388 | | | | 1,505,388 | |
| | | | | | | | |
| | |
| | | SHARES | | | FAIR
VALUE | |
INVESTMENTS PURCHASED WITH THE CASH PROCEEDS FROM SECURITIES LENDING - 5.0% (continued) | |
Morgan Stanley Institutional Liquidity Funds - Prime Portfolio, 2.49% (g) | | | 13,548,494 | | | $ | 13,548,494 | |
| | | | | | | | |
TOTAL INVESTMENTS PURCHASED WITH THE CASH PROCEEDS FROM SECURITIES LENDING
(Cost $15,053,882) | | | | | | | 15,053,882 | |
| | | | | | | | |
TOTAL INVESTMENTS
(Cost $321,478,086) - 102.5% | | | | | | | 310,985,785 | |
| | | | | | | | |
LIABILITIES IN EXCESS OF OTHER ASSETS - (2.5)% | | | | | | | (7,709,376) | |
| | | | | | | | |
TOTAL NET ASSETS - 100.0% | | | | | | $ | 303,276,409 | |
| | | | | | | | |
Percentages are stated as a percent of net assets.
| (a) | This security or a portion of this security was out on loan as of May 31, 2019. Total loaned securities had a market value of $11,486,646 as of May 31, 2019. |
| (b) | Non-income producing security. |
| (c) | Although security is restricted as to resale, the Portfolio’s Adviser has determined this security to be liquid based upon procedures approved by the Board of Trustees. The aggregate value of these securities at May 31, 2019 was $8,611,645, which represents 2.8% of net assets. |
| (e) | This security or a portion of this security was held as collateral for derivative contracts as of May 31, 2019. |
| (f) | Value determined using significant unobservable inputs. |
| (g) | Rate shown is the7-day effective yield. |
| (h) | Rate shown is the effective yield based on purchase price. The calculation assumes the security is held to maturity. |
Open Futures Contracts
| | | | | | | | | | | | |
| | | |
| DESCRIPTION | | NUMBER OF
CONTRACTS
PURCHASED | | | NOTIONAL
VALUE | | | VALUE/
UNREALIZED
DEPRECIATION | |
| FUTURES CONTRACTS PURCHASED | | | | | | | | | |
Australian Dollar, June 2019 Settlement | | | 90 | | | $ | 6,248,700 | | | $ | (133,334 | ) |
British Pound, June 2019 Settlement | | | 460 | | | | 36,348,625 | | | | (1,761,522 | ) |
Euro FX, June 2019 Settlement | | | 98 | | | | 13,704,075 | | | | (255,411 | ) |
Mini MSCI EAFE Index, June 2019 Settlement | | | 122 | | | | 11,089,190 | | | | (152,604 | ) |
| | | | | | | | | | | | |
TOTAL FUTURES CONTRACTS PURCHASED | | | | | | $ | 67,390,590 | | | $ | (2,302,871 | ) |
| | | | | | | | | | | | |
| | | | |
| | The accompanying Notes to the Financial Statements are an integral part of these Financial Statements. | | (Continued) |
| | | | | | | | | | | | | | | | |
| | Elements Portfolios | | | | | | Annual Report | | | | | | May 31, 2019 | | |
| | | | |
69
| | |
| Schedule of Investments | | as of May 31, 2019 |
| | | | |
| ELEMENTS INTERNATIONAL SMALL CAP PORTFOLIO | | | | |
Total Return Swaps
| | | | | | | | | | | | | | | | | | | | | | | | | | |
| | | | | | | | |
| COUNTERPARTY (a) | | REFERENCE
ENTITY | | PAY/RECEIVE
TOTAL
RETURN ON
REFERENCE
ENTITY | | BASE FINANCING
RATE (b) | | TERMINATION
DATE | | | PAYMENT
FREQUENCY | | | NOTIONAL
VALUE | | | NUMBER OF
UNITS | | | UNREALIZED
APPRECIATION
(DEPRECIATION) | |
| | | | | | | | | | | | | | | | | | | | | | |
| B | | 888 Holdings PLC | | Receive | | 1-Month LIBOR GBP | | | 3/18/2026 | | | | Term | | | $ | 173,412 | | | | 129,554 | | | $ | (52,308 | ) |
| C | | 888 Holdings PLC | | Receive | | 1-Month LIBOR GBP | | | 9/20/2021 | | | | Term | | | | 86,268 | | | | 63,526 | | | | (28,252 | ) |
| C | | A.G. Barr PLC | | Receive | | 1-Month LIBOR GBP | | | 9/20/2021 | | | | Term | | | | 103,731 | | | | 15,294 | | | | 17,033 | |
| B | | AA PLC | | Receive | | 1-Month LIBOR GBP | | | 3/18/2026 | | | | Term | | | | 49,532 | | | | 64,642 | | | | (33,691 | ) |
| C | | AA PLC | | Receive | | 1-Month LIBOR GBP | | | 9/20/2021 | | | | Term | | | | 176,509 | | | | 253,688 | | | | (103,866 | ) |
| C | | Acacia Mining PLC | | Receive | | 1-Month LIBOR GBP | | | 9/20/2021 | | | | Term | | | | 6,375 | | | | 5,436 | | | | 619 | |
| A | | Accent Group Ltd. | | Receive | | 1-Month Bank Bill Swap Rate | | | 6/28/2024 | | | | Term | | | | 560,900 | | | | 271,952 | | | | 19,391 | |
| B | | Advanced Medical Solutions | | Receive | | 1-Month LIBOR GBP | | | 3/18/2026 | | | | Term | | | | 5,955 | | | | 2,327 | | | | 589 | |
| C | | Advanced Medical Solutions | | Receive | | 1-Month LIBOR GBP | | | 9/20/2021 | | | | Term | | | | 8,780 | | | | 3,577 | | | | 1,505 | |
| A | | AES Corp. | | Pay | | 1-Month LIBOR USD | | | 4/2/2029 | | | | Term | | | | 2,247,900 | | | | 127,000 | | | | 237,777 | |
| C | | Aggreko PLC | | Receive | | 1-Month LIBOR GBP | | | 9/20/2021 | | | | Term | | | | 103,029 | | | | 17,399 | | | | 8,859 | |
| C | | Akka Technologies | | Receive | | 1-Month LIBOR EUR | | | 9/20/2021 | | | | Term | | | | 191,681 | | | | 3,866 | | | | 11,230 | |
| B | | Akwel S.A. | | Receive | | 1-Month LIBOR EUR | | | 3/18/2026 | | | | Term | | | | 82,710 | | | | 6,094 | | | | 81 | |
| C | | Akwel S.A. | | Receive | | 1-Month LIBOR EUR | | | 9/20/2021 | | | | Term | | | | 49,518 | | | | 3,321 | | | | (5,490 | ) |
| C | | Alfa Financial Software Holding | | Receive | | 1-Month LIBOR GBP | | | 9/20/2021 | | | | Term | | | | 39,119 | | | | 37,624 | | | | (2,664 | ) |
| C | | Alliance Pharma PLC | | Receive | | 1-Month LIBOR GBP | | | 9/20/2021 | | | | Term | | | | 13,136 | | | | 24,963 | | | | 3,721 | |
| B | | Alten S.A. | | Receive | | 1-Month LIBOR EUR | | | 3/18/2026 | | | | Term | | | | 44,755 | | | | 529 | | | | (2,187 | ) |
| C | | Alten S.A. | | Receive | | 1-Month LIBOR EUR | | | 9/20/2021 | | | | Term | | | | 193,010 | | | | 2,224 | | | | (15,171 | ) |
| A | | Altium Ltd. | | Receive | | 1-Month Bank Bill Swap Rate | | | 6/28/2024 | | | | Term | | | | 5,848 | | | | 200 | | | | 1,456 | |
| A | | Altria Group, Inc. | | Pay | | 1-Month LIBOR USD | | | 4/2/2029 | | | | Term | | | | 3,702,411 | | | | 75,467 | | | | — | |
| A | | AMA Group Ltd. | | Receive | | 1-Month Bank Bill Swap Rate | | | 6/28/2024 | | | | Term | | | | 12,098 | | | | 7,054 | | | | 391 | |
| A | | Anadarko Petroleum Corp. | | Pay | | 1-Month LIBOR USD | | | 4/2/2029 | | | | Term | | | | 2,844,989 | | | | 40,429 | | | | — | |
| A | | Ansell Ltd. | | Receive | | 1-Month Bank Bill Swap Rate | | | 6/28/2024 | | | | Term | | | | 141,606 | | | | 3,915 | | | | 195 | |
| C | | AO World PLC | | Receive | | 1-Month LIBOR GBP | | | 9/20/2021 | | | | Term | | | | 8,064 | | | | 9,535 | | | | 496 | |
| A | | ARB Corp. Ltd. | | Receive | | 1-Month Bank Bill Swap Rate | | | 6/28/2024 | | | | Term | | | | 173,221 | | | | 6,915 | | | | 6,203 | |
| B | | Ascential PLC | | Receive | | 1-Month LIBOR GBP | | | 3/18/2026 | | | | Term | | | | 26,053 | | | | 9,277 | | | | 3,698 | |
| C | | Ashmore Group PLC | | Receive | | 1-Month LIBOR GBP | | | 9/20/2021 | | | | Term | | | | 199,243 | | | | 66,782 | | | | 88,325 | |
| | | | |
| | The accompanying Notes to the Financial Statements are an integral part of these Financial Statements. | | (Continued) |
| | | | | | | | | | | | | | | | |
| | Elements Portfolios | | | | | | Annual Report | | | | | | May 31, 2019 | | |
| | | | |
70
| | |
| Schedule of Investments | | as of May 31, 2019 |
| | | | |
| ELEMENTS INTERNATIONAL SMALL CAP PORTFOLIO | | | | |
| | | | | | | | | | | | | | | | | | | | | | | | | | |
| | | | | | | | |
| COUNTERPARTY (a) | | REFERENCE
ENTITY | | PAY/RECEIVE
TOTAL
RETURN ON
REFERENCE
ENTITY | | BASE FINANCING
RATE (b) | | TERMINATION
DATE | | | PAYMENT
FREQUENCY | | | NOTIONAL
VALUE | | | NUMBER OF
UNITS | | | UNREALIZED
APPRECIATION
(DEPRECIATION) | |
| | | | | | | | | | | | | | | | | | | | | | |
| B | | ASOS PLC | | Receive | | 1-Month LIBOR GBP | | | 3/18/2026 | | | | Term | | | $ | 62,643 | | | | 2,463 | | | $ | 6,732 | |
| C | | ASOS PLC | | Receive | | 1-Month LIBOR GBP | | | 9/20/2021 | | | | Term | | | | 89,645 | | | | 4,210 | | | | 39,237 | |
| A | | Assurant, Inc. | | Pay | | 1-Month LIBOR USD | | | 4/2/2029 | | | | Term | | | | 4,044,580 | | | | 43,000 | | | | (267,219 | ) |
| B | | Assystem S.A. | | Receive | | 1-Month LIBOR EUR | | | 3/18/2026 | | | | Term | | | | 60,170 | | | | 2,168 | | | | 2,503 | |
| C | | Assystem S.A. | | Receive | | 1-Month LIBOR EUR | | | 9/20/2021 | | | | Term | | | | 29,723 | | | | 1,117 | | | | 2,895 | |
| A | | Assystem S.A. | | Receive | | 1-Month LIBOR EUR | | | 6/28/2024 | | | | Term | | | | 5,927 | | | | 189 | | | | (287 | ) |
| C | | Aston Martin Lagonda Global | | Receive | | 1-Month LIBOR GBP | | | 9/20/2021 | | | | Term | | | | 64,274 | | | | 9,762 | | | | 4,936 | |
| A | | Atlas Arteria | | Receive | | 1-Month Bank Bill
Swap Rate | | | 6/28/2024 | | | | Term | | | | 116,489 | | | | 12,346 | | | | 5,032 | |
| A | | Australian Pharma Indus Ltd. | | Receive | | 1-Month Bank Bill
Swap Rate | | | 6/28/2024 | | | | Term | | | | 334,665 | | | | 157,305 | | | | (13,969 | ) |
| A | | Automotive Holdings Group Ltd. | | Receive | | 1-Month Bank Bill
Swap Rate | | | 6/28/2024 | | | | Term | | | | 462,652 | | | | 193,477 | | | | 168,866 | |
| B | | Aveva Group PLC | | Receive | | 1-Month LIBOR GBP | | | 3/18/2026 | | | | Term | | | | 83,995 | | | | 3,414 | | | | 24,924 | |
| C | | Aveva Group PLC | | Receive | | 1-Month LIBOR GBP | | | 9/20/2021 | | | | Term | | | | 56,213 | | | | 2,397 | | | | 21,904 | |
| C | | Bakkavor Group PLC | | Receive | | 1-Month LIBOR GBP | | | 9/20/2021 | | | | Term | | | | 16,522 | | | | 15,026 | | | | (2,818 | ) |
| C | | Balfour Beatty PLC | | Receive | | 1-Month LIBOR GBP | | | 9/20/2021 | | | | Term | | | | 1,383 | | | | 700 | | | | (94 | ) |
| C | | BBA Aviation PLC | | Receive | | 1-Month LIBOR GBP | | | 9/20/2021 | | | | Term | | | | 38,350 | | | | 20,428 | | | | 7,721 | |
| C | | BCA Marketplace PLC | | Receive | | 1-Month LIBOR GBP | | | 9/20/2021 | | | | Term | | | | 211,018 | | | | 131,172 | | | | (38,100 | ) |
| A | | Beach Energy Ltd. | | Receive | | 1-Month Bank Bill
Swap Rate | | | 6/28/2024 | | | | Term | | | | 208,200 | | | | 72,076 | | | | (9,614 | ) |
| A | | Bellamy’S Australia Ltd. | | Receive | | 1-Month Bank Bill
Swap Rate | | | 6/28/2024 | | | | Term | | | | 162,762 | | | | 14,686 | | | | 7,766 | |
| B | | Bellway PLC | | Receive | | 1-Month LIBOR GBP | | | 3/18/2026 | | | | Term | | | | 152,464 | | | | 6,227 | | | | (24,569 | ) |
| C | | Bellway PLC | | Receive | | 1-Month LIBOR GBP | | | 9/20/2021 | | | | Term | | | | 327,601 | | | | 14,806 | | | | 5,157 | |
| B | | Beneteau | | Receive | | 1-Month LIBOR EUR | | | 3/18/2026 | | | | Term | | | | 206,161 | | | | 21,441 | | | | (15,947 | ) |
| C | | Beneteau | | Receive | | 1-Month LIBOR EUR | | | 9/20/2021 | | | | Term | | | | 126,364 | | | | 12,917 | | | | (10,693 | ) |
| C | | Biffa PLC | | Receive | | 1-Month LIBOR GBP | | | 9/20/2021 | | | | Term | | | | 83,464 | | | | 57,003 | | | | 30,842 | |
| A | | Blackmores Ltd. | | Receive | | 1-Month Bank Bill
Swap Rate | | | 6/28/2024 | | | | Term | | | | 140,617 | | | | 997 | | | | (2,390 | ) |
| B | | Bodycote PLC | | Receive | | 1-Month LIBOR GBP | | | 3/18/2026 | | | | Term | | | | 30,420 | | | | 4,448 | | | | (3,125 | ) |
| C | | Bodycote PLC | | Receive | | 1-Month LIBOR GBP | | | 9/20/2021 | | | | Term | | | | 34,644 | | | | 6,118 | | | | 7,113 | |
| B | | Boiron S.A. | | Receive | | 1-Month LIBOR EUR | | | 3/18/2026 | | | | Term | | | | 60,095 | | | | 1,281 | | | | (18,168 | ) |
| C | | Boiron S.A. | | Receive | | 1-Month LIBOR EUR | | | 9/20/2021 | | | | Term | | | | 92,077 | | | | 2,003 | | | | (26,024 | ) |
| A | | Boiron S.A. | | Receive | | 1-Month LIBOR EUR | | | 6/28/2024 | | | | Term | | | | 1,756 | | | | 22 | | | | (1,153 | ) |
| B | | Bonduelle SCA | | Receive | | 1-Month LIBOR EUR | | | 3/18/2026 | | | | Term | | | | 82,582 | | | | 3,271 | | | | (1,517 | ) |
| C | | Bonduelle SCA | | Receive | | 1-Month LIBOR EUR | | | 9/20/2021 | | | | Term | | | | 78,020 | | | | 3,062 | | | | (1,722 | ) |
| B | | Boohoo Group PLC | | Receive | | 1-Month LIBOR GBP | | | 3/18/2026 | | | | Term | | | | 2,381 | | | | 1,659 | | | | 913 | |
| C | | Boohoo Group PLC | | Receive | | 1-Month LIBOR GBP | | | 9/20/2021 | | | | Term | | | | 124,453 | | | | 83,851 | | | | 39,594 | |
| C | | Bovis Homes Group PLC | | Receive | | 1-Month LIBOR GBP | | | 9/20/2021 | | | | Term | | | | 210,258 | | | | 27,207 | | | | 14,569 | |
| A | | Breville Group Ltd. | | Receive | | 1-Month Bank Bill
Swap Rate | | | 6/28/2024 | | | | Term | | | | 207,213 | | | | 13,392 | | | | 57,966 | |
| B | | Brewin Dolphin Holdings PLC | | Receive | | 1-Month LIBOR GBP | | | 3/18/2026 | | | | Term | | | | 67,079 | | | | 25,679 | | | | (7,631 | ) |
| | | | |
| | The accompanying Notes to the Financial Statements are an integral part of these Financial Statements. | | (Continued) |
| | | | | | | | | | | | | | | | |
| | Elements Portfolios | | | | | | Annual Report | | | | | | May 31, 2019 | | |
| | | | |
71
| | |
| Schedule of Investments | | as of May 31, 2019 |
| | | | |
| ELEMENTS INTERNATIONAL SMALL CAP PORTFOLIO | | | | |
| | | | | | | | | | | | | | | | | | | | | | | | | | |
| | | | | | | | |
| COUNTERPARTY (a) | | REFERENCE
ENTITY | | PAY/RECEIVE
TOTAL
RETURN ON
REFERENCE
ENTITY | | BASE FINANCING
RATE (b) | | TERMINATION
DATE | | | PAYMENT
FREQUENCY | | | NOTIONAL
VALUE | | | NUMBER OF
UNITS | | | UNREALIZED
APPRECIATION
(DEPRECIATION) | |
| | | | | | | | | | | | | | | | | | | | | | |
| C | | Brewin Dolphin Holdings PLC | | Receive | | 1-Month LIBOR GBP | | | 9/20/2021 | | | | Term | | | $ | 59,133 | | | | 23,895 | | | $ | (555 | ) |
| A | | Brickworks Ltd. | | Receive | | 1-Month Bank Bill
Swap Rate | | | 6/28/2024 | | | | Term | | | | 20,313 | | | | 853 | | | | (142 | ) |
| B | | Britvic PLC | | Receive | | 1-Month LIBOR GBP | | | 3/18/2026 | | | | Term | | | | 26,888 | | | | 3,591 | | | | (2,306 | ) |
| C | | Britvic PLC | | Receive | | 1-Month LIBOR GBP | | | 9/20/2021 | | | | Term | | | | 18,261 | | | | 2,955 | | | | 4,904 | |
| B | | BTG PLC | | Receive | | 1-Month LIBOR GBP | | | 3/18/2026 | | | | Term | | | | 79,789 | | | | 12,137 | | | | 34 | |
| C | | BTG PLC | | Receive | | 1-Month LIBOR GBP | | | 9/20/2021 | | | | Term | | | | 52,854 | | | | 12,016 | | | | 41,578 | |
| B | | C&C Group PLC | | Receive | | 1-Month LIBOR EUR | | | 3/18/2026 | | | | Term | | | | 2,544 | | | | 902 | | | | 598 | |
| C | | C&C Group PLC | | Receive | | 1-Month LIBOR EUR | | | 9/20/2021 | | | | Term | | | | 47,319 | | | | 17,872 | | | | 15,696 | |
| B | | Card Factory PLC | | Receive | | 1-Month LIBOR GBP | | | 3/18/2026 | | | | Term | | | | 47,037 | | | | 31,360 | | | | 2,252 | |
| C | | Card Factory PLC | | Receive | | 1-Month LIBOR GBP | | | 9/20/2021 | | | | Term | | | | 73,926 | | | | 51,735 | | | | 12,212 | |
| A | | Cedar Woods Properties Ltd. | | Receive | | 1-Month Bank Bill
Swap Rate | | | 6/28/2024 | | | | Term | | | | 40,316 | | | | 5,162 | | | | 1,974 | |
| A | | Celgene Corp. | | Pay | | 1-Month LIBOR USD | | | 4/2/2029 | | | | Term | | | | 1,384,010 | | | | 14,672 | | | | 13,059 | |
| B | | Centamin PLC | | Receive | | 1-Month LIBOR GBP | | | 3/18/2026 | | | | Term | | | | 216,483 | | | | 300,120 | | | | (748 | ) |
| C | | Centamin PLC | | Receive | | 1-Month LIBOR GBP | | | 9/20/2021 | | | | Term | | | | 357,029 | | | | 483,565 | | | | (18,420 | ) |
| C | | Central Asia Metals PLc | | Receive | | 1-Month LIBOR GBP | | | 9/20/2021 | | | | Term | | | | 1,934 | | | | 1,091 | | | | (79 | ) |
| C | | CGG S.A. | | Receive | | 1-Month LIBOR EUR | | | 9/20/2021 | | | | Term | | | | 30,877 | | | | 25,596 | | | | (452 | ) |
| B | | Cherming Group PLC | | Receive | | 1-Month LIBOR GBP | | | 3/18/2026 | | | | Term | | | | 22,807 | | | | 18,794 | | | | 2,466 | |
| C | | Cherming Group PLC | | Receive | | 1-Month LIBOR GBP | | | 9/20/2021 | | | | Term | | | | 8,970 | | | | 6,635 | | | | (642 | ) |
| C | | Cineworld Group PLC | | Receive | | 1-Month LIBOR GBP | | | 9/20/2021 | | | | Term | | | | 35,470 | | | | 15,047 | | | | (417 | ) |
| A | | Clorox Co. | | Pay | | 1-Month LIBOR USD | | | 4/2/2029 | | | | Term | | | | 513,966 | | | | 3,342 | | | | 15,342 | |
| B | | CMC Markets PLC | | Receive | | 1-Month LIBOR GBP | | | 3/18/2026 | | | | Term | | | | 14,015 | | | | 21,345 | | | | 1,126 | |
| C | | CMC Markets PLC | | Receive | | 1-Month LIBOR GBP | | | 9/20/2021 | | | | Term | | | | 24,097 | | | | 31,383 | | | | (3,884 | ) |
| B | | CME Group Inc. | | Receive | | 1-Month LIBOR USD | | | 3/18/2026 | | | | Term | | | | 415,094 | | | | 2,437 | | | | 50,543 | |
| C | | Coats Group PLC | | Receive | | 1-Month LIBOR GBP | | | 9/20/2021 | | | | Term | | | | 5,276 | | | | 8,379 | | | | (120 | ) |
| B | | Coface S.A. | | Receive | | 1-Month LIBOR EUR | | | 3/18/2026 | | | | Term | | | | 43,782 | | | | 6,075 | | | | 9,177 | |
| C | | Coface S.A. | | Receive | | 1-Month LIBOR EUR | | | 9/20/2021 | | | | Term | | | | 246,508 | | | | 35,468 | | | | 65,028 | |
| A | | Collins Foods Ltd. | | Receive | | 1-Month Bank Bill
Swap Rate | | | 6/28/2024 | | | | Term | | | | 220,435 | | | | 24,652 | | | | 29,325 | |
| B | | Compagnie Des Alpes | | Receive | | 1-Month LIBOR EUR | | | 3/18/2026 | | | | Term | | | | 74,128 | | | | 3,501 | | | | 9,337 | |
| C | | Compagnie Des Alpes | | Receive | | 1-Month LIBOR EUR | | | 9/20/2021 | | | | Term | | | | 52,901 | | | | 2,553 | | | | 9,841 | |
| A | | Compagnie Des Alpes | | Receive | | 1-Month LIBOR EUR | | | 6/28/2024 | | | | Term | | | | 8,218 | | | | 365 | | | | 742 | |
| B | | Compagnie Plastic Omnium S.A. | | Receive | | 1-Month LIBOR EUR | | | 3/18/2026 | | | | Term | | | | 132,084 | | | | 5,990 | | | | (22,847 | ) |
| C | | Compagnie Plastic Omnium S.A. | | Receive | | 1-Month LIBOR EUR | | | 9/20/2021 | | | | Term | | | | 273,402 | | | | 13,921 | | | | (11,206 | ) |
| C | | Computacenter PLC | | Receive | | 1-Month LIBOR GBP | | | 9/20/2021 | | | | Term | | | | 359,093 | | | | 39,395 | | | | 56,504 | |
| A | | ConocoPhillips | | Pay | | 1-Month LIBOR USD | | | 4/2/2029 | | | | Term | | | | 6,249,100 | | | | 95,000 | | | | 637,900 | |
| A | | Corning, Inc. | | Pay | | 1-Month LIBOR USD | | | 4/2/2029 | | | | Term | | | | 829,121 | | | | 28,749 | | | | — | |
| | | | |
| | The accompanying Notes to the Financial Statements are an integral part of these Financial Statements. | | (Continued) |
| | | | | | | | | | | | | | | | |
| | Elements Portfolios | | | | | | Annual Report | | | | | | May 31, 2019 | | |
| | | | |
72
| | |
| Schedule of Investments | | as of May 31, 2019 |
| | | | |
| ELEMENTS INTERNATIONAL SMALL CAP PORTFOLIO | | | | |
| | | | | | | | | | | | | | | | | | | | | | | | | | |
| | | | | | | | |
| COUNTERPARTY (a) | | REFERENCE
ENTITY | | PAY/RECEIVE
TOTAL
RETURN ON
REFERENCE
ENTITY | | BASE FINANCING
RATE (b) | | TERMINATION
DATE | | | PAYMENT
FREQUENCY | | | NOTIONAL
VALUE | | | NUMBER OF
UNITS | | | UNREALIZED
APPRECIATION
(DEPRECIATION) | |
| | | | | | | | | | | | | | | | | | | | | | |
| A | | Coronado Global Resource — CDI | | Receive | | 1-Month Bank Bill
Swap Rate | | | 6/28/2024 | | | | Term | | | $ | 13,663 | | | | 3,231 | | | $ | 573 | |
| B | | Costain Group PLC | | Receive | | 1-Month LIBOR GBP | | | 3/18/2026 | | | | Term | | | | 51,223 | | | | 18,988 | | | | (4,065 | ) |
| C | | Costain Group PLC | | Receive | | 1-Month LIBOR GBP | | | 9/20/2021 | | | | Term | | | | 31,263 | | | | 11,231 | | | | (4,083 | ) |
| C | | Countryside Properties PLC | | Receive | | 1-Month LIBOR GBP | | | 9/20/2021 | | | | Term | | | | 48,975 | | | | 20,916 | | | | 3,881 | |
| C | | Cranswick PLC | | Receive | | 1-Month LIBOR GBP | | | 9/20/2021 | | | | Term | | | | 215,481 | | | | 10,046 | | | | (4,690 | ) |
| C | | Crest Nicholson Holdings | | Receive | | 1-Month LIBOR GBP | | | 9/20/2021 | | | | Term | | | | 65,524 | | | | 21,653 | | | | (404 | ) |
| A | | CSR Ltd. | | Receive | | 1-Month Bank Bill
Swap Rate | | | 6/28/2024 | | | | Term | | | | 263,105 | | | | 55,076 | | | | 31,894 | |
| C | | CVS Group PLC | | Receive | | 1-Month LIBOR GBP | | | 9/20/2021 | | | | Term | | | | 86,505 | | | | 23,041 | | | | 50,344 | |
| B | | Dart Group PLC | | Receive | | 1-Month LIBOR GBP | | | 3/18/2026 | | | | Term | | | | 38,597 | | | | 5,791 | | | | 3,784 | |
| C | | Dart Group PLC | | Receive | | 1-Month LIBOR GBP | | | 9/20/2021 | | | | Term | | | | 362,314 | | | | 56,628 | | | | 61,096 | |
| A | | Dave & Buster’s Entertainment, Inc. | | Pay | | 1-Month LIBOR USD | | | 4/2/2029 | | | | Term | | | | 1,200,000 | | | | 24,000 | | | | 9,884 | |
| C | | De La Rue PLC | | Receive | | 1-Month LIBOR GBP | | | 9/20/2021 | | | | Term | | | | 12,947 | | | | 3,418 | | | | (7,261 | ) |
| B | | Dechra Pharmaceuticals PLC | | Receive | | 1-Month LIBOR GBP | | | 3/18/2026 | | | | Term | | | | 13,840 | | | | 710 | | | | 2,309 | |
| B | | Derichebourg | | Receive | | 1-Month LIBOR EUR | | | 3/18/2026 | | | | Term | | | | 101,949 | | | | 29,701 | | | | (25,484 | ) |
| C | | Derichebourg | | Receive | | 1-Month LIBOR EUR | | | 9/20/2021 | | | | Term | | | | 338,989 | | | | 99,649 | | | | (75,868 | ) |
| A | | Derichebourg | | Receive | | 1-Month LIBOR EUR | | | 6/28/2024 | | | | Term | | | | 4,615 | | | | 817 | | | | (2,755 | ) |
| B | | Devoteam S.A. | | Receive | | 1-Month LIBOR EUR | | | 3/18/2026 | | | | Term | | | | 60,297 | | | | 659 | | | | (3,721 | ) |
| B | | DFS Furniture PLC | | Receive | | 1-Month LIBOR GBP | | | 3/18/2026 | | | | Term | | | | 45,464 | | | | 23,267 | | | | (729 | ) |
| C | | DFS Furniture PLC | | Receive | | 1-Month LIBOR GBP | | | 9/20/2021 | | | | Term | | | | 66,235 | | | | 37,859 | | | | 12,839 | |
| B | | Dialight PLC | | Receive | | 1-Month LIBOR GBP | | | 3/18/2026 | | | | Term | | | | 8,375 | | | | 2,143 | | | | 668 | |
| A | | Dicker Data Ltd. | | Receive | | 1-Month Bank Bill
Swap Rate | | | 6/28/2024 | | | | Term | | | | 17,036 | | | | 2,464 | | | | 689 | |
| B | | Diploma PLC | | Receive | | 1-Month LIBOR GBP | | | 3/18/2026 | | | | Term | | | | 208,565 | | | | 18,283 | | | | 11,221 | |
| C | | Diploma PLC | | Receive | | 1-Month LIBOR GBP | | | 9/20/2021 | | | | Term | | | | 119,327 | | | | 11,391 | | | | 24,357 | |
| C | | Dixons Carphone PLC | | Receive | | 1-Month LIBOR GBP | | | 9/20/2021 | | | | Term | | | | 102,428 | | | | 98,304 | | | | (20,538 | ) |
| A | | DowDuPont, Inc. | | Pay | | 1-Month LIBOR USD | | | 4/2/2029 | | | | Term | | | | 5,644,800 | | | | 144,000 | | | | 1,246,901 | |
| A | | Downer Edi Ltd. | | Receive | | 1-Month Bank Bill
Swap Rate | | | 6/28/2024 | | | | Term | | | | 1,281,891 | | | | 120,150 | | | | (19,631 | ) |
| B | | Drax Group PLC | | Receive | | 1-Month LIBOR GBP | | | 3/18/2026 | | | | Term | | | | 142,954 | | | | 47,679 | | | | (46,258 | ) |
| C | | Drax Group PLC | | Receive | | 1-Month LIBOR GBP | | | 9/20/2021 | | | | Term | | | | 422,651 | | | | 142,092 | | | | (134,670 | ) |
| A | | Duluxgroup Ltd. | | Receive | | 1-Month Bank Bill
Swap Rate | | | 6/28/2024 | | | | Term | | | | 161,016 | | | | 15,426 | | | | 26,825 | |
| B | | Dunlem Group PLC | | Receive | | 1-Month LIBOR GBP | | | 3/18/2026 | | | | Term | | | | 104,304 | | | | 14,898 | | | | 484 | |
| C | | Dunlem Group PLC | | Receive | | 1-Month LIBOR GBP | | | 9/20/2021 | | | | Term | | | | 368,735 | | | | 65,241 | | | | 153,488 | |
| B | | EI Group PLC | | Receive | | 1-Month LIBOR GBP | | | 3/18/2026 | | | | Term | | | | 97,134 | | | | 57,376 | | | | (2,312 | ) |
| C | | EI Group PLC | | Receive | | 1-Month LIBOR GBP | | | 9/20/2021 | | | | Term | | | | 67,696 | | | | 48,150 | | | | 19,875 | |
| B | | Electrocomponents PLC | | Receive | | 1-Month LIBOR GBP | | | 3/18/2026 | | | | Term | | | | 130,849 | | | | 29,018 | | | | 13,294 | |
| C | | Electrocomponents PLC | | Receive | | 1-Month LIBOR GBP | | | 9/20/2021 | | | | Term | | | | 17,144 | | | | 4,314 | | | | 5,615 | |
| C | | Elior Group | | Receive | | 1-Month LIBOR EUR | | | 9/20/2021 | | | | Term | | | | 63,887 | | | | 5,912 | | | | (10,334 | ) |
| | | | |
| | The accompanying Notes to the Financial Statements are an integral part of these Financial Statements. | | (Continued) |
| | | | | | | | | | | | | | | | |
| | Elements Portfolios | | | | | | Annual Report | | | | | | May 31, 2019 | | |
| | | | |
73
| | |
| Schedule of Investments | | as of May 31, 2019 |
| | | | |
| ELEMENTS INTERNATIONAL SMALL CAP PORTFOLIO | | | | |
| | | | | | | | | | | | | | | | | | | | | | | | | | |
| | | | | | | | |
| COUNTERPARTY (a) | | REFERENCE
ENTITY | | PAY/RECEIVE
TOTAL
RETURN ON
REFERENCE
ENTITY | | BASE FINANCING
RATE (b) | | TERMINATION
DATE | | | PAYMENT
FREQUENCY | | | NOTIONAL
VALUE | | | NUMBER OF
UNITS | | | UNREALIZED
APPRECIATION
(DEPRECIATION) | |
| | | | | | | | | | | | | | | | | | | | | | |
| B | | Emis Group PLC | | Receive | | 1-Month LIBOR GBP | | | 3/18/2026 | | | | Term | | | $ | 44,400 | | | | 5,810 | | | $ | 17,449 | |
| C | | Emis Group PLC | | Receive | | 1-Month LIBOR GBP | | | 9/20/2021 | | | | Term | | | | 95,055 | | | | 12,758 | | | | 41,753 | |
| A | | Emis Group PLC | | Receive | | 1-Month LIBOR GBP | | | 6/28/2024 | | | | Term | | | | 45 | | | | 6 | | | | 22 | |
| C | | Enquest PLC | | Receive | | 1-Month LIBOR GBP | | | 9/20/2021 | | | | Term | | | | 235,156 | | | | 1,457,135 | | | | (10,083 | ) |
| B | | Entertainment One Ltd. | | Receive | | 1-Month LIBOR GBP | | | 3/18/2026 | | | | Term | | | | 48,457 | | | | 13,877 | | | | (984 | ) |
| C | | Entertainment One Ltd. | | Receive | | 1-Month LIBOR GBP | | | 9/20/2021 | | | | Term | | | | 64,024 | | | | 18,934 | | | | 1,915 | |
| C | | Equiniti Group PLC | | Receive | | 1-Month LIBOR GBP | | | 9/20/2021 | | | | Term | | | | 9,780 | | | | 5,813 | | | | 766 | |
| A | | Equinix, Inc. | | Pay | | 1-Month LIBOR USD | | | 4/2/2029 | | | | Term | | | | 698,080 | | | | 1,437 | | | | — | |
| B | | Eramet | | Receive | | 1-Month LIBOR EUR | | | 3/18/2026 | | | | Term | | | | 145,191 | | | | 3,183 | | | | 543 | |
| C | | Eramet | | Receive | | 1-Month LIBOR EUR | | | 9/20/2021 | | | | Term | | | | 109,347 | | | | 2,321 | | | | (3,905 | ) |
| A | | Estia Health Ltd. | | Receive | | 1-Month Bank Bill
Swap Rate | | | 6/28/2024 | | | | Term | | | | 102,404 | | | | 29,944 | | | | 8,499 | |
| C | | Euromoney Institutional Investor PLC | | Receive | | 1-Month LIBOR GBP | | | 9/20/2021 | | | | Term | | | | 17,181 | | | | 1,718 | | | | 899 | |
| B | | Euronext N.V. | | Receive | | 1-Month LIBOR EUR | | | 3/18/2026 | | | | Term | | | | 95,062 | | | | 1,886 | | | | 18,286 | |
| A | | Evolution Mining Ltd. | | Receive | | 1-Month Bank Bill
Swap Rate | | | 6/28/2024 | | | | Term | | | | 51,773 | | | | 11,809 | | | | 6,888 | |
| A | | Federal Realty Investment Trust | | Pay | | 1-Month LIBOR USD | | | 4/2/2029 | | | | Term | | | | 916,156 | | | | 7,008 | | | | — | |
| B | | Ferrexpo PLC | | Receive | | 1-Month LIBOR GBP | | | 3/18/2026 | | | | Term | | | | 352,238 | | | | 164,787 | | | | (73,793 | ) |
| C | | Ferrexpo PLC | | Receive | | 1-Month LIBOR GBP | | | 9/20/2021 | | | | Term | | | | 39,014 | | | | 25,684 | | | | 13,893 | |
| B | | Fevertree Drinks PLC | | Receive | | 1-Month LIBOR GBP | | | 3/18/2026 | | | | Term | | | | 21,225 | | | | 962 | | | | (1,610 | ) |
| C | | Fevertree Drinks PLC | | Receive | | 1-Month LIBOR GBP | | | 9/20/2021 | | | | Term | | | | 3,408 | | | | 173 | | | | 347 | |
| C | | Figeac-Aero | | Receive | | 1-Month LIBOR EUR | | | 9/20/2021 | | | | Term | | | | 16,221 | | | | 1,419 | | | | (1,611 | ) |
| C | | Firstgroup PLC | | Receive | | 1-Month LIBOR GBP | | | 9/20/2021 | | | | Term | | | | 514,625 | | | | 716,816 | | | | 219,658 | |
| A | | Flexigroup Ltd. | | Receive | | 1-Month Bank Bill
Swap Rate | | | 6/28/2024 | | | | Term | | | | 468,485 | | | | 231,371 | | | | 70,350 | |
| B | | FNAC Darty S.A. | | Receive | | 1-Month LIBOR EUR | | | 3/18/2026 | | | | Term | | | | 298,504 | | | | 4,706 | | | | (14,131 | ) |
| C | | FNAC Darty S.A. | | Receive | | 1-Month LIBOR EUR | | | 9/20/2021 | | | | Term | | | | 441,868 | | | | 7,789 | | | | 41,899 | |
| B | | Forterra PLC | | Receive | | 1-Month LIBOR GBP | | | 3/18/2026 | | | | Term | | | | 69,648 | | | | 29,445 | | | | (3,470 | ) |
| C | | Forterra PLC | | Receive | | 1-Month LIBOR GBP | | | 9/20/2021 | | | | Term | | | | 153,924 | | | | 78,834 | | | | 42,190 | |
| A | | Forterra PLC | | Receive | | 1-Month LIBOR GBP | | | 6/28/2024 | | | | Term | | | | 9,422 | | | | 4,529 | | | | 2,214 | |
| A | | G.U.D. Holdings Ltd. | | Receive | | 1-Month Bank Bill
Swap Rate | | | 6/28/2024 | | | | Term | | | | 13,711 | | | | 800 | | | | (817 | ) |
| A | | G8 Education Ltd. | | Receive | | 1-Month Bank Bill
Swap Rate | | | 6/28/2024 | | | | Term | | | | 322,374 | | | | 109,537 | | | | 75,602 | |
| C | | Galliford Try PLC | | Receive | | 1-Month LIBOR GBP | | | 9/20/2021 | | | | Term | | | | 11,046 | | | | 2,459 | | | | 2,400 | |
| C | | Games Workshop Group PLC | | Receive | | 1-Month LIBOR GBP | | | 9/20/2021 | | | | Term | | | | 356,100 | | | | 13,838 | | | | 220,751 | |
| B | | Gaztransport et Techniga S.A. | | Receive | | 1-Month LIBOR EUR | | | 3/18/2026 | | | | Term | | | | 295,948 | | | | 3,940 | | | | (4,064 | ) |
| C | | Gaztransport et Techniga S.A. | | Receive | | 1-Month LIBOR EUR | | | 9/20/2021 | | | | Term | | | | 26,426 | | | | 361 | | | | 500 | |
| A | | Gaztransport et Techniga S.A. | | Receive | | 1-Month LIBOR EUR | | | 6/28/2024 | | | | Term | | | | 22,734 | | | | 691 | | | | 38,992 | |
| B | | GL Events S.A. | | Receive | | 1-Month LIBOR EUR | | | 3/18/2026 | | | | Term | | | | 50,141 | | | | 2,878 | | | | 7,169 | |
| C | | GL Events S.A. | | Receive | | 1-Month LIBOR EUR | | | 9/20/2021 | | | | Term | | | | 66,474 | | | | 3,984 | | | | 13,609 | |
| A | | GL Events S.A. | | Receive | | 1-Month LIBOR EUR | | | 6/28/2024 | | | | Term | | | | 7,115 | | | | 370 | | | | 439 | |
| | | | |
| | The accompanying Notes to the Financial Statements are an integral part of these Financial Statements. | | (Continued) |
| | | | | | | | | | | | | | | | |
| | Elements Portfolios | | | | | | Annual Report | | | | | | May 31, 2019 | | |
| | | | |
74
| | |
| Schedule of Investments | | as of May 31, 2019 |
| | | | |
| ELEMENTS INTERNATIONAL SMALL CAP PORTFOLIO | | | | |
| | | | | | | | | | | | | | | | | | | | | | | | | | |
| | | | | | | | |
| COUNTERPARTY (a) | | REFERENCE
ENTITY | | PAY/RECEIVE
TOTAL
RETURN ON
REFERENCE
ENTITY | | BASE FINANCING
RATE (b) | | TERMINATION
DATE | | | PAYMENT
FREQUENCY | | | NOTIONAL
VALUE | | | NUMBER OF
UNITS | | | UNREALIZED
APPRECIATION
(DEPRECIATION) | |
| | | | | | | | | | | | | | | | | | | | | | |
| B | | GO-AHEAD Group PLC | | Receive | | 1-Month LIBOR GBP | | | 3/18/2026 | | | | Term | | | $ | 87,299 | | | | 5,463 | | | $ | (8,728 | ) |
| C | | GO-AHEAD Group PLC | | Receive | | 1-Month LIBOR GBP | | | 9/20/2021 | | | | Term | | | | 224,940 | | | | 16,761 | | | | 49,322 | |
| C | | Gocompare.Com Group PLC | | Receive | | 1-Month LIBOR GBP | | | 9/20/2021 | | | | Term | | | | 68,890 | | | | 116,889 | | | | 14,485 | |
| C | | Grafton Group PLC | | Receive | | 1-Month LIBOR GBP | | | 9/20/2021 | | | | Term | | | | 217,399 | | | | 34,825 | | | | 29,087 | |
| A | | Graincorp Ltd. — Class A | | Receive | | 1-Month Bank Bill
Swap Rate | | | 6/28/2024 | | | | Term | | | | 527,880 | | | | 47,611 | | | | 1,189 | |
| C | | Greencore Group PLC | | Receive | | 1-Month LIBOR GBP | | | 9/20/2021 | | | | Term | | �� | | 155,997 | | | | 98,097 | | | | 9,174 | |
| B | | Greene King PLC | | Receive | | 1-Month LIBOR GBP | | | 3/18/2026 | | | | Term | | | | 44,029 | | | | 8,292 | | | | (3,653 | ) |
| C | | Greene King PLC | | Receive | | 1-Month LIBOR GBP | | | 9/20/2021 | | | | Term | | | | 260,932 | | | | 55,961 | | | | 34,732 | |
| B | | Greggs PLC | | Receive | | 1-Month LIBOR GBP | | | 3/18/2026 | | | | Term | | | | 442,568 | | | | 30,289 | | | | 132,851 | |
| C | | Greggs PLC | | Receive | | 1-Month LIBOR GBP | | | 9/20/2021 | | | | Term | | | | 82,206 | | | | 8,301 | | | | 98,322 | |
| A | | Greggs PLC | | Receive | | 1-Month LIBOR GBP | | | 6/28/2024 | | | | Term | | | | 18,586 | | | | 2,194 | | | | 31,867 | |
| B | | Groupe Crit S.A. | | Receive | | 1-Month LIBOR EUR | | | 3/18/2026 | | | | Term | | | | 29,189 | | | | 614 | | | | 5,880 | |
| C | | Groupe Crit S.A. | | Receive | | 1-Month LIBOR EUR | | | 9/20/2021 | | | | Term | | | | 39,646 | | | | 764 | | | | 3,174 | |
| A | | Groupe Crit S.A. | | Receive | | 1-Month LIBOR EUR | | | 6/28/2024 | | | | Term | | | | 6,239 | | | | 94 | | | | (896 | ) |
| C | | Groupe Guillin | | Receive | | 1-Month LIBOR EUR | | | 9/20/2021 | | | | Term | | | | 50,699 | | | | 2,873 | | | | (2,495 | ) |
| B | | Guerbet S.A. | | Receive | | 1-Month LIBOR EUR | | | 3/18/2026 | | | | Term | | | | 42,081 | | | | 941 | | | | 24 | |
| C | | Guerbet S.A. | | Receive | | 1-Month LIBOR EUR | | | 9/20/2021 | | | | Term | | | | 61,412 | | | | 1,247 | | | | (7,001 | ) |
| C | | Gulf Keystone Petroleum Ltd. | | Receive | | 1-Month LIBOR GBP | | | 9/20/2021 | | | | Term | | | | 65,086 | | | | 36,584 | | | | 1,617 | |
| A | | GWA Group Ltd. | | Receive | | 1-Month Bank Bill
Swap Rate | | | 6/28/2024 | | | | Term | | | | 183,579 | | | | 39,597 | | | | 7,844 | |
| B | | Halfords Group PLC | | Receive | | 1-Month LIBOR GBP | | | 3/18/2026 | | | | Term | | | | 234,170 | | | | 120,133 | | | | (33,225 | ) |
| C | | Halfords Group PLC | | Receive | | 1-Month LIBOR GBP | | | 9/20/2021 | | | | Term | | | | 371,665 | | | | 187,479 | | | | (60,318 | ) |
| A | | Halfords Group PLC | | Receive | | 1-Month LIBOR GBP | | | 6/28/2024 | | | | Term | | | | 5,134 | | | | 1,793 | | | | (2,457 | ) |
| A | | Halliburton Co. | | Pay | | 1-Month LIBOR USD | | | 4/2/2029 | | | | Term | | | | 3,968,946 | | | | 186,423 | | | | — | |
| A | | Hansen Technologies Ltd. | | Receive | | 1-Month Bank Bill
Swap Rate | | | 6/28/2024 | | | | Term | | | | 102,955 | | | | 22,381 | | | | 11,202 | |
| C | | Haulotte Group | | Receive | | 1-Month LIBOR EUR | | | 9/20/2021 | | | | Term | | | | 1,729 | | | | 225 | | | | (383 | ) |
| B | | Hays PLC | | Receive | | 1-Month LIBOR GBP | | | 3/18/2026 | | | | Term | | | | 338,125 | | | | 274,511 | | | | (26,817 | ) |
| C | | Hays PLC | | Receive | | 1-Month LIBOR GBP | | | 9/20/2021 | | | | Term | | | | 239,599 | | | | 201,498 | | | | (4,077 | ) |
| A | | HCA Healthcare, Inc. | | Pay | | 1-Month LIBOR USD | | | 4/2/2029 | | | | Term | | | | 1,934,392 | | | | 15,992 | | | | — | |
| A | | Healius Ltd. | | Receive | | 1-Month Bank Bill
Swap Rate | | | 6/28/2024 | | | | Term | | | | 39,968 | | | | 9,900 | | | | 2,672 | |
| A | | Highwoods Properties, Inc. | | Pay | | 1-Month LIBOR USD | | | 4/2/2029 | | | | Term | | | | 1,159,080 | | | | 26,000 | | | | 9,890 | |
| B | | Hikma Pharmaceuticals PLC | | Receive | | 1-Month LIBOR GBP | | | 3/18/2026 | | | | Term | | | | 170,976 | | | | 13,580 | | | | 807 | |
| C | | Hikma Pharmaceuticals PLC | | Receive | | 1-Month LIBOR GBP | | | 9/20/2021 | | | | Term | | | | 3,043 | | | | 216 | | | | (518 | ) |
| C | | Hill & Smith Holdings PLC | | Receive | | 1-Month LIBOR GBP | | | 9/20/2021 | | | | Term | | | | 58,875 | | | | 5,912 | | | | (2,468 | ) |
| C | | Hochschild Mining PLC | | Receive | | 1-Month LIBOR GBP | | | 9/20/2021 | | | | Term | | | | 101,425 | | | | 78,079 | | | | (8,752 | ) |
| | | | |
| | The accompanying Notes to the Financial Statements are an integral part of these Financial Statements. | | (Continued) |
| | | | | | | | | | | | | | | | |
| | Elements Portfolios | | | | | | Annual Report | | | | | | May 31, 2019 | | |
| | | | |
75
| | |
| Schedule of Investments | | as of May 31, 2019 |
| | | | |
| ELEMENTS INTERNATIONAL SMALL CAP PORTFOLIO | | | | |
| | | | | | | | | | | | | | | | | | | | | | | | | | |
| | | | | | | | |
| COUNTERPARTY (a) | | REFERENCE
ENTITY | | PAY/RECEIVE
TOTAL
RETURN ON
REFERENCE
ENTITY | | BASE FINANCING
RATE (b) | | TERMINATION
DATE | | | PAYMENT
FREQUENCY | | | NOTIONAL
VALUE | | | NUMBER OF
UNITS | | | UNREALIZED
APPRECIATION
(DEPRECIATION) | |
| | | | | | | | | | | | | | | | | | | | | | |
| A | | Home Depot, Inc. | | Pay | | 1-Month LIBOR USD | | | 4/2/2029 | | | | Term | | | $ | 5,163,750 | | | | 25,000 | | | $ | 433,180 | |
| B | | Hotel Chocolat Group Ltd. | | Receive | | 1-Month LIBOR GBP | | | 3/18/2026 | | | | Term | | | | 1,667 | | | | 602 | | | | (26 | ) |
| B | | Howden Joinery Group PLC | | Receive | | 1-Month LIBOR GBP | | | 3/18/2026 | | | | Term | | | | 377,474 | | | | 94,975 | | | | 7,831 | |
| C | | Howden Joinery Group PLC | | Receive | | 1-Month LIBOR GBP | | | 9/20/2021 | | | | Term | | | | 129,484 | | | | 36,251 | | | | 26,830 | |
| A | | Howden Joinery Group PLC | | Receive | | 1-Month LIBOR GBP | | | 6/28/2024 | | | | Term | | | | 1,284 | | | | 353 | | | | 248 | |
| A | | Ht&E Ltd. | | Receive | | 1-Month Bank Bill
Swap Rate | | | 6/28/2024 | | | | Term | | | | 35,406 | | | | 13,715 | | | | 519 | |
| C | | Hunting PLC | | Receive | | 1-Month LIBOR GBP | | | 9/20/2021 | | | | Term | | | | 9,134 | | | | 2,451 | | | | 1,195 | |
| B | | ID Logistics Group | | Receive | | 1-Month LIBOR EUR | | | 3/18/2026 | | | | Term | | | | 20,464 | | | | 153 | | | | 1,114 | |
| A | | IDP Education Ltd. | | Receive | | 1-Month Bank Bill
Swap Rate | | | 6/28/2024 | | | | Term | | | | 16,720 | | | | 1,232 | | | | 6,549 | |
| C | | IG Group Holdings PLC | | Receive | | 1-Month LIBOR GBP | | | 9/20/2021 | | | | Term | | | | 425,828 | | | | 93,770 | | | | (29,730 | ) |
| A | | Iluka Resources Ltd. | | Receive | | 1-Month Bank Bill
Swap Rate | | | 6/28/2024 | | | | Term | | | | 437,140 | | | | 39,886 | | | | 63,395 | |
| A | | Inchcape PLC | | Receive | | 1-Month LIBOR GBP | | | 6/28/2024 | | | | Term | | | | 223 | | | | 33 | | | | (97 | ) |
| B | | Inchcape PLC | | Receive | | 1-Month LIBOR GBP | | | 3/18/2026 | | | | Term | | | | 311,743 | | | | 68,533 | | | | 23,673 | |
| C | | Inchcape PLC | | Receive | | 1-Month LIBOR GBP | | | 9/20/2021 | | | | Term | | | | 614,454 | | | | 133,031 | | | | 30,927 | |
| A | | Inghams Group Ltd. | | Receive | | 1-Month Bank Bill
Swap Rate | | | 6/28/2024 | | | | Term | | | | 1,283,114 | | | | 232,975 | | | | 123,619 | |
| B | | Inmarsat PLC | | Receive | | 1-Month LIBOR GBP | | | 3/18/2026 | | | | Term | | | | 4,773 | | | | 1,400 | | | | 2,186 | |
| C | | Inmarsat PLC | | Receive | | 1-Month LIBOR GBP | | | 9/20/2021 | | | | Term | | | | 21,439 | | | | 6,945 | | | | 14,403 | |
| C | | International Personal Finance | | Receive | | 1-Month LIBOR GBP | | | 9/20/2021 | | | | Term | | | | 91,423 | | | | 56,945 | | | | (26,834 | ) |
| A | | Interparfums S.A. | | Receive | | 1-Month LIBOR EUR | | | 6/28/2024 | | | | Term | | | | 2,778 | | | | 112 | | | | 1,821 | |
| B | | Interparfums S.A. | | Receive | | 1-Month LIBOR EUR | | | 3/18/2026 | | | | Term | | | | 115,106 | | | | 2,795 | | | | (13,180 | ) |
| C | | Interparfums S.A. | | Receive | | 1-Month LIBOR EUR | | | 9/20/2021 | | | | Term | | | | 216,822 | | | | 5,782 | | | | (1,066 | ) |
| B | | Iomart Group PLC | | Receive | | 1-Month LIBOR GBP | | | 3/18/2026 | | | | Term | | | | 12,700 | | | | 4,522 | | | | 87 | |
| A | | Ioof Holdings Ltd. | | Receive | | 1-Month Bank Bill
Swap Rate | | | 6/28/2024 | | | | Term | | | | 255,775 | | | | 35,726 | | | | 14,756 | |
| A | | IPH Ltd. | | Receive | | 1-Month Bank Bill
Swap Rate | | | 6/28/2024 | | | | Term | | | | 57,407 | | | | 6,158 | | | | 1,479 | |
| B | | Ipsos S.A. | | Receive | | 1-Month LIBOR EUR | | | 3/18/2026 | | | | Term | | | | 290,811 | | | | 13,729 | | | | 14,990 | |
| C | | Ipsos S.A. | | Receive | | 1-Month LIBOR EUR | | | 9/20/2021 | | | | Term | | | | 120,221 | | | | 6,107 | | | | 18,112 | |
| B | | J.D. Wetherspoon PLC | | Receive | | 1-Month LIBOR GBP | | | 3/18/2026 | | | | Term | | | | 45,658 | | | | 4,389 | | | | 910 | |
| C | | J.D. Wetherspoon PLC | | Receive | | 1-Month LIBOR GBP | | | 9/20/2021 | | | | Term | | | | 24,018 | | | | 2,274 | | | | (84 | ) |
| B | | Jacquet Metal Service S.A. | | Receive | | 1-Month LIBOR EUR | | | 3/18/2026 | | | | Term | | | | 6,905 | | | | 472 | | | | (173 | ) |
| C | | Jacquet Metal Service S.A. | | Receive | | 1-Month LIBOR EUR | | | 9/20/2021 | | | | Term | | | | 90,344 | | | | 6,380 | | | | 1,420 | |
| A | | JBHi-Fi Ltd. | | Receive | | 1-Month Bank Bill
Swap Rate | | | 6/28/2024 | | | | Term | | | | 1,432,739 | | | | 43,277 | | | | 177,963 | |
| B | | JD Sports Fashion PLC | | Receive | | 1-Month LIBOR GBP | | | 3/18/2026 | | | | Term | | | | 416,601 | | | | 107,166 | | | | 168,072 | |
| | | | |
| | The accompanying Notes to the Financial Statements are an integral part of these Financial Statements. | | (Continued) |
| | | | | | | | | | | | | | | | |
| | Elements Portfolios | | | | | | Annual Report | | | | | | May 31, 2019 | | |
| | | | |
76
| | |
| Schedule of Investments | | as of May 31, 2019 |
| | | | |
| ELEMENTS INTERNATIONAL SMALL CAP PORTFOLIO | | | | |
| | | | | | | | | | | | | | | | | | | | | | | | | | |
| | | | | | | | |
| COUNTERPARTY (a) | | REFERENCE
ENTITY | | PAY/RECEIVE
TOTAL
RETURN ON
REFERENCE
ENTITY | | BASE FINANCING
RATE (b) | | TERMINATION
DATE | | | PAYMENT
FREQUENCY | | | NOTIONAL
VALUE | | | NUMBER OF
UNITS | | | UNREALIZED
APPRECIATION
(DEPRECIATION) | |
| | | | | | | | | | | | | | | | | | | | | | |
| C | | JD Sports Fashion PLC | | Receive | | 1-Month LIBOR GBP | | | 9/20/2021 | | | | Term | | | $ | 68,332 | | | | 15,980 | | | $ | 15,192 | |
| C | | John Laing Group PLC | | Receive | | 1-Month LIBOR GBP | | | 9/20/2021 | | | | Term | | | | 34,136 | | | | 14,096 | | | | 15,756 | |
| B | | John Menzies PLC | | Receive | | 1-Month LIBOR GBP | | | 3/18/2026 | | | | Term | | | | 17,218 | | | | 4,353 | | | | (1,011 | ) |
| C | | John Menzies PLC | | Receive | | 1-Month LIBOR GBP | | | 9/20/2021 | | | | Term | | | | 34,804 | | | | 8,345 | | | | (4,835 | ) |
| B | | Jpj Group PLC | | Receive | | 1-Month LIBOR GBP | | | 3/18/2026 | | | | Term | | | | 24,970 | | | | 4,690 | | | | 1,432 | |
| C | | Jpj Group PLC | | Receive | | 1-Month LIBOR GBP | | | 9/20/2021 | | | | Term | | | | 68,346 | | | | 12,361 | | | | (384 | ) |
| B | | Jupiter Fund Management PLC | | Receive | | 1-Month LIBOR GBP | | | 3/18/2026 | | | | Term | | | | 35,085 | | | | 12,500 | | | | 1,932 | |
| C | | Jupiter Fund Management PLC | | Receive | | 1-Month LIBOR GBP | | | 9/20/2021 | | | | Term | | | | 220,861 | | | | 84,266 | | | | 59,065 | |
| A | | Kainos Group PLC | | Receive | | 1-Month LIBOR GBP | | | 6/28/2024 | | | | Term | | | | 1,065 | | | | 524 | | | | 2,435 | |
| B | | Kainos Group PLC | | Receive | | 1-Month LIBOR GBP | | | 3/18/2026 | | | | Term | | | | 14,575 | | | | 3,543 | | | | 4,236 | |
| B | | Kaufman & Broad S.A. | | Receive | | 1-Month LIBOR EUR | | | 3/18/2026 | | | | Term | | | | 135,521 | | | | 4,524 | | | | 3,270 | |
| C | | Kaufman & Broad S.A. | | Receive | | 1-Month LIBOR EUR | | | 9/20/2021 | | | | Term | | | | 309,675 | | | | 9,588 | | | | (21,757 | ) |
| C | | Kaz Minerals PLC | | Receive | | 1-Month LIBOR GBP | | | 9/20/2021 | | | | Term | | | | 9,793 | | | | 2,040 | | | | (2,437 | ) |
| B | | Keller Group PLC | | Receive | | 1-Month LIBOR GBP | | | 3/18/2026 | | | | Term | | | | 33,215 | | | | 6,654 | | | | 7,249 | |
| C | | Keller Group PLC | | Receive | | 1-Month LIBOR GBP | | | 9/20/2021 | | | | Term | | | | 124,026 | | | | 28,152 | | | | 57,014 | |
| A | | Kogan.com Ltd. | | Receive | | 1-Month Bank Bill
Swap Rate | | | 6/28/2024 | | | | Term | | | | 515,305 | | | | 92,095 | | | | 111,887 | |
| C | | Korian | | Receive | | 1-Month LIBOR EUR | | | 9/20/2021 | | | | Term | | | | 56,319 | | | | 1,790 | | | | 939 | |
| C | | Lagardere SCA | | Receive | | 1-Month LIBOR EUR | | | 9/20/2021 | | | | Term | | | | 1,412,011 | | | | 65,711 | | | | (81,074 | ) |
| C | | Latecoere | | Receive | | 1-Month LIBOR EUR | | | 9/20/2021 | | | | Term | | | | 5,845 | | | | 2,135 | | | | (521 | ) |
| C | | Lisi | | Receive | | 1-Month LIBOR EUR | | | 9/20/2021 | | | | Term | | | | 26,069 | | | | 1,054 | | | | (1,089 | ) |
| B | | LNA Sante S.A. | | Receive | | 1-Month LIBOR EUR | | | 3/18/2026 | | | | Term | | | | 8,389 | | | | 200 | | | | (642 | ) |
| C | | LNA Sante S.A. | | Receive | | 1-Month LIBOR EUR | | | 9/20/2021 | | | | Term | | | | 72,115 | | | | 1,725 | | | | (5,221 | ) |
| A | | Lovisa Holdings Ltd. | | Receive | | 1-Month Bank Bill
Swap Rate | | | 6/28/2024 | | | | Term | | | | 140,331 | | | | 9,796 | | | | 9,815 | |
| A | | LXI Reit PLC (c) | | Receive | | 1-Month LIBOR GBP | | | 9/20/2021 | | | | Term | | | | 840 | | | | 10,631 | | | | (1,316 | ) |
| A | | LyondellBasell Industries N.V. | | Pay | | 1-Month LIBOR USD | | | 4/2/2029 | | | | Term | | | | 1,294,103 | | | | 17,429 | | | | — | |
| B | | M6 Metropole Television | | Receive | | 1-Month LIBOR EUR | | | 3/18/2026 | | | | Term | | | | 173,602 | | | | 11,440 | | | | (372 | ) |
| C | | M6 Metropole Television | | Receive | | 1-Month LIBOR EUR | | | 9/20/2021 | | | | Term | | | | 385,630 | | | | 27,387 | | | | 35,920 | |
| A | | Magellan Financial Group Ltd. | | Receive | | 1-Month Bank Bill
Swap Rate | | | 6/28/2024 | | | | Term | | | | 419,186 | | | | 7,802 | | | | 32,769 | |
| B | | Maisons Du Monde S.A. | | Receive | | 1-Month LIBOR EUR | | | 3/18/2026 | | | | Term | | | | 59,386 | | | | 3,453 | | | | (4,514 | ) |
| C | | Maisons Du Monde S.A. | | Receive | | 1-Month LIBOR EUR | | | 9/20/2021 | | | | Term | | | | 70,783 | | | | 4,889 | | | | 10,233 | |
| C | | Man Group PLC | | Receive | | 1-Month LIBOR GBP | | | 9/20/2021 | | | | Term | | | | 182,940 | | | | 166,503 | | | | 22,699 | |
| B | | Manitou BF S.A. | | Receive | | 1-Month LIBOR EUR | | | 3/18/2026 | | | | Term | | | | 22,505 | | | | 945 | | | | (1,387 | ) |
| C | | Manitou BF S.A. | | Receive | | 1-Month LIBOR EUR | | | 9/20/2021 | | | | Term | | | | 32,144 | | | | 1,638 | | | | 6,174 | |
| | | | |
| | The accompanying Notes to the Financial Statements are an integral part of these Financial Statements. | | (Continued) |
| | | | | | | | | | | | | | | | |
| | Elements Portfolios | | | | | | Annual Report | | | | | | May 31, 2019 | | |
| | | | |
77
| | |
| Schedule of Investments | | as of May 31, 2019 |
| | | | |
| ELEMENTS INTERNATIONAL SMALL CAP PORTFOLIO | | | | |
| | | | | | | | | | | | | | | | | | | | | | | | | | |
| | | | | | | | |
| COUNTERPARTY (a) | | REFERENCE
ENTITY | | PAY/RECEIVE
TOTAL
RETURN ON
REFERENCE
ENTITY | | BASE FINANCING
RATE (b) | | TERMINATION
DATE | | | PAYMENT
FREQUENCY | | | NOTIONAL
VALUE | | | NUMBER OF
UNITS | | | UNREALIZED
APPRECIATION
(DEPRECIATION) | |
| | | | | | | | | | | | | | | | | | | | | | |
| A | | Marshalls PLC | | Receive | | 1-Month LIBOR
GBP | | | 6/28/2024 | | | | Term | | | $ | 21,998 | | | | 7,131 | | | $ | 24,742 | |
| B | | Marshalls PLC | | Receive | | 1-Month LIBOR
GBP | | | 3/18/2026 | | | | Term | | | | 190,670 | | | | 40,372 | | | | 23,919 | |
| C | | Marston’s PLC | | Receive | | 1-Month LIBOR
GBP | | | 9/20/2021 | | | | Term | | | | 1,880 | | | | 2,512 | | | | 470 | |
| C | | Maurel & Prom | | Receive | | 1-Month LIBOR
EUR | | | 9/20/2021 | | | | Term | | | | 18,914 | | | | 6,143 | | | | (3,705 | ) |
| C | | Mccarthy & Stone PLC | | Receive | | 1-Month LIBOR
GBP | | | 9/20/2021 | | | | Term | | | | 17,640 | | | | 17,253 | | | | 371 | |
| A | | McMillan Shakespeare Ltd. | | Receive | | 1-Month Bank
Bill Swap Rate | | | 6/28/2024 | | | | Term | | | | 322,951 | | | | 15,354 | | | | (16,211 | ) |
| C | | Mersen | | Receive | | 1-Month LIBOR
EUR | | | 9/20/2021 | | | | Term | | | | 59,380 | | | | 2,168 | | | | (2,299 | ) |
| A | | Metcash Ltd. | | Receive | | 1-Month Bank
Bill Swap Rate | | | 6/28/2024 | | | | Term | | | | 1,151,490 | | | | 291,867 | | | | 48,885 | |
| C | | Mitchells & Butlers PLC | | Receive | | 1-Month LIBOR
GBP | | | 9/20/2021 | | | | Term | | | | 13,569 | | | | 6,621 | | | | 1,350 | |
| B | | Moneysupermarket.com Group PLC | | Receive | | 1-Month LIBOR
GBP | | | 3/18/2026 | | | | Term | | | | 141,228 | | | | 49,562 | | | | 12,765 | |
| C | | Moneysupermarket.com Group PLC | | Receive | | 1-Month LIBOR
GBP | | | 9/20/2021 | | | | Term | | | | 174,128 | | | | 72,891 | | | | 71,885 | |
| C | | Morgan Sindall Group PLC | | Receive | | 1-Month LIBOR
GBP | | | 9/20/2021 | | | | Term | | | | 12,418 | | | | 1,256 | | | | 1,013 | |
| A | | Myer Holdings Ltd. | | Receive | | 1-Month Bank
Bill Swap Rate | | | 6/28/2024 | | | | Term | | | | 239,017 | | | | 239,886 | | | | (3,741 | ) |
| A | | Nanosonics Ltd. | | Receive | | 1-Month Bank
Bill Swap Rate | | | 6/28/2024 | | | | Term | | | | 1,874 | | | | 459 | | | | 522 | |
| C | | National Express Group PLC | | Receive | | 1-Month LIBOR
GBP | | | 9/20/2021 | | | | Term | | | | 93,099 | | | | 28,950 | | | | (601 | ) |
| A | | Navitas Ltd. | | Receive | | 1-Month Bank
Bill Swap Rate | | | 6/28/2024 | | | | Term | | | | 242,958 | | | | 39,232 | | | | 39,612 | |
| B | | Neopost S.A. | | Receive | | 1-Month LIBOR
EUR | | | 3/18/2026 | | | | Term | | | | 149,524 | | | | 7,390 | | | | (24,785 | ) |
| C | | Neopost S.A. | | Receive | | 1-Month LIBOR
EUR | | | 9/20/2021 | | | | Term | | | | 308,600 | | | | 14,945 | | | | (57,776 | ) |
| A | | New Hope Corp Ltd. | | Receive | | 1-Month Bank
Bill Swap Rate | | | 6/28/2024 | | | | Term | | | | 642,156 | | | | 121,557 | | | | (83,194 | ) |
| A | | New Relic, Inc. | | Pay | | 1-Month LIBOR
USD | | | 4/2/2029 | | | | Term | | | | 1,359,540 | | | | 14,000 | | | | (38,748 | ) |
| A | | New Residential Investment Corp. | | Pay | | 1-Month LIBOR
USD | | | 4/2/2029 | | | | Term | | | | 304,627 | | | | 18,340 | | | | 26,073 | |
| B | | Nexans S.A. | | Receive | | 1-Month LIBOR
EUR | | | 3/18/2026 | | | | Term | | | | 9,222 | | | | 365 | | | | (958 | ) |
| C | | Nexans S.A. | | Receive | | 1-Month LIBOR
EUR | | | 9/20/2021 | | | | Term | | | | 438,340 | | | | 17,445 | | | | (42,648 | ) |
| C | | Nexity | | Receive | | 1-Month LIBOR
EUR | | | 9/20/2021 | | | | Term | | | | 164,045 | | | | 4,246 | | | | (7,396 | ) |
| A | | NIB Holdings Ltd. | | Receive | | 1-Month Bank
Bill Swap Rate | | | 6/28/2024 | | | | Term | | | | 549,425 | | | | 69,926 | | | | 69,031 | |
| A | | Nine Entertainment Co., Holdings | | Receive | | 1-Month Bank
Bill Swap Rate | | | 6/28/2024 | | | | Term | | | | 92,244 | | | | 39,826 | | | | 14,342 | |
| A | | Northern Star Resources Ltd. | | Receive | | 1-Month Bank
Bill Swap Rate | | | 6/28/2024 | | | | Term | | | | 37,799 | | | | 3,593 | | | | 5,997 | |
| A | | Northrop Grumman Corp. | | Pay | | 1-Month LIBOR
USD | | | 4/2/2029 | | | | Term | | | | 544,940 | | | | 1,797 | | | | — | |
| | | | |
| | The accompanying Notes to the Financial Statements are an integral part of these Financial Statements. | | (Continued) |
| | | | | | | | | | | | | | | | |
| | Elements Portfolios | | | | | | Annual Report | | | | | | May 31, 2019 | | |
| | | | |
78
| | |
| Schedule of Investments | | as of May 31, 2019 |
| | | | |
| ELEMENTS INTERNATIONAL SMALL CAP PORTFOLIO | | | | |
| | | | | | | | | | | | | | | | | | | | | | | | | | |
| | | | | | | | |
| COUNTERPARTY (a) | | REFERENCE
ENTITY | | PAY/RECEIVE
TOTAL
RETURN ON
REFERENCE
ENTITY | | BASE FINANCING
RATE (b) | | TERMINATION
DATE | | | PAYMENT
FREQUENCY | | | NOTIONAL
VALUE | | | NUMBER OF
UNITS | | | UNREALIZED
APPRECIATION
(DEPRECIATION) | |
| | | | | | | | | | | | | | | | | | | | | | |
| A | | NRW Holdings Ltd. | | Receive | | 1-Month Bank
Bill Swap Rate | | | 6/28/2024 | | | | Term | | | $ | 264,345 | | | | 67,798 | | | $ | 1,770 | |
| C | | Numis Corporation PLC | | Receive | | 1-Month LIBOR
GBP | | | 9/20/2021 | | | | Term | | | | 2,578 | | | | 1,263 | | | | 261 | |
| C | | Oeneo S.A. | | Receive | | 1-Month LIBOR
EUR | | | 9/20/2021 | | | | Term | | | | 1,753 | | | | 229 | | | | 411 | |
| A | | OFX Group Ltd. | | Receive | | 1-Month Bank
Bill Swap Rate | | | 6/28/2024 | | | | Term | | | | 61,625 | | | | 24,653 | | | | (3,313 | ) |
| B | | Origin Enterprises PLC | | Receive | | 1-Month LIBOR
EUR | | | 3/18/2026 | | | | Term | | | | 59,432 | | | | 12,339 | | | | 119 | |
| C | | Origin Enterprises PLC | | Receive | | 1-Month LIBOR
EUR | | | 9/20/2021 | | | | Term | | | | 10,399 | | | | 2,084 | | | | (17 | ) |
| A | | PACCAR, Inc. | | Pay | | 1-Month LIBOR
USD | | | 4/2/2029 | | | | Term | | | | 347,614 | | | | 5,054 | | | | 14,633 | |
| B | | Pagegroup PLC | | Receive | | 1-Month LIBOR
GBP | | | 3/18/2026 | | | | Term | | | | 153,932 | | | | 39,955 | | | | 14,984 | |
| C | | Pagegroup PLC | | Receive | | 1-Month LIBOR
GBP | | | 9/20/2021 | | | | Term | | | | 278,492 | | | | 77,728 | | | | 62,496 | |
| C | | Paragon Banking Group PLC | | Receive | | 1-Month LIBOR
GBP | | | 9/20/2021 | | | | Term | | | | 13,555 | | | | 4,056 | | | | 563 | |
| A | | Pendal Group Ltd. | | Receive | | 1-Month Bank
Bill Swap Rate | | | 6/28/2024 | | | | Term | | | | 180,383 | | | | 15,620 | | | | (5,626 | ) |
| C | | Pendragon PLC | | Receive | | 1-Month LIBOR
GBP | | | 9/20/2021 | | | | Term | | | | 15,369 | | | | 82,110 | | | | (204 | ) |
| C | | Permanent TSB Group Holdings | | Receive | | 1-Month LIBOR
EUR | | | 9/20/2021 | | | | Term | | | | 432 | | | | 343 | | | | (26 | ) |
| B | | Petrofac Ltd. | | Receive | | 1-Month LIBOR
GBP | | | 3/18/2026 | | | | Term | | | | 7,267 | | | | 1,884 | | | | (1,322 | ) |
| C | | Petrofac Ltd. | | Receive | | 1-Month LIBOR
GBP | | | 9/20/2021 | | | | Term | | | | 237,688 | | | | 74,730 | | | | 28,425 | |
| C | | Pets at Home Group PLC | | Receive | | 1-Month LIBOR
GBP | | | 9/20/2021 | | | | Term | | | | 245,238 | | | | 223,480 | | | | 128,793 | |
| B | | Phoenix Group Holdings PLC | | Receive | | 1-Month LIBOR
GBP | | | 3/18/2026 | | | | Term | | | | 47,890 | | | | 8,704 | | | | (320 | ) |
| C | | Phoenix Group Holdings PLC | | Receive | | 1-Month LIBOR
GBP | | | 9/20/2021 | | | | Term | | | | 26,202 | | | | 4,832 | | | | 424 | |
| A | | Platinum Asset Management | | Receive | | 1-Month Bank
Bill Swap Rate | | | 6/28/2024 | | | | Term | | | | 604,542 | | | | 82,189 | | | | (24,219 | ) |
| C | | Playtech PLC | | Receive | | 1-Month LIBOR
GBP | | | 9/20/2021 | | | | Term | | | | 241,795 | | | | 74,157 | | | | 1,679 | |
| A | | Plus500 Ltd. | | Receive | | 1-Month LIBOR
GBP | | | 6/28/2024 | | | | Term | | | | 16,568 | | | | 4,310 | | | | 19,387 | |
| B | | Plus500 Ltd. | | Receive | | 1-Month LIBOR
GBP | | | 3/18/2026 | | | | Term | | | | 76,295 | | | | 11,848 | | | | (27,626 | ) |
| C | | Plus500 Ltd. | | Receive | | 1-Month LIBOR
GBP | | | 9/20/2021 | | | | Term | | | | 288,115 | | | | 50,513 | | | | (55,084 | ) |
| A | | PNC Financial Services Group Inc/The | | Pay | | 1-Month LIBOR
USD | | | 4/2/2029 | | | | Term | | | | 1,037,541 | | | | 8,151 | | | | (3,649 | ) |
| C | | Polypipe Group PLC | | Receive | | 1-Month LIBOR
GBP | | | 9/20/2021 | | | | Term | | | | 8,158 | | | | 2,540 | | | | 884 | |
| A | | PPL Corp. | | Pay | | 1-Month LIBOR
USD | | | 4/2/2029 | | | | Term | | | | 3,691,192 | | | | 124,032 | | | | — | |
| C | | Premier Foods PLC | | Receive | | 1-Month LIBOR
GBP | | | 9/20/2021 | | | | Term | | | | 5,374 | | | | 20,178 | | | | 427 | |
| A | | Premier Investments Ltd. | | Receive | | 1-Month Bank
Bill Swap Rate | | | 6/28/2024 | | | | Term | | | | 219,275 | | | | 9,403 | | | | 8,896 | |
| | | | |
| | The accompanying Notes to the Financial Statements are an integral part of these Financial Statements. | | (Continued) |
| | | | | | | | | | | | | | | | |
| | Elements Portfolios | | | | | | Annual Report | | | | | | May 31, 2019 | | |
| | | | |
79
| | |
| Schedule of Investments | | as of May 31, 2019 |
| | | | |
| ELEMENTS INTERNATIONAL SMALL CAP PORTFOLIO | | | | |
| | | | | | | | | | | | | | | | | | | | | | | | | | |
| | | | | | | | |
| COUNTERPARTY (a) | | REFERENCE
ENTITY | | PAY/RECEIVE
TOTAL
RETURN ON
REFERENCE
ENTITY | | BASE FINANCING
RATE (b) | | TERMINATION
DATE | | | PAYMENT
FREQUENCY | | | NOTIONAL
VALUE | | | NUMBER OF
UNITS | | | UNREALIZED
APPRECIATION
(DEPRECIATION) | |
| | | | | | | | | | | | | | | | | | | | | | |
| C | | Premier Oil PLC | | Receive | | 1-Month LIBOR GBP | | | 9/20/2021 | | | | Term | | | $ | 183,476 | | | | 254,179 | | | $ | (41,283 | ) |
| A | | Pro Medicus Ltd. | | Receive | | 1-Month Bank Bill
Swap Rate | | | 6/28/2024 | | | | Term | | | | 84,633 | | | | 5,772 | | | | 49,938 | |
| C | | PZ Cussons PLC | | Receive | | 1-Month LIBOR GBP | | | 9/20/2021 | | | | Term | | | | 107,374 | | | | 69,880 | | | | 7,504 | |
| C | | Qinetiq Group PLC | | Receive | | 1-Month LIBOR GBP | | | 9/20/2021 | | | | Term | | | | 22,470 | | | | 9,351 | | | | (1,556 | ) |
| C | | Quilter PLC | | Receive | | 1-Month LIBOR GBP | | | 9/20/2021 | | | | Term | | | | 61,070 | | | | 62,108 | | | | 8,355 | |
| A | | Raytheon Co. | | Pay | | 1-Month LIBOR USD | | | 4/2/2029 | | | | Term | | | | 1,324,676 | | | | 7,417 | | | | 35,325 | |
| A | | Realty Income Corp. | | Pay | | 1-Month LIBOR USD | | | 4/2/2029 | | | | Term | | | | 462,063 | | | | 6,439 | | | | 9,622 | |
| A | | Redcentric PLC | | Receive | | 1-Month LIBOR GBP | | | 6/28/2024 | | | | Term | | | | 1,041 | | | | 1,530 | | | | (104 | ) |
| B | | Redcentric PLC | | Receive | | 1-Month LIBOR GBP | | | 3/18/2026 | | | | Term | | | | 37,470 | | | | 64,224 | | | | 6,534 | |
| A | | Redde PLC | | Receive | | 1-Month LIBOR GBP | | | 6/28/2024 | | | | Term | | | | 4,759 | | | | 3,478 | | | | (2,050 | ) |
| B | | Redde PLC | | Receive | | 1-Month LIBOR GBP | | | 3/18/2026 | | | | Term | | | | 75,319 | | | | 83,224 | | | | (7,906 | ) |
| C | | Redde PLC | | Receive | | 1-Month LIBOR GBP | | | 9/20/2021 | | | | Term | | | | 113,351 | | | | 97,040 | | | | (45,214 | ) |
| B | | Redrow PLC | | Receive | | 1-Month LIBOR GBP | | | 3/18/2026 | | | | Term | | | | 232,004 | | | | 43,985 | | | | (51,204 | ) |
| C | | Redrow PLC | | Receive | | 1-Month LIBOR GBP | | | 9/20/2021 | | | | Term | | | | 543,848 | | | | 116,666 | | | | (13,282 | ) |
| C | | Renewi PLC | | Receive | | 1-Month LIBOR GBP | | | 9/20/2021 | | | | Term | | | | 82,908 | | | | 348,308 | | | | 16,063 | |
| B | | Renishaw PLC | | Receive | | 1-Month LIBOR GBP | | | 3/18/2026 | | | | Term | | | | 26,711 | | | | 814 | | | | (2,566 | ) |
| C | | RHI Magnesita N.V. | | Receive | | 1-Month LIBOR GBP | | | 9/20/2021 | | | | Term | | | | 109,959 | | | | 2,972 | | | | 3,829 | |
| C | | Rightmove PLC | | Receive | | 1-Month LIBOR GBP | | | 9/20/2021 | | | | Term | | | | 28,928 | | | | 8,414 | | | | 15,425 | |
| B | | Rotork PLC | | Receive | | 1-Month LIBOR GBP | | | 3/18/2026 | | | | Term | | | | 48,383 | | | | 20,753 | | | | (1,130 | ) |
| C | | Rotork PLC | | Receive | | 1-Month LIBOR GBP | | | 9/20/2021 | | | | Term | | | | 4,898 | | | | 2,084 | | | | (255 | ) |
| B | | RPS Group PLC | | Receive | | 1-Month LIBOR GBP | | | 3/18/2026 | | | | Term | | | | 15,928 | | | | 11,388 | | | | 1,065 | |
| C | | RPS Group PLC | | Receive | | 1-Month LIBOR GBP | | | 9/20/2021 | | | | Term | | | | 60,276 | | | | 45,734 | | | | 9,924 | |
| C | | Rubis SCA | | Receive | | 1-Month LIBOR EUR | | | 9/20/2021 | | | | Term | | | | 125,105 | | | | 3,049 | | | | (3,977 | ) |
| B | | Saga PLC | | Receive | | 1-Month LIBOR GBP | | | 3/18/2026 | | | | Term | | | | 9,544 | | | | 10,500 | | | | (9,512 | ) |
| C | | Saga PLC | | Receive | | 1-Month LIBOR GBP | | | 9/20/2021 | | | | Term | | | | 84,666 | | | | 139,531 | | | | (58,852 | ) |
| A | | Sandfire Resources Nl | | Receive | | 1-Month Bank Bill
Swap Rate | | | 6/28/2024 | | | | Term | | | | 238,949 | | | | 23,672 | | | | (13,739 | ) |
| A | | Saracen Mineral Holdings Ltd. | | Receive | | 1-Month Bank Bill
Swap Rate | | | 6/28/2024 | | | | Term | | | | 74,172 | | | | 25,032 | | | | 19,297 | |
| C | | Savills PLC | | Receive | | 1-Month LIBOR GBP | | | 9/20/2021 | | | | Term | | | | 118,966 | | | | 16,655 | | | | (8,846 | ) |
| C | | Senior PLC | | Receive | | 1-Month LIBOR GBP | | | 9/20/2021 | | | | Term | | | | 66,893 | | | | 42,394 | | | | 18,669 | |
| C | | Serco Group PLC | | Receive | | 1-Month LIBOR GBP | | | 9/20/2021 | | | | Term | | | | 38,749 | | | | 39,333 | | | | 3,971 | |
| A | | Service Stream Ltd. | | Receive | | 1-Month Bank Bill
Swap Rate | | | 6/28/2024 | | | | Term | | | | 51,896 | | | | 15,240 | | | | 1,239 | |
| A | | Seven West Media Ltd. | | Receive | | 1-Month Bank Bill
Swap Rate | | | 6/28/2024 | | | | Term | | | | 291,077 | | | | 372,837 | | | | (8,972 | ) |
| A | | SG Fleet Group Ltd. | | Receive | | 1-Month Bank Bill
Swap Rate | | | 6/28/2024 | | | | Term | | | | 240,923 | | | | 60,873 | | | | 21,590 | |
| B | | SIG PLC | | Receive | | 1-Month LIBOR GBP | | | 3/18/2026 | | | | Term | | | | 325,273 | | | | 274,478 | | | | (71,522 | ) |
| C | | SIG PLC | | Receive | | 1-Month LIBOR GBP | | | 9/20/2021 | | | | Term | | | | 231,063 | | | | 239,508 | | | | 21,922 | |
| A | | Sigma Healthcare Ltd. | | Receive | | 1-Month Bank Bill
Swap Rate | | | 6/28/2024 | | | | Term | | | | 378,543 | | | | 459,612 | | | | (9,182 | ) |
| C | | SMCP S.A. | | Receive | | 1-Month LIBOR EUR | | | 9/20/2021 | | | | Term | | | | 34,605 | | | | 2,770 | | | | (1,785 | ) |
| C | | Soco International PLC | | Receive | | 1-Month LIBOR GBP | | | 9/20/2021 | | | | Term | | | | 9,048 | | | | 17,092 | | | | 874 | |
| B | | Softcat PLC | | Receive | | 1-Month LIBOR GBP | | | 3/18/2026 | | | | Term | | | | 198,306 | | | | 29,949 | | | | 28,285 | |
| C | | Softcat PLC | | Receive | | 1-Month LIBOR GBP | | | 9/20/2021 | | | | Term | | | | 52,236 | | | | 10,081 | | | | 33,779 | |
| C | | Solocal Group | | Receive | | 1-Month LIBOR EUR | | | 9/20/2021 | | | | Term | | | | 121,692 | | | | 196,288 | | | | 13,568 | |
| B | | Solutions 30 SE | | Receive | | 1-Month LIBOR EUR | | | 3/18/2026 | | | | Term | | | | 11,230 | | | | 1,124 | | | | (2,845 | ) |
| B | | Sopra Steria Group | | Receive | | 1-Month LIBOR EUR | | | 3/18/2026 | | | | Term | | | | 121,526 | | | | 1,294 | | | | (4,418 | ) |
| | | | |
| | The accompanying Notes to the Financial Statements are an integral part of these Financial Statements. | | (Continued) |
| | | | | | | | | | | | | | | | |
| | Elements Portfolios | | | | | | Annual Report | | | | | | May 31, 2019 | | |
| | | | |
80
| | |
| Schedule of Investments | | as of May 31, 2019 |
| | | | |
| ELEMENTS INTERNATIONAL SMALL CAP PORTFOLIO | | | | |
| | | | | | | | | | | | | | | | | | | | | | | | | | |
| | | | | | | | |
| COUNTERPARTY (a) | | REFERENCE
ENTITY | | PAY/RECEIVE
TOTAL
RETURN ON
REFERENCE
ENTITY | | BASE FINANCING
RATE (b) | | TERMINATION
DATE | | | PAYMENT
FREQUENCY | | | NOTIONAL
VALUE | | | NUMBER OF
UNITS | | | UNREALIZED
APPRECIATION
(DEPRECIATION) | |
| | | | | | | | | | | | | | | | | | | | | | |
| C | | Sopra Steria Group | | Receive | | 1-Month LIBOR EUR | | | 9/20/2021 | | | | Term | | | $ | 248,450 | | | | 3,126 | | | $ | 45,743 | |
| A | | Southern Cross Media Group Ltd. | | Receive | | 1-Month Bank Bill
Swap Rate | | | 6/28/2024 | | | | Term | | | | 162,764 | | | | 98,411 | | | | 8,275 | |
| A | | Southwestern Energy Co. | | Pay | | 1-Month LIBOR USD | | | 4/2/2029 | | | | Term | | | | 1,409,360 | | | | 316,000 | | | | 279,200 | |
| A | | Spark Infrastructure Group | | Receive | | 1-Month Bank Bill
Swap Rate | | | 6/28/2024 | | | | Term | | | | 134,491 | | | | 41,240 | | | | 3,754 | |
| C | | Spie S.A. | | Receive | | 1-Month LIBOR EUR | | | 9/20/2021 | | | | Term | | | | 260,282 | | | | 18,503 | | | | 674 | |
| C | | Spire Healthcare Group PLC | | Receive | | 1-Month LIBOR GBP | | | 9/20/2021 | | | | Term | | | | 81,592 | | | | 78,694 | | | | (6,470 | ) |
| A | | Spirit AeroSystems Holdings, Inc. | | Pay | | 1-Month LIBOR USD | | | 4/2/2029 | | | | Term | | | | 428,529 | | | | 5,054 | | | | 20,543 | |
| B | | Sports Direct International PLC | | Receive | | 1-Month LIBOR GBP | | | 3/18/2026 | | | | Term | | | | 169,521 | | | | 74,302 | | | | (1,683 | ) |
| C | | Sports Direct International PLC | | Receive | | 1-Month LIBOR GBP | | | 9/20/2021 | | | | Term | | | | 295,051 | | | | 134,814 | | | | 16,025 | |
| C | | Ssp Group Plc | | Receive | | 1-Month LIBOR GBP | | | 9/20/2021 | | | | Term | | | | 1,211 | | | | 219 | | | | (82 | ) |
| A | | St. Barbara, Ltd. | | Receive | | 1-Month Bank Bill
Swap Rate | | | 6/28/2024 | | | | Term | | | | 207,578 | | | | 46,457 | | | | (17,564 | ) |
| A | | St. Barbara, Ltd. — Rights (c) | | Receive | | N/A | | | 6/4/2019 | | | | Term | | | | 6,771 | | | | 14,987 | | | | (3,272 | ) |
| B | | Staffline Group PLC | | Receive | | 1-Month LIBOR GBP | | | 3/18/2026 | | | | Term | | | | 12,239 | | | | 1,758 | | | | (13,722 | ) |
| C | | Staffline Group PLC | | Receive | | 1-Month LIBOR GBP | | | 9/20/2021 | | | | Term | | | | 13,876 | | | | 1,469 | | | | (17,326 | ) |
| C | | Stagecoach Group PLC | | Receive | | 1-Month LIBOR GBP | | | 9/20/2021 | | | | Term | | | | 41,320 | | | | 37,286 | | | | (7,083 | ) |
| C | | Stallergenes Greer PLC (c) | | Receive | | 1-Month LIBOR EUR | | | 9/20/2021 | | | | Term | | | | 7,442 | | | | 227 | | | | 94 | |
| A | | Stock Spirits Group PLC | | Receive | | 1-Month LIBOR GBP | | | 6/28/2024 | | | | Term | | | | 1,210 | | | | 950 | | | | 1,065 | |
| B | | Stock Spirits Group PLC | | Receive | | 1-Month LIBOR GBP | | | 3/18/2026 | | | | Term | | | | 63,239 | | | | 34,984 | | | | 3,847 | |
| C | | Stock Spirits Group PLC | | Receive | | 1-Month LIBOR GBP | | | 9/20/2021 | | | | Term | | | | 10,452 | | | | 6,350 | | | | 2,718 | |
| A | | SunTrust Banks, Inc. | | Pay | | 1-Month LIBOR USD | | | 4/2/2029 | | | | Term | | | | 6,181,030 | | | | 103,000 | | | | — | |
| A | | Super Retail Group Ltd. | | Receive | | 1-Month Bank Bill
Swap Rate | | | 6/28/2024 | | | | Term | | | | 692,197 | | | | 61,754 | | | | 72,327 | |
| B | | SuperDry PLC | | Receive | | 1-Month LIBOR GBP | | | 3/18/2026 | | | | Term | | | | 45,054 | | | | 10,402 | | | | (11,441 | ) |
| C | | SuperDry PLC | | Receive | | 1-Month LIBOR GBP | | | 9/20/2021 | | | | Term | | | | 436,243 | | | | 96,834 | | | | (127,971 | ) |
| B | | Synergie S.A. | | Receive | | 1-Month LIBOR EUR | | | 3/18/2026 | | | | Term | | | | 6,015 | | | | 237 | | | | 724 | |
| C | | Synergie S.A. | | Receive | | 1-Month LIBOR EUR | | | 9/20/2021 | | | | Term | | | | 16,517 | | | | 711 | | | | 4,087 | |
| C | | Synthomer PLC | | Receive | | 1-Month LIBOR GBP | | | 9/20/2021 | | | | Term | | | | 17,628 | | | | 5,899 | | | | (895 | ) |
| C | | Tarkett | | Receive | | 1-Month LIBOR EUR | | | 9/20/2021 | | | | Term | | | | 150,030 | | | | 8,487 | | | | (7,201 | ) |
| B | | Tate & Lyle PLC | | Receive | | 1-Month LIBOR GBP | | | 3/18/2026 | | | | Term | | | | 348,922 | | | | 63,371 | | | | 19,461 | |
| C | | Tate & Lyle PLC | | Receive | | 1-Month LIBOR GBP | | | 9/20/2021 | | | | Term | | | | 578,782 | | | | 107,674 | | | | 57,742 | |
| C | | Technicolor | | Receive | | 1-Month LIBOR EUR | | | 9/20/2021 | | | | Term | | | | 122,138 | | | | 127,367 | | | | (15,842 | ) |
| A | | Technology One Ltd. | | Receive | | 1-Month Bank Bill
Swap Rate | | | 6/28/2024 | | | | Term | | | | 71,356 | | | | 9,425 | | | | 12,734 | |
| C | | Ted Baker PLC | | Receive | | 1-Month LIBOR GBP | | | 9/20/2021 | | | | Term | | | | 38,902 | | | | 3,146 | | | | (6,415 | ) |
| B | | Telecom Plus PLC | | Receive | | 1-Month LIBOR GBP | | | 3/18/2026 | | | | Term | | | | 96,584 | | | | 8,161 | | | | (1,455 | ) |
| | | | |
| | The accompanying Notes to the Financial Statements are an integral part of these Financial Statements. | | (Continued) |
| | | | | | | | | | | | | | | | |
| | Elements Portfolios | | | | | | Annual Report | | | | | | May 31, 2019 | | |
| | | | |
81
| | |
| Schedule of Investments | | as of May 31, 2019 |
| | | | |
| ELEMENTS INTERNATIONAL SMALL CAP PORTFOLIO | | | | |
| | | | | | | | | | | | | | | | | | | | | | | | | | | | |
| | | | | | | | |
| COUNTERPARTY (a) | | REFERENCE
ENTITY | | PAY/RECEIVE
TOTAL
RETURN ON
REFERENCE
ENTITY | | BASE FINANCING
RATE (b) | | | TERMINATION
DATE | | | PAYMENT
FREQUENCY | | | NOTIONAL
VALUE | | | NUMBER OF
UNITS | | | UNREALIZED
APPRECIATION
(DEPRECIATION) | |
| | | | | | | | | | | | | | | | | | | | | | | |
| C | | Telecom Plus PLC | | Receive | | | 1-Month LIBOR GBP | | | | 9/20/2021 | | | | Term | | | $ | 208,767 | | | | 20,044 | | | $ | 43,302 | |
| C | | Television Francaise | | Receive | | | 1-Month LIBOR EUR | | | | 9/20/2021 | | | | Term | | | | 171,279 | | | | 22,360 | | | | 7,134 | |
| C | | Thomas Cook Group PLC | | Receive | | | 1-Month LIBOR GBP | | | | 9/20/2021 | | | | Term | | | | 344,108 | | | | 1,511,005 | | | | (221,369 | ) |
| A | | Total System Services, Inc. | | Pay | | | 1-Month LIBOR USD | | | | 4/2/2029 | | | | Term | | | | 3,035,997 | | | | 24,577 | | | | — | |
| C | | TP ICAP PLC | | Receive | | | 1-Month LIBOR GBP | | | | 9/20/2021 | | | | Term | | | | 281,506 | | | | 123,354 | | | | (15,628 | ) |
| C | | Travis Perkins PLC | | Receive | | | 1-Month LIBOR GBP | | | | 9/20/2021 | | | | Term | | | | 95,372 | | | | 9,759 | | | | 2,879 | |
| B | | Trigano S.A. | | Receive | | | 1-Month LIBOR EUR | | | | 3/18/2026 | | | | Term | | | | 38,294 | | | | 508 | | | | (9,418 | ) |
| C | | Trigano S.A. | | Receive | | | 1-Month LIBOR EUR | | | | 9/20/2021 | | | | Term | | | | 193,692 | | | | 2,601 | | | | (43,705 | ) |
| C | | Tullow Oil PLC | | Receive | | | 1-Month LIBOR GBP | | | | 9/20/2021 | | | | Term | | | | 102,585 | | | | 57,537 | | | | (16,934 | ) |
| C | | Ultra Electronics Holdings PLC | | Receive | | | 1-Month LIBOR GBP | | | | 9/20/2021 | | | | Term | | | | 64,320 | | | | 5,890 | | | | 14,178 | |
| C | | Vesuvius PLC | | Receive | | | 1-Month LIBOR GBP | | | | 9/20/2021 | | | | Term | | | | 60,689 | | | | 12,676 | | | | (15,751 | ) |
| B | | Vicat S.A. | | Receive | | | 1-Month LIBOR EUR | | | | 3/18/2026 | | | | Term | | | | 196,829 | | | | 5,173 | | | | 19,951 | |
| C | | Vicat S.A. | | Receive | | | 1-Month LIBOR EUR | | | | 9/20/2021 | | | | Term | | | | 162,055 | | | | 4,161 | | | | 11,438 | |
| A | | Victrex PLC | | Receive | | | 1-Month LIBOR GBP | | | | 6/28/2024 | | | | Term | | | | 16 | | | | 1 | | | | 3 | |
| B | | Victrex PLC | | Receive | | | 1-Month LIBOR GBP | | | | 3/18/2026 | | | | Term | | | | 93,862 | | | | 5,213 | | | | (19,458 | ) |
| C | | Victrex PLC | | Receive | | | 1-Month LIBOR GBP | | | | 9/20/2021 | | | | Term | | | | 22,465 | | | | 1,229 | | | | (5,117 | ) |
| A | | Village Roadshow Ltd. | | Receive | |
| 1-Month Bank Bill
Swap Rate |
| | | 6/28/2024 | | | | Term | | | | 182,703 | | | | 47,282 | | | | 22,854 | |
| C | | Vilmorin & Cie | | Receive | | | 1-Month LIBOR EUR | | | | 9/20/2021 | | | | Term | | | | 36,092 | | | | 750 | | | | (3,155 | ) |
| B | | Virbac S.A. | | Receive | | | 1-Month LIBOR EUR | | | | 3/18/2026 | | | | Term | | | | 55,494 | | | | 539 | | | | 32,238 | |
| C | | Virbac S.A. | | Receive | | | 1-Month LIBOR EUR | | | | 9/20/2021 | | | | Term | | | | 53,767 | | | | 436 | | | | 15,014 | |
| A | | Virtus Health Ltd. | | Receive | |
| 1-Month Bank Bill
Swap Rate |
| | | 6/28/2024 | | | | Term | | | | 52,591 | | | | 8,873 | | | | (247 | ) |
| A | | Viva Energy Group Ltd. | | Receive | |
| 1-Month Bank Bill
Swap Rate |
| | | 6/28/2024 | | | | Term | | | | 343,378 | | | | 102,844 | | | | (12,839 | ) |
| A | | WABCO Holdings, Inc. | | Pay | | | 1-Month LIBOR USD | | | | 4/2/2029 | | | | Term | | | | 325,821 | | | | 2,445 | | | | 6,955 | |
| B | | Watkins Jones PLC | | Receive | | | 1-Month LIBOR GBP | | | | 3/18/2026 | | | | Term | | | | 12,571 | | | | 6,939 | | | | (1,239 | ) |
| C | | Watkins Jones PLC | | Receive | | | 1-Month LIBOR GBP | | | | 9/20/2021 | | | | Term | | | | 64,412 | | | | 36,998 | | | | (2,266 | ) |
| A | | Wells Fargo & Co. | | Pay | | | 1-Month LIBOR USD | | | | 4/2/2029 | | | | Term | | | | 1,164,690 | | | | 24,371 | | | | 76,704 | |
| B | | WH Smith PLC | | Receive | | | 1-Month LIBOR GBP | | | | 3/18/2026 | | | | Term | | | | 74,428 | | | | 4,380 | | | | (10,626 | ) |
| C | | WH Smith PLC | | Receive | | | 1-Month LIBOR GBP | | | | 9/20/2021 | | | | Term | | | | 61,259 | | | | 4,347 | | | | 11,046 | |
| B | | William Hill PLC | | Receive | | | 1-Month LIBOR GBP | | | | 3/18/2026 | | | | Term | | | | 270,682 | | | | 215,331 | | | | (47,766 | ) |
| C | | William Hill PLC | | Receive | | | 1-Month LIBOR GBP | | | | 9/20/2021 | | | | Term | | | | 246,949 | | | | 185,341 | | | | (65,312 | ) |
| B | | Worldline S.A. | | Receive | | | 1-Month LIBOR EUR | | | | 3/18/2026 | | | | Term | | | | 160,790 | | | | 3,567 | | | | 14,039 | |
| C | | Worldline S.A. | | Receive | | | 1-Month LIBOR EUR | | | | 9/20/2021 | | | | Term | | | | 219,166 | | | | 5,327 | | | | 47,182 | |
| A | | WPP Aunz Ltd. | | Receive | |
| 1-Month Bank Bill
Swap Rate |
| | | 6/28/2024 | | | | Term | | | | 25,289 | | | | 21,610 | | | | (3,966 | ) |
| A | | Yum China Holdings, Inc. | | Pay | | | 1-Month LIBOR USD | | | | 4/2/2029 | | | | Term | | | | 437,134 | | | | 10,026 | | | | 36,412 | |
| | | | | | | | | | | | | | | | | | | | | | | | | | | | |
| | | | | | | | | | | | | | | | | | $ | 121,986,262 | | | | | | | $ | 5,112,433 | |
| | | | | | | | | | | | | | | | | | | | | | | | | | | | |
| (b) | The swaps accrue financing fees according to the relevant base financing rate which resets periodically, plus a fixed spread. |
| (c) | Value determined using significant unobservable inputs. |
| | | | |
| | The accompanying Notes to the Financial Statements are an integral part of these Financial Statements. | | |
| | | | | | | | | | | | | | | | |
| | Elements Portfolios | | | | | | Annual Report | | | | | | May 31, 2019 | | |
| | | | |
82
| | |
| Schedule of Investments | | as of May 31, 2019 |
| | | | |
| ELEMENTS EMERGING MARKETS PORTFOLIO | | | | |
| | | | | | | | |
| | | SHARES | | | FAIR
VALUE | |
COMMON STOCKS - 82.9% | | | | | | | | |
| Argentina - 0.1% | | | | | | |
BBVA Banco Frances S.A. - ADR | | | 9,600 | | | $ | 86,016 | |
Grupo Financiero Galicia S.A. - ADR | | | 3,100 | | | | 79,391 | |
Telecom Argentina S.A. - ADR | | | 2,500 | | | | 37,075 | |
YPF S.A. - ADR | | | 1,800 | | | | 26,694 | |
| | | | | | | | |
| | | | | | | 229,176 | |
| | | | | | | | |
| Bermuda - 0.3% | | | | | | |
Haier Electronics Group Co., Ltd. | | | 387,000 | | | | 986,314 | |
Sihuan Pharmaceutical Holdings Group Ltd. | | | 199,000 | | | | 44,676 | |
| | | | | | | | |
| | | | | | | 1,030,990 | |
| | | | | | | | |
| Brazil - 1.9% | | | | | | |
Ambev S.A. | | | 189,400 | | | | 848,063 | |
Atacadao S.A. | | | 51,700 | | | | 303,959 | |
Banco BTG Pactual S.A. | | | 26,188 | | | | 312,405 | |
CCR S.A. | | | 8,500 | | | | 28,984 | |
Cia de Saneamento Basico do Estado de Sao Paulo | | | 23,000 | | | | 260,072 | |
Embraer S.A. | | | 52,000 | | | | 250,594 | |
Equatorial Energia S.A. | | | 1,600 | | | | 35,189 | |
Hypera S.A. | | | 7,600 | | | | 58,299 | |
JBS SS.A.A | | | 73,900 | | | | 409,619 | |
Lojas Renner S.A. | | | 5,830 | | | | 65,373 | |
M Dias Branco S.A. | | | 10,600 | | | | 104,543 | |
Magazine Luiza S.A. | | | 7,200 | | | | 358,188 | |
Natura Cosmeticos S.A. | | | 5,900 | | | | 89,689 | |
Notre Dame Intermedica Participacoes S.A. | | | 33,562 | | | | 350,678 | |
Petrobras Distribuidora S.A. | | | 82,800 | | | | 537,869 | |
Petroleo Brasileiro S.A. | | | 5,500 | | | | 39,709 | |
Porto Seguro S.A. | | | 43,600 | | | | 583,896 | |
Raia Drogasil S.A. | | | 7,900 | | | | 139,299 | |
TIM Participacoes S.A. | | | 74,100 | | | | 206,214 | |
Ultrapar Participacoes S.A. | | | 139,300 | | | | 730,234 | |
Vale S.A. | | | 95,600 | | | | 1,193,797 | |
| | | | | | | | |
| | | | | | | 6,906,673 | |
| | | | | | | | |
| Cayman Islands - 3.7% | | | | | | |
3SBio, Inc. (a) (Cost: $16,147; Original Acquisition Date: 10/31/2017) | | | 9,000 | | | | 14,672 | |
51job, Inc. - ADR (b) | | | 400 | | | | 28,140 | |
58.com, Inc. - ADR (b)(c) | | | 9,675 | | | | 551,765 | |
Autohome, Inc. - ADR (b) | | | 3,300 | | | | 283,470 | |
Baidu, Inc. - ADR (b) | | | 1,200 | | | | 132,000 | |
China Hongqiao Group Ltd. | | | 515,500 | | | | 372,838 | |
China Medical System Holdings Ltd. | | | 624,000 | | | | 549,215 | |
China Mengniu Dairy Co., Ltd. | | | 226,000 | | | | 825,928 | |
China Resources Cement Holdings Ltd. | | | 892,000 | | | | 773,718 | |
ENN Energy Holdings Ltd. | | | 23,100 | | | | 207,735 | |
iQIYI, Inc. - ADR (b) | | | 200 | | | | 3,646 | |
JD.com, Inc. - ADR (b)(c) | | | 15,808 | | | | 407,214 | |
Kingboard Laminates Holdings Ltd. | | | 194,000 | | | | 165,553 | |
Li Ning Co., Ltd. | | | 255,500 | | | | 423,033 | |
Logan Property Holdings Co., Ltd. | | | 42,000 | | | | 62,039 | |
Momo, Inc. - ADR | | | 3,367 | | | | 92,828 | |
NetEase, Inc. - ADR (c) | | | 3,100 | | | | 770,691 | |
| | | | | | | | |
| | | SHARES | | | FAIR
VALUE | |
| Cayman Islands - 3.7% (continued) | | | | | | |
New Oriental Education & Technology Group, Inc. - ADR (b) | | | 6,798 | | | $ | 582,249 | |
Noah Holdings Ltd. - ADR (b)(c) | | | 5,500 | | | | 210,375 | |
SINA Corp. (b) | | | 21,256 | | | | 855,767 | |
Sino Biopharmaceutical Ltd. | | | 856,500 | | | | 864,197 | |
TAL Education Group - ADR (b)(c) | | | 8,177 | | | | 281,371 | |
Tencent Music Entertainment Group - ADR (b)(c) | | | 41,000 | | | | 542,840 | |
Uni-President China Holdings Ltd. | | | 550,000 | | | | 584,409 | |
Vipshop Holdings Ltd. - ADR (b) | | | 182,700 | | | | 1,377,558 | |
Want Want China Holdings Ltd. | | | 772,000 | | | | 550,475 | |
YY, Inc. - ADR (b) | | | 23,247 | | | | 1,591,257 | |
Zhongsheng Group Holdings Ltd. | | | 68,500 | | | | 172,483 | |
| | | | | | | | |
| | | | | | | 13,277,466 | |
| | | | | | | | |
| Chile - 0.2% | | | | | | |
Cia Cervecerias Unidas S.A. - ADR (c) | | | 13,179 | | | | 353,329 | |
Enel Americas S.A. - ADR (c) | | | 19,523 | | | | 155,989 | |
Latam Airlines Group S.A. - ADR (c) | | | 22,439 | | | | 197,912 | |
| | | | | | | | |
| | | | | | | 707,230 | |
| | | | | | | | |
| China - 7.9% | | | | | | |
Agricultural Bank of China Ltd. | | | 1,580,000 | | | | 677,182 | |
Anhui Conch Cement Co., Ltd. | | | 291,000 | | | | 1,700,072 | |
BAIC Motor Corp Ltd. (a) (Cost: $94,528; Original Acquisition Date: 12/18/2018) | | | 181,000 | | | | 111,977 | |
Bank of China Ltd. | | | 2,779,000 | | | | 1,152,075 | |
Bank of Communications Co., Ltd. | | | 759,000 | | | | 594,455 | |
Beijing Capital International Airport Co., Ltd. | | | 922,000 | | | | 779,746 | |
CGN Power Co., Ltd. (a) (Cost: $210,258; Original Acquisition Date: 10/31/2017) | | | 816,000 | | | | 224,829 | |
China Coal Energy Co., Ltd. | | | 2,111,000 | | | | 861,682 | |
China Eastern Airlines Corp Ltd. | | | 278,000 | | | | 152,838 | |
China Merchants Bank Co., Ltd. | | | 71,500 | | | | 344,296 | |
China Molybdenum Co., Ltd. | | | 2,139,000 | | | | 671,204 | |
China National Building Material Co., Ltd. | | | 730,000 | | | | 561,499 | |
China Petroleum & Chemical Corp. | | | 642,000 | | | | 427,479 | |
China Railway Construction Corp. Ltd. | | | 16,500 | | | | 19,300 | |
China Railway Group Ltd. | | | 273,000 | | | | 204,065 | |
China Railway Signal & Communication Corp Ltd. (a) (Cost: $290,536; Original Acquisition Date: 12/18/2018) | | | 407,000 | | | | 267,888 | |
China Shenhua Energy Co., Ltd. | | | 157,000 | | | | 322,429 | |
China Southern Airlines Co., Ltd. | | | 140,000 | | | | 90,005 | |
China Tower Corp Ltd. (a) (Cost: $590,666; Original Acquisition Date: 10/25/2018) | | | 2,900,000 | | | | 651,058 | |
China Vanke Co., Ltd. | | | 177,100 | | | | 626,889 | |
CNOOC Ltd. | | | 1,577,000 | | | | 2,570,818 | |
Datang International Power Generation Co., Ltd. | | | 10,000 | | | | 2,500 | |
Fuyao Glass Industry Group Co., Ltd. (a) (Cost: $560,232; Original Acquisition Date: 07/26/2017) | | | 168,400 | | | | 502,651 | |
GF Securities Co., Ltd. | | | 301,000 | | | | 343,252 | |
Guangzhou Automobile Group Co., Ltd. | | | 1,600 | | | | 1,543 | |
Haitong Securities Co Ltd. | | | 378,400 | | | | 388,075 | |
Huadian Power International Corp Ltd. | | | 952,000 | | | | 394,666 | |
| | | | |
| | The accompanying Notes to the Financial Statements are an integral part of these Financial Statements. | | (Continued) |
| | | | | | | | | | | | | | | | |
| | Elements Portfolios | | | | | | Annual Report | | | | | | May 31, 2019 | | |
| | | | |
83
| | |
| Schedule of Investments | | as of May 31, 2019 |
| | | | |
| ELEMENTS EMERGING MARKETS PORTFOLIO | | | | |
| | | | | | | | |
| | | SHARES | | | FAIR
VALUE | |
| China - 7.9% (continued) | | | | | | |
Huaneng Power International, Inc. | | | 130,000 | | | $ | 81,918 | |
Huatai Securities Co., Ltd. (a) (Cost: $732,316; Original Acquisition Date: 10/18/2018) | | | 439,600 | | | | 696,447 | |
Industrial & Commercial Bank of China Ltd. | | | 3,509,000 | | | | 2,506,572 | |
Jiangsu Expressway Co., Ltd. | | | 16,000 | | | | 22,287 | |
Metallurgical Corp of China Ltd. | | | 213,000 | | | | 56,785 | |
PetroChina Co., Ltd. | | | 394,000 | | | | 220,130 | |
PICC Property & Casualty Co., Ltd. | | | 953,000 | | | | 1,029,640 | |
Ping An Insurance Group Company of China Ltd. | | | 245,000 | | | | 2,706,405 | |
Postal Savings Bank of China Co., Ltd. (a) (Cost: $871,855; Original Acquisition Date: 10/25/2018) | | | 1,532,000 | | | | 916,517 | |
Sinopharm Group Co., Ltd. | | | 17,600 | | | | 66,116 | |
Tong Ren Tang Technologies Co., Ltd. | | | 550,000 | | | | 704,377 | |
Tsingtao Brewery Co., Ltd. | | | 220,000 | | | | 1,337,194 | |
Weichai Power Co., Ltd. | | | 153,000 | | | | 232,636 | |
WuXi AppTec Co., Ltd. (a) (Cost: $136,793; Original Acquisition Date: 05/06/2019) | | | 12,500 | | | | 136,886 | |
Yanzhou Coal Mining Co., Ltd. | | | 332,000 | | | | 312,115 | |
Yuzhou Properties Co., Ltd. | | | 718,000 | | | | 326,965 | |
Zhaojin Mining Industry Co., Ltd. | | | 37,000 | | | | 33,982 | |
Zhejiang Expressway Co., Ltd. | | | 346,000 | | | | 361,467 | |
Zhuzhou CRRC Times Electric Co., Ltd. | | | 169,200 | | | | 910,797 | |
Zijin Mining Group Co., Ltd. | | | 1,876,000 | | | | 662,860 | |
ZTE Corp. (b) | | | 182,000 | | | | 437,847 | |
| | | | | | | | |
| | | | | | | 28,404,416 | |
| | | | | | | | |
| Colombia - 0.2% | | | | | | |
Ecopetrol S.A. - ADR (c) | | | 33,171 | | | | 543,673 | |
Grupo Aval Acciones y Valores S.A. - ADR | | | 25,966 | | | | 179,944 | |
| | | | | | | | |
| | | | | | | 723,617 | |
| | | | | | | | |
| Greece - 0.0% (d) | | | | | | |
Motor Oil Hellas Corinth Refineries S.A. | | | 2,543 | | | | 64,773 | |
| | | | | | | | |
| | | | | | | | |
| Hong Kong - 8.6% | | | | | | |
Air China Ltd. | | | 232,000 | | | | 215,145 | |
Aluminum Corp of China Ltd. (b) | | | 1,162,000 | | | | 417,988 | |
ANTA Sports Products Ltd. | | | 101,000 | | | | 618,403 | |
BYD Electronic International Co., Ltd. | | | 391,500 | | | | 515,371 | |
China Agri-Industries Holdings Ltd. | | | 35,000 | | | | 10,581 | |
China Aoyuan Group Ltd. | | | 36,000 | | | | 38,895 | |
China CITIC Bank Corp Ltd | | | 451,000 | | | | 256,003 | |
China Communications Services Corp Ltd. | | | 132,000 | | | | 98,837 | |
China Everbright Bank Co., Ltd. | | | 612,000 | | | | 276,353 | |
China Evergrande Group | | | 75,000 | | | | 199,469 | |
China Longyuan Power Group Corp Ltd. | | | 1,200,000 | | | | 757,697 | |
China Mobile Ltd. | | | 622,500 | | | | 5,435,277 | |
China Oriental Group Co., Ltd. | | | 2,056,000 | | | | 1,193,283 | |
China Overseas Land & Investment Ltd. | | | 2,000 | | | | 6,939 | |
China Reinsurance Group Corp. | | | 882,000 | | | | 160,884 | |
China Resources Beer Holdings Co., Ltd. | | | 220,000 | | | | 962,555 | |
China Resources Gas Group Ltd. | | | 136,000 | | | | 651,415 | |
China Resources Land Ltd. | | | 34,000 | | | | 138,350 | |
| | | | | | | | |
| | | SHARES | | | FAIR
VALUE | |
| Hong Kong - 8.6% (continued) | | | | | | |
China Resources Pharmaceutical Group Ltd. (a) (Cost: $1,057,702; Original Acquisition Date: 10/18/2018) | | | 762,000 | | | $ | 995,323 | |
China Resources Power Holdings Co., Ltd. | | | 76,000 | | | | 110,710 | |
China Taiping Insurance Holdings Co., Ltd. | | | 309,000 | | | | 794,223 | |
China Telecom Corp. Ltd. | | | 1,540,000 | | | | 773,973 | |
China Traditional Chinese Medicine Holdings Co., Ltd. | | | 260,000 | | | | 137,304 | |
China Unicom Hong Kong Ltd. | | | 2,374,000 | | | | 2,504,350 | |
CITIC Securities Co., Ltd. | | | 350,500 | | | | 638,447 | |
Country Garden Holdings Co., Ltd. | | | 34,000 | | | | 45,972 | |
Country Garden Services Holdings Co., Ltd. | | | 60,586 | | | | 124,270 | |
CRRC Corp., Ltd. | | | 83,000 | | | | 71,147 | |
CSPC Pharmaceutical Group Ltd. | | | 226,000 | | | | 364,388 | |
Dali Foods Group Co., Ltd. (a) (Cost: $392,575; Original Acquisition Date: 10/18/2018) | | | 559,500 | | | | 400,380 | |
Fosun International Ltd. | | | 38,000 | | | | 49,054 | |
Geely Automobile Holdings Ltd. | | | 500,000 | | | | 820,200 | |
Greentown Service Group Co., Ltd. | | | 68,000 | | | | 53,519 | |
Guangdong Investment Ltd. | | | 132,000 | | | | 259,637 | |
Guotai Junan Securities Co., Ltd. (a) (Cost: $971,097; Original Acquisition Date: 10/18/2018) | | | 468,000 | | | | 798,750 | |
Haitian International Holdings Ltd. | | | 57,000 | | | | 112,698 | |
Hengan International Group Co., Ltd. | | | 32,000 | | | | 234,707 | |
Hua Hong Semiconductor Ltd. (a) (Cost: $181,654; Original Acquisition Date: 10/18/2018) | | | 103,000 | | | | 216,523 | |
Kingdee International Software Group Co., Ltd. | | | 94,000 | | | | 104,677 | |
Kunlun Energy Co., Ltd. | | | 1,092,000 | | | | 1,005,701 | |
Lee & Man Paper Manufacturing Ltd. | | | 666,000 | | | | 433,265 | |
Lenovo Group Ltd. | | | 1,200,000 | | | | 834,232 | |
Longfor Group Holdings Ltd. | | | 139,500 | | | | 511,589 | |
Nine Dragons Paper Holdings Ltd. | | | 6,000 | | | | 4,783 | |
Shandong Weigao Group Medical Polymer Co., Ltd. | | | 100,000 | | | | 86,995 | |
Shanghai Pharmaceuticals Holding Co., Ltd. | | | 597,200 | | | | 1,179,233 | |
Shenzhou International Group Holdings Ltd. | | | 50,700 | | | | 597,893 | |
Shui On Land Ltd. | | | 2,316,000 | | | | 525,857 | |
Sinotrans Ltd. | | | 280,000 | | | | 102,863 | |
Sinotruk Hong Kong Ltd. | | | 566,000 | | | | 1,072,863 | |
Sun Art Retail Group Ltd. | | | 1,264,500 | | | | 1,103,275 | |
Sunac China Holdings Ltd. | | | 28,000 | | | | 120,721 | |
Tingyi Cayman Islands Holding Corp. | | | 706,000 | | | | 1,147,316 | |
TravelSky Technology Ltd. | | | 239,000 | | | | 495,100 | |
Yuexiu Property Co., Ltd. | | | 912,000 | | | | 207,073 | |
| | | | | | | | |
| | | | | | | 30,992,456 | |
| | | | | | | | |
| Hungary - 0.0% (d) | | | | | | |
MOL Hungarian Oil & Gas Plc | | | 9,946 | | | | 112,001 | |
| | | | | | | | |
| | | | | | | | |
| India - 1.3% | | | | | | |
Dr Reddy’s Laboratories Ltd. - ADR | | | 5,313 | | | | 202,478 | |
ICICI Bank Ltd. - ADR (c) | | | 4,800 | | | | 57,600 | |
| | | | |
| | The accompanying Notes to the Financial Statements are an integral part of these Financial Statements. | | (Continued) |
| | | | | | | | | | | | | | | | |
| | Elements Portfolios | | | | | | Annual Report | | | | | | May 31, 2019 | | |
| | | | |
84
| | |
| Schedule of Investments | | as of May 31, 2019 |
| | | | |
| ELEMENTS EMERGING MARKETS PORTFOLIO | | | | |
| | | | | | | | |
| | | SHARES | | | FAIR
VALUE | |
| India - 1.3% (continued) | | | | | | |
Infosys Ltd. - ADR | | | 172,100 | | | $ | 1,801,887 | |
Tata Motors Ltd. - ADR (b) | | | 110,770 | | | | 1,385,733 | |
Tata Steel Ltd. | | | 648 | | | | 4,471 | |
Vedanta Ltd. - ADR | | | 24,400 | | | | 225,456 | |
Wipro Ltd. - ADR (c) | | | 218,976 | | | | 967,874 | |
| | | | | | | | |
| | | | | | | 4,645,499 | |
| | | | | | | | |
| Indonesia - 0.0% (d) | | | | | | |
Telekomunikasi Indonesia Persero Tbk PT - ADR (b)(c) | | | 4,900 | | | | 132,153 | |
| | | | | | | | |
| | | | | | | | |
| Luxembourg - 0.1% | | | | | | |
Globant S.A. (b)(c) | | | 1,700 | | | | 157,828 | |
Reinet Investments SCA | | | 4,440 | | | | 70,412 | |
| | | | | | | | |
| | | | | | | 228,240 | |
| | | | | | | | |
| Mexico - 0.4% | | | | | | |
Alsea SAB de CV (b) | | | 20,700 | | | | 40,515 | |
Cemex SAB de CV (b) | | | 3,900 | | | | 1,600 | |
Coca-Cola Femsa SAB de CV | | | 145,658 | | | | 905,738 | |
Fomento Economico Mexicano SAB de CV | | | 8,900 | | | | 82,875 | |
Grupo Aeroportuario del Sureste SAB de CV | | | 545 | | | | 8,623 | |
Grupo Carso SAB de CV | | | 17,600 | | | | 64,971 | |
Grupo Financiero Banorte SAB de CV | | | 1,100 | | | | 5,994 | |
Grupo Televisa SAB | | | 22,900 | | | | 42,695 | |
Mexichem SAB de CV | | | 2,800 | | | | 5,839 | |
Wal-Mart de Mexico SAB de CV | | | 38,400 | | | | 108,056 | |
| | | | | | | | |
| | | | | | | 1,266,906 | |
| | | | | | | | |
| Netherlands - 0.8% | | | | | | |
LyondellBasell Industries N.V. | | | 40,716 | | | | 3,023,163 | |
| | | | | | | | |
| | | | | | | | |
| Peru - 0.1% | | | | | | |
Cia de Minas Buenaventura SAA - ADR | | | 22,800 | | | | 345,876 | |
| | | | | | | | |
| | | | | | | | |
| Poland - 0.9% | | | | | | |
Bank Millennium S.A. (b) | | | 8,200 | | | | 20,475 | |
Cyfrowy Polsat S.A. | | | 31,577 | | | | 215,034 | |
Dino Polska S.A. (a)(b) (Cost: $285,634; Original Acquisition Date: 07/27/2018) | | | 10,953 | | | | 355,507 | |
Grupa Lotos S.A. | | | 28,716 | | | | 657,980 | |
Jastrzebska Spolka Weglowa S.A. | | | 30,596 | | | | 400,741 | |
KGHM Polska Miedz S.A. (b) | | | 2,225 | | | | 55,150 | |
LPP S.A. | | | 89 | | | | 170,328 | |
mBank S.A. (b) | | | 817 | | | | 85,821 | |
Orange Polska S.A. (b) | | | 35,529 | | | | 47,740 | |
Polski Koncern Naftowy ORLEN S.A. | | | 16,727 | | | | 422,376 | |
Polskie Gornictwo Naftowe i Gazownictwo S.A. | | | 345,464 | | | | 504,761 | |
Powszechna Kasa Oszczednosci Bank Polski S.A. | | | 12,587 | | | | 129,065 | |
Powszechny Zaklad Ubezpieczen S.A. | | | 23,596 | | | | 255,064 | |
| | | | | | | | |
| | | | | | | 3,320,042 | |
| | | | | | | | |
| Republic of Korea - 10.1% | | | | | | |
Amorepacific Corp. | | | 3,527 | | | | 530,131 | |
AMOREPACIFIC Group | | | 11,730 | | | | 638,260 | |
BGF retail Co., Ltd. | | | 1,737 | | | | 272,022 | |
Cheil Worldwide, Inc. | | | 21,794 | | | | 483,132 | |
| | | | | | | | |
| | | SHARES | | | FAIR
VALUE | |
| Republic of Korea - 10.1% (continued) | | | | | | |
CJ ENM Co., Ltd. | | | 268 | | | $ | 43,118 | |
Daelim Industrial Co Ltd. | | | 8,530 | | | | 741,334 | |
Daewoo Engineering & Construction Co., Ltd. (b) | | | 89,791 | | | | 362,285 | |
Daewoo Shipbuilding & Marine Engineering Co., Ltd. (b) | | | 10,612 | | | | 265,545 | |
DB Insurance Co., Ltd. | | | 9,704 | | | | 501,130 | |
Doosan Bobcat, Inc. | | | 9,525 | | | | 269,538 | |
E-MART, Inc. | | | 2,523 | | | | 305,073 | |
Fila Korea Ltd. | | | 6,413 | | | | 420,030 | |
GS Engineering & Construction Corp. | | | 23,771 | | | | 801,415 | |
GS Holdings Corp. | | | 4,411 | | | | 185,566 | |
GS Retail Co., Ltd. | | | 15,027 | | | | 429,018 | |
Hana Financial Group, Inc. | | | 300 | | | | 9,144 | |
Hankook Tire & Technology Co., Ltd. | | | 9,935 | | | | 291,985 | |
Hanon Systems | | | 16,422 | | | | 159,959 | |
Hanwha Chemical Corp. | | | 7,135 | | | | 123,720 | |
Hanwha Corp. | | | 18,447 | | | | 395,769 | |
Hotel Shilla Co., Ltd. | | | 10,533 | | | | 836,696 | |
Hyundai Department Store Co., Ltd. | | | 3,156 | | | | 224,198 | |
Hyundai Development Co., Ltd. | | | 7,566 | | | | 272,234 | |
Hyundai Engineering & Construction Co., Ltd. | | | 8,055 | | | | 347,659 | |
Hyundai Glovis Co., Ltd. | | | 2,205 | | | | 300,876 | |
Hyundai Heavy Industries Co., Ltd. (b) | | | 315 | | | | 31,079 | |
Hyundai Marine & Fire Insurance Co., Ltd. | | | 25,713 | | | | 663,930 | |
Hyundai Mobis Co., Ltd. | | | 5,702 | | | | 1,038,991 | |
Hyundai Motor Co. | | | 666 | | | | 75,218 | |
Hyundai Steel Co. | | | 4,166 | | | | 142,726 | |
Kakao Corp. | | | 1,827 | | | | 191,000 | |
Kangwon Land, Inc. | | | 13,021 | | | | 339,493 | |
KCC Corp. | | | 1,396 | | | | 302,433 | |
Kia Motors Corp. | | | 41,172 | | | | 1,360,415 | |
Korea Aerospace Industries Ltd. | | | 645 | | | | 17,954 | |
Korea Zinc Co., Ltd. | | | 1,991 | | | | 730,596 | |
Korean Air Lines Co., Ltd. | | | 4,249 | | | | 112,567 | |
KT&G Corp. | | | 2,565 | | | | 217,537 | |
Kumho Petrochemical Co., Ltd. | | | 5,313 | | | | 427,396 | |
LG Electronics, Inc. | | | 14,369 | | | | 948,361 | |
LG Household & Health Care Ltd. | | | 575 | | | | 617,054 | |
LG Uplus Corp. | | | 73,946 | | | | 866,191 | |
Lotte Corp. (b) | | | 152 | | | | 5,386 | |
Lotte Shopping Co Ltd. | | | 1,043 | | | | 140,129 | |
NCSoft Corp. | | | 166 | | | | 66,489 | |
Netmarble Corp. (a)(b) (Cost: $179,247; Original Acquisition Date: 01/03/2019) | | | 1,807 | | | | 173,735 | |
OCI Co., Ltd. | | | 4,570 | | | | 346,520 | |
Orion Corp/Republic of Korea | | | 735 | | | | 53,078 | |
Ottogi Corp. | | | 1 | | | | 597 | |
Pan Ocean Co., Ltd. (b) | | | 2,056 | | | | 7,484 | |
Pearl Abyss Corp. (b) | | | 858 | | | | 142,436 | |
POSCO | | | 5,360 | | | | 1,068,940 | |
POSCO Chemical Co., Ltd. (c) | | | 3,387 | | | | 154,717 | |
Posco International Corp. | | | 3,436 | | | | 49,626 | |
S-1 Corp. | | | 2,806 | | | | 226,195 | |
Samsung C&T Corp. | | | 10,974 | | | | 850,533 | |
Samsung Electro-Mechanics Co., Ltd. | | | 2,423 | | | | 193,693 | |
| | | | |
| | The accompanying Notes to the Financial Statements are an integral part of these Financial Statements. | | (Continued) |
| | | | | | | | | | | | | | | | |
| | Elements Portfolios | | | | | | Annual Report | | | | | | May 31, 2019 | | |
| | | | |
85
| | |
| Schedule of Investments | | as of May 31, 2019 |
| | | | |
| ELEMENTS EMERGING MARKETS PORTFOLIO | | | | |
| | | | | | | | |
| | | SHARES | | | FAIR
VALUE | |
| Republic of Korea - 10.1% (continued) | | | | | | |
Samsung Electronics Co., Ltd. | | | 281,346 | | | $ | 10,040,478 | |
Samsung Engineering Co., Ltd. (b) | | | 36,150 | | | | 506,932 | |
Samsung Fire & Marine Insurance Co., Ltd. | | | 3,606 | | | | 820,578 | |
Samsung Heavy Industries Co., Ltd. (b) | | | 9,385 | | | | 61,863 | |
Samsung Life Insurance Co., Ltd. | | | 1,906 | | | | 129,318 | |
Samsung SDS Co., Ltd. | | | 3,211 | | | | 558,130 | |
SK Holdings Co., Ltd. | | | 2,215 | | | | 430,576 | |
SK Hynix, Inc. | | | 23,831 | | | | 1,306,713 | |
SK Innovation Co., Ltd. | | | 3,434 | | | | 475,783 | |
SK Telecom Co., Ltd. | | | 4,355 | | | | 916,053 | |
Woongjin Coway Co., Ltd. | | | 3,817 | | | | 256,732 | |
Yuhan Corp. | | | 1,356 | | | | 281,812 | |
| | | | | | | | |
| | | | | | | 36,557,304 | |
| | | | | | | | |
| Russian Federation - 5.7% | | | | | | |
Gazprom PJSC | | | 611,570 | | | | 4,018,015 | |
LUKOIL PJSC - ADR | | | 12,900 | | | | 1,028,517 | |
Magnit PJSC | | | 73,502 | | | | 1,027,926 | |
Magnitogorsk Iron & Steel Works PJSC | | | 10,362 | | | | 91,186 | |
MMC Norilsk Nickel PJSC - ADR | | | 19,964 | | | | 416,449 | |
MMC Norilsk Nickel PJSC | | | 76,864 | | | | 1,604,920 | |
Mobile TeleSystems PJSC - ADR | | | 20,920 | | | | 163,594 | |
Novatek PJSC | | | 491 | | | | 100,655 | |
Novolipetsk Steel PJSC | | | 80,712 | | | | 2,122,726 | |
Rosneft Oil Co PJSC | | | 629,835 | | | | 4,197,220 | |
Sberbank of Russia PJSC - ADR | | | 28,269 | | | | 407,074 | |
Severstal PJSC | | | 133,609 | | | | 2,107,014 | |
Tatneft PJSC - ADR | | | 2,100 | | | | 145,740 | |
Tatneft PJSC | | | 39,469 | | | | 2,688,628 | |
VTB Bank PJSC | | | 426,716 | | | | 492,430 | |
| | | | | | | | |
| | | | | | | 20,612,094 | |
| | | | | | | | |
| South Africa - 3.2% | | | | | | |
Absa Group Ltd. | | | 6,867 | | | | 79,672 | |
Anglo American Platinum Ltd. | | | 9,504 | | | | 478,115 | |
AngloGold Ashanti Ltd. | | | 33,718 | | | | 450,646 | |
Bid Corp. Ltd. | | | 24,280 | | | | 507,261 | |
Capitec Bank Holdings Ltd. | | | 1,660 | | | | 150,340 | |
Clicks Group Ltd. | | | 23,348 | | | | 305,622 | |
FirstRand Ltd. | | | 102,999 | | | | 473,055 | |
Gold Fields Ltd. | | | 27,172 | | | | 122,072 | |
Imperial Logistics Ltd. | | | 18,367 | | | | 75,883 | |
Investec Ltd. | | | 11,553 | | | | 67,964 | |
Kumba Iron Ore Ltd. (c) | | | 35,472 | | | | 1,076,464 | |
Life Healthcare Group Holdings Ltd. | | | 5,900 | | | | 9,377 | |
Mondi Ltd. | | | 29,770 | | | | 612,210 | |
Mr Price Group Ltd. | | | 20,847 | | | | 282,158 | |
MTN Group Ltd. | | | 27,764 | | | | 195,637 | |
Nedbank Group Ltd. | | | 6,248 | | | | 112,407 | |
Netcare Ltd. | | | 149,605 | | | | 191,034 | |
Pick n Pay Stores Ltd. | | | 117,958 | | | | 574,718 | |
Rand Merchant Investment Holdings Ltd. | | | 162 | | | | 366 | |
RMB Holdings Ltd. | | | 41,808 | | | | 236,418 | |
Sanlam Ltd. | | | 75,707 | | | | 395,836 | |
Shoprite Holdings Ltd. | | | 49,419 | | | | 583,545 | |
Standard Bank Group Ltd. | | | 100,163 | | | | 1,366,680 | |
Telkom S.A. SOC Ltd. | | | 75,673 | | | | 476,494 | |
The Bidvest Group Ltd. | | | 32,316 | | | | 459,462 | |
| | | | | | | | |
| | | SHARES | | | FAIR
VALUE | |
| South Africa - 3.2% (continued) | | | | | | |
The Foschini Group Ltd. | | | 25,689 | | | $ | 310,570 | |
The SPAR Group Ltd. | | | 40,452 | | | | 531,788 | |
Tiger Brands Ltd. | | | 18,014 | | | | 272,060 | |
Truworths International Ltd. | | | 110,581 | | | | 543,937 | |
Vodacom Group Ltd. | | | 38,111 | | | | 310,827 | |
Woolworths Holdings Ltd. | | | 80,945 | | | | 254,234 | |
| | | | | | | | |
| | | | | | | 11,506,852 | |
| | | | | | | | |
| Taiwan, Province of China - 2.1% | | | | | | |
Acer, Inc. | | | 11,000 | | | | 6,629 | |
Advantech Co., Ltd. | | | 23,000 | | | | 192,803 | |
Asustek Computer, Inc. | | | 45,000 | | | | 308,897 | |
Catcher Technology Co., Ltd. | | | 30,000 | | | | 182,206 | |
Chicony Electronics Co., Ltd. | | | 31,000 | | | | 73,449 | |
China Airlines Ltd. | | | 293,000 | | | | 90,275 | |
China Development Financial Holding Corp. | | | 217,000 | | | | 63,839 | |
China Steel Corp. | | | 214,000 | | | | 164,498 | |
Chunghwa Telecom Co., Ltd. | | | 99,000 | | | | 352,313 | |
Delta Electronics, Inc. | | | 23,000 | | | | 103,677 | |
Eclat Textile Co., Ltd. | | | 14,000 | | | | 181,795 | |
Eva Airways Corp. | | | 621,000 | | | | 295,644 | |
Far EasTone Telecommunications Co., Ltd. | | | 45,000 | | | | 111,744 | |
Formosa Petrochemical Corp. | | | 113,000 | | | | 414,646 | |
Foxconn Technology Co., Ltd. | | | 228,000 | | | | 443,559 | |
Hon Hai Precision Industry Co., Ltd. | | | 82,000 | | | | 191,690 | |
Innolux Corp. | | | 999,000 | | | | 236,695 | |
Lite-On Technology Corp. | | | 374,000 | | | | 533,567 | |
Nanya Technology Corp. | | | 77,000 | | | | 150,042 | |
Nien Made Enterprise Co., Ltd. | | | 32,000 | | | | 233,326 | |
Pou Chen Corp. | | | 27,000 | | | | 30,619 | |
Powertech Technology, Inc. | | | 40,000 | | | | 94,013 | |
President Chain Store Corp. | | | 6,000 | | | | 57,129 | |
Standard Foods Corp. | | | 105,000 | | | | 201,281 | |
Taiwan Business Bank | | | 922,000 | | | | 377,696 | |
Taiwan Mobile Co., Ltd. | | | 51,000 | | | | 190,368 | |
Taiwan Semiconductor Manufacturing Co., Ltd. | | | 89,000 | | | | 663,013 | |
Teco Electric and Machinery Co., Ltd. | | | 1,000 | | | | 723 | |
United Microelectronics Corp. | | | 338,000 | | | | 137,926 | |
Walsin Technology Corp. | | | 41,000 | | | | 206,216 | |
Wistron Corp. | | | 715,000 | | | | 508,897 | |
WPG Holdings Ltd. | | | 43,000 | | | | 53,729 | |
Yageo Corp. | | | 34,000 | | | | 280,712 | |
Zhen Ding Technology Holding Ltd. | | | 106,000 | | | | 310,497 | |
| | | | | | | | |
| | | | | | | 7,444,113 | |
| | | | | | | | |
| Thailand - 2.0% | | | | | | |
Airports of Thailand PCL | | | 53,300 | | | | 107,366 | |
Bangkok Bank PCL | | | 11,900 | | | | 73,887 | |
Bumrungrad Hospital PCL | | | 46,200 | | | | 244,521 | |
CP ALL PCL | | | 180,400 | | | | 454,598 | |
Home Product Center PCL | | | 719,800 | | | | 384,379 | |
Indorama Ventures PCL | | | 104,300 | | | | 151,601 | |
IRPC PCL | | | 2,281,400 | | | | 341,696 | |
Kasikornbank PCL - NVDR | | | 110,098 | | | | 648,812 | |
Kasikornbank PCL | | | 112,200 | | | | 664,744 | |
| | | | |
| | The accompanying Notes to the Financial Statements are an integral part of these Financial Statements. | | (Continued) |
| | | | | | | | | | | | | | | | |
| | Elements Portfolios | | | | | | Annual Report | | | | | | May 31, 2019 | | |
| | | | |
86
| | |
| Schedule of Investments | | as of May 31, 2019 |
| | | | |
| ELEMENTS EMERGING MARKETS PORTFOLIO | | | | |
| | | | | | | | |
| | | SHARES | | | FAIR
VALUE | |
| Thailand - 2.0% (continued) | | | | | | |
Krung Thai Bank PCL | | | 454,100 | | | $ | 274,060 | |
Land & Houses PCL | | | 367,200 | | | | 122,990 | |
PTT Exploration & Production PCL | | | 125,100 | | | | 496,091 | |
PTT Global Chemical PCL | | | 260,495 | | | | 500,042 | |
PTT PCL | | | 1,042,310 | | | | 1,523,243 | |
Ratch Group PCL | | | 23,600 | | | | 45,862 | |
Robinson PCL | | | 229,300 | | | | 394,876 | |
Thai Oil PCL | | | 24,400 | | | | 45,681 | |
Thai Union Group PCL | | | 464,100 | | | | 265,430 | |
The Siam Cement PCL | | | 31,000 | | | | 442,752 | |
The Siam Commercial Bank PCL | | | 22,400 | | | | 91,660 | |
| | | | | | | | |
| | | | | | | 7,274,291 | |
| | | | | | | | |
| Turkey - 0.6% | | | | | | |
Akbank T.A.S. (b) | | | 118,877 | | | | 122,030 | |
Anadolu Efes Biracilik Ve Malt Sanayii AS | | | 36,966 | | | | 122,152 | |
Arcelik AS (b) | | | 25,999 | | | | 77,745 | |
BIM Birlesik Magazalar AS | | | 26,720 | | | | 365,562 | |
Eregli Demir ve Celik Fabrikalari TAS | | | 176,061 | | | | 219,113 | |
Ford Otomotiv Sanayi AS | | | 16,697 | | | | 157,784 | |
KOC Holding AS | | | 135,851 | | | | 378,485 | |
TAV Havalimanlari Holding AS | | | 21,095 | | | | 92,122 | |
Tupras Turkiye Petrol Rafinerileri AS | | | 13,430 | | | | 302,005 | |
Turkcell Iletisim Hizmetleri AS | | | 70,012 | | | | 139,892 | |
Turkiye Garanti Bankasi AS (b) | | | 21,421 | | | | 29,160 | |
Turkiye Is Bankasi AS (b) | | | 226,340 | | | | 198,929 | |
Turkiye Sise ve Cam Fabrikalari AS | | | 87,975 | | | | 78,529 | |
| | | | | | | | |
| | | | | | | 2,283,508 | |
| | | | | | | | |
| United Kingdom - 1.8% | | | | | | |
LUKOIL PJSC | | | 71,271 | | | | 5,741,592 | |
Old Mutual Ltd. | | | 410,704 | | | | 593,235 | |
PhosAgro PJSC | | | 17,378 | | | | 223,655 | |
| | | | | | | | |
| | | | | | | 6,558,482 | |
| | | | | | | | |
| United States - 30.9% | | | | | | |
AAC Technologies Holdings, Inc. | | | 9,000 | | | | 47,873 | |
Alphabet, Inc. - Class A (b)(e) | | | 8,880 | | | | 9,825,720 | |
Altria Group, Inc. | | | 176,295 | | | | 8,649,033 | |
Amgen, Inc. | | | 16,000 | | | | 2,667,200 | |
Anadarko Petroleum Corp. | | | 94,444 | | | | 6,646,024 | |
Celgene Corp. (b) | | | 80,274 | | | | 7,528,899 | |
Cisco Systems, Inc. | | | 57,500 | | | | 2,991,725 | |
Clorox Co. (c) | | | 18,285 | | | | 2,720,991 | |
ConocoPhillips | | | 99,000 | | | | 5,837,040 | |
Corning, Inc. | | | 67,160 | | | | 1,936,894 | |
DowDuPont, Inc. (e) | | | 145,000 | | | | 4,425,400 | |
HCA Healthcare, Inc. | | | 37,358 | | | | 4,518,824 | |
Home Depot, Inc. | | | 28,000 | | | | 5,315,800 | |
Northrop Grumman Corp. | | | 4,198 | | | | 1,273,044 | |
Oracle Corp. | | | 33,341 | | | | 1,687,054 | |
PACCAR, Inc. | | | 27,650 | | | | 1,819,923 | |
Pitney Bowes, Inc. (c) | | | 210,000 | | | | 766,500 | |
PPL Corp. | | | 93,604 | | | | 2,785,655 | |
Raytheon Co. (e) | | | 40,583 | | | | 7,081,733 | |
Reliance Industries Ltd. (a) (Cost: $802,455; Original Acquisition Date: 12/19/2018) | | | 23,190 | | | | 893,975 | |
| | | | | | | | |
| | | SHARES | | | FAIR
VALUE | |
| United States - 30.9% (continued) | | | | | | |
Sberbank of Russia PJSC | | | 26,961 | | | $ | 389,586 | |
Spirit AeroSystems Holdings, Inc. | | | 27,650 | | | | 2,240,756 | |
The PNC Financial Services Group Inc. | | | 44,596 | | | | 5,675,287 | |
WABCO Holdings, Inc. (b) | | | 13,379 | | | | 1,751,445 | |
Walgreens Boots Alliance, Inc. (c) | | | 59,500 | | | | 2,935,730 | |
Wells Fargo & Co. | | | 133,344 | | | | 5,916,473 | |
Yum China Holdings, Inc. | | | 88,655 | | | | 3,547,086 | |
Zoetis, Inc. (c)(e) | | | 98,000 | | | | 9,902,900 | |
| | | | | | | | |
| | | | | | | 111,778,570 | |
| | | | | | | | |
TOTAL COMMON STOCKS
(Cost $302,045,719) | | | | | | | 299,425,891 | |
| | | | | | | | |
| | | | | | | | |
PREFERRED STOCKS - 1.6% | | | | | | | | |
| Brazil - 1.0% | | | | | | |
Braskem S.A. (b) | | | 40,300 | | | | 437,000 | |
Centrais Eletricas Brasileiras S.A. | | | 17,100 | | | | 155,924 | |
Cia Brasileira de Distribuicao | | | 27,800 | | | | 616,085 | |
Cia Energetica de Minas Gerais | | | 16,600 | | | | 62,441 | |
Gerdau S.A. | | | 146,200 | | | | 517,146 | |
Itau Unibanco Holding S.A. | | | 80,700 | | | | 721,661 | |
Lojas Americanas S.A. | | | 5,400 | | | | 22,239 | |
Petroleo Brasileiro S.A. - Preferred | | | 75,500 | | | | 491,603 | |
Telefonica Brasil S.A. | | | 34,200 | | | | 419,748 | |
| | | | | | | | |
| | | | | | | 3,443,847 | |
| | | | | | | | |
| Republic of Korea - 0.6% | | | | | | |
Amorepacific Corp. - Preferred | | | 4,891 | | | | 409,055 | |
Hyundai Motor Co. - Preferred | | | 5,384 | | | | 387,445 | |
Hyundai Motor Co. - Series 2 | | | 6,519 | | | | 429,163 | |
LG Chem Ltd. | | | 362 | | | | 58,971 | |
LG Household & Health Care Ltd. - Preferred | | | 1,113 | | | | 681,314 | |
Samsung Electronics Co., Ltd. - Preferred | | | 13,035 | | | | 380,904 | |
| | | | | | | | |
| | | | | | | 2,346,852 | |
| | | | | | | | |
TOTAL PREFERRED STOCKS
(Cost $5,964,251) | | | | | | | 5,790,699 | |
| | | | | | | | |
| | | | | | | | |
REAL ESTATE INVESTMENT TRUSTS - 6.9% | | | | | |
| United States - 6.9% | | | | | | |
Federal Realty Investment Trust | | | 16,370 | | | | 2,140,050 | |
New Residential Investment Corp. | | | 100,342 | | | | 1,530,215 | |
Realty Income Corp. (c) | | | 35,231 | | | | 2,468,989 | |
Ventas, Inc. | | | 107,000 | | | | 6,880,100 | |
Welltower, Inc. (e) | | | 146,000 | | | | 11,858,120 | |
| | | | | | | | |
TOTAL REAL ESTATE INVESTMENT TRUSTS
(Cost $24,466,907) | | | | | | | 24,877,474 | |
| | | | | | | | |
| | | | | | | | |
SHORT-TERM INVESTMENTS - 3.4% | | | | | | | | |
| Money Market Funds - 1.0% | | | | | | |
Fidelity Investments Money Market Funds - Government Portfolio, 2.27% (f) | | | 688,667 | | | | 688,667 | |
Morgan Stanley Institutional Liquidity Funds - Government Portfolio - Institutional Class, 2.29% (f) | | | 688,667 | | | | 688,667 | |
Morgan Stanley Institutional Liquidity Funds - Treasury Portfolio, 2.27% (f) | | | 688,667 | | | | 688,667 | |
| | | | |
| | The accompanying Notes to the Financial Statements are an integral part of these Financial Statements. | | (Continued) |
| | | | | | | | | | | | | | | | |
| | Elements Portfolios | | | | | | Annual Report | | | | | | May 31, 2019 | | |
| | | | |
87
| | |
| Schedule of Investments | | as of May 31, 2019 |
| | | | |
| ELEMENTS EMERGING MARKETS PORTFOLIO | | | | |
| | | | | | | | |
| | | SHARES | | | FAIR
VALUE | |
| Money Market Funds - 1.0% (continued) | |
Short-Term Investments Trust - Treasury Portfolio - Institutional Class, 2.29% (f) | | | 688,667 | | | $ | 688,667 | |
STIT-Government & Agency Portfolio, 2.31% (f) | | | 688,667 | | | | 688,667 | |
| | | | | | | | |
| | | | | | | 3,443,335 | |
| | | | | | | | |
| | |
| | | PRINCIPAL
AMOUNT | | | FAIR VALUE | |
| US TREASURY BILL - 2.5% | | | | | | |
2.329%, 06/25/2019 (g) | | $ | 6,000,000 | | | | 5,990,866 | |
2.314%, 06/18/2019 (g) | | | 3,000,000 | | | | 2,996,692 | |
| | | | | | | | |
| | | | | | | 8,987,558 | |
| | | | | | | | |
TOTAL SHORT-TERM INVESTMENTS
(Cost $12,430,893) | | | | | | | 12,430,893 | |
| | | | | | | | |
| | |
| | | SHARES | | | FAIR
VALUE | |
INVESTMENTS PURCHASED WITH THE CASH PROCEEDS FROM
SECURITIES LENDING - 6.9% | |
BlackRock Liquidity Funds FedFund Portfolio, 2.30% (g) | | | 2,477,759 | | | | 2,477,759 | |
Morgan Stanley Institutional Liquidity Funds - Prime Portfolio, 2.49% (g) | | | 22,299,829 | | | | 22,299,829 | |
| | | | | | | | |
TOTAL INVESTMENTS PURCHASED WITH THE CASH PROCEEDS FROM SECURITIES LENDING
(Cost $24,777,588) | | | | | | | 24,777,588 | |
| | | | | | | | |
TOTAL INVESTMENTS
(Cost $369,685,357) - 101.7% | | | | | | | 367,302,545 | |
| | | | | | | | |
LIABILITIES IN EXCESS OF OTHER ASSETS - (1.7)% | | | | | | | (6,009,445) | |
| | | | | | | | |
TOTAL NET ASSETS - 100.0% | | | | | | $ | 361,293,100 | |
| | | | | | | | |
Percentages are stated as a percent of net assets.
ADR - American Depository Receipt
PLC - Public Limited Company
| (a) | Although security is restricted as to resale, the Portfolio’s Adviser has determined this security to be liquid based upon procedures approved by the Board of Trustees. The aggregate value of these securities at May 31, 2019 was $7,357,118, which represents 2.0% of net assets. |
| (b) | Non-income producing security. |
| (c) | This security or a portion of this security was out on loan as of May 31, 2019. Total loaned securities had a market value of $12,733,132 as of May 31, 2019. |
| (e) | This security or a portion of this security was held as collateral for derivative contracts as of May 31, 2019. |
| (f) | Rate shown is the7-day effective yield. |
| (g) | Rate shown is the effective yield based on purchase price. The calculation assumes the security is held to maturity. |
Open Futures Contracts
| | | | | | | | | | | | |
| | | |
| DESCRIPTION | | NUMBER OF
CONTRACTS
PURCHASED | | | NOTIONAL
VALUE | | | VALUE/
UNREALIZED
DEPRECIATION | |
| FUTURES CONTRACTS PURCHASED | | | | | | | | | | | | |
Mini MSCI Emerging Markets Index, June 2019 Settlement | | | 1,518 | | | $ | 75,915,180 | | | $ | (3,909,797 | ) |
| | | | | | | | | | | | |
TOTAL FUTURES CONTRACTS PURCHASED | | | | | | $ | 75,915,180 | | | $ | (3,909,797 | ) |
| | | | | | | | | | | | |
| | | | |
| | The accompanying Notes to the Financial Statements are an integral part of these Financial Statements. | | (Continued) |
| | | | | | | | | | | | | | | | |
| | Elements Portfolios | | | | | | Annual Report | | | | | | May 31, 2019 | | |
| | | | |
88
| | |
| Schedule of Investments | | as of May 31, 2019 |
| | | | |
| ELEMENTS EMERGING MARKETS PORTFOLIO | | | | |
Total Return Swaps
| | | | | | | | | | | | | | | | | | | | | | | | | | |
| | | | | | | | |
| COUNTERPARTY (a) | | REFERENCE ENTITY | | PAY/RECEIVE
TOTAL
RETURN ON
REFERENCE
ENTITY | | BASE FINANCING
RATE (b) | | TERMINATION
DATE | | | PAYMENT
FREQUENCY | | | NOTIONAL
VALUE | | | NUMBER
OF UNITS | | | UNREALIZED
APPRECIATION
(DEPRECIATION) | |
| | | | | | | | | | | | | | | | | | | | | | |
| A | | Acer Inc. | | Receive | | 1-Month LIBOR USD | | | 6/28/2024 | | | | Term | | | $ | 254,114 | | | | 497,000 | | | $ | 34,565 | |
| A | | Advanced Petrochemicals Co. | | Receive | | 1-Month SAIBOR | | | 6/28/2024 | | | | Term | | | | 181,667 | | | | 12,101 | | | | (1,469 | ) |
| A | | Advantech Co., Ltd. | | Receive | | 1-Month LIBOR USD | | | 6/28/2024 | | | | Term | | | | 233,586 | | | | 33,000 | | | | 38,323 | |
| C | | AirAsia Group Berhad | | Receive | | 1-Month LIBOR USD | | | 9/20/2021 | | | | Term | | | | 387,165 | | | | 589,200 | | | | 22,235 | |
| A | | Al Rajhi Bank | | Receive | | 1-Month SAIBOR | | | 6/28/2024 | | | | Term | | | | 113,709 | | | | 6,572 | | | | 10,601 | |
| A | | Alphabet, Inc. — Class A | | Pay | | 1-Month LIBOR USD | | | 4/2/2029 | | | | Term | | | | 10,705,195 | | | | 8,880 | | | | 925,537 | |
| A | | Altria Group, Inc. | | Pay | | 1-Month LIBOR USD | | | 4/2/2029 | | | | Term | | | | 8,649,033 | | | | 176,295 | | | | — | |
| A | | Amgen, Inc. | | Pay | | 1-Month LIBOR USD | | | 4/2/2029 | | | | Term | | | | 2,919,520 | | | | 16,000 | | | | 237,985 | |
| C | | AMMB Holdings Berhad | | Receive | | 1-Month LIBOR USD | | | 9/20/2021 | | | | Term | | | | 52,990 | | | | 49,500 | | | | (783 | ) |
| A | | Amorepacific Corp. — Preferred | | Receive | | 1-Month LIBOR USD | | | 6/28/2024 | | | | Term | | | | 176,411 | | | | 1,797 | | | | (28,826 | ) |
| C | | Amorepacific Corp. — Preferred | | Receive | | 1-Month LIBOR USD | | | 9/20/2021 | | | | Term | | | | 12,093 | | | | 139 | | | | (528 | ) |
| C | | Amorepacific Group | | Receive | | 1-Month LIBOR USD | | | 9/20/2021 | | | | Term | | | | 61 | | | | 1 | | | | (7 | ) |
| A | | Anadarko Petroleum Corp. | | Pay | | 1-Month LIBOR USD | | | 4/2/2029 | | | | Term | | | | 6,646,024 | | | | 94,444 | | | | — | |
| A | | ASE Technology Holding Co., Ltd. | | Receive | | 1-Month LIBOR USD | | | 6/28/2024 | | | | Term | | | | 52,609 | | | | 23,500 | | | | (9,538 | ) |
| A | | Asia Cement Corp. | | Receive | | 1-Month LIBOR USD | | | 6/28/2024 | | | | Term | | | | 75,848 | | | | 71,000 | | | | 24,061 | |
| A | | Asustek Computer Inc. | | Receive | | 1-Month LIBOR USD | | | 6/28/2024 | | | | Term | | | | 859,767 | | | | 105,000 | | | | (136,711 | ) |
| A | | Atacadao Distribuicao Comercio E Industria Ltd. | | Receive | | 1-Month LIBOR USD | | | 6/28/2024 | | | | Term | | | | 528,850 | | | | 113,266 | | | | 133,252 | |
| C | | Atacadao Distribuicao Comercio E Industria Ltd. | | Receive | | 1-Month LIBOR USD | | | 9/20/2021 | | | | Term | | | | 339 | | | | 100 | | | | 249 | |
| A | | AU Optronics Corp. | | Receive | | 1-Month LIBOR USD | | | 6/28/2024 | | | | Term | | | | 108,392 | | | | 290,000 | | | | (25,157 | ) |
| A | | B3Sa-Brasil Bolsa Balcao | | Receive | | 1-Month LIBOR USD | | | 6/28/2024 | | | | Term | | | | 68,245 | | | | 9,828 | | | | 23,243 | |
| A | | Banco Santander Brasil | | Receive | | 1-Month LIBOR USD | | | 6/28/2024 | | | | Term | | | | 38,635 | | | | 4,704 | | | | 17,706 | |
| A | | Bank Albilad | | Receive | | 1-Month SAIBOR | | | 6/28/2024 | | | | Term | | | | 170,245 | | | | 27,521 | | | | 3,847 | |
| A | | BankAl-Jazira | | Receive | | 1-Month SAIBOR | | | 6/28/2024 | | | | Term | | | | 50,415 | | | | 11,723 | | | | (3,364 | ) |
| A | | BGF Retail Co., Ltd. | | Receive | | 1-Month LIBOR USD | | | 6/28/2024 | | | | Term | | | | 427,553 | | | | 2,540 | | | | (33,060 | ) |
| A | | Braskem S.A. — Preferred A | | Receive | | 1-Month LIBOR USD | | | 6/28/2024 | | | | Term | | | | 385,415 | | | | 30,592 | | | | (55,991 | ) |
| C | | British American Tobacco Berhad | | Receive | | 1-Month LIBOR USD | | | 9/20/2021 | | | | Term | | | | 355,911 | | | | 39,400 | | | | (73,532 | ) |
| A | | Bupa Arabia For Cooperative | | Receive | | 1-Month SAIBOR | | | 6/28/2024 | | | | Term | | | | 196,736 | | | | 8,326 | | | | (1,583 | ) |
| A | | Catcher Technology Co., Ltd. | | Receive | | 1-Month LIBOR USD | | | 6/28/2024 | | | | Term | | | | 500,830 | | | | 53,000 | | | | (184,856 | ) |
| A | | CCR S.A. | | Receive | | 1-Month LIBOR USD | | | 6/28/2024 | | | | Term | | | | 6,457 | | | | 2,858 | | | | 3,623 | |
| A | | Celgene Corp. | | Pay | | 1-Month LIBOR USD | | | 4/2/2029 | | | | Term | | | | 7,572,246 | | | | 80,274 | | | | 71,448 | |
| A | | Centrais Eletricas Brasilier | | Receive | | 1-Month LIBOR USD | | | 6/28/2024 | | | | Term | | | | 125,171 | | | | 19,900 | | | | 51,821 | |
| | | | |
| | The accompanying Notes to the Financial Statements are an integral part of these Financial Statements. | | (Continued) |
| | | | | | | | | | | | | | | | |
| | Elements Portfolios | | | | | | Annual Report | | | | | | May 31, 2019 | | |
| | | | |
89
| | |
| Schedule of Investments | | as of May 31, 2019 |
| | | | |
| ELEMENTS EMERGING MARKETS PORTFOLIO | | | | |
| | | | | | | | | | | | | | | | | | | | | | | | | | |
| | | | | | | | |
| COUNTERPARTY (a) | | REFERENCE ENTITY | | PAY/RECEIVE
TOTAL
RETURN ON
REFERENCE
ENTITY | | BASE FINANCING
RATE (b) | | TERMINATION
DATE | | | PAYMENT
FREQUENCY | | | NOTIONAL
VALUE | | | NUMBER
OF UNITS | | | UNREALIZED
APPRECIATION
(DEPRECIATION) | |
| | | | | | | | | | | | | | | | | | | | | | |
| A | | Centrais Eletricas Brasilier — Preferred B | | Receive | | 1-Month LIBOR USD | | | 6/28/2024 | | | | Term | | | $ | 254,589 | | | | 33,346 | | | $ | 57,221 | |
| A | | Chang Hwa Commercial Bank | | Receive | | 1-Month LIBOR USD | | | 6/28/2024 | | | | Term | | | | 578,822 | | | | 1,106,844 | | | | 105,811 | |
| A | | Cheil Worldwide Inc. | | Receive | | 1-Month LIBOR USD | | | 6/28/2024 | | | | Term | | | | 398,391 | | | | 23,243 | | | | 118,628 | |
| A | | Chicony Electronics Co., Ltd. | | Receive | | 1-Month LIBOR USD | | | 6/28/2024 | | | | Term | | | | 406,745 | | | | 185,805 | | | | 29,912 | |
| A | | China Airlines Ltd. | | Receive | | 1-Month LIBOR USD | | | 6/28/2024 | | | | Term | | | | 11,961 | | | | 33,000 | | | | (1,970 | ) |
| A | | China Development Financial | | Receive | | 1-Month LIBOR USD | | | 6/28/2024 | | | | Term | | | | 161,539 | | | | 511,000 | | | | (13,799 | ) |
| A | | China Steel Corp. | | Receive | | 1-Month LIBOR USD | | | 6/28/2024 | | | | Term | | | | 425,703 | | | | 531,000 | | | | (25,804 | ) |
| A | | Chunghwa Telecom Co., Ltd. | | Receive | | 1-Month LIBOR USD | | | 6/28/2024 | | | | Term | | | | 615,166 | | | | 180,000 | | | | 16,935 | |
| A | | Cia Brasileira de Distribuicao — Preferred | | Receive | | 1-Month LIBOR USD | | | 6/28/2024 | | | | Term | | | | 389,299 | | | | 18,641 | | | | 22,679 | |
| C | | Cia Brasileira de Distribuicao — Preferred | | Receive | | 1-Month LIBOR USD | | | 9/20/2021 | | | | Term | | | | 10,703 | | | | 500 | | | | 345 | |
| A | | Cia Energetica MinasGer-Prf | | Receive | | 1-Month LIBOR USD | | | 6/28/2024 | | | | Term | | | | 167,876 | | | | 50,123 | | | | 25,662 | |
| A | | Cia Saneamento Basico de Sao Paulo | | Receive | | 1-Month LIBOR USD | | | 6/28/2024 | | | | Term | | | | 182,592 | | | | 20,373 | | | | 48,976 | |
| A | | Cia Siderurgica Nacional S.A. | | Receive | | 1-Month LIBOR USD | | | 6/28/2024 | | | | Term | | | | 53,700 | | | | 22,265 | | | | 43,097 | |
| A | | Cisco Systems, Inc. | | Pay | | 1-Month LIBOR USD | | | 4/2/2029 | | | | Term | | | | 3,237,825 | | | | 57,500 | | | | 255,932 | |
| A | | Clorox Co. | | Pay | | 1-Month LIBOR USD | | | 4/2/2029 | | | | Term | | | | 2,812,050 | | | | 18,285 | | | | 83,941 | |
| A | | Compal Electronics | | Receive | | 1-Month LIBOR USD | | | 6/28/2024 | | | | Term | | | | 14,828 | | | | 26,000 | | | | 1,120 | |
| A | | ConocoPhillips | | Pay | | 1-Month LIBOR USD | | | 4/2/2029 | | | | Term | | | | 6,512,220 | | | | 99,000 | | | | 664,759 | |
| A | | Corning, Inc. | | Pay | | 1-Month LIBOR USD | | | 4/2/2029 | | | | Term | | | | 1,936,894 | | | | 67,160 | | | | — | |
| A | | Cosan S.A. | | Receive | | 1-Month LIBOR USD | | | 6/28/2024 | | | | Term | | | | 65,542 | | | | 7,637 | | | | 26,934 | |
| A | | CTBC Financial Holding Co., Ltd. | | Receive | | 1-Month LIBOR USD | | | 6/28/2024 | | | | Term | | | | 29,258 | | | | 45,000 | | | | 159 | |
| C | | Daelim Industrial Co., Ltd. | | Receive | | 1-Month LIBOR USD | | | 9/20/2021 | | | | Term | | | | 3,322 | | | | 36 | | | | (199 | ) |
| A | | Dar Al Arkan Real Estate Development Company | | Receive | | 1-Month SAIBOR | | | 6/28/2024 | | | | Term | | | | 213,598 | | | | 76,354 | | | | (8,185 | ) |
| C | | DB Insurance Co., Ltd. | | Receive | | 1-Month LIBOR USD | | | 9/20/2021 | | | | Term | | | | 23,236 | | | | 374 | | | | (3,730 | ) |
| A | | Delta Electronics Inc. | | Receive | | 1-Month LIBOR USD | | | 6/28/2024 | | | | Term | | | | 246,032 | | | | 53,000 | | | | (11,668 | ) |
| C | | Dongsuh Companies, Inc. | | Receive | | 1-Month LIBOR USD | | | 9/20/2021 | | | | Term | | | | 3,198 | | | | 200 | | | | 25 | |
| A | | Doosan Bobcat, Inc. | | Receive | | 1-Month LIBOR USD | | | 6/28/2024 | | | | Term | | | | 201,152 | | | | 6,506 | | | | (18,680 | ) |
| C | | Doosan Bobcat, Inc. | | Receive | | 1-Month LIBOR USD | | | 9/20/2021 | | | | Term | | | | 82,174 | | | | 2,818 | | | | (2,633 | ) |
| A | | DowDuPont, Inc. | | Pay | | 1-Month LIBOR USD | | | 4/2/2029 | | | | Term | | | | 5,684,000 | | | | 145,000 | | | | 1,255,560 | |
| A | | E.Sun Financial Holding Co. | | Receive | | 1-Month LIBOR USD | | | 6/28/2024 | | | | Term | | | | 1,916 | | | | 3,419 | | | | 1,044 | |
| A | | Eclat Textile Company Ltd. | | Receive | | 1-Month LIBOR USD | | | 6/28/2024 | | | | Term | | | | 55,682 | | | | 5,000 | | | | 8,419 | |
| A | | Embraer S.A. | | Receive | | 1-Month LIBOR USD | | | 6/28/2024 | | | | Term | | | | 192,959 | | | | 35,751 | | | | (22,746 | ) |
| A | | Etihad Etisalat Co. | | Receive | | 1-Month SAIBOR | | | 6/28/2024 | | | | Term | | | | 100,223 | | | | 17,359 | | | | 1,398 | |
| A | | EVA Airways Corp. | | Receive | | 1-Month LIBOR USD | | | 6/28/2024 | | | | Term | | | | 96,660 | | | | 197,147 | | | | (4,576 | ) |
| | | | |
| | The accompanying Notes to the Financial Statements are an integral part of these Financial Statements. | | (Continued) |
| | | | | | | | | | | | | | | | |
| | Elements Portfolios | | | | | | Annual Report | | | | | | May 31, 2019 | | |
| | | | |
90
| | |
| Schedule of Investments | | as of May 31, 2019 |
| | | | |
| ELEMENTS EMERGING MARKETS PORTFOLIO | | | | |
| | | | | | | | | | | | | | | | | | | | | | | | | | |
| | | | | | | | |
| COUNTERPARTY (a) | | REFERENCE ENTITY | | PAY/RECEIVE
TOTAL
RETURN ON
REFERENCE
ENTITY | | BASE FINANCING
RATE (b) | | TERMINATION
DATE | | | PAYMENT
FREQUENCY | | | NOTIONAL
VALUE | | | NUMBER
OF UNITS | | | UNREALIZED
APPRECIATION
(DEPRECIATION) | |
| | | | | | | | | | | | | | | | | | | | | | |
| A | | Evergreen Marine Corp. Ltd. | | Receive | | 1-Month LIBOR USD | | | 6/28/2024 | | | | Term | | | $ | 18,257 | | | | 44,936 | | | $ | (1,327 | ) |
| A | | Far Eastern New Century Corp. | | Receive | | 1-Month LIBOR USD | | | 6/28/2024 | | | | Term | | | | 155,685 | | | | 192,000 | | | | 41,939 | |
| A | | Far Eastone Telecomm Co., Ltd. | | Receive | | 1-Month LIBOR USD | | | 6/28/2024 | | | | Term | | | | 343,162 | | | | 143,000 | | | | 6,361 | |
| A | | Federal Realty Investment Trust | | Pay | | 1-Month LIBOR USD | | | 4/2/2029 | | | | Term | | | | 2,140,050 | | | | 16,370 | | | | — | |
| A | | Feng Tay Enterprise Co., Ltd. | | Receive | | 1-Month LIBOR USD | | | 6/28/2024 | | | | Term | | | | 498,961 | | | | 101,000 | | | | 255,692 | |
| C | | Fila Korea Ltd. | | Receive | | 1-Month LIBOR USD | | | 9/20/2021 | | | | Term | | | | 136,570 | | | | 2,958 | | | | 55,267 | |
| A | | Formosa Chemicals & Fibre | | Receive | | 1-Month LIBOR USD | | | 6/28/2024 | | | | Term | | | | 407,766 | | | | 134,000 | | | | 52,122 | |
| A | | Formosa Petrochemical Corp. | | Receive | | 1-Month LIBOR USD | | | 6/28/2024 | | | | Term | | | | 1,234,200 | | | | 354,000 | | | | 61,043 | |
| A | | Formosa Plastics Corp. | | Receive | | 1-Month LIBOR USD | | | 6/28/2024 | | | | Term | | | | 62,129 | | | | 20,000 | | | | 7,157 | |
| A | | Formosa Taffeta Co. | | Receive | | 1-Month LIBOR USD | | | 6/28/2024 | | | | Term | | | | 173,569 | | | | 163,000 | | | | 25,116 | |
| A | | Foxconn Technology Co., Ltd. | | Receive | | 1-Month LIBOR USD | | | 6/28/2024 | | | | Term | | | | 476,295 | | | | 229,000 | | | | (39,323 | ) |
| C | | Fraser & Neave Holdings Berhad | | Receive | | 1-Month LIBOR USD | | | 9/20/2021 | | | | Term | | | | 295,393 | | | | 35,500 | | | | (5,151 | ) |
| C | | Genting Berhad | | Receive | | 1-Month LIBOR USD | | | 9/20/2021 | | | | Term | | | | 218,066 | | | | 132,600 | | | | (16,315 | ) |
| A | | Gerdau S.A. — Preferred | | Receive | | 1-Month LIBOR USD | | | 6/28/2024 | | | | Term | | | | 336,780 | | | | 84,337 | | | | (39,434 | ) |
| A | | Giant Manufacturing | | Receive | | 1-Month LIBOR USD | | | 6/28/2024 | | | | Term | | | | 113,995 | | | | 23,000 | | | | 46,619 | |
| A | | Globalwafers Co., Ltd. | | Receive | | 1-Month LIBOR USD | | | 6/28/2024 | | | | Term | | | | 228,678 | | | | 28,000 | | | | 37,136 | |
| C | | GS Engineering & Construction Corp. | | Receive | | 1-Month LIBOR USD | | | 9/20/2021 | | | | Term | | | | 40,565 | | | | 965 | | | | (7,938 | ) |
| A | | GS Holdings | | Receive | | 1-Month LIBOR USD | | | 6/28/2024 | | | | Term | | | | 259,008 | | | | 4,805 | | | | (56,626 | ) |
| C | | GS Holdings | | Receive | | 1-Month LIBOR USD | | | 9/20/2021 | | | | Term | | | | 27,446 | | | | 589 | | | | (2,272 | ) |
| A | | Hankook Tire Co., Ltd. | | Receive | | 1-Month LIBOR USD | | | 6/28/2024 | | | | Term | | | | 579,823 | | | | 11,571 | | | | (256,881 | ) |
| C | | Hankook Tire Co., Ltd. | | Receive | | 1-Month LIBOR USD | | | 9/20/2021 | | | | Term | | | | 25,460 | | | | 681 | | | | (5,601 | ) |
| C | | Hanon Systems | | Receive | | 1-Month LIBOR USD | | | 9/20/2021 | | | | Term | | | | 30,712 | | | | 3,249 | | | | 854 | |
| C | | Hanwha Corporation | | Receive | | 1-Month LIBOR USD | | | 9/20/2021 | | | | Term | | | | 77,889 | | | | 2,797 | | | | (17,628 | ) |
| A | | HCA Healthcare, Inc. | | Pay | | 1-Month LIBOR USD | | | 4/2/2029 | | | | Term | | | | 4,518,824 | | | | 37,358 | | | | — | |
| A | | Highwealth Construction Corp. | | Receive | | 1-Month LIBOR USD | | | 6/28/2024 | | | | Term | | | | 78,355 | | | | 53,000 | | | | 1,994 | |
| A | | Home Depot, Inc. | | Pay | | 1-Month LIBOR USD | | | 4/2/2029 | | | | Term | | | | 5,783,400 | | | | 28,000 | | | | 485,161 | |
| A | | Hon Hai Precision Industry | | Receive | | 1-Month LIBOR USD | | | 6/28/2024 | | | | Term | | | | 130,465 | | | | 39,800 | | | | (39,807 | ) |
| C | | Hotel Shilla Co., Ltd. | | Receive | | 1-Month LIBOR USD | | | 9/20/2021 | | | | Term | | | | 284,962 | | | | 60,300 | | | | (15,170 | ) |
| A | | Hua Nan Financial Holdings Co. | | Receive | | 1-Month LIBOR USD | | | 6/28/2024 | | | | Term | | | | 44,295 | | | | 78,291 | | | | 6,985 | |
| A | | Hyundai Dept Store Co. | | Receive | | 1-Month LIBOR USD | | | 6/28/2024 | | | | Term | | | | 306,857 | | | | 3,615 | | | | (59,097 | ) |
| C | | Hyundai Glovis Co., Ltd. | | Receive | | 1-Month LIBOR USD | | | 9/20/2021 | | | | Term | | | | 111,438 | | | | 959 | | | | 20,039 | |
| C | | Hyundai Marine & Fire Ins Co., Ltd. | | Receive | | 1-Month LIBOR USD | | | 9/20/2021 | | | | Term | | | | 4,777 | | | | 129 | | | | (1,412 | ) |
| | | | |
| | The accompanying Notes to the Financial Statements are an integral part of these Financial Statements. | | (Continued) |
| | | | | | | | | | | | | | | | |
| | Elements Portfolios | | | | | | Annual Report | | | | | | May 31, 2019 | | |
| | | | |
91
| | |
| Schedule of Investments | | as of May 31, 2019 |
| | | | |
| ELEMENTS EMERGING MARKETS PORTFOLIO | | | | |
| | | | | | | | | | | | | | | | | | | | | | | | | | |
| | | | | | | | |
| COUNTERPARTY (a) | | REFERENCE ENTITY | | PAY/RECEIVE
TOTAL
RETURN ON
REFERENCE
ENTITY | | BASE FINANCING
RATE (b) | | TERMINATION
DATE | | | PAYMENT
FREQUENCY | | | NOTIONAL
VALUE | | | NUMBER
OF UNITS | | | UNREALIZED
APPRECIATION
(DEPRECIATION) | |
| | | | | | | | | | | | | | | | | | | | | | |
| C | | Hyundai Motor Co., Ltd. | | Receive | | 1-Month LIBOR USD | | | 9/20/2021 | | | | Term | | | $ | 9,447 | | | | 90 | | | $ | 771 | |
| C | | Hyundai Motor Co., Ltd. — 2nd Preference | | Receive | | 1-Month LIBOR USD | | | 9/20/2021 | | | | Term | | | | 29,297 | | | | 436 | | | | 2,612 | |
| C | | Hyundai Motor Co., Ltd. — Preferred | | Receive | | 1-Month LIBOR USD | | | 9/20/2021 | | | | Term | | | | 41,149 | | | | 670 | | | | 3,813 | |
| C | | Hyundai Steel Co., Ltd. | | Receive | | 1-Month LIBOR USD | | | 9/20/2021 | | | | Term | | | | 65,599 | | | | 1,567 | | | | (12,040 | ) |
| C | | Indocement Tunggal Prakarsa | | Receive | | 1-Month LIBOR USD | | | 9/20/2021 | | | | Term | | | | 49,901 | | | | 36,200 | | | | 5,176 | |
| C | | Indofood CBP Sukses Makmur Tbk | | Receive | | 1-Month LIBOR USD | | | 9/20/2021 | | | | Term | | | | 342,429 | | | | 487,700 | | | | (10,696 | ) |
| A | | Innolux Corp. | | Receive | | 1-Month LIBOR USD | | | 6/28/2024 | | | | Term | | | | 232,069 | | | | 641,000 | | | | (82,773 | ) |
| A | | Inventec Corp. | | Receive | | 1-Month LIBOR USD | | | 6/28/2024 | | | | Term | | | | 311,175 | | | | 402,000 | | | | (12,580 | ) |
| A | | Itau Unibanco Holding — Preferred | | Receive | | 1-Month LIBOR USD | | | 6/28/2024 | | | | Term | | | | 126,451 | | | | 4,650 | | | | 9,449 | |
| A | | Itausa-Investimentos Itau — Preferred | | Receive | | 1-Month LIBOR USD | | | 6/28/2024 | | | | Term | | | | 21,262 | | | | 8,847 | | | | 8,467 | |
| A | | Jarir Marketing Co. | | Receive | | 1-Month SAIBOR | | | 6/28/2024 | | | | Term | | | | 373,481 | | | | 8,371 | | | | 4,829 | |
| A | | JBS S.A. | | Receive | | 1-Month LIBOR USD | | | 6/28/2024 | | | | Term | | | | 400,933 | | | | 152,536 | | | | 438,765 | |
| C | | Korea Zinc Co., Ltd. | | Receive | | 1-Month LIBOR USD | | | 9/20/2021 | | | | Term | | | | 125,071 | | | | 316 | | | | (8,473 | ) |
| A | | Kroton Educacional S.A. | | Receive | | 1-Month LIBOR USD | | | 6/28/2024 | | | | Term | | | | 15,416 | | | | 6,683 | | | | 2,126 | |
| A | | KT&G Corp. | | Receive | | 1-Month LIBOR USD | | | 6/28/2024 | | | | Term | | | | 429,144 | | | | 4,675 | | | | (32,759 | ) |
| C | | Kuala Lumpur Kepong Berhad | | Receive | | 1-Month LIBOR USD | | | 9/20/2021 | | | | Term | | | | 1,765 | | | | 300 | | | | 10 | |
| C | | LG Electronics, Inc. | | Receive | | 1-Month LIBOR USD | | | 9/20/2021 | | | | Term | | | | 69,487 | | | | 1,164 | | | | 6,939 | |
| C | | LG Household & Healthcare | | Receive | | 1-Month LIBOR USD | | | 9/20/2021 | | | | Term | | | | 28,450 | | | | 28 | | | | 1,365 | |
| A | | LG Household & Healthcare — Preference Shares | | Receive | | 1-Month LIBOR USD | | | 6/28/2024 | | | | Term | | | | 241,991 | | | | 420 | | | | 11,979 | |
| C | | LG Household & Healthcare — Preference Shares | | Receive | | 1-Month LIBOR USD | | | 9/20/2021 | | | | Term | | | | 10,542 | | | | 18 | | | | 441 | |
| A | | Lite-On Technology Corp. | | Receive | | 1-Month LIBOR USD | | | 6/28/2024 | | | | Term | | | | 432,782 | | | | 310,000 | | | | (4,490 | ) |
| A | | Lojas Americanas S.A. — Preferred | | Receive | | 1-Month LIBOR USD | | | 6/28/2024 | | | | Term | | | | 42,744 | | | | 8,621 | | | | (7,734 | ) |
| A | | Lojas Renner S.A. | | Receive | | 1-Month LIBOR USD | | | 6/28/2024 | | | | Term | | | | 95,843 | | | | 11,424 | | | | 31,315 | |
| A | | LyondellBasell Industries N.V. | | Pay | | 1-Month LIBOR USD | | | 4/2/2029 | | | | Term | | | | 3,023,163 | | | | 40,716 | | | | — | |
| A | | Magazine Luiza S.A. | | Receive | | 1-Month LIBOR USD | | | 6/28/2024 | | | | Term | | | | 126,439 | | | | 2,838 | | | | 14,184 | |
| C | | Malayan Banking Berhad | | Receive | | 1-Month LIBOR USD | | | 9/20/2021 | | | | Term | | | | 134,792 | | | | 60,700 | | | | (864 | ) |
| C | | Malaysia Airports Holdings Berhad | | Receive | | 1-Month LIBOR USD | | | 9/20/2021 | | | | Term | | | | 120,065 | | | | 61,400 | | | | (12,577 | ) |
| A | | Mediatek Inc. | | Receive | | 1-Month LIBOR USD | | | 6/28/2024 | | | | Term | | | | 359,146 | | | | 46,000 | | | | 86,281 | |
| A | | Mega Financial Holding Co., Ltd. | | Receive | | 1-Month LIBOR USD | | | 6/28/2024 | | | | Term | | | | 520,189 | | | | 653,000 | | | | 118,082 | |
| A | | Micro-Star International Co. | | Receive | | 1-Month LIBOR USD | | | 6/28/2024 | | | | Term | | | | 284,298 | | | | 120,000 | | | | 30,855 | |
| A | | MSCI China A Inclusion Index (c) | | Receive | | 1-Month LIBOR USD | | | 9/12/2019 | | | | Term | | | | 3,999,493 | | | | 4,993 | | | | 586,765 | |
| | | | |
| | The accompanying Notes to the Financial Statements are an integral part of these Financial Statements. | | (Continued) |
| | | | | | | | | | | | | | | | |
| | Elements Portfolios | | | | | | Annual Report | | | | | | May 31, 2019 | | |
| | | | |
92
| | |
| Schedule of Investments | | as of May 31, 2019 |
| | | | |
| ELEMENTS EMERGING MARKETS PORTFOLIO | | | | |
| | | | | | | | | | | | | | | | | | | | | | | | | | |
| | | | | | | | |
| COUNTERPARTY (a) | | REFERENCE ENTITY | | PAY/RECEIVE
TOTAL
RETURN ON
REFERENCE
ENTITY | | BASE FINANCING
RATE (b) | | TERMINATION
DATE | | | PAYMENT
FREQUENCY | | | NOTIONAL
VALUE | | | NUMBER
OF UNITS | | | UNREALIZED
APPRECIATION
(DEPRECIATION) | |
| | | | | | | | | | | | | | | | | | | | | | |
| A | | MSCI China A Inclusion Index (c) | | Receive | | 1-Month LIBOR USD | | | 6/20/2022 | | | | Term | | | $ | 3,000,005 | | | | 3,046 | | | $ | (240,750 | ) |
| A | | MSCI Daily TR Net Emerging Markets Index (c) | | Receive | | 3-Month LIBOR USD | | | 12/27/2019 | | | | Term | | | | 14,958,671 | | | | 33,860 | | | | 538,192 | |
| A | | MSCI Emerging Markets Index | | Receive | | 1-Month LIBOR USD | | | 6/20/2022 | | | | Term | | | | 14,010,321 | | | | 21,593 | | | | 585,513 | |
| A | | Nan Ya Plastics Corp. | | Receive | | 1-Month LIBOR USD | | | 6/28/2024 | | | | Term | | | | 343,499 | | | | 139,000 | | | | 2,682 | |
| A | | Nanya Technology Corp. | | Receive | | 1-Month LIBOR USD | | | 6/28/2024 | | | | Term | | | | 372,663 | | | | 230,000 | | | | 68,754 | |
| A | | National Industrialization Corp | | Receive | | 1-Month SAIBOR | | | 6/28/2024 | | | | Term | | | | 94,785 | | | | 21,800 | | | | (433 | ) |
| A | | Natura Cosmeticos S.A. | | Receive | | 1-Month LIBOR USD | | | 6/28/2024 | | | | Term | | | | 297,091 | | | | 37,800 | | | | 277,102 | |
| A | | Ncsoft Corp. | | Receive | | 1-Month LIBOR USD | | | 6/28/2024 | | | | Term | | | | 401,743 | | | | 1,202 | | | | 72,937 | |
| C | | Nestle (Malaysia) Berhad | | Receive | | 1-Month LIBOR USD | | | 9/20/2021 | | | | Term | | | | 382,070 | | | | 10,700 | | | | (6,758 | ) |
| C | | NetMarble Corp. | | Receive | | 1-Month LIBOR USD | | | 9/20/2021 | | | | Term | | | | 952 | | | | 10 | | | | (4 | ) |
| A | | New Residential Investment Corp. | | Pay | | 1-Month LIBOR USD | | | 4/2/2029 | | | | Term | | | | 1,666,681 | | | | 100,342 | | | | 142,650 | |
| A | | Nien Made Enterprise Co., Ltd. | | Receive | | 1-Month LIBOR USD | | | 6/28/2024 | | | | Term | | | | 155,010 | | | | 23,000 | | | | 9,343 | |
| A | | Northrop Grumman Corp. | | Pay | | 1-Month LIBOR USD | | | 4/2/2029 | | | | Term | | | | 1,273,044 | | | | 4,198 | | | | — | |
| A | | Novatek Microelectronics Corp. | | Receive | | 1-Month LIBOR USD | | | 6/28/2024 | | | | Term | | | | 393,213 | | | | 105,000 | | | | 163,106 | |
| C | | OCI Co., Ltd. | | Receive | | 1-Month LIBOR USD | | | 9/20/2021 | | | | Term | | | | 2,587 | | | | 26 | | | | (638 | ) |
| A | | Oracle Corp. | | Pay | | 1-Month LIBOR USD | | | 4/2/2029 | | | | Term | | | | 1,799,414 | | | | 33,341 | | | | 134,599 | |
| A | | Orion Corp. | | Receive | | 1-Month LIBOR USD | | | 6/28/2024 | | | | Term | | | | 320,791 | | | | 3,760 | | | | (56,379 | ) |
| A | | PACCAR, Inc. | | Pay | | 1-Month LIBOR USD | | | 4/2/2029 | | | | Term | | | | 1,901,767 | | | | 27,650 | | | | 80,053 | |
| A | | Pegatron Corp. | | Receive | | 1-Month LIBOR USD | | | 6/28/2024 | | | | Term | | | | 52,724 | | | | 32,000 | | | | (4,377 | ) |
| C | | Perusahaan Gas Negara Perser | | Receive | | 1-Month LIBOR USD | | | 9/20/2021 | | | | Term | | | | 168,399 | | | | 1,048,700 | | | | (15,111 | ) |
| A | | Petrobras Distribuidora S.A. | | Receive | | 1-Month LIBOR USD | | | 6/28/2024 | | | | Term | | | | 677,854 | | | | 111,820 | | | | 102,262 | |
| A | | Petroleo Brasileiro S.A. | | Receive | | 1-Month LIBOR USD | | | 6/28/2024 | | | | Term | | | | 807,776 | | | | 157,765 | | | | 315,225 | |
| A | | Petroleo Brasileiro S.A. — Preferred | | Receive | | 1-Month LIBOR USD | | | 6/28/2024 | | | | Term | | | | 807,946 | | | | 138,242 | | | | 104,502 | |
| C | | Petronas Chemicals Group Berhad | | Receive | | 1-Month LIBOR USD | | | 9/20/2021 | | | | Term | | | | 322,308 | | | | 159,200 | | | | (3,279 | ) |
| C | | Petronas Dagangan Berhad | | Receive | | 1-Month LIBOR USD | | | 9/20/2021 | | | | Term | | | | 183,485 | | | | 30,000 | | | | 505 | |
| C | | Petronas Gas Berhad | | Receive | | 1-Month LIBOR USD | | | 9/20/2021 | | | | Term | | | | 192,196 | | | | 45,100 | | | | (2,308 | ) |
| A | | Phison Electronics Corp. | | Receive | | 1-Month LIBOR USD | | | 6/28/2024 | | | | Term | | | | 477,103 | | | | 70,000 | | | | 147,876 | |
| A | | Pitney Bowes, Inc. | | Pay | | 1-Month LIBOR USD | | | 4/2/2029 | | | | Term | | | | 1,472,100 | | | | 210,000 | | | | 699,570 | |
| A | | Porto Seguro S.A. | | Receive | | 1-Month LIBOR USD | | | 6/28/2024 | | | | Term | | | | 515,313 | | | | 47,816 | | | | 170,183 | |
| C | | Posco Chemtech Co., Ltd. | | Receive | | 1-Month LIBOR USD | | | 9/20/2021 | | | | Term | | | | 36,699 | | | | 718 | | | | (4,236 | ) |
| A | | Pou Chen | | Receive | | 1-Month LIBOR USD | | | 6/28/2024 | | | | Term | | | | 181,823 | | | | 165,000 | | | | 2,860 | |
| | | | |
| | The accompanying Notes to the Financial Statements are an integral part of these Financial Statements. | | (Continued) |
| | | | | | | | | | | | | | | | |
| | Elements Portfolios | | | | | | Annual Report | | | | | | May 31, 2019 | | |
| | | | |
93
| | |
| Schedule of Investments | | as of May 31, 2019 |
| | | | |
| ELEMENTS EMERGING MARKETS PORTFOLIO | | | | |
| | | | | | | | | | | | | | | | | | | | | | | | | | |
| | | | | | | | |
| COUNTERPARTY (a) | | REFERENCE ENTITY | | PAY/RECEIVE
TOTAL
RETURN ON
REFERENCE
ENTITY | | BASE FINANCING
RATE (b) | | TERMINATION
DATE | | | PAYMENT
FREQUENCY | | | NOTIONAL
VALUE | | | NUMBER
OF UNITS | | | UNREALIZED
APPRECIATION
(DEPRECIATION) | |
| | | | | | | | | | | | | | | | | | | | | | |
| A | | Powertech Technology Inc. | | Receive | | 1-Month LIBOR USD | | | 6/28/2024 | | | | Term | | | $ | 25,637 | | | | 12,000 | | | $ | 2,188 | |
| A | | PPL Corp. | | Pay | | 1-Month LIBOR USD | | | 4/2/2029 | | | | Term | | | | 2,785,655 | | | | 93,604 | | | | — | |
| A | | President Chain Store Corp. | | Receive | | 1-Month LIBOR USD | | | 6/28/2024 | | | | Term | | | | 624,172 | | | | 72,000 | | | | 83,915 | |
| C | | PT Adaro Energy Tbk | | Receive | | 1-Month LIBOR USD | | | 9/20/2021 | | | | Term | | | | 600,905 | | | | 6,178,400 | | | | (23,621 | ) |
| C | | PT Astra International Tbk | | Receive | | 1-Month LIBOR USD | | | 9/20/2021 | | | | Term | | | | 126,627 | | | | 233,500 | | | | (4,039 | ) |
| C | | PT Bukit Asam Tbk | | Receive | | 1-Month LIBOR USD | | | 9/20/2021 | | | | Term | | | | 806,299 | | | | 2,799,400 | | | | (159,922 | ) |
| C | | PT Charoen Pokphand Indonesia Tbk | | Receive | | 1-Month LIBOR USD | | | 9/20/2021 | | | | Term | | | | 837,142 | | | | 1,845,500 | | | | (209,550 | ) |
| C | | PT Gudang Garam Tbk | | Receive | | 1-Month LIBOR USD | | | 9/20/2021 | | | | Term | | | | 912,903 | | | | 155,900 | | | | (43,445 | ) |
| C | | PT HM Sampoerna Tbk | | Receive | | 1-Month LIBOR USD | | | 9/20/2021 | | | | Term | | | | 190,650 | | | | 743,800 | | | | (9,816 | ) |
| C | | PT Indofood Sukses Makmur Tbk | | Receive | | 1-Month LIBOR USD | | | 9/20/2021 | | | | Term | | | | 12,479 | | | | 28,400 | | | | 640 | |
| C | | PT Jasa Marga (Persero) Tbk | | Receive | | 1-Month LIBOR USD | | | 9/20/2021 | | | | Term | | | | 9,559 | | | | 27,600 | | | | 1,442 | |
| C | | PT Kalbe Farma Tbk | | Receive | | 1-Month LIBOR USD | | | 9/20/2021 | | | | Term | | | | 38,362 | | | | 392,300 | | | | 257 | |
| C | | PT Pakuwon Jati Tbk | | Receive | | 1-Month LIBOR USD | | | 9/20/2021 | | | | Term | | | | 35,640 | | | | 757,700 | | | | 1,729 | |
| C | | PT Semen Indonesia Persero Tbk | | Receive | | 1-Month LIBOR USD | | | 9/20/2021 | | | | Term | | | | 257,567 | | | | 292,100 | | | | (21,892 | ) |
| C | | PT Surya Citra Media Tbk | | Receive | | 1-Month LIBOR USD | | | 9/20/2021 | | | | Term | | | | 389,900 | | | | 3,039,800 | | | | (35,269 | ) |
| C | | PT Unilever Indonesia Tbk | | Receive | | 1-Month LIBOR USD | | | 9/20/2021 | | | | Term | | | | 398,918 | | | | 129,500 | | | | 11,010 | |
| C | | PT United Tractors Tbk | | Receive | | 1-Month LIBOR USD | | | 9/20/2021 | | | | Term | | | | 389,959 | | | | 210,700 | | | | (9,349 | ) |
| A | | Ptt Global Chemical PCL | | Receive | | 1-Month LIBOR USD | | | 6/28/2024 | | | | Term | | | | 127 | | | | 59 | | | | (2,411 | ) |
| A | | Quanta Computer Inc. | | Receive | | 1-Month LIBOR USD | | | 6/28/2024 | | | | Term | | | | 4,605 | | | | 3,000 | | | | 896 | |
| A | | Raia Drogasil S.A. | | Receive | | 1-Month LIBOR USD | | | 6/28/2024 | | | | Term | | | | 71,136 | | | | 4,656 | | | | 10,403 | |
| A | | Raytheon Co. | | Pay | | 1-Month LIBOR USD | | | 4/2/2029 | | | | Term | | | | 7,248,124 | | | | 40,583 | | | | 193,287 | |
| A | | Realtek Semiconductor Corp. | | Receive | | 1-Month LIBOR USD | | | 6/28/2024 | | | | Term | | | | 486,269 | | | | 132,000 | | | | 349,749 | |
| A | | Realty Income Corp. | | Pay | | 1-Month LIBOR USD | | | 4/2/2029 | | | | Term | | | | 2,528,177 | | | | 35,231 | | | | 52,645 | |
| A | | Riyad Bank | | Receive | | 1-Month SAIBOR | | | 6/28/2024 | | | | Term | | | | 10,394 | | | | 1,700 | | | | 1,782 | |
| A | | Robinson PCL | | Receive | | 1-Month LIBOR USD | | | 6/28/2024 | | | | Term | | | | 95,488 | | | | 59,100 | | | | 5,891 | |
| A | | Ruentex Development Co Ltd | | Receive | | 1-Month LIBOR USD | | | 6/28/2024 | | | | Term | | | | 43,795 | | | | 30,000 | | | | (5,725 | ) |
| A | | S-1 Corporation | | Receive | | 1-Month LIBOR USD | | | 6/28/2024 | | | | Term | | | | 156,770 | | | | 1,953 | | | | (7,541 | ) |
| C | | S-1 Corporation | | Receive | | 1-Month LIBOR USD | | | 9/20/2021 | | | | Term | | | | 7,741 | | | | 100 | | | | 326 | |
| A | | Samba Financial Group | | Receive | | 1-Month SAIBOR | | | 6/28/2024 | | | | Term | | | | 86,278 | | | | 9,000 | | | | (1,015 | ) |
| C | | Samsung C&T Corp. | | Receive | | 1-Month LIBOR USD | | | 9/20/2021 | | | | Term | | | | 45,233 | | | | 457 | | | | (9,887 | ) |
| C | | Samsung Electronics Co., Ltd. — Preferred | | Receive | | 1-Month LIBOR USD | | | 9/20/2021 | | | | Term | | | | 84,656 | | | | 2,982 | | | | 2,748 | |
| | | | |
| | The accompanying Notes to the Financial Statements are an integral part of these Financial Statements. | | (Continued) |
| | | | | | | | | | | | | | | | |
| | Elements Portfolios | | | | | | Annual Report | | | | | | May 31, 2019 | | |
| | | | |
94
| | |
| Schedule of Investments | | as of May 31, 2019 |
| | | | |
| ELEMENTS EMERGING MARKETS PORTFOLIO | | | | |
| | | | | | | | | | | | | | | | | | | | | | | | | | |
| | | | | | | | |
| COUNTERPARTY (a) | | REFERENCE ENTITY | | PAY/RECEIVE
TOTAL
RETURN ON
REFERENCE
ENTITY | | BASE FINANCING
RATE (b) | | TERMINATION
DATE | | | PAYMENT
FREQUENCY | | | NOTIONAL
VALUE | | | NUMBER
OF UNITS | | | UNREALIZED
APPRECIATION
(DEPRECIATION) | |
| | | | | �� | | | | | | | | | | | | | | | | | |
| C | | Samsung Engineering Co., Ltd. | | Receive | | 1-Month LIBOR USD | | | 9/20/2021 | | | | Term | | | $ | 73,296 | | | | 4,451 | | | $ | (11,958 | ) |
| C | | Samsung Fire & Marine Insurance Co., Ltd. | | Receive | | 1-Month LIBOR USD | | | 9/20/2021 | | | | Term | | | | 53,792 | | | | 223 | | | | (2,006 | ) |
| A | | Saudi Airlines Catering Co. | | Receive | | 1-Month SAIBOR | | | 6/28/2024 | | | | Term | | | | 214,591 | | | | 9,738 | | | | 2,868 | |
| A | | Saudi Arabian Fertilizer Co. | | Receive | | 1-Month SAIBOR | | | 6/28/2024 | | | | Term | | | | 163,633 | | | | 7,877 | | | | 3,383 | |
| A | | Saudi Basic Industries Corp. | | Receive | | 1-Month SAIBOR | | | 6/28/2024 | | | | Term | | | | 2,878,827 | | | | 92,810 | | | | (99,349 | ) |
| A | | Saudi Industrial Investment Group | | Receive | | 1-Month SAIBOR | | | 6/28/2024 | | | | Term | | | | 386,438 | | | | 55,982 | | | | (28,416 | ) |
| A | | Saudi Telecom Co. | | Receive | | 1-Month SAIBOR | | | 6/28/2024 | | | | Term | | | | 1,138,180 | | | | 41,017 | | | | (18,460 | ) |
| A | | Savola | | Receive | | 1-Month SAIBOR | | | 6/28/2024 | | | | Term | | | | 38,612 | | | | 4,522 | | | | 1,598 | |
| C | | Sime Darby Berhad | | Receive | | 1-Month LIBOR USD | | | 9/20/2021 | | | | Term | | | | 30,211 | | | | 56,200 | | | | 838 | |
| A | | Sinopac Financial Holdings | | Receive | | 1-Month LIBOR USD | | | 6/28/2024 | | | | Term | | | | 270,268 | | | | 910,013 | | | | 88,683 | |
| C | | SK Hynix Inc. | | Receive | | 1-Month LIBOR USD | | | 9/20/2021 | | | | Term | | | | 256,823 | | | | 4,746 | | | | 4,718 | |
| A | | Spirit AeroSystems Holdings, Inc. | | Pay | | 1-Month LIBOR USD | | | 4/2/2029 | | | | Term | | | | 2,344,444 | | | | 27,650 | | | | 112,387 | |
| A | | Standard Foods Corp. | | Receive | | 1-Month LIBOR USD | | | 6/28/2024 | | | | Term | | | | 146,747 | | | | 84,840 | | | | 13,281 | |
| A | | Suzano Papel e Celulose S.A. | | Receive | | 1-Month LIBOR USD | | | 6/28/2024 | | | | Term | | | | 39,793 | | | | 3,300 | | | | 6,028 | |
| A | | Synnex Technology International Corp. | | Receive | | 1-Month LIBOR USD | | | 6/28/2024 | | | | Term | | | | 332,146 | | | | 299,000 | | | | 35,437 | |
| A | | Taiwan Business Bank | | Receive | | 1-Month LIBOR USD | | | 6/28/2024 | | | | Term | | | | 242,116 | | | | 722,000 | | | | 49,401 | |
| A | | Taiwan Cement | | Receive | | 1-Month LIBOR USD | | | 6/28/2024 | | | | Term | | | | 237,711 | | | | 217,500 | | | | 53,982 | |
| A | | Taiwan Mobile Co., Ltd. | | Receive | | 1-Month LIBOR USD | | | 6/28/2024 | | | | Term | | | | 370,522 | | | | 105,000 | | | | 16,135 | |
| A | | Telefonica Brasil S.A. — Preferred | | Receive | | 1-Month LIBOR USD | | | 6/28/2024 | | | | Term | | | | 620,668 | | | | 50,574 | | | | 18,152 | |
| C | | Telekomunikasi Indonesia Persero | | Receive | | 1-Month LIBOR USD | | | 9/20/2021 | | | | Term | | | | 125,819 | | | | 469,800 | | | | 2,196 | |
| A | | Thai Oil PCL | | Receive | | 1-Month LIBOR USD | | | 6/28/2024 | | | | Term | | | | 75 | | | | 31 | | | | (2,081 | ) |
| A | | The PNC Financial Services Group Inc. | | Pay | | 1-Month LIBOR USD | | | 4/2/2029 | | | | Term | | | | 5,676,625 | | | | 44,596 | | | | (19,963 | ) |
| A | | Tim Participacoes S.A. | | Receive | | 1-Month LIBOR USD | | | 6/28/2024 | | | | Term | | | | 691,581 | | | | 202,819 | | | | (129,585 | ) |
| A | | Ultrapar Participacoes S.A. | | Receive | | 1-Month LIBOR USD | | | 6/28/2024 | | | | Term | | | | 63,601 | | | | 9,680 | | | | (12,575 | ) |
| A | | Uni-President Enterprises Co. | | Receive | | 1-Month LIBOR USD | | | 6/28/2024 | | | | Term | | | | 716,163 | | | | 352,000 | | | | 206,107 | |
| A | | United Microelectronics Corp. | | Receive | | 1-Month LIBOR USD | | | 6/28/2024 | | | | Term | | | | 94,295 | | | | 258,000 | | | | 9,531 | |
| A | | Vale S.A. | | Receive | | 1-Month LIBOR USD | | | 6/28/2024 | | | | Term | | | | 807,961 | | | | 71,040 | | | | 91,659 | |
| A | | Vanguard International Semiconductor Corp. | | Receive | | 1-Month LIBOR USD | | | 6/28/2024 | | | | Term | | | | 141,890 | | | | 80,000 | | | | 7,919 | |
| A | | Ventas, Inc. | | Pay | | 1-Month LIBOR USD | | | 4/2/2029 | | | | Term | | | | 6,806,270 | | | | 107,000 | | | | (44,544 | ) |
| | | | |
| | The accompanying Notes to the Financial Statements are an integral part of these Financial Statements. | | (Continued) |
| | | | | | | | | | | | | | | | |
| | Elements Portfolios | | | | | | Annual Report | | | | | | May 31, 2019 | | |
| | | | |
95
| | |
| Schedule of Investments | | as of May 31, 2019 |
| | | | |
| ELEMENTS EMERGING MARKETS PORTFOLIO | | | | |
| | | | | | | | | | | | | | | | | | | | | | | | | | |
| | | | | | | | |
| COUNTERPARTY (a) | | REFERENCE ENTITY | | PAY/RECEIVE
TOTAL
RETURN ON
REFERENCE
ENTITY | | BASE FINANCING
RATE (b) | | TERMINATION
DATE | | | PAYMENT
FREQUENCY | | | NOTIONAL
VALUE | | | NUMBER
OF UNITS | | | UNREALIZED
APPRECIATION
(DEPRECIATION) | |
| | | | | | | | | | | | | | | | | | | | | | |
| A | | WABCO Holdings, Inc. | | Pay | | 1-Month LIBOR USD | | | 4/2/2029 | | | | Term | | | $ | 1,782,886 | | | | 13,379 | | | $ | 38,057 | |
| A | | Walgreens Boots Alliance, Inc. | | Pay | | 1-Month LIBOR USD | | | 4/2/2029 | | | | Term | | | | 3,280,830 | | | | 59,500 | | | | 328,882 | |
| A | | Wells Fargo & Co. | | Pay | | 1-Month LIBOR USD | | | 4/2/2029 | | | | Term | | | | 6,372,510 | | | | 133,344 | | | | 419,679 | |
| A | | Welltower, Inc. | | Pay | | 1-Month LIBOR USD | | | 4/2/2029 | | | | Term | | | | 11,335,440 | | | | 146,000 | | | | (600,926 | ) |
| A | | Winbond Electronics Corp. | | Receive | | 1-Month LIBOR USD | | | 6/28/2024 | | | | Term | | | | 11,688 | | | | 26,000 | | | | (141 | ) |
| A | | Wistron Corp. | | Receive | | 1-Month LIBOR USD | | | 6/28/2024 | | | | Term | | | | 416 | | | | 480 | | | | (80 | ) |
| A | | WPG Holdings Ltd. | | Receive | | 1-Month LIBOR USD | | | 6/28/2024 | | | | Term | | | | 31,997 | | | | 27,320 | | | | 1,070 | |
| A | | Yageo Corporation | | Receive | | 1-Month LIBOR USD | | | 6/28/2024 | | | | Term | | | | 166,685 | | | | 16,000 | | | | (37,058 | ) |
| A | | Yanbu National Petrochemical | | Receive | | 1-Month SAIBOR | | | 6/28/2024 | | | | Term | | | | 419,955 | | | | 23,394 | | | | (20,021 | ) |
| A | | Yum China Holdings, Inc. | | Pay | | 1-Month LIBOR USD | | | 4/2/2029 | | | | Term | | | | 2,391,634 | | | | 54,854 | | | | 199,218 | |
| A | | Zhen Ding Technology Holding | | Receive | | 1-Month LIBOR USD | | | 6/28/2024 | | | | Term | | | | 352,100 | | | | 141,000 | | | | 56,204 | |
| A | | Zoetis, Inc. | | Pay | | 1-Month LIBOR USD | | | 4/2/2029 | | | | Term | | | | 9,999,920 | | | | 98,000 | | | | 123,975 | |
| | | | | | | | | | | | | | | | | | | | | | | | | | |
| | | | | | | | | | | | | | | | $ | 225,923,291 | | | | | | | $ | 9,739,691 | |
| | | | | | | | | | | | | | | | | | | | | | | | | | |
| | | |
| Swaps on Futures | | | | | | | | | | | | | |
| | | | | | | | |
| COUNTERPARTY (a) | | REFERENCE ENTITY | | PAY/RECEIVE
TOTAL
RETURN ON
REFERENCE
ENTITY | | BASE FINANCING
RATE | | TERMINATION
DATE | | | PAYMENT
FREQUENCY | | | NOTIONAL
VALUE | | | NUMBER
OF UNITS | | | UNREALIZED
APPRECIATION | |
| B | | RTS Index Future — June 2019 Expiration | | Receive | | N/A | | | 6/20/2019 | | | | Term | | | $ | 4,682,278 | | | | 1,949 | | | $ | 253,370 | |
| | | | | | | | | | | | | | | | | | | | | | | | | | |
| | | | | | | | | | | | | | | | $ | 4,682,278 | | | | | | | $ | 253,370 | |
| | | | | | | | | | | | | | | | | | | | | | | | | | |
| | | | | | | | | | | | | | | | | | | | | | | | $ | 9,993,061 | |
| | | | | | | | | | | | | | | | | | | | | | | | | | |
| (b) | The swaps accrue financing fees according to the relevant base financing rate which resets periodically, plus a fixed spread. |
| (c) | Value determined using significant unobservable inputs. |
| | | | |
| | The accompanying Notes to the Financial Statements are an integral part of these Financial Statements. | | |
| | | | | | | | | | | | | | | | |
| | Elements Portfolios | | | | | | Annual Report | | | | | | May 31, 2019 | | |
| | | | |
96
| | |
| Statement of Assets and Liabilities | | May 31, 2019 |
| | | | | | | | |
| | |
| | | ELEMENTS
U.S. PORTFOLIO | | | ELEMENTS
U.S. SMALL CAP
PORTFOLIO | |
| | |
| ASSETS: | | | | | | | | |
Investments, at fair value(1)(2) | | $ | 966,076,849 | | | $ | 370,979,116 | |
Dividends and interest receivable | | | 1,829,826 | | | | 321,741 | |
Receivable for fund shares sold | | | 1,449,308 | | | | 1,029,464 | |
Receivable from Adviser | | | 25,791 | | | | 45,332 | |
Receivable for investments sold | | | 21,715 | | | | 3,733,780 | |
Securities lending income receivable | | | 4,421 | | | | 14,951 | |
Cash | | | 2,980 | | | | 2,033 | |
Receivable for swaps sold | | | — | | | | 21,703 | |
Cash collateral segregated for swaps | | | — | | | | 610,000 | |
Other assets | | | 30,926 | | | | 26,853 | |
| | |
| Total assets | | | 969,441,816 | | | | 376,784,973 | |
| | |
| LIABILITIES: | | | | | | | | |
Payable for securities on loan | | | 14,771,272 | | | | 15,983,788 | |
Payable for fund shares redeemed | | | 446,707 | | | | 13,329 | |
Variation margin payable for futures | | | 259,940 | | | | 209,094 | |
Accrued distribution fees | | | 79,741 | | | | 30,109 | |
Payable to custodian | | | 5,556 | | | | 2,011 | |
Unrealized depreciation on swap contracts | | | — | | | | 285,670 | |
Payable for investment securities purchased | | | — | | | | 3,780,619 | |
Payable for swaps purchased | | | — | | | | 358,470 | |
Other accrued expenses | | | 194,034 | | | | 164,501 | |
| | |
| Total liabilities | | | 15,757,250 | | | | 20,827,591 | |
| | |
| Total net assets | | $ | 953,684,566 | | | $ | 355,957,382 | |
| | | | | | | | | |
| | |
| NET ASSETS CONSIST OF: | | | | | | | | |
Capital stock | | $ | 842,144,464 | | | $ | 337,980,275 | |
Total distributable earnings | | | 111,540,102 | | | | 17,977,107 | |
| | |
| Total net assets | | $ | 953,684,566 | | | $ | 355,957,382 | |
| | | | | | | | | |
| | |
| Class M | | | | | | | | |
Net Assets | | $ | 897,791,561 | | | $ | 331,856,257 | |
Shares outstanding | | | 78,360,141 | | | | 32,927,797 | |
Class M Net asset value, offering and redemption price per share | | $ | 11.46 | | | $ | 10.08 | |
| | |
| Class Y | | | | | | | | |
Net Assets | | $ | 55,893,005 | | | $ | 24,101,125 | |
Shares outstanding | | | 4,879,711 | | | | 2,391,077 | |
Class Y Net asset value, offering and redemption price per share | | $ | 11.45 | | | $ | 10.08 | |
| | | | | | | | | |
(1) Cost of Investments | | $ | 857,103,086 | | | $ | 318,103,975 | |
(2) Fair value of securities out on loan | | | 14,448,186 | | | | 15,262,927 | |
| | | | |
| | The accompanying Notes to the Financial Statements are an integral part of these Financial Statements. | | (Continued) |
| | | | | | | | | | | | | | | | |
| | Elements Portfolios | | | | | | Annual Report | | | | | | May 31, 2019 | | |
| | | | |
97
| | |
| Statement of Assets and Liabilities | | May 31, 2019 |
| | | | | | | | |
| | |
| | | ELEMENTS
INTERNATIONAL
PORTFOLIO | | | ELEMENTS
INTERNATIONAL
SMALL CAP
PORTFOLIO | |
| | |
| ASSETS: | | | | | | | | |
Investments, at fair value(1)(2) | | $ | 614,587,286 | | | $ | 310,985,785 | |
Receivable for investments sold | | | 28,597,177 | | | | 28,391,720 | |
Unrealized appreciation on swap contracts | | | 14,799,845 | | | | 8,196,615 | |
Dividends and interest receivable | | | 3,485,872 | | | | 1,631,410 | |
Cash | | | 1,654,072 | | | | 6,445,781 | |
Receivable for fund shares sold | | | 1,450,604 | | | | 997,500 | |
Foreign currencies, at value(3) | | | 1,366,113 | | | | 947,811 | |
Receivable for swaps sold | | | 1,328,320 | | | | 2,492,895 | |
Variation margin receivable for futures | | | 354,667 | | | | 59,506 | |
Spot trade receivable | | | 317,000 | | | | 1,918,765 | |
Receivable from Adviser | | | 65,405 | | | | 85,706 | |
Securities lending income receivable | | | 35,171 | | | | 17,796 | |
Receivable for return of capital | | | 18,176 | | | | 37,389 | |
Other assets | | | 7,969 | | | | 9,408 | |
| | |
| Total assets | | | 668,067,677 | | | | 362,218,087 | |
| | |
| LIABILITIES: | | | | | | | | |
Payable for investment securities purchased | | | 31,164,782 | | | | 31,701,580 | |
Payable for securities on loan | | | 21,416,215 | | | | 15,053,882 | |
Due to broker | | | 11,997,547 | | | | 6,486,865 | |
Unrealized depreciation on swap contracts | | | 3,795,700 | | | | 3,084,182 | |
Payable for swaps purchased | | | 528,469 | | | | 390,187 | |
Spot trade payable | | | 318,870 | | | | 1,917,489 | |
Payable for fund shares redeemed | | | 103,155 | | | | 24,923 | |
Payable to custodian | | | 80,418 | | | | 118,586 | |
Accrued distribution fees | | | 52,457 | | | | 27,329 | |
Other accrued expenses | | | 200,907 | | | | 136,655 | |
| | |
| Total liabilities | | | 69,658,520 | | | | 58,941,678 | |
| | |
| Total net assets | | $ | 598,409,157 | | | $ | 303,276,409 | |
| | | | | | | | | |
| | |
| NET ASSETS CONSIST OF: | | | | | | | | |
Capital stock | | $ | 641,073,791 | | | $ | 332,244,330 | |
Total distributable earnings | | | (42,664,634 | ) | | | (28,967,921 | ) |
| | |
| Total net assets | | $ | 598,409,157 | | | $ | 303,276,409 | |
| | | | | | | | | |
| | |
| Class M | | | | | | | | |
Net Assets | | $ | 598,369,852 | | | $ | 303,258,509 | |
Shares outstanding | | | 61,454,935 | | | | 31,826,335 | |
Class M Net asset value, offering and redemption price per share | | $ | 9.74 | | | $ | 9.53 | |
| | |
| Class Y | | | | | | | | |
Net Assets | | $ | 39,305 | | | $ | 17,900 | |
Shares outstanding | | | 4,033 | | | | 1,878 | |
Class Y Net asset value, offering and redemption price per share | | $ | 9.75 | | | $ | 9.53 | |
| | | | | | | | | |
(1) Cost of Investments | | $ | 616,579,831 | | | $ | 321,478,086 | |
(2) Fair value of securities out on loan | | | 13,118,025 | | | | 11,486,646 | |
(3) Cost of foreign currencies | | | 1,392,767 | | | | 1,445,241 | |
| | | | |
| | The accompanying Notes to the Financial Statements are an integral part of these Financial Statements. | | (Continued) |
| | | | | | | | | | | | | | | | |
| | Elements Portfolios | | | | | | Annual Report | | | | | | May 31, 2019 | | |
| | | | |
98
| | |
| Statement of Assets and Liabilities | | May 31, 2019 |
| | | | |
| |
| | | ELEMENTS
EMERGING
MARKETS
PORTFOLIO | |
| |
| ASSETS: | | | | |
Investments, at fair value(1)(2) | | $ | 367,302,545 | |
Receivable for investments sold | | | 54,518,961 | |
Unrealized appreciation on swap contracts | | | 13,316,342 | |
Spot trade receivable | | | 8,704,217 | |
Cash | | | 4,054,690 | |
Receivable for fund shares sold | | | 1,640,272 | |
Receivable for swaps sold | | | 1,745,696 | |
Cash collateral segregated for swaps | | | 1,434,076 | |
Foreign currencies, at value(3) | | | 1,416,590 | |
Dividends and interest receivable | | | 777,037 | |
Variation margin receivable for futures | | | 409,875 | |
Receivable from Adviser | | | 34,894 | |
Securities lending income receivable | | | 2,315 | |
Other assets | | | 76,273 | |
| |
| Total assets | | | 455,433,783 | |
| |
| LIABILITIES: | | | | |
Payable for investment securities purchased | | | 40,608,971 | |
Payable for securities on loan | | | 24,777,588 | |
Due to broker | | | 13,608,901 | |
Spot trade payable | | | 8,700,708 | |
Unrealized depreciation on swap contracts | | | 3,323,281 | |
Payable for swaps purchased | | | 2,930,256 | |
Payable to custodian | | | 31,638 | |
Accrued distribution fees | | | 30,677 | |
Payable for fund shares redeemed | | | 14,429 | |
Other accrued expenses | | | 114,234 | |
| |
| Total liabilities | | | 94,140,683 | |
| |
| Total net assets | | $ | 361,293,100 | |
| | | | | |
| |
| NET ASSETS CONSIST OF: | | | | |
Capital stock | | $ | 384,647,706 | |
Total distributable earnings | | | (23,354,606 | ) |
| |
| Total net assets | | $ | 361,293,100 | |
| | | | | |
| |
| Class M | | | | |
Net Assets | | $ | 361,249,740 | |
Shares outstanding | | | 38,216,288 | |
Class M Net asset value, offering and redemption price per share | | $ | 9.45 | |
| |
| Class Y | | | | |
Net Assets | | $ | 43,360 | |
Shares outstanding | | | 4,588 | |
Class Y Net asset value, offering and redemption price per share | | $ | 9.45 | |
| | | | | |
(1) Cost of Investments | | $ | 369,685,357 | |
(2) Fair value of securities out on loan | | | 12,733,132 | |
(3) Cost of foreign currencies | | | 1,419,413 | |
| | | | |
| | The accompanying Notes to the Financial Statements are an integral part of these Financial Statements. | | |
| | | | | | | | | | | | | | | | |
| | Elements Portfolios | | | | | | Annual Report | | | | | | May 31, 2019 | | |
| | | | |
99
| | |
| Statement of Operations | | For the Year Ended May 31, 2019 |
| | | | | | | | |
| | |
| | | ELEMENTS
U.S. PORTFOLIO | | | ELEMENTS
U.S. SMALL CAP
PORTFOLIO | |
| | |
| INVESTMENT INCOME: | | | | | | | | |
Dividend income | | $ | 16,927,051 | | | $ | 7,018,317 | |
Interest income | | | 692,834 | | | | 358,021 | |
Securities lending income | | | 30,268 | | | | 187,459 | |
| | |
| Total investment income | | | 17,650,153 | | | | 7,563,797 | |
| | |
| EXPENSES: | | | | | | | | |
Advisory fees (See Note 4) | | | 3,000,478 | | | | 2,357,618 | |
Distribution(12b-1) fees | | | 988,901 | | | | 466,467 | |
Fund accounting and administration fees | | | 161,644 | | | | 164,753 | |
Legal fees | | | 105,194 | | | | 62,241 | |
Transfer agency fees and expenses | | | 79,274 | | | | 51,603 | |
Federal and state registration fees | | | 67,122 | | | | 65,796 | |
Audit and tax related fees | | | 59,414 | | | | 53,939 | |
Custody fees | | | 50,194 | | | | 24,396 | |
Chief Compliance Officer compensation | | | 45,100 | | | | 45,100 | |
Trustees fees and expenses | | | 37,345 | | | | 19,347 | |
Other expenses | | | 110,150 | | | | 92,924 | |
| | |
| Total expenses before Adviser waiver | | | 4,704,816 | | | | 3,404,184 | |
Expenses waived by Adviser (See Note 4) | | | (3,201,622 | ) | | | (2,690,641 | ) |
| | |
| Total net expenses | | | 1,503,194 | | | | 713,543 | |
| | |
| Net investment income | | | 16,146,959 | | | | 6,850,254 | |
| | |
| NET REALIZED AND UNREALIZED GAIN (LOSS): | | | | | | | | |
| Net realized gain (loss) on: | | | | | | | | |
Investments | | | (5,487,904 | ) | | | (32,170,506 | ) |
Futures contracts | | | 8,361,860 | | | | 1,547,034 | |
Swap contracts | | | (4,284,341 | ) | | | (2,480,078 | ) |
| Net change in unrealized appreciation (depreciation) on: | | | | | | | | |
Investments | | | 4,218,559 | | | | (21,938,124 | ) |
Futures contracts | | | 296,089 | | | | (1,866,472 | ) |
Swap contracts | | | (207,850 | ) | | | 658,909 | |
| | |
| Net realized and unrealized gain (loss) | | | 2,896,413 | | | | (56,249,237 | ) |
| | |
| Net increase (decrease) in net assets resulting from operations | | $ | 19,043,372 | | | $ | (49,398,983 | ) |
| | | | | | | | | |
| | | | |
| | The accompanying Notes to the Financial Statements are an integral part of these Financial Statements. | | (Continued) |
| | | | | | | | | | | | | | | | |
| | Elements Portfolios | | | | | | Annual Report | | | | | | May 31, 2019 | | |
| | | | |
100
| | |
| Statement of Operations | | For the Year Ended May 31, 2019 |
| | | | | | | | |
| | |
| | | ELEMENTS
INTERNATIONAL
PORTFOLIO | | | ELEMENTS
INTERNATIONAL
SMALL CAP
PORTFOLIO | |
| | |
| INVESTMENT INCOME: | | | | | | | | |
Dividend income | | $ | 15,586,605 | | | $ | 6,510,160 | |
Interest income | | | 565,777 | | | | 474,912 | |
Securities lending income | | | 152,920 | | | | 205,838 | |
| | |
| Total investment income | | | 16,305,302 | | | | 7,190,910 | |
| | |
| EXPENSES: | | | | | | | | |
Advisory fees (See Note 4) | | | 2,829,353 | | | | 1,454,333 | |
Distribution(12b-1) fees | | | 628,721 | | | | 264,398 | |
Custody fees | | | 254,173 | | | | 318,471 | |
Fund accounting and administration fees | | | 228,806 | | | | 220,710 | |
Federal and state registration fees | | | 97,030 | | | | 91,031 | |
Transfer agency fees and expenses | | | 83,993 | | | | 22,590 | |
Legal fees | | | 67,172 | | | | 30,159 | |
Audit and tax related fees | | | 59,854 | | | | 59,854 | |
Chief Compliance Officer compensation | | | 45,100 | | | | 45,100 | |
Trustees fees and expenses | | | 23,585 | | | | 9,167 | |
Other expenses | | | 111,057 | | | | 88,647 | |
| | |
| Total expenses before Adviser waiver | | | 4,428,844 | | | | 2,604,460 | |
Expenses waived by Adviser (See Note 4) | | | (3,141,526 | ) | | | (2,056,149 | ) |
| | |
| Total net expenses | | | 1,287,318 | | | | 548,311 | |
| | |
| Net investment income | | | 15,017,984 | | | | 6,642,599 | |
| | |
| NET REALIZED AND UNREALIZED GAIN (LOSS): | | | | | | | | |
| Net realized gain (loss) on: | | | | | | | | |
Investments | | | (37,018,639 | ) | | | (20,702,145 | ) |
Foreign currency translation | | | (428,661 | ) | | | (186,473 | ) |
Forward currency contracts | | | 1,709 | | | | — | |
Futures contracts | | | (13,465,217 | ) | | | (4,550,693 | ) |
Securities sold short | | | 967 | | | | (128 | ) |
Swap contracts | | | (11,973,116 | ) | | | (2,582,526 | ) |
| Net change in unrealized appreciation (depreciation) on: | | | | | | | | |
Investments | | | (21,594,403 | ) | | | (20,482,875 | ) |
Foreign currency translation | | | 18,636 | | | | 20,869 | |
Futures contracts | | | 464,698 | | | | (564,736 | ) |
Securities sold short | | | (404 | ) | | | — | |
Swap contracts | | | 5,056,788 | | | | 2,992,898 | |
| | |
| Net realized and unrealized loss | | | (78,937,642 | ) | | | (46,055,809 | ) |
| | |
| Net decrease in net assets resulting from operations | | $ | (63,919,658 | ) | | $ | (39,413,210 | ) |
| | | | | | | | | |
| | | | |
| | The accompanying Notes to the Financial Statements are an integral part of these Financial Statements. | | (Continued) |
| | | | | | | | | | | | | | | | |
| | Elements Portfolios | | | | | | Annual Report | | | | | | May 31, 2019 | | |
| | | | |
101
| | |
| Statement of Operations | | For the Year Ended May 31, 2019 |
| | | | |
| |
| | | ELEMENTS
EMERGING
MARKETS
PORTFOLIO | |
| |
| INVESTMENT INCOME: | | | | |
Dividend income | | $ | 7,689,165 | |
Interest income | | | 507,037 | |
Securities lending income | | | 49,510 | |
| |
| Total investment income | | | 8,245,712 | |
| |
| EXPENSES: | | | | |
Advisory fees (See Note 4) | | | 1,844,919 | |
Distribution(12b-1) fees | | | 307,463 | |
Fund accounting and administration fees | | | 156,263 | |
Custody fees | | | 102,631 | |
Federal and state registration fees | | | 97,891 | |
Audit and tax related fees | | | 59,854 | |
Transfer agency fees and expenses | | | 46,242 | |
Chief Compliance Officer compensation | | | 45,100 | |
Legal fees | | | 35,187 | |
Trustees fees and expenses | | | 10,577 | |
Other expenses | | | 112,382 | |
| |
| Total expenses before Adviser waiver | | | 2,818,509 | |
Expenses waived by Adviser (See Note 4) | | | (2,139,074 | ) |
| |
| Total net expenses | | | 679,435 | |
| |
| Net investment income | | | 7,566,277 | |
| |
| NET REALIZED AND UNREALIZED GAIN (LOSS): | | | | |
| Net realized loss on: | | | | |
Investments | | | 221,908 | |
Foreign currency translation | | | (149,334 | ) |
Forward currency contracts | | | (272,106 | ) |
Futures contracts | | | (23,521,147 | ) |
Swap contracts | | | (15,242,980 | ) |
| Net change in unrealized appreciation (depreciation) on: | | | | |
Investments | | | (10,746,579 | ) |
Foreign currency translation | | | 11,218 | |
Forward currency contracts | | | 226,152 | |
Futures contracts | | | 7,108,945 | |
Swap contracts | | | 8,716,195 | |
| |
| Net realized and unrealized loss | | | (33,647,728 | ) |
| |
| Net decrease in net assets resulting from operations | | $ | (26,081,451 | ) |
| | | | | |
| | | | |
| | The accompanying Notes to the Financial Statements are an integral part of these Financial Statements. | | |
| | | | | | | | | | | | | | | | |
| | Elements Portfolios | | | | | | Annual Report | | | | | | May 31, 2019 | | |
| | | | |
102
| | |
| Statement of Changes in Net Assets | | |
| | | | | | | | | | | | | | | | |
| | |
| | | ELEMENTS U.S. PORTFOLIO | | | ELEMENTS U.S.
SMALL CAP PORTFOLIO | |
| | | | |
| | | YEAR
ENDED
MAY 31, 2019 | | | YEAR
ENDED
MAY 31, 2018 | | | YEAR
ENDED
MAY 31, 2019 | | | YEAR
ENDED
MAY 31, 2018 | |
| | | | |
| OPERATIONS: | | | | | | | | | | | | | | | | |
Net investment income | | $ | 16,146,959 | | | $ | 11,729,421 | | | $ | 6,850,254 | | | $ | 6,991,516 | |
| Net realized gain (loss) on: | | | | | | | | | | | | | | | | |
Investments | | | (5,487,904 | ) | | | (4,763,430 | ) | | | (32,170,506 | ) | | | (8,499,638 | ) |
Futures contracts | | | 8,361,860 | | | | 3,772,940 | | | | 1,547,034 | | | | 3,965,977 | |
Swap contracts | | | (4,284,341 | ) | | | (2,070,903 | ) | | | (2,480,078 | ) | | | 1,405,729 | |
| Net change in unrealized appreciation (depreciation) on: | | | | | | | | | | | | | | | | |
Investments | | | 4,218,559 | | | | 96,802,468 | | | | (21,938,124 | ) | | | 77,995,649 | |
Futures contracts | | | 296,089 | | | | (1,104,790 | ) | | | (1,866,472 | ) | | | 976,298 | |
Swap contracts | | | (207,850 | ) | | | 207,850 | | | | 658,909 | | | | (944,579 | ) |
Net increase (decrease) in net assets resulting from operations | | | 19,043,372 | | | | 104,573,556 | | | | (49,398,983 | ) | | | 81,890,952 | |
| | | | |
| DISTRIBUTIONS TO SHAREHOLDERS: | | | | | | | | | | | | | | | | |
Net dividends and distributions — Class M(1) | | | (13,665,103 | ) | | | (8,149,280 | ) | | | (6,907,090 | ) | | | (5,618,678 | ) |
Net dividends and distributions — Class Y | | | — | | | | — | | | | — | | | | — | |
Total distributions | | | (13,665,103 | ) | | | (8,149,280 | ) | | | (6,907,090 | ) | | | (5,618,678 | ) |
| | | | |
| CAPITAL SHARE TRANSACTIONS: | | | | | | | | | | | | | | | | |
Proceeds from shares sold — Class M | | | 377,868,263 | | | | 274,412,617 | | | | 114,949,889 | | | | 116,390,890 | |
Proceeds from shares sold — Class Y | | | 78,343,721 | | | | — | | | | 35,546,789 | | | | — | |
Proceeds from shares issued to holders in reinvestment of dividends —Class M | | | 13,023,486 | | | | 7,685,699 | | | | 6,490,196 | | | | 4,316,415 | |
Proceeds from shares issued to holders in reinvestment of dividends — Class Y | | | — | | | | — | | | | — | | | | — | |
Cost of shares redeemed — Class M | | | (432,273,423 | ) | | | (63,253,906 | ) | | | (259,800,613 | ) | | | (95,015,674 | ) |
Cost of shares redeemed — Class Y | | | (20,000,015 | ) | | | — | | | | (10,000,000 | ) | | | — | |
Net increase (decrease) in net assets from capital share transactions | | | 16,962,032 | | | | 218,844,410 | | | | (112,813,739 | ) | | | 25,691,631 | |
| Total increase (decrease) in net assets | | | 22,340,301 | | | | 315,268,686 | | | | (169,119,812 | ) | | | 101,963,905 | |
| | | | |
| NET ASSETS: | | | | | | | | | | | | | | | | |
Beginning of year | | | 931,344,265 | | | | 616,075,579 | | | | 525,077,194 | | | | 423,113,289 | |
| | | | |
| End of year | | $ | 953,684,566 | | | $ | 931,344,265 | * | | $ | 355,957,382 | | | $ | 525,077,194 | * |
| | | | | | | | | | | | | | | | | |
| | (1) | | Includes net investment income distributions of $7,729,315 and $4,813,383 and net realized gain distributions of $419,965 and $805,295 for the year ended May 31, 2018, for Class M of the Elements U.S. Portfolio and Elements U.S. Small Cap Portfolio, respectively. |
| | * | | Includes accumulated net investment income of $5,397,854 and $2,902,854 for the year ended May 31, 2018, for Elements U.S. Portfolio and Elements U.S. Small Cap Portfolio, respectively. |
| | | | |
| | The accompanying Notes to the Financial Statements are an integral part of these Financial Statements. | | (Continued) |
| | | | | | | | | | | | | | | | |
| | Elements Portfolios | | | | | | Annual Report | | | | | | May 31, 2019 | | |
| | | | |
103
| | |
| Statement of Changes in Net Assets | | |
| | | | | | | | | | | | | | | | |
| | |
| | | ELEMENTS
INTERNATIONAL
PORTFOLIO | | | ELEMENTS
INTERNATIONAL
SMALL CAP PORTFOLIO | |
| | | | |
| | | YEAR
ENDED
MAY 31, 2019 | | | YEAR
ENDED
MAY 31, 2018 | | | YEAR
ENDED
MAY 31, 2019 | | | YEAR
ENDED
MAY 31, 2018 | |
| | | | |
| OPERATIONS: | | | | | | | | | | | | | | | | |
Net investment income | | $ | 15,017,984 | | | $ | 9,949,767 | | | $ | 6,642,599 | | | $ | 3,203,054 | |
| Net realized gain (loss) on: | | | | | | | | | | | | | | | | |
Investments | | | (37,018,639 | ) | | | (33,338 | ) | | | (20,702,145 | ) | | | (549,559 | ) |
Foreign currency translation | | | (428,661 | ) | | | 2,561,773 | | | | (186,473 | ) | | | 1,132,919 | |
Forward currency contracts | | | 1,709 | | | | — | | | | — | | | | — | |
Futures contracts | | | (13,465,217 | ) | | | 5,292,297 | | | | (4,550,693 | ) | | | 2,343,036 | |
Securities sold short | | | 967 | | | | — | | | | (128 | ) | | | — | |
Swap contracts | | | (11,973,116 | ) | | | 4,198,382 | | | | (2,582,526 | ) | | | 2,214,002 | |
| Net change in unrealized appreciation (depreciation) on: | | | | | | | | | | | | | | | | |
Investments | | | (21,594,403 | ) | | | 19,776,530 | | | | (20,482,875 | ) | | | 10,158,446 | |
Foreign currency translation | | | 18,636 | | | | (1,199,917 | ) | | | 20,869 | | | | (824,324 | ) |
Futures contracts | | | 464,698 | | | | (6,385,881 | ) | | | (564,736 | ) | | | (1,755,907 | ) |
Securities sold short | | | (404 | ) | | | 404 | | | | — | | | | — | |
Swap contracts | | | 5,056,788 | | | | 6,044,954 | | | | 2,992,898 | | | | 2,066,655 | |
Net increase (decrease) in net assets resulting from operations | | | (63,919,658 | ) | | | 40,204,971 | | | | (39,413,210 | ) | | | 17,988,322 | |
| | | | |
| DISTRIBUTIONS TO SHAREHOLDERS: | | | | | | | | | | | | | | | | |
Net dividends and distributions — Class M(1) | | | (13,124,905 | ) | | | (9,862,605 | ) | | | (4,537,212 | ) | | | (4,688,352 | ) |
Net dividends and distributions — Class Y | | | — | | | | — | | | | — | | | | — | |
Total distributions | | | (13,124,905 | ) | | | (9,862,605 | ) | | | (4,537,212 | ) | | | (4,688,352 | ) |
| | | | |
| CAPITAL SHARE TRANSACTIONS: | | | | | | | | | | | | | | | | |
Proceeds from shares sold — Class M | | | 517,394,859 | | | | 250,594,918 | | | | 238,576,633 | | | | 94,827,677 | |
Proceeds from shares sold — Class Y | | | 40,897 | | | | — | | | | 18,676 | | | | — | |
Proceeds from shares issued to holders in reinvestment of dividends — Class M | | | 12,014,857 | | | | 9,158,096 | | | | 4,054,992 | | | | 4,394,257 | |
Proceeds from shares issued to holders in reinvestment of dividends — Class Y | | | — | | | | — | | | | — | | | | — | |
Cost of shares redeemed — Class M | | | (444,481,411 | ) | | | (73,973,111 | ) | | | (126,219,252 | ) | | | (12,990,482 | ) |
Cost of shares redeemed — Class Y | | | — | | | | — | | | | — | | | | — | |
Net increase in net assets from capital share transactions | | | 84,969,202 | | | | 185,779,903 | | | | 116,431,049 | | | | 86,231,452 | |
| Total increase in net assets | | | 7,924,639 | | | | 216,122,269 | | | | 72,480,627 | | | | 99,531,422 | |
| | | | |
| NET ASSETS: | | | | | | | | | | | | | | | | |
Beginning of year | | | 590,484,518 | | | | 374,362,249 | | | | 230,795,782 | | | | 131,264,360 | |
| | | | |
| End of year | | $ | 598,409,157 | | | $ | 590,484,518 | * | | $ | 303,276,409 | | | $ | 230,795,782 | * |
| | | | | | | | | | | | | | | | | |
| | (1) | | Includes net investment income distributions of $7,854,166 and $2,802,025 and net realized gain distributions of $2,008,439 and $1,886,327 for the year ended May 31, 2018, for Class M of the Elements International Portfolio and Elements International Small Cap Portfolio, respectively. |
| | * | | Includes accumulated net investment income of $6,848,710 and $1,828,313 for the year ended May 31, 2018, for Elements International Portfolio and Elements International Small Cap Portfolio, respectively. |
| | | | |
| | The accompanying Notes to the Financial Statements are an integral part of these Financial Statements. | | (Continued) |
| | | | | | | | | | | | | | | | |
| | Elements Portfolios | | | | | | Annual Report | | | | | | May 31, 2019 | | |
| | | | |
104
| | |
| Statement of Changes in Net Assets | | |
| | | | | | | | |
| |
| | | ELEMENTS EMERGING
MARKETS PORTFOLIO | |
| | |
| | | YEAR
ENDED
MAY 31, 2019 | | | YEAR
ENDED
MAY 31, 2018 | |
| | |
| OPERATIONS: | | | | | | | | |
Net investment income | | $ | 7,566,277 | | | $ | 3,042,428 | |
| Net realized gain (loss) on: | | | | | | | | |
Investments | | | 221,908 | | | | 951,559 | |
Foreign currency translation | | | (149,334 | ) | | | (3,162 | ) |
Forward currency contracts | | | (272,106 | ) | | | (8,378 | ) |
Futures contracts | | | (23,521,147 | ) | | | 23,259,955 | |
Swap contracts | | | (15,242,980 | ) | | | (1,887,361 | ) |
| Net change in unrealized appreciation (depreciation) on: | | | | | | | | |
Investments | | | (10,746,579 | ) | | | 8,376,979 | |
Foreign currency translation | | | 11,218 | | | | (10,304 | ) |
Forward currency contracts | | | 226,152 | | | | (226,152 | ) |
Futures contracts | | | 7,108,945 | | | | (11,018,742 | ) |
Swap contracts | | | 8,716,195 | | | | 1,276,866 | |
Net increase (decrease) in net assets resulting from operations | | | (26,081,451 | ) | | | 23,753,688 | |
| | |
| DISTRIBUTIONS TO SHAREHOLDERS: | | | | | | | | |
Net dividends and distributions — Class M(1) | | | (6,035,261 | ) | | | (14,991,583 | ) |
Net dividends and distributions — Class Y | | | — | | | | — | |
Total distributions | | | (6,035,261 | ) | | | (14,991,583 | ) |
| | |
| CAPITAL SHARE TRANSACTIONS: | | | | | | | | |
Proceeds from shares sold — Class M | | | 259,496,758 | | | | 278,569,475 | |
Proceeds from shares sold — Class Y | | | 46,157 | | | | — | |
Proceeds from shares issued to holders in reinvestment of dividends — Class M | | | 5,282,097 | | | | 14,277,937 | |
Proceeds from shares issued to holders in reinvestment of dividends — Class Y | | | — | | | | — | |
Cost of shares redeemed — Class M | | | (146,985,095 | ) | | | (26,039,622 | ) |
Cost of shares redeemed — Class Y | | | — | | | | — | |
Net increase in net assets from capital share transactions | | | 117,839,917 | | | | 266,807,790 | |
| Total increase in net assets | | | 85,723,205 | | | | 275,569,895 | |
| | |
| NET ASSETS: | | | | | | | | |
Beginning of year | | | 275,569,895 | | | | — | |
| | |
| End of year | | $ | 361,293,100 | | | $ | 275,569,895 | * |
| | | | | | | | | |
| | (1) | | Includes net investment income distributions of $1,283,564 and net realized gain distributions of $13,708,019 for the year ended May 31, 2018, for Class M of Elements Emerging Markets Portfolio. |
| | * | | Includes accumulated net investment income of $1,747,324 for the year ended May 31, 2018, for Elements Emerging Markets Portfolio. |
| | | | |
| | The accompanying Notes to the Financial Statements are an integral part of these Financial Statements. | | |
| | | | | | | | | | | | | | | | |
| | Elements Portfolios | | | | | | Annual Report | | | | | | May 31, 2019 | | |
| | | | |
105
| | |
| Financial Highlights | | May 31, 2019 |
| | | | | | | | | | | | | | | | |
| | | PER SHARE DATA: | |
| | | Income (loss) from Investment Operations | |
| | | Net Asset
Value,
Beginning
of Period | | | Net
Investment
Income(4) | | |
Net Realized
and
Unrealized Gains
(Losses) | | | Total Income
(Loss) from
Investment
Operations | |
| ELEMENTS U.S. PORTFOLIO—CLASS M | | | | | | | | | | | | | | | | |
| Year Ended May 31, 2019 | | $ | 11.43 | | | | 0.19 | | | | — | | | | 0.19 | |
| Year Ended May 31, 2018 | | $ | 10.12 | | | | 0.16 | | | | 1.26 | | | | 1.42 | |
Period Ended May 31, 2017(1) | | $ | 10.00 | | | | 0.03 | | | | 0.09 | | | | 0.12 | |
| ELEMENTS U.S. PORTFOLIO—CLASS Y | | | | | | | | | | | | | | | | |
Period Ended May 31, 2019(9) | | $ | 12.03 | | | | 0.04 | | | | (0.62 | ) | | | (0.58 | ) |
| ELEMENTS U.S. SMALL CAP PORTFOLIO—CLASS M | | | | | | | | | | | | | | | | |
| Year Ended May 31, 2019 | | $ | 11.42 | | | | 0.16 | | | | (1.35 | ) | | | (1.19 | ) |
| Year Ended May 31, 2018 | | $ | 9.81 | | | | 0.15 | | | | 1.58 | | | | 1.73 | |
Period Ended May 31, 2017(1) | | $ | 10.00 | | | | 0.02 | | | | (0.21 | ) | | | (0.19 | ) |
| ELEMENTS U.S. SMALL CAP PORTFOLIO—CLASS Y | | | | | | | | | | | | | | | | |
Period Ended May 31, 2019(9) | | $ | 10.79 | | | | 0.02 | | | | (0.73 | ) | | | (0.71 | ) |
| ELEMENTS INTERNATIONAL PORTFOLIO—CLASS M | | | | | | | | | | | | | | | | |
| Year Ended May 31, 2019 | | $ | 11.03 | | | | 0.24 | | | | (1.32 | ) | | | (1.08 | ) |
| Year Ended May 31, 2018 | | $ | 10.29 | | | | 0.21 | | | | 0.73 | | | | 0.94 | |
Period Ended May 31, 2017(2) | | $ | 10.00 | | | | 0.01 | | | | 0.28 | | | | 0.29 | |
| ELEMENTS INTERNATIONAL PORTFOLIO—CLASS Y | | | | | | | | | | | | | | | | |
Period Ended May 31, 2019(9) | | $ | 10.14 | | | | 0.07 | | | | (0.46 | ) | | | (0.39 | ) |
| ELEMENTS INTERNATIONAL SMALL CAP PORTFOLIO—CLASS M | | | | | | | | | | | | | | | | |
| Year Ended May 31, 2019 | | $ | 11.35 | | | | 0.25 | | | | (1.88 | ) | | | (1.63 | ) |
| Year Ended May 31, 2018 | | $ | 10.36 | | | | 0.19 | | | | 1.08 | | | | 1.27 | |
Period Ended May 31, 2017(2) | | $ | 10.00 | | | | 0.01 | | | | 0.35 | | | | 0.36 | |
| ELEMENTS INTERNATIONAL SMALL CAP PORTFOLIO—CLASS Y | | | | | | | | | | | | | | | | |
Period Ended May 31, 2019(9) | | $ | 9.94 | | | | 0.08 | | | | (0.49 | ) | | | (0.41 | ) |
| ELEMENTS EMERGING MARKETS PORTFOLIO—CLASS M | | | | | | | | | | | | | | | | |
| Year Ended May 31, 2019 | | $ | 10.63 | | | | 0.24 | | | | (1.19 | ) | | | (0.95 | ) |
Year Ended May 31, 2018(3) | | $ | 10.00 | | | | 0.14 | | | | 1.19 | | | | 1.33 | |
| ELEMENTS EMERGING MARKETS PORTFOLIO—CLASS Y | | | | | | | | | | | | | | | | |
Period Ended May 31, 2019(9) | | $ | 10.06 | | | | 0.04 | | | | (0.65 | ) | | | (0.61 | ) |
| | See | | footnotes on following page |
| | | | |
| | The accompanying Notes to the Financial Statements are an integral part of these Financial Statements. | | |
| | | | | | | | | | | | | | | | |
| | Elements Portfolios | | | | | | Annual Report | | | | | | May 31, 2019 | | |
| | | | |
106
| | |
| Financial Highlights | | May 31, 2019 |
| | | | | | | | | | | | | | | | | | | | | | | | | | | | | | | | | | | | | | | | | | | | | | | | | | |
| | | SUPPLEMENT DATA AND RATIOS: | |
| Distributions to Shareholders | | | | | | | | | | | | | | | | | | | | | | | | | | | | | | | |
Net
Investment
Income | | | Net
Realized
Gains | | | Total
Distributions | | | Net
Asset
Value,
End of
Period | | | Total
Return(5) | | | Net
Assets,
End of
Period
(000’s) | | | Ratio of
Expenses to
Average
Net Assets
(Before
Expense
Reimbursement/
Recoupment) | | | Ratio of
Expenses to
Average
Net Assets
(After
Expense
Reimbursement/
Recoupment) | | | Ratio of Net
Investment
Income
(Loss)
to Average
Net Assets
(Before
Expense
Reimbursement/
Recoupment) | | | Ratio of Net
Investment
Income
to Average
Net Assets
(After
Expense
Reimbursement/
Recoupment) | | | Portfolio
Turnover
Rate | | | Supplemental
Portfolio
Turnover
Rate(8) | | | | |
| | | | | | | | | | | | | | | | | | | | | | | | | | | | | | | | | | | | | | | | | | | | | | | | | | |
| | (0.16 | ) | | | — | | | | (0.16 | ) | | $ | 11.46 | | | | 1.68 | % | | $ | 897,792 | | | | 0.47 | % | | | 0.15 | % | | | 1.29 | % | | | 1.61 | % | | | 52.00 | % | | | 37.64 | % | | | | |
| | (0.10 | ) | | | (0.01 | ) | | | (0.11 | ) | | $ | 11.43 | | | | 14.02 | % | | $ | 931,344 | | | | 0.51 | % | | | 0.15 | % | | | 1.06 | % | | | 1.42 | % | | | 21.56 | % | | | 14.17 | % | | | | |
| | — | | | | — | | | | — | | | $ | 10.12 | | | | 1.20 | %(6) | | $ | 616,076 | | | | 0.66 | %(7) | | | 0.00 | %(7) | | | 1.16 | %(7) | | | 1.82 | %(7) | | | 0.40 | %(6) | | | N/A | | | | | |
| | | | | | | | | | | | | | | | | | | | | | | | | | | | | | | | | | | | | | | | | | | | | | | | | | |
| | — | | | | — | | | | — | | | $ | 11.45 | | | | (4.82 | %)(6) | | $ | 55,893 | | | | 0.38 | %(7) | | | 0.05 | %(7) | | | 1.61 | %(7) | | | 1.94 | %(7) | | | 52.00 | % | | | 37.64 | % | | | | |
| | | | | | | | | | | | | | | | | | | | | | | | | | | | | | | | | | | | | | | | | | | | | | | | | | |
| | (0.15 | ) | | | — | | | | (0.15 | ) | | $ | 10.08 | | | | (10.41 | %) | | $ | 331,856 | | | | 0.72 | % | | | 0.15 | % | | | 0.89 | % | | | 1.46 | % | | | 64.16 | % | | | 46.75 | % | | | | |
| | (0.10 | ) | | | (0.02 | ) | | | (0.12 | ) | | $ | 11.42 | | | | 17.65 | % | | $ | 525,077 | | | | 0.75 | % | | | 0.15 | % | | | 0.78 | % | | | 1.38 | % | | | 25.19 | % | | | 21.06 | % | | | | |
| | — | | | | — | | | | — | | | $ | 9.81 | | | | (1.90 | %)(6) | | $ | 423,113 | | | | 0.91 | %(7) | | | 0.00 | %(7) | | | 0.37 | %(7) | | | 1.28 | %(7) | | | 0.01 | %(6) | | | N/A | | | | | |
| | | | | | | | | | | | | | | | | | | | | | | | | | | | | | | | | | | | | | | | | | | | | | | | | | |
| | — | | | | — | | | | — | | | $ | 10.08 | | | | (6.58 | %)(6) | | $ | 24,101 | | | | 0.69 | %(7) | | | 0.05 | %(7) | | | 0.63 | %(7) | | | 1.27 | %(7) | | | 64.16 | % | | | 46.75 | % | | | | |
| | | | | | | | | | | | | | | | | | | | | | | | | | | | | | | | | | | | | | | | | | | | | | | | | | |
| | (0.14 | ) | | | (0.07 | ) | | | (0.21 | ) | | $ | 9.74 | | | | (9.75 | %) | | $ | 598,370 | | | | 0.70 | % | | | 0.20 | % | | | 1.89 | % | | | 2.39 | % | | | 121.71 | % | | | 80.87 | % | | | | |
| | (0.16 | ) | | | (0.04 | ) | | | (0.20 | ) | | $ | 11.03 | | | | 9.22 | % | | $ | 590,485 | | | | 0.76 | % | | | 0.21 | % | | | 1.38 | % | | | 1.93 | % | | | 20.84 | % | | | 13.52 | % | | | | |
| | — | | | | — | | | | — | | | $ | 10.29 | | | | 2.90 | %(6) | | $ | 374,362 | | | | 1.23 | %(7) | | | 0.00 | %(7) | | | (0.59 | %)(7) | | | 0.64 | %(7) | | | 0.00 | %(6) | | | N/A | | | | | |
| | | | | | | | | | | | | | | | | | | | | | | | | | | | | | | | | | | | | | | | | | | | | | | | | | |
| | — | | | | — | | | | — | | | $ | 9.75 | | | | (3.85 | %)(6) | | $ | 39 | | | | 0.68 | %(7) | | | 0.10 | %(7) | | | 3.69 | %(7) | | | 4.27 | %(7) | | | 121.71 | % | | | 80.87 | % | | | | |
| | | | | | | | | | | | | | | | | | | | | | | | | | | | | | | | | | | | | | | | | | | | | | | | | | |
| | (0.12 | ) | | | (0.07 | ) | | | (0.19 | ) | | $ | 9.53 | | | | (14.33 | %) | | $ | 303,259 | | | | 0.98 | % | | | 0.21 | % | | | 1.73 | % | | | 2.50 | % | | | 106.41 | % | | | 63.84 | % | | | | |
| | (0.17 | ) | | | (0.11 | ) | | | (0.28 | ) | | $ | 11.35 | | | | 12.34 | % | | $ | 230,796 | | | | 1.11 | % | | | 0.21 | % | | | 0.81 | % | | | 1.71 | % | | | 19.19 | % | | | 9.84 | % | | | | |
| | — | | | | — | | | | — | | | $ | 10.36 | | | | 3.60 | %(6) | | $ | 131,264 | | | | 2.65 | %(7) | | | 0.00 | %(7) | | | (1.60 | %)(7) | | | 1.05 | %(7) | | | 0.00 | %(6) | | | N/A | | | | | |
| | | | | | | | | | | | | | | | | | | | | | | | | | | | | | | | | | | | | | | | | | | | | | | | | | |
| | — | | | | — | | | | — | | | $ | 9.53 | | | | (4.12 | %)(6) | | $ | 18 | | | | 0.99 | %(7) | | | 0.10 | %(7) | | | 4.16 | %(7) | | | 5.05 | %(7) | | | 106.41 | % | | | 63.84 | % | | | | |
| | | | | | | | | | | | | | | | | | | | | | | | | | | | | | | | | | | | | | | | | | | | | | | | | | |
| | (0.11 | ) | | | (0.12 | ) | | | (0.23 | ) | | $ | 9.45 | | | | (8.87 | %) | | $ | 361,250 | | | | 0.92 | % | | | 0.22 | % | | | 1.76 | % | | | 2.46 | % | | | 227.60 | % | | | 32.74 | % | | | | |
| | (0.06 | ) | | | (0.64 | ) | | | (0.70 | ) | | $ | 10.63 | | | | 13.46 | % | | $ | 275,570 | | | | 0.98 | % | | | 0.22 | % | | | 0.56 | % | | | 1.32 | % | | | 60.28 | % | | | 4.49 | % | | | | |
| | | | | | | | | | | | | | | | | | | | | | | | | | | | | | | | | | | | | | | | | | | | | | | | | | |
| | — | | | | — | | | | — | | | $ | 9.45 | | | | (6.06 | %)(6) | | $ | 43 | | | | 0.88 | %(7) | | | 0.15 | %(7) | | | 1.78 | %(7) | | | 2.51 | %(7) | | | 227.60 | % | | | 32.74 | % | | | | |
| | (1) | | The Portfolio commenced operations on April 3, 2017. |
| | (2) | | The Portfolio commenced operations on May 1, 2017. |
| | (3) | | The Portfolio commenced operations on June 1, 2017. |
| | (4) | | Net investment income per share has been calculated based on average shares outstanding during the period. Net investment income per share is net of fees and expenses that were waived or reimbursed by the Adviser. |
| | (5) | | Results shown reflect the reinvestment of all dividends, are net of fees and expenses, and reflect waivers of all of the Portfolio’s investment management fees and partial reimbursement of the Portfolio’s expenses by Stone Ridge. Stone Ridge has contractually agreed to waive its management fee entirely through September 30, 2021 and to pay or otherwise bear operating expenses as necessary to limit total annualized expenses, other than certain excluded expenses, of the Portfolios to 0.15% (for the Elements U.S. Portfolio and Elements U.S. Small Cap Portfolio) or 0.20% (for the Elements International Portfolio, Elements International Small Cap Portfolio and Elements Emerging Markets Portfolio) for the period from September 28, 2018 through September 30, 2019. Fee waivers and expense reimbursement may be discontinued after such dates. In the absence of fee waivers and reimbursements, returns for the Portfolios would have been lower. Returns shown do not reflect the deduction of taxes that a shareholder would pay on fund distributions or the redemption of fund shares. |
| | (8) | | Turnover calculation for the Portfolio’s single stock factor investing. Calculated as the lesser of notional bought or sold in equities and single-name equity derivatives, divided by average net assets for the period. Excludes activity that the Adviser believes contributes minimal transaction cost and activity in other products such as index derivatives. |
| | (9) | | Class Y for each portfolio commenced operations on April 1, 2019. |
| | | | |
| | The accompanying Notes to the Financial Statements are an integral part of these Financial Statements. | | |
| | | | | | | | | | | | | | | | |
| | Elements Portfolios | | | | | | Annual Report | | | | | | May 31, 2019 | | |
| | | | |
107
| | |
| Notes to Financial Statements | | May 31, 2019 |
1. Organization
Stone Ridge Trust (the “Trust”) is anopen-end management investment company, organized as a Delaware statutory trust and registered under the Investment Company Act of 1940, as amended (the “1940 Act”). Currently, the Trust consists of a number of different funds, each having distinct investment management objectives, strategies, risks and policies. Included in this report are the Elements U.S. Portfolio, the Elements U.S. Small Cap Portfolio, the Elements International Portfolio, the Elements International Small Cap Portfolio and the Elements Emerging Markets Portfolio, each a “Portfolio” and collectively the “Portfolios.”
Each Portfolio is classified asnon-diversified under the 1940 Act. The Elements U.S. Portfolio and the Elements U.S. Small Cap Portfolio commenced operations on April 3, 2017. The Elements International Portfolio and the Elements International Small Cap Portfolio commenced operations on May 1, 2017. The Elements Emerging Markets Portfolio commenced operations on June 1, 2017. Each Portfolio offers two classes of shares to investors: Class Y shares, with nofront-end orback-end sales charges, and no12b-1 fees; and Class M Shares, with nofront-end orback-end sales charges, and a 0.10%12b-1 fee. No Portfolio charges redemption fees. Each Portfolio has an unlimited number of authorized shares.
The investment objective of each Portfolio is to seek long-term capital appreciation. The Elements U.S. Portfolio seeks to achieve its investment objective by investing in a broad and diverse group of securities of U.S. companies. The Elements U.S. Small Cap Portfolio seeks to achieve its investment objective by investing in a broad and diverse group of securities of U.S. small capitalization companies. The Elements International Portfolio seeks to achieve its investment objective by investing in a broad and diverse group of securities of companies associated with countries, other than the United States, with developed markets. The Elements International Small Cap Portfolio seeks to achieve its investment objective by investing in a broad and diverse group of securities of small capitalization companies associated with countries, other than the United States, with developed markets. The Elements Emerging Markets Portfolio seeks to achieve its investment objective by investing in a broad and diverse group of securities of companies associated with countries with emerging or frontier markets.
2. Summary of Significant Accounting Policies
The following is a summary of significant accounting policies consistently followed by the Portfolios in the preparation of their financial statements. The financial statements have been prepared in conformity with accounting principles generally accepted in the United States of America (“GAAP”). The Portfolios are investment companies and apply specific accounting and financial reporting requirements under Financial Accounting Standards Board (“FASB”) Accounting Standards Topic 946,Financial Services — Investment Companies.
(a) Investment Valuation and Fair Value Measurement
The Board of Trustees (“Board”) of Stone Ridge Trust has approved procedures pursuant to which each Portfolio values its investments (the “Valuation Procedures”). The Board has established an Adviser Valuation Committee made up of employees of Stone Ridge Asset Management LLC (the “Adviser”) to which the Board has delegated responsibility for overseeing the implementation of the Valuation Procedures and fair value determinations made on behalf of the Board.
Listed below is a summary of certain of the methods generally used currently to value investments of each Portfolio under the Valuation Procedures:
Short-term debt instruments, such as money market funds, commercial paper, bankers’ acceptances and U.S. Treasury Bills, having a maturity of 60 days or less, are generally valued at amortized cost, which approximates fair value.
Other debt securities, including corporate and government debt securities (of U.S. or foreign issuers) and municipal debt securities in each case having a remaining maturity in excess of 60 days, loans, mortgage-backed securities, collateralized mortgage obligations and other asset-backed securities are valued by an independent pricing service at an evaluated (or estimated) mean between the closing bid and asked prices.
| | | | | | | | | | | | | | | | |
| | Elements Portfolios | | | | | | Annual Report | | | | | | May 31, 2019 | | |
| | | | |
108
| | |
| Notes to Financial Statements | | May 31, 2019 |
For investments inopen-end management companies that are registered under the 1940 Act, the value of the shares of such funds is calculated based upon the net asset value (“NAV”) per share of such funds. The prospectuses for such funds explain the circumstances under which they will use fair value pricing and its effects.
Equity securities are valued at the last sale, official close or if there are no reported sales at the mean between the bid and asked price on the primary exchange on which they are traded. The values of the Portfolios’ investments in publicly traded foreign equity securities generally will be the closing or final trading prices in the local trading markets but may be adjusted based on values determined by a pricing service using pricing models designed to estimate changes in the values of those securities between the times in which the trading in those securities is substantially completed and the close of the New York Stock Exchange (“NYSE”).
Exchange-traded derivatives, such as options and futures contracts, are valued at the settlement price on the exchange or mean of the bid and asked prices.
Total return swaps on exchange-traded underliers or indices are generally valued on the basis of funding accruals and underlying instruments’ total returns. Othernon-exchange traded derivatives, such as forward currency contracts, are generally valued on the basis of valuations provided by a pricing service.
If market quotations are not readily available or available market quotations or other information are deemed to be unreliable by the Adviser Valuation Committee, and if the valuation of the applicable instrument is not covered by the valuation methods described above or if the valuation methods are described above, but such methods are deemed unreliable by the Adviser Valuation Committee, then such instruments will be valued as determined in good faith by the Adviser Valuation Committee. In these circumstances, a Portfolio determines fair value in a manner that seeks to reflect the market value of the security on the valuation date based on consideration by the Adviser Valuation Committee of any information or factors it deems appropriate. For purposes of determining the fair value of securities, the Adviser Valuation Committee may generally consider, without limitation: (i) indications or quotes from brokers or other third-party sources; (ii) valuations provided by a third-party pricing agent; (iii) internal models that take into consideration different factors determined to be relevant by the Adviser; or (iv) any combination of the above.
Fair value pricing may require subjective determinations about the value of a portfolio instrument. Fair values may differ from quoted or published prices, or from prices that are used by others, for the same investments. Also, the use of fair value pricing may not always result in adjustments to the prices of securities or other assets or liabilities held by a Portfolio. It is possible that the fair value determined for a security may be materially different than the value that could be realized upon the sale of such security. Thus, fair valuation may have an unintended dilutive or accretive effect on the value of shareholders’ investments in a Portfolio.
Investments initially valued in currencies other than the U.S. dollar are converted to U.S. dollars using exchange rates obtained from pricing services. As a result, the NAV of a Portfolio’s shares may be affected by changes in the value of currencies in relation to the U.S. dollar. International markets are sometimes open on days when U.S. markets are closed, which means that the value of foreign securities owned by a Portfolio could change on days when Portfolio shares cannot be bought or sold. The value of investments traded in markets outside the U.S. or denominated in currencies other than the U.S. dollar may be affected significantly on a day that the NYSE is closed, and the NAV of a Portfolio’s shares may change on days when an investor is not able to purchase, redeem or exchange shares. The calculation of a Portfolio’s NAV may not take place contemporaneously with the determination of the prices of foreign securities used in NAV calculations.
The Portfolios adhere to authoritative fair valuation accounting standards that set out a hierarchy for measuring fair valuation inputs. These standards require additional disclosures about the various inputs and valuation techniques used to develop the measurements of fair value and a discussion of changes in valuation techniques and related inputs during the period. The hierarchy gives the highest priority to unadjusted quoted prices in active markets for identical assets or liabilities (Level 1 measurements) and the lowest priority to significant unobservable inputs (Level 3 measurements). The three levels of the fair value hierarchy are as follows:
Level 1 Inputs: quoted prices (unadjusted) in active markets for identical assets or liabilities that the Portfolios can access at the measurement date;
| | | | | | | | | | | | | | | | |
| | Elements Portfolios | | | | | | Annual Report | | | | | | May 31, 2019 | | |
| | | | |
109
| | |
| Notes to Financial Statements | | May 31, 2019 |
Level 2 Inputs: inputs other than quoted prices included within Level 1 that are observable for the asset or liability, either directly or indirectly including inputs in markets that are not considered to be active or in active markets for similar assets or liabilities, observable inputs other than quoted prices and inputs that are not directly observable but are corroborated by observable market data;
Level 3 Inputs: significant unobservable inputs for the asset or liability.
Inputs are used in applying the various valuation techniques and broadly refer to the assumptions that market participants use to make valuation decisions, including assumptions about risk. A financial instrument’s level within the fair value hierarchy is based on the lowest level of any input that is significant to the fair value measurement. However, the determination of what constitutes “observable” requires significant judgment by the Adviser. The Adviser considers observable data to be that market data which is readily available, regularly distributed or updated, reliable and verifiable, not proprietary, and provided by independent sources that are actively involved in the relevant market. The categorization of a financial instrument within the hierarchy is based upon the pricing transparency of the instrument and does not necessarily correspond to the Adviser’s perceived risk of that instrument.
There were transfers between Levels 1 and 3 during the reporting period. Transfers from Level 1 to Level 3 occurred because quoted prices became unavailable for the securities. Transfers from Level 3 to Level 1 occurred because quoted prices became available for the securities. The following tables summarize the inputs used to value the Portfolios’ investments as of May 31, 2019.
| | | | | | | | | | | | | | | | |
| DESCRIPTION | | LEVEL 1 | | | LEVEL 2 | | | LEVEL 3 | | | TOTAL | |
| Elements U.S. Portfolio (1) | | | | | | | | | | | | | | | | |
Assets | | | | | | | | | | | | | | | | |
Common Stocks | | $ | 927,306,522 | | | $ | — | | | $ | — | | | $ | 927,306,522 | |
Real Estate Investment Trusts | | | 24,482 | | | | — | | | | — | | | | 24,482 | |
Money Market Funds | | | 3,995,395 | | | | — | | | | — | | | | 3,995,395 | |
U.S. Treasury Bills | | | — | | | | 19,979,178 | | | | — | | | | 19,979,178 | |
Investments Purchased with the Cash Proceeds from Securities Lending | | | 14,771,272 | | | | — | | | | — | | | | 14,771,272 | |
| | | | |
Total Assets | | $ | 946,097,671 | | | $ | 19,979,178 | | | $ | — | | | $ | 966,076,849 | |
Other Financial Instruments* | | | | | | | | | | | | | | | | |
Unrealized depreciation on futures contracts | | $ | (824,278 | ) | | $ | — | | | $ | — | | | $ | (824,278 | ) |
| | | | |
Total | | $ | (824,278 | ) | | $ | — | | | $ | — | | | $ | (824,278 | ) |
| Elements U.S. Small Cap Portfolio (1) | | | | | | | | | | | | | | | | |
Assets | | | | | | | | | | | | | | | | |
Common Stocks | | $ | 342,125,875 | | | $ | — | | | $ | 4,579 | | | $ | 342,130,454 | |
Real Estate Investment Trusts | | | 5,002,626 | | | | — | | | | — | | | | 5,002,626 | |
Rights | | | — | | | | — | | | | 6,927 | | | | 6,927 | |
Money Market Funds | | | 2,363,110 | | | | — | | | | — | | | | 2,363,110 | |
U.S. Treasury Bills | | | — | | | | 5,492,211 | | | | — | | | | 5,492,211 | |
Investments Purchased with the Cash Proceeds from Securities Lending | | | 15,983,788 | | | | — | | | | — | | | | 15,983,788 | |
| | | | |
Total Assets | | $ | 365,475,399 | | | $ | 5,492,211 | | | $ | 11,506 | | | $ | 370,979,116 | |
Other Financial Instruments* | | | | | | | | | | | | | | | | |
Unrealized depreciation on futures contracts | | $ | (932,801 | ) | | $ | — | | | $ | — | | | $ | (932,801 | ) |
Unrealized depreciation on swap contracts | | | — | | | | (285,670 | ) | | | — | | | | (285,670 | ) |
| | | | |
Total | | $ | (932,801 | ) | | $ | (285,670 | ) | | $ | — | | | $ | (1,218,471 | ) |
| | | | | | | | | | | | | | | | |
| | Elements Portfolios | | | | | | Annual Report | | | | | | May 31, 2019 | | |
| | | | |
110
| | |
| Notes to Financial Statements | | May 31, 2019 |
| | | | | | | | | | | | | | | | |
| DESCRIPTION | | LEVEL 1 | | | LEVEL 2 | | | LEVEL 3 | | | TOTAL | |
| Elements International Portfolio (1) | | | | | | | | | | | | | | | | |
Assets | | | | | | | | | | | | | | | | |
Common Stocks | | $ | 559,677,377 | | | $ | — | | | $ | — | | | $ | 559,677,377 | |
Preferred Stocks | | | 5,443,080 | | | | — | | | | — | | | | 5,443,080 | |
Real Estate Investment Trusts | | | 16,045,757 | | | | — | | | | — | | | | 16,045,757 | |
Rights | | | — | | | | — | | | | 18,089 | | | | 18,089 | |
U.S. Treasury Bills | | | — | | | | 11,986,768 | | | | — | | | | 11,986,768 | |
Investments Purchased with the Cash Proceeds from Securities Lending | | | 21,416,215 | | | | — | | | | — | | | | 21,416,215 | |
| | | | |
Total Assets | | $ | 602,582,429 | | | $ | 11,986,768 | | | $ | 18,089 | | | $ | 614,587,286 | |
Other Financial Instruments* | | | | | | | | | | | | | | | | |
Unrealized depreciation on futures contracts | | | (5,718,102 | ) | | | — | | | | — | | | | (5,718,102 | ) |
Unrealized appreciation on swap contracts | | | — | | | | 14,799,845 | | | | — | | | | 14,799,845 | |
Unrealized depreciation on swap contracts | | | — | | | | (3,795,700 | ) | | | — | | | | (3,795,700 | ) |
| | | | |
Total | | $ | (5,718,102 | ) | | $ | 11,004,145 | | | $ | — | | | $ | 5,286,043 | |
| Elements International Small Cap Portfolio (1) | | | | | | | | | | | | | | | | |
Assets | | | | | | | | | | | | | | | | |
Common Stocks | | $ | 282,780,948 | | | $ | — | | | $ | 495,978 | | | $ | 283,276,926 | |
Preferred Stocks | | | 506,066 | | | | — | | | | — | | | | 506,066 | |
Real Estate Investment Trusts | | | 3,795,163 | | | | — | | | | — | | | | 3,795,163 | |
Rights | | | — | | | | — | | | | 33,653 | | | | 33,653 | |
Money Market Funds | | | 1,728,665 | | | | — | | | | — | | | | 1,728,665 | |
U.S. Treasury Bills | | | — | | | | 6,591,430 | | | | — | | | | 6,591,430 | |
Investments Purchased with the Cash Proceeds from Securities Lending | | | 15,053,882 | | | | — | | | | — | | | | 15,053,882 | |
| | | | |
Total Assets | | $ | 303,864,724 | | | $ | 6,591,430 | | | $ | 529,631 | | | $ | 310,985,785 | |
Other Financial Instruments* | | | | | | | | | | | | | | | | |
Unrealized depreciation on futures contracts | | | (2,302,871 | ) | | | — | | | | — | | | | (2,302,871 | ) |
Unrealized appreciation on swap contracts | | | — | | | | 8,196,521 | | | | 94 | | | | 8,196,615 | |
Unrealized depreciation on swap contracts | | | — | | | | (3,079,594 | ) | | | (4,588 | ) | | | (3,084,182 | ) |
| | | | |
Total | | $ | (2,302,871 | ) | | $ | 5,116,927 | | | $ | (4,494 | ) | | $ | 2,809,562 | |
| Elements Emerging Markets Portfolio (1) | | | | | | | | | | | | | | | | |
Assets | | | | | | | | | | | | | | | | |
Common Stocks | | $ | 299,425,891 | | | $ | — | | | $ | — | | | $ | 299,425,891 | |
Preferred Stocks | | | 5,790,699 | | | | — | | | | — | | | | 5,790,699 | |
Real Estate Investment Trusts | | | 24,877,474 | | | | — | | | | — | | | | 24,877,474 | |
Money Market Funds | | | 3,443,335 | | | | — | | | | — | | | | 3,443,335 | |
U.S. Treasury Bills | | | — | | | | 8,987,558 | | | | — | | | | 8,987,558 | |
Investments Purchased with the Cash Proceeds from Securities Lending | | | 24,777,588 | | | | — | | | | — | | | | 24,777,588 | |
| | | | |
Total Assets | | $ | 358,314,997 | | | $ | 8,987,558 | | | $ | — | | | $ | 367,302,545 | |
Other Financial Instruments* | | | | | | | | | | | | | | | | |
Unrealized depreciation on futures contracts | | $ | (3,909,797 | ) | | $ | — | | | $ | — | | | $ | (3,909,797 | ) |
Unrealized appreciation on swap contracts | | | — | | | | 12,191,385 | | | | 1,124,957 | | | | 13,316,342 | |
Unrealized depreciation on swap contracts | | | — | | | | (3,082,531 | ) | | | (240,750 | ) | | | (3,323,281 | ) |
| | | | |
Total | | $ | (3,909,797 | ) | | $ | 9,108,854 | | | $ | 884,207 | | | $ | 6,083,264 | |
| * | Other financial instruments are derivatives, such as futures contracts and swap contracts. These instruments are reflected at the unrealized appreciation (depreciation) on the instrument. |
| (1) | The Portfolios measure Level 3 activity as of the beginning and end of each financial reporting period. |
| | | | | | | | | | | | | | | | |
| | Elements Portfolios | | | | | | Annual Report | | | | | | May 31, 2019 | | |
| | | | |
111
| | |
| Notes to Financial Statements | | May 31, 2019 |
Below is a reconciliation that details the activity of securities in Level 3 during the year ended May 31, 2019:
| | | | | | | | | | | | | | | | | | | | | | | | | | | | | | | | |
| | | BEGINNING
BALANCE —
JUNE 1, 2018 | | | ACQUISITIONS | | | DISPOSITIONS | | | REALIZED
GAINS/
(LOSSES) | | | RETURN OF
CAPITAL | | | CHANGE IN
UNREALIZED
APPRECIATION/
(DEPRECIATION) | | | TRANSFERS
IN/(OUT) OF
LEVEL 3 | | | ENDING
BALANCE —
MAY 31,
2019 | |
Elements U.S. Small Cap Portfolio: | | | | | | | | | | | | | | | | | | | | | | | | | | | | | | | | |
Common Stocks | | $ | 7,719 | | | $ | — | | | $ | (982 | ) | | $ | 982 | | | $ | — | | | $ | (3,140 | ) | | $ | — | | | $ | 4,579 | |
Rights | | | — | | | | — | | | | — | | | | — | | | | — | | | | 6,927 | | | | — | | | $ | 6,927 | |
Elements International Portfolio: | | | | | | | | | | | | | | | | | | | | | | | | | | | | | | | | |
Rights | | | — | | | | 18,212 | | | | (5 | ) | | | — | | | | — | | | | (118 | ) | | | — | | | $ | 18,089 | |
Elements International Small Cap Portfolio: | | | | | | | | | | | | | | | | | | | | | | | | | | | | | | | | |
Common Stocks | | | — | | | | — | | | | — | | | | — | | | | — | | | | — | | | | 495,978 | | | $ | 495,978 | |
Rights | | | — | | | | 40,067 | | | | — | | | | — | | | | — | | | | (6,414 | ) | | | — | | | $ | 33,653 | |
Swap Contracts | | | — | | | | — | | | | — | | | | — | | | | — | | | | (4,494 | ) | | | — | | | $ | (4,494 | ) |
Elements Emerging Markets Portfolio: | | | | | | | | | | | | | | | | | | | | | | | | | | | | | | | | |
Common Stocks | | | 70,828 | | | | 356,023 | | | | (48,275 | ) | | | (17,730 | ) | | | — | | | | 77,001 | | | | (437,847 | ) | | $ | — | |
Swap Contracts | | | — | | | | — | | | | — | | | | — | | | | — | | | | 884,207 | | | | — | | | $ | 884,207 | |
As of May 31, 2019, the change in unrealized appreciation (depreciation) on positions still held in the Elements U.S. Small Cap Portfolio were $(3,140) and $6,927 for common stocks and rights, respectively, in the Elements International Portfolio was $(118) for rights, in the Elements International Small Cap Portfolio were $30,212, $(6,414), and $(4,494) for common stocks, rights, and swap contracts, respectively, and in the Elements Emerging Markets Portfolio was $884,207 for swap contracts.
Unobservable inputs used to value a Portfolio’s investment in equity securities or equity swaps potentially include the analytical data relating to the security and issuer from the issuer’s financial statements, press releases and public filings, relevant material news events and other factors deemed relevant by the Adviser Valuation Committee. Significant changes in any of these inputs could impact the fair value measurement of the position.
Derivative Transactions —All of the Portfolios engage in futures and swap transactions while the Elements Emerging Markets Portfolio also engages in forward currency transactions. These transactions were for speculative purposes, to maintain liquidity, hedge equity and foreign exchange rate exposure or to earn an enhanced return during the year ended May 31, 2019.
Futures Contracts —All of the Portfolios engage in transactions in futures contracts and options on futures contracts. Futures contracts are standardized, exchange-traded contracts that obligate a purchaser to take delivery, and a seller to make delivery, of a specific amount of an asset at a specified future date at a specified price. A futures contract on an index is an agreement pursuant to which two parties agree to take or make delivery of an amount of cash equal to the difference between the value of the index at the close of the last trading day of the contract and the price at which the index contract originally was written. Although the value of an index might be a function of the value of certain specified securities, physical delivery of these securities is not always made. A currency future is an agreement pursuant to which two parties agree to take or make delivery of an amount of cash equal to the difference between the value of the specified currencies at the close of the last trading day of the contract and the price at which the currency contract originally was written. The Portfolios are also authorized to purchase or sell call and put options on futures contracts. Each Portfolio may maintain margin fornon-U.S. futures transactions directly with its broker or the clearinghouse.
| | | | | | | | | | | | | | | | |
| | Elements Portfolios | | | | | | Annual Report | | | | | | May 31, 2019 | | |
| | | | |
112
| | |
| Notes to Financial Statements | | May 31, 2019 |
The average notional amount of futures contracts held during the year ended May 31, 2019, were as follows:
| | | | | | | | | | | | | | | | | | | | |
| | | ELEMENTS U.S.
PORTFOLIO | | | ELEMENTS
U.S. SMALL CAP
PORTFOLIO | | | ELEMENTS
INTERNATIONAL
PORTFOLIO | | | ELEMENTS
INTERNATIONAL
SMALL CAP
PORTFOLIO | | | ELEMENTS
EMERGING
MARKETS
PORTFOLIO | |
Long futures contracts | | | | | | | | | | | | | | | | | | | | |
Equity index contracts | | $ | 48,743,056 | | | $ | 46,601,555 | | | $ | 164,759,115 | | | $ | 64,016,198 | | | $ | 115,544,011 | |
Total long futures contracts | | $ | 48,743,056 | | | $ | 46,601,555 | | | $ | 164,759,115 | | | $ | 64,016,198 | | | $ | 115,544,011 | |
Total Return Swaps — All of the Portfolios enter into total return swaps. In a swap transaction, two parties generally agree to exchange the returns (or differentials in rates of return) earned or realized on a particular predetermined reference instrument or instruments, which can be adjusted for an interest rate factor. The gross returns to be exchanged or “swapped” between the parties are generally calculated with respect to a “notional amount” (i.e., the return on or increase in value of a particular dollar amount invested in a particular security or other asset or in a “basket” of securities representing a particular index). Other types of swap agreements may calculate the obligations of the parties to the agreement on a “net basis.” Consequently, a party’s current obligations (or rights) under a swap agreement will generally be equal only to the net amount to be paid or received under the agreement based on the relative values of the positions held by each party to the agreement (the “net amount”). An equity swap is an agreement in which at least one party’s payments are based on the rate of return of an equity security or equity index. The other party’s payments can be based on a fixed rate, anon-equity variable rate or even a different equity index. The Portfolios use swaps for both speculative and hedging purposes.
The average notional amount of total return swaps held during the year ended May 31, 2019, were as follows:
| | | | | | | | | | | | | | | | | | | | |
| | | ELEMENTS U.S.
PORTFOLIO | | | ELEMENTS
U.S. SMALL CAP
PORTFOLIO | | | ELEMENTS
INTERNATIONAL
PORTFOLIO | | | ELEMENTS
INTERNATIONAL
SMALL CAP
PORTFOLIO | | | ELEMENTS
EMERGING
MARKETS
PORTFOLIO | |
Swaps | | | | | | | | | | | | | | | | | | | | |
Equity contracts | | $ | 21,557,344 | | | $ | 31,846,399 | | | $ | 276,613,217 | | | $ | 93,024,537 | | | $ | 404,537,983 | |
Total swaps | | $ | 21,557,344 | | | $ | 31,846,399 | | | $ | 276,613,217 | | | $ | 93,024,537 | | | $ | 404,537,983 | |
Forward Currency Contracts — The Elements Emerging Markets Portfolio enters into, and the other Portfolios may enter into forward currency contracts. When entering into a forward currency contract, in the case of a deliverable contract, a Portfolio agrees to receive or deliver a fixed quantity of foreign currency for an agreed-upon price on an agreed future date, or in the case of anon-deliverable contract, to settle the equivalent in U.S. dollars. The Portfolio’s net equity therein, represents unrealized gain or loss on the contracts as measured by the difference between the forward foreign exchange rates at the dates of entry into the contracts and the forward rates at the reporting date. These instruments may involve market risk from movements in currencies or credit risk from the possible inability of counterparties to meet the terms of their contracts.
The average notional amount of forward currency contracts held during the year ended May 31, 2019, were as follows:
| | | | |
| | | ELEMENTS EMERGING
MARKETS PORTFOLIO | |
Forwards | | | | |
Long foreign exchange contracts | | $ | 1,014,971 | |
Short foreign exchange contracts | | | 997,575 | |
Total forwards | | $ | 2,012,546 | |
| | | | | | | | | | | | | | | | |
| | Elements Portfolios | | | | | | Annual Report | | | | | | May 31, 2019 | | |
| | | | |
113
| | |
| Notes to Financial Statements | | May 31, 2019 |
The tables below reflect the values of the derivative assets and liabilities as reflected in each Portfolio’s Statement of Assets and Liabilities.
| | | | | | |
| | | ASSET DERIVATIVES | |
| | | STATEMENT OF ASSETS AND
LIABILITIES LOCATION | | FAIR VALUE | |
Elements International Portfolio | | | | | | |
Swaps | | | | | | |
Equity contracts | | Unrealized appreciation on swap contracts* | | $ | 14,799,845 | |
| |
Elements International Small Cap Portfolio | | | | |
Swaps | | | | | | |
Equity contracts | | Unrealized appreciation on swap contracts* | | | 8,196,615 | |
| |
Elements Emerging Markets Portfolio | | | | |
Swaps | | | | | | |
Equity contracts | | Unrealized appreciation on swap contracts* | | | 13,316,342 | |
| * | Reflects cumulative unrealized appreciation of swap contracts as reported in the Schedule of Investments. |
| | | | | | |
| | | LIABILITY DERIVATIVES | |
| | | STATEMENT OF ASSETS AND
LIABILITIES LOCATION | | FAIR VALUE | |
Elements U.S. Portfolio | | | | | | |
Futures | | | | | | |
Equity contracts | | Net assets—Unrealized depreciation* | | $ | (824,278 | ) |
| | |
Elements U.S. Small Cap Portfolio | | | | | | |
Futures | | | | | | |
Equity contracts | | Net assets—Unrealized depreciation* | | | (932,801 | ) |
Swaps | | | | | | |
Equity contracts | | Unrealized depreciation on swap contracts** | | | (285,670 | ) |
| | |
Elements International Portfolio | | | | | | |
Futures | | | | | | |
Equity contracts | | Net assets—Unrealized depreciation* | | | (447,978 | ) |
Foreign exchange contracts | | Net assets—Unrealized depreciation* | | | (5,270,124 | ) |
Swaps | | | | | | |
Equity contracts | | Unrealized depreciation on swap contracts** | | | (3,795,700 | ) |
| |
Elements International Small Cap Portfolio | | | | |
Futures | | | | | | |
Equity contracts | | Net assets—Unrealized depreciation* | | | (152,604 | ) |
Foreign exchange contracts | | Net assets—Unrealized depreciation* | | | (2,150,267 | ) |
Swaps | | | | | | |
Equity contracts | | Unrealized depreciation on swap contracts** | | | (3,084,182 | ) |
| |
Elements Emerging Markets Portfolio | | | | |
Futures | | | | | | |
Equity contracts | | Net assets—Unrealized depreciation* | | | (3,909,797 | ) |
Swaps | | | | | | |
Equity contracts | | Unrealized depreciation on swap contracts** | | | (3,323,281 | ) |
| * | Reflects cumulative unrealized depreciation of futures contracts as reported in the Schedule of Investments. |
| ** | Reflects cumulative unrealized depreciation of swap contracts as reported in the Schedule of Investments. |
| | | | | | | | | | | | | | | | |
| | Elements Portfolios | | | | | | Annual Report | | | | | | May 31, 2019 | | |
| | | | |
114
| | |
| Notes to Financial Statements | | May 31, 2019 |
The tables below reflect the effect of derivative instruments on the Statement of Operations for the year ended May 31, 2019.
| | | | | | | | | | | | | | | | |
| AMOUNT OF REALIZED GAIN OR (LOSS) ON DERIVATIVES TRANSACTIONS | |
| | | FUTURES
CONTRACTS | | | SWAP
CONTRACTS | | | FORWARD
CURRENCY
CONTRACTS | | | TOTAL | |
Elements U.S. Portfolio | | | | | | | | | | | | | | | | |
Equity contracts | | $ | 8,361,860 | | | $ | (4,284,341 | ) | | $ | — | | | $ | 4,077,519 | |
| | | | | | | | | | | | | | | | |
Elements U.S. Small Cap Portfolio | | | | | | | | | | | | | | | | |
Equity contracts | | | 1,547,034 | | | | (2,480,078 | ) | | | — | | | | (933,044 | ) |
| | | | | | | | | | | | | | | | |
Elements International Portfolio | | | | | | | | | | | | | | | | |
Equity contracts | | | (3,701,657 | ) | | | (11,973,116 | ) | | | — | | | | (15,674,773 | ) |
Foreign exchange contracts | | | (9,763,560 | ) | | | — | | | | 1,709 | | | | (9,761,851 | ) |
| | | | | | | | | | | | | | | | |
Elements International Small Cap Portfolio | | | | | | | | | | | | | | | | |
Equity contracts | | | (1,724,030 | ) | | | (2,582,526 | ) | | | — | | | | (4,306,556 | ) |
Foreign exchange contracts | | | (2,826,663 | ) | | | — | | | | — | | | | (2,826,663 | ) |
| | | | | | | | | | | | | | | | |
Elements Emerging Markets Portfolio | | | | | | | | | | | | | | | | |
Equity contracts | | | (23,521,147 | ) | | | (15,242,980 | ) | | | — | | | | (38,764,127 | ) |
Foreign exchange contracts | | | — | | | | — | | | | (272,106 | ) | | | (272,106 | ) |
| | | | | | | | | | | | | | | | |
| CHANGE IN UNREALIZED APPRECIATION OR (DEPRECIATION) ON DERIVATIVES TRANSACTIONS | |
| | | FUTURES
CONTRACTS | | | SWAP
CONTRACTS | | | FORWARD
CURRENCY
CONTRACTS | | | TOTAL | |
Elements U.S. Portfolio | | | | | | | | | | | | | | | | |
Equity contracts | | $ | 296,089 | | | $ | (207,850 | ) | | $ | — | | | $ | 88,239 | |
| | | | | | | | | | | | | | | | |
Elements U.S. Small Cap Portfolio | | | | | | | | | | | | | | | | |
Equity contracts | | | (1,866,472 | ) | | | 658,909 | | | | — | | | | (1,207,563 | ) |
| | | | | | | | | | | | | | | | |
Elements International Portfolio | | | | | | | | | | | | | | | | |
Equity contracts | | | 751,934 | | | | 5,056,788 | | | | — | | | | 5,808,722 | |
Foreign exchange contracts | | | (287,236 | ) | | | — | | | | — | | | | (287,236 | ) |
| | | | | | | | | | | | | | | | |
Elements International Small Cap Portfolio | | | | | | | | | | | | | | | | |
Equity contracts | | | 80,043 | | | | 2,992,898 | | | | — | | | | 3,072,941 | |
Foreign exchange contracts | | | (644,779 | ) | | | — | | | | — | | | | (644,779 | ) |
| | | | | | | | | | | | | | | | |
Elements Emerging Markets Portfolio | | | | | | | | | | | | | | | | |
Equity contracts | | | 7,108,945 | | | | 8,716,195 | | | | — | | | | 15,825,140 | |
Foreign exchange contracts | | | — | | | | — | | | | 226,152 | | | | 226,152 | |
(b) Offsetting on the Statement of Assets and LiabilitiesAccounting Standards UpdateNo. 2011-11 “Disclosures about Offsetting Assets and Liabilities” (“ASU2011-11”) intended to help investors and other financial statement users better assess the effect or potential effect of offsetting arrangements on a fund’s financial position. ASU2011-11 requires entities to disclose both gross and net information about both instruments and transactions eligible for offset on the Statement of Assets and Liabilities, and disclose instruments and transactions subject to master netting or similar agreements. In addition, in January 2013, the FASB issued Accounting Standards UpdateNo. 2013-1 “Clarifying the Scope of Offsetting Assets and Liabilities” (“ASU2013-1”), specifying exactly which transactions are subject to offsetting disclosures. The scope of the disclosure requirement is limited to derivative instruments, repurchase agreements and reverse repurchase agreements, and securities lending transactions. The International Swap and Derivative Association (“ISDA”) agreements specify collateral posting arrangements. Under the agreements, collateral is routinely transferred if the total net exposure to certain transactions (net of existing collateral already in place) governed under an agreement with a counterparty in a given account exceeds a specified threshold.
| | | | | | | | | | | | | | | | |
| | Elements Portfolios | | | | | | Annual Report | | | | | | May 31, 2019 | | |
| | | | |
115
| | |
| Notes to Financial Statements | | May 31, 2019 |
The Portfolios are each subject to a netting arrangement, which governs the terms of certain transactions with select counterparties. The netting arrangement allows the Portfolios to individually close out and net their total exposure to a counterparty in the event of a default with respect to all the transactions governed under a single agreement with a counterparty. The netting arrangement also specifies collateral posting arrangements at prearranged exposure levels. Under the netting arrangement, collateral is routinely transferred if the total net exposure to certain transactions (net of existing collateral already in place) governed under the relevant netting arrangement with a counterparty in a given account exceeds a specified threshold depending on the counterparty and the type of netting arrangement.
| | | | | | | | | | | | | | | | | | | | | | | | |
| | | | |
| | | GROSS
AMOUNT OF
RECOGNIZED
ASSETS | | | GROSS AMOUNT
OFFSET IN THE
CONSOLIDATED
STATEMENT
OF ASSETS
AND LIABILITIES | | | AMOUNTS
PRESENTED IN THE
CONSOLIDATED
STATEMENT
OF ASSETS
AND LIABILITIES | | | GROSS AMOUNTS NOT OFFSET IN THE
CONSOLIDATED STATEMENT OF ASSETS
AND LIABILITIES | |
| ASSETS: | | FINANCIAL
INSTRUMENTS | | | COLLATERAL
RECEIVED | | | NET
AMOUNT | |
| Elements U.S. Portfolio | | | | | | | | | | | | | | | | | | | | | |
Total return swap contracts | | $ | — | | | $ | — | | | $ | — | | | $ | — | | | $ | — | | | $ | — | |
| | | $ | — | | | $ | — | | | $ | — | | | $ | — | | | $ | — | | | $ | — | |
| Elements U.S. Small Cap Portfolio | | | | | | | | | | | | | | | | | | | | | |
Total return swap contracts | | $ | — | | | $ | — | | | $ | — | | | $ | — | | | $ | — | | | $ | — | |
| | | $ | — | | | $ | — | | | $ | — | | | $ | — | | | $ | — | | | $ | — | |
| Elements International Portfolio | | | | | | | | | | | | | | | | | | | | | |
Total return swap contracts | | $ | 14,799,845 | | | $ | — | | | $ | 14,799,845 | | | $ | (3,574,771 | ) | | $ | (10,210,946 | ) | | $ | 1,014,128 | |
| | | $ | 14,799,845 | | | $ | — | | | $ | 14,799,845 | | | $ | (3,574,771 | ) | | $ | (10,210,946 | ) | | $ | 1,014,128 | |
| Elements International Small Cap Portfolio | | | | | | | | | | | | | | | | | |
Total return swap contracts | | $ | 8,196,615 | | | $ | — | | | $ | 8,196,615 | | | $ | (3,046,522 | ) | | $ | (4,784,604 | ) | | $ | 365,489 | |
| | | $ | 8,196,615 | | | $ | — | | | $ | 8,196,615 | | | $ | (3,046,522 | ) | | $ | (4,784,604 | ) | | $ | 365,489 | |
| Elements Emerging Markets Portfolio | | | | | | | | | | | | | | | | | | | | | |
Total return swap contracts | | $ | 13,316,342 | | | $ | — | | | $ | 13,316,342 | | | $ | (2,698,849 | ) | | $ | (7,530,000 | ) | | $ | 3,087,493 | |
| | | $ | 13,316,342 | | | $ | — | | | $ | 13,316,342 | | | $ | (2,698,849 | ) | | $ | (7,530,000 | ) | | $ | 3,087,493 | |
| | | | | | | | | | | | | | | | | | | | | | | | |
| | | | |
| | | GROSS
AMOUNT OF
RECOGNIZED
LIABILITIES | | | GROSS AMOUNT
OFFSET IN THE
CONSOLIDATED
STATEMENT
OF ASSETS
AND LIABILITIES | | | NET AMOUNTS
PRESENTED IN THE
CONSOLIDATED
STATEMENT
OF ASSETS
AND LIABILITIES | | | GROSS AMOUNTS NOT OFFSET IN THE
CONSOLIDATED STATEMENT OF
ASSETS AND LIABILITIES | |
| LIABILITIES: | | FINANCIAL
INSTRUMENTS | | | COLLATERAL
PLEDGED | | | NET
AMOUNT | |
| Elements U.S. Portfolio | | | | | | | | | | | | | | | | | | | | | | | | |
Total return swap contracts | | $ | — | | | $ | — | | | $ | — | | | $ | — | | | $ | — | | | $ | — | |
| | | $ | — | | | $ | — | | | $ | — | | | $ | — | | | $ | — | | | $ | — | |
| Elements U.S. Small Cap Portfolio | | | | | | | | | | | | | | | | | | | | | |
Total return swap contracts | | $ | 285,670 | | | $ | — | | | $ | 285,670 | | | $ | — | | | $ | (285,670 | ) | | $ | — | |
| | | $ | 285,670 | | | $ | — | | | $ | 285,670 | | | $ | — | | | $ | (285,670 | ) | | $ | — | |
| Elements International Portfolio | | | | | | | | | | | | | | | | | | | | | |
Total return swap contracts | | $ | 3,795,700 | | | $ | — | | | $ | 3,795,700 | | | $ | (3,574,771 | ) | | $ | (220,929 | ) | | $ | — | |
| | | $ | 3,795,700 | | | $ | — | | | $ | 3,795,700 | | | $ | (3,574,771 | ) | | $ | (220,929 | ) | | $ | — | |
| Elements International Small Cap Portfolio | | | | | | | | | | | | | | | | | |
Total return swap contracts | | $ | 3,084,182 | | | $ | — | | | $ | 3,084,182 | | | $ | (3,046,522 | ) | | $ | — | | | $ | 37,660 | |
| | | $ | 3,084,182 | | | $ | — | | | $ | 3,084,182 | | | $ | (3,046,522 | ) | | $ | — | | | $ | 37,660 | |
| Elements Emerging Markets Portfolio | | | | | | | | | | | | | | | | | | | | | |
Total return swap contracts | | $ | 3,323,281 | | | $ | — | | | $ | 3,323,281 | | | $ | (2,698,849 | ) | | $ | (624,432 | ) | | $ | — | |
| | | $ | 3,323,281 | | | $ | — | | | $ | 3,323,281 | | | $ | (2,698,849 | ) | | $ | (624,432 | ) | | $ | — | |
| | | | | | | | | | | | | | | | |
| | Elements Portfolios | | | | | | Annual Report | | | | | | May 31, 2019 | | |
| | | | |
116
| | |
| Notes to Financial Statements | | May 31, 2019 |
Actual collateral pledged may be more than reported in order to satisfy broker requirements.
(c) Use of EstimatesThe preparation of the financial statements in conformity with GAAP requires management to make estimates and assumptions that affect the reported amounts of assets and liabilities and disclosure of contingent assets and liabilities at the date of the financial statements and the reported amounts of increases and decreases in net assets from operations during the reporting period. Actual results could differ from those estimates.
(d) IndemnificationsIn the normal course of business, the Portfolios enter into contracts that contain a variety of representations which provide general indemnifications. The Portfolios’ maximum exposure under these arrangements cannot be known; however, the Portfolios expect any risk of loss to be remote.
(e) Federal Income TaxesThe Portfolios qualify and intend to continue to qualify as regulated investment companies (“RIC”) under Subchapter M of the Internal Revenue Code of 1986, as amended. If so qualified, the Portfolios will not be subject to federal income tax to the extent they distribute substantially all of their net investment income and capital gains to shareholders. Therefore, no federal income tax provision is required.
(f) Distributions to ShareholdersThe Portfolios intend to distribute to their shareholders any net investment income and any net realized long- or short-term capital gains, if any, at least annually. Distributions are recorded on theex-dividend date. The Portfolios each may periodically make reclassifications among certain of their capital accounts as a result of the characterization of certain income and realized gains determined annually in accordance with federal tax regulations that may differ from GAAP.
(g) Foreign Securities and Currency TransactionsThe Portfolios’ books and records are maintained in U.S. dollars. Foreign currency denominated transactions (i.e. market value of investment securities, assets and liabilities, purchases and sales of investment securities, and income and expenses) are translated into U.S. dollars at the current rate of exchange. The Portfolios do not isolate that portion of results of operations resulting from changes in foreign exchange rates on investments from the fluctuations arising from changes in market prices of securities held.
The Elements International Portfolio, the Elements International Small Cap Portfolio and the Elements Emerging Markets Portfolio invest primarily in foreign-issued securities. Investments in foreign(non-U.S.) issuers involve risks not ordinarily associated with exposure to securities and instruments of U.S. issuers, including risks relating to political, social and economic developments affecting issuers located in foreign countries and differences between U.S. and foreign regulatory requirements and market practices, including fluctuations in foreign currency exchange rates and regulations, or foreign withholding taxes. Investing directly or indirectly in foreign securities may result in a Portfolio experiencing more rapid and extreme changes in value than a fund that obtains exposure exclusively in securities of U.S. issuers.
If the Portfolios invest in foreign issuers by purchasing American Depositary Receipts (“ADRs”) (U.S. dollar-denominated depositary receipts issued generally by banks and representing the deposit with the bank of a security of anon-U.S. issuer; ADRs are publicly traded on exchanges orover-the counter in the United States), the Portfolios are exposed to credit risk with respect to the issuer of the ADR, in addition to the risks of the underlying foreign securities.
(h) OtherInvestment transactions are recorded on the trade date. Dividend income, less any foreign tax withheld, is recognized on theex-dividend date and interest income is recognized on an accrual basis, including amortization/accretion of premiums or discounts. Discounts and premiums on securities purchased are amortized over the lives of the respective securities using the constant yield method.
(i) Restricted SecuritiesThe Portfolios may invest a portion of their assets in securities that are restricted, but eligible for purchase and sale by certain qualified institutional buyers, as defined in Rule 144A under the Securities Act of 1933, as amended, as well as other restricted securities. Restricted securities may be resold in transactions that are exempt from registration under Federal securities laws or if the securities are publicly registered. Restricted securities may be deemed illiquid.
(j) REIT Distributions The character of distributions received from real estate investment trusts (“REITs”) held by the Portfolios is generally made up of net investment income, capital gains, and return of capital. It is the policy of the
| | | | | | | | | | | | | | | | |
| | Elements Portfolios | | | | | | Annual Report | | | | | | May 31, 2019 | | |
| | | | |
117
| | |
| Notes to Financial Statements | | May 31, 2019 |
Portfolios to estimate the character of distributions received from underlying REITs based on historical data provided by the REITs. After each calendar year end, REITs report the actual tax character of these distributions. Differences between the estimated and actual amounts reported by the REITs are reflected in the Portfolios’ records in the year in which they are reported by the REITs by adjusting related investment cost basis, capital gains and income, as necessary.
(k) CounterpartiesThe counterparties presented in the Schedules of Investments are as follows: A: Goldman Sachs International, B: Morgan Stanley Capital Services LLC, C: UBS Group AG.
(l) Securities Lending The Elements U.S. Portfolio and Elements U.S. Small Cap Portfolio entered into securities lending arrangements with Securities Finance Trust Company (a “securities lending agent”). The Elements International Portfolio, Elements International Small Cap Portfolio and Elements Emerging Markets Portfolio entered into securities lending arrangements with Brown Brothers Harriman & Co. (a “securities lending agent”). Under the terms of the agreements, the securities lending agent is authorized to loan securities on behalf of the Portfolios to approved borrowers. In exchange, the Portfolios receive collateral in the amount of 102% of the value of securities loaned for domestic securities and 105% of the value of securities loaned with respect to foreign securities and the loans are marked to market daily. The Portfolios’ cash collateral is invested in short-term instruments as noted in the Schedules of Investments. Although risk is mitigated by the collateral, the borrower may fail to return the securities in a timely manner or at all. As a result, the Portfolios may lose money and there may be a delay in recovering securities. In addition, the Portfolios bear the risk of loss associated with the investment of collateral received. After predetermined rebates to borrowers, a percentage of the net securities lending revenue is credited to the applicable Portfolio. The securities lending agent is paid a fee for administering a securities lending program for the Portfolios, equal to a predetermined percentage of such net securities lending revenues. Securities lending income is disclosed in the Portfolios’ Statement of Operations.
(m) Allocation of Income, Expenses, Gains/LossesIncome, expenses (other than those deemed attributable to a specific share class), and gains and losses of each portfolio are allocated daily to each share class based upon the ratio of net assets represented by each class as a percentage of the net assets of each portfolio. Expenses deemed directly attributable to a class of shares are recorded by the specific class. Most expenses are allocated based on average net assets, with the exception of12b-1 fees, which are expensed at 0.10% of average daily net assets of the Class M shares.
3. Federal Tax Matters
Provisions for federal income taxes or excise taxes have not been made since the Portfolios intend to be taxed as Regulated Investment Companies and intend to distribute substantially all taxable income to shareholders and otherwise comply with the provisions of the Internal Revenue Code applicable to Regulated Investment Companies. Distributions from net realized gains for book purposes may include short-term capital gains which are included as ordinary income to shareholders for tax purposes. Additionally, GAAP requires that certain components of net assets relating to permanent differences be reclassified between financial and tax reporting. The reclassifications have no effect on net assets or NAV per share. Permanent differences for the year ended May 31, 2019, were primarily attributable to differences in the book and tax treatment of foreign currencies realized gains and losses, distributions from real estate investment trusts and investment in passive foreign investment companies.
For the year ended May 31, 2019, the effect of permanent “book/tax” reclassifications resulted in increases and decreases to components of the Portfolios’ net assets as follows:
| | | | | | | | | | | | |
| Portfolio | | UNDISTRIBUTED
NET INVESTMENT
INCOME/(LOSS) | | | ACCUMULATED
NET REALIZED
GAIN/(LOSS) | | | PAID IN
CAPITAL | |
Elements U.S. Portfolio | | $ | (31,997 | ) | | $ | 31,998 | | | $ | (1 | ) |
Elements U.S. Small Cap Portfolio | | | (194,171 | ) | | | 3 | | | | 194,168 | |
Elements International Portfolio | | | (348,635 | ) | | | 348,632 | | | | 3 | |
Elements International Small Cap Portfolio | | | (148,176 | ) | | | 150,504 | | | | (2,328 | ) |
Elements Emerging Markets Portfolio | | | (414,041 | ) | | | 414,042 | | | | (1 | ) |
| | | | | | | | | | | | | | | | |
| | Elements Portfolios | | | | | | Annual Report | | | | | | May 31, 2019 | | |
| | | | |
118
| | |
| Notes to Financial Statements | | May 31, 2019 |
As of May 31, 2019, the components of accumulated earnings (losses) for income tax purposes were as follows:
| | | | | | | | | | | | | | | | | | | | |
| | | ELEMENTS U.S.
PORTFOLIO | | | ELEMENTS
U.S. SMALL CAP
PORTFOLIO | | | ELEMENTS
INTERNATIONAL
PORTFOLIO | | | ELEMENTS
INTERNATIONAL
SMALL CAP
PORTFOLIO | | | ELEMENTS
EMERGING
MARKETS
PORTFOLIO | |
Tax cost of Investments | | $ | 859,766,565 | | | $ | 322,798,735 | | | $ | 626,369,815 | | | $ | 324,828,626 | | | $ | 371,206,942 | |
Unrealized Appreciation | | | 149,958,036 | | | | 74,076,191 | | | | 58,740,623 | | | | 30,649,265 | | | | 32,907,818 | |
Unrealized Depreciation | | | (43,647,752 | ) | | | (26,181,525 | ) | | | (59,546,903 | ) | | | (39,371,340 | ) | | | (26,805,028 | ) |
Net unrealized appreciation (depreciation) | | | 106,310,284 | | | | 47,894,666 | | | | (806,280 | ) | | | (8,722,075 | ) | | | 6,102,790 | |
Undistributed Ordinary Income | | | 7,856,319 | | | | 2,651,847 | | | | 13,534,333 | | | | 5,766,466 | | | | 6,076,653 | |
Undistributed Long Term Capital Gains/Capital Loss Carryover | | | (2,626,501 | ) | | | (32,569,406 | ) | | | (55,392,687 | ) | | | (26,012,312 | ) | | | (35,534,049 | ) |
Distributable earnings | | | 5,229,818 | | | | (29,917,559 | ) | | | (41,858,354 | ) | | | (20,245,846 | ) | | | (29,457,396 | ) |
Other accumulated loss | | | — | | | | — | | | | — | | | | — | | | | — | |
Total accumulated gain/(loss) | | $ | 111,540,102 | | | $ | 17,977,107 | | | $ | (42,664,634 | ) | | $ | (28,967,921 | ) | | $ | (23,354,606 | ) |
The differences between book-basis andtax-basis unrealized appreciation (depreciation) are primarily attributable to passive foreign investments and wash sales loss deferrals.
The tax character of distributions paid during the year ended May 31, 2019 was as follows:
| | | | | | | | | | | | | | | | |
| | | ORDINARY
INCOME | | | LONG-TERM
CAPITAL GAIN | | | RETURN OF
CAPITAL | | | TOTAL | |
Elements U.S. Portfolio | | $ | 13,665,103 | | | | — | | | | — | | | $ | 13,665,103 | |
Elements U.S. Small Cap Portfolio | | | 6,907,090 | | | | — | | | | — | | | | 6,907,090 | |
Elements International Portfolio | | | 13,124,905 | | | | — | | | | — | | | | 13,124,905 | |
Elements International Small Cap Portfolio | | | 4,537,212 | | | | — | | | | — | | | | 4,537,212 | |
Elements Emerging Markets Portfolio | | | 6,035,261 | | | | — | | | | — | | | | 6,035,261 | |
The tax character of distributions paid during the year ended May 31, 2018 was as follows:
| | | | | | | | | | | | | | | | |
| | | ORDINARY
INCOME | | | LONG-TERM
CAPITAL GAIN | | | RETURN OF
CAPITAL | | | TOTAL | |
Elements U.S. Portfolio | | $ | 7,965,223 | | | $ | 184,057 | | | | — | | | $ | 8,149,280 | |
Elements U.S. Small Cap Portfolio | | | 5,215,054 | | | | 403,624 | | | | — | | | | 5,618,678 | |
Elements International Portfolio | | | 8,060,355 | | | | 1,802,250 | | | | — | | | | 9,862,605 | |
Elements International Small Cap Portfolio | | | 3,519,708 | | | | 1,168,644 | | | | — | | | | 4,688,352 | |
Elements Emerging Markets Portfolio | | | 6,954,814 | | | | 8,036,769 | | | | — | | | | 14,991,583 | |
Each of the Funds designated as long-term capital gain dividends, pursuant to Internal Revenue Code Section 852(b)(3), the amount necessary to reduce the earnings and profits related to net capital gain to zero.
At May 31, 2019 certain Funds have tax basis capital losses which may be carried forward indefinitely to offset future capital gains as shown below:
| | | | | | | | | | | | |
| | | SHORT-TERM | | | LONG-TERM | | | TOTAL | |
Elements U.S. Portfolio | | $ | (2,626,501 | ) | | $ | — | | | $ | (2,626,501 | ) |
Elements U.S. Small Cap Portfolio | | | (13,707,193 | ) | | | (18,862,213 | ) | | | (32,569,406 | ) |
Elements International Portfolio | | | (30,986,408 | ) | | | (24,406,279 | ) | | | (55,392,687 | ) |
Elements International Small Cap Portfolio | | | (16,519,715 | ) | | | (9,492,597 | ) | | | (26,012,312 | ) |
Elements Emerging Markets Portfolio | | | (24,506,293 | ) | | | (11,027,756 | ) | | | (35,534,049 | ) |
The Portfolios did not incur Late Year Ordinary Losses between January 1, 2019 and May 31, 2019 and elect not to defer, where applicable, Post-October Capital Losses incurred between November 1, 2018 and May 31, 2019.
| | | | | | | | | | | | | | | | |
| | Elements Portfolios | | | | | | Annual Report | | | | | | May 31, 2019 | | |
| | | | |
119
| | |
| Notes to Financial Statements | | May 31, 2019 |
There is no tax liability resulting from unrecognized tax benefits relating to uncertain income tax positions taken or expected to be taken on the tax returns for the year ended May 31, 2019. As of May 31, 2019 open tax years include the periods ended May 31, 2017, 2018, and 2019. The Portfolios recognize interest and penalties, if any, related to unrecognized tax benefits as income tax expense in the Statement of Operations. During the period the Portfolios did not incur any interest or penalties.
4. Agreements
(a) Investment Management AgreementThe Adviser is the Portfolios’ investment adviser, and was organized as a Delaware limited liability company in 2012. The Adviser’s primary business is to provide a variety of investment management services, including an investment program for the Portfolios.
As compensation for its services, the Adviser is paid by each of the Portfolios a fee, computed daily and paid monthly in arrears, at the annual rate of 0.30% of the average daily net assets for the Elements U.S. Portfolio, 0.50% of the average daily net assets for the Elements U.S. Small Cap Portfolio, 0.45% of the average daily net assets for the Elements International Portfolio, 0.55% of the average daily net assets of the Elements International Small Cap Portfolio, and 0.60% of the average daily net assets of the Elements Emerging Markets Portfolio.
Effective September 28, 2018 and through September 30, 2021 for the Portfolios, the Adviser has agreed to waive its management fee in its entirety. In addition, effective September 28, 2018 and through September 30, 2019, the Adviser has agreed to pay or otherwise bear operating and other expenses of the applicable Portfolio or a share class thereof (including offering expenses, but excluding brokerage and transactional expenses, borrowing and other investment-related costs and fees including interest and commitment fees, short dividend expense, acquired fund fees and expenses, taxes, litigation and indemnification expenses, judgments and extraordinary expenses not incurred in the ordinary course of the Portfolio’s business (collectively, the “Excluded Expenses”)) solely to the extent necessary to limit the total annualized expenses, other than Excluded Expenses, of the applicable share class, to the percentage specified below of the average daily net assets attributable to such class.
| | |
| PORTFOLIO | | EXPENSE CAP |
Elements U.S. Portfolio | | 0.15% for Class M Shares |
Elements U.S. Small Cap Portfolio | | 0.05% for Class Y Shares |
| |
Elements International Portfolio | | |
Elements International Small Cap Portfolio | | 0.20% for Class M Shares |
Elements Emerging Markets Portfolio | | 0.10% for Class Y Shares |
As of May 31, 2019, the amounts waived or reimbursed by the Adviser during the fiscal year ended with respect to the Elements U.S. Portfolio, the Elements U.S. Small Cap Portfolio, the Elements International Portfolio, the Elements International Small Cap Portfolio and the Elements Emerging Markets Portfolio were as follows:
| | | | |
| PORTFOLIO | | AMOUNTS WAIVED FOR
THE FISCAL YEAR ENDED
MAY 31, 2019 | |
Elements U.S. Portfolio—Class M | | $ | 3,164,119 | |
Elements U.S. Portfolio—Class Y | | | 37,503 | |
Elements U.S. Small Cap Portfolio—Class M | | | 2,658,142 | |
Elements U.S. Small Cap Portfolio—Class Y | | | 32,499 | |
Elements International Portfolio—Class M | | | 3,141,487 | |
Elements International Portfolio—Class Y | | | 39 | |
Elements International Small Cap Portfolio—Class M | | | 2,056,121 | |
Elements International Small Cap Portfolio—Class Y | | | 28 | |
Elements Emerging Markets Portfolio—Class M | | | 2,139,018 | |
Elements Emerging Markets Portfolio—Class Y | | | 56 | |
| | | | | | | | | | | | | | | | |
| | Elements Portfolios | | | | | | Annual Report | | | | | | May 31, 2019 | | |
| | | | |
120
| | |
| Notes to Financial Statements | | May 31, 2019 |
As of September 28, 2018, expenses reimbursed by the Adviser, not including advisory fees waived, on or after such date will be available for recoupment to the extent that the expenses for the Portfolio after such recoupment do not exceed the lower of (i) the annual expense limitation rate in effect at the time of the actual reimbursement and (ii) the annual expense limitation rate in effect at the time of the recoupment. However, the Adviser shall not be permitted to recoup any such expenses beyond three years from the month end in which the Adviser reimbursed an expense. As of May 31, 2019, no expenses have been recouped by the Adviser. As of May 31, 2019, the amounts available to be recouped by the Adviser with respect to the Elements U.S. Portfolio, the Elements U.S. Small Cap Portfolio, the Elements International Portfolio, the Elements International Small Cap Portfolio and the Elements Emerging Markets Portfolio were as follows:
| | | | |
| Portfolio | | REMAINING AMOUNT
TO BE RECOUPED
(EXPIRING BY
MAY 31, 2022) | |
Elements U.S. Portfolio—Class M | | $ | 117,968 | |
Elements U.S. Portfolio—Class Y | | | 3,303 | |
Elements U.S. Small Cap Portfolio—Class M | | | 224,632 | |
Elements U.S. Small Cap Portfolio—Class Y | | | 6,932 | |
Elements International Portfolio—Class M | | | 240,777 | |
Elements International Portfolio—Class Y | | | 8 | |
Elements International Small Cap Portfolio—Class M | | | 460,999 | |
Elements International Small Cap Portfolio—Class Y | | | 10 | |
Elements Emerging Markets Portfolio—Class M | | | 207,356 | |
Elements Emerging Markets Portfolio—Class Y | | | 8 | |
(b) Custodian, Administrator and Transfer Agent The custodians to the Trust are U.S. Bank, N.A for the Elements U.S. Portfolio and the Elements U.S. Small Cap Portfolio and Brown Brothers Harriman & Co. for the Elements International Portfolio, the Elements International Small Cap Portfolio and the Elements Emerging Markets Portfolio. The administrator and transfer agent to the Trust is U.S. Bancorp Fund Services, LLC, doing business as U.S. Bank Global Fund Services, an affiliate of U.S. Bank, N.A.
(c) DistributorALPS Distributors, Inc. (the “Distributor”) serves as the Portfolios’ distributor.
5. Distribution Plan
The Class M Shares of the Portfolios pay Rule12b-1 fees to compensate financial intermediaries in connection with (i) personal and account maintenance services rendered to Class M shareholders (fees for such services, “servicing fees”) and/or (ii) activities or expenses primarily intended to result in the sale of Class M shares (fees for such services, if any, “distribution fees”). Servicing fees and distribution fees may be paid pursuant to a Distribution Plan(“12b-1 Plan”) adopted by each Portfolio, with respect to its class M shares, at the maximum annual rate of 0.25% of such Portfolio’s average daily net assets attributable to Class M. Class M Shares of each Portfolio currently pay a rate of 0.10% of the average daily net assets attributable to Class M shares and may not pay at a higher rate unless authorized to do so by the Board (not to exceed 0.25%). These fees are paid out of each Portfolio’s Class M shares’ assets on an ongoing basis and may be administered or facilitated by the Distributor. Because Rule12b-1 fees are paid out of a Portfolio’s Class M shares’ assets on an ongoing basis, over time these fees will increase the cost of your investment in Class M shares of the Portfolios and may cost you more than other types of sales charges. The Distributor does not retain any portion of the distribution fees. The Adviser performs certain services and incurs certain expenses with respect to the promotion of the Portfolios’ Class M shares and the servicing of Class M shareholders. If amounts remain from the12b-1 fees after the Distributor has paid the intermediaries, such amounts may be used to compensate the Adviser for the services it provides and for the expenses it bears in connection with the distribution of the Portfolios’ Class M shares. To the extent that there are expenses associated with shareholder services that exceed the amounts payable pursuant to the 12b-1 Plan, the Class M shares of the Portfolios will bear such expenses.
6. Related Parties
Certain officers of the Trust are also employees of the Adviser. The officers, with the exception of the Chief Compliance Officer, are not compensated by the Trust. The Trust pays a portion of the Chief Compliance Officer’s salary.
| | | | | | | | | | | | | | | | |
| | Elements Portfolios | | | | | | Annual Report | | | | | | May 31, 2019 | | |
| | | | |
121
| | |
| Notes to Financial Statements | | May 31, 2019 |
7. Investment Transactions
For the year ended May 31, 2019, aggregate purchases and sales of securities (excluding short-term securities) by the Portfolios were as follows:
| | | | | | | | | | | | | | | | | | | | |
| | | Elements U.S.
Portfolio | | | Elements U.S.
Small Cap
Portfolio | | | Elements
International
Portfolio | | | Elements
International
Small Cap
Portfolio | | | Elements
Emerging
Markets
Portfolio | |
Purchases | | $ | 553,426,642 | | | $ | 289,437,091 | | | $ | 836,572,192 | | | $ | 388,650,154 | | | $ | 753,527,780 | |
Sales | | | 501,905,165 | | | | 364,600,855 | | | | 722,194,916 | | | | 255,994,273 | | | | 649,990,892 | |
U.S. Government Security Purchases | | | — | | | | — | | | | — | | | | — | | | | — | |
U.S. Government Security Sales | | | — | | | | — | | | | — | | | | — | | | | — | |
8. Capital Share Transactions
| | | | | | | | |
| ELEMENTS U.S. PORTFOLIO - CLASS M | | YEAR ENDED
MAY 31, 2019 | | | YEAR ENDED
MAY 31, 2018 | |
Shares sold | | | 33,337,508 | | | | 25,543,456 | |
Shares issued to holders in reinvestment of dividends | | | 1,183,953 | | | | 683,781 | |
Shares redeemed | | | (37,631,660 | ) | | | (5,638,072 | ) |
Net increase/(decrease) in shares | | | (3,110,199 | ) | | | 20,589,165 | |
Shares outstanding: | | | | | | | | |
Beginning of year | | | 81,470,340 | | | | 60,881,175 | |
End of year | | | 78,360,141 | | | | 81,470,340 | |
| | |
| | | | | | | | |
| ELEMENTS U.S. PORTFOLIO - CLASS Y(1) | | PERIOD ENDED
MAY 31, 2019 | | | YEAR ENDED
MAY 31, 2018 | |
Shares sold | | | 6,512,365 | | | | — | |
Shares issued to holders in reinvestment of dividends | | | — | | | | — | |
Shares redeemed | | | (1,632,654 | ) | | | — | |
Net increase in shares | | | 4,879,711 | | | | — | |
Shares outstanding: | | | | | | | | |
Beginning of year | | | — | | | | — | |
End of year | | | 4,879,711 | | | | — | |
| | |
| | | | | | | | |
| ELEMENTS U.S. SMALL CAP PORTFOLIO - CLASS M | | YEAR ENDED
MAY 31, 2019 | | | YEAR ENDED
MAY 31, 2018 | |
Shares sold | | | 10,805,093 | | | | 11,100,520 | |
Shares issued to holders in reinvestment of dividends | | | 646,434 | | | | 400,039 | |
Shares redeemed | | | (24,519,155 | ) | | | (8,615,960 | ) |
Net increase/(decrease) in shares | | | (13,067,628 | ) | | | 2,884,599 | |
Shares outstanding: | | | | | | | | |
Beginning of year | | | 45,995,425 | | | | 43,110,826 | |
End of year | | | 32,927,797 | | | | 45,995,425 | |
| | |
| | | | | | | | |
| | | | | | | | | | | | | | | | |
| | Elements Portfolios | | | | | | Annual Report | | | | | | May 31, 2019 | | |
| | | | |
122
| | |
| Notes to Financial Statements | | May 31, 2019 |
| | | | | | | | |
| ELEMENTS U.S. SMALL CAP PORTFOLIO - CLASS Y(1) | | PERIOD ENDED
MAY 31, 2019 | | | YEAR ENDED
MAY 31, 2018 | |
Shares sold | | | 3,294,419 | | | | — | |
Shares issued to holders in reinvestment of dividends | | | — | | | | — | |
Shares redeemed | | | (903,342 | ) | | | — | |
Net increase in shares | | | 2,391,077 | | | | — | |
Shares outstanding: | | | | | | | | |
Beginning of year | | | — | | | | — | |
End of year | | | 2,391,077 | | | | — | |
| | |
| | | | | | | | |
| ELEMENTS INTERNATIONAL PORTFOLIO - CLASS M | | YEAR ENDED
MAY 31, 2019 | | | YEAR ENDED
MAY 31, 2018 | |
Shares sold | | | 51,832,112 | | | | 22,998,616 | |
Shares issued to holders in reinvestment of dividends | | | 1,263,392 | | | | 838,653 | |
Shares redeemed | | | (45,193,831 | ) | | | (6,657,301 | ) |
Net increase in shares | | | 7,901,673 | | | | 17,179,968 | |
Shares outstanding: | | | | | | | | |
Beginning of year | | | 53,553,262 | | | | 36,373,294 | |
End of year | | | 61,454,935 | | | | 53,553,262 | |
| | |
| | | | | | | | |
| ELEMENTS INTERNATIONAL PORTFOLIO - CLASS Y(1) | | PERIOD ENDED
MAY 31, 2019 | | | YEAR ENDED
MAY 31, 2018 | |
Shares sold | | | 4,033 | | | | — | |
Shares issued to holders in reinvestment of dividends | | | — | | | | — | |
Shares redeemed | | | — | | | | — | |
Net increase in shares | | | 4,033 | | | | — | |
Shares outstanding: | | | | | | | | |
Beginning of year | | | — | | | | — | |
End of year | | | 4,033 | | | | — | |
| | |
| | | | | | | | |
| ELEMENTS INTERNATIONAL SMALL CAP PORTFOLIO - CLASS M | | YEAR ENDED
MAY 31, 2019 | | | YEAR ENDED
MAY 31, 2018 | |
Shares sold | | | 24,159,117 | | | | 8,418,582 | |
Shares issued to holders in reinvestment of dividends | | | 433,226 | | | | 394,104 | |
Shares redeemed | | | (13,105,334 | ) | | | (1,146,308 | ) |
Net increase in shares | | | 11,487,009 | | | | 7,666,378 | |
Shares outstanding: | | | | | | | | |
Beginning of year | | | 20,339,326 | | | | 12,672,948 | |
End of year | | | 31,826,335 | | | | 20,339,326 | |
| | |
| | | | | | | | |
| ELEMENTS INTERNATIONAL SMALL CAP PORTFOLIO - CLASS Y(1) | | PERIOD ENDED
MAY 31, 2019 | | | YEAR ENDED
MAY 31, 2018 | |
Shares sold | | | 1,878 | | | | — | |
Shares issued to holders in reinvestment of dividends | | | — | | | | — | |
Shares redeemed | | | — | | | | — | |
Net increase in shares | | | 1,878 | | | | — | |
Shares outstanding: | | | | | | | | |
Beginning of year | | | — | | | | — | |
End of year | | | 1,878 | | | | — | |
| | |
| | | | | | | | |
| | | | | | | | | | | | | | | | |
| | Elements Portfolios | | | | | | Annual Report | | | | | | May 31, 2019 | | |
| | | | |
123
| | |
| Notes to Financial Statements | | May 31, 2019 |
| | | | | | | | |
| ELEMENTS EMERGING MARKETS PORTFOLIO - CLASS M | | YEAR ENDED
MAY 31, 2019 | | | YEAR ENDED
MAY 31, 2018 | |
Shares sold | | | 27,472,249 | | | | 27,019,063 | |
Shares issued to holders in reinvestment of dividends | | | 571,656 | | | | 1,374,200 | |
Shares redeemed | | | (15,749,206 | ) | | | (2,471,674 | ) |
Net increase in shares | | | 12,294,699 | | | | 25,921,589 | |
Shares outstanding: | | | | | | | | |
Beginning of year | | | 25,921,589 | | | | — | |
End of year | | | 38,216,288 | | | | 25,921,589 | |
| | |
| | | | | | | | |
| ELEMENTS EMERGING MARKETS PORTFOLIO - CLASS Y(1) | | PERIOD ENDED
MAY 31, 2019 | | | YEAR ENDED
MAY 31, 2018 | |
Shares sold | | | 4,588 | | | | — | |
Shares issued to holders in reinvestment of dividends | | | — | | | | — | |
Shares redeemed | | | — | | | | — | |
Net increase in shares | | | 4,588 | | | | — | |
Shares outstanding: | | | | | | | | |
Beginning of year | | | — | | | | — | |
End of year | | | 4,588 | | | | — | |
| (1) | Class Y commenced operations on April 1, 2019. |
9. Financing
The Elements U.S. Portfolios may obtain leverage through borrowings in seeking to achieve their investment objectives. As of May 31, 2019, the Elements U.S. Portfolio and Elements U.S. Small Cap Portfolio, along with six other series of the Trust advised by the Adviser (the Stone Ridge High Yield Reinsurance Risk Premium Fund (the “High Yield Fund”), the Stone Ridge U.S. Large Cap Variance Risk Premium Fund (the “U.S. Large Cap VRP Fund”), the Stone Ridge U.S. Small Cap Variance Risk Premium Fund (the “U.S. Small Cap VRP Fund”), the Stone Ridge U.S. Variance Risk Premium Master Fund (the “U.S. VRP Master Fund”), the Stone Ridge International Developed Markets Variance Risk Premium Fund (the “International Developed Markets VRP Fund”) and the Stone Ridge Global Equity Variance Risk Premium Fund (the “Global Equity VRP Master Fund”), shared an umbrella line of credit with a maximum withdrawal capacity of the lesser of (1) $50,000,000 across all Stone Ridge Trust funds less any loans outstanding with Stone Ridge Trust III to the extent such loans exceed $25,000,000 or (2) (a) for funds with a secured line of credit, 33.3% of the net market value of the collateral posted by the fund or (b) for funds with an unsecured line of credit, 33.3% of the net assets of the fund. For the High Yield Fund, the U.S. VRP Master Fund, the International Developed Markets VRP Fund, the Global Equity VRP Master Fund, the Elements U.S. Portfolio and the Elements U.S. Small Cap Portfolio, the umbrella line of credit takes the form of a secured loan agreement, which is effective November 28, 2017—October 29, 2019. For the U.S. Large Cap VRP Fund and U.S. Small Cap VRP Fund, the umbrella line of credit takes the form of an unsecured loan agreement, which is effective November 1, 2018—October 29, 2019.
Through the year ended May 31, 2019, the Elements U.S. Portfolio’s maximum borrowing was $18,470,000 and average borrowing was $151,808. This borrowing resulted in interest expenses of $6,296 at a weighted average interest rate of 4.50% and is included in “Other expenses” on the Elements U.S. Portfolio’s Statement of Operations. As of May 31, 2019, the Elements U.S. Portfolio did not have an outstanding loan balance.
Through the year ended May 31, 2019, the Elements U.S. Small Cap Portfolio did not draw on the line of credit and as of May 31, 2019, the Elements U.S. Small Cap Portfolio did not have an outstanding loan balance.
10. Subsequent Events Evaluation
In preparing these financial statements, the Portfolios have evaluated events and transactions for potential recognition or disclosure resulting from subsequent events through the date the financial statements were available to be issued. This evaluation did not result in any subsequent events that necessitated disclosures and/or adjustments.
| | | | | | | | | | | | | | | | |
| | Elements Portfolios | | | | | | Annual Report | | | | | | May 31, 2019 | | |
| | | | |
124
| | |
| Notes to Financial Statements | | May 31, 2019 |
11. Other Information
In August 2018, FASB issued ASU2018-13,Fair Value Measurement (Topic 820): Disclosure Framework—Changes to the Disclosure Requirements for Fair Value Measurement (“ASU2018-13”). The primary focus of ASU2018-13 is to improve the effectiveness of the disclosure requirements for fair value measurements. The changes affect all companies that are required to include fair value measurement disclosures. In general, the amendments in ASU2018-13 are effective for all entities for fiscal years and interim periods within those fiscal years, beginning after December 15, 2019. An entity is permitted to early adopt the removed or modified disclosures upon the issuance of ASU2018-13 and may delay adoption of the additional disclosures, which are required for public companies only, until their effective date. The Portfolios have early adopted this standard effective November 30, 2018, and the changes are incorporated into the financial statements.
| | | | | | | | | | | | | | | | |
| | Elements Portfolios | | | | | | Annual Report | | | | | | May 31, 2019 | | |
| | | | |
125
|
| Report of Independent Registered Public Accounting Firm |
To the Shareholders of Elements U.S. Portfolio, Elements U.S. Small Cap Portfolio, Elements International Portfolio, Elements International Small Cap Portfolio, and Elements Emerging Markets Portfolio and the Board of Trustees of Stone Ridge Trust
Opinion on the Financial Statements
We have audited the accompanying statements of assets and liabilities of the Elements U.S. Portfolio, Elements U.S. Small Cap Portfolio, Elements International Portfolio, Elements International Small Cap Portfolio, and Elements Emerging Markets Portfolio (collectively referred to as the “Portfolios”), (five of the portfolios constituting Stone Ridge Trust (the “Trust”)), including the schedules of investments, as of May 31, 2019, and the related statements of operations, changes in net assets, and the financial highlights for each of the periods indicated in the table below and the related notes (collectively referred to as the “financial statements”). In our opinion, the financial statements present fairly, in all material respects, the financial position of each of the Portfolios (five of the Portfolios constituting the Trust) at May 31, 2019, and the results of their operations, changes in net assets and financial highlights for each of the periods indicated in the table below, in conformity with U.S. generally accepted accounting principles.
| | | | | | |
Individual portfolio
comprising the
Stone Ridge Trust | | Statement of
operations | | Statements of
changes in net assets | | Financial highlights |
Elements U.S. Portfolio Elements U.S. Small Cap Portfolio | | For the year ended May 31, 2019 | | For each of the two years in the period ended May 31, 2019 | | For each of the two years in the period ended May 31, 2019 and the period from April 3, 2017 (commencement of operations) through May 31, 2017 |
| | | |
Elements International Portfolio Elements International Small Cap Portfolio | | For the year ended May 31, 2019 | | For each of the two years in the period ended May 31, 2019 | | For each of the two years in the period ended May 31, 2019 and the period from May 1, 2017 (commencement of operations) through May 31, 2017 |
| | | |
| Elements Emerging Markets Portfolio | | For the year ended May 31, 2019 | | For each of the two years in the period ended May 31, 2019 | | For each of the two years in the period ended May 31, 2019 |
Basis for Opinion
These financial statements are the responsibility of the Trust’s management. Our responsibility is to express an opinion on each of the Portfolios’ financial statements based on our audits. We are a public accounting firm registered with the Public Company Accounting Oversight Board (United States) (“PCAOB”) and are required to be independent with respect to the Trust in accordance with the U.S. federal securities laws and the applicable rules and regulations of the Securities and Exchange Commission and the PCAOB.
We conducted our audits in accordance with the standards of the PCAOB. Those standards require that we plan and perform the audit to obtain reasonable assurance about whether the financial statements and financial highlights are free of material misstatement, whether due to fraud or error. The Trust is not required to have, nor were we engaged to perform, an audit of the Trust’s internal control over financial reporting. As part of our audits we are required to obtain an understanding of internal control over financial reporting but not for the purpose of expressing an opinion on the effectiveness of the Trust’s internal control over financial reporting. Accordingly, we express no such opinion.
| | | | | | | | | | | | | | | | |
| | Elements Portfolios | | | | | | Annual Report | | | | | | May 31, 2019 | | |
| | | | |
126
|
| Report of Independent Registered Public Accounting Firm |
Our audits include performing procedures to assess the risks of material misstatement of the financial statements, whether due to error or fraud, and performing procedures that respond to those risks. Such procedures including examining, on a test basis, evidence regarding the amounts and disclosures in the financial statements. Our procedures included confirmation of securities owned as of May 31, 2019, by correspondence with the custodians and brokers or by other appropriate auditing procedures where replies from brokers were not received. Our audits also included evaluation the accounting principles used and significant estimated made by management, as well as evaluating the overall presentation of the financial statements. We believe that our audits provide a reasonable basis for our opinion.

We have served as the auditor of one or more of the Stone Ridge investment companies since 2013.
Minneapolis, Minnesota
July 30, 2019
| | | | | | | | | | | | | | | | |
| | Elements Portfolios | | | | | | Annual Report | | | | | | May 31, 2019 | | |
| | | | |
127
| | |
| Expense Examples (Unaudited) |
As a shareholder of the Portfolios, you incur ongoing costs, including investment advisory fees, distribution and/or shareholder servicing fees, and other Portfolio expenses, which are indirectly paid by shareholders. This example is intended to help you understand your ongoing costs (in U.S. dollars) of investing in a Portfolio and to compare these costs with the ongoing costs of investing in other mutual funds.
The example is based on an investment of $1,000 invested at the beginning of the period and held for the entire period from December 1, 2018 through May 31, 2019.
Actual Expenses
The first line on each table below provides information about actual account values and actual expenses. However, the table does not include shareholder specific fees, such as the $15.00 fee charged for wire redemptions by the Portfolios’ transfer agent. The table also does not include portfolio trading commissions and related trading costs. You may use the information in this line, together with the amount you invested, to estimate the expenses that you paid over the period. Simply divide your account value by $1,000 (for example, an $8,600 account value divided by $1,000 = 8.6), then multiply the result by the number in the first line under the heading entitled “Expenses Paid During Period” to estimate the expenses you paid on your account during the period.
Hypothetical Example For Comparison Purposes
The second line on each table below provides information about hypothetical account values and hypothetical expenses based on the actual expense ratio for each Portfolio and an assumed rate of return of 5% per year before expenses, which is not the Portfolio’s actual return. The hypothetical account values and expenses may not be used to estimate the actual ending account balance or expenses you paid for the period. You may use this information to compare the ongoing costs of investing in the Portfolios and other funds. To do so, compare this 5% hypothetical example with the 5% hypothetical examples that appear in the shareholder reports of the other funds. Please note that the expenses shown in the table are meant to highlight your ongoing costs only and do not reflect any transactional costs, such as sales charges (loads), redemption fees, or exchange fees. Therefore, the second line of the table is useful in comparing ongoing costs only, and will not help you determine the relevant total cost of owning different funds.
Elements U.S. Portfolio — Class M
| | | | | | | | | | | | |
| | | BEGINNING
ACCOUNT
VALUE
DECEMBER 1, 2018 | | | ENDING
ACCOUNT
VALUE
MAY 31, 2019 | | | EXPENSES
PAID DURING
PERIOD*
DECEMBER 1, 2018 –
MAY 31, 2019 | |
Actual | | $ | 1,000.00 | | | $ | 992.50 | | | $ | 0.75 | |
Hypothetical (5% annual return before expenses)* | | $ | 1,000.00 | | | $ | 1,024.18 | | | $ | 0.76 | |
| * | Expenses are equal to the Portfolio’s annualized six month expense ratio of 0.15% for Elements U.S. Portfolio — Class M, multiplied by the average account value over the period, multiplied by 182/365 to reflect the partial year period. |
Elements U.S. Portfolio — Class Y
| | | | | | | | | | | | |
| | | BEGINNING
ACCOUNT
VALUE
APRIL 1, 2018 | | | ENDING
ACCOUNT
VALUE
MAY 31, 2019 | | | EXPENSES
PAID DURING
PERIOD*
APRIL 1, 2018 –
MAY 31, 2019 | |
Actual | | $ | 1,000.00 | | | $ | 951.80 | | | $ | 0.08 | |
Hypothetical (5% annual return before expenses)* | | $ | 1,000.00 | | | $ | 1,024.68 | | | $ | 0.25 | |
| * | Actual expenses are equal to the Portfolio’s annualized six month expense ratio of 0.05% for Elements U.S. Portfolio — Class Y, multiplied by the average account value over the period, multiplied by 60/365 to reflect the partial period since the inception of the class. Hypothetical expenses are equal to the Portfolio’s annualized six month expense ratio of 0.05% for Elements U.S. Portfolio — Class Y, multiplied by the average account value over the period, multiplied by 182/365 for comparison purposes. |
| | | | | | | | | | | | | | | | |
| | Elements Portfolios | | | | | | Annual Report | | | | | | May 31, 2019 | | |
| | | | |
128
| | |
| Expense Examples (Unaudited) | | |
Elements U.S. Small Cap Portfolio — Class M
| | | | | | | | | | | | |
| | | BEGINNING
ACCOUNT
VALUE
DECEMBER 1, 2018 | | | ENDING
ACCOUNT
VALUE
MAY 31, 2019 | | | EXPENSES
PAID DURING
PERIOD*
DECEMBER 1, 2018 –
MAY 31, 2019 | |
Actual | | $ | 1,000.00 | | | $ | 935.30 | | | $ | 0.77 | |
Hypothetical (5% annual return before expenses)* | | $ | 1,000.00 | | | $ | 1,024.13 | | | $ | 0.81 | |
| * | Expenses are equal to the Portfolio’s annualized six month expense ratio of 0.16% for Elements U.S. Small Cap Portfolio — Class M, multiplied by the average account value over the period, multiplied by 182/365 to reflect the partial year period. |
Elements U.S. Small Cap Portfolio — Class Y
| | | | | | | | | | | | |
| | | BEGINNING
ACCOUNT
VALUE
APRIL 1, 2018 | | | ENDING
ACCOUNT
VALUE
MAY 31, 2019 | | | EXPENSES
PAID DURING
PERIOD*
APRIL 1, 2018 –
MAY 31, 2019 | |
Actual | | $ | 1,000.00 | | | $ | 934.20 | | | $ | 0.08 | |
Hypothetical (5% annual return before expenses)* | | $ | 1,000.00 | | | $ | 1,024.68 | | | $ | 0.25 | |
| * | Actual expenses are equal to the Portfolio’s annualized six month expense ratio of 0.05% for Elements U.S. Small Cap Portfolio — Class Y, multiplied by the average account value over the period, multiplied by 60/365 to reflect the partial period since the inception of the class. Hypothetical expenses are equal to the Portfolio’s annualized six month expense ratio of 0.05% for Elements U.S. Small Cap Portfolio — Class Y, multiplied by the average account value over the period, multiplied by 182/365 for comparison purposes. |
Elements International Portfolio — Class M
| | | | | | | | | | | | |
| | | BEGINNING
ACCOUNT
VALUE
DECEMBER 1, 2018 | | | ENDING
ACCOUNT
VALUE
MAY 31, 2019 | | | EXPENSES
PAID DURING
PERIOD*
DECEMBER 1, 2018 –
MAY 31, 2019 | |
Actual | | $ | 1,000.00 | | | $ | 1,002.40 | | | $ | 1.05 | |
Hypothetical (5% annual return before expenses)* | | $ | 1,000.00 | | | $ | 1,023.88 | | | $ | 1.06 | |
| * | Expenses are equal to the Portfolio’s annualized six month expense ratio of 0.21% for Elements International Portfolio — Class M, multiplied by the average account value over the period, multiplied by 182/365 to reflect the partial year period. |
Elements International Portfolio — Class Y
| | | | | | | | | | | | |
| | | BEGINNING
ACCOUNT
VALUE
APRIL 1, 2018 | | | ENDING
ACCOUNT
VALUE
MAY 31, 2019 | | | EXPENSES
PAID DURING
PERIOD*
APRIL 1, 2018 –
MAY 31, 2019 | |
Actual | | $ | 1,000.00 | | | $ | 961.50 | | | $ | 0.16 | |
Hypothetical (5% annual return before expenses)* | | $ | 1,000.00 | | | $ | 1,024.43 | | | $ | 0.50 | |
| * | Actual expenses are equal to the Portfolio’s annualized six month expense ratio of 0.10% for Elements International Portfolio — Class Y, multiplied by the average account value over the period, multiplied by 60/365 to reflect the partial period since the inception of the class. Hypothetical expenses are equal to the Portfolio’s annualized six month expense ratio of 0.10% for Elements International Portfolio — Class Y, multiplied by the average account value over the period, multiplied by 182/365 for comparison purposes. |
| | | | | | | | | | | | | | | | |
| | Elements Portfolios | | | | | | Annual Report | | | | | | May 31, 2019 | | |
| | | | |
129
| | |
| Expense Examples (Unaudited) | | |
Elements International Small Cap Portfolio — Class M
| | | | | | | | | | | | |
| | | BEGINNING
ACCOUNT
VALUE
DECEMBER 1, 2018 | | | ENDING
ACCOUNT
VALUE
MAY 31, 2019 | | | EXPENSES
PAID DURING
PERIOD*
DECEMBER 1, 2018 –
MAY 31, 2019 | |
Actual | | $ | 1,000.00 | | | $ | 981.20 | | | $ | 1.04 | |
Hypothetical (5% annual return before expenses)* | | $ | 1,000.00 | | | $ | 1,023.88 | | | $ | 1.06 | |
| * | Expenses are equal to the Portfolio’s annualized six month expense ratio of 0.21% for Elements International Small Cap Portfolio — Class M, multiplied by the average account value over the period, multiplied by 182/365 to reflect the partial year period. |
Elements International Small Cap Portfolio — Class Y
| | | | | | | | | | | | |
| | | BEGINNING
ACCOUNT
VALUE
APRIL 1, 2018 | | | ENDING
ACCOUNT
VALUE
MAY 31, 2019 | | | EXPENSES
PAID DURING
PERIOD*
APRIL 1, 2018 –
MAY 31, 2019 | |
Actual | | $ | 1,000.00 | | | $ | 958.80 | | | $ | 0.16 | |
Hypothetical (5% annual return before expenses)* | | $ | 1,000.00 | | | $ | 1,024.43 | | | $ | 0.50 | |
| * | Actual expenses are equal to the Portfolio’s annualized six month expense ratio of 0.10% for Elements International Small Cap Portfolio — Class Y, multiplied by the average account value over the period, multiplied by 60/365 to reflect the partial period since the inception of the class. Hypothetical expenses are equal to the Portfolio’s annualized six month expense ratio of 0.10% for Elements International Small Cap Portfolio — Class Y, multiplied by the average account value over the period, multiplied by 182/365 for comparison purposes. |
Elements Emerging Markets Portfolio — Class M
| | | | | | | | | | | | |
| | | BEGINNING
ACCOUNT
VALUE
DECEMBER 1, 2018 | | | ENDING
ACCOUNT
VALUE
MAY 31, 2019 | | | EXPENSES
PAID DURING
PERIOD*
DECEMBER 1, 2018 –
MAY 31, 2019 | |
Actual | | $ | 1,000.00 | | | $ | 1,012.20 | | | $ | 1.15 | |
Hypothetical (5% annual return before expenses)* | | $ | 1,000.00 | | | $ | 1,023.78 | | | $ | 1.16 | |
| * | Expenses are equal to the Portfolio’s annualized six month expense ratio of 0.23% for Elements Emerging Markets Portfolio —Class M, multiplied by the average account value over the period, multiplied by 182/365 to reflect the partial year period. |
Elements Emerging Markets Portfolio — Class Y
| | | | | | | | | | | | |
| | | BEGINNING
ACCOUNT
VALUE
APRIL 1, 2018 | | | ENDING
ACCOUNT
VALUE
MAY 31, 2019 | | | EXPENSES
PAID DURING
PERIOD*
APRIL 1, 2018 –
MAY 31, 2019 | |
Actual | | $ | 1,000.00 | | | $ | 939.40 | | | $ | 0.24 | |
Hypothetical (5% annual return before expenses)* | | $ | 1,000.00 | | | $ | 1,024.18 | | | $ | 0.76 | |
| * | Actual expenses are equal to the Portfolio’s annualized six month expense ratio of 0.15% for Elements Emerging Markets Portfolio — Class Y, multiplied by the average account value over the period, multiplied by 60/365 to reflect the partial period since the inception of the class. Hypothetical expenses are equal to the Portfolio’s annualized six month expense ratio of 0.10% for Elements Emerging Markets Portfolio — Class Y, multiplied by the average account value over the period, multiplied by 182/365 for comparison purposes. |
| | | | | | | | | | | | | | | | |
| | Elements Portfolios | | | | | | Annual Report | | | | | | May 31, 2019 | | |
| | | | |
130
|
| Additional Information (Unaudited) |
1. Disclosure Regarding Trustees and Officers
| | | | | | | | | | |
| Independent Trustees |
NAME
(YEAR OF BIRTH) | | POSITION(S)
HELD WITH
THE TRUST | | TERM OF
OFFICE AND
LENGTH OF
TIME SERVED(1) | | PRINCIPAL OCCUPATION(S)
DURING THE PAST 5 YEARS | | NUMBER OF
PORTFOLIOS
IN THE FUND
COMPLEX
OVERSEEN BY
TRUSTEE(2) | | OTHER
DIRECTORSHIPS /
TRUSTEESHIPS
HELD BY TRUSTEE
DURING THE
PAST 5 YEARS |
Jeffery Ekberg (1965) | | Trustee | | since 2016 | | Self-employed (personal investing) since 2011; Principal, TPG Capital, L.P. (private equity firm) until 2011; Chief Financial Officer, Newbridge Capital, LLC (subsidiary of TPG Capital, L.P.) until 2011 | | 15 | | None. |
| | | | | |
Daniel Charney (1970) | | Trustee | | since 2016 | | Co-President, Cowen and Company, Cowen, Inc. (financial services firm) since 2012 | | 15 | | None. |
| | | | | |
| | | | | | | | | | |
| Interested Trustee |
NAME
(YEAR OF BIRTH) | | POSITION(S)
HELD WITH
THE TRUST | | TERM OF
OFFICE AND
LENGTH OF
TIME SERVED(1) | | PRINCIPAL OCCUPATION(S)
DURING THE PAST 5 YEARS | | NUMBER OF
PORTFOLIOS
IN THE FUND
COMPLEX
OVERSEEN BY
TRUSTEE(2) | | OTHER
DIRECTORSHIPS /
TRUSTEESHIPS
HELD BY TRUSTEE
DURING THE
PAST 5 YEARS |
Ross Stevens(3) (1969) | | Trustee, Chairman | | since 2016 | | Founder and Chief Executive Officer of Stone Ridge since 2012 | | 15 | | None. |
| (1) | Each Trustee serves until resignation or removal from the Board. |
| (2) | The Fund Complex includes the Trust and Stone Ridge Trust II, Stone Ridge Trust III, Stone Ridge Trust IV and Stone Ridge Trust V, other investment companies managed by the Adviser. |
| (3) | Mr. Stevens is an “interested person” of the Trust, as defined in Section 2(a)(19) of the 1940 Act, due to his position with the Adviser. |
The Statement of Additional Information includes additional information about the Funds’ Trustees and is available free of charge upon request by calling the Fund toll free at 1.855.609.3680
| | | | | | |
| Officers of the Trust |
NAME
(YEAR OF BIRTH)
AND ADDRESS(1)(2) | | POSITION(S)
HELD
WITH THE TRUST | | TERM OF
OFFICE AND
LENGTH OF
TIME SERVED(3) | | PRINCIPAL OCCUPATION(S) DURING PAST 5 YEARS |
Ross Stevens (1969) | | President, Chief Executive Officer and Principal Executive Officer | | since 2015 | | Founder of Stone Ridge Asset Management LLC, Chief Executive Officer and President of the Adviser, since 2012. |
| | | |
Lauren D. Macioce (1978) | | Chief Compliance Officer, Secretary, Chief Legal Officer and Anti-Money Laundering Compliance Officer | | since 2016 | | General Counsel and Chief Compliance Officer of the Adviser, since 2016; prior to that Associate at Ropes & Gray LLP (law firm). |
| | | | | | | | | | | | | | | | |
| | Elements Portfolios | | | | | | Annual Report | | | | | | May 31, 2019 | | |
| | | | |
131
| | |
| Additional Information (Unaudited) | | |
| | | | | | |
| Officers of the Trust |
NAME
(YEAR OF BIRTH)
AND ADDRESS(1)(2) | | POSITION(S)
HELD
WITH THE TRUST | | TERM OF
OFFICE AND
LENGTH OF
TIME SERVED(3) | | PRINCIPAL OCCUPATION(S) DURING PAST 5 YEARS |
Anthony Zuco (1975) | | Treasurer, Principal Financial Officer, Chief Financial Officer and Chief Accounting Officer | | since 2018 | | Supervising Fund Controller at the Adviser, since 2013; prior to that Controller at Owl Creek Asset Management L.P. (investment advisory firm). |
| | | |
Alexander Nyren (1980) | | Assistant Secretary | | since 2018 | | Head of Reinsurance of the Adviser, since 2018; member of Reinsurance portfolio management team at the Adviser, since 2013. |
| | | |
David Thomas (1980) | | Assistant Treasurer | | since 2018 | | Member of Operations at the Adviser, since 2015; prior to that member of Operations at KCG holdings, Inc. (financial services firm). |
| | | |
Leson Lee (1975) | | Assistant Treasurer | | since 2019 | | Member of Operations at the Adviser, since 2018; prior to that Treasury Manager at Eton Park Capital Management (investment advisory firm). |
| | | |
Cathleen Hu (1983) | | Assistant Treasurer | | since 2019 | | Member of Operations at the Adviser, since 2015; prior to that Clearing Manager at KCG Holdings, Inc. (financial services firm). |
| (1) | Each Officer’s mailing address is c/o Stone Ridge Asset Management LLC, 510 Madison Avenue, 21st Floor, New York, NY 10022. |
| (2) | Each of the Officers is an affiliated person of the Adviser as a result of his or her position with the Adviser. |
| (3) | The term of office of each Officer is indefinite. |
2. Shareholder Notification of Federal Tax Status
For the fiscal year ended May 31, 2019, certain dividends paid by the Portfolios may be subject to a maximum tax rate of 15%, as provided by the Jobs and Growth Tax Relief Reconciliation Act of 2003. The percentage of dividends declared from ordinary income designated as qualified dividend income was as follows:
| | | | |
| | | |
Elements U.S. Portfolio | | | 96.01 | % |
Elements U.S. Small Cap Portfolio | | | 95.30 | % |
Elements International Portfolio | | | 51.34 | % |
Elements International Small Cap Portfolio | | | 46.99 | % |
Elements Emerging Markets Portfolio | | | 22.35 | % |
For corporate shareholders, the percentage of ordinary income distributions qualifying for the corporate dividend received deduction for the fiscal year ended May 31, 2019 was as follows:
| | | | |
| | | |
Elements U.S. Portfolio | | | 95.84 | % |
Elements U.S. Small Cap Portfolio | | | 94.64 | % |
Elements International Portfolio | | | 6.16 | % |
Elements International Small Cap Portfolio | | | 5.04 | % |
Elements Emerging Markets Portfolio | | | 13.55 | % |
| | | | | | | | | | | | | | | | |
| | Elements Portfolios | | | | | | Annual Report | | | | | | May 31, 2019 | | |
| | | | |
132
| | |
| Additional Information (Unaudited) | | |
The percentage of taxable ordinary income distributions that are designated as short-term capital gain distributions under Internal Revenue Section 871(k)(2)(C) for each Portfolio was as follows:
| | | | |
| | | |
Elements U.S. Portfolio | | | 0.00 | % |
Elements U.S. Small Cap Portfolio | | | 0.00 | % |
Elements International Portfolio | | | 34.63 | % |
Elements International Small Cap Portfolio | | | 35.61 | % |
Elements Emerging Markets Portfolio | | | 51.18 | % |
The percentage of taxable ordinary income distributions that are designated as interest related dividends under Internal Revenue Section 871(k)(1)(C) for each Portfolio was as follows:
| | | | |
| | | |
Elements U.S. Portfolio | | | 5.20 | % |
Elements U.S. Small Cap Portfolio | | | 9.94 | % |
Elements International Portfolio | | | 2.25 | % |
Elements International Small Cap Portfolio | | | 3.15 | % |
Elements Emerging Markets Portfolio | | | 4.43 | % |
Pursuant to Section 853 of the Internal Revenue Code, the following Portfolios elect to pass-through to shareholders the credit for taxes paid to eligible foreign countries, which may be less than the actual amount paid for financial statement purposes.
| | | | | | | | | | | | | | | | | | | | |
| | | | | | | | | PER SHARE | | | | |
| FUND | | GROSS FOREIGN
SOURCE INCOME | | | FOREIGN TAXES
PASSTHROUGH | | | GROSS FOREIGN
SOURCE INCOME | | | FOREIGN
TAXES
PASSTHROUGH | | | SHARES
OUTSTANDING AT
5/31/2019 | |
Elements International Portfolio | | | 14,896,638 | | | | 1,741,641 | | | | 0.2423834696 | | | | 0.028338273 | | | | 61,458,968 | |
Elements International Small Cap Portfolio | | | 6,133,384 | | | | 591,174 | | | | 0.1927027480 | | | | 0.018573899 | | | | 31,828,212 | |
3. Availability of Quarterly Portfolio Holdings Schedules
The Portfolios are required to file their complete schedule of portfolio holdings with the SEC for the first and third quarters of each fiscal year on Part F of FormN-PORT, which is available without charge on the SEC’s website,www.sec.gov or by calling 1.855.609.3680.
4. Proxy Voting Policies and Procedures and Proxy Voting Record
A description of the policies and procedures that the Portfolios use to determine how to vote proxies relating to portfolio securities is available without charge by calling 1.855.609.3680 and on the SEC’s websitewww.sec.gov. The Portfolios are required to file how they voted proxies related to portfolio securities during the most recent12-month period ended June 30. The information is available without charge, upon request by calling 1.855.609.3680 and on the SEC’s website,www.sec.gov.
| | | | | | | | | | | | | | | | |
| | Elements Portfolios | | | | | | Annual Report | | | | | | May 31, 2019 | | |
| | | | |
133
Investment Adviser
Stone Ridge Asset Management LLC
510 Madison Avenue, 21st Floor
New York, NY 10022
Independent Registered Public Accounting Firm
Ernst & Young LLP
220 South 6th Street
Minneapolis, MN 55402
Legal Counsel
Ropes & Gray LLP
Prudential Tower
800 Boylston Street
Boston, MA 02199
Custodians
U.S. Bank, N.A.
1555 North RiverCenter Drive, Suite 302
Milwaukee, WI 53212
Brown Brothers Harriman & Co.
50 Post Office Square
Boston, MA 02110
Distributor
ALPS Distributors, Inc.
1290 Broadway #1100
Denver, CO 80203
Administrator, Transfer Agent and Dividend Disbursing Agent
U.S. Bancorp Fund Services, LLC
doing business as U.S. Bank Global Fund Services
615 East Michigan Street
Milwaukee, WI 53202
| | | | | | |
 | | Elements Portfolios P.O. Box 701 Milwaukee, WI 53201-0701 855-609-3680 www.elementsfunds.com | | | XXANNU | |
Item 2. Code of Ethics.
The registrant has adopted a code of ethics that applies to the registrant’s principal executive officer and principal financial officer. The registrant has not made any substantive amendments to its code of ethics during the period covered by this report. The registrant has not granted any waivers from any provisions of the code of ethics during the period covered by this report.
A copy of the registrant’s Code of Ethics is filed herewith.
Item 3. Audit Committee Financial Expert.
The registrant’s board of trustees has determined that there is at least one audit committee financial expert serving on its audit committee. Jeffery Ekberg is the “audit committee financial expert” and is considered to be “independent” as each term is defined in Item 3 ofForm N-CSR.
Item 4. Principal Accountant Fees and Services.
The registrant has engaged its principal accountant to perform audit services, audit-related services, tax services and other services during the past two fiscal years. “Audit services” refer to performing an audit of the registrant’s annual financial statements or services that are normally provided by the accountant in connection with statutory and regulatory filings or engagements for those fiscal years. “Audit-related services” refer to the assurance and related services by the principal accountant that are reasonably related to the performance of the audit of the registrant’s annual financial statements and are not included as “audit services”. “Tax services” refer to professional services rendered by the principal accountant for tax compliance, tax advice, and tax planning including review of the Portfolios’ tax returns, asset diversification and income testing, excise taxes, and fiscal year end income calculations. “All other fees” refer to the aggregate fees for products and services provided by the principal accountant, other than the services reported in the foregoing three categories. The following table details the aggregate fees billed or expected to be billed for each of the last two fiscal years for audit fees, audit-related fees, tax fees and other fees by the principal accountant.
| | | | | | | | |
| | | FYE 5/31/2019 | | | FYE 5/31/2018 | |
Audit Fees | | $ | 196,750 | | | $ | 186,500 | |
Audit-Related Fees | | | — | | | | — | |
Tax Fees | | | 96,250 | | | | 94,250 | |
All Other Fees | | | — | | | | — | |
To the extent required by applicable law,pre-approval by the audit committee is needed for all audit and permissiblenon-audit services rendered to the registrant and all permissiblenon-audit services rendered to Stone Ridge Asset Management LLC (the “Adviser”) or to various entities either controlling, controlled by, or under common control with the Adviser that provide ongoing services to the registrant if the services relate directly to the operations and financial reporting of the registrant.Pre-approval is currently on anengagement-by-engagement basis.
1
The percentage of fees billed by Ernst & Young, LLP applicable tonon-audit services that were approved by the audit committee pursuant to paragraph (c)(7)(i)(C) of Rule2-01 of RegulationS-X (which permits waiver ofpre-approval, if certain conditions are satisfied) were as follows:
| | | | | | | | |
| | | FYE 5/31/2019 | | | FYE 5/31/2018 | |
Audit-Related Fees | | | 0 | % | | | 0 | % |
Tax Fees | | | 0 | % | | | 0 | % |
All Other Fees | | | 0 | % | | | 0 | % |
All of the principal accountant’s hours spent on auditing the registrant’s financial statements were attributed to work performed byfull-time permanent employees of the principal accountant.
The following table indicates thenon-audit fees billedor expected to be billed by the registrant’s accountant for services to the registrant and to the registrant’s investment adviser and any entity controlling, controlled by, or under common control with the registrant’s investment adviser that provides ongoing services to the registrant for the last two fiscal years of the registrant. The audit committee of the board of trustees has considered whether the provision of anynon-audit services that were rendered to the registrant’s investment adviser and any entity controlling, controlled by, or under common control with the registrant’s investment adviser that provides ongoing services to the registrant that were notpre-approved pursuant to paragraph (c)(7)(ii) of Rule2-01 of RegulationS-X is compatible with maintaining the principal accountant’s independence.
| | | | | | | | |
Non-Audit Related Fees | | FYE 5/31/2019 | | | FYE 5/31/2018 | |
Registrant | | $ | 96,250 | | | $ | 94,250 | |
Registrant’s Investment Adviser | | $ | 227,113 | | | $ | 203,622 | |
Item 5. Audit Committee of Listed Registrants.
Not applicable to registrants who are not listed issuers (as defined in Rule10A-3 under the Securities Exchange Act of 1934).
Item 6. Investments.
| (a) | Schedule of Investments is included as part of the report to shareholders filed under Item 1 of this Form. |
Item 7. Disclosure of Proxy Voting Policies and Procedures forClosed-End Management Investment Companies.
Not applicable toopen-end investment companies.
Item 8. Portfolio Managers ofClosed-End Management Investment Companies.
Not applicable toopen-end investment companies.
2
Item 9. Purchases of Equity Securities byClosed-End Management Investment Company and Affiliated Purchasers.
Not applicable toopen-end investment companies.
Item 10. Submission of Matters to a Vote of Security Holders.
Not Applicable.
Item 11. Controls and Procedures.
| (a) | The Registrant’s Principal Executive Officer and Principal Financial Officer have reviewed the Registrant’s disclosure controls and procedures (as defined in Rule30a-3(c) under the Investment Company Act of 1940 (the “Act”)) as of a date within 90 days of the filing of this report, as required by Rule30a-3(b) under the Act and Rules13a-15(b) or15d-15(b) under the Securities Exchange Act of 1934. Based on their review, such officers have concluded that the disclosure controls and procedures are effective in ensuring that information required to be disclosed in this report is appropriately recorded, processed, summarized and reported and made known to them by others within the Registrant and by the Registrant’s service provider. |
| (b) | There were no changes in the Registrant’s internal control over financial reporting (as defined in Rule30a-3(d) under the Act) that occurred during the period covered by this report that have materially affected, or are reasonably likely to materially affect, the Registrant’s internal control over financial reporting. |
Item 12. Disclosure of Securities Lending Activities forClosed-End Management Investment Companies
Not applicable toopen-end investment companies.
Item 13. Exhibits.
| (a) | (1)Any code of ethics or amendment thereto, that is the subject of the disclosure required by Item 2, to the extent that the registrant intends to satisfy Item 2 requirements through filing an exhibit.Filed herewith. |
(2)A separate certification for each principal executive officer and principal financial officer pursuant to Section 302 of the Sarbanes-Oxley Act of 2002.Filed herewith.
(3)Any written solicitation to purchase securities under Rule 23c-1 under the Act sent or given during the period covered by the report by or on behalf of the registrant to 10 or more persons.Not applicable.
(4)Change in the registrant’s independent public accountant.There was no change in the registrant’s independent public accountant for the period covered by this report.
| (b) | Certifications pursuant to Section 906 of the Sarbanes-Oxley Act of 2002. Furnished herewith. |
3
SIGNATURES
Pursuant to the requirements of the Securities Exchange Act of 1934 and the Investment Company Act of 1940, the registrant has duly caused this report to be signed on its behalf by the undersigned, thereunto duly authorized.
| | |
| (Registrant)Stone Ridge Trust |
| |
| By (Signature and Title)* | | /s/ Ross Stevens |
| | Ross Stevens, President, Chief Executive Officer and Principal Executive Officer |
|
| Date8/6/19 |
Pursuant to the requirements of the Securities Exchange Act of 1934 and the Investment Company Act of 1940, this report has been signed below by the following persons on behalf of the registrant and in the capacities and on the dates indicated.
| | |
| By (Signature and Title)* | | /s/ Ross Stevens |
| | Ross Stevens, President, Chief Executive Officer and Principal Executive Officer |
|
| Date8/6/19 |
| |
| By (Signature and Title)* | | /s/ Anthony Zuco |
| | Anthony Zuco, Treasurer, Principal Financial Officer, Chief Financial Officer and Chief Accounting Officer |
|
| Date8/6/19 |
| * | Print the name and title of each signing officer under his or her signature. |
4