As filed with the Securities and Exchange Commission on 21 March 2016
UNITED STATES
SECURITIES AND EXCHANGE COMMISSION
Washington, D.C. 20549
Form 20-F
(Mark One)
☐REGISTRATION STATEMENT PURSUANT TO SECTION 12(b) OR 12(g) OF THE SECURITIES EXCHANGE ACT OF 1934
or
☒ ANNUAL REPORT PURSUANT TO SECTION 13 OR 15(d) OF THE SECURITIES EXCHANGE ACT OF 1934
For the fiscal year ended 31 December 2015
or
☐TRANSITION REPORT PURSUANT TO SECTION 13 OR 15(d) OF THE SECURITIES EXCHANGE ACT OF 1934
For the transition period from to
or
☐SHELL COMPANY REPORT PURSUANT TO SECTION 13 OR 15(d) OF THE SECURITIES EXCHANGE ACT OF 1934
Date of event requiring this shell company report
For the transition period from to
Commission file number: 001-35785
Sibanye Gold Limited
(Exact name of registrant as specified in its charter)
Republic of South Africa
(Jurisdiction of incorporation or organization)
Libanon Business Park
1 Hospital Street (off Cedar Avenue)
Libanon, Westonaria, 1780
South Africa.
011-27-11-278-9600
(Address of principal executive offices)
With copies to:
Charl Keyter
Chief Financial Officer
Sibanye Gold Limited
Tel: 011-27-11-278-9700
Fax: 011-27-11-278-9863
Libanon Business Park
1 Hospital Street (off Cedar Avenue)
Libanon, Westonaria, 1780
South Africa
(Name, Telephone, E-mail and/or Facsimile number and Address of Company Contact Person)
and
Thomas B. Shropshire, Jr.
Linklaters LLP
Tel: 011-44-20-7456-3223
Fax: 011-44-20-7456-2222
One Silk Street
London EC2Y 8HQ
United Kingdom
Securities registered or to be registered pursuant to Section 12(b) of the Act
| | |
Title of Each Class
Ordinary shares of no par value each
American Depositary Shares, each representing four ordinary shares | Name of Each Exchange on Which Registered
New York Stock Exchange*
New York Stock Exchange |
*Not for trading, but only in connection with the registration of the American Depositary Shares pursuant to the requirements of the Securities and Exchange Commission. Securities registered or to be registered pursuant to Section 12(g) of the Act None (Title of Class) Securities for which there is a reporting obligation pursuant to Section 15(d) of the Act None (Title of Class) Indicate the number of outstanding shares of each of the issuer’s classes of capital or common stock
as of the close of the period covered by the Annual Report 916,140,552 ordinary shares of no par value each |
Indicate by check mark if the registrant is a well-known seasoned issuer, as defined in Rule 405 of the Securities Act: Yes ☒ No If this report is an annual or transition report, indicate by check mark if the registrant is not required to file reports pursuant to Section 13 or 15(d) of the Securities Exchange Act of 1934. Yes No ☒ Note – Checking the box above will not relieve any registrant required to file reports pursuant to Section 13 or 15(d) of the Securities Exchange Act of 1934 from their obligations under those Sections. Indicate by check mark whether the registrant (1) has filed all reports required to be filed by Section 13 or 15(d) of the Securities Exchange Act of 1934 during the preceding 12 months (or for such shorter period that the registrant was required to file such reports), and (2) has been subject to such filing requirements for the past 90 days. ☒ Yes No Indicate by check mark whether the registrant has submitted electronically and posted on its corporate Web site, if any, every Interactive Data File required to be submitted and posted pursuant to Rule 405 of Regulation S-T (§232.405 of this chapter) during the preceding 12 months (or for such shorter period that the registrant was required to submit and post such files)*. Yes No Indicate by check mark whether the registrant is a large accelerated filer, an accelerated filer, or a non-accelerated filer. See definition of “accelerated filer and large accelerated filer” in Rule 12b-2 of the Exchange Act. (Check one): Large accelerated filer ☒Accelerated filer Non-accelerated filer Indicate by check mark which basis of accounting the registrant has used to prepare the financial statements included in this filing: |
US GAAP | International Financial Reporting Standards as issued by the International Accounting Standards Board ☒ | Other |
If “Other” has been checked in response to the previous question, indicate by check mark which financial statement item the registrant has elected to follow: Item 17 Item 18 If this is an annual report, indicate by check mark whether the registrant is a shell company (as defined in Rule 12b-2 of the Exchange Act). Yes No ☒ (APPLICABLE ONLY TO ISSUERS INVOLVED IN BANKRUPTCY PROCEEDINGS DURING THE PAST FIVE YEARS) Indicate by check mark whether the registrant has filed all documents and reports required to be filed by Sections 12, 13 or 15(d) of the Securities Exchange Act of 1934 subsequent to the distribution of securities under a plan confirmed by a court. Yes No |
* This requirement does not apply to the registrant
FORM 20-F CROSS REFERENCE GUIDE
| | | | | | |
Item | | Form 20-F Caption | | Location in this document | | Page |
1 | | Identity of directors, senior management and advisers | | NA | | NA |
2 | | Offer statistics and expected timetable | | NA | | NA |
3 | | Key information | | | | |
| | (a) Selected Financial Data | | Annual Financial Report—Overview——Five year financial performance | | 76-77 |
| | (b) Capitalisation and indebtedness | | NA | | NA |
| | (c) Reasons for the offer | | NA | | NA |
| | (d) Risk factors | | Further Information—Risk Factors | | 183-195 |
4 | | Information on the Company | | | | |
| | (a) History and Development of the Company | | Annual Financial Report—Administrative Details—Administration and corporate information | | 182 |
| | | | Integrated Annual Report—About Sibanye’s reports | | 12 |
| | | | Integrated Annual Report—Group profile | | 13-14 |
| | | | Integrated Annual Report—Perspective from the Chair | | 18-19 |
| | | | Integrated Annual Report—Chief Executive’s review | | 20-23 |
| | | | Annual Financial Report—Accountability—Directors’ report | | 111-115 |
| | | | Annual Financial Report—Overview——Five year financial performance | | 76-77 |
| | | | Integrated Annual Report—Capitals overview and business model | | 24-25 |
| | | | Integrated Annual Report—Grow—Acquisitions and funding model | | 72 |
| | | | Annual Financial Report— Overview—Management’s discussion and analysis of the financial statements—Acquisitions | | 80-82 |
| | | | Annual Financial Report—Annual Financial Statements—Notes to the consolidated financial statements—Note 12: Acquisitions | | 151-153 |
| | | | Further Information—Acquisition Assets | | 202-207 |
| | (b) Business Overview | | Integrated Annual Report—Group profile | | 13-14 |
| | | | Integrated Annual Report—Capitals overview and business model | | 24-25 |
| | | | Integrated Annual Report—Optimise | | 39-50 |
| | | | Integrated Annual Report—Sustain—Manage environmental impact | | 60-64 |
| | | | Integrated Annual Report—Material issues | | 26-38 |
| | | | Annual Financial Report—Overview——Five year financial performance | | 76-77 |
| | | | | | |
Item | | Form 20-F Caption | | Location in this document | | Page |
| | | | Further Information—Environmental and Regulatory Matters | | 208-212 |
| | (c) Organisational structure | | Integrated Annual Report—Group profile | | 13-14 |
| | | | Annual Financial Report—Annual Financial Statements—Notes to the consolidated financial statements—Note 1.3: Consolidation | | 133-134 |
| | (d) Property, plant and equipment | | Integrated Annual Report—Optimise—Optimise and integrate operations | | 39-45 |
| | | | Further Information—Reserves of Sibanye as of 31 December 2015 | | 196-201 |
| | | | Further Information—Acquisition Assets | | 202-207 |
| | | | Further Information—Environmental and Regulatory Matters | | 208-212 |
| | | | Annual Financial Report—Annual Financial Statements—Notes to the consolidated financial statements—Note 11: Property, plant and equipment | | 146-150 |
4A | | Unresolved staff comments | | NA | | NA |
5 | | Operating and financial review and prospects | | | | |
| | (a) Operating results | | Annual Financial Report—Overview—Management’s discussion and analysis of the financial statements | | 78-95 |
| | | | Annual Financial Report—Annual Financial Statements—Consolidated income statement | | 127 |
| | | | Annual Financial Report—Annual Financial Statements—Consolidated statement of financial position | | 128 |
| | | | Annual Financial Report—Annual Financial Statements—Consolidated statement of cash flows | | 130 |
| | (b) Liquidity and capital resources | | Annual Financial Report—Overview—Management’s discussion and analysis of the financial statements—Liquidity and capital resources | | 91-94 |
| | (c) Research and development, patents and licences, etc. | | NA | | NA |
| | (d) Trend information | | Annual Financial Report—Overview—Management’s discussion and analysis of the financial statements | | 78-95 |
| | (e) Off-balance sheet arrangements | | Annual Financial Report—Overview—Management’s discussion and analysis of the financial statements—Off balance sheet arrangements and contractual commitments | | 94 |
| | (f) Tabular disclosure of contractual obligations | | Annual Financial Report—Overview—Management’s discussion and analysis of the financial statements—Off balance sheet arrangements and contractual commitments | | 94 |
| | (g) Safe harbour | | Forward-looking statements | | 9 |
| | | | | | |
Item | | Form 20-F Caption | | Location in this document | | Page |
6 | | Directors, senior management and employees | | | | |
| | (a) Directors and senior management | | Annual Financial Report—Accountability—Board of directors and management | | 98-102 |
| | (b) Compensation | | Annual Financial Report—Accountability—Remuneration report | | 118-125 |
| | (c) Board practices | | Annual Financial Report—Accountability—Corporate governance report | | 103-108 |
| | (d) Employees | | Integrated Annual Report—Optimise—Develop productive, skilled and engaged workforce | | 46-50 |
| | (e) Share ownership | | Annual Financial Report—Accountability—Remuneration report | | 118-125 |
| | | | Annual Financial Report—Overview—Management’s discussion and analysis of the financial statements—Share-based payments | | 89 |
| | | | Annual Financial Report—Annual Financial Statements—Notes to the consolidated financial statements—Note 6: Share-based payments | | 139-142 |
7 | | Major Shareholders and Related Party Transactions | | | | |
| | (a) Major shareholders | | Annual Financial Report—Administrative Details—Shareholder ownership | | 180-181 |
| | | | Integrated Annual Report—Group profile | | 13-14 |
| | | | Further Information—The Offer and Listing | | 214-215 |
| | (b) Related party transactions | | Annual Financial Report—Accountability—Directors’ report | | 111-115 |
| | | | Annual Financial Report—Annual Financial Statements—Notes to the consolidated financial statements—Note 34: Related-party transactions | | 177-178 |
| | (c) Interests of experts and counsel | | NA | | NA |
8 | | Financial information | | | | |
| | (a) Consolidated statements and other financial information | | Annual Financial Report—Overview—Management’s discussion and analysis of the financial statements | | 78-95 |
| | | | Annual Financial Report—Annual Financial Statements—Consolidated income statement | | 127 |
| | | | Annual Financial Report—Annual Financial Statements—Consolidated statement of financial position | | 128 |
| | | | Annual Financial Report—Annual Financial Statements—Consolidated statement of cash flows | | 130 |
| | | | Annual Financial Report—Accountability—Directors’ report—Financial affairs—Dividend policy | | 112 |
| | | | | | |
Item | | Form 20-F Caption | | Location in this document | | Page |
| | | | Further information—Financial information—Dividend policy and dividend distributions | | 213 |
| | (b) Significant Changes | | NA | | NA |
9 | | The Offer and Listing | | | | |
| | (a) Offer and listing details | | Further Information—The Offer and Listing | | 214-215 |
| | (b) Plan of distribution | | NA | | NA |
| | (c) Markets | | Further Information—The Offer and Listing | | 214-215 |
| | (d) Selling shareholders | | NA | | NA |
| | (e) Dilution | | NA | | NA |
| | (f) Expenses of the issue | | NA | | NA |
10 | | Additional information | | | | |
| | (a) Share capital | | NA | | NA |
| | (b) Memorandum and articles of association | | Further Information—Additional Information—Memorandum of Incorporation | | 216 |
| | (c) Material contracts | | Further Information—Additional Information—Material Contracts | | 216-218 |
| | (d) Exchange controls | | Further Information—Additional Information—South African Exchange Control Limitations Affecting Security Holders | | 223 |
| | | | Further Information—Environmental and Regulatory Matters—Exchange Controls | | 212 |
| | (e) Taxation | | Further Information—Additional Information—Taxation | | 223-226 |
| | (f) Dividends and paying agents | | NA | | NA |
| | (g) Statement by experts | | NA | | NA |
| | (h) Documents on display | | Further Information—Additional Information—Documents on display | | 226-227 |
| | (i) Subsidiary information | | NA | | NA |
11 | | Quantitative and qualitative disclosures about market risk | | Annual Financial Report—Annual Financial Statements—Notes to the Consolidated Financial Statements—Note 33: Risk Management Activities | | 173-177 |
12 | | Description of securities other than equity securities | | | | |
| | (a) Debt securities | | NA | | NA |
| | (b) Warrants and rights | | NA | | NA |
| | (c) Other securities | | NA | | NA |
| | (d) American depositary shares | | Further Information—Additional Information—American Depositary Shares | | 218-223 |
13 | | Defaults, dividend arrearages and delinquencies | | NA | | NA |
14 | | Material modifications to the rights of security holders and use of proceeds | | NA | | NA |
| | | | | | |
Item | | Form 20-F Caption | | Location in this document | | Page |
15 | | Controls and procedures | | Further Information—Controls and Procedures | | 228 |
16A | | Audit Committee Financial Expert | | Annual Financial Report—Accountability—Corporate governance report—Board committees—The Audit Committee | | 105-106 |
16B | | Code of ethics | | Annual Financial Report—Accountability—Corporate governance report—Key Standards and Principles | | 103 |
16C | | Principal accountant fees and services | | Annual Financial Report—Accountability—Report of the Audit Committee | | 109-110 |
16D | | Exemptions from the listing standards for audit committees | | NA | | NA |
16E | | Purchase of equity securities by the issuer and affiliated purchasers | | None | | |
16F | | Change in registrant’s certifying accountant | | NA | | NA |
16G | | Corporate governance | | Annual Financial Report—Accountability—Corporate governance report—Corporate Governance | | 108 |
16H | | Mine safety disclosure | | NA | | NA |
17 | | Financial statements | | NA | | NA |
18 | | Financial statements | | Annual Financial Report—Accountability—Report of Independent Registered Public Accounting Firm | | 117 |
| | | | Annual Financial Report—Annual Financial Statements—Consolidated income statement | | 127 |
| | | | Annual Financial Report—Annual Financial Statements—Consolidated statement of financial position | | 128 |
| | | | Annual Financial Report—Annual Financial Statements—Consolidated Statement of Changes in Equity | | 129 |
| | | | Annual Financial Report—Annual Financial Statements—Consolidated statement of cash flows | | 130 |
| | | | Annual Financial Report—Annual Financial Statements—Notes to the consolidated financial statements | | 131-178 |
19 | | Exhibits | | Exhibits | | 229-230 |
PRESENTATION OF FINANCIAL AND OTHER INFORMATION
Historical Consolidated Financial Statements
Sibanye Gold Limited (Sibanye) is a South African company and all of our existing operations are located in South Africa. Accordingly, our books of account are maintained in South African Rand and our annual financial statements are prepared in accordance with International Financial Reporting Standards (IFRS), as issued by the International Accounting Standards Board, as prescribed by law. These financial statements are distributed to shareholders and are submitted to the Johannesburg Stock Exchange (JSE) and the New York Stock Exchange (NYSE).
In previous years, the IFRS financial statements were furnished to the Securities and Exchange Commission (SEC) on Form 6-K. Until 31 December 2013, Sibanye also prepared annual financial statements in accordance with United States Generally Accepted Accounting Principles (US GAAP) for inclusion in the annual report on Form 20-F, which were translated into US dollars. Sibanye has prepared the annual financial statements contained in this annual report on Form 20-F for the fiscal years ended 31 December 2015, 2014 and 2013 and as at 31 December 2015, 2014 and 2013 in accordance with IFRS. Sibanye changed to reporting in accordance with IFRS in our Form 20-F to remove duplication, improve efficiencies as we report in accordance with IFRS in South Africa, our home country, and align with the majority of our peers.
The audited consolidated financial statements of Sibanye as at and for the fiscal years ended 31 December 2015, 2014 and 2013 (the Consolidated Financial Statements) have been prepared using the historical results of operations, assets and liabilities attributable to Sibanye and all of its subsidiaries (the Sibanye Group). In addition, the Consolidated Financial Statements include historical charges from Gold Fields Limited (Gold Fields). The Consolidated Financial Statements have been prepared under the historical cost convention, except for financial assets and financial liabilities (including derivative financial instruments), which are measured at fair value through profit or loss or through the fair value adjustment reserve in equity.
Non-IFRS Measures
The financial information in this annual report includes certain measures that are not defined by IFRS, including “operating costs”, “operating margin,”, “earnings before interest, tax, depreciation and amortisation” (EBITDA), “total cash cost”, “All-in sustaining cost”, “All-in cost”, “All-in cost margin”, “headline earnings per share”, “free cash flow” and “net debt” (each as defined below or in “Annual Financial Report—Overview—Five year financial performance”). These measures are not measures of financial performance or cash flows under IFRS and may not be comparable to similarly titled measures of other companies. These measures have been included for the reasons described below or in “Annual Financial Report—Overview—Five year financial performance” and should not be considered by investors as alternatives to costs of sales, net operating profit, profit before taxation, cash from operating activities or any other measure of financial performance presented in accordance with IFRS.
Operating costs is defined as cost of sales excluding amortisation and depreciation. Operating margin is defined as revenue minus operating costs, divided by revenue. Free cash flow is defined as cash flows from operating activities before dividends paid, less additions to property, plant and equipment. Management considers free cash flow to be an indicator of cash available for repaying debt, funding exploration and paying dividends.
See “Annual Financial Report—Overview—Five year financial performance—Footnote 1” and “Annual Financial Report—Overview—Five year financial performance—Footnote 2” for more information.
Conversion Rates
Certain information in this annual report presented in Rand has been translated into US dollars. Unless otherwise stated, the conversion rate for these translations is R15.54/US$1.00 which was the closing rate on 31 December 2015. By including the US dollar equivalents, Sibanye is not representing that the Rand amounts actually represent the US dollar amounts shown or that these amounts could be converted into US dollars at the rates indicated.
The Acquisitions of the Rustenburg Operations and Aquarius
On 9 September 2015, Sibanye announced that it entered into an agreement with Rustenburg Platinum Mines Limited (RPM), a wholly owned subsidiary of Anglo American Platinum Limited (Anglo American Platinum) to acquire the Bathopele, Siphumelele (including Khomanani), and Thembelani (including Khuseleka) mining operations, two concentrating plants, an on-site chrome recovery plant, the Western Limb Tailings Retreatment Plant, associated surface infrastructure and related assets and liabilities on a going concern basis (the Rustenburg Operations) (the Rustenburg Transaction).
On 6 October 2015, Sibanye announced a cash offer of US$0.195 per share for the entire issued share capital of Aquarius (the Aquarius Transaction and, together with the Rustenburg Transaction, the Acquisitions). Aquarius owns stakes in the Kroondal mine and Platinum Mile retreatment facilities near Rustenburg in South Africa and the Mimosa joint venture with Impala Platinum in Zimbabwe. Both Acquisitions remain subject to conditions precedent.
This annual report contains operational and financial information regarding the Rustenburg Operations and the operations of Aquarius which have been extracted without material adjustment from the publicly available information regarding these operations published by Anglo American Platinum and Aquarius, respectively. Sibanye has not independently verified the completeness or accuracy of this information and such information was not prepared for the purpose of this annual report.
The ore reserve statements of the Rustenburg Operations and Aquarius have not been included in this annual report because they have not been prepared in accordance with Industry Guide 7. Management believes that the Acquisitions will add a substantial amount of platinum group metals (PGMs) (4E) to Sibanye’s ore reserves.
Investors should note that the Acquisitions remain subject to conditions precedent, including obtaining clearances from the DMR with regard to the Rustenburg Operations.
Market Information
This annual report includes industry data about Sibanye’s markets obtained from industry surveys, industry publications, market research and other publicly available third-party information. Industry surveys and industry publications generally state that the information they contain has been obtained from sources believed to be reliable but that the accuracy and completeness of such information is not guaranteed. Sibanye and its advisers have not independently verified this data.
In addition, in many cases statements in this annual report regarding the gold mining industry and Sibanye’s position in that industry have been made based on internal surveys, industry forecasts, market research, as well as Sibanye’s own experiences. While these statements are believed by Sibanye to be reliable, they have not been independently verified.
DEFINED TERMS AND CONVENTIONS
In this annual report, all references to “we”, “us” and “our” refer to Sibanye and the Sibanye Group, as applicable. On 18 February 2013, the board of directors of Gold Fields completed the separation of its wholly-owned subsidiary, Sibanye (formerly known as GFI Mining South Africa Proprietary Limited (GFIMSA)), into an independent, publicly traded company (the Spin-off). The Spin-off was achieved by way of Gold Fields making a distribution on a pro rata basis of one Sibanye share for every one Gold Fields share (whether held in the form of shares, American Depositary Receipts (ADRs) or international depositary receipts) to Gold Fields shareholders, registered as such in Gold Fields’ register at close of business on 15 February 2013, in terms of section 46 of the South African Companies Act, 2008 (Act No 71 of 2008) (the Companies Act), section 46 of the Income Tax Act and the JSE Listing Requirements. The board of directors of Gold Fields passed the resolution necessary to implement the Spin-off on 12 December 2012, and Sibanye shares were listed on the JSE as well as on the NYSE on 11 February 2013. As of the Spin-off date, Gold Fields and Sibanye were independent, publicly traded companies and with separate public ownership, boards of directors and management. Results of operations for the periods prior to the Spin-off date are for GFIMSA when it was operated as a wholly-owned subsidiary of Gold Fields.
In this annual report, all references to “fiscal 2016” and “2016” are to the fiscal year ending 31 December 2016, all references to “fiscal 2015” and “2015” are to the audited fiscal year ended 31 December 2015, all references to “fiscal 2014” and “2014” are to the audited fiscal year ended 31 December 2014 and all references to “fiscal 2013” and “2013” are to the audited fiscal year ended 31 December 2013.
In this annual report, all references to “South Africa” are to the Republic of South Africa, all references to the “United States” and “US” are to the United States of America, its territories and possessions and any state of the United States and the District of Columbia, all references to the “United Kingdom” and “UK” are to the United Kingdom of Great Britain and Northern Ireland and all references to “Zimbabwe” are to the Republic of Zimbabwe.
In this annual report, all references to the “DMR” are references to the South African Department of Mineral Resources, the government body responsible for regulating the mining industry in South Africa.
This annual report contains descriptions of gold mining and the gold mining industry, including descriptions of geological formations and mining proceeds. In order to facilitate a better understanding of these descriptions, this annual report contains a glossary defining a number of technical and geological terms.
In this annual report, gold production figures are provided in kilograms, which are referred to as “kg”, or in troy ounces, which are referred as “ounces” or “oz”. Ore grades are provided in grams per metric ton, which are referred to as “grams per ton” or “g/t.” All references to “tons”, “tonnes” or “t” in this annual report are to metric tons.
In this annual report, “R”, “Rand” and “rand” refer to the South African Rand and “Rand cents” and “SA cents” refers to subunits of the South African Rand, “$”, “US$”, “US dollars” and “dollars” refer to United States dollars and “US cents” refers to subunits of the US dollar, “£”, “GBP” and “pounds sterling” refer to British pounds and “pence” refers to the subunits of the British pound.
FORWARD-LOOKING STATEMENTS
This annual report contains forward-looking statements within the meaning of Section 27A of the Securities Act and Section 21E of the US Securities Exchange Act of 1934, as amended (the Exchange Act) with respect to our financial condition, results of operations, business strategies, operating efficiencies, competitive position, growth opportunities for existing services, plans and objectives of management, markets for stock and other matters.
These forward-looking statements, including, among others, those relating to our future business prospects, revenues and income, wherever they may occur in this annual report and the exhibits to this annual report, are necessarily estimates reflecting the best judgment of our senior management and involve a number of risks and uncertainties that could cause actual results to differ materially from those suggested by the forward-looking statements. As a consequence, these forward-looking statements should be considered in light of various important factors, including those set forth in this annual report. Important factors that could cause actual results to differ materially from estimates or projections contained in the forward-looking statements include, without limitation:
| · | | the occurrence of labour disruptions and industrial actions; |
| · | | the outcome and consequence of any potential or pending litigation or regulatory proceedings or other environmental, health or safety issues; |
| · | | the occurrence of temporary stoppages of mines for safety incidents and unplanned maintenance; |
| · | | the occurrence of hazards associated with underground and surface gold and uranium mining; |
| · | | changes in relevant government regulations, particularly environmental, tax, health and safety regulations and new legislation affecting water, mining, mineral rights and business ownership, including any interpretation thereof which may be subject to dispute; |
| · | | economic, business, political and social conditions in South Africa and elsewhere; |
| · | | power disruption, constraints and cost increases; |
| · | | the ability of Sibanye to comply with requirements that it operate in a sustainable manner; |
| · | | the ability to achieve anticipated efficiencies and other cost savings in connection with past and future acquisitions, as well as at existing operations; |
| · | | the completion of the Acquisitions of the Rustenburg Operations and Aquarius and the risks associated with platinum mining; |
| · | | supply chain shortages and increases in the price of production inputs; |
| · | | changes in the market price of gold and/or uranium; |
| · | | fluctuations in exchange rates, currency devaluations, inflation and other macro-economic monetary policies; |
| · | | failure of Sibanye’s information technology and communications systems; |
| · | | changes in assumptions underlying Sibanye’s estimation of its current mineral reserves; |
| · | | the success of Sibanye’s business strategy, exploration and development activities; |
| · | | the availability, terms and deployment of capital or credit; |
| · | | Sibanye’s ability to hire and retain senior management or sufficient technically skilled employees, as well as its ability to achieve sufficient representation of historically disadvantaged South Africans in its management positions; |
| · | | the adequacy of Sibanye’s insurance coverage; |
| · | | any social unrest, sickness or natural or man-made disaster at informal settlements in the vicinity of some of Sibanye’s operations; and |
| · | | the impact of HIV, tuberculosis and other contagious diseases. |
We undertake no obligation to update publicly or release any revisions to these forward-looking statements to reflect events or circumstances after the date of this annual report or to reflect the occurrence of unanticipated events.
Integrated annual report
Contents
| |
Sibanye Gold Integrated Annual Report 2015 | 11 |
ABOUT SIBANYE’S REPORTS
THE 2015 SUITE OF REPORTS
covers the financial year
from 1 January 2015 to 31 December 2015.
Sibanye Gold Limited (Sibanye or the Group) is listed on the Main Board of the Johannesburg Stock Exchange (JSE) (ordinary shares) and on the New York Stock Exchange (NYSE) through an American Depositary Receipt (ADR) programme.
REPORTING PHILOSOPHY
The reports are produced to provide stakeholders with transparent insight into the Group’s strategy, the business and its performance over the past year. Stakeholders are thus able to make informed decisions on Sibanye’s ability to create and sustain value.
In this integrated report, Sibanye has endeavoured to build on the information provided in last year’s report. The Group has also sought to be more focused and concise in its reporting. In this regard, Sibanye has produced its annual financial statements as a separate document, the
Annual Financial Report 2015. This report is focused on Sibanye’s strategy, its most material risks and issues, and its related performance and outlook.
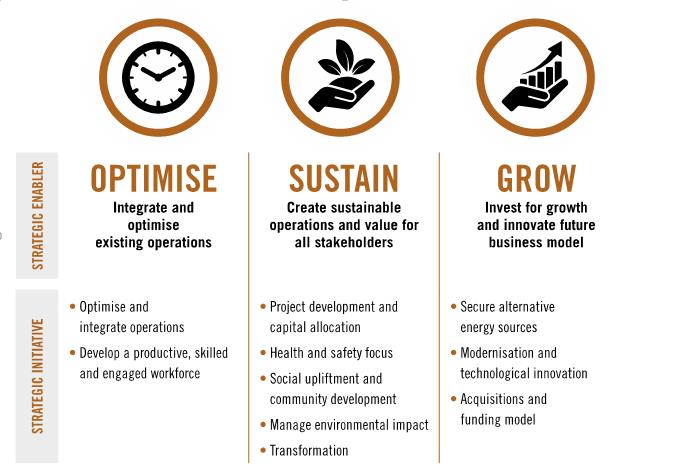
The theme of this year’s integrated annual report is based on the strategic enablers ‘optimise, sustain and grow’, illustrating how Sibanye has optimised its business so as to sustain and grow the value it creates, and its dividends in particular. The integrated annual report provides an account of Sibanye’s most material risks and opportunities. The Group’s materiality determination process is explained in Integrated Annual Report–Material issues. Sibanye considers an issue to be material if it substantially affects the Group’s ability to create and sustain value in the short, medium and long term. Where external entities substantially influence Sibanye’s business, their real and potential impacts are also discussed in the report.
| |
Sibanye Gold Integrated Annual Report 2015 | 12 |
Group PROFILE
Sibanye is a primarily South Africa-focused mining company committed to paying industry-leading dividends.
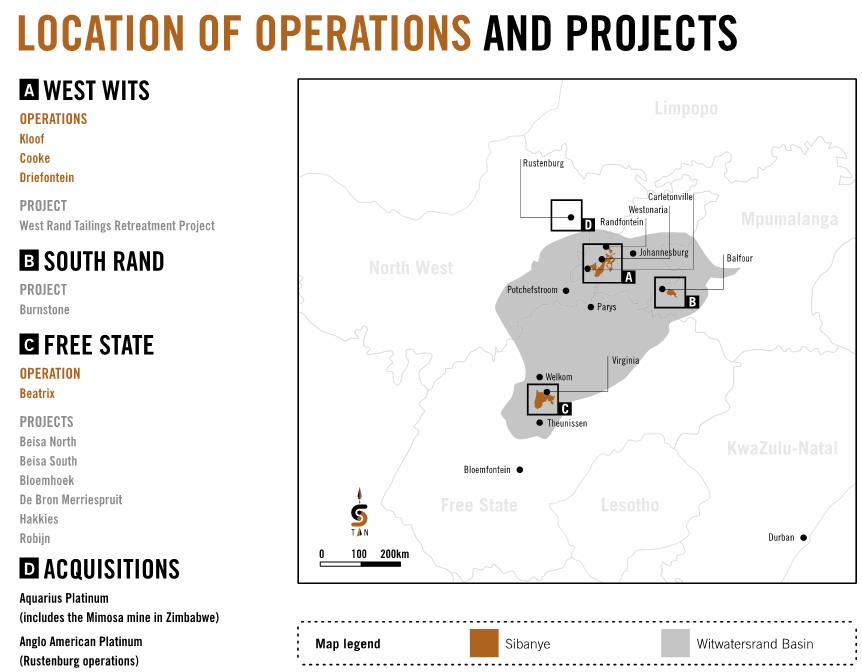
Sibanye is an independent mining group – domiciled in and focused on South Africa – which currently owns and operates high-quality gold and uranium operations and projects throughout the Witwatersrand Basin. The Group’s corporate office is located close to Westonaria, in the province of Gauteng, near its West Wits operations.
As a responsible corporate citizen, Sibanye fosters and maintains constructive engagement with all stakeholders in order to deliver on its vision to deliver superior value to all of its stakeholders, to maintain its licence to operate, and ultimately for the long-term success and sustainability of the business.
The Group currently owns and operates four underground and surface gold operations in South Africa – the Cooke, Driefontein and Kloof operations in the West Witwatersrand region, and the Beatrix Operation in the southern Free State province. In addition to its mining activities, Sibanye owns and manages significant extraction and processing facilities at its operations, where gold-bearing ore is treated and beneficiated to produce gold doré.
Sibanye is currently investing in a number of organic projects. Those currently being developed include the Kloof and Driefontein below infrastructure projects on the West Rand and the Burnstone project on the South Rand of Gauteng province. Engineering design is underway on the West Rand Tailings Retreatment Project (WRTRP) and financing options are being considered for this project, which awaits environmental permits before it is submitted to the Board for approval. A dedicated projects team continues to assess and refine plans for projects, including Beisa, Bloemhoek and De Bron Merriespruit in the Free State. For a more detailed account of these projects, see Integrated Annual Report–Sustain–Project Development and Capital Allocation.
In line with Sibanye’s strategy to create value for stakeholders and enhance or sustain its dividend, it entered into two separate transactions to acquire the Rustenburg platinum assets from Anglo American Platinum Limited (Rustenburg Operations) and Aquarius Platinum Limited (Aquarius) in 2015. These transactions are expected to be finalised during the course of 2016.
Shareholder base and information
The Group’s primary listing is on the JSE, trading under the share code SGL, where it is a constituent of the FTSE/JSE Responsible Investment Index. The Group has a secondary ADR listing on the NYSE, trading under the ticker code SBGL. Each ADR is equivalent to four ordinary shares.
At 31 December 2015, Sibanye had issued share capital of 916,140,552 shares (2014: 898,840,196) –1,000,000,000 authorised – and market capitalisation of approximately R20.9 billion (2014: R20.3 billion) or US$1.3 billion (2014: US$1.8 billion).
The Group’s diverse shareholder base predominantly comprises institutional investors in China (20%), South Africa (32%), the United States (35%), the United Kingdom (5%), the rest of Europe (5%) and the rest of the world (3%) at 31 December 2015. Sibanye has 80% free float and its three largest institutional shareholders (holding 23% of the Group) at 31 December 2015 were the Public Investment Corporation (SOC) Limited (PIC) (8%), Allan Gray Proprietary Limited (Allan Gray) (8%) and Van Eck Associates Corporation (7%).
The Group is committed to transformation and is guided by the Broad-Based Socio-Economic Empowerment Charter for the South African Mining and Minerals Industry (Mining Charter). In 2004, Gold Fields of South Africa Limited (Gold Fields) undertook a black economic empowerment (BEE) transaction, transferring an amount equivalent to 15% of its equity from Sibanye, formerly GFI Mining South Africa Proprietary Limited (GFI Mining South Africa), to Mvelaphanda Gold Proprietary Limited (Mvelaphanda Gold). In 2010, a further 10% of equity was allocated to an employee share ownership plan (ESOP) and another 1% in an empowerment deal. At the end of 2015, 26,444 employees were participants in the ESOP.
OUR PRODUCTS AND MARKETS
Sibanye mines, extracts and processes gold ore to produce a beneficiated product, doré, which is then further refined at Rand Refinery Proprietary Limited (Rand Refinery) into gold bars with a purity of at least 99.5% in accordance with the Good Delivery standards determined by the London Bullion Market Association. The refined gold is then sold on international markets. Sibanye holds a 33% interest in Rand Refinery, one of the largest global refiners of gold, and the largest in Africa. Rand Refinery markets gold to customers around the world.
In addition, Sibanye derives uranium ore as a by-product of gold production from the Cooke operation and keeps it separate from other gold ores by way of a dedicated stream into the uranium section of the Ezulwini gold and uranium plant. The uranium ore is first treated for uranium and then subsequently to recover gold. Production of uranium as a by-product enables Cooke’s gold Mineral Resources to be optimised. Revenue from the sale of uranium is offset against gold production costs, thereby allowing lower-grade gold resources to be mined profitably.
| |
Sibanye Gold Integrated Annual Report 2015 | 13 |
| |
Sibanye Gold Integrated Annual Report 2015 | 14 |
STRATEGY
| |
Sibanye Gold Integrated Annual Report 2015 | 15 |
Sibanye’s care values underpin its strategy, how it conducts its business and interacts with stakeholders.
In living these values, we show that we care about safe production, our stakeholders, our environment, our company and our future.
Our approach is holistic with clear focus on delivery of all strategic imperatives critical to Sibanye’s long-term success.
Sibanye recognises that:
| · | | safety, costs, volumes and grade are the primary operational deliverables underpinning our business |
| · | | strong cash flow supports the dividend paid to shareholders and underpins our growth |
| · | | growth (organic and acquisitive) ensures the long-term delivery of sustainable value to all stakeholders. |
Holistic and integrated strategy
Sibanye strives to deliver value to shareholders through consistent, industry-leading dividends and capital appreciation by applying its holistic, efficient operating model at its operations and by investing in value-accretive growth.
Sibanye’s commitment to paying industry-leading dividends underpins and informs its corporate strategy and decisions, and is supported by an inclusive approach to stakeholder relations.
Sibanye’s strategy is not limited to the gold sector – it will pursue value-accretive opportunities in other mining sectors.
Responding to shareholders
Sibanye’s shareholder base is broad and diverse, and its shares were actively traded in 2015. An average of 3,024,491 ordinary shares and 1,110,883 ADRs were traded daily on the JSE and NYSE respectively. As at 31 December 2015, the top eight shareholders (including ADR depositary) held around 60% of the issued capital.
Engagement with shareholders is regular and proactive, which is consistent with Sibanye’s strategy and vision to deliver value to all stakeholders.
What Sibanye offers investors:
| · | | leverage to commodity prices |
| · | | capital expedience and discipline |
| · | | industry-leading sustainable dividends and capital appreciation |
Continuous interaction and communication with investors on Sibanye’s performance against its strategic objectives is essential. Its aim is to ensure that they are appropriately and timeously informed and aware of plans to transform Sibanye into a multi-commodity mining company without falling foul of regulatory authorities or compromising the transactions.
In this report, Sibanye’s performance is measured and considered in the context of the following strategic factors:
| |
Sibanye Gold Integrated Annual Report 2015 | 16 |
| |
Sibanye Gold Integrated Annual Report 2015 | 17 |
PERSPECTIVE FROM THE CHAIR
There is an old Latin saying, ex Africa semper aliquid novi, that roughly translates as ‘out of Africa, there is always something new’. This is what it has felt like as we have undergone the dynamic changes that are core to Sibanye’s activities.
In just two years, the Group and its mature gold assets, which were spun out of Gold Fields, have developed more deeply into gold and organically into uranium. During the latter part of 2015, Sibanye positioned itself to naturally leverage its regional advantages and extend its tabular, hard-rock mining skills into the platinum sector. The developments have been imaginative, well-considered and founded firmly on the precepts of extending the lives of our operations and growing the business in support of our vision to create superior value for all the Group’s stakeholders.
As with the gold operations we acquired in 2014, on conclusion of the transactions, the smooth integration of the platinum assets into the Group will be the primary focus of the executive management team with the aim of realising synergies between the platinum assets and Sibanye’s existing assets. To manage this complex process while retaining our operational focus, the Group has been restructured into focused operating divisions that are serviced by a central CEO’s office and central shared services. Although management at the gold and uranium division will remain largely the same, we will be appointing people to critical positions in the platinum division and, in anticipation of these corporate developments, we have been building capacity at senior management level. I am confident that Sibanye’s diverse and technically competent team, headed by Neal Froneman, is one on which Sibanye stakeholders can depend for the continued delivery of value.
In my role as Chairman, I continue to have the benefit of a Board with a vast assortment of skills and experience, not only in mining but also in such areas of expertise as finance, human resources, corporate governance and general business management. This balance of skills and experience means that the Board can effectively and robustly interrogate the strategic and operating plans of the executive management team, and has the capacity to deal competently with risk, which proved to be particularly effective during the year as we considered the strategic basis for, and probed the opportunities and risks of, entering the platinum sector.
The Board has also adopted a considered approach to the prospect of obtaining a more secure electricity supply with independent power producers (IPPs) to support the low-risk strategy of developing a solar power plant at Driefontein and Kloof.
As was the case in 2014, we continued to maintain a conservative approach to our financing, ensuring at all times that, whatever debt we carry on our balance sheet, can be managed with little stress no matter what direction metal prices take. We shall not deviate from this strategy, which will be co-ordinated with our commitment to paying industry-leading dividends.
The macro-economic environment in which we operate remained increasingly challenging. Globally, sluggish economic growth, in China in particular, the resultant decline in demand for commodities and the impending increase in interest rates in the US have played havoc with the currencies of emerging and resource-based economies such as South Africa’s. Not even increased geopolitical uncertainty has helped boost the dollar price of gold. The dollar gold price continued to decline, falling by 14% between January and December while, at the same time, our operations were exposed to cost pressures well in excess of inflation. It is only the weakening of the local currency, the rand, against the dollar, which provided some relief with the average rand gold price increasing 8% to R475,508/kg in 2015 compared with 2014.
In South Africa, these challenges are not limited to the macro-economic environment. The global financial crisis and downturn in commodity prices has resulted in the mining sector and the economy as a whole contracting. Growth rates continue to be revised downwards and unemployment levels are increasing as the mining sector restructures and cuts back so as to limit and contain cost increases. This has resulted in various socio-economic challenges, particularly in the vicinity of mining operations with knock-on effects that could potentially have a significant impact on the future of the South African mining industry.
The labour environment in South Africa remains challenging and, while we continue to engage directly with our unions and employees so as to maintain harmonious relations, we experienced relatively limited disruptions during 2015. Aside from the clashes between two prominent unions, the Association of Mineworkers and Construction Union (AMCU) and the NUM, at Beatrix early in the year, the biggest disappointment was our inability to achieve a broad-reaching economic and social agreement with labour as part of a three-year wage agreement with all unions. Nevertheless, we continue to engage proactively with our employees, having implemented the final three-year wage agreement reached with three of the unions across all our operations. We will continue to do whatever we can to maintain harmonious labour relations and to limit disruptions in the workplace.
A primary concern is, and will remain, the health and safety of our employees and members of our communities with the aim of zero fatalities on our mines and diminishing accident rates so it was pleasing to note a further improvement in our safety performance.
Regrettably, there were seven fatalities during the year and it is with a heavy heart that I extend the condolences of the Sibanye Board to the families, colleagues and associates of those who were fatally injured in the workplace during the year. These employees (David Matsie, Bonno Keiditswe, Thomas Ndzimande, Sikoko Vuyosile, Sejakgomo Mokhali, Kagiso Rabola and Alberto Constantino) were our colleagues and we will take cognisance of the events that led to their deaths, and work harder to prevent their recurrence in future. Nevertheless, the fatal injury frequency rate (FIFR) continued to fall during the year, declining by 50% in 2015 to 0.06 fatalities per million man hours worked. This is comparable with average fatality rates in the US mining industry of 2014, and is a credible performance considering the depth at which our mines operate and the number of employees who work daily at our operations.
A critical programme to ensure the safety of our employees, particularly as our mines become ever deeper and more complex, is the development of appropriate new technology. Our Safe Technology programme is advancing technical innovation by designing and developing machines to be deployed underground to make mining at depth safer. This machinery, to be operated remotely,
| |
Sibanye Gold Integrated Annual Report 2015 | 18 |
will enable us to work and mine safely at greater depths and in more onerous conditions than has previously been possible. This will have longer-term benefits for our operations and for the country as a whole.
Stakeholder engagement is essential to the sustainability of our business. Beyond the mine gates, we continue to engage with our communities on issues as wide ranging as housing, the environment, and the provision of utilities and infrastructure. Our policy is to buy as much as possible from businesses in our host communities and, as far as is feasible, buy products from local businesses. On this basis we have, for example, made direct interventions to assist with the establishment of farming ventures that can sell and deliver food to the mines or to local people. Less directly, we offer programmes to improve the financial knowledge of our employees and their families to facilitate their escape from or avoidance of the traps of injudicious indebtedness. These financial-wellness programmes are long-term and open to all, and we encourage our unions to bring their members onto the programme.
And, as changes to the regulatory environment are mooted or implemented, we maintain relations with government authorities directly and indirectly (through the Chamber of Mines). We are determined that our voice is heard and clearly understood in any debate over legislative change. In particular, we have engaged on matters that include the ownership principle in the Mining Charter and the proposed carbon tax.
It would be remiss of me not to recognise the part played by Neal and his team in taking Sibanye forward. The Group is South Africa’s largest producer of gold, it ranks high on the list of uranium producers, it is heavily engaged in reprocessing residue dumps, thereby helping to improve the environment, and it will soon be moving in the direction of a new commodity, platinum. This would not have been possible without the wholehearted commitment of the entire workforce with whom it is a privilege to be associated. My gratitude goes to all of my Sibanye colleagues.
Sello Moloko
Chairman
18 March 2016
| |
Sibanye Gold Integrated Annual Report 2015 | 19 |
CHIEF EXECUTIVE’S REVIEW
I am very pleased to recommend to shareholders and other stakeholders our third integrated annual report.
While it is perhaps customary to thank stakeholders in the business at the end of a report, it is my view that this must be our starting point. And I do so with humility because we share Sibanye’s success with all of our stakeholders.
Strategy remains in place
Despite the volatility and flux in the global mining sector over the past few years, and despite Sibanye’s own significant corporate developments, our strategy continues to be guided by our vision:
To create superior value for all of our stakeholders through a culture of caring.
As we stated in our 2014 integrated report, our strategy is underpinned by our commitment to pay our shareholders sustainable, industry-leading dividends, and we will achieve this vision by optimising our current operations and extending their operating lives, and by using existing infrastructure to enhance the inherent value of brownfields and greenfields projects.
In addition, we have consistently said that we would pursue acquisitive growth options if they were value accretive and enhanced our ability to pay or sustain the dividend to shareholders.
Reporting theme
Our theme for this year’s report – optimise, sustain and grow – reflects the implementation of our strategy since listing in February 2013 and, through this report, we provide shareholders with insight into the progress we have made, despite the mining industry having to adapt to some of the most challenging times experienced in the global commodities markets.
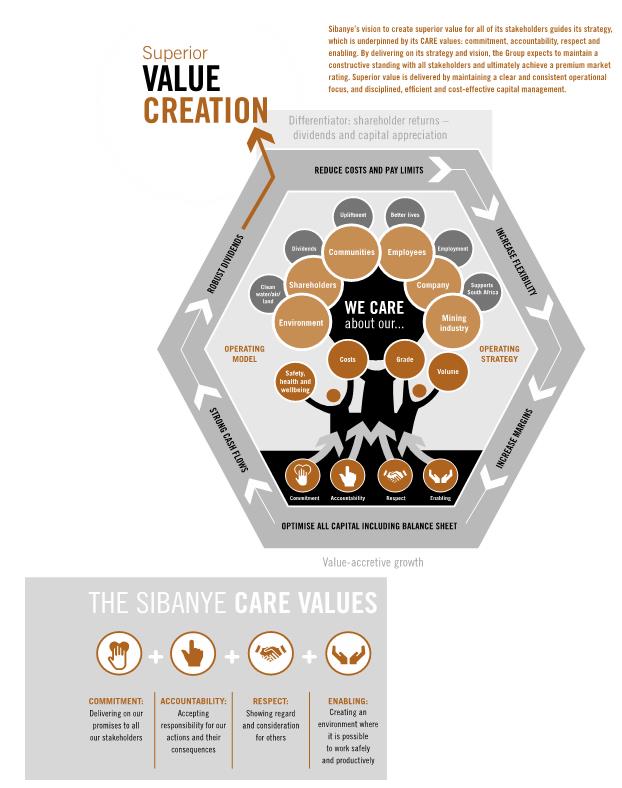
Sibanye’s values, which underpin our caring culture, are an integral part of the way we do business and the way in which we create superior value for all of our stakeholders, and are captured in the acronym CARE – commitment, accountability, respect and enabling. These are the values we would like all Sibanye employees to internalise and live by – see Integrated Annual Report–Strategy.
Our corporate strategy, culture and values are symbolised by the indigenous Umdoni tree (Syzygium cordatum). The fundamental roots of Sibanye are in our values and CARE culture, which provide a solid basis for the way we do business. The trunk of the tree represents the material strength that holds Sibanye together (our intellectual capital and the support provided by employees in upholding our operating model and business strategy), which is underpinned by the fundamentals of safety, health and wellbeing, costs, grade and volume. The leaves on the branches of the tree represent all our stakeholders, who rely on and influence the future success of Sibanye. The tree’s seeds and fruits signify the varying benefits that our success will bring to all stakeholders.
Health and safety
It is an incontrovertible fact that, at their workplaces and beyond them, healthy employees are more aware of safety and are more productive than would otherwise be the case. I have deliberately placed the words ‘safety’ and ‘productive’ in that particular order.
It is pleasing therefore to note that, despite the incidence of events such as underground fires and seismicity at our mines, in 2015 we achieved a 50% reduction in the FIFR per million man hours worked across our mines. Comparisons such as these are invidious but our safety performance, insofar as our FIFR is concerned, is now comparable with the US mining industry averages despite their mines generally being shallower, and less hazardous and labour-intensive. I regret to report though that, despite this improvement, at Sibanye we mourn the loss of seven of our colleagues at work during the year. The safety of our employees is paramount and we continually strive to improve our health and safety standards in order to achieve our goal of zero harm.
An area of concern and one which will receive significant management attention is the continued incidence of disabling accidents that lead to lost working time and which has regressed during the year. Every accident is one accident too many, and we will continue to examine the situations that lead to each accident as well as to near-accidents in order to devise ways to prevent recurrences.
Accidents at work are not only injurious to our employees but also result in lost working time, which can have a significant effect on our performance. While we continue to try and reduce accidents in the workplace, we have also revised our approach to healthcare.
We aim to provide employees who are injured or fall ill with treatment or medication as quickly and conveniently as possible. As such, we have moved away from the conventional industry approach of running centralised mine hospitals, which is not our core business or expertise, in favour of establishing primary health and safety clinical facilities, which are located at each shaft. In this way, minor injuries and other less serious illnesses can be treated promptly and efficiently. Employees with more serious traumas or illnesses are transferred to regional hospitals (some of which used to be owned by Sibanye) where they are assured of first-rate treatment at facilities run by dedicated healthcare experts – our people know that, when they are in need, they can count on receiving the best possible medical care.
| |
Sibanye Gold Integrated Annual Report 2015 | 20 |
Our commitment to safety, health and employee wellness, and our CARE culture, also encompasses the way in which we are seeking to address occupational health issues such as noise induced hearing loss (NIHL) and occupational lung disease (OLD), which includes silicosis. We have introduced some of the most innovative and consistent measures to limit occupational health issues, which has resulted in the prevalence of NIHL and OLD (see Integrated Annual Report–Sustain–Health and safety focus) declining dramatically, and we ensure that employees have access to appropriate treatment where required. Yet we know that exposure to silica dust over long periods of time may only manifest as silicosis decades after first exposure and often long after employees have left our employ or indeed the industry. To assist past employees who may suffer from silicosis and other forms of OLD, we are working closely with other gold companies to address the shortcomings in the existing publicly run compensation system, the Occupational Diseases in Mines and Works Act, 1973 (Act 78 of 1973) (ODMWA) and, for current and future employees, we are engaged with government about their transfer to the better compensation system, the Compensation for Occupational Injuries and Diseases Act, 1993 (Act No 130 of 1993) (COIDA).
2015 IN REVIEW
At the beginning of the year under review, we anticipated that the operating environment would be challenging – a view which proved to be correct.
A number of operational issues in the first two months resulted in production for the first quarter falling well short of our forecasts and, despite the operations delivering more representative and consistent results for the rest of the year, we were unable to claw back production lost in the first quarter. Other factors which contributed to operational targets not being met included load shedding during the first and second quarters as Eskom attempted to catch up on maintenance, and the wage negotiations which, while not resulting in direct operational disruptions, require significant time and focus from management and serve to distract employees from their primary jobs.
Gold production for the year of 47,775kg (1.54Moz) was as a result of the lower-than-forecast production at the beginning of the year with All-in sustaining cost of R422,472/kg or US$1,031/oz (based on the year’s average R:$ exchange rate) commensurately higher than forecast. While there was some relief from a higher gold price in the second half of the year, as the rand weakened by 28% between 30 June 2015 and 31 December 2015, lower production in the first half of the year resulted in cash generated from operating activities decreasing 24% to R5,420 million compared with 2014 from which R3,345 million was disbursed on the capital projects that underpin the Group’s longer-term future and R658 million or 72 cents per share (ZAR) was paid as dividends to shareholders.
challenges in 2015
Conflict between members of AMCU and NUM at Beatrix in February 2015, which resulted in injuries to nine employees, was a portent of the difficulties we would experience during the wage negotiations scheduled for mid-year. Management’s reaction was swift and unequivocal. We suspended operations at the Beatrix North and South shafts until calm had been restored, and the rival groups had been successfully reintegrated.
Gold-industry wage negotiations, which are undertaken centrally under the auspices of the Chamber of Mines, began in June 2015 and finally concluded in September – taking longer than we had expected. While there were no formal work stoppages, these negotiations served to distract employees from their jobs, thereby negatively affecting our operational performance. While the eventual agreement reached with three of the unions was not optimal, it was affordable and, we believe, satisfactory.
In consideration of the significant headwinds our industry continues to face – a stagnant or falling gold price, fast-rising operating costs, steadily declining ore tonnages and grades, changing union dynamics and rising stakeholder expectations – we sought to approach wage negotiations differently in 2015.
At the start of negotiations, we and other gold companies represented by the Chamber attempted to introduce a fresh approach, founded on the concept of an economic and social compact, which took the impact on all stakeholders into account. While many of the ideas we proposed found resonance with our union counterparts, they were not prepared to abandon the traditional positional-bargaining approach and, while we will continue to try and engage on the compact, it will be some time before the precepts underlying the sustainability of the industry will be fully embedded in our ongoing engagement.
Despite significant attempts on our part to reach a single settlement with all four representative unions, we were only able to reach agreement for a period of three years with three of the unions – the NUM, Solidarity and UASA – who collectively represented around 49% of employees in the collective bargaining units at our operations. AMCU leadership remained obdurate throughout the process and did not move from its initial demands. It was clear that we were not going to reach agreement with AMCU and, in the interests of fairness and maintaining a harmonious and safe working environment, we elected to implement the agreed wage increases for all employees irrespective of their union membership. To have excluded those who were members of AMCU (42% of employees in the collective-bargaining unit) would, in our view, have been unjust and could have sparked further inter-union rivalry and violence.
AMCU’s leadership has reserved its position and ended the year repeating that it would consider embarking on industrial action ‘at the appropriate time’. Our view remains that there is little appetite for industrial action by the members of any union and this has been borne out to date.
I personally believe that there is a realisation that unrealistic demands are unsustainable and more likely to lead to job losses than to permanent improvements for all. This was illustrated in the platinum sector where the losses from the five-month strike of 2014 remain fresh in the minds of those who participated.
Having said this, I should add that, while we do not expect a strike at our gold operations in 2016, we have detailed and robust plans to deal with such an eventuality. We will maintain our approach to the social and economic consequences that surround these issues, and we will not allow the threat of industrial action to distract us from our primary focus areas.
| |
Sibanye Gold Integrated Annual Report 2015 | 21 |
A critical and growing imperative for sustainability is community relations and engagement. We will be placing great emphasis on improving engagement with local and labour-sending communities, and ensuring delivery of high-impact, sustainable projects in these communities. We are confident that the support of our communities and the commitment of our employees will underpin our development into the South African mining champion.
Another challenge relates to the legal suit brought by the Chamber on the industry’s behalf on the continuing consequences of BEE transactions post 2004. Sibanye is supportive of the Chamber’s initiative to seek clarity through a declaratory order by the courts although we are confident of the validity of the BEE transactions. Policy and regulatory certainty is critical for our industry and our stakeholders, and continued dilution (should the consequences of previous BEE transactions not be recognised) will severely undermine the value of an already struggling sector.
An issue that does need addressing by the industry as a whole is the extent to which the DMR imposes Section 54 closures in the event of accidents. We, at Sibanye, fully agree with the need for operational closures when the causes of accidents need to be investigated, and when it is necessary to ensure that safety conditions and procedures are rigorous. But we believe that the Section 54 stoppages should be restricted to the immediate area of an accident’s occurrence and not involve the complete closure of a shaft, which can have a detrimental impact on the viability of an entire mine.
achievements of 2015
Turning to our achievements in the past year, the most far-reaching was our entry into the platinum sector – a sector we had already identified as offering potential value in early 2014. Our moves to acquire Anglo American Platinum’s Rustenburg Operations and Aquarius were well-considered investment decisions and, we believe, are transactions that are sufficiently robust to withstand all likely vagaries of the platinum sector at market and operational levels.
The acquisitions will deliver a substantial amount of PGMs (4E) reserves. By 2017, Sibanye will rank as the world’s fourth largest PGM producer. More importantly, the Rustenburg Operations and Aquarius’ Kroondal mine are contiguous, which will allow for significant realisation of operational synergies in addition to cost savings we expect from rationalising replicated services and other overhead costs.
We maintain a conservative and innovative approach to financing acquisitions and, before making the decision to advance the platinum acquisitions, we made sure that our balance sheet was sufficiently robust and flexible, and that our cash flows would be more than adequate to service any debt we would be taking on. The Rustenburg transaction has been defensively structured to give us downside protection from lower PGM prices until 31 December 2018 and has limited recourse to the central balance sheet. Debt reduction will continue to be central to our approach after we take control of the platinum interests, just as it was when Sibanye first became an independent group.
On 31 December 2015, Sibanye’s net debt was a modest 0.21 times multiple of EBITDA. Even taking into account the expected US$250 million partial draw on our US$350 million revolving credit facilities and the US$150 million additional financing facility provided by HSBC for the Aquarius acquisition, the approximate multiple will remain 1.0 times, indicating how conservatively we have managed the financing of these acquisitions. In order to maintain financing flexibility, however, we will consider restructuring our financial position soon after concluding both transactions. Further financial detail and other parameters relating to the acquisitions are contained elsewhere in this report.
Through these proposed acquisitions, we are increasing our footprint in South Africa and this is with good reason. We are comfortable with the operating environment and confident that there will be further opportunities, which will allow us to continue delivering sustainable value for all of our stakeholders.
SUSTAINABLE VALUE FOR STAKEHOLDERS
| · | | We have significant experience operating in South Africa and understand the regulatory environment |
| · | | South Africa contains one of the most valuable resource endowments in the world |
| · | | Our geology is well-understood and simple |
| · | | There is an abundance of skilled and experienced mining practitioners |
| · | | The areas in which we operate are supported by first-class infrastructure |
| · | | The established mining industry is serviced by well-developed and innovative supply as well as associated industries |
While policy uncertainty and regulatory inefficiency have been signalled by investors as factors which have inhibited investment in recent years, the country also has sound financial and judicial systems and a world-class Constitution, which protects individual and corporate rights.
There are various conditions to be met before our acquisitions are finally consummated. However, we shall become engaged operationally, particularly in the platinum sector’s wage-negotiating round, to ensure that we shall have a sound labour-relations foundation when we start what will be the synergistic merger of the Aquarius and Rustenburg properties.
Energy
The reliability of supply and cost of electricity has become a primary risk factor for industry in South Africa. It is our policy to minimise the risk factors beyond our direct control. We have developed an integrated and co-ordinated strategy to mitigate the associated risk for the near term and for the longer term.
In 2013, we identified the risk that Eskom, the state-owned power monopoly, would be unlikely to supply the entire power needs of the country reliably, affordably and without interruption. Electricity costs have been rising annually at rates significantly higher
| |
Sibanye Gold Integrated Annual Report 2015 | 22 |
than inflation since 2007 with power costs at Sibanye increasing from about 9% in 2007 to some 18% of our 2015 costs. With supply remaining inconsistent and further above-inflation increases highly likely in coming years in order to finance Eskom’s capital programmes, it is clear that alternatives are required in order to ensure the sustainability of our mines. The more we can reduce our reliance on Eskom power, the more secure and more cost-efficient will be our core operations.
In late 2013, we began to investigate the potential of solar photovoltaic generation to reduce our reliance on Eskom, and have demonstrated the technical and economic feasibility of constructing a 150MW plant. We have now launched the development phase of the project, which encompasses applications for all the required permits, basic engineering design and establishment of the most appropriate commercial model to optimise the financial benefits. We expect this will require significant involvement of financial partners to fund the project capital. We remain on track to start generating electricity late in 2017. Solar photovoltaic electricity remains only a partial solution and we have continued to explore other alternative sources of electricity.
Sibanye is also investigating various opportunities to support a coal-based IPP platform devoted exclusively to delivering power to our operations.
Gold production for the year ending 31 December 2016 is forecast to increase to approximately 50,000kg (1.61Moz) with total cash cost forecast at approximately R355,000/kg and All-in sustaining cost at approximately R425,000/kg. The recent sharp depreciation of the rand to over R16.00/US$ means that costs in dollar terms are likely to be significantly lower than in 2015, assuming an average exchange rate of R15.00/US$ for 2016. Total cash cost is forecast at US$735/oz and All-in sustaining cost at US$880/oz. All-in cost is forecast to be R440,000/kg.
(US$915/oz) due, inter alia, to the initiation of the Kloof and Driefontein below infrastructure projects, and the development of the Burnstone mine, which were approved in 2015. Costs in dollar terms are significantly lower at the current average exchange rate of over R16/US$.
Total capital expenditure for 2016 is planned at R3.9 billion (US$265 million).
Due to the weaker rand, and a recovery in the dollar gold price, the rand gold price year to date is on average approximately R100,000/kg higher than in 2015. While we provide no forecast of the future gold price, should this gold price persist throughout 2016, the Group total cash cost margin will increase to approximately 38% and the All-in sustaining cost margin to approximately 25%.
THE FUTURE
Following the significant changes that took place or were initiated in 2015, 2016 will be a year of considerable restructuring, integration and consolidation. At the most basic level, we will re-evaluate all our gold assets on a shaft-by-shaft basis with a view to determining whether the primary focus might be on gold or uranium. On a developmental level, the focus will be on incorporating the PGM assets into Sibanye so as to obtain the maximum possible cost and other synergies.
The successful integration of these substantial platinum assets will ensure that we continue to deliver acceptable and sustainable benefits to our shareholders in the form of dividends and capital appreciation in order to remain an investment of choice. For it is only by being an investment of choice that we can be sure to attract the rating and the funds needed to pursue further profitable growth prospects and projects.
We are aware, however, that in order to achieve our goals and re-establish the primacy of mining to South Africa’s economic development in the eyes of government and all the country’s people, we are going to have to adopt a prominent leadership role in the industry. I am confident that we have laid a sufficiently solid foundation in the past two years to allow this.
Neal Froneman
Chief Executive Officer
18 March 2016
| |
Sibanye Gold Integrated Annual Report 2015 | 23 |
CAPITALS OVERVIEW AND BUSINESS MODEL
Successful implementation of Sibanye’s strategy depends on effective management of various capitals, which include resources and relationships.
These capitals are necessary inputs into the business model and their judicious management enables Sibanye to deliver on its strategy. While this report is not structured according to the capitals, it does provide insight into Sibanye’s current capabilities in terms of these capitals as well as related challenges affecting delivering on its strategy to create superior value for all stakeholders. A discussion of the capitals follows, explaining how they affect Sibanye, including cross references to supplementary information.
financial CAPITAL
The management of financial capital is essential for the sustainability of any business. At Sibanye, financial-capital management will enable the generation of sustainable cash flow, which will support regular, consistent, industry-leading dividend payments and allow long-term capital value accretion. This is underpinned by profitable operations and growth, both organic and inorganic. Positive free cash flow is necessary to fund the dividends and growth.
In order to extend its operating life and sustain dividend payment for longer, Sibanye has not only committed to the development of organic projects but also made strategic, value-accretive acquisitions. Organic projects and acquisitions are predominantly funded through operational cash flow and, where necessary, by debt and other financial instruments. While the downturn in the commodity cycle and negative investor sentiment towards the resources sector can make accessing equity capital a challenge, Sibanye has sufficient debt facilities and the recent increase in the rand gold price will ensure that dividend payments to shareholders can be maintained. Should the opportunity arise, restructuring of debt or raising equity capital may be considered.
Similarly, revenue and earnings are used as the basis for value creation and derivatives of these determine what value will be distributed to stakeholders: salaries and wages (employees), dividends (shareholders), social and local economic development (communities), and taxation and royalties (government and the national fiscus).
Insights into
The management of financial capital, and Sibanye’s financial performance and position, are provided in Integrated Annual Report–Sustain–Project development and capital allocation.
human CAPITAL
Deep-level gold mining is labour-intensive and Sibanye’s employees play an integral part in the successful delivery on Sibanye’s operating model and strategy. Sibanye’s people work at great depth and under physically demanding conditions – their safety and wellbeing are priorities. We strive to develop a transformed, productive, skilled and engaged team of people at Sibanye. South Africa, and the mining sector specifically, has faced intense challenges regarding industry and labour relations due to legacy issues as well as the difficult socio-economic environment, inequality and unemployment in the country. South Africa has well-developed industrial-relations processes and practices with strong trade unions representing employees in different sectors on issues such as, inter alia, remuneration, other benefits and workplace issues. Employees are Sibanye’s most important asset and are key stakeholders in the business. Aligning employees with Sibanye’s values and strategy will ensure the sustainability of the business and that it is able to deliver superior value for all of its stakeholders.
Insights into
Sibanye’s people are provided in Integrated Annual Report–Optimise–Develop a productive, skilled and engaged workforce and Integrated Annual Report–Sustain–Health and safety focus.
intellectual CAPITAL
Allied to human capital is Sibanye’s intellectual capital. Its operating model is vital to its ability to turn around unprofitable mines and extend their economic lives. This is underpinned by its operating processes and employees’ expertise, which together contribute to the intellectual capital required to successfully operate its mining portfolio. Ultimately, Sibanye sees its strategy and operating model as its differentiators in the mining sector.
Sibanye’s ability to remain competitive depends on future innovations relating to Safe Technology and modernisation of its mines. Over the past two years, the Group has invested in research and development (R&D) in these two areas. Sibanye also works closely with suppliers on innovative development of identified technologies. Technological advances will make Sibanye’s workplaces safer, improve productivity and facilitate the conversion from resources to reserves of deeper-level and secondary ore bodies through the development of new products and technologies.
Insights into
Sibanye’s operating model are provided in Integrated Annual Report–Optimise–Optimise and integrate operations, Integrated Annual Report–Grow–Secure alternative energy sources and Integrated Annual Report–Grow–Modernisation and technological innovation.
| |
Sibanye Gold Integrated Annual Report 2015 | 24 |
social AND RELATIONSHIP CAPITAL
Proactive, positive and constructive stakeholder engagement is necessary to identify and manage stakeholder concerns and expectations, together with any associated material risks and opportunities, and to effectively respond to and address them. Sibanye’s stakeholder engagement programmes are vital in building relationships and maintaining a positive reputation with stakeholders by promoting and delivering on its value-creation proposition.
Sibanye is committed to creating shared value for its surrounding communities and labour-sending areas beyond its Mining Charter and Social and Labour Plan (SLP) commitments.
Insights into
Sibanye’s stakeholder engagement, key stakeholder insights and progress against its Mining Charter and SLP commitments are provided in Integrated Annual Report–Material issues and Integrated Annual Report–Sustain–Social upliftment and community development.
Natural CAPITAL
Mining has a significant impact on the environment and the environment can in turn materially affect mining operations and activities. Various programmes have been put in place at Sibanye to reduce and mitigate the impact of mining on the environment. This is not only done for compliance purposes but to ensure that it does not create value at the expense of the environment.
Access to strategic inputs, such as water and electricity, is essential to Sibanye’s operations, and the availability and cost of these inputs is critical to long-term profitability and viability. Electricity supply and costs are a particular concern with the deep-level gold mines required to cool and ventilate the mines and deal with the ingress of water, which is pumped to surface, treated and either used in production or discharged safely into the environment. Efforts continue to be made to reduce the consumption of electricity – consumption at Sibanye has declined by 20% since 2007. In order to reduce reliance on the state utility, Eskom, and control power costs, Sibanye is investigating self-generation, primarily through solar and coal-fired generation projects.
Insights into
Natural capital are provided in Integrated Annual Report–Sustain–Manage environmental impact and Integrated Annual Report–Grow–Secure alternative energy sources.
manufactured CAPITAL
Sibanye has continued to make the investment required to maintain its infrastructure and plants in order to ensure the sustainability of its operations. The Group continues to assess and will upgrade its infrastructure where necessary.
The acquisition of the Rustenburg Operations and Aquarius assets, in the process of being finalised, will deliver a substantial amount of PGMs (4E) reserves. The purchase and optimisation of its newly acquired mines will depend on Sibanye’s funding model and integration approach.
Insights into
Manufactured capital are provided in Integrated Annual Report–Optimise–Optimise and integrate operations, Integrated Annual Report–Sustain–Project development and capital allocation, Integrated Annual Report–Grow–Secure alternative energy sources and Integrated Annual Report–Grow–Acquisitions and funding model.
| |
Sibanye Gold Integrated Annual Report 2015 | 25 |
MATERIAL ISSUES
managing Material issues
Sibanye considers an issue to be material if it substantially affects the group’s ability to create and sustain value in the short, medium and long term.
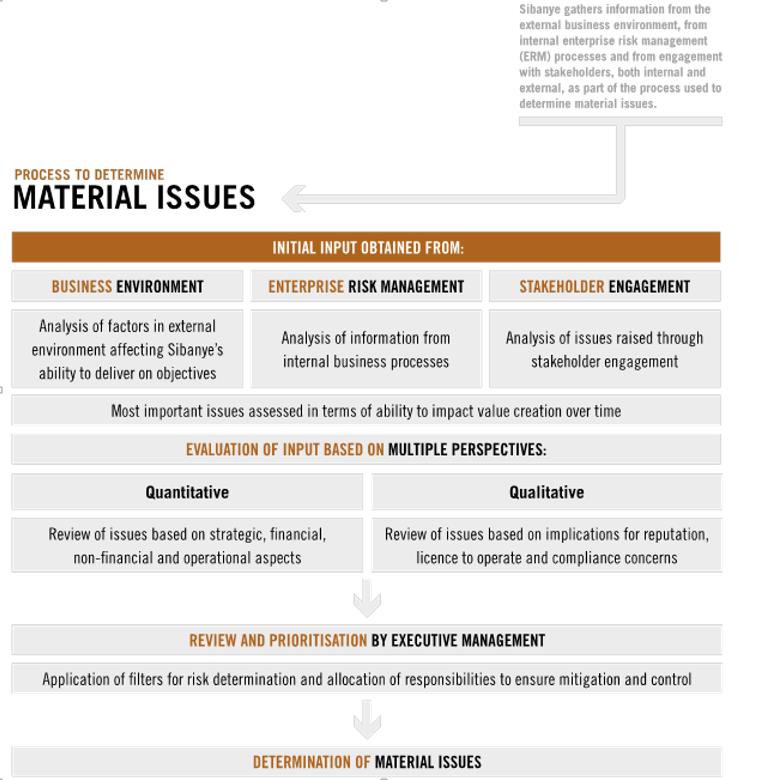
Business environment
Analysis of the business environment in which the organisation operates.
THE GOLD PRICE AND THE RAND
Sibanye’s revenue is driven by commodity prices and the rand exchange rate relative to the US dollar. The primary commodity price driver in 2015 was the dollar gold price, which has been under pressure since mid-2013 and continued to test lows not seen
| |
Sibanye Gold Integrated Annual Report 2015 | 26 |
since 2010. Over the past year, lacklustre physical demand and the liquidation of above-ground stocks, predominantly in the form of exchange traded funds (ETFs), were the primary drivers of the price weakness, with anticipation of a recovery in the US economy rising US interest rates and a strong dollar, perceived as being negative for gold demand.
The sharp decline in the oil price in the latter half of 2015 and weaker-than-expected economic data out of China, coupled with significant political turmoil globally, and negative real interest rates in a number of countries, seem to have restored gold’s safe-haven status somewhat and the dollar gold price appears to have stabilised recently.
The lower gold price has resulted in significant restructuring in the global gold industry and the rationalisation of overhead costs, reduced capital expenditure, the sale of non-core assets and restructuring of debt on balance sheets. Restructuring in the gold-mining sector preceded that in the non-gold mining industry with the result that gold producers are significantly better placed to weather the current phase of the commodity cycle. Low prices will continue to constrain growth and the ability to pay dividends to shareholders.
South African gold producers have been protected, to a large extent, from the declining US dollar gold price by the rand, which has depreciated as the US dollar strengthened. A deteriorating outlook for the South African economy, coupled with recent politically related changes in the South African finance ministry, were poorly received by the market and resulted in a significant structural deterioration in the rand/US dollar exchange rate. The weaker rand has translated into a substantial increase in the rand gold price received at year end, and significantly expanding margins for South African gold producers.
The outlook for the dollar gold price remains positive. Increasing global political and economic uncertainty are likely to be supportive and gold continues to be regarded as an important reserve asset by central banks globally.
SOUTH AFRICAN ECONOMY
The economic outlook for South Africa deteriorated markedly in 2015, partly due to the fall out experienced by all emerging market economies as economic growth in China continued to stall, but was exacerbated by South Africa-specific economic and political issues and concerns.
The increasingly negative outlook for the country’s prospects were reflected in the final weeks of 2015, when three rating agencies lowered their assessments of South African sovereign debt to just above junk status, adding to weakness in the currency.
POLICY AND REGULATORY CERTAINTY
Policy and regulatory issues are cited by international investors as being primary concerns and barriers to investment in the South African gold-mining sector. Of most concern is the continued delay in passing the Mineral and Petroleum Resources Development Act (MPRDA) Amendment Bill into law, and uncertainty around its final contents, particularly as related to compliance with the Department of Trade and Industry (DTI) Codes of Good Practice. During 2015, the previous Minister of Mineral Resources suspended the Bill’s passing into law, pending further review. In late 2015, the Department of Mineral Resources (DMR) announced that the mining industry would be exempt from compliance with the DTI codes until the Bill had been finalised.
The DMR’s assessment of mining companies’ compliance with the Mining Charter, and in particular equity ownership by historically disadvantaged South Africans (HDSAs), has given rise to a difference of opinion between the department and the industry. An independent analysis commissioned by the Chamber of Mines indicates that all Chamber members had met this requirement. However, the DMR’s interpretation indicated lower levels of compliance. The discrepancy lies in the interpretation of ‘continuing consequences’ of BEE transactions concluded since 2004. At issue is those transactions in which the BEE shareholding has not remained at 26% as, given changes in market circumstances, the BEE partner had either sold or departed from the transaction.
The Chamber of Mines has applied to the High Court for a declaratory order that will clarify the empowerment clauses in the Mining Charter and on whether or not the so-called ‘once empowered, always empowered’ principle applies. The industry remains concerned that, should further equity issues be required to maintain BEE ownership at 26%, there may be further dilution of shareholder value.
These issues, along with the pending alignment of the MPRDA, 2002 (Act No 28 of 2002) and the Mining Charter with those of the BBBEE Act, 2003 (Act No 53 of 2003), and of the DTI codes, continue to create uncertainty and are perceived by investors as an investment risk.
It is hoped that these concerns and many other broader issues will be addressed and settled through the Presidency’s Project Phakisa. Towards the end of 2015, Project Phakisa brought the industry, government and other key stakeholders together for discussions to stimulate collaboration on ways to revitalise the South African mining sector and ensure its survival in the long term. It is encouraging that, in these developments, government has displayed an appreciation of the need for a stable, justiciable and clear regulatory environment. The next step in Project Phakisa will involve the implementation and, where required, the modification of agreed plans, as well as monitoring, reporting and evaluation.
ENERGY AVAILABILITY AND COST
The major challenge facing the mining industry and South Africa as a whole is the reliability of supply and cost of electricity. In South Africa, electricity is supplied by Eskom, the state-owned power utility, which has, owing to a backlog of undercapitalisation, poor project delivery and inconsistent maintenance, been unable to reliably supply power to the country since 2007. In addition, Eskom has implemented significant, above-inflation, electricity price increases, which have seen electricity costs, as a proportion
| |
Sibanye Gold Integrated Annual Report 2015 | 27 |
of overall costs at Sibanye, rise from 9% in 2007 to about 18% in 2015. Adding to Sibanye’s concern about energy costs is the proposed carbon tax that will be particularly damaging for heavy industrial users of coal-fired electricity.
South Africa’s power difficulties seem likely to persist for some years and Sibanye is proactively developing ways to reduce its reliance on Eskom power. Currently, a 150MW photovoltaic plant, which is expected to begin first production towards the end of 2017, is being developed on Sibanye property at Driefontein and Kloof (see Integrated Annual Report–Grow–Secure alternative energy sources).
LABOUR RELATIONS AND EMPLOYMENT
The South African gold sector has well-established labour relations processes and practices, including its history of collective, centralised bargaining. Industry-wide centralised bargaining takes place under the auspices of the Chamber of Mines, giving rise to an established system of wage and benefits adjustments that are largely the same across all mines.
The 2015 wage negotiations began in June 2015 and were concluded in October 2015 without any industrial action. Agreement on wages and conditions of service was reached with three of the four representative unions and, at Sibanye, the wage agreement was implemented for all employees when it became clear that no agreement could be reached with AMCU, which represented around 42% of employees. Category 4-8 employees and B-lower officials will receive an increase of 12% in year 1, 11% in year 2 and 10% in year 3. Miners, artisans and officials will receive an increase of 6% on standard rate of pay in year 1 and 6% or consumer price index (CPI), whichever is greater, in years 2 and 3. Further detail on the wage agreements is available at www.goldwagenegotiations.co.za
An incident of inter-union rivalry did, however, lead to the closure of operations at Beatrix in February 2015 although the matters were rapidly resolved (see Integrated Annual Report–Material issues–Reflecting on stakeholders–Employees and organised labour).
Enterprise risk management
An overview of Sibanye’s risk-management approach, governance structures and top ERM risks
Risk management is a continuous, proactive and dynamic process designed to identify, understand, manage and communicate risks that may have a negative impact on Sibanye’s ability to achieve its business objectives.
Sibanye’s risk-management process is established and well-considered. Risk-management policies, practices and management systems are reviewed annually by the Board’s Risk Committee, and approved by the Board. Policies, practices and systems are embodied in Sibanye’s ERM Framework, which is aligned with the King III codes and International Organization for Standardization (ISO) 31000 standards, and entrenched at the operations.
BOARD RESPONSIBILITY
The Board is satisfied that governance, risk management and compliance, internal control and compliance with the Sarbanes-Oxley Act (SOX) of 2002 as well as internal audit processes operated effectively for the period under review. Business activities have been managed within the approved risk-tolerance and risk-appetite levels. Primary controls have been implemented and further mitigating action has been taken to improve primary controls.
ENERGY AVAILABILITY AND COST
The Board is ultimately accountable for risk management and is ably assisted by the Risk Committee, see Annual Financial Report–Accountability–Corporate governance report–Board committees–The Risk Committee for our risk reporting structures.
RISK MANAGEMENT
The risk-management process is a systematic application of management policies, procedures and practices in communicating, consulting and establishing the context, and identifying, analysing, evaluating, treating, monitoring and reviewing risk. Risk-management documents include the Risk Policy, Plan and Charter, which sets out the requirements for effective oversight of risks, including the identification, assessment, evaluation, treatment and reporting of risks. The risk-management process is embodied in Sibanye’s Risk Management Framework, which is used for implementation. Sibanye’s ERM process combines operational and strategic risk processes.
During the period under review, Sibanye conducted an independent risk-management effectiveness assessment and maturity review. The results showed some significant progress towards full maturity and support the introduction of the advanced measurement approach Sibanye has adopted.
| |
Sibanye Gold Integrated Annual Report 2015 | 28 |
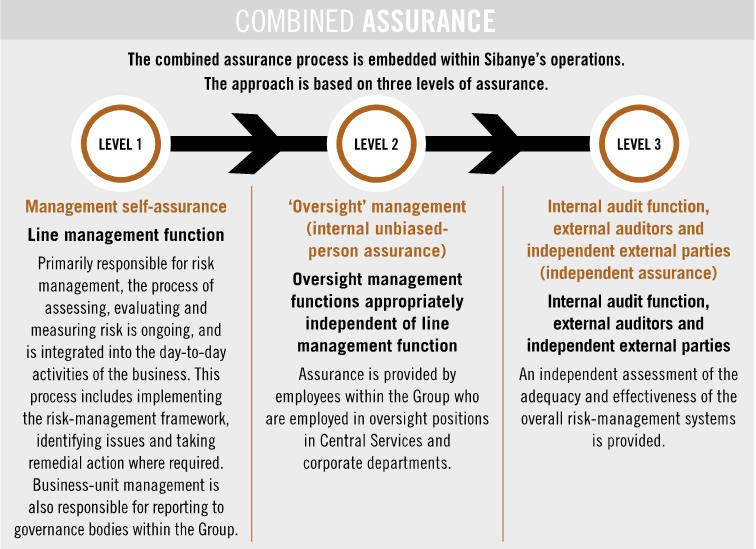
stakeholder engagement
An analysis that provides a view of our relationships with key stakeholders and their concerns
The outcomes of stakeholder engagement – the concerns of our primary stakeholders (see Integrated Annual Report–Material issued–Reflecting on stakeholders) – are important determinants of Sibanye’s material issues and hence inform decisions taken to control risk and identify opportunities for the business.
Sibanye is committed to proactive, open and constructive stakeholder engagement, which informs participative decision-making. Our stakeholder engagement aims to:
| · | | strategically inculcate a culture of effective engagement within the organisation |
| · | | develop and implement formal and informal systems of communication for the benefit of the Group and stakeholders |
| · | | ensure regular engagement and response to issues material to stakeholders |
| · | | accurately understand the influence of business activities on stakeholders and the potential impact stakeholders may have on the business, whether positive or negative, to enhance the engagement process |
| · | | ensure engagement is conducted in a timely, accurate and relevant manner |
| · | | continuously monitor, review and improve engagement activities. |
As a responsible corporate citizen, Sibanye fosters and maintains constructive engagement with all stakeholders in order to deliver on our vision to create superior value for all stakeholders, to maintain our licence to operate, and ultimately for the long-term success and sustainability of the business.
The Board’s performance and interaction with stakeholders is guided by the South African Constitution, including the Bill of Rights, and management is tasked with the development and implementation of corporate citizenship policies and programmes for relevant stakeholders.
Sibanye expects employees and communities to appreciate the importance that a profitable and sustainable business holds for them and the other stakeholders who rely on the mining industry.
REFLECTING ON STAKEHOLDERS
INVESTORS AND MARKET ANALYSTS
Excluding Gold One, which represents a consortium of Chinese investors who have acquired a strategic 20% stake in the Group, Sibanye’s investors are primarily geographically diverse institutional investors, located predominantly in the US and South Africa.
| |
Sibanye Gold Integrated Annual Report 2015 | 29 |
Engagement is regular and structured with quarterly operational updates, and more detailed six-monthly operational and financial reviews, which enable investors to engage directly with management via live webcast or conference calls. Senior management also undertakes regular global roadshows to interact directly with current and prospective investors. Shareholders expect management to deliver on operational forecasts and the communicated corporate strategy. Adherence to the highest standards of corporate governance are expected. Shareholder investment strategies and tenures differ, making it difficult to target and cater to specific investor groups. A consistent and transparent strategy is crucial to building investor confidence.
Sibanye is widely covered by sell-side analysts who provide investment research and advice to existing and prospective institutional investors. Sell-side analysts tend to do relatively detailed and in-depth analyses of relevant sectors and companies, including peer-group comparisons and benchmarking. Sibanye is comprehensively covered by local and international sell-side analysts from smaller brokers to global, bulge bracket banks. At least nine analysts produce independent research on the Group at any given time.
SUPPLIERS AND CONTRACTORS
Sibanye has categorised its suppliers and contractors into three groups: strategic, tactical and local. Strategic suppliers provide services and products that could have a high impact on Sibanye’s operations, such as reagents and underground support. Without their inputs, production would be seriously hampered. Engagement with them is interactive and contracted to minimise any potential risk to production. Continuous innovation would enhance solutions and drive down costs. A highly interactive partnership ensures that Sibanye’s ability to produce is enhanced.
Tactical suppliers provide Sibanye with the bulk of the day-to-day goods and services required for production. Engagement with these suppliers takes place at an operational level and any issues are managed through the supply chain, which is bound by the Group’s procurement policy. The quality and cost of goods and services are managed through tenders and the ordering process.
Local suppliers are small, medium and micro enterprises (SMMEs) within communities around Sibanye’s operations. Engagement is highly active as the Group needs to develop and grow these suppliers to enable them to support local economic development (LED) and job creation. The skills and experience of local suppliers need to be developed and enhanced to ensure good-quality and sustainable supply of goods and services. These stakeholders expect to play an active and sizeable role in Sibanye’s supply chain.
CHAMBER OF MINES AND INDUSTRY PEERS
Sibanye engages regularly with its peers in the gold, platinum, coal and bulk minerals segments. Collaborative engagement, involving non-competitive issues of common interest, is more prevalent in the gold sector with information and other lessons, particularly sharing health and safety management and community engagement, and collaboration is actively pursued where it can be more effective. The Group also co-operates in strategic industry interventions with potential for synergies. Co-operation is based on agreed mechanisms for and mature rules of engagement. Among gold-mining companies, particularly, co-operation to promote achievement of common goals is strong.
The Chamber of Mines, which plays an important role in expediting peer engagement and in lobbying national government on behalf of the industry, protects the collective interests of mining companies and promotes a positive image of the mining sector as being progressive, transformed and effective, in consultation with other national stakeholders. Chamber membership is voluntary and most major South African mining companies are members.
The Chamber provides a platform, through company representation on collective committee structures, to discuss matters of strategic importance to the mining industry and to provide a mandate to the Chamber. Experts within the Chamber provide leadership in strategic thinking on a broad range of policy domains. Established communication channels are in place to secure strong alignment between the Chamber and its members.
EMPLOYEES AND ORGANISED LABOUR
Sibanye employs 46,269 people with a diverse set of skills, and various educational and cultural backgrounds. They provide services ranging from core mining to processing and support services. Engagement varies, based on the nature of the issue and level of employee. Engagement with management is generally constructive.
Allied to engagement with employees is engagement with organised labour, which includes unions representing certain employee categories, principally those involved in core mining and processing. The unions with whom Sibanye engages are AMCU, the National Union of Mineworkers (NUM), the United Association of South Africa (UASA) and Solidarity. The nature of this engagement is formal. Wage negotiations, conducted collectively for the gold producers under the auspices of the Chamber of Mines, are the most visible subject in union engagement. Inter-union rivalry and its effects are a major concern. Sibanye’s engagement and interaction with the unions is generally respectful and constructive.
Since listing, Sibanye has made significant effort to re-establish direct lines of communication with its employees. Given the close contact and consistent communication, there has been a shift from an adversarial to a more collaborative approach, albeit with some level of scepticism. Sustainable employment, higher wages and benefits are the main tangible employee expectations. However, they also expect a relationship based on values. Union relationships tend to be more complex with a clear political influence affecting relations. The quality of the relationship with employees is evident in greater participation in Group programmes, feedback and the degree of workplace disruptions.
| |
Sibanye Gold Integrated Annual Report 2015 | 30 |
COMMUNITY AND CONSULTATIVE FORUMS
Communities in the vicinity of and affected by Sibanye’s operations, together with those in the Southern African Development Community (SADC) labour-sending areas, are an important stakeholder grouping. Engagement is undertaken with formal and informal representatives through community and consultative forums as well as civic groups, non-governmental organisations (NGOs), and other special-interest groups. These forums, which are often multi-stakeholder in nature, comprise local community leaders and representatives as well as local government officials. They address issues of mutual concern, such as employment and LED, especially business development and access to supply-chain opportunities. The forums have introduced greater degrees of transparency and openness between Sibanye and communities. Ongoing, structured engagement facilitates positive dialogue to identify and address the negative impacts of mining on communities. The chief focus is to identify, discuss and resolve issues affecting communities.
REGULATOR, NATIONAL, PROVINCIAL AND LOCAL GOVERNMENT
Sibanye engages with all levels of government and various government departments but principally with office bearers based in the Gauteng and Free State, as well as (following the Burnstone acquisition) the Mpumalanga regional offices of the DMR regarding safety and mining rights. Other departments with which Sibanye engages include environmental affairs, water and sanitation, labour, health and education, among others.
Engagement with the national offices is on an as-and-when-needed basis. Engagement is ongoing and generally robust yet constructive. Inconsistencies in the application of regulatory requirements and individuals’ preferences can be problematic, and engagement at local level is frequently included in the community and consultative forums in which local government is represented.
Other regulators with whom Sibanye engages are the National Nuclear Regulator and National Energy Regulator of South Africa as well as the JSE, the NYSE and US SEC regarding its stock-exchange listings.
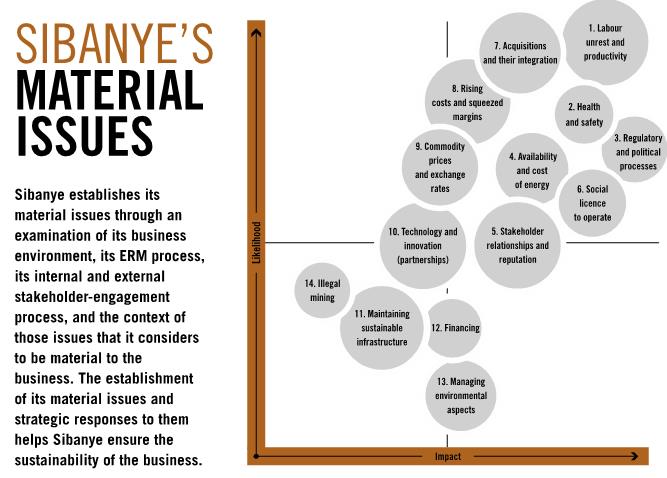
| |
Sibanye Gold Integrated Annual Report 2015 | 31 |
TOP 14 MATERIAL ISSUES
1. LABOUR UNREST AND PRODUCTIVITY
Context
Industrial unrest and union rivalry have featured in the South African mining industry for some time. This undermines Sibanye’s operational efficiency and performance, and negatively affects financial performance. Labour unrest can result in work stoppages. Demand for higher wages results in increased costs often without a corresponding increase in productivity.
Sibanye’s view
Sibanye is concerned that strikes in the major mining companies could damage the South African economy, and hold back growth and employment. This remains a threat to the Group’s operations in light of the implementation of the wage agreement without full acceptance during the negotiations. Union rivalry may further fuel the situation.
Sibanye recognises and respects employees’ rights, including the right to work safely, to develop and contribute, and to associate. Harmonious relations are top of mind.
Sibanye understands its history and the union membership landscape so it has been essential to create and sustain an engagement platform where all represented and recognised unions are allowed equal rights to engage with employees and management. Information is shared and discussed using agreed joint leadership and future forums when rights and obligations are consistently applied.
Sibanye’s vision is to create superior value for all its stakeholders, and this has resulted in processes to modernise employee engagement within and outside the workplace.
Employees understand the positive impact that the operating model has had on extending life of mine (LoM) and thus creating employment opportunities. However, this could be jeopardised by union rivalry, which does not consider or the stability of the business as a top priority.
Strategic response and action
Since inception, post the 2012 unbundling of Sibanye from Gold Fields, the Group proactively tried to win the hearts and minds of employees with the ‘People at Sibanye’ strategy. This integrated approach deals with key employee-related aspects and focuses on implementing integrated solutions.
Elements of the People at Sibanye strategy include:
| · | | selling Group houses and facilitating affordable housing aligned to home-ownership allowances paid to employees |
| · | | indebtedness programmes focused on moving beyond consolidating debt to personal balance sheet growth and financial wellbeing |
These initiatives are backed by unfiltered dialogue between employees and line managers, supported by frequent factual communication from the desk of the Chief Executive Officer (CEO). Recent employee survey findings have clearly indicated that employees prefer management communication and engagement to gather information as the ‘union rivalry’ phase has created a measure of confusion and distrust.
For further information, see Integrated Annual Report–Optimise–Develop a productive, skilled and engaged workforce and Integrated Annual Report–Sustain–Social upliftment and community development.
2. HEALTH AND SAFETY
Context
Underground mining exposes miners to, among others, heat, dust, noise and injury through fall of ground. Consequently, the industry is subject to stringent health and safety laws and regulations. In addition, the industry is experiencing the negative effects of pandemics, such as HIV/Aids, along with accidents, accident investigations and stoppages, which adversely affect productivity and costs. Furthermore, investors do not want to invest in companies that do not manage their safety and health matters effectively.
Sibanye’s view
Sibanye believes that the safety and health of employees are essential for an engaged, productive workforce and that healthy employees work safely.
| |
Sibanye Gold Integrated Annual Report 2015 | 32 |
In striving for zero harm at its operations, Sibanye aims to eliminate the potential for accidents and injury, and to minimise hazards inherent in the working environment in a practical manner.
Sibanye has extensive systems of control in place to minimise health and safety risks. About 80% rely on employees taking ownership – from the CEO to line management, supervisors and mineworkers. Sibanye’s integrated safety and health strategy includes adherence to operational standards and responsibility, engineering-out risk initiatives, fall-of-ground initiatives and action plans, improvement of employee wellbeing, application of appropriate technologies, and effective education and training.
Strategic response and action
For further information, see Integrated Annual Report–Optimise–Develop a productive, skilled and engaged workforce, Integrated Annual Report–Sustain–Health and safety focus and Integrated Annual Report–Grow–Modernisation and technological innovation.
3. REGULATORY AND POLITICAL PROCESSES
Context
The South African mining environment is governed by legislation to redress some of the social and economic imbalances of the past. The mineral rights are subject to legislation in terms of the MPRDA, the Mining Charter and SLPs. Policy changes, particularly related to the MPRDA and the Mining Charter, create a framework for the transformation of the mining industry but increase the risk of non-compliance and handicap Sibanye’s ability to deliver value.
It is important to maintain sound relations with the regulator, the DMR, particularly upholding licence conditions. This includes directives, instructions, suspension or cancellation of mining rights.
The political environment is outside of Sibanye’s control but any negatives can be improved by the quality of stakeholder relations.
Sibanye’s view
The threat of policy changes, including amendments to the MPRDA and legislative concerns, such as the outcome of the interpretation of BEE ownership, increases uncertainty and deters investment required for growth and sustainability.
Policy uncertainty is making South African business reluctant to invest in the country and adding to the difficulty of attracting investors.
As 2015 preceded an election year, the DMR was under increasing pressure, particularly from local government officials, to compel mining companies to comply with Mining Charter requirements and SLP commitments. Operations have had to bear the brunt of these demands in the form of stringent compliance inspections. Sibanye made an effort to maintain relations with the regulator to ensure that a neutral platform prevails for issues to be raised before sanctions are considered.
Strategic response and action
In view of the pending local elections in 2016, Sibanye has made an effort to engage with executive mayors in district and local municipalities, particularly in the Free State. This was important to understand the socio-political dynamics on the ground and potential risks for our operations. Executive mayors and councillors were kept in the loop about developments at Sibanye and realistic assessment of projects that can be funded. This engagement is expected to gain momentum in early 2016.
At industry level, differences between the interpretations of the ‘once empowered, always empowered’ principle saw the Chamber of Mines approaching the courts to seek a ‘declaratory order’ on the issue. The matter is still pending. We have yet to engage the new Minister following Cabinet changes made by the President.
The recent promulgation of the BBBEE Amendment Act, 2013 (Act No 46 of 2013) has resulted in the introduction of a ‘trumping’ provision (the Act will trump other laws) in relation to legislation on transformation. The current Mining Charter now needs to be aligned with the BBBEE Amendment Act before it is published. We have been part of the consultation process and will continue to influence the process to ensure that the requirements can be achieved.
For further information, see Integrated Annual Report–Sustain–Social upliftment and community development, Integrated Annual Report–Sustain–Transformation and Integrated Annual Report–Grow–Secure alternative energy sources.
4. AVAILABILITY AND COST OF ENERGY
Context
National supply of electricity has been constrained due to the shortage of available generating capacity at Eskom. This has resulted in regular load curtailment, especially during the first half of 2015, which interrupted certain production activities, mainly in the milling and processing of low-grade surface sources.
Eskom has been successful in reducing the extent of load curtailment, albeit through extensive use of expensive generating plant, which increases the upwards cost pressure on Eskom tariffs. Electricity tariffs have escalated substantially above general inflation for several years, resulting in electricity costs increasing from 9% of operating costs in 2007 to over 20% in 2015.
| |
Sibanye Gold Integrated Annual Report 2015 | 33 |
Sibanye’s view
While Eskom expects minimal load curtailment in 2016, risks of load curtailment, with associated impact on production operations, are expected to remain appreciable for the next five years.
Despite the operations reducing energy consumption by 2% to 3% per annum since initiatives to improve energy efficiency and reduce energy wastage, electricity costs have increased to about 18% of operating costs.
Escalation of electricity tariffs is expected to continue well above general inflation for Eskom’s tariffs to remain cost-reflective, as included in the national electricity regulation framework. This escalation will contribute significantly to above-inflation increases in mining costs, which will erode margins and raise pay limits, thereby potentially sterilising Mineral Resources.
Strategic response and action
Electricity tariff escalation is partially offset through continuous effort to reduce electrical energy consumption through efficiency improvement and reduction in wasted energy with a view to continuing to secure a 2% to 3% per annum reduction in energy consumption.
In addition, strategies for complying with load curtailment obligations are being enhanced to lessen the impact on revenue-generating activities. The above-inflation electricity cost escalation that cannot be offset is accommodated in the pay limit calculations that are the basis of declaring Mineral Reserves and annual operational planning.
For the longer term, Sibanye has developed an alternative electricity programme that focuses on establishing private electricity-generating capacity that will provide energy security and cost- competitiveness. In addition to assessing various opportunities to generate base load electricity supply with an independent power producer (IPP), a 150MW photovoltaic project is currently in permitting phase with a target date for first generation of electricity towards the end of 2017.
For further information, see Integrated Annual Report–Optimise–Optimise and integrate operations, Integrated Annual Report–Sustain–Manage environmental impact and Integrated Annual Report–Grow–Secure alternative energy sources.
5. STAKEHOLDER RELATIONSHIPS AND REPUTATION
Context
Sibanye’s reputation is determined and defined by stakeholders’ perceptions of the Group, particularly communities in the vicinity of the mining operations. Sibanye recognises that its long-term success is based on establishing and maintaining sound and respectful relationships of trust with a wide range of internal and external stakeholders.
Sibanye recognises that there are enormous challenges and developmental needs among some members of its communities, and recognises its own limitations in terms of what it can do.
Sibanye’s view
Sibanye’s engagement efforts are guided and underpinned by its CARE philosophy and vision. This enables it to immediately hear and validate its stakeholders’ concerns while respectfully affirming the Group’s position.
Through sound stakeholder engagement, the Group is able to make a lasting and meaningful contribution to human development while ensuring that its reputation and business remain intact.
While building and maintaining good relations with stakeholders does not guarantee avoidance of social unrest, this positions Sibanye well to navigate issues that arise within its communities from time to time.
Strategic response and action
Sibanye engages proactively and speedily to avoid the reputational impact that could result from non-responsiveness. It endeavours to form meaningful partnerships with other businesses in its areas of operation in order to pool its resources for greater impact. Collaboration bodes well for all parties and keeps local municipalities in the loop as key stakeholders.
For further information, see Integrated Annual Report–Sustain–Social upliftment and community development, Integrated Annual Report–Sustain–Manage environmental impact and Integrated Annual Report–Sustain–Transformation.
6. SOCIAL LICENCE TO OPERATE
Context
Sibanye’s social licence to operate is the vehicle that drives government’s transformation agenda in that it revolves around the level of satisfaction within communities adjacent to the operations. At the heart of this agenda is the Mining Charter.
Sibanye’s view
While the Mining Charter expired at the end of 2014, this does not mean that there is no need to continue with the transformation effort. Work currently underway on the new Mining Charter seems to indicate that there will be a renewed sense of urgency in the next few years.
| |
Sibanye Gold Integrated Annual Report 2015 | 34 |
Strategic response and action
At a minimum, Sibanye will continue to engage with its stakeholders, deliver on its socio-economic development initiatives, share value with all stakeholders, and submit and implement its SLPs.
The Group has continued to engage the DMR to ensure that it remains proactive and compliant with regard to the maintenance of mining rights for all the operations.
The Corporate Affairs department plays a critical role in the Chamber of Mines Charter Reference Group developing industry proposals on the new Mining Charter and alignment with the new DTI codes and the BBBEE Amendment Act.
Sibanye has established relations with structures representing communities in order to streamline processes relating to employment and procurement opportunities in the Free State. The same approach is being tested before rolling out in the Gauteng area. The current partnership, which includes the Matjhabeng Local Municipality, is underpinned by a memorandum of understanding (MoU).
Sibanye has begun engaging with traditional leaders and municipal councillors in rural labour-sending areas as well as representatives of the governments of Lesotho, Botswana and Mozambique. As these stakeholders have potential influence over more than 67% of Sibanye employees, it was important to ensure that they were apprised of Sibanye and how the CARE approach is implemented.
Corporate Affairs has been instrumental in providing guidance and support to the mining operations to ensure that adequate compliance levels are achieved. This includes scanning the internal and external environments for potential and other risks, and identifying and implementing mitigation strategies.
For further information, see Integrated Annual Report–Sustain–Social upliftment and community development, Integrated Annual Report–Sustain–Manage environmental impact and Integrated Annual Report–Sustain–Transformation.
7. ACQUISITIONS AND THEIR INTEGRATION
Context
Timely and efficient integration of Sibanye’s inorganic acquisitions into the operating model and supply chain will be essential to delivering on the business strategy.
Sibanye’s view
The proposed acquisitions of Anglo American Platinum’s Rustenburg Operations and Aquarius will require significant management focus to align them with the Sibanye operating model. The lessons learnt from the integration of the Cooke operations and Burnstone will be taken into account.
Strategic response and action
Sibanye will integrate the acquisitions based on sound project-management principles and, where applicable, external parties may be contracted to assist with post-acquisition integration and stakeholder communication.
For further information, see Integrated Annual Report–Optimise–Optimise and integrate operations and Integrated Annual Report–Grow–Acquisitions and funding model.
8. RISING COSTS AND SQUEEZED MARGINS
Context
Increasing costs – of power and labour in particular – affect operating margins, inhibit cash flow and profitability, and consequently Sibanye’s ability to pay dividends.
As a result of escalating electricity, wages and other costs, and other input price increases, the mining sector is losing out on opportunities to sustain current jobs or create more jobs. Rising costs and squeezed margins are contributing factors to slowing economic growth and the unemployment rate increasing from 25.0% to 25.5% in 2015.
Sibanye’s view
From Sibanye’s point of view, these are the critical implications of rising costs:
| · | | increased pay limit (break-even grade) |
| · | | reduction in Mineral Reserves and LoM |
| · | | possible early closure of shafts |
| · | | labour tension due to downsizing |
| · | | reduced cash generation impacting the dividend |
| |
Sibanye Gold Integrated Annual Report 2015 | 35 |
Strategic response and action
Dealing with rising costs is an ongoing initiative, which includes:
| · | | conservative commodity and exchange-rate assumptions for planning |
| · | | cost management and control |
| · | | strategic procurement initiatives |
| · | | stakeholder management (for example, with Eskom) |
For further information, see Integrated Annual Report–Optimise–Optimise and integrate operations, Integrated Annual Report–Sustain–Project development and capital allocation, Integrated Annual Report–Grow–Secure alternative energy sources and Integrated Annual Report–Grow–Modernisation and technological innovation.
9. COMMODITY PRICES AND EXCHANGE RATES
Context
The revenue Sibanye earns is determined largely by the prices received for gold sold and, to a lesser extent, for uranium. Both these prices, over which Sibanye has no influence, are set on global markets in terms of US dollars.
As Sibanye is domiciled and operates in South Africa, dollar receipts for product sold must be converted to South African rand, and the amount received in rands is thus a function of the rand/US dollar exchange rate. Ultimately, rand revenue is then a function of the gold price in dollars and the local exchange rate. As the dollar gold price has continued to weaken over the past three years so too has the rand/dollar exchange rate, which has helped to counter declines in the dollar price of gold in terms of rand revenue earned.
Sibanye’s view
Volatility in the gold price and the rand/US dollar exchange rate in recent years has resulted in financial uncertainty in terms of revenue generated, cash flows and profitability.
Furthermore, the rand/US dollar exchange rate also has an impact on costs incurred, chiefly in rand. A weakening rand contributes to higher rand revenue, to lower costs in terms of US dollars and to increased operating margins. The opposite is also true: a stronger rand implies reduced rand revenue, higher costs in terms of dollars and decreased operating margins. It is therefore vital that the business is managed to counter the effects of this volatility.
Strategic response and action
To counter the effects of market volatility, Sibanye has devised an operating model that, to increase margins, is based on:
| · | | optimising capital expenditure |
| · | | reducing costs and pay limits |
For further information, see Integrated Annual Report–Optimise–Optimise and integrate operations, Integrated Annual Report–Sustain–Project development and capital allocation and Integrated Annual Report–Grow–Acquisitions and funding model.
10. TECHNOLOGY AND INNOVATION (PARTNERSHIPS)
Context
Modernisation of mining processes is a means to improve productivity and the safety of employees in the workplace.
Sibanye’s view
Development of new technology or innovation will have a substantial impact on Sibanye’s ability to create value over time. Improved mining methods and cycles will allow extraction of maximum value from assets and resources by lowering cut-off grades, decreasing dilution and increasing production rate. The net result will be higher volumes of better-quality product with substantial reductions in injury-frequency rates, facilitated by reduced employee exposure to danger areas.
Strategic response and action
In order to develop fit-for-purpose technology, Sibanye has developed partnerships with developers and suppliers as well as MoUs governing information sharing with counterparts in the mining industry.
Sibanye established the Safe Technology department in July 2014. It has since facilitated industry-wide due diligence on past, current and future developments with respect to modernising narrow, tabular and steeply dipping ore-body extraction. The
| |
Sibanye Gold Integrated Annual Report 2015 | 36 |
process yielded a number of technologies that have been actively pursued and are in various stages of investigation, development and implementation.
For further information, see Integrated Annual Report–Optimise–Optimise and integrate operations, Integrated Annual Report–Grow–Secure alternative energy sources and Integrated Annual Report–Grow–Modernisation and technological innovation.
11. MAINTAINING SUSTAINABLE INFRASTRUCTURE
Context
Modernisation of mining processes is a means to improve productivity and the safety of employees in the workplace.
Sibanye’s view
Inadequately maintained infrastructure can result in unplanned breakdowns and stoppages with possible production delays, increased costs and industrial accidents.
Strategic response and action
Capital expenditure is linked to infrastructure risk assessment. Sibanye keeps a maintenance risk register and conducts regular shaft infrastructure maintenance management inspections.
For further information, see Integrated Annual Report–Optimise–Optimise and integrate operations, Integrated Annual Report–Sustain–Project development and capital allocation and Integrated Annual Report–Grow–Acquisitions and funding model.
12. FINANCING
Context
Appropriate and required financing can be difficult and often expensive. Efficient, sensible funding of acquisitions and aging infrastructure must be planned and co-ordinated, and optimum levels of debt and funding mechanisms determined.
Sibanye’s view
Sibanye is particularly aware that:
| · | | lack of finance can cause short-term liquidity constraints during periods of low delivery (extended Christmas and Easter breaks) and during strikes (legal/illegal) |
| · | | availability and cost of funding can impact internal organic growth and acquisitive growth |
| · | | the cost of finance can have a severe impact on cash flow and the dividend. |
Strategic response and action
Debt facilities are in place at competitive interest rates:
| · | | R2.5 billion revolving-credit facility |
| · | | R1 billion term-loan facility |
| · | | US$350 million revolving-credit facility |
| · | | US$150 million bridge financing for the Aquarius acquisition |
| · | | restructuring or refinancing of debt will be considered when appropriate. |
For further information, see Integrated Annual Report–Sustain–Project development and capital allocation and Integrated Annual Report–Grow–Acquisitions and funding model.
13. MANAGING ENVIRONMENTAL ASPECTS
Context
By its very nature, mining has an impact on its surrounding environment. The South African mining industry is governed by extensive laws and regulations to regulate its use of natural resources and to protect the environment against adverse impacts caused by its activities.
Sibanye’s view
Sibanye believes it is vital that it acts as a responsible environmental steward. Preventing and minimising the environmental consequences of mining activities will also contribute to positive stakeholder relations and will minimise any reputational damage.
Strategic response and action
| |
Sibanye Gold Integrated Annual Report 2015 | 37 |
Sibanye must make optimal use of natural resources, especially water and energy, conserve land and comply strictly with environmental legislation.
For further information, see Integrated Annual Report–Sustain–Manage environmental impact.
14. ILLEGAL MINING
Context
Illegal mining impacts Sibanye on the surface, and in its underground working areas. These activities are difficult to control, and can disrupt the business and expose it to liability. This negatively impacts employees, production and profitability.
Sibanye’s view
While illegal surface mining holds lesser risks for Sibanye from a reputational, health and safety, and financial perspective, illegal mining in its underground workings is of grave concern. Illegal mining in the underground workings negatively impacts infrastructure, health and safety, equipment, product, production schedules/targets, and people.
In some instances, central blasts are tampered with resulting in lost blasts and therefore lost production. In other instances, winches and other equipment are used by illegal miners and this equipment is often damaged, which incurs repair costs or lost time with a negative impact on production.
Health and safety may be compromised by illegal miners lighting fires, indiscriminately urinating and defecating, smoking, undermining underground support and spiking water supply systems. A major consequence of illegal miner induced anomalies could be statutory stoppage of operations, which results in substantial production and financial loss.
Also of concern is employees (including security employees) being coerced, corrupted or compromised to assist the practice of illegal mining.
Strategic response and action
Illegal mining activities, on the surface and within the underground workings at Sibanye, may be described as manageable. In order to deal with this risk, Sibanye has the following in place:
| · | | a security roll-out plan to deal with this issue from a preventative, investigative and criminal perspective |
| · | | a highly trained tactical response team to locate and extricate illegal miners from underground workings |
| · | | an anonymous reporting platform |
| · | | a reward system for whistleblowers and employees who apprehend illegal miners |
| · | | a well-developed internal communication strategy |
| · | | a focused Illegal Mining Task Team (multi-disciplinary with senior representation) |
For further information, see Integrated Annual Report–Optimise–Optimise and integrate operations.
| |
Sibanye Gold Integrated Annual Report 2015 | 38 |
Our performance review is structured around the optimise, sustain and grow strategic enablers.
We have sought to provide further insight into the underlying strategic initiatives to demonstrate our performance and outlook that is ultimately linked to our ability to create and sustain value.
Optimise
OPTIMISE AND INTEGRATE OPERATIONS
Approach
Sibanye’s operating model is based on the implementation of fundamental mining practices and flat, cost-efficient structures designed to optimise and sustain operational performance. The Group has a proven operational track record of managing complex mines and is confident that, by applying its operating model and mining capability to new acquisitions and projects, it can continue to realise value for stakeholders.
The Group’s cash-generative capacity of its high-quality gold operations and robust balance sheet ideally position the Group to benefit in the current environment of depressed commodity prices and relatively low mining-company valuations. By optimally managing its current operations and successfully integrating recent and pending acquisitions, Sibanye will be able to deliver on its vision while continuing to pay sustainable, industry-leading dividends to shareholders.
Performance
The optimisation of operations is multi-faceted, and is underpinned by the Sibanye operating model and its principal objectives. The focus is primarily on initially reducing then managing costs, which are under management’s control, thereby lowering pay limits (or the grade at which the operations can be mined at break-even), which results in an increase in operational flexibility and cash margins. Key elements of the optimisation process include continuous re-engineering of the business, and introduction and adherence to planned return cut-off ore reserve management principles. Initial restructuring in 2013 and 2014 of the gold assets resulted in a meaningful increase in production and decrease in operating costs. Further cost reductions at these assets are likely to be more incremental.
Optimisation of the existing gold operations also involved, among other initiatives, reducing energy consumption so as to minimise the effect of load shedding on operations as well as reducing the cost of power; addressing air leakages underground and increased expenditure on security in order to reduce the impact of illegal mining, which negatively impacts on production and hence profitability and potentially the life of the operations.
Sibanye’s Safe Technology function – see the section Integrated Annual Report–Grow–Modernisation and technological innovation – is researching and developing new technology, which aims to provide a modern mining environment that is safer and more productive in future, and could potentially deliver a profitable long-term future for the industry by allowing safe extraction of previously inaccessible resources and resources at depth.
OPERATIONAL PERFORMANCE
Overall, gold production in 2015 was lower year-on-year, largely as a result of operational disruptions in the first quarter of the year, especially at Kloof, and periodic electrical load curtailments for most of the first half of the year. Opportunities to improve productivity and recover lost production were identified and implemented at all operations, resulting in improved production levels in the second half of the year.
Average unit costs for the year were negatively affected by the lower level of production, the inclusion of the Cooke Operations for a full year (only seven months in 2014), higher labour costs and electricity tariffs.
Two-thirds – R2,305 million – of the total capital expenditure of R3,345 million was spent on ORD at the operations to maintain operational flexibility, in line with our operating model, while R669 million was expended on sustaining capital expenditure and infrastructural maintenance (one of our material issues).
Future focus
The focus in 2016 will be on ensuring that operational issues, which affected the first quarter of 2015, are not repeated and that greater effort is applied to quality-of-mining factors in order to ensure safe operational delivery against plan in the Gold division. Efficient integration of the platinum assets and implementation of the Sibanye operating model, and CARE culture, will be driven by the organisational effectiveness team together with executive and senior management.
| |
Sibanye Gold Integrated Annual Report 2015 | 39 |
KEY statistics by operation
| | | | | | | | | | |
Tons milled (000) | |
| Underground | Surface | Total | Main development | Area mined(m2) |
| 2015 | 2014 | 2015 | 2014 | 2015 | 2014 | 2015 | 2014 | 2015 | 2014 |
Beatrix | 2,723 | 2,571 | 1,596 | 1,975 | 4,319 | 4,546 | 21,599 | 19,733 | 416,684 | 384,701 |
Cooke1 | 1,470 | 893 | 4,323 | 2,779 | 5,793 | 3,672 | 12,923 | 9,508 | 204,835 | 175,627 |
Driefontein | 2,412 | 2,497 | 3,360 | 2,867 | 5,772 | 5,364 | 15,704 | 17,376 | 384,109 | 374,914 |
Kloof | 1,979 | 1,983 | 1,998 | 2,670 | 3,977 | 4,653 | 17,899 | 18,743 | 307,750 | 304,930 |
1 Since incorporation on 15 May 2014
| | | | | | | | | | |
Yield (g/t) | All-in sustaining cost |
| Underground | Surface | Overall | Actual (R/kg) | Margin (%) |
| 2015 | 2014 | 2015 | 2014 | 2015 | 2014 | 2015 | 2014 | 2015 | 2014 |
Beatrix | 3.51 | 3.74 | 0.34 | 0.38 | 2.34 | 2.28 | 408,422 | 377,101 | 14 | 15 |
Cooke1 | 3.65 | 4.16 | 0.21 | 0.21 | 1.08 | 1.17 | 541,843 | 445,645 | (14) | (2) |
Driefontein | 6.36 | 6.54 | 0.60 | 0.49 | 3.01 | 3.31 | 373,752 | 357,333 | 21 | 19 |
Kloof | 6.49 | 7.89 | 0.61 | 0.52 | 3.54 | 3.66 | 426,223 | 352,624 | 10 | 20 |
1 Since incorporation on 15 May 2014
| | | | | | | | | | |
Tons milled (000) | |
| Underground | Surface | Total | Capital expenditure (Rm) | Total cash (R/kg) |
| 2015 | 2014 | 2015 | 2014 | 2015 | 2014 | 2015 | 2014 | 2015 | 2014 |
Beatrix | 9,557 | 9,603 | 548 | 751 | 10,105 | 10,354 | 597 | 548 | 340,792 | 313,888 |
Cooke1 | 5,359 | 3,719 | 893 | 586 | 6,252 | 4,305 | 337 | 230 | 474,584 | 395,168 |
Driefontein | 15,345 | 16,329 | 2,005 | 1,406 | 17,350 | 17,735 | 994 | 1,149 | 309,764 | 283,129 |
Kloof | 12,848 | 15,653 | 1,220 | 1,385 | 14,068 | 17,038 | 1,130 | 1,236 | 342,764 | 271,282 |
1 Since incorporation on 15 May 2014
Beatrix
Located in the Free State province of South Africa, some 240km south-west of Johannesburg, near Welkom and Virginia, Beatrix operates under new order mining rights covering a total area of 16,821ha. Beatrix is principally an underground mine with nominal surface reserves represented by surface rock dumps (SRDs) accumulated during the operating history of the mine.
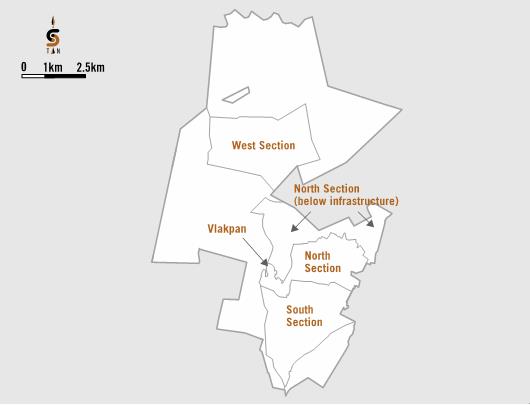
| |
Sibanye Gold Integrated Annual Report 2015 | 40 |
DESCRIPTION
Gold mining began at Beatrix in 1985 and at Oryx (Beatrix 4 Shaft, also known as West Section) in 1993.The existing scope of operations is the result of the consolidation of the adjacent Beatrix and Oryx mines on 1 July 2002.
Beatrix has three operating shaft systems with two ventilation shafts to provide additional upcast and downcast ventilation capacity, and is serviced by two metallurgical plants.
Beatrix, a shallow to intermediate-depth operation, mining at depths of between 700m and 2,200m below surface, exploits the Beatrix Reef at shafts 1 and 3, and the Kalkoenkrans Reef at 4 Shaft. Situated near regional urban centres where it can routinely obtain supplies, the mine has access to the national electricity grid and to water, road and rail infrastructure.
Processing occurs by way of carbon in leach (CIL) and carbon in pulp (CIP) treatment at the No 1 and 2 plants respectively.
INFRASTRUCTURE
| |
Shaft system | Hoisting capacity1 |
No 1 | 138ktpm |
No 3 | 170ktpm |
No 42 | 120ktpm |
1 Capacities based on operations requirements and constraints
2 Includes Beisa
| | |
Processing plant | Capacity | Recovery factor |
No 1 | 243ktpm | 96% |
No 2 | 130ktpm | 95% |
PERFORMANCE IN 2015
Gold production decreased by 2% to 10,105kg (324,900oz) in 2015. This was primarily due to anticipated lower grades at the West Section (4 Shaft), partly offset by high volumes and grades from the North Section.
Underground ore milled increased by 6% to 2.7Mt in 2015, offsetting a 6% lower yield, which averaged 3.51g/t. As a result, gold production from underground was flat at 9,557kg.Unit costs decreased by 2% to R1,169/t.
To improve mining flexibility, on-reef development was increased by 4% to 6,344m, mainly at the West Section. Main development increased by 9% to 21,599m. The average development value increased to 1,100cm.g/t from 1,034cm.g/t.
Underground operating costs increased by 4% to R3,185 million, reflecting the higher development and stoping volumes at the North and West sections, and the above-inflation increases in wages and electricity tariffs, partly offset by an increase in ORD capitalised. Underground operating profit increased by 16% to R1,371 million and the operating margin increased from 28% to 30% in 2015.
The Beatrix surface operations contributed 548kg, 27% lower than in 2014. This was mostly due to a 19% decrease in tons processed due to SRD material being displaced by higher grade underground ore, and marginally lower grades. Operating profit for the year amounted to R53 million.
Capital expenditure increased by 9% to R597 million in 2015. The increase was predominantly due to the increase in off-reef development at Beatrix West Section, following the suspension of development in 2014 in order to maintain the economic viability of the section.
Cooke
Located near Randfontein, approximately 30km south-west of Johannesburg in the province of Gauteng, South Africa, the Cooke underground operations comprise four vertical shafts (Cooke 1 to 4 and the Ezulwini Plant) and the surface operation (with a dedicated processing facility), serviced by a developed network of mining and civil infrastructure with adequate electricity and water supplies. The operations have three individual new order mining rights: Cooke 1, 2 and 3 cover 7,875ha, Cooke 4 covers 3,718ha and the surface operations cover 3,230ha.
| |
Sibanye Gold Integrated Annual Report 2015 | 41 |
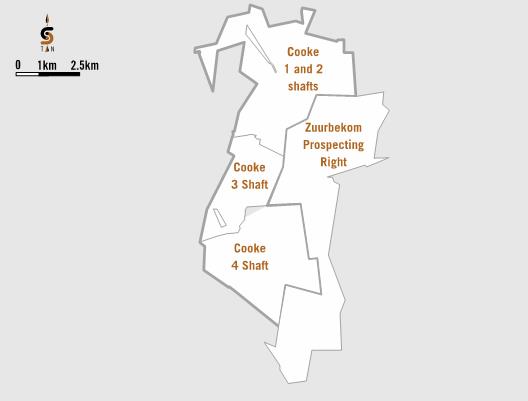
DESCRIPTION
The Cooke Operations consist of four producing shaft systems and well as three metallurgical plants.
The underground operations are relatively shallow (~1,000m) with fewer seismicity or heat challenges than experienced at the neighbouring Kloof or Driefontein operations. The primary gold-bearing reef horizon mined at Cooke 1, 2 and 3 is the UE1A and the Upper Elsburg Reef at Cooke 4.
Access to the Ezulwini uranium plant allows for near-term production of uranium from underground ore mined at Cooke as a by-product.
The Cooke Plant was constructed in 1978 and has a nameplate capacity of 280,000tpm.
In 2005, it was converted from a reef treatment plant to treat sand from the nearby high-grade Dump 20 tailings storage facility (TSF). High-grade ore from the Cooke 1, 2 and 3 shafts was diverted for toll treatment at Harmony’s Doornkop Plant.
Today, the Cooke surface operations process tailings from Dump 20 at a monthly rate of approximately 350,000t to produce approximately 32,000oz of gold per annum. Mixed gold and uranium underground ore from Cooke 3 and all of Cooke 4’s ore is treated at the dual-stream Ezulwini gold- and uranium-recovery plants.
INFRASTRUCTURE
Shaft system | Hoisting capacity1 |
No 1 | 15ktpm |
No 2 | 28ktpm |
No 3 | 54ktpm |
No 4 | 56ktpm |
1 Capacities based on operations requirements and constraints | |
| | |
Processing plant | Capacity | Recovery factor |
Cooke plant | 400ktpm | 60% |
Ezulwini gold plant | 150ktpm | 95% |
Ezulwini uranium plant | 50ktpm | 78% |
PERFORMANCE IN 2015
Gold production in 2015 amounted to 6,252kg (201,000oz) compared with 4,305kg (138,400oz) for the seven months since acquisition, ended 31 December 2014. The average yield was marginally lower at 1.08g/t.
Underground production was 5,359kg compared with 3,719kg for seven months in 2014. Underground ore milled was 1.5Mt at a yield of 3.65g/t.
| |
Sibanye Gold Integrated Annual Report 2015 | 42 |
The R58 million operating loss from the underground operation was offset by R54 million operating profit from surface, resulting in an operating loss of R4 million. Underground operating costs for 2015 were R2,620 million at a unit cost of R1,782/t compared with R1,641/t in 2014.
Main development of 12,923m was 36% higher than in 2014 at an average value of 834cm.g/t, compared with 799cm.g/t for 2014.
The Cooke surface operations contributed 893kg (28,700oz) from throughput of 4.3Mt at a yield of 0.21g/t, which was similar to 2014.
Capital expenditure of R337 million was mainly spent on ORD and infrastructure upgrades, and the studies relating to the growth project: the WRTRP.
Driefontein
Located on the Far West Rand, in the mining district of Oberholzer, some 70km south-west of Johannesburg in the province of Gauteng, South Africa, Driefontein operates under new order mining rights covering a total of 8,561ha. It is an underground mine with surface reserves represented by rock dumps and TSFs that have accumulated throughout the operating history of the mine.
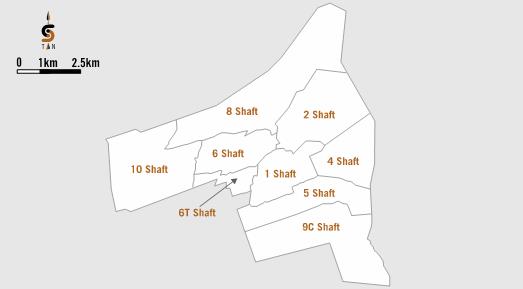
DESCRIPTION
Driefontein has six operating shaft systems at depths of between 700m and 3,420m below surface and three metallurgical plants exploiting the Carbon Leader Reef, the Ventersdorp Contact Reef and the Middelvlei Reef.
Driefontein has access to the extensive national electricity grid and to water, road and rail infrastructure. Located near regional urban centres where it can routinely obtain supplies, the mine was formed from the amalgamation of the East Driefontein and West Driefontein mines in 1999.
The Driefontein 1 Plant treats underground ore and has a processing capacity of 240,000tpm. The upgraded CIP circuit at the No 1 Plant consists of a semi-autogenous grinding (SAG) mill circuit followed by cyanide leaching, CIP and a central elution facility.
The Driefontein 2 Plant processes SRD material, which is delivered by rail and truck. Plant flow incorporates two SAG mills and a ball milling circuit, cyanide leaching and a CIP plant. A CIL circuit was commissioned in 2014 at the No 2 Plant to improve recoveries by replacing the aging CIP circuit.
The Driefontein 3 Plant was originally designed as a uranium plant but was converted to process low-grade surface rock in 1998. Similar to the No 2 Plant, SRD ore is delivered by rail and truck. The plant has four SAG mills followed by cyanide leaching and a CIP circuit.
INFRASTRUCTURE
| |
Shaft system | Hoisting capacity1 |
No 1 | 105ktpm |
No 2 | 165ktpm |
No 4 | 57ktpm |
No 5 | 159ktpm |
No 6 | 26ktpm |
No 8 | 60ktpm |
| |
Sibanye Gold Integrated Annual Report 2015 | 43 |
1 Capacities based on operations requirements and constraints
| | |
Processing plant | Capacity | Recovery factor |
No 1 | 240ktpm | 97% |
No 2 | 180ktpm | 81% |
No 3 | 100ktpm | 82% |
PERFORMANCE IN 2015
Due to a decrease in underground volumes and a planned decrease in grade, gold production from Driefontein decreased by 2% to 17,350kg (557,800oz) during 2015. The overall yield decreased from 3.31g/t to 3.01g/t.
Underground ore milled decreased by 3% to 2.4Mt, largely due to lower volumes in the March 2015 quarter. The yield also decreased by 3% year-on-year due to a face value decrease from 1,840cm.g/t in 2014 to 1,742cm.g/t in 2015. Accordingly, underground gold production was 6% lower at 15,345kg.
The cost of underground ore milled increased by 9% to R1,941/t year-on-year due to lower throughput and above-inflation increases in electricity tariffs and wages. In nominal terms costs increased by less than 6%. Main development decreased by 10% to 15,704m and on-reef development of 3,242m was 18% lower, as planned. Operating profit from the underground operations declined by 6% to R2,603 million due to the lower gold production and increase in costs. The operating margin decreased from 37% in 2014 to 36% in 2015.
Lower underground production was partly replaced by surface production, with gold from processing surface reserves increasing by 43% to 2,005kg. This was driven by a 22% increase in the yield to 0.60g/t due to higher-grade available SRDs and a 17% increase in tons milled at 3.4Mt. This was due to optimisation of existing milling capacity. Operating profit from surface operations increased from R145 million in 2014 to R399 million in 2015.
Capital expenditure of R994 million was 13% lower than in 2014. This was mainly due to the completion of infrastructure upgrades – a significant element being the No 2 Plant CIL upgrade (R117 million in 2014). Capital in 2015 was predominantly spent on ORD, the refrigeration and cooling plant on 38 Level and stabilisation of the shaft barrel at the Ya Rona Shaft.
Kloof
Located in the Far West Rand mining district of Westonaria, some 60km south-west of Johannesburg in Gauteng province, South Africa, Kloof’s new order mining rights cover a total of approximately 20,100ha. It is principally an underground mine with nominal surface reserves represented by SRDs and TSFs accumulated during the operating history of the mine.
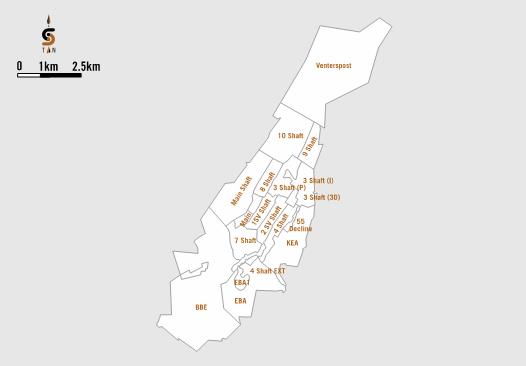
DESCRIPTION
The Kloof Operation is a complex of intermediate to ultra-deep level mines, predominantly mining the Ventersdorp Contact Reef, at depths of between 1,300m and 3,350m below surface. The mine is situated near regional urban centres where it can routinely
| |
Sibanye Gold Integrated Annual Report 2015 | 44 |
obtain supplies, and has access to the national electricity grid and to water, road and rail infrastructure. Kloof’s existing scope of operation is the result of the consolidation of the Kloof, Libanon, Leeudoorn and Venterspost mines in 2000.
Gold mining began in the area now covered by these operations in 1934.
Kloof’s operations comprise five producing shaft systems and two metallurgical gold plants. The Kloof 1 Plant (KP1) was commissioned in 1968 and originally designed to process underground ore. It was converted to process surface reclamation dumps in 2001. KP1 comprises three-stage crushing, open-circuit rod mills for primary grinding and closed-circuit pebble mills for secondary milling. This is followed by cyanide leaching, filtration, zinc precipitation and smelting.
The Kloof 2 Plant (KP2) was commissioned in November 1990 and currently treats all of Kloof’s underground ore. Reef is trucked and conveyed to a central stacker pad, which feeds two SAG mills equipped with variable-speed ring motor drives. Milling is followed by cyanide leaching, CIP and treatment at an independent elution and smelting facility. The elution facility was upgraded in June 2001 and again in October 2003 to process loaded carbon from KP1 and the former KP3 (Libanon) plant. The upgrade included the installation of continuous electro-winning sludge reactors.
INFRASTRUCTURE
| | |
Shaft system | Hoisting capacity1 |
No 1 | 100ktpm |
No 32 | 55ktpm |
No 4 | 82ktpm |
No 7 | 32ktpm |
No 8 | 15ktpm |
| | |
1 Capacities based on operations requirements and constraints
2 Includes Beisa
Processing plant | Capacity | Recovery factor |
KP1 | 180ktpm | 92% |
KP2 | 165ktpm | 98% |
PERFORMANCE IN 2015
Year-on-year gold production declined by 17% to 14,068kg (452,300oz) in 2015. Production was impacted by underground fires at 7 and 1 shafts, which resulted in lower volumes and lower grades, and load shedding.
Underground production volumes in the second half of 2015 were much improved, albeit at lower grades, resulting in tons milled for 2015 of 2.0Mt being only marginally lower than that achieved in 2014. However, yields and gold output both declined by 18% to 6.49g/t and 12,848kg respectively.
On-reef development increased by 8% to 4,314m and the average development value increased to 1,824cm.g/t from 1,637cm.g/t. Main development was planned down due to the recapitalisation project largely completed by the end of 2014 but was also affected by the fires, as well as safety stoppages, and decreased by 5% to 17,899m.
Lower production resulted in unit costs increasing by 9% to R2,251/t and operating profit from the underground operations declining from R2,800 million in 2014 to R1,658 million in 2015.
Surface throughput decreased by 25% to 2.0Mt as a result of decommissioning the Python mobile processing plant in July 2014. Average surface grades increased from 0.52g/t to 0.61g/t due to more selective processing of SRD material, which partly offset the lower throughput, resulting in a 12% decline in surface gold production to 1,220kg. Despite the lower production, closure of the Python Plant resulted in reduced costs and an increase in operating profit from R200 million in 2014 to R256 million in 2015.
Capital expenditure of R1,130 million was 9% lower than in 2014. Capital was mainly spent on ORD, maintenance and equipment upgrades, and the 4 Shaft 45 Level decline project.
| |
Sibanye Gold Integrated Annual Report 2015 | 45 |
DEVELOP A PRODUCTIVE, SKILLED AND ENGAGED WORKFORCE
Approach
Sibanye places significant emphasis on open, honest and regular communication with employees in order to align the business and employees. One of the initiatives to address the trust deficit that has historically developed between management and employees in the South African mining industry has been the development of the People at Sibanye strategy, aimed at winning the hearts and minds of employees and engendering a sense of ownership and pride in the Group. This strategy is an integrated and solution-based approach that seeks to address key employee-related issues by enhancing the employee value proposition.
Our corporate culture
Our corporate culture is founded on the values of CARE, which underpin our business strategy, and promote competitiveness and success. These values have been embedded through continuous communication, transformation, education and training. They are supported by our safety, health and wellbeing strategy, which has five key pillars:
| · | | Compliance with safety rules is essential |
| · | | Workplace and process risks must be identified and engineered out |
| · | | Employee wellbeing is fundamental to success |
| · | | Staying fit and healthy is a joint responsibility |
| · | | Relationships are important and should be based on mutual respect – managers and employees need to share goals and engage with teamwork underpinning what we do – we seek motivated and competent teams |
Performance
As at 31 December 2015, Sibanye employed a total of 46,269 people (2014: 44,411 people) – 86% full-time permanent employees and 14% full-time contractors. The slight increase in the number of employees since the beginning of 2015 is mainly in the production environment. Decreases in employment, particularly in the services areas, are due to a restructuring process undertaken in the last quarter.
Sibanye’s employee complement will increase to more than 70,000 people in 2016 following the conclusion of the Rustenburg Operations and Aquarius acquisitions.
Permanent employees in 2015 comprised:
| · | | men: 35,393 (2014: 35,453); 89% (2014: 90%) |
| · | | women: 4,332 (2014: 3,779); 11% (2014: 10%). |
Contractors employed by Sibanye in 2015 comprised:
| · | | men: 6,148 (2014: 4,766); 94% (2014: 92%) |
| · | | women: 396 (2014: 413); 6% (2014: 8%). |
In terms of age, permanent employees comprised:
| · | | younger than 30 years of age: 5,251 (2014: 5,798); 13% (2014: 15%) |
| · | | between 30 and 50 years old: 27,017 (2014: 26,460); 68% (2014: 67%) |
| · | | older than 50: 7,457 (2014: 6,974); 19% (2014: 18%). |
Contractors, in terms of age, comprised:
| · | | younger than 30: 1,890 (2014: 1,756); 29% (2014: 34%) |
| · | | aged 30 to 50: 3,805 (2014: 2,821); 58% (2014: 54%) |
| · | | older than 50: 849 (2014: 602); 13% (2014: 12%). |
| |
Sibanye Gold Integrated Annual Report 2015 | 46 |
NUMBER OF EMPLOYEES AT 31 DECEMBER 2015
| | 1 | | | | | | | |
| Permanent employees | 2015 Contractors1 | Total | Permanent employees | 2014 Contractors | Total | Permanent employees | 2013 Contractors | Total |
Corporate office | 3,054 | 1,018 | 4,072 | 2,895 | 897 | 3,792 | 248 | - | 248 |
Beatrix | 7,618 | 1,362 | 8,980 | 7,444 | 806 | 8,250 | 7,963 | 565 | 8,528 |
Cooke | 5,236 | 2,084 | 7,320 | 5,570 | 2,051 | 7,621 | - | - | - |
Driefontein | 10,772 | 949 | 11,721 | 10,425 | 672 | 11,097 | 11,860 | 775 | 12,635 |
Kloof | 10,192 | 941 | 11,133 | 9,791 | 695 | 10,486 | 10,469 | 766 | 11,235 |
Other2 | 2,853 | 190 | 3,043 | 3,107 | 58 | 3,165 | 3,628 | - | 3,628 |
Total | 39,725 | 6,544 | 46,269 | 39,232 | 5,179 | 44,411 | 34,168 | 2,106 | 36,274 |
| 86% | 14% | | 88% | 12% | | 94% | 6% | |
1 Excludes ‘free’ contractors (receive a fee for service irrespective of the number of contractor employees on site – they are not compensated on a fee-per-head basis but on a fee for the service or work performed)
2 Includes all services (Property, Sibanye Gold Academy, Sibanye Gold Shared Services, Sibanye Gold Protection Services and Sibanye Gold Health Services) as well as Burnstone
SAFE, PRODUCTIVE AND FAIR EMPLOYMENT
Our employment practices and policies are governed by South African labour legislation and regulations, as well as various collective-bargaining and recognition agreements.
New employees are increasingly drawn from local communities. A number of operations signed MoUs with local government and community leaders in 2015 in respect of fair and transparent recruitment processes. Of the 2,217 employees recruited by Sibanye in 2015, 75% were classified as local (permanent residents within the communities surrounding our operations).
Absenteeism is a major issue affecting productivity and several initiatives were implemented to address this with some success. Absenteeism has fallen by about 7% year-on-year, which has had a positive impact on the availability of employees at work.
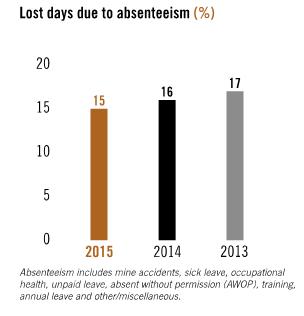
SKILLS DEVELOPMENT
Developing a productive, skilled and engaged workforce requires a significant investment in training and educating employees. By identifying, recognising and developing employees’ expertise, skills and talents, the business is able to run more efficiently and profitably, and employees tend to be more fulfilled and engaged. Training has also been made available to community members. In 2015, the Group spent R385 million (2014: R353 million) on human capital development, representing a total of 7.93 million hours of training (2014: 7.85 million hours).
Sibanye Gold Academy
The Sibanye Gold Academy, located in Westonaria, Gauteng, supports human capital development by developing employees’ skills and knowledge through training and experiential learning, for the benefit of Sibanye, employees and the broader society. The Academy is fully accredited by the Mining Qualifications Authority and its programmes have been approved by a number of Sector Education and Training Authorities. Satellite campuses, managed by the Academy, are located at each operation.
| |
Sibanye Gold Integrated Annual Report 2015 | 47 |
ADULT BASIC EDUCATION AND TRAINING
Portable skills training equips employees with practical skills that will stand them in good stead for life after mining, and equips community members with skills they can utilise for employment and self-employment. In addition to the South African Qualifications Authority-recognised qualifications in mechanical, electrical and construction trades, training is now provided in agriculture, clothing and textile manufacturing.
To improve employees’ skills and to provide opportunities for community members to enter the mining industry, learnership programmes are offered as a combination of study and on-the-job training. Learnerships play an important role in advancing employees’ careers as they lead to recognised qualifications. Sibanye invested R81 million in learnerships in 2015 (2014: R77 million).
Training and development
Training and development is aligned with our business needs, and our talent pipeline is maintained through adult basic education and training (ABET) for community members, portable skills training, learnerships, internships, study assistance, and core skills and leadership development. ABET is offered to employees and community members on a full-time and after-hours basis. Learners are examined by the nationally recognised Independent Examinations Board.
HUMAN RIGHTS
Sibanye’s employees, including security personnel, are trained to uphold human rights, and to respect all cultures and customs. Training is provided in terms of our human rights policies and procedures as part of the return-from-leave and new-engagement processes. A well-articulated and fair system is in place to deal with discrimination and breaches of human rights.
Training of security employees was included in the Workplace Skills Plan (WSP) for 2015. A service provider, Maccauvlei Learning Academy, was appointed to provide training in human rights to Protection Services, and trained 62 employees.
The WSP is a strategic training document, published annually, which articulates an employer’s approach to training and development needs in the workplace. It is governed by the Skills Development Act, 1998 (Act No 97 of 1998) and the Labour Relations Act, 1995 (Act No 66 of 1995), compiled jointly by the employer, employee representatives and non-unionised employees.
All significant investment agreements and contracts that include human rights clauses were screened in 2015.
Our human capital policies also address risks related to human rights, child labour or forced labour at any of our operations or among our suppliers, employment equity and employee relations, including discipline and recognition.
A total of 118 (2014: 18) incidents relating to corruption were reported in 2015. These incidents involved dishonesty with the intention to obtain cash and assist illegal miners. A total of 173 (2014: six) employees were charged – 27 criminally and disciplined in terms of Sibanye’s Code of Ethics.
ADDRESSING INDEBTEDNESS
High levels of indebtedness are not unique to the mining industry, and this continues to be problematic. Sibanye therefore launched a personal financial-education programme – CARE for iMali/Khathalel’imali/Hlokomela chelete (meaning ‘care for money’ in isiXhosa and Sesotho) – in 2014, aimed at curbing indebtedness and providing financial planning and rehabilitation to employees.
In Phase 1 (2014 to May 2015), more than 12,000 employees and community members attended training sessions. Training extended to community members in the Eastern Cape, a significant labour-sending area, and to visiting spouses, retiring employees and local schools. An external service provider audited and validated garnishee orders, assisted employees in managing their debt, returned significant amounts incorrectly or fraudulently debited to employees, and stopped the erroneous application of garnishee and emolument attachment orders. During Phase 2 (June 2015 to December 2016), 18,000 employees and community members will be trained.
A total of 11,468 employees and community members attended CARE for iMali sessions during
2015. A CARE for iMali industrial-theatre production and song, reinforcing the principles of financial accountability, have been developed for employees and local communities. Employees under debt stress are supported by CARE for iMali coaches and they can choose debt consolidation on manageable terms.
| |
Sibanye Gold Integrated Annual Report 2015 | 48 |
HUMAN CAPITAL DEVELOPMENT
| | | | |
| Expenditure (Rm) | Number of learners | Total Training hours2 | Average hours Per employee |
Internships | 31.5 | 107 | 215,712 | |
Bursaries | 17.5 | 216 | 435,456 | |
ABET (employees) | 46.0 | 1,276 | 444,048 | |
ABET (community) | 8.5 | 1,325 | 1,017,600 | |
Engineering learnerships | 41.0 | 386 | 778,176 | |
Mining learnerships | 39.9 | 367 | 739,872 | |
Portable skills (employees) | 2.2 | 828 | 39,744 | |
Portable skills (community) | 3.7 | 945 | 90,720 | |
Leadership development (including electives) | 6.4 | 845 | 33,800 | |
Core skills training | 146.7 | 62.9271 | 4,027,328 | |
Coaches/mentors training | 2.8 | 705 | 5,640 | |
Employees indebtedness | 5.6 | 11,468 | 91,744 | |
Community maths and science | 0.5 | 120 | 14,400 | |
Support and research | 8.0 | 0 | 0 | |
| 23.6 | 0 | 0 | |
Total | 383.9 | 81,515 | 7,934,240 | 97.33 |
1 Learners counted per course
2 Number of learners x average training days per learner
COLLECTIVE BARGAINING AND REMUNERATION
The mining sector is highly unionised with entrenched collective bargaining. At the end of 2015, around 93% (2014: 86%) of our total permanent workforce was unionised. Currently, four unions are recognised by Sibanye, namely AMCU, NUM, Solidarity and UASA.
Gold wage negotiations under the auspices of the Chamber of Mines began in June 2015 and a three-year settlement (effective from 1 July 2015) was reached with three unions in late October. Negotiations were particularly challenging, given prevailing economic circumstances, excessive wage demands and union rivalry. All parties, including government, pressed for job preservation. Other gold companies signed agreements with three unions – NUM, Solidarity and UASA – on 2 October 2015. Sibanye continued to engage with all four representative unions. Every effort was made to reach an agreement with AMCU but this was not possible. An agreement was reached between Sibanye and NUM, UASA and Solidarity on 21 October 2015.
No employee was disadvantaged by union affiliation and, to keep industrial peace, all employees in the bargaining unit received benefits. The increases were substantial, above inflation and aimed to make a real difference for employees, their families and mining communities, and will ensure the sustainability of the industry as far as possible.
| |
Sibanye Gold Integrated Annual Report 2015 | 49 |
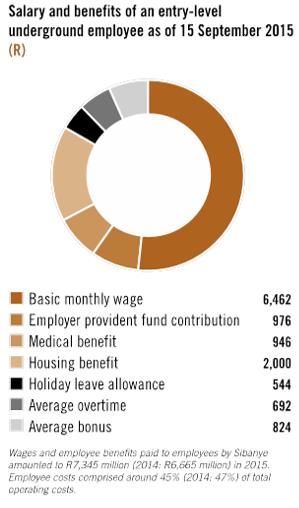
Future focus
In 2016, we will focus on transformation, creating a performance-driven culture, improving internal stakeholder relationships and implementing initiatives identified in our People at Sibanye project (see Integrated Annual Report–Material issues–Business environment–Labour relations and employment).
| |
Sibanye Gold Integrated Annual Report 2015 | 50 |
Sustain
PROJECT DEVELOPMENT AND CAPITAL ALLOCATION
Approach
Projects are identified and then filtered or assessed at annual strategic and LoM planning sessions. These projects proceed through the various stages of project investigation – from concept to prefeasibility study (PFS), feasibility study (FS), approval and project execution. Sibanye’s approach is to have strong owners’ teams managing the projects with consultants and contractors considered for execution when external resources are required over and above internal resources. Major projects are monitored in line with the Group’s projects control framework, which includes scheduled project reviews, steering committee reviews and Board updates.
Sibanye focuses primarily on brownfields opportunities that will extend its operational LoM, increase its return on invested capital (ROIC) and enhance or sustain its dividend profile. To ensure delivery on this aspect of the business and to avoid distracting core production personnel at the operations, Sibanye appointed a dedicated project team in 2014 to evaluate, rank and progress organic projects. With the Burnstone Project, the Kloof 4 and Driefontein 5 shafts below-infrastructure decline projects approved in 2015 for execution in 2016, the project team will play a leading role in this process.
Both organic projects and external growth opportunities are evaluated using criteria based on strategic, technical and financial parameters, including investment hurdle rates that vary between 15% and 30% (real rates in South African rand) depending on the level of project confidence.
Key criteria
Key criteria guide corporate decisions on project funding to ensure that dividends are not compromised:
| · | | projects must be funded primarily from cash flow, after dividends have been paid, although alternative funding options may be considered where appropriate |
| · | | strict filters are applied to organic projects, including assessment of risk, returns and the impact of financing on returns |
| · | | acquisitions must be earnings-accretive with medium-term potential to support our core dividend strategy |
| · | | valuable opportunities are pursued in other similar mining sectors as long as these opportunities are consistent with Sibanye’s underlying benchmark dividend strategy |
Performance
KLOOF BELOW INFRASTRUCTURE DECLINE PROJECT
This project will extend Kloof’s operating life from 2030 to 2033, producing 0.5Moz incremental gold in addition to the current LoM plan from 2021 when the first reef intersection and wide-raise development begins on 46 Level. Total project capital is estimated at R691 million (in 2015 terms).
In 2015, R55 million was spent to access the project site and establish excavations that will support the mechanised development fleet and project infrastructure. Mining equipment is due to be delivered into Quarter 1 and the first development metres below 45 Level are planned by the end of the second quarter. The 45 Level Decline Project FS was completed and presented to the Board with R107 million capital expenditure approved for 2016.
DRIEFONTEIN BELOW INFRASTRUCTURE DECLINE PROJECT
This project has potential to extend Driefontein’s operating life from 2028 to 2042, producing an additional 2.1Moz of gold in addition to the current LoM plan following the first reef intersection and raise development from 2021. Project capital is estimated at R1,061 million (in 2015 terms).
Initial site preparation and development equipment procurement cost R9 million in 2015. The 50 Level Decline FS was completed and presented to the Board with R124 million capital expenditure approved for 2016. The expenditure is primarily for developing the site access excavations and supporting infrastructure on 50 Level for the two decline shafts.
The first two years of the project require conventional mining development to access the two decline shaft positions, followed by development of the incline portions of each shaft above 50 Level, and creation of the shaft tipping, sheave wheel and winder excavations in preparation for engineering construction and equipping. The key project milestone of shaft sinking below 50 Level is planned from the first quarter of 2018.
| |
Sibanye Gold Integrated Annual Report 2015 | 51 |
BURNSTONE PROJECT
The Burnstone project FS was presented to the Board for approval in 2015. The project is planned with steady-state production of between 100koz and 130koz per annum with an initial 23-year LoM plan, accessing 1.8Moz of Mineral Reserves. The mine design and schedule in the FS were limited to the mineable reserves within a 3km radius of the shaft infrastructure. Extensive development will begin in 2016 with first gold production due in 2018 and the full production run rate achieved in 2020. Total LoM capital is estimated at R1,852 million (in 2015 terms).
In 2015, R272 million was spent on completing the mine-dewatering pumping and rock hoisting infrastructure, and approximately 2km of development to access the ore body. The Board approved the project budget of R705 million for 2016 for the procurement of the additional mechanised mining fleet, for the development to access the ore body and additional infrastructure, as identified in the FS.
Approximately 4,500m of primary off-reef development is planned in 2016 to access the various mining blocks as well as 1,200m on-reef development in preparation for the first raise lines in 2017.
The three existing mechanised development fleets were refurbished in 2015 and an additional three fleets will be procured and delivered in 2016. A mechanised development fleet comprises one twin boom drill rig, one roof bolter, one LHD (load, haul, dump) machine, one or two dump trucks and a dedicated emulsion explosive charge-up utility vehicle.
WEST RAND TAILINGS RETREATMENT PROJECT
The WRTRP will process up to 715Mt of the historic Driefontein, Kloof and Cooke TSFs for gold and uranium. The definitive feasibility study (DFS) for this project has been completed, and the project has an estimated gold and uranium Mineral Reserve of 6.5Moz and 99.1Mlb respectively.
Key to the successful execution of this project is the permitting and construction of a high-volume central processing plant (CPP) for economical extraction of gold, uranium and sulphur from the TSFs, and redeposition of the residues onto a single large regional TSF in accordance with modern, sustainable deposition practices in order to reduce future environmental liabilities.
The WRTRP DFS was completed in December 2015. The scope of the integrated DFS includes the design and construction of a CPP to treat 1Mt per month from the Driefontein 3 and 5 TSFs, and concurrently treat 400,000tpm from the Cooke dump. The resultant tailings will be deposited onto the new regional TSF.
Steady state production of 110koz of gold, 2.2Mlb of uranium and 250,000t of sulphuric acid per annum is planned during the first phase, allowing for the recovery of 1.32Moz of saleable gold and 33.4Mlb of saleable uranium over the first 18 years of the project, at an operating cost of approximately R80/t (in 2015 terms).
The WRTRP will also improve the management of currently affected sensitive dolomitic aquifers and water resources. The direct result of commissioning a sulphuric acid plant will be a reduction in residual sulphide sulphur concentrations from the existing historic TSFs, thereby averting the risk of acid mine drainage (AMD) and mobilisation of harmful, toxic heavy metals into the environment. Sibanye is currently considering alternative ways to finance the project in order to reduce upfront capital requirements and improve the project’s return on capital for the Group.
URANIUM BY-PRODUCTS
Sibanye has produced approximately 290,000lb of uranium since production began in 2014 and expects to produce another 250,000lb in 2016.
Sibanye’s uranium production is being stored as ready-to-go inventory in anticipation of securing more attractive term arrangements as opposed to selling at spot into the market. Sibanye’s uranium strategy is based on an improvement in the price of uranium – dictated in the longer term by a well-understood supply-and-demand relationship.
Future focus
For 2016, R75 million has been approved for the WRTRP to fund the detailed engineering design work as well as completion of the design, construction and operation of a pilot plant while the environmental permitting processes continue. Approximately 60% of the R75 million budget planned for 2016 will be spent on an external party review and the detailed engineering design with the balance on funding the pilot plant and permitting. A positive record of decision is expected from the regulators in mid-2016 when an execution budget will be taken to the Board for consideration and approval.
The Beisa Project at Beatrix West is now included in the Mineral Reserves with gold Reserves of 0.5Moz and uranium Reserves of 11.7Mlb. The PFS for this project was enhanced through cut-off grades and leveraging synergies with the current Beatrix West Operation. Further study work will be conducted during 2016.
Mineral Reserves at the WRTRP remain largely unchanged year-on-year although the life will now extend well beyond 2050, based on the DFS production profile and planned treatment capacity.
The gold Mineral Reserves for the De Bron Merriespruit Project are based on the original FS previously conducted by Wits Gold in 2013. However, the production design and schedule was modified during 2015 in line with geological and estimation models, which were restated following the acquisition of Wits Gold in 2014. The Mineral Reserves for this project remain at 2.1Moz.
The Bloemhoek Project is adjacent to Beatrix North Operation. A study to access a portion of this area with a decline system from Beatrix North has begun and is due for completion in 2016. Concurrently, an exploration-drilling programme designed to improve geological confidence in the immediate vicinity of the planned decline system will also be completed.
| |
Sibanye Gold Integrated Annual Report 2015 | 52 |
HEALTH AND SAFETY FOCUS
Approach
Sibanye strives to prevent all accidents, and to have a healthy and productive workforce through continuous improvements in safety by focusing on compliance and the systematic reduction of employees’ exposure to risk in the work environment by:
| · | | identifying and ranking risks |
| · | | identifying technical and procedural engineering solutions in terms of a risk mitigation hierarchy to eliminate the risk completely |
| · | | controlling the risk at source |
| · | | monitoring risk exposure |
| · | | providing personal protective equipment (PPE). |
As required by the Mine Health and Safety Act, 1996 (Act No 29 of 1996) (MHSA), all employees are represented in formal joint management-worker health and safety committees through their representatives to assist in monitoring and advising occupational health and safety programmes.
Safety performance
It is with deep regret that we report the death of seven employees during the year under review although this is a significant improvement on the 12 fatalities reported in 2014. Our Board and management extend their deepest sympathies to the families, friends and colleagues of the deceased.
The more than 40% decline in fatalities is pleasing and reflects the lowest number on record for our mines. However, it is of concern that, in general, other safety trends have deteriorated. Management acknowledges that the deterioration in other safety trends is cause for concern but action plans have been put in place to address these issues.
All accidents are investigated and the main causes have been found to be incorrect identification of risks, not timeously and effectively correcting identified risks and not complying with mine standards. Greater attention is being paid to the impact supervisors have on the work environment.
KEY INDICATORS: SAFETY (PER MILLION HOURS WORKED)
| | | |
| |
| 2015 | 2014 | % change |
Fatalities | 7 | 12 | (42%) |
FIFR | 0.06 | 0.12 | (50%) |
LTIFR | 6.74 | 5.87 | 15% |
SIFR1 | 4.68 | 3.88 | 21% |
Medically treated injury frequency rate2 | 3.60 | 3.37 | 12% |
Section 54 work stoppages | 109 | 77 | 42% |
Production shifts lost as a result of section 54 stoppages | 70 | 99 | (29%) |
Internal stoppages3 | 18,642 | 23.257 | (20%) |
1 Serious injury frequency rate
2 Referred to as treat-and-return injury frequency rate (TRIFR)
3 Internal stoppages are an integral part of Sibanye’s risk management strategy (any person can stop a task of workplace until arrangements have been made to reduce high risk)
FATALITY-FREE MILESTONES: 2015
1 million fatality-free shifts achieved:
2 million fatality free shifts achieved:
| |
Sibanye Gold Integrated Annual Report 2015 | 53 |
MINESAFE AWARDS 2015
| · | | Kloof: No 2 metallurgical plant |
| · | | Driefontein: Mining Unit 1 |
Healthcare and occupational health performance
Sibanye’s new operational model for health is aimed at prevention, early detection and management of disease, and prevention of disability, through the provision of accessible healthcare. Early identification of health risks with early intervention and stringent application of the mandatory code of practice on minimum standards of fitness to perform work at a mine are critical.
Our health model is in its second year of a planned three-year roll out that has seen focus on optimisation, efficiencies and excellence.
As with safety risks, we reduce occupational health risks by proactively managing health risk factors. The most significant occupational diseases encountered at our operations are NIHL, chronic obstructive airways disease (COAD), cardiorespiratory TB and silicosis. The most challenging public health concerns are HIV/Aids, TB, hypertension and diabetes mellitus.
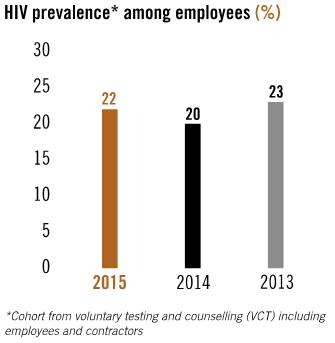
The new Sibanye healthcare model focuses primarily on disease prevention, early detection thereof and management. Since the disposal of our healthcare assets in 2014, we have focused on efficiencies and embedding the new healthcare model.
VOLUNTARY COUNSELLING AND TESTING AND TB SCREENING
In line with the Department of Health’s strategic initiative to screen 90% of the population for TB and HIV, we have increased access to screening by introducing annual testing for all employees following certificate of- fitness examinations. In all, 23,538 employees were offered VCT, of whom 8,505 were tested for HIV, while 47,465 employees and contractors were screened for TB. Employees diagnosed with communicable and no communicable diseases are appropriately referred for further management in the Sibanye network.
SHAFT CLINICS
Recognising the shift in employees’ residential preferences and the reduction in formalised hostel residents, we have improved access to quality healthcare by building five clinics close to the shafts. These clinics manage trauma, acute ailments and chronic diseases for all employees, and provide entry into the Sibanye Health network. Mining accidents are immediately assessed and referred to an appropriate facility of definitive care, which includes referral to Level 1 trauma units in the greater Johannesburg area and Bloemfontein.
DISEASE AND CASE MANAGEMENT
All employees suffering chronic diseases are registered and managed in terms of formalised disease-management programmes. In 2015, a total of 14,871 medical conditions were formally registered and managed in these programmes (including medical schemes), which ensure that employees are monitored objectively for adherence and compliance with evidence based treatment protocols. A team of highly proficient case managers ensure that employees are referred and managed by the network specialists and provider hospitals.
TB CARE
The number of new TB cases declined in 2015 despite intensified case finding and the use of DNA molecular assay studies for diagnosis. Of significance is the reduction in multidrug-resistant TB (MDR-TB) strains from 34 cases in 2014 to 14 cases in 2015. This can be attributed, in part, to stricter controls in the TB programme. Primary MDR-TB, which accounts for around 50% of MDR cases, refers to infection of an individual with the resistant strain of TB, which can be contracted on mine and within
| |
Sibanye Gold Integrated Annual Report 2015 | 54 |
communities. This provides a measure of the degree of transmission of the MDR-TB strain. Secondary MDR is resistant TB, which develops in patients previously treated for TB.
TRAUMA CARE MANAGEMENT
All employees are insured for work-related injuries and disease in terms of COIDA by Rand Mutual Assurance from the first day of the injury. We ensure that employees are appropriately triaged on scene and referred to a facility for definitive care. In this context, the majority of employees are referred to Level 1 or Level 2 trauma units.
HIV CARE
Early detection and management of employees affected with HIV and the suppression of viral replication remain the clinical end points of disease control. The new integrated health model allows patients to be assisted at numerous service points and, with almost 80% of employees managed on once-daily therapy, progress is being made in achieving the targets.
OCCUPATIONAL HEALTH
All employees undergo stringent medical testing annually as part of the medical-surveillance programme monitoring the health effects of hazards in the workplace.
| | | |
| 2015 | 2014 | % change |
Medical surveillance and certificate-of-fitness examinations: | | | |
– Total | 84,022 | 72,132 | 16% |
– Employees | 69,284 | 63,338 | 9% |
– Contractors | 14,738 | 8,744 | 69% |
VCT for HIV – employees and contractors | 8,505 | 5,590 | 52% |
Percentage of employees and contractors who have undergone VCT | 18% | 13% | 38% |
Number of cases of NIHL reported1 | 105 | 138 | 24% |
Number of cases of COAD reported2 | 57 | 45 | 27% |
Number of cases of silicosis reported3 | 186 | 264 | (30%) |
Number of new and retreatment cases of cardiorespiratory TB | 679 | 715 | (5%) |
Number of new and retreatment cases of TB treated | 744 | 832 | (11%) |
Number of new cases of MDR-TB treated | 14 | 34 | (59%) |
Total number of new recipients of HAART4 (Category 3-8) | 875 | 548 | 60% |
Total number of Category 3-8 employees on HAART | 5,023 | 4,604 | 9% |
HAART patients alive and on treatment4 (in active Sibanye employment) | 5,750 | 5,283 | 9% |
Total number of employees leaving HAART programme5 | 127 | 57 | 123% |
Lost days due to health-related absenteeism6 | 478,568 | 414,424 | 15% |
1 Diagnosis of NIHL is made on the assessment of the percentage hearing loss from baseline audiograms, where NIHL is defined as a loss of hearing in excess of 10%, which manifests over a prolonged period after repeated exposure to noise levels in excess of 85dBA.
2 COAD is characterised by chronically poor airflow, resulting in shortness of breath, coughing and sputum production. Long-term exposure to smoking, and particulates associated with air pollution and genetic predisposition cause an inflammatory response in the lungs, resulting in a narrowing of the small airways and breakdown of lung tissue known as emphysema or chronic bronchitis.
3 Exposure to free silica (SiO2), also known as crystalline quartz, found across a broad range of industries, including mining, cement manufacturing and quarrying, reaches the small airways of the lungs and forms tiny nodules (pulmonary fibroses), resulting in the development of silicosis.
4 Highly active antiretroviral treatment (HAART) refers to the combination of drugs used to suppress HIV (includes all employees).
5 Number of employees leaving HAART within 12 months of ART initiation.
6 Cooke Operations included from 2015.
Progress has been made in reducing exposure to silica dust and noise
| · | | silicosis submissions declined to 4.91 per 1,000 (186 cases) versus 7.26 per 1,000 (264 cases) in 2014 |
| · | | NIHL submissions declined to 2.82 per 1,000 (105 cases) versus 3.74 per 1,000 (138 cases) in 2014 |
Future focus
There has been renewed emphasis on supervisor safety awareness training to positively influence employees’ behaviour so as to timeously and correctly identify and deal with risks as well as to ensure compliance with mine safety standards. We need to ensure that our focus on preventing falls of ground in particular remains top of mind during all planning and auditing interventions, and during the daily execution of mining activities.
Our health strategy has been designed to achieve excellence, which is accessible, equitable and quality healthcare for all employees by 2017.
| |
Sibanye Gold Integrated Annual Report 2015 | 55 |
We will focus on improving efficiencies in our healthcare value chain in 2016 with the delivery of improved clinical outcomes and healthy, productive employees.
| |
Sibanye Gold Integrated Annual Report 2015 | 56 |
SOCIAL UPLIFTMENT AND COMMUNITY DEVELOPMENT
Sibanye’s community-development strategy is designed to improve living conditions and uplift communities by creating opportunities for employment, local vendors, procurement of goods and services, and directing tangible development benefits to communities.
Approach
The principles embedded in the SLPs, determined in conjunction with the DMR, aim to assist government in developing self-sustaining communities that are not dependent on the mines they host.
Our approach is underpinned by:
| · | | effective engagement and relationship building, and a commitment to go beyond compliance |
| · | | the need to use human and capital resources appropriately, and effectively in responding to identified and agreed current and future community needs |
| · | | streamlining our efforts to ensure tangible and sustainable impact that will continue beyond LoM |
| · | | engaging directly with communities to identify their specific needs, and then partnering with local government and other collaborative partners where possible. |
Performance
The most significant achievement in 2015 was approval of the revised SLPs for the Kloof and Driefontein operations, and for the Cooke Operations by the DMR (Gauteng region).
A review of the implementation and impact of our LED projects in 2014 indicated that, while our projects were aligned with the local municipalities’ integrated development plans (IDPs) and had been accepted by the DMR, they did not necessarily have the desired impacts on mining communities. The magnitude of the challenges faced by communities often neutralises or negates the impact of projects or hampers their implementation. While we recognise that the responsibility to address the challenges facing our neighbouring communities cannot reside solely with Sibanye, we also recognise that communities often do not understand this. Failure to make a meaningful and visible impact could threaten our own sustainability and licence to operate.
In 2015, we sought to align our community engagement and development (CED) programme with the development priorities of local municipalities while also interacting directly with affected communities to understand their needs. The Group’s own strategic imperatives were also taken into account. Our approach was to find common ground between the needs of our various stakeholders and those identified by Sibanye, which can be challenging at times. Stakeholders have different priorities and expectations while the Group’s resources are limited and will never be able to address all needs.
Nonetheless, certain priorities have emerged, such as the need to establish or improve critical infrastructure – for example, healthcare clinics that assist in eradicating diseases such as TB and implementing community programmes initiated by the Department of Health. The location of these healthcare facilities, such as the facility at Blybank, has wider impact during the current SLP cycle in that the 1,500 people attended to every month have a facility on their doorstep, presenting additional advantages as savings in travel and other costs, as well as safety and immediate access.
Examples of critical infrastructure development include plans for a new school in the Eastern Cape labour-sending area. The plans have been approved to accommodate more than 1,600 learners currently housed in a dilapidated hostel without running water and proper sanitation
Our corporate approach is two-pronged, focusing on the Mining Charter and exceeding SLP implementation and performance monitoring on the one hand, and CED on the other.
Following the acquisition of the Cooke Operations in 2014, a review of community development projects revealed that more than 40 projects were at various stages of implementation. Many of these were legacy projects previously owned by three different companies, and the scope of these projects was not aligned with Cooke’s current production profile or profitability. The review also showed that there were many small projects that were not sustainable in the longer term and would require continued long-term funding.
Following the review, advanced projects were completed and handed over to beneficiaries. The remaining projects were rationalised and streamlined.
Legacy projects will be addressed through Sibanye’s corporate social investment (CSI) programme and collaboration with third parties in consultation with local municipalities. In future, Sibanye will focus on solutions that are regional, integrated and catalytic in nature with the ultimate measure of success being their ability to continue without ongoing support.
As the current SLPs are due to expire at the end of 2016, we have an opportunity to ensure that the new SLPs focus on the Sibanye strategy of:
| · | | high-impact projects with emphasis on post-closure continuity |
| · | | a regional approach aligned with municipal spatial development frameworks (fewer but larger projects) |
| · | | encouraging collaboration and partnerships to significantly increase impact |
| |
Sibanye Gold Integrated Annual Report 2015 | 57 |
| · | | sustainability in line with Sibanye’s operating model and operational CED priorities, guided by our growth and sustainability, which are inherent in the operating model. |
Sibanye’s CED unit focuses primarily on communities in host and labour-sending areas affected by our operations, and which have the potential to affect our business. We allocate expenditure to eligible communities in terms of their proximity to mining operations and the degree of mining impacts they potentially sustain.
As far as possible, we seek to contribute meaningfully in terms of size and impact to mine communities by leveraging benefits derived from partnering with our peers in the mining industry and other sectors. These partnerships are founded on common and similar challenges, which include safety, health, preferential procurement, and social and community issues.
Initiatives currently benefitting from this collaborative approach and undertaken in partnership with Gold Fields’ South Deep mine and the Westonaria Community Trust are:
| · | | Simunye Secondary School, Bekkersdal (redundant infrastructure has been donated by Sibanye for conversion into a high-school building for 1,500 learners) |
| · | | the Westonaria campus of Westcol Technical and Vocational Education and Training College (Sibanye is planning the construction of permanent facilities for 620 students) and Agri College |
| · | | the Gold Fields/Sibanye Gold Alliance Project focused on reinforcing commercial farming in the West Wits area as a key job-creation initiative for the region. |
SOCIO-ECONOMIC DEVELOPMENT EXPENDITURE (R MILLION)
| | | |
| 2015 | 2014 | 2013 |
Local economic development/SLPs | 27 | 24 | 17 |
Training | 384 | 353 | 316 |
Sport | 1 | 10 | 9 |
Infrastructure development1 | 197 | 649 | 699 |
Health | 6 | 5 | 5 |
Enterprise development | - | 3 | 2 |
Education | 62 | 10 | 1 |
Donations | 14 | 1 | 1 |
Total | 691 | 1,055 | 1,050 |
1 Major infrastructure-development projects were completed between 2013 and 2014. Spend in 2015 included hostel upgrade at Cooke 3, hostel conversions at Cooke 2 and construction of family units at Driefontein.
LED PROJECTS DEFINED IN SLPs
LED projects defined in SLPs are distinguished from CSI projects:
| · | | LED projects are socio-economic interventions that harness local resources for the purpose of broadening the economic base of host and labour-sending areas. These are typically high-value projects, such as infrastructure development (for example, the construction or rehabilitation of schools and clinics), as well as projects aimed at diversifying the economies of the areas in which we operate (to create sustainable livelihoods that will endure long after the mines have concluded their economic lives). |
| · | | CSI activities typically address broader and generally short-term community needs – often undertaken as a result of requests from local communities in the form of community development funding and donations. |
Growth strategy focused on South Africa
In 2015, we announced critical acquisitions, which will make us a multi-commodity company. With our sights firmly set on South Africa, we will be expected to create superior value for a wider range of stakeholders. From a community development perspective, this will result in a more diversified stakeholder portfolio, which will present new challenges and needs, as well as interests and idiosyncrasies.
The Gold Fields/Sibanye Gold Alliance Project will form the basis of our new LED strategy to create jobs outside of mining, focusing on high-impact, large-scale and regionally based projects because of their potential impact on agriculture, infrastructure development and capacity building/skills development. Because of the larger numbers that can be impacted and the partnerships that can be formed, the alliance will be central to these growth strategies. Key agricultural projects will focus on agribusiness and processing. The development of ‘agrihubs’ and ‘outgrowers’ in a hub-and-spoke model, including ‘micro greens’, vegetables, poultry, school feeding schemes and livestock, will from part of a larger value chain aimed at enhancing value creation.
Infrastructure projects will be implemented within the agricultural part of the project and through our home-ownership scheme, which will be supported by the creation of enterprises related to, among others, construction, brick and paver manufacture, and school infrastructure development. Capacity-building and skills-development initiatives will range from ABET to portable skills training and learnerships, internships and skills transfers – all integrated in support of agribusiness, processing and infrastructure development. Partnerships with stakeholders, such as government, mining companies and businesses in other industries, will ensure greater consolidation of project funding and sustainability. Partnerships and investment gearing will help us achieve targets of 1,000 direct and 2,000 indirect jobs, as well as 1,000 houses to be built for employees to own, and the creation of
| |
Sibanye Gold Integrated Annual Report 2015 | 58 |
opportunities for local SMMEs supporting youth and women. SMMEs also stand to benefit from the planned development of incubation centres.
Future focus
The new SLP cycle beginning in 2017 presents an opportunity to implement regionalised community development projects and programmes in our areas of operation. These projects will be fewer but larger, more impactful and fully integrated to reduce inherent dependency on mining. This approach will enable better alignment with national and regional imperatives, such as the National Development Plan, Sustainable Development Goals, Special Presidential Package, spatial development frameworks, IDPs and other national developmental policy frameworks. We believe that this will align with phases 2 and 3 of the Gold Fields/Sibanye Gold Alliance Project.
| |
Sibanye Gold Integrated Annual Report 2015 | 59 |
MANAGE ENVIRONMENTAL IMPACT
Approach
Sibanye upholds the highest environmental standards and complies with applicable legislation governing the use of resources, responsible waste management, conservation of biodiversity, and closure and post-mining land use. Employees are also kept informed, and they are encouraged to adhere to and practise our environmental policy.
Performance
WATER MANAGEMENT
Total water withdrawal was 114,735Ml in 2015 with 14,795Ml (13%) from municipal sources (potable water) and 99,940Ml (87%) from underground sources. While the volumes withdrawn from ground fissure water did not change significantly, notably less potable water was withdrawn from municipal sources as a result of the water-treatment plant commissioned at Driefontein.
Total water withdrawal includes groundwater extracted from underground sources and water purchased from municipalities.
Sibanye’s water-management team focuses on four functional areas:
| · | | Compliance: Water use licence compliance improved as result of specialist interventions on surface and underground. The team approached the regulator to consider amendment of certain water use licence conditions in order to align current water use licences with the proposed resource-quality objective and catchment realities. We also prepared and completed the WRTRP water use licence application. The regulator conducted several audit inspections but no directives were issued. Assistance was provided in upgrading the Driefontein water laboratory for analysing many operational water samples. |
| · | | Innovation and projects: The team focused on several water-use improvement projects, including further process optimisation and refurbishment of the Driefontein North Shaft water-treatment plant. A 5Ml/day crystalactor softening plant was completed at Cooke 4, and Sibanye initiated the design and construction of the 30Ml/day settlers for the Trans Caledon Tunnel Authority Western Basin Water Plant Upgrade Project. The purpose of this project is to improve stability of the side walls of Dump 20 and restrict AMD into the environment. Test work was done on metal and salt reduction from underground water using lime softening and coagulation as unit processes. |
| · | | Operational and maintenance support: This provided support in the operation of the 20Ml/day Driefontein North Shaft water plant, which achieved a 20Ml/day saving in Rand Water intake. In addition, focus was on optimal operation of Sibanye’s underground settlers. By splitting underground fissure water and mine process water systems, Sibanye improved water quality in the discharges. The team also continued developing compliance and operational water and salt balances for mining sections. |
| · | | Awareness and stewardship: Several community visits were hosted at the Western Basin surface operations, including a visit by government. Sibanye participated in several stakeholder and water management public forum meetings. The SibanyeAMANZI strategic programme was updated and the revised strategy was presented to the Executive Committee. The focus of the SibanyeAMANZI strategy remains the improvement of water-use licence compliance, reducing the use of municipal water and water conservation/water demand management as well as reducing the cost of water management. |
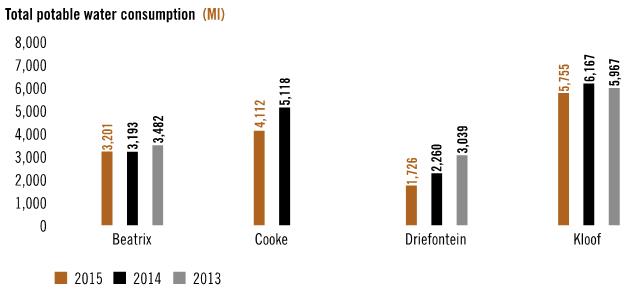
WATER USE LICENCE STATUS
Rand Uranium (Cooke 1, 2 and 3), Ezulwini (Cooke 4), Kloof, Driefontein, Beatrix and Burnstone all have current water use licences or authorisations.
| |
Sibanye Gold Integrated Annual Report 2015 | 60 |
Applications have been made for amendments to some of these water use licences, and feedback from the Department of Water and Sanitation (DWS) is pending.
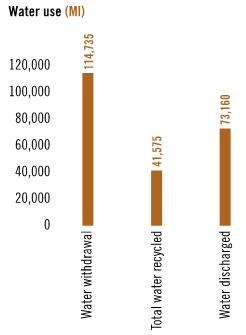
In line with water use licence requirements, we reported 11 water-related incidents to the DWS in 2015. Generally, these incidents related to accidental water discharges and spills.
TAILINGS AND WASTE PROGRAMME
To reduce costly double handling of development or waste rock, previously hoisted separately and stored on rock dumps for future processing through dedicated surface material plants, a decision was taken in 2014 to mill and process development rock with underground ore at all operations. Significant effort has also been made to improve the quality of mining factors, such as reducing dilution by lowering stoping widths and ensuring that as much gold is recovered from the stoping area as possible by improving seepings in order to reduce or eliminate accumulations. Reducing dilution by minimising the amount of waste rock mined has significant cost benefits, including less effort on mining and processing waste material not containing gold, resulting in higher yields. Environmental gains include a smaller SRD footprint as land use is reduced, lower dust emissions and more effective management of water pollution.
There are environmental and health risks associated with the use of cyanide, the primary reagent for leaching gold from ore. The International Cyanide Management Code for the manufacture, transportation and use of cyanide in the production of gold is embedded in Sibanye’s management processes and systems, and management assurance is an ongoing process. No cyanide-related incidents were reported at our operations in 2015. Sibanye purchased 11,924t of cyanide in 2015 (2014: 11,758t).
WASTE MANAGEMENT
| | | |
| 2015 | 2014 | 2013 |
Tailings into TSFs | 14.31 | 15.73 | 13.11 |
Tailings into pits | 4.20 | 3.79 | - |
Waste rock | 7.14 | 0.60 | 0.76 |
Recycled | 11.34 | 11.96 | 13.29 |
Total mining waste | 25.65 | 20.12 | 13.87 |
AIR QUALITY MANAGEMENT
While surface dust levels at our operations in 2015 were generally below legislated limits, some exceedances were experienced mainly as a result of the extremely dry weather in the latter part of 2015, continuing into 2016. As a result, dust suppression required additional interventions.
Using dustfall regulations listed by the American Society for Testing and Materials (ASTM) International D1739 as a reference, single and multi-directional buckets were used to collect dust throughout 2015. Wind direction also provided information on potential sources that may be contributing to dustfall at particular points. A process to determine equivalence between the ASTM method and the multi-directional buckets began in 2014, and a technical paper was presented at the National Association for Clean Air Conference in 2015 for review and discussion with delegates. Work continues in 2016.
| |
Sibanye Gold Integrated Annual Report 2015 | 61 |
Ridge ploughing of the dormant No 1 TSF at Beatrix has been done to minimise dust blow-off. Ridge ploughing has been completed at the Cooke TSF and the roadways have been clad with rock to minimise dust liberation during tramming operations. At the Driefontein No 2 and 3 gold plants, tramming over gravel roads and rock-conveyor systems has been reviewed. The frequency of dust suppression on gravel roads has increased and some stockpiles have been decommissioned with trucks tipping directly into bins to minimise dust liberation. Installation of water sprays at the Driefontein No 2 TSF has begun with a view to commissioning in 2016. At Kloof, handling and transportation of tailings material from the dormant TSF beside Masimthembe Shaft has been reviewed. Watering down of gravel roads is more frequent and, during periods of high winds, loading and transportation activities are curtailed. It is envisaged that the WRTRP will provide a long-term solution for some of the TSFs on the West Rand. In the interim, holding patterns will be maintained.
Sibanye’s listed activities affecting ambient air quality, identified by the Department of Environmental Affairs (DEA) through the National Environmental Management: Air Quality Act, 2004 (Act No 39 of 2004) (Air Quality Act), include the metallurgical smelting process, lead processes in the assay laboratories and waste incinerators at sewage works. To manage these processes, isokinetic sampling is used (particles are collected in a stream moving at the same velocity within the sampling device as in the sampled stream). The sample is analysed at a laboratory to determine composition and concentration of emission gases and particulate matter. Results are used in impact assessments.
All of Sibanye’s operations with activities listed in terms of the Air Quality Act have provisional atmospheric emissions licences. In 2015, the operations focused on optimising compliance in terms of these licences, including quarterly stack emissions sampling and engaging with the West Rand District Municipality.
As Sibanye complies with the Air Quality Act, legislated air quality standards in terms of this Act take precedence over South African National Standards (SANS) compliance. In terms of draft regulations on pollution prevention plans and atmospheric emission reporting, as well as a discussion paper on desired emission reduction outcomes, companies like Sibanye emitting more than 100,000t carbon dioxide equivalent (CO2e) per annum may be required to submit five-year pollution prevention plans to the DEA. In addition, these companies may be allocated carbon credits, which have to be managed to achieve desired emission reduction outcomes.
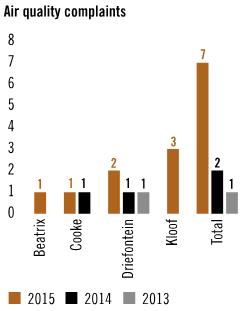
All operations completed setup and initial reporting on the National Atmospheric Emissions Inventory System in 2015. Mandatory reporting begins in 2016.
REDUCING ENERGY CONSUMPTION
Energy-efficiency initiatives have been implemented across the Group, in line with Eskom’s demand-side management programme, to reduce electricity consumption by 2% to 3% annually over five years. Employees are encouraged to conserve energy and more energy service companies are due to be employed in 2016 to increase energy-saving measures. In 2015, Sibanye realised a saving of 15.8MW (2014: 23.7MW).
Sibanye has intensified load shifting to protect the national grid at peak times, to offset the effects of load curtailment when the national grid has been constrained and to manage peak power costs.
The Group measures, monitors and manages its energy and carbon footprints in terms of its integrated energy and carbon-management strategy. It has found that electricity consumption contributes approximately 85% to its total Scope 1 and 2 emissions (carbon footprint). The balance comprises fugitive methane emissions at Beatrix, as well as diesel, petrol, liquid petroleum gas (LPG), oxyacetylene, blasting agents and coal.
The strategy has been integrated with Sibanye’s approach to energy management, given that its carbon footprint is dominated by energy use and, in particular, the use of fossil-fuelled electricity sourced from Eskom. Sibanye continues to design, develop and implement strategies that seek to reduce the energy consumption of operations and, thereby, reduce the carbon footprint of the Group, pursue any potential opportunities and use energy- efficient technologies where this is feasible.
| |
Sibanye Gold Integrated Annual Report 2015 | 62 |
The Beatrix carbon-reduction project, which includes secondary sealing activities underground and the use of methane gas to generate electricity, registered under the Clean Development Mechanism (CDM) of the Kyoto Protocol to the United Nations Framework Convention on Climate Change (UNFCCC) in 2013, accrued 34,591 certified emission reductions (CERs) in 2015 (2014: 30,051). CERs (also known as carbon credits) are emission units issued by the CDM to assist organisations in offsetting their emissions and complying with their targets.
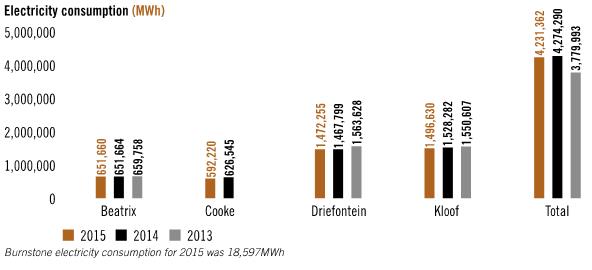
EMISSIONS (tCO2e)
| | | |
| 2015 | 2014 | 2013 |
Scope 11 | 94,175 | 109,840 | 120,076 |
Scope 2 | 4,271,717 | 4,404,562 | 4,559,995 |
Scope 32 | 866,745 | 863,009 | 633,928 |
NOx (t) | 618 | 19,901 | 14,618 |
SOx (t) | 499 | 632 | 464 |
1 Scope 1 emissions exclude fugitive mine methane, which amounted to 649,733tCO2e in 2015.
2 Emissions from 13 of the 15 categories have been included under Scope 3 as follows:
| 1. | | Purchased goods and services: emissions associated with the extraction and production of timber, cyanide, hydrochloric acid, lime, cement, caustic soda and purchased water. |
| 2. | | Capital goods: emissions associated with the production of purchased company-owned vehicles. |
| 3. | | Fuel- and energy-related emissions not included in Scope 1 or Scope 2: emissions associated with the extraction, production and transportation of diesel, petrol, LPG, coal (industrial), blasting agents (ANFO), oxyacetylene and grid electricity. |
| 4. | | Upstream transportation and distribution: emissions associated with the transportation and distribution of purchased timber, cyanide, hydrochloric acid, lime, cement and caustic soda between suppliers and Sibanye. |
| 5. | | Waste generated in operations: emissions associated with the disposal and treatment of Sibanye’s solid waste and wastewater in facilities owned or operated by third parties (such as municipal landfills and wastewater treatment facilities). |
| 6. | | Business travel: emissions associated with transporting Sibanye’s employees for business-related activities. |
| 7. | | Employee commuting: emissions associated with the transportation of Sibanye’s employees between their homes and work sites. |
| 8. | | Upstream leased assets: CO2e emissions associated with leasing helicopters. |
| 9. | | Downstream transportation and distribution: CO2e emissions associated with transporting Sibanye’s gold from the mines to Rand Refinery. |
| 10. | | Processing of sold products: CO2e emissions associated with smelting and refining gold. |
| 11. | | End-of-life treatment of sold products: CO2e emissions associated with smelting gold to repurpose the product. |
| 12. | | Downstream leased assets: CO2e emissions associated with the leasing of houses to mine workers where emissions are generated from electricity use. |
| 13. | | Investments: CO2e emissions associated with investment in companies, Living Gold and Rand Refinery. Sibanye has a 50% share in Living Gold and a 33.1% share in Rand Refinery. |
| 14. | | Scope 3 emissions from the following 2 categories have not been included: |
| " | | Franchises: Sibanye does not have any franchises |
| " | | Use of sold products: emissions associated with the use of sold gold products are deemed insignificant as only processing and end-of-life treatment of sold products are expected to have significant associated emissions. |
| |
Sibanye Gold Integrated Annual Report 2015 | 63 |
energy intensity
| | | |
| 2015 | 2014 | 2013 |
Beatrix | 0.73 | 0.69 | 0.70 |
Cooke | 0.76 | 0.77 | - |
Driefontein | 1.03 | 1.09 | 1.08 |
Kloof | 1.56 | 1.36 | 1.36 |
REHABILITATION
Total land under Sibanye’s management in 2015 and 2014 (including Cooke) was 50,316ha (2013: 36,690ha). The cumulative total of land disturbed by mining and related activities in 2015 and 2014 (including Cooke) was 17,359ha (2013: 7,449ha).
Biodiversity action plans (BAPs) are being developed for all operations. Driefontein’s BAPs have been completed and implemented while a BAP for Kloof is due to be finalised in April 2016. The Kloof BAP includes a detailed land-capability study, which was extended to include the Driefontein freehold area. The Beatrix assessment is due to be completed in 2016.
Based on the outcome of a land-use survey conducted in 2013, indicating that landowners wanted to continue agricultural activities in future, Sibanye embarked on a study to determine the land capability of the Kloof and Driefontein properties in 2014. The study was finalised towards the end of 2015 and this information is being incorporated into the Kloof BAP to be included in the review of the Driefontein BAP in 2016.
As sustainable development and land management are closely related, alien vegetation is removed through LED projects at Kloof and Driefontein. This intervention was rolled out across the Group in 2015.
Potential soil contamination studies were conducted at Kloof and Driefontein, and identified areas with the highest risk of soil contamination. Phase 2 of the study will be conducted in 2016 in order to quantify contaminated soil and management plans will be compiled to address rehabilitation of these areas.
Sibanye’s closure liability is assessed annually by a recognised independent consultant, and it is funded by trust funds and insurance guarantees. Closure liability as at 31 December 2015 was R3,817 million (2014: R3,549 million).
PERMITTING AND COMPLIANCE
The environmental management system is audited on a rotational basis. Each operation has an approved environmental management programme (EMP), which is a formal contract between Sibanye, as the holder of the mining right, and the regulator, the DMR, regarding the impacts that may arise from mining operations, assessment of these impacts from a risk perspective, proposed measures to mitigate the impacts and commitments or undertakings by the licence holder to implement mitigation measures.
The EMPs are reviewed in monthly site inspections, quarterly internal and external audits by independent auditors, and in annual closure liability assessments and site inspections by the DMR. Any shortcomings will be addressed.
In addition to regulatory reporting processes, a legal register, management code of practice and sustainable-development assurance processes, Sibanye’s Internal Audit department monitors legal compliance, as well as external EMP assessments.
| · | | Beatrix: In 2015, the outcomes of site inspections by the DMR were predominantly positive with a high degree of compliance. |
| · | | Cooke 1, 2 and 3: Site inspections were also predominantly positive with a high degree of compliance in 2015. An in-house performance assessment on the EMP in August 2015 found overall compliance of 86%. The main issues of concern were waste management (separation and storage) and water management (clean and dirty water separation and storm water infrastructure maintenance). Sibanye’s Group Environmental Management function, working with mine personnel, will drive these initiatives in 2016. |
| · | | Burnstone: An external EMP performance assessment conducted in August 2015 found overall compliance of 74%. Hydrocarbon spill management, topsoil stockpile management and stormwater run-off management were major concerns. The project team will work with Group Environmental Management with focus on hydrocarbon spill management in 2016. |
| · | | Kloof, Driefontein and Beatrix: In-house EMP performance assessments are due to be conducted in the first quarter of 2016. |
Sibanye reports on Level 3 (ongoing but limited impact), Level 4 (medium-term impact) and
Level 5 (long-term impact) environmental incidents.
In 2015, Sibanye reported eight (2014: nine) Level 3 environmental incidents. There were three Level 3 incidents at Cooke Operations, three Level 3 incidents at Kloof and two Level 3 incidents at Driefontein. No Level 4 and 5 incidents were reported during the period under review.
Future focus
Sibanye is set to reduce its carbon footprint and improve its carbon intensity ratio through a combination of energy-efficiency and energy-saving projects as well as the introduction of renewable energy into its energy-supply mix.
| |
Sibanye Gold Integrated Annual Report 2015 | 64 |
TRANSFORMATION
Approach
Sibanye believes that transformation is a critical national imperative for ensuring the growth and sustainability of the business, and the South African economy at large. The Group believes that, by creating an enabling business environment, historically disadvantaged South Africans (HDSAs) will be empowered to participate meaningfully as employees, shareholders, communities and suppliers. This approach resonates with Sibanye’s vision to ‘create superior value for all stakeholders’.
Sibanye’s approach entails:
| · | | inculcating a positive mindset to drive the achievement of Mining Charter objectives |
| · | | striving to achieve commitments made in SLPs |
| · | | mitigating risks affecting social licences to operate |
| · | | embedding sustainability principles in everything the Group does. |
To ensure accountability and responsibility, the Vice President: Corporate Affairs is accountable to the Sustaining our Social Licence to Operate Committee (SSLOC), part of the Executive Committee, which in turn reports to the Social and Ethics Committee of the Board on issues pertaining to Sibanye’s social licence to operate and transformation. The Vice President: Corporate Affairs also chairs the SLP Working Group (comprising information owners for all Mining Charter/SLP elements). The SLP Working Group mainly drives transformation within the operations and ensures alignment with the business plan and affordability. To ensure that transformation is embedded in the business, each operation has quarterly SLP forums, chaired by the mine’s Vice President and attended by members of organised labour. Progress made with each element of the Mining Charter and SLP is reviewed and discussed. Feedback on progress is also presented to the Group Leadership Forum – a high-level engagement platform between organised labour and management, including members of the Executive Committee.
Towards the end of 2014, the DMR engaged with the Chamber of Mines through the Mining Industry Growth and Development Task Team (MIGDETT) regarding the regulator’s intentions to conduct Mining Charter assessments. The scope of the assessments would be broadened to cover all mining rights holders in the country and would include the 2013 Mining Charter reports. To assist the process, a web-based system was developed to allow for companies to make online submissions, particularly given the broad scope of the assessments: 2012, 2013 and 2014 for companies that could submit them. All Sibanye operations participated in the Mining Charter assessments and achieved an ‘excellent performance’ rating in 2014. The 2015 Mining Charter report will be submitted to the DMR at the end of March 2016 when it is due.
While the current Mining Charter was intended to be in effect from 2009 to 2014, its remit has been extended to 2016 while the next phase is developed.
Sibanye’s transformation guide
Sibanye’s Transformation Guide mirrors Mining Charter and SLP elements, and each element is further divided into:
| · | | Strategic intent: the strategic framework of each element is outlined |
| · | | Key targets: minimum compliance requirements in terms of SLPs are highlighted |
| · | | Risks/Issues: shortcomings and risks are flagged to overcome barriers in achieving implementation, targets and mining licence |
| · | | Mitigation: steps are identified to mitigate risks identified above |
| · | | Deliverables: key areas are listed to uphold a legally defensible position, including objectives, measures, timelines and accountability structures, with indicators selected for relevance and applicability to each SLP/Mining Charter element |
| · | | Stakeholders: key stakeholders are identified for engagement |
| · | | Inputs for reports: regular reporting required by each information owner is noted |
Performance
OWNERSHIP
In 2010, a broad-based employee share plan, the Thusano Trust, was implemented in terms of which Gold Fields’ employees acquired 10,717,207 Gold Fields shares. The share plan was implemented in line with a collective agreement between the NUM, UASA, Solidarity and Sibanye (previously GFI Mining South Africa Proprietary Limited). The shares were allocated to employees in Paterson employment bands A, B and C, according to their years of service. The Thusano Trust was registered as the vehicle to administer the share plan. In terms of the trust deed, the allocated shares are to be held in trust for a period of 15 years on behalf of employees. During this restrictive period, employees may not dispose of or otherwise encumber the shares. Discounting the fact that the employees cannot dispose of shares for a period of 15 years, employees acquired full rights of ownership in the shares, which entitles them to voting rights and dividends paid in relation to the shares. With the unbundling of Gold Fields, employees were allocated an equal number of Sibanye and Gold Fields shares.
By the end of 2015, 26,444 (2014: 27,959) employees were participants in the ESOP scheme.
| |
Sibanye Gold Integrated Annual Report 2015 | 65 |
EMPLOYMENT EQUITY – LOCALISATION AND DEMOGRAPHICS
As far as possible, Sibanye seeks to employ local people (from local communities within 50km of the operations). At the end of 2015, 33% (2014: 31%) of Sibanye’s employees could be defined as local.
A large percentage of employees with core skills, experience and many years of loyal service are also drawn from labour-sending areas in rural provinces of South Africa and neighbouring countries within the Southern African Development Community (SADC). At the end of 2015, migrant employees made up around 67% (2014: 68%) of Sibanye’s employee base with 28% (2014: 29%) drawn from other SADC countries. While Sibanye recognises the imperative of local recruitment, it also notes the adverse impact the shift to employing locals is likely to have on the labour-sending areas where mine remittances are often the sole source of income for communities and regional economies.
Nonetheless, Sibanye recognises the broader negative social issues arising from the migrant-labour system and is attempting to address these through various measures, including alternative working arrangements and the provision of acceptable accommodation. Different shift cycles and longer shifts should result in more time off for employees, potentially allowing them to travel home more often, as well as creating more employment opportunities and enhancing productivity on mature mines, although it is difficult to estimate the impact of these arrangements at this stage.
Sibanye has established a task team to develop a strategy to increase the number of women in mining and to address some of the hurdles inherent in this practice, including ensuring the personal safety and successful integration of women into established male working teams. These issues are also monitored by women in mining forums made up of female employees at each operation. These forums deal specifically with gender-related challenges and their aim is to ensure that there is complete integration of women in all working places and at management levels.
Key focus areas include gender-neutral policies and procedures, wellbeing of women (including safety and security in the workplace), creating working environments conducive to the employment, placement and development of women.
In order to increase the number of women employed in core and critical skills, changes have been made to Sibanye’s recruitment strategy. This has resulted in an increase of 2% during the year. Several leadership development sessions, co-ordinated by Sibanye Gold Academy, were held for women in 2015.
Sibanye remains committed to creating and maintaining a diverse and representative workforce. In 2015, Sibanye continued to make progress towards reaching the required HDSA representation at senior, middle and junior management levels, acknowledges that more needs to be done by the Group, and it will continue to focus efforts on ensuring that there is an integrated talent-management framework that will primarily focus on education, training and development of HDSA employees as well as the external appointment of high-quality HDSA employees into key management positions.
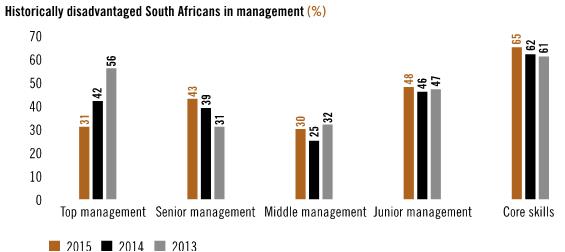
HOUSING AND LIVING CONDITIONS
Of Sibanye’s 39,725 permanent employees (2014: 39,232), 32% (2014: 33%) lived in high-density residences, 20% (2014: 17%) lived in other Group accommodation, including family units built by the Group, and 48% (2014: 57%) opted to receive a living-out allowance in 2015.
The high density-residence upgrade programme has been completed at the Beatrix, Driefontein and Kloof operations, representing a total investment of R425.2 million over eight years. In line with the Mining Charter requirements, this resulted in a reduction in occupancy rate to one person per room (between six and 10 people per room at the outset of the project). Sibanye acquired the Cooke Operations in 2015 and has since spent R4.4 million upgrading Block 1 at Cooke 3. Since the occupancy rate at Cooke Operations is currently less than one person per room, the upgrades are intended to bring about qualitative improvements to living conditions and align with Sibanye’s standards.
Sibanye supports the Mining Charter’s aim to accommodate as many families as possible by building new family units in viable, integrated communities, given that high-density residences are not suitable for families. Of the final 50 houses planned as part of
| |
Sibanye Gold Integrated Annual Report 2015 | 66 |
the Driefontein SLP, 34 were completed in 2015 in Blybank near the Driefontein Operation. Construction of the last 16 houses hinges on finalisation of a land-swap arrangement with the Merafong City Local Municipality.
Sibanye is also actively pursuing an employee home-ownership scheme, which will enable employees to own the houses. This programme comprises the sale of current mine-owned houses at a discount, based on years of service to the Group and the sale of new affordable houses subsidised by the Group. In 2015, to kick-start the home-ownership programme, a two-pronged approach was used for occupied and vacant mine-owned houses:
| · | | Sibanye-owned Paterson D and E band houses were first offered to occupants with no obligation to buy and |
| · | | vacant houses in the D and E bands were first offered to Sibanye employees via a tender process, and then to the open market. |
Through this process, 92 Paterson D and E band houses were sold while a further 44 houses were being processed at the end of December 2015 out of the possible 265 Paterson D and E band houses owned by Sibanye in the West Wits area. This excludes houses sold to employees on Paterson C Band and those sold to Gold Fields’ South Deep employees. The sale of houses continues, supported by an ongoing marketing drive. With respect to the sale of new houses, no specific targets have been set as uptake is driven by demand. Progress in the sale of new houses was preceded by extensive stakeholder engagement between management and organised labour about designs and layout of prototype showhouses. Subsequently, prototypes of two- and three-bedroomed showhouses were built in Glenharvie, near Kloof, and Virginia in the Free State. As a result of employee-driven demand, 32 houses were built for sale in Glenharvie and more will be built based on demand. The sale of these new houses continues.
The aim of the affordable home-ownership programme is to provide affordable and sustainable homes to Sibanye’s lower-level employees. Primarily, this programme focuses on in-house project management and construction to keep costs low and local people are employed where possible. Sibanye aims to build houses that can be funded from living-out allowances with minimal subsidisation by the Group.
PROCUREMENT
Sibanye has performed well in meeting the procurement targets set out in the Mining Charter, except for capital goods procured by Cooke 1, 2 and 3 due to the operations ceasing all capital expenditure in the second quarter of 2015.
In support of local entrepreneurs, an online registration system has been developed and implemented for all prospective suppliers. The team also assisted local communities by being visible to local vendors at various workshops organised by the DMR and/or the local/district municipalities. Establishment of community access centres, in conjunction with the Small Enterprise Development Agency, has provided a platform to improve communication with potential local vendors.
Sibanye’s total procurement spend with BEE entities was R4.70 billion (2014: R4.68 billion) in 2015.
BEE PROCUREMENT IN 2015 (%)
| | | | |
| Capital goods Target: 40% | Consumable goods Target: 50% | Services Target: 70% | Multinational companies |
Beatrix | 59 | 74 | 74 | No imports |
Cooke 4 | 52 | 64 | 82 | No imports |
Cooke 1,2 and 3 | 33 | 60 | 70 | No imports |
Driefontein | 52 | 74 | 78 | No imports |
Kloof | 66 | 80 | 78 | No imports |
ENTERPRISE DEVELOPMENT
In respect of transformation, Sibanye achieved the following in the past year:
| · | | establishment of an electronic portal that has provided SMMEs with a link to register as vendors, including Burnstone operations |
| · | | more SMMEs participated in the tender processes in 2015 – for instance, SMMEs built showhouses at Glenharvie and Virginia, and have been awarded tenders to upgrade facilities used by Protection Services |
Future focus
The procurement strategy is being revised in order to integrate an approach that will culminate in a progression plan that supports compliance objectives with specific intent to increase the proportion of procurement spend on HDSA enterprises. To date, the development of business acumen among BBBEE service providers, which will impact the mining operations of Beatrix in the form of joint ventures (JVs) or business alignment, has been identified. The following opportunities and options are being investigated:
| · | | creation of JVs and/or business alignment with current suppliers through contract apportionment: successful SMMEs will be given an opportunity to enter into a JV or business alignment with larger suppliers through allocation of part of a contract with built-in exit strategies |
| · | | greater focus on including local HDSA SMMEs in the formal tender process: this will apply to all HDSA suppliers but will focus on activities that do not pose a risk to the mining process. This implies that HDSA companies offering goods and services required by Sibanye will be included in tenders to increase competition and expose these companies to the tender processes while providing them with opportunities to compete actively |
| |
Sibanye Gold Integrated Annual Report 2015 | 67 |
| · | | local community access centres currently assist local SMMEs to register their service offerings with Sibanye along with other entities within the local communities but a FS of this concept will be performed to ensure that local businesses manage the facilities sustainably |
| |
Sibanye Gold Integrated Annual Report 2015 | 68 |
Grow
SECURE ALTERNATIVE ENERGY SOURCES
Approach
Shortly after listing in 2013, Sibanye indicated its intention to explore alternative sources of long-term electricity supply in response to this material risk. Sibanye intends to reduce its dependency on Eskom over the next few years as this will make a material difference to production costs.
Photovoltaic generation from sites adjacent to Sibanye’s mining operations represents a partial solution to securing alternative electricity supply. This technology can be implemented over a relatively short time while baseload solutions will be required to complement photovoltaic power for a more comprehensive approach.
Performance
INDEPENDENT COAL-BASED ENERGY SUPPLY
Sibanye has completed several studies of other energy sources it considers reliable and over which we will be able to exercise some control. An in-depth investigation into coal-fired power stations, varying in size from 200MW to 600MW, was completed in 2014. A critical aspect of the study was the need to ensure reliable, quality coal sources. Sibanye is also engaging with technology partners to develop a deeper insight into independent power generation.
Sibanye has been exploring various alternative sources of long-term stable energy supply in response to the inconsistent and increasingly expensive power supplied by Eskom. To this end, projects have been identified as possible platforms to facilitate the Group’s electricity-supply objectives and development of a viable IPP platform. Ultimately, security of supply and enhanced cost control would continue to support Sibanye’s bottom line and hence the Group’s ability to pay industry-leading dividends.
SOLAR ENERGY PROJECT
A PFS completed in 2014 confirmed that solar power would be an economically competitive solution, and could ameliorate the effects of interruptions in Eskom supply on operations. The photovoltaic project is in development phase with focus currently on acquiring the required environmental permitting for the entire project, including the selected site, adjacent to the Driefontein and Kloof operations, engineering design and establishing the most appropriate business arrangements to optimise commercial benefits. The 150MW photovoltaic project remains on track to begin generating electricity towards the end of 2017.
Future focus
While coal-fired power generation is regarded as the most likely alternative, the feasibility of a range of other baseload-supply options, including renewable electricity sources, are being evaluated.
| |
Sibanye Gold Integrated Annual Report 2015 | 69 |
MODERNISATION AND TECHNOLOGICAL INNOVATION
APPROACH
Sibanye recognises that radical transformation is necessary in the mining industry in order for mechanisation and modernisation to succeed. There is a need for generally higher levels of skill and a new way of thinking – the mining industry needs to have learning as the norm and to focus on improved rates of productivity. Sibanye is committed to seeking and achieving technological breakthroughs in mining processes, and believes there is the will and the ability to solve any technical issues, particularly when developing methods to bring about modernisation in deeper mines.
To achieve this, Sibanye participates fully in R&D in pursuit of technological innovations that could safely unlock the Mineral Resource and Mineral Reserve potential of its operations in high-grade remnants and pillars, current mining horizons and at depths in excess of current operations. Sibanye considers the development of technology as a fundamental strategy and has identified Safe Technology as a strategic imperative.
PERFORMANCE
A dedicated Safe Technology function was established within Sibanye in July 2014 with the responsibility to explore ways in which to modernise the operations by using new technologies to improve working conditions and to make the working environment safer for employees while, at the same time, improving productivity and reducing costs. An interim strategy was developed, which considered ways in which new technology can have an impact on LoM projections, ore-body complexity, productivity profiles and cost pressures, as well as the growing portfolio of capital-expansion projects in order to improve productivity.
The three main strategy pillars are:
| · | | legacy mining pillar: reclamation of gold lost or left behind during mining operations in the form of fines, ultra-fines, crush and stability pillars |
| · | | current mining process improvement: reducing employees’ exposure to danger areas while increasing output and decreasing costs |
| · | | future-state mining methods: facilitating a 24-hour mining cycle, maximising utilisation of assets, and facilitating the conversion of resource to reserve of deeper level and secondary ore bodies. |
In early 2015, the interim strategy was reviewed, deemed appropriate and remains the cornerstone of the department. The strategy has steered the Safe Technology focus towards areas that could accomplish short- and long-term improvements in safety and efficiency in current mining operations and productivity – commensurate with innovation in new product development and gold-extraction methods.
Throughout 2015, the focus of the Safe Technology portfolio was to further refine its strategy, and progress our immediate operational needs, namely:
| · | | research into industry-leading practices and strategies |
| · | | obtaining insight from institutions such as universities or research organisations on potential progressive technological advancements |
| · | | regular counsel by original equipment manufacturers (OEMs) and selected industry technology experts |
| · | | engage with government through the Chamber of Mines Innovation team in order to leverage funding mechanisms in support of mining modernisation and innovation |
| · | | initiate micro and macro projects in line with the strategy. |
The Safe Technology team capitalises on Sibanye’s internal wealth of knowledge and experience in investigating, developing and driving innovation, and has established symbiotic relationships with counterparts in the industry, innovative developers and OEMs to ensure that safety technology adds value.
MACRO AND MICRO PROJECTS
Safe Technology’s endeavours are further categorised into macro or micro projects. Micro projects are generally in alignment with Safe Technology’s current mining process-improvement strategy, initiated either by the Safe Technology department or put forward by the operations. These include smaller safety-enhancing and production-optimisation projects such as:
| · | | roof-bolting optimisation and standardisation |
| · | | localised hydropower mining |
| · | | automated cleaning methods |
| · | | continuous dust monitoring and suppression |
| · | | structural inspection and maintenance management system (SIMMS) optimisation |
| · | | diesel particulate matter reduction and control |
| · | | personnel locating systems. |
| |
Sibanye Gold Integrated Annual Report 2015 | 70 |
Macro projects are aligned with Safe Technology’s old-gold recovery and future-state mining methods, and are initiated and driven by the Safe Technology department with operational assistance from selected mining units. All macro projects represent a significant departure from conventional mining methods, and aim to incorporate industry and often world-leading technologies.
In line with the future-state mining method, a paradigm shift in hard-rock mining is required for Sibanye to remain competitive locally and globally. Sibanye has, therefore, embarked on a stope-mechanisation programme to enable it to reduce costs and pay limits with non-explosive, continuous production. Work includes facilitating the conceptualisation and design of two primary mining platforms, the MT100 and MT1000, and the commissioning of prototypes for delivery in the first quarter of 2016.
The MT100 is a multi-track machine, with four adjustable flippers, capable of carrying payloads of up to 200kg. The unit is supplied with two separate attachments. The dozing attachment will be used to perform cleaning operations, previously facilitated by scraper winches. The sweeping attachment consists of a rotary brush and will be used to perform ultra-fine sweeping in-stope.
The MT1000 is a multi-track with four adjustable directional flippers, capable of carrying payloads of up to 1,000kg. The unit will also be supplied with two separate attachments. The Multi-Drill attachment is designed with four hydropower drills and will facilitate rapid face drilling (90 minutes per 30m panel). The Drill-and-Break attachment consists of a hydropower drill, coupled and indexed with a high-powered rock breaker, which will facilitate a non-explosive mining method, enabling a 24/7 mining cycle.
Although referred to as prototypes, much time has been spent on industrialising the design, taking into account the supply of material and manufacturing processes required to produce these machines so as to greatly reduce production time should the trials be deemed successful.
Another example of a ground-breaking development is Sibanye’s hybrid locomotive. Based on the original Sibanye locomotive, the unit will continue to use highly efficient asynchronous permanent magnet motors, with an increased voltage, enabling the use of smaller, less costly and more readily available motors that are capable of regenerating approximately 30% of the energy expended in a tramming cycle. Energy storage will be facilitated by lithium-ferrite phosphate (LiFePO4) batteries, which present reduced weight and substantially increased life when compared to the current lead-acid equivalent. A generator set will charge the batteries when required and thus alleviate the need for up to three lead-acid batteries per locomotive, presenting a substantial reduction in capital.
The locomotive is designed to be a direct replacement for conventional diesel locomotives without having to construct capital-intensive battery bays and associated infrastructure. The first hybrid locomotive will also be delivered in the first quarter of 2016.
Concurrently, Sibanye has continued to collaborate with its peers in the mining industry regarding technology development through inter-company, regulatory, administrative and institutional relationships as well as partnerships.
Other macro projects include:
| · | | mechanised wide-raise development in production trials at Kloof’s Ikamva Shaft |
| · | | mechanised and rapid infrastructure development using tunnel boring machines (TBMs) currently in the latter stages of establishment with operation expected by the end of Q2 2016 |
| · | | production trials of strike-and-dip pillar reef-boring with positive initial results. |
FUTURE FOCUS
In 2016, the focus will be on consolidating and refining successful projects so as to commercialise concepts for roll-out to the operations, and to deploy 2015’s prototype developments for assessment and conclusion. Having already industrialised the design of MT100, MT1000 and the Sibanye hybrid locomotive, the next step is to qualify the technology, through a comprehensive testing process, for roll-out on a larger scale.
Furthermore, Sibanye will continue to design, develop and implement new innovative strategies and technologies in an attempt to reduce energy consumption at the operations through the use of energy-efficient technologies and, where feasible, reduce carbon footprint. These strategies include the use of renewable energy, such as solar power, methane gas and climate change-mitigation initiatives. Sibanye will also continue to concentrate efforts in the area of water-technology innovation to reduce consumption and environmental impact through increased recycling.
| |
Sibanye Gold Integrated Annual Report 2015 | 71 |
acquisitions and funding model
APPROACH
While the high-quality gold operations underpin Sibanye’s ability to deliver a sustainable dividend to shareholders and gold production will always be an important component of the asset portfolio, delivery on the dividend strategy is not necessarily restricted to the gold sector. Sibanye is confident that its operating model and structures can be applied to unlock value in other sectors in the same way it has created value at Sibanye.
In this regard, in February 2014, Sibanye announced interest in participating in any potential restructuring in the South African platinum industry should there be opportunities for value creation in terms of earnings and cash flow on a per-share basis in the near to medium term.
The technical similarities between the tabular intermediate to deep, hard-rock mining in South African gold and platinum mines makes the platinum sector a natural extension for application of Sibanye’s core mining competences. Sibanye’s operating model, which has delivered an operational turnaround at its mature deep-level gold mining operations, can be applied to deliver similar value from platinum-mining operations.
Funding of acquisitions may be achieved through gearing, equity raising and internal cash generation.
PERFORMANCE
RUSTENBURG MINING AND CONCENTRATING OPERATIONS
On 9 September 2015, the proposed acquisition of Anglo American Platinum’s Rustenburg mining and concentrating operations was announced. In terms of the acquisition, Sibanye will acquire the Bathopele, Siphumelele (including Khomanani) and Thembelani (including Khuseleka) mining operations, two concentrating plants, an on-site chrome recovery plant, the Western Limb Tailings Retreatment Plant, associated surface infrastructure, and related assets and liabilities on a going-concern basis, including normalised levels of working capital.
Consistent with Sibanye’s transformation objectives, a consortium of broad-based BBBEE stakeholders will be included in the transaction, which will result in Sibanye owning 74% of the Rustenburg Operations and the BBBEE stakeholders owning 26%.
The transaction represents a meaningful entry for Sibanye into the PGMs sector and secures annual production of PGMs (4E) of more than 800,000oz and a large high-quality resource of over 88Moz of PGMs (4E), which affords the potential for substantial LoM extensions and/or growth. The transaction is consistent with Sibanye’s strategy to grow its business to enhance and sustain its position in paying an industry-leading dividend.
AQUARIUS
On 6 October 2015, Sibanye announced a cash offer for the entire issued share capital of Aquarius. The transaction has a strong strategic and financial rationale for Sibanye, both on a stand-alone basis and particularly when considered in conjunction with the proposed acquisition of the Rustenburg Operations.
Aquarius owns stakes in the Kroondal mine and the Platinum Mile retreatment facilities near Rustenburg in South Africa and, in a joint venture with Impala Platinum Holdings Limited, the Mimosa mine in Zimbabwe. The Aquarius operations are efficiently managed, mechanised and low-cost and would consolidate Sibanye’s position in the South African PGM sector. There is potential to realise significant additional value by optimising inherent regional and operational synergies between Aquarius’ Kroondal mine and the adjacent Rustenburg Operations. The transaction provides an entry point into Zimbabwe, which hosts the second largest platinum reserves in the world.
Aquarius is a significant primary producer of PGMs with attributable production of 349,426oz of PGMs (including 193,422oz of platinum) for its financial year ended 30 June 2015.
Through these transactions, Sibanye expects it will become a leading global multi-commodity company predominantly active in the precious metals industry. Sibanye expects it will be the eighth largest gold producer globally, the largest gold producer from South Africa and the fourth largest global PGM producer.
FUTURE FOCUS
In 2016, the priority will be to conclude the transactions announced in 2015 but Sibanye will continue to assess opportunities to develop the business in a manner that enhances value for stakeholders and supports the dividend strategy. The near-term focus will include consolidation and growth in the sectors in which Sibanye is currently operating or expanding into as well as value-accretive growth into other commodity sectors.
Sibanye is in an excellent position to maintain the performance at existing operations and grow the Group through smart, value-accretive acquisitions.
| |
Sibanye Gold Integrated Annual Report 2015 | 72 |
annual financial report
ABOUT SIBANYE’S REPORTS
THE 2015 SUITE OF REPORTS
covers the financial year
from 1 January 2015 to 31 December 2015.
Sibanye Gold Limited (Sibanye or the Group) is listed on the Main Board of the JSE Limited (JSE) (ordinary shares) and on the New York Stock Exchange (NYSE) American Depositary Receipts (ADRs). Sibanye reports in compliance with the JSE Listing Requirements, the International Financial Reporting Standards (IFRS) (issued by the International Accounting Standards Board (IASB)), the South African Institute of Chartered Accountants (SAICA) Financial Reporting Guides (issued by the Financial Reporting Standards Council), the South African Companies Act, 2008 (Act No 71 of 2008) (the Companies Act) and the Code of and Report on Governance Principles for South Africa (King III). Sibanye’s Mineral Resources and Mineral Reserves are reported in terms of the South African Code for Reporting of Exploration Results, Mineral Resources and Mineral Reserves (SAMREC).
| |
Sibanye Gold Annual Financial Report 2015 | 73 |
| |
Sibanye Gold Annual Financial Report 2015 | 74 |
| |
Sibanye Gold Annual Financial Report 2015 | 75 |
FIVE YEAR FINANCIAL PERFORMANCE
| | 2015 | 2014 | 2013 | 2012 | 2011 |
GROUP OPERATING STATISTICS | | | | | | |
Gold produced | kg | 47,775 | 49,432 | 44,474 | 38,059 | 45,005 |
| ’000oz | 1,536 | 1,589 | 1,430 | 1,224 | 1,447 |
Ore milled | 000t | 19,861 | 18,235 | 13,624 | 12,185 | 14,648 |
Gold price | R/kg | 475,508 | 440,615 | 434,663 | 434,943 | 369,139 |
| US$/oz | 1,160 | 1,267 | 1,408 | 1,652 | 1,590 |
Operating cost | R/t | 825 | 785 | 879 | 888 | 673 |
Operating profit | Rm | 6,337 | 7,469 | 7,358 | 5,730 | 6,752 |
Operating margin | % | 28 | 34 | 38 | 35 | 41 |
Total cash cost1 | R/kg | 347,613 | 295,246 | 273,281 | 285,851 | 220,224 |
| US$/oz | 848 | 849 | 885 | 1,086 | 949 |
All-in sustaining cost2 | R/kg | 422,472 | 372,492 | 354,376 | 382,687 | 296,531 |
| US$/oz | 1,031 | 1,071 | 1,148 | 1,453 | 1,277 |
All-in cost2 | R/kg | 430,746 | 375,854 | 354,376 | 382,687 | 296,531 |
| US$/oz | 1,051 | 1,080 | 1,148 | 1,453 | 1,277 |
All-in cost margin3 | % | 9 | 15 | 18 | 12 | 20 |
GROUP FINANCIAL STATISTICS4 | | | | | | |
INCOME STATEMENT | | | | | | |
Revenue | Rm | 22,717 | 21,781 | 19,331 | 16,554 | 16,613 |
Net operating profit | Rm | 2,700 | 4,215 | 4,254 | 3,367 | 4,559 |
Profit for the year | Rm | 538 | 1,507 | 1,698 | 2,980 | 2,563 |
Profit for the year attributable to owners of Sibanye | Rm | 717 | 1,552 | 1,692 | 2,980 | 2,564 |
Basic earnings per share | cents | 79 | 186 | 260 | 297,960,000 | 256,410,000 |
Diluted earnings per share | cents | 78 | 182 | 255 | 297,960,000 | 256,410,000 |
Headline earnings per share | cents | 74 | 170 | 355 | 297,790,000 | 256,130,000 |
Dividend per share | cents | 72 | 125 | 37 | 73,130,000 | 242,330,000 |
Weighted average number of shares | ’000 | 912,038 | 835,936 | 650,621 | 1 | 1 |
Diluted weighted average number of shares | ’000 | 917,709 | 854,727 | 664,288 | 1 | 1 |
Number of shares in issue at end of period | ’000 | 916,140 | 898,840 | 735,079 | 1 | 1 |
STATEMENT OF FINANCIAL POSITION | | | | | | |
Property, plant and equipment | Rm | 22,132 | 22,704 | 15,151 | 16,376 | 15,359 |
Cash and cash equivalents | Rm | 717 | 563 | 1,492 | 292 | 363 |
Total assets | Rm | 28,266 | 27,922 | 19,995 | 19,698 | 18,492 |
Net assets/(liabilities) | Rm | 14,985 | 14,986 | 9,423 | (9,673) | (11,976) |
Stated share capital | Rm | 21,735 | 21,735 | 17,246 | – | – |
Borrowings5 | Rm | 3,804 | 3,170 | 1,991 | 4,220 | – |
Total liabilities | Rm | 13,281 | 12,936 | 10,572 | 29,371 | 30,468 |
STATEMENT OF CASH FLOWS | | | | | | |
Cash from operating activities | Rm | 3,515 | 4,053 | 6,360 | 2,621 | 3,861 |
Cash used in investing activities | Rm | (3,340) | (4,309) | (3,072) | (3,126) | (3,005) |
Cash (used in)/flows from financing activities | Rm | (21) | (673) | (2,088) | 434 | (1,529) |
Net increase/(decrease) in cash and cash equivalents | Rm | 155 | (930) | 1,201 | (71) | (673) |
OTHER FINANCIAL DATA | | | | | | |
EBITDA6 | Rm | 6,337 | 7,469 | 7,358 | 5,730 | 6,752 |
Net debt (cash)7 | Rm | 1,362 | 1,506 | 499 | 3,928 | (363) |
Net debt to EBITDA8 | ratio | 0.21 | 0.20 | 0.07 | 0.69 | (0.05) |
Net asset value per share | R | 16.36 | 16.67 | 12.80 | (9,672,700.00) | (11,975,600.00) |
Average exchange rate9 | R/US$ | 12.75 | 10.82 | 9.60 | 8.19 | 7.22 |
Closing exchange rate10 | R/US$ | 15.54 | 11.56 | 10.34 | 8.57 | 8.13 |
SHARE DATA | | | | | | |
Ordinary share price – high | R | 32.26 | 29.52 | 16.30 | n/a11 | n/a11 |
Ordinary share price – low | R | 13.66 | 12.34 | 6.73 | n/a11 | n/a11 |
Ordinary share price at year end | R | 22.85 | 22.55 | 12.30 | n/a11 | n/a11 |
Average daily volume of shares traded | | 3,024,491 | 2,868,842 | 4,754,958 | n/a11 | n/a11 |
Market capitalisation at year end | Rbn | 20.9 | 20.3 | 9.04 | n/a11 | n/a11 |
1 Sibanye presents the financial measures “total cash cost”, “total cash cost per kilogram” and “total cash cost per ounce” which have been determined using industry standards promulgated by the Gold Institute and are not IFRS measures. The Gold Institute was a non-profit international industry association of miners, refiners, bullion suppliers and manufacturers of gold products that ceased operation in 2002, which developed a uniform format for reporting production costs on a per ounce basis. The Gold Institute has now been incorporated into the National Mining Association. The guidance was first adopted in 1996 and revised in November 1999. An investor should not consider these items in isolation or as alternatives to cost of sales, net operating profit, profit before tax, profit for the year, cash from operating activities or any other
| |
Sibanye Gold Annual Financial Report 2015 | 76 |
measure of financial performance presented in accordance with IFRS. While the Gold Institute provided definitions for the calculation of total cash costs, the calculation of total cash cost per kilogram and the calculation of total cash cost per ounce, these may vary significantly among gold mining companies, and by themselves do not necessarily provide a basis for comparison with other gold mining companies. Total cash costs is defined as cost of sales as recorded in profit or loss, less amortisation and depreciation and off-site (i.e. central) general and administrative expenses (including head office costs) plus royalties and production taxes. Total cash cost per kilogram is defined as the average cost of producing a kilogram of gold, calculated by dividing the total cash costs in a period by the total gold sold over the same period. Management considers total cash cost and total cash cost per kilogram to be a measure of the on-going costs of production. For a reconciliation of operating costs to total cash cost, see Annual Financial Report–Overview–Management’s discussion and analysis of the financial statements–2015 financial performance compared with 2014 and 2013–Cost of sales–Operating costs – Cost of sales less amortisation and depreciation.
2 Sibanye presents the financial measures “All-in sustaining cost”, “All-in cost”, “All-in sustaining cost per kilogram”, “All-in sustaining cost per ounce”, “All-in cost per kilogram” and “All-in cost per ounce”, which were introduced during the year ended 31 December 2013 by the World Gold Council (the Council). Despite not being a current member of the Council, Sibanye adopted the principles prescribed by the Council. The Council is a non-profit association of the world’s leading gold mining companies established in 1987 to promote the use of gold from industry, consumers and investors and is not a regulatory organisation. The Council has worked with its member companies to develop a metric that expands on IFRS measures such as cost of goods sold and currently accepted non-IFRS measures to provide relevant information to investors, governments, local communities and other stakeholders in understanding the economics of gold mining operations related to expenditures, operating performance and the ability to generate cash flow from operations. This is especially true with reference to capital expenditure associated with developing and maintaining gold mines, which has increased significantly in recent years and is reflected in this metric.
All-in sustaining cost, All-in cost, All-in sustaining cost per kilogram, All-in sustaining cost per ounce, All-in cost per kilogram and All-in cost per ounce metrics are intended to provide additional information only, do not have any standardised meaning prescribed by IFRS and should not be considered in isolation or as alternatives to cost of sales, profit before tax, profit for the year, cash from operating activities or any other measure of financial performance presented in accordance with IFRS. All-in sustaining cost, All-in cost, All-in sustaining cost per kilogram, All-in sustaining cost per ounce, All-in cost per kilogram and All-in cost per ounce as presented in this document may not be comparable to other similarly titled measures of performance of other companies. Other companies may calculate these measures differently as a result of differences in the underlying accounting principles, policies applied and accounting frameworks such as in US GAAP. Differences may also arise related to definitional differences of sustaining versus development capital activities based upon each company’s internal policies.
Total All-in cost excludes income tax, costs associated with merger and acquisition activities, working capital, impairments, financing costs, one-time severance charges and items needed to normalise earnings.
All-in cost is made up of All-in sustaining cost, being the cost to sustain current operations, given as a sub-total in the All-in cost calculation, together with corporate and major capital expenditure growth.
For a reconciliation of operating costs to All-in cost, see Annual Financial Report–Overview–Management’s discussion and analysis of the financial statements–2015 financial performance compared with 2014 and 2013–Cost of sales–All-in cost.
3 All-in cost margin is defined as revenue minus All-in cost divided by revenue.
4 The selected historical consolidated financial data set out above have been derived from Sibanye’s consolidated financial statements for those periods and as of those dates which have been prepared in accordance with IFRS.
5 Borrowings of R1,995 million that have recourse to Sibanye excludes the Burnstone Debt. Borrowings also exclude related-party loans.
6 Earnings before interest, taxes, depreciation and amortisation (EBITDA) is defined as net operating profit before depreciation and amortisation. EBITDA may not be comparable to similarly titled measures of other companies. Management believes that EBITDA is used by investors and analysts to evaluate companies in the mining industry. EBITDA is not a measure of performance under IFRS and should be considered in addition to, and not as a substitute for, other measures of financial performance and liquidity reported in accordance with IFRS.
7 Net debt represents borrowings and bank overdraft less cash and cash equivalents. Borrowings are only those borrowings that have recourse to Sibanye and therefore exclude the Burnstone Debt. Borrowings also exclude related-party loans. Net debt excludes Burnstone cash and cash equivalents.
8 Net debt to EBITDA ratio is defined as net debt as at the end of a reporting period divided by EBITDA of the last 12 months ending on the same reporting date.
9 The average exchange rate during the relevant period as reported by I-Net Bridge. The average exchange rate for the period through 14 March 2016 was R15.39/US$. The following table sets forth the high and low exchange rates for each month during the previous six months.
| | |
Month ended | High | Low |
30 September 2015 | 14.05 | 13.27 |
31 October 2015 | 13.92 | 13.04 |
30 November 2015 | 14.43 | 13.76 |
31 December 2015 | 15.88 | 14.35 |
31 January 2016 | 16.85 | 15.52 |
29 February 2016 | 16.33 | 15.18 |
Through 14 March 2016 | 15.59 | 15.21 |
10 The closing exchange rate at period end. The closing exchange on 14 March 2015, as reported by I-Net Bridge, was R15.52/US$. Fluctuations in the exchange rate between the rand and the US dollar will affect the US dollar equivalent of the price of the ordinary shares on the JSE, which may affect the market price of the ADRs on the NYSE. These fluctuations will also affect the US dollar amounts received by owners of ADRs on the conversion of any dividends paid in rand on the ordinary shares.
11 Sibanye was previously a wholly owned subsidiary of Gold Fields Limited (Gold Fields). The Company separated from Gold Fields in February 2013 to become an independent and publicly traded company.
| |
Sibanye Gold Annual Financial Report 2015 | 77 |
The following discussion and analysis should be read together with Sibanye’s consolidated financial statements including the notes, which appear elsewhere in this annual financial report. Certain information contained in the discussion and analysis set forth below includes forward-looking statements that involve risks and uncertainties. See Annual Financial Report–About Sibanye’s reports–Forward-looking statements for a discussion of important factors that could cause actual results to differ materially from the results described in or implied by the forward-looking statements contained in this annual financial report.
INTRODUCTION
Sibanye is an independent, South African domiciled and focused mining group, which currently owns and operates high-quality gold and uranium operations and projects throughout the Witwatersrand Basin. The Group currently owns and operates four underground and surface gold operations, Driefontein, Kloof and Cooke in the West Witwatersrand region and Beatrix in the southern Free State province. In addition to its mining activities, the Group owns and manages significant extraction and processing facilities at its operations, where gold-bearing ore is treated and processed to produce gold doré.
Sibanye is the largest producer of gold in South Africa and one of the 10 largest globally, based on annual production in 2015.
In line with Sibanye’s strategy to create value for stakeholders and enhance or sustain its dividend, it entered into two separate transactions to acquire the platinum assets of Anglo American Platinum Limited’s Rustenburg Operations and Aquarius Platinum Limited (Aquarius) in 2015. These transactions are expected to be finalised during the course of 2016.
In 2015, Sibanye produced 47,775kg (1.54Moz) (2014: 49,432kg (1.59Moz) and 2013: 44,474kg (1.43Moz)) of gold at an average All-in cost of R430,746/kg (US$1,051/oz) (2014: R375,854/kg (US$1,080/oz) and 2013: R354,376/kg (US$1,148/oz)) and invested R3,345 million (2014: R3,251 million and 2013: R2,902 million) in capital.
In 2015, Sibanye had an operating margin of 28% (2014: 34% and 2013: 38%) and an All-in cost margin of 9% (2014: 15% and 2013: 18%). During the year, Sibanye generated free cash flow of R829 million (2014: R1,807 million and 2013: R3,731 million) and recognised profit of R538 million (2014: R1,507 million and 2013: R1,698 million), of which R717 million (2014: R1,552 million and 2013: R1,692 million) is attributable to the owners of Sibanye.
At 31 December 2015, Sibanye had gold mineral reserves of 31.0Moz (2014: 28.4Moz and 2013: 19.7Moz) and uranium mineral reserves of 113.8Mlb (2014: 102.5Mlb and 2013: 43.2Mlb).
The following financial review provides stakeholders with greater insight into the financial performance and position of the Group during the periods indicated. Sibanye’s primary financial focuses are to reduce costs, increase cash generation and to reward shareholders with sustainable dividends.
FACTORS AFFECTING SIBANYE’s PERFORMANCE
GOLD PRICE
Sibanye’s revenues are primarily derived from the sale of the gold that it produces. Sibanye does not generally enter into forward sales, commodity derivatives or other hedging arrangements in order to establish a price in advance of the sale of its gold production. As a result it is normally fully exposed to changes in the gold price. Gold hedging could however be considered under one or more of the following circumstances: to protect cash flows at times of significant capital expenditures; financing projects; or to safeguard the viability of higher cost operations, see note 33: Risk management activities to the consolidated financial statements.
The market price of gold has historically been volatile and is affected by numerous factors over which Sibanye has no control, such as general supply and demand, speculative trading activity and global economic drivers. Further, over the period from 2013 to 2015, the gold price has declined from an average price of US$1,409/oz to US$1,159/oz. Should the gold price decline below Sibanye’s unit production cost the Group may experience losses and, should this situation remain for an extended period, Sibanye may be forced to curtail or suspend some or all of its projects, operations and/or reduce operational capital expenditure. Sibanye might not be able to recover any losses incurred during, or after, such events. A sustained period of significant gold price volatility may also adversely affect Sibanye’s ability to evaluate the feasibility of undertaking new capital projects or continuing existing operations or to make other long-term strategic decisions.
The volatility of, and recent decline in, the price of gold is illustrated in the gold price table below (which shows the annual high, low and average of the London afternoon fixing price of gold).
| |
Sibanye Gold Annual Financial Report 2015 | 78 |
Table of Contents
MANAGEMENT'S DISCUSSION AND ANALYSIS OF THE FINANCIAL STATEMENTS continued
| US$/oz1 |
Gold | High | Low | Average |
2011 | 1,895 | 1,319 | 1,571 |
2012 | 1,792 | 1,540 | 1,669 |
2013 | 1,694 | 1,192 | 1,409 |
2014 | 1,385 | 1,142 | 1,265 |
2015 | 1,296 | 1,049 | 1,159 |
2016 (through 14 March 2016) | 1,278 | 1,077 | 1,171 |
1 Rounded to the nearest US dollar
On 14 March 2016, the London afternoon fixing price of gold was US$1,243/oz.
EXCHANGE RATE
Sibanye’s operations are all located in South Africa and its revenues are equally sensitive to changes in the US dollar gold price and the rand/US dollar exchange rate (the exchange rate). Depreciation of the rand against the US dollar results in Sibanye’s revenues and operating margins increasing. Conversely, should the rand appreciate against the US dollar, revenues and operating margins would decrease. The impact on profitability of any change in the exchange rate can be substantial. Furthermore, the exchange rates obtained when converting US dollars to rand are set by foreign exchange markets, over which Sibanye has no control. The relationship between currencies and commodities, which includes the gold price, is complex and changes in exchange rates can influence commodity prices and vice versa.
As a general rule, Sibanye does not enter into long-term currency hedging arrangements and is exposed to the spot market exchange rate. Sibanye’s operating costs are primarily denominated in rand and forward cover could be considered for significant expenditures based in foreign currency or those items which have long lead times to production or delivery. No foreign exchange hedging contracts were entered into in 2015.
COSTS
Sibanye’s operating costs (being cost of sales less amortisation and depreciation) comprise mainly labour and contractor costs, power and water, and consumable stores which include, inter alia, explosives, timber, cyanide and other consumables. Sibanye expects that its operating costs, particularly the input costs noted above, are likely to continue to increase in the near future and will be driven by inflation, general economic trends, market dynamics and other regulatory changes. In order to restrict these cost inputs, there is a continuous restructuring programme throughout the Group to improve efficiencies and productivity. Cost saving initiatives, especially with reference to reducing the impact of electricity consumption, have been specifically successful.
The South African inflation rate or Consumer Price Index (CPI) was 4.6% in 2015 (2014: 6.1% and 2013: 5.7%). Mining inflation has historically been higher than CPI driven by above inflation wage increases and more recently increases in electricity tariffs, which increased 12.69% effective 1 April 2015.
Sibanye’s operations are labour intensive. Labour represented 45%, 47% and 51% of operating costs during 2015, 2014 and 2013, respectively.
On 22 October 2015, Sibanye signed a three-year wage agreement with the National Union of Mineworkers (NUM), Solidarity and UASA. The Association of Mineworkers and Construction Union (AMCU) rejected, and continue to reject, all offers made. However, effective from 1 July 2015, all employees have received the wage increase and additional benefits, as agreed to by the majority of unions and no other agreement will now be considered. The average increase over the three years is expected to be around 6.7% per annum.
Despite above inflation increases in electricity tariffs, power and water comprised 19% of operating costs in 2015, 2014 and 2013. During 2013 Eskom applied to the National Energy Regulator of South Africa for an average annual tariff increase of 16% for a five-year period as of 1 April 2013, of which an increase of 8% was approved. However, in addition to the 8%, a further increase of 4.69% was approved effective from 1 April 2015 and further increases are expected in the future to meet the growing cost of the service provider, Eskom.
The effect of the abovementioned increases, especially being above the average inflation rate, has adversely affected and, may continue to adversely affect, the profitability of Sibanye’s operations. Further, Sibanye’s operating costs are primarily denominated in rand, while revenues from gold sales are in US dollars. Generally when inflation is high the rand tends to devalue, thereby increasing rand revenues, and potentially offsetting any increase in costs. However, there can be no guarantee that any cost saving measures or the effects of any potential devaluation will offset the effects of increased inflation and production costs.
| |
Sibanye Gold Annual Financial Report 2015 | 79 |
Table of Contents
MANAGEMENT'S DISCUSSION AND ANALYSIS OF THE FINANCIAL STATEMENTS continued
PRODUCTION
Sibanye’s revenues are driven by its production levels and the price it realises from the sale of gold, as discussed above. Production can be affected by a number of factors including industrial action, safety related work stoppages, mining grades and other mining related incidents. These factors could have an impact on production levels in the future.
In recent years, the South African mining industry has experienced increased union unrest. The entry of new unions such as AMCU, which has become a significant rival to the traditionally dominant NUM, has resulted in more frequent industrial disputes, including violent protests, intra-union violence and clashes with police authorities. During 2013, 2014 and 2015 Sibanye experienced very little disruption to production as a result of industrial action. Currently AMCU retains a certificate of non-resolution with respect to the 2015 wage agreement mentioned above, which allows the union to proceed on protected strike action at certain of the Sibanye workplaces on 48 hours’ notice, the indication amongst our employees is that there is limited appetite to embark on strike action. Should AMCU leadership serve the company with a strike notice, Sibanye is ready to implement carefully considered plans to limit losses during a strike. Sibanye is continually working to improve relations with its employees and unions to hopefully prevent any future production losses.
Sibanye’s operations are also subject to South African health and safety laws and regulations that impose various duties on Sibanye’s mines while granting the authorities’ powers to, among other things, close or suspend operations and order corrective action relating to health and safety matters. During 2015, Sibanye’s operations experienced 109 work stoppages (2014: 77 and 2013: 55).
Sibanye’s gold operations are in their mature life stage and have encountered lower mining grades and yields.
Sibanye’s key focus is to maintain profitable operations and sustain current production levels for a longer period than had previously been envisaged, through an increased focus on productivity. Furthermore, focus will be on realising the extensive reserves and resources potential that still exists.
ROYALTIES AND MINING TAX
South African mining operations pay a royalty tax. The formula for calculating royalties takes into account the profitability of individual operations. The royalty formula is detailed in note 8.1: Royalties to the consolidated financial statements.
Under South African tax legislation, gold mining companies and non-gold mining companies are taxed at different rates. Sibanye’s operations are subject to the gold tax formula on their respective mining incomes. The formula calculating tax payable, which is detailed in note 8.2: Mining and income tax to the consolidated financial statements, is affected by the profitability of the applicable mining operation. In addition, these operations are ring fenced, so each operation is taxed separately and, as a result, taxable losses and capital expenditure at one of the operations cannot be used to reduce taxable income from another operation. Depending on the profitability of the operations, the tax rate can vary significantly from year to year.
CAPITAL EXPENDITURE
Sibanye will continue to invest capital in new and existing infrastructure and possible growth opportunities. Therefore, management will be required to consider, on an ongoing basis, the capital expenditure necessary to achieve its sustainable production objectives against other demands on cash.
As part of its strategy, Sibanye may investigate the potential exploitation of mineralisation below its current infrastructure limits as well as other capital-intensive projects. Management expects that Sibanye’s dividend policy will not, however, be affected by its capital expenditure.
In 2015, Sibanye’s total capital expenditure was R3,345 million (2014: R3,251 million and 2013: R2,902 million). Sibanye expects to spend approximately R4.0 billion on capital in 2016, excluding any acquisitions.
The actual amount of capital expenditure will depend on a number of factors, such as production volumes, the price of gold and general economic conditions and may differ from the amount forecast above. Some of these factors are outside of the control of Sibanye.
ACQUISITIONS
PLATINUM ACQUISITIONS
On 9 September 2015 Sibanye announced that it entered into an agreement with Rustenburg Platinum Mines Limited (RPM), a wholly owned subsidiary of Anglo American Platinum Limited (Anglo American Platinum) to acquire the Bathopele, Siphumelele (including Khomanani), and Thembelani (including Khuseleka) mining operations, two concentrating plants, an on-site chrome
| |
Sibanye Gold Annual Financial Report 2015 | 80 |
Table of Contents
MANAGEMENT'S DISCUSSION AND ANALYSIS OF THE FINANCIAL STATEMENTS continued
recovery plant, the Western Limb Tailings Retreatment Plant, associated surface infrastructure and related assets and liabilities on a going concern basis (the Rustenburg Operations) (the Rustenburg Operations Transaction).
The purchase consideration comprises an upfront payment of R1.5 billion in cash or shares at the closing of the Rustenburg Operation Transaction (Closing) and a deferred payment calculated as being equal to 35% of the distributable free cash flow generated by the Rustenburg Operations over a six year period from the later of Closing or 1 January 2017 (Deferred Payment), subject to a minimum nominal payment of R3.0 billion. In addition to the Deferred Payment, which allows for a favourably extended payment period; should, the Rustenburg Operations generate negative distributable free cash flows in either 2016, 2017 or 2018, RPM will be required to pay up to R267 million per annum to ensure that the free cash flow for the relevant year is equal to zero.
On 18 January 2016 at the shareholders meeting of Sibanye, the Sibanye shareholders approved the proposed Rustenburg Operations Transaction by voting in favour of the various resolutions to give effect to the Rustenburg Operations Transaction.
The Rustenburg Operations Transaction is still subject to the fulfilment of the following condition precedent, among others, and is likely to be concluded during the second half of 2016:
| · | | the granting on or before 30 June 2017 of consent in terms of section 11 of the Mineral and Petroleum Resources Development Act for the transfer of the mining right and prospecting right pursuant to the Rustenburg Operations Transaction. |
On 6 October 2015 Sibanye announced a cash offer of US$0.195 per share for the entire issued share capital of Aquarius (the Aquarius Transaction and, together with the Rustenburg Transaction, the Acquisitions). Aquarius owns stakes in the Kroondal mine and Platinum Mile retreatment facilities near Rustenburg in South Africa and the Mimosa joint venture with Impala Platinum in Zimbabwe.
On 18 January 2016 at the special general meeting of Aquarius, the requisite majority of Aquarius shareholders approved the transaction, whereby Sibanye will acquire all of the shares of Aquarius. The implementation of the Aquarius Transaction remains subject to final conditions precedent, and is likely to be concluded before the end of April 2016.
Assuming that Sibanye completes one or both Acquisitions, Sibanye intends to restructure its operations into two operating divisions, being a gold and uranium operation (division) and a platinum operation (division). If Sibanye completes one or both Acquisitions, it will be exposed to the platinum market and the following factors may affect its performance:
Platinum price
Assuming that Sibanye completes the Acquisitions, Sibanye’s revenues will be primarily derived from the sale of the gold and PGMs that it will produce. Sibanye does not expect to enter into forward sales, commodity derivatives or other hedging arrangements with respect to PGMs. As a result it expects to be fully exposed to changes in PGM prices. PGM hedging could however be considered in the future under one or more of the following circumstances: to protect cash flows at times of significant capital expenditures; financing projects; or to safeguard the viability of higher cost operations.
Historically, platinum, palladium and rhodium prices have been subject to wide fluctuations and are affected by numerous factors beyond Sibanye’s control, including international macroeconomic conditions and outlook, levels of supply and/or demand, any actual or potential threats to the stability of supply and/or demand, inventory levels maintained by users and producers, actions of participants in the commodities markets and currency exchange rates, particularly the rand to the US dollar. Further, between 2013 and 2015, the average PGM (4E) basket price has decreased from US$1,196/oz to US$928/oz.
In addition, the introduction of platinum, palladium and rhodium exchange-traded funds (ETFs) have added a further element of unpredictability and volatility to the pricing environment and may increase volatility in PGM prices, as investors may purchase shares in ETFs at times of rising prices, adding to the upward pressure on prices, and sell during periods of falling prices, potentially increasing the fall in prices. The market prices of platinum, palladium, rhodium and other PGMs have been, and may in the future be, subject to rapid short-term changes.
Exchange rates
Like Sibanye’s gold operations, the Rustenburg Operations and the mines owned by Aquarius (with the exception of Mimosa) are all located in South Africa and management expects that their revenues will be equally sensitive to changes in the dollar PGM (4E) basket price and the rand/US dollar exchange rate. See –Factors Affecting Our Performance–Exchange Rate.
Costs
The cash cost of the platinum operations are composed principally of labour; stores; electricity, water and other utilities; and contractors and other costs. Sibanye expects that these operating costs are likely to continue to increase in the near future and will be driven by inflation, general economic trends, market dynamics and other regulatory changes, similar to such costs in the gold mining industry. Whereas Sibanye’s gold operations have a significant component of cash cost from power related charges, with electricity making up 18% of the gold division’s cash cost base, the platinum Acquisitions are far less power intensive in absolute terms. This is largely due to the Acquisitions only producing PGM in concentrate, thereby avoiding power intensive PGM smelting and refining processes, and Sibanye will not beneficiate the PGMs (and associated base metals) as part of these Acquisitions.
| |
Sibanye Gold Annual Financial Report 2015 | 81 |
Table of Contents
MANAGEMENT'S DISCUSSION AND ANALYSIS OF THE FINANCIAL STATEMENTS continued
Labour comprises the largest component of the Acquisition cash costs, accounting for in excess of 50%, while electricity costs amount to less than 10% of underlying platinum cash costs. Given similarities in the mining method employed across the gold and platinum divisions, the remainder of the cash cost base is driven by similar cost components.
Production
Assuming that Sibanye completes the Acquisitions, the revenues of the platinum operations will be driven by the production levels of, and prices realised from, the PGMs and associated co- and by-products. Production can be affected by a number of factors including industrial action, safety related work stoppages, mining grades and other mining related incidents. These factors could have an impact on production levels in the future.
In recent years, the South African mining industry has experienced greater union unrest. The entry of new unions such as AMCU, which has become a significant rival to the traditionally dominant NUM, has resulted in more frequent industrial disputes, including violent protests, intra-union violence and clashes with police authorities. In the first half of 2014, the South African platinum majors experienced a five month wage strike, impacting among others the South African operations to be acquired by Sibanye as part of the Rustenburg Acquisition.
The South African platinum operations are also subject to South African health and safety laws and regulations that impose various duties on these operations while granting the authorities’ powers to, among other things, close or suspend operations and order corrective action relating to health and safety matters.
These platinum operations are at steady state production levels.
WITS GOLD, COOKE ANE BURNSTONE ACQUISITIONS
On 21 August 2013, Sibanye entered into an agreement with Gold One to acquire the Cooke operations. On 11 December 2013, Sibanye made an offer to acquire 100% of Witwatersrand Consolidated Gold Resources Ltd (Wits Gold). On 5 July 2013, Wits Gold had submitted a final binding offer to the business rescue practitioner of Sibanye Gold Eastern Operations Proprietary Limited (SGEO) (previously Southgold Exploration Proprietary Limited) to acquire SGEO, the sole owner of the Burnstone operation, which was included in the business rescue plan and approved by the creditors of SGEO on 11 July 2013.
The acquisitions of Wits Gold, Cooke and Burnstone were completed on 14 April 2014, 15 May 2014 and 1 July 2014, respectively.
Results of Wits Gold, Cooke and Burnstone are presented for the eight, seven and six months ended 31 December 2014, respectively, following the completion of the acquisitions.
ACQUISITION COSTS
Sibanye incurred R26 million in acquisition related costs in 2015, R112 million in 2014 and R9 million in 2013. Sibanye expects that it will continue to incur costs related to the acquisition and integration of the operations listed above in the future.
Sibanye has pursued and may continue to pursue growth opportunities that allow it to leverage its existing processing capacity and infrastructure and to extend its operating life. Such growth may continue to occur through the acquisition of other companies and assets, development projects, or by entering into joint ventures. Sibanye may incur acquisition and integration related costs with regard to any operations or entities that it acquires or seeks to acquire in the future.
2015 FINANCIAL PERFORMANCE COMPARED WITH 2014 and 2013
Group profit decreased by 64% to R538 million in 2015 from R1,507 million in 2014 (2013: R1,698 million). The reasons for this decrease are discussed below.
The primary factors explaining the movements in net profit are set out in the table below.
| |
Sibanye Gold Annual Financial Report 2015 | 82 |
Table of Contents
MANAGEMENT'S DISCUSSION AND ANALYSIS OF THE FINANCIAL STATEMENTS continued
| | | | | |
Rand million except as otherwise stated | 2015 | 2014 | % change 2015/2014 | 2013 | % change 2014/2013 |
Revenue | 22,717 | 21,781 | 4 | 19,331 | 13 |
Cost of sales | (20,017) | (17,566) | (14) | (15,077) | (17) |
Net operating profit | 2,700 | 4,215 | (36) | 4,254 | (1) |
Investment income | 257 | 183 | 40 | 160 | 14 |
Finance expense | (562) | (400) | (41) | (420) | 5 |
Share-based payments | (274) | (418) | 34 | (306) | (37) |
Share of results of equity-accounted investees after tax | 116 | (471) | 125 | 52 | (1,006) |
Loss on financial instruments | (230) | (108) | (113) | (5) | (2,060) |
(Loss)/gain on foreign exchange differences | (359) | (63) | (470) | 24 | (363) |
Net loss on derecognition of financial guarantee asset and liability | (158) | – | (100) | – | – |
Impairments | – | (275) | 100 | (821) | 67 |
Reversal of impairment | – | 474 | (100) | – | 100 |
Transaction costs | (26) | (112) | 77 | (9) | (1,144) |
Restructuring costs | (105) | (160) | 34 | (439) | 64 |
Net other movements | (43) | (99) | 57 | (121) | 18 |
Profit before royalties and tax | 1,316 | 2,766 | (52) | 2,369 | 17 |
Royalties | (401) | (431) | 7 | (415) | (4) |
Profit before tax | 915 | 2,335 | (61) | 1,954 | 19 |
Mining and income tax | (377) | (828) | 54 | (256) | (223) |
Profit for the year | 538 | 1,507 | (64) | 1,698 | (11) |
REVENUE
Revenue increased by 4% to R22,717 million in 2015 from R21,781 million in 2014 driven by the average rand gold price, which increased by 8% partly offset by the level of gold produced and sold, which decreased by 3%.
The decrease in the gold produced to 47,775kg in 2015 from 49,432kg in 2014 was mainly due to the cumulative impact of operational disruptions and underground fires at Kloof during the quarter ended 31 March 2015, as well as the disruptive effect of periodic load curtailments by the state utility, Eskom during the quarters ended 31 March and 30 June 2015. Productivity and cost trends improved throughout the remainder of the year but it was not possible to recoup the production lost earlier in the year. Gold production from the operations is shown in the graph below.
The increase in the average rand gold price was due to the 18% weaker rand of R12.75/US$ in 2015 compared with R10.82/US$ in 2014. However, this was partly offset by the decrease in the average realised US dollar gold price to US$1,160/oz in 2015 from US$1,267/oz in 2014.
Revenue increased by 13% to R21,781 million in 2014 from R19,331 million in 2013 driven by an increase of 11% in gold produced and sold, and an increase of 1% in the average rand gold price. The increase in the gold produced to 49,432kg in 2014 from 44,474kg in 2013 was mainly due to the acquisition and integration of Cooke for the seven months ended 31 December 2014. Gold production excluding Cooke was marginally higher at 45,127kg, despite the loss of over 500kg due to an underground fire at Driefontein early in 2014 and the intermittent loss of electricity (load shedding by the power supplier – Eskom) in the latter part of the year. The increase in the average rand gold price was due to the 13% weaker rand of R10.82/US$ in 2014 compared with R9.60/US$ in 2013. However, this was mostly offset by the decrease in the average realised US dollar gold price to US$1,267/oz in 2014 from US$1,408/oz in 2013.
| |
Sibanye Gold Annual Financial Report 2015 | 83 |
Table of Contents
MANAGEMENT'S DISCUSSION AND ANALYSIS OF THE FINANCIAL STATEMENTS continued
Gold produced (kg)
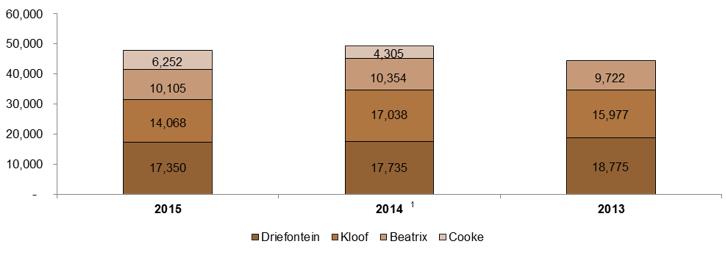
1 Includes production from Cooke for the seven months ended 31 December 2014.
COST OF SALES
Cost of sales, which consist of operating costs and amortisation and depreciation, increased by 14% to R20,017 million in 2015 from R17,566 million in 2014, with the incorporation of Cooke for 12 months (compared with seven months in 2014) which accounted for R1,682 million of this increase. Cost of sales increased by 17% to R17,566 million in 2014 from R15,077 million in 2013, with the incorporation of Cooke which accounted for R2,001 million of this increase.
The primary drivers of cost of sales are set out in the table below.
Rand million except as otherwise stated | 2015 | 2014 | % change 2015/2014 | 2013 | % change 2014/2013 |
Salaries and wages | 7,345 | 6,665 | (10) | 6,156 | (8) |
Consumable stores | 3,996 | 3,481 | (15) | 2,721 | (28) |
Utilities | 3,128 | 2,753 | (14) | 2,315 | (19) |
Mine contracts | 1,458 | 1,136 | (28) | 928 | (22) |
Other | 2,758 | 2,403 | (15) | 1,736 | (38) |
Ore reserve development (ORD) costs capitalised | (2,305) | (2,127) | (8) | (1,883) | (13) |
Operating costs | 16,380 | 14,311 | (14) | 11,973 | (20) |
– Driefontein, Kloof and Beatrix | 13,402 | 12,618 | (6) | 11,973 | (5) |
– Cooke | 2,978 | 1,693 | (76) | – | (100) |
Amortisation and depreciation | 3,637 | 3,255 | (12) | 3,104 | 5 |
– Driefontein, Kloof and Beatrix | 2,932 | 2,947 | 1 | 3,104 | 5 |
– Cooke | 705 | 308 | (129) | – | (100) |
Total cost of sales | 20,017 | 17,566 | (14) | 15,077 | (17) |
– Driefontein, Kloof and Beatrix | 16,334 | 15,565 | (5) | 15,077 | (3) |
– Cooke | 3,683 | 2,001 | (84) | – | (100) |
The analysis that follows provides a more detailed discussion of cost of sales, together with the total cash cost, All-in sustaining cost and All-in cost.
OPERATING COSTS – COST OF SALES LESS AMORTISATION AND DEPRECIATION
Operating costs increased by 14% to R16,380 million in 2015 from R14,311 million in 2014, or just over 6% excluding Cooke, and increased by 20% in 2014 from R11,973 million in 2013, or just over 5% excluding Cooke. The increase in operating costs excluding Cooke in 2015 was due to above inflation wage increases, increased electricity tariffs, increased maintenance costs and inflationary increases in consumable stores, as well as additional crews to improve productivity. These increases were partly offset by ongoing cost-saving initiatives, which included further restructuring across the group – including reduced number of contractors, improved efficiencies and programmes aimed at reducing electricity costs.
| |
Sibanye Gold Annual Financial Report 2015 | 84 |
Table of Contents
MANAGEMENT'S DISCUSSION AND ANALYSIS OF THE FINANCIAL STATEMENTS continued
The increase in operating costs excluding Cooke in 2014 was due to above inflation wage increases, increased electricity tariffs and costs associated with the increased production, such as consumable stores and bonuses. These increases were partly offset by cost-saving initiatives implemented in 2013, which continued in 2014. The increase in the ORD costs capitalised was mainly due to an increase in capitalised development at the Beatrix West Section of R77 million and the inclusion of Cooke.
The table below presents a reconciliation from cost of sales to total cash cost.
| | | | | | | |
| | 2015 |
Rand million except as otherwise stated | | Group | Driefontein | Kloof | Beatrix | Cooke | Corporate |
Cost of sales per income statement | | 20,017 | 6,377 | 5,806 | 4,130 | 3,683 | 21 |
Deduct: Amortisation and depreciation | | (3,637) | (1,143) | (1,029) | (739) | (705) | (21) |
Operating costs | | 16,380 | 5,234 | 4,777 | 3,391 | 2,978 | – |
Adjusted for: | | | | | | | |
General and admin costs | | (174) | (57) | (53) | (36) | (28) | – |
Royalties1 | | 401 | 197 | 98 | 89 | 17 | – |
Total cash cost | | 16,607 | 5,374 | 4,822 | 3,444 | 2,967 | – |
Gold sold | kg | 47,775 | 17,350 | 14,068 | 10,105 | 6,252 | |
| ‘000oz | 1,536.0 | 557.8 | 452.3 | 324.9 | 201.0 | |
Total cash cost2 | R/kg | 347,613 | 309,764 | 342,764 | 340,792 | 474,584 | |
| US$/oz | 848 | 756 | 836 | 831 | 1,158 | |
| | | | | | | |
| | | | | | | |
| | 2014 |
Rand million except as otherwise stated | | Group | Driefontein | Kloof | Beatrix | Cooke | Corporate |
Cost of sales per income statement | | 17,566 | 6,041 | 5,824 | 3,673 | 2,001 | 27 |
Deduct: Amortisation and depreciation | | (3,255) | (1,129) | (1,322) | (469) | (308) | (27) |
Operating costs | | 14,311 | 4,912 | 4,502 | 3,204 | 1,693 | – |
Adjusted for: | | | | | | | |
General and admin costs | | (147) | (56) | (55) | (36) | – | – |
Royalties1 | | 431 | 166 | 175 | 82 | 8 | – |
Total cash cost | | 14,595 | 5,022 | 4,622 | 3,250 | 1,701 | – |
Gold sold | kg | 49,432 | 17,735 | 17,038 | 10,354 | 4,305 | |
| ‘000oz | 1,589.3 | 570.2 | 547.8 | 332.9 | 138.4 | |
Total cash cost2 | R/kg | 295,246 | 283,129 | 271,282 | 313,888 | 395,168 | |
| US$/oz | 849 | 814 | 780 | 902 | 1,136 | |
| | | | | | | |
| | 2013 |
Rand million except as otherwise stated | | Group | Driefontein | Kloof | Beatrix | Corporate |
Cost of sales per income statement | | 15,077 | 6,339 | 5,198 | 3,519 | 21 |
Deduct: Amortisation and depreciation | | (3,104) | (1,458) | (1,097) | (528) | (21) |
Operating costs | | 11,973 | 4,881 | 4,101 | 2,991 | – |
Adjusted for: | | | | | | |
General and admin costs | | (234) | (85) | (69) | (80) | – |
Royalties1 | | 415 | 199 | 147 | 69 | – |
Total cash cost | | 12,154 | 4,995 | 4,179 | 2,980 | – |
Gold sold | kg | 44,474 | 18,775 | 15,977 | 9,722 | |
| ‘000oz | 1,429.9 | 603.6 | 513.7 | 312.6 | |
Total cash cost2 | R/kg | 273,281 | 265,997 | 261,570 | 306,593 | |
| US$/oz | 885 | 862 | 847 | 993 | |
The average exchange rate for the year ended 31 December 2015 was R12.75/US$ (2014: R10.82/US$ and 2013: R9.60/US$).
1 Royalties are included as part of total cash cost but are reflected below operating profit in profit or loss.
2 For information on how Sibanye has calculated total cash cost per kilogram and total cash cost per ounce, see Annual Financial Report–Overview–Five year financial performance.
Total cash cost per kilogram increased by 18% to an average of R347,613/kg in 2015 from R295,246/kg in 2014, and increased by 8% in 2014 from R273,281/kg in 2013. The increase in 2015 was mostly due to the 3% decrease in production and an increase in unit costs at Cooke. In US dollar terms, total cash cost per ounce decreased marginally to US$848/oz from US$849/oz primarily due to the 18% weaker rand/US dollar exchange rate partly offset by the decrease in production and increase in unit costs at Cooke mentioned above.
| |
Sibanye Gold Annual Financial Report 2015 | 85 |
Table of Contents
MANAGEMENT'S DISCUSSION AND ANALYSIS OF THE FINANCIAL STATEMENTS continued
The increase in total cash cost per kilogram in 2014 was mostly due to the inclusion of Cooke, which operated at an average unit cost of R395,168/kg for the seven months since incorporation. In US dollar terms, total cash cost per ounce decreased by 4% to US$849/oz from US$885/oz due to the 13% weaker rand/US dollar exchange rate partly offset by the inclusion of Cooke.
AMORTISATION AND DEPRECIATION
Amortisation and depreciation increased by 12% to R3,637 million in 2015 from R3,255 million in 2014, and increased by 5% in 2014 from R3,104 million in 2013. The increase in 2015 was due to the inclusion of Cooke for 12 months, which added R397 million, and amortisation and depreciation at Beatrix, which increased by R270 million due to accelerated depreciation of 2 shaft of R65 million and an increase in the mine’s overall rate of depreciation due to the reversal of the R474 million impairment at the West Section late in 2014. These increases were partly offset by a decrease in amortisation and depreciation at Kloof due to the lower production in 2015 and a reduction stemming from the impairment of the Python plant in 2014.
The increase in 2014 was due to the inclusion of Cooke, which added R308 million, and the increase in production at Kloof, adding R225 million. This was partly offset by a decrease of R329 million at Driefontein due to an increase in reserves on which the amortisation calculation is based, and R59 million at Beatrix as no amortisation occurred at the West Section during 2014, as this section was impaired in mid-2013.
ALL-IN COST
All-in cost per ounce, was introduced in 2013 by the members of the World Gold Council. Sibanye has adopted the principle prescribed by the Council. This non-GAAP measure provides more transparency into the total costs associated with gold mining.
The All-in cost per ounce metric provides relevant information to investors, governments, local communities and other stakeholders in understanding the economics of gold mining. This is especially true with reference to capital expenditure associated with developing and maintaining gold mines, which has increased significantly in recent years and is reflected in this new metric.
Total All-in cost excludes income tax, costs associated with merger and acquisition activities, working capital, impairments, financing costs, one-time severance charges and items needed to normalise earnings.
All-in cost is made up of All-in sustaining cost, being the cost to sustain current operations, given as a sub-total in the All-in cost calculation, together with corporate and major capital expenditure associated with growth.
The table below presents a reconciliation from operating costs to All-in sustaining cost and All-in cost.
| | | | | | | |
| | 2015 |
Rand million except as otherwise stated | | Group | Driefontein | Kloof | Beatrix | Cooke | Corporate |
Operating costs | | 16,380 | 5,234 | 4,777 | 3,391 | 2,978 | – |
Plus: | | | | | | | |
Community costs1 | | 41 | 14 | 9 | 15 | 3 | – |
Share-based payments2 | | 274 | 35 | 27 | 24 | – | 188 |
Royalties3 | | 401 | 197 | 98 | 89 | 17 | – |
Rehabilitation4 | | 138 | 23 | 23 | 17 | 75 | – |
ORD5 | | 2,305 | 727 | 841 | 510 | 227 | – |
Sustaining capital expenditure6 | | 654 | 249 | 226 | 86 | 93 | – |
On-mine exploration | | 18 | 14 | 1 | 1 | 2 | – |
Less: | | | | | | | |
By-product credit7 | | (27) | (8) | (6) | (6) | (7) | – |
All-in sustaining cost | | 20,184 | 6,485 | 5,996 | 4,127 | 3,388 | 188 |
Plus: | | | | | | | |
Group exploration and other | | 9 | – | – | – | – | 9 |
Corporate cost and growth capital | | 386 | 18 | 64 | – | 17 | 287 |
All-in cost | | 20,579 | 6,503 | 6,060 | 4,127 | 3,405 | 484 |
Gold sold | kg | 47,775 | 17,350 | 14,068 | 10,105 | 6,252 | |
| ‘000oz | 1,536.0 | 557.8 | 452.3 | 324.9 | 201.0 | |
All-in sustaining cost8 | R/kg | 422,472 | 373,752 | 426,223 | 408,422 | 541,843 | |
| US$/oz | 1,031 | 912 | 1,040 | 996 | 1,322 | |
All-in cost8 | R/kg | 430,746 | 374,790 | 430,751 | 408,422 | 544,658 | |
| US$/oz | 1,051 | 914 | 1,051 | 996 | 1,329 | |
| |
Sibanye Gold Annual Financial Report 2015 | 86 |
Table of Contents
MANAGEMENT'S DISCUSSION AND ANALYSIS OF THE FINANCIAL STATEMENTS continued
| | | | | | | |
| | 2014 |
Rand million except as otherwise stated | | Group | Driefontein | Kloof | Beatrix | Cooke | Corporate |
Operating costs | | 14,311 | 4,912 | 4,502 | 3,204 | 1,693 | – |
Plus: | | | | | | | |
Community costs1 | | 37 | 12 | 11 | 14 | – | – |
Share-based payments2 | | 418 | 69 | 58 | 46 | – | 245 |
Royalties3 | | 431 | 166 | 175 | 82 | 8 | – |
Rehabilitation4 | | 138 | 39 | 33 | 18 | 48 | – |
ORD5 | | 2,127 | 684 | 880 | 446 | 117 | – |
Sustaining capital expenditure6 | | 975 | 465 | 356 | 102 | 52 | – |
Less: | | | | | | | |
By-product credit7 | | (24) | (10) | (7) | (7) | – | – |
All-in sustaining cost | | 18,413 | 6,337 | 6,008 | 3,905 | 1,918 | 245 |
Plus: | | | | | | | |
Group exploration and other | | 16 | – | – | 9 | 6 | 1 |
Corporate cost and growth capital | | 150 | – | – | – | 61 | 89 |
All-in cost | | 18,579 | 6,337 | 6,008 | 3,914 | 1,985 | 335 |
Gold sold | kg | 49,432 | 17,735 | 17,038 | 10,354 | 4,305 | |
| ‘000oz | 1,589.3 | 570.2 | 547.8 | 332.9 | 138.4 | |
All-in sustaining cost8 | R/kg | 372,492 | 357,333 | 352,624 | 377,101 | 445,645 | |
| US$/oz | 1,071 | 1,027 | 1,014 | 1,084 | 1,281 | |
All-in cost8 | R/kg | 375,854 | 357,333 | 352,624 | 378,008 | 461,045 | |
| US$/oz | 1,080 | 1,027 | 1,014 | 1,087 | 1,325 | |
| | | | | | |
| | 2013 |
Rand million except as otherwise stated | | Group | Driefontein | Kloof | Beatrix | Corporate |
Operating costs | | 11,973 | 4,881 | 4,101 | 2,991 | – |
Plus: | | | | | | |
Community costs1 | | 24 | 9 | 8 | 7 | – |
Share-based payments2 | | 306 | 61 | 47 | 42 | 156 |
Royalties3 | | 415 | 199 | 147 | 69 | – |
Rehabilitation4 | | 165 | 84 | 54 | 27 | – |
ORD5 | | 1,883 | 703 | 844 | 336 | – |
Sustaining capital expenditure6 | | 1,018 | 319 | 460 | 201 | 38 |
Less: | | | | | | |
By-product credit7 | | (23) | (10) | (7) | (6) | – |
All-in sustaining cost | | 15,761 | 6,246 | 5,654 | 3,667 | 194 |
Plus: | | | | | | |
Group exploration and other | | – | – | – | – | – |
Corporate cost and growth capital | | – | – | – | – | – |
All-in cost | | 15,761 | 6,246 | 5,654 | 3,667 | 194 |
Gold sold | kg | 44,474 | 18,775 | 15,977 | 9,722 | |
| ‘000oz | 1,429.9 | 603.6 | 513.7 | 312.6 | |
All-in sustaining cost8 | R/kg | 354,376 | 332,660 | 353,884 | 377,206 | |
| US$/oz | 1,148 | 1,078 | 1,147 | 1,222 | |
All-in cost8 | R/kg | 354,376 | 332,660 | 353,884 | 377,206 | |
| US$/oz | 1,148 | 1,078 | 1,147 | 1,222 | |
The average exchange rate for the year ended 31 December 2015 was R12.75/US$ (2014: R10.82/US$ and 2013: R9.60/US$).
1 Community costs includes costs related to community development.
2 Share-based payments includes share-based payments compensation cost to support Sibanye’s corporate structure not directly related to current gold production. Share-based payments are calculated based on the fair value at initial recognition and do not include the fair value adjustment of the cash-settled share-based payment liability to the reporting date fair value.
3 Royalties is the royalty on refined minerals payable to the South African government.
4 Rehabilitation includes the interest charge related to the environmental rehabilitation obligation and the amortisation of the related capitalised rehabilitation costs recorded as an asset. The interest charge related to the environmental rehabilitation obligation and the amortisation of the capitalised rehabilitation costs do not reflect annual cash outflows and are calculated in accordance with IFRS. The interest charge and amortisation reflect the periodic costs of rehabilitation associated with current gold production and are therefore included in the measure.
| |
Sibanye Gold Annual Financial Report 2015 | 87 |
Table of Contents
MANAGEMENT'S DISCUSSION AND ANALYSIS OF THE FINANCIAL STATEMENTS continued
5 ORD are those capital expenditures that allow access to reserves that are economically recoverable in the future, including, but not limited to, crosscuts, footwalls, return airways and box holes which will avail gold production or reserves.
6 Sustaining capital expenditure are those capital expenditures that are necessary to maintain current gold production and execute the current mine plan. Sustaining capital costs are relevant to the All-in cost metric as these are needed to maintain Sibanye’s current operations and provide improved transparency related to Sibanye’s ability to finance these expenditures.
7 By-product credit—The All-in cost metric is focused on the cost associated with producing and selling a kilogram of gold, and therefore the metric captures the benefit of mining other metals when gold is produced and sold. In determining the All-in cost, the costs associated with producing and selling a kilogram of gold is reduced by the benefit received from the sale of silver, recognised as product sales, which is extracted and processed along with the gold produced. This is relevant to the All-in cost metric as it aids in the investor’s analysis of the profitability of producing a kilogram of gold, without the need to consider multiple metal prices.
8 For information on how Sibanye has calculated All-in sustaining cost per kilogram, All-in sustaining cost per ounce, All-in cost per kilogram and All-in cost per ounce, see Annual Financial Report–Overview–Five year financial performance.
All-in sustaining cost, a sub-set of All-in cost increased by 13% to R422,472/kg (US$1,031/oz) in 2015 from R372,492/kg (US$1,071/oz) in 2014, and increased by 5% in 2014 from R354,376/kg (US$1,148/oz) in 2013. The increase in 2015 was as a result of the effect of fixed costs on the lower production at Driefontein and Beatrix but more significantly due to the 17% decrease at Kloof, together with increased labour costs and the increase in the electricity tariff, as well as the full year impact of higher cost Cooke production, which was 45% higher in 2015 than in 2014, primarily due to the fact that 2014 had only seven months of production. The increase in 2014 was as a result of the Cooke acquisition, which added unit costs of R445,645/kg (US$1,281/oz), together with the increased operating cost and increased ORD at Beatrix and Kloof.
All-in cost increased by 15% to R430,746/kg (US$1,051/oz) in 2015 from R375,854/kg (US$1,080/oz) in 2014, and increased by 6% in 2014 from R354,376/kg (US$1,148/oz) in 2013. The increase in 2015 included corporate expenditure of R287 million, which relates to capital expenditure at Burnstone of R272 million and corporate expenditure of R15 million. Included in the All-in cost for 2014 is corporate expenditure of R89 million, which predominately relates to capital expenditure at the newly acquired Burnstone mine of R72 million and exploration cost on the Beisa uranium project of R9 million.
NET OPERATING PROFIT
As a result of the factors discussed above, net operating profit decreased by 36% to R2,700 million in 2015 from R4,215 million in 2014 and decreased marginally in 2014 from R4,254 million in 2013.
INVESTMENT INCOME
Investment income increased by 40% to R257 million in 2015 from R183 million in 2014, and increased by 14% in 2014 from R160 million in 2013.
Included in investment income in 2015 was R135 million interest on funds invested in various interest bearing investments for the environmental rehabilitation obligations of the group (2014: R99 million and 2013: R85 million), R80 million interest on cash balances (2014: R68 million and 2013: R63 million), R5 million unwinding of the financial guarantee asset (2014: R15 million and 2013: R12 million) and R37 million interest on the loan to Rand Refinery Proprietary Limited (Rand Refinery) (2014: R1 million and 2013: Rnil).
The increase in interest income in 2015 was due to higher average cash balances and environmental rehabilitation obligation funds when compared with 2014, and interest at JIBAR plus a margin of 3.5% on the loan (of R385 million) to Rand Refinery (on 18 December 2014).
The increase in interest income in 2014 was due to the incorporation of Cooke, which added R15 million, and a higher balance of the environmental rehabilitation obligation funds when compared with 2013.
FINANCE EXPENSE
Finance expense increased by 41% to R562 million in 2015 from R400 million in 2014, and decreased by 5% in 2014 from R420 million in 2013. Included in finance expense in 2015 was R248 million interest on borrowings (2014: R188 million and 2013: R319 million), R102 million unwinding of the Burnstone Debt (2014: R43 million and 2013: Rnil), R198 million environmental rehabilitation liability accretion expense (2014: R162 million and 2013: R93 million), and R14 million sundry interest charges (2014: R7 million and 2013: R8 million).
The increase in interest on borrowings in 2015 was due to the increase in the average indebtedness and effective interest rate year-on-year. Sibanye’s average gross debt outstanding, excluding the Burnstone Debt, was approximately R2.2 billion in 2015 compared with approximately R2.0 billion in 2014. The increase in environmental rehabilitation liability accretion expense was primarily due to the incorporation of Cooke and Burnstone for 12 months, which added R25 million and new disturbances.
The decrease in interest on borrowings in 2014 was due to the decrease in the average indebtedness year-on-year. Sibanye’s debt outstanding during the first half of 2013 was approximately R4.0 billion and it was only during the second half of 2013 that Sibanye
| |
Sibanye Gold Annual Financial Report 2015 | 88 |
Table of Contents
MANAGEMENT'S DISCUSSION AND ANALYSIS OF THE FINANCIAL STATEMENTS continued
was able to reduce its debt levels to R2.5 billion. Sibanye’s average gross debt outstanding, excluding the Burnstone Debt, during 2014 was approximately R2.0 billion. The increase in environmental rehabilitation liability accretion expense was mainly due to an increase in the life of mine and the incorporation of Cooke and Burnstone, which added R28 million and R2 million, respectively.
SHARE-BASED PAYMENTS
The share-based payment expense decreased by 34% to R274 million in 2015 from R418 million, and increased by 37% in 2014 from R306 million in 2013. The share-based payment expense consists of R119 million relating to equity-settled share options granted under the Sibanye Gold Limited 2013 Share Plan (SGL Share Plan), Gold Fields Limited 2012 Share Plan and Gold Fields Limited 2005 Share Plan (2014: R176 million and 2013: R213 million), and R155 million relating to instruments granted under the Sibanye Gold 2013 Phantom Share Scheme (the SGL Phantom Scheme) (2014: R242 million and 2013: R92 million).
The decrease in the share-based payment expense in 2015 was mainly due to the number of performance shares that vested on 1 March 2015, with no new significant allocations in 2015.
The increase in the SGL Phantom Scheme share-based payment expense in 2014 was due to the fair value of each option granted under the scheme increasing due to the appreciation in Sibanye’s share price.
The cash-settled share instruments are valued at each reporting date based on the fair value of the instrument at that reporting date. The difference between the reporting date fair value and the initial recognition fair value of these cash settled share options is included in loss/gain on financial instruments in profit or loss.
SHARE OF RESULTS OF EQUITY-ACCOUNTED INVESTEES AFTER TAX
The profit from share of results of associates of R116 million in 2015 (2014: R471 million loss and 2013: R52 million profit) was primarily due to share of profits of R115 million relating to Sibanye’s 33.1% interest in Rand Refinery.
For additional information of Sibanye’s investment in Rand Refinery and the equity loss, see note 14: Equity-accounted investments to the consolidated financial statements.
LOSS ON FINANCIAL INSTRUMENTS
The loss on financial instruments of R230 million in 2015 compared with R108 million in 2014 and R5 million in 2013. The loss on financial instruments consists of R87 million fair value loss relating to SGL Phantom Scheme options (2014: R202 million and 2013: R33 million) and R163 million (2014: Rnil and 2013: Rnil) loss on revised estimated cash flows of the Burnstone Debt, partly offset by R8 million fair value gain on investments under the environmental rehabilitation obligation funds (2014: R63 million and 2013: Rnil) and R12 million gain relating to the financial guarantee liability (2014: R31 million and 2013: R28 million).
LOSS/GAIN ON FOREIGN EXCHANGE DIFFERENCES
The loss on foreign exchange differences of R359 million in 2015 compared with R63 million in 2014 and a gain of R24 million in 2013. The loss on foreign exchange differences in 2015 and 2014 were mainly due to exchange differences on the Burnstone Debt of R412 million and R89 million, respectively.
NET LOSS ON DERECOGNITION OF FINANCIAL GUARANTEE ASSET AND LIABILITY
On 24 April 2015, Sibanye was released as guarantor by the note holders of Gold Fields’ US$1 billion bond, resulting in a net loss on derecognition of the financial guarantee asset and financial guarantee liability of R158 million.
For additional information on the derecognition of the financial guarantee asset and financial guarantee liability, see note 16: Financial guarantee to the consolidated financial statements.
IMPAIRMENTS
Impairments were Rnil in 2015, R275 million if 2014 and R821 million in 2013.
The impairment in 2014 related to a R155 million impairment of the Python plant at Kloof, which was decommissioned in July 2014 due to process design flaws, and the R120 million impairment of investment in Rand Refinery. For additional information of Sibanye’s investment in Rand Refinery and the equity loss, see note 14: Equity-accounted investments to the consolidated financial statements.
During February 2013, a fire at Beatrix West Section affected approximately 38% of the planned production area, threatening the commercial viability of the Beatrix West Section. As a result a decision was taken during the year to impair Beatrix West’s mining assets by R821 million.
| |
Sibanye Gold Annual Financial Report 2015 | 89 |
Table of Contents
MANAGEMENT'S DISCUSSION AND ANALYSIS OF THE FINANCIAL STATEMENTS continued
REVERSAL OF IMPAIRMENT
Due to the positive results of a restructuring process at the Beatrix West Section it has subsequently returned to profitability. As a result a decision was taken in December 2014 to reverse the impairment by R474 million.
TRANSACTION COSTS
The transaction costs were R26 million in 2015 compared with R112 million in 2014 and R9 million in 2013. The transaction costs in 2015 related to the Rustenburg Operations Transaction and Aquarius Transaction of R10 million and R16 million, respectively. The transaction costs in 2014 related to the finalisation of the Cooke and Burnstone acquisitions of R82 million and R30 million, respectively.
RESTRUCTURING COSTS
Significant restructuring in 2013 had resulted in R439 million additional costs. In 2014 restructuring costs, including voluntary separation packages of R160 million were incurred at Cooke, Driefontein and Corporate Services. In 2015 restructuring costs, including voluntary separation packages of R105 million were incurred at all operations and Corporate Services.
ROYALTIES
Royalties decreased by 7% to R401 million in 2015 from R431 million in 2014 and increased by 4% in 2014 from R415 million in 2013. The decreased royalty in 2015 was mainly due to the decrease in earnings before interest and taxes. The increased royalty in 2014 was mainly due to the increase in gold sold.
The rate of royalty tax payable as a percentage of revenue is set out in the table below.
% | 2015 | 2014 | 2013 |
Driefontein | 2.4 | 2.1 | 2.4 |
Kloof | 1.5 | 2.3 | 2.1 |
Beatrix | 1.8 | 1.8 | 1.6 |
Cooke | 0.6 | 0.5 | – |
Average for Group | 1.8 | 2.0 | 2.1 |
MINING AND INCOME TAX
Mining and income tax decreased by 54% to R377 million in 2015 from R828 million in 2014 and increased from R256 million in 2013. The table below indicates Sibanye’s effective tax expense rate in 2015, 2014 and 2013.
Rand million except as otherwise stated | 2015 | 2014 | 2013 |
Mining and income tax | 377 | 828 | 256 |
Effective tax rate (%) | 41.2 | 35.5 | 13.1 |
In 2015, the effective tax expense rate of 41% was higher than the maximum South African mining statutory tax rate of 34% mainly due to the tax effect of the following:
| · | | R30 million rate adjustment to reflect the actual realised company tax rates; |
| · | | R41 million non-deductible charges related to share-based payments; |
| · | | R328 million assessed losses not recognised; |
| · | | R29 million deferred tax charge on increase of long-term expected tax rate; and |
| · | | R10 million net non-taxable income and non-deductible expenditure. |
The above were offset by the following:
| · | | R266 million reduction related to the mining tax formula rate adjustment; |
| · | | R39 million non-taxable share of results of equity-accounted investees; and |
| · | | R67 million non-taxable gain on derecognition of financial guarantee liability. |
In 2014, the effective tax expense rate of 36% was higher than the maximum South African mining statutory tax rate of 34% mainly due to the tax effect of the following:
| · | | R10 million rate adjustment to reflect the actual realised company tax rates; |
| |
Sibanye Gold Annual Financial Report 2015 | 90 |
Table of Contents
MANAGEMENT'S DISCUSSION AND ANALYSIS OF THE FINANCIAL STATEMENTS continued
| · | | R60 million non-deductible charges related to share-based payments; |
| · | | R160 million non-taxable share of results of equity-accounted investees; |
| · | | R41 million non-deductible impairments; |
| · | | R23 million net non-taxable income and non-deductible expenditure; and |
| · | | R81 million assessed losses not recognised. |
The above was offset by the R340 million reduction related to the mining tax formula rate adjustment.
In 2013, the effective tax expense rate of 13% was lower than the maximum South African mining statutory tax rate of 34% mainly due to the tax effect of the following:
| · | | R330 million reduction related to the mining tax formula rate adjustment; |
| · | | R17 million of non-taxable share of results of equity-accounted investees; and |
| · | | R214 million deferred tax released on reduction of the long-term expected tax rate at the operations. |
The above were offset by the following:
| · | | R64 million adjustment reflected the actual realised company tax rates; |
| · | | R73 million non-deductible charges related to share-based payments; and |
| · | | R16 million net non-taxable income and non-deductible expenditure. |
PROFIT FOR THE YEAR
As a result of the factors discussed above, the profit in 2015 was R538 million, compared with R1,507 million in 2014 and R1,698 million in 2013. Of this, R717 million (2014: R1,552 million and 2013: R1,692 million) is attributable to the owners of Sibanye.
The following graph depicts contributions from various segments to the profit attributable to the owners of Sibanye.
Contributions (Rm)
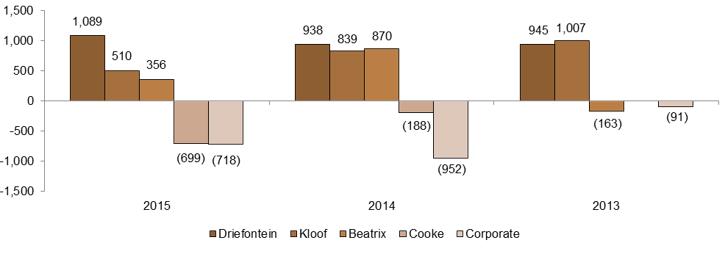
LIQUIDITY AND CAPITAL RESOURCES
CASH FLOW ANALYSIS
Net cash generated in 2015 was R154 million compared with R930 million utilised in 2014 and R1,201 million generated in 2013.
The principal factors explaining the changes in net cash flow for the year are set out in the table below.
| |
Sibanye Gold Annual Financial Report 2015 | 91 |
Table of Contents
MANAGEMENT'S DISCUSSION AND ANALYSIS OF THE FINANCIAL STATEMENTS continued
Rand million except as otherwise stated | 2015 | 2014 | % change 2015/2014 | 2013 | % change 2014/2013 |
Net cash from operating activities | 3,515 | 4,053 | (13) | 6,360 | (36) |
Additions to property, plant and equipment | (3,345) | (3,251) | (3) | (2,902) | (12) |
Net borrowings repaid | (21) | (673) | 97 | (2,220) | 70 |
Free cash flow | 829 | 1,807 | (54) | 3,731 | (52) |
One of the most important drivers to sustain and increase shareholder value is free cash flow generation as that determines the cash available for dividends and other investing activities. Sibanye defines free cash flow as net cash from operating activities before dividends, less additions to property, plant and equipment.
The following graph details the cash movement in determining the free cash flow in 2015 and 2014.
2015 Free cash flow analysis (Rm)
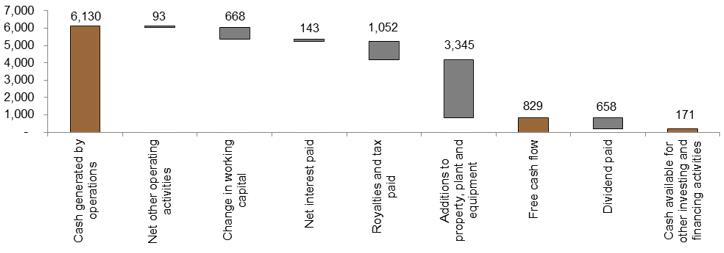
2014 Free cash flow analysis (Rm)
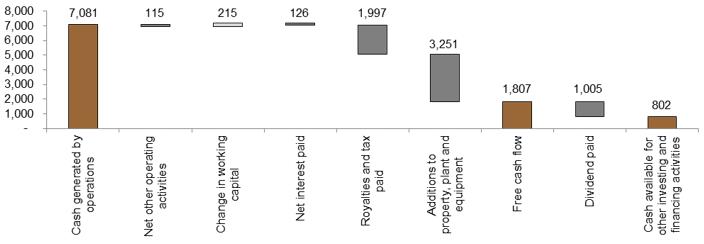
CASH FLOWS FROM OPERATING ACTIVITIES
Cash from operating activities decreased to R3,515 million in 2015 from R4,053 million in 2014 and decreased in 2014 from R6,360 million in 2013. The items contributing to the decrease in 2015 and 2014 are indicated in the table below.
| |
Sibanye Gold Annual Financial Report 2015 | 92 |
Table of Contents
MANAGEMENT'S DISCUSSION AND ANALYSIS OF THE FINANCIAL STATEMENTS continued
| | |
Rand million except as otherwise stated | 2015 | 2014 |
(Decrease)/increase in cash generated by operations1 | (951) | 241 |
Decrease/(increase) in cash-settled share-based payments paid | 124 | (163) |
Increase in investment in/(decrease in release from) working capital | (882) | (354) |
(Increase)/decrease in interest paid | (66) | 132 |
Decrease/(increase) in royalties paid2 | 255 | (401) |
Decrease/(increase) in tax paid1 | 691 | (1,042) |
Decrease/(increase) in dividends paid | 347 | (733) |
Other | (55) | 13 |
Decrease in cash flows from operating activities | (537) | (2,307) |
1 The decrease in cash generated by operations in 2015 was mainly due to higher operating costs. The increase in cash generated by operations in 2014 was mainly due to increase in gold production.
2 The increase in royalties, tax and dividends paid in 2014 was due to additional payments made during 2014 compared with 2013.
CASH FLOWS FROM INVESTING ACTIVITIES
Cash used in investing activities decreased to R3,340 million in 2015 from R4,309 million in 2014 and increased in 2014 from R3,072 million in 2013. The decrease in cash from investing activities in 2015 and increase in 2014 was mainly due the acquisitions of Wits Gold, Cooke and Burnstone in 2014 for R616 million and the loan advanced to Rand Refinery in 2014 of R385 million. For additional information of Sibanye’s investment in Rand Refinery and the loan to Rand Refinery, see note 14: Equity-accounted investments to the consolidated financial statements.
Capital expenditure increased by 3% to R3,345 million in 2015 from R3,251 million in 2014 and increased by 12% in 2014 from R2,902 million in 2013. Capital expenditure at the individual mines is shown in the graph below.
Capital expenditure (Rm)
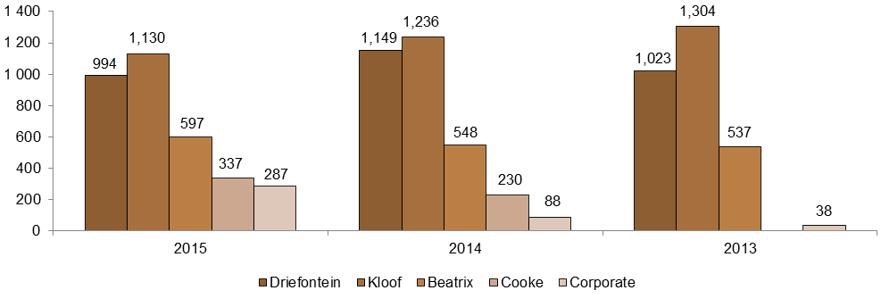
CASH FLOWS FROM FINANCING ACTIVITIES
Cash used in financing activities decreased to R21 million in 2015 from R673 million in 2014 and decreased in 2014 from R2,088 million in 2013.
On various dates during 2015, Sibanye made additional drawdowns of R1,000 million and repaid R1,021 million under the R4.5 billion Facilities.
In 2014, Sibanye repaid R656 million debt assumed through the acquisitions of Wits Gold and Cooke. On various dates during 2014, Sibanye made additional drawdowns of R500 million and repaid R900 million under the R4.5 billion Facilities. On 18 December 2014, Sibanye borrowed a further R385 million to fund its portion of the Rand Refinery loan, increasing its debt under the facility to just below R2.0 billion.
On 1 February 2013, Gold Fields subscribed for shares in Sibanye at a subscription price of R17,246 million. Sibanye used R17,108 million of the proceeds to repay the GFL Mining Services Limited (GFLMS, a subsidiary of Gold Fields) loan. On 18 February 2013, the date of unbundling from Gold Fields, Sibanye refinanced its long- and short-term credit facilities, which were Gold Fields group debt facilities, by drawing down R4,570 million under the Bridge Loan Facilities. In 2013 Sibanye repaid R2,570 million of the Bridge Loan Facilities and on 13 December 2013, Sibanye repaid the balance of the Bridge Loan Facilities by drawing down R2,000 million under the R4.5 billion Facilities.
| |
Sibanye Gold Annual Financial Report 2015 | 93 |
Table of Contents
MANAGEMENT'S DISCUSSION AND ANALYSIS OF THE FINANCIAL STATEMENTS continued
NET INCREASE/(DECREASE) IN CASH AND CASH EQUIVALENTS
As a result of the above, net cash generated in 2015 amounted to R155 million compared with R930 million utilised in 2014 and R1,201 million generated in 2013.
Total Group cash and cash equivalents amounted to R717 million at 31 December 2015 (2014: R563 million and 2013: R1,492 million).
STATEMENT OF FINANCIAL POSITION
BORROWINGS
Total debt (short- and long-term) excluding R1,808 million attributable to the Burnstone project, which has no recourse to Sibanye’s balance sheet, decreased to R1,995 million at 31 December 2015 from R2,036 million at 31 December 2014 (2013: R1,991 million).
At 31 December 2015, Sibanye had committed unutilised banking facilities of R6.2 billion available under the R4.5 billion Facilities and US$300 million revolving credit facility (RCF). Subsequent to year end the US$300 million RCF increased to US$350 million.
For a description of borrowings, see note 23: Borrowings to the consolidated financial statements.
WORKING CAPITAL AND GOING-CONCERN ASSESSMENT
The Group’s current liabilities exceeded its current assets by R2,597 million at 31 December 2015 (2014: R1,630 million and 2013: R887 million). Current liabilities at 31 December 2015 includes the current portion of borrowings of R1,995 million which is the semi-annual repayment due and payable in June 2016 and the final settlement due and payable in December 2016.
Sibanye generated cash from operating activities of R3,515 million in 2015. The Group had committed unutilised debt facilities of R6.2 billion at 31 December 2015.
The directors believe that the cash generated by operations and the remaining balance of the Group’s revolving credit facility will enable the Group to continue to meet its obligations as they fall due.
Off balance sheet arrangements and contractual commitments
At 31 December 2015, Sibanye had no off balance sheet items. For a description of Sibanye’s contractual commitments, see the following notes to the consolidated financial statements.
Contractual commitments | Note per the consolidated financial statements |
Environmental rehabilitation obligation | 24 – Environmental rehabilitation obligation |
Commercial commitments | 29 – Commitments |
Contingent liabilities | 30 – Contingent liabilities |
Debt | |
– capital | 23 – Borrowings |
– interest | 33 – Risk management activities |
These contractual commitments for expenditure, together with other expenditure and liquidity requirements, will be met from internal cash flow and, to the extent necessary, from the existing facilities.
CRITICAL ACCOUNTING POLICIES AND ESTIMATES
Sibanye’s significant accounting policies are fully described in the various notes to its consolidated financial statements. Some of Sibanye’s accounting policies require the application of significant judgements and estimates by management that can affect the amounts reported in the consolidated financial statements.
These judgements and estimates are based on management’s best knowledge of the relevant facts and circumstances, having regard to previous experience, but actual results may differ from the amounts included in the consolidated financial statements.
| |
Sibanye Gold Annual Financial Report 2015 | 94 |
Table of Contents
MANAGEMENT'S DISCUSSION AND ANALYSIS OF THE FINANCIAL STATEMENTS continued
For Sibanye’s significant accounting policies that are subject to significant judgements, estimates and assumptions, see the following notes to the consolidated financial statements:
Significant accounting policy | Note per the consolidated financial statements |
Basis of preparation | 1 – Accounting policies |
Consolidation | 1 – Accounting policies |
Royalties, mining and income tax | 8 – Royalties, and mining and income tax |
Property, plant and equipment | 11 – Property, plant and equipment |
Business combinations | 12 – Acquisitions |
Goodwill | 13 – Goodwill |
Equity-accounted investments | 14 – Equity accounted investments |
Environmental rehabilitation obligation funds | 15 – Environmental rehabilitation obligation funds |
Inventories | 17 – Inventories |
Environmental rehabilitation obligation | 24 – Environmental rehabilitation obligation |
Contingent liabilities | 30 – Contingent liabilities |
| |
Sibanye Gold Annual Financial Report 2015 | 95 |
| |
Sibanye Gold Annual Financial Report 2015 | 96 |
The directors are responsible for the preparation and fair presentation of the consolidated financial statements of Sibanye, comprising the consolidated statement of financial position at 31 December 2015, and consolidated income statement and consolidated statements of comprehensive income, changes in equity and cash flows for the year then ended, and the notes to the consolidated financial statements, which include a summary of significant accounting policies, and other explanatory notes, in accordance with IFRS, the SAICA Financial Reporting Guides, as issued by the Accounting Practices Committee, and Financial Reporting Pronouncements as issued by the Financial Reporting Standards Council, as well as the requirements of the Companies Act and the JSE Listings Requirements.
In addition, the directors are responsible for preparing the directors’ report.
The directors consider that, in preparing the consolidated financial statements, they have used the most appropriate accounting policies, consistently applied and supported by reasonable and prudent judgements and estimates, and that all IFRS standards that they consider to be applicable have been complied with for the financial year ended 31 December 2015. The directors are satisfied that the information contained in the consolidated financial statements fairly presents the results of operations for the year and the financial position of the Group at year end. The directors also prepared the information included in the annual financial report, and are responsible for both its accuracy and its consistency with the consolidated annual financial statements.
The directors have responsibility for ensuring that accounting records are kept. The accounting records should disclose with reasonable accuracy the financial position of the Group to enable the directors to ensure that the consolidated financial statements comply with the relevant legislation.
The Group operated in a well-established control environment, which is well documented and regularly reviewed. This incorporates risk management and internal control procedures, which are designed to provide reasonable assurance that assets are safeguarded and the material risks facing the business are being controlled.
The directors have made an assessment of the ability of the Company and its subsidiaries to continue as going concerns and have no reason to believe that Sibanye and its subsidiaries will not be going concerns in the year ahead.
Sibanye has adopted a Company Code of Ethics, which applies to all directors and employees, is available on Sibanye’s website.
The Group’s external auditors, KPMG Inc audited the consolidated financial statements. For their report, see Annual Financial Report–Accountability–Report of independent registered public accounting firm.
The consolidated annual financial statements were approved by the Board of Directors and are signed on its behalf by:
Neal Froneman
Chief Executive Officer
Charl Keyter
Chief Financial Officer
18 March 2016
COMPANY SECRETARY'S CONFIRMATION
In terms of section 88(2)(e) of the Companies Act 71 of 2008, as amended, I certify that the Company has lodged with the Companies and Intellectual Property Commission all such returns as are required to be lodged by a public company in terms of the Companies Act, and that all such returns are true, correct and up to date.
Cain Farrel
COMPANY Secretary
18 March 2016
| |
Sibanye Gold Annual Financial Report 2015 | 97 |
BOARD
SELLO MOLOKO (50)
CHAIRMAN
Non-executive director
BSc (Hons) and Postgraduate Certificate in Education, University of Leicester
Advanced Management Programme, University of Pennsylvania Wharton School
Sello is the executive Chairman of Thesele Group, a business he co-founded in 2004. He is also currently serving as non-executive Chairman of two listed companies, Sibanye and Alexander Forbes Group Holdings, and also serves as non-executive director of General Reinsurance Africa. Sello has a strong financial services background and is the former Chief Executive Officer (CEO) of Old Mutual Asset Managers. He is a former non-executive director of the Industrial Development Corporation, Gold Fields Limited, Acucap Properties Limited, Sycom Property Fund and Seartec Industries. He is also a trustee of the Nelson Mandela Foundation and is a past president of the Association of Securities and Investment Professionals.
NEAL FRONEMAN (56)
Chief Executive Officer
Executive director and Chairman of the Executive Committee
BSc Mech Eng (Ind Opt), University of the Witwatersrand
BCompt, University of South Africa PrEng
Neal Froneman was appointed an executive director and CEO of Sibanye on 1 January 2013. He has over 32 years of relevant operational, corporate development and mining industry experience. He was appointed CEO of Aflease Gold Limited (Aflease Gold) in April 2003. Aflease Gold, through a series of reverse take-overs, became Gold One in May 2009. Neal was primarily responsible for the creation of Uranium One Incorporated (Uranium One) from the Aflease Gold uranium assets. During this period, he was CEO of Aflease Gold and Uranium One until his resignation from Uranium One in February 2008. Prior to joining Aflease Gold, Neal held executive and senior management positions at Gold Fields of South Africa Limited, Harmony Gold Mining Company Limited (Harmony) and JCI Limited. He is also a non-executive director of Delview Three Proprietary Limited, 17 Perissa Proprietary Limited and Forestry Services Proprietary Limited.
CHARL KEYTER (42)
Chief Financial Officer
Executive director
BCom, University of Johannesburg
MBA, North-West University
ACMA and CGMA
Charl Keyter was appointed a director of Sibanye on 9 November 2012, and executive director and CFO on 1 January 2013. Previously, he was Vice President and Group Head of International Finance at Gold Fields. Charl has more than 20 years’ mining experience, having begun his career at Gold Fields in February 1995. He is also a non-executive director of Oil Recovery and Maintenance Services Proprietary Limited.
CHRISTOPHER CHADWICK (47)
Non-executive director
BCompt (Hons) (CTA), University of South Africa
CA(SA)
Christopher Chadwick was appointed a non-executive director on 16 May 2014. He is a chartered accountant who passed the South African Institute of Chartered Accountants Board exam in 1991 when he also completed his articles at Deloitte Touche Tohmatsu Limited. The earlier part of his career was spent with Comair Limited, the largest privately owned airline in South Africa, where he assisted in growing the company tenfold over a period of four years. After financial executive roles in the advertising, fast-moving consumer goods and services industries, Christopher moved into the information technology industry to assume financial and strategic directorships for five years. He spent another four years at an investment holding group where he was involved in corporate development and finance across many different sectors. Christopher joined Gold One in July 2008 as a Board director and is
| |
Sibanye Gold Annual Financial Report 2015 | 98 |
currently the CEO of Gold One. He was directly involved in the creation of Gold One through the reverse take-over of Australian listed BMA Gold Limited.
ROBERT CHAN (69)
Non-executive director
BSc (Economics) (Hons), University of London
MBA, University of Liverpool
Robert Chan was appointed a non-executive director on 16 May 2014. He is an experienced banker with over 39 years’ experience in commercial and investment banking, having worked in London, Malaysia and Singapore. He retired from the United Overseas Bank Limited (United Overseas Bank) on 31 December 2011 after 35 years of service (25 years as CEO of United Overseas Bank, Hong Kong). Robert has served as an independent non-executive director of Noble Group Limited since 1996. He is an independent non-executive director of Hutchison Port Holdings Trustees Pte Limited, Trustee Manager of Hutchison Port Holdings Trust, a business trust listed in Singapore, as well as Quam Limited, which is listed in Hong Kong. He is currently the non-executive Chairman of The Hour Glass (HK) Limited. He is also a Fellow of the Hong Kong Institute of Directors.
TIMOTHY CUMMING (58)
Non-executive director
BSc (Hons) (Engineering), University of Cape Town
BA (PPE), MA (Oxford)
Timothy (Tim) Cumming was appointed a non-executive director on 21 February 2013. He is the founder and executive director of Scatterlinks Proprietary Limited, a South African-based company providing mentoring and coaching services to senior business executives as well as leadership and strategic advisory services to companies. He was previously involved with the Old Mutual group in various capacities: CEO of Old Mutual Investment Group (South Africa) Proprietary Limited, Executive Vice President: Director of Global Business Development of Old Mutual Asset Management for Old Mutual (US) Holdings Inc, Managing Director: Head of Corporate Segment at Old Mutual (South Africa), Strategy Director of Old Mutual Emerging Markets and Interim CEO of Old Mutual Investment Group (South Africa). He was also executive director and Head of Investment Research (Africa) for HSBC Securities (Africa) and General Manager at Allan Gray Limited. Other board roles include Chairman of Amama South Africa Rural Social Enterprise NPC, and independent non-executive director of Nedgroup Investments Limited. Tim started his career as an engineer and management trainee at the Anglo American Corporation of South Africa Limited (Anglo American). He worked on a number of diamond mines and was Resident Engineer at Anglo American’s gold mines in Welkom, South Africa. He is also a trustee of the Woodside Endowment Trust.
BARRY DAVISON (70)
Non-executive director
BA (Law and Economics), University of the Witwatersrand
Graduate Commerce Diploma, Birmingham University
CIS Diploma in Advanced Financial Management and Advanced Executive Programme, University of South Africa
Barry Davison was appointed as a non-executive director on 21 February 2013. He has more than 40 years’ experience in the mining industry and served as Executive Chairman of Anglo American Platinum, Chairman of Anglo American’s Platinum Division, and Ferrous Metals and Industries Division, and was an executive director of Anglo American. He has been a director of a number of listed companies, including Nedbank Group Limited, Kumba Resources Limited, Samancor Limited and the Tongaat-Hulett Group Limited.
RICHARD MENELL (60)
Non-executive director
MA (Natural Sciences, Geology), Trinity College, University of Cambridge
MSc (Mineral Exploration and Management), Stanford University
Richard (Rick) Menell was appointed a non-executive director on 1 January 2013. He has over 35 years’ experience in the mining industry and has been a director of Gold Fields since 8 October 2008. Previously, he occupied the positions of President and Member of the Chamber of Mines of South Africa, President and CEO of TEAL Exploration & Mining Inc, Chairman of Anglovaal Mining Limited and Avgold Limited, Chairman of Bateman Engineering Proprietary Limited (Dutch), Deputy Chairman of Harmony and African Rainbow Minerals Limited. He has also been a director of Telkom Group Limited, Standard Bank of South Africa Limited, and Mutual and Federal Insurance Company Limited. He is currently a non-executive director and Chairman of Credit Suisse
| |
Sibanye Gold Annual Financial Report 2015 | 99 |
Securities Johannesburg Proprietary Limited, non-executive director of Gold Fields, The Weir Group plc and Rockwell Diamonds Inc. Rick is a trustee of Brand South Africa and the Carrick Foundation. He is co-Chairman of the City Year South Africa Citizen Service Organisation, and Chairman and trustee of the Palaeontological Scientific Trust.
NKOSEMNTU NIKA (58)
Non-executive director
BCom, University of Fort Hare
BCompt (Hons), University of South Africa
Advanced Management Programme, INSEAD
CA(SA)
Nkosemntu Nika was appointed a non-executive director on 21 February 2013. He is currently an independent non-executive director of Trollope Mining Services Proprietary Limited, Scaw South Africa Proprietary Limited and Foskor Proprietary Limited and Chairman of the Audit and Risk Committees of the latter two companies. He was previously CFO and Finance Director of PetroSA (SOC) Limited and Executive Manager: Finance at the Development Bank of Southern Africa. He has held various internal auditing positions at Eskom Holdings (SOC) Limited, Shell Company of South Africa Limited and Anglo American. He was also a non-executive board member of the Industrial Development Corporation of South Africa Limited and chaired its Audit and Risk Committee and Governance and Ethics Committee.
KEITH RAYNER (59)
Non-executive director
BCom, Rhodes University
CTA, Rhodes University
CA(SA)
Keith Rayner was appointed as a non-executive director on 1 January 2013. Keith is a South African chartered accountant with experience in corporate finance. He is CEO of KAR Presentations, an advisory and presentation corporation, which specialises in corporate finance and regulatory advice and presentations. Advice and presentations include, inter alia, the JSE Listings Requirements, Financial Markets Act, Companies Act, governance, takeover law, corporate action strategy, valuation theory and practice, IFRS and various directors’ courses. He is an independent non-executive director of Ecponent Limited, and a non-executive director of Nexus Intertrade Proprietary Limited, 2Quins Engineered Business Information Proprietary Limited, Keidav Properties Proprietary Limited and Appropriate Process Technologies Proprietary Limited. He is a member of the JSE Limited’s Issuer Regulation Advisory Committee, is a fellow of the Institute of Directors in South Africa (IOD), is a non-broking member of the Institute of Stockbrokers in South Africa and is a member of the Investment Analysts Society. He is a past member of the SAMREC/SAMVAL working group, the Takeover Regulation Panel’s rewrite committee, the IOD’s CRISA committee and the South African Institute of Chartered Accountants Accounting Practices Committee.
SUSAN VAN DER MERWE (61)
Non-executive director
BA, University of Cape Town
Susan van der Merwe was appointed a non-executive director on 21 February 2013. She served as a member of Parliament for 18 years until October 2013, and held various positions, including Deputy Minister of Foreign Affairs from 2004 to 2010. She is currently a member of the National Executive Committee of the ANC. She has participated in various civil society organisations and currently serves as a trustee and Chair of the Kay Mason Foundation, which is a non-profit organisation assisting disadvantaged scholars in Cape Town. Susan was appointed to the National Council of the South African Institute of International Affairs in 2014.
JERRY VILAKAZI (55)
Non-executive director
BA, University of South Africa
MA, Thames Valley University
MA, University of London
MBA, California Coast University
Jerry Vilakazi was appointed a non-executive director on 1 January 2013. He is Chairman of Palama Investment Holdings Proprietary Limited, which he co-founded to facilitate investments in strategic sectors. He is a past CEO of Business Unity South Africa. Prior to this, he was Managing Director of the Black Management Forum. In 2009 Jerry was appointed to the Presidential
| |
Sibanye Gold Annual Financial Report 2015 | 100 |
Broad-based Black Economic Empowerment Advisory Council and he was appointed as a Commissioner of the National Planning Commission in 2010. He was appointed Public Service Commissioner in 1999 and has played a critical role in shaping major public service policies in post-1994 South Africa. Jerry was Chairman of the Mpumalanga Gambling Board from 2006 to 2015 and the State Information Technology Agency (SOC) Proprietary Limited until end of the term in 2015. He previously held the position of Chairman of Netcare Limited and holds non-executive directorships in Blue Label Telecoms Limited, Palama Industrial and Saatchi & Saatchi. He is also a former non-executive director of Pretoria Portland Cement Limited.
JIYU YUAN (54)
Non-executive director
Mining Engineering, Xi’an University of Architecture and Technology
Jiyu Yuan was appointed a non-executive director on 12 May 2015. Jiyu is a mining engineer with 33 years of experience in China and Peru. He is currently a director of Gold One and General Manager of Shouxin Peru Mine Company Limited. Previously, Jiyu served as a General Manager at Xinjiang Mine Development Limited of Baiyin Nonferrous Group Company Limited (Baiyin), General Manager, at Changba Lead and Zinc Mine of Baiyin, director in the Mine Department of Baiyin and Senior Engineer at Northwest Research Institute of Mining and Metallurgy.
FORMER DIRECTOR
ZOLA SKWEYIYA (73)
Non-executive director
LLD, University of Leipzig
Zola Skweyiya was appointed as a non-executive director on 1 October 2013 and resigned as a director on 21 May 2015. He was Minister of Public Service and administration from 1994 to 1999 and Minister of Social Development from 1999 to 2008. He was a founding member of the Centre for Development Studies at the University of the Western Cape. Zola also served on the board of trustees of the National Commission for the Rights of Children. He was previously Chairman of the United Nations Commission for Social Development, and Founder and Chairman of the Constitution Committee African National Congress (ANC). In August 2013, he returned to South Africa after serving as the South African High Commissioner to the United Kingdom. He is also a director of Umsimbithi Holdings Proprietary Limited.
TERMS OF OFFICE
Barry Davison, Neal Froneman, Nkosemntu Nika, Susan van der Merwe and Jiyu Yuan retire by rotation at the upcoming Annual General Meeting (AGM) on 24 May 2016, and have indicated that they are available for election or re-election.
Christopher Chadwick, Robert Chan, Timothy Cumming, Charl Keyter and Sello Moloko retire by rotation in 2017.
MANAGEMENT
HARTLEY DIKGALE (55)
Executive Vice President: Corporate Affairs
BIuris, University of the North
LLB, HDip (Company Law), University of the Witwatersrand LLM, Vista University
Hartley Dikgale was recently appointed to this position after serving as Senior Vice President: General Counsel and Sustainable Development from May 2013. Hartley is an admitted advocate of the High Court of South Africa and has more than 30 years of corporate experience as a business executive. He has served on more than 20 boards of directors of listed and unlisted companies. He was introduced to the mining sector in 2004 when he was appointed to the Board of Pamodzi Gold Limited as a non-executive director. He has worked for, among others, Sanlam Limited, Old Mutual, the Independent Communications Authority of South Africa, Rand Water Board and Pamodzi Investment Holdings Proprietary Limited. In recent years (from 2010 to 2012), Hartley has worked for Rand Uranium Proprietary Limited (Rand Uranium) in an executive capacity as Senior Vice President: General Counsel. When Gold One acquired Rand Uranium, Hartley joined Gold One as Senior Vice President: General Counsel from 2012 to 2013.
| |
Sibanye Gold Annual Financial Report 2015 | 101 |
DAWIE MOSTERT (46)
Executive Vice President: Commercial Services
Diploma in Labour Relations
MDP (Adv Labour Law)
MBA, University of South Africa
Dawie Mostert, who has more than 18 years’ experience in the mining industry, was recently appointed to this position after serving as Senior Vice President: Organisational Effectiveness from January 2013. Prior to joining Sibanye, he served as Vice President: Commercial Services at Gold One in 2012 and Vice President: Human Capital at Great Basin Gold from 2006 to 2012. Prior to joining Great Basin Gold in 2006, he was Executive: Organisational Development and Employee Relations at Harmony from 2002 to 2006. Dawie joined Harmony in 1996 as part of the acquisition transformational team and was appointed Mine Manager at Elandsrand mine from 2001 to 2002.
WAYNE ROBINSON (53)
Divisional Chief Executive Officer: Gold and Uranium
BSc (Mechanical Engineering), University of Natal
BSc (Mining Engineering), University of the Witwatersrand PrEng
South African Mine Manager’s Certificate of Competency (Metalliferous)
South African Mechanical Engineer’s Certificate of Competency
Wayne Robinson was recently appointed to this position after serving as Senior Vice President: Underground Operations – Beatrix and Cooke from June 2014. Wayne has worked in the South African gold and platinum mining sectors for more than 25 years with experience in underground mine management. Prior to joining Sibanye, he was the Executive Vice President of Cooke Operations and served on the Gold One Executive Committee from 2012 to 2014. He has held senior management positions at Eastern Platinum Limited from 2006 to 2012, Richards Bay Minerals, from 2005 to 2006 and Gold Fields, prior to 2005, having qualified as a mechanical and mining engineer.
RICHARD STEWART (40)
Executive Vice President: Business Development
BSc (Hons), PhD (Geology), University of the Witwatersrand
MBA, Warwick Business School (UK)
Pr. Sci. Nat.
Richard Stewart was recently appointed to this position after serving as Senior Vice President: Business Development from June 2014. Richard has over 17 years’ experience in South Africa’s geological and mining industries, and is a professional natural scientist registered with the South African Council for Natural Scientific Professions and a Fellow of the Geological Society of South Africa. Prior to joining Sibanye, he served on the Gold One Executive Committee as Executive Vice President: Technical Services and was also CEO of Goliath Gold from January 2013 to April 2014. Prior to that he held management positions at the Council for Scientific and Industrial Research Mining Technology division, Shango Solutions (where he remains a director), Uranium One and was an Investment Consultant for African Global Capital Proprietary Limited.
ROBERT VAN NIEKERK (51)
Executive Vice President: Organisational Effectiveness
National Higher Diploma (Metalliferous Mining), Technikon Witwatersrand
BSc (Mining Engineering), University of the Witwatersrand
South African Mine Manager’s Certificate of Competency
Robert van Niekerk was recently appointed to this position after serving as Senior Vice President: Organisational Effectiveness from February 2013. Prior to joining Sibanye, he was the Senior Vice President and Group Technical Head of Mining at Gold Fields from November 2011. Robert has held several other senior operational and executive management positions at Harmony, Anglo American Platinum, Gold One and Uranium One, including that of CEO of Uranium One Africa. Robert began his mining career in 1982 as a Barlow’s Learner Official and progressed through the mining ranks gaining experience at a number of South African and offshore underground and surface mining operations.
| |
Sibanye Gold Annual Financial Report 2015 | 102 |
KEY STANDARDS AND PRINCIPLES
Sibanye listed on 11 February 2013, with its primary listing on the JSE. It is registered with the US Securities and Exchange Commission (SEC) in the United States of America (US) and its ordinary shares are represented by ADRs which are listed on the NYSE. The ADR programme is administered by BNY Mellon.
As a result, the Group is subject to compliance with the JSE Listings Requirements and to the disclosure and corporate governance requirements of the NYSE applicable to foreign private issuers. In 2015, management believes the Group complied with all the applicable governance requirements.
The Group has adopted high standards of accountability, transparency and integrity in the running of the business and reporting to shareholders and other stakeholders.
The approach to corporate governance is guided by the principles of fairness, accountability, responsibility and transparency. Special attention has been given to providing stakeholders and the financial investment community with clear, concise, accurate and timely information about the Group’s operations and results; reporting to shareholders on an integrated basis on Sibanye’s financial and sustainable performance; ensuring appropriate business and financial risk management; ensuring that no director, management official or other employee of the Sibanye Group deals directly or indirectly in Sibanye shares on the basis of unpublished price-sensitive information regarding the Sibanye Group, or otherwise during any prohibited period; and recognition of the Group’s social responsibility to provide assistance and development support to the communities in which it operates and to deserving institutions at large.
The Group applies all but one of the principles contained in King III and has implemented the King III principles and recommendations across the Group. The one exception is the King III recommendation that employment contracts should not compensate executives for severance because of change of control (although this does not preclude payments for retaining key executives during a period of uncertainty), see Annual Financial Report–Accountability–Remuneration report.
Sibanye complies with the principle that companies should remunerate directors and executives fairly and responsibly. The Remuneration Committee develops a remuneration policy aligned with the strategy of Sibanye and linked to individual performances. This policy addresses the base pay, bonuses, employee contracts, severance and retirement benefits and share-based and other long-term incentive schemes.
All 75 King III principles are recorded in the compliance schedule on Sibanye’s website, detailing the principles and the corresponding explanations.
Sibanye complied with all of the mandatory specific governance requirements contained in paragraph 3.84 of the JSE Listings Requirements during the 2015 financial year.
The Group’s Code of Ethics requires its directors, officers and employees to conduct business in an ethical and fair manner and it promotes a socially and environmentally responsible culture. The Audit Committee is responsible for ensuring compliance with the Code of Ethics.
In addition to the requirements of King III and the relevant aspects of the Sarbanes-Oxley Act, 2002, the Group is also subject to the relevant requirements of the Dodd-Frank Act, 2010, the Foreign Corrupt Practices Act, 1977, the Organisation for Economic Co-operation and Development Convention on Combating Bribery of Foreign Public Officials in International Business Transactions, 1997, the UN Convention against Corruption, 2003, and South Africa’s Prevention and Combating of Corrupt Activities Act, 2004.
Employees, suppliers and customers are encouraged to report irregularities and misconduct without fear of victimisation using an independently managed, anonymous, toll-free line.
BOARD OF DIRECTORS
The Company’s Memorandum of Incorporation (MOI) requires no fewer than four and no more than 15 members on the Board of Directors. The Board currently comprises 13 members – eight of these are independent non-executive directors, three non-independent non-executive directors and the two executive directors holding the positions of CEO and CFO. Jiyu Yuan was appointed on 12 May 2015 as an additional member of the Board and is eligible and available for election at the upcoming AGM. Zola Skweyiya resigned as a director of the Board on 21 May 2015.
The roles of the Chairman of the Board and the CEO are separate.
The Board, advised by the Nominating and Governance Committee, ensures that the candidates for election as independent non-executive directors are reputable, competent and experienced and are willing to devote the necessary time to the role.
The Board of Directors’ Charter (Charter) outlines the objectives and responsibilities of the Board, see –Board of director’s charter, and all Board sub-committees operate in accordance with written terms of reference, which are regularly reviewed by the Board. The Board takes ultimate responsibility for the Group’s adherence to sound corporate governance standards and sees to it that all business judgements are made with reasonable care, skill and diligence.
| |
Sibanye Gold Annual Financial Report 2015 | 103 |
The executive directors and the Company Secretary keep the Board informed of all developments in the Group.
For current membership of all the Board sub-committees, see –Board committees.
The Board met seven times during the year under review.
REMUNERATION
The Board obtains independent advice before making recommendations to shareholders for the remuneration of non-executive directors. The remuneration is paid in accordance with a special resolution approved by the shareholders within the previous two years.
Non-executive directors only receive remuneration due to them as members of the Board. Directors serving on Board sub-committees receive additional remuneration. For details of the directors’ remuneration packages as well as those of the prescribed officers, see Annual Financial Report–Accountability–Remuneration report.
MONITORING PERFORMANCE
In 2015, and in line with recommendations of King III, the Board carried out a rigorous evaluation of the independence of directors and conducted an internal assessment of the effectiveness of the Board and Board sub-committees.
The Chairman is appointed annually by the Board which, with the assistance of the Nominating and Governance Committee, carried out a rigorous review of the Chairman’s performance and independence during 2015. The Board concluded that there were no factors that impaired his independence and appointed the Chairman for another year.
The performance of the Company Secretary was evaluated by the Board. The Board was satisfied with his competence, qualifications, experience and maintaining an arms-length relationship with the Board.
ROTATION AND RETIREMENT FROM THE BOARD
In accordance with the MOI, one third of the directors shall retire from office at each AGM. The first to retire are those directors appointed as additional members of the Board, followed by the longest-serving members. The Board, assisted by the Nominating and Governance Committee, can recommend the eligibility of retiring directors (subject to availability and their contribution to the business) for re-appointment. Retiring directors can be immediately re-elected by the shareholders at the AGM.
BOARD OF DIRECTORS’ CHARTER
In 2015, the Board reviewed and re-assessed the adequacy of the Charter. This document compels directors to promote the vision of the Group, while upholding sound principles of corporate governance. Directors’ responsibilities under the Charter include:
| · | | determining the Group’s Code of Ethics and conducting the Group’s affairs in a professional manner, upholding the core values of integrity, transparency and enterprise; |
| · | | evaluating, determining and ensuring the implementation of corporate strategy and policy; |
| · | | determining compensation, development, skills development and other relevant policies for employees; |
| · | | developing and setting best-practice disclosure and reporting practices that meet the needs of all stakeholders; |
| · | | authorising and controlling capital expenditure and reviewing investment capital and funding proposals; |
| · | | constantly updating the risk management systems, including setting management expenditure authorisation levels and exposure limit guidelines; and |
| · | | reviewing executive succession planning and endorsing senior executive appointments, organisational changes and general remuneration policies. |
In this regard the Board is guided by the Audit Committee, the Risk Committee, the Nominating and Governance Committee, the Remuneration Committee, and Safety, Health and Sustainable Development Committee.
The Board considers that this annual financial report and associated reports comply in all material respects with the relevant statutory requirements of the various regulations governing disclosure and reporting by Sibanye; and that the consolidated financial statements comply in all material respects with IFRS, the SAICA Financial Reporting Guides issued by the Accounting Practices Committee and Financial Reporting Pronouncements issued by the Financial Reporting Standards Council, the Companies Act and the JSE Listings Requirements. As such, the Board has approved the content of the annual financial report, including the consolidated financial statements on 18 March 2016.
| |
Sibanye Gold Annual Financial Report 2015 | 104 |
BOARD COMMITTEES
The Board has formed the following committees in compliance with good corporate governance:
| · | | Nominating and Governance Committee; |
| · | | Safety, Health and Sustainable Development Committee; and |
| · | | Social and Ethics Committee (to comply with the statutory requirements of the Companies Act). |
All these committees are composed of a majority of independent non-executive directors except for the Safety, Health and Sustainable Development Committee of which the CEO is also a member, and the Risk Committee of which Christopher Chadwick, Robert Chan and Jiyu Yuan are also members. The committees are all chaired by an independent non-executive director and operate in accordance with written terms of reference which have been approved by the Board.
Board meetings and attendance | Date |
Director | 17/2 | 12/5 | 7/7 | 3/8 | 4/8 | 1/9 | 3/11 |
Sello Moloko (Chairman) | √ | √ | √ | √ | √ | – | √ |
Timothy Cumming | √ | √ | √ | – | √ | √ | √ |
Christopher Chadwick | √ | √ | √ | – | √ | √ | √ |
Robert Chan | √ | √ | – | √ | √ | √ | √ |
Barry Davison | √ | √ | √ | √ | √ | √ | √ |
Neal Froneman | √ | √ | √ | √ | √ | √ | √ |
Charl Keyter | √ | √ | √ | √ | √ | √ | √ |
Richard Menell | √ | √ | √ | √ | √ | √ | √ |
Nkosemntu Nika | √ | √ | √ | √ | √ | √ | √ |
Keith Rayner | √ | √ | √ | √ | √ | √ | √ |
Zola Skweyiya1 | √ | √ | – | – | – | – | – |
Susan van der Merwe | √ | √ | √ | √ | √ | √ | √ |
Jerry Vilakazi | √ | √ | √ | √ | √ | √ | √ |
Jiyu Yuan2 | – | – | √ | – | √ | √ | √ |
1 Resigned as a director on 21 May 2015
2 Appointed as a director on 12 May 2015
THE AUDIT COMMITTEE
This committee monitors and reviews Sibanye’s accounting controls and procedures, including the effectiveness of its information systems and other systems of internal control; the effectiveness of the internal audit function; reports of both external and internal auditors; interim reports, the Form 20-F; the consolidated annual financial statements; the accounting policies of Sibanye and any proposed revisions thereto; external audit findings and reports, and the approval thereof; and compliance with applicable legislation and requirements of regulatory authorities and Sibanye’s Code of Ethics.
The CFO’s expertise was evaluated by the Audit Committee. The committee is satisfied that the incumbent has the appropriate expertise and experience to carry out his duties as the financial director of the Group and that he is supported by qualified competent senior staff.
The committee reviewed and assessed the independence of the external auditors, including their confirmation in writing that the criteria for independence as set out in the rules of the Independent Regulatory Board for Auditors and international bodies have been followed. The committee is satisfied that KPMG Inc is independent of the Group and is accredited by the JSE.
Sibanye’s CFO and internal and external auditors as well as senior management attend all the Audit Committee meetings and have unrestricted access to the Chairman of this committee. The Audit Committee, in turn, communicates freely with other members of the Board not serving as members of the Audit Committee. To perform its functions effectively, the Audit Committee meets at least quarterly, but more frequently if required.
The Sarbanes-Oxley Act requires the Board to identify an audit committee financial expert from within its ranks or to determine that the Audit Committee does not have a financial expert. The Board has resolved that the committee’s Chairman, Keith Rayner, is the Audit Committee’s financial expert. Further, the Board of Directors believes that the members of the Audit Committee collectively possess the knowledge and experience to oversee and assess the performance of Sibanye’s management and auditors, the quality of Sibanye’s disclosure controls, the preparation and evaluation of Sibanye’s financial statements and Sibanye’s financial reporting. Sibanye’s Board of Directors also believes that the members of the Audit Committee collectively possess the understanding of audit committee functions necessary to diligently execute their responsibilities.
| |
Sibanye Gold Annual Financial Report 2015 | 105 |
Membership and attendance of the Audit Committee | Date |
Director | 16/2 | 13/3 | 19/3 | 13/4 | 11/5 | 4/8 | 2/11 | 4/12 |
Keith Rayner (Chairman) | √ | √ | √ | √ | √ | √ | √ | √ |
Richard Menell | √ | √ | √ | √ | √ | √ | √ | √ |
Nkosemntu Nika | √ | √ | √ | √ | √ | √ | √ | √ |
Susan van der Merwe | √ | √ | – | √ | √ | √ | √ | √ |
THE RISK COMMITTEE
This committee is responsible for ensuring that management implements appropriate risk management processes and controls. The total process of risk management, which includes the related systems of internal control, is the responsibility of the Board. Management is accountable to the Board for designing, implementing and monitoring an integrated process of risk management into the daily activities of Sibanye. The Board, through the Risk Committee, ensures that management implements appropriate risk management processes and controls. The responsibilities of the committee include:
| · | | reviewing the effectiveness and efficiency of the Enterprise Risk Management system within the Company and being assured that material risks are identified and that appropriate risk management processes are in place, including the formulation and subsequent updating of appropriate Company policies; |
| · | | reviewing the adequacy of the risk management charter, policy and plan; |
| · | | reviewing the parameters of the Company’s risk/reward strategy, in terms of the risk appetite and tolerance relative to reward and ensuring that risks are quantified where practicable; |
| · | | regularly receiving a register of the Company’s key risks and potential material risk exposures from management, reviewing and approving mitigations strategies, and reporting to the Board any material changes and/or divergence to the risk profile of the Company; |
| · | | monitoring the implementation of operational and corporate risk management plans; |
| · | | reviewing the insurance and other risk transfer arrangements, and considering whether appropriate coverage is in place; |
| · | | reviewing the business contingency planning process within the Group and being assured that material risks are identified and that appropriate contingency plans are in place; |
| · | | conducting a formal risk assessment at least once a year, which should be continually reviewed, updated and applied; and |
| · | | ensuring that a combined assurance model is applied to provide a coordinated approach to assurance activities. |
Membership and attendance of the Risk Committee | Date |
Director | 11/5 | 2/11 |
Richard Menell (Chairman) | √ | √ |
Christopher Chadwick | √ | √ |
Robert Chan | √ | √ |
Timothy Cumming | √ | √ |
Keith Rayner | √ | √ |
Zola Skweyiya1 | – | – |
Jiyu Yuan2 | – | √ |
1 Resigned as a director on 21 May 2015
2 Appointed as a director on 12 May 2015
THE NOMINATING AND GOVERNANCE COMMITTEE
This committee is responsible for ensuring that new directors undergo an appropriate induction process; recommending to the Board the need for Board participation in continuing education programmes; identifying and recommending to the Board successors to the Chairman and CEO; developing the approach of Sibanye to matters of corporate governance; and making recommendations to the Board concerning such matters.
| | | | |
Membership and attendance of the Nominating and Governance Committee | Date |
Director | 16/2 | 11/5 | 4/8 | 2/11 |
Sello Moloko (Chairman) | √ | √ | √ | √ |
Barry Davison | √ | √ | √ | √ |
Richard Menell | √ | √ | √ | √ |
Nkosemntu Nika | √ | √ | √ | √ |
Jerry Vilakazi | √ | √ | √ | √ |
| |
Sibanye Gold Annual Financial Report 2015 | 106 |
THE REMUNERATION COMMITTEE
This committee is responsible for determining Sibanye’s remuneration policy and the practices needed to attract, retain and motivate high-performing executives who are demonstrably aligned with Sibanye’s corporate objectives and business strategy; and for ensuring that remuneration levels relative to other comparable companies are pitched at the desired level taking relative performance into account. The Remuneration Committee also reviews, on behalf of the Board, both the remuneration levels of senior executives and management share-incentive schemes and the related performance criteria and measurements. To perform these functions the Remuneration Committee meets quarterly, or more frequently if required.
Membership and attendance of the Remuneration Committee | Date |
Director | 26/1 | 16/2 | 11/5 | 3/8 | 2/11 |
Timothy Cumming (Chairman) | √ | √ | √ | – | √ |
Robert Chan 1 | √ | √ | √ | – | – |
Barry Davison | √ | √ | √ | √ | √ |
Sello Moloko | √ | √ | √ | √ | √ |
Nkosemntu Nika | √ | √ | √ | √ | √ |
Keith Rayner2 | – | – | – | √ | √ |
1 Resigned from this committee on 12 May 2015
2 Appointed to this committee on 12 May 2015
THE SAFETY, HEALTH AND SUSTAINABLE DEVELOPMENT COMMITTEE
This committee reviews adherence to occupational health, safety and environmental standards by Sibanye. The committee seeks to minimise mining-related accidents, to ensure that Sibanye’s operations are in compliance with all environmental regulations and to establish policy in respect of HIV/Aids and health matters.
Membership and attendance of the Safety, Health and Sustainable Development Committee | Date |
Director | 16/2 | 11/5 | 3/8 | 2/11 |
Barry Davison (Chairman) | √ | √ | √ | √ |
Christopher Chadwick | √ | √ | – | √ |
Neal Froneman | √ | √ | √ | √ |
Richard Menell | √ | √ | – | √ |
Sello Moloko | √ | √ | √ | √ |
Zola Skweyiya1 | √ | √ | – | – |
Susan van der Merwe | – | √ | √ | √ |
1 Resigned as a director on 21 May 2015
THE SOCIAL AND ETHICS COMMITTEE
This committee is responsible for discharging its statutorily imposed duties as outlined in section 72 of the Companies Act and the applicable regulations, which include monitoring Sibanye’s activities in relation to relevant legislation, other legal requirements and prevailing codes of best practice regarding:
| · | | the social and economic development; |
| · | | good corporate citizenship; |
| · | | the environment, health and public safety and the impact on Sibanye’s activities, products and services; |
| · | | labour and employment legislation. |
The Social and Ethics Committee must bring any matters relating to this monitoring to the attention of the Board and report to shareholders at the AGM. The Board seeks the assistance of the Social and Ethics Committee in ensuring that Sibanye complies with best practice recommendations in respect of social and ethical management.
| |
Sibanye Gold Annual Financial Report 2015 | 107 |
Membership and attendance of the Social and Ethics Committee | Date |
Director | 16/2 | 11/5 | 4/8 | 2/11 |
Jerry Vilakazi (Chairman) | √ | √ | √ | √ |
Robert Chan1 | – | – | √ | √ |
Timothy Cumming | √ | √ | √ | √ |
Barry Davison | √ | √ | √ | √ |
Richard Menell | √ | √ | √ | √ |
Sello Moloko | √ | √ | √ | √ |
Keith Rayner | √ | √ | √ | √ |
1 Appointed to this committee on 12 May 2015
EXECUTIVE DIRECTORS AND EXECUTIVE COMMITTEE
Assuming that Sibanye completes the acquisitions of Aquarius and the Rustenburg Operations, Sibanye intends to restructure its operations into two operating divisions, being a gold and uranium operation (division) and a platinum operation (division) each of which would be managed by a divisional CEO with a supporting executive management team. Should Sibanye expand into other commodities, similar divisional structures will be implemented. With effect from 1 January 2016 the membership of Sibanye’s Executive Committee is as follows:
Membership of the Executive Committee1 | |
Neal Froneman (CEO) | Wayne Robinson |
Charl Keyter (CFO) | Richard Stewart |
Hartley Dikgale | Robert van Niekerk |
Dawie Mostert | John Wallington2 |
1 Prior to the reorganisation of Sibanye’s Executive Committee, Shadwick Bessit, Cain Farrel, Nash Lutchman, Adam Mutshinya, Thabisile Phumo, Peter Turner and James Wellsted were prescribed officers and members of Sibanye’s Executive Committee. Dick Plaistowe retired on 30 September 2015.
2 Appointed on 1 February 2016.
Sibanye’s Executive Committee meets on a regular basis to discuss and make decisions on the strategic and operating issues facing Sibanye.
CORPORATE GOVERNANCE
Sibanye’s corporate governance practices are regulated by the JSE Listings Requirements. The following is a summary of the significant ways in which South Africa’s corporate governance standards and Sibanye’s corporate governance practices differ from those followed by domestic companies under the NYSE Listing Standards.
The NYSE Listing Standards require that the non-management directors of US listed companies meet at regularly scheduled executive sessions without management. The JSE Listing Requirements do not require such meetings of listed company non-executive directors. Sibanye’s non-management directors meet regularly without management.
The NYSE Listing Standards require US listed companies to have a nominating/corporate governance committee composed entirely of independent directors. The JSE Listings Requirements do not require the appointment of such a committee, however if such a committee is appointed it must stipulate that all members of this committee must be non-executive directors, the majority of whom must be independent and the chair must be the chair of the Board, if independent, or must be the lead independent director, if the Board chair is not independent. Sibanye has a Nominating and Governance Committee which is currently comprised of five non-executive directors, all of whom are independent under the JSE Listings Requirements and chaired by the Chairman of Sibanye, as required by the JSE Listings Requirements.
The NYSE Listing Standards require US listed companies to have a compensation committee composed entirely of independent directors. The JSE Listings Requirements merely require the appointment of such a committee. Sibanye has appointed a Remunerations (or Compensation) Committee, currently comprised of five board members, all of whom are independent under the JSE Listings Requirements.
The NYSE Listings Standards require US listed companies to have an audit committee composed entirely of independent directors. The Companies Act requires that the Audit Committee be approved by shareholders on an annual basis at a company’s AGM. The Companies Act and the JSE Listings Requirements also require an audit committee composed entirely of independent directors. Sibanye has appointed an Audit Committee, currently comprised of four board members, all of whom are independent non-executive, as defined under the Companies Act and the JSE Listings Requirements. One of these non-executive directors is also a non-executive director of Gold Fields, the former parent of Sibanye; however, Sibanye believes he satisfies the requirements of Rule 10A-3 under the US Securities Exchange Act of 1934 and applicable NYSE Listing Standards.
| |
Sibanye Gold Annual Financial Report 2015 | 108 |
REPORT OF THE AUDIT COMMITTEE
The Audit Committee has formal terms of reference which are updated on an annual basis. The Board is satisfied that the Audit Committee has complied with these terms, and with its legal and regulatory responsibilities as set out in the Companies Act, King III and the JSE Listings Requirements.
The Audit Committee consisted of four independent non-executive directors throughout the financial year. For membership and attendance at meetings, see Annual Financial Report–Accountability–Corporate governance report–Board committees–The Audit Committee.
The Board believes that the members collectively possess the knowledge and experience to supervise Sibanye’s financial management, internal and external auditors, the quality of Sibanye’s financial controls, the preparation and evaluation of Sibanye’s consolidated financial statements and Sibanye’s financial reporting.
The Board has established and maintains internal controls and procedures, which are reviewed on a regular basis. These are designed to manage the risk of business failures and to provide reasonable assurance against such failures. However, this is not a guarantee that such risks are eliminated.
It is the duty of the Audit Committee, inter alia, to monitor and review:
| · | | the effectiveness of the internal audit function; findings and the appointment of external auditors; reports of both internal and external auditors; |
| · | | evaluation of the performance of the CFO; |
| · | | the governance of information technology (IT) and the effectiveness of the Group’s information systems; |
| · | | interim and annual financial and operating reports, the consolidated annual financial statements and all other widely distributed financial documents; |
| · | | the Form 20-F filing with the SEC; |
| · | | accounting policies of the Group and proposed revisions; |
| · | | compliance with applicable legislation, requirements of appropriate regulatory authorities and the Group’s Code of Ethics; |
| · | | the integrity of the annual financial report and associated reports (by ensuring that its content is reliable and recommending it to the Board for approval); and |
| · | | policies and procedures for preventing and detecting fraud. |
Internal and external auditors have unrestricted access to the Audit Committee, the Audit Committee Chairman and the Chairman of the Board, ensuring that auditors are able to maintain their independence. Both the internal and external auditors report at Audit Committee meetings. The Audit Committee also meets with both internal and external auditors separately without other invitees being present. Management may attend the Audit Committee meetings by invitation.
The Audit Committee is responsible for recommending the appointment of an independent firm of external auditors to the Board who will in turn recommend the appointment to the shareholders.
The Audit Committee is also responsible for determining that the designated appointee has the necessary independence, experience, qualifications and skills, and that audit and other fees are reviewed and approved.
The Audit Committee has reviewed and assessed the independence of the external auditor, and has confirmed in writing that the criteria for independence, as set out in the rules of the Independent Regulatory Board for Auditors and international bodies, have been followed. The Audit Committee is satisfied that KPMG Inc is independent of the Group. The following table sets forth the aggregate audit and audit-related fees, tax fees and all other fees billed by our external auditors (KPMG Inc) for each of the 2015, 2014 and 2013 years:
| | | | | |
Rand million except as otherwise stated | | | 2015 | 2014 | 2013 |
Audit fees1 | | | 19.0 | 16.1 | 12.7 |
Audit-related fees2 | | | 3.0 | 1.2 | 1.2 |
Tax fees3 | | | 0.2 | – | 0.2 |
All other fees4 | | | 0.8 | – | – |
Total | | | 23.0 | 17.3 | 14.1 |
1 Audit fees consist of fees billed for the annual audit of Sibanye’s consolidated financial statements, audit of the Group’s internal controls over financial reporting in accordance with section 404 of the Sarbanes-Oxley Act and the audit of statutory financial statements of the Company’s subsidiaries, including fees billed for assurance and related services that are reasonably related to the performance of the audit or reviews of the Company’s financial statements that are services that only an external auditor can reasonably provide.
2 Audit-related fees include consist of the review of documents filed with regulatory authorities, consultations concerning financial accounting and reporting standards, review of security controls and operational effectiveness of systems, and due diligence related to acquisitions.
3Tax fees include fees billed for tax compliance, tax advice, tax planning and other tax-related services.
4 All other fees consists of fees for all other services not included under audit fees, audit related fees or tax fees.
The Audit Committee determines the nature and extent of non-audit services that the firm can provide and pre-approves all permitted non-audit assignments by the Group’s independent auditor. In accordance with the SEC rules regarding auditor independence, the
| |
Sibanye Gold Annual Financial Report 2015 | 109 |
Audit Committee has established policies and procedures for audit and non-audit services provided by an independent auditor. The rules apply to Sibanye and its consolidated subsidiaries engaging any accounting firms for audit services and the auditor who audits the accounts filed with the SEC (the external auditor) for permissible non-audit services. When engaging the external auditor for permissible non-audit services (audit related services, tax services, and all other services), pre-approval is obtained prior to the commencement of the services.
The Audit Committee approves the annual audit plan presented by the external auditors and monitors progress against the plan. The audit plan provides the Audit Committee with the necessary assurance on risk management, internal control environments and IT governance. The Audit Committee recommends that KPMG Inc is reappointed for the 2016 financial year with Jacques Erasmus as the Group audit engagement partner.
The Audit Committee has satisfied itself that both KPMG Inc and Jacques Erasmus are accredited in terms of the JSE Listings Requirements.
The internal control systems of the Group are monitored by internal auditors who report their findings and recommendations to the Audit Committee and to senior management. The Audit Committee determines the purpose, authority and responsibility of the internal audit function (Internal Audit) in an Internal Audit Charter. The internal audit function is headed by the Vice President: Internal Audit, who may be appointed or dismissed by the Audit Committee. The Audit Committee is satisfied that the incumbent Vice President: Internal Audit has the requisite skills and experience and that she is supported by a sufficient staff complement with appropriate skills and training.
Sibanye’s Internal Audit operates in accordance with the International Standards for the Professional Practice of Internal Auditing as prescribed by the Institute of Internal Auditors. The internal audit activities carried out during the year were identified through a combination of the Sibanye Risk Management framework and the risk-based methodologies adopted by Internal Audit. The Audit Committee approves the annual internal audit assurance plan presented by Internal Audit and monitors progress against the plan.
Internal Audit reports deficiencies to the Audit Committee every quarter together with recommended remedial actions, which are then followed up. Internal Audit provided the Audit Committee with a written report, which assessed as adequate the internal controls over financial reporting, IT governance and the risk management process during 2015.
The Audit Committee is responsible for IT governance on behalf of the Board and reviews the report of the IT Senior Manager at each meeting.
The Audit Committee evaluated the expertise and performance of the CFO during 2015. It is satisfied that he has the appropriate expertise and experience to carry out his duties as the CFO of the Group, and is supported by qualified and competent senior staff.
AUDIT COMMITTEE STATEMENT
Based on information from, and discussions with, management and external auditors, the Audit Committee has no reason to believe that there were any material breakdowns in the design and operating effectiveness of internal financial controls during the year and that the financial records may be relied upon as the basis for preparation of the consolidated financial statements.
The Audit Committee has considered and discussed this annual financial report and associated reports with both management and the external auditors.
During this process, the Audit Committee:
| · | | evaluated significant judgements and reporting decisions; |
| · | | determined that the going-concern basis of reporting is appropriate; |
| · | | evaluated the material factors and risks that could impact on the annual financial report and associated reports; |
| · | | evaluated the completeness of the financial and sustainability discussion and disclosures; and |
| · | | discussed the treatment of significant and unusual transactions with management and the external auditors. |
The Audit Committee considers that the annual financial report complies in all material respects with the statutory requirements of the various regulations governing disclosure and reporting of the consolidated annual financial statements and that the consolidated financial statements comply in all material respects with IFRS, the SAICA Financial Reporting Guides issued by the Accounting Practices Committee and Financial Reporting Pronouncements issued by the Financial Reporting Standards Council, as well as the requirements of the Companies Act and the JSE Listings Requirements. The Audit Committee has recommended to the Board that the consolidated annual financial statements be adopted and approved by the Board.
Keith Rayner CA(SA)
Chairman: Audit Committee
18 March 2016
| |
Sibanye Gold Annual Financial Report 2015 | 110 |
FOR THE YEAR ENDED 31 DECEMBER 2015
The directors have pleasure in submitting this report and the consolidated annual financial statements of Sibanye for the year ended 31 December 2015.
PROFILE
BUSINESS OF THE GROUP
Sibanye is a producer of gold and a major holder of gold resources and reserves in South Africa. The Group is primarily involved in underground and surface gold-mining and related activities, including extraction, and processing. All of the Group’s operations are located in South Africa. At 31 December 2015, Sibanye held gold mineral reserves of 31.0Moz (2014: 28.4Moz) and uranium mineral reserves of 113.8Mlb (2014: 102.5Mlb).
REVIEW OF OPERATIONS
For a review of Sibanye’s operations, see Annual Financial Report–Overview–Management’s discussion and analysis of the financial statements–2015 financial performance compared with 2014 and 2013.
FINANCIAL RESULTS
The information on the financial position of the Group for the year ended 31 December 2015 is set out in the consolidated financial statements including the notes, which appear elsewhere in this annual financial report. The income statement for the Group shows a profit of R538 million for the year ended 31 December 2015 compared with R1,507 million in 2014.
DIRECTORATE
COMPOSITION OF THE BOARD
On 12 May 2015, Jiyu Yuan was appointed as a non-executive director. He is eligible and available for election. On 21 May 2015, Zola Skweyiya resigned as a non-executive director.
For the membership of the Board and its sub-committees, see Annual Financial Report–Accountability–Corporate governance report–Board committees.
DIRECTORS’ AND OFFICERS’ DISCLOSURE OF INTERESTS IN CONTRACTS
As of the date of this report, none of the directors, officers or major shareholders of Sibanye or, to the knowledge of Sibanye’s management, their families, had any interest, direct or indirect, in any transaction during the last fiscal year or in any proposed transaction which has affected or will materially affect Sibanye or its investment interests or subsidiaries, other than as stated elsewhere in the annual financial report. None of the directors or officers of Sibanye or any associate of such director or officer is currently or has been at any time during the past fiscal year materially indebted to Sibanye.
For related party information, see Annual Financial Report–Annual financial statements–Notes to the consolidated financial statements–Note 34: Related-party transactions.
ROTATION OF DIRECTORS
Directors retiring in terms of the Company’s MOI are Barry Davison, Neal Froneman, Nkosemntu Nika, Susan van der Merwe and Jiyu Yuan.
All the directors are eligible and offer themselves for re-election.
The directors of various subsidiaries of the Company comprise some of the executive officers and one of the executive directors, where appropriate.
| |
Sibanye Gold Annual Financial Report 2015 | 111 |
FINANCIAL AFFAIRS
DIVIDEND POLICY
Sibanye‘s dividend policy is to return at least 25% to 35% of normalised earnings to shareholders and after due consideration of future requirements the dividend may be increased beyond these levels. Normalised earnings are defined as profit for the year excluding gains and losses on foreign exchange differences and financial instruments, non-recurring items, and share of results of equity-accounted investees after tax.
For the year under review, the Group paid a total dividend of R658 million compared with R1,005 million in 2014.
On 24 February 2016 a final dividend in respect of the six months ended 31 December 2015 of 90 SA cents per share was approved by the Board, resulting in a total dividend of 100 SA cents per share for the year ended 31 December 2015.
BORROWING POWERS
In terms of Clause 4 of the Company’s MOI, the borrowing powers of the Company are unlimited. As at 31 December 2015, the borrowings of the Company and the Group, excluding the Burnstone Debt, was R1,962 million (2014: R1,980 million) and R1,995 million (2014: R2,036 million), respectively, see Annual Financial Report–Notes to the consolidated financial statements–Note 23: Borrowings.
Sibanye is subject to financial and other covenants and restrictions under its credit facilities from time to time. Such covenants may include restrictions on Sibanye incurring additional financial indebtedness and obligations to maintain certain financial covenant ratios for as long as any amount is outstanding under such facilities.
SIGNIFICANT ANNOUNCEMENTS
2 February 2015: Sibanye advised shareholders that the Company had successfully completed the Cooke 4 Section 189 consultation process and that an agreement was reached with employees and organised labour on 12 November 2014.
6 February 2015: Sibanye reported that on 5 February 2015, a conflict between members of the Association of Mineworkers and Construction Union (AMCU) and the National Union of Mineworkers (NUM) at Beatrix resulted in injuries to 9 employees.
10 February 2015: Sibanye advised that it had reached formal agreement with all representative unions at Beatrix, resulting in commitment from the unions to ensuring peaceful co-existence and hence a safe working environment.
11 March 2015: Sibanye confirmed the arrest of 11 employees following investigation of the inter-union conflict at Beatrix. The South African Police Service and Sibanye Gold Protection Services have concluded a joint investigation into the inter-union conflict at Beatrix which took place on 5 February 2015.
20 April 2015: Sibanye reports that the Competition Tribunal has ordered that the Notice of Apparent Breach issued against Sibanye by the Competition Commission on 11 November 2014 be set aside.
29 April 2015: Sibanye informed shareholders that the Group has been released as guarantor by the noteholders of Gold Fields Limited’s US$1 billion bond issued 30 September 2010 by a subsidiary of Gold Fields Limited.
31 August 2015: Sibanye announced the successful conclusion of a US$300 million revolving credit facility which was concluded on 20 August 2015.
2 September 2015: Sibanye confirmed that during the day shift on 1 September 2015, approximately 1,200 of its employees elected to remain underground at its Masakhane shaft, Driefontein Operations.
9 September 2015: Sibanye announced the proposed acquisition of the Rustenburg Mining and Concentrating Operations from Anglo American Platinum for an upfront consideration of R1.5 billion in cash or shares and a deferred consideration equal to 35% of the distributable free cash flows generated by the Rustenburg Operations over a six year period, subject to a minimum nominal payment of R3 billion. For additional information of the proposed acquisition of the Rustenburg Operations, see Annual Financial Report–Overview–Management’s discussion and analysis of the financial statements–Factors affecting Sibanye’s performance–Acquisitions–Platinum acquisitions.
2 October 2015: Sibanye advised shareholders that NUM, Solidarity and UASA have accepted the offers made by fellow gold producers AngloGold Ashanti and Harmony. AMCU had unfortunately rejected all of the companies’ offers and obtained a certificate of non-resolution from the CCMA.
6 October 2015: Sibanye announced the proposed acquisition of Aquarius by way of a cash offer of US$0.195 per share (R2.66 per share) (translated using the rate at 5 October 2015 of R13.63/US$) valuing Aquarius at US$294 million (R4 billion) for the entire issued share capital of Aquarius. For additional information of the proposed acquisition of Aquarius, see Annual Financial Report–Overview–Management’s discussion and analysis of the financial statements–Factors affecting Sibanye’s performance–Acquisitions–Platinum acquisitions.
| |
Sibanye Gold Annual Financial Report 2015 | 112 |
30 November 2015: Sibanye provided shareholders with an update on progress towards finalising the acquisitions of the Rustenburg Operations and Aquarius, which were announced on 9 September 2015 and 6 October 2015, respectively.
GOING CONCERN
The consolidated financial statements have been prepared using appropriate accounting policies, supported by reasonable judgements and estimates. The directors believe that the Group has adequate resources to continue as a going concern for the foreseeable future.
For further details on the Group’s liquidity position at 31 December 2015, see Annual Financial Report–Notes to the consolidated financial statements–Note 36: Liquidity.
SPECIAL RESOLUTIONS PASSED BY SUBSIDIARY COMPANIES
The following special resolutions were passed by subsidiary companies during the year ended 31 December 2015:
1. SPECIAL RESOLUTION PASSED BY WEST DRIEFONTEIN GOLD MINING COMPANY PROPRIETARY LIMITED, WITWATERSRAND CONSOLIDATED GOLD RESOURCES PROPRIETARY LIMITED AND WITWATERSRAND DEEP INVESTMENTS PROPRIETARY LIMITED
Special resolution passed by the sole shareholder of the subsidiary companies listed below, in terms of sections 16(1) and 16(5)(a) of the Companies Act that the directors of the Company propose to the shareholder of the company that the existing MOI of the company, that is, the memorandum and articles of association of the company, be replaced in its entirety by a new MOI.
| · | | West Driefontein Gold Mining Company Proprietary Limited; |
| · | | Witwatersrand Consolidated Gold Resources Proprietary Limited; and |
| · | | Witwatersrand Deep Investments Proprietary Limited. |
2. SPECIAL RESOLUTION PASSED BY VARIOUS SUBSIDIARY COMPANIES
Special resolution passed by the sole shareholder of the subsidiary companies listed below, approving that the directors of the company may at any time and from time to time during the two years from the passing hereof authorise the company in terms of and subject to the provisions of section 45(3)(b) of the Companies Act, to provide any type of direct or indirect financial assistance as defined in section 45(1) of the Companies Act, to any company or corporation that is related or inter-related to the company, on such terms and conditions and for such amounts as the directors may determine.
| · | | Agrihold Proprietary Limited; |
| · | | Golden Hytec Farming Proprietary Limited; |
| · | | Golden Oils Proprietary Limited; |
| · | | K2013164354 Proprietary Limited; |
| · | | M Janse van Rensburg Proprietary Limited; |
| · | | Milen Mining Proprietary Limited; |
| · | | Sibanye Gold Academy Proprietary Limited; |
| · | | Sibanye Gold Nursing College Proprietary Limited; |
| · | | Sibanye Gold Protection Services Limited; |
| · | | Sibanye Gold Shared Services Proprietary Limited; |
| · | | West Driefontein Gold Mining Company Proprietary Limited; |
| · | | Witwatersrand Consolidated Gold Resources Proprietary Limited; |
| · | | Witwatersrand Deep Investments Proprietary Limited; |
| · | | Ezulwini Mining Company Proprietary Limited; |
| · | | Rand Uranium Proprietary Limited; |
| · | | St Helena Hospital Proprietary Limited; |
| · | | Sibanye Gold Eastern Operations Proprietary Limited; and |
| · | | Puma Gold Proprietary Limited. |
| |
Sibanye Gold Annual Financial Report 2015 | 113 |
3. SPECIAL RESOLUTION PASSED BY VARIOUS SUBSIDIARY COMPANIES
Special resolution passed by the majority shareholder of the subsidiary companies listed below, approving that the directors of the company may at any time and from time to time during the two years from the passing hereof authorise the company, in terms of and subject to the provisions of section 45(3)(b) of the Companies Act, to provide any type of direct or indirect financial assistance as defined in section 45(1) of the Companies Act, to any company or corporation that is related or inter-related to the company, on such terms and conditions and for such amounts as the directors may determine.
| · | | Bushbuck Ventures Proprietary Limited; |
| · | | Living Gold Proprietary Limited; |
| · | | Newshelf 1114 Proprietary Limited; and |
| · | | Oryx Ventures Proprietary Limited. |
LITIGATION
The Group provides occupational healthcare services to its employees through its existing facilities at the various operations. There is a risk that the cost of providing such services could increase in future, depending upon changes in the nature of underlying legislation and the profile of employees. Any such increased cost cannot be quantified. The costs are however also mitigated by advances in technology relating to occupational health. The Group is monitoring developments in this regard.
The principal health risks associated with Sibanye's mining operations in South Africa arise from occupational exposure to silica dust, noise, heat and certain hazardous chemicals. The most significant occupational diseases affecting Sibanye's workforce include lung diseases (such as silicosis, tuberculosis, a combination of the two and chronic obstructive airways disease, as well as noise induced hearing loss). The Occupational Diseases in Mines and Works Act, 78 of 1973, (ODMWA), governs the compensation paid to mining employees who contract certain illnesses, such as silicosis. The South African Constitutional Court has ruled that a claim for compensation under ODMWA does not prevent an employee from seeking compensation from its employer in a civil action under common law (either as individuals or as a class). While issues, such as negligence and causation, need to be proved on a case-by-case basis, it is possible that such ruling could expose Sibanye to individual or class action claims related to occupational hazards and diseases (including silicosis). If Sibanye were to face a significant number of such claims and the claims were suitably established against it, the payments of compensation for the claims could have a material adverse effect on Sibanye’s results of operations and financial position. In addition, Sibanye may incur significant additional costs arising out of these issues, including costs relating to the payment of fees, levies or other contributions in respect of compensatory or other funds established (if any), and expenditures arising out of its efforts to resolve any outstanding claims or other potential action.
On 21 August 2012, a court application was served on a group of respondents that included Sibanye (the August Respondents). On 21 December 2012, a further court application was issued and was formally served on a number of respondents, including Sibanye (the December Respondents) and, again on 10 January 2013, both the August Respondents and the December Respondents (together the Respondents), on behalf of current and former mine workers, and their dependants, of, amongst others, Sibanye, and who allegedly contracted silicosis and/or other occupational lung diseases (OLD) (the Class). The court application of 21 August 2012 and 21 December 2012 are together referred to below as the Applications.
Sibanye filed a notice of its intention to oppose the Applications and its attorneys to defend the claims.
These Applications requested that the court,
| 1. | | As a first phase, certify a class action to be instituted by the applicants on behalf of the Class, as defined. |
| 2. | | As a second phase to possibly split the Class, as defined into smaller classes based on common legal and factual issues. The Respondents are of the view that the definition of the class in the first phase and the proposed process involving the second phase are contrary to South African legal precedent. |
| 3. | | In the last phase, bring an action wherein they will attempt to hold the Respondents liable for silicosis and other OLD and resultant consequences. |
The Applications do not identify the number of claims that may be instituted against the Respondents or the quantum of damages that the applicants may seek.
The Applications were heard during the weeks of 12 and 19 October 2015. Judgement is expected to be handed down in the next few months. Anglo American South Africa, AngloGold Ashanti, Gold Fields, Harmony and Sibanye announced in November 2014 that they have formed a gold mining industry working group to address issues relating to the compensation and medical care for OLD in the gold mining industry in South Africa. Essentially, the companies are seeking a comprehensive and sustainable solution which deals both with the legacy compensation issues and future legal frameworks and which, while being fair to employees, also ensures the future sustainability of companies in the industry.
The companies have engaged all stakeholders on these matters, including government, organised labour, other mining companies and legal representatives of claimants who have filed legal suits against the companies. These legal proceedings are being defended.
At this stage, Sibanye can neither quantify the potential liability from the action as the Application is currently for certification of a class (and possibly, subsequent classes) nor can the length of time until finalisation be estimated.
| |
Sibanye Gold Annual Financial Report 2015 | 114 |
ADMINISTRATION
Cain Farrel was appointed Company Secretary of Sibanye with effect from 1 January 2013.
With effect from 11 February 2013, Computershare Investor Services Proprietary Limited became the Company’s South African transfer secretaries and Capita Asset Services became the United Kingdom registrars of the Company.
AUDITORS
The Audit Committee has recommended to the Board that KPMG Inc continues in office in accordance with section 90(1) of the Companies Act and in terms of the JSE Listings Requirements. Jacques Erasmus is KPMG’s lead audit partner, accredited by the JSE, for Sibanye.
SUBSIDIARY COMPANIES
For details of major subsidiary companies in which the Company has a direct or indirect interest, see Annual Financial Report–Annual financial statements–Notes to the consolidated financial statements–Note 1: Accounting policies.
| |
Sibanye Gold Annual Financial Report 2015 | 115 |
AUTHORISED AND ISSUED
At the shareholder’s meeting held on 21 November 2012 (Gold Fields being the sole shareholder) the Company’s authorised and issued share capital each consisting of 1,000 par value shares of R1.00 each was converted into 1,000 ordinary shares with no par value. The authorised share capital was increased by the creation of a further 999,999,000 ordinary no par value shares, each ranking pari passu in all respects with the existing no par value shares in the Company’s share capital so as to result in the Company’s authorised share capital being 1,000,000,000 ordinary no par value shares. As at 31 December 2012 the authorised share capital was 1,000,000,000 ordinary no par value shares and the issued share capital was 1,000 ordinary no par value shares.
On 1 February 2013, prior to the unbundling of Sibanye from Gold Fields on 18 February 2013, Gold Fields subscribed for a further 731,647,614 shares in Sibanye for R17,246 million.
As of 31 December 2014 the authorised share capital was 1,000,000,000 ordinary no par value shares and issued share capital was 898,840,196 ordinary no par value shares.
During 2015, the Company issued 17,300,356 shares as part of the SGL Share Plan.
As at 31 December 2015, the authorised share capital was 2,000,000,000 ordinary no par value shares and the issued and listed share capital was 916,140,552 ordinary no par value shares.
In terms of the general authority granted at the shareholder’s meeting on 12 May 2015, the authorised but unissued ordinary share capital of the Company representing not more than 5% of the issued share capital of the Company as at 31 December 2014, after setting aside so many ordinary shares as may be required to be allotted and issued pursuant to the share incentive scheme, was placed under the control of the directors.
This authority expires at the next AGM where shareholders will be asked to place under the control of the directors the authorised but unissued ordinary share capital of the Company representing not more than 5% of the issued share capital of the Company from time to time.
REPURCHASE OF SHARES
The Company has not exercised the general authority granted to buy back shares from its issued ordinary share capital granted at the shareholders’ meeting held on 12 May 2015.
At the next AGM, shareholders will be asked to approve the general authority for the acquisition by the Company, or a subsidiary of the Company, of its own shares.
| |
Sibanye Gold Annual Financial Report 2015 | 116 |
THE BOARD OF DIRECTORS AND STOCKHOLDERS
SIBANYE GOLD LIMITED
We have audited the accompanying consolidated statements of financial position of Sibanye Gold Limited (Sibanye) and its subsidiaries as at 31 December 2015, 2014 and 2013, the related consolidated income statements and the consolidated statements of changes in equity, and cash flows for each of the years in the three-year period ended 31 December 2015, and the information in the remuneration report as set out on pages 118 to 178. We also have audited Sibanye’s internal control over financial reporting as of 31 December 2015, based on criteria established in Internal Control – Integrated Framework (2013) issued by the Committee of Sponsoring Organizations of the Treadway Commission (COSO). Sibanye’s management is responsible for these consolidated financial statements, for maintaining effective internal control over financial reporting, and for its assessment of the effectiveness of internal control over financial reporting, included in the accompanying “Management’s Report on Internal Control over Financial Reporting”. Our responsibility is to express an opinion on these consolidated financial statements and an opinion on Sibanye’s internal control over financial reporting based on our audits.
We conducted our audits in accordance with the standards of the Public Company Accounting Oversight Board (United States). Those standards require that we plan and perform the audits to obtain reasonable assurance about whether the financial statements are free of material misstatement and whether effective internal control over financial reporting was maintained in all material respects. Our audits of the consolidated financial statements included examining, on a test basis, evidence supporting the amounts and disclosures in the financial statements, assessing the accounting principles used and significant estimates made by management, and evaluating the overall financial statement presentation. Our audit of internal control over financial reporting included obtaining an understanding of internal control over financial reporting, assessing the risk that a material weakness exists, and testing and evaluating the design and operating effectiveness of internal control based on the assessed risk. Our audits also included performing such other procedures as we considered necessary in the circumstances. We believe that our audits provide a reasonable basis for our opinions.
A company’s internal control over financial reporting is a process designed to provide reasonable assurance regarding the reliability of financial reporting and the preparation of financial statements for external purposes in accordance with generally accepted accounting principles. A company’s internal control over financial reporting includes those policies and procedures that (1) pertain to the maintenance of records that, in reasonable detail, accurately and fairly reflect the transactions and dispositions of the assets of Sibanye; (2) provide reasonable assurance that transactions are recorded as necessary to permit preparation of financial statements in accordance with generally accepted accounting principles, and that receipts and expenditures of Sibanye are being made only in accordance with authorisations of management and directors of Sibanye; and (3) provide reasonable assurance regarding prevention or timely detection of unauthorised acquisition, use, or disposition of Sibanye’s assets that could have a material effect on the financial statements.
Because of its inherent limitations, internal control over financial reporting may not prevent or detect misstatements. Also, projections of any evaluation of effectiveness to future periods are subject to the risk that controls may become inadequate because of changes in conditions, or that the degree of compliance with the policies or procedures may deteriorate.
In our opinion, the consolidated financial statements referred to above present fairly, in all material respects, the financial position of Sibanye and subsidiaries as of 31 December 2015, 2014 and 2013, and the results of their operations and their cash flows for each of the years in the three-year period ended 31 December 2015, in conformity with International Financial Reporting Standards as issued by the International Accounting Standards Board. Also in our opinion, Sibanye maintained, in all material respects, effective internal control over financial reporting as of 31 December 2015, based on criteria established in Internal Control – Integrated Framework (2013) issued by the Committee of Sponsoring Organizations of the Treadway Commission (COSO).
/s/ KPMG Inc.
Johannesburg, South Africa
18 March 2016
| |
Sibanye Gold Annual Financial Report 2015 | 117 |
It is the Remuneration Committee’s role and responsibility to ensure that the remuneration arrangements for executive directors and senior executives offer an incentive to enhance the Group’s performance and deliver responsibly on the Group’s strategy. The Remuneration Committee also needs to ensure that the actual rewards received by the executive directors are proportionate to levels of performance achieved and the returns received by shareholders. The Remuneration Committee gives full consideration to the Group’s priorities, its performance and shareholder interests.
Sibanye believes it is important that the structure and level of remuneration and reward are reasonably consistent across the Group and appropriately competitive within the operating market. Our remuneration structures are benchmarked against our peers and we operate comprehensive performance-based reward systems to retain and also attract the best people.
All information disclosed in this Remuneration Report for the year ended 31 December 2015 was in compliance with remuneration policies set by the Remuneration Committee. The Remuneration Committee reviewed the performance measures for the Group’s incentive plans during 2015 to reposition alignment with the Group strategy.
2015 REMUNERATION POLICY
The key principles of Sibanye’s remuneration policy are to:
| · | | support the execution of the Group’s business strategy; |
| · | | provide competitive rewards to attract, motivate and retain highly skilled executives and staff; |
| · | | motivate and reinforce individual, team and business performance; and |
| · | | ensure Sibanye’s remuneration arrangements are reasonably equitable and facilitate the deployment of people across the Group’s operations. |
At Sibanye, one of the critical drivers of performance is the Total Reward strategy. The Total Reward strategy is an integral part of the people strategy and promotes a holistic approach which combines all elements of cash remuneration (guaranteed and performance based) with other elements of reward (shares as well as non-financial motivators) to attract, retain and motivate employees. The principle of performance-based rewards is one of the cornerstones of the reward strategy. The reward strategy is also underpinned by sound remuneration management and governance principles which are promoted across Sibanye in order to ensure the consistent application of the strategy and its policies.
The Group’s reward strategy includes the following elements:
| · | | guaranteed remuneration; |
| · | | cash bonus and (short term incentives) bonus shares; and |
| · | | performance shares (long term incentives). |
REMUNERATION MIX
Sibanye’s remuneration model and practices are aimed at attracting and retaining motivated, high-calibre employees and aligning their interests with the shareholders. Such alignment is achieved through an appropriate mix of guaranteed and performance-based remuneration (variable pay), which provides for differentiation between high, average and low performers. The mix of guaranteed pay and variable pay differs according to the level of the employee within the Group. Typically, more senior employees’ remuneration will consist of a higher portion of variable pay as a percentage of their total remuneration.
The following remuneration mix for the period under review was approved by the Remuneration Committee.
Role | Total | Guaranteed
pay | Cash
bonus | Bonus
shares | Performance
shares |
CEO | 100% | 36% | 24% | 16% | 24% |
CFO | 100% | 39% | 23% | 15% | 23% |
SVP | 100% | 43% | 21.5% | 14% | 21.5% |
GUARANTEED REMUNERATION
Sibanye endeavours to reward its people fairly and consistently according to their role and individual contribution to the Group. To achieve reasonable external parity and a competitive total remuneration position, Sibanye surveys the relevant data on comparable pay practices regularly. The Committee also pays attention to the matter of internal parity of pay differentials across executives and role types within the company.
The benchmark for guaranteed remuneration is the market median level per category within the relevant gold mining companies and other comparable mining companies together with consideration of internal parity comparisons.
| |
Sibanye Gold Annual Financial Report 2015 | 118 |
Guaranteed remuneration levels are reviewed annually by the Remuneration Committee, taking into account the Group’s performance, change in responsibility, levels of remuneration increases based on market trends and inflation. The Remuneration Committee also considers the impact of any guaranteed remuneration increase on the total remuneration package.
ANNUAL BONUS
Executive directors are able to earn bonuses of 60% (for the CFO) and 65% (for the CEO) of their guaranteed pay for on-target performance, which is a determined by a combination of Group and individual performance outcomes. The annual bonus could increase above 60% and 65% if stretch targets are achieved whereby the maximum variable pay potential is capped at two times the on-target bonus percentage.
The targets for annual bonus are set by the Remuneration Committee. In the case of the CEO and CFO, 90% of the annual bonus is based on Group objectives and the remaining 10% on individual objectives.
In 2015 annual bonuses were based on targets approved in advance by the Remuneration Committee, comprising a combination of Group and Operational objectives taking account of the Group’s business plans. For the year ended 31 December 2015, the Group performance measures for the senior executives were set by the Remuneration Committee and the weightings were as follows:
Aside from these four key performance indicators, the CEO and CFO were also assessed on individual objectives. There are set every year for each executive director based on key performance areas and are approved at the beginning of each year by the Remuneration Committee. The individual objectives are typically centred on three themes: Operational Excellence, Growing Sibanye and Securing Sibanye’s Future.
For the year ended 31 December 2015, the Group performance measures for executive directors and senior executives were:
| Weight | | | Achieved |
Corporate performance 2015 | % | Actual | Target | % |
Safety | Reduce FIFR | 10 | 0.065 | 0.090 | 200% |
Reduce LTIFR | 5 | 6.74 | 5.27 | 0% |
Reduce SIFR | 5 | 4.68 | 3.15 | 0% |
Volume | Primary on-reef development (m) | 10 | 19,543 | 19,222 | 133% |
Primary off-reef development (m) | 10 | 48,581 | 47,246 | 157% |
Cost | Cost of ore milled – R/ton (underground) | 25 | 1,740 | 1,771 | 135% |
Quality | Grade and quality – gold produced (kg)1 | 35 | 48,638 | 52,000 | 57% |
| | 100 | | | 103% |
1 The organisational performance is based on allowance for 710kg gold production at Kloof that was lost due to three fires that are considered to be events outside direct management control as well as 152kg of gold that was lost at our surface operations across Beatrix, Driefontein and Kloof due to the need to reduce electricity consumption in response to load curtailment requirements imposed by Eskom.
In turn, the CEO develops specific individual objectives with his own direct reports at the beginning of each year. These objectives are then reviewed with the Remuneration Committee and form the basis upon which the other executives’ performance, together with the Operational performance outcomes, will be reviewed at the end of the year.
| |
Sibanye Gold Annual Financial Report 2015 | 119 |
Based on the bonuses determined for each executive for the year ended 31 December 2015, the annual bonus as a percentage of guaranteed pay paid to executive directors and prescribed officers of Sibanye in February 2016 was:
| |
Name | 2015 Annual Incentive as Percentage of Guaranteed Pay |
Executive directors | |
Neal Froneman | 70.8% |
Charl Keyter | 64.1% |
Prescribed officers | |
Shadwick Bessit | 52.4% |
Hartley Dikgale | 52.4% |
Cain Farrel | 41.9% |
Nash Lutchman | 52.4% |
Dawie Mostert | 53.2% |
Adam Mutshinya | 52.2% |
Thabisile Phumo1 | 52.7% |
Dick Plaistowe2 | 51.2% |
Wayne Robinson | 52.7% |
Richard Stewart | 53.7% |
Peter Turner | 52.7% |
Robert van Niekerk | 52.9% |
James Wellsted | 52.7% |
1 Appointed as a prescribed officer on 1 June 2015
2 Retired as a prescribed officer on 30 September 2015
SCHEDULES OF FEES AND REMUNERATION
The tables below set out the various fees, remuneration and equity ownership of executives and non-executives directors.
DIRECTORS’ FEES
In terms of the MOI, the fees for services as non-executive directors are determined by the Company’s shareholders at a general meeting. The current applicable schedule of fees, effective from 1st June 2015 is set out below.
| |
| Per annum |
The Chair of the Board | R1,575,000 |
The Chair of the Audit Committee | R301,350 |
The Chairs of the Nominating and Governance Committee, Remuneration Committee, Social and Ethics Committee, Risk Committee and Safety, Health and Sustainable Development Committee (excluding the Chairman of the Board) | R185,850 |
Members of the Board (excluding the Chairman of the Board) | R832,650 |
Members of the Audit Committee (excluding the Chairman of the Board) | R156,450 |
The Chairs of the Nominating and Governance Committee, Remuneration Committee, Social and Ethics Committee, Risk Committee and Safety, Health and Sustainable Development Committee (excluding the Chairman of the Board) | R117,600 |
| |
Sibanye Gold Annual Financial Report 2015 | 120 |
NON-EXECUTIVE DIRECTORS’ FEES, EXECUTIVE DIRECTORS AND PRESCRIBED OFFICERS’ REMUNERATION
The directors and prescribed officers of Sibanye were paid the following remuneration during the year ended 31 December 2015:
| | | | | | | | | |
| Directors’
fees
(R’000) | Committee
fees
(R’000) | Salary
(R’000) | Annual
bonus
accrued
for the
period
ended 31
December
2015 paid
in 2016
(R’000) | Shares
proceeds
and
dividends
on Bonus
Shares
(R’000) | Pension
scheme
total
contributions
(R’000) | Expense
allowance
(R’000) | For the
period
ended 31
December
2015
(R’000) | For the
period
ended 31
December
2014
(R’000) |
Executive directors | | | | | | | | | |
Neal Froneman | – | – | 7,136 | 5,660 | 6,165 | 793 | 132 | 19,886 | 12,868 |
Charl Keyter | – | – | 3,861 | 2,896 | 5,736 | 549 | 77 | 13,119 | 7,427 |
Prescribed officers | | | | | | | | | |
Shadwick Bessit | – | – | 3,278 | 2,012 | 5,122 | 571 | – | 10,983 | 6,029 |
Hartley Dikgale | – | – | 2,569 | 1,409 | 1,223 | 167 | – | 5,368 | 3,926 |
Cain Farrel | – | – | 1,815 | 938 | 3,078 | 404 | – | 6,235 | 3,880 |
Nash Lutchman | – | – | 2,016 | 1,184 | 2,829 | 280 | – | 6,309 | 3,237 |
Dawie Mostert | – | – | 2,501 | 1,573 | 1,461 | 439 | – | 5,974 | 4,170 |
Adam Mutshinya | – | – | 2,271 | 1,398 | 878 | 399 | – | 4,946 | 4,570 |
Thabisile Phumo1 | – | – | 1,306 | 749 | 133 | 124 | – | 2,312 | – |
Dick Plaistowe2 | – | – | 3,016 | 1,123 | 876 | – | – | 5,015 | 2,842 |
Wayne Robinson | – | – | 3,584 | 1,962 | 357 | 277 | – | 6,180 | 3,636 |
Marius Saaiman3 | – | – | 824 | – | – | 70 | – | 894 | 4,130 |
Richard Stewart | – | – | 2,876 | 1,671 | 296 | 309 | – | 5,152 | 3,003 |
Peter Turner | – | – | 5,231 | 3,212 | 17,334 | 908 | – | 26,685 | 13,541 |
Robert van Niekerk | – | – | 3,633 | 2,119 | 9,585 | 397 | – | 15,734 | 9,126 |
James Wellsted | – | – | 2,473 | 1,541 | 412 | 435 | – | 4,861 | 4,282 |
Non-executive directors | | | | | | | | | |
Robert Chan | 816 | 231 | – | – | – | – | – | 1,047 | 553 |
Chris Chadwick | 816 | 231 | – | – | – | – | – | 1,047 | 633 |
Timothy Cumming | 816 | 413 | – | – | – | – | 49 | 1,278 | 1,190 |
Barry Davison | 816 | 528 | – | – | – | – | 43 | 1,387 | 1,255 |
Richard Menell | 816 | 681 | – | – | – | – | 38 | 1,535 | 1,351 |
Sello Moloko | 1,544 | – | – | – | – | – | – | 1,544 | 1,539 |
Nkosemntu Nika | 816 | 384 | – | – | – | – | – | 1,200 | 1,115 |
Keith Rayner | 816 | 604 | – | – | – | – | – | 1,420 | 1,253 |
Zola Skweyiya4 | 330 | 93 | – | – | – | – | – | 423 | 931 |
Susan van der Merwe | 816 | 269 | – | – | – | – | – | 1,085 | 1,054 |
Jerry Vilakazi | 816 | 297 | – | – | – | – | – | 1,113 | 1,082 |
Jiyu Yuan5 | 529 | 75 | – | – | – | – | – | 604 | – |
Total | 9,747 | 3,806 | 48,390 | 29,447 | 55,485 | 6,122 | 339 | 153,336 | 98,623 |
1 Appointed as a prescribed officer on 1 June 2015
2 Retired on 30 September 2015
3 Resigned on 31 March 2015
4 Resigned as a non-executive director on 21 May 2015.
5 Appointed as a non-executive director on 12 May 2015
| |
Sibanye Gold Annual Financial Report 2015 | 121 |
DIRECTORS AND PRESCRIBED OFFICERS’ EQUITY-SETTLED INSTRUMENTS
The directors and prescribed officers of Sibanye held the following Sibanye equity-settled instruments at 31 December 2015:
| | | | | | | |
| Equity‑settled
instruments at 31
December 2014 | Equity‑settled
instruments
granted
during
the year | Equity‑settled
instruments
forfeited
during
the year | Equity-settled instruments
exercised during the year | Equity‑settled
instruments
at 31
December
2015 |
| Number | Number | Number | Number | Average
price | Share
proceeds
in Rands | Number |
Executive directors | | | | | | | |
Neal Froneman | 2,392,055 | 461,109 | – | 273,732 | 21.44 | 5,962,328 | 2,579,432 |
Charl Keyter | 759,740 | 210,099 | – | 261,813 | 21.26 | 5,580,540 | 708,026 |
Prescribed officers | | | | | | | |
Shadwick Bessit | 552,204 | 137,150 | – | 246,902 | 20.67 | 5,042,051 | 442,452 |
Hartley Dikgale | 249,767 | 96,039 | – | 51,642 | 23.07 | 1,182,799 | 294,164 |
Cain Farrel | 347,079 | 63,862 | – | 142,002 | 21.06 | 2,996,846 | 268,939 |
Nash Lutchman | 251,424 | 78,549 | – | 126,404 | 22.36 | 2.753.683 | 203,569 |
Dawie Mostert | 273,450 | 118,469 | – | 69,234 | 20.40 | 1,410,750 | 322,685 |
Adam Mutshinya | 437,872 | 95,549 | 3,133 | 38,632 | 20.29 | 77,215 | 491,656 |
Thabisile Phumo1 | 87,327 | 23,301 | – | 5,374 | 23.45 | 126,020 | 105,254 |
Dick Plaistowe2 | 37,207 | 86,881 | 80,599 | 43,489 | 19.78 | 859,971 | - |
Wayne Robinson | 47,296 | 126,259 | – | 16,525 | 20.41 | 337,219 | 157,030 |
Marius Saaiman3 | 73,457 | – | 73,457 | – | – | – | - |
Richard Stewart | 39,339 | 293,979 | – | 13,950 | 20.00 | 279,000 | 319,368 |
Peter Turner | 1,279,412 | 239,526 | – | 748,386 | 22.71 | 16,895,049 | 770,552 |
Robert van Niekerk | 873,179 | 160,408 | – | 456,631 | 20.39 | 9,325,944 | 576,956 |
James Wellsted | 333,427 | 117,002 | – | 15,790 | 22.52 | 355,605 | 434,639 |
1 Appointed as a prescribed officer on 1 June 2015 ( and at 31 May 2015 the opening balance of equity-settled instruments was 87,327)
2 Retired on 30 September 2015
3 Resigned on 31 March 2015
SHARE OWNERSHIP OF DIRECTORS AND PRESCRIBED OFFICERS
The following sets forth, to the knowledge of Sibanye’s management, the total amount of ordinary shares of Sibanye directly or indirectly owned by the directors, prescribed officers, and their associates as at 31 December 2015:
| | |
| Ordinary shares |
Holder | 2015 | 2014 |
Executive directors | | |
Neal Froneman1 | 164,832 | - |
Charl Keyter2 | 227,898 | 78,404 |
Prescribed officers | | |
Cain Farrel1 | 120,031 | 37,772 |
Peter Turner3 | 614,302 | 448,135 |
James Wellsted4 | 42,416 | 33,016 |
Non-executive directors | | |
Chris Chadwick1 | 88 | 88 |
Timothy Cumming1 | 100 | 100 |
Barry Davison1 | 500,000 | - |
Richard Menell1 | 44,800 | 44,800 |
Keith Rayner5 | 60,000 | 60,000 |
1 Share ownership at the date of this report is unchanged
2 Share ownership at the date of this report is 20,000 ordinary shares
3 Share ownership at the date of this report is 207,000 ordinary shares
4 Share ownership at the date of this report is 35,379 ordinary shares
5 Share ownership at the date of this report is 45,000 ordinary shares
| |
Sibanye Gold Annual Financial Report 2015 | 122 |
REVIEW OF RULES AND TARGETS
All scheme rules and targets are regularly reviewed by the Remuneration Committee to ensure they remain relevant and effective in enabling Sibanye business objectives by driving appropriate behaviours and providing retention incentives.
THE SIBANYE GOLD LIMITED 2013 SHARE PLAN
Sibanye has in place a share plan for certain of its employees, the Sibanye Gold Limited 2013 Share Plan (SGL Share Plan). The SGL Share Plan comprises two parts:
| · | | annual offers of bonus matching forfeitable shares, serving as a form of bonus deferral (part of the short term incentive awarded in addition to the cash bonus); and |
| · | | annual conditional offers of performance vesting forfeitable shares, serving as a form of share-based long-term incentive. |
The SGL Share Plan is considered to provide a solid framework for short and long term (share based) incentivisation in a multi-commodity divisionalised resources company. However certain amendments to the implementation of the SGL Share Plan, prompted by shareholder feedback are to be implemented and are now disclosed.
A brief description is given of the two elements allowed for in the SGL Share Plan, together with a more detailed description of the performance share element, and its currently envisaged implementation.
BONUS SHARES
The Remuneration Committee makes an annual award of forfeitable shares to the executive directors, prescribed officers, Senior Vice Presidents (SVPs) and Vice Presidents (VPs). These are referred to as Bonus Shares. The size of this Bonus Share award depends on the individual’s annual cash bonus, which is determined by actual performance against predetermined targets.
The face value of the Bonus Share award is equal to two-thirds of the actual annual cash bonus and is allocated in the form of restricted forfeitable shares. The Bonus Shares vest in two equal parts at nine months and eighteen months after the award date. Dividends are payable on the Bonus Shares during the holding period.
PERFORMANCE SHARES
The Remuneration Committee makes an annual award of conditional shares to the executive directors, prescribed officers, SVPs and VPs. These are referred to as Performance Shares. The number of Performance Shares awarded to an employee is based on the employee’s annual guaranteed pay and their grade combined with a factor related to their assessed performance rating for the prior year and using the relevant share price calculation at the offer date.
Up until now, the actual number of Performance Shares which can vest from previous awards is determined by Sibanye’s share price performance measured against the performance of Harmony Gold Mining Company Limited and Pan African Resources plc over a performance period of three years. The number of Performance Shares which finally vest is based on the relative change in the Sibanye share price compared to the respective change in the share prices of the other two peer-group companies, with discretion allowed due to the small sample size. For any Performance Share award to be settled by executives, an internal company performance target is required to be met before the external relative measure is applied.
This threshold performance criterion for vesting of any Performance Shares is set at the achievement of at least 85% of Sibanye’s expected gold production over the three-year measurement period as set out in the business plans of Sibanye as approved by the Board. Only once this internal measure has been achieved, will the external measure (Sibanye’s share price performance measured against the abovementioned companies) be applied to determine the scale of the vesting of awards of Performance Shares.
Various concerns have been expressed by representatives of the investor community relating to the performance conditions applicable on the vesting of Performance Shares. Specifically, concerns were expressed that:
| · | | a peer group comprising only two other companies was not sufficiently robust for the evaluation of Sibanye’s performance over the vesting period; and |
| · | | the condition of an 85% threshold as an internal target for gold produced over the three year period under which the Performance Shares would not vest was insufficiently stretching. |
A review has been conducted to identify appropriate adjustments to the implementation policy that would appropriately address these concerns and provide for enhanced alignment with shareholder interests. The decisions resulting from this review and the revised policy, inter alia, are disclosed below. These will be applicable for all Performance Share awards from 1 March 2016 onwards,.
Annual conditional awards of Performance Shares will continue to be made to the executive directors, prescribed officers, SVPs and VPs, and this element will be the primary form of share-based long term incentivisation.
Performance Shares vest no earlier than the third anniversary of their award, to the extent that Sibanye has met specified performance criteria over the intervening period. Essentially the number of shares that vest will depend on the extent to which
| |
Sibanye Gold Annual Financial Report 2015 | 123 |
Sibanye’s has performed over the intervening three year period relative to two particular performance criteria, Total Shareholder Return and Return on Capital Employed. These are considered to be the most widely acceptable vesting performance measures suited to aligning the outcome of long term share incentive awards with shareholders’ interests. This change will result in a possible vesting percentage ranging from 0% in the case of very poor performance to 100% vesting of the awarded Performance Shares in the event of having achieved stretched performance outcomes.
The performance criteria used to govern the vesting of Performance Shares are determined by the Remuneration Committee and communicated in award letters to participants. The following two performance conditions, applied with the indicated weightings, are to be implemented for determining the vesting of future awards effective from March 2016 onwards:
TOTAL SHAREHOLDER RETURN (TSR) – 70% WEIGHTING
Total shareholder return (TSR) will be measured against a benchmark of eight mining and resources companies, a few of which can be deemed direct competitors, but collectively they can be deemed to be an alternative investment portfolio for Sibanye’s shareholders. TSR is generally recognised as the most faithful indicator of shareholder value creation. It is used extensively internationally and increasingly in South Africa, sometimes as a single metric but most often as one of two or three weighted performance metrics. In a few cases an absolute target is set, but most often it is targeted in relation to a peer or comparator group of “like” companies. The performance curve governing vesting will be:
| |
TOTAL SHAREHOLDER RETURN ELEMENT OF PERFORMANCE CONDITION (70%) | |
Percentile on Peer Group Total Shareholder Return Curve | % vesting |
0% | 0% |
10% | 0% |
20% | 0% |
30% | 5% |
40% | 20% |
50% | 35% |
60% | 55% |
70% | 75% |
80% | 90% |
90% | 100% |
100% | 100% |
The eight peer group comparator companies for TSR comprises of similar market capitalisation companies reflective of the expected positioning of Sibanye over the short to medium term as a value driven multi-commodity resources company with a specific focus on gold and platinum and are set out in the table below:
|
PEER GROUP COMPANIES FOR TSR COMPARISON |
AngloGold Ashanti Limited |
Anglo American Platinum Limited |
Gold Fields Limited |
Impala Platinum Holdings Limited |
Northam Platinum Limited |
Exxaro Resources Limited |
Harmony Gold Mining Company Limited |
African Rainbow Minerals Limited |
| |
Sibanye Gold Annual Financial Report 2015 | 124 |
RETURN ON CAPITAL EMPLOYED (ROCE) - 30% WEIGHTING
Return on capital employed (ROCE) is a profitability ratio that measures how efficiently a company generates profits from its capital employed. This measure has been adopted as there has been a shift towards “excess returns” – “excess returns” provide a more central role in determining the current and potential value of a business. There is an increased focus on measuring and forecasting returns earned by businesses on both investments made in the past and expected future investments. For Sibanye, ROCE is to be evaluated against the company’s cost of capital (Ke). A minimum threshold on the performance scale for ROCE is set as equaling the cost of capital, Ke, which would lead to the ROCE element contributing 0% towards the performance condition. Delivering a return that exceeds Ke by 6% or more would be regarded as a superior return representing the maximum 100% on the performance scale and full vesting in respect of the ROCE element. The performance curve governing vesting will be as follows:
| |
RETURN ON CAPITAL EMPLOYED ELEMENT OF PERFORMANCE CONDITION (30%) | |
Annual Return on Capital Employed | % vesting |
≤Ke | 0% |
Ke + 1% | 16.7% |
Ke + 2% | 33.3% |
Ke + 3% | 50.0% |
Ke +4% | 66.7% |
Ke + 5% | 83.3% |
Ke + 6% | 100% |
The overall performance condition will be determined by adding 70% of the Total Shareholder Return element to 30% of the Return on Capital Employed element. Furthermore, should the Board, at its sole discretion, determine that there is evidence of extreme Environmental, Social and Governance (ESG) malpractice during the Vesting Period, up to 20% of the Performance Shares that would otherwise settle on vesting may be forfeited.
As indicated, the performance criteria described above govern vesting of all awards effective from 1 March 2016. Should any further adjustments be made they will govern future offers but will not be applied retrospectively.
EXECUTIVE DIRECTORS’ CONTRACTS OF EMPLOYMENT
The employment of an executive director will continue until terminated upon (i) 24 or 12 months’ notice by either party for the CEO and CFO, respectively, or (ii) retirement of the relevant executive director (currently provided for at age 60 in the contract). Sibanye can also terminate the executive director’s employment summarily for any reason recognised by law as justifying summary termination.
Except for the two current executive directors, none of the prescribed officers have entered into employment contracts that provide for any compensation for severance because of change of control.
The service agreements of the two current executive directors contain ‘change of control’ conditions, which are set out for information below. These contracts and conditions will be honoured until they terminate. However, any future appointments of executive directors will be made without provision for any compensation for severance because of change of control.
The employment contracts for the two current executive directors provide that, in the event of the relevant executive director’s employment being terminated solely as a result of a “change of control” as defined below, within 12 months of the change of control, the executive director is entitled to:
| · | | payment of an amount equal to twice his Gross Remuneration Package, or two and a half times in the case of the CEO; |
| · | | payment of an amount equal to the average of the incentive bonuses paid to the executive director during the previous two completed financial years; |
| · | | any other payments and/or benefits due under the contracts; |
| · | | payment of any annual incentive bonus he has earned during the financial year notwithstanding that the financial year is incomplete; |
| · | | an entitlement to awards, in terms of the Sibanye Gold Limited Incentive Scheme, shall accelerate on the date of termination of employment and settle with the full number of shares previously awarded. The employment contracts further provide that these payments cover any compensation or damages the executive director may have under any applicable employment legislation. |
A “change of control” for the above is defined as the acquisition by a third party or concerned parties of 30% or more of Sibanye ordinary shares. In the event of the consummation of an acquisition, merger, consolidation, scheme of arrangement or other reorganisation, whether or not there is a change of control, if the executive director’s services are terminated, the “change of control” provisions summarised above also apply.
| |
Sibanye Gold Annual Financial Report 2015 | 125 |
Annual financial statements
The audited consolidated financial statements for the year ended 31 December 2015 have been prepared by Sibanye’s group financial reporting team headed by Alicia Brink. This process was supervised by the Group’s CFO, Charl Keyter and authorised for issue by Sibanye’s Board of Directors on 18 March 2016.
| |
Sibanye Gold Annual Financial Report 2015 | 126 |
CONSOLIDATED INCOME STATEMENT
FOR THE YEAR ENDED 31 DECEMBER 2015
| | | | | |
Figures in million - SA rand | | Notes | 2015 | 2014 | 2013 |
Revenue | | 3 | 22 717.4 | 21 780.5 | 19 331.2 |
Cost of sales | | 4 | (20 017.0) | (17 566.1) | (15 077.2) |
Net operating profit | | | 2 700.4 | 4 214.4 | 4 254.0 |
Investment income | | 14,15,16.1 | 257.0 | 183.2 | 160.3 |
Finance expense | | 5 | (561.8) | (400.0) | (420.3) |
Share-based payments | | 6 | (274.4) | (417.9) | (305.8) |
Share of results of equity-accounted investees after tax | | 14 | 116.0 | (470.7) | 51.5 |
Loss on financial instruments | | | (229.5) | (107.7) | (4.6) |
(Loss)/gain on foreign exchange differences | | | (359.4) | (63.3) | 24.0 |
Exploration and feasibility costs | | 11 | (23.6) | (15.1) | - |
Other income | | | 125.7 | 155.9 | 219.3 |
Other costs | | | (204.3) | (249.9) | (314.9) |
Net loss on derecognition of financial guarantee asset and liability | | 16.3 | (158.3) | - | - |
Impairments | | 7 | - | (275.1) | (821.0) |
Reversal of impairment | | 11 | - | 474.1 | - |
Profit on disposal of property, plant and equipment | | 11 | 58.7 | 9.5 | 5.5 |
Loss on loss of control of subsidiary | | | - | - | (30.2) |
Transaction costs | | | (25.7) | (111.6) | (9.3) |
Restructuring costs | | | (104.8) | (160.3) | (439.4) |
Profit before royalties and tax | | | 1 316.0 | 2 765.5 | 2 369.1 |
Royalties | | 8.1 | (400.6) | (430.5) | (414.6) |
Profit before tax | | | 915.4 | 2 335.0 | 1 954.5 |
Mining and income tax | | 8.2 | (377.2) | (828.1) | (256.2) |
Profit for the year | | | 538.2 | 1 506.9 | 1 698.3 |
Attributable to: | | | | | |
Owners of Sibanye | | | 716.9 | 1 551.5 | 1 692.4 |
Non-controlling interests | | | (178.7) | (44.6) | 5.9 |
Earnings per share attributable to owners of Sibanye: | | | | | |
Basic earnings per share - cents | | 9.1 | 79 | 186 | 260 |
Diluted earnings per share - cents | | 9.2 | 78 | 182 | 255 |
The Group does not have other comprehensive income, therefore no statement of comprehensive income is presented.
The accompanying notes form an integral part of these consolidated financial statements.
| |
Sibanye Gold Annual Financial Report 2015 | 127 |
CONSOLIDATED STATEMENT OF FINANCIAL POSITION
AS AT 31 DECEMBER 2015
| | | | | |
Figures in million - SA rand | | Notes | 2015 | 2014 | 2013 |
ASSETS | | | | | |
Non-current assets | | | 25 515.0 | 25 981.4 | 17 289.9 |
Property, plant and equipment | | 11 | 22 132.4 | 22 704.0 | 15 151.0 |
Goodwill | | 13 | 736.7 | 736.7 | - |
Equity-accounted investments | | 14 | 167.5 | 69.4 | 275.1 |
Investments | | | 1.3 | 1.4 | 1.4 |
Environmental rehabilitation obligation funds | | 15 | 2 413.9 | 2 192.8 | 1 588.1 |
Financial guarantee asset | | 16.1 | - | 225.5 | 238.5 |
Deferred tax assets | | 22 | 63.2 | 51.6 | 35.8 |
| | | | | |
Current assets | | | 2 750.7 | 1 940.5 | 2 705.0 |
Inventories | | 17 | 405.9 | 327.7 | 187.1 |
Trade and other receivables | | 18 | 1 627.4 | 992.8 | 973.8 |
Current portion of financial guarantee asset | | 16.1 | - | 57.1 | 51.7 |
Cash and cash equivalents | | 19 | 717.4 | 562.9 | 1 492.4 |
| | | | | |
Total assets | | | 28 265.7 | 27 921.9 | 19 994.9 |
| | | | | |
EQUITY AND LIABILITIES | | | | | |
Equity attributable to owners of Sibanye | | | 14 875.0 | 14 656.3 | 9 421.2 |
Stated share capital | | 20 | 21 734.6 | 21 734.6 | 17 245.8 |
Other reserves | | | 2 938.2 | 2 819.1 | 2 643.3 |
Accumulated loss | | | (9 797.8) | (9 897.4) | (10 467.9) |
Non-controlling interests | | 21 | 109.8 | 329.6 | 2.2 |
Total equity | | | 14 984.8 | 14 985.9 | 9 423.4 |
| | | | | |
Non-current liabilities | | | 7 933.6 | 9 365.4 | 6 980.0 |
Deferred tax liabilities | | 22 | 3 561.4 | 3 869.3 | 3 735.4 |
Borrowings | | 23 | 1 808.3 | 2 615.8 | 1 491.4 |
Environmental rehabilitation obligation | | 24 | 2 411.0 | 2 486.8 | 1 660.7 |
Post-retirement healthcare obligation | | | 16.3 | 15.1 | 16.3 |
Share-based payment obligations | | 6 | 136.6 | 378.4 | 76.2 |
| | | | | |
Current liabilities | | | 5 347.3 | 3 570.6 | 3 591.5 |
Trade and other payables | | 25 | 2 759.4 | 2 714.6 | 2 073.0 |
Financial guarantee liability | | 16.2 | - | 197.0 | 206.6 |
Tax and royalties payable | | 28 | 129.6 | 84.0 | 767.2 |
Current portion of borrowings | | 23 | 1 995.3 | 554.2 | 499.5 |
Current portion of share-based payment obligations | | 6 | 463.0 | 20.8 | 45.2 |
| | | | | |
Total equity and liabilities | | | 28 265.7 | 27 921.9 | 19 994.9 |
The accompanying notes form an integral part of these consolidated financial statements.
| |
Sibanye Gold Annual Financial Report 2015 | 128 |
CONSOLIDATED STATEMENT OF CHANGES IN EQUITY
FOR THE YEAR ENDED 31 DECEMBER 2015
| | | | | | | | |
Figures in million - SA rand | | Notes | Stated
share
capital1 | Share-
based
payment
reserve | Accumulated
loss | Equity
attributable
to owners
of Sibanye | Non- controlling interests | Total
equity |
Balance at 31 December 2012 | | | - | 2 429.9 | (12 098.0) | (9 668.1) | (4.6) | (9 672.7) |
Total comprehensive income for the year | | | - | - | 1 692.4 | 1 692.4 | 5.9 | 1 698.3 |
Profit for the year | | | - | - | 1 692.4 | 1 692.4 | 5.9 | 1 698.3 |
Share-based payments | | 6 | - | 213.4 | - | 213.4 | - | 213.4 |
Dividends paid | | 10 | - | - | (271.9) | (271.9) | - | (271.9) |
Transaction with non-controlling interests | | 21 | - | - | - | - | 3.0 | 3.0 |
Share subscription | | 20 | 17 245.8 | - | - | 17 245.8 | - | 17 245.8 |
Loss of control of subsidiary | | | - | - | - | - | (2.1) | (2.1) |
Transaction with shareholder | | 16 | - | - | 209.6 | 209.6 | - | 209.6 |
Balance at 31 December 2013 | | | 17 245.8 | 2 643.3 | (10 467.9) | 9 421.2 | 2.2 | 9 423.4 |
Total comprehensive income for the year | | | - | - | 1 551.5 | 1 551.5 | (44.6) | 1 506.9 |
Profit for the year | | | - | - | 1 551.5 | 1 551.5 | (44.6) | 1 506.9 |
Share-based payments | | 6 | - | 175.8 | - | 175.8 | - | 175.8 |
Dividends paid | | 10 | - | - | (1 005.2) | (1 005.2) | - | (1 005.2) |
Transaction with non-controlling interests | | 21 | - | - | 24.2 | 24.2 | (24.2) | - |
Shares issued | | 20 | 4 488.8 | - | - | 4 488.8 | - | 4 488.8 |
Acquisition of subsidiary with non-controlling interests | | 12 | - | - | - | - | 396.2 | 396.2 |
Balance at 31 December 2014 | | | 21 734.6 | 2 819.1 | (9 897.4) | 14 656.3 | 329.6 | 14 985.9 |
Total comprehensive income for the year | | | - | - | 716.9 | 716.9 | (178.7) | 538.2 |
Profit for the year | | | - | - | 716.9 | 716.9 | (178.7) | 538.2 |
Share-based payments | | 6 | - | 119.1 | - | 119.1 | - | 119.1 |
Dividends paid | | 10 | - | - | (658.4) | (658.4) | - | (658.4) |
Transaction with non-controlling interests | | 21 | - | - | 41.1 | 41.1 | (41.1) | - |
Balance at 31 December 2015 | | | 21 734.6 | 2 938.2 | (9 797.8) | 14 875.0 | 109.8 | 14 984.8 |
1 Stated share capital as at 31 December 2012 was a nominal amount of 1,000 shares of R1,000 and shown as zero due to rounding.
The accompanying notes form an integral part of these consolidated financial statements.
| |
Sibanye Gold Annual Financial Report 2015 | 129 |
CONSOLIDATED STATEMENT OF CASH FLOWS
FOR THE YEAR ENDED 31 DECEMBER 2015
| | | | | |
Figures in million - SA rand | | Notes | 2015 | 2014 | 2013 |
CASH FLOWS FROM OPERATING ACTIVITIES | | | | | |
Cash generated by operations | | 26 | 6 130.4 | 7 081.4 | 6 840.0 |
Post-retirement health care payments | | | (0.1) | (2.4) | (2.7) |
Cash-settled share-based payments paid | | 6 | (42.2) | (166.6) | (3.9) |
Change in working capital | | 27 | (668.0) | 214.5 | 568.7 |
Cash generated from operating activities | | | 5 420.1 | 7 126.9 | 7 402.1 |
Interest received | | | 117.3 | 68.5 | 63.3 |
Interest paid | | 5 | (260.2) | (194.0) | (326.3) |
Guarantee fee received | | 16.1 | 9.6 | 53.6 | 47.0 |
Guarantee release fee | | 16.3 | (61.4) | - | - |
Royalties paid | | 28.1 | (395.4) | (650.1) | (249.0) |
Tax paid | | 28.2 | (656.3) | (1 347.1) | (304.8) |
Dividends paid | | 10 | (658.4) | (1 005.2) | (271.9) |
Net cash from operating activities | | | 3 515.3 | 4 052.6 | 6 360.4 |
| | | | | |
CASH FLOWS FROM INVESTING ACTIVITIES | | | | | |
Additions to property, plant and equipment | | 11 | (3 344.8) | (3 250.8) | (2 901.5) |
Proceeds on disposal of property, plant and equipment | | 11 | 65.1 | 22.6 | 6.9 |
Payment of environmental rehabilitation obligation | | 24 | (0.3) | (10.9) | (10.5) |
Contributions to environmental rehabilitation obligation funds | | 15 | (77.8) | (69.3) | (172.3) |
Investment in subsidiary | | 12 | - | (415.3) | - |
Loans granted to subsidiaries prior to acquisition | | 12 | - | (238.6) | - |
Cash acquired on acquisition of subsidiaries | | 12 | - | 38.1 | - |
Loan repaid by equity-accounted investee | | 14 | 20.9 | - | - |
Loan advanced to equity-accounted investee | | 14 | (3.0) | (384.6) | - |
Cash flow on loss of control of subsidiary | | | - | - | 5.9 |
Net cash used in investing activities | | | (3 339.9) | (4 308.8) | (3 071.5) |
| | | | | |
CASH FLOWS FROM FINANCING ACTIVITIES | | | | | |
Proceeds from shares issued on unbundling | | | - | - | 17 245.8 |
Loans repaid | | 23 | (1 572.9) | (2 296.9) | (9 840.0) |
Loans raised | | 23 | 1 552.0 | 1 623.6 | 7 620.0 |
Related-party loans repaid | | | - | - | (17 108.0) |
Financing costs capitalised | | | - | - | (9.1) |
Proceeds on shares issued to non-controlling interests | | | - | - | 3.0 |
Net cash used in financing activities | | | (20.9) | (673.3) | (2 088.3) |
| | | | | |
Net increase/(decrease) in cash and cash equivalents | | | 154.5 | (929.5) | 1 200.6 |
Cash and cash equivalents at beginning of the year | | | 562.9 | 1 492.4 | 291.8 |
Cash and cash equivalents at end of the year | | 19 | 717.4 | 562.9 | 1 492.4 |
The accompanying notes form an integral part of these consolidated financial statements.
| |
Sibanye Gold Annual Financial Report 2015 | 130 |
Table of Contents
NOTES TO THE CONSOLIDATED FINANCIAL STATEMENTS
FOR THE YEAR ENDED 31 DECEMBER 2015
1. ACCOUNTING POLICIES
The principal accounting policies applied in the preparation of these consolidated financial statements are set out below. Where an accounting policy is specific to a note, the policy is described in the note which it relates to. These policies have been consistently applied to all the periods presented, except for the adoption of new and revised standards and interpretations.
1.1 REPORTING ENTITY
Sibanye Gold Limited (Sibanye or the Company) is a South African focused gold producer, listed on the Main Board of the JSE Limited (JSE) and New York Stock Exchange (NYSE). Sibanye’s principal operations are Driefontein, Kloof, Beatrix and Cooke as well as a number of service company subsidiaries, collectively referred to as the Group.
1.2 BASIS OF PREPARATION
The consolidated financial statements for the year ended 31 December 2015 have been prepared on a going concern basis in accordance with International Financial Reporting Standards (IFRS), as issued by the International Accounting Standards Board, the South African Institute of Chartered Accountants Financial Reporting Guides issued by the Accounting Practices Committee and Financial Reporting Pronouncements issued by the Financial Reporting Standards Council, as well as the requirements of the South African Companies Act and JSE Listings Requirements. The consolidated financial statements have been prepared under the historical cost convention, except for financial assets and financial liabilities (including derivative instruments), which are measured at fair value through profit or loss.
STANDARDS, INTERPRETATIONS AND AMENDMENTS TO PUBLISHED STANDARDS EFFECTIVE FOR THE YEAR ENDED 31 DECEMBER 2015
During the financial year, the following new and revised accounting standards and amendments to standards became effective and had no impact on the Group’s financial statements:
| | |
Pronouncement | Title | Effective date |
IAS 19 (Amendment) | Defined Benefit Plans: Employee Contributions | 1 July 2014 |
Amendments to 6 standards | Improvements to IFRS 2010-2012 cycle | 1 July 2014 |
Amendments to 4 standards | Improvements to IFRS 2011-2013 cycle | 1 July 2014 |
STANDARDS, INTERPRETATIONS AND AMENDMENTS TO PUBLISHED STANDARDS WHICH ARE NOT YET EFFECTIVE
Certain new standards, amendments and interpretations to existing standards have been published that apply to the Group’s accounting periods beginning on or after 1 January 2016 but have not been early adopted by the Group. Other than disclosure, the impact of these standards is not expected to be significant. The standards, amendments and interpretations that are applicable to the Group are:
| | |
Pronouncement | Title | Effective date1 |
IFRS 9 (New standard) | Financial Instruments IFRS 9 arises from a three-part project to replace IAS 39 Financial Instruments: Recognition and Measurement. | 1 January 2018 |
Amendments to IFRS 10 and IAS 28 | Sale or Contribution of Assets between an Investor and its Associate or Joint Venture The amendments address a conflict between the requirements of IAS 28 Investments in Associates and Joint Ventures and IFRS 10 Consolidated Financial Statements, and clarify that in a transaction involving an associate or joint venture the extent of gain or loss recognition depends on whether the assets sold or contributed constitute a business. | 1 January 2016 |
IFRS 11 (Amendment) | Accounting for Acquisitions of Interests in Joint Operations The amendments add new guidance on how to account for the acquisition of an interest in a joint operation that constitutes a business which specify the appropriate accounting treatment for such acquisitions. | 1 January 2016 |
| |
Sibanye Gold Annual Financial Report 2015 | 131 |
NOTES TO THE CONSOLIDATED FINANCIAL STATEMENTS continued
FOR THE YEAR ENDED 31 DECEMBER 2015
| | |
Pronouncement | Title | Effective date 1 |
IFRS 15 (New standard) | Revenue from Contracts with Customers IFRS 15 replaces IAS 11 Construction contracts, IAS 18 Revenue, IFRIC 13 Customer Loyalty Programmes, IFRIC 15 Agreements for the Construction of Real Estate, IFRIC 18 Transfers of Assets from Customers and SIC-31 Revenue - Barter Transactions Involving Advertising Services. IFRS 15 specifies how and when an IFRS reporter will recognise revenue as well as requiring such entities to provide users of financial statements with more informative, relevant disclosures. The standard provides a single, principles based five-step model to be applied to all contracts with customers. | 1 January 2018 |
IFRS 16 (New standard) | Leases IFRS 16 replaces the previous lease standard IAS 17 Leases and related interpretations. IFRS 16 has one model for lessees which will result in almost all leases being included in the Statement of Financial position. | 1 January 2019 |
IAS 1 (Amendment) | Disclosure Initiative The amendments provide additional guidance on the application of materiality and aggregation when preparing financial statements. | 1 January 2016 |
Amendments to IAS 16 and IAS 38 | Clarification of Acceptable Methods of Depreciation and Amortisation The amendments clarify the basis for the calculation of depreciation and amortisation as being the expected pattern of consumption of the future economic benefits of the asset. | 1 January 2016 |
Amendments to 4 standards | Improvements to IFRSs 2012-2014 Cycle | 1 January 2016 |
1 Effective date refers to annual period beginning on or after said date
SIGNIFICANT ACCOUNTING JUDGEMENTS AND ESTIMATES
Use of estimates: The preparation of the financial statements requires the Group’s management to make estimates and assumptions that affect the reported amounts of assets and liabilities and disclosure of contingent assets and liabilities at the date of the financial statements, and the reported amounts of revenues and expenses during the reporting period. The determination of estimates requires the exercise of judgement based on various assumptions and other factors such as historical experience, current and expected economic conditions, and in some cases actuarial techniques. Actual results could differ from those estimates.
The more significant areas requiring the use of management estimates and assumptions relate to Mineral Reserves that are the basis of future cash flow estimates and unit-of-production depreciation, depletion and amortisation calculations; impairments, reversal of impairments, write-downs of inventory to net realisable value; deferred tax; borrowings; environmental, reclamation and closure obligations; and contingent liabilities.
Estimates and judgements are continually evaluated and are based on historical experience and other factors, including expectations of future events that are believed to be reasonable under the circumstances.
The estimates and assumptions that have a significant risk of causing a material adjustment to the carrying amounts of assets and liabilities within the financial year are discussed under the relevant note of the item affected.
| |
Sibanye Gold Annual Financial Report 2015 | 132 |
NOTES TO THE CONSOLIDATED FINANCIAL STATEMENTS continued
FOR THE YEAR ENDED 31 DECEMBER 2015
1.3 CONSOLIDATION
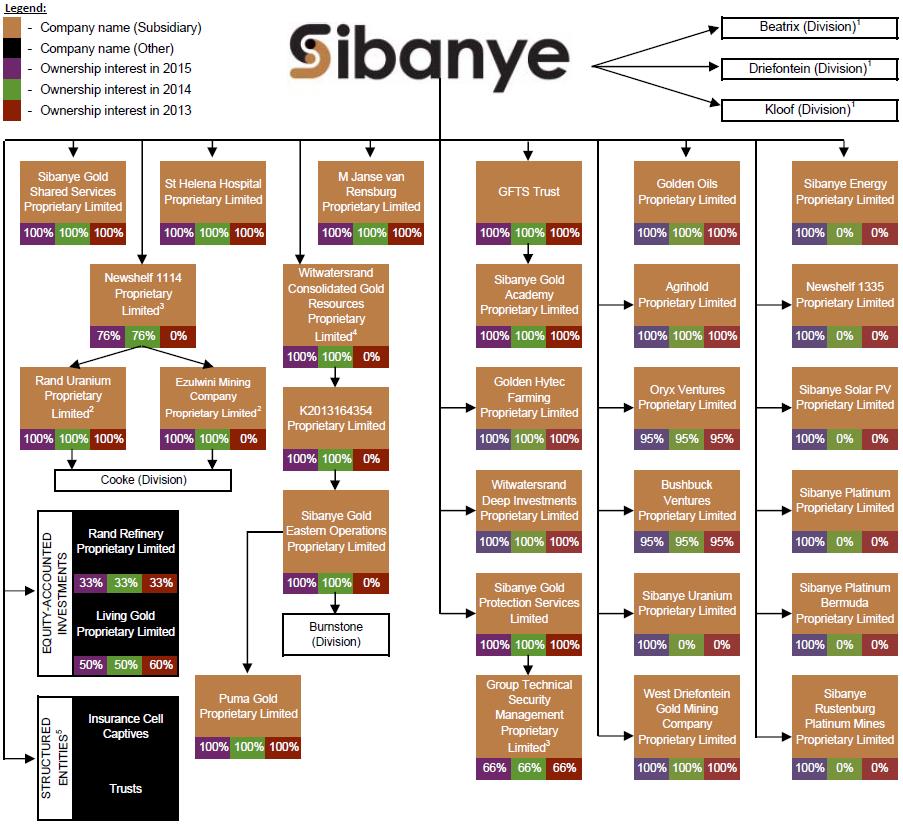
1 Beatrix, Driefontein and Kloof are divisions of Sibanye and not separate legal entities. These are also three of the Group’s operating segments (refer to note 2).
2 Rand Uranium Proprietary Limited (Rand Uranium) and Ezulwini Mining Company Proprietary Limited (Ezulwini) together own a number of underground and surface mining operations. These operations are reported to and managed by the Group’s chief operating decision maker (the Executive Committee) as a separate segment, namely Cooke.
3 The non-controlling interests in the statement of changes in equity relates to the attributable share of accumulated profits of the Newshelf 1114 Proprietary Limited (Newshelf 1114) group and Goldfields Technical Security Management Proprietary Limited (refer to note 21).
4 Witwatersrand Consolidated Gold Resources Proprietary Limited (Wits Gold) has ceded and pledged its shares in K2013164354 Proprietary Limited (K2013) (a dormant entity) and K2013 has ceded and pledged it shares in Sibanye Gold Eastern Operations Proprietary Limited (SGEO) in favour of the lenders of the Burnstone Debt (refer to note 23(c)).
5 The Group has no current or contractual obligation to provide financial support to any of its structured entities.
SUBSIDIARIES
Subsidiaries are all entities over which the Group exercises control. The Group controls an entity when it is exposed to, or has rights to, variable returns from its involvement with the entity and has the ability to affect those returns through its power over the entity. Subsidiaries are consolidated from the date on which control is obtained by the Group until the date on which control ceases.
| |
Sibanye Gold Annual Financial Report 2015 | 133 |
NOTES TO THE CONSOLIDATED FINANCIAL STATEMENTS continued
FOR THE YEAR ENDED 31 DECEMBER 2015
Inter-company transactions, balances and unrealised gains on transactions between Group companies are eliminated. Unrealised losses are also eliminated. Accounting policies of subsidiaries have been changed where necessary to ensure consistency with the policies adopted by the Group.
STRUCTURED ENTITIES
Structured entities are those entities that have been designed so that voting (or similar) rights are not the dominant factor in deciding who controls the entity. Structured entities controlled by the Group are consolidated.
TRANSACTIONS WITH SHAREHOLDERS OF SIBANYE
Transactions with owners in the capacity as equity participants are not recognised in profit or loss, but instead are recognised in equity with a corresponding change in assets or liabilities.
1.4 FOREIGN CURRENCIES
FUNCTIONAL AND PRESENTATION CURRENCY
Items included in the financial statements of each of the Group’s entities are measured using the currency of the primary economic environment in which the entity operates (the functional currency) which is South African rand. The consolidated financial statements are presented in South African rand, which is the Group’s presentation currency.
TRANSACTIONS AND BALANCES
Foreign currency transactions are translated into the functional currency using the exchange rates prevailing at the dates of the transactions. Translation of monetary assets and liabilities into the functional currency is done as at 31 December 2015. Foreign exchange gains and losses resulting from the settlement of such transactions and from the translation of monetary assets and liabilities denominated in foreign currencies, are recognised in profit or loss.
1.5 COMPARATIVES
Where necessary comparative periods may be adjusted to conform to changes in presentation.
With effect from 1 January 2015 the Group has reclassified exploration and evaluation assets as a separate class of property, plant and equipment in order to enhance disclosure. The 31 December 2013 carrying value of mine development, infrastructure and other has decreased by R244.3 million, which has been reclassified as exploration and evaluation assets. The 31 December 2014 carrying value of mine development, infrastructure and other, and land, mineral rights and rehabilitation has decreased by R262.8 million and R1,622.2 million, respectively, which have been reclassified as exploration and evaluation assets.
The reclassifications have no impact on the statements of financial position.
| |
Sibanye Gold Annual Financial Report 2015 | 134 |
NOTES TO THE CONSOLIDATED FINANCIAL STATEMENTS continued
FOR THE YEAR ENDED 31 DECEMBER 2015
2. SEGMENT REPORTING
ACCOUNTING POLICY
Operating segments are reported in a manner consistent with the internal reporting provided to the chief operating decision maker and is based on individual mining operations. The chief operating decision maker, who is responsible for allocating resources and assessing performance of the operating segments, has been identified as the Executive Committee that makes strategic decisions.
| | | | | | | |
Figures in million - SA rand | | Group | Driefontein | Kloof | Beatrix | Cooke | Corporate1 |
31 December 2015 | | | | | | | |
Revenue | | 22 717.4 | 8 236.0 | 6 691.4 | 4 815.5 | 2 974.5 | - |
Underground revenue | | 20 515.0 | 7 284.1 | 6 112.8 | 4 555.7 | 2 562.4 | - |
Surface revenue | | 2 202.4 | 951.9 | 578.6 | 259.8 | 412.1 | - |
Operating costs2 | | (16 380.4) | (5 234.2) | (4 777.2) | (3 391.0) | (2 978.0) | - |
Underground operating costs | | (14 940.8) | (4 681.2) | (4 454.9) | (3 184.5) | (2 620.2) | - |
Surface operating costs | | (1 439.6) | (553.0) | (322.3) | (206.5) | (357.8) | - |
| | | | | | | |
Operating profit3 | | 6 337.0 | 3 001.8 | 1 914.2 | 1 424.5 | (3.5) | - |
Amortisation and depreciation | | (3 636.6) | (1 142.6) | (1 029.3) | (739.4) | (704.6) | (20.7) |
Net operating profit | | 2 700.4 | 1 859.2 | 884.9 | 685.1 | (708.1) | (20.7) |
Investment income | | 257.0 | 67.5 | 50.6 | 31.3 | 27.1 | 80.5 |
Finance expense | | (561.8) | (147.7) | (150.1) | (57.2) | (61.3) | (145.5) |
Share-based payments | | (274.4) | (35.1) | (27.6) | (23.5) | - | (188.2) |
Exploration and feasibility costs | | (23.6) | (13.9) | (0.6) | (0.9) | (1.9) | (6.3) |
Net other costs4 | | (551.5) | (64.0) | (59.8) | (46.4) | (28.2) | (353.1) |
Non-recurring items5 | | (230.1) | (2.9) | 7.2 | (8.4) | (31.8) | (194.2) |
Royalties | | (400.6) | (196.8) | (98.4) | (88.7) | (16.7) | - |
Current tax | | (696.7) | (430.8) | (97.4) | (153.4) | - | (15.1) |
Deferred tax | | 319.5 | 53.4 | 0.9 | 18.0 | 122.0 | 125.2 |
Profit for the year | | 538.2 | 1 088.9 | 509.7 | 355.9 | (698.9) | (717.4) |
Attributable to: | | | | | | | |
Owners of the parent | | 716.9 | 1 088.9 | 509.7 | 355.9 | (519.9) | (717.7) |
Non-controlling interests | | (178.7) | - | - | - | (179.0) | 0.3 |
Sustaining capital expenditure | | 668.9 | 249.2 | 225.6 | 86.1 | 92.9 | 15.1 |
Ore reserve development | | 2 304.9 | 727.0 | 840.6 | 510.4 | 226.9 | - |
Growth projects | | 371.0 | 18.0 | 63.7 | - | 17.6 | 271.7 |
Total capital expenditure | | 3 344.8 | 994.2 | 1 129.9 | 596.5 | 337.4 | 286.8 |
1 Corporate represents the items to reconcile segment data to the consolidated financial statement totals. This does not represent a separate segment as it does not generate mining revenue.
2 Operating costs is defined as cost of sales before amortisation and depreciation.
3 Operating profit is defined as revenue minus operating costs.
4 Net other costs consists of loss on financial instruments; loss on foreign exchange differences; other income and other costs as detailed in profit or loss. Corporate net other costs includes the share of results of equity-accounted investees after tax as detailed in profit or loss.
5 Non-recurring items consists of net loss on derecognition of financial guarantee asset and liability; profit on disposal of property, plant and equipment, transaction costs and restructuring costs as detailed in profit or loss.
| |
Sibanye Gold Annual Financial Report 2015 | 135 |
NOTES TO THE CONSOLIDATED FINANCIAL STATEMENTS continued
FOR THE YEAR ENDED 31 DECEMBER 2015
| | | | | | | |
Figures in million - SA rand | | Group | Driefontein | Kloof | Beatrix | Cooke1 | Corporate2 |
31 December 2014 | | | | | | | |
Revenue | | 21 780.5 | 7 829.4 | 7 502.8 | 4 566.3 | 1 882.0 | - |
Underground revenue | | 19 908.7 | 7 200.2 | 6 887.3 | 4 228.8 | 1 592.4 | - |
Surface revenue | | 1 871.8 | 629.2 | 615.5 | 337.5 | 289.6 | - |
Operating costs3 | | (14 311.4) | (4 912.3) | (4 502.3) | (3 204.0) | (1 692.8) | - |
Underground operating costs | | (13 032.2) | (4 427.6) | (4 087.0) | (3 052.1) | (1 465.5) | - |
Surface operating costs | | (1 279.2) | (484.7) | (415.3) | (151.9) | (227.3) | - |
| | | | | | | |
Operating profit4 | | 7 469.1 | 2 917.1 | 3 000.5 | 1 362.3 | 189.2 | - |
Amortisation and depreciation | | (3 254.7) | (1 129.3) | (1 322.3) | (468.4) | (308.3) | (26.4) |
Net operating profit | | 4 214.4 | 1 787.8 | 1 678.2 | 893.9 | (119.1) | (26.4) |
Investment income | | 183.2 | 48.3 | 42.7 | 24.5 | 14.7 | 53.0 |
Finance expense | | (400.0) | (152.8) | (132.6) | (41.8) | (56.5) | (16.3) |
Share-based payments | | (417.9) | (69.1) | (58.2) | (45.9) | - | (244.7) |
Exploration and feasibility costs | | (15.1) | - | - | (9.4) | (5.1) | (0.6) |
Net other costs5 | | (735.7) | (86.3) | (56.6) | (56.5) | (5.8) | (530.5) |
Non-recurring items6 | | (63.4) | (95.1) | (152.0) | 469.4 | (17.9) | (267.8) |
Royalties | | (430.5) | (165.5) | (174.5) | (82.1) | (8.4) | - |
Current tax | | (879.2) | (339.2) | (379.6) | (153.9) | - | (6.5) |
Deferred tax | | 51.1 | 9.8 | 71.3 | (128.5) | 10.3 | 88.2 |
Profit for the year | | 1 506.9 | 937.9 | 838.7 | 869.7 | (187.8) | (951.6) |
Attributable to: | | | | | | | |
Owners of the parent | | 1 551.5 | 937.9 | 838.7 | 869.7 | (143.2) | (951.6) |
Non-controlling interests | | (44.6) | - | - | - | (44.6) | - |
Sustaining capital expenditure | | 991.5 | 465.3 | 355.7 | 101.9 | 51.7 | 16.9 |
Ore reserve development | | 2 126.5 | 683.6 | 879.8 | 446.1 | 117.0 | - |
Growth projects | | 132.8 | - | - | - | 61.2 | 71.6 |
Total capital expenditure | | 3 250.8 | 1 148.9 | 1 235.5 | 548.0 | 229.9 | 88.5 |
1 Cooke’s performance is for the seven months ended 31 December 2014, as Cooke was only acquired on 15 May 2014 (refer to note 12).
2 Corporate represents the items to reconcile segment data to consolidated financial statement totals. This does not represent a separate segment as it does not generate mining revenue.
3 Operating costs is defined as cost of sales before amortisation and depreciation.
4 Operating profit is defined as revenue minus operating cost.
5 Net other costs consists of loss on financial instruments; loss on foreign exchange differences; other income and other costs as detailed in profit or loss. Corporate net other costs includes the share of results of equity-accounted investees after tax as detailed in profit or loss.
6 Non-recurring items consists of impairment; reversal of impairment; profit on disposal of property, plant and equipment; transaction costs and restructuring costs as detailed in profit or loss.
| |
Sibanye Gold Annual Financial Report 2015 | 136 |
NOTES TO THE CONSOLIDATED FINANCIAL STATEMENTS continued
FOR THE YEAR ENDED 31 DECEMBER 2015
| | | | | | | |
Figures in million - SA rand | | | Group | Driefontein | Kloof | Beatrix | Corporate1 |
31 December 2013 | | | | | | | |
Revenue | | | 19 331.2 | 8 162.7 | 6 954.4 | 4 214.1 | - |
Underground revenue | | | 17 663.6 | 7 354.6 | 6 323.4 | 3 985.6 | - |
Surface revenue | | | 1 667.6 | 808.1 | 631.0 | 228.5 | - |
Operating costs2 | | | (11 973.3) | (4 881.2) | (4 100.7) | (2 991.4) | - |
Underground operating costs | | | (11 030.5) | (4 421.9) | (3 762.1) | (2 846.5) | - |
Surface operating costs | | | (942.8) | (459.3) | (338.6) | (144.9) | - |
| | | | | | | |
Operating profit3 | | | 7 357.9 | 3 281.5 | 2 853.7 | 1 222.7 | - |
Amortisation and depreciation | | | (3 103.9) | (1 458.0) | (1 096.5) | (528.1) | (21.3) |
Net operating profit | | | 4 254.0 | 1 823.5 | 1 757.2 | 694.6 | (21.3) |
Investment income | | | 160.3 | 55.0 | 47.4 | 27.5 | 30.4 |
Finance expense | | | (420.3) | (193.6) | (152.3) | (72.8) | (1.6) |
Share-based payments | | | (305.8) | (61.1) | (47.2) | (41.8) | (155.7) |
Net other costs4 | | | (24.7) | (67.0) | (70.5) | (40.4) | 153.2 |
Non-recurring items5 | | | (1 294.4) | (159.5) | (125.6) | (900.1) | (109.2) |
Royalties | | | (414.6) | (198.3) | (147.1) | (69.2) | - |
Current tax | | | (809.8) | (427.7) | (273.5) | (97.5) | (11.1) |
Deferred tax | | | 553.6 | 174.0 | 18.3 | 336.3 | 25.0 |
Profit for the year | | | 1 698.3 | 945.3 | 1 006.7 | (163.4) | (90.3) |
Attributable to: | | | | | | | |
Owners of the parent | | | 1 692.4 | 945.3 | 1 006.7 | (163.4) | (96.2) |
Non-controlling interests | | | 5.9 | - | - | - | 5.9 |
Sustaining capital expenditure | | | 1 018.5 | 320.2 | 459.8 | 200.6 | 37.9 |
Ore reserve development | | | 1 883.0 | 702.8 | 843.8 | 336.4 | - |
Total capital expenditure | | | 2 901.5 | 1 023.0 | 1 303.6 | 537.0 | 37.9 |
1 Corporate represents the items to reconcile segment data to consolidated financial statement totals. This does not represent a separate segment as it does not generate mining revenue.
2 Operating costs is defined as cost of sales before amortisation and depreciation.
3 Operating profit is defined as revenue minus operating cost.
4 Net other costs consists of loss on financial instruments; loss on foreign exchange differences; other income and other costs as detailed in profit or loss. Corporate net other costs includes the share of results of equity-accounted investees after tax as detailed in profit or loss.
5 Non-recurring items consists of impairment; profit on disposal of property, plant and equipment; loss on loss of control of subsidiary; transaction costs and restructuring costs as detailed in profit or loss.
3. REVENUE
ACCOUNTING POLICY
Revenue is recognised to the extent that it is probable that economic benefits will flow to the Group and the amount of revenue can be reliably measured.
Revenue arising from gold sales is recognised at the fair value of the consideration received or receivable, once the significant risks and rewards of ownership have passed to the buyer. These criteria are typically met when the gold is delivered to the refinery. The price of gold is determined by market forces.
| | | | | |
Figures in million - SA rand | | | 2015 | 2014 | 2013 |
Revenue from mining activities | | | 22 717.4 | 21 780.5 | 19 331.2 |
Total revenue | | | 22 717.4 | 21 780.5 | 19 331.2 |
| |
Sibanye Gold Annual Financial Report 2015 | 137 |
NOTES TO THE CONSOLIDATED FINANCIAL STATEMENTS continued
FOR THE YEAR ENDED 31 DECEMBER 2015
4. COST OF SALES
ACCOUNTING POLICY
The following accounting policies relates to some costs that are included in cost of sales:
SHORT-TERM EMPLOYEE BENEFITS
Short-term employee benefits are expensed as the related service is provided. A liability is recognised for the amount expected to be paid if the Group has a present legal or constructive obligation to pay this amount as a result of past service provided by the employee and the obligation can be reliably estimated.
PENSION AND PROVIDENT FUNDS
The Group operates a defined contribution retirement plan and contributes to a number of industry-based defined contribution retirement plans. The retirement plans are funded by payments from employees and Group companies.
Contributions to defined contribution funds are expensed as incurred.
| | | | | |
Figures in million - SA rand | | Notes | 2015 | 2014 | 2013 |
Salaries and wages | | | (7 345.0) | (6 664.9) | (6 155.9) |
Consumable stores | | 17 | (3 995.7) | (3 480.4) | (2 720.7) |
Utilities | | | (3 128.2) | (2 753.3) | (2 315.4) |
Mine contracts | | | (1 457.9) | (1 136.4) | (928.2) |
Other | | | (2 758.5) | (2 402.9) | (1 736.1) |
Ore reserve development costs capitalised | | 11 | 2 304.9 | 2 126.5 | 1 883.0 |
Operating costs | | | (16 380.4) | (14 311.4) | (11 973.3) |
Amortisation and depreciation | | 11 | (3 636.6) | (3 254.7) | (3 103.9) |
Total cost of sales | | | (20 017.0) | (17 566.1) | (15 077.2) |
All employees are members of various defined contribution retirement plans. The cost of providing retirement benefits for the year amounted to R691.1 million (2014: R558.5 million and 2013: R548.6 million).
5. FINANCE EXPENSE
ACCOUNTING POLICY
Finance expense comprises interest on borrowings, post-retirement healthcare obligation and environmental rehabilitation obligation offset by borrowing costs capitalised on qualifying assets.
Interest payable on borrowings is recognised in profit or loss over the term of the borrowings using the effective interest method. Cash flows from interest paid are classified under operating activities in the statement of cash flows.
| | | | | |
Figures in million - SA rand | | Notes | 2015 | 2014 | 2013 |
Interest charge on: | | | | | |
Borrowings - interest paid | | 23 | (247.9) | (187.7) | (319.4) |
Borrowings - unwinding of amortised cost | | 23 | (102.3) | (43.3) | - |
Environmental rehabilitation obligation | | 24 | (197.9) | (161.5) | (92.7) |
Post-retirement healthcare obligation | | | (1.4) | (1.2) | (1.3) |
Other | | | (12.3) | (6.3) | (6.9) |
Total finance expense | | | (561.8) | (400.0) | (420.3) |
| |
Sibanye Gold Annual Financial Report 2015 | 138 |
NOTES TO THE CONSOLIDATED FINANCIAL STATEMENTS continued
FOR THE YEAR ENDED 31 DECEMBER 2015
6. SHARE-BASED PAYMENTS
ACCOUNTING POLICY
The Group operates an equity-settled compensation plan in which certain employees of the Group participate. The fair value of the equity-settled instruments is measured by reference to the fair value of the equity instrument granted.
Fair value is based on market prices of the equity-settled instruments granted, if available, taking into account the terms and conditions upon which those equity-settled instruments were granted. Fair value of equity-settled instruments granted is estimated using appropriate valuation models and appropriate assumptions at the grant date. Non-market vesting conditions (service period prior to vesting) are not taken into account when estimating the fair value of the equity-settled instruments at grant date. Market conditions are taken into account in determining the fair value at grant date.
The grant date fair value of the equity-settled instruments is recognised as an employee benefit expense over the vesting period based on the Group’s estimate of the number of instruments that will eventually vest, with a corresponding increase in the share-based payment reserve. Vesting assumptions for non-market conditions are reviewed at each reporting date to ensure they reflect current expectations.
The Group also operates a cash-settled compensation plan in which certain employees of the Group participate. The grant date fair value of the cash-settled instruments is equal to the value of the equity-settled instrument granted on the same grant date.
The grant date fair value of the cash-settled instruments is recognised as an employee benefit expense over the vesting period based on the Group’s estimate of the number of instruments that will eventually vest, with a corresponding increase in the share-based payment obligation. At each reporting date the obligation is remeasured to the fair value of the instrument, to reflect the potential outflow of cash resources to settle the liability, with a corresponding adjustment to gain or loss on financial instrument in profit or loss. Vesting assumptions for non-market conditions are reviewed at each reporting date to ensure they reflect current expectations.
Where the terms of an equity-settled or a cash-settled award are modified, the originally determined expense is recognised as if the terms had not been modified. In addition, an expense is recognised for any modification, which increases the total fair value of the share-based payment arrangement, or is otherwise beneficial to the participant as measured at the date of the modification.
| | | | | |
Figures in million - SA rand | | | 2015 | 2014 | 2013 |
(a) Sibanye Gold Limited 2013 Share Plan | | | | | |
Performance shares | | | (96.2) | (147.7) | (154.3) |
Bonus shares | | | (22.9) | (28.1) | (17.8) |
(b) Sibanye Gold Limited 2013 Phantom Share Scheme | | | | | |
Performance shares | | | (136.4) | (138.7) | (41.9) |
Bonus shares | | | (17.7) | (96.7) | (48.2) |
Phantom share dividends | | | (1.2) | (6.7) | (2.3) |
(c) Gold Fields Limited 2012 Share Plan | | | | | |
Performance shares | | | - | - | (13.1) |
Bonus shares | | | - | - | (2.9) |
(d) Gold Fields Limited 2005 Share Plan | | | | | |
Performance vesting restricted shares | | | - | - | (23.1) |
Performance allocated share appreciation rights | | | - | - | (2.2) |
Total share-based payments | | | (274.4) | (417.9) | (305.8) |
(a) SIBANYE GOLD LIMITED 2013 SHARE PLAN
On 21 November 2012 the shareholder of Sibanye approved the adoption of the Sibanye Gold Limited 2013 Share Plan (SGL Share Plan) with effect from the date of listing. The SGL Share Plan provides for two methods of participation, namely Performance Shares (PS) and the Bonus Shares (BS). This plan seeks to attract, retain, motivate and reward participating employees on a basis which seeks to align the interests of such employees with those of the shareholders.
| |
Sibanye Gold Annual Financial Report 2015 | 139 |
NOTES TO THE CONSOLIDATED FINANCIAL STATEMENTS continued
FOR THE YEAR ENDED 31 DECEMBER 2015
The Remuneration Committee makes an annual conditional award of PS to the CEO, CFO, SVPs and Vice Presidents (VPs). The number of PS awarded to an employee is based on the employee’s annual guaranteed remuneration, grade and performance. The actual number of PS which vest is determined by Sibanye’s share price performance measured against the performance of a peer group, being Harmony Gold Mining Company Limited (Harmony), Pan African Resources PLC and Gold One International Limited (Gold One) (subsequently delisted), over a performance period of three years. This peer group is determined and approved by the Remuneration Committee. The PS, which vest, are based on the relative change in the Sibanye share price compared to the respective share prices of the individual companies within the peer group and with discretion allowed due to the small sample size. For any PS award to be settled to executives, an internal company performance target is required to be met before the external relative measure is applied. The target performance criterion is set at 85% of Sibanye’s expected gold production over the three-year measurement period as set out in the business plans of Sibanye as approved by the Board. Only once the internal measure has been achieved, will the external measure (Sibanye’s share price performance measured against the abovementioned peer group) be applied to determine the scale of the vesting of awards of PS.
The Remuneration Committee makes an annual conditional award of BS to each executive director and senior executive. The size of the award depends on the individual’s annual cash bonus, which is determined by actual performance against predetermined targets. Restricted BS are allocated on the ratio of two-thirds of an individual’s annual bonus. The BS vest in two equal parts at nine months and 18 months after the award date. Dividends are payable on the BS during the holding period.
Details of the options granted under this plan to employees are detailed below:
| | | | | | | | |
Performance shares (PS) | | | | Bonus Shares (BS) |
| 2013 | 2014 | 2015 | | Number of instruments | | 2015 | 2014 | 2013 |
- | 28 083 703 | 23 289 262 | | Outstanding at beginning of the year | | 595 012 | 1 135 455 | - |
| | | | Movement during the year: | | | | |
28 568 317 | - | - | | Granted to replace Gold Fields share plans | | - | - | 702 915 |
4 118 870 | 2 953 057 | 3 059 058 | | Granted during the year | | 862 702 | 1 275 979 | 1 135 455 |
(1 523 111) | (5 567 771) | (16 690 497) | | Exercised and released | | (1 010 209) | (1 672 579) | (638 086) |
(3 080 373) | (2 179 727) | (259 751) | | Forfeited | | (30 239) | (143 843) | (64 829) |
28 083 703 | 23 289 262 | 9 398 072 | | Outstanding at end of the year | | 417 266 | 595 012 | 1 135 455 |
The fair value of the above PS equity instruments granted during the year were valued using the Monte Carlo Simulation model. For the BS equity instruments, a future trading model is used to estimate the loss in value to the holders of bonus shares due to trading restrictions. The actual valuation is developed using a Monte Carlo analysis of the future share price of Sibanye.
The inputs to the models for options granted during the year were as follows:
| | | | | | | | |
Performance shares (PS) | | | | Bonus Shares (BS) |
| 2013 | 2014 | 2015 | | | | 2015 | 2014 | 2013 |
| 64.6% | 56.4% | 42.3% | | – weighted average historical volatility (based on a statistical analysis of the share price on a weighted moving average basis for the expected term of the option) | | 42.3% | 56.4% | 64.6% |
| 3 | 3 | 3 | | – expected term (years) | | n/a | n/a | n/a |
n/a | n/a | n/a | | – expected term (months) | | 9 - 18 | 9 - 18 | 9 - 18 |
| 2.5% | 4.7% | 4.9% | | – expected dividend yield | | 4.9% | 4.7% | 2.5% |
| 6.0% | 5.7% | 6.4% | | – weighted average three-year risk-free interest rate (based on SA interest rates) | | 6.4% | 5.7% | 6.0% |
n/a | n/a | n/a | | – marketability discount | | 2.1% | 2.2% | 3.0% |
| 12.55 | 38.61 | 37.41 | | – weighted average fair value | | 25.56 | 24.94 | 12.57 |
The compensation cost related to awards not yet recognised under the plan at 31 December 2015 amounts to R134.2 million and is to be spread over three years. 1,287,074 options had vested and were exercisable as at 31 December 2015.
At the Annual General Meeting (AGM) the directors of Sibanye were authorised to issue and allot all or any of such shares required for the plans, but in aggregate all plans may not exceed 70,619,126 (10%) of the total issued ordinary shares capital of the Company. An individual participant may also not be awarded an aggregate of shares from all or any such plans exceeding 7,061,913 (1%) of the Company’s total issued ordinary share capital. The unexercised options and shares under all plans represented 11,102,412 (1.2%) of the total issued ordinary share capital of Sibanye at 31 December 2015.
| |
Sibanye Gold Annual Financial Report 2015 | 140 |
NOTES TO THE CONSOLIDATED FINANCIAL STATEMENTS continued
FOR THE YEAR ENDED 31 DECEMBER 2015
(b) SIBANYE GOLD LIMITED 2013 PHANTOM SHARE SCHEME
On 14 May 2013 Sibanye’s Remuneration Committee limited the issuance of share options for the 2013 allocation under the SGL Share Plan to senior management only. Middle and certain senior management, who previously participated in the equity-settled share option scheme, now participate in a cash-settled share scheme, the Sibanye Gold 2013 Phantom Share Scheme (the SGL Phantom Scheme). Notwithstanding that the SGL Phantom Scheme is not subject to compliance with the JSE Listings Requirements as it is a purely cash-settled remuneration scheme, the SGL Share Plan rules apply, in all material aspects, to the SGL Phantom Scheme, other than the issue of new shares to participants.
Details of the phantom shares granted under this scheme to employees are detailed below:
| | | | | | | | |
Performance shares (PS) | | | | Bonus Shares (BS) |
| 2013 | 2014 | 2015 | | Number of instruments | | 2015 | 2014 | 2013 |
- | 16 429 766 | 22 212 627 | | Outstanding at beginning of the year | | 1 731 262 | 6 529 404 | - |
| | | | Movement during the year: | | | | |
17 539 440 | 7 119 727 | - | | Granted during the year | | - | 3 604 577 | 7 002 146 |
(55 393) | (125 932) | (773 814) | | Vested and paid | | (1 668 503) | (8 076 789) | (68 007) |
(1 054 281) | (1 210 934) | (1 239 938) | | Forfeited | | (62 759) | (325 930) | (404 735) |
16 429 766 | 22 212 627 | 20 198 875 | | Outstanding at end of the year | | - | 1 731 262 | 6 529 404 |
The grant date fair value of the above PS and BS cash-settled instruments granted during the year were valued using the Monte Carlo Simulation model and a future trading model, respectively, as with the equity-settled instruments above. As the cash-settled and equity-settled instruments are issued on the same day the grant date fair value assumptions of the cash-settled instruments is the same as for the equity-settled instruments.
The fair value of the cash-settled instruments at reporting date, used to value the share-based payment obligation, is determined using the same assumptions as for the grant date valuation. However, the respective models take into account the actual share data of the peer group for the period from the grant date to the reporting date.
The compensation cost related to awards not yet recognised under the scheme at 31 December 2015 amounts to R115.0 million and is to be spread over 14 months.
Reconciliation of the share-based payment obligations:
| | | | | |
Figures in million - SA rand | | | 2015 | 2014 | 2013 |
Balance at beginning of the year | | | 399.2 | 121.4 | - |
Share-based payments expense | | | 155.3 | 242.1 | 92.5 |
Fair value adjustment of obligation1 | | | 87.3 | 202.3 | 32.8 |
Cash-settled share-based payments paid2 | | | (42.2) | (166.6) | (3.9) |
Balance at end of the year | | | 599.6 | 399.2 | 121.4 |
| | | | | |
Reconciliation of the non-current and current portion of the share-based payments obligations: | | | | | |
Share-based payment obligations | | | 599.6 | 399.2 | 121.4 |
Current portion of share-based payment obligations | | | (463.0) | (20.8) | (45.2) |
Non-current portion of share-based payment obligation | | | 136.6 | 378.4 | 76.2 |
1 The fair value adjustment at reporting date is included in loss on financial instruments in profit or loss and not as part of share-based payments expense.
2 Payments during the year relate to the proportionate vesting of shares to employees who have left the Group in good faith. BS options under the SGL Share Plan are issued on grant date and thus dividends are paid when the Company declares a dividend. Similarly the BS holders under the SGL Phantom Scheme receive share-based payments to the equivalent of dividends paid, which were also paid during the year.
(c) GOLD FIELDS LIMITED 2012 SHARE PLAN
At the Gold Fields AGM on 14 May 2012 Gold Fields shareholders approved the adoption of the Gold Fields Limited 2012 Share Plan (the 2012 Plan) to replace the Gold Fields Limited 2005 Share Plan. The 2012 Plan provided for two methods of participation, namely PS and BS.
As a result of the unbundling all unvested options on the date of the unbundling were converted to instruments under the SGL Share Plan as described in (a). Sibanye employees had to exercise all options that vested proportionately up to the date of unbundling.
| |
Sibanye Gold Annual Financial Report 2015 | 141 |
NOTES TO THE CONSOLIDATED FINANCIAL STATEMENTS continued
FOR THE YEAR ENDED 31 DECEMBER 2015
Details of the options granted under this scheme to Sibanye employees are detailed below:
| | | | | | | | |
Performance shares (PS) | | | | | | Bonus Shares (BS) |
| 2013 | 2014 | 2015 | | Number of instruments | | 2015 | 2014 | 2013 |
1 537 383 | - | - | | Outstanding at beginning of the year | | - | - | 256 451 |
| | | | Movement during the year: | | | | |
312 546 | - | - | | Granted during the year | | - | - | - |
(496 303) | - | - | | Exercised and released | | - | - | (137 265) |
(77 386) | - | - | | Transferred within the Gold Fields group | | - | - | (31 337) |
(1 276 240) | - | - | | Converted to Sibanye options | | - | - | (87 849) |
- | - | - | | Outstanding at end of the year | | - | - | - |
The shares that were granted during 2013 were as a result of the unbundling and took into account the current share prices and vesting percentage at the date of unbundling. The valuation was not done according to the Monte Carlo Simulation as in 2012 for options granted in the ordinary course of business.
(d) GOLD FIELDS LIMITED 2005 SHARE PLAN
At the Gold Fields AGM on 17 November 2005 shareholders approved the adoption of the Gold Fields Limited 2005 Share Plan (the 2005 Plan) to replace the GF Management Incentive Scheme approved in 1999. The 2005 Plan provided for two methods of participation, namely Performance Allocated Share Appreciation Rights (SARS) and Performance Vesting Restricted Share (PVRS).
As a result of the unbundling all unvested options on the date of the unbundling were converted to instruments under the SGL Share Plan as described in (a). Sibanye employees had to exercise all options that vested proportionately up to the date of unbundling.
The following information details the options granted under this scheme to Sibanye employees:
| | | | | |
| | | 2013 |
Number of instruments | | | PVRS | SARS | Average instrument price (cps) |
Outstanding at beginning of the year | | | 2 230 586 | 921 506 | 106.82 |
Movement during the year: | | | | | |
Granted during the year | | | 466 253 | 171 643 | 106.82 |
Exercised and released | | | (2 153 455) | (484 908) | 106.82 |
Transferred within the Gold Fields group | | | (2 605) | (4 077) | 106.82 |
Converted to Sibanye options | | | (540 779) | (604 164) | 106.82 |
Outstanding at end of the year | | | - | - | - |
7. IMPAIRMENTS
| | | | | |
Figures in million - SA rand | | Notes | 2015 | 2014 | 2013 |
Impairment of property, plant and equipment | | 11 | - | (155.5) | (821.0) |
Impairment of investment in equity-accounted investee | | 14 | - | (119.6) | - |
Total impairments | | | - | (275.1) | (821.0) |
8. ROYALTIES, AND MINING AND INCOME TAX
SIGNIFICANT ACCOUNTING JUDGEMENTS AND ESTIMATES
The Group is subject to income taxes in South Africa. Significant judgement is required in determining the liability for income taxes due to the complexity of legislation. There are many transactions and calculations for which the ultimate tax determination is uncertain during the ordinary course of business. The Group recognises liabilities for anticipated tax audit issues based on estimates of whether additional taxes will be due. Where the final tax outcome of these matters is different from the amounts that were initially recorded, such differences will impact the income tax and deferred tax provisions in the period in which such determination is made.
The Group recognises the net future tax benefit related to deferred tax assets to the extent that it is probable that the deductible temporary differences will reverse in the foreseeable future. Assessing the recoverability of deferred tax assets requires the Group to make significant estimates related to expectations of future taxable income. Estimates of future taxable income are based on forecast cash flows from operations and the application of existing tax laws in South Africa.
| |
Sibanye Gold Annual Financial Report 2015 | 142 |
NOTES TO THE CONSOLIDATED FINANCIAL STATEMENTS continued
FOR THE YEAR ENDED 31 DECEMBER 2015
To the extent that future cash flows and taxable income differ significantly from estimates, the ability of the Group to realise the net deferred tax assets recorded at the reporting date could be impacted.
The mining operations are taxed on a variable rate that increases as the profitability of the operation increases. The deferred tax rate used to calculate deferred tax is based on the current estimate of future profitability when the temporary differences will reverse based on tax rates and laws that have been enacted or substantively enacted at the reporting date. Depending on the profitability of the operations, the deferred tax rate can consequently be significantly different from year to year. Calculating the future profitability of the operations is inherently uncertain and could materially change over time.
Additionally, future changes in tax laws in South Africa could limit the ability of the Group to obtain tax deductions in future periods.
ACCOUNTING POLICY
Income tax comprises current and deferred tax. Current tax and deferred tax is recognised in profit or loss except to the extent that it relates to a business combination, or items recognised directly in equity or in other comprehensive income.
Current tax is measured on taxable income at the applicable statutory rate enacted or substantively enacted at the reporting date.
Deferred tax is provided on temporary differences existing at each reporting date between the tax values of assets and liabilities and their carrying amounts. Substantively enacted tax rates are used to determine future anticipated effective tax rates which in turn are used in the determination of deferred tax.
Deferred tax is not recognised for:
| · | | temporary differences on the initial recognition of assets or liabilities in a transaction that is not a business combination and that affects neither accounting nor taxable profit or loss; |
| · | | temporary differences related to investments in subsidiaries to the extent that the Group is able to control the timing of the reversal of the temporary differences and it is probable that they will not reverse in the foreseeable future; and |
| · | | taxable temporary differences arising on the initial recognition of goodwill. |
These temporary differences are expected to result in taxable or deductible amounts in determining taxable profits for future periods when the carrying amount of the asset is recovered or the liability is settled. The principal temporary differences arise from depreciation of property, plant and equipment, provisions, unutilised capital allowances and tax losses carried forward.
Deferred tax assets and liabilities are offset if there is a legally enforceable right to offset current tax liabilities and assets, and they relate to taxes levied by the same tax authority on the same taxable entity, or on different tax entities, but they intend to settle current tax liabilities and assets on a net basis or their tax assets and liabilities will be realised simultaneously.
Deferred tax assets relating to the carry forward of unutilised tax losses and/or unutilised capital allowances are recognised to the extent it is probable that future taxable profit will be available against which the unutilised tax losses and/or unutilised capital allowances can be recovered. Deferred tax assets are reviewed at each reporting date and are adjusted if recovery is no longer probable.
No provision is made for any potential tax liability on the distribution of retained earnings by Group companies.
8.1 ROYALTIES
The Mineral and Petroleum Resource Royalty Act 2008 (Royalty Act) imposes a royalty on refined (mineral resources that have undergone a comprehensive level of beneficiation such as smelting and refining as defined in Schedule 1 of the Royalty Act) and unrefined (mineral resources that have undergone limited beneficiation as defined in Schedule 2 of the Royalty Act) minerals payable to the State. The royalty in respect of refined minerals (which include gold refined to 99.5% and above and platinum) is calculated by dividing earnings before interest and taxes (EBIT) by the product of 12.5 times gross revenue calculated as a percentage, plus an additional 0.5%. EBIT refers to taxable mining income (with certain exceptions such as no deduction for interest payable and foreign exchange losses) before assessed losses but after capital expenditure. A maximum royalty of 5% of mining revenue has been introduced on refined minerals. The effective rate of royalty tax payable for the year ended 31 December 2015 was approximately 1.8% of mining revenue (2014: 2.0% and 2013: 2.1%).
| | | | | |
Figures in million - SA rand | | Notes | 2015 | 2014 | 2013 |
Current year charge | | 28 | (400.6) | (430.5) | (414.6) |
Total royalties | | | (400.6) | (430.5) | (414.6) |
| |
Sibanye Gold Annual Financial Report 2015 | 143 |
NOTES TO THE CONSOLIDATED FINANCIAL STATEMENTS continued
FOR THE YEAR ENDED 31 DECEMBER 2015
8.2 MINING AND INCOME TAX
The components of mining and income tax are the following:
| | | | | |
Figures in million - SA rand | | Notes | 2015 | 2014 | 2013 |
Mining tax | | | (665.6) | (847.9) | (771.0) |
Non-mining tax | | | (16.0) | (24.8) | (27.7) |
Company and capital gain tax | | | (15.1) | (6.5) | (12.7) |
Prior year adjustment current tax | | | - | - | 1.6 |
Total current tax | | 28 | (696.7) | (879.2) | (809.8) |
Deferred tax | | 22 | 319.5 | 51.1 | 553.6 |
Total mining and income tax | | | (377.2) | (828.1) | (256.2) |
Reconciliation of the Group’s income tax to the maximum South African statutory mining tax rate of 34.0%:
| | | | | |
Figures in million - SA rand | | Notes | 2015 | 2014 | 2013 |
South African statutory tax rates | | | | | |
Mining tax1 | | | Y=34-170/X | Y=34-170/X | Y=34-170/X |
Non-mining tax2 | | | 28.0% | 28.0% | 28.0% |
Company tax rate | | | 28.0% | 28.0% | 28.0% |
Tax on profit before tax at maximum South African statutory mining tax rate | (311.2) | (793.9) | (664.5) |
South African mining tax formula rate adjustment | | | 265.6 | 340.2 | 329.6 |
Rate adjustment to reflect the company tax rate of 28% | | | (29.5) | (10.4) | (63.7) |
Non-deductible share-based payments | | 6 | (40.5) | (59.8) | (72.6) |
Non-taxable share of results of equity-accounted investees | | 14 | 39.4 | (160.0) | 17.5 |
Net other non-taxable income and non-deductible expenditure | | | (1.3) | (6.4) | (18.8) |
Deferred tax assets not recognised | | | (328.2) | (80.5) | - |
Non-deductible wear and tear allowances | | | (31.2) | (23.2) | (4.0) |
Non-taxable gain loss on foreign exchange differences | | | 21.6 | 6.6 | 6.7 |
Change in estimated deferred tax rate3 | | | (28.8) | - | 213.6 |
Non-taxable gain on derecognition of financial guarantee liability | | 16.2 | 66.9 | - | - |
Non-deductible impairments | | 7 | - | (40.7) | - |
Mining and income tax | | | (377.2) | (828.1) | (256.2) |
1 Mining tax is determined according to a formula which takes into account the profit and revenue attributable to mining operations. Mining taxable income is determined after the deduction of all mining capital expenditure, with the provision that this cannot result in an assessed loss. Capital expenditure amounts not deducted are carried forward as unredeemed capital expenditure to be deducted from future mining income. Accounting depreciation is ignored for the purpose of calculating mining tax. In the formula above, Y is the percentage rate of tax payable and X is the ratio of mining profit, after the deduction of redeemable capital expenditure, to mining revenue expressed as a percentage.
2 Non-mining income consists primarily of interest income and the guarantee fee received (refer to note 16.1).
3 The change in the estimated long term deferred tax rate, as a result of applying the mining tax formula as described in footnote 1, at which the temporary differences will reverse, amounted to a tax charge of R28.8 million for the year ended 31 December 2015 and a tax credit of R213.6 million during the year ended 31 December 2013.
9. EARNINGS PER SHARE
ACCOUNTING POLICY
Earnings per share (EPS) is calculated based on the profit attributable to owners of Sibanye divided by the weighted average number of ordinary shares in issue during the period. A diluted EPS is presented when the inclusion of ordinary shares that may be issued in the future has a dilutive effect on EPS.
Headline EPS is calculated by dividing the headline earnings attributable to owners of Sibanye by the weighted average number of ordinary shares in issue during the year.
9.1 BASIC EARNINGS PER SHARE
Basic EPS is calculated by dividing the profit attributable to owners of Sibanye by the weighted average number of ordinary shares in issue during the year.
| | | | | |
| | | 2015 | 2014 | 2013 |
Weighted average number of shares | | | | | |
Ordinary shares in issue ('000) | | | 916 140 | 898 840 | 735 079 |
Adjustment for weighting of ordinary shares in issue ('000) | | | (4 102) | (62 904) | (84 458) |
Weighted average number of shares ('000) | | | 912 038 | 835 936 | 650 621 |
Profit attributable to owners of Sibanye (SA rand million) | | | 716.9 | 1 551.5 | 1 692.4 |
Basic EPS (cents) | | | 79 | 186 | 260 |
| |
Sibanye Gold Annual Financial Report 2015 | 144 |
NOTES TO THE CONSOLIDATED FINANCIAL STATEMENTS continued
FOR THE YEAR ENDED 31 DECEMBER 2015
9.2 DILUTED EARNINGS PER SHARE
Diluted EPS is calculated by dividing the profit attributable to owners of Sibanye by the diluted number of ordinary shares in issue during the year.
Dilutive shares are the number of potentially dilutive ordinary shares that could be issued as a result of share options granted to employees under the share option schemes referred to in note 6.
| | | | | |
| | | 2015 | 2014 | 2013 |
Weighted average number of shares | | | | | |
Weighted average number of shares ('000) | | | 912 038 | 835 936 | 650 621 |
Potential ordinary shares ('000) | | | 5 671 | 18 791 | 13 667 |
Diluted weighted average number of shares ('000) | | | 917 709 | 854 727 | 664 288 |
Diluted basic EPS (cents) | | | 78 | 182 | 255 |
9.3 HEADLINE EARNINGS PER SHARE
Reconciliation of profit attributable to owners of Sibanye to headline earnings:
| | | | | |
Figures in million - SA rand | | | | Gross | Net of tax |
31 December 2015 | | | | | |
Profit attributable to owners of Sibanye | | | | | 716.9 |
Profit on disposal of property, plant and equipment | | | | (58.7) | (42.3) |
Headline earnings | | | | | 674.6 |
Headline EPS (cents) | | | | | 74 |
| | | | | |
31 December 2014 | | | | | |
Profit attributable to owners of Sibanye | | | | | 1 551.5 |
Profit on disposal of property, plant and equipment | | | | (9.5) | (6.8) |
Impairments | | | | 275.1 | 233.1 |
Reversal of impairment | | | | (474.1) | (360.3) |
Headline earnings | | | | | 1 417.5 |
Headline EPS (cents) | | | | | 170 |
31 December 2013 | | | | | |
Profit attributable to owners of Sibanye | | | | | 1 692.4 |
Profit on disposal of property, plant and equipment | | | | (5.5) | (3.9) |
Impairment | | | | 821.0 | 591.1 |
Loss on loss of control of subsidiary | | | | 30.2 | 30.2 |
Headline earnings | | | | | 2 309.8 |
Headline EPS (cents) | | | | | 355 |
9.4 DILUTED HEADLINE EARNINGS PER SHARE
Diluted headline EPS is calculated by dividing the headline earnings attributable to owners of Sibanye by the diluted weighted average number of ordinary shares in issue during the year.
| | | | | |
| | | 2015 | 2014 | 2013 |
Diluted headline EPS (cents) | | | 74 | 166 | 348 |
10. DIVIDENDS
ACCOUNTING POLICY
Dividends are recognised only when such dividends are declared.
Cash flows from dividends paid are classified under operating activities in the statement of cash flows.
| | | | | |
Figures in million - SA rand | | | 2015 | 2014 | 2013 |
Dividend declared and paid | | | 658.4 | 1 005.2 | 271.9 |
Dividend per share (cents) | | | 72 | 125 | 37 |
The dividend declared and paid relates to the final dividend of 62 SA cents per share or R567.1 million in respect of the year ended 31 December 2014 declared on 19 February 2015 and the interim dividend of 10 SA cents per share or R91.3 million in respect of the six months ended 30 June 2015 declared on 5 August 2015.
| |
Sibanye Gold Annual Financial Report 2015 | 145 |
NOTES TO THE CONSOLIDATED FINANCIAL STATEMENTS continued
FOR THE YEAR ENDED 31 DECEMBER 2015
11. PROPERTY, PLANT AND EQUIPMENT
SIGNIFICANT ACCOUNTING JUDGEMENTS AND ESTIMATES
CARRYING VALUE OF PROPERTY, PLANT AND EQUIPMENT
All mining assets are amortised using the units-of-production method where the mine operating plan calls for production from proved and probable Mineral Reserves.
Mobile and other equipment are depreciated over the shorter of the estimated useful life of the asset or the estimate of mine life based on proved and probable Mineral Reserves.
The calculation of the units-of-production rate of amortisation could be impacted to the extent that actual production in the future is different from current forecast production based on proved and probable Mineral Reserves. This would generally result from the extent that there are significant changes in any of the factors or assumptions used in estimating Mineral Reserves.
These factors could include:
| · | | Changes in proved and probable Mineral Reserves; |
| · | | Differences between actual commodity prices and commodity price assumptions; |
| · | | Unforeseen operational issues at mine sites; |
| · | | Changes in capital, operating, mining, processing and reclamation costs, discount rates and foreign exchange rates; and |
| · | | Changes in Mineral Reserves could similarly impact the useful lives of assets depreciated on a straight-line basis, where those lives are limited to the life of the mine. |
The recoverable amounts of cash-generating units and individual assets have been determined based on the higher of value-in-use calculations and fair value less cost to sell. These calculations require the use of estimates and assumptions. It is reasonably possible that the gold price assumption may change which may then impact the Group estimated life of mine determinant and may then require a material adjustment to the carrying value of property, plant and equipment.
The Group reviews and tests the carrying value of assets when events or changes in circumstances suggest that the carrying amount may not be recoverable by comparing expected future cash flows to these carrying values. Assets are grouped at the lowest level for which identifiable cash flows are largely independent of cash flows of other assets and liabilities. If there are indications that impairment may have occurred, estimates are prepared of expected future cash flows of each group of assets. Expected future cash flows used to determine the value in use and fair value less costs to sell of property, plant and equipment are inherently uncertain and could materially change over time. They are significantly affected by a number of factors including reserves and production estimates, together with economic factors such as spot and future gold prices, discount rates, foreign currency exchange rates, estimates of costs to produce reserves and future capital expenditure.
MINERAL RESERVES ESTIMATES
Mineral Reserves are estimates of the amount of product that can be economically and legally extracted from the Group’s properties. In order to calculate the reserves, estimates and assumptions are required about a range of geological, technical and economic factors, including but not limited to quantities, grades, production techniques, recovery rates, production costs, transport costs, commodity demand, commodity prices and exchange rates.
Estimating the quantity and grade of the Mineral Reserves requires the size, shape and depth of orebodies to be determined by analysing geological data such as the logging and assaying of drill samples. This process may require complex and difficult geological judgements and calculations to interpret the data.
The Group is required to determine and report, inter alia, on the Mineral Reserves in accordance with the South African Code for Reporting of Exploration Results, Mineral Resources and Mineral Reserves (SAMREC).
| |
Sibanye Gold Annual Financial Report 2015 | 146 |
NOTES TO THE CONSOLIDATED FINANCIAL STATEMENTS continued
FOR THE YEAR ENDED 31 DECEMBER 2015
Estimates of Mineral Reserves may change from period to period due to the change in economic assumptions used to estimate Mineral Reserves and due to additional geological data becoming available during the course of operations. Changes in reported proven and probable reserves may affect the Group’s financial results and position in a number of ways, including the following:
| · | | Asset carrying values may be affected due to changes in estimated cash flows; |
| · | | Depreciation and amortisation charges to profit or loss may change as these are calculated on the units-of production method, or where the useful lives of assets change; |
| · | | Decommissioning site restoration and environmental provisions may change where changes in ore reserves affect expectations about the timing or cost of these activities; and |
| · | | The carrying value of deferred tax assets may change due to changes in estimates of the likely recovery of the tax benefits. |
PRE-PRODUCTION
The Group assesses the stage of each mine construction project to determine when a mine moves into the production stage. The criteria used to assess the start date are determined based on the unique nature of each mine construction project. The Group considers various relevant criteria to assess when the mine is substantially complete, ready for its intended use and moves into the production stage. Some of the criteria would include, but are not limited to the following:
| · | | the level of capital expenditure compared to the construction cost estimates; |
| · | | ability to produce metal in saleable form (within specifications); and |
| · | | ability to sustain commercial levels of production of metal. |
When a mine construction project moves into the production stage, the capitalisation of certain mine construction costs ceases and costs are expensed, except for capitalisable costs related to mining asset additions or improvements, underground mine development or ore reserve development.
ACCOUNTING POLICY
MINERAL AND SURFACE RIGHTS
Mineral and surface rights are recorded at cost less accumulated amortisation and accumulated impairment losses. When there is little likelihood of a mineral right being exploited, or the carrying amount has exceeded its recoverable amount, impairment is recognised in profit or loss in the year that such determination is made.
MINE DEVELOPMENT AND INFRASTRUCTURE
Mining assets, including mine development and infrastructure costs and mine plant facilities, are recorded at cost less accumulated depreciation and accumulated impairment losses.
These costs which include the purchase price of assets used in the construction of the mine, expenditure incurred to evaluate and develop new ore bodies, to define mineralisation in existing ore bodies and to establish or expand productive capacity, are capitalised until commercial levels of production are achieved, at which times the costs are amortised as set out below.
Development of ore bodies includes the development of shaft systems and waste rock removal that allows access to reserves that are economically recoverable in the future. Subsequent to this, costs are capitalised if the criteria for recognition as an asset are met. Access to individual orebodies exploited by the Group is limited to the time span of the respective mining leases.
LAND
Land is shown at cost and is not depreciated.
OTHER ASSETS
Non-mining assets are recorded at cost less accumulated depreciation and accumulated impairment losses. These assets include the assets of the mining operations not included in mine development and infrastructure, borrowing costs, mineral and surface rights, land and all the assets of the non-mining operations.
| |
Sibanye Gold Annual Financial Report 2015 | 147 |
NOTES TO THE CONSOLIDATED FINANCIAL STATEMENTS continued
FOR THE YEAR ENDED 31 DECEMBER 2015
AMORTISATION AND DEPRECIATION OF MINING ASSETS
Amortisation and depreciation is determined to give a fair and systematic charge in profit or loss taking into account the nature of a particular ore body and the method of mining that ore body. To achieve this, the following calculation methods are used:
| · | | Mining assets, including mine development and infrastructure costs, mine plant facilities and evaluation costs, are amortised over the life of the mine using the units-of-production method, based on estimated proved and probable Mineral Reserves above infrastructure. |
| · | | Proved and probable Mineral Reserves reflect estimated quantities of economically recoverable reserves, which can be recovered in future from known mineral deposits. |
| · | | Certain mining plant and equipment included in mine development and infrastructure are depreciated on a straight-line basis over their estimated useful lives. |
DEPRECIATION OF NON-MINING ASSETS
Non-mining assets are recorded at cost and depreciated on a straight-line basis over their current expected useful lives to their residual values as follows:
| · | | Furniture and equipment 10% |
The assets’ useful lives, depreciation methods and residual values are reassessed at each reporting date and adjusted if appropriate.
IMPAIRMENT
Recoverability of the carrying values of long-term assets or cash-generating units (CGU) of the Group are reviewed whenever events or changes in circumstances indicate that such carrying value may not be recoverable. To determine whether a long-term asset or CGU may be impaired, the higher of value in use (defined as: the present value of future cash flows expected to be derived from an asset or CGU) or fair value less costs to sell (defined as: the price that would be received to sell an asset in an orderly transaction between market participants at the measured rate, less the costs of disposal) is compared to the carrying value of the asset/unit.
A CGU is defined by the Group as the smallest identifiable group of assets that generates cash inflows that are largely independent of the cash inflows from other assets or groups of assets. Generally for the Group this represents an individual operating mine, including mines which are part of a larger mine complex. The costs attributable to individual shafts of a mine are impaired if the shaft is closed.
Impairment losses are recognised in profit or loss. Impairment recognised in respect of a CGU is allocated to the individual assets in the CGU.
When any infrastructure is closed down or placed on care and maintenance during the year, any carrying value attributable to that infrastructure is impaired. Expenditure incurred on care and maintenance is recognised in profit or loss.
When the review of the events or changes in circumstances of an asset or CGU that was previously impaired indicate that such historical carrying value is recoverable, the impairment is reversed. The impairment is only reversed to such an amount that the new carrying amount does not exceed the historical carrying amount. Reversal of impairment losses are recognised in profit or loss. Reversal of impairment recognised in respect of a CGU is allocated to the individual assets in the CGU.
GAIN OR LOSS ON DISPOSAL
Any gain or loss on disposal on an item of property, plant and equipment (calculated as the net proceeds from disposal and the carrying amount of the item) is recognised in profit or loss.
| |
Sibanye Gold Annual Financial Report 2015 | 148 |
NOTES TO THE CONSOLIDATED FINANCIAL STATEMENTS continued
FOR THE YEAR ENDED 31 DECEMBER 2015
EXPLORATION AND EVALUATION EXPENDITURE
All exploration and evaluation expenditure, prior to obtaining the legal rights to explore a specific area, is recognised in profit or loss. After the legal rights to explore are obtained, exploration and evaluation expenditure, comprising the costs of acquiring prospecting rights and directly attributable exploration expenditure, is capitalised as a separate class of property, plant and equipment or intangible assets, on a project-by-project basis, pending determination of the technical feasibility and commercial viability.
The technical feasibility and commercial viability of extracting a mineral resource is generally considered to be determinable through a feasibility study and when proven reserves are determinable to exist. Upon determination of proven reserves, exploration and evaluation assets attributable to those reserves are first tested for impairment and then reclassified from exploration and evaluation assets to another appropriate class of property, plant and equipment. Subsequently, all cost directly incurred to prepare an identified mineral asset for production is capitalised to mine development assets. Amortisation of these assets commences once these assets are available for use, which is expected to be when the mine is in commercial production. These assets will be measured at cost less accumulated amortisation and impairment losses.
| | | | | | |
Figures in million - SA rand | | Notes | Total | Mine development, infrastructure and other | Land,
mineral
rights and
rehabilitation | Exploration
and
evaluation
assets |
31 December 2015 | | | | | | |
Cost | | | | | | |
Balance at beginning of the year | | | 54 404.9 | 48 637.6 | 3 882.3 | 1 885.0 |
Additions | | | 3 344.8 | 3 303.5 | 6.0 | 35.3 |
Change in estimate of rehabilitation assets | | 24 | (273.4) | - | (273.4) | - |
Disposals | | | (44.6) | (21.2) | (23.4) | - |
Balance at end of the year | | | 57 431.7 | 51 919.9 | 3 591.5 | 1 920.3 |
Accumulated amortisation, depreciation and impairment | | | | | | |
Balance at beginning of the year | | | 31 700.9 | 30 650.2 | 1 050.7 | - |
Amortisation and depreciation | | 4 | 3 636.6 | 3 358.4 | 278.2 | - |
Disposals | | | (38.2) | (30.5) | (7.7) | - |
Balance at end of the year | | | 35 299.3 | 33 978.1 | 1 321.2 | - |
| | | | | | |
Carrying value at end of the year | | | 22 132.4 | 17 941.8 | 2 270.3 | 1 920.3 |
SECURITY
The Burnstone Debt is fully secured against the assets of Burnstone (R1.4 billion) and there is no recourse to the Sibanye Group.
| |
Sibanye Gold Annual Financial Report 2015 | 149 |
NOTES TO THE CONSOLIDATED FINANCIAL STATEMENTS continued
FOR THE YEAR ENDED 31 DECEMBER 2015
| | | | | | |
Figures in million - SA rand | | Notes | Total | Mine
development,
infrastructure
and other | Land,
mineral
rights and
rehabilitation | Exploration
and
evaluation
assets |
31 December 2014 | | | | | | |
Cost | | | | | | |
Balance at beginning of the year | | | 43 970.8 | 42 362.5 | 1 364.0 | 244.3 |
Additions | | | 3 250.8 | 3 231.2 | 1.1 | 18.5 |
Change in estimates of rehabilitation assets | | 24 | 131.5 | - | 131.5 | - |
Disposals | | | (68.1) | (66.1) | (2.0) | - |
Assets acquired on acquisition of subsidiaries | | 12 | 7 119.9 | 3 110.0 | 2 387.7 | 1 622.2 |
Balance at end of the year | | | 54 404.9 | 48 637.6 | 3 882.3 | 1 885.0 |
Accumulated amortisation, depreciation and impairment | | | | | | |
Balance at beginning of the year | | | 28 819.8 | 27 942.0 | 877.8 | - |
Amortisation and depreciation | | 4 | 3 254.7 | 3 054.0 | 200.7 | - |
Impairment | | 7 | 155.5 | 155.5 | - | - |
Reversal of impairment | | | (474.1) | (448.1) | (26.0) | - |
Disposals | | | (55.0) | (53.2) | (1.8) | - |
Balance at end of the year | | | 31 700.9 | 30 650.2 | 1 050.7 | - |
| | | | | | |
Carrying value at end of the year | | | 22 704.0 | 17 987.4 | 2 831.6 | 1 885.0 |
IMPAIRMENT
The Python processing plant was decommissioned in July 2014 due to process design flaws. As a result a decision was taken to impair the entire carrying value of the Python plant by R155.5 million.
REVERSAL OF IMPAIRMENT AT BEATRIX WEST
During the six months ended 30 June 2013 the mining assets of Beatrix West Section was impaired by R821.0 million due to a fire during February 2013 which affected approximately 38% of the planned production area, impacting on the commercial viability of the Beatrix West Section. In addition management entered into a section 189 consultation with affected stakeholders, agreeing that ore reserve development would largely be suspended and that the remaining ore reserves would be mined to completion.
Due to the positive results of the restructured Beatrix West Section it returned to profitability and as a result a decision was taken to reverse the impairment recorded during the six months ended 30 June 2013. This resulted in a R474.1 million reversal of impairment to the historical carrying value less depreciation subsequent to 30 June 2013.
The reversal was based on the estimated fair value less cost to sell over the life of mine. The fair value was calculated based on expected discounted cash flows from the expected gold reserves and costs to extract the gold.
| | | | | | |
Figures in million - SA rand | | | Total | Mine
development,
infrastructure
and other | Land,
mineral
rights and
rehabilitation | Exploration
and
evaluation
assets |
31 December 2013 | | | | | | |
Cost | | | | | | |
Balance at beginning of the year | | | 41 362.3 | 39 593.4 | 1 524.6 | 244.3 |
Additions | | | 2 901.5 | 2 901.5 | - | - |
Change in estimates of rehabilitation assets | | 24 | (160.6) | - | (160.6) | - |
Disposals | | | (15.2) | (15.2) | - | - |
Loss of control of subsidiary | | | (117.2) | (117.2) | - | - |
Balance at end of the year | | | 43 970.8 | 42 362.5 | 1 364.0 | 244.3 |
Accumulated amortisation, depreciation and impairment | | | | | | |
Balance at beginning of the year | | | 24 986.2 | 24 238.0 | 748.2 | - |
Amortisation and depreciation | | 4 | 3 103.9 | 3 018.7 | 85.2 | - |
Impairment | | 7 | 821.0 | 776.6 | 44.4 | - |
Disposals | | | (13.8) | (13.8) | - | - |
Loss of control of subsidiary | | | (77.5) | (77.5) | - | - |
Balance at end of the year | | | 28 819.8 | 27 942.0 | 877.8 | - |
| | | | | | |
Carrying value at end of the year | | | 15 151.0 | 14 420.5 | 486.2 | 244.3 |
| |
Sibanye Gold Annual Financial Report 2015 | 150 |
NOTES TO THE CONSOLIDATED FINANCIAL STATEMENTS continued
FOR THE YEAR ENDED 31 DECEMBER 2015
12. ACQUISITIONS
ACCOUNTING POLICY
BUSINESS COMBINATIONS
The acquisition method of accounting is used to account for business combinations by the Group. The consideration transferred for the acquisition of a business is the fair value of the assets transferred, the liabilities incurred and the equity interests issued by the Group. The consideration transferred includes the fair value of any asset or liability resulting from a contingent consideration arrangement. Acquisition-related costs are expensed as incurred. Identifiable assets acquired and liabilities and contingent liabilities assumed in a business combination are measured initially at their fair values at the acquisition date. On an acquisition-by-acquisition basis, the Group recognises any non-controlling interest in the acquiree either at fair value or at the non-controlling interest’s proportionate share of the acquiree’s net assets. Subsequently, the carrying amount of non-controlling interest is the amount of the interest at initial recognition plus the non-controlling interest’s share of the subsequent changes in equity, plus or minus changes in the portion interest of the equity of the subsidiary not attributable, directly or indirectly, to Sibanye shareholders
The excess of the consideration transferred, the amount of any non-controlling interest in the acquiree and the acquisition-date fair value of any previous equity interest in the acquiree over the fair value of the identifiable net assets acquired is recorded as goodwill. If this is less than the fair value of the net assets of the subsidiary acquired in the case of a bargain purchase, the difference is recognised directly in profit or loss.
a) COOKE ACQUISITION
On 15 May 2014 all conditions precedent to the acquisition of Gold One’s 76% shareholding in, and the Gold One Group claims against, Newshelf 1114 were fulfilled. Newshelf 1114 holds a 100% shareholding in Rand Uranium and Ezulwini, the activities of these companies include the Cooke Operations.
On completion of the Newshelf 1114 black economic empowerment (BEE) structure, Sibanye will have a 74% interest in Newshelf 1114. The current balance of 24% not owned by Sibanye forms part of the Newshelf 1114 BEE structure. The negotiated Newshelf 1114 BEE structure will also include an additional 2% to be issued to an Employees Trust Fund of which the financing mechanism is still being finalised. Once finalised Sibanye will issue the 26 shares at R2.0 million per share as agreed with all stakeholders.
As consideration for the acquisition of the Cooke Operations, Sibanye issued 156,894,754 new Sibanye ordinary shares at R28.61.
CONSIDERATION TRANSFERRED
The following table summarises the acquisition date fair value of each major class of consideration transferred:
| | | |
Figures in million - SA rand | | | 2014 |
Equity instruments (156,894,754 ordinary shares) | | | 4 488.8 |
Loans granted prior to acquisition | | | 161.2 |
Total consideration transferred | | | 4 650.0 |
ACQUISITION RELATED COSTS
The Group incurred acquisition related costs of R81.5 million on advisory and legal fees. These costs are recognised as transaction costs in profit or loss in 2014.
| |
Sibanye Gold Annual Financial Report 2015 | 151 |
NOTES TO THE CONSOLIDATED FINANCIAL STATEMENTS continued
FOR THE YEAR ENDED 31 DECEMBER 2015
IDENTIFIED ASSETS ACQUIRED AND LIABILITIES ASSUMED
The following table summarises the fair value of assets acquired and liabilities assumed at the acquisition date:
| | | |
Figures in million - SA rand | | | 2014 |
Property, plant and equipment | | | 5 556.4 |
Environmental rehabilitation obligation funds | | | 341.7 |
Inventories | | | 77.6 |
Trade and other receivables | | | 156.8 |
Cash and cash equivalents | | | 31.8 |
Deferred tax | | | (169.2) |
Borrowings | | | (696.2) |
Environmental rehabilitation obligation | | | (501.8) |
Trade and other payables | | | (486.2) |
Tax and royalties payable | | | (1.4) |
Total identifiable net assets acquired | | | 4 309.5 |
The fair value of assets and liabilities excluding property plant and equipment and rehabilitation obligation approximate their carrying value. The fair value of property, plant and equipment was based on the expected discounted cash flows of the expected gold reserves and costs to extract the gold discounted at a nominal discount rate of 12.2% and a gold price of R440,000/kg.
GOODWILL
Goodwill arising from the acquisition has been recognised as follows:
| | | |
Figures in million - SA rand | | Notes | 2014 |
Consideration transferred | | | 4 650.0 |
Fair value of identifiable net assets | | | (4 309.5) |
Non-controlling interests, based on their proportionate interest in the recognised amounts of the assets and liabilities of Cooke1 | | | 396.2 |
Goodwill | | 13 | 736.7 |
1 The amount recognised as non-controlling interests represents the BEE consortium’s proportionate share of the net assets at acquisition date of Newshelf 1114 after considering the loan amount due and payable to Sibanye.
b) WITWATERSRAND CONSOLIDATED GOLD RESOURCES LIMITED ACQUISITION
Sibanye announced on 11 December 2013 that it had offered to acquire the entire issued share capital of Wits Gold for a cash consideration of R11.55 per Wits Gold share. The transaction was subject to the fulfilment of various conditions precedent which were completed on 14 April 2014.
On 13 March 2014, at the Wits Gold shareholders meeting, the shareholders of Wits Gold approved the proposed transaction by voting in favour of the various resolutions to give effect to the transaction.
On 14 April 2014, Sibanye paid R400.5 million to the Wits Gold shareholders and obtained control (100%) of Wits Gold. Wits Gold is not a business as defined in IFRS and thus the acquisition is considered to be outside the scope of IFRS 3 Business Combinations. The acquisition was accounted for as an asset acquisition in which the consideration paid for the acquisition is allocated to the individual identifiable assets acquired and liabilities assumed based on their relative fair values. Transaction related expenses of R14.8 million have been capitalised.
The consideration paid was as follows:
| | | |
Figures in million - SA rand | | | 2014 |
Cash | | | 415.3 |
Total consideration paid | | | 415.3 |
The identified assets acquired and liabilities assumed at the acquisition date is as follows:
| | | |
Figures in million - SA rand | | | 2014 |
Property, plant and equipment | | | 472.7 |
Trade and other receivables | | | 1.7 |
Cash and cash equivalents | | | 5.6 |
Borrowings | | | (40.0) |
Trade and other payables | | | (24.7) |
Total identifiable net assets acquired | | | 415.3 |
| |
Sibanye Gold Annual Financial Report 2015 | 152 |
NOTES TO THE CONSOLIDATED FINANCIAL STATEMENTS continued
FOR THE YEAR ENDED 31 DECEMBER 2015
c) BURNSTONE ACQUISITION
On 5 July 2013 Wits Gold announced to its shareholders that it had submitted a final binding offer (the Offer) to Mr Peter van den Steen, the business rescue practitioner of SGEO (previously Southgold Exploration Proprietary Limited), to acquire SGEO, the sole owner of Burnstone located in South Africa’s Mpumalanga Province.
All the outstanding conditions precedent were met on 1 July 2014, and Sibanye, through its subsidiary Wits Gold, took control (100%) of Burnstone from this date.
Sibanye acquired all of the issued shares of SGEO together with all shareholder and inter-group loans against SGEO for a purchase consideration of R100.00.In addition Wits Gold has to fund up to R950 million by means of a loan (Wits Gold Loan), over time, as working capital to support the production plan. The Wits Gold Loan will attract interest at the Johannesburg Interbank Agreed Rate (JIBAR) plus a margin of 4% from 1 July 2017.
There were no changes during the year ended 31 December 2015 to the provisional purchase price allocation performed at the time of the Burnstone acquisition.
CONSIDERATION TRANSFERRED
The following table summarises the acquisition date fair value of each major class of consideration transferred:
| | | |
Figures in million - SA rand | | | 2014 |
Cash | | | - |
Loan granted prior to acquisition | | | 77.4 |
Total consideration transferred | | | 77.4 |
ACQUISITION RELATED COSTS
The Group incurred acquisition related costs of R29.7 million on advisory and legal fees. These costs are recognised as transaction costs in profit or loss.
IDENTIFIED ASSETS ACQUIRED AND LIABILITIES ASSUMED
The following table summarises the fair value of assets acquired and liabilities assumed at the acquisition date:
| | | |
Figures in million - SA rand | | Notes | 2014 |
Property, plant and equipment | | | 1 089.7 |
Environmental rehabilitation obligation funds | | | 32.4 |
Inventories | | | 0.4 |
Trade and other receivables | | | 27.2 |
Cash and cash equivalents | | | 0.7 |
Borrowings | | 23 | (1 007.6) |
Environmental rehabilitation obligation | | | (42.2) |
Trade and other payables | | | (23.2) |
Total identifiable net assets acquired | | | 77.4 |
The fair value of assets and liabilities excluding property plant and equipment approximate their carrying value. The fair value of property, plant and equipment was based on the expected discounted cash flows of the expected gold reserves and costs to extract the gold discounted at a nominal discount rate of 17.5% and a gold price of R440,000/kg.
| |
Sibanye Gold Annual Financial Report 2015 | 153 |
NOTES TO THE CONSOLIDATED FINANCIAL STATEMENTS continued
FOR THE YEAR ENDED 31 DECEMBER 2015
13. GOODWILL
SIGNIFICANT ACCOUNTING JUDGEMENTS AND ESTIMATES
Goodwill is tested for impairment on an annual basis. Expected future cash flows used to determine the recoverable amount of property, plant and equipment and goodwill are inherently uncertain and could materially change over time. The recoverable amount is significantly affected by a number of factors including reserves and production estimates, together with economic factors such as the expected commodity price, foreign currency exchange rates, estimates of production costs, future capital expenditure and discount rates.
An individual operating mine does not have an indefinite life because of the finite life of its reserves. The allocation of goodwill to an individual mine will result in an eventual goodwill impairment due to the wasting nature of the mine.
ACCOUNTING POLICY
Goodwill is stated at cost less accumulated impairment losses. In accordance with the provisions of IAS 36 Impairment of Assets, the Group performs its annual impairment review of goodwill at each financial year end or whenever there are impairment indicators to establish whether there is any indication of impairment to goodwill. A write-down is made if the carrying amount exceeds the recoverable amount. Impairment losses on goodwill are not reversed. Gains and losses on the disposal of an entity include the carrying amount of goodwill allocated to the entity sold.
Goodwill is allocated to cash-generating units for the purpose of impairment testing. The allocation is made to those cash-generating units or groups of cash-generating units that are expected to benefit from the business combination in which the goodwill arose.
| | | | | |
Figures in million - SA rand | | Notes | 2015 | 2014 | 2013 |
Balance at beginning of the year | | | 736.7 | - | - |
Goodwill on acquisition of Cooke | | 12 | - | 736.7 | - |
Balance at end of the year | | | 736.7 | 736.7 | - |
The goodwill arose on the acquisition of Cooke and was attributable to the synergies at the Group’s other operations, the underlying assets of Cooke and WRTRP. The goodwill is allocated to Beatrix R103.9 million, Driefontein R166.9 million Kloof R165.5 million, Cooke R201.3 million and WRTRP R99.1 million CGUs where it is tested for impairment.
In line with the accounting policy, the recoverable amount was determined by reference to “fair value less costs to sell” being the higher of “value in use” and “fair value less cost to sell”, based on the cash flows over the life of the CGUs and discounted to present value at an appropriate discount rate.
The Group’s estimates and assumptions used in the 31 December 2015 calculation include:
| · | | Nominal discount rates between 11.4% and 14.7% for operating mines and 17.2% for WRTRP; and |
| · | | The annual life-of-mine plan that takes into account the following: |
| - | | Proved and probable ore reserves of the CGUs; |
| - | | Resources are valued using appropriate price assumptions; |
| - | | Cash flows are based on the life-of-mine of operating mines that range between 8 and 27 and WRTRP in excess of 20 years; |
| - | | Capital expenditure estimates over the life-of-mine plan. |
| - | | Gold price of R550,000/kg; and |
| - | | Uranium price of R1,300/kg. |
There were no other events or changes in circumstances that suggest that the carrying amount of a CGU may not be recoverable. There is no goodwill impairment at 31 December 2015.
The recoverable amounts of the Driefontein, Kloof, Beatrix and WRTRP CGUs are significantly higher than the carrying values, therefore a reasonably possible adverse change in the abovementioned assumptions would not likely result in an adjustment to the carrying values. The recoverable amount of the Cooke CGU approximates its carrying value due to the fair value recognised on the acquisition of Cooke (refer to note 12), therefore any reasonably possible adverse change in the abovementioned assumptions compared to the fair value assumptions used at acquisition (refer to note 12) could result in impairment.
| |
Sibanye Gold Annual Financial Report 2015 | 154 |
NOTES TO THE CONSOLIDATED FINANCIAL STATEMENTS continued
FOR THE YEAR ENDED 31 DECEMBER 2015
14. EQUITY-ACCOUNTED INVESTMENTS
SIGNIFICANT ACCOUNTING JUDGEMENTS AND ESTIMATES
Rand Refinery implemented a new Enterprise Resource Planning system in April 2013. An imbalance was detected between physical gold and silver on hand (physical inventory) and what Rand Refinery owed its depositors and bullion bankers (ownership) per the metallurgical trial balance. Rand Refinery’s investigations revealed that the shortfall could have been attributed to a number of factors. Various internal projects, campaigns and external reviews were performed to reduce the risk of recurrence. The carrying value of Rand Refinery remains an area of estimation and uncertainty until the root cause of the imbalance is determined.
ACCOUNTING POLICY
The equity method of accounting is used for investments in associates.
An associate is an investment over which the Group exercises significant influence, but not control. Associates are equity-accounted from the date that significant influence or joint control is obtained to the date that the Group ceases to have significant influence.
Results of associates are equity-accounted using the results of their most recent audited annual financial statements or unaudited management accounts. Any losses from associates are brought to account in the consolidated financial statements until the interest in such associates is written down to zero. The interest includes any long-term interests that in substance, form part of the entity’s net investment in the equity-accounted investee, for example long-term receivables for which settlement is neither planned nor likely to occur in the foreseeable future. Thereafter, losses are accounted for only insofar as the Group is committed to providing financial support to such associates.
The carrying value of an equity-accounted investment represents the cost of the investment, including goodwill, the proportionate share of the post-acquisition retained earnings and losses, any other movements in reserves, any impairment losses and loans to or from the equity-accounted investee. The carrying value together with any long-term interests that in substance form part of the net investment in the equity-accounted investee is assessed annually for existence of indicators of impairment and if such exist, the carrying amount is compared to the recoverable amount, being the higher of value in use or fair value less costs to sell. If an impairment in value has occurred, it is recognised in the period in which the impairment arose. Indicators of impairment include a significant or prolonged decline in the investments fair value below its carrying value.
The Group holds the following equity-accounted investments:
| | | | | |
Figures in million - SA rand | | | 2015 | 2014 | 2013 |
Rand Refinery | | | 148.7 | 55.1 | 270.1 |
Living Gold | | | 18.8 | 14.3 | 5.0 |
Balance at end of the year | | | 167.5 | 69.4 | 275.1 |
MATERIAL EQUITY-ACCOUNTED INVESTMENTS
RAND REFINERY
Sibanye has a 33.1% interest in Rand Refinery, a company incorporated in the Republic of South Africa, which is involved in the refining of bullion and by-products sourced from, inter alia, South African and foreign gold producing mining companies. The investment has been equity-accounted since 1 July 2002.
The movement for the year is as follows:
| | | | | |
Figures in million - SA rand | | Notes | 2015 | 2014 | 2013 |
Balance at beginning of the year | | | 55.1 | 270.1 | 218.6 |
Share of results of equity-accounted investee after tax1 | | | 114.5 | (480.0) | 51.5 |
Impairment | | 7 | - | (119.6) | - |
Loan (repaid by)/advanced to equity-accounted investee | | | (20.9) | 384.6 | - |
Balance at end of the year | | | 148.7 | 55.1 | 270.1 |
1 Rand Refinery has a 30 September year end and equity accounting is based on its results to 30 September.
On 18 December 2014, Rand Refinery drew down R1.029 billion under a R1.2 billion subordinated shareholders loan (the Facility), with Sibanye’s proportional share being R384.6 million. Amounts drawn down under the Facility are repayable within two years from the first draw down date. If the loan is not repaid within two years, it will automatically convert into equity in Rand Refinery. Interest under the Facility is at JIBAR plus a margin of 3.5%. Sibanye has subordinated all claims
| |
Sibanye Gold Annual Financial Report 2015 | 155 |
NOTES TO THE CONSOLIDATED FINANCIAL STATEMENTS continued
FOR THE YEAR ENDED 31 DECEMBER 2015
it might have against Rand Refinery as part of the Facility agreement. During the year Rand Refinery paid R37.3 million (2014: R1.2 million) interest on the loan.
The Group’s interest in the summarised financial statements of Rand Refinery are:
| | | | | |
Figures in million - SA rand | | Notes | 2015 | 2014 | 2013 |
Total revenue of Rand Refinery | | | 1 021.0 | 377.0 | 776.0 |
Total comprehensive income of Rand Refinery | | | 346.0 | (299.0) | 155.7 |
| | | | | |
Total assets | | | 1 220.0 | 872.0 | 1 459.0 |
Total liabilities | | | (1 375.0) | (1 373.0) | (511.1) |
Net (liabilities)/assets (100.0%) | | | (155.0) | (501.0) | 947.9 |
| | | | | |
Reconciliation of the total investment in associate with attributable net assets: | | | | | |
Net assets (33.1%) | | | (51.7) | (166.2) | 313.8 |
Dividend received | | | (8.2) | (8.2) | (8.2) |
Fair value adjustment1 | | | (35.5) | (35.5) | (35.5) |
Impairment | | 7 | (119.6) | (119.6) | - |
Loan to equity-accounted investee | | | 363.7 | 384.6 | - |
Total investment in equity-accounted investee | | | 148.7 | 55.1 | 270.1 |
1 The investment in equity-accounted investee was fair valued at 1 July 2002, the date when significant influence was obtained.
15. ENVIRONMENTAL REHABILITATION OBLIGATION FUNDS
ACCOUNTING POLICY
The Group’s rehabilitation obligation funds includes equity-linked investments that are fair valued at each reporting date. The fair value is calculated with reference to underlying equity instruments using industry valuation techniques and appropriate models. While Sibanye’s management believes that these assumptions are appropriate, the use of different assumptions could have a material impact on the fair value of the investments.
Annual contributions are made to dedicated environmental rehabilitation obligation funds to fund the estimated cost of rehabilitation during and at the end of the life of the relevant mine. The amounts contributed to these funds are included under non-current assets and are measured at fair value through profit or loss. Interest earned on monies paid to rehabilitation funds is accrued on a time proportion basis and is recorded as investment income.
In addition, bank guarantees are provided for funding shortfalls of the environmental rehabilitation obligations.
| | | | | |
Figures in million - SA rand | | Notes | 2015 | 2014 | 2013 |
Environmental rehabilitation obligation funds | | | | | |
Balance at beginning of the year | | | 2 192.8 | 1 588.1 | 1 331.1 |
Contributions | | | 77.8 | 69.3 | 172.3 |
Investment income | | | 134.8 | 98.5 | 84.7 |
Fair value adjustment1 | | | 8.5 | 62.7 | - |
Environmental rehabilitation obligation funds on acquisition of subsidiaries | | 12 | - | 374.2 | - |
Balance at end of the year | | | 2 413.9 | 2 192.8 | 1 588.1 |
Environmental rehabilitation obligation funds comprise of the following: | | | | | |
Restricted cash2 | | | 341.8 | 301.5 | 73.5 |
Funds | | | 2 072.1 | 1 891.3 | 1 514.6 |
1 The environmental rehabilitation trust fund includes equity-linked investments that are fair valued at each reporting date.
2 The funds are set aside to serve as collateral against the guarantees made to the Department of Minerals and Resources (DMR) for environmental rehabilitation obligations.
| |
Sibanye Gold Annual Financial Report 2015 | 156 |
NOTES TO THE CONSOLIDATED FINANCIAL STATEMENTS continued
FOR THE YEAR ENDED 31 DECEMBER 2015
16. FINANCIAL GUARANTEE
ACCOUNTING POLICY
Financial guarantee contracts are accounted for as financial instruments and are recognised initially at fair value and are subsequently measured at the higher of the amount determined in accordance with IAS 37 Provisions, Contingent Liabilities and Assets, and the initial amount recognised less cumulative amortisation.
As of 18 February 2013, the Gold Fields group no longer guarantee any debt of Sibanye, similarly Sibanye was released from all of its obligations as guarantor under Gold Fields group debt, except, Sibanye remained a joint guarantor of the US$1 billion 4.875% guaranteed notes (the Notes) issued by Gold Fields Orogen Holding (BVI) Limited (Orogen), a subsidiary of Gold Fields.
An indemnity agreement (the Indemnity Agreement) was entered into between Gold Fields, Sibanye, Gold Fields Operations (GFO) Limited and Gold Fields Holding Company (BVI) Limited (GF Holdings) (collectively the Guarantors) pursuant to which the Guarantors (other than Sibanye) hold Sibanye harmless from and against any and all liabilities and expenses which may be incurred by Sibanye under or in connection with the Notes, including any payment obligations by Sibanye to the note holders or the trustee of the Notes pursuant to the guarantee of the Notes.
The Group initially recognised the financial guarantee liability at fair value of the guarantee in connection with the Notes and subsequently amortised over the remaining period of the Notes.
As of 18 February 2013, the Group raised a receivable under the financial guarantee asset for the future guarantee fee income that Orogen was obliged to pay bi-annually to Sibanye until it was released as a guarantor under the Notes.
During March 2015 Gold Fields approached the note holders through a consent solicitation process to release Sibanye of its obligations as a guarantor under the Notes. On 22 April 2015 the note holders approved the various resolutions to release Sibanye as guarantor. The release became effective on 24 April 2015 when all the conditions to the extraordinary resolution were met. As part of the agreement Sibanye paid a guarantee release fee of US$5 million to Orogen, and derecognised the financial guarantee asset and liability.
16.1 FINANCIAL GUARANTEE ASSET
| | | | | |
Figures in million - SA rand | | | 2015 | 2014 | 2013 |
Balance at beginning of the year | | | 282.6 | 290.2 | - |
Initial recognition at fair value | | | - | - | 282.3 |
Guarantee fees received | | | (9.6) | (53.6) | (47.0) |
Interest income | | | 4.9 | 15.0 | 12.3 |
Gain on foreign exchange differences | | | 15.9 | 31.0 | 42.6 |
Loss on derecognition of financial guarantee asset | | | (293.8) | - | - |
Balance at end of the year | | | - | 282.6 | 290.2 |
Reconciliation of the non-current and current portion of the guarantee asset: | | | | | |
Financial guarantee asset | | | - | 282.6 | 290.2 |
Current portion of financial guarantee asset | | | - | (57.1) | (51.7) |
Non-current portion of financial guarantee asset | | | - | 225.5 | 238.5 |
The financial guarantee asset was discounted to a present value at 5.38%, which is a reflection of the interest rate of the Notes adjusted for risk factors.
16.2 FINANCIAL GUARANTEE LIABILITY
| | | | | |
Figures in million - SA rand | | | 2015 | 2014 | 2013 |
Balance at beginning of the year | | | 197.0 | 206.6 | 196.4 |
Amortisation of guarantee liability1 | | | (11.7) | (31.8) | (28.2) |
Foreign exchange loss | | | 11.6 | 22.2 | 38.4 |
Gain on derecognition of financial guarantee liability | | | (196.9) | - | - |
Balance at end of the year | | | - | 197.0 | 206.6 |
1 The amortisation charge of the guarantee liability is disclosed as part of the (loss)/gain on financial instruments in profit or loss.
| |
Sibanye Gold Annual Financial Report 2015 | 157 |
NOTES TO THE CONSOLIDATED FINANCIAL STATEMENTS continued
FOR THE YEAR ENDED 31 DECEMBER 2015
16.3 NET LOSS ON DERECOGNITION OF FINANCIAL GUARANTEE ASSET AND LIABILITY
| | | | | |
Figures in million - SA rand | | | | | 2015 |
Guarantee release fee | | | | | (61.4) |
Loss on derecognition of financial guarantee asset | | | | | (293.8) |
Gain on derecognition of financial guarantee liability | | | | | 196.9 |
Net loss on derecognition of the financial guarantee asset and liability | | (158.3) |
17. INVENTORIES
SIGNIFICANT ACCOUNTING JUDGEMENTS AND ESTIMATES
Costs that are incurred in or benefit the productive process are accumulated gold-in-process, uranium-in-process and product inventories. Net realisable value tests are performed at least annually and represent the estimated future sales price of the product based on prevailing spot commodity prices at the reporting date, less estimated costs to complete production and bring the product to sale. Future commodity price fluctuations could negatively impact the valuation of inventory. If any inventories are expected to be realised in the long-term horizon, estimated future sales prices are used for valuation purposes.
ACCOUNTING POLICY
The Group’s inventories comprise consumable stores and uranium stockpiles. Inventory is valued at the lower of cost and net realisable value. The Group values uranium-in-process and gold-in-process when it can be reliably measured. Consumable stores are valued at weighted average cost after appropriate provision for surplus and slow-moving items.
| | | | | |
Figures in million - SA rand | | | 2015 | 2014 | 2013 |
Consumable stores1 | | | 277.5 | 274.9 | 187.1 |
Uranium finished goods and uranium-in-process2 | | | 128.4 | 52.8 | - |
Total inventories | | | 405.9 | 327.7 | 187.1 |
1The cost of consumable stores consumed during the year and included in operating cost amounted to R3,995.7 million (2014: R3,480.4 million and 2013: R2,720.7 million).
2 Although the Uranium finished goods and Uranium-in-process was presented under current assets, management does not expect that this inventory will be realised within 12 months from the reporting date.
During the year ended 31 December 2015, the Company recognised a net realisable value write down of R24.0 million on its Uranium finished goods and Uranium-in-process inventory. The write down is disclosed as part of cost of sales.
18. TRADE AND OTHER RECEIVABLES
ACCOUNTING POLICY
Trade and other receivables are initially recognised at fair value and subsequently carried at amortised cost less allowance for impairment. Estimates made for impairment are based on a review of all outstanding amounts at period end. Irrecoverable amounts are written off during the period in which they are identified.
| | | | | |
Figures in million - SA rand | | | 2015 | 2014 | 2013 |
Trade receivables - gold sales | | | 933.4 | 383.4 | 473.3 |
Other trade receivables | | | 108.4 | 177.6 | 91.8 |
Prepayments | | | 123.7 | 68.9 | 116.7 |
Value added tax | | | 344.6 | 262.1 | 197.2 |
Payroll debtors | | | 109.5 | 87.3 | 54.9 |
Interest receivable | | | 7.8 | 13.5 | 39.9 |
Total trade and other receivables | | | 1 627.4 | 992.8 | 973.8 |
| |
Sibanye Gold Annual Financial Report 2015 | 158 |
NOTES TO THE CONSOLIDATED FINANCIAL STATEMENTS continued
FOR THE YEAR ENDED 31 DECEMBER 2015
19. CASH AND CASH EQUIVALENTS
ACCOUNTING POLICY
Cash and cash equivalents comprise cash on hand, demand deposits and short-term, highly liquid investments readily convertible to known amounts of cash and subject to insignificant risk of changes in value and are measured at amortised cost which is deemed to be fair value as they have a short-term maturity.
Bank overdrafts are included within current liabilities in the statement of financial position.
| | | | | |
Figures in million - SA rand | | | 2015 | 2014 | 2013 |
Cash at the bank and on hand | | | 717.4 | 562.9 | 1 082.4 |
Restricted cash1 | | | - | - | 410.0 |
Total cash and cash equivalents | | | 717.4 | 562.9 | 1 492.4 |
1 At 31 December 2013 R410.0 million was in an escrow account, being the consideration for the Wits Gold acquisition. Refer to note 12 for further details relating to the transaction.
20. STATED SHARE CAPITAL
ACCOUNTING POLICY
ORDINARY SHARE CAPITAL
Ordinary shares are classified as equity. Incremental costs directly attributable to the issue of ordinary shares are recognised as a deduction from equity, net of any tax effects.
| | | | | |
Figures in thousand | | Notes | 2015 | 2014 | 2013 |
Authorised number of shares | | | 2 000 000 | 1 000 000 | 1 000 000 |
Reconciliation of issued number of shares | | | | | |
Number of shares in issue at beginning of the year | | | 898 840 | 735 079 | 1 |
Shares issued under SGL Share Plan | | | 17 300 | 6 866 | 3 430 |
Shares issued as consideration for the acquisition of Cooke | | 12 | - | 156 895 | - |
Shares issued on unbundling | | | - | - | 731 648 |
Number of shares in issue at end of the year | | | 916 140 | 898 840 | 735 079 |
The authorised share capital was increased to 2,000,000,000 during the year ended 31 December 2015.
In terms of the general authority granted by the shareholders of the Company on 12 May 2015, the Board may issue authorised but unissued ordinary share capital representing not more than 5% of the issued share capital of the Company at 31 December 2014 in accordance with the memorandum of incorporation and the Companies Act.
On 15 May 2014 the Company issued 156,894,754 shares for the acquisition of Cooke (refer to note 12) in terms of the shareholder’s approval on 5 November 2013 that the Company may issue 150 million ordinary shares, or such number of shares that represent 17% of the issued share capital, on a fully diluted basis for the acquisition.
All the Sibanye ordinary shares rank pari passu in all respects, there being no conversion or exchange rights attached thereto, and all of the ordinary shares will have equal rights to participate in capital, dividend and profit distributions by the Company.
| |
Sibanye Gold Annual Financial Report 2015 | 159 |
NOTES TO THE CONSOLIDATED FINANCIAL STATEMENTS continued
FOR THE YEAR ENDED 31 DECEMBER 2015
21. NON-CONTROLLING INTERESTS
ACCOUNTING POLICY
NON-CONTROLLING INTERESTS
The Group recognises any non-controlling interests in an acquiree either at fair value or at the non-controlling interest’s proportionate share of the acquiree’s net assets on an acquisition by acquisition basis. Subsequently, the carrying amount of non-controlling interest is the amount of the interest at initial recognition plus the non-controlling interest’s subsequent share of changes in equity.
TRANSACTIONS WITH NON-CONTROLLING INTERESTS
The Group treats transactions with non-controlling interests as transactions with equity owners of the Group. For purchases from non-controlling interests, the difference between any consideration paid and the relevant share acquired of the carrying value of net assets of the subsidiary is recorded in equity. Gains or losses on disposals to non-controlling interests where control is not lost are also recorded in equity. Where control is lost over a subsidiary, the gains or losses are recognised in profit or loss.
The Group's non-controlling interests relates to the following subsidiaries:
| | | | | |
Figures in million - SA rand | | | 2015 | 2014 | 2013 |
Non-controlling interests of Newshelf 1114 | | | 107.3 | 327.4 | - |
Non-controlling interests of Goldfields Technical Security Management Proprietary Limited | | | 2.5 | 2.2 | 2.2 |
Total non-controlling interests | | | 109.8 | 329.6 | 2.2 |
SUBSIDIARIES THAT HAVE MATERIAL NON-CONTROLLING INTERESTS
NEWSHELF 1114
Sibanye has a 76% interest in Newshelf 1114, a company incorporated in the Republic of South Africa, which is involved in the mining of gold and uranium. The investment was acquired on 15 May 2014 (refer to note 12).
The current balance of 24% not owned by Sibanye forms part of the Newshelf 1114 BEE structure. Non-controlling interest takes into account any portion of the equity of Newshelf 1114 which is indirectly attributable to the shareholders of Sibanye as a result of funding provided by Sibanye.
The Newshelf 1114 BEE partners have no voting rights until it has fully repaid the loan owed to Sibanye.
The non-controlling interests of Newshelf 1114 consists of:
| | | | | |
Figures in million - SA rand | | Notes | 2015 | 2014 | 2013 |
Balance at beginning of the year | | | 327.4 | - | - |
Fair value of non-controlling interest on acquisition of Cooke | | 12 | - | 396.2 | - |
Non-controlling interest of the share of profits and losses of Cooke | | 2 | (179.0) | (44.6) | - |
Transactions with Sibanye1 | | | (41.1) | (24.2) | - |
Balance at end of the year | | | 107.3 | 327.4 | - |
1 The transaction with Sibanye relates to the interest on funding from Sibanye.
Summarised financial information of the Newshelf 1114 group:
| | | | | |
Figures in million - SA rand | | | 2015 | 2014 | 2013 |
Total revenue of the Newshelf 1114 group | | | 2 974.5 | 1 881.9 | - |
Total comprehensive income of the Newshelf 1114 group | | | (744.9) | (187.8) | - |
Non-current assets | | | 5 278.6 | 5 579.8 | - |
Current assets | | | 395.5 | 219.0 | - |
Non-current liabilities | | | (5 496.5) | (5 203.0) | - |
Current-liabilities | | | (1 143.5) | (816.8) | - |
Net assets (100.0%) | | | (965.9) | (221.0) | - |
| |
Sibanye Gold Annual Financial Report 2015 | 160 |
NOTES TO THE CONSOLIDATED FINANCIAL STATEMENTS continued
FOR THE YEAR ENDED 31 DECEMBER 2015
22. DEFERRED TAX
ACCOUNTING POLICY
Refer to note 8 for details of the accounting policy on deferred tax.
The detailed components of the net deferred tax liabilities which result from the differences between the amounts of assets and liabilities recognised for financial reporting and tax purposes in different accounting periods are:
| | | | | |
Figures in million - SA rand | | | 2015 | 2014 | 2013 |
Deferred tax liabilities | | | | | |
Mining assets | | | 4 822.8 | 5 202.8 | 3 849.7 |
Environmental rehabilitation obligation funds | | | 575.3 | 472.7 | 414.9 |
Other | | | 14.9 | 97.4 | 109.9 |
Gross deferred tax liabilities | | | 5 413.0 | 5 772.9 | 4 374.5 |
Deferred tax assets | | | | | |
Environmental rehabilitation obligation | | | (612.3) | (630.1) | (437.8) |
Other provisions | | | (341.6) | (228.5) | (202.0) |
Tax losses and unredeemed capital expenditure | | | (812.6) | (995.5) | (4.4) |
Share-based payment obligation | | | (148.3) | (101.1) | (30.7) |
Gross deferred tax assets | | | (1 914.8) | (1 955.2) | (674.9) |
| | | | | |
Net deferred tax liabilities | | | 3 498.2 | 3 817.7 | 3 699.6 |
| | | | | |
Included in the statement of financial position as follows: | | | | | |
Deferred tax assets | | | (63.2) | (51.6) | (35.8) |
Deferred tax liabilities | | | 3 561.4 | 3 869.3 | 3 735.4 |
Net deferred tax liabilities | | | 3 498.2 | 3 817.7 | 3 699.6 |
Reconciliation of the deferred tax balance: | | | | | |
Balance at beginning of the year | | | 3 817.7 | 3 699.6 | 4 162.2 |
Deferred tax recognised in profit or loss | | 8.2 | (319.5) | (51.1) | (553.6) |
Deferred tax recognised in equity | | | - | - | 79.1 |
Deferred tax on acquisition of subsidiaries | | 12 | - | 169.2 | - |
Loss of control of subsidiary | | | - | - | 11.9 |
Balance at end of the year | | | 3 498.2 | 3 817.7 | 3 699.6 |
At 31 December 2015, the Group had the following estimated amounts available for set-off against future income:
| | | | | |
Figures in million - SA rand | | | 2015 | 2014 | 2013 |
Tax losses | | | | | |
Wits Gold | | | 84.4 | 84.9 | - |
Burnstone | | | 155.3 | 422.5 | - |
Ezulwini | | | 1 481.0 | 1 186.7 | - |
St Helena Hospital Proprietary Limited | | | 31.3 | 33.4 | 14.2 |
Newshelf 1114 | | | 73.1 | - | - |
Golden Oils Proprietary Limited | | | - | 9.8 | 9.7 |
Total gross tax losses | | | 1 825.1 | 1 737.3 | 23.9 |
Other deductible temporary differences | | | | | |
Wits Gold | | | 64.2 | 64.2 | - |
Burnstone | | | 9 009.0 | 7 175.1 | - |
Ezulwini | | | 2 778.8 | 2 754.1 | - |
Total gross tax losses and other deductible temporary differences | 13 677.1 | 11 730.7 | 23.9 |
| | | | | |
Deferred tax assets not recognised | | | | | |
Wits Gold | | | 41.6 | 41.7 | - |
Burnstone | | | 2 566.0 | 2 127.3 | - |
Ezulwini | | | 1 192.7 | 1 103.4 | - |
St Helena Hospital Proprietary Limited | | | 8.8 | 9.4 | - |
Newshelf 1114 | | | 20.5 | - | - |
Golden Oils Proprietary Limited | | | - | 2.7 | 2.7 |
Total deferred tax assets not recognised | | | 3 829.6 | 3 284.5 | 2.7 |
These deductions are available to be utilised against income generated by the relevant tax entity and do not expire unless the tax entity concerned ceases to operate for a period of longer than one year. Under South African mining tax ring-fencing legislation, each tax entity is treated separately and as such these deductions can only be utilised by the tax entities in which the deductions have been generated.
| |
Sibanye Gold Annual Financial Report 2015 | 161 |
NOTES TO THE CONSOLIDATED FINANCIAL STATEMENTS continued
FOR THE YEAR ENDED 31 DECEMBER 2015
23. BORROWINGS
SIGNIFICANT ACCOUNTING JUDGEMENTS AND ESTIMATES
Borrowings are recognised initially at fair value. Expected future cash flows used to determine the fair value of borrowings are inherently uncertain and could materially change over time. They are significantly affected by a number of factors including reserves and production estimates, together with economic factors such as the expected commodity price, foreign currency exchange rates, estimates of production costs, future capital expenditure and discount rates.
ACCOUNTING POLICY
Borrowings are recognised initially at fair value, net of transaction costs incurred, where applicable and subsequently measured at amortised cost using the effective interest method.
Borrowings are classified as current liabilities unless the Group has an unconditional right to defer settlement of the liability for at least 12 months after the reporting date.
| | | | | |
Figures in million - SA rand | | | 2015 | 2014 | 2013 |
(a) R4.5 billion Facilities | | | 1 961.6 | 1 979.5 | 1 990.9 |
(b) Other borrowings | | | 33.7 | 56.1 | - |
(c) Burnstone Debt | | | 1 808.3 | 1 134.4 | - |
Total borrowings | | | 3 803.6 | 3 170.0 | 1 990.9 |
Reconciliation of the non-current and current portion of the borrowings: | | | |
Borrowings | | | 3 803.6 | 3 170.0 | 1 990.9 |
Current portion of borrowings | | | (1 995.3) | (554.2) | (499.5) |
Non-current portion of borrowings | | | 1 808.3 | 2 615.8 | 1 491.4 |
The current portion of borrowings will be repaid out of operational cash flows or it will be refinanced by utilising available Group facilities.
(a) R4.5 BILLION FACILITIES
On 13 December 2013, Sibanye cancelled and replaced the Bridge Loan Facilities (refer below) by drawing R2 billion under the R4.5 billion Facilities (the R4.5 billion Facilities), the balance may be applied to ongoing capital expenditure, working capital and general corporate expenditure requirements, where required.
| | | | |
Terms of the R4.5 billion Facilities |
Facility: | - R2.5 billion revolving credit facility (RCF) |
| - R2.0 billion term loan facility (Term Loan) |
Interest rate: | JIBAR |
Interest rate margin: | - RCF: 2.85% |
| - Term Loan: 2.75% |
Term of loan: | Three years |
Repayment period: | The Term Loan will repaid in equal six-monthly instalments of R250 million, with the R750 million balance and any amounts outstanding under the RCF due for settlement on final maturity, being 13 December 2016. |
Security and Guarantors: | The Facilities are unsecured and guaranteed by Rand Uranium and Ezulwini. |
| | | | | |
Figures in million - SA rand | | Notes | 2015 | 2014 | 2013 |
Balance at beginning of the year | | | 1 979.5 | 1 990.9 | - |
Loans raised | | | 1 000.0 | 884.6 | 2 000.0 |
Loans repaid | | | (1 020.9) | (900.0) | - |
Unwinding of amortised cost | | 5 | 3.0 | 4.0 | (9.1) |
Balance at end of the year | | | 1 961.6 | 1 979.5 | 1 990.9 |
Reconciliation of facilities: | | | | | |
Term loan | | | 998.0 | 1 494.9 | 1 990.9 |
RCF | | | 963.6 | 484.6 | - |
| |
Sibanye Gold Annual Financial Report 2015 | 162 |
NOTES TO THE CONSOLIDATED FINANCIAL STATEMENTS continued
FOR THE YEAR ENDED 31 DECEMBER 2015
(b) OTHER BORROWINGS
i) WITS GOLD LOAN
Wits Gold had a R40 million short-term unsecured loan (Wits Gold Loan) outstanding as part of the net assets acquired on 14 April 2014 (refer to note 12). On 15 May 2014 the Wits Gold Loan was repaid.
| | | | | |
Figures in million - SA rand | | Notes | 2015 | 2014 | 2013 |
Borrowings on acquisition of subsidiary | | 12 | - | 40.0 | - |
Loans repaid | | | - | (40.0) | - |
Balance at end of the year | | | - | - | - |
ii) COOKE LOAN
Cooke had R696.2 million of borrowings outstanding as part of the net assets acquired on 15 May 2014 (refer to note 12). These borrowings consisted of a R616 million term loan (Cooke Loan) and a US$7.7 million (R80.2 million) liability (Franco-Nevada liability (as detailed in (iii))).
As part of the conditions precedent to the acquisition of Cooke, the Cooke Loan was to be settled on completion of the acquisition. The Group thus repaid and cancelled the loan on 15 May 2014.
| | | | | |
Figures in million - SA rand | | Notes | 2015 | 2014 | 2013 |
Borrowings on acquisition of subsidiary | | 12 | - | 616.0 | - |
Loans repaid | | | - | (616.0) | - |
Balance at end of the year | | | - | - | - |
iii) FRANCO-NEVADA LIABILITY
On 5 November 2009, First Uranium Limited (First Uranium) (Ezulwini’s holding company prior to Sibanye’s acquisition of Cooke) signed an agreement with Franco-Nevada (Barbados) Corporation (Franco-Nevada).
The agreement establishes a determinable consideration for the sales of 7% of Ezulwini's production to Franco-Nevada in exchange for an upfront cash payment from Franco-Nevada to Ezulwini of US$50.0 million (Upfront Payment).
The Upfront Payment, which is guaranteed by Sibanye, is reduced by an amount equal to the difference between the spot price of gold on the date of gold delivery to Franco-Nevada and the lesser of US$400/oz (the Fixed Price), multiplied by the total ounces delivered. Ezulwini delivers 7% of its monthly production under this agreement.
In addition, Franco-Nevada will make an on-going payment equal to the lesser of the Fixed Price (subject to inflation adjustment of 1% per annum from 30 November 2013) and the prevailing spot price at such time of such payment, for each ounce of gold delivered under the contract.
| | | | | |
Figures in million - SA rand | | Notes | 2015 | 2014 | 2013 |
Balance at beginning of the year | | | 56.1 | - | - |
Borrowings on acquisition of subsidiary | | 12 | - | 80.2 | - |
Liability repaid1 | | | (34.6) | (26.2) | - |
Loss of foreign exchange differences | | | 12.2 | 2.1 | - |
Balance at end of the year | | | 33.7 | 56.1 | - |
1 The liability is reduced by an amount equal to the difference between the gold spot price on the date of delivery and the Fixed Price multiplied by the ounces delivered and is recognised as revenue. This reduction is not cash and is not reflected in the statement of cash flows.
| |
Sibanye Gold Annual Financial Report 2015 | 163 |
NOTES TO THE CONSOLIDATED FINANCIAL STATEMENTS continued
FOR THE YEAR ENDED 31 DECEMBER 2015
(c) BURNSTONE DEBT
SGEO had bank debt of US$178.1 million (R1,883.9 million) (the Burnstone Debt) outstanding as part of the net assets acquired on 1 July 2014 (refer to note 12 for further details of the Burnstone acquisition).
| |
Terms of the Burnstone Debt |
Facility: | - A1: US$0.2 million |
| - A2: US$7.8 million |
| - A3: US$51.0 million |
| - A4: US$119.1 million |
Interest rate: | - A1 and A2: Interest free |
| - A3 and A4: Interest free until 1 July 2017, then at London Interbank Offered Rate (LIBOR) |
Interest rate margin: | - A3 and A4: 4% from 1 July 2017 |
Term of loan: | No fixed term |
Repayment period: | - A1: Repaid on 1 July 2014 |
| - A2: From 1 July 2017 the first 50% of Burnstone’s free cash flow will be used to repay the Wits Gold Loan and the balance of 50% to repay A2 |
| - A3 and A4: On settlement of A2, 90% of Burnstone’s free cash flow will be used to repay the Wits Gold Loan and the balance of 10% to repay the Burnstone Debt. On settlement of the Wits Gold Loan and interest, 30% of Burnstone’s free cash flow will be used to repay the Burnstone Debt and the balance will be distributed to Wits Gold. |
| - The Bank Lenders will continue to participate in 10% of Burnstone’s free cash flow after the Burnstone Debt has been repaid in full to a maximum amount of US$63.0 million under a revenue participation agreement. |
Security: | The Burnstone Debt is fully secured against the assets of Burnstone and there is no recourse to the Sibanye Group. The security package includes a cession over the bank accounts, insurance policies’ proceeds, special and general notarial bonds over movable assets and mortgage bonds over property. |
The Burnstone Debt facilities of US$178.1 million (R1,883.9 million) were initially recognised at the acquisition fair value using level 2 (refer to note 32) assumptions, being R1,007.6 million, in terms of IFRS 3. The expected free cash flows to repay the loan as detailed above were based on the estimates and assumptions to determine the fair value:
| · | | A US$ swap forward curve adjusted with the 4% interest rate margin above; |
| · | | The annual life-of-mine (LOM) plan that takes into account the following: |
| - | | Proved and probable ore reserves of Burnstone; |
| - | | Cash flows are based on the life-of-mine plan of 23 years; and |
| - | | Capital expenditure estimates over the life-of-mine plan. |
| | | | | |
Figures in million - SA rand | | Notes | 2015 | 2014 | 2013 |
Balance at beginning of year | | | 1 134.4 | - | - |
Borrowings on acquisition of subsidiary | | | - | 1 007.6 | - |
Loans repaid | | | - | (1.9) | - |
Unwinding of amortised cost | | 5 | 99.3 | 39.3 | - |
Loss on foreign exchange differences | | | 412.1 | 89.4 | - |
Loss on revised estimated cash flows1 | | | 162.5 | - | - |
Balance at end of the year | | | 1 808.3 | 1 134.4 | - |
1 At the 31 December 2015, the expected free cash flows expected to repay the loan as detailed above were revised as a result of:
| · | | Revised proven and probable reserves; |
| · | | Revised cash flows over the LOM plan as a result of: |
| o | | Revised forecast costs and capital expenditure; and |
| o | | Revised gold prices (R550,000/kg) and exchange rates (R15.00/US$) |
In terms of IAS 39 AG8 the carrying value of the Burnstone Debt increased by R162.5 million, disclosed as part of loss on financial instruments in profit or loss.
| |
Sibanye Gold Annual Financial Report 2015 | 164 |
NOTES TO THE CONSOLIDATED FINANCIAL STATEMENTS continued
FOR THE YEAR ENDED 31 DECEMBER 2015
(d) BRIDGE LOAN FACILITIES
On 28 November 2012, Sibanye entered into a R6.0 billion term loan and RCF (the Bridge Loan Facilities) reducing to R5.0 billion as detailed below.
Terms of the Bridge Loan Facilities |
Facility: | - R2.0 billion RCF (Facility A) increased to R3.0 billion after it was amended in July 2013 |
| - R4.0 billion term loan facility (Facility B) reduced to R3.0 billion after it was amended in July 2013 |
| - Facility A and B would have reduced to R2.5 billion on the earliest of the Group declaring a final dividend in respect of 2013 or 12 months after the unbundling date |
Interest rate: | JIBAR |
Interest rate margin: | - 3.0% for 12 months after unbundling |
| - 3.5% for last six months of the facilities |
| - If Sibanye was not released as guarantor under the Notes within six months of unbundling, being 18 August 2013, the margin would have increased to 3.25% and 3.75% for the seven to 12 month and 13 to 18 month periods after unbundling, respectively |
Term of loan: | 18 months after the unbundling date |
Repayment period: | Full payment of the outstanding amount on maturity of the loan, being 18 August 2014 |
Cancellation: | These facilities were cancelled and repaid on 13 December 2013 |
| | | | | |
Figures in million - SA rand | | | 2015 | 2014 | 2013 |
Loans raised | | | - | - | 4 570.0 |
Loans repaid | | | - | - | (4 570.0) |
Balance at end of the year | | | - | - | - |
(e) LONG-TERM CREDIT FACILITIES
Sibanye and GFO (collectively the Borrowers) entered into various RCFs with some of the major banks in South Africa with tenors between three and five years. The purpose of these facilities was to finance capital expenditure, general corporate and working capital requirements and to refinance existing borrowings.
Terms of the Revolving credit facilities |
Facility: | - R1.0 billion RCF entered into on 9 December 2009 |
| - R500.0 million RCF entered into on 8 March 2010 |
| - R2.0 billion RCF entered into on 15 December 2011 |
Interest rate: | JIBAR |
Interest rate margin: | - R1.0 billion RCF: 3.00% |
| - R500.0 million RCF: 2.85% |
| - R2.0 billion RCF: 1.95% |
Term of loan: | - R1.0 billion RCF matures on 30 June 2013, being 3.5 years |
| - R500.0 million RCF maturing on 10 March 2013, being three years |
| - R2.0 billion RCF maturing on 19 December 2016, being five years |
Repayment period: | Full payment of outstanding amounts were due on maturity |
Guarantors: | Gold Fields and certain of its subsidiaries: GF Holdings, GFO, Orogen, Newshelf 899 Proprietary Limited and Sibanye. |
Cancelation: | These facilities were cancelled and repaid on 18 February 2013 |
| | | | | |
Figures in million - SA rand | | | 2015 | 2014 | 2013 |
Balance at beginning of the year | | | - | - | 3 000.0 |
Loans raised | | | - | - | 500.0 |
Loans repaid | | | - | - | (3 500.0) |
Balance at end of the year | | | - | - | - |
| |
Sibanye Gold Annual Financial Report 2015 | 165 |
NOTES TO THE CONSOLIDATED FINANCIAL STATEMENTS continued
FOR THE YEAR ENDED 31 DECEMBER 2015
(f) US$350 MILLION REVOLVING CREDIT FACILITY
On 24 August 2015 Sibanye entered into a US$300 million syndicated RCF agreement. Subsequent to year end the facility increased to US$350 million. The purpose of the facility was to finance ongoing capital expenditure, working capital and general corporate expenditure requirements which may include the financing of future acquisitions of business combinations.
Terms of the Revolving credit facility |
Facility: | - US$350 million RCF (31 December 2015: US$300 million RCF) |
Interest rate: | - LIBOR |
Interest rate margin: | - 2% per annum |
Utilisation fees: | Where the total outstanding loans under the RCF fall within the range of the percentage of the total loan as set out below, Sibanye shall pay an utilisation fee equal to the percentage per annum set out opposite such percentage range. |
| % of the total loans | | Utilisation fee |
| Less than or equal to 33⅓% | | 0.15% |
| Greater than 33⅓% and less than or equal to 66⅔% | | 0.30% |
| Greater than 66⅔% | | 0.50% |
Term of loan: | Three years | | |
Security and Guarantors: | The facility is unsecured and guaranteed by Rand Uranium |
The facility was undrawn as at 31 December 2015.
(g) US$150 MILLION BRIDGE FACILITY
On 5 October 2015 Sibanye entered into a US$300 million acquisition facility agreement with HSBC Bank plc as sole arranger for the purpose of providing funding, if required for the Aquarius Platinum Limited (Aquarius) acquisition (the Bridge Facility). The Bridge Facility can only be drawn on completion of the Aquarius acquisition. Subsequent to year end the Bridge Facility was reduced to US$150 million.
Terms of the bridge loan facility |
Facility: | - US$150 million (31 December 2015: US$300 million) |
Interest rate: | - LIBOR |
Interest rate margin: | - Month 0 - 6: 2.25% per annum. |
| - Month 7 - 9: 3.00% per annum. |
| - Month 10 - 12: 3.50% per annum. |
| - Month 13 - 18: 4.25% per annum. |
Term of loan: | 12 months from completion of the Aquarius acquisition with Sibanye’s option to extend for another six months (18 months from completion) |
Security and Guarantors: | Loans are unsecured and guaranteed by Rand Uranium |
The Bridge Facility can only be drawn on completion of the Aquarius Transaction which is expected to be in the first half of 2016, thus the facility was undrawn as at 31 December 2015.
(h) SHORT-TERM CREDIT FACILITIES
Sibanye has uncommitted loan facilities with various banks to fund the capital expenditure and working capital requirements at its operations. These facilities had no fixed terms, are short-term in nature and interest rates are market related.
| | | | | |
Figures in million - SA rand | | | 2015 | 2014 | 20131 |
Balance at beginning of the year | | | - | - | 1 220.0 |
Loans raised | | | 552.0 | 739.0 | 550.0 |
Loans repaid | | | (552.0) | (739.0) | (1 770.0) |
Balance at end of the year | | | - | - | - |
1 Borrowings under these facilities were guaranteed by Gold Fields. On the date of unbundling, these facilities were refinanced by drawing down under the Bridge Loan Facilities as detailed in (d).
| |
Sibanye Gold Annual Financial Report 2015 | 166 |
NOTES TO THE CONSOLIDATED FINANCIAL STATEMENTS continued
FOR THE YEAR ENDED 31 DECEMBER 2015
| | | | | |
Figures in million - SA rand | | | 2015 | 2014 | 2013 |
The exposure of the Group’s borrowings to interest rate changes and the contractual repricing dates at the reporting dates are as follows: | | | | | |
Floating rate with exposure to change in JIBAR | | | 1 961.6 | 1 979.5 | 1 990.9 |
Floating rate with exposure to change in LIBOR | | | 1 808.3 | 1 134.4 | - |
Non-current borrowings exposed to interest rate changes | | | 3 769.9 | 3 113.9 | 1 990.9 |
| | | | | |
The Group has the following undrawn borrowing facilities: | | | | | |
Committed | | | 6 198.4 | 2 015.4 | 2 500.0 |
Uncommitted | | | 548.0 | 548.0 | 499.7 |
Total undrawn facilities | | | 6 746.4 | 2 563.4 | 2 999.7 |
| | | | | |
All of the above facilities have floating rates. The uncommitted facilities have no expiry dates. The undrawn committed facilities have the following expiry dates: | | | | | |
– within one year | | 1 536.4 | - | - |
– later than one year and not later than two years | | | - | 2 015.4 | - |
– later than two years and not later than three years | | | 4 662.0 | - | 2 500.0 |
Total undrawn committed facilities | | | 6 198.4 | 2 015.4 | 2 500.0 |
24. ENVIRONMENTAL REHABILITATION OBLIGATION
SIGNIFICANT ACCOUNTING JUDGEMENTS AND ESTIMATES
The Group’s mining and exploration activities are subject to various laws and regulations governing the protection of the environment. The Group recognises management’s best estimate for asset retirement obligations in the period in which they are incurred. Actual costs incurred in future periods could differ materially from the estimates. Additionally, future changes to environmental laws and regulations, life of mine estimates and discount rates could affect the carrying amount of this provision.
ACCOUNTING POLICY
Provisions are recognised when the Group has a present obligation, legal or constructive resulting from past events and it is probable that an outflow of resources embodying economic benefits will be required to settle the obligation and a reliable estimate can be made of the amount of the obligation.
Long-term environmental obligations are based on the Group’s environmental management plans, in compliance with applicable environmental and regulatory requirements.
The estimated costs of rehabilitation are reviewed annually and adjusted as appropriate for changes in legislation, technology or other circumstances. Cost estimates are not reduced by the potential proceeds from the sale of assets or from plant clean up at closure.
Based on disturbances to date, the net present value of expected rehabilitation cost estimates is recognised and provided for in full in the financial statements. The estimates are reviewed annually and are discounted using a risk-free rate that is adjusted to reflect the current market assessments of the time value of money and the risks specific to the obligation.
Annual changes in the provision consist of finance costs relating to the change in the present value of the provision and inflationary increases in the provision estimate, as well as changes in estimates. Changes in estimates are capitalised or reversed against the relevant asset. If a decrease in the liability exceeds the carrying amount of the asset, the excess is recognised immediately in profit or loss. The present value of environmental disturbances created are capitalised to mining assets against an increase in the environmental rehabilitation obligation.
Rehabilitation projects undertaken, included in the estimates are charged to the provision as incurred. The cost of ongoing current programmes to prevent and control environmental disturbances is charged against income as incurred. The unwinding of the discount due to the passage of time is recognised as finance cost, and the capitalised cost is amortised over the remaining lives of the mines.
| |
Sibanye Gold Annual Financial Report 2015 | 167 |
NOTES TO THE CONSOLIDATED FINANCIAL STATEMENTS continued
FOR THE YEAR ENDED 31 DECEMBER 2015
| | | | | |
Figures in million - SA rand | | Notes | 2015 | 2014 | 2013 |
Balance at beginning of the year | | | 2 486.8 | 1 660.7 | 1 739.1 |
Interest charge1 | | | 197.9 | 161.5 | 92.7 |
Payment of environmental rehabilitation obligation | | | (0.3) | (10.9) | (10.5) |
Change in estimates2 | | 11 | (273.4) | 131.5 | (160.6) |
Environmental rehabilitation obligation on acquisition of subsidiaries | | 12 | - | 544.0 | - |
Balance at end of the year | | | 2 411.0 | 2 486.8 | 1 660.7 |
1 The provision is calculated based on the discount rates of 8.5% - 10.2% (2014: 7.2% – 8.6% and 2013: 7.2% – 8.2%).
2 Changes in estimates are defined as changes in reserves and corresponding changes in life of mine, changes in discount rates, and changes in laws and regulations governing environmental matters. In 2014 the environmental rehabilitation obligation acquired was calculated based on the weighted average cost of capital in terms of IFRS 3 for acquisition purposes. Subsequent to initial recognition the provision was recalculated based on the risk free rate of interest in terms of IAS 37. The relating change in estimate during 2014 was R153.1 million.
The Group’s mining operations are required by law to undertake rehabilitation works as part of their ongoing operations. The Group makes contributions into environmental rehabilitation obligation funds (refer to note 15) and holds guarantees to fund the estimated costs.
25. TRADE AND OTHER PAYABLES
ACCOUNTING POLICY
Trade and other payables are recognised initially at fair value and subsequently measured at amortised cost using the effective interest method.
| | | | | |
Figures in million - SA rand | | | 2015 | 2014 | 2013 |
Trade creditors | | | 508.7 | 542.6 | 529.4 |
Accruals and other creditors | | | 873.3 | 923.9 | 730.7 |
Payroll creditors | | | 797.8 | 748.4 | 402.1 |
Leave pay accrual | | | 553.8 | 482.5 | 401.4 |
Other | | | 25.8 | 17.2 | 9.4 |
Total trade and other payables | | | 2 759.4 | 2 714.6 | 2 073.0 |
26. CASH GENERATED BY OPERATIONS
| | | | | |
Figures in million - SA rand | | Notes | 2015 | 2014 | 2013 |
Profit for the year | | | 538.2 | 1 506.9 | 1 698.3 |
Royalties | | 8.1 | 400.6 | 430.5 | 414.6 |
Mining and income tax | | 8.2 | 377.2 | 828.1 | 256.2 |
Investment income | | | (257.0) | (183.2) | (160.3) |
Finance expense | | 5 | 561.8 | 400.0 | 420.3 |
Profit before interest, royalties and tax | | | 1 620.8 | 2 982.3 | 2 629.1 |
Non-cash and other adjusting items: | | | | | |
Amortisation and depreciation | | 4 | 3 636.6 | 3 254.7 | 3 103.9 |
Share-based payments | | 6 | 274.4 | 417.9 | 305.8 |
Share of results of equity-accounted investees after tax | | 14 | (116.0) | 470.7 | (51.5) |
Loss on financial instruments | | | 229.5 | 107.7 | 4.6 |
Loss/(gain) on foreign exchange differences | | | 420.1 | 82.7 | (4.2) |
Net loss on derecognition of financial guarantee asset and liability | | 16.3 | 158.3 | - | - |
Impairments | | 7 | - | 275.1 | 821.0 |
Reversal of impairment | | | - | (474.1) | - |
Loss on loss of control of subsidiary | | | - | - | 30.2 |
Other | | | (93.3) | (35.6) | 1.1 |
Total cash generated by operations | | | 6 130.4 | 7 081.4 | 6 840.0 |
27. CHANGE IN WORKING CAPITAL
| | | | | |
Figures in million - SA rand | | | 2015 | 2014 | 2013 |
Inventories | | | (78.2) | (62.6) | 161.8 |
Trade and other receivables | | | (634.6) | 166.7 | 132.6 |
Trade and other payables | | | 44.8 | 110.4 | 265.9 |
Living Gold working capital | | | - | - | 8.4 |
Total change in working capital | | | (668.0) | 214.5 | 568.7 |
| |
Sibanye Gold Annual Financial Report 2015 | 168 |
NOTES TO THE CONSOLIDATED FINANCIAL STATEMENTS continued
FOR THE YEAR ENDED 31 DECEMBER 2015
28. ROYALTIES AND TAX PAID
28.1 Royalties paid
| | | | | |
Figures in million - SA rand | | | 2015 | 2014 | 2013 |
Royalties payable at beginning of the year | | | 20.4 | 240.0 | 74.4 |
Royalties | | 8.1 | 400.6 | 430.5 | 414.6 |
Royalties paid | | | (395.4) | (650.1) | (249.0) |
Royalties payable at end of the year | | | 25.6 | 20.4 | 240.0 |
28.2 Tax paid
| | | | | |
Figures in million - SA rand | | Notes | 2015 | 2014 | 2013 |
Tax payable at beginning of the year | | | 63.6 | 527.2 | 22.2 |
Current tax | | 8.2 | 696.7 | 879.2 | 809.8 |
Tax payable on acquisition of subsidiaries | | 12 | - | 4.3 | - |
Tax paid | | | (656.3) | (1 347.1) | (304.8) |
Tax payable at end of the year | | | 104.0 | 63.6 | 527.2 |
29. COMMITMENTS
| | | | | |
Figures in million - SA rand | | | 2015 | 2014 | 2013 |
Capital expenditure | | | | | |
– authorised | | | 3 052.6 | 4 717.4 | 4 206.3 |
Kloof | | | 1 307.7 | 1 851.0 | 1 847.6 |
Driefontein | | | 725.5 | 1 177.1 | 1 387.1 |
Beatrix | | | 120.3 | 270.8 | 965.0 |
Cooke | | | 194.1 | 650.5 | - |
Burnstone | | | 705.0 | 768.0 | - |
Other | | | - | - | 6.6 |
– contracted for | | | 294.4 | 350.5 | 286.9 |
Other guarantees | | | 55.5 | 55.5 | 4.1 |
Commitments will be funded from internal sources and to the extent necessary from borrowings. This expenditure primarily relates to hostel upgrades, mining activities and infrastructure.
30. CONTINGENT LIABILITIES
SIGNIFICANT ACCOUNTING JUDGEMENTS AND ESTIMATES
Contingencies can be either possible assets or possible liabilities arising from past events which, by their nature, will only be resolved when one or more future events not wholly within the control of the Group occur or fail to occur or for contingent liabilities where a present obligation arising from a past event exists but is not recognised because either it is not probable that an out-flow of resources embodying economic benefits will be required to settle the obligation or the amount of the obligation cannot be determined with sufficient reliability. The assessment of such contingencies inherently involves the exercise of significant judgement and estimates of the outcome of future events.
POST CLOSURE WATER MANAGEMENT LIABILITY
The Group has identified a minor risk of potential long-term Acid Mine Drainage (AMD), on certain of its operations. AMD relates to the acidification and contamination of naturally occurring water resources by pyrite-bearing ore contained in underground mines and in rock dumps, tailings dams and pits on the surface. The Group has not been able to reliably determine the financial impact that AMD might have on the Group, nor the timing of possible out flow, however, the Group has adopted a proactive approach by initiating projects such as Sibanye Amanzi (long-term water management strategy), the acquisition and development of innovative treatment technologies; and the development of regional mine closure
| |
Sibanye Gold Annual Financial Report 2015 | 169 |
NOTES TO THE CONSOLIDATED FINANCIAL STATEMENTS continued
FOR THE YEAR ENDED 31 DECEMBER 2015
models to predict water quality impacts. The Group operates a comprehensive water quality monitoring program, including bio-monitoring, as an early detection of potential AMD.
OCCUPATIONAL HEALTHCARE SERVICES
The Group provides occupational healthcare services to its employees through its existing facilities at the various operations. There is a risk that the cost of providing such services could increase in future, depending upon changes in the nature of underlying legislation and the profile of employees. Any such increased cost cannot be quantified. The costs are however also mitigated by advances in technology relating to occupational health. The Group is monitoring developments in this regard.
The principal health risks associated with Sibanye's mining operations in South Africa arise from occupational exposure to silica dust, noise, heat and certain hazardous chemicals. The most significant occupational diseases affecting Sibanye's workforce include lung diseases (such as silicosis, tuberculosis, a combination of the two and chronic obstructive airways disease (COAD), as well as noise induced hearing loss. The Occupational Diseases in Mines and Works Act, 78 of 1973, (ODMWA), governs the compensation paid to mining employees who contract certain illnesses, such as silicosis. The South African Constitutional Court has ruled that a claim for compensation under ODMWA does not prevent an employee from seeking compensation from its employer in a civil action under common law (either as individuals or as a class). While issues, such as negligence and causation, need to be proved on a case-by-case basis, it is possible that such ruling could expose Sibanye to individual or class action claims related to occupational hazards and diseases (including silicosis). If Sibanye were to face a significant number of such claims and the claims were suitably established against it, the payments of compensation for the claims could have a material adverse effect on Sibanye’s results of operations and financial position. In addition, Sibanye may incur significant additional costs arising out of these issues, including costs relating to the payment of fees, levies or other contributions in respect of compensatory or other funds established (if any), and expenditures arising out of its efforts to resolve any outstanding claims or other potential action.
On 21 August 2012, a court application was served on a group of respondents that included Sibanye (the August Respondents). On 21 December 2012, a further court application was issued and was formally served on a number of respondents, including Sibanye (the December Respondents) and, again on 10 January 2013, both the August Respondents and the December Respondents (together the Respondents), on behalf of current and former mine workers, and their dependants, of, amongst others, Sibanye, and who allegedly contracted silicosis and/or other occupational lung diseases (OLD) (the Class). The court application of 21 August 2012 and 21 December 2012 are together referred to below as the Applications.
Sibanye filed a notice of its intention to oppose the applications and its attorneys to defend the claims.
These Applications requested that the court,
| 1. | | As a first phase, to certify a class action to be instituted by the applicants on behalf of the class, as defined. |
| 2. | | As a second phase to possibly split the class, as defined into smaller classes based on common legal and factual issues. The Respondents are of the view that the definition of the class in the first phase and the proposed process involving the second phase are contrary to South African legal precedent. |
| 3. | | In the last phase, bring an action wherein they will attempt to hold the respondents liable for silicosis and other OLD and resultant consequences. |
The Applications do not identify the number of claims that may be instituted against the Respondents or the quantum of damages that the applicants may seek.
The Applications were heard during the weeks of 12 and 19 October 2015. Judgement is expected to be handed down during the first quarter of 2016. Anglo American South Africa, AngloGold Ashanti, Gold Fields, Harmony and Sibanye announced in November 2014 that they have formed a gold mining industry working group to address issues relating to the compensation and medical care for OLD in the gold mining industry in South Africa. Essentially, the companies are seeking a comprehensive and sustainable solution which deals both with the legacy compensation issues and future legal frameworks which, while being fair to employees, also ensures the future sustainability of companies in the industry.
The companies have engaged all stakeholders on these matters, including government, organised labour, other mining companies and legal representatives of claimants who have filed legal suits against the companies. These legal proceedings are being defended.
At this stage, Sibanye can neither quantify the potential liability from the action as the application is currently for certification of a class (and possibly, subsequent classes) nor can the length of time until finalisation be estimated.
| |
Sibanye Gold Annual Financial Report 2015 | 170 |
NOTES TO THE CONSOLIDATED FINANCIAL STATEMENTS continued
FOR THE YEAR ENDED 31 DECEMBER 2015
31. EVENTS AFTER THE REPORTING DATE
There were no events that could have a material impact on the financial results of the Group after 31 December 2015, other than those disclosed below.
FINAL DIVIDEND DECLARED
On 24 February 2016 a final dividend in respect of the six months ended 31 December 2015 of 90 SA cents per share was approved by the Board, resulting in a total dividend of 100 SA cents per share for the year ended 31 December 2015. This dividend is not reflected in these financial statements. The final dividend will be subject to Dividend Withholding Tax.
AQUARIUS ACQUISITION
On 6 October 2015 Sibanye announced a cash offer of US$0.195 per share for the entire issued share capital of Aquarius (the Aquarius Transaction), valuing Aquarius at US$294 million. On 18 January 2016 at the special general meeting of Aquarius, the requisite majority of Aquarius shareholders approved the transaction, whereby Sibanye will acquire all of the shares of Aquarius. On 16 March 2016, the suspensive condition to obtain competition commission approval was met for the Aquarius acquisition. Sibanye and Aquarius will now proceed to fulfil the final conditions precedent, in accordance with the Implementation Agreement. An update and the required business combination disclosures will accordingly be provided in Sibanye’s interim report for the six months ended 30 June 2016.
Carrying value of assets and liabilities of Aquarius at 31 December 2015
The following table summarises the carrying value of assets and liabilities of Aquarius at 31 December 2015 and is provided for information purposes only. The assets and liabilities have been extracted from the unaudited financial results for the six months ended 31 December 2015 and translated using the rate at 31 December 2015 of R15.54/US$.
| | | | | | | | | |
Figures in million - SA rand | | | | | | | | | 2015 |
Property, plant and equipment | | | | | | | | | 2 210.5 |
Investments in joint venture entities | | | | | | | | | 1 477.1 |
Other non-current assets | | | | | | | | | 402.8 |
Inventories | | | | | | | | | 148.8 |
Trade and other receivables | | | | | | | | | 282.2 |
Cash and cash equivalents | | | | | | | | | 655.3 |
Environmental rehabilitation obligation | | | | | | | | | (744.1) |
Other non-current liabilitites | | | | | | | | | (75.2) |
Trade and other payables | | | | | | | | | (479.8) |
Other current liabilities | | | | | | | | | (80.0) |
Total identifiable net assets acquired | | | | | | | | | 3 797.6 |
Acquisition related costs
The Group incurred acquisition related costs of R16.2 million on advisory and legal fees. These costs are recognised as transaction costs in profit or loss.
THE RUSTENBURG OPERATIONS ACQUISITION
On 9 September 2015 Sibanye announced that it entered into written agreements with Rustenburg Platinum Mines Limited (RPM), a wholly owned subsidiary of Anglo American Platinum Limited to acquire the Bathopele, Siphumelele (including Khomanani), and Thembelani (including Khuseleka) mining operations, two concentrating plants, an on-site chrome recovery plant, the Western Limb Tailings Retreatment Plant, associated surface infrastructure and related assets and liabilities on a going concern basis (the Rustenburg Operations) (the Rustenburg Operations Transaction).
The purchase consideration comprises an upfront payment of R1.5 billion in cash or shares at the closing of the Rustenburg Operation Transaction (Closing) and a deferred payment calculated as being equal to 35% of the distributable free cash flow generated by the Rustenburg Operations over a six year period from the later of Closing or 1 January 2017 (Deferred Payment), subject to a minimum payment of R3.0 billion. In addition to the Deferred Payment, which allows for a favourably extended payment period; should, the Rustenburg Operations generate negative distributable free cash flows in either 2016, 2017 or 2018, RPM will be required to pay up to R267 million per annum to ensure that the free cash flow for the relevant year is equal to zero.
On 18 January 2016 at the shareholders meeting of Sibanye, the Sibanye shareholders approved the proposed Rustenburg Operations Transaction by voting in favour of the various resolutions to give effect to the Rustenburg Operations Transaction.
| |
Sibanye Gold Annual Financial Report 2015 | 171 |
NOTES TO THE CONSOLIDATED FINANCIAL STATEMENTS continued
FOR THE YEAR ENDED 31 DECEMBER 2015
On 16 March 2016, the suspensive condition to obtain competition commission approval was met for the Rustenburg Operations acquisition.
The Rustenburg Operations Transaction is still subject to the fulfilment of the following condition precedent and is likely to be concluded during the second half of 2016:
| · | | the granting on or before 30 June 2017 of consent in terms of section 11 of the Mineral and Petroleum Resources Development Act for the sale of the mining right and prospecting right pursuant to the Rustenburg Operations Transaction. |
32. FAIR VALUE OF FINANCIAL ASSETS AND FINANCIAL LIABILITIES
ACCOUNTING POLICY
Financial instruments recognised in the statement of financial position include cash and cash equivalents, investments, trade and other receivables, borrowings, trade and other payables and derivative financial instruments.
The Group initially recognises loans and receivables on the date they originate. All other financial assets (including assets designated at fair value through profit or loss) are recognised initially on trade date, which is the date that the Group becomes a party to the contractual provisions of the instrument. The Group derecognises a financial asset when the contractual rights to the cash flows in a transaction in which substantially all the risks and rewards of the ownership of the financial asset are transferred. The Group derecognises a financial liability when its contractual obligations are discharged, cancelled or expired. Any interest in such transferred financial asset that is created or retained by the Group is recognised as a separate asset or liability. The particular recognition and measurement methods adopted are disclosed in the individual policy statements associated with each item.
A financial asset not classified at fair value through profit or loss is assessed at each reporting date to determine whether there is objective evidence that it is impaired. A financial asset is impaired if there is objective evidence of impairment as a result of one or more events that occurred after the initial recognition of the asset and those event(s) had an impact on the estimated future cash flows of that asset, that can be estimated reliably. Impairment losses are recognised through profit or loss.
On derecognition of a financial asset or liability, the difference between the carrying amount of the asset or liability and the sum of the consideration received and cumulative gains recognised in equity is recognised in profit or loss.
Refer to the relevant notes for the accounting policies of the following financial assets and financial liabilities:
| · | | Environmental rehabilitation obligation funds |
| · | | Trade and other receivables |
| · | | Cash and cash equivalents |
| · | | Trade and other payables |
The following methods and assumptions were used to estimate the fair value of each class of financial instrument:
| · | | Trade and other receivables/payables, cash and cash equivalents and financial guarantee asset and liability |
The carrying amounts approximate fair values due to the short maturity of these instruments.
| · | | Investments and environmental rehabilitation obligation funds |
The fair value of publicly traded instruments is based on quoted market values. The environmental rehabilitation obligation funds are stated at fair value based on the nature of the funds’ investments.
The fair value of borrowings approximates its carrying amounts as the impact of credit risk is included in the measurement of carrying amounts.
The fair value of financial instruments is estimated based on ruling market prices, volatilities and interest rates at 31 December 2015. All derivatives are carried on the statement of financial position at fair value.
| |
Sibanye Gold Annual Financial Report 2015 | 172 |
NOTES TO THE CONSOLIDATED FINANCIAL STATEMENTS continued
FOR THE YEAR ENDED 31 DECEMBER 2015
The Group uses the following hierarchy for determining and disclosing the fair value of financial instruments:
Level 1: unadjusted quoted prices in active markets for identical asset or liabilities;
Level 2: inputs other than quoted prices in level 1 that are observable for the asset or liability, either directly (as prices) or indirectly (derived from prices); and
Level 3: inputs for the asset or liability that are not based on observable market data (unobservable inputs).
| | | | | | | | | | |
| | Carrying value | Fair Value |
Figures in million - SA Rand | | Fair value
through
profit or
loss | Loans and other receivables | Available
for sale | Other
financial
liabilities | Total | Level 1 | Level 2 | Level 3 | Total |
31 December 2015 | | | | | | | | | | |
Financial assets | | | | | | | | | | |
Measured at fair value: | | | | | | | | | | |
- Environmental rehabilitation obligation funds | | 2 413.9 | - | - | - | 2 413.9 | 2 413.9 | - | - | 2 413.9 |
Financial liabilities | | | | | | | | | | |
Not measured at fair value: | | | | | | | | | | |
- Borrowings | | - | - | - | 3 803.6 | 3 803.6 | | | | |
31 December 2014 | | | | | | | | | | |
Financial assets | | | | | | | | | | |
Not measured at fair value: | | | | | | | | | | |
- Financial guarantee asset | | - | 282.6 | - | - | 282.6 | | | | |
Measured at fair value: | | | | | | | | | | |
- Environmental rehabilitation obligation funds | | 2 192.8 | - | - | - | 2 192.8 | 2 192.8 | - | - | 2 192.8 |
Financial liabilities | | | | | | | | | | |
Not measured at fair value: | | | | | | | | | | |
- Financial guarantee liability | | - | - | - | 197.0 | 197.0 | | | | |
- Borrowings | | - | - | - | 3 170.0 | 3 170.0 | | | | |
31 December 2013 | | | | | | | | | | |
Financial assets | | | | | | | | | | |
Not measured at fair value: | | | | | | | | | | |
- Financial guarantee asset | | - | 290.2 | - | - | 290.2 | | | | |
Measured at fair value: | | | | | | | | | | |
- Environmental rehabilitation obligation funds | | 1 588.1 | - | - | - | 1 588.1 | 1 588.1 | - | - | 1 588.1 |
Financial liabilities | | | | | | | | | | |
Not measured at fair value: | | | | | | | | | | |
- Financial guarantee liability | | - | - | - | 206.6 | 206.6 | | | | |
- Borrowings | | - | - | - | 1 990.9 | 1 990.9 | | | | |
Environmental rehabilitation obligation funds
Comprises interest-bearing short-term investments valued using quoted market prices.
33. RISK MANAGEMENT ACTIVITIES
In the normal course of its operations, the Group is exposed to market risks, including commodity price, foreign currency, interest rate, liquidity and credit risk associated with underlying assets, liabilities and anticipated transactions. In order to manage these risks, the Group has developed a comprehensive risk management process to facilitate control and monitoring of these risks.
CONTROLLING AND MANAGING RISK IN THE GROUP
Sibanye has policies in areas such as counterparty exposure, hedging practices and prudential limits which have been approved by Sibanye's Board of Directors (the Board). Management of financial risk is centralised at Sibanye’s treasury department (Treasury), which acts as the interface between Sibanye’s Operations and counterparty banks. Treasury manages financial risk in accordance with the policies and procedures established by the Board and Executive Committee.
| |
Sibanye Gold Annual Financial Report 2015 | 173 |
NOTES TO THE CONSOLIDATED FINANCIAL STATEMENTS continued
FOR THE YEAR ENDED 31 DECEMBER 2015
The Board has approved dealing limits for money market, foreign exchange and commodity transactions, which Treasury is required to adhere to. Among other restrictions, these limits describe which instruments may be traded and demarcate open position limits for each category as well as indicating counterparty credit-related limits. The dealing exposure and limits are checked and controlled each day and reported to the CFO.
The objective of Treasury is to manage all financial risks arising from the Group’s business activities in order to protect profit and cash flows. Treasury activities of Sibanye and its subsidiaries are guided by the Treasury Policy, the Treasury Framework as well as domestic and international financial market regulations. Treasury activities are currently performed within the Treasury Framework with appropriate resolutions from the Board, which are reviewed and approved annually by the Audit Committee.
The financial risk management objectives of the Group are defined as follows:
| · | | Liquidity risk management: the objective is to ensure that the Group is able to meet its short-term commitments through the effective and efficient management of cash and usage of credit facilities. |
| · | | Currency risk management: the objective is to maximise the Group’s profits by minimising currency fluctuations. |
| · | | Funding risk management: the objective is to meet funding requirements timeously and at competitive rates by adopting reliable liquidity management procedures. |
| · | | Investment risk management: the objective is to achieve optimal returns on surplus funds. |
| · | | Interest rate risk management: the objective is to identify opportunities to prudently manage interest rate exposures. |
| · | | Counterparty exposure: the objective is to only deal with approved counterparts that are of a sound financial standing and who have an official credit rating. The Group is limited to a maximum investment of 2.5% of the financial institutions’ equity, which is dependent on the institutions’ credit rating. The credit rating used is Fitch Ratings’ short-term credit rating for financial institutions. |
| · | | Commodity price risk management: commodity risk management takes place within limits and with counterparts as approved in the treasury framework. |
| · | | Operational risk management: the objective is to implement controls to adequately mitigate the risk of error and/or fraud. |
| · | | Banking relations management: the objective is to maintain relationships with credible financial institutions and ensure that all contracts and agreements related to risk management activities are co-ordinated and consistent throughout the Group and that they comply where necessary with all relevant regulatory and statutory requirements. |
CREDIT RISK
Credit risk represents risk that an entity will suffer a financial loss due to the other party of a financial instrument not discharging its obligation.
The Group has reduced its exposure to credit risk by dealing with a number of counterparties. The Group approves these counterparties according to its risk management policy and ensures that they are of good credit quality.
Trade receivables are reviewed on a regular basis and an allowance for impairment is raised when they are not considered recoverable.
The combined maximum credit risk exposure is as follows:
| | | | | | | |
Figures in million - SA rand | | | | Notes | 2015 | 2014 | 2013 |
Environmental rehabilitation obligation funds | | | | 15 | 2 413.9 | 2 192.8 | 1 588.1 |
Trade and other receivables | | | | 18 | 1 159.1 | 661.8 | 659.9 |
Cash and cash equivalents | | | | 19 | 717.4 | 562.9 | 1 492.4 |
Financial guarantee asset | | | | 16.1 | - | 282.6 | 290.2 |
Trade receivables comprise banking institutions purchasing gold bullion. These receivables are in a sound financial position and no impairment has been recognised. Trade and other receivables above exclude VAT and pre-payments.
Receivables that are past due but not impaired total R5.4 million (2014: R19.4 million and 2013: R10.4 million). At 31 December 2015, receivables of R1.9 million (2014: R0.3 million and 2013: R0.8 million) are considered impaired and are provided for.
Concentration of credit risk on cash and cash equivalents and non-current assets is considered minimal due to the abovementioned investment risk management and counterparty exposure risk management policies.
| |
Sibanye Gold Annual Financial Report 2015 | 174 |
NOTES TO THE CONSOLIDATED FINANCIAL STATEMENTS continued
FOR THE YEAR ENDED 31 DECEMBER 2015
LIQUIDITY RISK
In the ordinary course of business, the Group receives cash proceeds from its operations and is required to fund working capital and capital expenditure requirements. The cash is managed to ensure surplus funds are invested to maximise returns whilst ensuring that capital is safeguarded to the maximum extent possible by investing only with top financial institutions.
Uncommitted borrowing facilities are maintained with several banking counterparties to meet the Group’s normal and contingency funding requirements.
The following are contractually due, undiscounted cash flows resulting from maturities of financial liabilities including interest payments:
| | | | | | | |
Figures in million - SA rand | | | | Total | Within one year | Between one and five years | After five years |
31 December 2015 | | | | | | | |
Trade and other payables | | | | 2 205.6 | 2 205.6 | - | - |
Borrowings1 | | | | | | | |
- Capital | | | | 4 871.7 | 1 970.7 | 113.9 | 2 787.1 |
- Interest | | | | 1 872.7 | 168.7 | 52.9 | 1 651.1 |
Total | | | | 8 950.0 | 4 345.0 | 166.8 | 4 438.2 |
31 December 2014 | | | | | | | |
Trade and other payables | | | | 2 232.1 | 2 232.1 | - | - |
Financial guarantee2 | | | | 11 560.0 | 11 560.0 | - | - |
Borrowings1 | | | | | | | |
- Capital | | | | 4 041.0 | 500.0 | 1 574.6 | 1 966.4 |
- Interest | | | | 1 754.9 | 124.3 | 81.9 | 1 548.7 |
Total | | | | 19 588.0 | 14 416.4 | 1 656.5 | 3 515.1 |
31 December 2013 | | | | | | | |
Trade and other payables | | | | 1 671.6 | 1 671.6 | - | - |
Financial guarantee2 | | | | 10 340.0 | 10 340.0 | - | - |
Borrowings1 | | | | | | | |
- Capital | | | | 2 000.0 | 500.0 | 1 500.0 | - |
- Interest | | | | 334.8 | 153.6 | 181.2 | - |
Total | | | | 14 346.4 | 12 665.2 | 1 681.2 | - |
1 Borrowings – JIBAR and LIBOR at 31 December 2015 adjusted by specific facility agreement of 2.75% and 4.00%, respectively.
2 Financial guarantee relates to Sibanye’s gross exposure in respect of the Gold Fields group’s borrowings at 31 December 2014 and 2013.
MARKET RISK
The Group is exposed to market risks, including foreign currency, commodity price, equity securities price and interest rate risk associated with underlying assets, liabilities and anticipated transactions. Following periodic evaluation of these exposures, the Group may enter into derivative financial instruments to manage some of these exposures.
SENSITIVITY ANALYSIS
The sensitivity analysis shows the effects of reasonable possible changes of relevant risk variables on profit or loss or shareholders’ equity. The Group is exposed to commodity price, currency and interest rate risks. The effects are determined by relating the reasonable possible change in the risk variable to the balance of financial instruments at period end date.
The amounts generated from the sensitivity analysis are forward-looking estimates of market risks assuming certain adverse or favourable market conditions occur. Actual results in the future may differ materially from those projected results and therefore should not be considered a projection of likely future events and gains/losses.
| |
Sibanye Gold Annual Financial Report 2015 | 175 |
NOTES TO THE CONSOLIDATED FINANCIAL STATEMENTS continued
FOR THE YEAR ENDED 31 DECEMBER 2015
FOREIGN CURRENCY SENSITIVITY
General and policy
In the ordinary course of business, the Group enters into transactions, such as gold sales, denominated in foreign currencies, primarily US dollar. Although this exposes the Group to transaction and translation exposure from fluctuations in foreign currency exchange rates, the Group does not generally hedge this exposure, although it could be considered for significant expenditures based in foreign currency or those items which have long lead times to produce or deliver. Also, the Group on occasion undertakes currency hedging to take advantage of favourable short-term fluctuations in exchange rates when management believes exchange rates are at unsustainably high levels.
Currency risk only exists on account of financial instruments being denominated in a currency that is not the functional currency and being of a monetary nature. This includes but is not limited to financial guarantee (refer to note 16), Franco-Nevada liability (refer to note 23(b)(iii)) and Burnstone Debt (refer to note 23(c)).
Foreign currency hedging experience
As at 31 December 2015, 2014 and 2013 there were no material foreign currency contract positions. As of 14 March 2016 there were no material foreign currency positions.
During the years ended 31 December 2015, 2014 and 2013, no forward cover was taken out to cover various commitments of Sibanye’s operations.
Foreign currency sensitivity analysis
Sibanye’s operations are all located in South Africa and its revenues are equally sensitive to changes in the US dollar gold price and the rand/US dollar exchange rate (the exchange rate). Depreciation of the rand against the US dollar results in Sibanye’s revenues and operating margin increasing. Conversely, should the rand appreciate against the US dollar, revenues and operating margins would decrease. The impact on profitability of any change in the exchange rate can be substantial. Furthermore, the exchange rates obtained when converting US dollars to rand are set by foreign exchange markets over which Sibanye has no control. The relationship between currencies and commodities, which includes the gold price, is complex and changes in exchange rates can influence commodity prices and vice versa. For more information regarding fluctuations in the value of the Rand against the US dollar, see Annual Financial Report–Overview–Five year financial performance.
A sensitivity analysis of the mark-to-market valuation has not been performed as there were no material foreign currency contracts as of 14 March 2016.
COMMODITY PRICE SENSITIVITY
Gold
The market price of gold has a significant effect on the results of operations of the Group and the ability of the Group to pay dividends and undertake capital expenditures. The gold price has historically fluctuated widely and is affected by numerous industry factors over which the Group does not have any control. The aggregate effect of these factors on the gold price, all of which are beyond the control of the Group, is impossible for the Group to predict.
COMMODITY PRICE HEDGING POLICY
Gold
As a general rule, the Group does not enter into forward sales, derivatives or other hedging arrangements to establish a price in advance for future gold production. Gold hedging could, however, be considered in future under one or more of the following circumstances: to protect cash flows at times of significant capital expenditure; financing projects or to safeguard the viability of higher cost operations.
To the extent that it enters into commodity hedging arrangements, the Group seeks to use different counterparty banks consisting of local and international banks to spread risk. None of the counterparties is affiliated with, or related to parties of the Group.
| |
Sibanye Gold Annual Financial Report 2015 | 176 |
NOTES TO THE CONSOLIDATED FINANCIAL STATEMENTS continued
FOR THE YEAR ENDED 31 DECEMBER 2015
Commodity price hedging experience
As at 31 December 2015, 2014 and 2013 no commodity price derivative instruments were entered into.
Subsequent to year end Sibanye entered into a sale of gold forward agreement (the Cooke Hedge) to sell forward 22,100oz of Cooke’s gold effective from 1 February 2016 to 23 December 2016 at an average price of R18,777/oz.
Commodity price contract position
As of 31 December 2015, 2014 and 2013, Sibanye had no outstanding commodity price contracts. As of 14 March 2015, 20,000 ounces of the Cooke Hedge had not yet been delivered.
INTEREST RATE SENSITIVITY
General
As the Group has no significant interest-bearing assets, the Group’s income and operating cash flows are substantially independent of changes in market interest rates. The Group’s interest rate risk arises from long-term borrowings.
As of 31 December 2015, the Group’s total borrowings amounted to R3,803.6 million (2014: R3,170.0 million and 2013: R1,990.9 million). The Group generally does not undertake any specific action to cover its exposure to interest rate risk, although it may do so in specific circumstances. Refer to note 23 for all the borrowings and the relevant interest rates per facility.
The portion of Sibanye’s interest-bearing borrowings at period end that is exposed to interest rate fluctuations is R3,769.9 million (2014:R3,113.9 million and 2013: R1,990.9 million). This debt is normally rolled for periods between one and three months and is therefore exposed to the rate changes in this period.
R1,961.6 million (2014: R1,979.5 million and 2013: R1,990.9 million) of the total borrowings at the end of the period is exposed to changes in the JIBAR rate and R1,808.3 million (2014: R1,134.4 and 2013: Rnil) is exposed to changes in the LIBOR rate. The relevant interest rates for each facility are described in note 23.
The table below summarises the effect of a change in finance expense on the Group’s profit or loss had JIBAR and LIBOR differed as indicated. The analysis is based on the assumption that the applicable interest rate increased/decreased with all other variables held constant. All financial instruments with fixed interest rates that are carried at amortised cost are not subject to the interest rate sensitivity analysis.
Interest rate sensitivity analysis
| | | | | | | |
| | Change in interest expense for a change in interest rate |
Figures in million - SA rand | | -1.5% | -1.0% | -0.5% | 0.5% | 1.0% | 1.5% |
Sensitivity to interest rates: | | | | | | | |
31 December 2015 | | | | | | | |
- JIBAR | | 35.4 | 23.6 | 11.8 | (11.8) | (23.6) | (35.4) |
- LIBOR1 | | - | - | - | (4.6) | (9.2) | (13.8) |
Change in finance expense | | 35.4 | 23.6 | 11.8 | (16.4) | (32.8) | (49.2) |
31 December 2014 | | | | | | | |
- JIBAR | | 31.5 | 21.0 | 10.5 | (10.5) | (21.0) | (31.5) |
- LIBOR1 | | - | - | - | (2.4) | (4.8) | (7.2) |
Change in finance expense | | 31.5 | 21.0 | 10.5 | (12.9) | (25.8) | (38.7) |
31 December 2013 | | | | | | | |
- JIBAR | | 54.6 | 36.4 | 18.2 | (18.2) | (36.4) | (54.6) |
Change in finance expense | | 54.6 | 36.4 | 18.2 | (18.2) | (36.4) | (54.6) |
1 No interest rate sensitivity analysis has been performed for a reduction in LIBOR due to LIBOR being less than 0.5%, as decrease in LIBOR would have no impact on the Group’s profit or loss.
34. RELATED-PARTY TRANSACTIONS
Sibanye entered into related-party transactions with Rand Refinery during the year as detailed below. The transactions with these related parties are generally conducted with terms comparable to transactions with third parties, however in certain circumstances such as related-party loans, the transactions were not at arm’s length.
For key management remuneration, see Annual Financial Report–Accountability–Remuneration report.
| |
Sibanye Gold Annual Financial Report 2015 | 177 |
NOTES TO THE CONSOLIDATED FINANCIAL STATEMENTS continued
FOR THE YEAR ENDED 31 DECEMBER 2015
RAND REFINERY
Rand Refinery, in which Sibanye holds a 33.1% interest, has an agreement with the Group whereby it refines all the Group’s gold production. No dividends were received during the years ended 31 December 2015, 2014 and 2013. For the year ending 31 December 2015, the group paid refining fees to Rand Refinery and received interest, refer to note 14 for the loan to Rand Refinery.
The table below details the transactions and balances between the Group and its related-parties:
| | | | | | | |
Figures in million - SA rand | | | | Notes | 2015 | 2014 | 2013 |
Interest received from Rand Refinery | | | | 14 | 37.3 | 1.2 | - |
Income from services rendered to Gold Fields group companies | | | | | | | |
Administration services | | | | | - | - | 33.2 |
Security services | | | | | - | - | 34.2 |
Training services | | | | | - | - | 16.0 |
Medical services | | | | | - | - | 19.0 |
Expenditure | | | | | | | |
Management fees paid to Gold Fields Group Services | | | | | - | - | (12.5) |
Refining fees paid to Rand Refinery | | | | | (30.8) | (30.6) | (12.1) |
Loan receivable from other related-parties | | | | | | | |
Rand Refinery | | | | 14 | 363.7 | 384.6 | - |
35. CAPITAL MANAGEMENT
The Group’s primary objective with regards to managing its capital is to ensure that there is sufficient capital available to support the funding requirements of the Group, including capital expenditure, in a way that: optimises the cost of capital; maximises shareholders’ returns; and ensures that the Group remains in a sound financial position.
There were no changes to the Group’s overall capital management approach during the current year.
The Group manages and makes adjustments to the capital structure as and when borrowings mature or as and when funding is required. This may take the form of raising equity, market or bank debt or hybrids thereof. Opportunities in the market are also monitored closely to ensure that the most efficient funding solutions are implemented.
The Group monitors capital using the ratio of net external debt to earnings (operating profit) before interest, taxes, depreciation and amortisation (EBITDA), but does not set absolute limits for this ratio. The Group is comfortable with a ratio of net debt to EBITDA of one times or lower.
| | | | | | | |
Figures in million - SA rand | | | | Notes | 2015 | 2014 | 2013 |
Borrowings1 | | | | 23 | 1 995.3 | 2 035.6 | 1 990.9 |
Cash and cash equivalents2 | | | | 19 | 633.4 | 529.6 | 1 492.4 |
Net debt3 | | | | | 1 361.9 | 1 506.0 | 498.5 |
EBITDA4 | | | | | 6 337.0 | 7 469.1 | 7 357.9 |
Net debt to EBITDA (ratio) | | | | | 0.21 | 0.20 | 0.07 |
1 Borrowings are only those borrowings that have recourse to Sibanye. Borrowings thus exclude the Burnstone Debt (refer to note 23).
2 Cash and cash equivalents exclude cash of Burnstone.
3 Net debt excludes Burnstone Debt and Burnstone cash.
4 EBITDA is net operating profit before amortisation and depreciation.
36. LIQUIDITY
The Group’s current liabilities exceeded its current assets by R2,596.6 million as at 31 December 2015 (2014: R1,630.1 million). Current liabilities at 31 December 2015 includes the current portion of borrowings of R1,995.3 million which is the bi-annual repayment due and payable in June 2016 and the final settlement due and payable in December 2016.
Sibanye generated cash from operating activities of R3,515.3 million for the year ended 31 December 2015. The Group has committed unutilised debt facilities of R6.2 billion at 31 December 2015.
The directors believe that the cash generated by its operations and the remaining balance of the Group’s revolving credit facility will enable the Group to continue to meet its obligations as they fall due.
| |
Sibanye Gold Annual Financial Report 2015 | 178 |
| |
Sibanye Gold Annual Financial Report 2015 | 179 |
| | | | |
REGISTERED SHAREHOLDER SPREAD |
Shareholder spread 31 December 2015 | Number of holders | % of total shareholders | Number of shares1 | % of issued capital2 |
1—1,000 shares | 12,277 | 83.01 | 1,908,948 | 0.21 |
1,001—10,000 shares | 1,718 | 11.61 | 5,634,570 | 0.61 |
10,001 – 100,000 shares | 486 | 3.29 | 17,112,016 | 1.87 |
100,001—1,000,000 shares | 234 | 1.58 | 80,646,630 | 8.80 |
1,000,001 shares and above | 75 | 0.51 | 810,838,388 | 88.51 |
Total | 14,790 | 100.00 | 916,140,552 | 100.00 |
1 As of 14 March 2016, the issued share capital of Sibanye consisted of 916,645,291 ordinary shares.
2 To our knowledge: (1) Sibanye is not directly or indirectly owned or controlled (a) by another entity or (b) by any foreign government; and (2) there are no arrangements the operation of which may at a subsequent date result in a change in control of Sibanye. To the knowledge of Sibanye’s management, there is no controlling shareholder of Sibanye.
| | | | |
PUBLIC AND NON-PUBLIC SHAREHOLDINGS |
Shareholder type 31 December 2015 | Number of holders | % of total shareholders | Number of shares | % of issued capital |
Non-public shareholders | 10 | 0.07 | 16,595,011 | 1.81 |
●Directors | 7 | 0.05 | 997,718 | 0.11 |
●Share trust | 1 | 0.01 | 13,525,394 | 1.48 |
●Own holding | 2 | 0.01 | 2,071,899 | 0.22 |
Public shareholders | 14,780 | 99.93 | 899,545,541 | 98.19 |
Total | 14,790 | 100.00 | 916,140,552 | 100.00 |
| | | | |
BENEFICIAL SHAREHOLDER CATEGORIES |
Category 31 DECEMBER 2015 | Number of holders | % of total shareholders | Number of shares | % of issued capital |
American Depository Receipts | 66 | 0.45 | 259,139,730 | 28.29 |
Other Managed Funds | 94 | 0.64 | 217,430,853 | 23.73 |
Unit Trusts/Mutual Funds | 213 | 1.44 | 167,113,943 | 18.24 |
Pension Funds | 193 | 1.30 | 153,511,160 | 16.76 |
Custodians | 57 | 0.39 | 33,125,212 | 3.62 |
Private Investor | 106 | 0.72 | 27,000,178 | 2.95 |
Sovereign Wealth | 8 | 0.05 | 17,015,745 | 1.86 |
Trading Position | 23 | 0.16 | 15,149,812 | 1.65 |
Insurance Companies | 17 | 0.11 | 11,671,107 | 1.27 |
Exchange Traded Fund | 13 | 0.09 | 5,595,028 | 0.61 |
Corporate Holding | 3 | 0.02 | 3,174,200 | 0.35 |
Hedge Fund | 3 | 0.02 | 2,195,759 | 0.24 |
University | 6 | 0.04 | 1,970,722 | 0.22 |
Charity | 8 | 0.05 | 1,310,674 | 0.14 |
Investment Trust | 2 | 0.01 | 278,808 | 0.03 |
Foreign Government | 2 | 0.01 | 122,871 | 0.01 |
Local Authority | 1 | 0.01 | 95,352 | 0.01 |
Stock Brokers | 1 | 0.01 | 39,466 | 0.00 |
Remainder | 13,974 | 94.48 | 199,932 | 0.02 |
Total | 14,790 | 100.00 | 916,140,552 | 100.00 |
| | |
FOREIGN CUSTODIANS ABOVE 3% | | |
CUSTODIAN 31 DECMEBER 2015 | Number of shares | % |
Bank of New York Depositary Receipts | 259,139,730 | 28.29 |
State Street Bank and Trust Company | 41,541,553 | 4.53 |
| |
Sibanye Gold Annual Financial Report 2015 | 180 |
The tables below show the change in the percentage ownership of Sibanye’s major shareholders, to the knowledge of Sibanye’s management, between 31 December 2013 and 31 December 2015.
| | | | | | |
BENEFICIAL SHAREHOLDINGS ABOVE 3% |
Beneficial shareholdings1 | 2015 | 2014 | 2013 |
Number of shares | % | Number of shares | % | Number of shares | % |
Gold One | 185,386,079 | 20.24 | 178,004,754 | 19.80 | - | - |
Government Employees Pension Fund (PIC) | 77,297,776 | 8.44 | 74,234,416 | 8.26 | 40,429,347 | 5.50 |
1 A list of the individuals and organisations holding, to the knowledge of Sibanye’s management, directly or indirectly, 3% or more of the issued share capital of Sibanye as of 14 March 2016 is set forth below:
| | |
| Number of shares | % |
Gold One | 185,386,079 | 20.22 |
Government Employees Pension Fund (PIC) | 87,775,951 | 9.58 |
| | | | | | |
INVESTMENT MANAGMENT SHAREHOLDINGS ABOVE 3% |
Beneficial shareholdings1 | 2015 | 2014 | 2013 |
Number of shares | % | Number of shares | % | Number of shares | % |
Public Investment Corporation (SOC) Limited | 76,599,424 | 8.36 | 71,372,617 | 7.94 | 34,470,776 | 4.69 |
Allan Gray Proprietary Limited | 75,903,026 | 8.29 | 89,681,047 | 9.98 | 108,218,598 | 14.72 |
Van Eck Associates Corporation | 65,030,159 | 7.10 | 45,569,180 | 5.07 | 43,326,036 | 5.89 |
Dimensional Fund Advisors | 43,107,899 | 4.71 | 37,800,158 | 4.21 | 35,337,505 | 4.81 |
Old Mutual Plc | 34,870,880 | 3.81 | 47,870,156 | 5.33 | 4,369,228 | 0.59 |
Investec | 29,818,210 | 3.25 | 29,171,028 | 3.25 | 103,985,030 | 14.15 |
First Eagle Investment Management | - | - | - | - | 26,043,384 | 3.54 |
Blackrock Inc | 59,100 | 0.01 | 9,966,258 | 1.11 | 24,731,965 | 3.36 |
1 A list of the investment managers holding, to the knowledge of Sibanye’s management, directly or indirectly, 3% or more of the issued share capital of Sibanye as of 14 March 2016 is set forth below:
| | |
| Number of shares | % |
Public Investment Corporation (SOC) Limited | 81,299,424 | 8,86 |
Allan Gray Proprietary Limited | 54,237,732 | 5.92 |
Van Eck Associates Corporation | 60,653,234 | 6.62 |
Dimensional Fund Advisors | 44,809,072 | 4.89 |
Old Mutual Plc | 35,378,444 | 3.86 |
Investec | 36,451,281 | 3.98 |
Sibanye’s ordinary shares are subject to dilution as a result of any non-pre-emptive share issuance, including upon the exercise of Sibanye’s outstanding share options, issues of shares by the Board in compliance with BEE legislation or in connection with acquisitions.
The principal non-United States trading market for the ordinary shares of Sibanye is the JSE Limited, on which they trade under the symbol “SGL”. Sibanye’s American depositary shares (ADSs) trade in the United States on the NYSE under the symbol “SBGL”. The ADRs representing the ADSs were issued by the Bank of New York Mellon (BNYM) as Depositary. Each ADS represents four ordinary shares.
No public takeover offers by third parties have been made in respect of Sibanye’s shares or by Sibanye in respect of other companies’ shares during the last and current fiscal year.
| |
Sibanye Gold Annual Financial Report 2015 | 181 |
ADMINISTRATIVE AND CORPORATE INFORMATION
| |
INVESTOR ENQUIRIES James Wellsted Senior Vice President: Investor Relations Sibanye Gold Limited Tel: +27 83 453 4014 +27 11 278 9656 E-mail: james.wellsted@sibanyegold.co.za COMPANY SECRETARY Cain Farrel Tel: +27 10 001 1122 Fax: +27 11 278 9863 E-mail: cain.farrel@sibanyegold.co.za REGISTERED OFFICE Libanon Business Park 1 Hospital Street (off Cedar Avenue) Libanon Westonaria 1780 South Africa Private Bag X5 Westonaria 1780 South Africa Tel: +27 11 278 9600 Fax: +27 11 278 9863 SIBANYE GOLD LIMITED Incorporated in the Republic of South Africa Registration number 2002/031431/06 Share code: SGL Issuer code: SGL ISIN – ZAE E000173951 LISTINGS JSE: SGL NYSE: SBGL WEBSITE www.sibanyegold.co.za | DIRECTORS Sello Moloko* (Chairman) Neal Froneman (CEO) Charl Keyter (CFO) Chris Chadwick# Robert Chan# Timothy Cumming* Barry Davison* Rick Menell* Nkosemntu Nika* Keith Rayner* Susan van der Merwe* Jerry Vilakazi Jiyu Yuan# * Independent non-executive # Non-executive JSE SPONSOR JP Morgan Equities South Africa (Proprietary) Limited (Registration number: 1995/011815/07) 1 Fricker Road, Illovo, Johannesburg, 2196 Private Bag X9936, Sandton, 2196, South Africa OFFICE OF THE UNITED KINGDOM SECRETARIES St James’s Corporate Services Limited Suite 31, Second Floor 107 Cheapside London EC2V 6DN United Kingdom Tel: +44 20 7796 8644 Fax: +44 20 7796 8645 AMERICAN DEPOSITARY RECEIPT TRANSFER AGENT BNY Mellon Shareowner Services PO Box 358516 Pittsburgh, PA 15252-8516 US Toll Free: +1 888 269 2377 Tel: +1 201 680 6825 Email: shrrelations@bnymellon.com Kim Schwarz Vice President, Relationship Manager BNY Mellon Depositary Receipts Direct Line: +1 212 815 2852 Mobile: +1 347 515 0068 Fax: +1 212 571 3050 Email: kimberly.schwarz@bnymellon.com | TRANSFER SECRETARIES SOUTH AFRICA Computershare Investor Services (Proprietary) Limited Ground Floor 70 Marshall Street Johannesburg 2001 PO Box 61051 Marshalltown 2107 Tel: +27 11 370 5000 Fax: +27 11 688 5248 TRANSFER SECRETARIES UNITED KINGDOM Capita Asset Services The Registry 34 Beckenham Road Beckenham Kent BR3 4TU England Tel: 0871 664 0300 (calls cost 10p a minute plus network extras, lines are open 8:30 to 17:00, Monday to Friday) or +44 20 8639 3399 (overseas) Fax: +44 20 8658 3430 E-mail: ssd@capitaregistrars.com AUDITORS KPMG Inc. KPMG Crescent 85 Empire Road Parktown 2193 Johannesburg South Africa Tel: +27 11 647 7111 |
| |
Sibanye Gold Annual Financial Report 2015 | 182 |
FURTHER INFORMATION
RISK FACTORS
In addition to the other information included in this annual report, the considerations listed below could have a material adverse effect on our business, financial condition or results of operations, resulting in a decline in the trading price of Sibanye’s ordinary shares or ADRs. The risks set forth below comprise all material risks currently known to us. These factors should be considered carefully, together with the information and financial data set forth in this document.
Risks related to Sibanye’s business
SIBANYE’S OPERATIONS AND PROFITS HAVE BEEN AND MAY BE ADVERSELY AFFECTED BY STRIKES AND UNION ACTIVITY.
Organised labour dynamics in the mining sector, particularly in South Africa, are volatile and uncertain and as such, they have had, and may in the future have, a material adverse impact on our operations, production and financial performance. A recent increase in union activity and labour unrest in South Africa has resulted in more frequent industrial disputes and extended negotiations that have negatively affected South Africa’s sovereign debt rating and subsequently the credit ratings of the country’s leading mining companies. While widespread strikes in the gold mining industry have not occurred since 2012, the South African platinum industry was subject to a five month strike in 2014. In October 2015, Sibanye concluded a three year labour agreement with NUM, UASA and Solidarity but AMCU, which currently has minority recognition status at Beatrix and Kloof and majority status at Driefontein, rejected, and continued to reject, further alternative offers made by Sibanye. Despite the acceptance of the labour agreement by NUM, UASA and Solidarity, there can be no guarantee that future negotiations will not be accompanied by further strikes, work stoppages or other disruptions. It also cannot be guaranteed that AMCU or another of the labour unions will not participate in work stoppages or other disruptions despite the agreement reached in fiscal 2015. Furthermore, rivalry between unions, such as the AMCU and the NUM, may destabilise labour relations in the mining sector. For example, on 5 February 2015, a conflict occurred between AMCU and NUM members at Beatrix, resulting in injuries to nine Sibanye employees. Operations at Beatrix were temporarily suspended as a result of the incident, and only resumed on 9 February 2015 after Sibanye and the rival unions agreed to commit to maintaining peaceful co-existence and a safe working environment for employees.
In the event that Sibanye experiences further industrial relations-related interruptions at any of its operations, other mines’ operations or in other industries that impact its operations, or increased employment-related costs due to union or employee activity, these may have a material adverse effect on its business, production levels, production targets, results of operations, financial condition, reputation and future prospects. In addition, lower levels of mining activity can have a longer-term impact on production levels and operating costs, which may affect operating life. Mining conditions can deteriorate during extended periods without production and Sibanye will not re-commence mining until health and safety conditions are considered appropriate to do so.
SIBANYE’S MINERAL RIGHTS ARE SUBJECT TO LEGISLATION, WHICH COULD IMPOSE SIGNIFICANT COSTS AND BURDENS AND WHICH IMPOSE CERTAIN OWNERSHIP REQUIREMENTS, THE INTERPRETATION OF WHICH ARE THE SUBJECT OF DISPUTE.
Our operations in South Africa are subject to legislation regulating mineral rights. This includes broad-based black economic empowerment (BEE) legislation designed to effect the entry and participation of historically disadvantaged South Africans (HDSAs), into the mining industry and increase their participation in the South African economy.
The Mineral and Petroleum Resources and Development Act (the MPRDA) came into effect on 1 May 2004. The MPRDA transferred ownership of mineral resources to the South African people with the South African government acting as custodian in order to, among other things, promote equitable access to the nation’s mineral resources by South Africans, expand opportunities for historically disadvantaged persons who wish to participate in the South African mining industry and advance social and economic development. As custodian, the South African government exercises regulatory control over the exploitation of mineral resources and does so by exercising the power to grant the rights required to prospect and mine for minerals. Mining companies were required to apply for the right to mine and/or prospect and to convert existing mining rights to “new order” mining rights. In order to qualify for these rights, applicants need to satisfy the South African government that the grant of such a right will advance the open-ended broad-based socio-economic empowerment requirements of the MPRDA. The MPRDA also required that mining companies submit social and labour plans (SLPs) to the DMR, which set out their commitments relating to, among other things, human resource development, labour planning and economic development planning. In order to provide guidance on the fulfilment of these broad-based socio-economic empowerment requirements to the mining industry, the DMR published a broad-based socio-economic empowerment charter for the South African mining and minerals industry known as the Mining Charter, which also became effective on 1 May 2004. The Mining Charter includes guidelines envisaging that each mining company should achieve a 15% ownership of mining assets by HDSAs within five years and a 26% HDSA ownership of mining assets within 10 years. See “—Environmental and Regulatory Matters—Mineral Rights—The MPRDA”. In 2010, the DMR introduced the Amended Mining Charter containing guidelines envisaging, among other things, that mining companies should achieve a minimum of 40% of HDSA demographic representation by 2014 at executive management (board) level, senior management (executive committee) level, core and critical skills, middle management level and junior management level. See “Environmental and Regulatory Matters—Mineral Rights.”
In 2014, the DMR launched audits of mining companies which were conducted by a third party appointed by the DMR to assess such companies’ compliance with the BEE guidelines of the Mining Charter and Amended Mining Charter. However, the DMR subsequently abandoned the externally conducted audit process. It is therefore unclear what the status of the process is and what the outcomes were. It is also unclear whether or not the information provided during this audit process will be considered or used by the DMR for any purpose in the future. In fiscal 2015, the DMR directed mining companies to provide information related to compliance with the Amended Mining Charter via an electronic reporting template. This template raised a number of concerns among mining companies due to its inflexible approach towards the assessment of compliance with the Amended Mining Charter. On 15 March 2016, the DMR directed mining companies to complete this template by 30 April 2016.
On 31 March 2015, the DMR made an interim report of consolidated results of the self-assessment by reporting companies of compliance with the Mining Charter, reporting relatively broad compliance with the non-ownership requirements of the Amended Mining Charter. However, the DMR did not report the results of compliance with the HDSA ownership guidelines of the Mining Charter and noted that there is no consensus on certain applicable principles.
On the same date, the Chamber of Mines reported that the DMR believes that empowerment transactions by mining companies concluded after 2004 where the HDSA ownership level has fallen due to HDSA disposal of assets or for other reasons, should not be included in the calculation of HDSA ownership for the purposes of, among other things, the 26% HDSA ownership guidelines under the Mining Charter. The position of Sibanye, is consistent with that of the Chamber of Mines, and is that such historical empowerment transactions should be included in the calculation of HDSA ownership. The DMR and the Chamber of Mines have jointly agreed to approach the South African courts to seek a declaratory order which will provide a ruling on the interpretation of relevant legislation and the status of the Mining Charter. In February 2016, an application was filed by a third party to consolidate the application by the Chamber of Mines and the DMR with its own application for a declaratory order on the empowerment aspects of the Mining Charter. The Chamber of Mines indicated that it would oppose the consolidation of these applications on the basis that the right to relief in the respective applications does not depend substantially on the same questions of law or fact. The application to consolidate the two actions has delayed the hearing of the application of the Chamber of Mines, extending the period of uncertainty regarding the interpretation of the Mining Charter.
If the DMR were to prevail in court, mining companies, including Sibanye, may be required to undertake further transactions in order to increase their HDSA ownership which would result in the dilution of ownership levels of the existing shareholders. In such event, mining companies may be required to maintain a minimum HDSA ownership level indefinitely. It is also possible, should the Chamber of Mines prevail in court, that the DMR may enact new regulations to, among other things, increase and maintain at a certain level, HDSA ownership guidelines for mining companies which would result in the dilution of existing shareholders.
Any adjustment to the ownership structure of Sibanye’s mining assets in order to meet BEE requirements could have a material adverse effect on the value of Sibanye’s securities. Further, Sibanye may in the future incur significant costs or have to issue additional ordinary shares as a result of changes in the interpretation of existing laws and guidelines or the imposition of new laws, which may have a material adverse effect on Sibanye’s business, operating results and financial condition.
The DMR may also suspend or cancel existing mining rights of, or prevent the obtaining of new mining rights by, mining companies, including Sibanye, deemed not to be in compliance with the other requirements of the MPRDA and those of South Africa’s empowerments requirements. If the DMR were to determine that Sibanye is not in compliance with the other requirements of the MPRDA, Sibanye may be required to engage in remedial steps, including changes to management and actions that require shareholder approval.
There is no guarantee that any steps that have already been taken, or that Sibanye might take in the future, will ensure the successful renewal of Sibanye’s existing mining rights, the retention of new mining rights, the granting of further new mining rights or that the terms of renewals of its rights would not be significantly less favourable to Sibanye than the terms of its current rights.
An Amendment Bill to the MPRDA (the MPRDB) was passed by both the National Assembly and the National Council of Provinces, or NCOP, on 27 March 2014. In January 2015, the President referred the MPRDB back to Parliament for reconsideration and Parliament has yet to produce a new draft of the MPRDB. There is a large degree of uncertainty regarding the changes that will be brought about should the MPRDB be made law. Among other things, the MPRDB sought to require the consent of the Minister of Mineral Resources for the transfer of any interest in an unlisted company or any controlling interest in a listed company where such companies hold a prospecting right or mining right and to give the Minister of Mineral Resources broad discretionary powers to prescribe the levels required for beneficiation in promoting the beneficiation of minerals. For further information, see “Integrated Annual Report—Material issues”. At the Investing in Africa Mining Indaba conference held in February 2016, the Minister of Mineral Resources indicated that the MPRDB would be finalised in the first half of 2016.
POWER STOPPAGES, FLUCTUATIONS AND USAGE CONSTRAINTS IN SOUTH AFRICA MAY FORCE SIBANYE TO HALT OR CURTAIL OPERATIONS.
Electricity supply in South Africa remains constrained and future power disruptions are possible. In addition to supply constraints, labour unrest in South Africa has before, and may in future, disrupt the supply of coal to power stations operated by the South African state utility Eskom Holdings SOC Limited (Eskom) and result in curtailed supply. In the first quarter of fiscal 2014, rain impacted coal supply and placed serious strain on Eskom’s ability to provide power. In November 2014, Eskom declared a power emergency and required large industrial users, including Sibanye, to reduce their electricity usage by 10% for five hours as part of a broader electricity usage reduction programme. Eskom has warned that, while it has adopted a policy of asking households to reduce usage before asking industrial users to do so in order to reduce the economic impact of such disruptions, power constraints will continue. Eskom has also warned that power constraints will continue.
The Department of Energy is developing a power conservation programme in an attempt to improve the power situation in South Africa. However there can be no assurance that this programme will provide sufficient supply for the needs of the country or for Sibanye to run its operations at full capacity or at all. While Sibanye has backup generating capacity, this is insufficient for all operations during emergencies at all its mines and comes at a significantly higher cost than electricity supplied by Eskom.
Any further disruption or decrease in the electrical power supply available to Sibanye’s operations could have a material adverse effect on its business, operating results and financial condition.
POWER COST INCREASES IN SOUTH AFRICA MAY ADVERSELY AFFECT SIBANYE’S RESULTS OF OPERATIONS.
Sibanye’s mining operations in South Africa depend upon electrical power generated by the state utility provider, Eskom. See “—Power stoppages, fluctuations and usage constraints in South Africa may force Sibanye to halt or curtail operations.” Eskom holds a monopoly on power supply in the South African market. In fiscal 2014, Eskom applied to the National Energy Regulator of South Africa, or NERSA, for tariff increases and for 2015 NERSA granted Eskom an average tariff increase of 12.69% effective 1 April 2015, being 8% plus 4.69% due to the clawing back by Eskom of prudent costs from the “Regulatory Clearing Account” for the three year period from April 2010 to March 2013. On 1 March 2016, NERSA gave permission for Eskom to raise rates by an additional 9.4% in order to make up a cash flow shortfall. Should Sibanye experience further power tariff increases, its business operating results and financial condition may be adversely impacted.
DUE TO THE NATURE OF DEEP LEVEL MINING AND THE EXTENSIVE ENVIRONMENTAL FOOTPRINT OF SIBANYE’S OPERATIONS, ENVIRONMENTAL HAZARDS, INDUSTRIAL ACCIDENTS, MINING ACCIDENTS AND POLLUTION MAY RESULT IN OPERATIONAL DISRUPTIONS SUCH AS STOPPAGES WHICH COULD RESULT IN INCREASED PRODUCTION COSTS AS WELL AS FINANCIAL AND REGULATORY LIABILITIES.
Mining by its nature involves significant risks and hazards, including environmental hazards, as well as industrial and mining accidents. These include, for example, seismic events, fires, cave-ins and blockages, flooding, discharges of gases and toxic substances, contamination of water, air or soil resources, radioactivity and other accidents or conditions resulting from mining activities including, among other things, blasting and the transport, storage and handling of hazardous materials.
We have experienced and continue to remain at risk of experiencing environmental and other industrial hazards, as well as industrial and mining accidents, and we are more susceptible than other mining operations to certain of these risks due to mining at deep levels. Furthermore, there are risks that relevant regulators, such as the DMR, may impose fines and stop orders (such as Section 54 stoppages), which will reduce or halt production until lifted. The occurrence of any of these events could delay or halt production, increase production costs and result in financial and regulatory liability for Sibanye, which could have a material adverse effect on its business, operating results and financial condition.
TO THE EXTENT THAT SIBANYE SEEKS TO EXPAND FURTHER THROUGH ACQUISITIONS, IT MAY EXPERIENCE DELAYS OR OTHER ISSUES IN EXECUTING ACQUISITIONS OR MANAGING AND INTEGRATING THE ACQUISITIONS WITH ITS EXISTING OPERATIONS.
Sibanye has pursued and may continue to pursue growth opportunities through acquisitions. Sibanye has pursued and may continue to pursue acquisitions in the gold and uranium mining industry that allow it to leverage its existing processing capacity and infrastructure and extend its operating life. For example, in fiscal 2014, Sibanye completed the acquisitions of Wits Gold, Cooke and Burnstone. Further growth may occur through the acquisition of other companies and assets, development projects, or by entering into joint ventures.
Sibanye has also sought and may continue to seek to enter mining sectors related to its existing operations through acquisitions or other business combination transactions. For example, in fiscal 2015, Sibanye entered into two agreements to acquire platinum mining operations. On 9 September 2015, Sibanye announced that it had entered into an agreement with RPM, a wholly owned subsidiary of Anglo American Platinum to acquire the Rustenburg Operations. On 6 October 2015, Sibanye announced a cash offer of US$0.195 per share for the entire issued share capital of Aquarius. Aquarius owns stakes in the Kroondal mine and Platinum Mile retreatment facilities near Rustenburg in South Africa and the Mimosa joint venture with Impala Platinum in Zimbabwe. Both Acquisitions remain subject to the fulfilment of conditions precedent. See “—Risks related to the Acquisitions”.
Any such acquisition or joint venture may change the scale of Sibanye’s business and operations and may expose it to new geographic, geological, commodity, political, social, labour, operating, financial, legal, regulatory and contractual risks. Further, the acquisition of any assets that produce commodities other than gold, such as the Rustenburg Operations and the Aquarius operations, will expose Sibanye to the risk of operating in an environment and market with which its management has less experience. In addition, to the extent Sibanye participates in the development of a project through a joint venture or any other multi-party commercial structure, there could be disagreements, legal or otherwise, or divergent interests or goals amongst the parties, which could jeopardise the success of the project. There can be no assurance that any acquisition or joint venture, including the acquisition of the Rustenburg Operations, Aquarius, Cooke, Wits Gold and SGEO, or the acquisition of any new mining assets or operations, will achieve the results intended, and, as such, could have a material adverse effect on Sibanye’s business, operating results and financial condition.
Sibanye faces intense competition for the acquisition of attractive mining properties. From time to time, Sibanye evaluates the acquisition of an ore reserve, development properties or operating mines, either as stand-alone assets or as part of existing companies. The decision to acquire these properties may be based on a variety of factors, including historical operating results, estimates and assumptions regarding the extent of the ore reserve, cash and other operating costs, gold and other mineral prices, projected economic returns and evaluations of existing or potential liabilities associated with the relevant property and its operations and how these factors may change in future. Other than historical operating results, these factors are uncertain and could have an impact on revenue, cash and other operating costs, as well as the process used to estimate the ore reserve.
The integration of any acquired assets requires management capacity. There can be no assurance that Sibanye’s current management team has sufficient capacity, nor that it can acquire additional skills to supplement that capacity, to integrate any acquired or new assets and operations into the Group and to realise cost and operational efficiencies at the acquired assets or maintain those at the existing operations.
TO THE EXTENT THAT SIBANYE SEEKS TO FURTHER EXPAND ITS CURRENT MINING OPERATIONS, IT MAY EXPERIENCE PROBLEMS ASSOCIATED WITH MINERAL EXPLORATION OR DEVELOPING MINING PROJECTS.
In order to expand its operations and reserve base organically, Sibanye investigates and may continue to investigate the exploitation of mineralisation below the current mining levels and infrastructure limits at its operations. Projects of this nature are generally capital intensive, have long lead time and are subject to risks relating to the location of economic ore bodies, the development of appropriate extractive processes, the receipt of necessary governmental permits and regulatory approvals and the extension of mining and processing facilities at the mining site. Further, in cases where Sibanye explores the production of commodities other than gold, Sibanye has been and may be exposed to further risk of operating in an environment and market with which its management has less experience. For example, Sibanye started producing uranium at Cooke during fiscal 2014.
There can be no assurance that any exploration or expansion projects will be successful, partially or at all, and the failure of Sibanye to expand its reserves through such projects could have a material adverse effect on its business, operating results and financial condition.
SIBANYE’S MINERAL RESERVES ARE ESTIMATES BASED ON A NUMBER OF ASSUMPTIONS, WHICH, IF CHANGED, MAY REQUIRE SIBANYE TO LOWER ITS ESTIMATED MINERAL RESERVES, AND THE RESERVES OF THE RUSTENBURG OPERATIONS AND AQUARIUS, THE ACQUISITION OF WHICH ENTITIES REMAIN SUBJECT TO CONDITIONS PRECEDENT, HAVE NOT BEEN PREPARED IN A MANNER CONSISTENT WITH INDUSTRY GUIDE 7.
The mineral reserves of Sibanye stated in this annual report are estimates based on assumptions regarding, among other things, Sibanye’s costs, expenditures, commodity prices, exchange rates, metallurgical and mining recovery assumptions, which may prove inaccurate due to a number of factors, many of which are beyond our control. In the event that we adversely revise any of the assumptions that underlie our mineral reserves, Sibanye may need to revise its mineral reserves downwards. Any downward revision in Sibanye’s mineral reserves and, over the longer term, any failure to replace reserve ounces as they are mined may have a material adverse effect on its business, operating results and financial condition. See “—Reserves of Sibanye as of 31 December 2015.”
Sibanye has entered into agreements to acquire the Rustenburg Operations and Aquarius. The ore reserve statements of the Rustenburg Operations and Aquarius have not been included in this annual report because they have not been prepared in accordance with Industry Guide 7. See “Presentation of Financial and Other Information — The Acquisitions of the Rustenburg Operations and Aquarius — Explanatory Note regarding Ore Reserves of the Rustenburg Operations and Aquarius” and “Reserves of Sibanye as of 31 December 2015 — Ore Reserves of the Rustenburg Operations and Aquarius — Explanatory Note”.
CHANGES IN THE MARKET PRICE FOR GOLD, WHICH IN THE PAST HAVE FLUCTUATED WIDELY, AFFECT THE PROFITABILITY OF SIBANYE’S GOLD MINING OPERATIONS AND THE CASH FLOWS GENERATED BY THOSE OPERATIONS.
Sibanye’s revenues from its gold mining operations are primarily derived from the sale of gold that they produce. Sibanye does not generally enter into forward sales, commodity derivatives or other hedging arrangements in order to establish a price in advance of the sale of its gold production. As a result, it is fully exposed to changes in the gold price, which could lead to reduced revenue should the gold price decline. For example, during fiscal 2015, the gold price fluctuated between $1,296 and $1,049 per ounce.
The market price for gold has historically been volatile and is affected by numerous factors over which Sibanye has no control, such as general supply and demand, speculative trading activity and global economic drivers. Over the period from 2013 to 2015, the gold price has declined from an average price of $1,409/oz to $1,159/oz. Should the gold price decline below Sibanye’s production costs, it may experience losses and, should this situation remain for an extended period, Sibanye may be forced to curtail or suspend some or all of its projects, operations and/or reduce operational capital expenditures. Sibanye might not be able to recover any losses incurred during, or after, such events. A sustained period of significant gold price volatility may also adversely affect Sibanye’s ability to undertake new capital projects or to make other long-term strategic decisions. The use of lower gold prices in reserve calculations and life of mine (LoM) plans could also result in material impairments of Sibanye’s investment in gold mining properties or a reduction in its reserve estimates and corresponding restatements of its reserves and increased amortisation, reclamation and closure charges.
Any of the above could have a material adverse effect on Sibanye’s business, operating results and financial condition.
BECAUSE GOLD IS GENERALLY SOLD IN US DOLLARS, WHILE SIBANYE’S GOLD PRODUCTION COSTS ARE PRIMARILY IN RAND, SIBANYE’S OPERATING RESULTS AND FINANCIAL
CONDITION WILL BE MATERIALLY HARMED IF THERE IS A MATERIAL CHANGE IN THE VALUE OF THE RAND.
Gold and other minerals are principally sold throughout the world in US dollars, but Sibanye’s costs of production at its operations in South Africa are primarily incurred in Rand. Recent volatility in the Rand, including, principally, depreciation of the Rand against the US dollar in recent years, has made our costs and results of operations less predictable than when exchange rates are more stable. As a result, any significant and sustained appreciation of the Rand against the US dollar would increase our operating costs in US dollar terms, which could materially adversely affect our operating results and financial condition. Conversely, a weaker Rand may also result in higher inflation in South Africa, which would increase the prices Sibanye pays for products and services and could have a material adverse effect on Sibanye’s business, operating results and financial condition.
DUE TO AGEING INFRASTRUCTURE AT OUR GOLD MINING OPERATIONS, UNPLANNED BREAKDOWNS AND STOPPAGES MAY RESULT IN PRODUCTION DELAYS, INCREASED COSTS AND INDUSTRIAL ACCIDENTS.
Nearly all of our operating shafts and processing plants at our gold operations are more than 30 years old. Maintaining this infrastructure requires skilled human resources, capital allocation, management and regular, planned maintenance. Once a shaft or a processing plant has reached the end of its intended lifespan, more than normal maintenance and care is required. Although we have a comprehensive maintenance strategy in place, incidents resulting in production delays, increased costs or industrial accidents may occur. There is also a risk that delays in procuring critical spares for major repairs may result in disruptions to production. Such incidents may have a material adverse effect on our business, operating results and financial condition.
ACTUAL AND POTENTIAL SUPPLY CHAIN SHORTAGES AND INCREASES IN THE PRICES OF PRODUCTION INPUTS MAY HAVE A MATERIAL ADVERSE EFFECT ON SIBANYE’S OPERATIONS AND PROFITS.
Sibanye’s results of operations may be affected by the availability and pricing of raw materials and other essential production inputs, including, for example, fuel, steel, cyanide and other reagents required at our gold mining operations. The price and quality of raw materials may be substantially affected by changes in global supply and demand, along with weather conditions, governmental controls and other factors. A sustained interruption in the supply of any of these materials would require Sibanye to find acceptable substitute suppliers and could require Sibanye to pay higher prices for such materials. The prices of certain of Sibanye’s production inputs are impacted by, among other things, the prices of oil and steel which may be volatile. Any significant increase in the prices of these materials will increase Sibanye’s operating costs and affect production considerations.
OUR BUSINESS IS SUBJECT TO HIGH FIXED COSTS WHICH MAY IMPACT ITS PROFITABILITY.
The South African mining industry, particularly the gold mining industry, is labour intensive and is characterised by high fixed costs. The majority of operating costs of each mine do not vary significantly with amount of production and, therefore, a relatively small change in productivity as a result of, for example, strikes or other work stoppages could have a disproportionate effect on operating and financial results. Costs are generally significantly more stable than revenues, the latter being driven by the gold price and exchange rates which can be volatile. Accordingly, changes in revenues due to commodity price or exchange rate movements could have a material adverse effect on Sibanye’s growth or financial performance. Above inflation increases in fixed costs such as labour or electricity costs may cause parts of Sibanye’s gold resources to become uneconomical to mine and lead to the closure of marginal shafts or other areas at its operations. This would impact on planned production levels and declared reserves and could have a material adverse effect on our business, operating results and financial condition. See “Annual Financial Report—Overview—Management’s discussion and analysis of the financial statements—Factors affecting our performance—Costs.”
THEFT OF GOLD AND PRODUCTION INPUTS, AS WELL AS ILLEGAL ARTISANAL MINING, OCCUR ON SOME OF SIBANYE’S PROPERTIES. THESE ACTIVITIES ARE DIFFICULT TO CONTROL, CAN DISRUPT SIBANYE’S BUSINESS AND CAN EXPOSE SIBANYE TO LIABILITY.
Sibanye has experienced illegal and artisanal mining activities and theft of gold bearing materials (which may be by employees or third parties) at its properties. The activities of illegal and artisanal miners could lead to reduction of mineral reserves, potentially affecting the economic viability of mining certain areas and shortening the lives of the operations as well as causing possible operational disruption, project delays, disputes with illegal miners and communities, pollution or damage to property for which Sibanye could potentially be held responsible, leading to fines or other costs. Rising gold prices may result in an increase in gold theft. The occurrence of any of these events could have a material adverse effect on Sibanye’s business, operating results and financial condition.
SOCIAL UNREST, SICKNESS OR NATURAL OR MAN-MADE DISASTER AT INFORMAL SETTLEMENTS IN THE VICINITY OF SOME OF SIBANYE’S OPERATIONS MAY DISRUPT ITS BUSINESS OR MAY LEAD TO GREATER SOCIAL OR REGULATORY IMPOSITIONS ON SIBANYE.
There are a number of informal settlements located in the vicinity of some of Sibanye’s operations. These settlements are populated by mining company employees (including Sibanye employees), the families of mining company employees and other people. As at 31 December 2015, 48% of Sibanye’s workforce opted to receive a “living out allowance” and management expects that a portion of these individuals reside in informal settlements. In recent years, the size of these settlements has grown
substantially. Poor living conditions in these settlements may lead to the spread of disease or other health hazards, which may increase absences or affect the productivity of employees. The population of such settlements or the surrounding communities may also demand jobs, social services or infrastructure from the local mining operations, including Sibanye. Any such demands or other demands from these communities may lead to increased costs or regulatory burdens on Sibanye. Such demands may also lead to protests or other actions which may hinder Sibanye’s ability to operate.
Any of the above factors could have a material adverse effect on Sibanye’s business, operating results and financial condition.
BECAUSE OUR OPERATIONS ARE REGIONALLY CONCENTRATED, DISRUPTIONS IN THESE REGIONS COULD HAVE A MATERIAL ADVERSE IMPACT ON THE OPERATIONS.
Our headquarters and our gold mining operations are located in the north western and south western margins of the Witwatersrand Basin in South Africa. As a result, any adverse economic, political or social conditions affecting this region or surrounding regions, as well as natural disasters or coordinated strikes or other work stoppages, could have a material adverse effect on Sibanye’s business, operating results and financial condition. See “—Risks related to South Africa”.
IF WE LOSE SENIOR MANAGEMENT OR ARE UNABLE TO HIRE AND RETAIN SUFFICIENT TECHNICALLY SKILLED EMPLOYEES OR SUFFICIENT HDSA REPRESENTATION IN MANAGEMENT POSITIONS IN SOUTH AFRICA, OUR BUSINESS MAY BE MATERIALLY ADVERSELY AFFECTED.
Our ability to operate or expand effectively depends largely on the experience, skills and performance of our senior management team and technically skilled employees. However, the mining industry, especially in South Africa, including Sibanye, continues to experience a shortage of qualified senior management and technically skilled employees. We may be unable to hire or retain (due to departure or unavailability) appropriate senior management, technically skilled employees or other management personnel, or we may have to pay higher levels of remuneration than we currently intend in order to do so. Additionally, as a condition of our mining rights in South Africa we must ensure sufficient HDSA participation in our management and core and critical skills, and failure to do so could result in fines or the loss or suspension of our mining rights. If we are unable to hire or retain appropriate management and technically skilled personnel or are unable to obtain sufficient HDSA representation in management positions, or if there are not sufficient succession plans in place, this could have a material adverse effect on our business, including production levels, operating results and financial position.
SIBANYE’S INSURANCE COVERAGE MAY NOT ADEQUATELY SATISFY ALL POTENTIAL CLAIMS IN THE FUTURE.
Sibanye has an insurance programme, including partial self-insurance. However, it may become subject to liability against which it has not been insured, cannot insure or is insufficiently insured, including those relating to past mining activities. Sibanye’s existing property and liability insurance contains specific exclusions and limitations on coverage. For example, should Sibanye be subject to any regulation or criminal fines or penalties, these amounts would not be covered under its insurance programme. Should Sibanye suffer a major loss, which is insufficiently covered, future earnings could be affected. In addition, certain classes of insurance may not continue to be available at economically acceptable premiums. As a result, in the future, Sibanye’s insurance coverage may not fully cover the extent of claims against it or any cross-claims made.
SIBANYE UTILISES INFORMATION TECHNOLOGY AND COMMUNICATIONS SYSTEMS, THE FAILURE OF WHICH COULD SIGNIFICANTLY IMPACT ITS OPERATIONS AND BUSINESS.
Sibanye utilises and is reliant on various information technology and communications systems, in particular SAP, payroll and time and attendance applications. Damage or interruption to Sibanye’s information technology and communications systems, whether due to accidents, human error, natural events or malicious acts, may lead to important data being irretrievably lost or damaged, thereby adversely affecting Sibanye’s business, operating results and financial condition.
AN ACTUAL OR ALLEGED BREACH OR BREACHES IN GOVERNANCE PROCESSES, OR FRAUD, BRIBERY AND CORRUPTION MAY LEAD TO PUBLIC AND PRIVATE CENSURE, REGULATORY PENALTIES, LOSS OF LICENCES OR PERMITS AND IMPACT NEGATIVELY UPON OUR EMPOWERMENT STATUS AND MAY DAMAGE SIBANYE’S REPUTATION.
The legal and regulatory framework in which Sibanye operates is complex, and its governance and compliance policies and processes may not prevent potential breaches of law or accounting or other governance practices. Sibanye’s operating and ethical codes, among other standards and guidance, may not prevent instances of fraudulent behaviour and dishonesty, nor guarantee compliance with legal and regulatory requirements.
To the extent that Sibanye suffers from any actual or alleged breach or breaches of relevant laws (including South African anti-bribery and corruption legislation or the US Foreign Corrupt Practices Act of 1977) under any circumstances, they may lead to regulatory and civil fines, litigation, public and private censure, loss of operating licences or permits and impact negatively upon Sibanye’s empowerment status and may damage its reputation. The occurrence of any of these events could have a material adverse effect on Sibanye’s business, operating results and financial condition.
RISKS RELATED TO SOUTH AFRICA
SIBANYE’S OPERATIONS ARE SUBJECT TO ENVIRONMENTAL, HEALTH AND SAFETY REGULATIONS, WHICH COULD IMPOSE ADDITIONAL COSTS AND COMPLIANCE REQUIREMENTS, AND SIBANYE HAS FACED, AND MAY FACE FURTHER, CLAIMS AND LIABILITY FOR BREACHES, OR ALLEGED BREACHES, OF SUCH REGULATIONS AND OTHER APPLICABLE LAWS.
Sibanye’s operations are subject to various environmental and health and safety laws, regulations, permitting requirements and standards. See “—Environmental and Regulatory Matters”. For example, Sibanye is required to fund environmental rehabilitation costs by making contributions into South African environmental trust funds and with insurance guarantees. Sibanye has and may in the future incur significant costs to comply with environmental and health and safety requirements imposed under existing or new legislation, regulations or permit requirements, or to comply with changes in existing laws and regulations or the manner in which they are applied. Sibanye has and may in the future also be subject to litigation and other costs as well as actions by authorities relating to environmental and health and safety matters, including mine closures, the suspension of operations and prosecution for industrial accidents as well as significant penalties and fines for non-compliance. In addition, there can be no assurance that unions will not take action in response to industrial accidents, which could lead to losses in Sibanye’s production and negatively affect Sibanye’s reputation. Any additional stoppages in production or increased costs associated with such incidents, could have a material adverse effect on Sibanye’s business, operating results and financial condition.
The principal health risks associated with Sibanye’s mining operations arise from occupational exposure and community environmental exposure to silica dust, noise and certain hazardous substances, including toxic gases and radioactive particulates. The most significant occupational diseases affecting Sibanye’s workforce include lung diseases (such as silicosis, tuberculosis, a combination of the two and chronic obstructive airways disease (COAD)) as well as noise-induced hearing loss (NIHL). Employees have sought and may continue to seek compensation for certain illnesses, such as silicosis, from their employer under workers compensation and also, at the same time, in a civil action under common law (either as individuals or as a class). Such actions may also arise in connection with the alleged incidence of such diseases in communities proximate to Sibanye’s mines.
As of 14 March 2016, two suits had been filed against several South African mining companies, including Sibanye, on behalf of current and former gold mine workers and the dependants of gold mine workers who have contracted or died from silicosis or other occupational lung diseases. A consolidated application for certification of the claimants in these suits as a class was argued at the High Court in Johannesburg in October 2015, and judgement is expected in the first half of 2016. The certification of the class, if granted, will mean that the claimants are able to sue the mining companies as a class. The class will though, still have to prove its claim as required by the law. Sibanye has also received an individual claim, not forming part of the class action, from the dependants of an alleged former employee who has allegedly died from contracting silicosis. If a significant number of such claims were suitably established against Sibanye, the payment of compensation for the claims and for any significant additional costs arising out of these issues could have a material adverse effect on our business, reputation, results of operations and financial condition. See “Annual Financial Report—Accountability—Directors’ Report—Litigation”. Further, any new regulations, potential litigation or any changes to health and safety laws which increase the burden of compliance or the penalties for non-compliance may cause Sibanye to incur further significant costs and could have a material adverse effect on Sibanye’s business, operating results and financial condition. See “Integrated Annual Report—Sustain—Health and safety focus” and “—Environmental and Regulatory Matters—Health and Safety”.
Regulators, such as the DMR, can and do issue, in the ordinary course of operations, instructions, such as Section 54 orders, following safety incidents or accidents to partially or completely halt operations at affected mines. South Africa’s deputy Mineral Resources Minister has stated that the ministry may increase sanctions, including closures, for mines in which fatalities occur because of violations of health and safety rules. In fiscal 2015, Sibanye received 109 section 54 orders (2014: 77). It is Sibanye’s policy to halt production at its operations when serious accidents occur in order to rectify dangerous situations and, if necessary, retrain workers. In addition, there can be no assurance that unions will not take industrial action in response to such accidents which could lead to losses in Sibanye’s production. Any additional stoppages in production, or increased costs associated with such incidents, could have a material adverse effect on Sibanye’s business, operating results and financial condition. Such incidents may also negatively affect Sibanye’s reputation with, among others, employees, unions and regulators.
SIBANYE IS SUBJECT TO THE IMPOSITION OF VARIOUS REGULATORY COSTS, SUCH AS MINING TAXES AND ROYALTIES, CHANGES TO WHICH MAY HAVE A MATERIAL ADVERSE EFFECT ON SIBANYE’S OPERATIONS AND PROFITS.
In recent years, governments (local and national), communities, non-governmental organisations and trade unions in several jurisdictions have sought and, in some cases, have implemented greater cost imposts on the mining industry, including through the imposition of additional taxes and royalties. Such resource nationalism, whether in the form of cost imposts, interference in project management, mandatory social investment requirements, local content requirements or creeping expropriation could impact the global mining industry and Sibanye’s business, operating results and financial condition.
In South Africa, the African National Congress (the ANC) has adopted two recommended approaches to interacting with the mining industry. While the ANC has rejected the possibility of mine nationalisation for now, the first approach contemplates, among other things, greater state intervention in the mining industry, including the revision of existing royalties, the imposition of new taxes and an increase in the South African government’s holdings in mining companies. The second approach contemplates the South African government taking a more active role in the mining sector, including through the strengthening of a state mining company to be involved in new projects either through partnerships or individually.
The adopted policies may impose additional restrictions, obligations, operational costs, taxes or royalty payments on gold mining companies, including Sibanye, any of which could have a material adverse effect on Sibanye’s business, operating results and financial condition.
ECONOMIC, POLITICAL OR SOCIAL INSTABILITY AFFECTING THE REGIONS WHERE SIBANYE OPERATES MAY HAVE A MATERIAL ADVERSE EFFECT ON SIBANYE’S OPERATIONS AND PROFITS.
Sibanye is a South African company domiciled with operations located in South Africa. Changes to or increased instability in the economic, political or social environment in South Africa or in surrounding countries could create uncertainty which discourages investment in the region and may affect an investment in Sibanye. High levels of unemployment and a shortage of critical skills in South Africa, despite increased government expenditure on education and training, remain issues and deterrents to foreign investment. The volatile and uncertain labour environment, which severely impacts on the local economy and investor confidence, has led and may lead to further downgrades in national credit ratings, making investment more expensive and difficult to secure. See “—Risks related to Sibanye’s business—Sibanye’s operations and profits have been and may be negatively affected by strikes and union activity” and “—A further downgrade of South Africa’s credit rating may have an adverse effect on Sibanye’s operations and profits.” This may restrict Sibanye’s future access to international financing and could have a material adverse effect on Sibanye’s business, operating results and financial condition.
Furthermore, any threats, or actual proceedings, to nationalise any of Sibanye’s assets, could halt or curtail operations, resulting in a material adverse effect on Sibanye’s business, operating results and financial condition and could cause the value of Sibanye’s securities to decline rapidly and dramatically, possibly causing investors to lose the entirety of their respective investments. For example, while the South African government has stated that it does not intend to nationalise mining asset or mining companies, certain new smaller political parties have stated publicly and in the media that the government should embark on a programme of nationalisation.
A FURTHER DOWNGRADE OF SOUTH AFRICA’S CREDIT RATING MAY HAVE AN ADVERSE EFFECT ON SIBANYE’S ABILITY TO SECURE FINANCING
The slowing economy, rising debt, escalating labour disputes and the structural challenges facing the mining industry and other sectors have resulted in the downgrading of South Africa’s sovereign credit rating to one level above speculative investment grade, or junk. In 2015, South Africa was downgraded to BBB- with a negative outlook by the Standard & Poor's rating agency. Moody's downgraded South Africa to "Baa2" and changed the stable perspective to negative, while Fitch Ratings downgraded South Africa to BBB- with a stable position.
Further downgrading of South Africa’s credit ratings to junk by any of these agencies may adversely effect the South African mining industry and Sibanye’s business, operating results and financial condition by making it more difficult to obtain external financing or could result in any such financing being available only at greater cost or on more restrictive terms than might otherwise be available.
SIBANYE’S FINANCIAL FLEXIBILITY COULD BE MATERIALLY CONSTRAINED BY SOUTH AFRICAN EXCHANGE CONTROL REGULATIONS.
South Africa’s exchange control regulations (the Exchange Control Regulations) restrict the export of capital from South Africa, the Republic of Namibia and the Kingdoms of Lesotho and Swaziland, known collectively as the Common Monetary Area (the CMA). Transactions between South African residents (including companies) and non-residents of the CMA are subject to exchange controls enforced by the South African Reserve Bank (SARB). As a result, Sibanye’s ability to raise and deploy capital outside the CMA is restricted. These restrictions could hinder Sibanye’s financial and strategic flexibility, particularly its ability to raise funds outside South Africa. See “—Environmental and Regulatory Matters—Exchange Controls.”
REGULATION OF GREENHOUSE GAS EMISSIONS AND CLIMATE CHANGE ISSUES MAY MATERIALLY ADVERSELY AFFECT SIBANYE’S OPERATIONS.
Energy is a significant input and cost to Sibanye’s mining and processing operations. Regulatory initiatives to curb carbon emissions could increase Sibanye’s energy, production and transport costs, specifically costs relating to its energy-intensive assets and assets that emit significant amounts of greenhouse gases. For example, the South African government is considering introducing a carbon tax. The carbon tax was intended to come into effect from 1 January 2015 but, in order to align the framework of the proposed carbon tax with the desired reduction outcomes, the implementation of the carbon tax was postponed in order to allow sufficient time for consultation on draft legislation and the implementation process. In November 2015, the government published for comment draft carbon tax legislation with a view to the implementation of the tax by January 2017. While many aspects of the proposed carbon tax remain uncertain, the financial implications of government’s proposed carbon tax for Sibanye, at an anticipated rate of R120 per tonne of CO2e, would have been between approximately R93 million and R261 million for fiscal 2015. The mining industry has raised concerns through the Chamber of Mines at various forums, including the Davis Tax Commission, on the potential negative financial impact of the tax, particularly in relation to marginal mining operations. For more information. See “Integrated Annual Report—Sustain—Manage Environmental Impact—Future Focus”.
Furthermore, the potential physical impacts of climate change on Sibanye’s operations are highly uncertain and may adversely impact the cost, production and financial performance of Sibanye’s operations.
HIV/AIDS, TUBERCULOSIS AND OTHER CONTAGIOUS DISEASES POSE RISKS TO SIBANYE IN TERMS OF LOST PRODUCTIVITY AND INCREASED COSTS.
The prevalence of HIV/AIDS in South Africa poses risks to Sibanye in terms of potentially reduced productivity and increased medical and other costs. Compounding this are the concomitant infections, such as tuberculosis, that can accompany HIV illness, particularly at the end stages, and cause additional healthcare-related costs. If there is a significant increase in the incidence of HIV/AIDS infection and related diseases among the workforce, this may have a material adverse effect on Sibanye’s business, operating results and financial condition.
Additionally, the spread of contagious diseases such as respiratory diseases is exacerbated by communal housing and close quarters. The spread of such diseases could impact employees’ productivity, treatment costs and, therefore, operational costs.
SIBANYE’S OPERATIONS ARE SUBJECT TO WATER USE REGULATION, WHICH COULD IMPOSE SIGNIFICANT COSTS AND BURDENS.
Sibanye’s operations are subject to regulatory controls on their usage and disposal of water. Under South African law, mining operations are subject to water use licences that govern each operation’s water usage and that require, among other things, mining operations to achieve and maintain certain water quality limits regarding all water discharges. Kloof currently operates under a regulatory directive that allows it to operate while its application for license renewal is being processed. Driefontein holds a water use licence but Sibanye remains in discussions with the Department of Water and Sanitation (DWS) regarding certain discrepancies regarding the license. Beatrix currently operates under a pre-existing permit of indefinite length; however, it has submitted an application for a licence under the current regime. The Rand Uranium section of the Cooke operations was issued a water licence in November 2013 which defines the water management regulatory requirements for the Cooke surface operations, as well as for the Cooke 1, 2 and 3 underground mining operations. The Cooke 4 underground mining operations currently operate under the old order water use authorisations. Application has been made to the DWS for a water use licence. Sibanye expects to incur significant expenditure to achieve and maintain compliance with the licence requirements at each of its operations. Any failure on Sibanye’s part to achieve or maintain compliance with the requirements of these licences with respect to any of its operations could result in Sibanye being subject to substantial claims, penalties, fees and expenses; significant delays in operations; or the loss of the relevant water use licence, which could curtail or halt production at the affected operation. Any of the above could have a material adverse effect on Sibanye’s business, operating results and financial condition.
Sibanye has identified a risk of potential long-term acid mine drainage (AMD) issues which are currently being experienced by peer mining groups. AMD relates to the acidification and contamination of naturally occurring water resources by pyrite-bearing ore contained in underground mines and in rock dumps, tailings dams and pits on the surface. Should Sibanye’s current preventative measures not be successful such that Sibanye were to experience any AMD issues, it could result in failure to comply with its water use licence requirements and could expose Sibanye to potential liabilities.
RISKS RELATED TO THE ACQUISITIONS
SIBANYE MAY NOT BE ABLE TO COMPLETE THE ACQUISITIONS ON A TIMELY BASIS OR AT ALL, AND REGULATORY AUTHORITIES MAY IMPOSE CONDITIONS ON US, THE RUSTENBURG OPERATIONS OR THE AQUARIUS OPERATIONS THAT COULD PREVENT US FROM ACHIEVING SOME OF THE EXPECTED BENEFITS AND REALISING THE ANTICIPATED SYNERGIES OF THE ACQUISITIONS.
The Acquisitions remain subject to conditions precedent, including obtaining clearances from the DMR with regard to the Rustenburg Operations. There can be no assurance that these conditions will be satisfied and completion of the Acquisitions will be achieved on a timely basis or at all. In particular, the regulatory clearance process, including clearance by the DMR, may take longer than expected to complete, which would delay the completion of one or both of the Acquisitions. These and other regulatory authorities could also block either or both of the Acquisitions or impose conditions on us as part of any authorisation or clearance, and any such conditions could prevent us from achieving some or all of the expected benefits and realising the anticipated synergies of the Acquisitions.
Any of the above could have a material adverse effect on Sibanye’s business, operating results and financial condition.
SIBANYE MAY FACE CHALLENGES INTEGRATING THE RUSTENBURG OPERATIONS AND AQUARIUS BUSINESS FOLLOWING COMPLETION OF THE ACQUISITIONS, WHICH COULD DISRUPT ITS CURRENT OPERATIONS OR RESULT IN HIGHER COSTS OR WORSE OVERALL PERFORMANCE THAN WE ANTICIPATE.
If we are unable to integrate the Rustenburg Operations and Aquarius’ business with our own operations in a timely and cost-effective manner, the potential benefits of the Acquisitions, including the estimated revenue and cost synergies we expect to achieve, may not be realised. In particular, if the effort we devote to the integration of our businesses with those of the Rustenburg Operations and Aquarius diverts more management time or other resources from carrying out our operations than we originally planned, our ability to maintain and increase revenues as well as manage our costs could be impaired. Furthermore, our capacity to expand other parts of our existing businesses may be impaired.
Any of the above could have a material adverse effect on Sibanye’s business, operating results and financial condition.
OUR GROWTH STRATEGY, INCLUDING THE ACQUISITIONS AND REORGANISATION OF OUR BUSINESS, MAY NOT BE SUCCESSFUL.
Prior to the Acquisitions (which remain subject to conditions precedent), our core businesses were primarily related to owning and operating four underground and surface gold operations, as well as operating extraction and processing facilities for treatment of gold-bearing ore before it is refined. As noted in “— Risks Related to Sibanye’s business — Changes in the market price for gold, which in the past have fluctuated widely, affect the profitability of Sibanye’s gold mining operations and the cash flows generated by those operations”, these operations have experienced significant volatility during the recent past.
Following the Acquisitions, key components of our strategy will be to reorganise the Group’s operations into a platinum division and a gold and uranium division, and to potentially grow through expansion in further markets. Our growth strategy, including the reorganisation will require significant investment and place strain on our financial and management resources, as well as our compliance systems, as our management team will be required to support and oversee operations in an industry where they may have limited or no experience while at the same time ensuring that our management systems are suitable for our expanding operations. We cannot assure you that we will be able to achieve the objectives our management anticipates or that our management will be able to manage any such processes successfully. Failure to achieve such objectives or any significant weakening of our overall management controls could have a material adverse effect on our business, operating results and financial condition.
IF EITHER OF THE RUSTENBURG OPERATIONS OR AQUARIUS DOES NOT PERFORM IN LINE WITH OUR EXPECTATIONS, WE MAY BE REQUIRED TO WRITE-DOWN THE CARRYING VALUE OF OUR INVESTMENT, WHICH COULD AFFECT OUR ABILITY TO PAY DIVIDENDS.
Under IFRS, we are required to test the carrying value of long-term assets or cash-generating units for impairment at least annually and more frequently if we have reason to believe that our expectations for the future cash flows generated by these assets may no longer be valid. If the results of operations and cash flows generated by the Rustenburg Operations or Aquarius following the Acquisitions are not in line with our expectations, we may be required to write-down the carrying value of the investment. Any write-down could materially affect our business, operating results, operations and financial condition.
WE MAY DISCOVER CONTINGENT OR OTHER LIABILITIES WITHIN THE RUSTENBURG OPERATIONS OR AQUARIUS OR OTHER FACTS OF WHICH WE ARE NOT AWARE THAT COULD EXPOSE SIBANYE TO LOSS.
Although Sibanye has received certain representations, warranties and indemnities regarding the Rustenburg Operations and Aquarius under the terms of the Rustenburg Operations Acquisition Agreements and the Aquarius Acquisition Agreements, respectively, and it has conducted general due diligence in connection with the Acquisitions, such due diligence was necessarily limited. There can be no assurance that Sibanye identified all the liabilities of, and risks associated with, the Acquisitions or that it will not be subject to unknown liabilities of, and risks associated with, the Acquisitions, including liabilities and risks that may become evident only after Sibanye has been involved in the operational management of the Acquisitions. Sibanye may incur losses in excess of this maximum amount or the matters giving rise to the losses may not be recoverable against the warranties or indemnities or at all.
WHILE THE RUSTENBURG OPERATIONS AND THE OPERATIONS OF AQUARIUS ARE PGM FOCUSED OPERATIONS, THEY FACE SIMILAR OPERATIONAL RISKS TO THE GOLD MINING OPERATIONS OF SIBANYE:
The Rustenburg Operations and the operations of Aquarius face similar operational risks to those of Sibanye’s gold mining operations, for example:
| · | | The operations of the Rustenburg Operations and Aquarius have been and may be adversely affected by strikes and union activity; |
| · | | The mineral reserves of the Rustenburg Operations and the Aquarius operations are estimates based on a number of assumptions, which, if changed, may require these operations to lower their estimated mineral reserves; |
| · | | Due to the nature of PGM mining and the extensive environmental footprint of the operations, environmental hazards, industrial accidents, mining accidents and pollution may result in operational disruptions such as stoppages which could result in increased production costs as well as financial and regulatory liabilities; |
| · | | Due to mature infrastructure at the Rustenburg Operations and the Aquarius operations, unplanned breakdowns and stoppages may result in production delays, increased costs and industrial accidents; |
| · | | Power stoppages, fluctuations and usage constraints may force the Rustenburg Operations and the Aquarius operations to halt or curtail operations; |
| · | | Actual and potential supply chain shortages and increases in the prices of production inputs may have a material adverse effect on the operations and profits of the Rustenburg Operations and Aquarius; and |
| · | | Social unrest, sickness or natural or man-made disaster at informal settlements in the vicinity of some of the Rustenburg Operations and Aquarius’ operations may disrupt its business or may lead to greater social or regulatory impositions on these operations. |
WHILE THE RUSTENBURG OPERATIONS AND THE OPERATIONS OF AQUARIUS ARE PGM FOCUSED OPERATIONS, THEY FACE SIMILAR LEGAL AND REGULATORY RISKS TO THE GOLD MINING OPERATIONS OF SIBANYE.
The Rustenburg Operations and the operations of Aquarius face similar legal and regulatory risks to those of Sibanye’s gold mining operations, for example:
| · | | The mineral rights associated with the Rustenburg Operations and the Aquarius operations are subject to legislation, which could impose significant costs and burdens and which impose certain ownership requirements, the interpretation of which are the subject of dispute; and |
| · | | The Rustenburg Operations and the operations of Aquarius are subject to environmental and health and safety regulations, which could impose additional costs and compliance requirements and Sibanye (assuming it completes the Acquisitions) may face claims and liability for breaches, or alleged breaches, of such regulations and other applicable laws. |
WHILE THE RUSTENBURG OPERATIONS AND THE OPERATIONS OF AQUARIUS ARE PGM FOCUSED OPERATIONS, THEY FACE SIMILAR FINANCIAL RISKS TO THE GOLD MINING OPERATIONS OF SIBANYE.
The Rustenburg Operations and the operations of Aquarius face similar financial risks to those of Sibanye’s gold mining operations, for example:
| · | | Change in the market price for platinum and associated minerals, which in the past have fluctuated widely, affect the profitability and cash flows of the Rustenburg Operations and the operations of Aquarius and, if Sibanye completes the Acquisitions, will affect the profitability of Sibanye; |
| · | | Power cost increases may adversely affect the results of operations of the Rustenburg Operations and Aquarius; |
| · | | Because platinum is generally sold in US dollars, while the Rustenburg Operations’ and the South African Aquarius operations’ production costs are primarily in Rand, these operations’ operating results and financial condition will be materially harmed if there is a material change in the value of the Rand; and |
| · | | Platinum mining operations are subject to high fixed costs which may impact its profitability. |
RISKS RELATED TO SIBANYE’S SHARES AND ADRS
SHAREHOLDERS OUTSIDE SOUTH AFRICA MAY NOT BE ABLE TO PARTICIPATE IN FUTURE ISSUES OF SECURITIES (INCLUDING ORDINARY SHARES) CARRIED OUT BY OR ON BEHALF OF SIBANYE.
Securities laws of certain jurisdictions may restrict Sibanye’s ability to allow participation by certain shareholders in future issues of securities (including ordinary shares) carried out by or on behalf of Sibanye. In particular, holders of Sibanye securities who are located in the United States (including those who hold ordinary shares or ADRs) may not be able to participate in securities offerings by or on behalf of Sibanye unless a registration statement under the Securities Act is effective with respect to such securities or an exemption from the registration requirements of the Securities Act is available thereunder.
Securities laws of certain other jurisdictions may also restrict Sibanye’s ability to allow the participation of all holders in such jurisdictions in future issues of securities carried out by Sibanye. Holders who have a registered address or are resident in, or who are citizens of, countries other than South Africa should consult their professional advisers as to whether they require any governmental or other consent or approvals or need to observe any other formalities to enable them to participate in any offering of Sibanye securities.
INVESTORS IN THE UNITED STATES AND OTHER JURISDICTIONS OUTSIDE SOUTH AFRICA MAY HAVE DIFFICULTY BRINGING ACTIONS, AND ENFORCING JUDGMENTS, AGAINST SIBANYE, THE DIRECTORS AND THE EXECUTIVE OFFICERS BASED ON THE CIVIL LIABILITIES PROVISIONS OF THE FEDERAL SECURITIES LAWS OR OTHER LAWS OF THE UNITED STATES OR ANY STATE THEREOF OR UNDER THE LAWS OF OTHER JURISDICTIONS OUTSIDE SOUTH AFRICA.
Sibanye is incorporated in South Africa. All of the Directors and Executive Officers (as well as Sibanye’s independent registered public accounting firm) reside outside of the United States. Substantially all of the assets of these persons and substantially all of the assets of Sibanye are located outside the United States. As a result, it may not be possible for investors to enforce against these persons or Sibanye a judgment obtained in a United States court predicated upon the civil liability provisions of the federal securities or other laws of the United States or any state thereof. In addition, investors in other jurisdictions outside South Africa may face similar difficulties.
Investors should be aware that it is the policy of South African courts to award compensation for the loss or damage actually sustained by the person to whom the compensation is awarded. Although the award of punitive damages is generally unknown to the South African legal system, it does not mean that such awards are necessarily contrary to public policy. Whether a judgment is contrary to public policy will depend on the facts of each case. Exorbitant, unconscionable or excessive awards will generally be contrary to public policy and contractually stipulated penalties are subject to and limited by the provisions of the Conventional
Penalties Act, 1962. South African courts cannot enter into the merits of a foreign judgment and cannot act as a court of appeal or review over the foreign court. South African courts will usually implement their own procedural laws and, where an action based on an international contract is brought before a South African court, the capacity of the parties to the contract will usually be determined in accordance with South African law. However, a South African court may, in certain circumstances, show expert evidence in relation to the law of the jurisdiction which governs the contract in question. It is doubtful whether an original action based on United States federal securities laws or the laws of other jurisdictions outside South Africa may be brought before South African courts. Further, a plaintiff who is not resident in South Africa may be required to provide security for costs in the event of proceedings being initiated in South Africa. In addition, the Rules of the High Court of South Africa require that documents executed outside South Africa must be authenticated for the purpose of use in South Africa.
Investors should also be aware that a foreign judgment is not directly enforceable in South Africa, but only constitutes a cause of action. Such a judgment will be enforced by South African courts only if certain conditions are met.
SIBANYE MAY NOT PAY DIVIDENDS OR MAKE SIMILAR PAYMENTS TO ITS SHAREHOLDERS IN THE FUTURE DUE TO VARIOUS FACTORS AND ANY DIVIDEND PAYMENTS MAY BE SUBJECT TO WITHHOLDING TAX.
Sibanye’s dividend policy is to return at least 25% to 35% of normalised earnings to shareholders. Sibanye may pay cash dividends only if funds are available for that purpose. Whether funds are available depends on a variety of factors, including the amount of cash available and Sibanye’s capital expenditures on both existing infrastructure as well as on exploration and other projects and other cash requirements existing at the time. Under South African law, Sibanye will be entitled to pay a dividend or similar payment to its shareholders only if it meets the solvency and liquidity tests set out in the Companies Act, and is permitted to do so in terms of Sibanye’s Memorandum of Incorporation (the Memorandum of Incorporation). Given these factors and the Board’s discretion to declare cash dividends or other similar payments, dividends may not be paid in the future. It should be noted that a 15% withholding tax on dividends declared by South African resident companies to non-resident shareholders or non-resident ADR holders was introduced with effect from 1 April 2012. See “—Additional Information—Taxation—Certain South African Tax Considerations—Withholding Tax on Dividends” and “Annual Financial Report—Accountability—Directors’ Report—Financial Affairs—Dividend Policy”.
SIBANYE’S NON-SOUTH AFRICAN SHAREHOLDERS FACE ADDITIONAL INVESTMENT RISK FROM CURRENCY EXCHANGE RATE FLUCTUATIONS SINCE ANY DIVIDENDS WILL BE PAID IN RAND.
Dividends or distributions with respect to Sibanye’s ordinary shares have historically been paid in Rand. The US dollar or other currency equivalent of future dividends or distributions with respect to Sibanye’s ordinary shares, if any, will be adversely affected by potential future reductions in the value of the Rand against the US dollar or other currencies. In the future, it is possible that there will be changes in South African Exchange Control Regulations such that dividends paid out of trading profits will not be freely transferable outside South Africa to shareholders who are not residents of the CMA. See “—Additional Information—South African Exchange Control Limitations Affecting Security Holders”.
SIBANYE’S ORDINARY SHARES ARE SUBJECT TO DILUTION AS A RESULT OF ANY NON-PRE-EMPTIVE SHARE ISSUANCE, INCLUDING UPON THE EXERCISE OF SIBANYE’S OUTSTANDING SHARE OPTIONS, ISSUES OF SHARES BY THE BOARD IN COMPLIANCE WITH BEE LEGISLATION OR IN CONNECTION WITH ACQUISITIONS.
Shareholders’ equity interests in Sibanye will be diluted to the extent of future exercises or settlements of rights under the Sibanye Gold Limited 2013 Share Plan (2013 Share Plan) and any additional rights. See “Annual Financial Report—Accountability—Remuneration Report—The Sibanye Gold Limited 2013 Share Plan”. Sibanye shares are also subject to dilution in the event that the Board is required to issue new shares in compliance with applicable BEE legislation. See “—Risks related to Sibanye’s business—Sibanye’s mineral rights are subject to legislation, which could impose significant costs and burdens.”
Further, the issuance of shares in connection with any acquisition (whether in the form of consideration or otherwise) may result in dilution to existing Shareholders. For example, on 15 May 2014, Sibanye concluded the acquisition of Cooke. As consideration for the acquisition, Sibanye issued 156,894,754 new Sibanye shares at R28.61, representing 17% of Sibanye’s issued share capital on a fully diluted basis.
Sibanye’s empowerment partner in Newshelf 1114 Proprietary Limited (the Newshelf 1114 Empowerment Partner) has a put option in respect of their 24% shareholding in Newshelf 1114 which allows them to acquire shares in Sibanye. If the partner exercises this option, Sibanye must acquire its shares in Newshelf 1114 based on the net attributable fair value of the underlying assets and liabilities of the Newshelf 1114 group by issuing the number of shares in Sibanye determined on the basis of the 30 day volume weighted average share price of Sibanye on the JSE. The Newshelf 1114 Empowerment Partner’s net attributable fair value will be adjusted with original subscription loan still due by the Newshelf 1114 Empowerment Partner on acquiring the 24% shareholding in 2013. The subscription loan’s balance at 31 December was R569 million. The option can be exercised until 8 February 2018.
A large volume of sales of Sibanye’s ordinary shares by this partner or another shareholder, all at once or in blocks, could decrease the prevailing market price of Sibanye’s ordinary shares and could impair Sibanye’s ability to raise capital through the sale of equity securities in the future. Additionally, even if substantial sales are not affected, the mere perception of the possibility of these sales could decrease the market price of Sibanye’s ordinary shares and could have a negative effect on Sibanye’s ability to raise capital in the future. Further, anticipated downward pressure on Sibanye’s ordinary share price due to actual or
anticipated sales of ordinary shares could cause some institutions or individuals to engage in short sales of Sibanye’s ordinary shares, which may itself cause the price of the ordinary shares to decline.
RESERVES OF SIBANYE AS OF 31 DECEMBER 2015
Introduction
Sibanye reports its mineral reserves in accordance with SAMREC, the South African Code for the reporting of Mineral Asset Valuation and other relevant international codes such as the SEC’s Industry Guide 7. Only the reserves at each of our operations and exploration projects as of 31 December 2015, which qualify as reserves for purposes of the SEC’s Industry Guide number 7, are presented in the tables below. In accordance with the requirements imposed by the JSE, we report our reserves using the terms and definitions of the SAMREC Code (2007 edition). Mineral or ore reserves, as defined under the SAMREC Code, are divided into categories of proved and probable reserves and are expressed in terms of tons to be processed at mill feed head grades, allowing for estimated mining dilution, mining recovery and other factors.
Geology
Our operations consist of deep level underground gold mines located along the northern and southwestern margins of the Witwatersrand Basin in South Africa. These properties include the Driefontein, Kloof and Cooke operations along the northern margin and the Beatrix operation along the southwestern margin. These mines are typical of the many Witwatersrand Basin operations, which have been the primary contributors to South Africa’s production of a significant portion of the world’s recorded gold output since 1886.
The Witwatersrand Basin comprises a 6,000-meter vertical thickness of sedimentary rocks, extending laterally for some 350 kilometres northeast to southwest by some 120 kilometres northwest to southeast, generally dipping at shallow angles toward the centre of the Witwatersrand Basin. The Witwatersrand Basin outcrops at its northern extent near Johannesburg, but to the west, south and east it is overlaid by up to 4,000 meters of volcanic and sedimentary rocks. The Witwatersrand Basin is Archaean in age, meaning the sedimentary rocks are of the order of 2.8 billion years old.
Gold mineralisation occurs within laterally extensive quartz pebble conglomerate beds called reefs, which are developed above unconformable surfaces near the basin margin. As a result of faulting and primary controls on mineralisation processes, the goldfields are not continuous and are characterised by the presence or dominance of different reef units. The reefs are generally less than two meters in thickness and are widely considered to represent laterally extensive braided fluvial deposits or unconfined flow deposits, which formed along the flanks of alluvial fan systems around the edge of an inland sea. Dykes and sills of diabase or dolerite composition are developed within the Witwatersrand Basin and are associated with several intrusive and extrusive events.
Gold generally occurs in native form, often associated with pyrite, carbon and uranium. Pyrite and gold within the reefs display a variety of forms, some obviously indicative of detrital transport within the depositional system and others suggesting crystallisation within the reef itself.
As early as 1923, the presence of uranium was noted in the Witwatersrand reefs. It was found that on average the reefs contain about 0.03% uranium and as a by-product of gold relatively low uranium grades can be recovered. Notwithstanding different opinions as to the origin of the uranium in the reefs, most theories accept localisation of both gold and uranium a function of sedimentary textures. Metal concentrations are directly related to the reefs. Exploration programmes and eventual evaluation of gold and uranium according to a placer philosophy, prove to be highly successful.
The most fundamental controls of gold and uranium distribution are the primary sedimentary features such as facies variation and channel directions. Consequently, the modeling of sedimentary features within the reefs and the correlation of payable grades within certain facies is key to in situ reserve estimation, as well as effective operational mine planning and grade control.
Block Model Estimation and Reserving Process
Underground reserves are based on an estimated block model of the ore body, which is derived from surface drilling, underground drilling, surface three-dimensional reflection seismics, ore body facies modeling, structural modeling, underground mapping, underground channel sampling and geostatistical estimation. The reefs are initially explored by drilling from the surface on an approximately 500-meter to 2,000-meter grid. Once underground access is available, definition drilling is undertaken on an approximately 30-meter to 90-meter grid. Underground channel sampling perpendicular to the reef is undertaken at three-meter intervals in development areas and five-meter intervals at stope faces. Estimation is constrained within both geologically homogenous structural and facies zones, and is generally derived from either ordinary or simple kriged small-scale grids. Areas close to current workings will have smaller block sizes ranging from 10-meter to 50-meter and is generally derived from either ordinary or simple kriging. Areas further away will have blocks sizes ranging from 50 meters to 420 meters, and is estimated using simple kriging in combination with declustered averaging or Sichel “t” techniques.
Surface low grade rock dumps (SRD) are estimated based on bulk samples taken at regular intervals, and historical processing results. Surface tailings (TSF) have been estimated using a regular, closely spaced drill pattern (100m x 100m). Volume estimates are determined by land and aerial surveys conducted on a regular basis.
Reserves are reported using pay limits, to reflect both the cost structures and required margins relevant to each mining operation. Pay limit is defined as the grade at which an ore body can be mined without profit or loss, and is calculated using an appropriate metal price, working cost and modifying factors. Modifying factors used to calculate the pay limit grades include adjustments to mill delivered amounts, due to dilution incurred in the course of mining. Modifying factors applied in estimating reserves are based on historical achievements, but may incorporate minor adjustments for planned operational improvements. Tonnage and grade include some mineralisation below the selected pay limit to ensure that the reserve comprises blocks of adequate size and continuity. Reserves also take into account cost levels at each operation and are derived from a strategic and operational
planning process that is embedded at each operation. Reserves on the operating mines are supported by cyclical mine plans, and the project reserves are derived from detailed pre-feasibility or feasibility studies compiled for each project respectively.
Reserve Classification Methodology
The reserve estimates are initially categorised according to the measured, indicated and inferred classification assigned to the block models. The measured confidence category is converted to proved reserves and indicated to probable reserves. The inferred confidence category have too low a confidence to be converted to reserves and are excluded.
The confidence classification applied to the block model uses a combination of the quality of the kriged estimates and the confidence in the geological interpretation (drill spacing, continuity of ore body, structural confidence, and confidence in extrapolation or interpolation of facies types). The lower of the two confidence estimates is accepted as the final classification.
The quality of the Kriged estimate is benchmarked using the 90% lower confidence limit on the estimates. The Kriging variance is used in conjunction with the estimated value to calculate the 90% lower confidence limit for each block. The 90% lower confidence limit value estimate is then divided by the estimate and expressed as a percentage. Blocks with a value of greater than 50% are considered to have measured confidence (assuming that the geological confidence is also good enough). Blocks with values of between 20% and 50% are considered to have indicated confidence, and block with values of less than 20% are classified as inferred confidence. The geological confidence is assigned by the geologists, and is based on their subjective judgement. The confidence could be down-graded by the geologists based on the level of ore body complexity. Blocks classified as measured confidence are generally adjacent to closely spaced sampling and generally pierced by a relatively dense irregular pattern of boreholes. Blocks classified as indicated confidence are generally adjacent to blocks classified as measured confidence. In cases where the mining engineer deems it necessary, he may downgrade the classification from proved to probable based on expected mining complexity.
Gold Reserve Statement
As of 31 December 2015, Sibanye had aggregate proved and probable gold reserves of approximately 30.988Moz as set forth in the following table.
GOLD ORE RESERVE STATEMENT AS OF 31 DECEMBER 20151, 2
| | | | | | | | | |
| | 2015 | | 2014 | |
| | Tons (Mt) | | Grade (g/t) | | Gold (Moz) | | Gold (Moz) | |
Operations | | | | | | | | | |
Beatrix | | | | | | | | | |
Proved (AI)3 | | 20.1 | | 3.7 | | 2.389 | | 1.706 | |
Probable (AI) | | 18.1 | | 3.2 | | 1.875 | | 1.892 | |
Total (AI) | | 38.2 | | 3.5 | | 4.264 | | 3.598 | |
Probable (BI)4 | | — | | — | | — | | — | |
Total underground | | 38.2 | | 3.5 | | 4.264 | | 3.598 | |
Driefontein | | | | | | | | | |
Proved (AI) | | 17.9 | | 7.2 | | 4.133 | | 2.716 | |
Probable (AI) | | 8.6 | | 6.7 | | 1.846 | | 3.387 | |
Total (AI) | | 26.4 | | 7.0 | | 5.980 | | 6.103 | |
Probable (BI) | | 9.1 | | 7.3 | | 2.122 | | 1.126 | |
Total underground | | 35.5 | | 7.1 | | 8.102 | | 7.228 | |
Kloof | | | | | | | | | |
Proved (AI) | | 19.6 | | 7.7 | | 4.857 | | 2.932 | |
Probable (AI) | | 4.6 | | 6.9 | | 1.024 | | 3.243 | |
Total (AI) | | 24.2 | | 7.6 | | 5.881 | | 6.175 | |
Probable (BI) | | 2.1 | | 7.4 | | 0.502 | | 0.532 | |
Total underground | | 26.3 | | 7.5 | | 6.383 | | 6.706 | |
Cooke | | | | | | | | | |
Proved (AI) | | 6.8 | | 4.7 | | 1.014 | | 1.555 | |
Probable (AI) | | 3.1 | | 4.6 | | 0.457 | | 0.286 | |
Total underground | | 9.8 | | 4.7 | | 1.471 | | 1.841 | |
Probable (BI) | | — | | — | | — | | — | |
Total underground | | 9.8 | | 4.7 | | 1.471 | | 1.841 | |
Total underground operations | | 109.8 | | 5.7 | | 20.219 | | 19.374 | |
Current SRD and TSF | | | | | | | | | |
Beatrix (Probable) | | 5.3 | | 0.4 | | 0.062 | | 0.071 | |
| | | | | | | | | |
| | 2015 | | 2014 | |
| | Tons (Mt) | | Grade (g/t) | | Gold (Moz) | | Gold (Moz) | |
Driefontein (Probable) | | 4.6 | | 0.6 | | 0.094 | | 0.125 | |
Kloof (Probable) | | 9.5 | | 0.5 | | 0.163 | | 0.194 | |
Randfontein Surface (Proved) | | 4.7 | | 0.3 | | 0.052 | | 0.086 | |
Randfontein Surface (Probable) | | — | | — | | — | | 0.028 | |
Total SRD and TSF | | 24.1 | | 0.5 | | 0.372 | | 0.504 | |
| | | | | | | | | |
Total (excluding projects) | | | | | | | | | |
Beatrix | | 43.5 | | 3.1 | | 4.326 | | 3.669 | |
Driefontein | | 40.1 | | 6.4 | | 8.196 | | 7.354 | |
Kloof | | 35.8 | | 5.7 | | 6.546 | | 6.900 | |
Cooke | | 14.5 | | 3.3 | | 1.523 | | 1.955 | |
Total (excluding projects) | | 134.0 | | 4.8 | | 20.591 | | 19.878 | |
Projects | | | | | | | | | |
Underground Projects (Probable) | | | | | | | | | |
Burnstone | | 13.0 | | 4.3 | | 1.799 | | — | |
De Bron Merriespruit | | 15.4 | | 4.3 | | 2.112 | | 2.088 | |
Total Underground Projects | | 28.4 | | 4.3 | | 3.911 | | 2.088 | |
WRTRP (Probable) | | | | | | | | | |
Driefontein | | 169.1 | | 0.3 | | 1.819 | | 1.805 | |
Kloof | | 265.3 | | 0.3 | | 2.267 | | 2.253 | |
Randfontein Surface | | 280.4 | | 0.3 | | 2.401 | | 2.401 | |
Total WRTRP | | 714.8 | | 0.3 | | 6.486 | | 6.459 | |
Total Projects | | 743.2 | | 0.4 | | 10.397 | | 8.547 | |
| | | | | | | | | |
Total Underground (including projects) | | 138.2 | | 5.4 | | 24.130 | | 21.462 | |
Total Surface (including projects) | | 738.9 | | 0.3 | | 6.858 | | 6.963 | |
Total mineral reserves | | 877.1 | | 1.1 | | 30.988 | | 28.425 | |
1 Managed, unless otherwise stated.
2
| a. | | Quoted as mill delivered metric tons and Run-of-Mine (RoM) grades, inclusive of all mining dilutions and gold losses except mill recovery. Metallurgical recovery factors have not been applied to the reserve figures. The metallurgical recovery is the ratio, expressed as a percentage, of the mass of the specific mineral product actually recovered from ore treated at the plant to its total specific mineral content before treatment. The approximate metallurgical factors for gold are as follows: (i) Driefontein Plant (DP) 1 97%, DP 2 81% and DP 3 82%, (ii) Kloof Plant (KP) 1 92%, KP 2 98%, (iii) Beatrix Plant (BP) 1 96%, BP2 95%, (iv) Cooke Doornkop Plant 95%, Ezulwini Plant 95%. Cooke Plant 60%, (v) De Bron Merriespruit 96%, (vi) WRTRP 52% and (vii) Burnstone 96%. |
| b. | | A gold price of R430,000/kg ($1,170/oz at an exchange rate of R11.45/US$) was applied in valuing the ore reserve. The gold price used for reserves is the approximate three-year trailing average, calculated on a monthly basis, of the London afternoon fixing price of gold. These prices are approximately 2% higher in Rand terms than the prices used for the 31 December 2014 declaration. |
| c. | | Mine dilution relates to the difference between the mill tonnage and the stope face tonnage and includes other sources stopping (which is waste that is broken on the mining horizon, other than on the stope face), development to mill and tonnage discrepancy (which is the difference between the tonnage expected on the basis of the mine’s measuring methods and the tonnage accounted for by the plant). The mine dilution factors are as follows: (i) Driefontein 31%; (ii) Kloof 30%; (iii) Beatrix 19%, (iv) Cooke 25%, (v) De Bron Merriespruit 48% and (vi) Burnstone 2%. |
| d. | | The mining recovery factor relates to the proportion or percentage of planned and scheduled reserves against total potentially available reserves at the gold price used for the declaration of reserves, with all modifying factors, mining constraints and pillar discounts applied. The mining recovery factors are as follows: (i) Driefontein 56%; (ii) Kloof 110%; (iii) Beatrix 70%, (iv) Cooke 34%, (v) De Bron Merriespruit 88%, (vi) Burnstone 90% and (vii) WRTRP 100%. Where the percentage is low, there is significant resource potential on the operation, and where it is more than 100% it is a function of low-grade incremental mining. |
| e. | | The pay limit varies per operation and per shaft, depending on the respective costs, depletion schedule, ore type and dilution. The following are the average pay limits applied in the underground planning process: (i) Driefontein 1,330cm.g/t, (ii) Kloof 1,580cm.g/t, (iii) Beatrix 840cm.g/t and (iv) Cooke 1,090cm g/t. |
| f. | | A mine call factor based on historic performance and incorporating any planned improvements is applied to the mineral reserves. The following mine call factors have been applied: Driefontein 86%, Kloof 82%, Beatrix 84%, Cooke 79%, DBM 81% and Burnstone 86%. |
| g. | | The WRTRP (assessing the potential for extraction of gold and uranium from Sibanye’s West Wits Line and the adjacent Cooke TSFs) is currently the subject of a Definitive Feasibility Study. The 31 December 2015 reserves are based on the DFS, but have been updated with deposition to the active TSF’s during 2015. |
| h. | | Totals may not sum due to rounding. |
3 Above infrastructure (AI) reserves relate to mineralisation which is located at a level at which an operation currently has infrastructure sufficient to allow mining operations to occur.
4 Below infrastructure (BI) reserves relate to mineralisation which is located at a level at which an operation currently does not have infrastructure sufficient to allow mining operations to occur, but where the operation has made plans to install additional infrastructure in the future which will allow mining to occur at that level.
GOLD PRICE SENSITIVITY
The amount of gold mineralisation that we can economically extract, and therefore can classify as reserves, is sensitive to fluctuations in the price of gold. The following table indicates our reserves at different gold prices that are 10% above and below the $1,170/oz (R430,000/kg) gold price used to estimate our attributable reserves; however, the reserve sensitivities are not based on detailed depletion schedules and should be considered on a relative and indicative basis only.
| | | | | | | |
| | R390,000/kg | | R430,000/kg | | R470,000/kg | |
| | (Moz)1 | |
Driefontein | | 7.868 | | 8.196 | | 8.442 | |
Kloof | | 6.528 | | 6.546 | | 6.521 | |
Beatrix | | 4.057 | | 4.326 | | 4.642 | |
Cooke | | 1.382 | | 1.523 | | 1.513 | |
WRTRP | | 6.486 | | 6.486 | | 6.486 | |
De Bron Merriespruit | | — | | 2.112 | | 2.207 | |
Burnstone | | — | | 1.799 | | 1.803 | |
Total | | 26.321 | | 30.988 | | 31.615 | |
1 Driefontein, Kloof, Beatrix and Cooke operations’ reserves include Run-of-Mine ore stockpiles, tailings and SRD.
Our attributable gold reserves increased from 28.4Moz at 31 December 2014 to 31.0Moz at 31 December 2015, primarily due to the inclusion of Burnstone, Beatrix Beisa Project and additional reserves from the Driefontein 5 Shaft drop-down project extension.
| | | |
| | Gold (Moz) | |
Life of Mine 31 December 2014 | | 28.425 | |
2015 depletion | | (1.577) | |
Post depletion Life of Mine | | 26.848 | |
Changes in geology structure at operations | | (0.081) | |
Changes in estimation models at operations | | (0.845) | |
Technical factors (Mine Call Factor, percentage waste mining, etc) | | 0.452 | |
Specific inclusions | | | |
Secondary reefs at Driefontein 8 Shaft and Kloof 8 Shaft | | 0.362 | |
White areas and general additions mainly at Driefontein 8 Shaft and Beatrix West | | 1.073 | |
Driefontein 5 Shaft drop-down project extension beyond inner core | | 1.016 | |
Beisa Project maiden Mineral Reserve | | 0.495 | |
Revised mining method applied to De Bron Merriespruit | | 0.024 | |
Burnstone Project maiden Mineral Reserve | | 1.799 | |
Beatrix South G Block Project | | 0.108 | |
Additions to SRDs at Driefontein, Kloof and Beatrix | | 0.054 | |
Deposition on active TSFs which form part of the WRTRP | | 0.027 | |
Specific exclusions | | | |
Beatrix South 2 Shaft decommissioned | | (0.113) | |
Uneconomic areas excluded, mainly from Cooke | | (0.230) | |
Total | | 30.988 | |
Uranium Reserve Statement
As of 31 December 2015, we had probable uranium reserves of approximately 113.8Mlb as set forth in the following table:
URANIUM ORE RESERVE STATEMENT AS OF 31 DECEMBER 20151, 2
| | | | | | | | | |
| | | | | | | | | |
| | 2015 | | 2014 | |
| | Tons (Mt) | | Grade (g/t) | | U3O8 (Mlb) | | U3O8 (Mlb) | |
Beatrix | | | | | | | | | |
Proved (AI)3 | | — | | — | | — | | — | |
Probable (AI) | | 7.4 | | 0.715 | | 11.654 | | — | |
Total underground | | 7.4 | | 0.715 | | 11.654 | | — | |
Cooke | | | | | | | | | |
Proved (AI) | | 2.7 | | 0.348 | | 2.056 | | 3.388 | |
Probable (AI) | | 1.5 | | 0.314 | | 1.017 | | 0.439 | |
Total underground | | 4.2 | | 0.336 | | 3.073 | | 3.827 | |
Total underground operations | | 11.5 | | 0.579 | | 14.727 | | 3.827 | |
| | | | | | | | | |
Total (excluding projects) | | | | | | | | | |
Beatrix | | 7.4 | | 0.715 | | 11.654 | | — | |
Cooke | | 4.2 | | 0.336 | | 3.073 | | 3.827 | |
Total (excluding projects) | | 11.5 | | 0.579 | | 14.727 | | 3.827 | |
WRTRP | | | | | | | | | |
Driefontein | | 160.9 | | 0.064 | | 22.686 | | 22.326 | |
Kloof | | 265.3 | | 0.038 | | 22.146 | | 22.071 | |
Randfontein Surface | | 280.4 | | 0.088 | | 54.256 | | 54.256 | |
Total WRTRP | | 706.6 | | 0.064 | | 99.088 | | 98.653 | |
Total Projects | | 706.6 | | 0.064 | | 99.088 | | 98.653 | |
| | | | | | | | | |
Total Underground (including projects) | | 11.5 | | 0.579 | | 14.727 | | 3.827 | |
Total Surface (including projects) | | 706.6 | | 0.064 | | 99.088 | | 98.653 | |
Total mineral reserve | | 718.1 | | 0.072 | | 113.814 | | 102.480 | |
1 Managed, unless otherwise stated.
2
| a. | | Quoted as mill delivered metric tons and Run-of-Mine (RoM) grades, inclusive of all mining dilutions and uranium losses except mill recovery. Metallurgical recovery factors have not been applied to the reserve figures. The metallurgical recovery is the ratio, expressed as a percentage, of the mass of the specific mineral product actually recovered from ore treated at the plant to its total specific mineral content before treatment. The approximate metallurgical factors is Ezulwini Plant 78%, and 67% for Beatrix Beisa Project. |
| b. | | A uranium price of R1,140 per kilogram ($45/lb at an exchange rate of R11.45/US) was applied in valuing the ore reserve. The uranium price used for reserves relates to the three year average long term contract price of R1,147/kg. The reserve price is approximately 3% higher in South African Rand terms than the price used for the 31 December 2014 declaration. |
| c. | | For the South African operations, mine dilution relates to the difference between the mill tonnage and the stope face tonnage and includes other sources stopping (which is waste that is broken on the mining horizon, other than on the stope face), development to mill and tonnage discrepancy (which is the difference between the tonnage expected on the basis of the mine’s measuring methods and the tonnage accounted for by the plant). The mine dilution factors are as follows: Cooke 25%, Beatrix Beisa Project 21%. |
| d. | | The mining recovery factor relates to the proportion or percentage of ore mined from the defined ore body at the gold price used for the declaration of reserves. This percentage will vary from mining area to mining area and reflects planned and scheduled reserves against total potentially available reserves (at the gold price used for the declaration of reserves), with all modifying factors, mining constraints and pillar discounts applied. The mining recovery factors for the operations with uranium reserves are as follows: Cooke 34%. Beatrix 70%. |
| e. | | Uranium is mined as a co-product and as such the pay-limit does not apply. |
| f. | | A mine call factor based on historic performance and planned improvements are applied to the mineral reserves. The following mine call factor has been applied: Cooke 76% and Beatrix Beisa Project 90%. |
| g. | | Totals may not sum due to rounding. |
3 AI: Above infrastructure reserves relate to mineralisation which is located at a level at which an operation currently has infrastructure sufficient to allow mining operations to occur.
Corporate Governance
The Competent Persons that take responsibility for the reporting of mineral reserves are the respective operation (per mining unit) or project based Mineral Resource Manager or Manager Geology. The details of all the personnel who approved the mineral reserves are listed in the respective Competent Person’s Reports for the specific operation.
Corporate Governance on the overall compliance of the company’s figures and responsibility for the generation of a Group consolidated statement has been overseen by the Technical Services team listed below This team, who consent to the disclosure
of the 31 December 2015 Mineral Reserve Statement, are permanent employees of Sibanye, and function independently of the operating mines and projects.
| | | | | | | |
Competent Person | | Title | | Qualifications | | Years | |
Gerhard Janse van Vuuren
PLATO PMS 243 | | Vice President: Mine Technical Services | | B Tech (MRM); GDE (Mining Engineering); MBA; MSCC | | 28 | |
Johan van Eeden
SACNASP 400043/092 | | Group Geologist | | MSc (Geology) | | 32 | |
Leon Tolmay
SAIMM 7041403 | | Group Evaluator | | NHD (Mine Survey); GDE (Mining Engineering); MSCC | | 39 | |
Steven Wild
SAIMM 706556 | | Group Mine Planner | | GDE Mining Engineering; NHD MRM | | 20 | |
Werner de Klerk
PLATO PMS233 | | Group Surveyor | | GDE Mining Engineering; MSCC and ND Survey | | 33 | |
M Greenhalgh
SAIMM 704826 | | Group Sampler | | GDE Mining Engineering | | 32 | |
ACQUISITION ASSETS
On 9 September 2015, Sibanye announced that it entered into an agreement with RPM, a wholly owned subsidiary of Anglo American Platinum to acquire the Rustenburg Operations.
On 6 October 2015 Sibanye announced a cash offer of US$0.195 per share for the entire issued share capital of Aquarius. Aquarius owns stakes in the Kroondal mine and Platinum Mile retreatment facilities near Rustenburg in South Africa and the Mimosa joint venture with Impala Platinum in Zimbabwe.
The Acquisitions remain subject to the fulfilment of certain conditions precedent. See “Annual Financial Report—Overview—Management’s Discussion and analysis of the financial statements—Acquisitions”.
The following descriptions were extracted without material adjustment from publicly available information regarding the Rustenburg Operations and the operations of Aquarius published by Anglo American Platinum and Aquarius, respectively. Sibanye has not independently verified the completeness or accuracy of this information and such information was not prepared for the purpose of this annual report.
Ore Reserves of the Rustenburg Operations and Aquarius
The ore reserve statements of the Rustenburg Operations and Aquarius have not been included in this annual report because they have not been prepared in accordance with Industry Guide 7. Management believes that the Acquisitions will add a substantial amount of PGMs (4E) to Sibanye’s ore reserves.
Rustenburg Operations
| | | | |
| | 2015 | 2014 | |
Safety | | | | |
Fatalities | | 1 | 1 | |
LTIFR | | 1.44 | 0.98 | |
Platinum produced ounces (000 oz) | | 485 | 284 | |
Net sales revenue (Rm) | | 11,117 | 8,940 | |
Operating cost of sales (Rm) | | (11,079) | (9,693) | |
Net cash flow (Rm) | | 64 | 445 | |
MINE OVERVIEW
The Rustenburg Operations are situated in the province of North West in South Africa, near the town of Rustenburg and within the Western Limb of the Bushveld complex. The mines operate under a mining right covering a total area of 185.4 square kilometres.
The operation was reorganised in fiscal 2015 into a two-mine operation from previously three mines and concentrators. The West mines consists of the Thembelani and Khuseleka shafts (the West Mine) and East Mine consists of the Siphumelele and Bathopele shafts (the East Mine).
The Bathopele shafts trackless mechanised operation mines the UG2 horizon exclusively at a depth varying between 40 meters and 350 meters below surface using low-profile (LP) and extra-low-profile (XLP) equipment suites.
The remaining operations have three vertical shafts (Thembelani 1, Khuseleka 1, and Siphumelele 1) and the associated declines, which transport rock, men and material. Mining occurs on both the Merensky reef and the UG2 reef horizons. The predominant mining layout on the West Mine is conventional scattered breast mining with strike pillars. The predominant mining layout at Siphumelele Mine is conventional breast stoping with strike pillars. The operating depth for the current workings is between 400 meters and 1,350 meters below surface.
All reclamation of material and equipment at the Khomanani shafts and Khuseleka 2 shaft, placed on long-term care and maintenance, was completed in April 2015.
Rustenburg Operations’ LoM extends to 2040.
KEY ACHIEVEMENTS
| · | | Commissioning of the Rustenburg concentrators tailings retreatment facility in the fourth quarter of fiscal 2015. |
| · | | Commencement of the UG2 ore replacement projects at Khuseleka, Thembelani and Siphumelele. |
| · | | Rustenburg Operations reorganisation into a two-mine structure consisting of an East and West Mine. |
OPERATIONAL REVIEW
The mine reported one fatality at Thembelani 1 shaft in a fall-of-ground accident on 12 May 2015.
The lost-time injury frequency rate at Rustenburg Operations deteriorated to 1.44 in fiscal 2015 from 0.98 in fiscal 2014. This general decline in safety performance was addressed during the second half of fiscal 2015 to ensure both safety compliance and
that all employees respond appropriately to high-risk conditions. Rustenburg remained fatality-free for the third and fourth quarters of fiscal 2015.
Platinum ounces increased to 0.485 million ounces, up 71% from strike-impacted fiscal 2014. The 4E built-up head grade increased to 2.63 g/t compared to 2.29 g/t in fiscal 2014.
Labour productivity was impacted in fiscal 2014 by the legal AMCU strike and showed an increase in fiscal 2015 of 59% to 7.4 m² per total employee.
CAPITAL EXPENDITURE
Total capital expenditure decreased by 34% to R400 million in fiscal 2015 (R543 million in fiscal 2014). Stay-in-business capital expenditure amounted to R239 million (R342 million in fiscal 2014), while project capital of R161 million was primarily spent on the Bathopele phase 4 and phase 5 projects.
Aquarius Operations
KROONDAL
KEY STATISTICS
| | | | | | |
| | | | |
| | Year ended 30 June 2015 | Year ended 30 June 2014 | Year ended 30 June 2013 |
Operations | | | | |
Tonnes milled | | 7.15 | 7.19 | 6.59 | |
Average head grade (g/t) | | 2.43 | 2.39 | 2.41 | |
Recoveries (%) | | 79 | 78 | 79 | |
Cost per PGM ounce produced | | | | | |
($/oz) | | 803 | 879 | 948 | |
(R/oz) | | 9,168 | 9,115 | 8,343 | |
Total no of employees (including contractors) | | 8,747 | 8,549 | 8,065 | |
Safety | | | | | |
DIIR1, 2 | | 0.65 | 0.73 | 1.14 | |
No. of fatalities | | 1 | 0 | 1 | |
Total production – in concentrate | | | | | |
Platinum (oz) | | 257,425 | 251,568 | 238,214 | |
Palladium (oz) | | 134,854 | 130,630 | 122,340 | |
Rhodium (oz) | | 47,985 | 46,380 | 43,879 | |
Gold (oz) | | 2,212 | 2,166 | 2,055 | |
Total PGM production3 (oz) | | 442,477 | 430,743 | 406,497 | |
Total PGM production4 (oz) | | 539,106 | 524,504 | 495,040 | |
Attributable PGM production (oz) | | 221,238 | 215,371 | 203,249 | |
Financials – attributable | | | | | |
Revenue5 ($m) | | 198 | 222 | 217 | |
Gross profit ($m) | | 1 | 9 | (8) | |
Capital expenditure ($m) | | 24 | 24 | 31 | |
| | | | | | |
1 DIIR is used interchangeably as a measure for LTIFR
2 Per 200,000 hours worked
3 3PGM+Au
4 5PGM+Au
5 Net of foreign exchange sales variance
SAFETY
While safety performance continued to improve overall during the year ended 30 June 2015, there was one mining-related death. On 11 October 2014, a production team leader lost his life in a fall-of-ground related incident at Kroondal’s Kwezi shaft. The requisite enquiries and investigations were conducted by management and the DMR.
Following the fatality and a deterioration in safety performance in the second quarter of the year ended 30 June 2015, safety campaigns were re-energised in January 2016. Several visual safety campaigns were conducted focusing on injuries on duty. This included re-enactments and demonstrations that coincided with industrial theatre shows by a local cultural group. Even greater attention was paid to investigations into identifying the root causes of safety accidents while an additional safety officer was appointed to each shaft with responsibility for safety inspections and compliance audits on the afternoon and night shifts. This helped to further increase visibility during all rotational production shifts and to ensure compliance with Company standards and procedures.
The disabling injury incident rate (DIIR) improved in the year ended 30 June 2015 to 0.65 per 200,000 hours worked for the year as a whole, compared with 0.73 in the year ended 30 June 2014, an 11% improvement.
The “My life, my responsibility, I will comply” safety campaign was launched in September 2013. This campaign focuses on promoting individual and joint responsibility for safety so as to prevent injuries and safety incidents. Under the campaign, each employee is intended to understand and take responsibility for their own safety as well as that of fellow employees. Safety is a companywide responsibility and involves everyone. Safety incidents are investigated and systems reviewed in an effort to prevent any re-occurrence.
In addition, given that one of the major causes of accidents is non-compliance with safety standards and procedures, this safety campaign has emphasised the importance of obeying safety procedures. In particular, the focus is on compliance regarding low-energy and general accidents.
Furthermore, dedicated on-site specialist services have been established to improve the management of injury sustained while on duty and have contributed to the reduction in the number of days lost due to injuries. These specialist services include those of medical practitioners, physiotherapists and wound-care specialists, which are available at our on-site clinics as well as a full-time clinic management team.
Weekly focused visible-felt leadership sessions are conducted together with visits underground to inspect and address areas of concern. Each weekly session focuses on a particular safety topic and/or identified challenge for which a checklist is compiled so as to address and mitigate the related risk to safety.
In all, 12 Section 54 instructions were issued during the year ended 30 June 2015 compared to the eight instructions issued during the year ended 30 June 2014, resulting in a total of nine production days being lost.
As of 31 December 2015, the 12-month rolling average DIIR improved by 19% to 0.50 per 200,000 man hours from 0.62 in the previous corresponding period.
OPERATIONS
Kroondal’s total annual production improved in the year ended 30 June 2015 to 442,477 PGM ounces (an attributable 221,238 PGM ounces) from 430,743 PGM ounces in the year ended 30 June 2014. A slight decline in volumes mined was offset by the higher head grade and improved recoveries, which together led to a 3% increase in production.
Production levels were maintained in the face of several operational challenges. Chief among them were the persistent challenging ground conditions and high incidence of potholes at the K6 shaft. Ground conditions appear to be improving at deeper levels.
Given the high incidence of falls of ground at the Kwezi shaft, all ends had been reduced in width, in line with rock-engineering recommendations to ensure a more stable hanging wall.
In addition, trials continued on how to mitigate the impact on recovery rates of the presence of iron rich ultramafic pegmatite (IRUP) in the ore mined at the Kwezi shaft. The solution involves blending the material mined with that from other shafts and using a revised cocktail of reagents in the process plants. This has contributed to improved recoveries. At Kopanang, shaft production remained steady during the year ended 30 June 2015 following commissioning of the new chairlift and the completion of the underground workshop that has resulted in reduced travelling time for the trackless mining machinery.
At Bambanani, all stope faces mining through the oxidised shear zone had successfully done so by the end of the first quarter of the year ended 30 June 2015. This contributed to improved grades and production. Some additional potholing has recently been encountered.
At Simunye, maintenance of trackless mining machinery and the stability of this fleet remained a priority in the year ended 30 June 2015 with some positive results evident towards the end of the year. A dyke intersection on the east and west of the shear zone proved challenging but good progress is being made in overcoming these geological features.
Process plant operations were steady during the year ended 30 June 2015 albeit slightly hampered in the second half by Eskom load shedding.
During the six months ended 31 December 2015, PGM production increased by 4% to 231,678 PGM ounces at Kroondal compared to the previous corresponding period.
KROONDAL RETREATMENT PROJECT
The feasibility study for the Kroondal tailings retreatment project is well advanced. This project involves the recovery of residual PGMs from the retreatment of the tailings from the two Kroondal concentrator plants and the depositing of the retreated tails in the Marikana pits. This would have the effect of substantially reducing Kroondal’s related rehabilitation liability. Initial estimates for this project on a 100% basis are capital expenditure of $23 million and annual production of 15,000 – 20,000 PGM ounces. Following the year ended 30 June 2015, the mine received approval from the Department of Water and Sanitation for the project designs and conditional approval for the technical specifications. These have been resubmitted to the department and work has begun internally on detailed planning for the implementation of this project.
LABOUR RELATIONS
Following the upheaval in labour relations in the platinum sector in particular and mining in general in South Africa in recent years, there has been increased awareness of the need to maintain good industrial relations. Engagement with employees and organised labour is continuous and ongoing.
In addition, there has been a change in the majority union representing employees. In January 2015, a recognition agreement was signed with AMCU which has achieved full organisational rights for the Category B bargaining unit (A1 – B6 band) with representation of more than 35%. As its representation had fallen below the 35% threshold, NUM was given notice to regain this threshold or have its existing recognition agreement for organisational rights terminated. Following the year ended 30 June 2015, this was terminated but NUM also achieved representation of 35% among category A (C Paterson band) employees and is to have similar standing to that of Solidarity, which also represents this category. Recognition agreements are currently being negotiated.
FINANCIALS
In the year ended 30 June 2015, Kroondal’s revenue declined by 2% to R4.5 billion compared to the year ended 30 June 2014. The increase in production together with a decline in the exchange rate between the Rand and the US dollar helped to limit the impact of the 7% decline in the US dollar basket price received. The cash margin declined to 10% for the year ended 30 June 2015, from 15% in the year ended 30 June 2014.
In the six month period ended 31 December 2015, revenue deteriorated by 17% to R1.9 billion compared to the previous financial year due to a 29% weakening of the US dollar basket prices (R0.3 billion negative sales adjustment) but was offset with the weakened exchange rate of 23%.
Additional initiatives to optimise costs and further improve productivity are being assessed.
Stay-in-business capital expenditure totalling $18 million was in line with the mine plan and mobile equipment replacement schedule for the year ended 30 June 2015.
PLATINUM MILE
KEY STATISTICS
| | | | | | |
| | | | |
| | Year ended 30 June 2015 | Year ended 30 June 2014 | Year ended 30 June 2013 |
Operations | | | | |
Tonnes processed | | 4.6 | 2.4 | 3.4�� | |
Average head grade (g/t) | | 0.58 | 0.61 | 0.75 | |
Recoveries (%) | | 12 | 7 | 14 | |
Cost per PGM ounce produced | | | | | |
($/oz) | | 702 | 865 | 721 | |
(R/oz) | | 8,237 | 9,165 | 6,606 | |
Price received per PGM ounce produced | | | | | |
($/oz) | | 1,049 | 1,171 | 1,247 | |
(R/oz) | | 11,953 | 12,401 | 11,423 | |
Total no of employees (including contractors) | | 59 | 15 | 60 | |
Safety | | | | | |
DIIR | | 0 | 0 | 0 | |
No. of fatalities | | 0 | 0 | 0 | |
Total production – in concentrate | | | | | |
Platinum (oz) | | 6,032 | 3,269 | 7,209 | |
Palladium (oz) | | 2,949 | 1,694 | 3,909 | |
Rhodium (oz) | | 872 | 474 | 1,075 | |
Gold (oz) | | 301 | 153 | 403 | |
Total PGM production (oz) | | 10,154 | 5,590 | 12,596 | |
Total PGM production (oz) | | 11,896 | 6,470 | 14,557 | |
Attributable PGM production (oz) | | 9,311 | 5,126 | 11,551 | |
Financials – attributable | | | | | |
Revenue ($m) | | 8.1 | 5.2 | 12.7 | |
Gross profit ($m) | | (1.9) | (2.4) | (8) | |
Capital expenditure ($m) | | 0.1 | 1.5 | 0.2 | |
| | | | | | |
REVIEW OF THE YEAR ENDED 30 JUNE 2015
Platinum Mile operates an on-surface process plant. As in the year ended 30 June 2014, there were no fatalities at Platinum Mile and the DIIR for the year ended 30 June 2015 was zero.
Volumes processed approximately doubled in the period under review as a full year’s supply of feed was received, in contrast to the year ended 30 June 2014 when the principal supplier, RPM, experienced a five-month strike during which its operations were suspended. Operations were resumed at the start of the year ended 30 June 2015 in July 2014, and Platinum Mile began building up production, in tandem with the hot commissioning of the three coarse grinding mills. Steady state production was achieved
by June 2015. Total volumes processed in the year ended 30 June 2015 approached levels last seen in the year ended 30 June 2012.
With the successful full commissioning of the R26 million ($2.5 million) coarse grinding expansion, recoveries improved from the year ended 30 June 2015 to an average of 12% for the year ended 30 June 2015.
Platinum Mile took advantage of the delayed start to Anglo American Platinum’s dump retreatment project to undertake planned and critical maintenance in the third quarter of the year ended 30 June 2015. Commissioning of the dump retreatment project, which remains on care and maintenance, should result in an additional 275,000 tons a month of feed for treatment by Platinum Mile.
Given the resumption of full operations at Platinum Mile in the year ended 30 June 2015, the staff complement increased to 59.
MIMOSA (50%)
KEY STATISTICS
| | | | | |
| | Year ended 30 June 2015 | Year ended 30 June 2014 | Year ended 30 June 2013 |
Operations | | | | |
Tonnes processed | | 2.59 | 2.51 | 2.41 | |
Average head grade (g/t) | | 3.65 | 3.65 | 3.66 | |
Recoveries (%) | | 78 | 77 | 78 | |
Cost per PGM ounce produced ($/oz) | | 802 | 878 | 867 | |
Price received per PGM ounce ($/oz) | | 1,075 | 1,133 | 1,206 | |
Total no of employees (including contractors) | | 1,402 | 1,550 | 1,682 | |
Safety | | | | | |
DIIR | | 0.03 | 0.08 | 0.05 | |
No. of fatalities | | 0 | 0 | 0 | |
Total production – in concentrate | | | | | |
Platinum (oz) | | 117,355 | 110,158 | 109,234 | |
Palladium (oz) | | 92,705 | 87,037 | 84,953 | |
Rhodium (oz) | | 10,205 | 9,270 | 8,849 | |
Gold (oz) | | 15,802 | 14,894 | 14,836 | |
Total PGM production (oz) | | 236,067 | 221,358 | 217,872 | |
Total PGM production (oz) | | 250,097 | 234,633 | 230,626 | |
Attributable PGM production (oz) | | 118,033 | 110,679 | 108,936 | |
Financials – attributable | | | | | |
Revenue ($m) | | 137 | 130 | 133 | |
Gross profit ($m) | | 27 | 22 | 25 | |
Capital expenditure ($m) | | 15 | 15 | 16 | |
SAFETY PERFORMANCE
There were no fatalities during in the year ended 30 June 2015 and one lost-time injury to give a 12-month rolling average DIIR of 0.03 per 200,000 hours worked (year ended 30 June 2014: 0.08). This is equivalent to a lost-time injury rate 0.13 per 1,000,000 hours worked (year ended 30 June 2014: 0.38). One lost-time injury was recorded during the year ended 30 June 2015 compared to three in the year ended 30 June 2014, a 67% improvement. There was a corresponding decrease in the number of injuries overall, from 12 to four. More than five million fatality-free shifts had been recorded by the end of the year ended 30 June 2015.
During the year ended 30 June 2015, safety remained a focus for Mimosa. The regular quarterly safety, health and environment (SHE) briefs continued at which employees were addressed by, among others, members of workers’ leadership structures and SHE practitioners. Similarly, work continued on the review and analysis of safety incidents over the past three years so as to compile action plans to prevent and mitigate their recurrence. Hand-in-hand with this was the on-going investigation into and analysis of near-miss incidents. In addition, themed campaigns are conducted each quarter, with the focus this year being the protection of hands and fingers, the use of personal protective equipment (hard hats, gloves, ear plugs and protective eye-wear as and where necessary), fire safety awareness training and teamwork. There was also a focus on off-the-job safety as a means of promoting employees’ overall safety awareness.
In the six months ended 31 December 2015, one fatality occurred at Mimosa, when a face preparation supervisor lost his life in a fall-of-ground accident. Four lost-time injuries were reported in the six months ended 31 December 2015. As a result, DIIR deteriorated to 0.13 per 200,000 man hours from 0.05 in the previous corresponding period.
OPERATIONS
Mimosa reported total annual production of 236,067 PGM ounces in the year ended 30 June 2015, compared to 221,358 PGM ounces in the year ended 30 June 2014. The mine exceeded design capacity for the fifth consecutive year. The level of production was largely due to the increase in volumes processed, while the grade mined was steady. The higher volumes together with a marginal increase in recoveries contributed to a 6.6% increase in PGMs produced for the year ended
30 June 2015 to give an increase of 18% in total over the last five years (year ended 30 June 2010: 99,812 attributable PGM ounces).
In the six months ended 31 December 2015, PGM production increased by 2% to 120,429 PGM ounces. During the same period, production decreased by 6% to 1.238 million tonnes. Volumes processed increased by 1% to 1.310 million tonnes in the six months ended 31 December 2015.
Operationally, the focus at Mimosa remained on continued process stabilisation and optimisation, and cost-reduction initiatives in the year ended 30 June 2015. The level of production achieved can be attributed to improved recoveries, good plant availability and the maintenance of the plant at steady state operation. Contributing factors to this were the optimisation of the reagents used to improve flotation efficiency, enhanced metallurgical skills training for plant operators, the installation of rod cleaning facilities on all level controllers and improved feed grades.
The plant optimisation programme aimed to ensure that production could exceed design capacity without affecting the life of the plant. The mine is also pursuing various cost-reduction initiatives involving continuous efficiency improvements.
The implementation of effective maintenance strategies enabled plant availability to exceed that planned which in turn enabled the higher level of production to be achieved.
Deteriorating ground conditions remain challenging as teams continue to mine towards the outer limits to the north of the ore body towards and crossing the 6.5m and 11m faults and southwards into Mtshingwe block. These adverse ground conditions are expected to persist during the remaining life of the mine.
All mining teams are now equipped with bolters and employees are receiving additional training by the rock engineering practitioners on anticipating safety risks, particularly falls of ground, and on how to mitigate these.
The mine will continue to use technology to scan the ground ahead of mining and to equip mining teams with technology necessary to make the work area safe and to conduct forward planning with regard to ground conditions.
LIFE-OF-MINE DEVELOPMENT
Expansion into the Mtshingwe block is expected to sustain Mimosa as a long-life mining asset for at least 20 years. Access to the block is being developed via the Wedza shaft and a total of 305m of on-reef development was achieved during the year ended 30 June 2015.
PLANNED EXPANSION
A prefeasibility study was completed earlier in the year ended 30 June 2015. Based on results of the prefeasibility study, the estimated capital requirement is $82 million (100%) over five years. This would include additional mill capacity and an upgrade to the crusher, additional fully equipped production teams and a ventilation upgrade.
Given the relatively low capital expenditure required for this expansion and the fixed cost dilution – unit costs are expected to decline by 6-8% from current levels, this expansion project is significantly value accretive. It is estimated that this project can be executed within 24 months of its start. However, guarantees of fiscal and regulatory stability would be important before any decision to commit the required capital was made.
FINANCIALS
Mimosa’s revenue increased by 5% year-on-year with production increases offsetting the decline in the average price received in the year ended 30 June 2015. The cash margin rose to 29% for the year ended 30 June 2015 compared to 24% in 30 June 2014.
Revenue decreased by 32% to $99 million in the six months ended 31 December 2015 due to lower metal prices.
The effect of the retrenchment process of the past two years as well as the 10% decline in the number of employees contributed to a decline in costs.
Stay-in-business expenditure at Mimosa for the year ended 30 June 2015 was $27.8 million ($118 per PGM ounce), spent mainly on mobile equipment, drill rigs, load haul dump machines (LHDs), the conveyor belt extension and down-dip on-reef development into Mtshingwe block.
As of 31 December 2015, stay in business capital expenditure at Mimosa was $18 million ($150 per PGM ounce), spent mainly on mobile equipment, support & drill rigs and LHDs, the conveyor belt extension, down dip development and ventilation walls.
Overall productivity improved from 142.81 PGM ounces produced per employee in the year ended 30 June 2014 to 168.38 in the year ended 30 June 2015 (the year ended 30 June 2013: 129.03).
ENVIRONMENTAL AND REGULATORY MATTERS
Environmental
Sibanye’s operations are subject to various laws relating to the protection of the environment and section 24 of South Africa’s Constitution of 1996 grants the country’s people the right to an environment that is not harmful to human health or well-being, and to the protection of that environment for the benefit of present and future generations through reasonable legislative and other measures. The Constitution and the National Environmental Management Act, 1998 (Act No 107 of 1998) (NEMA), as well as various other related pieces of legislation enacted and implemented since 1996, grant legal standing to a wide range of interest groups to bring legal proceedings to enforce their environmental rights, which are enforceable against private entities as well as the South African government.
South African environmental legislation commonly requires businesses whose operations may have an impact on the environment to obtain permits, authorisations and other approvals for those operations. The rationale behind this is to ensure that companies with activities that are reasonably expected to have environmental impacts, can initially assess the extent of the environmental impacts from such activities, as well as to put reasonable and practicable mitigation measures in place to manage these impacts. The applicable environmental legislation also imposes general compliance requirements and incorporates the “polluter pays” principle. Prior to 8 December 2014, under the terms of the MPRDA, all prospecting and mining operations had to be conducted according to an environmental management plan/programme (EMP), which had to be approved by competent officials of the DMR. From 8 December 2014, the “One Environmental System” for the mining industry, which changed the previous environmental regulatory regime, came into force following the commencement of legislation creating the new regime on 2 September 2014. In terms of the “One Environmental System”, prescribed officials at the DMR became the competent authority to grant environmental authorisations under the NEMA framework for prospecting/mining operations, a responsibility which was previously administered by the Department of Environmental Affairs (DEA). Since that point, environmental authorisations have replaced the traditional EMPs for all new prospecting and mining projects (with existing MPRDA-approved EMPs remaining valid until formally requested to convert). However, the DEA remains the appeal authority. Directors, in their personal capacity, may be held liable under provisions of NEMA for any environmental degradation and/or the remediation thereof.
Amendments to the Mineral and Petroleum Resources Development Amendment Act, 2008 (the MPRDAA), which came into force in 2014, introduced the “One Environmental System” on 8 December 2014. This allowed for the integration of environmental management with mining activities. Among others, it designates the Minister of Mineral Resources as the competent authority for environmental matters insofar as these matters relate to prospecting, exploration, mining or production of mineral and petroleum resources. Under the MPRDAA, the Minster of Environmental Affairs may, under certain circumstances, make an environmental decision insofar as mining activities are concerned. The MPRDAA also allows for the Minister of Mineral Resources to appoint environmental mineral resource inspectors to monitor the compliance of mining companies, as well as the enforcement of provisions insofar as it relates to prospecting, exploration, mining or production. Importantly, Section 28 of the MPRDAA repealed section 14(2) of the 2008 NEMA Amendment Act, deleting the provisions which provided for the 18-month transitional period after the commencement of the MPRDAA, with effect from 1 September 2014 (or presumably now with effect from 8 December 2014).
Two key environmental regulations have been promulgated under the “One Environmental System” over the last two years:
| · | | The Environmental Impact Assessment Regulations (EIA Regulations) of December 2014; and |
| · | | The Financial Provisioning Regulations of 20 November 2015. |
While the mining industry has largely accepted and implemented the EIA Regulations, there have been serious concerns about the intent of, and ability to implement the new regulations pertaining to the “Financial Provision for Prospecting, Exploration, Mining and Production Operations”, which were drafted and promulgated under NEMA and will be implemented by the DMR. Under these regulations, existing environmental rehabilitation trust funds may no longer be utilised for their intended purpose of concurrent and final rehabilitation and closure, and as a result, new provisions will have to be made for these activities. Accordingly, the regulations have significant financial implications for the mining industry. Engagement with all of the regulatory parties is ongoing in order to address the challenges posed by the new regulations.
The introduction of a carbon tax has been pending for some time and the most recent indication of the government’s intention to introduce the tax is the publication for comment of the draft Carbon Tax Bill in November 2015. It is anticipated that the carbon tax will be implemented on 1 January 2017. The carbon tax design requires the calculation of liability to be based on the volume of fossil fuel input which results in Scope 1 greenhouse gas emissions, and for such liability to commence at R120 per tonne of CO2e, increasing by 10% per annum. The design also anticipates a tax free threshold of 60% and various allowances that would permit a tax liable entity to further mitigate its liability. Such allowances include an increased tax free threshold for trade exposed sectors and the use of carbon offsets against a carbon tax liability. While many aspects of the proposed carbon tax remain uncertain, the financial implications of government’s proposed carbon tax for Sibanye, in today’s terms and at an anticipated rate of R120 per tonne of CO2e, would be between approximately R93 million and R261 million for fiscal 2015. The mining industry has raised concerns through the Chamber of Mines at various forums, including the Davis Tax Commission, on the potential negative financial impact of the tax, particularly in relation to marginal mining operations. See “Integrated Annual Report—Sustain—Manage Environmental Impact—Future Focus”.
The National Environmental Management Waste Act, 2008 (Act No 59 of 2008) (the Waste Act) commenced on 1 July 2009 with the exception of certain sections relating to contaminated land, which came into force on 2 May 2014. Responsible waste management has become a priority for the DEA. On 2 June 2014, amendments to the Waste Act were published, which had the effect that as of 8 December 2014, residue deposits and residue stockpiles would be brought within the Waste Act’s scope of operation and as such, residue stockpiles and residue deposits are now subject to regulation under the Waste Act and waste management licenses for activities relating to their establishment and reclamation will need to be obtained. In addition, Regulations Regarding the Planning and Management of Residue Stockpiles and Residue Deposits, published on 24 July 2015,
are also likely to have a financial impact on the management of these facilities, since they impose various classifications and associated liner requirements for new residue stockpiles and deposits. Engagement with the government in relation to this issue is ongoing
With regards to the requirements of the Waste Act, applications for waste management licences for all of the relevant waste management activities have been made. Sibanye currently has two waste disposal facilities at each of its Beatrix and Driefontein operations. Pursuant to the requirements of the Waste Act, these facilities will need to be managed and, if necessary, rehabilitated.
Sibanye undertakes activities which are regulated by the National Nuclear Regulator Act, 1999 (Act No 47 of 1999) (the NNR Act). The NNR Act requires Sibanye to obtain authorisation from the National Nuclear Regulator (NNR) and undertake activities in accordance with the conditions of such authorisations. During the reporting period, both internal and external audits and inspections were conducted. Each of Sibanye’s mining operations possesses and maintains a Certificate of Registration (CoR) as required by the NNR Act.
Although having been traditionally poor, the enforcement of environmental laws under South Africa’s comprehensive environmental regulatory framework, has experienced rapid improvement. Three separate legislative acts, including the NEMA (enforced by the DEA), the MPRDA (enforced by the DMR) and the National Water Act (enforced by the Department of Water and Sanitation) all make provisions for the appointment of environmental management inspectors, which have sweeping authority and mandates to enforce environmental legislation.
Health and Safety
Health and safety performance on mines is regulated by the South African Mine Health and Safety Act, 1996 (Act No 29 of 1996) (the MHSA). The MHSA, among others, requires the mining companies as employers and their contractors to ensure that their operating and non-operating mines maintain a safe and healthy working environment, confers on the employees the right to refuse to perform hazardous work or enter into an unsafe working place, and describes the powers and functions of the Mine Health and Safety Inspectorate (the MHSI), within the jurisdiction of the DMR and as part of the process of enforcement.
As legally required, all employees are represented in formal joint management/worker health and safety committees, through their representatives, to help monitor and advise on occupational health and safety programmes.
In terms of the MHSA, an employer is obligated, among others, to ensure that mines are designed, constructed and equipped to provide conditions for safe operation and a healthy working environment, and the mines are commissioned, operated, maintained and decommissioned so that employees can perform their work without endangering their health and safety or that of any other person. Every employer must ensure that people who are not employees, but who may be directly affected by the activities at a mine, are not exposed to any health and safety hazards. The MHSA authorises the inspectors in the MHSI, upon identifying certain health and safety hazards, to restrict or stop, partially or wholly, operations at any mine or a workplace, and require an employer to take steps to address the said health and safety hazards before such restriction or stoppage can be lifted.
The principal health risks associated with mining operations in South Africa arise from occupational exposure to silica dust, noise, heat and certain hazardous chemicals. The most significant occupational diseases affecting our workforce include lung diseases such as silicosis, tuberculosis (TB), a combination of both, and chronic obstructive airways disease (COAD) as well as noise induced hearing loss (NIHL).
The Occupational Diseases in Mines and Works Act, 1973 (Act No 78 of 1973) (ODMWA) governs compensation paid to mining employees who contract certain occupational illnesses, such as silicosis. The South African Constitutional Court has ruled that a claim for compensation under ODMWA does not prevent an employee from seeking compensation from an employer in a civil action under common law (either as individuals or as a class).
A failure to comply with MHSA is a criminal offence for which an employer, or any responsible person, may be charged and, if successfully prosecuted, be fined or imprisoned, or both. The MHSI also has the power to impose administrative fines upon an employer in the event of a breach of the Mine Health and Safety Act. The maximum administrative fine that may be imposed is R1 million per offence.
Mineral Rights
THE MPRDA
The MPRDA came into effect on 1 May 2004. The MPRDA consists of two parts, namely the Act itself and the Transitional Provisions contained in Schedule II to the Act. In terms of the MPRDA, the mineral and petroleum resources of South Africa belong to the nation and the state (as custodian of the nation’s resources), which is entitled to grant prospecting and mining rights.
Under the MPRDA, prospecting rights may be granted for an initial maximum period of five years and can be renewed once upon application for a further period not exceeding three years. Mining rights are valid for a maximum period of 30 years, and can be renewed upon application for further periods, each of which may not exceed 30 years. A wide range of factors and principles, including proposals relating to BEE and social responsibility, will be considered by the Minister of Mineral Resources when exercising his discretion whether to grant these applications. A prospecting or mining right can be suspended or cancelled if the holder conducts mining operations in breach of the MPRDA, a term or condition of the right or an environmental management plan, or if the holder of the right submits false, incorrect or misleading information to the DMR. The MPRDA sets out a process which must be followed before the Minister of Mineral Resources is entitled to suspend or cancel the prospecting or mining right.
In November 2006, the DMR approved the conversion of Sibanye’s mining licences under the old regulatory regime at Kloof, Driefontein and Beatrix into rights under the new regime. All of Sibanye’s mines have received their new-order mining rights.
The MPRDA empowered the Minister of Mineral Resources to develop the Mining Charter to set the framework, targets and timetable for effecting entry of HDSAs into the mining industry and to allow such South Africans to benefit from the exploitation of South Africa’s mineral resources.
Among other things, the Mining Charter stated that mining companies agreed to achieve 26% HDSA ownership of South African mining industry assets within 10 years (i.e. by the end of 2014). Ownership can comprise active involvement, through HDSA-controlled companies (where HDSAs own at least 50% plus one share of the company and have management control), strategic joint ventures or partnerships (where HDSAs own at least 25% plus one vote of the joint venture or partnership interest and there is joint management and control) or collective investment vehicles, the majority ownership of which is HDSA based, or passive involvement, particularly through broad-based vehicles such as employee stock option plans. The Mining Charter also required mining companies to submit annual, audited reports on progress toward their commitments, as part of an ongoing review process.
Following a review, the DMR released the Amended Mining Charter on 13 September 2010. Amendments to the Mining Charter in the Amended Mining Charter included, among other things, the requirement by mining companies to: (i) facilitate local beneficiation of mineral commodities; (ii) procure a minimum of 40% of capital goods, 70% of services and 50% of consumable goods from HDSA suppliers (i.e. suppliers in which a minimum of 25% + 1 vote of their share capital must be owned by HDSAs) by 2014 (exclusive of non-discretionary procurement expenditure); (iii) ensure that multinational suppliers of capital goods contribute a minimum of 0.5% of their annual income generated from South African mining companies into a social development fund from 2010 towards the socio-economic development of South African communities; (iv) achieve a minimum of 40% HDSA demographic representation by 2014 at top management (board) level, senior management (executive committee) level, middle management level, junior management level and core and critical skills; (v) invest up to 5% of annual payroll in essential skills development activities; and (vi) implement measures to improve the standards of housing and living conditions for mineworkers by converting or upgrading mineworkers’ hostels into family units, attaining an occupancy rate of one person per room and facilitating home ownership options for all mineworkers in consultation with organised labour, all of which was to be achieved by 2014. In addition, mining companies are required to monitor and evaluate their compliance to the Amended Mining Charter and must submit annual compliance reports to the DMR. The Scorecard for the Broad-Based Socio-Economic Empowerment Charter for the South African Mining Industry attached to the Amended Mining Charter (the Scorecard) made provision for a phased-in approach for compliance with the above targets over the five year period ended 2014. For measurement purposes, the Scorecard allocates various weightings to the different elements of the Amended Mining Charter. Failure to comply with the provisions of the Amended Mining Charter will amount to a breach of the MPRDA and may result in the cancellation or suspension of a mining company’s existing mining rights. In light of the Amended Mining Charter, the status of the Mining Charter is unclear although such charter appears to have been replaced by the Amended Mining Charter.
In accordance with the MPRDA, on 29 April 2009 the DMR published the Code relating to the socio-economic transformation of the mining industry. The current industry position is that the DMR does not apply the Codes and that mining companies are subject only to the provisions of the MPRDA and the Amended Mining Charter.
In the same vein as the 2009 review, during the course of fiscal 2014, the DMR appointed a private entity to conduct Amended Mining Charter compliance audits on its behalf, in respect of a number of mining companies. Mining companies were required to complete questionnaires and templates as a means of reporting on their compliance with fiscal 2014 targets as set in the Amended Mining Charter. However, it is generally understood that the DMR disregarded or abandoned this audit process. It is therefore unclear what the status of the process is and what the outcomes were. It is also unclear whether or not the information provided during this audit process will be considered or used by the DMR for any purpose in the future. It appears that the information gathering mechanism has been substituted by the DMR’s own formal request for information and data on Amended Mining Charter compliance in terms of section 29 of the MPRDA. The DMR directed mining companies to populate an electronic reporting template, but this template has raised a number of concerns due to its inflexible approach towards the assessment of compliance with the Amended Mining Charter. The template applies a mechanical process in that it asks specific questions and requires the completion of certain information, without making provision for the detailing of complex facts or historical transactions entered into in pursuance of meeting the Mining Charter HDSA ownership element.
With the 2014 HDSA ownership target date contemplated in the Amended Mining Charter having passed, the DMR’s application of the Amended Mining Charter and its assessment of compliance therewith in respect of the ownership element is concerning. There are concerns in the mining industry that the approach followed by the DMR poses a risk of government action against many mining entities, which will threaten security of tenure, in that government may order the suspension or cancelation of mining rights in instances of deemed non-compliance with the requirements of the Amended Mining Charter.
Specifically, on 31 March 2015, the Chamber of Mines reported that the DMR believes that empowerment transactions by mining companies concluded after 2004 where the HDSA ownership level has fallen due to HDSA disposal of assets or for other reasons, should not be included in the calculation of HDSA ownership for the purposes of, among other things, the 26% HDSA ownership guideline under the Mining Charter. The position of Sibanye is consistent with that of the Chamber of Mines, and is that such historical empowerment transactions should be included in the calculation of HDSA ownership. The DMR and the Chamber have agreed to approach the South African courts to seek a declaratory order which will provide a ruling on the relevant legislation and the status of the Mining Charter. On 4 June 2015, the Chamber of Mines commenced an action against the Minister of Mineral Resources seeking a declaratory order in relation to the correct interpretation and application of the MPRDA and the Amended Mining Charter. In February 2016, an application was filed by a third party to consolidate the application by the Chamber of Mines and the DMR with its own application for a declaratory order on the empowerment aspects of the Mining Charter. The Chamber of Mines indicted that it would oppose the consolidation of these applications on the basis that the right to relief in the respective applications does not depend substantially on the same questions of law or fact. The application to consolidate the two actions has delayed the hearing of the application of the Chamber of Mines extending the period of uncertainty regarding the interpretation of the Mining Charter.
If the DMR were to prevail in court, mining companies, including Sibanye, may be required to undertake further transactions in order to increase their HDSA ownership which would result in the dilution of existing shareholders. In such a case, mining companies may be required to maintain a minimum HDSA ownership level indefinitely. If the Chamber of Mines were to prevail in court, the DMR may enact new regulations to, among other things, increase HDSA ownership requirements for mining companies which would result in the dilution of existing shareholders. The position taken by the DMR also poses a risk that government may order the suspension or cancellation of mining rights for mining companies deemed not to be in compliance with the guidelines of the Amended Mining Charter. It is doubtful that they may lawfully do so in view of the Mining Charter’s questionable legal status and enforceability, among other things. At the Investing in Africa Mining Indaba conference in February 2016, the Minister of Mineral Resources indicated that the third Mining Charter or “Mining Charter III” would be released in the first half of 2016.
The Mineral and Petroleum Resources Development Amendment Act, 2008 (the MPRDAA) was assented to by the President on 19 April 2009 and was to come into effect on a date to be proclaimed by the President. From 19 April 2009 to 31 May 2013, the fate of the MPRDAA was unclear and it was thought that the government would not proceed with the MPRDAA. On 31 May 2013, it was published in the government gazette that the MPRDAA would come into effect 7 June 2013. This proclamation was amended by a further proclamation dated 6 June 2013 such that only certain sections of the MPRDAA took effect as of 7 June 2013. Because Sibanye is already the holder of mining rights in respect of its mines, the amendments introduced by the MPRDAA have limited impact on the current regulation of its operations.
In December 2012, the first draft of the MPRDB was published for comment. While the stated purpose of the MPRDB is, among other things, to remove ambiguities and enhance sanctions, the MPRDB has been criticised by stakeholders in the mining industry. Comments on the MPRDB were submitted and a second draft, known as the Mineral and Petroleum Resources Development Amendment Bill B15-2013 (MPRDB 2013) was published on 31 May 2013. A further revised version of the MPRDB 2013, the Mineral and Petroleum Resources Development Amendment Bill B15B-2013 (the Revised MPRDB 2013) was approved by the National Assembly of Parliament on 12 March 2014 and by the National Council of Provinces on 27 March 2014. The President must now assent to the Revised MPRDB 2013 if he finds it to be in accordance with the Constitution of South Africa. If the President assents to the Revised MPRDB 2013, it will become an Act of Parliament and will come into effect on a date to be proclaimed by the President. It is unclear whether the President will assent to the Revised MPRDB in 2013 in its current form or whether the Bill will be subject to further amendment. At the investing in Africa Mining Indaba conference held in February 2016, the Minister of Mineral Resources indicated that the MPRDB would be finalised in the first half of 2016.
THE BBBEE ACT AND THE BBBEE AMENDMENT ACT
The BBBEE Act established a national policy on broad-based black economic empowerment with the objective of increasing the participation of HDSAs in the economy. The BBBEE Act provides for various measures to promote black economic empowerment, including empowering the Minister of Trade and Industry to issue the BBBEE Codes of Good Practice (BBBEE Codes), with which organs of state and public entities and parties interacting with them or obtaining rights and licenses from them would be required to comply. There has been some debate as to whether or to what extent the mining industry was subject to the BBBEE Act and the policies and codes provided for thereunder. On 24 October 2014, the BBBEE Amendment Act, No. 46 of 2013 was brought into operation. The BBBEE Amendment Act inserts a new provision in the BBBEE Act, whereby the BBBEE Act would trump the provisions of any other law in South Africa which conflicts with the provisions of the BBBEE Act, provided such conflicting law was in force immediately prior to the effective date of the BBBEE Amendment Act. The BBBEE Amendment Act also stipulates that this provision would only be effective one year after the BBBEE Amendment Act is brought into effect. This provision came into effect on 24 October 2015 and, on 27 October 2015, the Minister for Trade and Industry published a government gazette notice declaring an exemption in favour of the DMR from applying the requirements contained in section 10(1) of the BBBEE Act for a period of 12 months. The exemption can be read as confirmation that the Department of Trade and Industry sees the BBBEE codes as “applicable” to the Mining Industry after the exemption is lifted on 27 October 2016. In any event, the DMR is likely to continue implementing the Mining Charter and it is unlikely that the DMR will begin applying the BBBEE Act and BBBEE codes in administering the MPRDA.
This raises the question of whether the BBBEE Act and the BBBEE Codes may overrule the Mining Charter in the future. There is no clarity on this point at this stage. The revised Broad-Based Black Economic Empowerment Codes of Good Practice (the Revised BEE Codes) became available for voluntary use on 11 October 2013 and became effective on 1 May 2015 but are still under consideration and are not yet in force. Entities may elect to be measured under the Revised BEE Codes immediately. Both the BBBEE Amendment Act and the Revised BEE Codes expressly stipulate that where an economic sector in South Africa has a Sector Code in place for BEE purposes, companies in that sector must comply with the Sector Code. For purposes of the BBBEE Act, the Mining Charter is not a Sector Code. It is not clear at this stage how the Mining Charter and Code relate to each other. The government may designate the Mining Charter as a Sector Code, in which case it will be under the auspices of the BBBEE Act. On the other hand, the Mining Charter may remain a stand-alone document under the auspices of the MPRDA and may be subject to the trumping provision discussed above. This uncertainty may be resolved through either government clarification or judicial attention. On 17 February 2016, the Minister of Trade and Industry published a gazette notice which repealed and confirmed the validity of a number of Sector Codes. The omission of the Mining Charter from the notice can be interpreted as confirmation that the Mining Charter is not contemplated as a Sector Code. This supports the interpretation BBBEE Act did not intend to trump the Mining Charter. While it remains to be seen how this will be interpreted, it appears that the BBBEE Act and the BEE Codes will not overrule the Mining Charter in the future.
THE ROYALTY ACT
The Mineral and Petroleum Resources Royalty Act, No. 28 of 2008 (the Royalty Act) imposes a royalty on refined and unrefined minerals payable to the South African government.
The royalty in respect of refined minerals (which include gold and platinum) is calculated by dividing earnings before interest and taxes (EBIT) by the product of 12.5 times gross revenue calculated as a percentage, plus an additional 0.5%. EBIT refers to
taxable mining income (with certain exceptions such as no deduction for interest payable and foreign exchange losses) before assessed losses but after capital expenditure. A maximum royalty of 5% of revenue has been introduced for refined minerals.
Sibanye currently pays a royalty based on the refined minerals royalty calculation as applied to its gross revenue.
The President has appointed the Davis Tax Review Committee to look into and review the current mining tax regime. The Committee’s First Interim Report on Mining, which was relapsed for public comment on 13 August 2015, proposed no changes to the royalty regime but recommended the discontinuation of the upfront capital expenditure write-off regime in favour of an accelerated capital expenditure depreciation regime. In addition, the report recommended retaining the so called “gold formula” for existing gold mines only, as new gold mines would be unlikely to be established in circumstances where profits are marginal or where gold mines would conduct mining of the type intended to be encouraged by the formula. The Committee also recommended to phase out the additional capital allowances available to gold mines in order to bring the gold mining corporate income tax regime in line with the tax system applicable to all taxpayers.
Exchange Controls
South African law provides for Exchange Control Regulations which, among other things, restrict the outward flow of capital from the CMA. The Exchange Control Regulations, which are administered by the Financial Surveillance Department of the SARB, are applied throughout the CMA and regulate international transactions involving South African residents, including companies. The South African government has committed itself to gradually relaxing exchange controls and various relaxations have occurred in recent years.
SARB approval is required for Sibanye and its subsidiaries to receive and/or repay loans to non-residents of the CMA. Funds raised outside of the CMA by any future Sibanye non-South African resident subsidiaries (whether through debt or equity) can be used for overseas expansion, subject to any conditions imposed by the SARB. Sibanye and its South African subsidiaries would, however, require SARB approval in order to provide guarantees for the obligations of any of Sibanye’s subsidiaries with regard to funds obtained from non-residents of the CMA. Debt raised outside the CMA by any future Sibanye non-South African subsidiaries must be repaid or serviced by those foreign subsidiaries. Absent SARB approval, income earned in South Africa by Sibanye and its South African subsidiaries cannot be used to repay or service such foreign debts. Unless specific SARB approval has been obtained, income earned by any future Sibanye foreign subsidiaries cannot be used to finance the operations of another foreign subsidiary.
Transfers of funds from South Africa for the purchase of shares in offshore entities or for the creation or expansion of business ventures offshore require exchange control approval. However, if the investment is a new outward foreign direct investment where the total cost does not exceed R500 million per company per calendar year, the investment application may, without specific SARB approval, be processed by an authorised dealer, subject to all existing criteria and reporting obligations.
Sibanye must obtain approval from the SARB regarding any capital-raising involving a currency other than the Rand. In connection with its approval, it is possible that the SARB may impose conditions on Sibanye’s use of the proceeds of any such capital-raising, such as limits on Sibanye’s ability to retain the proceeds of the capital-raising outside South Africa or requirements that Sibanye seeks further SARB approval prior to applying any such funds to a specific use.
FINANCIAL INFORMATION
Dividend Policy and Dividend Distributions
Sibanye may make distributions from time to time, provided that any such distribution is pursuant to an existing legal obligation of Sibanye or a court order or has been authorised by resolution of the Board and (save in the case of a pro rata distribution to all shareholders (except one which results in shareholders holding shares in an unlisted entity which requires the sanction of an ordinary resolution), cash dividends paid out of retained income, capitalisation issues or scrip dividends incorporating an election to receive either capitalisation shares or cash) has been sanctioned by ordinary resolution, and provided further that:
| · | | dividends be paid to shareholders registered as at a date subsequent to the date of declaration or date of confirmation of the dividend, whichever is the later; |
| · | | it reasonably appears that Sibanye will satisfy the ‘solvency and liquidity’ test as set out in the Companies Act immediately after completing the proposed distribution; and |
| · | | no obligation is imposed by Sibanye, if it is a distribution of capital, that such capital be used to subscribe for shares in Sibanye. |
Sibanye must complete any such distribution fully within 120 business days after the Board acknowledges that the ‘solvency and liquidity’ test has been applied as aforesaid, failing which it must again comply with the above.
Sibanye must hold all unclaimed distributions due to the shareholders of Sibanye in trust indefinitely, but subject to the laws of prescription, and accordingly may release any distributions once the prescriptive period in relation to those dividends has expired.
All dividends paid by Sibanye prior to the Spin-off were historically paid to Gold Fields. After the Spin-off, the Board adopted a new dividend policy to return at least 25% to 35% of normalised earnings. Sibanye defines normalised earnings as net earnings excluding gains and losses on foreign exchange, financial instruments, non-recurring items and share of result of associates after royalties and taxation.
A final dividend in respect of the six months ended 31 December 2015 of 90 Rand cents per share was declared, resulting in a total dividend of 100 Rand cents per share for fiscal 2015.
Under South African law, Sibanye will be entitled to pay a dividend or similar payment to its shareholders only if it meets the solvency and liquidity tests set out in the Companies Act, and we are permitted to do so in terms of the Memorandum of Incorporation.
There is no arrangement under which future dividends are waived or agreed to be waived.
THE OFFER AND LISTING
Listing Details
As of 31 December 2015, 83 record holders of Sibanye’s ordinary shares, holding an aggregate of 324,606,665 ordinary shares (35%), were listed as having addresses in the United States.
JSE Trading History
The tables below show the high and low closing prices in Rand and the average daily volume of trading activity on the JSE for Sibanye’s ordinary shares for the periods indicated.
The following table sets out ordinary share trading information on a yearly basis for the last three fiscal years since the shares began trading on 11 February 2013, as reported by I-Net Bridge, a South African financial information service:
| Ordinary share price (R/ordinary share) | Average daily trading volume (number of ordinary shares) |
Year ended | High | Low |
31 December 2013 | 16.30 | 6.73 | 4,754,958 |
31 December 2014 | 29.52 | 12.34 | 2,868,842 |
31 December 2015 | 32.26 | 13.66 | 3,024,491 |
through 14 March 2016 | 57.85 | 24.57 | 8,465.796 |
The following table sets out ordinary share trading information on a quarterly basis for the periods indicated, as reported by I-Net Bridge:
| Ordinary share price (R/ordinary share) | Average daily trading volume (number of ordinary shares) |
Quarter ended | High | Low |
31 March 2014 | 25.60 | 12.34 | 2,709,498 |
30 June 2014 | 29.00 | 23.00 | 3,911,206 |
30 September 2014 | 29.52 | 22.10 | 2,112,659 |
31 December 2014 | 24.62 | 19.05 | 2,829,663 |
31 March 2015 | 32.26 | 21.75 | 2,674,968 |
30 June 2015 | 28.87 | 18.75 | 2,668,716 |
30 September 2015 | 20.78 | 13.66 | 3,200,103 |
31 December 2015 | 25.06 | 16.46 | 3,526,479 |
The following table sets out ordinary share trading information on a monthly basis for each of the last six months, as reported by I-Net Bridge:
| Ordinary share price (R/ordinary share) | Average daily trading volume (number of ordinary shares) |
Month ended | High | Low |
30 September 2015 | 18.50 | 15.69 | 4,112,502 |
31 October 2015 | 25.06 | 16.46 | 3,585,189 |
30 November 2015 | 23.26 | 17.65 | 2,389,693 |
31 December 2015 | 24.90 | 20.00 | 4,601,758 |
31 January 2016 | 37.35 | 24.57 | 5,500,881 |
29 February 2016 | 57.01 | 35.30 | 11,717,981 |
On 14 March 2016, the closing price of the ordinary shares on the JSE was R54.00.
NYSE Trading History
The tables below show the high and low closing prices in US dollars and the average daily volume of trading activity on the NYSE for the periods indicated.
The following table sets out ordinary share trading information on a yearly basis for the last three fiscal years since the shares began trading on 11 February 2013, as reported by Bloomberg:
| ADS price (US$/ADS) | Average daily trading volume (number of ADSs) |
Year ended | High | Low |
31 December 2013 | 7.47 | 2.65 | 887,984 |
31 December 2014 | 11.09 | 4.69 | 844,925 |
31 December 2015 | 11.35 | 4.21 | 1,122,803 |
through 14 March 2016 | 14.67 | 6.09 | 1,740,632 |
The following table sets out ADS trading information on a quarterly basis for the periods indicated, as reported by Bloomberg:
| ADS price (US$/ADS) | Average daily trading volume (number of ADSs) |
Quarter ended | High | Low |
31 March 2014 | 9.76 | 4.69 | 813,194 |
30 June 2014 | 11.09 | 8.62 | 704,607 |
30 September 2014 | 10.98 | 7.96 | 780,790 |
31 December 2014 | 9.02 | 6.60 | 1,077,427 |
31 March 2015 | 11.35 | 7.52 | 1,162,621 |
30 June 2015 | 9.68 | 6.20 | 852,273 |
30 September 2015 | 6.80 | 4.21 | 1,339,318 |
31 December 2015 | 7.27 | 4.60 | 1,134,637 |
The following table sets out ADS trading information on a monthly basis for each of the last six months, as reported by Bloomberg:
| ADS price (US$/ADS) | Average daily trading volume (number of ADSs) |
Month ended | High | Low |
30 September 2015 | 5.86 | 4.51 | 1,651,847 |
31 October 2015 | 7.27 | 4.60 | 1,339,477 |
30 November 2015 | 6.80 | 4.78 | 994,519 |
31 December 2015 | 6.43 | 5.42 | 1,057,177 |
31 January 2016 | 9.13 | 6.16 | 1,416,462 |
29 February 2016 | 14.37 | 8.88 | 1,845,108 |
On 14 March 2016, the closing price of Sibanye’s ADSs quoted on the NYSE was US$13.83.
ADDITIONAL INFORMATION
Memorandum of Incorporation
A summary of Sibanye’s Memorandum of Incorporation can be found in the 2012 Annual Report on Form 20-F filed with the SEC on 26 April 2013.
Material Contracts
The following are material contracts not entered into in the ordinary course of business that were entered into, novated or amended by Sibanye in the period under review.
US$350 MILLION REVOLVING CREDIT FACILITY
See “Annual Financial Report—Annual Financial Statements—Notes to the Consolidated Financial Statements—Note 23(f): US$350 million Revolving Credit Facility”.
US$150 MILLION BRIDGE FACILITY
See “Annual Financial Report—Annual Financial Statements—Notes to the Consolidated Financial Statements—Note 23(g): US$150 million Bridge Facility”.
RUSTENBURG OPERATIONS TRANSACTION
General
On 9 September 2015, Sibanye announced that it entered into written agreements with RPM, a wholly owned subsidiary of Anglo American Platinum to acquire the Rustenburg Operations. The following is a summary of the key elements of the Rustenburg Operations Transaction, including the purchase price, transitional agreements and conditions precedent. See “Integrated Annual Report—Acquisitions and funding model” and “Annual Financial Report—Overview—Management’s discussion and analysis of the financial statements—Acquisitions”.
Purchase price
The purchase price will consist of an upfront payment and a deferred payment paid by Sibanye Rustenburg Platinum Mines Proprietary Limited, a subsidiary of Sibanye, to Anglo American Platinum. The upfront payment of R1.5 billion will be settled at Sibanye’s election, in cash or through the issue of new ordinary shares in the share capital of Sibanye. The deferred payment will be calculated as 35% of the distributable free cash flows generated by the Rustenburg Operations on an annual basis for a period of six full years commencing from the later of 1 January 2017 or the closing date, subject to a minimum nominal payment of R3.0 billion. Should an outstanding balance remain at the end of the six year period, Sibanye may elect to extend the period by a further two years. Any remaining balance at the end of this period will be settled by Sibanye either in cash or shares.
Transitional arrangements
In the event that, after the closing date, the Rustenburg Operations generate negative distributable free cash flows in either 2016, 2017 or 2018, Anglo American Platinum will be required to pay up to R267 million per year to Sibanye such that the distributable free cash flow for the relevant year is equal to zero.
Conditions precedent
The implementation of the Rustenburg Operations Transaction is both subject to and conditional on the fulfilment of certain conditions precedent, including:
| · | | the granting on or before 30 June 2017 of consent in terms of section 11 of the MPRDA for the sale of the mining and prospecting right pursuant to the Rustenburg Operations Transactions being obtained from the Department of Mineral Resources; |
| · | | the granting on or before 30 June 2017 of consent in terms of section 102 of the MPRDA relating to applications to amend mining areas being obtained from the Department of Mineral Resources; |
| · | | all necessary approvals being obtained from the JSE and New York Stock Exchange to the extent required; and |
| · | | no material adverse change in respect of the Rustenburg Operations. |
AQUARIUS TRANSACTION
General
On 6 October 2015, Sibanye announced that it entered into an implementation agreement to acquire the entire issued share capital of Aquarius. The following is a summary of the key elements of the Aquarius Transaction, which will be implemented as an amalgamation in accordance with the provisions of the Companies Act 1981 of Bermuda (Bermuda Companies Act) and the
Aquarius bye-laws. See “Integrated Annual Report—Acquisitions and funding model” and “Annual Financial Report—Overview—Management’s discussion and analysis of the financial statements—Acquisitions”.
Consideration
Subject to the completion of the Aquarius Transaction, Aquarius shareholders will receive US$0.195 per share of the entire issued share capital of Aquarius. This represents a premium of:
| · | | 60.3% to Aquarius’ closing share price of GBP0.08 on 5 October 2015, the trading day prior to announcement; and |
| · | | 71.4% to Aquarius’ volume-weighted average share price of GBP0.07 over the last 30 days up to and including 5 October 2015. |
Conditions precedent
The Aquarius Transaction is both subject to and conditional on the fulfilment of certain conditions precedent, including:
| · | | the procurement by Aquarius of any necessary written third party consents, including with Impala Platinum in respect of Mimosa. |
R4.5 BILLION FACILITIES
See “Annual Financial Report—Annual Financial Statements—Notes to the Consolidated Financial Statements—Note 23(a): R4.5 billion Facilities”.
BRIDGE LOAN FACILITIES
See “Annual Financial Report—Annual Financial Statements—Notes to the Consolidated Financial Statements—Note 23 (d): Bridge Loan Facilities”.
GOLD ONE INTERNATIONAL LIMITED AGREEMENT
See “Annual Financial Report—Annual Financial Statements—Notes to the Consolidated Financial Statements—Note 12: Acquisitions”.
SGEO TERM LOAN FACILITY AGREEMENT
See “Annual Financial Report—Annual Financial Statements—Notes to the Consolidated Financial Statements—Note 23(c): Burnstone Debt”.
ADDITIONAL BLACK ECONOMIC EMPOWERMENT TRANSACTIONS
The BBBEE Act established a national policy on BBBEE with the objective of increasing the participation of HDSAs in the economy. Accordingly, on 5 August 2010, Gold Fields announced a series of three empowerment transactions to meet its 2014 Black Economic Empowerment equity ownership requirements. On 2 November 2010, the shareholders of Gold Fields approved these transactions at the general meeting.
As part of the first transaction, on 19 November 2010, Gold Fields issued 13,525,394 shares to the ESOP housed and administered by the Gold Fields Thusano Share Trust (the Thusano Trust) thereby commencing the implementation of the ESOP transaction. Gold Fields facilitated the establishment of the ESOP in respect of 10.75% of Sibanye. The holding in Sibanye is equivalent to about 13.5 million unencumbered Gold Fields shares with full voting rights, which were issued to and held by the trust at par value of R0.50 which represents a 99.5% discount to the 30-days volume-weighted average Gold Fields share price at 30 July 2010. This represents approximately 1.75% of the current Gold Fields shares in issue.
As a result of the Spin-off, the Thusano Trust now also holds 13,525,394 shares in Sibanye, representing approximately 1.50% of the current Sibanye shares in issue.
The second transaction consisted of an issue to a BBBEE consortium as described below (BEECO) of about 600,000 Gold Fields shares at par value of R0.50, representing a 99.5% discount to the 30‑days volume-weighted average Gold Fields share price at 30 July 2010. This represented about 0.08% of the Gold Fields shares in issue at that time. These shares carried no restrictions.
As part of the third transaction, BEECO subscribed for a 10% holding with full voting rights directly in South Deep with a phased in participation over 20 years. As part of this transaction, Gold Fields transferred the ownership of the two entities holding interests in the South Deep mine from Sibanye to a newly formed, 90% owned subsidiary of Gold Fields. This transaction was below the JSE transaction threshold of 5% and is not with related parties as defined as per the JSE Listing Requirements and is therefore included for information purposes only. These deals are central to Gold Fields’ and Sibanye’s objective to make every current employee at both companies an owner, while at the same time expanding opportunities for historically disadvantaged persons to benefit from the exploitation of the country’s mineral resources by promoting broad-based ownership, employment, and the advancement of social and economic welfare generally.
US$1 BILLION NOTES ISSUE DUE 2020
On 30 September 2010, Orogen announced the issue of US$1,000,000,000 4.875% guaranteed Notes due 7 October 2020. The payment of all amounts due in respect of the Notes was unconditionally and irrevocably guaranteed on a joint and several basis by the Guarantors. Sibanye remained as a Guarantor of the Notes following the Unbundling from Gold Fields.
On 12 March 2015, Gold Fields announced the launch of a consent solicitation process to ask Note holders to vote to among other things, remove Sibanye as a Guarantor under the Notes. On 22 April 2015, the Note holders approved the resolutions to release Sibanye as a Guarantor. The release became effective on 24 April 2015.
DEPOSIT AGREEMENT
In connection with the establishment of an ADR facility in respect of Sibanye’s shares, Sibanye entered into a deposit agreement with BNYM in respect of Sibanye’s shares among Sibanye, BNYM and all owners and holders from time to time of ADRs issued thereunder (the Deposit Agreement).
This summary is subject to and qualified in its entirety by reference to the Deposit Agreement, including the form of ADRs attached thereto. Terms used in this section and not otherwise defined will have the meanings set forth in the Deposit Agreement. Copies of the Deposit Agreement are available for inspection at the Corporate Trust Office of the Depositary, located at 101 Barclay Street, New York, New York 10286. BNYM’s principal executive office is located at One Wall Street, New York, New York 10286.
American Depositary Shares
Each ADS represents four shares (or a right to receive four shares) deposited with the principal Johannesburg offices of either of FirstRand Bank, Societe Generale (ZA) or Standard Bank of South Africa, as custodians for the Depositary. Each ADS also represents any other securities, cash or other property which may be held by BNYM under the Deposit Agreement.
You may hold ADSs either (A) directly (i) by having an American Depositary Receipt, also referred to as an ADR, which is a certificate evidencing a specific number of ADSs, registered in your name, or (ii) by having ADSs registered in your name in the Direct Registration System (or DRS) or (B) indirectly by holding a security entitlement in ADSs through your broker or other financial institution. If you hold ADSs directly, you are a registered ADS holder, also referred to as an ADS holder. This description assumes you are an ADS holder. If you hold the ADSs indirectly, you must rely on the procedures of your broker or other financial institution to assert the rights of ADS holders described in this section. You should consult with your broker or financial institution to find out what those procedures are.
The DRS is a system administered by The Depository Trust Company (or the DTC) pursuant to which the Depositary may register the ownership of uncertificated ADSs, which ownership shall be evidenced by periodic statements sent by the Depositary to the registered holders of uncertificated ADSs.
South African law governs shareholder rights. BNYM will be the holder of the shares underlying your ADSs. As a registered holder of ADSs, you will have ADS holder rights. A deposit agreement among Sibanye, BNYM and you, as an ADS holder, and all other persons indirectly holding ADSs sets out ADS holder rights, as well as the rights and obligations of the Depositary. New York law governs the Deposit Agreement and the ADSs.
The following is a summary of the material provisions of the Deposit Agreement. For more complete information, you should read the entire Deposit Agreement and the form of ADR.
SHARE DIVIDENDS AND OTHER DISTRIBUTIONS
HOW WILL YOU RECEIVE DIVIDENDS AND OTHER DISTRIBUTIONS ON THE ORDINARY SHARES?
BNYM will pay to you the cash dividends or other distributions it or the custodian receives on the ordinary shares or other deposited securities, after deducting its fees and expenses. You will receive these distributions in proportion to the number of ordinary shares your Sibanye ADRs represent.
Cash
BNYM will convert any cash dividend or other cash distribution Sibanye pays on the ordinary shares other than any dividend or distribution paid in US dollars, into US dollars. If that is not possible or if any government approval is needed and cannot be obtained, the Deposit Agreement allows BNYM to distribute the foreign currency only to those ADR holders to whom it is possible to do so. It will hold the foreign currency it cannot convert for the account of the ADR holders who have not been paid. It will not invest the foreign currency and it will not be liable for any interest.
Before making a distribution, BNYM will deduct any withholding taxes that must be paid. It will distribute only whole US dollars and US cents and will round fractional amounts to the nearest whole cent. If the exchange rates fluctuate during a time when BNYM cannot convert the foreign currency, you may lose some or all of the value of the distribution.
Shares
BNYM may, and will if Sibanye so requests, distribute new ADRs representing any ordinary shares Sibanye distributes as a dividend or free distribution. BNYM will only distribute whole ADRs. It will sell ordinary shares which would require it to issue a fractional ADR and distribute the net proceeds to the holders entitled to those ordinary shares. If BNYM does not distribute
additional cash or ADRs, each ADR will also represent the new ordinary shares. BNYM may sell a portion of the distributed shares sufficient to pay its fees and expenses in connection with the distribution.
Rights to purchase additional ordinary shares
If Sibanye offers holders of securities any rights, including rights to subscribe for additional ordinary shares, BNYM may make these rights available to you. Sibanye must first instruct BNYM to do so and furnish it with satisfactory evidence that it is legal to do so. If Sibanye does not furnish this evidence and/or give these instructions, and BNYM determines that it is practical to sell the rights, BNYM may sell the rights and distribute the proceeds to holders’ accounts. BNYM will allow rights that are not distributed or sold to lapse. In that case, you will receive no value for them.
If BNYM makes rights available to you, upon instruction from you it will exercise the rights and purchase the ordinary shares on your behalf. BNYM will then deposit the ordinary shares and deliver ADSs to the persons entitled to them. It will only exercise rights if you pay BNYM the exercise price and any other charges the rights require you to pay.
US securities laws may restrict the sale, deposit, cancellation and transfer of the ADSs issued after exercise of rights. For example, you may not be able to trade these ADSs freely in the United States. In this case, BNYM may deliver the ADRs under a separate restricted deposit agreement, which will contain the same provisions as the Deposit Agreement except for changes needed to put the necessary restrictions in place. BNYM will not offer you rights unless those rights and the securities to which the rights relate are either exempt from registration or have been registered under the Securities Act of 1933 with respect to a distribution to all ADR holders.
Other Distributions
BNYM will send to you anything else Sibanye distributes on deposited securities by any means BNYM thinks is legal, fair and practical. If it cannot make the distribution in that way, BNYM may decide to sell what Sibanye distributed-for example by public or private sale-and distribute the net proceeds, in the same way as it does with cash, or it may decide to hold what Sibanye distributed, in which case ADSs will also represent the newly distributed property. BNYM may sell a portion of the distributed securities or property sufficient to pay its fees and expenses in connection with the distribution.
BNYM is not responsible if it decides that it is unlawful or impractical to make a distribution available to any ADR holder. Sibanye will have no obligation to take any other action to permit the distribution of ADRs, shares, rights or anything else to ADR holders. This means that you may not receive the distribution Sibanye makes on its ordinary shares or any value for them if it is illegal or impractical for Sibanye to make them available to you.
DEPOSIT, WITHDRAWAL AND CANCELLATION
HOW ARE ADRS ISSUED?
BNYM will deliver the ADRs that you are entitled to receive in the offer against deposit of the underlying ordinary shares. BNYM will deliver additional ADRs if you or your broker deposit ordinary shares with the custodian. You must also deliver evidence satisfactory to BNYM of any necessary approvals of the governmental agency in South Africa, if any, which is responsible for regulating currency exchange at that time. If required by BNYM, you must in addition deliver an agreement transferring your rights as a shareholder to receive dividends or other property. Upon payment of its fees and of any taxes or charges, BNYM will register the appropriate number of ADRs in the names you request and will deliver the ADRs to the persons you request.
HOW DO ADR HOLDERS CANCEL ADRS AND OBTAIN ORDINARY SHARES?
You may submit a written request to withdraw ordinary shares and turn in your ADRs evidencing your ADSs at the Corporate Trust Office of BNYM. Upon payment of its fees and of any taxes or charges, such as stamp taxes or stock transfer taxes, BNYM will deliver the deposited securities underlying the ADSs to an account designated by you at the office of the custodian. At your request, risk and expense, BNYM may deliver at its Corporate Trust Office any dividends or distributions with respect to the deposited securities represented by the ADSs, or any proceeds from the sale of any dividends, distributions or rights, which may be held by BNYM.
HOW DO ADS HOLDERS INTERCHANGE BETWEEN CERTIFICATED ADSS AND UNCERTIFICATED ADSS?
You may surrender your ADR to the Depositary for the purpose of exchanging your ADR for uncertificated ADSs. The Depositary will cancel that ADR and will send to the ADS holder a statement confirming that the ADS holder is the registered holder of uncertificated ADSs. Alternatively, upon receipt by the Depositary of a proper instruction from a registered holder of uncertificated ADSs requesting the exchange of uncertificated ADSs for certificated ADSs, the Depositary will execute and deliver to the ADS holder an ADR evidencing those ADSs.
RECORD DATES
Whenever any distribution of cash or rights, change in the number of ordinary shares represented by ADRs or notice of a meeting of holders of ordinary shares or ADRs is made, BNYM will fix a record date for the determination of the owners entitled to receive the benefits, rights or notice.
VOTING RIGHTS
HOW DO YOU VOTE?
If you are an ADR holder on a record date fixed by BNYM, you may instruct BNYM how to exercise the voting rights of the ordinary shares represented by your ADRs. Otherwise, you will not be able to exercise your right to vote unless you withdraw the ordinary shares. However, you may not know about the meeting enough in advance to withdraw the shares. If Sibanye asks for your instructions, BNYM will notify you of the upcoming meeting and arrange to deliver certain materials to you. The materials will: (1) include all information included with the meeting notice sent by Sibanye to BNYM; (2) explain how you may instruct BNYM to vote the ordinary shares or other deposited securities underlying your ADRs as you direct if you vote by mail or by proxy; and (3) include a voting instruction card and any other information required under South African law that Sibanye and BNYM will prepare. For instructions to be valid, BNYM must receive them on or before the date specified in the instructions. BNYM will try, to the extent practical, subject to applicable law and the provisions of the by-laws of Sibanye, to vote or have its agents vote the underlying shares as you instruct. BNYM will only vote, or attempt to vote, as you instruct. However, if we give notice to BNYM on or before the first date when we give notice, by publication or otherwise, of any meeting of holders of ordinary shares, and if BNYM does not receive your voting instructions, BNYM will give a proxy to vote your ordinary shares to a designated representative of Sibanye, unless Sibanye informs BNYM that: (1) it does not want the proxy issued; (2) substantial opposition exists; or (3) the matter materially and adversely affects the rights of holders of ordinary shares.
Sibanye cannot assure that you will receive the voting materials in time to ensure that you can instruct BNYM to vote your ordinary shares. In addition, BNYM and its agents are not responsible for failing to carry out voting instructions or for the manner of carrying out voting instructions. This means that you may not be able to exercise your right to vote and there may be nothing you can do if your ordinary shares are not voted as you requested.
INSPECTION OF TRANSFER BOOKS
BNYM will keep books for the registration and transfer of ADRs. These books will be open at all reasonable times for inspection by you, provided that you are inspecting the books for a purpose related to Sibanye or the Deposit Agreement or the ADRs.
FEES AND EXPENSES
BNYM, as Depositary, will charge any party depositing or withdrawing ordinary shares or any party surrendering ADRs or to whom ADRs are issued:
Persons depositing or withdrawing shares or ADS holders must pay: | | For: |
$5.00 (or less) per 100 Sibanye ADRs (or portion of 100 Sibanye ADRs) | | Issuance of Sibanye ADRs, including issuances resulting from a distribution of ordinary shares or rights or other property or cancellation of Sibanye ADRs for the purpose of withdrawal, including if the deposit agreement terminates |
$.05 (or less) per ADR (or portion thereof) | | Any cash distribution pursuant to the Deposit Agreement |
A fee equivalent to the fee that would be payable if securities distributed to you had been ordinary shares and those ordinary shares had been deposited for issuance of ADRs | | Distribution of securities distributed to holders of deposited securities which are distributed by BNYM to Sibanye’s ADR holders |
$.05 (or less) per ADRs per calendar year | | Depositary services |
Registration or transfer fees | | Transfer and registration of shares on Sibanye’s share register to or from the name of BNYM or its agent when you deposit or withdraw ordinary shares |
Expenses of BNYM | | Cable, telex and facsimile transmissions (when expressly provided in the deposit agreement) converting foreign currency to US dollars |
Taxes and other governmental charges BNYM or the custodian have to pay on any ADR or share underlying an ADR, for example, stock transfer taxes, stamp duty or withholding taxes | | As necessary |
Any charges incurred by BNYM or its agents for servicing the deposited securities | | As necessary |
The Depositary collects its fees for delivery and surrender of ADSs directly from investors depositing shares or surrendering ADSs for the purpose of withdrawal or from intermediaries acting for them. The Depositary collects fees for making distributions to investors by deducting those fees from the amounts distributed or by selling a portion of distributable property to pay the fees. The Depositary may collect its annual fee for depositary services by deduction from cash distributions or by directly billing investors or by charging the book-entry system accounts of participants acting for them. The Depositary may generally refuse to provide fee-attracting services until its fees for those services are paid.
From time to time, the Depositary may make payments to Sibanye to reimburse and/or share revenue from the fees collected from ADR holders, or waive fees and expenses for services provided, generally relating to costs and expenses arising out of establishment and maintenance of the ADR programme. In performing its duties under the Deposit Agreement, the Depositary may use brokers, dealers or other service providers that are affiliates of the Depositary and that may earn or share fees or commissions.
PAYMENT OF TAXES
You will be responsible for any taxes or other governmental charges payable on your ADRs or on the deposited securities underlying your ADRs. BNYM may deduct the amount of any taxes owed from any payments to you. It may also restrict or refuse the transfer of your Sibanye ADRs or restrict or refuse the withdrawal of your underlying deposited securities until you pay any taxes owed on your Sibanye ADRs or underlying securities. It may also sell deposited securities to pay any taxes owed.
You will remain liable if the proceeds of the sale are not enough to pay the taxes. If BNYM sells deposited securities, it will, if appropriate, reduce the number of Sibanye ADRs held by you to reflect the sale and pay to you any proceeds, or send to you any property, remaining after it has paid the taxes.
RECLASSIFICATIONS, RECAPITALISATIONS AND MERGERS
If Sibanye: | | Then: |
Reclassifies, splits up or consolidates any of the Sibanye ordinary shares | | |
Distributes securities on any of the Sibanye ordinary shares that are not distributed to you | | The cash, ordinary shares or other securities received by BNYM will become new deposited securities under the Deposit Agreement. Each Sibanye ADR will automatically represent the right to receive a proportional interest in the new deposited securities. |
Recapitalises, reorganises, merges, consolidates, sells its assets, or takes any similar action | | BNYM may, and will if Sibanye asks it to, deliver new Sibanye ADRs representing the new deposited securities or ask you to surrender your outstanding Sibanye ADRs in exchange for new Sibanye ADRs identifying the new deposited securities |
AMENDMENT AND TERMINATION
HOW MAY THE DEPOSIT AGREEMENT BE AMENDED?
Sibanye may agree with BNYM to amend the Deposit Agreement and the ADRs without your consent for any reason. If the amendment adds or increases fees or charges, except for taxes and governmental charges or prejudices an important right of Sibanye ADR holders, it will only become effective 30 days after BNYM notifies you of the amendment. At the time an amendment becomes effective, you are considered, by continuing to hold your ADRs, to agree to the amendment and to be bound by the agreement as amended. However, no amendment will impair your right to receive the deposited securities in exchange for your Sibanye ADRs.
HOW MAY THE DEPOSIT AGREEMENT BE TERMINATED?
BNYM will terminate the Deposit Agreement if Sibanye asks it to do so, in which case it must notify you at least 30 days before termination. BNYM may also terminate the agreement after notifying you if BNYM informs Sibanye that it would like to resign and Sibanye does not appoint a new depositary bank within 90 days.
If any Sibanye ADRs remain outstanding after termination, BNYM will stop registering the transfer of Sibanye ADRs, will stop distributing dividends to Sibanye ADR holders, and will not give any further notices or do anything else under the Deposit Agreement other than:
| · | | collect dividends and distributions on the deposited securities, sell rights and other property offered to holders of deposited securities; and deliver ordinary shares and other deposited securities upon cancellation of Sibanye’s ADRs. At any time after four months after termination of the Deposit Agreement, BNYM may sell any remaining deposited securities by public or private sale. After that, BNYM will hold the money it received on the sale, as well as any cash it is holding under the Deposit Agreement for the pro rata benefit of the Sibanye ADR holders that have not surrendered their Sibanye ADRs. It will not invest the money and has no liability for interest. BNYM’s only obligations will be to account for the money and cash. After termination, Sibanye’s only obligations will be with respect to indemnification of, and to pay specified amounts to, BNYM. |
LIMITATIONS ON OBLIGATIONS AND LIABILITY
The Deposit Agreement expressly limits the obligations of Sibanye and BNYM. It also limits the liability of Sibanye and BNYM. Sibanye and BNYM:
| · | | are only obligated to take the actions specifically set forth in the Deposit Agreement without negligence or bad faith; |
| · | | are not liable if either of them is prevented or delayed by law, any provision of the Sibanye by-laws or circumstances beyond their control from performing their obligations under the Deposit Agreement; |
| · | | are not liable if either of them exercises or fails to exercise discretion permitted under the Deposit Agreement; |
| · | | have no obligation to become involved in a lawsuit or proceeding related to the ADRs or the Deposit Agreement on your behalf or on behalf of any other party; and |
| · | | may rely upon any advice of or information from any legal counsel, accountants, any person depositing ordinary shares, any Sibanye ADR holder or any other person whom they believe in good faith is competent to give them that advice or information. |
In the Deposit Agreement, Sibanye and BNYM agree to indemnify each other under specified circumstances.
REQUIREMENTS FOR DEPOSITARY ACTIONS
Before BNYM will deliver or register the transfer of a Sibanye ADR, make a distribution on a Sibanye ADR, or permit withdrawal of ordinary shares, BNYM may require:
| · | | payment of taxes, including stock transfer taxes or other governmental charges, and transfer or registration fees charged by third parties for the transfer of any ordinary shares or other deposited securities, as well as the fees and expenses of BNYM; |
| · | | production of satisfactory proof of the identity of the person presenting ordinary shares for deposit or Sibanye ADRs upon withdrawal, and of the genuineness of any signature; and |
| · | | compliance with regulations BNYM may establish, consistent with the Deposit Agreement, including presentation of transfer documents. |
BNYM may refuse to deliver, transfer, or register transfer of Sibanye ADRs generally when the transfer books of BNYM are closed or at any time if BNYM or Sibanye thinks it advisable to do so.
YOUR RIGHT TO RECEIVE THE ORDINARY SHARES UNDERLYING YOUR ADRS
You have the right to cancel your Sibanye ADRs and withdraw the underlying ordinary shares at any time, except:
| · | | due to temporary delays caused by BNYM or Sibanye closing its transfer books, the transfer of ordinary shares being blocked in connection with voting at a shareholders’ meeting, or Sibanye paying dividends; |
| · | | when you or other ADR holders seeking to withdraw ordinary shares owe money to pay fees, taxes and similar charges; or |
| · | | when it is necessary to prohibit withdrawals in order to comply with any laws or governmental regulations that apply to Sibanye ADRs or to the withdrawal of ordinary shares or other deposited securities. |
This right of withdrawal may not be limited by any provision of the Deposit Agreement.
PRE-RELEASE OF SIBANYE ADRS
In certain circumstances, subject to the provisions of the Deposit Agreement, BNYM may deliver Sibanye ADRs before deposit of the underlying ordinary shares. This is called a pre-release of Sibanye ADRs. BNYM may also deliver ordinary shares prior to the receipt and cancellation of pre-released Sibanye ADRs (even if those Sibanye ADRs are cancelled before the pre-release transaction has been closed out). A pre-release is closed out as soon as the underlying ordinary shares are delivered to BNYM. BNYM may receive Sibanye ADRs instead of ordinary shares to close out a pre-release. BNYM may pre-release Sibanye ADRs only under the following conditions: (1) before or at the time of the pre-release, the person to whom the pre-release is being made must represent to BNYM in writing that it or its customer owns the ordinary shares or Sibanye ADRs to be deposited; (2) the pre-release must be fully collateralised with cash or collateral that BNYM considers appropriate; and (3) BNYM must be able to close out the pre-release on not more than five business days’ notice. The pre-release will be subject to whatever indemnities and credit regulations BNYM considers appropriate. In addition, BNYM will limit the number of Sibanye ADRs that may be outstanding at any time as a result of pre-release.
DIRECT REGISTRATION SYSTEM
In the Deposit Agreement, all parties to the Deposit Agreement acknowledge that the DRS and Profile Modification System (Profile) will apply to uncertificated ADSs upon acceptance thereof to DRS by DTC. DRS is the system administered by DTC pursuant to which the Depositary may register the ownership of uncertificated ADSs, which ownership shall be evidenced by periodic statements sent by the Depositary to the registered holders of uncertificated ADSs. Profile is a required feature of DRS which allows a DTC participant, claiming to act on behalf of a registered holder of ADSs, to direct the Depositary to register a transfer of those ADSs to DTC or its nominee and to deliver those ADSs to the DTC account of that DTC participant without receipt by the Depositary of prior authorisation from the ADS holder to register that transfer.
In connection with and in accordance with the arrangements and procedures relating to DRS/Profile, the parties to the Deposit Agreement understand that the Depositary will not verify, determine or otherwise ascertain that the DTC participant which is claiming to be acting on behalf of an ADS holder in requesting registration of transfer and delivery described in the paragraph above has the actual authority to act on behalf of the ADS holder (notwithstanding any requirements under the Uniform Commercial Code). In the Deposit Agreement, the parties agree that the Depositary’s reliance on and compliance with
instructions received by the Depositary through the DRS/Profile System and in accordance with the Deposit Agreement, shall not constitute negligence or bad faith on the part of the Depositary.
SHAREHOLDER COMMUNICATIONS; INSPECTION OF REGISTER OF HOLDERS OF ADSs
The Depositary will make available for your inspection at its office all communications that it receives from us as a holder of deposited securities that Sibanye makes generally available to holders of deposited securities. The Depositary will send you copies of those communications if Sibanye asks it to. You have a right to inspect the register of holders of ADSs, but not for the purpose of contacting those holders about a matter unrelated to our business or the ADSs.
GOVERNING LAW
The Deposit Agreement is governed by the law of the State of New York.
SOUTH AFRICAN EXCHANGE CONTROL LIMITATIONS AFFECTING SECURITY HOLDERS
The discussion below relates to exchange controls in force as of the date of this annual report. These controls are subject to change at any time without notice. It is not possible to predict whether existing exchange controls will be abolished, continued or amended by the South African government in the future. Investors are urged to consult a professional adviser as to the exchange control implications of their particular investments.
Acquisitions of shares or assets of South African companies by non-South African purchasers solely for a cash consideration equal to the fair value of the shares or assets will generally be permitted by the SARB pursuant to South African Exchange Control Regulations. An acquisition of shares or assets of a South African company by a non-South African purchaser may be refused by the SARB in other circumstances, such as if the consideration for the acquisition is shares in a non-South African company or if the acquisition is financed by a loan from a South African lender. Denial of SARB approval for an acquisition of shares or assets of a South African company may result in the transaction not being able to be completed. Subject to this limitation, there are no restrictions on equity investments in South African companies and a foreign investor may invest freely in the ordinary shares and ADRs of Sibanye.
There are no exchange control restrictions on the remittance in full of dividends declared out of trading profits to non-residents of the CMA by Sibanye, provided the share certificates held by non-resident Sibanye shareholders have been endorsed with the words “non-resident”. The same endorsement, however, will not be applicable to ADRs of Sibanye held by non-resident shareholders.
Under South African Exchange Control Regulations, the ordinary shares and ADRs representing ordinary shares of Sibanye are freely transferable outside South Africa between persons who are not residents of the CMA, provided such transfer is reported to the SARB and, where new share certificates are issued, such certificates are endorsed with the words “non-resident”. The same endorsement, however, will not be applicable to ADRs of Sibanye held by non-resident shareholders. Additionally, where ordinary shares are sold on the JSE on behalf of shareholders of Sibanye who are not residents of the Common Monetary Area, the proceeds of such sales will be freely exchangeable into foreign currency and remittable to them. In such case no share certificates need to be endorsed as the shares on the JSE have been dematerialised.
TAXATION
CERTAIN SOUTH AFRICAN TAX CONSIDERATIONS
The discussion in this section sets out the material South African tax consequences of the purchase, ownership and disposition of Sibanye’s ordinary shares or ADSs under current South African law. Changes in the law may alter the tax treatment of Sibanye’s ordinary shares or ADSs, possibly on a retroactive basis.
The following summary is not a comprehensive description of all of the tax considerations that may be relevant to a decision to purchase, own or dispose of Sibanye’s ordinary shares or ADSs and does not cover tax consequences that depend upon your particular tax circumstances. In particular, the following summary addresses tax consequences for holders of ordinary shares or ADSs who are not residents of, or who do not carry on business in, South Africa and who hold ordinary shares or ADSs as capital assets (that is, for investment purposes). For the purposes of the income tax treaty between South Africa and the United States and South African tax law, a United States resident that owns Sibanye ADSs will be treated as the owner of the Sibanye ordinary shares represented by such ADSs. Sibanye recommends that you consult your own tax adviser about the consequences of holding Sibanye’s ordinary shares or ADSs, as applicable, in your particular situation.
Withholding Tax on Dividends
It should be noted that the 15% withholding tax on dividends declared by South African resident companies to non-resident shareholders or non-resident ADS holders was introduced with effect from 1 April 2012. Generally, under the terms of the reciprocal tax treaty entered into between South Africa and the United States (the Treaty) the withholding tax on dividends will be reduced to 5% of the gross amount of the dividends if the beneficial owner of the shares is a company holding directly at least 10% of the voting stock of the company paying the dividends and to 15% of the gross amount of the dividends in all other cases.
Income Tax and Capital Gains Tax
Non-resident holders of ordinary shares or ADSs should not be subject to income or capital gains tax in South Africa with respect to the disposal of those ordinary shares or ADSs unless those ordinary shares or ADSs are attributable to a permanent
establishment of the non-resident in South Africa or where the non‑resident holds 20% or more of the ordinary shares or ADSs of which 80% or more of the market value of the ordinary shares or ADSs are directly or indirectly derived from immovable property (including prospecting and/or mining rights) located in South Africa.
As Sibanye operates in the mining sector, it is highly probable that 80% or more of the market value of the ordinary shares or ADSs are directly or indirectly derived from immovable property located in South Africa. In the instances where non-resident shareholders hold 20% or more of the ordinary shares or ADSs and dispose of the same, the purchaser of the ordinary shares or ADSs will be obliged to withhold a percentage (between 5% and 10%, depending on the nature of the seller) of the purchase consideration for the ordinary shares or ADSs payable to the non-resident shareholders and pay such amount over to the South African Revenue Service within 14 days where the purchaser is a South African resident or within 28 days where the purchaser is a non-resident. The taxing right of the capital gain could, however, be awarded to the specific jurisdiction of the seller (and not South Africa) depending on the wording and application of the applicable Double Taxation Treaty.
Securities Transfer Tax
No Securities Transfer Tax (STT) is payable in South Africa with respect to the issue of a security.
STT is charged at a rate of 0.25% on the taxable amount of the transfer of every security issued by a company or a close corporation incorporated in South Africa, or a company incorporated outside South Africa but listed on an exchange in South Africa, subject to certain exemptions.
The word “transfer” is broadly defined and includes the transfer, sale, assignment or cession or disposal in any other manner of a security. The cancellation or redemption of a security is also regarded as a transfer unless the company is being liquidated. However, the transfer of a security that does not result in a change in beneficial ownership is not regarded as a transfer.
STT is levied on the taxable amount of a security. The taxable amount of a listed security is the greater of the consideration given for the security declared by the transferee or the closing price of that security. The taxable amount of an unlisted security is the greater of the consideration given for the acquisition of the security or the market value of an unlisted security. In the case of a transfer of a listed security, either the member, the participant or the person to whom the security is transferred is liable for the tax. The tax must be paid by the 14th day of the month following the transfer. The liability for tax with respect to the transfer of listed securities lies with the party facilitating the transfer or the recipient of the security.
Interest withholding tax
Interest withholding tax has been introduced into the South African tax regime with effect from 1 March 2015. Although not specifically applicable to non-resident shareholders or non-resident ADS holders, interest withholding tax will be levied at a rate of 15% on any interest paid for the benefit of any foreign person to the extent that the interest is regarded as being from a source within South Africa. There is, however, a specific exemption from interest withholding tax on any interest incurred on a listed debt (i.e. debt listed on a recognised exchange). Any interest withholding tax may further be reduced by the applicable Double Taxation Treaty.
Davis Tax Committee
The Davis Tax Committee has been established to review the current South African mining tax regime and to consider input from the industry on practical elements not currently taken into account by the mining tax legislation. No update has been provided on the status of the outcome of the Davis Tax Committee’s investigations. This does not currently affect any non-resident shareholders or non-resident ADS holders, although it could have an indirect effect in future depending on the findings of the Davis Tax Committee and the impact thereof on the mining tax regime in South Africa.
US FEDERAL INCOME TAX CONSIDERATIONS
The following discussion summarises the material US federal income tax consequences of the acquisition, ownership and disposition of ordinary shares and ADRs by a US Holder. As used herein, the term “US Holder” means a beneficial owner of ordinary shares or ADRs that is for US federal income tax purposes:
| · | | a citizen or resident of the United States; |
| · | | a corporation created or organised under the laws of the United States or any state within the United States or the District of Columbia; |
| · | | an estate the income of which is subject to US federal income tax without regard to its source; or |
| · | | a trust if a court within the United States is able to exercise primary supervision over the administration of the trust and one or more US persons have the authority to control all substantial decisions of the trust, or the trust has validly elected to be treated as a domestic trust for US federal income tax purposes. |
This summary only applies to US Holders that hold ordinary shares or ADRs as capital assets. This summary is based upon:
| · | | the current federal income tax laws of the United States, including the Internal Revenue Code of 1986 as amended and regulations promulgated thereunder; |
| · | | current US Internal Revenue Service practice and applicable US court decisions; and |
| · | | the income tax treaty between the United States and South Africa. |
all as of the date hereof and all subject to change at any time, possibly with retroactive effect.
This summary assumes that the obligations of the Depositary under the Deposit Agreement and any related agreements will be performed in accordance with their terms.
This summary is of a general nature and does not address all US federal income tax consequences that may be relevant to you in light of your particular situation (including consequences under the alternative minimum tax or the net investment income tax), and does not address state, local, non-US or other tax laws (such as estate and gift tax laws). For example, this summary does not apply to:
| · | | investors that own (directly, indirectly or by attribution) 5% or more of Sibanye’s stock by vote or value; |
| · | | individual retirement accounts and other tax-deferred accounts; |
| · | | tax-exempt organisations; |
| · | | dealers in securities or currencies; |
| · | | investors that hold ordinary shares or ADRs as part of straddles, hedging transactions or conversion transactions for US federal income tax purposes; |
| · | | persons that have ceased to be US citizens or lawful permanent residents of the United States; |
| · | | investors holding the ordinary shares or ADRs in connection with a trade or business conducted outside the United States; |
| · | | US citizens or lawful permanent residents living abroad; or |
| · | | investors whose functional currency is not the US dollar. |
The US federal income tax treatment of a partner in an entity treated as a partnership for US federal income tax purposes that holds ordinary shares or ADRs will depend upon the status of the partner and the activities of the partnership. If you are an entity treated as a partnership for US federal income tax purposes, you should consult your tax adviser concerning the US federal income tax consequences to you and your partners of the acquisition, ownership and disposition of ordinary shares or ADRs by you.
Sibanye does not believe that it was a PFIC within the meaning of Section 1297 of the Code for its 2015 taxable year and does not expect to be a PFIC for its current taxable year or in the foreseeable future. However, Sibanye’s possible status as a PFIC must be determined annually and therefore may be subject to change. If Sibanye were to be treated as a PFIC, US Holders of ordinary shares or ADRs would be required (i) to pay a special US addition to tax on certain distributions and gains on sale and (ii) to pay tax on any gain from the sale of ordinary shares or ADRs at ordinary income (rather than capital gains) rates in addition to paying the special addition to tax on this gain. Additionally, dividends paid by Sibanye would not be eligible for the reduced rate of tax described below under “Taxation of Dividends”. The remainder of this discussion assumes that Sibanye is not a PFIC for US federal income tax purposes. You should consult your own tax advisers regarding the potential application of the PFIC regime.
The summary of US federal income tax consequences set out below is for general information only. You are urged to consult your tax advisers as to the particular tax consequences to you of acquiring, owning and disposing of the ordinary shares or ADRs, including your eligibility for the benefits of the treaty and the applicability and effect of state, local, non-US and other tax laws and possible changes in tax law.
US Holders of ADRS
For US federal income tax purposes, a US Holder of ADRs generally will be treated as the owner of the corresponding number of underlying ordinary shares held by the Depositary for the ADRs, and references to ordinary shares in the following discussion refer also to ADRs representing the ordinary shares.
Deposits and withdrawals of ordinary shares by US Holders in exchange for ADRs will not result in the realisation of gain or loss for US federal income tax purposes. Your tax basis in withdrawn ordinary shares will be the same as your tax basis in the ADRs surrendered, and your holding period for the ordinary shares will include the holding period of the ADRs.
Taxation of Dividends
Distributions paid out of Sibanye’s current or accumulated earnings and profits (as determined for US federal income tax purposes), before reduction for any South African withholding tax paid by Sibanye with respect thereto, will generally be taxable to you as foreign source dividend income, and will not be eligible for the dividends received deduction allowed to corporations. Distributions that exceed Sibanye’s current and accumulated earnings and profits will be treated as a non-taxable return of capital to the extent of your basis in the ordinary shares and thereafter as capital gain. However, we do not maintain calculations of our earnings and profits in accordance with US federal income tax accounting principles. You should therefore assume that any distribution by us with respect to the shares will be reported as ordinary dividend income. You should consult your own tax advisers with respect to the appropriate US federal income tax treatment of any distribution received from us. For purposes of determining limitations on any foreign tax credits, dividends paid by Sibanye will generally constitute “passive income”.
Dividends paid by Sibanye generally will be taxable to non-corporate US Holders at the reduced rate normally applicable to long-term capital gains, provided that either (i) Sibanye qualifies for the benefits of the income tax treaty between the United States and South Africa, or (ii) the ADRs are considered to be “readily tradable” on the NYSE, and certain other requirements are met.
For US federal income tax purposes, the amount of any dividend paid in Rand will be included in income in a US dollar amount calculated by reference to the exchange rate in effect on the date the dividends are received by you (in the case of ordinary shares) or the depositary (in the case of ADRs) regardless of whether they are converted into US dollars at that time. If you or the
Depositary, as the case may be, convert dividends received in Rand into US dollars on the day they are received, you generally will not be required to recognise foreign currency gain or loss in respect of this dividend income.
Effect of South African Withholding Taxes
As discussed in “Certain South African Tax Considerations—Withholding Tax on Dividends”, under current law, South Africa imposes a withholding tax of 15% on dividends paid by Sibanye. A US Holder will generally be entitled, subject to certain limitations, to a foreign tax credit against its US federal income tax liability, or a deduction in computing its US federal taxable income, for South African income taxes withheld by Sibanye.
US Holders that receive payments subject to this withholding tax will be treated, for US federal income tax purposes, as having received the amount of South African taxes withheld by Sibanye, and as then having paid over the withheld taxes to the South African taxing authorities. As a result of this rule, the amount of dividend income included in gross income for US federal income tax purposes by a US Holder with respect to a payment of dividends may be greater than the amount of cash actually received (or receivable) by the US Holder from Sibanye with respect to the payment.
The rules governing foreign tax credits are complex. You should consult your tax adviser concerning the foreign tax credit implications of the payment of South African withholding taxes.
Taxation of a Sale or Other Disposition
Your tax basis in an ordinary share will generally be its US dollar cost. The US dollar cost of an ordinary share purchased with foreign currency will generally be the US dollar value of the purchase price on the date of purchase or, in the case of ordinary shares traded on an established securities market, as defined in the applicable Treasury Regulations, that are purchased by a cash basis taxpayer (or an accrual basis taxpayer that so elects), on the settlement date for the purchase. Such an election by an accrual basis taxpayer must be applied consistently from year to year and cannot be revoked without the consent of the IRS.
Upon a sale or other disposition of ordinary shares or ADRs, other than an exchange of ADRs for ordinary shares and vice versa, you will generally recognise capital gain or loss for US federal income tax purposes equal to the difference between the amount realised and your adjusted tax basis in the ordinary shares or ADRs. This capital gain or loss will be long-term capital gain or loss if your holding period in the ordinary shares or ADRs exceeds one year. However, regardless of your actual holding period, any loss may be treated as long-term capital loss to the extent you receive a dividend that qualifies for the reduced rate described above under “Taxation of Dividends” and also exceeds 10% of your basis in the ordinary shares. Any gain or loss will generally be US source.
The amount realised on a sale or other disposition of ordinary shares for an amount in foreign currency will be the US dollar value of this amount on the date of sale or disposition. On the settlement date, you will recognise US source foreign currency gain or loss (taxable as ordinary income or loss) equal to the difference (if any) between the US dollar value of the amount received based on the exchange rates in effect on the date of sale or other disposition and the settlement date. However, in the case of ordinary shares traded on an established securities market that are sold by a cash basis taxpayer (or an accrual basis taxpayer that so elects), the amount realised will be based on the exchange rate in effect on the settlement date for the sale, and no exchange gain or loss will be recognised at that time.
Foreign currency received on the sale or other disposition of an ordinary share will have a tax basis equal to its US dollar value on the settlement date. Foreign currency that is purchased will generally have a tax basis equal to the US dollar value of the foreign currency on the date of purchase. Any gain or loss recognised on a sale or other disposition of a foreign currency (including its use to purchase ordinary shares or upon exchange for US dollars) will be US source ordinary income or loss.
To the extent you incur Securities Transfer Tax in connection with a transfer or withdrawal of ordinary shares as described under “—Certain South African Tax Considerations—Securities Transfer Tax” above, such securities transfer tax will not be a creditable tax for US foreign tax credit purposes.
Backup Withholding and Information Reporting
Payments of dividends and other proceeds with respect to ordinary shares or ADRs by US persons will be reported to you and to the IRS as may be required under applicable regulations. Backup withholding may apply to these payments if you fail to provide an accurate taxpayer identification number or certification of exempt status or fail to comply with applicable certification requirements. Some holders are not subject to backup withholding. You should consult your tax adviser about these rules and any other reporting obligations that may apply to the ownership or disposition of the ordinary shares or ADRs, including requirements related to the holding of certain foreign financial assets.
Documents on Display
Sibanye will also file annual and special reports and other information with the SEC. You may read and copy any reports or other information on file at the SEC’s public reference room at the following location:
100 F Street, N.E.
Washington, D.C. 20549
Please call the SEC at 1-800-SEC-0330 for further information on the public reference room. The SEC filings are also available to the public from commercial document retrieval services. Sibanye’s SEC filings may also be obtained electronically via the EDGAR system on the website maintained by the SEC at http://www.sec.gov.
The above information may also be obtained at the registered office of Sibanye and can be accessed at http://www.sibanyegold.co.za.
Subsidiary Information
Not applicable.
Refining and Marketing
Sibanye has appointed Rand Refinery Proprietary Limited (Rand Refinery) to refine all of Sibanye’s South African-produced gold. Rand Refinery is a private company in which Sibanye holds a 33.1% interest, with the remaining interests held by other South African gold producers. Since 1 October 2004, up to the Spin-off date, Gold Fields’ treasury department arranged the sale of all the gold production from Sibanye’s operations. As from the Spin-off, Rand Refinery advises Sibanye’s department of treasury (Treasury) on a daily basis of the amount of gold available for sale. Treasury, then sells the gold at a price benchmarked against the London afternoon fixing price. Two business days after the sale of gold, Sibanye deposits an amount in US dollars equal to the value of the gold at the London afternoon fixing price into Rand Refinery’s nominated US dollar account. Rand Refinery deducts refining charges payable by Sibanye relating to such amount of gold and deposits the balance of the proceeds into the nominated US dollar account of Sibanye.
Acquisitions
See “Annual Financial Report—Annual Financial Statements—Notes to the Consolidated Financial Statements—Note 12: Acquisitions” and “Annual Financial Report—Annual Financial Statements—Notes to the Consolidated Financial Statements—Note 31: Events After the Reporting Date”.
CONTROLS AND PROCEDURES
| (a) | | Disclosure Controls and Procedures: |
Sibanye has carried out an evaluation, under the supervision and with the participation of management, including the Chief Executive Officer and Chief Financial Officer of Sibanye, of the effectiveness of the design and operation of Sibanye’s disclosure controls and procedures (as defined in Exchange Act Rule 13a-15(e)) as of the end of the period covered by this annual report. Based upon that evaluation, Sibanye’s Chief Executive Officer and Chief Financial Officer concluded that, as of 31 December 2015, Sibanye’s disclosure controls and procedures were effective.
| (b) | | Management’s Report on Internal Control over Financial Reporting: |
Sibanye’s management is responsible for establishing and maintaining adequate internal control over financial reporting. The Securities Exchange Act of 1934 defines internal control over financial reporting in Rule 13a-15(f) and 15d-15(f) as a process designed by, or under the supervision of, the company’s principal executive and principal financial officers and effected by the company’s board of directors, management and other personnel, to provide reasonable assurance regarding the reliability of financial reporting and the preparation of financial statements for external purposes in accordance with generally accepted accounting principles and includes those policies and procedures that:
| · | | pertain to the maintenance of records that in reasonable detail accurately and fairly reflect the transactions and dispositions of the assets of the company; |
| · | | provide reasonable assurance that transactions are recorded as necessary to permit preparation of financial statements in accordance with generally accepted accounting principles, and that receipts and expenditures of the company are being made only in accordance with authorisations of management and directors of the company; and |
| · | | provide reasonable assurance regarding prevention or timely detection of unauthorised acquisition, use or disposition of the company’s assets that could have a material effect on the consolidated financial statements. |
Because of its inherent limitations, internal control over financial reporting may not prevent or detect misstatements. Also, projections of any evaluation of effectiveness to future periods are subject to risk that controls may become inadequate because of changes in conditions, or that the degree of compliance with the policies or procedures may deteriorate.
Sibanye’s management assessed the effectiveness of its internal control over financial reporting as of 31 December 2015. In making this assessment, Sibanye’s management used the criteria set forth in Internal Control - Integrated Framework (2013) issued by the Committee of Sponsoring Organizations of the Treadway Commission (COSO). Based upon its assessment, Sibanye’s management concluded that, as of 31 December 2015, its internal control over financial reporting is effective based upon those criteria.
KPMG Inc., an independent registered public accounting firm that audited the consolidated financial statements included in this annual report on Form 20-F, has issued an attestation report on the effectiveness of Sibanye’s internal control over financial reporting as of 31 December 2015.
| (c) | | Attestation Report of the Registered Public Accounting Firm: |
See Annual Financial Report–Accountability–Report of independent registered public accounting firm.
| (d) | | Changes in Internal Control Over Financial Reporting: |
There has been no change in Sibanye’s internal control over financial reporting that occurred during fiscal 2015 that has materially affected, or is reasonably likely to materially affect, Sibanye’s internal control over financial reporting.
EXHIBITS
The following instruments and documents are included as Exhibits to this annual report.
No. | | Exhibit |
1.1 | | Memorandum of Incorporation of Sibanye.1 |
2.1 | | Form of Deposit Agreement among Sibanye, BNYM, as depositary, and the owners and beneficial owners from time to time of ADRs.2 |
2.2 | | Form of ADR.2 |
2.3 | | The Sibanye 2013 Share Plan, adopted 21 November 2012.1 |
2.4 | | Trust Deed among Orogen, as issuer; Gold Fields, GFIMSA, GFO and GFH, as guarantors; and Citicorp Trustee Company Limited, as trustee, dated 7 October 2010 in relation to the Notes.1 |
4.1 | | R4.5 billion term and revolving credit facilities agreement between Bank of China Limited Johannesburg Branch, FirstRand Bank, ABSA Bank Limited, J.P. Morgan Chase Bank, N.A., Johannesburg Branch, Standard Bank, Nedbank, the Financial Institutions listed in Schedule 1, Opiconsivia Trading 305 (RF) Proprietary Limited and Sibanye dated 10 December 2013.3 |
4.2 | | First Addendum to the R4.5 billion term and revolving credit facilities agreement between Bank of China Limited Johannesburg Branch, FirstRand Bank, ABSA Bank Limited, J.P. Morgan Chase Bank, N.A., Johannesburg Branch, Standard Bank, Nedbank, the Financial Institutions listed in Schedule 1, Opiconsivia Trading 305 (RF) Proprietary Limited and Sibanye dated 13 March 2014.3 |
4.3 | | Second Addendum to the R4.5 billion term and revolving credit facilities agreement between Bank of China Limited Johannesburg Branch, FirstRand Bank, ABSA Bank Limited, J.P. Morgan Chase Bank, N.A., Johannesburg Branch, Standard Bank, Nedbank, the Financial Institutions listed in Schedule 1, Opiconsivia Trading 305 (RF) Proprietary Limited and Sibanye dated 12 May 2014.4 |
4.4 | | Third Addendum to the R4.5 billion term and revolving credit facilities agreement between Bank of China Limited Johannesburg Branch, FirstRand Bank, ABSA Bank Limited, J.P. Morgan Chase Bank, N.A., Johannesburg Branch, Standard Bank, Nedbank, the Financial Institutions listed in Schedule 1, Opiconsivia Trading 305 (RF) Proprietary Limited and Sibanye dated 22 July 2014.4 |
4.5 | | Fourth Addendum to the R4.5 billion term and revolving credit facilities agreement between Bank of China Limited Johannesburg Branch, FirstRand Bank, ABSA Bank Limited, J.P. Morgan Chase Bank, N.A., Johannesburg Branch, Standard Bank, Nedbank, the Financial Institutions listed in Schedule 1, Opiconsivia Trading 305 (RF) Proprietary Limited and Sibanye dated 14 August 2014.4 |
4.6 | | Fifth Addendum to the R4.5 billion term and revolving credit facilities agreement between Bank of China Limited Johannesburg Branch, FirstRand Bank, ABSA Bank Limited, J.P. Morgan Chase Bank, N.A., Johannesburg Branch, Standard Bank, Nedbank, the Financial Institutions listed in Schedule 1, Opiconsivia Trading 305 (RF) Proprietary Limited and Sibanye dated 6 October 2014.4 |
4.7 | | Amended and Restatement Agreement of the R4.5 billion term and revolving credit facilities agreement between Bank of China Limited Johannesburg Branch, FirstRand Bank, ABSA Bank Limited, J.P. Morgan Chase Bank, N.A., Johannesburg Branch, Standard Bank, Nedbank, the Financial Institutions listed in Schedule 1, Opiconsivia Trading 305 (RF) Proprietary Limited and Sibanye dated 6 October 2015. |
4.8 | | Cession and Pledge in Security by Sibanye Gold Limited (as Pledgor) in favor of Opiconsivia Trading 305 Proprietary Limited (as Debt Guarantor), dated 22 August 2013.3 |
4.9 | | Addendum to the Cession and Pledge in Security by Sibanye Gold Limited (as Pledgor) in favor of Opiconsivia Trading 305 Proprietary Limited (as Debt Guarantor), dated 10 December 2013.3 |
4.10 | | Cession in Security by Sibanye Gold Limited (as Pledgor) in favor of Opiconsivia Trading 305 Proprietary Limited (as Debt Guarantor), dated 22 August 2013.3 |
4.11 | | Cession in Security by Sibanye Gold Limited (as Pledgor) in favor of Opiconsivia Trading 305 Proprietary Limited (as Debt Guarantor), dated 22 October 2013.3 |
4.12 | | Cession in Security by Sibanye Gold Limited (as Pledgor) in favor of Opiconsivia Trading 305 Proprietary Limited (as Debt Guarantor), dated 15 August 2014.4 |
4.13 | | Notorial General Bond by Sibanye Gold Limited in favor of Opiconsivia Trading 305 Proprietary Limited (as Debt Guarantor), registered 24 October 2013.3 |
4.14 | | Merger Agreement between Sibanye, Gold One International Limited, and Newshelf 1114 Proprietary Limited dated 20 August 2013.3 |
4.15 | | First Addendum to the Merger Agreement between Sibanye, Gold One International Limited, and Newshelf 1114 Proprietary Limited dated 26 September 2013.3 |
4.16 | | Second Addendum to the Merger Agreement between Sibanye, Gold One International Limited, and Newshelf 1114 Proprietary Limited dated 17 February 2014.3 |
No. | | Exhibit |
4.17 | | Third Addendum to the Merger Agreement between Sibanye, Gold One International Limited, and Newshelf 1114 Proprietary Limited dated 24 March 2014.3 |
4.18 | | Fourth Addendum to the Merger Agreement between Sibanye, Gold One International Limited, and Newshelf 1114 Proprietary Limited dated 30 April 2014.4 |
4.19 | | Fifth Addendum to the Merger Agreement between Sibanye, Gold One International Limited, and Newshelf 1114 Proprietary Limited dated 6 May 2014.4 |
4.20 | | Sixth Addendum to the Merger Agreement between Sibanye, Gold One International Limited, and Newshelf 1114 Proprietary Limited dated 15 May 2014.4 |
4.21 | | Indemnity Agreement among Orogen, Gold Fields, GFO, GFH and Sibanye, in respect of Sibanye’s obligations under the Notes, dated 20 December 2012.1 |
4.22 | | Cession in Security Agreement among Sibanye, ABSA Bank Limited, Nedbank, Standard Bank, FirstRand Bank and JP Morgan Chase Bank, N.A., Johannesburg Branch, dated 20 December 2012.1 |
4.23 | | Agreement between Neal Froneman and Sibanye, dated 7 December 2012.1 |
4.24 | | Agreement between Charl Keyter and Sibanye, dated 7 December 2012.1 |
4.25 | | Term Loan Facility Agreement between SGEO (previously Southgold Exploration Proprietary Limited), the Financial Institutions listed in Schedule 1, Credit Suisse AG, Standard Chartered Bank and Purple Rain Security SPV (RF) Proprietary Limited, dated 17 April 2014.4 |
4.26 | | First Amendment to the Term Loan Facility Agreement between SGEO (previously Southgold Exploration Proprietary Limited), the Financial Institutions listed in Schedule 1, Credit Suisse AG, Standard Chartered Bank and Purple Rain Security SPV (RF) Proprietary Limited, dated 26 June 2014.4 |
4.27 | | Second Amendment to the Term Loan Facility Agreement between SGEO (previously Southgold Exploration Proprietary Limited), the Financial Institutions listed in Schedule 1, Credit Suisse AG, Standard Chartered Bank and Purple Rain Security SPV (RF) Proprietary Limited, dated 1 July 2014.4 |
4.28 | | Third Amendment to the Term Loan Facility Agreement between SGEO (previously Southgold Exploration Proprietary Limited), the Financial Institutions listed in Schedule 1, Credit Suisse AG, Standard Chartered Bank and Purple Rain Security SPV (RF) Proprietary Limited, dated 8 July 2014.4 |
4.29 | | Cession and Pledge in Security amongst Witwatersrand Consolidated Gold Resources Limited, K2013164354 Proprietary Limited and Purple Rain Security SPV (RF) Proprietary Limited, dated 2 April 2014.4 |
4.30 | | Cession in Security by SGEO (previously Southgold Exploration Proprietary Limited) in favour of Purple Rain Security SPV (RF) Proprietary Limited, dated 2 April 2014.4 |
4.31 | | Sale and Purchase Agreement between Rustenburg Platinum Mines Limited, Sibanye Rustenburg Platinum Mines Proprietary Limited and Sibanye Gold Limited, signed on 8 September 2015. Confidential portions of this exhibit have been omitted pursuant to a request for confidential treatment and filed separately with the SEC. |
4.32 | | Implementation Agreement between Sibanye Gold Limited and Sibanye Platinum Bermuda Proprietary Limited and Aquarius Platinum Limited, signed on 6 October 2015. |
4.33 | | Revolving Facility Agreement between Sibanye Gold Limited, Bank of America Merrill Lynch International Limited and HSBC Bank plc, dated 24 August 2015. |
4.34 | | $350 million Bridge Facility Agreement between Sibanye Gold Limited and HSBC Bank plc, dated 5 October 2015. |
8.1 | | List of subsidiaries of the registrant. |
12.1 | | Certification of Chief Executive Officer. |
12.2 | | Certification of Chief Financial Officer. |
13.1 | | Certification of Chief Executive Officer. |
13.2 | | Certification of Chief Financial Officer. |
1 Filed as an exhibit to the registration statement on Form 20-F (File No. 001-35785), filed by Sibanye with the Securities and Exchange Commission on 16 January 2013.
2 Filed as an exhibit to the registration statement on Form 20-F (File No. 001-35785), filed by Sibanye with the Securities and Exchange Commission on 1 February 2013.
3 Filed as an exhibit to the annual report on Form 20-F (File No. 001-35785), filed by Sibanye with the Securities and Exchange Commission on 29 April 2014.
4 Filed as an exhibit to the annual report on Form 20-F (File No. 001-35785), filed by Sibanye with the Securities and Exchange Commission on 24 March 2015.
SIGNATURES
The registrant hereby certifies that it meets all of the requirements for filing on Form 20-F and that it has duly caused and authorised the undersigned to sign this annual report on its behalf.
SIBANYE GOLD LIMITED | | |
| | |
/s/ Neal J. Froneman | | |
Name: | Neal J. Froneman | | |
Title: | Chief Executive Officer | | |
Date: | 21 March 2016 | | |