As filed with the Securities and Exchange Commission on 6 April 2017
UNITED STATES
SECURITIES AND EXCHANGE COMMISSION
Washington, D.C. 20549
Form 20-F
(Mark One)
☐REGISTRATION STATEMENT PURSUANT TO SECTION 12(b) OR 12(g) OF THE SECURITIES EXCHANGE ACT OF 1934
or
☒ ANNUAL REPORT PURSUANT TO SECTION 13 OR 15(d) OF THE SECURITIES EXCHANGE ACT OF 1934
For the fiscal year ended 31 December 2016
or
☐TRANSITION REPORT PURSUANT TO SECTION 13 OR 15(d) OF THE SECURITIES EXCHANGE ACT OF 1934
For the transition period from to
or
☐SHELL COMPANY REPORT PURSUANT TO SECTION 13 OR 15(d) OF THE SECURITIES EXCHANGE ACT OF 1934
Date of event requiring this shell company report
For the transition period from to
Commission file number: 001-35785
Sibanye Gold Limited
(Exact name of registrant as specified in its charter)
Republic of South Africa
(Jurisdiction of incorporation or organization)
Libanon Business Park
1 Hospital Street (off Cedar Avenue)
Libanon, Westonaria, 1780
South Africa.
011-27-11-278-9600
(Address of principal executive offices)
With copies to:
Charl Keyter
Chief Financial Officer
Sibanye Gold Limited
Tel: 011-27-11-278-9700
Fax: 011-27-11-278-9863
Libanon Business Park
1 Hospital Street (off Cedar Avenue)
Libanon, Westonaria, 1780
South Africa
(Name, Telephone, E-mail and/or Facsimile number and Address of Company Contact Person)
and
Thomas B. Shropshire, Jr.
Linklaters LLP
Tel: 011-44-20-7456-3223
Fax: 011-44-20-7456-2222
One Silk Street
London EC2Y 8HQ
United Kingdom
Securities registered or to be registered pursuant to Section 12(b) of the Act
| | |
Title of Each Class
Ordinary shares of no par value each
American Depositary Shares, each representing four ordinary shares | Name of Each Exchange on Which Registered
New York Stock Exchange*
New York Stock Exchange |
*Not for trading, but only in connection with the registration of the American Depositary Shares pursuant to the requirements of the Securities and Exchange Commission. Securities registered or to be registered pursuant to Section 12(g) of the Act None (Title of Class) Securities for which there is a reporting obligation pursuant to Section 15(d) of the Act None (Title of Class) Indicate the number of outstanding shares of each of the issuer’s classes of capital or common stock
as of the close of the period covered by the Annual Report 929,004,342 ordinary shares of no par value each |
Indicate by check mark if the registrant is a well-known seasoned issuer, as defined in Rule 405 of the Securities Act: Yes ☒ No If this report is an annual or transition report, indicate by check mark if the registrant is not required to file reports pursuant to Section 13 or 15(d) of the Securities Exchange Act of 1934. Yes No ☒ Note – Checking the box above will not relieve any registrant required to file reports pursuant to Section 13 or 15(d) of the Securities Exchange Act of 1934 from their obligations under those Sections. Indicate by check mark whether the registrant (1) has filed all reports required to be filed by Section 13 or 15(d) of the Securities Exchange Act of 1934 during the preceding 12 months (or for such shorter period that the registrant was required to file such reports), and (2) has been subject to such filing requirements for the past 90 days. ☒ Yes No Indicate by check mark whether the registrant has submitted electronically and posted on its corporate Web site, if any, every Interactive Data File required to be submitted and posted pursuant to Rule 405 of Regulation S-T (§232.405 of this chapter) during the preceding 12 months (or for such shorter period that the registrant was required to submit and post such files)*. Yes No Indicate by check mark whether the registrant is a large accelerated filer, an accelerated filer, or a non-accelerated filer. See definition of “accelerated filer and large accelerated filer” in Rule 12b-2 of the Exchange Act. (Check one): Large accelerated filer ☒Accelerated filer Non-accelerated filer Indicate by check mark which basis of accounting the registrant has used to prepare the financial statements included in this filing: |
US GAAP | International Financial Reporting Standards as issued by the International Accounting Standards Board ☒ | Other |
If “Other” has been checked in response to the previous question, indicate by check mark which financial statement item the registrant has elected to follow: Item 17 Item 18 If this is an annual report, indicate by check mark whether the registrant is a shell company (as defined in Rule 12b-2 of the Exchange Act). Yes No ☒ (APPLICABLE ONLY TO ISSUERS INVOLVED IN BANKRUPTCY PROCEEDINGS DURING THE PAST FIVE YEARS) Indicate by check mark whether the registrant has filed all documents and reports required to be filed by Sections 12, 13 or 15(d) of the Securities Exchange Act of 1934 subsequent to the distribution of securities under a plan confirmed by a court. Yes No |
* This requirement does not apply to the registrant
FORM 20-F CROSS REFERENCE GUIDE
| | | | | | |
Item | | Form 20-F Caption | | Location in this document | | Page |
1 | | Identity of directors, senior management and advisers | | NA | | NA |
2 | | Offer statistics and expected timetable | | NA | | NA |
3 | | Key information | | | | |
| | (a) Selected financial data | | Annual Financial Report—Overview—Five-year financial performance | | 77-79 |
| | (b) Capitalisation and indebtedness | | NA | | NA |
| | (c) Reasons for the offer | | NA | | NA |
| | (d) Risk factors | | Further Information—Risk factors | | 176-190 |
4 | | Information on the Company | | | | |
| | (a) History and development of the Company | | Annual Financial Report—Administrative details—Administrative and corporate information | | 175 |
| | | | Integrated Annual Report—Introduction—Group profile | | 14-15 |
| | | | Integrated Annual Report—View from the top—Perspective from the Chair | | 18-19 |
| | | | Integrated Annual Report—View from the top—Chief Executive’s review | | 20-22 |
| | | | Integrated Annual Report—View from the top—CFO’s report | | 23 |
| | | | Annual Financial Report—Accountability—Directors’ report | | 112-116 |
| | | | Integrated Annual Report—View from the top—Material risks and opportunities—Stillwater Transaction | | 30 |
| | | | Integrated Annual Report—Performance review—Creating value from operations, projects and technology—Establishing the Platinum Division | | 35 |
| | | | Annual Financial Report—Overview—Five-year financial performance | | 77-79 |
| | | | Annual Financial Report—Overview—Management’s discussion and analysis of the financial statements—Recent platinum acquisitions | | 82-83 |
| | | | Annual Financial Report—Annual financial statements—Notes to the consolidated financial statements—Note 12: Acquisitions | | 147-149 |
| | (b) Business overview | | Integrated Annual Report—Introduction—Group profile | | 14-15 |
| | | | Integrated Annual Report—View from the top—Material risks and opportunities | | 24-33 |
| | | | Annual Financial Report—Overview—Five-year financial performance | | 77-79 |
| | | | Integrated Annual Report—Performance review—Health and safety focus | | 50-59 |
| | | | Integrated Annual Report—Performance review—Social upliftment and community development | | 60-64 |
| | | | Further Information—Environmental and regulatory matters | | 199-203 |
| | | | | | |
Item | | Form 20-F Caption | | Location in this document | | Page |
| | (c) Organisational structure | | Integrated Annual Report—Introduction—Group profile | | 14-15 |
| | | | Annual Financial Report—Annual financial statements—Notes to the consolidated financial statements—Note 1.3: Consolidation | | 126-127 |
| | (d) Property, plant and equipment | | Integrated Annual Report—Performance overview—Creating value from operations, projects and technology | | 34-41 |
| | | | Further Information—Reserves of Sibanye as of 31 December 2016 | | 191-198 |
| | | | Further Information—Environmental and regulatory matters | | 199-203 |
| | | | Annual Financial Report—Annual financial statements—Notes to the consolidated financial statements—Note 11: Property, plant and equipment | | 143-146 |
4A | | Unresolved staff comments | | NA | | NA |
5 | | Operating and financial review and prospects | | | | |
| | (a) Operating results | | Annual Financial Report—Overview—Management’s discussion and analysis of the financial statements | | 80-93 |
| | | | Annual Financial Report—Annual financial statements—Consolidated income statement | | 119 |
| | | | Annual Financial Report—Annual financial statements—Consolidated statement of financial position | | 120 |
| | | | Annual Financial Report—Annual financial statements—Consolidated statement of cash flows | | 122 |
| | (b) Liquidity and capital resources | | Annual Financial Report—Overview—Management’s discussion and analysis of the financial statements—Liquidity and capital resources | | 91-92 |
| | (c) Research and development, patents and licences, etc. | | NA | | NA |
| | (d) Trend information | | Annual Financial Report—Overview—Management’s discussion and analysis of the financial statements | | 80-93 |
| | (e) Off-balance sheet arrangements | | Annual Financial Report—Overview—Management’s discussion and analysis of the financial statements—Off balance sheet arrangements and contractual commitments | | 93 |
| | (f) Tabular disclosure of contractual obligations | | Annual Financial Report—Overview—Management’s discussion and analysis of the financial statements—Off balance sheet arrangements and contractual commitments | | 93 |
| | (g) Safe harbour | | Forward-looking statements | | 9 |
6 | | Directors, senior management and employees | | | | |
| | (a) Directors and senior management | | Annual Financial Report—Accountability—Board and executive committee | | 104-109 |
| | (b) Compensation | | Integrated Annual Report—Leadership and governance—Remuneration report | | 72-75 |
| | | | | | |
Item | | Form 20-F Caption | | Location in this document | | Page |
| | | | Annual Financial Report—Annual financial statements—Notes to the consolidated financial statements—Note 32: Related-party transactions | | 170-172 |
| | (c) Board practices | | Annual Financial Report—Accountability—Corporate governance report—Board—Rotation and retirement from the Board | | 97 |
| | | | Integrated Annual Report—Leadership and governance—Remuneration report—Executive directors’ contracts of employment | | 75 |
| | | | Annual Financial Report—Accountability—Corporate governance report—Board sub-committees—Audit Committee | | 99 |
| | | | Annual Financial Report—Accountability—Corporate governance report—Board sub-committees—Remuneration Committee | | 101 |
| | (d) Employees | | Integrated Annual Report—Performance overview—Superior value for the workforce | | 42-49 |
| | (e) Share ownership | | Annual Financial Report—Annual financial statements—Notes to the consolidated financial statements—Note 32: Related-party transactions | | 170-172 |
| | | | Annual Financial Report—Annual financial statements—Notes to the consolidated financial statements—Note 6: Share-based payments | | 133-138 |
7 | | Major Shareholders and Related Party Transactions | | | | |
| | (a) Major shareholders | | Annual Financial Report—Administrative details—Shareholders ownership | | 173-174 |
| | | | Integrated Annual Report—Introduction—Group profile | | 14 |
| | | | Further Information—The listing | | 205-206 |
| | (b) Related party transactions | | Annual Financial Report—Accountability—Directors’ report—Directors’ and officers’ disclosure of interests in contracts | | 112 |
| | | | Annual Financial Report—Annual financial statements—Notes to the consolidated financial statements—Note 32: Related-party transactions | | 170-172 |
| | (c) Interests of experts and counsel | | NA | | NA |
8 | | Financial information | | | | |
| | (a) Consolidated statements and other financial information | | Annual Financial Report—Overview—Management’s discussion and analysis of the financial statements | | 80-93 |
| | | | Annual Financial Report—Annual financial statements—Consolidated income statement | | 119 |
| | | | Annual Financial Report—Annual financial statements—Consolidated statement of other comprehensive income | | 119 |
| | | | Annual Financial Report—Annual financial statements—Consolidated statement of financial position | | 120 |
| | | | | | |
Item | | Form 20-F Caption | | Location in this document | | Page |
| | | | Annual Financial Report—Annual financial statements—Consolidated statement of changes in equity | | 121 |
| | | | Annual Financial Report—Annual financial statements—Consolidated statement of cash flows | | 122 |
| | | | Annual Financial Report—Annual financial statements—Notes to the consolidated financial statements | | 123-172 |
| | | | Annual Financial Report—Accountability—Directors’ report—Financial affairs—Dividend policy | | 112 |
| | | | Further Information—Additional information—Dividend policy and dividend distributions | | 204 |
| | (b) Significant changes | | NA | | NA |
9 | | The Offer and listing | | | | |
| | (a) Listing details | | Further Information—The listing | | 205-206 |
| | (b) Plan of distribution | | NA | | NA |
| | (c) Markets | | Further Information—The listing | | 205-206 |
| | (d) Selling shareholders | | NA | | NA |
| | (e) Dilution | | NA | | NA |
| | (f) Expenses of the issue | | NA | | NA |
10 | | Additional information | | | | |
| | (a) Share capital | | NA | | NA |
| | (b) Memorandum and articles of association | | Further Information—Additional information—Memorandum of Incorporation | | 207 |
| | (c) Material contracts | | Further Information—Additional information—Material contracts | | 207 |
| | (d) Exchange controls | | Further Information—Additional information—South African Exchange Control limitations affecting Security holders | | 212 |
| | | | Further Information—Environmental and regulatory matters—Exchange Controls | | 203 |
| | (e) Taxation | | Further Information—Additional information—Taxation | | 212-216 |
| | (f) Dividends and paying agents | | NA | | NA |
| | (g) Statement by experts | | NA | | NA |
| | (h) Documents on display | | Further Information—Additional information—Documents on display | | 216 |
| | (i) Subsidiary information | | NA | | NA |
11 | | Quantitative and qualitative disclosures about market risk | | Annual Financial Report—Annual financial statements—Notes to the consolidated financial statements—Note 29.2: Risk management activities | | 165-168 |
12 | | Description of securities other than equity securities | | | | |
| | (a) Debt securities | | NA | | NA |
| | (b) Warrants and rights | | NA | | NA |
| | (c) Other securities | | NA | | NA |
| | (d) American depositary shares | | Further Information—Additional information—American depositary shares | | 207-212 |
13 | | Defaults, dividend arrearages and delinquencies | | NA | | NA |
| | | | | | |
Item | | Form 20-F Caption | | Location in this document | | Page |
14 | | Material modifications to the rights of security holders and use of proceeds | | NA | | NA |
15 | | Controls and procedures | | Further Information—Controls and procedures | | 218 |
16A | | Audit Committee financial expert | | Annual Financial Report—Accountability—Corporate governance report—Board sub-committees—Audit Committee | | 99 |
16B | | Code of ethics | | Annual Financial Report—Accountability—Corporate governance report—Code of ethics | | 103 |
16C | | Principal accountant fees and services | | Annual Financial Report—Accountability—Report of the Audit Committee | | 110-111 |
16D | | Exemptions from the listing standards for audit committees | | NA | | NA |
16E | | Purchase of equity securities by the issuer and affiliated purchasers | | None | | |
16F | | Change in registrant’s certifying accountant | | NA | | NA |
16G | | Corporate governance | | Annual Financial Report—Accountability—Corporate governance report—JSE corporate governance practices compared with NYSE Listing Standards | | 103 |
16H | | Mine safety disclosure | | NA | | NA |
17 | | Financial statements | | NA | | NA |
18 | | Financial statements | | Financial Information—Report of independent registered public accounting firm | | 118 |
| | | | Annual Financial Report—Annual financial statements—Consolidated income statement | | 119 |
| | | | Annual Financial Report—Annual financial statements—Consolidated statement of other comprehensive income | | 119 |
| | | | Annual Financial Report—Annual financial statements—Consolidated statement of financial position | | 120 |
| | | | Annual Financial Report—Annual financial statements—Consolidated statement of changes in equity | | 121 |
| | | | Annual Financial Report—Annual financial statements—Consolidated statement of cash flows | | 122 |
| | | | Annual Financial Report—Annual financial statements—Notes to the consolidated financial statements | | 123-172 |
19 | | Exhibits | | Exhibits | | 219-220 |
PRESENTATION OF FINANCIAL AND OTHER INFORMATION
Historical Consolidated Financial Statements
Sibanye Gold Limited (Sibanye) is a South African domiciled mining company, which currently owns and operates gold and uranium operations and projects throughout the Witwatersrand Basin in South Africa, as well as platinum group metal (PGM) operations in the Bushveld Igneous Complex in South Africa and the Great Dyke in Zimbabwe. See “Annual Financial Report—Overview—Management’s discussion and analysis of financial statements—Recent platinum acquisitions”. Accordingly, our books of account are maintained in South African Rand and our annual financial statements are prepared in accordance with International Financial Reporting Standards (IFRS), as issued by the International Accounting Standards Board, as prescribed by law. These financial statements are distributed to shareholders and are submitted to the Johannesburg Stock Exchange (JSE) and the New York Stock Exchange (NYSE).
The consolidated financial statements of Sibanye as at and for the fiscal years ended 31 December 2016, 2015 and 2014 (the Consolidated Financial Statements) have been prepared using the historical results of operations, assets and liabilities attributable to Sibanye and all of its subsidiaries (the Sibanye Group, or the Group). The Consolidated Financial Statements have been prepared under the historical cost convention, except for financial assets and financial liabilities (including derivative financial instruments), which are measured at fair value through profit or loss or through the fair value adjustment reserve in equity.
Non-IFRS Measures
The financial information in this annual report includes certain measures that are not defined by IFRS, including “operating costs”, “operating margin,”, “earnings before interest, tax, depreciation and amortisation” (EBITDA), “total cash cost”, “All-in sustaining cost”, “All-in cost”, “All-in cost margin”, “headline earnings per share”, “free cash flow” and “net debt” (each as defined below or in “Annual Financial Report—Overview—Five-year financial performance”. These measures are not measures of financial performance or cash flows under IFRS and may not be comparable to similarly titled measures of other companies. These measures have been included for the reasons described below or in “Annual Financial Report—Overview—Five-year financial performance” and should not be considered by investors as alternatives to costs of sales, net operating profit, profit before taxation, cash from operating activities or any other measure of financial performance presented in accordance with IFRS.
Operating costs is defined as cost of sales excluding amortisation and depreciation. Operating margin is defined as revenue minus operating costs, divided by revenue. Free cash flow is defined as cash flows from operating activities before dividends paid, less additions to property, plant and equipment. Management considers free cash flow to be an indicator of cash available for repaying debt, funding exploration and paying dividends.
See “Annual Financial Report—Overview—Five-year financial performance—Footnote 1”, “Annual Financial Report—Overview—Five-year financial performance—Footnote 2”, “Annual Financial Report—Overview—Five-year financial performance—Footnote 3”, “Annual Financial Report—Overview—Five-year financial performance—Footnote 6” and “Annual Financial Report—Overview—Five-year financial performance—Footnote 7” for more information.
Conversion Rates
Certain information in this annual report presented in Rand has been translated into US dollars. Unless otherwise stated, the conversion rate for these translations is R13.69/US$1.00 which was the closing rate on 31 December 2016. By including the US dollar equivalents, Sibanye is not representing that the Rand amounts actually represent the US dollar amounts shown or that these amounts could be converted into US dollars at the rates indicated.
The Acquisitions of the Rustenburg Operations and Aquarius
On 9 September 2015, Sibanye announced that it entered into an agreement with Rustenburg Platinum Mines Limited (RPM), a wholly owned subsidiary of Anglo American Platinum Limited (Anglo American Platinum) to acquire the Bathopele, Siphumelele (including Khomanani), and Thembelani (including Khuseleka) mining operations, two concentrating plants, an on-site chrome recovery plant, the Western Limb Tailings Retreatment Plant, associated surface infrastructure and related assets and liabilities on a going concern basis (the Rustenburg Operations) (the Rustenburg Operations Transaction). On 19 October 2016, Sibanye obtained consent in terms of section 11 of the Mineral and Petroleum Resources Development Act for the transfer of the mining right and prospecting right pursuant to the Rustenburg Operations Transaction, and control of the Rustenburg Operations on this date. The effective date of the implementation of the transaction was 1 November 2016, when Sibanye took over legal ownership and management of the Rustenburg Operations.
On 6 October 2015, Sibanye announced a cash offer of US$0.195 per share for the entire issued share capital of Aquarius Platinum Limited (Aquarius) (the Aquarius Transaction and, together with the Rustenburg Operations Transaction, the Acquisitions). Aquarius owns stakes in the Kroondal mine and Platinum Mile retreatment facilities near Rustenburg in South Africa and the Mimosa joint venture with Impala Platinum in Zimbabwe. The Aquarius Transaction was subject to the fulfilment of various conditions precedent which were completed on 12 April 2016, when Sibanye paid R4,301.5 million to the Aquarius shareholders and obtained control of Aquarius.
market information
This annual report includes industry data about Sibanye’s markets obtained from industry surveys, industry publications, market research and other publicly available third-party information. Industry surveys and industry publications generally state that the information they contain has been obtained from sources believed to be reliable but that the accuracy and completeness of such information is not guaranteed. Sibanye and its advisers have not independently verified this data.
In addition, in many cases statements in this annual report regarding the gold mining industry and Sibanye’s position in that industry have been made based on internal surveys, industry forecasts, market research, as well as Sibanye’s own experiences. While these statements are believed by Sibanye to be reliable, they have not been independently verified.
DEFINED TERMS AND CONVENTIONS
In this annual report, all references to “we”, “us” and “our” refer to Sibanye and the Sibanye Gold Group, as applicable.
In this annual report, all references to “fiscal 2017” and “2017” are to the fiscal year ending 31 December 2017, all references to “fiscal 2016” and “2016” are to the audited fiscal year ended 31 December 2016, all references to “fiscal 2015” and “2015” are to the audited fiscal year ended 31 December 2015 and all references to “fiscal 2014” and “2014” are to the audited fiscal year ended 31 December 2014.
In this annual report, all references to “South Africa” are to the Republic of South Africa, all references to the “United States” and “US” are to the United States of America, its territories and possessions and any state of the United States and the District of Columbia, all references to the “United Kingdom” and “UK” are to the United Kingdom of Great Britain and Northern Ireland and all references to “Zimbabwe” are to the Republic of Zimbabwe.
In this annual report, all references to the “DMR” are references to the South African Department of Mineral Resources, the government body responsible for regulating the mining industry in South Africa.
This annual report contains descriptions of gold mining and the gold mining industry, including descriptions of geological formations and mining proceeds. In order to facilitate a better understanding of these descriptions, this annual report contains a glossary defining a number of technical and geological terms.
In this annual report, gold production figures are provided in kilograms, which are referred to as “kg”, or in troy ounces, which are referred as “ounces” or “oz”. Ore grades are provided in grams per metric ton, which are referred to as “grams per ton” or “g/t.” All references to “tons”, “tonnes” or “t” in this annual report are to metric tons.
In this annual report, “R”, “Rand” and “rand” refer to the South African Rand and “Rand cents” and “SA cents” refers to subunits of the South African Rand, “$”, “US$”, “US dollars” and “dollars” refer to United States dollars and “US cents” refers to subunits of the US dollar, “£”, “GBP” and “pounds sterling” refer to British pounds and “pence” refers to the subunits of the British pound.
FORWARD-LOOKING STATEMENTS
This annual report contains forward-looking statements within the meaning of Section 27A of the Securities Act and Section 21E of the US Securities Exchange Act of 1934, as amended (the Exchange Act) with respect to our financial condition, results of operations, business strategies, operating efficiencies, competitive position, growth opportunities for existing services, plans and objectives of management, markets for stock and other matters.
These forward-looking statements, including, among others, those relating to our future business prospects, revenues and income, the potential benefit of the Acquisitions (including statements regarding growth, cost savings, benefits from and access to international financing and financial re-ratings), PGM pricing expectations, levels of output, supply and demand, information relating to the Stillwater's underground Blitz PGM project adjacent to the east of the existing Stillwater Mine designed to explore, define and extract the PGM resource along the far eastern extent of the J-M Reef (Blitz Project), and estimations or expectations of enterprise value, EBITDA and net asset values wherever they may occur in this annual report and the exhibits to this annual report, are necessarily estimates reflecting the best judgement of our senior management and involve a number of risks and uncertainties that could cause actual results to differ materially from those suggested by the forward-looking statements. As a consequence, these forward-looking statements should be considered in light of various important factors, including those set forth in this annual report. Important factors that could cause actual results to differ materially from estimates or projections contained in the forward-looking statements include, without limitation:
| · | | changes in the market price of the minerals that it mines and sells; |
| · | | fluctuations in exchange rates, currency devaluations, inflation and other macro-economic monetary policies; |
| · | | the occurrence of labor disruptions and industrial actions; |
| · | | changes in relevant government regulations, particularly environmental, tax, health and safety regulations and new legislation affecting water, mining, mineral rights and business ownership, including any interpretation thereof which may be subject to dispute; |
| · | | power disruption, constraints and cost increases; |
| · | | the outcome and consequence of any potential or pending litigation or regulatory proceedings or environmental, health or safety issues; |
| · | | the occurrence of temporary stoppages of mines for safety incidents and unplanned maintenance; |
| · | | the occurrence of hazards associated with underground and surface mining; |
| · | | the ability to achieve anticipated efficiencies and other cost savings in connection with, and the ability to successfully integrate, past and future acquisitions, as well as at existing operations; |
| · | | operating in new geographies and regulatory environments where Sibanye had no previous experience; |
| · | | Sibanye’s ability to implement its strategy and any changes thereto; |
| · | | Sibanye’s future financial position, plans, strategies, objectives, capital expenditures, projected costs and anticipated cost savings and financing plans; |
| · | | changes in assumptions underlying Sibanye’s estimation of its current mineral reserves; |
| · | | supply chain shortages and increases in the price of production inputs; |
| · | | economic, business, political and social conditions in South Africa, Zimbabwe, the United States and elsewhere; |
| · | | the ability of Sibanye to comply with requirements that it operates in a sustainable manner; |
| · | | failure of Sibanye’s information technology and communications systems; |
| · | | the success of Sibanye’s business strategy, exploration and development activities; |
| · | | the availability, terms and deployment of capital or credit; |
| · | | Sibanye’s ability to hire and retain senior management or sufficient technically skilled employees, as well as its ability to achieve sufficient representation of HDSAs in its management positions; |
| · | | the adequacy of Sibanye’s insurance coverage; |
| · | | uncertainty regarding the title to Sibanye’s properties; |
| · | | social unrest, sickness or natural or man-made disaster at informal settlements in the vicinity of Sibanye’s African operations; |
| · | | the impact of HIV, tuberculosis and other contagious diseases; and |
| · | | Sibanye’s intention to issue debt securities, which may not be available on commercially reasonable terms, or at all, which will be structurally senior to our ordinary shares and ADRs and which may limit our ability to respond to changes in market conditions or pursue business opportunities. |
The foregoing factors and others described under “Risk Factors” should not be construed as exhaustive. There are other factors that may cause our actual results to differ materially from the forward-looking statements. Moreover, new risk factors emerge from time to time and it is not possible for us to predict all such risk factors. We cannot assess the impact of all risk factors on our business or the extent to which any factor, or combination of factors, may cause actual results to differ materially from those contained in any forward-looking statements. Given these risks and uncertainties, you should not place undue reliance on forward-looking statements as a prediction of actual results.
We undertake no obligation to update publicly or release any revisions to these forward-looking statements to reflect events or circumstances after the date of this annual report or to reflect the occurrence of unanticipated events.
| |
Sibanye Integrated Annual Report 2016 | 11 |
ABOUT SIBANYE’S REPORTS
Our 2016 suite of reports, covering the financial year from 1 January 2016 to 31 December 2016, comprises the following:
| · | | Integrated Annual Report 2016 |
| · | | Summarised Report 2016 and Notice of Annual General Meeting |
| · | | Annual Financial Report 2016 |
| · | | Company Financial Statements 2016 |
These reports collectively cover the operational, financial and non-financial performance of the operations and activities of Sibanye Gold Limited (Sibanye or the Group) and provide stakeholders with transparent insight into our strategy, our business and our performance over the past year. No separate sustainable development report is produced as this information is presented in the integrated report. These reports also take note of any material events that have arisen between year-end and the date of their approval by the Board. In producing this suite of reports and the Form 20-F, Sibanye complies with the requirements of the exchanges on which it is listed, namely the Johannesburg Stock Exchange (JSE) and the New York Stock Exchange (NYSE).
SCOPE AND BOUNDARY OF REPORTS
During the course of 2016, Sibanye revised its organisational structure and the management of its business in order to ensure continued delivery on its strategic objectives. Following this restructuring, Sibanye comprises two operating divisions:
| · | | Gold Division, incorporating the gold mining operations and projects |
| · | | Platinum Division, incorporating the platinum group metal (PGM) mining operations and projects |
Annual comparative data is provided where applicable from 2013, the year Sibanye was established and listed as a separate entity on the JSE. For the 2016 financial year, annual data is provided where possible by division and at group level.
Please note that the annual data provided at group-level for 2013 to 2015 is comparable to data for the Gold Division in 2016. Where data for previous years, has been restated, this is indicated.
The data reported for the Platinum Division for the 2016 financial year includes the assets of Aquarius Platinum Limited (Aquarius) acquired with effect from 12 April 2016, while the assets acquired from Anglo American Platinum Limited (Anglo American Platinum) (now Sibanye’s Rustenburg Operations) are included from 1 November 2016. The data for the Platinum Division is thus effectively for the nine months from April 2016 to December 2016, unless otherwise indicated.
REPORTING PHILOSOPHY
In this integrated report, our primary report, the information provided is intended to inform stakeholders about Sibanye’s operating and financial performance and progress made in delivering on its strategy. While the principal audience for our integrated report is investors and shareholders, we acknowledge that there are other stakeholders who have varied and specific information requirements, many of which we aim to fulfil. This is particularly so since we do not produce a separate sustainable development report. Instead all non-financial reporting is either included in this integrated report or is available on the website, where referenced.
We have endeavoured to build on the information provided in last year’s integrated report. This report discusses what we did in 2016 to create value, to improve lives and to achieve our strategic objectives. In so doing, we give an account of the impact of our activities and, more importantly, of those factors and risks, both in the external environment and internally, that have had an impact on our ability to achieve our strategic objectives and to create superior value in the past year. The process to determine the most material of these is described in “—View from the top—Material risks and opportunities”. Sibanye considers an issue to be material if it substantially affects our ability to create and sustain value in the short, medium and long term.
APPROVAL AND ASSURANCE
Sibanye’s internal audit function provides an independent evaluation of the Group’s internal control processes and systems that have been devised to mitigate business risks and has ensured the accuracy of the information presented in these reports.
REPORTING COMPLIANCE
The following frameworks, guidelines and requirements have been applied, where relevant in compiling this integrated report and the entire suite of 2016 reports:
| · | | International Integrated Reporting Framework |
| · | | Global Reporting Initiative (GRI) G4 |
| · | | King Report on Governance for South Africa 2009 (King III) |
| · | | South African Companies Act, 71 of 2008 (the Companies Act) |
| · | | JSE Listings Requirements |
| · | | South African Code for Reporting of Exploration Results, Mineral Resources and Mineral Reserves (SAMREC Code) |
| · | | Broad-Based Socio-Economic Empowerment Charter for the South African Mining and Minerals Industry (Mining Charter) (2002) and related scorecard (2004) |
| · | | Amendments to the Mining Charter (2010) and related scorecard (2010) |
| · | | Social and Labour Plans (SLPs) – in terms of the requirements of the Mineral and Petroleum Resources Development Act 28 of 2002 (MPRDA) |
| |
Sibanye Integrated Annual Report 2016 | 12 |
| · | | International Council on Mining and Metals (ICMM) |
| · | | United Nations Global Compact (UNGC) |
| · | | Greenhouse Gas (GHG) Protocol |
| · | | Sustainability Accounting Standards Board’s (SASB) standards |
| · | | FTSE/JSE Responsible Investment Index |
| · | | International Financial Reporting Standards (IFRS) |
| · | | South African Institute of Chartered Accountants (SAICA) Financial Reporting Guides |
| · | | US Securities and Exchange Commission regulations, including the Industry Guide 7 for the Reporting of Mineral Reserves |
The required disclosure is included in this integrated report or in the supplementary reports and documents available online, http://reports.sibanyegold.co.za
| |
Sibanye Integrated Annual Report 2016 | 13 |
Group PROFILE
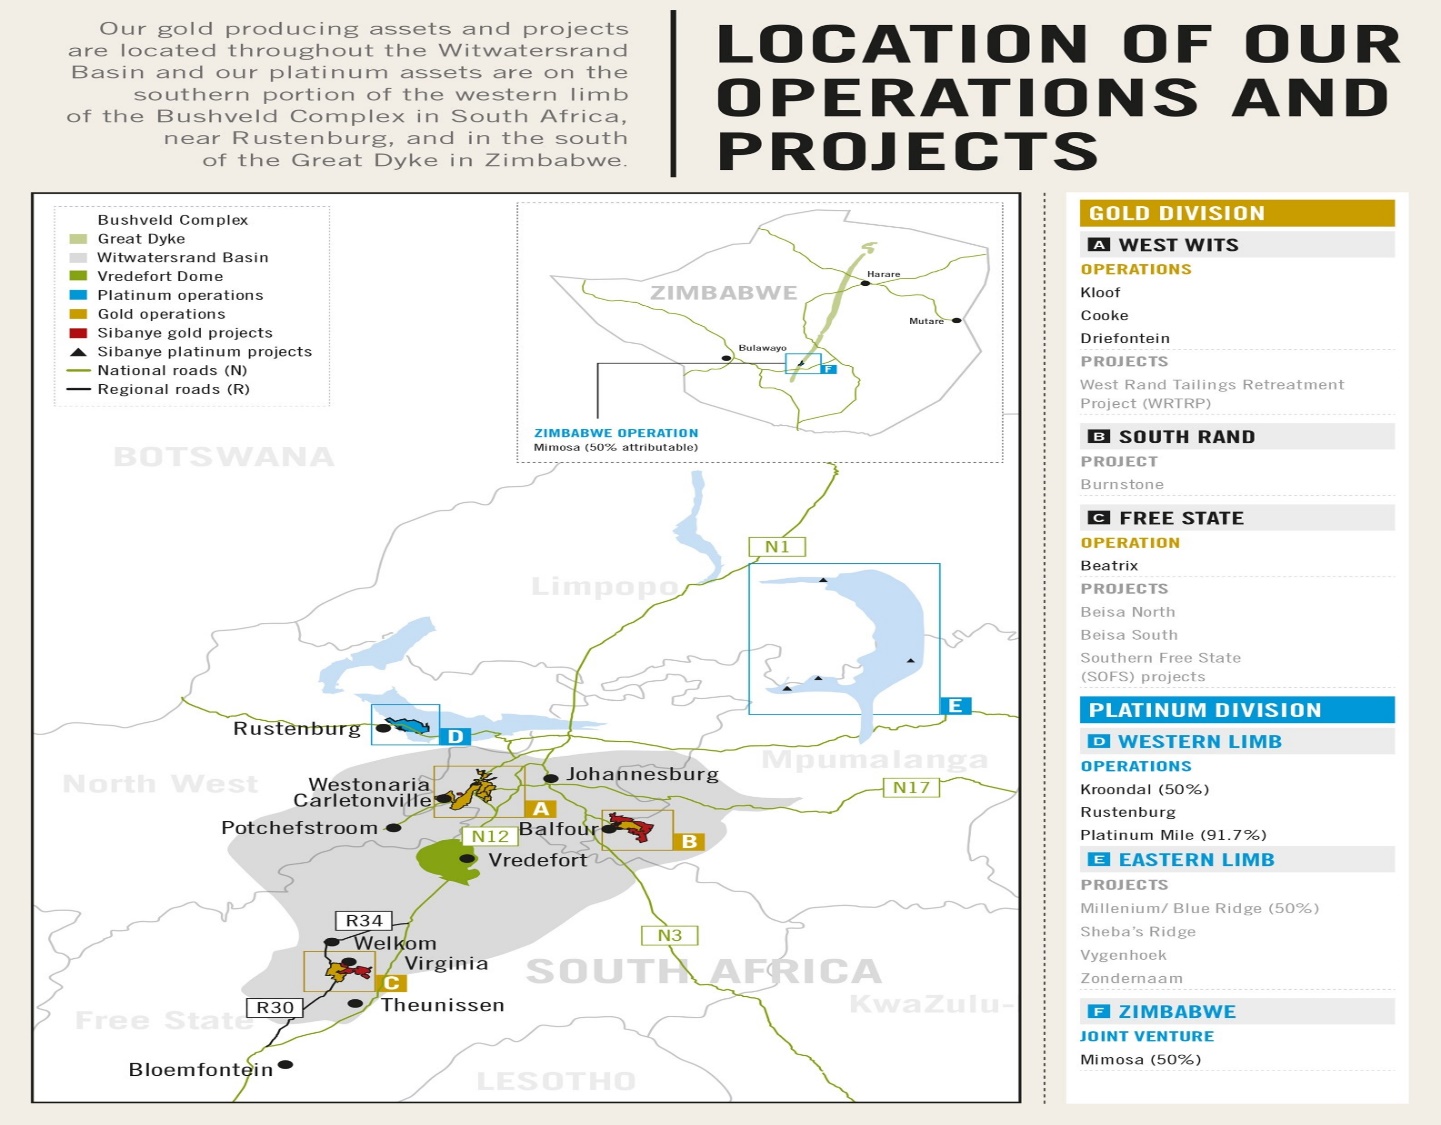
Sibanye is an independent mining group domiciled in South Africa, which owns and operates a portfolio of high-quality gold and platinum group metals (PGMs) operations and projects.
Our assets
At financial year end, Sibanye’s gold assets included four underground and surface gold mining operations in South Africa – the Cooke, Driefontein and Kloof operations in the West Witwatersrand (West Wits) region of Gauteng and the Beatrix operation in the southern Free State. Sibanye also owns and manages significant extraction and processing facilities at its operations where gold-bearing ore is treated and beneficiated to produce gold doré. In addition, Sibanye is currently investing in a number of organic projects to sustain it in the long term.
During 2016, Sibanye acquired Aquarius Platinum Limited (effective 12 April 2016). The Aquarius assets include a 50% stake in each of the Kroondal and Mimosa mines, and associated infrastructure and concentrating facilities, as well as Platinum Mile (91.7%).
The assets acquired from Anglo American Platinum Limited (effective 1 November) are the Bathopele, Siphumelele, and Thembelani (including Khuseleka) shafts, two concentrating plants, an on-site chrome recovery plant, the western limb tailings retreatment plant and all associated surface infrastructure, referred to as the Rustenburg Operations.
Towards year end, Sibanye announced the proposed acquisition of Stillwater Mining Company (Stillwater), which has palladium and platinum producing operations in Montana in the United States.
black economic empowerment
The Group is committed to transformation and is guided by the Broad-Based Socio-Economic Empowerment Charter for the South African Mining and Minerals Industry (Mining Charter). In 2004, Gold Fields of South Africa Limited (Gold Fields) undertook a broad-based black economic empowerment (BBBEE) transaction, transferring an amount equivalent to 15% of its equity in Sibanye, formerly GFI Mining South Africa Proprietary Limited (GFI Mining South Africa), to Mvelaphanda Gold Proprietary Limited (Mvelaphanda Gold).
In 2010, a further 10% of equity was allocated to an employee share ownership plan (ESOP) and another 1% in an empowerment deal. At the end of 2016, 24,523 Sibanye employees were participants in the Thusano Trust, our ESOP.
With the acquisition of the Rustenburg operations, Sibanye concluded a 26% BBBEE transaction with a consortium comprising: Rustenburg Mine Employees Trust (30.4%), Rustenburg Mine Community Development Trust (24.8%), Bakgatla-Ba-Kgafela Investment Holdings (24.8%) and Siyanda Resources Proprietary Limited (20%).
listing information
The Group’s primary listing is on the JSE, trading under the share code SGL, where it is a constituent of the FTSE/JSE Responsible Investment Index. The Group has a secondary American Depositary Receipts (ADR) listing on the NYSE, trading under the ticker code SBGL. Each ADR is equivalent to four ordinary shares.
At 31 December 2016, Sibanye had issued share capital of 929,004,342 shares and a market capitalisation of R23.6 billion (US$1.7 billion) (2015: R20.9 billion (US$1.3 billion)).
Our products
Gold
Sibanye mines, extracts and processes gold-bearing ore to produce a beneficiated product, doré, which is then refined further at Rand Refinery Proprietary Limited (Rand Refinery) into gold bars with a purity of at least 99.5% in accordance with the London Bullion Market Association’s standards of Good Delivery. Sibanye holds a 33% interest in Rand Refinery, one of the largest global refiners of gold, and the largest in Africa, which then markets and sells the refined gold on international markets to customers around the world.
Platinum group metals
Sibanye mines PGM-bearing ore at its newly acquired assets that is processed to produce PGMs-in-concentrate. The primary PGMs produced are platinum, palladium and rhodium, which together with the gold occurring as a co-product, are referred to as 4E (3PGM+Au).
By-products
Sibanye derives uranium ore as a by-product of gold production and, up until it ceased underground production from the Cooke 4 mine, produced ammonium diuranate from a dedicated uranium stream at the Ezulwini plant. The underground ore was processed to recover the uranium and then subsequently to recover gold.
At our platinum operations, the minor PGMs produced are iridium and ruthenium, which, together with the three primary PGMs, are referred to as 6E (5PGM+Au). In addition, nickel, copper and chrome, among other minerals are produced as by-products at these operations.
| |
Sibanye Integrated Annual Report 2016 | 14 |
| |
Sibanye Integrated Annual Report 2016 | 15 |
OUR VISION AND STRATEGY EXPLAINED
Our vision
Superior value creation for all our stakeholders through mining our multi-commodity resources in a safe and healthy environment.
Superior value is delivered by:
| · | | maintaining a clear and consistent operational focus and applying a holistic, efficient operating model |
| · | | disciplined, efficient and cost-effective capital management to enable investment in value-accretive growth |
Our STRATEGY
By delivering on its strategy and vision to create superior value and improve lives, Sibanye expects to maintain mutually constructive relationships with all stakeholders and, ultimately, to achieve a premium market rating.
| |
OUR VALUE PROPOSITION – DELIVERING SUPERIOR VALUE TO STAKEHOLDERS • EMPLOYEES Sibanye provides employment enabling those employed to earn an income, to acquire skills and advance through training and development, in an environment where their safety, health and welbeing are priorities. • COMMUNITIES In turning to account our resources and reserves, Sibanye contributes to host and labour-sending communities as well as to society and the economy at large by investing in socio-economic development initiatives, employing those who reside in the vicinity of our operations and through preferential local procurement. • GOVERNMENT Sibanye contributes directly to the national fiscus by way of taxes and royalties paid, enabling government to provide social infrastructure and services. Sibanye also contributes indirectly through the payment, in turn, by employees of personal income tax. • SHAREHOLDERS Sibanye delivers value to shareholders by the payment of consistent dividends and by capital appreciation spurred by operational efficiency and organic and acquisitive growth. Sibanye’s commitment to paying industry-leading dividends underpins and informs our strategy. Sibanye recognises that: • safety, costs, volumes and grade are the primary operational deliverables underpinning our business • strong cash flow supports the dividend paid to shareholders and is vital to growth • growth (organic and acquisitive) ensures the long-term delivery of sustainable value to all stakeholders | 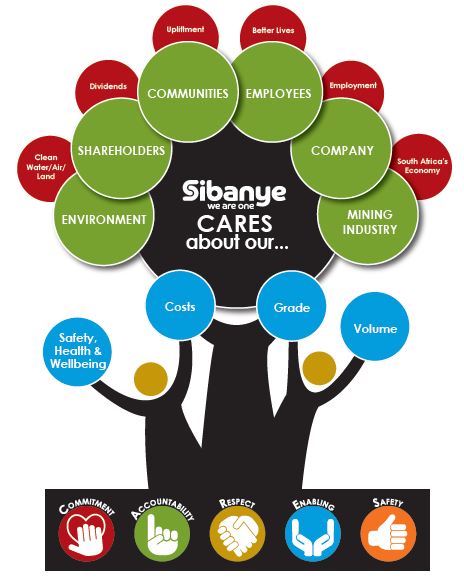
In living our values of commitment, accountability, respect, enabling and safety, we show that we care about safe production, our stakeholders, our environment, our company and our future. Our approach is holistic with a clear focus to deliver on all strategic imperatives critical to Sibanye’s long-term success. |
| |
Sibanye Integrated Annual Report 2016 | 16 |
how we create value
Below we describe how Sibanye operates, the inputs that are required for the conduct of the business and how these are transformed into value for stakeholders.
Sibanye's
PRIMARY BUSINESS activities are:
| · | | Mine development and mining operations, primarily underground ore bodies |
| · | | Developing organic growth projects |
| · | | Beneficiation and further refining as required |
| · | | Sale of end products produced |
| · | | Exploring for and/or acquiring new ventures |
Allied to these activities are:
| · | | Community and social development initiatives |
| · | | Environmental management and rehabilitation |
business model:
Sibanye’s business model is to optimise its operations by managing the fundamental inputs of safety cost, grade and tonnes and, by leveraging its low-cost operating expertise, to realise additional value from new acquisitions. Sustainability is achieved by investing in organic projects and making value-accretive acquisitions which support the ability to continue paying industry leading dividends. Sibanye views proactive stakeholder engagement as a critical factor in ensuring business stability and sustainability.
operating context and risk:
In conducting our business, various factors in our external operating environment have an effect on our business and ability to create superior value. In monitoring and managing our operating environment, we have identified the top material risks, both internal and external, to our ability to create value, and steps taken to mitigate these risks.
For additional information on our operating environment and risks, see “—View from the top—Material risks and opportunities”.
| |
Sibanye Integrated Annual Report 2016 | 17 |
PERSPECTIVE FROM THE CHAIR
The past year has been particularly significant for Sibanye. We concluded the acquisitions of Aquarius Platinum Limited and the Rustenburg assets, establishing Sibanye as a leading PGM producer.
I am pleased to present this report to all the stakeholders at a time when we have positioned Sibanye to be a company of real stature in our sector. The past year has been particularly significant with Sibanye’s entry into the PGM industry resulting in the company transitioning from a top ten gold producer to a leading precious metals enterprise. The conclusion of the acquisitions of Aquarius Platinum Limited and the Rustenburg assets, established Sibanye as a leading PGM producer.
The proposed acquisition of the low-cost, high-grade Stillwater operations and downstream processing and refining operations is likely to cement Sibanye’s position as a globally influential, top tier precious metals company, if approved by shareholders. This strategy has the full support of the Sibanye Board. We are confident that the longer-term fundamentals for platinum and palladium supply and demand remain sound and we are convinced that Sibanye’s considered entry into this industry, at a favourable point in the commodity price cycle, will deliver significant value for stakeholders.
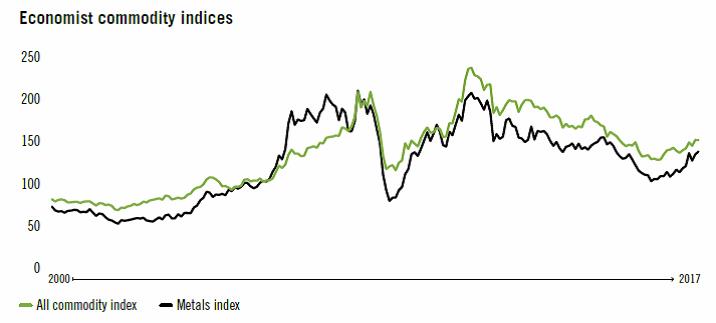
The global political and economic outlook in the beginning of 2016 was poor and with the demand outlook for commodities uncertain and little evidence of supply discipline, commodity prices in general were depressed, reaching lows not seen since 2009, just after the global financial crisis.
Uncertainty of this nature is generally positive for gold demand, and the dollar gold price rose steadily in the first quarter of 2016, supported by a muted US economic outlook and the threat of an interest rate hike becoming more remote. Local gold producers, after years of restructuring and cost cutting, were already benefiting from higher rand gold prices following the abrupt depreciation of the rand in November and December 2015, due to unexpected political disquiet in the Finance Ministry of South Africa. These astonishing political actions, seemed to set the scene for a number of unpredictable global economic and political events, which caused considerable market instability and volatility.
The first of these implausible global events in 2016 was the unanticipated pro-Brexit victory in June, which threw global markets into turmoil. The resultant increase in speculative demand for gold as a hedge against uncertainty, boosted the dollar gold price to over US$1,360/oz and the rand gold price to new all-time highs of over R650,000/kg in July 2016, significantly boosting operating margins for the local industry.
Somewhat surprisingly though, following the initial reaction to the pro-Brexit vote, the global markets appeared to shrug off any major economic consequences. The commodity prices in fact continued to build on price gains made since the beginning of the year, signalling expectations of a recovery in demand. With economic concerns abating, expectations of interest rate hikes in the US again began to weigh on the gold price, which declined steadily toward year end, dragging the platinum price with it. Even the widely unanticipated election of Donald Trump as President of the US in November 2016, which many market commentators had predicted to be positive for the gold price, did little to arrest the steady decline in the gold price and other precious metals.
South Africa has never been immune from political excitement and the groundswell of activism for change grew into 2016. The student campaigns, the Constitutional Court rulings seeking to protect the sanctity of the country’s constitution and the prominent losses suffered by the ANC in local municipal elections were highlights of 2016. With the leadership shown by the National Treasury, South Africa managed to reduce the prospect of a ratings downgrade.
With the risk of a sovereign ratings downgrade diminishing and the rand strengthening against the US dollar, the rand gold price retraced most of its gains to end the year flat at R509,000/kg. With operating margins again under pressure, Sibanye’s share price lost gains previously made, along with rand gold and PGM prices, and, just prior to the announcement of the Stillwater transaction, had fallen from a peak of R70 to approximately R28 a share.
While the longer-term political and economic ramifications of events such as the pro-Brexit vote in the United Kingdom and the election of Donald Trump in the United States of America, are difficult to predict and market uncertainty and volatility are likely to persist for some time, the consensus outlook for precious metal prices in the near term remains subdued. This is particularly so in rand terms, with the rand remaining surprisingly resilient and market consensus increasingly biased towards a stronger for longer local currency. The strong currency will significantly impact industry margins, particularly when considering that local mining cost inflation is higher than general CPI or PPI due to above inflation electricity cost increases and above inflation wages increases. Management at Sibanye in preparation for a strong rand environment, have already deferred non-critical growth capital expenditure at some projects and are reviewing operating costs and reassessing operating plans in order to ensure sustainability.
| |
Sibanye Integrated Annual Report 2016 | 18 |
In addition to the prevailing economic uncertainty, the business environment in South Africa has become more challenging in the last year, due to continued policy uncertainty, heightened regulatory intervention and an unsettled political environment. These political and economic challenges and their possible future impact on the operating environment need to be acknowledged and regularly considered by the board and management of Sibanye and factored into the Group strategic thinking. We remain committed to building a sustainable mining company which creates superior value for all stakeholders and we will continue to respond to challenges by managing our assets as efficiently and cost effectively as possible and, without compromising our strategic fundamentals, adapting our strategy in order to protect shareholder value.
We have pledged to deliver superior value to all stakeholders and we continue to engage with our employees, the unions, our host communities and the authorities, to ensure that all stakeholders benefit from our activities. We have had some notable successes, with constructive engagement with the unions averting a threatened strike early in the 2016 year, and securing the three-year gold wage agreement struck in October 2015. In October 2016 too, a three-year wage settlement was peacefully agreed in the Platinum Sector including our Rustenburg Operations, which I believe represents a maturing of the multi-union relationship in the industry and displays a refreshing pragmatism on employment and remuneration by employees as well as employers. We are also actively engaging with our communities to ensure that our social expenditure results in sustainable and value enhancing community development.
Looking forward, we continue to face policy and regulatory uncertainty, particularly the effects that the eventual passing of the Mineral and Petroleum Resources Development Act (MPRDA) Amendment Bill might have on the industry’s voluntarily agreed Mining Charter and the discretionary powers proposed for the Minister of Mineral Resources. As a major employer and listed company, we need to understand the terms and cost of doing business in South Africa to make informed decisions and commit to what is fair. The Industry through the Chamber of Mines has attempted to engage constructively with the Department of Mineral Resources (DMR) on some of the more punitive and ambiguous aspects of both the MPRDA and the Mining Charter, but at this stage the outcome remains unclear.
Another issue which has arisen between the industry and the DMR has been imposition of work stoppages in terms Section 54 of the Mine Health and Safety Act, in the event of accidents or safety transgressions in localised sections of a mine. While our commitment to safety remains firm and we apply significant resources to improving safety at our operations, these stoppages can have a significant impact on the economic viability of operations and hence, on future employment. The industry continues to engage with the DMR on this issue and is hoping to agree on a set of clear procedures and guidelines governing the application of Section 54s.
The integration of the Aquarius PGM operations, since the transaction was concluded in April 2016, has proceeded according to plan. Transitions of this nature and scale are always difficult, but it has been pleasing to note that the operational excellence that characterised the Aquarius operations has been maintained under Sibanye’s management. The outstanding regulatory approvals for the acquisition of the Rustenburg Operations were finally received towards the end 2016 enabling Sibanye to take operational control from 1 November. It was again pleasing to note the operational turnaround achieved at the Rustenburg Operations during the final quarter of 2016, after a challenging first nine months. During the two months under Sibanye operational control, the Rustenburg Operations delivered to plan and contributed R74 million in operating profit to the Group after recording significant losses earlier in the year. As previously indicated, management expects to realise over R800 million of identified annual synergies as the Platinum Division is fully integrated over the next three years. The initial steps have been taken and management expects to achieve approximately R400 million of these synergies by the end of 2017.
The proposed acquisition of Stillwater Mining Company (Stillwater) was announced on 9 December 2016 following extensive due diligence by management. The Board is confident that this transaction is value accretive and will uniquely and strategically position Sibanye as an influential and globally-competitive precious metals producer. The proposed transaction is consistent with Sibanye’s strategy of pursuing value-accretive growth which will sustain its status as an industry-leading dividend-paying company and offers the additional strategic benefits of commodity and geographical diversification as well as a potential market rerating over time.
Sibanye remains committed to growth in South Africa and other geographies, and is well positioned to pursue further value-accretive opportunities in the near and medium term. The Board and management of Sibanye will also be mindful of the prevailing risks however, when considering further significant long-term capital investment in the local and international mining industry.
Our primary focus in the coming year will be on bedding down our platinum acquisitions, making progress on reducing our financial leverage in line with our long-term targets and on fulfilling our vision to establish the Sibanye as a premier, globally competitive precious metals mining company and in so doing to improve the lives of all. For this, our executive management team, led by Neal Froneman, are to be commended. Appreciation is also due to the entire Sibanye workforce, whose commitment to the company has been critical to what we have achieved in the past year. My thanks also go to my fellow directors on the Board, for their invaluable guidance and whole hearted support.
Sello Moloko
Chairman
30 March 2017
| |
Sibanye Integrated Annual Report 2016 | 19 |
chief executive’s review
Our strategic vision at Sibanye is to create superior value for all of our stakeholders, and as a company, if we are to deliver value in a sustainable manner, we need to ensure delivery through all the phases of the economic and commodity cycles.
As such, our strategy needs to be sound and consistent in order to deliver in the long term, yet flexible enough to respond to sudden changes in our operating environment.
This requires optimising our operations and ensuring that we continue to deliver on the operational deliverables of safety, volume, cost and grade and by extending, as far as is profitably possible, the lives of our operations. Sibanye’s foundation remains firmly rooted in its South African gold operations and we continue to explore ways to reduce costs and ensure sustainable operational delivery, including continued capital investment in organic growth projects. It is sometimes necessary to make tough decisions however, with the restructuring or closure of loss making operations necessary, to secure a more certain future for the Group. The cessation of mining at Cooke 4 in the latter half of 2016 was one such difficult decision. This had followed unsuccessful engagement with key stakeholders in an attempt to restore the mine to profitability. Subsidising loss-making production by profitable operations is value destructive for all stakeholders and will not be done at Sibanye.
We continue to see merit in industry consolidation. Significant value can be realised by removing unnecessary overhead costs and by optimising the use of infrastructure and resources. We remain confident that this will be borne out at our Platinum Division in coming years, where we anticipate realising over R800 million in annual cost and operational synergies between the Aquarius assets (Kroondal, Mimosa and Platinum Mile) acquired in April 2016 and the Rustenburg Operations, which we assumed control of in November 2016. Despite a relatively short period under Sibanye’s management, the performance from both the Aquarius assets and the Rustenburg Operations have been pleasing, and in line with our expectations.
Value-accretive acquisitive growth remains strategically important and, while the South African gold and PGM sectors continue to offer opportunities, value-accretive prospects in other commodities and geographies will be considered. The proposed US$2.2 billion cash offer for Stillwater announced in December 2016 is consistent with this strategy. Stillwater offers high grade, low cost operations and significant low cost growth potential, as well as world class processing facilities and a strategically relevant recycling business, which is the largest in the world. The acquisition would transform Sibanye, making it globally competitive, lowering its cost of capital and providing significant upside through a potential rerating in the market.
The relative attractiveness and risk associated with investing in South Africa is also an important consideration, and heightened political and regulatory uncertainty recently has added to investment risk. It is clear that a new, more co-operative approach involving all stakeholders is required if the mining industry is to continue to play its critical role in the development and transformation of the South African economy. I will explore this in a bit more detail later in this review.
Stillwater Transaction rationale
| · | | It is value accretive on a net asset value basis and cash flow accretive as the Blitz project ramps up |
| · | | The Blitz project brings near-term, organic and low-cost growth |
| · | | Stillwater will add two low-cost, low-risk, steady state producing PGM mines to Sibanye’s portfolio |
| · | | It will position the Platinum Division further down the global cost curve, with potential for further cost reductions |
| · | | It will improve access to lower-cost global financing |
| · | | It will balance the portfolio operationally and geographically with the addition of world-class assets in an attractive mining jurisdiction |
| - | | a high-grade (20g/t), palladium-biased (78% palladium), long-life (+25 years), low-cost (< $500/2E oz), mechanised operation |
| - | | a mine-to-market PGM business |
| - | | a large, PGM-recycling business providing a steady margin and strategic insight into the market |
More information on the Blitz Project:
The Blitz project is basically an extension of the current Stillwater mine’s orebody which is scheduled to start first production in early 2018. Blitz will add 270,000 – 330,000 2E ounces to the complex and aims to reach steady state production in 2021. US$140 million of total planned capital expenditure of US$250 million remains to be spent.
SAFETY
Sibanye’s commitment to its vision of “creating superior value for all stakeholders” defines and guides all aspects of the business. Employees are key stakeholders, and the health, wellbeing and safety of Sibanye’s employees is of primary importance. Workplace accidents are not an inescapable factor of mining. They are preventable and can even be eliminated through coordinated action by everyone involved within Sibanye, across all occupations.
Our gold operations showed an improved safety trend in terms of the fatal injury frequency rate (FIFR) since 2012. Our performance compared favourably with that of the US mining industry’s safety benchmark.
Regrettably there was a regression in the Gold Division’s safety performance during the first six months of the year, when there were eight fatalities compared with four during the comparative period in 2015. Sibanye management implemented urgent action to address this regression in safety, appointing Peter Turner, who has exemplary qualifications and significant mining experience in the role of Senior Vice President: Safety, Health and Environment. Sibanye’s executive management, together with senior safety specialists, completely reviewed the Group's safety principles and, following the review, rolled out an extensive safety awareness campaign, elevating safety as a core value in the Group “CARES” values.
It was therefore pleasing to note the significant improvement in safety from August 2016, in particular at the Gold Division, which recorded a significantly improved safety performance for the second half of 2016: the FIFR improved by 50% to 0.07 per million hours worked; the
| |
Sibanye Integrated Annual Report 2016 | 20 |
SIFR by 27% to 3.72 per million hours worked; and the LTIFR by 19% to 6.25 per million hours worked. The Platinum Division ended the year as follows: FIFR 0.09, SIFR 2.88 and LTIFR 4.84.
Nonetheless, any loss of life is extremely distressing and my deepest condolences and those of Sibanye’s management team go to the families, friends and colleagues of employees who passed away in 2016. Sibanye will continue to strive to achieve our goal of Zero Harm in the workplace and we have a structured, workable plan to achieve this. Further detail on the safety performance and strategy is provided in “—Performance overview—Health and safety focus—Safety”.
OPERATING AND FINANCIAL SUMMARY
The Group operating result and financial performance was on the whole solid, with the Gold Division benefiting from the relatively high rand gold price for most of the year, and the newly incorporated Platinum Division performing well, resulting in record Group operating profit of R10.5 billion (US$717 million), 66% higher than for the year ended 31 December 2015. Operating profit from the Gold Division of R10.2 billion (US$692 million), was 60% higher than for the previous year, with the Platinum Division contributing R376 million (US$26 million), reflecting a positive contribution from the Rustenburg Operations from 1 November 2016 and continued good performances at the Kroondal and Mimosa Operations.
Normalised earnings of R3.7 billion (US$249 million) were also significantly higher than in 2015 (R1.2 billion (US$96 million)), allowing the Board to declare a total dividend of 145 cents per share (R1.4 billion) for the year ended 31 December 2016, representing a dividend yield of 5%. Sibanye has declared a dividend with a yield of more than 5% every year since listing, which is more than double the average of our gold peers globally.
Production from Sibanye’s Gold Division was 47,034/kg (1,512,200oz), marginally lower than in 2015. This was primarily due to safety stoppages in the first half of the year, which disrupted production and the cessation of underground mining operations at Cooke 4 mine in the second half of the year.
A stronger US dollar gold price, together with a weaker rand/dollar exchange rate, resulted in a 23% year-on-year increase in the average rand gold price from R475,508/kg (US$1,160/oz) to R586,319/kg (US$1,242/oz). Revenue from the Gold Division increased by 36% year-on-year, to R27.5 billion (US$1.9 billion) from R22.7 billion (US$1.8 billion).
Costs were well managed, with unit costs only increasing 4% to R862/t (US$59/t), and all-in sustaining costs increasing 6.6% to R450,152/kg (US$954/oz). Sibanye is by some margin the lowest cost producer among the majors in South Africa on both cost measures, reflecting the relative efficiency of its mining.
Integration of the Platinum Division proceeded according to plan, with the Aquarius operations, Kroondal and Mimosa, continuing to consistently outperform and the Rustenburg Operations delivering as expected for the first two months under Sibanye's management. The Platinum Division reported attributable production of 420,763oz (4E) at an average operating cost of R10,296/4Eoz (US$701/4Eoz), resulting in a 10% operating margin, despite the average PGM basket price remaining subdued at R12,209/4Eoz (US$832/4Eoz).
Following the successful integration of the Aquarius Operations, the integration of the Rustenburg Operations is now underway and proceeding according to schedule. We have previously highlighted that we expect to realise operational synergies of approximately R800 million per annum from the combined Aquarius and Rustenburg operations over the next three years. The first steps in realising these synergies have begun, with approximately R400 million in synergies expected to be realised by year-end. In this regard, a restructuring of the Platinum Division was announced on 26 January 2017.
INTERNAL GROWTH PROJECTS
Expenditure on organic growth projects for the year ended 31 December 2016 was R762 million (US$52 million), 70% of which was spent at the Burnstone project. As a result of the recent strength in the rand and its impact on operating margins for the gold industry, organic project capital expenditure at the non-essential projects has been reviewed. This includes reducing planned expenditure at the Burnstone project by R300 million and only committing enough capital to the UG2 project at the Rustenburg Operations to sustain current planned production levels. A decision on the West Rand Tailings Retreatment Project (WRTRP) has also been deferred while alternative financing options are evaluated. Committing to further investment in long lead time capital intensive projects in South Africa is complicated by continued delays to, and uncertainty around, policy and regulations in South Africa. Despite continued attempts by the mining industry to co-operate with the authorities and contribute to legislation and regulations which will benefit all stakeholders, while ensuring the sustainability of the industry, finding common ground has been difficult and the future remains uncertain.
A VISION FOR THE FUTURE
As an industry we have called for a re-evaluation of the mining industry and what, if any, changes are needed to ensure its sustainability and profitability so that benefits are realised by all stakeholders. The Mining Phakisa (refer to the glossary, available online at http://reports.sibanyegold.co.za, for an explanation of the Mining Phakisa) called by the President of South Africa at the end of 2015 was, we believed, an honest attempt to bring all stakeholders together to define what was required to ensure the sustainability of the industry and the flow of benefits to stakeholders. While the Mining Phakisa has resulted in some very positive initiatives, commitment from stakeholders has been wanting. The lack of co-operation among different stakeholders continues to hamper efforts to progress many of the initiatives arising from the Phakisa.
Sibanye’s future, and that of the entire South African mining industry, depends on all stakeholders working together to develop a new frame of mind based on mutual trust. This, I firmly believe, will need to be based on the mining industry itself recognising its past – the good and the bad legacies of its many decades of operation. It calls for honest introspection.
Our future success depends on mutually respectful relationships with our employees, our unions, our host communities, educational and research institutions, government and the state’s regulatory authorities and requires a foundation of trust to be developed between the industry and its stakeholders.
This was the underlying precept of the Zambezi Protocol, which was the fruit of a meeting in April 2016 on the banks of the Zambezi River,
| |
Sibanye Integrated Annual Report 2016 | 21 |
convened by the Brenthurst Foundation and chaired by former Nigerian president Olusegun Obasanjo and devised to give direction to sustainable mining across the African continent. A suggested “roadmap” of how this could be achieved was developed, with the roles of each stakeholder defined to some extent.
| · | | The first step is that we in the industry acknowledge our past, which is necessary to build a relationship of trust between the industry and other stakeholders and is a mandatory precondition for the next two steps |
| · | | The second step is that we need to agree a vision for the mining industry |
| · | | The third and final step in our roadmap, once we have an agreed vision for the industry, is the development of a social and economic compact that creates superior value for all stakeholders |
By means of example, some of the commitments required from key stakeholders would be:
Business: will be required to commit to open and transparent disclosure of information as the basis for meaningful engagement with all stakeholders. It will need to adhere to exemplary standards of environmental and social performance and governance, including, as priorities, aspiring to zero harm in respect of safety and health. The development of local economies and communities will be imperative, with the establishment of a sustainable local economy post mining critical. More importantly business will have to ensure that value flows equitably to all stakeholders according to an agreed and specific framework, including employee benefits, profit sharing, taxes, social expenditure and dividends to shareholders. We know that sustainable viable businesses attract investment, grow, create significant economic benefits and employ large numbers of people. They are also key drivers of transformation.
Unions: should focus on promoting their members’ interests first and not a narrower political agenda. They should engage pro-actively around the sustainability of the industry and avoid actions which unnecessarily threaten the viability of employment.
Employees: will be required to apply themselves responsibly to safely deliver required operational performance, recognising the role that a strong and sustainable business plays in achieving their personal life ambitions. Employees should also align themselves to the fortunes of the business by securing an increasing portion of their remuneration through profit sharing arrangements, so that they benefit alongside shareholders and management from positive upticks in the economic cycles, but also contribute to the industry’s survival through economic downturns.
Community organisations: should ideally represent the needs of their constituencies and understand and appreciate the implications of up- and down- cycles in the minerals economy, and the impact on the affordability of social programmes, as well as the shared responsibility of Government and business in delivering these.
Government: should provide clear policy and a regulatory guidelines that provide the level of certainty that is required for confident investment in mining projects. Increased incentives for investment in mining growth projects and a fair taxation regime will promote investment, both from industry as well as from local and foreign investors. Fair and efficient administrative processes will be in place, and adhered to, as enshrined in legislation without impeding business operations.
Our vision for the future is for a “modernised” industry run in a sustainable manner for the benefit of all stakeholders. This was well defined at the Joburg Mining Indaba in 2015 as follows:
“A modern mining industry will optimally extract and beneficiate the country’s natural resources, causing no harm to people or the planet. It benefits both the local community as well as the national economy. It procures locally, it is a preferred employer of well skilled people and creates appropriate risk adjusted returns for investors. Regulations, taxation and incentives are consistent, transparent and recognise mining as a long- term driver of economic growth.”
From Sibanye’s perspective, the concept of modernisation resonated with what we had already embraced, through our corporate vision, established in 2013, of creating superior value for all stakeholders. We continue to pursue this vision with passion, knowing that it is an imperative for the success and sustainability of our business.
RECOGNITION AND APPRECIATION
In conclusion, I extend my gratitude to all my colleagues throughout the company for their commitment and co-operation in making Sibanye the premier, precious metals producer globally, and to the members of the Board for their support and guidance over the past year.
Neal Froneman
Chief executive officer
30 March 2017
| |
Sibanye Integrated Annual Report 2016 | 22 |
CHIEF FINANCIAL OFFICER'S REPORT
Our net asset value per share has increased by 40% since Sibanye’s listing in 2013.
The 2016 financial year was positively impacted by a 15% weakening in the rand/US dollar exchange rate, which declined from an average of R12.75/US$ in 2015 to R14.68/US$. The weaker rand/US dollar exchange rate and a 7% increase in the average US dollar gold price resulted in record operating profit and net operating profit in excess of R10.5 billion and R6.5 billion respectively. All-in sustaining costs for the Gold Division of R450,152/kg (US$954/oz) in 2016 increased by 7% compared to R422,472/kg (US$1,031/oz) in 2015. In comparison, the all-in sustaining cost in rands per kilogram of our major peers in South Africa increased by 25%, 13% and 8%.
Increased revenue and cost control resulted in headline earnings for 2016 of R2.5 billion which represents a 269% increase year on year. The group declared a dividend of 145 cents per share for the year, the highest since listing in February 2013. This equated to a 36% dividend payout ratio for 2016, which is consistent with our strategy of being a leading dividend payer.
A notable feature of 2016 for Sibanye was the two major platinum acquisitions – Aquarius and the Rustenburg Operations from Anglo American Platinum. These acquisitions resulted in our net debt (excluding Burnstone) increasing from R1.4 billion in 2015 to R6.3 billion in 2016. The gearing ratio of net debt:earnings before interest, tax, depreciation and amortisation (EBITDA) ended the year at 0.60:1 (2015: 0.21:1) which was well below our internal benchmark of 1:1, demonstrating Sibanye’s conservative balance sheet management.
Capital expenditure for 2016 at R4.2 billion increased from R3.3 billion in 2015, mainly due to expenditure growth at Burnstone and at the Kloof and Driefontein decline projects as well as the inclusion of the Aquarius assets and Rustenburg Operations for nine months and two months respectively.
The financial outlook for 2017 will primarily centre around leveraging the acquisition synergies at both the Aquarius assets and the Rustenburg Operations, which together comprise the Platinum Division, while containing unit costs at the existing operations at or below inflation.
Our proposed transaction, announced on 9 December 2016, to acquire Stillwater Mining Company (Stillwater) for US$2.2 billion in cash will be funded by bridge finance to be led by Citi and HSBC and which has been syndicated by a total of 16 banks. The syndication process was oversubscribed by more than US$1 billion, indicating the appetite for the finance of the transaction as well as providing another level of due diligence for the transaction’s rationale.
Shareholders will vote at a general meeting on 25 April 2017 to approve the transaction (majority of votes cast required) and on the increase and issue of additional share capital to enable the maximum rights offer of US$1.3 billion to be effected (75% of votes cast required). The rights offer will be initiated shortly after the shareholders’ vote, while the remainder of the finance required will be funded through a potential capital market debt issuance.
For management’s explanation of factors that have affected the Group’s financial condition and results of operations for the historical periods covered by the financial statements, and management’s assessment of factors and trends which are anticipated to have a material effect on the Group’s financial condition and results of operations in future periods, see “Annual Financial Report—Overview—Management’s discussion and analysis of the financial statements”.
Charl Keyter
Chief financial officer
30 March 2017
| |
Sibanye Integrated Annual Report 2016 | 23 |
material risks and opportunities
Sibanye considers a risk and/or an opportunity (together referred to in this report as an ‘issue’ or ‘issues’) to be material if it substantially affects the group’s ability to create and sustain value in the short, medium and long term.
In determining whether an issue is material, information is gathered from our external business environment, from interaction with stakeholders (both internally and externally) and from our internal enterprise risk management processes.
How we determine material issues
When determining material issues, management considers information from the external business environment, interaction with stakeholders (both internally and externally) and from internal ERM processes. These three sources provide management with the most important issues assessed, which may impact the group in meeting strategic objectives, business objectives and creating value over time. Management evaluates the potential impact and likelihood should the issue materialise from multiple perspectives, including strategic, financial and operational viewpoints. This results in the most material issues being prioritised with appropriate response plans.
determinING OUR material issues:
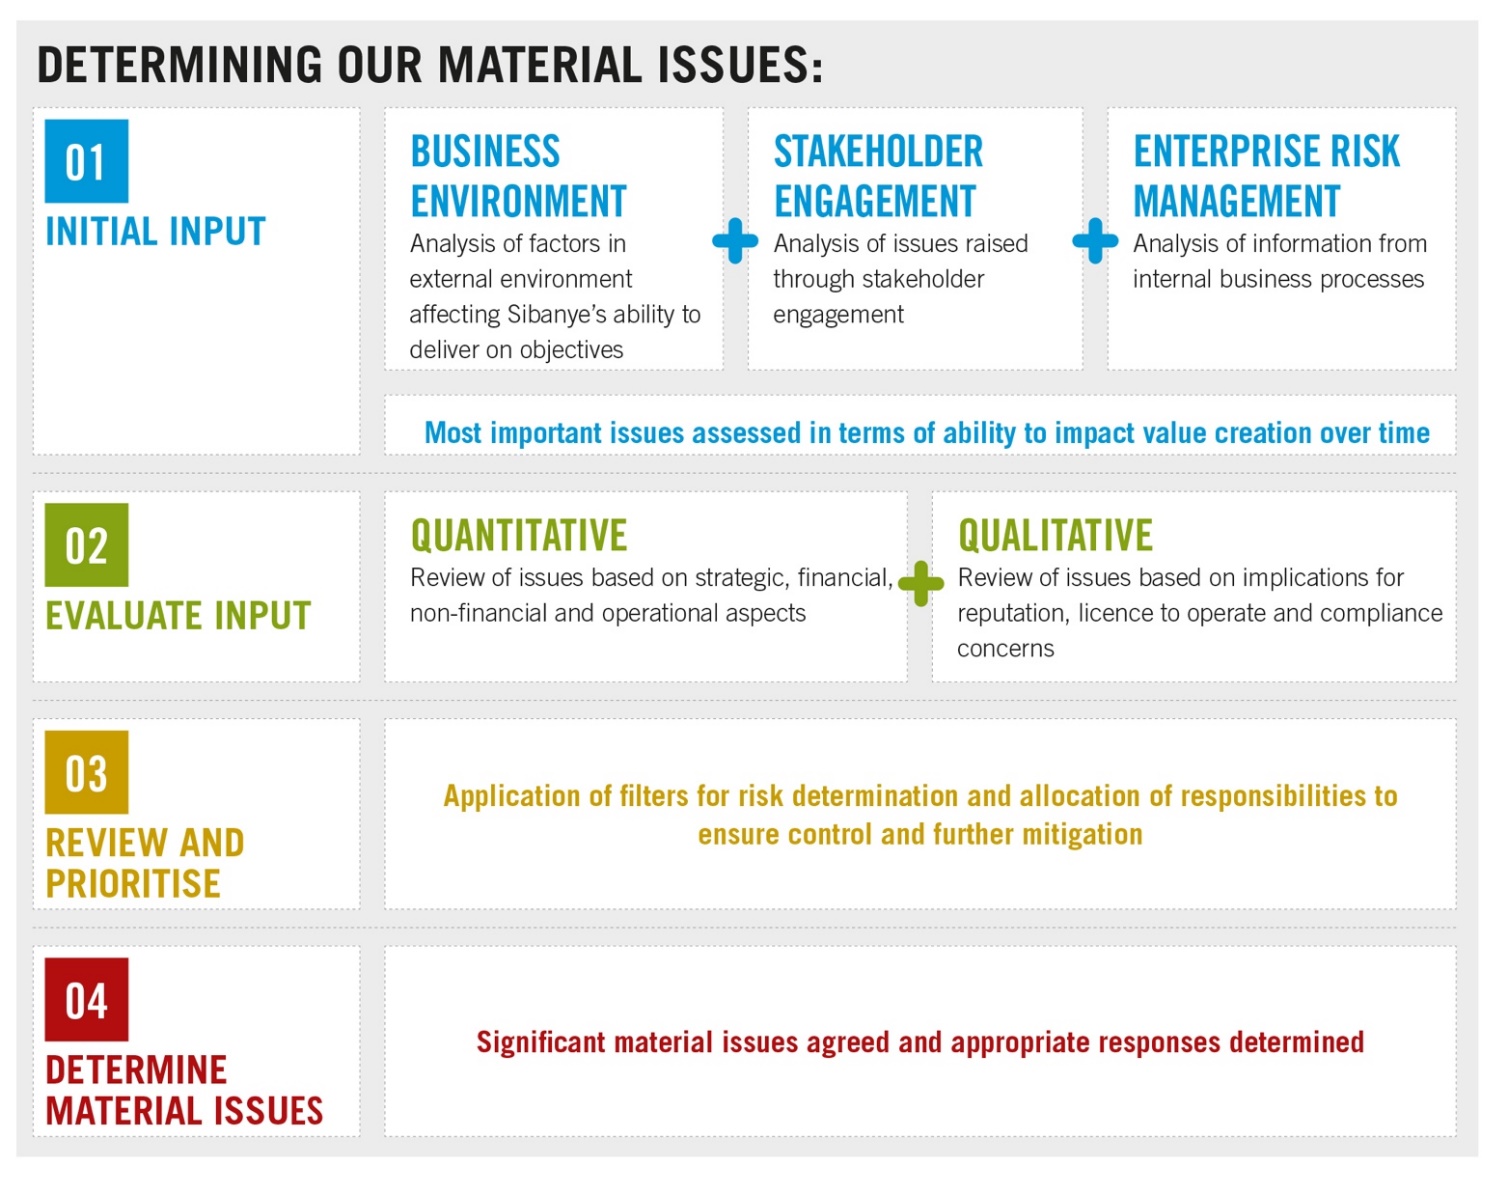
| |
Sibanye Integrated Annual Report 2016 | 24 |
OUR TOP 10 Material ISSUES
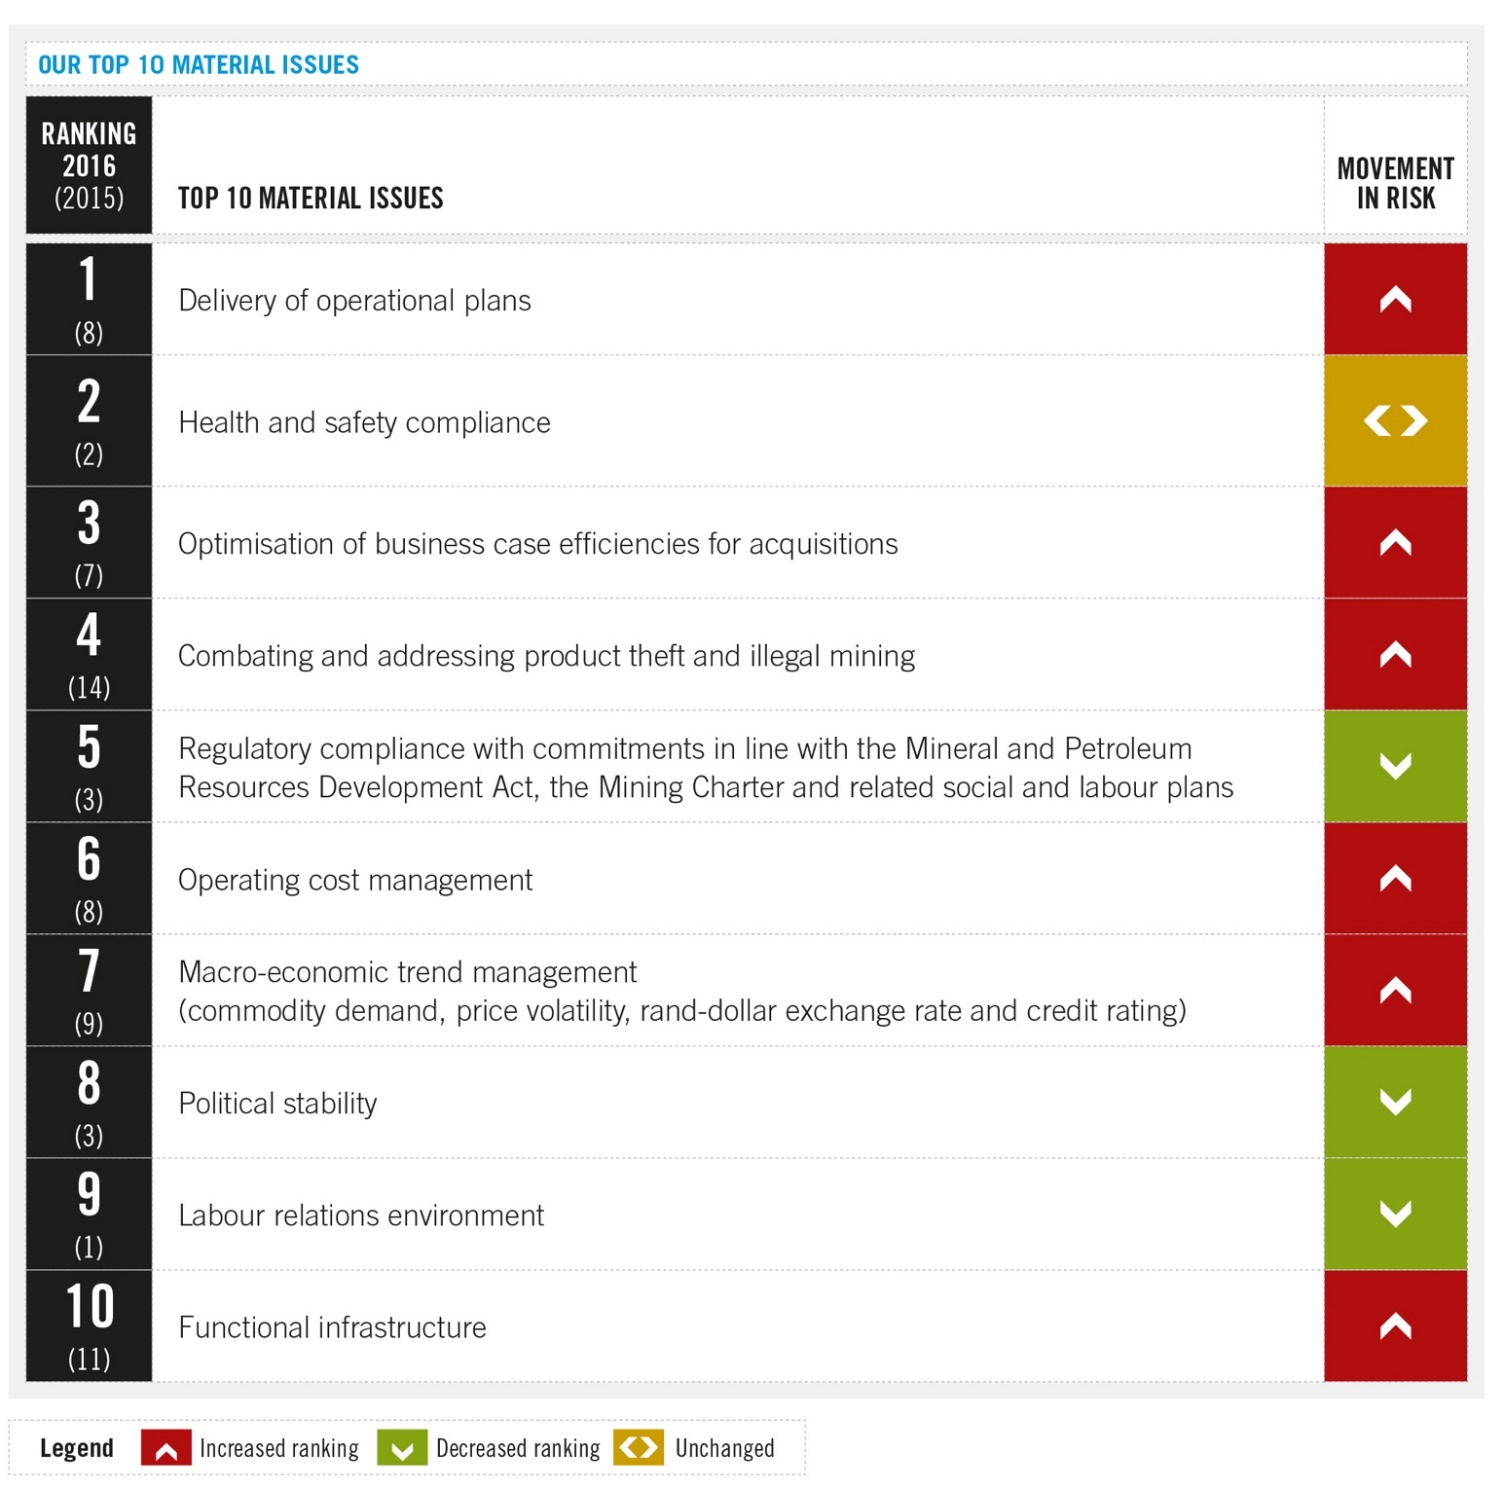
The detail related to each risk, its context, potential consequences and what action Sibanye has taken in mitigation, is given on the following pages. This is followed by analysis of the external business environment, the enterprise risk management process and stakeholder engagement to provide more context on how Sibanye’s material issues are determined.
| |
Sibanye Integrated Annual Report 2016 | 25 |
TOP 10 MATERIAL ISSUES
| | | | |
Risk | Context and related opportunity | Potential consequences | Response/mitigation | For further information: |
1. Delivery of operational plans | Achieving operational plans and targets is essential to Sibanye’s sustained profitability and ability to create value. | • Failure to achieve production and operating targets affects profitability and value creation for stakeholders • Strict management of costs is essential to maintaining positive operating margins and profitability | • Regular monitoring of all internal and external variables that may have an adverse impact in Sibanye’s ability to meet operational plans and targets, ultimately creating value. These variables include, among others, productivity targets, face length availability and mining flexibility, commodity grade mined and unit costs – also refer to risk 6 • Strategic and operational business plans are adjusted and aligned to changes in variables | —View from the top—Chief Executive’s review —View from the top—Chief Financial Officer’s review —Performance review—Creating value from our operations, projects and technology |
2. Health and safety compliance | Underground mining exposes miners to, among others, heat, dust, noise and injury from fall of ground. Stringent health and safety laws and regulations are in place. Safety accidents, and related investigations and stoppages adversely affect production and costs, while the industry is still experiencing the negative effects of the HIV/AIDS pandemic. | • Non-compliance with applicable health and safety laws and regulations results in safety-related work stoppages, fines and penalties, impacting profitability • Loss of investor confidence as investors do not want to invest in companies that cannot manage their health and safety matters effectively • Employee morale and confidence in management affected, which in turn affects productivity | • Integrated safety and health plans and systems in place • Safety is included in the values underpinning Sibanye’s business • Dedicated CEO’s safety sub-committee established • Line management accountability increased with renewed commitment to improve safety performance and ensure rigorous compliance with laws, regulations, standards and procedures • Ongoing monitoring and root cause analysis of safety incidents conducted to ensure that root causes are addressed • Application of engineering and technology to make the workplace safer | —View from the top—Chief Executive’s review —Performance review—Health and safety focus —Performance review—Creating value from our operations, projects and technology |
| |
Sibanye Integrated Annual Report 2016 | 26 |
| | | | |
Risk | Context and related opportunity | Potential consequences | Response/mitigation | For further information: |
3. Optimisation of business case efficiencies for acquisitions | The platinum assets acquired in 2016 will enable Sibanye to leverage its core competencies in deep-level hard rock mining, diversify its business activities and reduce its dependence on a single commodity. | There will be financial and reputational implications should the company be unable to optimise operating efficiencies at the acquired operations | • Integration plan implemented to effectively and efficiently integrate the recently acquired platinum operations. Progress being closely monitored to ensure achievement of synergies, operational and strategic targets • Platinum operations have an experienced and competent management structure • Dedicated employee and primary stakeholder engagement undertaken and concerns addressed to ensure operational continuity and minimise uncertainty | —View from the top—Chief Executive’s review —View from the top—Chief Financial Officer’s review —Performance review—Creating value from our operations, projects and technology |
4. Combating and addressing product theft and illegal mining | Illegal mining impacts Sibanye on the surface and in its underground working areas. These activities are difficult to control, are disruptive and expose the business to liability. This negatively impacts employees, production and profitability. Theft includes
gold-bearing material, explosives, copper from the plants and shafts. | • Theft and illegal mining are disruptive on surface and underground, exposing the company to financial loss, and negatively impacting employees, production, costs, margins and profitability • Illegal mining underground also affects safety, infrastructure and operating schedules | • Enhanced security systems implemented involving increased security guard complements, stricter access controls and the use of biometrics • Severe disciplinary action is taken against employees found to be involved • A dedicated task team appointed to implement a plan to address the illegal mining at Sibanye’s operations | |
| |
Sibanye Integrated Annual Report 2016 | 27 |
| | | | |
Risk | Context and related opportunity | Potential consequences | Response/mitigation | For further information: |
5. Regulatory compliance with commitments in line with the Mineral and Petroleum Resources Development Act, the Mining Charter and related social and labour plans | The South African mining sector is governed by legislation to redress the social and economic imbalances of the past. Mineral rights are subject to legislation. The MPRDA and Mining Charter, create a framework for the transformation of the mining industry but increase the risk of non-compliance and handicap Sibanye’s ability to deliver value. | • Failure to deliver on the requirements, targets and related commitments could result in the suspension or withdrawal of Sibanye's mining licences and prospecting rights • Ability to deliver on Sibanye's strategic objectives can be impeded by unexpected and ill-considered legislative and regulatory changes • The new Mining Charter’s release date is unknown and compliance with new/amended provisions may be a challenge | • Maintaining sound relations with the regulator, the DMR, is important particularly regarding licensing conditions. Engagement relates to directives and instructions issued, suspensions and cancellation of mining rights • Awaiting outcome of declaratory order regarding ownership clause in the Mining Charter • Complying with the Mining Charter (2014) as it currently stands • Close monitoring, auditing of compliance and reporting on progress made in achieving targets agreed in the social and labour plans relating to transformation, mine community development among others | —View from the top—Chief Executive’s review —Performance review—Superior value for our workforce —Performance review—Health and safety focus —Performance review—Social upliftment and community development —Performance review—Minimising our environmental impact Annual Financial Report—Accountability—Corporate governance report |
6. Operating cost management | Increasing costs – of power and labour in particular –affect operating margins, inhibit cash flow, profitability and consequently Sibanye’s ability to pay dividends. | Excessive increases in costs could have dire consequences for delivery on operational plans, operating margins and the profitability of individual shafts, resulting in closure, loss of jobs (retrenchments) and a reduction in reserves. | • Strategic and operational planning processes implemented • Strict management, monitoring and control of costs • Planning based on conservative assumptions • Frequent, regular review of costs, strategic and operational plans • Focused engagement with suppliers regarding costs and strategic procurement initiatives | —View from the top—Chief Executive’s review —View from the top—Chief Financial Officer’s review —Performance review—Creating value from our operations, projects and technology |
| |
Sibanye Integrated Annual Report 2016 | 28 |
| | | | |
Risk | Context and related opportunity | Potential consequences | Response/mitigation | For further information: |
7. Macro-economic trend management
(commodity demand, price volatility, rand-dollar exchange rate and credit rating) | • Revenue earned is largely determined by commodity prices set in US dollars and the rand-dollar exchange rate. These prices are subject to global market fluctuations. Changes in these parameters can pose either a risk or an opportunity • The newly acquired platinum operations give commodity prices exposure to both gold and platinum | Operational and business planning could be based on unrealistic commodity prices and exchange rates leading to losses. | • To counter the effects of market volatility, Sibanye’s business and operating model focuses on: • Optimising capital expenditure • Reducing costs and pay limits • Optimising LoM plans • Closely monitoring commodity prices, exchange rates, the global economy and related events and trends likely to have an impact • Reviewing business and operational plans in line with global economic trends at monthly operational meetings | —View from the top—Chief Executive’s review —View from the top—Chief Financial Officer’s review |
8. Political stability | As a company domiciled in South Africa, political uncertainty and volatility could have a negative impact on Sibanye’s investment and credit ratings. | • Increased legislative burden and related uncertainty can impact delivery on operational targets, profitability and capacity to meet socio-economic commitments • Accompanying demands for resource nationalisation and related politicisation have implications for the country’s ratings | • Comprehensive detailed compliance systems are in place to monitor regulatory and legislative changes • Related training and reviews undertaken to ensure compliance • Strategic planning processes in place • Regular engagement with the regulators and national authorities • Improved stakeholder relations through effective communication and engagement | —View from the top—Chief Executive’s review —The macro-economic environment |
9. Labour relations environment | • Labour unrest can result in work stoppages, impact operational efficiency, company performance and negatively affect financial performance • Despite having experienced less labour unrest in 2016 than in 2015, it remains a material risk • Integration of the platinum workforce presents a new dynamic in this relationship • Good relations with employees and their unions help to minimise the risk of labour disputes and unrest, inter-union rivalry and work stoppages | Union rivalry and unrealistic wage demands lead to labour unrests and industrial action that affect Sibanye’s productivity, operational efficiencies and performance. | • Consistent, regular, honest engagement with employees and unions • Three-year wage agreement in place at gold operations, in effect until 2018 • Two-year wage agreement secured at Rustenburg operations • Kroondal’s wage agreement expires in 2017 • Continuous monitoring of industrial relations at Sibanye and within the broader mining sector to identify reasons for any discontent and potential labour unrest | —View from the top—Chief Executive’s review —Performance review—Creating value from our operations, projects and technology —Performance review—Superior value for our workforce |
| |
Sibanye Integrated Annual Report 2016 | 29 |
| | | | |
Risk | Context and related opportunity | Potential consequences | Response/mitigation | For further information: |
10. Functional infrastructure | • Fully functioning mining and engineering infrastructure are essential to Sibanye’s business • Ageing and inadequately maintained infrastructure can result in unplanned breakdowns and stoppages resulting in production targets not being met and increased costs | Incidents resulting in operational stoppages affect production, increase costs, compromise safety and negatively affect Sibanye’s ability to deliver on its strategic and operational targets. | • A maintenance risk register is updated and reviewed regularly • Regular inspections are conducted of shaft infrastructure and other essential equipment to ensure that proactive steps can be taken to identify and address any potential weaknesses • Capital expenditure is allocated to ensure that infrastructure is in good repair and that operations are not compromised | —View from the top—Chief Executive’s review —Performance review—Creating value from our operations, projects and technology |
For further details on Sibanye's risks, see “Further Information—Risk Factors”.
Stillwater transaction
The proposed transaction to acquire Stillwater was announced on 9 December 2016. The particular risks and opportunities pertaining to this acquisition have not been specifically included in the material issues table above. Shareholders will have the opportunity to vote in favour of the transaction (majority of votes cast required) and the increase of authorised and issued capital for the proposed rights offer (75% of votes cast required) during a general meeting scheduled for 25 April 2017. See “—View from the top—Chief Executive’s review” which highlight the opportunities that Stillwater brings to the Sibanye Group.
An analysis of the business environment, our enterprise risk management and stakeholder engagement are presented below to provide the context in which Sibanye's material issues are determined.
the MACRO-economic ENVIRONMENT*
GLOBAL FACTORS THAT COULD AFFECT SIBANYE’S PROSPECTS
The external business environment has a significant impact on how Sibanye does business and on profitability. We can have little influence on the global macro economic environment, such as the gold market, but we can mitigate other external impacts on our business by managing stakeholder expectations and ensuring our social licence to operate. Transparent and consistent engagement with all stakeholders is key in this regard.
The past year was characterised by political uncertainty and flat growth. Having begun the year at US$1,077/oz, gold prices reflected this uncertainty, peaking in July following the results of the British referendum, Brexit, at US$1,366/oz. The price had retreated to US$1,145/oz by year-end on the new US president’s growth-boosting rhetoric, based on which the dollar has strengthened on heightened expectations of an increase in US interest rates. Nevertheless, the fundamentals of supply and demand in the gold market remain in place.
Global political uncertainty is expected to continue in 2017, given elections in France, the Netherlands and Germany, and gold prices are likely to remain volatile, given the “safe-haven” nature of the commodity. Compounding this uncertainty are expectations regarding US interest rate hikes that may negatively impact gold prices as investors favour higher yielding assets.
Following President Trump’s surprise election victory in the US, few details are known about his policy agenda, his priorities, and whether or not he can deliver. Increasingly protectionist measures proposed by President Trump may create friction between the US and its trading partners. In time, this may create further uncertainty. However, White House tax reform and a rising interest rate cycle are likely to be positive for riskier asset classes. In the meantime, equities and gold have performed strongly but a clearer idea of President Trump’s long-term agenda is required to form a constructive view on gold prices going forward. US policy framework is likely to be the key driver of emerging market sentiment in 2017, affecting equities and precious metals markets.
Aside from the US, the greatest political risk is linked to the European Union (EU) where growth is forecast to improve slightly to 1.5% in 2017. The British Brexit vote galvanised initial rumblings of political upheaval in the EU over the course of 2016. Populist uprising in the region is expected to influence markets into 2017 and investors remain nervous about Eurozone politics. Brexit, the second worst GBP crisis in four decades, has shaken investor confidence across the region and materially increased the potential for the EU to break up.
* Source: JP Morgan
SOUTH AFRICA’S MACRO-ECONOMIC ENVIRONMENT
South African economic growth has contracted sharply over the past couple of years due to the underperformance of the primary and secondary sectors, the effect of the severe and prolonged drought on agricultural output, stagnation of manufacturing output, resulting in consolidation and rationalisation in the mining sector. GDP growth for 2016 was 0.4%, improving to 1.0% in 2017 and 1.5% in 2018.
| |
Sibanye Integrated Annual Report 2016 | 30 |
Stakeholder engagement and risk mitigation
Stakeholder engagement is a two-way process. While engagement is essential in identifying potential material issues, it is also a critical mitigation tool. Effective stakeholder engagement can mitigate many such issues facing the company by reducing their impact and likelihood. The optimising of opportunities depends on our maintaining good and credible relations with stakeholders. Constructive, meaningful relationships with stakeholders are critical to retaining our social licence to operate. Among others:
| · | | Successful integration of our acquisitions depends on good relationships with employees, unions and the local community, among others (see issue 3) |
| · | | To minimise safety-related work stoppages in terms of section 54, we need to have positive relationships with the Department of Mineral Resources and health and safety inspectors (see issue 2) |
| · | | Good relations with employees and unions will enable us to better manage and limit any industrial action (see risk 9) |
| · | | Close collaboration with local municipalities and other community structures is an important aspect of socio-economic development project planning and implementation |
Prioritising proactive, tailored and consistent engagement with concerned, key stakeholders helps to pre-empt any negative consequences. A comprehensive communications strategy is in place to oversee stakeholder engagement and manage expectations.
As a responsible corporate citizen, Sibanye fosters and maintains constructive engagement with all stakeholders in order to deliver on our vision to create superior value for all stakeholders, to maintain our licence to operate, and ultimately for the long-term success and sustainability of the business.
STAKEHOLDERS AND RELATED CONCERNS
| | |
Stakeholders | Related issues | Sibanye’s response and form of engagement |
Investors and market analysts | Stakeholder concerns: • Achievement of operational, financial and strategic targets, costs and operational performance • Consistent and transparent growth strategy • Acquisitions – progress made on their integration and optimisation of processes • Safety performance • Labour unrest and productivity • Mining licences – regulatory compliance and delivery on commitments • Infrastructure maintenance and related capital expenditure • Stillwater acquisition • Political and country risk and impact on Sibanye’s ability to conduct its business profitably and sustainably • Impact of global macro-economic trends • Impact of theft and illegal mining Sibanye’s concerns: • Achieving operational and growth targets • Maintaining premium rating and ability to create value and pay dividends | • Regular, structured engagement, including six-monthly operational and financial updates at which investors can engage directly with management (webcast and conference calls). A biennial investor day was held during 2016 • Attendance at investor conferences and one-on-one meetings as and when necessary • Also communicate by email and telephonically • Regular site visits conducted • All investor-related engagement complies with the regulations of our exchange listings |
Suppliers and contractors | Stakeholder concerns: • Long-term sustainability of Sibanye’s business which is a function of: - Achieving operational, financial and strategic targets - Operational and cost performance as they relate to the sustainability of the business Sibanye’s concerns: • Productivity, contractors specifically, • Containing increases in costs • Mining licence commitments in terms of preferential procurement and Mining Charter targets, especially as related to the development and growth of SMMEs and skills enhancement | Categorised into three groups: • Strategic, with whom engagement is high-level and interactive • Tactical, where engagement is conducted at an operational level and managed by supply chain in line with our procurement policy • Local, includes SMMEs, and involves close, active engagement aimed at developing and supporting these suppliers to enable them to grow and play an active, sizeable role in our supply chain |
| |
Sibanye Integrated Annual Report 2016 | 31 |
| | |
Stakeholders | Related issues | Sibanye’s response and form of engagement |
Chamber of Mines
and peers | Sibanye’s concerns: • Impending release of new Mining Charter, and in particular the ownership and other legislation that is pending such as the proposed carbon tax • Safety and health • Industry-wide labour relations • Community engagement • Wage negotiations • Illegal mining and theft, as an industry-wide issue | • A member of the Chamber of Mines, which expedites peer engagement, lobbies national government on behalf of industry and protects its collective interests • Co-operation with peers on non-competitive issues of common interest in the broader mining sector and with fellow gold and platinum mining companies in particular • On behalf of the industry, including Sibanye, the Chamber petitioned the High Court for a declaratory order on the empowerment clause in the Mining Charter • Sibanye participates in the mining aspect of government’s Mining Phakisa project |
Employees and organised labour | Stakeholder concerns: • Increased wages and benefits • Sustainable employment and job security • Accommodation and living conditions • Skills development • Indebtedness Sibanye’s concerns: • Safety and health • Costs and operational performance – achieving targets as this relates to the sustainability of the business and capacity to pay higher wages and bonuses • Optimisation of processes • Labour unrest, inter-union rivalry and productivity • Skills retention | Engagement varies, based on the nature of the issue and level of employee and is generally constructive, values-based and collaborative • Great effort is made to ensure direct lines of communication • Allied to this is formal engagement with organised labour. • Care for Imali • Housing programme • Safety and Health policy and related framework |
Communities and consultative forums Includes municipalities communities and multi-stakeholder forums, as well as NGOs, in close proximity to and affected by our operations as well as in labour-sending areas, where municipalities and development agencies are engaged | Stakeholder concerns: • Community expectations, especially those in the vicinity of our Rustenburg operations • Employment opportunities • Local procurement and enterprise development • Local economic development • Legacy health issues (silicosis) • Environmental impacts of mining Sibanye’s concerns: • Illegal mining • Skills | • Particular focus on engagement with the Rustenburg communities • Communities are a key partner in delivery on SLP commitments relating to mine community development and supply chain opportunities • Projects planned in consultation with local municipalities who are apprised of progress and updates • Identifying, discussing and resolving issues affecting communities • Establishing forums to engage with elected community representatives to address issues raised by the community |
| |
Sibanye Integrated Annual Report 2016 | 32 |
| | |
Stakeholders | Related issues | Sibanye’s response and form of engagement |
Regulators, national, provincial and local government Involves all levels of government and various government departments at a regional level - environmental affairs, water and sanitation, labour, health and education, among others. At national level, engagement is as-and-when-necessary | Stakeholder/Sibanye concerns: • Employee safety and health • Costs and operational performance – health of company • Integration of acquisitions • Labour relations, wage negotiations and productivity • Regulatory compliance, specifically with SLP commitments and Mining Charter requirements targets, including among others, procurement, transformation, mine community development, housing and living conditions • Legacy health issues • Environmental compliance | Maintaining regular, transparent engagement at all levels of interaction with the authorities and regulators |
enterprise risk management
Risk management is a continuous, proactive and dynamic process designed to identify, understand, manage and communicate risks that may have a negative impact on Sibanye’s ability to achieve its business objectives.
Sibanye’s risk-management policies, practices and systems are reviewed annually by the Board’s Risk Committee and approved by the Board. The risk management process is embodied in Sibanye’s enterprise risk management (ERM) framework, which is aligned with the King III code of corporate governance and International Organization for Standardization (ISO) 31000 standards, and are embedded within the operations of the company.
BOARD RESPONSIBILITY
The Board is satisfied that governance, risk management, compliance, internal control and compliance with the Sarbanes-Oxley Act (SOX) of 2002 as well as internal audit processes operated effectively for the period under review. Business activities were managed within approved risk-tolerance and risk-appetite levels. Primary controls have been implemented and continuous review undertaken to refine and improve them.
RISK MANAGEMENT
The risk management process is a systematic application of management policies, procedures and practices in communicating, consulting and establishing the context, identifying, analysing, evaluating, treating, monitoring and reviewing risk. The risk policy, plan and charter set out the requirements for effective oversight of risks, including the identification, assessment, evaluation, treatment and reporting of risks. Sibanye’s ERM process combines operational and strategic risk processes.
| |
Sibanye Integrated Annual Report 2016 | 33 |
CREATING VALUE FROM OPERATIONS, PROJECTS AND TECHNOLOGY
Mining is our core business activity. The performance of our operations is key to our vision to create superior value for all stakeholders. Our future lies in our reserves and resources while our investment in technology aims to deliver a profitable long-term future by allowing the safe extraction of previously inaccessible resources.
OPERATIONS
APPROACH
Efficient management of its operations has enabled Sibanye to pay industry-leading dividends to shareholders and deliver significant value to other stakeholders since it listed in 2013 (details on value add to other stakeholders is available in “—Performance overview—Social upliftment and community development—Highlights of 2016”). The integration of the platinum operations acquired in 2016 will enable sustainable delivery of further value and allow the Group to capitalise on further value-accretive opportunities in the mining sector.
Sibanye’s operating model is based on implementing fundamental mining practices and flat, cost-efficient structures designed to optimise and sustain operational performance. The Group has a proven operational track record of managing complex mines and is confident that, by applying its operating model and mining capability to new acquisitions and projects, it can continue to realise value for stakeholders.
PERFORMANCE
Sibanye has successfully restructured and optimised its gold operations since 2013, significantly extending their economic lives. Initial restructuring resulted in a meaningful increase in production and decrease in operating costs. Further cost reductions at these assets are likely to be more incremental.
Capital investment in the sustainability of our operations continues. The decline projects at Driefontein and Kloof will extend the life of these mines and sustain production in the longer term.
The integration of the platinum operations (Kroondal, Mimosa, Platinum Mile as well as the Rustenburg assets) is a primary focus. Our operating model is based primarily on initially reducing then managing those costs that are under our control, thereby lowering pay limits (or the break-even grade at which the operations can be profitably mined). This contributes to greater operational flexibility and improved cash margins. Key elements of the optimisation process include continuous re-engineering of the business, and the introduction and adherence to planned return cut-off, ore reserve-management principles.
The daily efforts of our workforce and other stakeholders are key to our success. Our focus on employee safety and health is set out in “—Performance overview—Health and safety focus” while our approach to employee engagement can be found in “—View from the top—Material risks and opportunities—Stakeholder engagement and risk mitigation—Stakeholder and related concerns—Employees and organised labour”.
| |
GOLD DIVISION Overall, operational performance in 2016 was solid. Gold production in 2016 remained stable year-on-year despite numerous safety stoppages in the first half of the year and the closure of the unprofitable Cooke 4 shaft after August 2016, which resulted in a 599kg reduction in gold produced by the Cooke operations year on year. Kloof produced 1,142kg more gold than in 2015 by improving throughput and yield following a renewed focus on mining quality factors, which resulted in a 16% higher mine call factor. At Driefontein, production was 7% lower year-on-year due to safety stoppages, infrastructure issues and power outages. Beatrix production was lower due to the lower volumes from the higher-grade Beatrix 4 shaft being processed. Annual gold production variance (kg) | 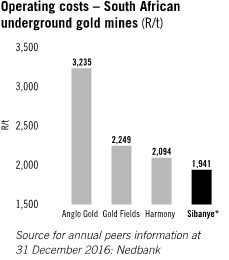
|
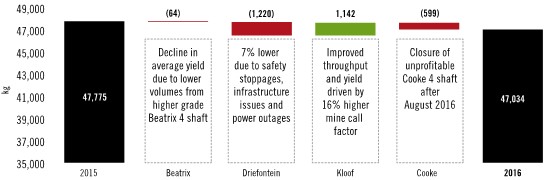
| |
| |
Sibanye Integrated Annual Report 2016 | 34 |
Given the safety incidents, stoppages and engineering challenges that impacted performance at the gold operations during the year, Sibanye did not achieve its original targets for costs and gold production. In the Gold Division, costs were well contained during the year with the division being the lowest cost gold producer in South Africa, with an average operating cost of R862/t and an average all-in sustaining cost of R450,152/kg (US$954/oz). In the Gold Division, two thirds – R2,394 million (2015: R2,305 million) – of total capital expenditure by the division of R3,824 million (2015: R3,345 million) was spent on ore reserve development to maintain operational flexibility, in line with our operating model, while R684 million (2015: R669 million) was expended on sustaining operations and infrastructural maintenance (one of our material issues). Following a review of capital requirements, planned capital expenditure for Burnstone was reduced by around R300 million for 2017. | 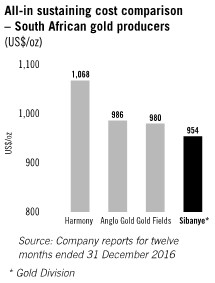
|
ESTABLISHING THE PLATINUM DIVISION
Since taking ownership, the platinum operations bought from Aquarius (Kroondal, Mimosa and Platinum Mile) continued to perform optimally as did the Rustenburg operations, for the two months of ownership in 2016. The Platinum Division posted an operating profit of R74 million for the two months.
The integration of the platinum assets has thus far been encouraging, with the Aquarius assets continuing to operate according to expectation since their acquisition. The Rustenburg Operations, acquired effective 1 November 2016, recorded a pleasing operational turnaround in the last quarter of the year after a difficult first nine months, prior to their acquisition.
Overall, the Platinum Division delivered attributable production of 420,763oz (4E) at an average operating cost of R10,260/4Eoz (US$701/4Eoz), or an average operating margin of 10%, for the nine months from April to December 2016. The division generated operating profit of R376 million1 (US$26 million) in 2016. Mimosa, which is equity-accounted, generated an operating profit of R254 million.
The Group has previously indicated that it expects to realise operational synergies of approximately R800 million annually from the combined Aquarius and Rustenburg operations over a three-year period. The first steps in achieving these synergies have begun with approximately R400 million in synergies expected to be achieved by 2017 year-end.
A Section 189 process at the Platinum Division was announced on 26 January 2017.
Steps taken at the Rustenburg Operation to achieve near-term profitability include:
| · | | Aligning development to maintain current production levels |
| · | | Implementing operational and cost efficiency improvements |
| · | | Implementing previously identified synergies with shared services and breaking down mine boundaries |
In the Platinum Division, R327 million of sustaining capital was spent. The division’s growth capital is being reviewed as we assess its requirements. Expenditure at the Rustenburg Operations has been reduced in line with planned production levels, with total planned capital expenditure for the division of R90 million estimated for 2017.
Attributable PGM production profile – 4E ounces2
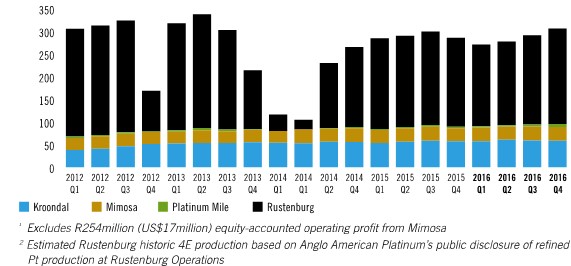
| |
Sibanye Integrated Annual Report 2016 | 35 |
Key statistics by operation
| | | | | | | | | | | | | |
Figures in million - SA rand | Group | Gold Division | Driefontein | Kloof | Beatrix | Cooke | Corporate
and
reconciling
items | Platinum Division1 | Kroondal | Platinum
Mile | Mimosa | Rustenburg Operations | Corporate
and
reconciling
items |
31 December 2016 | | | | | | | | | | | | | |
OPERATING RESULTS | | | | | | | | | | | | | |
Ore milled (000t) | | 20,181 | 5,971 | 4,676 | 4,333 | 5,201 | | 11,611 | 2,732 | 5,669 | 1,012 | 2,198 | |
Underground | | 8,084 | 2,055 | 2,009 | 2,862 | 1,158 | | 4,948 | 2,732 | | 1,012 | 1,204 | |
Surface | | 12,097 | 3,916 | 2,667 | 1,471 | 4,043 | | 6,663 | - | 5,669 | - | 994 | |
Yield (g/t) | | 2.33 | 2.70 | 3.25 | 2.32 | 1.09 | | 1.72 | 2.48 | 0.65 | 3.57 | 2.69 | |
Underground | | 5.21 | 6.77 | 6.82 | 3.35 | 4.19 | | 2.99 | 2.48 | | - | 3.65 | |
Surface | | 0.41 | 0.56 | 0.56 | 0.30 | 0.20 | | 0.78 | - | 0.65 | 3.57 | 1.53 | |
Gold produced (kg) | | 47,034 | 16,130 | 15,210 | 10,041 | 5,653 | | | | | | | |
Underground | | 42,078 | 13,920 | 13,704 | 9,601 | 4,853 | | | | | | | |
Surface | | 4,956 | 2,210 | 1,506 | 440 | 800 | | | | | | | |
Gold sold (kg) | | 46,905 | 16,046 | 15,176 | 10,041 | 5,642 | | 13,087 | 5,543 | 425 | 2,833 | 4,286 | |
Underground | | 41,960 | 13,836 | 13,670 | 9,601 | 4,853 | | 12,092 | 5,543 | | 2,833 | 3,716 | |
Surface | | 4,945 | 2,210 | 1,506 | 440 | 789 | | 995 | - | 425 | - | 570 | |
Revenue (R/kg) | | 586,319 | 585,884 | 585,853 | 585,997 | 595,923 | | 287,339 | 355,999 | 308,471 | 431,768 | 386,374 | |
Total cash cost (R/kg) | | 377,034 | 355,416 | 340,762 | 381,625 | 527,916 | | | | | | | |
All-in cost (R/kg) | | 472,585 | 424,872 | 435,609 | 453,232 | 595,959 | | | | | | | |
All-in cost margin (%) | | 19 | 28 | 26 | 23 | (1) | | | | | | | |
Operating cost (R/t) | | 862 | 937 | 1,080 | 866 | 575 | | 373 | 619 | 16 | 958 | 720 | |
Underground | | 1,941 | 2,374 | 2,300 | 1,246 | 2,268 | | 832 | 619 | - | 958 | 1,209 | |
Surface | | 140 | 182 | 162 | 126 | 90 | | 33 | - | 16 | - | 128 | |
FINANCIAL RESULTS (R million) | | | | | | | | | | | | | |
Revenue | 31,240.7 | 27,501.3 | 9,401.1 | 8,890.9 | 5,883.9 | 3,362.2 | (36.8) | 3,739.4 | 1,973.3 | 131.1 | 1,223.2 | 1,656.0 | (1,244.2) |
Underground revenue | 28,026.5 | 24,608.4 | 8,105.3 | 8,012.6 | 5,626.9 | 2,900.4 | (36.8) | 3,418.1 | 1,973.3 | - | 1,223.2 | 1,465.8 | (1,244.2) |
Surface revenue | 3,214.2 | 2,892.9 | 1,295.8 | 878.3 | 257.0 | 461.8 | - | 321.3 | - | 131.1 | - | 190.2 | - |
Operating costs | (20,709.1) | (17,346.0) | (5,566.6) | (5,041.0) | (3,753.4) | (2,985.0) | - | (3,363.1) | (1,689.8) | (90.8) | (969.0) | (1,582.5) | 969.0 |
Underground operating costs | (18,800.6) | (15,655.1) | (4,852.1) | (4,609.4) | (3,567.4) | (2,626.2) | - | (3,145.5) | (1,689.8) | - | (969.0) | (1,455.7) | 969.0 |
Surface operating costs | (1,908.5) | (1,690.9) | (714.5) | (431.6) | (186.0) | (358.8) | - | (217.6) | - | (90.8) | - | (126.8) | - |
Operating profit | 10,531.6 | 10,155.3 | 3,834.5 | 3,849.9 | 2,130.5 | 377.2 | (36.8) | 376.3 | 283.5 | 40.3 | 254.2 | 73.5 | (275.2) |
Underground | 9,225.9 | 8,953.3 | 3,253.2 | 3,403.2 | 2,059.5 | 274.2 | (36.8) | 272.6 | 283.5 | - | 254.2 | 10.1 | (275.2) |
Surface | 1,305.7 | 1,202.0 | 581.3 | 446.7 | 71.0 | 103.0 | - | 103.7 | - | 40.3 | - | 63.4 | - |
Amortisation and depreciation | (4,041.9) | (3,814.7) | (1,012.9) | (1,190.7) | (818.0) | (770.8) | (22.3) | (227.2) | (136.2) | (1.2) | (223.7) | (58.6) | 192.5 |
Net operating profit | 6,489.7 | 6,340.6 | 2,821.6 | 2,659.2 | 1,312.5 | (393.6) | (59.1) | 149.1 | 147.3 | 39.1 | 30.5 | 14.9 | (82.7) |
Capital expenditure - total | (4,151.2) | (3,824.2) | (1,051.6) | (1,304.2) | (628.4) | (249.2) | (590.8) | (327.0) | (175.8) | (1.3) | (159.8) | (148.7) | 158.6 |
Sustaining capital expenditure | (1,010.5) | (683.5) | (218.5) | (261.2) | (84.8) | (48.9) | (70.1) | (327.0) | (175.8) | (1.3) | (159.8) | (148.7) | 158.6 |
Ore reserve development | (2,394.4) | (2,394.4) | (779.0) | (912.9) | (542.9) | (159.6) | - | - | - | - | - | - | - |
Growth projects | (746.3) | (746.3) | (54.1) | (130.1) | (0.7) | (40.7) | (520.7) | - | - | - | - | - | - |
1 The Platinum Division’s results for the year ended 31 December 2016 include the Aquarius assets for nine months following their acquisition in April 2016 and the Rustenburg Operations for two months, November and December 2016
| |
Sibanye Integrated Annual Report 2016 | 36 |
| | | | | | |
Figures in million - SA rand | Group | Driefontein | Kloof | Beatrix | Cooke | Corporate and reconciling items |
31 December 2015 | | | | | | |
OPERATING RESULTS | | | | | | |
Ore milled (000t) | 19,861 | 5,772 | 3,977 | 4,319 | 5,793 | |
Underground | 8,584 | 2,412 | 1,979 | 2,723 | 1,470 | |
Surface | 11,277 | 3,360 | 1,998 | 1,596 | 4,323 | |
Yield (g/t) | 2.41 | 3.01 | 3.54 | 2.34 | 1.08 | |
Underground | 5.02 | 6.36 | 6.49 | 3.51 | 3.65 | |
Surface | 0.41 | 0.60 | 0.61 | 0.34 | 0.21 | |
Gold produced/sold (kg) | 47,775 | 17,350 | 14,068 | 10,105 | 6,252 | |
Underground | 43,109 | 15,345 | 12,848 | 9,557 | 5,359 | |
Surface | 4,666 | 2,005 | 1,220 | 548 | 893 | |
Gold price (R/kg) | 475,508 | 474,697 | 475,647 | 476,546 | 475,768 | |
Total cash cost (R/kg) | 347,613 | 309,764 | 342,764 | 340,792 | 474,584 | |
All-in cost (R/kg) | 430,746 | 374,790 | 430,751 | 408,422 | 544,658 | |
All-in cost margin (%) | 9 | 21 | 9 | 14 | (14) | |
Operating cost (R/t) | 825 | 907 | 1,201 | 785 | 514 | |
Underground | 1,741 | 1,941 | 2,251 | 1,169 | 1,782 | |
Surface | 128 | 165 | 161 | 129 | 83 | |
FINANCIAL RESULTS (R million) | | | | | | |
Revenue | 22,717.4 | 8,236.0 | 6,691.4 | 4,815.5 | 2,974.5 | - |
Underground | 20,515.0 | 7,284.1 | 6,112.8 | 4,555.7 | 2,562.4 | - |
Surface | 2,202.4 | 951.9 | 578.6 | 259.8 | 412.1 | - |
Operating costs | (16,380.4) | (5,234.2) | (4,777.2) | (3,391.0) | (2,978.0) | - |
Underground operating costs | (14,940.8) | (4,681.2) | (4,454.9) | (3,184.5) | (2,620.2) | - |
Surface operating costs | (1,439.6) | (553.0) | (322.3) | (206.5) | (357.8) | - |
Operating profit | 6,337.0 | 3,001.8 | 1,914.2 | 1,424.5 | (3.5) | - |
Underground | 5,574.2 | 2,602.9 | 1,657.9 | 1,371.2 | (57.8) | - |
Surface | 762.8 | 398.9 | 256.3 | 53.3 | 54.3 | - |
Amortisation and depreciation | (3,636.6) | (1,142.6) | (1,029.3) | (739.4) | (704.6) | (20.7) |
Net operating profit | 2,700.4 | 1,859.2 | 884.9 | 685.1 | (708.1) | (20.7) |
Capital expenditure - total | (3,344.8) | (994.2) | (1,129.9) | (596.5) | (337.4) | (286.8) |
Sustaining capital expenditure | (668.9) | (249.2) | (225.6) | (86.1) | (92.9) | (15.1) |
Ore reserve development | (2,304.9) | (727.0) | (840.6) | (510.4) | (226.9) | - |
Growth projects | (371.0) | (18.0) | (63.7) | - | (17.6) | (271.7) |
FUTURE FOCUS
The operational focus in 2017 will be on ensuring that we achieve our production and safety targets. Integration of the Rustenburg assets into the Platinum Division, and implementation of Sibanye’s operating model and our values-based culture will continue. Realisation of cost and operational synergies in the Platinum Division will be a priority.
Gold production for the year ending 31 December 2017 is forecast at between 47,000kg and 48,000kg (1.51Moz and 1.54Moz)with total cash cost forecast between R385,000/kg and R395,000/kg (US$890/oz to US$910/oz) and an all-in sustaining cost of between R470,000/kg and R480,000/kg (US$1,080/oz and US$1,105/oz). Total capital expenditure for 2017, including Burnstone, is currently planned at approximately R4.0 billion (US$300 million). The dollar costs are based on an average exchange rate of R13.50/US$.
The Platinum Division is forecast to produce between 1.05Moz and 1.10Moz (4E) in 2017. The operating cost forecast for Kroondal is R10,500/4Eoz (US$780/4Eoz), for Mimosa at R11,400/4Eoz (US$845/4Eoz), for Platinum Mile R8,500/4Eoz (US$615/4Eoz) and for Rustenburg R11,800/4Eoz (US$875/4Eoz).
The total operating cost for the Platinum Division is forecast at between R11,150/4Eoz and R11,450/4Eoz (US$825/4Eoz and US$850/4Eoz).
Expected capital expenditure for 2017 is planned at approximately R900 million (US$67 million) or between R780/4Eoz and R850/4Eoz. Marketable (saleable) chrome production from Rustenburg is forecast to be approximately 400,000t.
PROJECTS
We invest and consider investing in projects which meet or exceed a real internal rate of return of 15%
Expenditure on organic growth projects in 2016 was R746 million (US$52 million), 70% of which was spent at the Burnstone project.
| |
Sibanye Integrated Annual Report 2016 | 37 |
As a result of the recent strength in the rand and its impact on operating margins for the gold industry, organic project capital expenditure has been reviewed. This includes a review of the planned 2017 capital profile at the UG2 project at Rustenburg, the Burnstone project and the West Rand Tailings Retreatment Project (WRTRP). Certain projects may be deferred or placed on care and maintenance until commodity prices sustainably improve and/or exchange rate volatility has subsided.
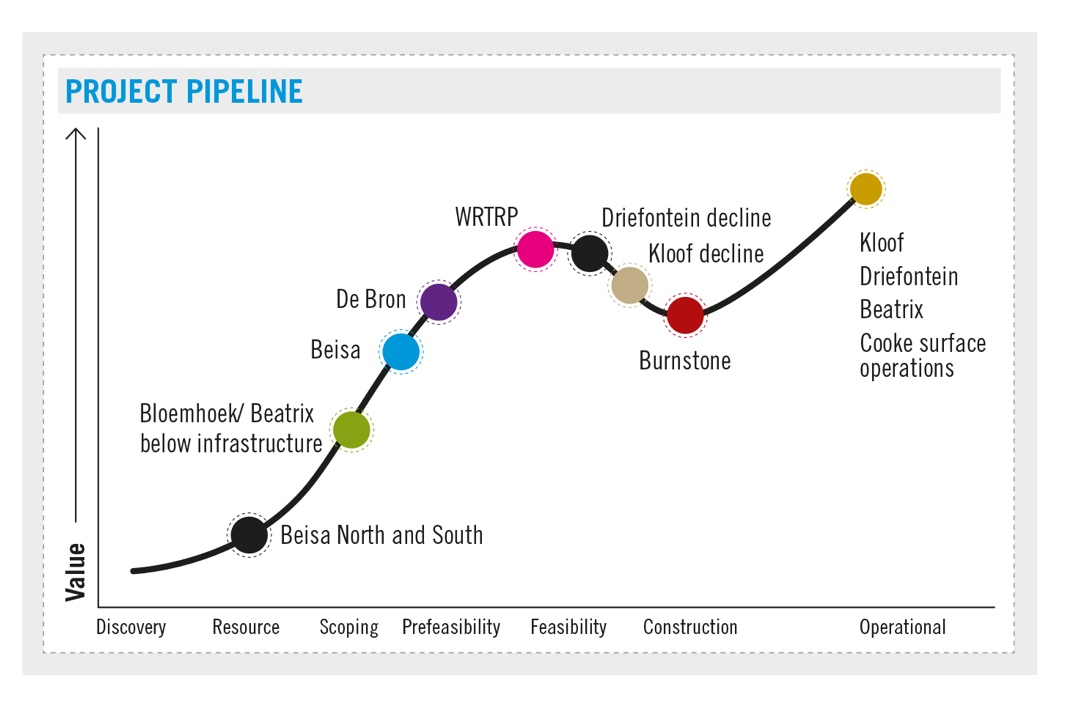
BURNSTONE
Burnstone is located in the South Rand Goldfield of the Witwatersrand Basin near the town of Balfour, approximately 75km east of Johannesburg in the Mpumalanga province of South Africa.
Sibanye acquired the Burnstone assets in April 2014, comprising two shaft complexes, namely the surface portal and mechanised vehicle access decline and the vertical shaft (shaft bottom at 495m below surface), as well as a 125,000tpm gold processing plant, the tailings storage facility and surface infrastructure to support a producing operation, albeit with areas still to be constructed.
Burnstone had previously produced approximately 38,000oz of gold before being placed on care and maintenance in mid-2012.
The Burnstone project feasibility study was approved by the Board for project execution in November 2015. The project is planned with a five-year build-up to steady-state production by 2021, then averaging 120,000oz annually for nine years till the end of 2029. Thereafter a 10-year period of decreasing but profitable production supports an initial 26-year life-of-mine plan, yielding 2.05Moz of gold production. This initial LoM plan was limited to approximately 60% of the total Burnstone resource as the mine design and schedule in the feasibility study were limited to mineable reserves within a 3km radius of the shaft infrastructure.
First gold production is planned in the second half of 2018 when there is sufficient on-reef development stockpiled (2.5 years) to start up the metallurgical plant, albeit at a reduced milling capacity. The full production run rate is planned to be achieved in 2021 and the total LoM project capital is estimated at R1,852 million (in 2015 terms).
In 2015, concurrent with completing the feasibility study, R272 million was spent on completing the mine-dewatering and permanent pumping infrastructure, re-aligning the shaft steelwork for rock-hoisting, and completing approximately 2km of development to commence accessing the orebody. The development was completed utilising the existing mechanised development machines which were first refurbished before being put back into production. Three development fleets of equipment were in production by year end.
In 2016, R531 million was spent in the first full year of the feasibility study build-up where the expenditure provided for:
| · | | 4,950m of development. In the fourth quarter, with all development fleets in production, 1,915m of the planned 2,100m was produced and the team’s performance has steadily improved |
| · | | mine infrastructure running costs |
| · | | planned project capital infrastructure |
| · | | procurement of additional mechanised mining fleets and ancillary support vehicles |
The budget for 2017 has been revised to R400 million – compared to an initial budget of R672 million – to deliver 6,000m of access development (this is a reduction from the feasibility study’s 8,300m of access development) and to run the mine in support of this revised plan and defer certain project infrastructure.
KLOOF DECLINE
The feasibility study for the Kloof below infrastructure decline project was approved by the Board for project execution in November 2015. The life-of-mine plan yields approximately 0.57Moz of gold in addition to that currently planned without the project and extends Kloof’s operating life by 2034.
| |
Sibanye Integrated Annual Report 2016 | 38 |
During 2016, the project programme and capital expenditure were re-assessed and a specialist mining contractor was appointed to deliver an accelerated project programme to first ore production. The Board approved project capital of R904 million which made provision for the mining contractor, an increase from the previously approved R757 million (2015 base inflated to 2017 terms). The improved project programme generates earlier revenue and more than offsets the increased capital and drives improved project financial metrics.
The reef-wide raises are now scheduled to begin mid-2020 on 46 level (same as the feasibility study) but significantly almost two years earlier on 47 level, commencing March 2021 (end 2022 in the feasibility study).
With project preparation and access development to the project site on 45 level, R55 million was spent in 2015 and R121 million in 2016, including the procurement of mechanised mining equipment and mobilisation of the mining contractor.
For 2017, project expenditure of R177 million is planned for the 900m of project development and associated infrastructure construction.
DRIEFONTEIN DECLINE
The feasibility study (2015) indicated this project has the potential to extend Driefontein’s operating life from 2028 to 2042, producing an additional 2.1Moz of gold in addition to that expected from the current life-of-mine plan, following the first reef intersection and raise development from mid-2020 on 52 Level and the end of 2023 on 54 Level. The feasibility study project capital is estimated at R1,126 million in 2017 terms (R1,061 million in 2015 terms).
The feasibility study for the Driefontein below infrastructure decline project was approved by the Board for project execution in November 2015. R34 million was spent on capital expenditure in 2016 with 370 metres developed.
For 2017, R125 million is approved to complete 700m of development and complete all flat conventional mine development in preparation to handover mining of the larger winder excavations, incline and the shaft-sinking project scope to a specialist mining contractor in 2018.
A similar process has been completed for the Driefontein decline project as for the Kloof project, where specialist mining and construction contractor tenders are being adjudicated. Improvements in the project schedule after accounting for significantly more stringent rock engineering design changes and mining extraction sequences indicate 52 level will be approximately nine months later than the feasibility study with 54 level 10 months ahead of schedule.
The potential to deliver robust financial returns, offsetting an increase in capital for a mining contractor to execute the project scope and develop the project is indicated by the tendered contractor rates and a full motivation for consideration and approval of this change of scope is to be considered in the third quarter of 2017. It is anticipated that contractor mobilisation on approval would commence in October 2017 with development starting in January 2018.
WEST RAND TAILINGS RETREATMENT PROJECT
The WRTRP is a large-scale, long-life surface tailings retreatment opportunity, the economic viability of which was secured through the acquisition of the Cooke assets by Sibanye in 2014. The combined WRTRP reserves amount to 677.3Mt of the historic Driefontein, Kloof and Cooke tailings storage facilities (TSFs), containing estimated gold and uranium mineral reserves of 6.2Moz and 97.2Mlb, respectively.
The definitive feasibility study for this project as well as the front-end engineering design was completed during the fourth quarter of 2016, rendering the WRTRP construction ready.
Key to the successful execution of this project is the permitting and construction of a high-volume capacity network of pipelines connecting reclamation stations, thickeners and processing plants for economical extraction of gold and uranium from the historical TSFs. In addition, the project must permit and construct a single large regional TSF covering 1,350ha in accordance with modern, sustainable deposition practices. Permitting for the WRTRP is well advanced, with the regulators due to award permits during the second quarter of 2017.
The scope of the initial “Get into Business” strategy included the reclamation of four key anchor resources. The gold-rich Driefontein 3 and 5 TSFs and the Cooke 4 South tailings dams will be reclaimed sequentially at a rate of 1Mtpm concurrently with the uranium-rich Cooke tailings dam at a rate of 400,000tpm. The resultant tailings will be deposited onto the new regional TSF. Steady-state annual production of ~100,000oz of gold and 900,000lb of uranium is planned during the first phase, allowing for the recovery of ~2.7Moz of saleable gold and ~31.1Mlb of saleable uranium over the first 40 years of the project.
The project team will continue to drive and close out the required regulatory approvals and pilot plant implementation as we advance potential funding solutions.
A pilot plant is currently being constructed and a commissioning date of June 2017 has been proposed. The pilot plant will be established to optimise gold and uranium recoveries ahead of the large scale WRTRP implementation and substantially reduce any process related uncertainty. Execution of the WRTRP will therefore not take place until further notice.
SOUTHERN FREE STATE PROJECTS
The Southern Free State (SOFS) projects include Sibanye’s Wits Gold mining right and prospecting right holdings in the Free State goldfields of the Witwatersrand Basin.
The mining right consolidating the De Bron Merriespruit, Bloemhoek, Hakkies and Robijn projects into one mining right has been approved for a period of 23 years and is in the process of being executed. This mining right is contiguous to the north-east of the Beatrix mining right. Sibanye acquired the De Bron Merriespruit and Bloemhoek projects in December 2013 on its acquisition in full of Wits Gold.
The Beisa project at Beatrix West is now included in the Mineral Reserve with gold reserves of 0.7Moz and uranium reserves of 16.1Mlb. The prefeasibility study for this project was enhanced by implementing cut-off grades and leveraging synergies with the current Beatrix West Operation. The principle driver for the Beisa project remains an increase in future in the uranium price. The environmental permitting process for the project including the updating of the Beatrix Environmental Management Programme (EMP) will be progressed through 2017.
| |
Sibanye Integrated Annual Report 2016 | 39 |
Gold Mineral Reserves for the De Bron Merriespruit project were reviewed in December 2015 with the mine design and schedule re-planned in line with revised geological and estimation models. The revised design and updated costing supports the Mineral Reserve for this project, which remains at 2.1Moz.
The Bloemhoek project is adjacent to Beatrix North. A prefeasibility study to access the Mineral Resource below infrastructure at Beatrix North, and potentially a portion of this southerly Bloemhoek area with a decline system from Beatrix North, is due for completion mid-2017. Concurrently, an exploration-drilling programme designed to improve geological confidence in the immediate vicinity of the planned decline system will also be completed.
TECHNOLOGICAL INNOVATION AND MODERNISATION
APPROACH
Despite an illustrious multi-decade operating history in the West Wits gold mines, there is still substantial value to be unlocked through the development and adoption of new technologies. In recognition of this, Sibanye has committed to further advance various developments and projects initiated since June 2014.
Although the overall strategy – based on three pillars, namely “capitalising on legacy mining”, “optimising current mining horizons” and “developing the future state mining method” – remains unchanged, the team has revised its vision for the mine of the future and adjusted its direction to include projects that satisfy the requirements in the diagram below.
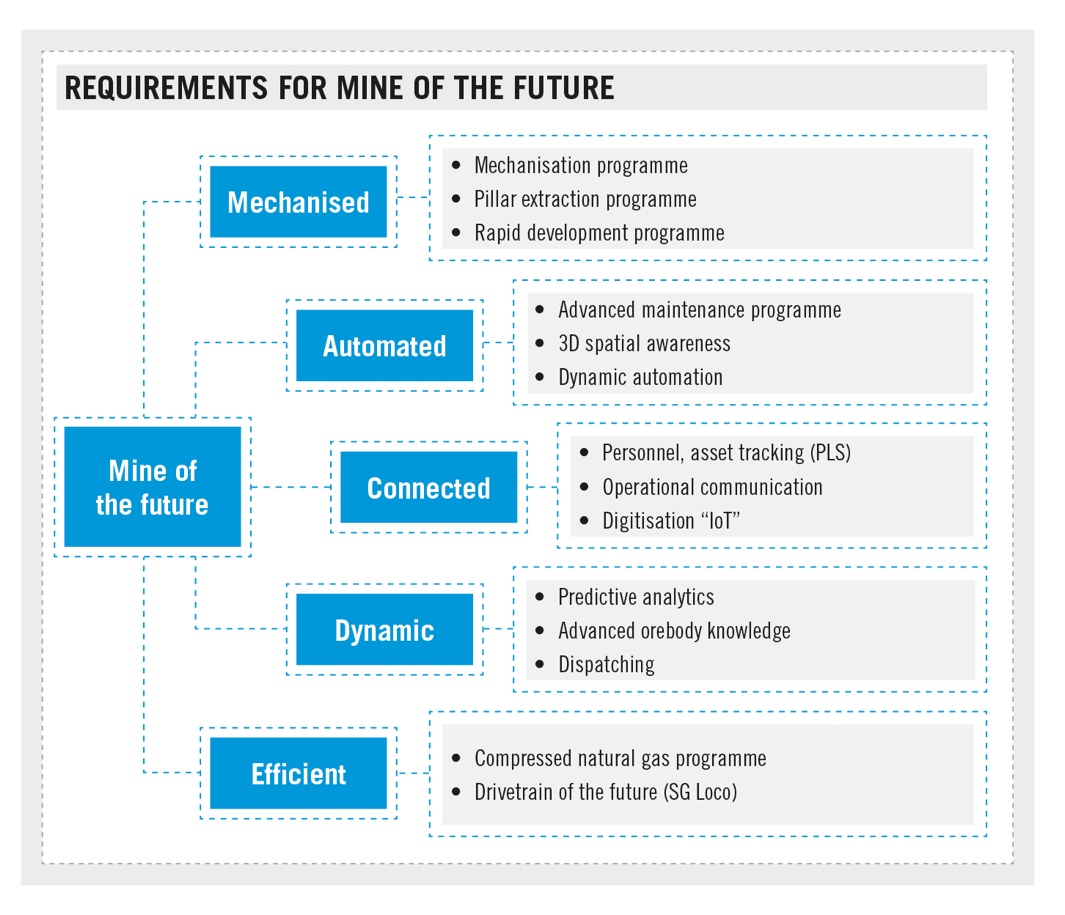
Achieving the mine of the future will have a number of value-adding benefits:
| · | | First and foremost, safety performance will improve markedly as employees are removed from dangerous work areas |
| · | | High-efficiency, remote and low-cost mining systems will allow access to previously inaccessible mining areas such as white areas, low-grade areas, those below-infrastructure, stability pillars and sections that are inaccessible owing to seismicity and these advanced mining systems will enable a drastic increase in the convertibility and sustainability of Sibanye’s resources |
| · | | Operational transparency, greater insights, through digitisation, would enable informed, real-time decision making and dynamic responses to changing operating conditions |
| · | | Drastically reduced environmental impact through efficient and renewable energy consumption |
| |
Sibanye Integrated Annual Report 2016 | 40 |
| · | | Generation of secondary industries to manufacture and service the mechanised mining equipment, and the associated need for highly skilled workers, will contribute to local community development and have an economic multiplier effect |
INNOVATION IN MINING
In addition to the work done internally, Sibanye, as a leading producer in the sector, has actively participated and assisted with the innovation aspect of government’s Mining Phakisa. The Mining Phakisa encompasses several exciting developments, including the establishment of an innovation hub, which is a collaborative initiative involving the Chamber of Mines, government and our counterparts in the mining industry. This hub, supported by an initial R17 million grant from government, is based at the former (Chamber of Mines Research Organisation) COMRO facility. In addition, government has committed additional funding of R150 million, over three years, in support of this collaborative approach to innovation in mining.
The innovation hub has registered a number of quick win projects, facilitated by participating mining companies and illustrating the mining industry’s commitment to technological development. These projects are supported by resources from the overarching mining hub with information shared among participating companies. The aim is to maximise the value of the research and development funding committed.
AT SIBANYE
In order to derive maximum value from the resources committed, the organisational structure will form part of the resources function and facilitate cross-divisional technology project management and information sharing between the Platinum and Gold divisions, eliminating duplication of effort and propagating divisional successes throughout the Group. The Safe Technology department will also assist with safety-related project implementation that may not form part of the original strategy such as proximity detection systems on trackless mobile machinery.
In particular, our mining innovation projects include the following:
| · | | Mechanised pillar extraction aimed at enabling us to extract resources that are contained within strike and stability pillars at our gold operations |
| · | | Advanced transport programme to develop more cost-efficient, environmentally friendly means of transport of ore and material in particular |
| · | | Stope mechanisation programme to develop a suite of mechanised machinery, especially for the narrow tabular environments prevalent in both gold and conventional platinum mining, that is also capable of performing drilling and cleaning operations. Increased efficiency and accuracy of such units will improve the rate and quality of mining, reduce pay limits and allow for additional resource to reserve conversion. Most importantly, a significant advantage will be the removal of employees from dangerous work areas, thus contributing to greatly increased safety performance |
| · | | Mine digitisation involves capitalising on the increased availability of data to enable development of comprehensive asset and behavioural management tools to enhance the efficiency and safety of mobile machinery |
| · | | Mining horizon improvement programme involves several short-term projects aimed at improving current mining methods |
| |
Sibanye Integrated Annual Report 2016 | 41 |
SUPERIOR VALUE FOR THE WORKFORCE
OUR APPROACH
Key to the success of our organisation is putting our people at the centre of our business strategy. We endeavour to engender a sense of ownership and pride in the company to which we make a valuable strategy.
Our ‘People at Sibanye’ strategy is an integrated and solutions-based approach that seeks to address key employee-related issues. We recognise the importance of open, honest and regular communication with employees and our strategy seeks to win the hearts and minds of our people by, among others, facilitating home ownership and promoting health and wellbeing and skills development.
Our focus in the past year was on consolidating our financial wellbeing programme which provides financial education and support to free our employees and communities of the burden of debt.
PEOPLE AT SIBANYE
Sibanye’s employees play an integral part in successfully delivering on Sibanye’s operating model and strategy and the People at Sibanye strategy aims to develop a transformed, productive, skilled and engaged workforce. This is in the context of the intense labour relations challenges facing the South African mining industry, due to legacy issues as well as the difficult socio-economic environment, inequality and unemployment in the country. South Africa has well-developed industrial-relations processes and practices with strong trade unions representing employees.
As employees are key stakeholders in the business, aligning employees with Sibanye’s values and strategy will ensure the sustainability of the business and its ability to deliver superior value for all stakeholders.
Underpinned by our CARES values, the People at Sibanye strategy has as its main elements:
| · | | personal wellbeing – encompasses employee safety, health, nutrition, housing and accommodation, financial wellness |
| · | | career development – includes training and skills development |
| · | | remuneration that is equitable and fair |
These initiatives are backed by ongoing two-way communication between employees and line managers, supported by regular communication from the desk of the Chief Executive Officer at divisional and group level.
The 'People at Sibanye' approach is being rolled out at the platinum operations.
SAFE, PRODUCTIVE AND FAIR EMPLOYMENT
| |
Our employment practices and policies are governed by South African labour legislation and regulations, as well as by collective bargaining and recognition agreements. | 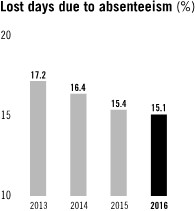
|
ABSENTEEISM
Absenteeism affects productivity and several initiatives implemented to address this issue have had a positive impact on the availability of employees at work. In 2016, a rate of 15.1% of days lost due to absenteeism was recorded, down from 17.2% in 2013 and 15.4% in 2015. For further information, see “—Performance overview—Health and safety focus”.
| |
Sibanye Integrated Annual Report 2016 | 42 |
performance
Sibanye’s total workforce as at 31 December 2016 was 74,351, including contractors. This compares with 46,269 for 2015. Of the 74,531 employed, 28,404 were employed in the Platinum Division.
Sibanye workforce numbers by operation as at 31 December
| | 2016 | | 2015 |
| Permanent employees | Contractors1 | Total | Permanent employees | Contractors | Total |
Beatrix | 7,884 | 1,671 | 9,555 | 7,618 | 1,362 | 8,980 |
Cooke | 3,788 | 1,624 | 5,412 | 5,236 | 2,084 | 7,320 |
Driefontein | 10,941 | 1,648 | 12,589 | 10,772 | 949 | 11,721 |
Kloof | 9,858 | 1,319 | 11,177 | 10,192 | 941 | 11,133 |
Burnstone | 241 | 336 | 577 | 122 | 0 | 122 |
Gold Division – total | 32,712 | 6,598 | 39,310 | 33,940 | 5,336 | 39,276 |
Kroondal (100%) | 6,021 | 4,378 | 10,399 | |
Rustenburg (100%) | 14,891 | 3,114 | 18,005 |
Platinum Division* – total | 20,912 | 7,492 | 28,404 | |
Corporate office2 | 2,966 | 1,340 | 4,306 | 3,054 | 1,018 | 4,072 |
Other3 | 2,054 | 457 | 2,511 | 2,731 | 190 | 2,921 |
Sibanye – total | 58,644 | 15,887 | 74,531 | 39,725 | 6,544 | 46,269 |
* The Platinum Division includes those operations under management. Kroondal is included for the nine months from April to December 2016 and the Rustenburg Operation for two months, November and December 2016
1 Contractors excludes ‘free’ contractors (those who receive a fee for service irrespective of the number of contractor employees on site – they are not compensated on a fee-per-head basis but on a fee for the service or work performed)
2 Corporate Office includes executive management of the divisions
3 Other includes Protection Services, Shared Services, the Sibanye Academy, Health Services and Property
Workforce composition 2016
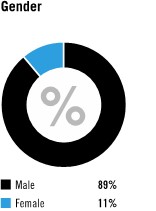
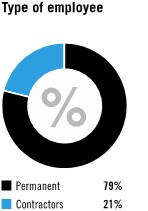
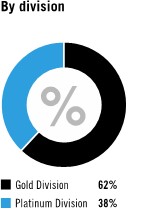
Workforce – breakdown by age
| | | | | | | | |
| 2016 | 2015 |
| Permanent employees | Contractors | Total | % | Permanent employees | Contractors | Total | % |
Younger than 30 years | 5,913 | 4,560 | 10,473 | 14 | 5,251 | 1,890 | 7,141 | 15 |
Between 30 and 50 years | 41,636 | 9,536 | 51,172 | 69 | 27,017 | 3,805 | 30,822 | 67 |
Older than 50 years | 11,095 | 1,791 | 12,886 | 17 | 7,457 | 849 | 8,306 | 18 |
Total | 58,644 | 15,887 | 74,531 | 100 | 39,725 | 6,544 | 46,269 | 100 |
Our recruitment strategy
Since 2015, Sibanye’s recruitment strategy has given preference to the hiring of people in the vicinity of our operations. TEBA, a human resources and social services provider with whom we are in partnership, assists with recruitment and conducts the interviews in a transparent process with community leaders and unions invited to sit in on interviews.
EMPLOYMENT EQUITY AND RECRUITMENT FROM LOCAL COMMUNITIES
New employees are increasingly drawn from local communities. A number of operations have signed memoranda of understanding with local government and community leaders in respect of fair and transparent recruitment processes. We have extended this practice to our platinum operations. While we continue to employ more people from local communities, we strive to maintain support of labour-sending areas where mine remittances are often the sole source of income for impoverished communities.
At the end of 2016, 38% of our employees were recruited from traditional labour-sending areas in rural South Africa and 26% from the Southern African Development Community (2015: 39% and 30% respectively). The balance, 36%, reside locally.
| |
Sibanye Integrated Annual Report 2016 | 43 |
Local community recruitment
| | | | | | | | | | |
| 2016 | 2015 |
| Gold Division | Corporate services and operations | Total | Gold Division | Corporate services and operations | Total |
| Contractors | Permanent | Contractors | Permanent | All | Contractors | Permanent | Contractors | Permanent | All |
Total appointments | 5,738 | 3,376 | 999 | 557 | 10,670 | 4,007 | 3,248 | 552 | 1,065 | 8,872 |
Recruited from local communities | 2,036 | 1,159 | 306 | 213 | 3,714 | 1,415 | 1,139 | 210 | 421 | 3,185 |
Local community members employed (%) | 35.48 | 34.33 | 30.63 | 38.24 | 35 | 35.31 | 35.07 | 38.04 | 39.53 | 36 |
Sibanye’s philosophy on recruitment is being carried through to our Platinum Division where we are reviewing current recruitment practices to – align with the rest of the company. We remain committed to creating a talent pipeline to enable us to recruit our general and specialist employees locally. A significant portion of employees in the platinum division is local. We will continue to work with the relevant stakeholders to ensure that we continue to sustain local employment.
There is currently a moratorium on recruitment. Only those positions requiring critical safety and production skills were filled during the year. With the cessation of mining operations at Cooke 4 during 2016, every effort was made to find alternative employment within Sibanye for those affected. Most of those affected were transferred to other Sibanye operations.
WOMEN IN MINING
A strategy to attract, develop and retain women in mining was implemented at all operations in 2016. It was agreed that 30% of all vacant positions be allocated to female applicants and that gender-related restrictions be removed. Key focus areas include gender-neutral policies and procedures, the wellbeing of women (including safety and security in the workplace) and creating working environments conducive to the employment, placement and development of women.
In the Gold Division, 120 women were appointed to mining positions in 2016. While women made up 12% of our total workforce in 2016 (2015: 10%), 7% of the total workforce are women in operational (core and critical) positions. To increase the number of women in operations positions a target of 30% women is in place for all operational recruitment. Currently, women comprise 12% of management positions (2015:18%) and 6% (2015: 10%) of senior management.
Although progress has been made at junior and senior management levels, representation in middle management was below target in 2016. We will therefore focus on increasing female representation in middle management through our executive assessment and succession planning process in 2017.
Women in core mining occupations in 2016 was as follows: 8% at Kloof and Beatrix, 9% at Driefontein, 16% at Burnstone and 17% at Cooke. In the Platinum Division, women represented 12% of the workforce in 2016.
To increase the number of women employed in core and critical skills, changes have been made to our recruitment strategy.
In partnership with the Gordon Institute of Business Science of the University of Pretoria, Sibanye also presented a Women in Leadership Programme, aimed at women in key leadership positions in private and government institutions, in 2016.
Sibanye was one of two mining companies selected by the Commission for Gender Equality to participate in a gender barometer project in 2016 to assess gender mainstreaming in the private sector for the first time. Sibanye represented large mining companies in the survey. Kloof was chosen as a pilot site and the commission visited our corporate office at Libanon, Westonaria. The findings will be presented to Parliament and Sibanye will receive a copy of the report with recommendations on achieving optimal gender equity.
Organised labour
The mining sector is highly unionised. At the end of 2016, around 92% (2015: 93%) of our total permanent workforce was unionised. Currently, four unions are recognised by Sibanye, namely AMCU, NUM, Solidarity and UASA.
An agreement signed by the gold operations with all unions in 2015 expires on 30 June 2018. At the former Anglo American Platinum assets, a three-year wage agreement was signed and became effective from 1 July 2016, prior to their acquisition. At Kroondal, the current wage agreement expires in July 2017 and negotiations for a new agreement will begin in April 2017.
| |
Sibanye Integrated Annual Report 2016 | 44 |
Union representation
| | | | | | | |
| 2016 | 2015 |
| Gold Division | Platinum Division | Corporate office and other | Total | Total |
| Membership | Representation (%) | Membership | Representation (%) | | | |
AMCU | 15,343 | 47 | 13,720 | 66 | 925 | 29,988 | 17,039 |
NUM | 13,318 | 41 | 2,776 | 13 | 2,722 | 18,816 | 16,965 |
UASA | 965 | 3 | 2,308 | 11 | 440 | 3,676 | 1,490 |
Solidarity | 594 | 2 | 394 | 2 | 269 | 1,257 | 948 |
Non-unionised | 2,492 | 7 | 1,714 | 8 | 664 | 4,728 | 3,283 |
Total employees | 32,712 | 100 | 20,912 | 100 | 5,020 | 58,465 | 39,725 |


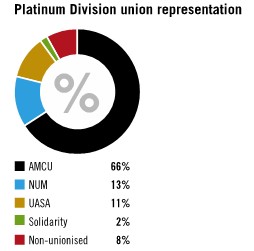
Human rights
Our employees, including security personnel, are trained to uphold human rights and respect all cultures and customs. Regular refresher training at the training centre is provided in terms of our human rights policies and recruitment procedures or when employees return from leave.
Training of security employees was again included in our Workplace Skills Plan for 2016. Our approach to training and development needs in the workplace is guided by this strategic document, which is published annually, governed by the Skills Development Act, 1998 (Act No 97 of 1998) and the Labour Relations Act, 1995 (Act No 66 of 1995), and compiled jointly by the employer, employee representatives and non-unionised employees.
Our human capital policies also address human rights, as well as child/forced labour at all operations and among our suppliers, employment equity and employee relations, including discipline and recognition.
Addressing indebtedness
High levels of indebtedness are not unique to the mining industry but continue to be a challenge. The events at Marikana on the platinum belt in August 2012 highlighted the many extraneous factors impacting the lives of employees and which contributed to the resultant labour instability in the sector and beyond. While wages became a rallying point for the strikes, the situation was exacerbated by other issues, including dual families, poor living conditions, lack of service delivery and high levels of employee indebtedness, which tend to severely reduce employees’ take home pay.
To address this, in 2014, Sibanye launched a personal financial-education programme – CARE for iMali/Khathalel’imali/Hlokomela chelete (meaning ‘care for money’ in isiXhosa and Sesotho) – aimed at curbing indebtedness and providing financial planning and rehabilitation to employees. By end of 2016, more than 22,000 employees and community members had participated in CARE for iMali training.
Additional training on home ownership, debt counselling and coaching are provided by financial coaches at all our operations. All garnishee orders received are validated and managed, and employees are informed of new garnishee orders received. Excessive instalments deductions are negotiated to assist employees to take home at least 30% of their earnings.
Community members also participate in the programme and more than 200 people from communities in the Merafong and Rand West municipal areas benefited from the programme.
The roll-out of Care for iMali at the platinum operations began in September 2016, benefiting over 500 employees and over 300 community members.
| |
Sibanye Integrated Annual Report 2016 | 45 |
Sibanye Academy
| · | | Improving literacy levels in the Gold Division – employees at adult education and training level 3 and higher increased to 70% in 2016 from 58% in 2015 |
| · | | Bursaries – bursaries are offered to dependants and children of employees |
The Sibanye Academy, located in Westonaria, Gauteng, supports human capital, our employees and the broader community, by developing employees’ skills and knowledge through training and experiential learning. The academy is fully accredited by the Mining Qualifications Authority (MQA) and its programmes have been approved by a number of sector education and training authorities (SETAs). Satellite campuses, managed by the academy, are located at each operation.
human capital development
Our skills development initiatives are available to employees and people living in host communities. Our talent pipeline is aligned with our business objectives and maintained through adult education and training, portable skills training, learnerships, internships, study assistance, and core skills and leadership development. As we had come to the end of our second five-year SLP cycle in 2015, most commitments in terms of employee and community training had been met. Following an analysis of Sibanye’s internal human resource and skills requirements, training conducted in 2016 was rationalised to focus on and align with the needs of the business and to develop employees. This explains the decline in the number of employees and community members who received portable skills training between 2015 and 2016 in the table below. In line with the MPRDA, the DMR were advised of the revised approach.
In addition, funding was secured from the MQA for new leadership programmes in partnership with the Gordon Institute of Business Science in 2016.
Group: Portable skills training – number of attendees
| | | | |
| 2016 | 2015 | 2014 | 2013 |
Employees | 204 | 828 | 1,109 | 865 |
Community | 312 | 945 | 1,091 | 1,354 |
Total | 516 | 1,773 | 2,200 | 2,219 |
Group: Learnerships – number of attendees
| 2016 | 2015 | 2014 | 2013 |
Engineering | 407 | 386 | 367 | 753 |
Mining | 385 | 207 | 337 | 544 |
Total | 792 | 593 | 704 | 1,297 |
In 2016, Sibanye spent R403 million (2015: R385 million) on education and training, of which the Platinum Division accounted for
R81 million. This represented a total of 6.99 million hours of training for the year (2015: 7.93 million hours).
TRAINING AND DEVELOPMENT
Adult education and training is offered to employees and community members full time and after hours to advance literacy and numeracy. Learners are examined by the nationally recognised Independent Examinations Board. As most of the five-year social and labour plan targets for adult education and training were achieved in 2016, we did not accept new intakes but allowed learners enrolled in 2015 to continue with their adult education and training levels 1-3 studies. Some learners continued with level 4 in line with business needs. In 2016, 16 (2.47%) employees who attended adult education and training moved into the learnership pipeline.
Our portable skills training equips employees with practical skills that are transferable beyond the mining industry and will stand them in good stead for life after mining. We also equip community members with skills for employment and entrepreneurship. In addition to qualifications in mechanical, electrical and construction trades, recognised by the South African Qualifications Authority, training is also provided in agriculture, clothing and textile manufacturing.
To improve employees’ skills and to provide opportunities for community members to enter the mining industry, learnership programmes are offered as a combination of study and on-the-job training. Learnerships play an important role in advancing employees’ careers as they lead to recognised qualifications. In 2016, Sibanye invested R63 million (R3 million in the Platinum Division) in learnerships (2015: R81 million) with 20 (4%) learnerships taking up permanent employment.
Bursaries are also available to employees and members of surrounding communities who need assistance to study towards critical core mining qualifications, particularly specific skills needed by Sibanye. In 2016, we invested R14.2 million (R2.4 million in our Platinum Division) in bursaries (2015: R17.47 million) with 11 (6.43%) bursars taking up permanent positions within Sibanye. Given Sibanye’s strategic partnerships with the University of Johannesburg and the University of the Witwatersrand, a donation of R4 million was made to each institution in 2016.
| |
Sibanye Integrated Annual Report 2016 | 46 |
Gold Division: Human capital development: SLP provision vs actual training spend (R million)
| 2016 | 2015 |
| SLP financial provision | Actual training expenditure | SLP financial provision | Actual training expenditure |
Beatrix | 25 | 59 | 30 | 78 |
Cooke | 41 | 34 | 35 | 50 |
Driefontein | 57 | 118 | 5 | 127 |
Kloof | 53 | 109 | 55 | 128 |
Total | 176 | 320 | 177 | 384 |
Sibanye also invests in employees with potential to advance within the group, 15% of those successors were promoted from the talent pool in 2016.
Gold Division: Current size of talent pool = 691 (A – D Upper bands)
| 2016 | 2015 | 2014 |
Successors promoted | 108 | 45 | 43 |
Group: Human capital development – 2016
| Expenditure (R million) | Number of trainees | Total no. of training hours |
Internships | 35 | 130 | 262,080 |
Bursaries | 14 | 325 | 655,200 |
Adult education and training (employees) | 49 | 1,392 | 501,120 |
Adult education and training (community) | 12 | 675 | 303,750 |
Engineering learnerships | 33 | 397 | 820,512 |
Mining learnerships | 30 | 385 | 776,160 |
Portable skills (employees) | 1 | 204 | 9,792 |
Portable skills (community) | 1 | 312 | 29,952 |
Leadership development | 12 | 784 | 31,360 |
Core skills training | 188 | 53,654 | 3,433,856 |
Coaches/mentors training | 2 | 504 | 4,032 |
Employee indebtedness | 4 | 17,959 | 143,672 |
Community Maths and Science | 1 | 70 | 8,400 |
Support and research | 9 | 0 | 0 |
Other | 12 | 1,835 | 14,680 |
Total | 403 | 78,626 | 6,994,566 |
Additional employee benefits
The Matshidiso Programme assists the dependants and families of employees who have died as a result of mine accidents and employees with permanent disability. In 2016, R685,600 was paid out in terms of this programme, bringing the total paid out since 2013 to R3.1 million.
In addition to the standard death in-service benefits paid to the families of employees, Sibanye, with the assistance of TEBA, provides assistance in the form of a food hamper and grocery vouchers delivered at the home of the nominated beneficiary. Introduced in January 2016, 247 families have benefited from this scheme at an approximate cost of R1.3 million for the year.
Executive succession planning
At the beginning of 2016, the Board tasked the Human Capital team with the development of an executive development and succession plan, the key objectives of which were to identify executive talent requirements and to implement strategies to attract and develop executives qualified to fill critical positions to enable Sibanye to deliver on its strategy. This also involved developing plans to ensure talent retention and engagement, and to facilitate the timely transfer of knowledge from current incumbents to successors
In compiling the plan, it was necessary to understand the critical roles and competencies required, to assess existing competencies and the potential of internal candidates in terms of readiness as well as exposure and development, and to propose appropriate interventions. The plan incorporated a short-term (three to six months) contingency plan and permanent replacements, as well as an emergency plan.
A detailed plan was completed and implemented in three phases at executive, senior management and management level.
By the end of 2016, critical roles had been identified and competencies required for executive positions finalised and incorporated into the Sibanye Leadership Development Framework. Assessments to identify potential, readiness and development were completed for all executive and senior management. The process for management level employees has begun and is on track to be completed by the end of 2017.
An initial executive succession plan was developed and presented to the Chief Executive Officer and the Board for approval. The initial succession plan includes a pool of external of potential candidates to be considered as needed. The plan will be updated on an ongoing basis.
| |
Sibanye Integrated Annual Report 2016 | 47 |
It is important that the executive development and succession process forms the basis of our Integrated talent management framework. All processes, including the leadership development and competency framework, the strategic workforce plan, training and transformation plans, succession planning as well as performance management, among others, will therefore be aligned with this process. With this in mind, starting in 2017, a talent review will be conducted biannually.
Affordable housing programme
| · | | 427 company-owned houses sold (162 to employees and 265 private sales) |
| · | | Affordable home-ownership programme: 32 houses built to date of 120 planned |
| · | | Approximately R430 million spent on high-density residence upgrades over eight years |
Affordable housing is key in enabling home ownership for all our employees. Our affordable housing model includes managing the construction in-house. A home ownership payment model was introduced in September 2016 to assist with registration costs, bond fees and fringe benefit tax. We have also donated available land and carry the costs of professional and legal services.
In all, 162 houses owned by Sibanye in the West Wits area have been sold to employees as part of the employee home-ownership programme, which began in 2015, to enable employees to own their houses. The houses are offered for sale to current occupants at a discount, based on years of service, with no obligation to buy. Alternatively, vacant houses in the higher grade levels are first offered to Sibanye employees before they are sold on the open market. To meet the demand for affordable housing, Sibanye has engaged with organised labour on the designs and layout of prototype show houses in Gauteng and the Free State. These houses are available to Category 4-8 employees who can use their living out allowances to pay for them with minimal subsidisation.
All single accommodation upgrades were completed. The focus in 2017 will be on cosmetic changes and maintenance, including painting. The provision of family accommodation will be addressed by the sale of houses to employees through the home-ownership programme.
Our housing programme has helped create employment as well as opportunities for local small, medium and micro enterprises (SMMEs) supporting youth and women. SMMEs also stand to benefit from planned incubation centres for our employee home ownership scheme, as well as housing programmes of local municipalities.
A brick manufacturing facility in Westonaria, employing 20 people from surrounding communities, is producing and stockpiling high quality bricks. Another 30 SMMEs have been selected and will be trained in carpentry, welding, spray painting, and the manufacture of roof trusses and roof tiles, in 2017 to enable them supply our housing programme. Once accredited, the SMMEs will be qualified to start their own businesses and operate in mainstream industries. Sibanye has spent R5.7 million on this project to date, mainly on refurbishing and equipping the incubation centre.
The provision of housing and accommodation in the Platinum Division is being reviewed, as part of the integration process into the company. This will be in line with our commitment to make affordable home ownership possible for all our employees.
FUTURE FOCUS – HUMAN CAPITAL
Formulation of a group-wide integrated human capital strategy which will take into account, from a holistic perspective, employee training, performance management and career development. As part of this, adult education and training, which is currently full time, is to be reviewed.
Sibanye will be implementing a new learner official programme in 2017 aimed at attracting top school leavers interested in pursuing a career in mining. Successful candidates will be paid a salary while receiving on-mine work integrated learning and occupational development together with tertiary education.
A pilot group of 24 matriculants will be chosen for this five-year programme, which will culminate in a national certificate in rock breaking, certified by the MQA, as well as a Bachelor of Engineering Technology degree from the University of Johannesburg.
THE MINING CHARTER AND TRANSFORMATION
OUR APPROACH
Sibanye is committed to playing a leading role in the transformation of the South African mining industry and the country as a whole. While the Broad-based Socio-economic Empowerment Charter for the South African Mining Industry (the Mining Charter) has laid the foundation, we believe that real transformation depends on a deeper understanding and commitment. We strive to be the most empowering mining company in South Africa by creating superior value so that historically disadvantaged South Africans can participate meaningfully as employees, shareholders, suppliers and communities. Our goal on the journey towards transformation is the sustainability of our business.
All of our operations initially submitted their 2015 Mining Charter reports on 31 March 2016 and were resubmitted by the end of April 2016, with additional information as requested by the DMR.
Given the shifting transformation landscape, and the planned revision of the Mining Charter, we have ensured that Sibanye is well-positioned to embrace change. The release of the Mining Charter Assessment Report by the DMR in 2015 set the scene for the revision of the Mining Charter, which had expired in December 2014.
| |
Sibanye Integrated Annual Report 2016 | 48 |
Following this review, a third draft of the amended Mining Charter, released for public comment in April 2016 and designed to strengthen its efficacy in bringing about meaningful transformation, sought to entrench the requirement for perpetual 26% black economic empowerment (BEE) ownership. This was contested by the industry, resulting in the DMR and the Chamber of Mines of South Africa approaching the High Court of South Africa to seek clarity on the interpretation of the “once empowered, always empowered” principle (ie that BEE ownership transactions in the mining industry concluded between 2004 and 2014 should continue to count towards BEE ownership, irrespective of whether the shareholding remained). The High Court has yet to rule although engagement on other aspects of the amended Mining Charter continued.
With the acquisition of the platinum mines, Sibanye concluded a 26% broad-based BEE transaction through a subsidiary. In terms of this transaction, Rustenburg Mine Employees Trust now has a shareholding of 30.4%, Rustenburg Mine Community Development Trust 24.8%, Bakgatla-ba-Kgafela Investment Holdings 24.8% and Siyanda Resources Proprietary Limited 20%.
EMPLOYEE SHARE OWNERSHIP
By the end of 2016, 24,523 employees (2015: 26,444) were participants in our employee share ownership plan, the Thusano Trust, which was established in 2010 when employees of Gold Fields acquired 13,524,365 Gold Fields shares in line with a collective agreement between the NUM, UASA, Solidarity and Sibanye (previously GFI Mining South Africa Proprietary Limited). The shares were allocated to employees in Paterson employment bands A, B and C, according to their years of service. The Thusano Trust was registered as the vehicle to administer the share plan. In terms of the trust deed, the allocated shares are to be held in trust for a period of 15 years on behalf of employees. During this restrictive period, employees may not dispose of or otherwise encumber the shares. Although they cannot dispose of shares for a period of 15 years, employees acquired full rights of ownership in the shares, which entitles them to voting rights and dividends paid in relation to the shares. With the unbundling of Gold Fields and the creation of Sibanye, Sibanye employees were allocated an equal number of Sibanye and Gold Fields shares.
| |
Sibanye Integrated Annual Report 2016 | 49 |
HEALTH AND SAFETY FOCUS
Re-energising the safety focus supported by our proactive health, safety and wellbeing strategy
OUR APPROACH TO SAFETY, HEALTH AND WELLBEING
Our employees are our most important asset. In order to keep our workforce safe and healthy, we focus on compliance and systematically reducing employees’ exposure to risk. We are therefore committed to:
| · | | identifying and ranking risks |
| · | | finding technical and procedural engineering solutions in terms of a risk mitigation hierarchy to eliminate risk completely, if possible |
| · | | controlling risk at source |
| · | | monitoring risk exposure |
| · | | providing personal protective equipment |
To this end, it is essential to create alignment with relevant stakeholders. As required by the Mine Health and Safety Act, 1996 (Act No 29 of 1996), all employees are represented in formal joint management-worker health and safety committees to ensure that our occupational health and safety programmes are agreed and effective.
Our safety, health and wellbeing strategy, supported by our CARES values (commitment, accountability, respect, enabling and safety), is illustrated below.
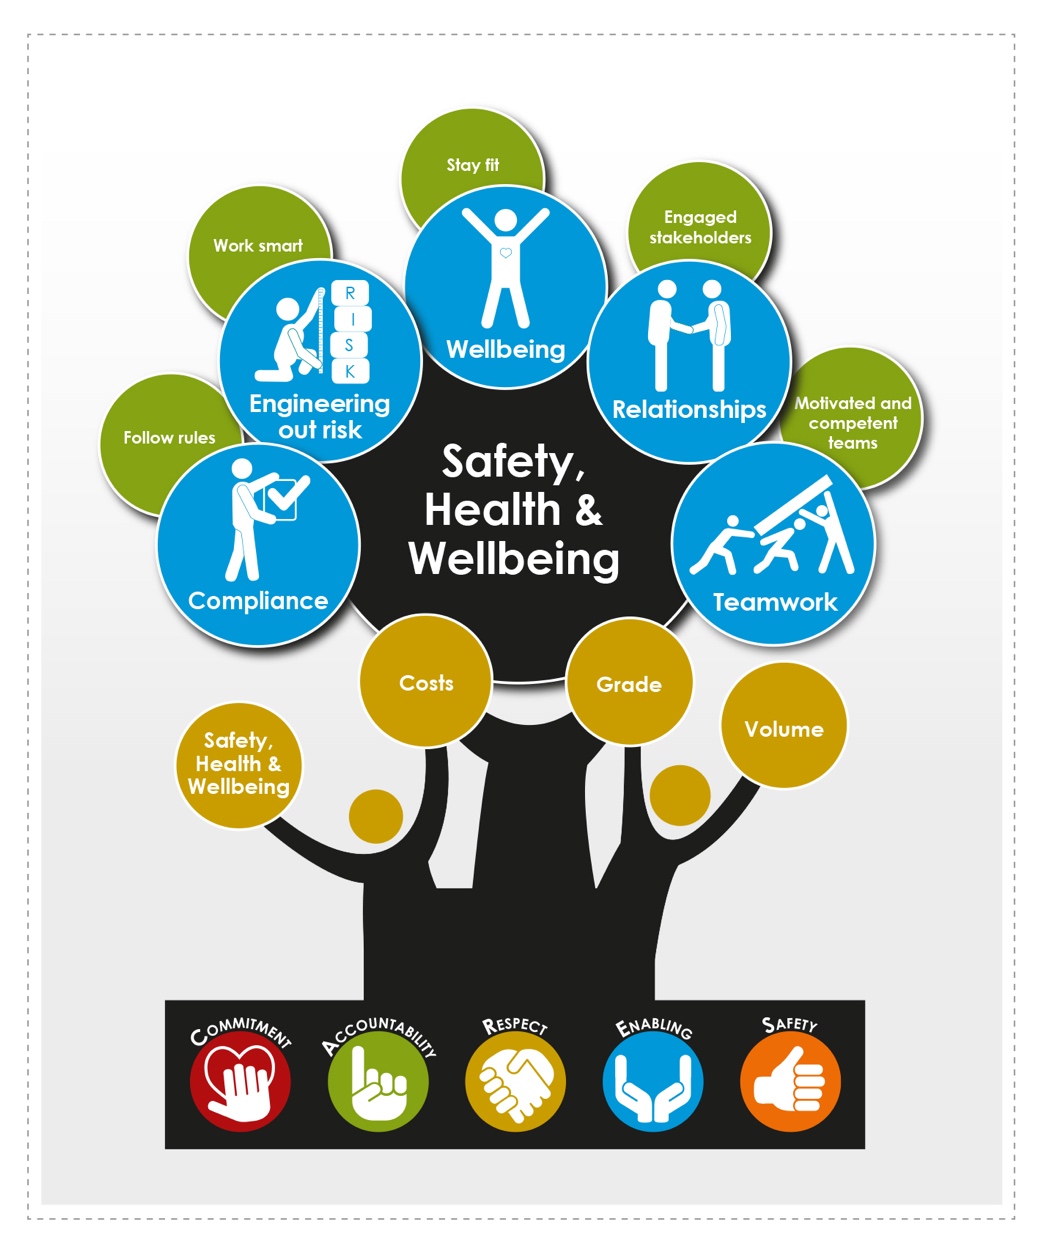
| |
Sibanye Integrated Annual Report 2016 | 50 |
SAFETY
PERFORMANCE OVERVIEW
It is with deep regret that Sibanye reports the death of 14 employees during the year under review – 12 employees within the Gold Division and two employees in the Platinum Division (during the period the assets were owned by Sibanye).
In memoriam
| | | | | |
Date | Full name | Age | Operation | Occupation | Cause of fatality |
2 February 2016 | Moreruoa Mahao | 57 | Cooke | Miner stoper | Fall of ground – gravity |
12 February 2016 | Tanki Sebolai | 32 | Cooke | Relieving team leader | Winches and rigging |
12 March 2016 | Elliot Kenosi | 53 | Beatrix | Scraper winch operator | Heat related |
18 March 2016 | Luis Alberto Massango | 34 | Kloof | Sweeping tool operator | Fall of ground – gravity |
7 April 2016 | Mzwandile Chitha | 32 | Cooke | Stope crew | Fall of ground – seismicity |
21 May 2016 | Pieter Janse van Rensburg | 49 | Driefontein | Fitter | Drowning |
12 June 2016 | Qamako Mpananyane | 42 | Beatrix | Team leader | Tramming |
27 June 2016 | Moeketsi Thaane | 40 | Cooke | Rock drill operator | Fall of ground – gravity |
11 July 2016 | Mongezi Bagege | 37 | Driefontein | Loco driver | Tramming |
21 July 2016 | Enock Dumisa Tsabedze | 52 | Kloof | Miner stoper | Fall of ground – gravity |
27 July 2016 | Johannes Masithela | 33 | Beatrix | Mining team | Tramming |
19 August 2016 | Simin Kabelo Rangwaga | 38 | Kroondal | Electrician | Trackless machinery |
2 November 2016 | Teboho Molise | 44 | Kloof | Assistant grade 1 construction | Material handling |
17 November 2016 | Cekiso Zamicebo | 42 | Kroondal | Spotter | Fall of ground – gravity |
Safety performance statistics
| | | | | | |
| | 2016 | | 2015 | 2014 | 2013 |
| Group | Platinum Division | Gold Division | Gold Division | Gold Division | Gold Division |
Fatalities | 14 | 2 | 12 | 7 | 12 | 9 |
Fatal injury frequency rate * | 0.10 | 0.09 | 0.11 | 0.06 | 0.12 | 0.10 |
Lost-time injury frequency rate * | 6.62 | 4.84 | 6.99 | 6.74 | 5.87 | 6.13 |
Serious injury frequency rate * | 4.16 | 2.88 | 4.42 | 4.68 | 3.88 | 3.50 |
Medically treated injury frequency rate ** | 3.85 | 5.72 | 3.47 | 3.60 | 3.37 | 4.32 |
No. of Section 54 work stoppages | 226 | 55 | 171 | 109 | 77 | 55 |
No. of production shifts lost owing to Section 54 stoppages | 402 | 245 | 157 | 70 | 99 | 35 |
No. of internal work stoppages *** | 21,849 | 2,044 | 19,805 | 18,642 | 16,423 | 10,383 |
* Per million hours worked
** Also referred to as treat-and-return injury frequency rate (TRIFR). Includes certain minor injuries
*** Internal stoppages are an integral part of Sibanye’s risk management strategy (any person can stop a task or workplace until arrangements have been made to reduce high risk)
Note: Data for 2014 includes Cooke from March 2014 onwards and date for 2016 includes the former Aquarius operations from April 2016 and the Rustenburg operations from November 2016
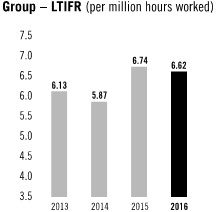
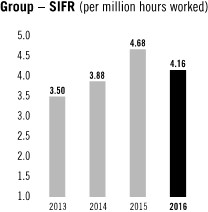
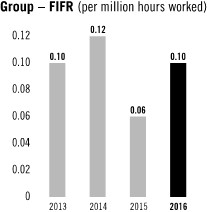
Note: Data for the Group for the years 2013 to 2015 is comparable with that of the Gold Division in 2016. Group data for 2016 includes the Gold Division as well as the platinum operations (Platinum Division) for the period of Sibanye's ownership during the year
| |
Sibanye Integrated Annual Report 2016 | 51 |
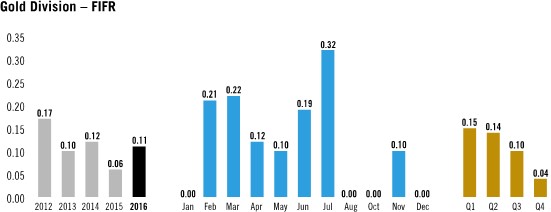
Despite a general improvement in the fatality rate prior to 2016, there was a disappointing regression in fatalities during the first six months of 2016 in the Gold Division. In the first half of the year, eight fatalities were recorded, raising serious concerns at executive level. A series of high-level safety workshops were held and an urgent 12-point safety plan devised. Following its implementation, safety performance improved with four fatalities recorded by the Gold Division in the second half of the year.
Regrettably, in 2016, the Gold Division’s fatal injury frequency rate (FIFR) deteriorated by 83% year on year and the lost-time injury frequency rate (LTIFR) by 4%. Most lost-time injuries in 2016 were caused by falls of ground as well as by tools and equipment, slip-trip-and-fall, and materials handling incidents. Intervention strategies have been put in place to rectify trends.
A 6% improvement was recorded in the Gold Division’s serious injury frequency rate.
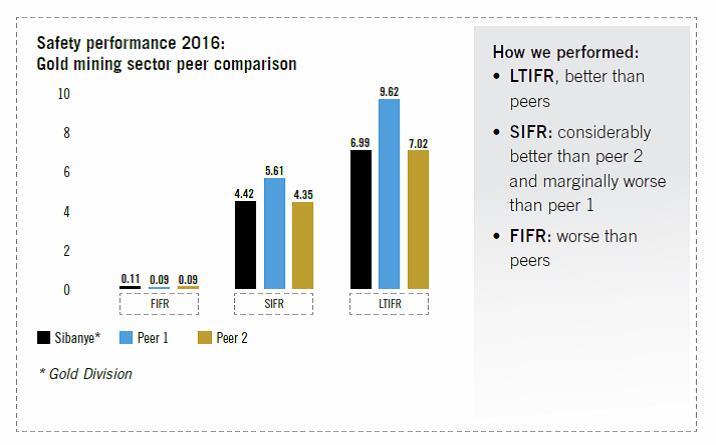
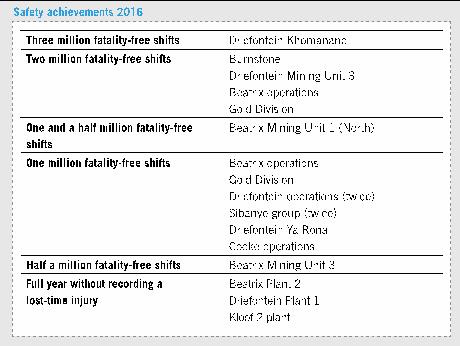
| |
Sibanye Integrated Annual Report 2016 | 52 |
ADDRESSING OUR SAFETY PERFORMANCE – Sharp! Sharp!
A new safety campaign, known as “Sharp! Sharp!”, was rolled out in 2016 to encourage safe behaviour, address the regression in our safety performance, counter the decline in the FIFR in the first half of the year and to reintroduce a culture of continuous improvement. This campaign includes short, medium and long-terms plans.
Short-term plans initiated to refocus and re-energise our safety performance included:
| · | | Restructuring the safety department by appointing a senior executive in the office of the CEO to spearhead our health and safety strategy |
| · | | Launching the new safety value now included in our CARES value system and the roll out of the “Sharp! Sharp!” campaign across the Group to reaffirm our commitment to safety |
| · | | Entrenching visible-felt leadership by executive and senior management at the operations to ensure close out of action plans and high potential hazards that warrant an immediate stop and fix |
| · | | Establishing an Executive Safety Subcommittee to ensure that our safety strategy is implemented accordingly and that operations are accountable |
| · | | Setting up a zero harm task team to investigate serious incidents and ensure that recommendations are implemented to prevent recurrence |
| · | | Reviews of all fatalities by the Office of CEO to ensure close outs are made to prevent recurrence. |
Medium-term plans to ensure that safety is constantly top of mind include:
| · | | Changing the hearts and minds of our employees to be more safety conscious in the workplace and adopt a safety first attitude as a way of life – training is provided to encourage accountability for safety incidents or substandard conditions (including a new slogan: “I am safe! We are safe! Phepha mina! Phepha zonke!” |
| · | | Restructuring the entire safety department to ensure appropriate allocation of skills |
| · | | Implementing measures that ensure employees comply with the safety system to reduce non-compliances, substandard conditions and accidents. |
Long-term safety plans (see 12-point plan below) include:
| · | | Aligning systems in the safety department across both divisions to ensure common understanding and a single reporting system that enables the sharing of experiences and knowledge of best practice |
| · | | Documenting the new safety management system to guide management of safety |
| · | | Securing tripartite commitment from Sibanye, the Mine Health and Safety Council and the DMR in support of a more effective safety management process at all operations |
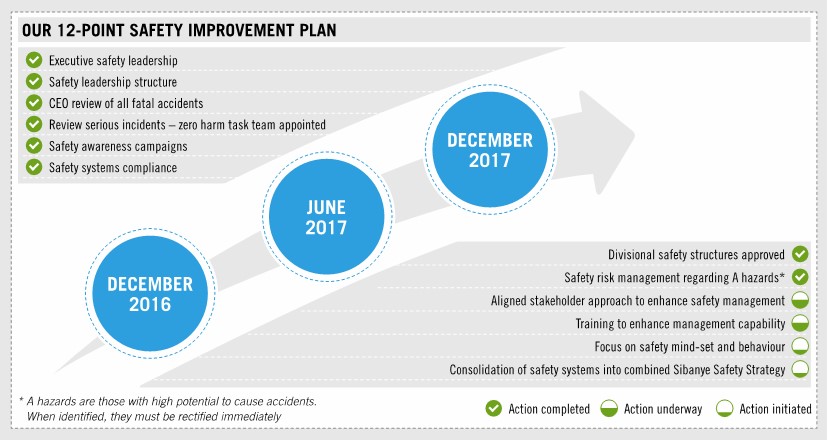
| |
Sibanye Integrated Annual Report 2016 | 53 |
EFFECTS OF S54 SAFETY STOPPAGES 2016
| | |
Gold Division No. of stoppages: 171 Revenue lost: R649 million | Platinum Division No. of stoppages: 55 Revenue lost: R223 million | Sibanye total No. of stoppages: 226 Revenue lost: R872 million |
SECTION 54 NOTICES
Despite the improvement in the safety performance of the Gold Division following management’s proactive safety intervention in August 2016. The frequency of Section 54 safety stoppage notices (S54s) issued remained high. S54s are issued by the DMR, in terms of the Mine Health and Safety Act 29 of 1996, in instances of dangerous occurrences, practices and conditions. S54s are however only supposed to be issued in exceptional circumstances. Sibanye supports the application of S54s when safety transgressions occur, however, their application is frequently inconsistent and their scope unwarranted. The effects of such stoppages are severe and they may impact the future viability of our operations as well as employment. In addition, if S54 stoppages results in mining activity being suspended for an extended period of time, there are serious safety implications.
A total of 226 Section 54 notices were issued to Sibanye by the Department of Mineral Resources in 2016 – 171 to the Gold Division and 55 to the Platinum Division. These notices resulted in the loss of 402 production shifts – 157 in the Gold Division and 245 in the Platinum Division. The S54s were issued mostly in the wake of serious injury incidents where substandard safety conditions were identified due to non-compliance with standards.
FUTURE FOCUS
Having established our Safe Technology department in June 2014, and recognising that a step change in safety performance requires innovative technologies to engineer out risk, we continue to work towards eliminating inherent safety risks by developing and implementing systems, such as mechanised equipment, that reduce employees’ exposure to risk.
We continue to pursue technology projects that will greatly reduce our risk profile and thus improve our safety performance with concomitant cost and productivity gains. See “—Performance overview—Creating value from operations, projects and technology—Technological innovation and modernisation”.
In the coming year, we will continue to roll out our “Sharp! Sharp!” campaign across the Group. This initiative is being led by our vice presidents and the Executive Safety Subcommittee under the guidance of our chief executive.
Zero harm task teams will also be responsible for investigating high-potential accident risks.
As industry stewards, we will also continue to play a leading role in supporting the development of technology and new generation mining through the Chamber of Mines.
SAFETY TARGETS
As we strive towards zero harm, executive management has set a safety improvement target of 10% (for all classes of injuries) at each operation for 2017 to ensure a consistent decline in the incidence of injuries, in line with our safety and health policy.
HEALTH AND WELLBEING
Moving from curative to preventative healthcare and promoting a healthy workforce
performance
Sibanye’s health model is based on the proactive management of employee health and wellbeing. It aims to provide accessible primary healthcare to support the prevention, early detection and management of disease, and also to prevent disabilities. Early identification of health risks together with intervention and stringent application of the mandatory code of practice on the minimum standards of fitness to perform work at a mine are critical.
Previously, the focus of healthcare was curative rather than preventive in nature. Healthcare was provided at centralised, company-owned mine hospitals which was time consuming to access, resulting in high rates of absenteeism at work. Since 2011, when we reported an average of 13.8 days lost per employee for the year, our average sick leave rate has improved by 9% to 12.6 days lost in 2016. We attribute this improvement to the provision of accessible primary healthcare to all employees at shaft clinics that serve as entry points to our extended network of service providers.
A sustainable healthcare system has been created so that employees can optimise their health throughout their working years and into retirement, with Sibanye assisting them to make informed healthcare decisions. Employees, their families and communities are encouraged to pursue healthy lifestyles. To this end, community infrastructure projects that enable access to affordable, quality healthcare have been developed. Strong interdependent relationships with local stakeholders, including the Department of Health, facilitate the integration of regional healthcare systems to ensure the effective use of resources.
Sibanye offers employees an array of healthcare products, including medical aid insurance and statutory insurance benefits for occupational injuries and diseases. Employees are given a choice in selecting their medical aid cover and can choose either the company-funded product or any of a number of designated medical schemes, including Sibanye’s own restricted (in-house) medical scheme. Medical schemes and options are chosen carefully in terms of strict criteria so that employees receive benefits at an affordable cost.
In the Gold Division, 81% of employees have chosen the company-funded option and 19% have opted for various other medical schemes. All employees in the Platinum Division are members of an external open (public) medical scheme.
| |
Sibanye Integrated Annual Report 2016 | 54 |
The 2016 data reported for the Platinum Division has been annualised for the purposes of monitoring health trends, comparative analysis of both communicable, non-communicable and occupational diseases and the objective measurement of progress made with health programmes in the newly-acquired operations. The statistics reflect the disease burden at the platinum operations for the entire year and have not been disaggregated to reflect liability in terms of ownership.
Healthcare funding (R million)
| | | | | | |
| 2016 | 2015 | 2014 |
| Group | % | Platinum Division | Gold Division | Gold Division | Gold Division |
Medical schemes | 679 | 56 | 400 | 279 | 296 | 282 |
Company-funded | 336 | 28 | 31 | 305 | 323 | 357 |
Compensation for occupational injuries and diseases* (Rand Mutual Assurance Company) | 178 | 16 | 52 | 125 | 115 | 106 |
Total | 1,193 | 100 | 483 | 709 | 733 | 745 |
| * | | In terms of the Compensation for Occupational Injuries and Diseases Act (COIDA) |
Currently, seven schemes are recognised in the Gold Division, 10 at Kroondal and three at the Rustenburg operation. Alexander Forbes, a specialist service provider in medical scheme and employee benefits administration, was contracted to assist with the selection of suitable medical schemes and healthcare products with a view to aligning funders with our strategic objectives, formalising sustainable relationships with a select group of funders, and consolidating the number of schemes.
Sibanye continues to positively influence healthcare funders within the legal framework by working closely with them for the benefit of each employee. Case managers and clinical teams are assisted to provide on-site preventative services, including screening for and monitoring of communicable and non-communicable diseases in the workplace, through our disease management programmes.
Sibanye’s approach to healthcare has been acknowledged by the University of the Witwatersrand’s School of Public Health, as has its work on developing a primary healthcare delivery model with the Geisel School of Medicine, Dartmouth College, New Hampshire in the United States.
In the third year of a planned three-year roll out of our healthcare model, the following outcomes were achieved in 2016:
| · | | Improved wellbeing: a result of the increased emphasis on education and awareness about key health topics as well as disease prevention. Tuberculosis (TB) screening increased to 122,842 screenings from a base of 47,269 in 2015 and HIV testing to more than 11,989 tests in 2016 (2015: 8,505 and 2014: 5,038) |
| · | | Improved clinical metrics: The total TB rate has decreased significantly from 19.19 per 1,000 employees in 2013 to 13.42 in 2016, due, in part, to improved delivery of the TB programme at shaft clinics and the greater active involvement of employees in the highly active anti-retroviral therapy (HAART) programme. Adherence to the HAART programme increased from 85% to 90% over the past year |
| · | | Monitoring of financial performance: Cost per employee in the Gold Division is R824.82 a month vs. R826.19 in 2015 for Cat 3-8 employees on the company-funded option |
| · | | Reduced hospitalisations: down by 20% and hospital-bed days declined by 15% in 2016 compared to 2015 for the company-funded option |
Overall, significant progress was made in 2016 in embedding the health strategy and achieving efficiencies in the delivery of healthcare. The new healthcare model continues to be cost efficient with improved clinical outcomes, as evidenced by lower death and medical incapacity rates, fewer admissions and readmissions to hospital and improved TB and HAART programme performance.
All of the planned West Wits shaft clinics were completed and commissioned in 2016, which improved access to healthcare for all employees regardless of funding mechanism. The shaft clinics operate on a 12-hourly basis, providing trauma and emergency care, preventative and general wellbeing services as well as disease management.
Clinic attendance exceeded expectations with the more established clinics recording more than a thousand visits a month. More importantly, the visibility and accessibility of healthcare services at the shafts facilitated the rollout of wellbeing services and contributed to improved uptake of screening for communicable and non-communicable diseases as well as better adherence to chronic disease management programmes. Employees diagnosed with communicable and non-communicable diseases are referred to the Sibanye healthcare network of selected specialists and centres of excellence.
Absenteeism
Absenteeism, which includes mine accident sick leave, medical sick leave, occupational health, unpaid leave, absent without permission (AWOP), training, annual leave and other, has a significant effect on productivity and remains a major challenge. The decrease in the number of days lost due to sick leave within the Gold Division can be attributed to our proactive healthcare, and the provision of accessible, preventative, primary, healthcare at shaft level. The total percentage of unavailable days over the past few years has declined to 15.1%, of which medical sick leave has declined to around 3% (compared to 4-5% previously).
The absenteeism rate (of unavailable labour) of 18% in the Platinum Division at the end of 2016 will be addressed in terms of Sibanye’s overall health strategy in 2017.
Note: Absenteeism rate is the percentage of labour unavailable while absenteeism applies to medical sick leave, mine accident sick leave and absence from work for human resources reasons such as leave and leave without permission
| |
Sibanye Integrated Annual Report 2016 | 55 |
DISEASE AND CASE MANAGEMENT
All employees suffering from chronic diseases, such as hypertension, diabetes and asthma which are commonly known as lifestyle diseases, and from infectious diseases, such as HIV and TB, are encouraged to participate in disease management programmes provided by the medical scheme or funder to which they belong. Employees are encouraged to take greater responsibility for their health and quality of life. The number of medical conditions managed on the various programmes is captured in the table below and, as evidenced by the number of conditions and employees requiring such services, warrants investment in such programmes.
How employees are funded
| | | | |
No. of employees | 2016 | 2015 |
| Group | Platinum Division | Gold Division | Gold Division |
Principal medical scheme members | 28,555 | 20,624 | 7,931 | 8,416 |
Company-funded employees | 32,677 | – | 32,677 | 31,419 |
Medical conditions under management
| | | | |
| 2016 | 2015 |
| Group | Platinum Division | Gold Division | Gold Division |
Chronic medical conditions (schemes) | 13,242 | 8,451 | 4,791 | 4,700 |
Chronic medical conditions (company | 9,790 | – | 9,790 | 8,814 |
Total | 23,032 | 8,451 | 14,581 | 13,514 |
Overall, 23,032 medical conditions are managed by company-funded medical services and various medical schemes in the Group. The number reported refers specifically to the number of medical conditions registered on disease management programmes and includes employees who are registered for more than one condition.
CARE AND MANAGEMENT OF HIV/AIDS AND TB
VOLUNTARY COUNSELLING AND TESTING
In line with the Department of Health’s national initiative to screen 90% of the population for TB and HIV, we have increased access to screening by introducing voluntary annual testing for all employees following certificate-of-fitness examinations. In 2016, Sibanye offered voluntary counselling and testing (VCT) to 54,451 employees and contractors, of whom 28,717 were tested for HIV.
HIV/Aids – voluntary counselling and testing and HAART
| | | | | |
| 2016 | 2015 | 2014 |
| Group | Platinum Division | Gold Division | Gold Division | Gold Division |
VCT offered | 54,451 | 27,226 | 27,225 | 23,538 | – |
VCT conducted | 28,717 | 16,728 | 11,989 | 8,505 | 5,590 |
HIV-positive | 2,243 | 650 | 1,593 | 1,929 | 1,169 |
% of workforce tested | 39 | 62 | 25 | 18 | 13 |
New recipients of HAART1 | Unknown | Unknown | 928 | 875 | 548 |
Category 3-8 employees on HAART | Unknown | Unknown | 5,561 | 5,023 | 4,604 |
HAART patients employed by Sibanye (alive and on treatment) | 9,925 | 3,545 | 6,380 | 5,750 | 5,283 |
Employees off HAART2 (left programme) | 86 | Unknown | 86 | 127 | 57 |
HIV prevalence3 (%) | 8 | 4 | 13 | 22 | 21 |
1 Entry-level mining employees (Category 3-8) employees
2 Employees who left the HAART programme within 12 months of starting antiretroviral therapy
3 The prevalence rate reported is based on the number of employees testing positive as a percentage of the total number of employees tested in a given period and not as a percentage of the total workforce
Unaids 90-90-90
The South African Department of Health has adopted the United Nations AIDS 90-90-90 targets aimed at reducing the incidence and management of HIV/Aids. The department has rolled out a similar strategy to help achieve its new national development goals for 2020. In support of this, South Africa is also among the first countries in Africa to formally adopt a universal test and treat (UTT) approach in accordance with the new WHO new guidelines on HIV treatment.
UNAIDS 90-90-90 targets aim to ensure that by 2020:
| · | | 90% of all people living with HIV know their status |
| · | | 90% of people with diagnosed HIV infection receive sustained ART |
| · | | 90% of all people receiving ART have viral suppression |
Furthermore, the 90-90-90 target has been included in the department’s national TB development goals:
| · | | 90% of the population to be screened |
| |
Sibanye Integrated Annual Report 2016 | 56 |
| · | | 90% of people with TB to be diagnosed and begin treatment and |
| · | | 90 % of those treated for TB should be cured |
HIV/AIDS CARE
Sibanye is working towards compliance with the recommendations of the Department of Health, which are aligned with the United Nations target. This facilitates detection and treatment of affected employees, irrespective of funding mechanism, those employees testing positive for HIV/Aids are offered highly-active antiretroviral therapy (HAART) and started immediately on HAART (universal test and treat) and compliance with treatment is monitored through viral suppression.
As a result, there was a 6% increase in the number of employees enrolled in the Group-funded HAART programme to 928 in 2016 from 875 in 2015. The number of active participants in the company-funded programme increased by 11% to 5,561 in 2016 from 5,023 in 2015. On a consolidated basis there are 9,925 employees on HAART programmes across the Group which represents 16% of all employees.
| |
TB CARE Given TB’s symbiotic relationship with HIV/Aids and the Department of Health’s new TB targets, the same approach to TB has been adopted as with HIV. Consequently, the target is to screen 90% of all employees (see “—Performance overview—Health and safety focus—UNAIDS 90-90-90”) for TB as well as for HIV/Aids. In addition, the Mine Health and Safety Council encourages achievement of the Mining Charter milestone which is to reduce the TB rate to below the National TB rate by 2022. The current national TB rate is between 7.5 and 10 per 1,000 people however the National Strategic Plan outlines a TB target of 8.34 per 1,000 by 2015 and 5.84 per 1000 by 2022. In 2016, a total of 122,834 (2015: 47,269) TB screenings were conducted across the Group and the total TB rate at Sibanye reduced to 13.42 per 1,000 employees at risk (2015: 15.79). | 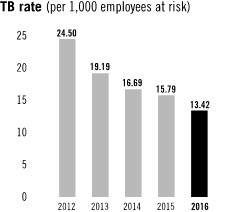
|
TB – no. of new and retreatment cases
| | | | | |
| 2016 | 2015 | 2014 |
| Group | Platinum Division* | Gold Division | Gold Division | Gold Division |
TB | 707 | 73 | 634 | 744 | 832 |
Cardiorespiratory TB | 618 | 73 | 545 | 679 | 715 |
New cases of multi-drug resistant TB | 16 | Unknown | 16 | 14 | 34 |
* Health data for the Platinum Division (Kroondal and the Rustenburg Operations) covers the entire 12 months of 2016. Tuberculosis has not been reported at the Rustenburg Operations and no data was available as it had been declared a non-controlled operation implying that TB is not recognised as an occupational disease. This will be reviewed and clarified by Sibanye and covered in the next reporting period
OCCUPATIONAL HEALTH MANAGEMENT
Sibanye’s occupational health programme focuses on preventing work-related injury and illness by engaging with stakeholders on occupational hygiene, safety and medicine, as well as formalised programmes, risk assessment, fitness to work and medical surveillance.
All employees undergo stringent medical testing annually, as part of a medical-surveillance programme aimed at monitoring the effects of occupational health hazards. The most significant occupational diseases monitored include silicosis, cardiorespiratory TB and noise-induced hearing loss.
Sibanye has made progress in reducing workplace exposure but, given the latency periods, a number of employees continue to present with occupation-related diseases.
Occupational health management
| | | | | |
| 2016 | 2015 | 2014 |
| Group | Platinum Division | Gold Division | Gold Division | Gold Division |
Medical surveillance and certificate-of-fitness examinations – total | 140,359 | 52,408 | 87,946 | 84,022 | 72,082 |
– Employees | 108,135 | 39,145 | 68,990 | 69,294 | 63,338 |
– Contractors | 32,219 | 13,263 | 18,956 | 14,738 | 8,744 |
Days lost due to health-related absenteeism | 817,075 | 340,408 | 476,667 | 478,568 | 414,424 |
| |
Sibanye Integrated Annual Report 2016 | 57 |
Healthy diets for employees
An average of 12,100 people (37% of our workforce) in the Gold Division and 1,756 people (15% of our workforce) in the Platinum Division are provided with four meals and a mid-shift snack daily.
In addition to achieving the Mining Charter’s nutritional guideline targets in both divisions, we have also standardised the menus and recalibrated portion sizes in all hostels to ensure nutritional value and contain costs.
The feeding scheme takes into account the dietary requirements of chronic diseases, such as hypertension, and omits salt from certain meals.
SILICOSIS
There was a reduction in the submitted silicosis rate for the Gold Division to 3.73 per 1,000 employees in 2016 (2015: 4.91). A total of 151 cases were submitted for the year compared to 186 in 2015, 264 cases in 2014 and 129 cases in 2013.
Within the Platinum Division, 89 cases of silicosis were submitted (39 from Kroondal and 50 cases from the Rustenburg operation) to the Medical Bureau of Occupational Diseases for adjudication in 2016. By way of comparison, the silicosis rate is 4.31 per 1,000 employees for Kroondal and 2.8 per 1,000 for the Rustenburg Operation, equivalent to a rate of 3.31 per 1,000 employees for the Platinum Division as a whole. The lower rate for the Platinum Division as compared to that for the Gold Division may be a reflection of the lower levels of crystalline silica present in platinum mining but there is significant movement of employees between the two industries. The effect of dust in the platinum industry however needs to be carefully monitored.
There appears to be an encouraging downward trend in the rates reported, which could be attributed to the adoption of the MOSH Best Practices on Dust Reduction Strategies and the target set by the Mine Health and Safety Council (MHSC) to lower the occupational exposure limit for silica to 0.05mg/m3. However, given the long latency period for the development of silicosis, there is reason to be cautious.
Continued focus on the various dust prevention mechanisms is required to prevent dust liberation at source and ultimately to reduce dust levels and the long-term incidence of silicosis and other occupational lung diseases.
NOISE-INDUCED HEARING LOSS
To reduce the incidence of noise-induced hearing loss (NIHL), which increased to 188 cases in 2016 across both divisions, from 105 in 2015, efforts to lessen noise in the workplace continue through the sourcing of quieter machinery and by providing more effective personal protective equipment.
Submissions of NIHL in the Gold Division increased to 3.12 per 1,000 employees in 2016 compared to 2.82 in 2015. A total of 126 cases were submitted for NIHL compensation compared to 105 cases in 2015 and 138 cases in 2014. Early NIHL, based on hearing loss of between 5% and 10%, declined to 63 cases in 2016 compared to 125 cases in 2015 and 332 cases in 2014.
NIHL in the Platinum Division is reported as 2.31 per 1,000 employees which is slightly less than that for the Gold Division – 2.08 per 1,000 for the Rustenburg Operation and 2.77 per 1000 employees for Kroondal.
The variance between the individual platinum operations will be investigated to identify opportunities to further reduce exposures. The introduction of customised hearing-protection devices for high-risk occupations is supported and is currently being rolled out.
The high submission rates of NIHL occur despite compliance with the new occupational exposure limit of less than 107dB (A), introduction of the noise clipper coach programme and ensuring high-risk employees are correctly fitted with hearing-protection devices. Sibanye aims to fit all high-risk employees with customised hearing-protection devices which will include basic education on the harmful effects of noise, the responsibility of each employee and product orientation.
Occupational diseases – no. of cases reported
| | | | | |
| 2016 | 2015 | 2014 |
| Group | Platinum
Division | Gold
Division | Gold
Division | Gold
Division |
Silicosis1 | 240 | 89 | 151 | 186 | 264 |
Chronic obstructive airways disease2 | 46 | 16 | 30 | 57 | 45 |
Noise-induced hearing loss3 | 188 | 62 | 126 | 105 | 138 |
1 Exposure to free silica (SiO2), also known as crystalline quartz, found across a broad range of industries, including mining, cement manufacturing and quarrying, reaches the small airways of the lungs and forms tiny nodules (pulmonary fibroses), resulting in silicosis
2 Chronic obstructive airways disease (COAD) is characterised by chronically poor airflow, resulting in shortness of breath, coughing and sputum production. Long-term exposure to smoking, and particulates associated with air pollution as well as genetic predisposition, cause an inflammatory response in the lungs, resulting in a narrowing of the small airways and breakdown of lung tissue, known as emphysema or chronic bronchitis
3 Diagnosis of noise-induced hearing loss (NIHL) is made on assessment of the percentage hearing loss from baseline audiograms with NIHL defined as loss of hearing in excess of 10% that has manifest over a prolonged period after repeated exposure to noise levels in excess of 85dBA
As a member of the mining industry’s Gold Working Group occupational lung disease initiative, Sibanye participated in a project with the Department of Health, the Medical Bureau for Occupational Diseases and the Compensation Commission for Occupational Diseases to address the backlog in claims for occupational lung disease. Sibanye has committed financial and occupational medical practitioner resources to this project, which is yielding promising results with more than 18,251 certifications having been processed in 2016, and 4,356 current and former mineworkers receiving compensation.
| |
Sibanye Integrated Annual Report 2016 | 58 |
TRAUMA CARE
Partnerships with major trauma centres in the regions in which we operate continue to be developed. The Trauma Society of South Africa has assisted Sibanye in improving trauma care at each operation and in our host communities by auditing systems, healthcare providers and facilities.
HEALTH – FUTURE FOCUS
Further improvements in efficiencies in healthcare and the quality of care are planned by consolidating the efforts of funders and the alignment of providers. The platinum operations will be integrated along the principles of preventative healthcare and will include the establishment of shaft clinics to enhance the access and delivery of healthcare to all employees.
The number of medical schemes will be consolidated with the most beneficial options chosen and the current working partnership with the Department of Health enhanced for the benefit of the community at large. Cost efficiencies will be improved by eliminating duplication, and the delivery of healthcare and related outcomes in the communities in which we operate will improve.
| |
Sibanye Integrated Annual Report 2016 | 59 |
social upliftment and community development
Highlights of 2016
| · | | Socio-economic development spend on community development projects – spend by the Gold Division totalled R59.4 million which accounted for 1.3% of that division’s pre-tax profit and that by the Platinum Division (excluding Rustenburg) totalled R12 million, 3.3% of the division’s pre-tax profit |
| · | | The 2012 five-year social and labour plan (SLP) cycle came to an end in 2016 |
| · | | Establishing relationships with communities and stakeholders in the vicinity of our platinum operations |
| · | | Distributed food hampers prior to the year-end break as a goodwill gesture in all host communities of our gold and platinum operations |
| · | | Assisted with resourcing the ante-natal unit at Leratong Hospital on the West Rand |
| · | | Optimised our learner support programme which benefits more than 1,000 learners in Merafong, Gauteng and in the Free State and Eastern Cape |
APPROACH
Sibanye believes that meaningful socio-economic transformation is dependent on all stakeholders working together to build safe and sustainable communities and recognises its role as a responsible corporate citizen in the context of the current and legacy challenges facing the South African mining industry.
Employees and communities are key stakeholders and ensuring that they, along with other stakeholders, derive value from Sibanye’s business activities, is critical to the success and sustainability of the Group. This is captured in Sibanye’s stated core purpose, which is that its mining improves lives. While the responsibility for delivery of infrastructure and services remains a primary responsibility of Government, Sibanye recognises that it can play an important role in enabling the transformation of the South African economy and delivering employment and purpose to the people of South Africa. This transformation requires an emphasis on public-private partnerships in which participants work together to achieve maximum, sustainable socio-economic impact.
Communities, which often include many Sibanye employees, can and should play a significant support role to the mining companies, by supplying labour, services and products. Our communities can, however, disrupt and have a negative impact on the economic viability of operations, affecting safety, production and posing other societal risks. It is vital that we develop mutually-beneficial relationships with our communities.
Poverty and unemployment in South Africa are increasing, and these social ills bring with them the threat of socio-economic instability. While poverty, unemployment and lack of decent housing are common in many South African communities, they are more prominent in mining towns and surrounding villages, where growth has been rapid and outpaced the delivery of housing and infrastructure. Informal settlements continue to proliferate, with critical services not being provided or maintained. Although these social challenges seem daunting, especially when considered in isolation, experience to date has taught that such challenges can be managed by means of collaborative, directed and targeted interventions.
Community development strategy
Sibanye’s community development strategy is based on the principles of the United Nations’ Sustainable Development Goals and its own strategic objectives. The strategy aims to:
| · | | maintain social licences to operate through effective engagement and mutually beneficial relationship building beyond compliance |
| · | | use resources appropriately and effectively to respond to identified and agreed community needs immediately and in the future |
| · | | actively identify key multi-sectoral partnership opportunities in order to leverage our contribution and associated impacts |
| · | | focus efforts on achieving tangible and sustainable impacts that will continue beyond the life of mine |
| · | | go beyond financial resources and consider the best use of other internal assets and resources |
| · | | build expertise and relationships through collaboration for the benefit of communities |
| · | | avoid dependency and encourage the creation of alternative economies that are independent of mining |
| · | | create long-term sustainability consistent with the closure strategies |
| · | | achieve the greatest impact by focusing on a few key areas that can be leveraged effectively |
| · | | continuously monitor and evaluate the impacts and social returns from investments |
Sibanye’s community development strategy is based on two important components:
| · | | Economic diversification |
| · | | Empowerment through skills development |
While economic diversification is critical in terms of the long-term sustainability of communities, it is contingent upon our communities having been given the requisite skill sets.
| |
Sibanye Integrated Annual Report 2016 | 60 |
The process of empowering our communities through skills development starts with basic education and progresses towards tertiary education and other more hands-on interventions like artisan training and learnerships. Sibanye believes that many of the issues currently faced by communities can be solved through a concerted effort in skills development and improved education levels. This approach will enable many to obtain employment in established industries and others to create local employment by creating sustainable enterprises. We thus focus on enabling empowerment and transformation within education.
The following infrastructure and education programme interventions were implemented during 2016:
| · | | Plans compiled for the construction of Skenjana Senior Secondary School in the town of Idutywa in the Mbhashe District Municipality in the Eastern Cape |
| · | | Planning completed for the construction of Simunye Senior Secondary School in Westonaria, Gauteng |
| · | | Construction of a school hall at Taiwe Senior Secondary School Hall in Theunissen in the Free State |
| · | | Construction of a hall at Embonisweni Primary School in the Free State |
| · | | Establishment of a mathematics laboratory as well as renovations and a borehole for the school feeding scheme at Mamello Senior Secondary School near Welkom in the Free State |
| · | | Mathematics and science programme in partnership with the Free State Department of Education and the Kutlwanong Centre for Maths, Science and Technology |
| · | | Construction input incubator hub being established in Westonaria, Gauteng |
| · | | Geotechnical investigations and land donation for the Westcol Technical, Vocational, Education and Training (TVET) College, Westonaria, Gauteng |
Governance
Aside from contributing to community development and upliftment as articulated above, Sibanye also carries out corporate social investment (CSI) in an effort to improve the conditions in communities and in response to requests for donations. These requests are reviewed by a Community Development Steering Committee which ensures accountability and responsibility for our CSI initiatives and donations and is governed by Sibanye’s mine community development and corporate social development policy. The committee is accountable to a higher level, executive-led Sustaining our Social Licence to Operate Committee.
The Sustaining our Social Licence to Operate Committee advises and makes regulatory compliance decisions on local economic development and on CSI projects that are above an investment threshold (R50,000) to be supported in host communities. It is also responsible for providing policy direction, overall project oversight and reviewing project impacts and effectiveness.
Both of these committees report to the relevant board committees, namely, the Social and Ethics Committee and the Safety, Health and Sustainable Development Committee. The Social and Ethics Committee monitors Sibanye’s activities to ensure compliance in relation to relevant legislation and codes of good practice while the Safety, Health and Sustainable Development Committee ensures that Sibanye adheres to sustainable development principles and practices.
PERFORMANCE IN 2016
Socio-economic development expenditure (R million)
| | | | | | |
| 2016 | 2015 | 2014 | 2013 |
| Group | Gold Division | Platinum Division | Gold Division | Gold Division | Gold Division |
Local economic development/social and labour plans | 59 | 47 | 12 | 27 | 24 | 17 |
Training | 4 | 4 | 0 | 384 | 353 | 316 |
Sport, conservation and environment | 0.4 | 0.4 | 0 | 1 | 10 | 9 |
Infrastructure | 181 | 181 | 0 | 197 | 649 | 699 |
Health | 4 | 4 | 0 | 6 | 5 | 5 |
Enterprise development | 0 | 0 | 0 | 0 | 3 | 2 |
Education | 393 | 321 | 72 | 62 | 10 | 1 |
Donations | 15 | 12 | 3 | 14 | 1 | 1 |
Total | 656 | 569 | 87 | 691 | 1,055 | 1,050 |
Details of our local economic development projects, as well as housing and accommodation and agriculture projects, are available on our corporate website at www.sibanyegold.co.za
THE SIBANYE-GOLD FIELDS ALLIANCE PROJECT
Sibanye and Gold Fields have co-operated on the implementation of community-based projects in Westonaria. This alliance project will form the basis of our local economic development strategy to create jobs outside of mining, especially in agriculture.
This community development initiative is being rolled out in two phases:
| · | | Phase 1 (completed in 2015) focused mainly on social aspects, such as mobilisation and communication, for the establishment of a fully representative community engagement platform as well as the creation of local small enterprises |
| |
Sibanye Integrated Annual Report 2016 | 61 |
| · | | As well as the sustainability of the phase 1 enterprises, phase 2 is focused on agricultural activities. This phase involves establishing an AgriPark or hub to serve as an agri-processing centre to provide support and input to surrounding community farmers, known as “outgrowers”. Certain local commercial farmers will be involved in the AgriPark and will provide assistance, farming implements and advice. Two outgrowers with 20ha of land each were assisted in site preparation for the planting season through to mid-2016. Training of beneficiaries is due to be completed in 2017. Integration of the initiative into the social and labour plans of Driefontein, Kloof and Cooke Operations has begun as well as engagement with the regulator and other key stakeholders, including local and district municipalities. Successful implementation of phase 2 will determine the way forward towards economic viability |
| · | | Sibanye and Gold Fields are currently funding the project jointly and have committed a combined R12 million for phase 2. Sibanye committed funding of R6 million towards this project in 2016 |
Stakeholder engagement
A proactive approach to stakeholder engagement is critical in our quest to build credible relationships with our stakeholders and uphold our social licence to operate. We engage continually with the government and in particular, the Department of Mineral Resources, local municipalities, communities and organised labour on matters of mutual interest and benefit.
The most tangible benefits of our proactive approach towards stakeholder engagement in 2016 included:
| · | | collaboration with key stakeholders, including municipalities, in key initiatives such as integrated development plans as well as launches, roll out and alignment of projects and assisting government in funding development opportunities |
| · | | enabling exploration of possible synergies in community development initiatives and co-funding |
| · | | facilitating alignment of the Sibanye Community Development Strategy with Gauteng’s provincial economic development strategy |
| · | | hosting empowerment workshops for unemployed youth with community forums |
| · | | averting planned marches and production stoppages by communicating clearly and unambiguously with interested and affected parties, including enabling safe routes for buses transporting employees to and from work, during labour disputes |
| · | | a community platform on recruitment processes |
| · | | support by municipalities during compliance inspections |
We engaged with host communities and those in labour-sending areas to assess their expectations and perceptions of our community development projects. We also invited labour-sending communities to visit Sibanye to see the living conditions of their family members employed by us.
In 2016, many informal and official engagements took place in the Rustenburg area following our acquisition of the platinum operations in North West Province. Engagement structures and forums are being streamlined accordingly.
Extensive stakeholder engagement focused mainly on recruitment and procurement processes, which constitute two major concerns in these communities. We have appointed a dedicated community engagement and development team in the Platinum Division to deal with what we deem to be unique challenges in the platinum belt.
In the interests of sustainability, we have also engaged with the Department of Mineral Resources in North West Province and, as a result, have streamlined and aligned our social and labour plans for operations within the Platinum Division with those of the Gold Division and to meet commitments set by our predecessors.
Following government’s Mining Phakisa workshop in December 2015, held under the auspices of the Department of Planning, Monitoring and Evaluation, engagement continued with key stakeholders in 2016. This engagement related in particular to our agricultural projects, in which we participate as part of the Sibanye-Gold Fields Alliance and which are due to be fully incorporated into our social and labour plans in the next cycle, as part of a much larger project roll-out.
Social and labour plans
In 2016, we engaged with the Department of Mineral Resources (DMR) in North West Province to have the social and labour plan (SLP) cycles for our platinum operations amended so that they would align with those of the rest of the Group. All the 2015 annual SLP reports for our gold operations were submitted in July 2016.
Our five-year SLPs expired at the end of December 2016. Preparatory work for the following five-year SLP cycle was begun in good time, starting with an independent baseline study to inform our approach to community development projects for Burnstone, which is due to begin operating in 2017. This study will enable us to adequately address the needs of host communities in the vicinity of the operation. Completion of Burnstone’s draft SLP compiled in the past year is subject to finalisation of targets and cash flow projections that form part of the mine’s work programme, which was included in Burnstone’s bankable feasibility study.
Preparation for the SLPs for the remaining gold and Kroondal operations included appointing an external service provider to conduct independent impact assessment studies and evaluate the efficacy of previous SLP projects, to identify risks associated with project implementation, as well as to identify and recommend areas of focus for future socio-economic interventions. The final report provided invaluable guidance on the nature and extent of investments to be made in the new SLP cycle.
In preparing these SLPs for submission to the DMR, we realised that there would be challenges in aligning our activities with key transformational and developmental imperatives, such as the revised Mining Charter, which is currently under review and expected to be finalised early in 2017, and municipalities’ Integrated Development Plans. We therefore requested and were granted a six-month extension to the deadline for submission to end June 2017. Such a request was not granted to Beatrix, for which a draft SLP was submitted in December 2016. The extension will enable us to align with the requirements of the revised Mining Charter, and to participate fully in the development of municipalities’ new Integrated Development Plans following the August 2016 local government elections.
Among the challenges relating to our SLPs was construction of employee accommodation at Beatrix and the Cooke 1, 2 and 3 operations. At Beatrix, this was complicated by the fact that planned upgrades and conversions were located in isolated mining areas and not fully integrated into the local community, and thus not aligned with the government’s human settlement programme. Cooke 1,
| |
Sibanye Integrated Annual Report 2016 | 62 |
2 and 3 operations on the other hand could not afford the construction costs given the production challenges being encountered. Formal requests were submitted to the DMR, in terms of the MPRDA, to amend the Housing and Living Conditions sections in the respective SLPs for Beatrix and for Cooke 1, 2 and 3. Both applications are being considered by the department and no formal response has been received to date.
Similarly, proposed changes to the Human Resources Development sections of the Beatrix and Cooke SLPs were also submitted to the DMR. Since most training targets had been met in the first four years of the SLPs, the operations sought to consider business-driven training requests or to reduce targets where possible. The regulator also requested that plans be submitted to address backlogs in adult education and training as well as learnerships.
Implementation plans for all operations were submitted to the DMR in February 2016, as required by each mining right. The implementation plans outline annual objectives set to meet SLP goals within the five-year cycle.
Following the submission of the 2015 annual Mining Charter reports on 31 March 2016, the DMR required completion and submission of a specific template by the end of April 2016. The detailed template was intended to aid the department in assessing the current Mining Charter which expired at the end of 2014. Revised reports for all Sibanye operations were submitted on 30 April 2016.
In terms of Section 92 of the MPRDA, inspections were conducted at Driefontein and Beatrix on 5 August 2016 and 17 November 2016, respectively, to assess compliance with the Mining Charter and implementation of SLP commitments. The DMR issued a directive to address shortcomings identified in certain aspects of human resource development and procurement at Beatrix. In its formal response to the directive, Beatrix undertook to incorporate these backlogs into its new SLP.
On 20 September 2016, Beatrix hosted the Parliamentary Portfolio Committee on Mineral Resources which conducted an oversight visit to assess our approach to silicosis, see “—Performance overview—Health and safety focus—Silicosis” for greater detail.
Procurement and enterprise development
In support of local entrepreneurs, an online registration system has been developed and implemented for all prospective suppliers. Sibanye assists local vendors in workshops organised by the Department of Mineral Resources and municipalities in collaboration with business and unemployment forums.
Of total Group procurement for the year, R9.9 billion was discretionary expenditure1.
The Gold Division’s total procurement spend with BEE entities was R4.9 billion2 (2015: R4.7 billion 2) in 2016 while the Platinum Division spent R2.7 billion since the effective acquisition of the relevant assets. Total BEE procurement spend amounted to R7.6 billion for the year. This was equivalent to 77% of total procurement spend for the year.
BEE procurement2 in 2016 (%)
Safety, Healthd Sustable Development Committee ensures that Sibanye adheres to sustainable development principles and practices | | | |
| Capital goods Target: 40% | Consumables Target: 50% | Services Target: 70% |
Gold Division | | | |
Beatrix | 63 | 66 | 73 |
Cooke 4 | 80 | 58 | 89 |
Cooke 1, 2 and 3 | 64 | 62 | 80 |
Driefontein | 71 | 56 | 77 |
Kloof | 86 | 65 | 81 |
Platinum Division | | | |
Kroondal | 87 | 93 | 95 |
Rustenburg | 80 | 73 | 86 |
Sibanye has an electronic portal that enables SMMEs to register as vendors. The portal includes the Burnstone project (currently under construction) and it will include the platinum operations in 2017. The portal facilitated participation of more SMMEs in tender processes in 2016 and has created more opportunities for local suppliers to be awarded contracts through closed tenders. As Sibanye does not import goods and services, it does not have any multinational companies on its supplier data base.
1 The procurement targets given by the Mining Charter apply to procurement that “excludes non-discretionary procurement expenditure”, which is defined as expenditure that cannot be influenced by a mining company, such as procurement from the public sector and state enterprises. The procurement targets thus apply to discretionary expenditure over which Sibanye has influence
2 Excludes expenditure on the Burnstone project
FUTURE FOCUS
Meaningful transformation is critical if we are to succeed as a company and as an industry to improve the lives of the communities around our operations. We believe that by building credible relationships and collaborating with all the relevant roles players, we will be able to ensure sustainable development.
We believe that by unlocking the local potential through skills development and acting as a catalyst for alternative economies that are not dependant on mining, we will be able to meet the aspirations of our communities.
Although specific local economic development projects have not been confirmed for the new SLP cycle, we have identified strategic focus areas and opportunities for collaboration that we believe are in line with the developmental aspirations of our stakeholders.
We are convinced that by implementing projects in the following critical areas we will realise our primary strategic objective, to create an economy within our communities that is aligned with the mainstream economy but independent of mining by:
| · | | establishing a construction incubator hub for SMME development related to housing infrastructure requirements in the region e.g. the planned development of a settlement called Syferfontein. It is envisaged that this hub will support about thirty SMMEs during 2017 to 2018. Plans are for the incubation hub with its initial five work streams (brick making, roof trusses, welding, carpentry, spray painting) to |
| |
Sibanye Integrated Annual Report 2016 | 63 |
become a fully-fledged construction supplier park, based in Westonaria where up to 30 work streams (employing close to 1,000 people) will supply the construction industry with items such as tiles, roof tiles, sanitary ware, plumbing supplies, construction equipment, etc. The hub will also include a showroom and sales facility for planned settlements and the municipal housing backlog as well as the Sibanye employee housing programme |
| · | | using impacted mine land (that is land that cannot be used for buildings owing to the risk of sink holes) and infrastructure such as warehouses and buildings to establish agri-infrastructure and create facilities for local SMMEs involved in agriculture for agri-processing and other forms of beneficiation. Some infrastructure will be converted into training centres so as to ensure the empowerment of our communities in terms of agriculture and its associated businesses. The use of mine land and infrastructure speaks to our social closure strategy and reduces our rehabilitation liabilities, while at the same time reducing the risk of land invasions and illegal occupation. The agri-infrastructure and agri-processing facilities will provide the offtake required for the regional farmer outgrower agriculture programme that was piloted by the Sibanye-Gold Fields Alliance |
| · | | constructing education and health infrastructure |
| · | | constructing technical and vocational education and training colleges where needed |
| · | | donating land and formalising informal settlements – this is at an advanced stage at Bhongweni and Toekomsrus, near Westonaria, in Gauteng, where Sibanye is donating land to the municipality which will assist with the provision of infrastructure. Certain stands will be reserved for mine employees while the remainder will include zones for light industry, business and rental units. We are also investigating the urban farming settlement concept instead of the normal RDP townships. The urban farming will realise self-sustainable settlements and the first of these concepts has been approved in Mpumalanga. The mayor of the Rand West City Local Municipality has set up a special steering committee to assist with adopting this concept. Government departments and financial institutions are key stakeholders that have bought into this concept. This could be a huge-impact development project and could be rolled out to other informal settlements occupied by mineworkers which could be formalised – such as Silver City in Merafong |
The impact of these projects will be compounded through collaboration and the creation of partnerships with other role players to augment Sibanye’s investment. As a result, Sibanye has established a community trust and is inviting external sources including our major suppliers, to contribute on a voluntary basis and who will be involved as trustees in terms of where their contributions would have the highest impact. Other potential sources of funding have been approached, including the departments of Small Business Development, of Agriculture and of Trade and Industry.
We have begun revising our supply chain strategy so that SMMEs in our host communities can benefit from our enterprise development programmes and participate meaningfully in our value chain so as to stimulate the local economy through the creation of enterprises that will eventually become independent of mining.
| |
Sibanye Integrated Annual Report 2016 | 64 |
minimising the environmental impact
OUR APPROACH
Duty of care
Sibanye adheres to the general environmental duty of care principle as outlined in Section 28(1) of the National Environmental Management Act, 1998 (Act No 107 of 1998) (NEMA). In addition, Sibanye strives to uphold the highest environmental standards and complies with all applicable legislation governing the use of resources, responsible waste management, conservation of biodiversity, and closure and post-mining land use. Employees are also kept informed about, and they are encouraged to adhere to and deliver on our water and environmental management policies.
Awards and recognitions received
Sibanye achieved an A rating for its 2016 Carbon Disclosure Project (CDP) climate change submission and has been included in the global A list of leaders in climate change reporters.
Environmental incidents
Sibanye considers any environmental incident to be serious but publicly reports on Level 3 (ongoing but limited impact), Level 4 (medium-term impact) and Level 5 (long-term impact) environmental incidents. All incidents are recorded, investigated and classified as they occur. Steps are taken to mitigate and prevent any recurrence. Incidents are monitored continuously and reported internally on a monthly and quarterly basis.
In 2016, the Gold Division reported six level 3 environmental incidents (2015: eight and 2014: nine). This comprised four level 3 incidents at the Cooke operations and two level 3 incidents at Driefontein. No level 4 or level 5 incidents were reported.
The Platinum Division reported 13 incidents, all at Kroondal – five level 3 and eight level 4 incidents – since its acquisition. It is important to note that the classification system used by the Platinum Division differed from that used by the Gold Division. A process to align and standardise the reporting, recording and classification of environmental incidents across the Group is underway and will be completed by June 2017.
PERFORMANCE
Water management
Total mine water consumption for the Group was 45,860Ml (Gold Division: 41,484Ml; Platinum Division: 4,376Ml) for 2016, of which 33% was purchased from water services authorities (2015: 36%).
Consistent water consumption in the Gold Division in 2016 was a result of the implementation of the SibanyeAMANZI water strategy, which seeks to reduce the quantity of water purchased by means of water conservation and demand management initiatives as well as deployment of Sibanye’s own water purification plants.
Water used* and discharged (Ml)
| | | | |
| 2016 | 2015 |
| Group | Platinum Division | Gold Division | Gold Division |
Water withdrawal | 111,693 | 4,376 | 107,317 | 114,735 |
Water discharged | 65,833 | 0 | 65,833 | 73,160 |
Water used* | 45,860 | 4,376 | 41,484 | 41,575 |
Total purchased | 15,027 | 2,674 | 12,353 | 14,795 |
Volumes treated (Mt) | 26.8 | 6.6 | 20.2 | 19.9 |
Intensity (Ml/tonne treated) | 0.00171 | 0.00066 | 0.00205 | 0.00209 |
Note: Water used = total abstracted – water discharged
| * | | This year we report on the volume of water used rather than on the volume recycled and reused. Sibanye operates mines that generate almost zero effluent (100%) consumed and mines that must discharge certain volumes of water in terms of their water use licences to satisfy the requirements of the environmental reserve and/or to satisfy dewatering requirements. Nevertheless, Sibanye continues to practice effective water conservation and water demand management, in accordance with the requirements each of its water use licence. |
| |
Sibanye Integrated Annual Report 2016 | 65 |
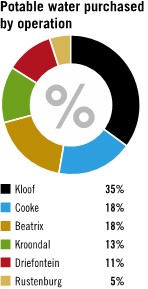
Although Cooke is a smaller operation than Kroondal, its water consumption includes that by the hostels located at the Cooke Operation. In addition, Kroondal's consumption is for nine months of the year, as opposed to a full year.
Sibanye’s Water Management Department has been structured to deliver on the following key functional areas:
| · | | Compliance with water use licence requirements continued to improve as a result of increased specialist interventions. Structural compliance with specific requirements of water use licences has been challenging and remains the key obstacle to achieving 100% compliance with regard to water quality. In order to address the issue, it has been decided to apply for amendments to these water use licences. |
| - | | Underground settler treatment systems converted into cold lime softening treatment plants at four mine shafts, to facilitate metals and uranium removal, and partial desalination, are delivering satisfactory results. |
| - | | A new water use licence was received for Kloof, which resulted in compliance cost savings as well as improved compliance. |
| - | | The Driefontein water laboratory has been upgraded and, from 2017, the use of external laboratories will be reduced as a result. |
| - | | Sibanye experienced an increase in inspections by the Compliance and Enforcement section of the Department of Water and Sanitation (DWS) in 2016. Two letters of intent to issue a directive were received. However, no directives were ultimately issued. |
| - | | The team is also responsible for water quality sampling at 868 points, monitoring and submission of results to the DWS as per the water use licence requirements, which stipulate that sample points should be monitored for frequencies of surface water, groundwater and discharges. |
| · | | Innovation and projects: Several projects were designed and implemented during 2016. |
| - | | Trans-Caledon Tunnel Authority (TCTA) Western Basin acid mine drainage (AMD) treatment plant: successful commissioning of the 30Ml/d settler upgrade project and modification of the precipitation system, resulting in substantial cost savings and prevention of AMD discharges from an old decline mining shaft in Randfontein (17 winze). |
| - | | Kloof water treatment plants: design and specification of several potable water treatment plants as well as a demineralisation plant to reduce dependency on supplies from water services providers and to improve feed water quality |
| - | | Underground lime softening plants: modifications to dosing systems to facilitate the removal of metals and uranium from underground mine water at Cooke 1 and 2 shafts, Ezulwini and Kloof 8 Shaft |
| - | | Ezulwini shaft closure project: project management and facilitation of the basic assessment and water management closure – the current cost of the pump and treatment process is approximately R13 million per month. Full shaft closure is planned for the fourth quarter of 2017. Studies have shown that rewatering of the Gemsbokfontein West compartment will produce minor risks as far as ground stability, water quality and barrier plug safety are concerned |
| - | | Innovation: Sibanye received approval in terms of Section 11D of the Income Tax Act, 1962 (Act No 58 of 1962) to conduct four water management innovation projects, which include biological treatment of mine effluent and tailings, rare earth elements recovery, cyanide recovery from tailings and economical remediation of mining impacts through the recovery of minerals as part of rehabilitation |
| · | | Operational and maintenance support: Sibanye continues to contract and administrate purchases of potable water, water resources charges, underground settler management, cooling water treatment contracts and the operation of the TCTA AMD treatment plant, the Driefontein North Shaft drinking water plant and the Ezulwini potable water treatment plant |
Sibanye continues to assess, optimise and document the water balance for each water use licence and submit the annual returns. We deployed a water conservation and demand management system in 2016, which provides real-time water consumption and alerts when leaks are detected. The system has already generated several real benefits, including reduced night flows, leak management and reconciliation of municipal and water board flow meters. The next phase of the system comprises the installation of instrument sensors at water plants, leak detection for tailings disposal and real time monitoring of water use licence discharges.
Awareness and stewardship: Sibanye hosted in an international investor conference and a technical tour for participants as well as several community visits to the Western Basin surface operation, and also participated in several stakeholder and water-management public forum meetings. Several students were assisted with post-graduate research and Sibanye participated in the Minerals Board meetings at the University of Cape Town, focusing on research and development within the mining industry.
ACID MINE DRAINAGE
Water management activities relating to the management of AMD include:
| |
Sibanye Integrated Annual Report 2016 | 66 |
| · | | Extensive water quality and salt load measurement and management |
| · | | Catchment-wide biomonitoring and toxicity assessments |
| · | | Ensuring that underground lime dosing plants and cold lime softening facilities operate within specifications |
| · | | Continuing research and pilot plant work to find ways to economically recover metals from AMD water |
| · | | Operating the Western Basin Trans-Caledon Tunnel Authority AMD treatment facility at the Cooke Operations |
WATER USE LICENCES – STATUS
| · | | Kloof received a new water use licence in 2016 |
| · | | All operations, in the Gold and Platinum Divisions have current water use licences or authorisations |
| · | | Applications have been made for amendments to some of these licences and feedback from the DWS is pending |
| · | | Splitting of the single water use licence for the Rustenburg assets, in line with the new ownership of assets following the acquisition of certain of the Rustenburg assets from Anglo American Platinum, awaits feedback from the DWS |
TAILINGS AND WASTE PROGRAMME
To reduce costly double handling of lower grade development or waste material, which was previously hoisted separately and stored on surface rock dumps for future processing through dedicated surface material plants, a decision was made in 2014 to mill and process development material with underground ore at all the gold operations. As a result there is no longer a need for rock dumps on surface and existing dumps are currently being processed and removed. Significant effort has also been made to improve the quality of mining factors, such as reducing dilution by lowering stoping widths. In addition, reducing dilution by minimising the amount of waste rock mined has significant cost and environmental benefits, including a smaller surface footprint, which results in lower dust emissions and more effective management of water pollution.
Gold Division
| | | | |
Waste management (Mt) | 2016 | 2015 | 2014 | 2013 |
Tailings into TSFs | 15.46 | 14.31 | 15.73 | 13.11 |
Tailings into pits | 4.02 | 4.20 | 3.79 | – |
Waste rock | 0.18 | 7.14 | 0.60 | 0.76 |
Recycled waste* | 12.09 | 11.34 | 11.96 | 13.29 |
Total mining waste | 19.69 | 25.65 | 20.12 | 13.87 |
* This gold-bearing material such as the waste rock dumps that is retreated at the plant
Platinum Division
| | | |
Waste management (Mt) | Kroondal (April – Dec) | Rustenburg (Nov – Dec) | Total 2016 |
Tailings into TSFs | 3.36 | 7.34 | 10.7 |
Tailings into pits | 0 | 0 | 0 |
Waste rock (including the Kroondal dense media separation dumps) | 1.85 | 0.37 | 2.22 |
Recycled waste | 0 | 0 | 0 |
Total mining waste | 5.21 | 7.71 | 12.92 |
CLIMATE CHANGE, EMISSIONS AND AIR QUALITY MANAGEMENT
Sibanye’s activities affecting ambient air quality, identified by the Department of Environmental Affairs (DEA) through the National Environmental Management: Air Quality Act, 2004 (Act No 39 of 2004) (Air Quality Act), include the metallurgical smelting process, lead processes in the assay laboratories and waste incinerators at sewage works. To manage these processes, isokinetic sampling and analysis is used to determine the composition and concentration of emission gases and particulate matter. Results are used in impact assessments.
All of Sibanye’s operations with activities listed in terms of the Air Quality Act have the necessary authorisations (provisional atmospheric emissions licences or atmospheric emissions licences). All operations completed setup and initial reporting of emissions in 2015 in terms of the National Atmospheric Emissions Inventory System, as required, by 31 March 2016.
Sibanye is committed to global warming and climate change initiatives through the deployment of responsible strategies and actions. Identified climate change risks include:
| · | | Financial (application of certain policies and measures such as carbon tax) |
| · | | Business risk (introduction of sector and Group carbon budgets, Eskom electricity supply constraints and impacts on production) |
| · | | Physical (extreme events such as heavy rainfall and severe storms, hail and tornadoes which damage infrastructure) |
| · | | Supply chain (disruption of key products such as timber support with concomitant cost increases) |
In order to manage these risks, Sibanye participates actively in shaping the national response to climate change by lobbying National Treasury and the DEA on policies and measures to achieve a low carbon economy. In addition, Sibanye also lobbies through institutions such as the Chamber of Mines.
In 2016, Sibanye participated in the National Business Institute (NBI) survey of adaptation to climate change by companies. The information gathered from the survey is being used by the NBI to draft a report on adapting to climate change. Changes in the physical
| |
Sibanye Integrated Annual Report 2016 | 67 |
environment are addressed through mitigation and adaptation. Mitigation measures relating to water storage and pumping infrastructure are being considered to handle extreme events and green building design is considered for new buildings.
Sibanye has embarked on a programme to raise awareness and build the resilience of its supply chain to climate change and thus minimise supply disruptions while managing product costs. In this regard, a meeting was held with our key timber supplier. The timber supplier is aware of the potential effects of climate change and manages its climate change risk by diversifying the geographical spread of its timber growing areas and holding prepared timber inventories in strategic areas.
Climate change also offers opportunities which Sibanye plans to harness, including revenue recycling opportunities through projects aimed at integrated electricity demand management (formerly demand side management projects) either partially or fully funded by Eskom and through tax incentives for low carbon intensive processes such as those included in Section 12L of the Income Tax Act.
In order to actively manage its carbon emissions, Sibanye carries out a detailed assessment of its Scope 1, 2 and 3 emissions (carbon inventory). The inventory is compared to the established base year and to short-, medium- and long-term targets.
Sibanye has also undertaken to align targets using the science-based sectoral decarbonisation approach. Our emissions are summarised below.
Scope 1 and Scope 2 (direct emissions) carbon inventory (000t CO2e)
| | 2016 | 2015 | 2014 | 2013 |
| | Group | Gold Division | Platinum Division | Gold Division | Gold Division | Gold Division |
Scope 1 (excluding fugitive mine methane) | t | 116 | 18 | 99 | 94 | 110 | 62 |
Scope 1 (fugitive mine methane) | t | 596 | | 596 | 650 | 660 | 572 |
Scope 2 | t | 4,720 | 557 | 4,163 | 4,272 | 4,405 | 3,774 |
Scope 3 | t | 1029 | 180 | 849 | 867 | 863 | 634 |
CO2e intensity | tCO2e /tonne milled | 0.22 | 0.12 | 0.24 | 0.25 | 0.28 | 0.32 |
The 2016 carbon emissions include emissions from the acquisitions as of the time they became effective (i.e. Kroondal from April 2016 and the Rustenburg Operations from November 2016)
Emissions from 12 of the 15 Scope 3 categories have been included for the Gold Division as follows:
| 1. | | Purchased goods and services: emissions associated with the extraction and production of timber, cyanide, hydrochloric acid, lime, cement, caustic soda and purchased water |
| 2. | | Capital goods: emissions associated with the production of purchased company-owned vehicles |
| 3. | | Fuel- and energy-related emissions not included in Scope 1 or Scope 2: emissions associated with the extraction, production and transportation of diesel, petrol, LPG, coal (industrial), blasting agents (ANFO), oxyacetylene and grid electricity |
| 4. | | Upstream transportation and distribution: emissions associated with the transportation and distribution of purchased timber, cyanide, hydrochloric acid, lime, cement and caustic soda between suppliers and Sibanye |
| 5. | | Waste generated in operations: emissions associated with the disposal and treatment of Sibanye’s solid waste and wastewater in facilities owned or operated by third parties (such as municipal landfills and waste water treatment facilities) |
| 6. | | Business travel: emissions associated with transporting Sibanye’s employees for business-related activities |
| 7. | | Employee commuting: emissions associated with the transportation of Sibanye’s employees between their homes and work sites |
| 8. | | Downstream transportation and distribution: CO2e emissions associated with transportation of product from Sibanye to refinery |
| 9. | | Processing of sold products: CO2e emissions associated with smelting and refining gold |
| 10. | | End-of-life treatment of sold products: CO2e emissions associated with smelting gold to repurpose the product |
| 11. | | Downstream leased assets: CO2e emissions associated with the leasing of houses to mine workers where emissions are generated from electricity use |
| 12. | | Investments: CO2e emissions associated with investment in companies, Living Gold and Rand Refinery. Sibanye has a 50% share in Living Gold and a 33.1% share in Rand Refinery |
The following Scope 3 categories have not been included:
| · | | Franchises: Sibanye does not have any franchises |
| · | | Use of sold products: emissions associated with the use of sold gold products are deemed insignificant as only processing and end-of-life treatment of sold products are expected to have significant associated emissions |
| · | | Upstream leased assets: no significant upstream leased assets identified |
The collation and integration of the platinum operations scope 3 emissions began during the 2016 calendar year. Scope 3 data for 2016 have been collated and reported primarily on the following categories: purchased goods and services; capital goods; fuel- and energy-related emissions not included in Scope 1 or Scope 2; upstream transportation and distribution; waste generated in operations; and employee commuting
REDUCING ENERGY CONSUMPTION
Energy-efficiency initiatives were implemented across the Group in 2016 in line with Eskom’s demand-side management programme and Sibanye funded projects to the value of around R50 million to reduce electricity consumption by 2% to 3% annually. Employees are encouraged to conserve energy and energy service companies were employed to assist with energy-saving measures, contributing to energy savings of 15.5MW in 2016 (2015: 15.8MW). The cost benefit totals approximately R76 million.
In agreement with Eskom, Sibanye continues load shifting to protect the national grid at peak times and to manage peak power costs.
Our energy and carbon footprints are measured, monitored and managed in terms of our integrated energy and carbon management strategy. It has been found that electricity consumption contributes approximately 87% to Sibanye’s total Scope 1 and Scope 2 emissions (carbon footprint). The balance comprises fugitive methane emissions at Beatrix, as well as diesel, petrol, liquid petroleum gas (LPG), oxyacetylene, blasting agents and coal.
Sibanye continues to design, develop and implement strategies that seek to reduce the energy consumption of operations and, thereby, reduce its carbon footprint while additional opportunities and energy-efficient technologies are pursued.
The Beatrix carbon-reduction project, which includes the use of methane gas to generate electricity, registered under the Clean Development Mechanism of the Kyoto Protocol to the United Nations Framework Convention on Climate Change in 2013, accrued 28,281 certified emission reductions in 2016 (2015: 89,290). Certified emission reductions (also known as carbon credits) are issued by the
| |
Sibanye Integrated Annual Report 2016 | 68 |
Clean Development Mechanism to assist organisations in offsetting their emissions and complying with their targets. During 2016, the depletion of methane emissions from boreholes and vandalisation of flares contributed to a decrease in the number of certified emissions reductions.
Regarding the Platinum Division, we will assess existing projects and the way forward in 2017.
Gold Division – Energy intensity (GJ/tonne milled)
| | | | |
| 2016 | 2015 | 2014 | 2013 |
Beatrix | 0.69 | 0.73 | 0.69 | 0.70 |
Cooke | 0.43 | 0.76 | 0.77 | – |
Driefontein | 0.89 | 1.03 | 1.09 | 1.08 |
Kloof | 1.15 | 1.56 | 1.36 | 1.36 |
Group emissions – NOx and SOx (t)
| | | | |
| 2016 | 2015 | 2014 | 2013 |
Nitrogen oxides (NOx) | 887 | 618 | 19,901 | 14,618 |
Sulphur oxides (SOx) | 667 | 499 | 632 | 464 |
Solar Energy
A prefeasibility study completed in 2014 confirmed that solar photovoltaic power would be an economically competitive solution and could partially ameliorate the effects of interruptions in Eskom supply. A 150MW photovoltaic plant is planned for development on a site strategically placed between the Driefontein and Kloof mining complexes on the West Rand.
Photovoltaic generation from a site adjacent to Sibanye’s mining operations represents a partial solution to securing alternative electricity supply and allows the power generated to be directly injected into the mine’s electrical reticulation. The first phase of 50MW is planned to be operational in the second half of 2018. This technology can be implemented over a relatively short time while baseload solutions will be required to complement photovoltaic power for a more comprehensive approach. Once complete, it will be the single largest private offtake plant on the African continent.
Significant progress was made in 2016 with the project team completing many of the key milestones required to ensure commercial operation in 2018. All environmental authorisation applications, including an environmental impact assessment and a water-use general authorisation, were submitted to the relevant regulatory bodies for consideration – provisional approval was obtained from the Department of Environmental Affairs in January 2017 with approval from the Department of Water and Sanitation expected in the first quarter of 2017.
An engineering concept and basic design were completed, providing critical information required for the environmental permitting and financial modelling of the project. In support of the design, all the required geotechnical work was also conducted. Applications to Eskom, for technical approval, and the Department of Energy, for regulatory approval,
have been submitted with the outcomes expected by April 2017. An application to the National Energy Regulator of South Africa for a generation licence will be made once approval has been received from the Department of Energy.
To execute the project, Sibanye has elected to run a competitive tender process to appoint a project developer who will build, own and operate the project, and sell power back to Sibanye through a power purchase agreement (PPA). This approach has no upfront capital requirement for the business and allows capital to be prioritised for core mining projects. The tender has been successfully run, enabling a significant forecast return to Sibanye over the course of the agreement. The preferred project developer will be announced in the first half of 2017.
In 2017, the final milestones will be reached, allowing the project to move to construction phase in the second half of the year. The most significant of these milestones will include the conclusion of the PPA negotiations with the preferred bidder and Board approval of the agreement. The final regulatory approvals will be required prior to financial close, at which stage construction may begin. Although the project team carefully manages these, external approvals remain the biggest threat to the implementation and timelines of the project.
The project team is confident that the project will be a success and provide a suitable solution to alternative energy supply while deriving commercial benefit. Initial estimates are that it will reduce our carbon consumption by around 128,000tCO2e per 50MW phase.
Dust
Three dust-related complaints were received during 2016 – two at the Cooke Operation and one at our Driefontein Operation. No air quality complaints made by the community to the Platinum Division in 2016, although there were several incidents of dust exceedances. Furthermore, the Platinum Division is not required to have an air emissions licence.
GOLD DIVISION
Dust control techniques deployed at various sources have been informed by site-specific conditions. For example, at certain dormant tailings dams, ridge ploughing and wind break netting have been installed and maintained and at certain operational areas dust suppression water sprays have been installed.
PLATINUM DIVISION
Surface dust levels at our operations were above legislated limits at the main mine road, K150 tailings dam, Klipfontein and the haul road in 2016. Exceedances were mainly due to extremely dry weather.
Although a sprinkler system has been installed at the K150 tailings dam, it is not entirely effective given the dry weather. Dust on the haul roads is suppressed by water tankers twice daily. At the Klipfontein tailings dam, trucks travelling near the dust bucket are causing dust
| |
Sibanye Integrated Annual Report 2016 | 69 |
exceedances. The main mine road dust bucket is situated next to tanker services where dust suppression as well as monitoring has been recommended to determine the effectiveness of this action plan.
Air quality complaints
| | | | |
Gold Division | 2016 | 2015 | 2014 | 2013 |
Beatrix | 0 | 1 | 1 | 0 |
Cooke | 2 | 1 | 1 | 0 |
Driefontein | 1 | 2 | 1 | 1 |
Kloof | 0 | 3 | 0 | 0 |
Total | 3 | 7 | 3 | 1 |
MATERIALS CONSUMED
Materials consumed (tonnes)
| 2016 | 2015 | 2014 |
Gold Division | | | |
Timber | 110,524 | 163,722 | 104,468 |
Cyanide | 11,967 | 11,924 | 11,758 |
Explosives | 6,768 | 7,854 | 4,175 |
Hydrochloric acid | 4,414 | 3,773 | 3,579 |
Caustic soda | 2,674 | 3,421 | 2,947 |
Lime | 76,556 | 68,128 | 39,843 |
Cement1 | 42,865 | 41,101 | 38,579 |
Diesel (kl) | 7,097 | 6,410 | 6,274 |
Platinum Division* | | | |
Timber | 82 | | |
Explosives | 7,046 | | |
Alkali agents | 65 | | |
Cement1 | 1,513 | | |
Diesel (kl) | 3,325 | | |
Lubricating and hydraulic oil (kl) | 7,777 | | |
Grease (kl) | 19 | | |
* The Platinum Division includes those operations under management. Kroondal (50%) is included for the nine months from April to December 2016 and the Rustenburg Operation for two months, November and December 2016
1 Includes all categories of cement and cement mixtures
CYANIDE
The use of cyanide, the primary reagent for leaching gold from ore, has associated environmental and health risks. Sibanye has adopted the International Cyanide Management Code for the manufacture, transportation and use of cyanide in the production of gold. Sibanye purchased 11,967t of cyanide in 2016 (2015: 11,924t).
LAND MANAGEMENT AND REHABILITATION
Total land under Sibanye’s management in the Gold Division in 2016 was 50,316ha. The cumulative total of land disturbed by mining and related activities in 2016 was 17,359ha, equivalent to 34% of all the land managed by the Gold Division. Much of the land under management is agricultural where no mining takes place.
Kloof’s biodiversity management plan was finalised and the assessment for Beatrix was completed with the management plan due to follow in 2017. In addition to the Kloof plan, a karst/cave study was conducted on the Kloof property to identify and map possible new karst/cave systems. The study resulted in the discovery of three entirely new cave systems, the re-investigation of the known cave systems and inspection of 78% of all current sinkholes. The Kloof caves provide roosting and overwintering habitat for a number of bat species as well as an important nesting habitat for the barn and spotted eagle owls. Conservation important species identified include the Geoffroy’s horseshoe and Natal long-fingered bats.
Phase 2 of a potential soil contamination study for Kloof and Driefontein began during 2016. Soil samples were taken at areas identified during the first phase. The study is in its final stage and results of the analysis are currently being reviewed and incorporated into a management plan. Finalisation of the study is due by the end of March 2017, following which the management plans will be implemented.
In the interests of sustainable development, land management and legal requirements, alien vegetation is removed through local economic development projects at the Kloof, Driefontein and Cooke operations. Alien invasive permits for Kloof and Driefontein were renewed in 2016 and a detailed management plan was compiled for the eradication of alien invasive plants.
Focus will be on high priority areas, primarily the containment and eradication of Category 1 species, in terms of the Conservation of Agricultural Resources Act, 1983 (Act No 43 of 1983), and Category 1b species, in terms of the National Environmental Management: Biodiversity Act, 2004 (Act No 10 of 2004).
No protected areas were identified at any of the West Wits and Free State operations.
A detailed heritage resource assessment was conducted for Kloof and Driefontein, and a management plan compiled.
The Gold Division’s total closure liability is assessed annually by a recognised independent consultant, and is funded by trust funds and insurance guarantees. Closure liability as at 31 December 2016 was R4,120 million (2015: R3,817 million).
| |
Sibanye Integrated Annual Report 2016 | 70 |
Total land under Sibanye’s management within the Platinum Division, and disturbed by mining and related activities at the respective mines, is 25,954ha.
All sites within the Platinum Division have completed biodiversity action plans as well as alien invader eradication programmes.
Total closure liability for our platinum assets is funded by trust funds and insurance guarantees closure liability as at 31 December 2016 for the platinum operations totalled R2,026 million and covers Kroondal, Marikana, Blue Ridge and the Rustenburg Operations.
ENVIRONMENTAL PERMITTING AND COMPLIANCE
In line with the environmental management system, each gold operation has an approved environmental management programme, which is a formal contract between Sibanye, as the holder of the mining right, and the regulator, the DMR, regarding impacts that may arise from mining operations, assessment of these impacts from a risk perspective, proposed measures to mitigate the impacts, and commitments or undertakings by the licence holder to implement mitigation measures.
The environmental management programmes are reviewed during monthly site inspections, quarterly internal and external audits by independent auditors, and in annual closure-liability assessments and site inspections by the DMR. Any shortcomings are addressed through appropriate action plans.
In addition to regulatory reporting processes and sustainable development assurance processes, Sibanye’s Internal Audit department monitors legal compliance, as well as performance against environmental management programme commitments.
During 2016, internal environmental management programme performance assessments were conducted at Kloof, Driefontein, Cooke and Beatrix. Overall, environmental management programme compliance was found to be, on average, 90%. Action plans have been put in place to address the gaps. A particular focus will be on finalising management plans for soil, land use and heritage with an emphasis on dust management, regular dam wall and pipeline inspections and completion of annual independent audits of historical environmental authorisations for fridge plants and diesel generators.
During 2016, the DMR conducted annual independent compliance audits at Kloof, Driefontein, Cooke and Beatrix. The department delivered a notice of intent to issue a compliance notice to our Kloof and Driefontein operations with regard to the addition of VAT to current closure provisions. A response has been drafted and submitted to the department, to which a final response is awaited.
During 2016, environmental impact assessments and associated permitting processes for the proposed WRTRP, and the proposed photovoltaic project, were completed and submitted to the relevant competent authorities/regulators for approval. In early January 2017, an environmental authorisation was received for the photovoltaic project and its associated transmission infrastructure.
During 2016 in the Platinum Division, external environmental management programme performance assessments were conducted at Kroondal, Marikana and related PSA areas.
The related reports were received in November 2016 noting compliance of at least 90%. Additional focus will be placed on those aspects highlighted in the reports that require attention in terms of compliance.
At Rustenburg, no external environmental management programme performance assessment had been conducted prior to 1 November 2016. Owing to time constraints, a formal request for an extension for the submission of the related report was made to the DMR on 9 December 2016.
FUTURE FOCUS
Sibanye has made significant strides in ensuring that environmental issues are fully integrated into its core business, and to remain legally compliant. Opportunities for optimisation will be identified and harnessed to reduce costs through innovation to offset our long-term closure liability. In 2017 and beyond, Sibanye will focus on:
| · | | improved waste management practices |
| · | | revival of environmental management systems |
| · | | readiness to deal with ongoing and emerging legal compliance issues, including conditions of approval for licences and permits |
| · | | playing a greater role in industry environmental forums to ensure that pertinent issues are addressed |
| · | | alignment of incident classification and reporting across the business to reduce environmental incidents |
Sibanye plans to focus on four key areas in order to meet it water management objectives:
| · | | Water management systems: expansion of the water management system will include real-time water quality data and flow metering for process control, further development and Group roll out of the Mine Environmental Management Decision Support System (MEMDSS) |
| · | | Water security and independence: amending water use licences in order to obtain regulatory approval to replace municipal potable water with our own production facilities |
| · | | Mine closure management: develop mine-based and regional closure plans, considering innovative approaches with regard to socio-economic closure, and determine the water management cost of mine closure |
| · | | Optimal water use licence compliance: review all water use licences in order to establish change required and/or treatment facilities to be considered in order to target 100% compliance |
| |
Sibanye Integrated Annual Report 2016 | 71 |
remuneration report
It is the Remuneration Committee’s role and responsibility to ensure that the remuneration arrangements for executive directors and senior executives offer an incentive to enhance the Group’s performance and deliver responsibly on the Group’s strategy. The Remuneration Committee also needs to ensure that the actual rewards received by the executive directors and executive management are proportionate to levels of performance achieved and the returns received by shareholders. The Remuneration Committee gives full consideration to the Group’s priorities, its performance and shareholder interests.
Sibanye believes it is important that the structure and level of remuneration and reward are reasonably consistent across the Group and appropriately competitive within the operating market. Our remuneration structures are benchmarked against our peers and we operate comprehensive performance-based reward systems to retain and also attract the best people.
All information disclosed in this Remuneration Report for the year ended 31 December 2016 was in compliance with remuneration policies set by the Remuneration Committee.
REMUNERATION POLICY AND PHILOSOPHY
The key principles of Sibanye’s remuneration policy and practices are to:
| · | | support the execution of the Group’s business strategy by providing for the rewards to attract, motivate and retain those with the talent and skills necessary for Sibanye to deliver on its strategic vision, particularly at executive and senior management levels |
| · | | motivate and reinforce individual, team and operational performances and |
| · | | ensure Sibanye’s remuneration arrangements are reasonably equitable, both internally and externally, and to facilitate the deployment of people, as necessary, across the Group’s operations |
At Sibanye, one of the critical drivers of performance is the Total Reward strategy. The Total Reward strategy is an integral part of the people strategy and promotes a holistic approach which combines all elements of cash remuneration (guaranteed and performance based) with other elements of reward (shares as well as non-financial motivators) to attract, retain and motivate employees. The principle of performance-based rewards is one of the cornerstones of the reward strategy. The reward and remuneration strategy and policies are also underpinned by sound remuneration management and governance principles which are promoted across Sibanye in order to ensure the consistent application of the strategy and its policies. We will endeavour to seamlessly entrench these policies at the newly-acquired platinum assets.
It is the primary role of the Remuneration Committee to oversee and ensure that these principles are applied and implemented so as to ensure that Sibanye is able to deliver on its strategic objectives.
The Remuneration Committee ensures that Sibanye’s remuneration policies and practices are market competitive to enable the attraction, retention and motivation of best-in-class talent and skills, especially at executive and senior management levels, to enable the company to deliver on its core purpose, vision and strategy.
The committee regularly reviews the skills profile of Sibanye’s executive leadership team in terms of the company’s requirements, and amends remuneration policies and practices accordingly. The policies set by the committee determine transformation and talent retention throughout the group.
The committee also reviews the performance of executive directors and the executive management team, and ensures that their remuneration remains competitive and is linked to the group’s performance, in terms of agreed indicators and targets.
At executive management level, the payment of incentives, both short- and long-term, is based on the achievement of performance targets, which include operational (for employees at an operational level) and strategic performance targets that are aligned with our strategic objectives.
REMUNERATION MIX
Sibanye’s remuneration model and practices are aimed at attracting and retaining motivated, high-calibre employees and aligning their interests with those of shareholders. Such alignment is achieved through an appropriate mix of guaranteed and performance-based remuneration (variable pay), which provides for differentiation between high, average and low performers. The mix of guaranteed pay and variable pay differs according to the level of the employee within the Group. Typically, the remuneration of more senior employees consists of a higher portion of variable pay, which is performance-based, as a percentage of their total remuneration than that of junior employees.
The Group’s reward/pay/remuneration structure includes the following elements:
| · | | guaranteed remuneration (cash) |
| · | | cash bonus and bonus shares (short-term incentives) and |
| · | | performance shares (long-term incentives) |
At executive management level, the following remuneration on-target performance mix for the period under review was approved by the Remuneration Committee.
| |
Sibanye Integrated Annual Report 2016 | 72 |
| | | | | |
Role | Total % | Guaranteed pay % | Cash bonus % | Bonus shares % | Performance shares % |
Chief Executive Officer | 100.0 | 24.8 | 16.1 | 10.7 | 48.4 |
Chief Financial Officer | 100.0 | 26.3 | 15.8 | 10.5 | 47.4 |
Executive Vice President (EVP) (or prescribed officer) | 100.0 | 28.0 | 15.4 | 10.3 | 46.3 |
Senior Vice President (SVP) | 100.0 | 30.0 | 15.0 | 10.0 | 45.0 |
Vice President (VP) | 100.0 | 34.9 | 14.0 | 9.3 | 41.8 |
E-band* | 100.0 | 60.7 | 39.3 | 0.0 | 0.0 |
D-band* | 100.0 | 69.0 | 31.0 | 0.0 | 0.0 |
* As per the Paterson grading system
GUARANTEED REMUNERATION
Sibanye endeavours to be fair and consistent in the reward of employees, in line with their roles and individual contributions to the Group. To achieve reasonable external parity and a competitive total remuneration position, Sibanye surveys the relevant data on comparable pay practices regularly. The Remuneration Committee also pays attention to the matter of internal parity of pay differentials across executives and role types within the Company.
The benchmark for guaranteed remuneration is the market median level by category for similar gold mining companies and other comparable mining companies, together with consideration of internal parity comparisons.
Guaranteed remuneration levels are reviewed annually by the Remuneration Committee, taking into account the Group’s performance, changes in responsibility, increases in remuneration based on market trends and inflation. The committee also considers the impact of any guaranteed remuneration increase on the total remuneration package. For prescribed officers, the annual bonus is 55% of guaranteed pay for on-target performance.
ANNUAL BONUS
Executive directors are able to earn bonuses of 60% (for the CFO) and 65% (for the CEO) of their guaranteed pay for on-target performance, which is determined by a combination of Group and individual performance outcomes. These annual bonuses could increase to more than 60% and 65% respectively if stretch targets are achieved whereby the maximum variable pay potential is capped at two times the on-target bonus percentage.
The targets for annual bonuses are set by the Remuneration Committee. In the case of the CEO and CFO, 90% of the annual bonus is based on Group objectives (i.e. corporate performance, including the outcome of the Gold Division at 87% weighting and the Platinum Division at 13%) and the remaining 10% on individual objectives.
For 2016, annual bonuses were based on targets approved in advance by the Remuneration Committee, comprising a combination of group and operational objectives, based on Sibanye’s business plans and operational targets. The group performance measures for the senior executives were set by the Remuneration Committee and the weightings were as follows:
The CEO and CFO performance assessments also take into account individual objectives. These are set annually for each executive director based on key performance areas and are approved at the beginning of each year by the Remuneration Committee. Typically, individual objectives are centred on two themes: strategic initiatives and stakeholder management.
For the year ended 31 December 2016, Group performance measures for executive directors and senior executives were:
| | | | | |
Corporate performance: Gold Division | Weight % | Actual | Target | Achieved %3 |
Safety | Reduce FIFR1 | 10 | 0.108 | 0.0591 | 0 |
| Reduce LTIFR | 5 | 6.99 | 5.28 | 0 |
| Reduce SIFR | 5 | 4.42 | 3.49 | 0 |
Volume | Primary on-reef development (m) | 10 | 14,252 | 16,155 | 21 |
| Primary off-reef development (m) | 10 | 43,765 | 45,816 | 70 |
Cost | Cost of ore milled – underground (R/tonne) | 20 | 1,929 | 1,844 | 69 |
Quality | Grade and quality – gold produced (kg)2 | 30 | 47,405 | 49,208 | 76 |
Total | 90 | | | 46 |
1 Despite Sibanye's commitment to Zero Harm, the bonus parameter for all safety targets is set at 10% below the lower rate achieved in the previous two years
2 The actual performance for 2016 includes an adjustment for 370kg additional gold which is the estimated lost production during the illegal AMCU strike in the second quarter considered to be outside direct management control. Production costs at Ezulwini have also been excluded from the target, from September 2016, due to a decision to terminate production at the unit
3 The achieved percentage is based on the actual result compared with the set target. If the target is achieved a bonus of 100% is earned. At 15% below target no bonus is earned up to a maximum bonus of 200% at 5% above target. At actual performance between these levels, the bonus is proportional
| |
Sibanye Integrated Annual Report 2016 | 73 |
| | | | | |
| | | | | |
Corporate performance: Platinum Division | Weight % | Actual | Target | Achieved %3 |
Safety | Reduce FIFR | 10 | 0.116 | 0 | 0 |
| Reduce LTIFR | 5 | 4.53 | 2.27 | 0 |
| Reduce SIFR | 5 | 2.79 | 1.98 | 0 |
Volume | Primary development (m) | 20 | 11,220 | 13,872 | 0 |
Cost | Cost (R/4Eoz) | 20 | 10,427 | 10,555 | 124 |
Quality | Grade and quality – 4E PGM produced (kg) | 30 | 11,511 | 10,255 | 200 |
Total | 90 | | | 85 |
In turn, the CEO develops specific individual objectives, aligned with the organisation’s strategic objectives, with those who report directly to him (executive management) at the beginning of each year. These objectives are then reviewed by the Remuneration Committee and, together with operational performance outcomes, form the basis upon which their performances are reviewed at the end of the year.
Based on the bonuses determined for each member of the executive management team for the year ended 31 December 2016, the annual bonus as a percentage of guaranteed pay paid to executive directors and prescribed officers in February 2017 was as follows:
Name | Annual incentive as percentage of guaranteed pay |
Executive directors | |
Neal Froneman | 42.7 |
Charl Keyter | 38.9 |
Prescribed officers | |
Hartley Dikgale | 34.0 |
Dawie Mostert | 34.5 |
Jean Nel1 | 41.6 |
Themba Nkosi2,4 | 69.84 |
Wayne Robinson | 31.8 |
Richard Stewart | 35.9 |
Robert van Niekerk | 40.0 |
John Wallington3 | 34.5 |
1 Appointed as a prescribed officer on 13 April 2016 and resigned as a prescribed officer on 1 November 2016
2 Appointed as a prescribed officer on 4 July 2016
3 Appointed as a prescribed officer on 1 February 2016
4 As an attraction mechanism, it was agreed to award Themba an annual incentive for 2016 based on service for the full year
SCHEDULES OF FEES AND REMUNERATION
The tables below set out the various fees and remuneration of executive and non-executive directors, and prescribed officers.
DIRECTORS’ FEES
In terms of Sibanye's Memorandum of Incorporation, the fees for services as non-executive directors are determined by the Company’s shareholders at a general meeting. The current applicable schedule of fees, effective from 1 June 2016 is set out below.
| |
| Per annum |
Chairman of the Board | R1,653,750 |
Chairman of the Audit Committee | R316,418 |
Chairmen of the Nominating and Governance Committee, Risk Committee, Remuneration Committee, Social and Ethics Committee and Safety, Health and Sustainable Development Committee (excluding the Chairman of the Board) | R195,143 |
Members of the Board (excluding the Chairman of the Board) | R874,283 |
Members of the Audit Committee (excluding the Chairman of the Board) | R164,273 |
Members of the Nominating and Governance Committee, Risk Committee, Remuneration Committee, Social and Ethics Committee and Safety, Health and Sustainable Development Committee (excluding the Chairman of the Board) | R123,480 |
EXECUTIVE DIRECTORS AND PRESCRIBED OFFICERS’ REMUNERATION, AND NON-EXECUTIVE DIRECTORS’ FEES
For the executive directors and prescribed officers’ remuneration, and non-executive directors’ fees, see “Annual Financial Report—Annual financial statements—Notes to the consolidated financial statements–Note 32: Related-party transactions”.
SIBANYE GOLD LIMITED 2013 SHARe PLAN
For details of the Sibanye Gold Limited 2013 Share Plan, see “Annual Financial Report—Annual financial statements—Notes to the consolidated financial statements–Note 6: Share-based payments”.
| |
Sibanye Integrated Annual Report 2016 | 74 |
EXECUTIVE DIRECTORS’ CONTRACTS OF EMPLOYMENT
The employment of an executive director will continue until terminated upon (i) 24 or 12 months’ notice by either party for the CEO and CFO, respectively, or (ii) retirement of the relevant executive director (currently provided for at age 65 in the contract). Sibanye can also terminate the executive director’s employment summarily for any reason recognised by law as justifying summary termination.
Except for the two current executive directors, none of the prescribed officers have entered into employment contracts that provide for any compensation for severance because of change of control.
The service agreements of the two current executive directors contain ‘change of control’ conditions, which are set out for information below. These contracts and conditions will be honoured until they terminate. However, any future appointments of executive directors will be made without provision for any compensation for severance because of change of control.
The employment contracts for the two current executive directors provide that, in the event of the relevant executive director’s employment being terminated solely as a result of a “change of control” as defined below, within 12 months of the change of control, the executive director is entitled to:
| · | | payment of an amount equal to twice his gross remuneration package, or two and a half times in the case of the CEO; |
| · | | payment of an amount equal to the average of the incentive bonuses paid to the executive director during the previous two completed financial years; |
| · | | any other payments and/or benefits due under the contracts; |
| · | | payment of any annual incentive bonus he has earned during the financial year notwithstanding that the financial year is incomplete; |
| · | | an entitlement to awards, in terms of the Sibanye Gold Limited Incentive Scheme, shall accelerate on the date of termination of employment and settle with the full number of shares previously awarded. The employment contracts further provide that these payments cover any compensation or damages the executive director may have under any applicable employment legislation. |
A “change of control” for the above is defined as the acquisition by a third party or concerned parties of 30% or more of Sibanye ordinary shares. In the event of the consummation of an acquisition, merger, consolidation, scheme of arrangement or other reorganisation, whether or not there is a change of control, if the executive director’s services are terminated, the “change of control” provisions summarised above also apply.
| |
Sibanye Integrated Annual Report 2016 | 75 |
| |
Sibanye Annual Financial Report 2016 | 76 |
| | | | | | |
| | 2016 | 2015 | 2014 | 2013 | 2012 |
GROUP OPERATING STATISTICS | | | | | | |
GOLD DIVISION | | | | | | |
Gold produced | kg | 47,034 | 47,775 | 49,432 | 44,474 | 38,059 |
| ’000oz | 1,512 | 1,536 | 1,589 | 1,430 | 1,224 |
Gold sold | kg | 46,905 | 47,775 | 49,432 | 44,474 | 38,059 |
| ’000oz | 1,508 | 1,536 | 1,589 | 1,430 | 1,224 |
Ore milled | ’000t | 20,181 | 19,861 | 18,235 | 13,624 | 12,185 |
Gold price | R/kg | 586,319 | 475,508 | 440,615 | 434,663 | 434,943 |
| US$/oz | 1,242 | 1,160 | 1,267 | 1,408 | 1,652 |
Operating cost | R/t | 862 | 825 | 785 | 879 | 888 |
Operating margin | % | 37 | 28 | 34 | 38 | 35 |
Total cash cost1 | R/kg | 377,034 | 347,613 | 295,246 | 273,281 | 285,851 |
| US$/oz | 799 | 848 | 849 | 885 | 1,086 |
Total capital expenditure | Rm | 3,824 | 3,345 | 3,251 | 2,902 | 3,107 |
All-in sustaining cost2 | R/kg | 450,152 | 422,472 | 372,492 | 354,376 | 382,687 |
| US$/oz | 954 | 1,031 | 1,071 | 1,148 | 1,453 |
All-in cost2 | R/kg | 472,585 | 430,746 | 375,854 | 354,376 | 382,687 |
| US$/oz | 1,002 | 1,051 | 1,080 | 1,148 | 1,453 |
All-in cost margin3 | % | 19 | 9 | 15 | 18 | 12 |
PLATINUM DIVISION | | | | | | |
Platinum produced | kg | 7,423 | - | - | - | - |
| ‘000oz | 239 | - | - | - | - |
PGM 4E production | kg | 13,087 | - | - | - | - |
| ‘000oz | 421 | - | - | - | - |
Ore milled | ’000t | 11,612 | - | - | - | - |
Average basket price | R/4Eoz | 12,209 | - | - | - | - |
| US$/4Eoz | 832 | - | - | - | - |
Operating cost | R/ton | 373 | - | - | - | - |
Operating margin | % | 10 | - | - | - | - |
Operating cost | R/4Eoz | 10,296 | - | - | - | - |
| US$/4Eoz | 701 | - | - | - | - |
Total capital expenditure | Rm | 327 | - | - | - | - |
GROUP FINANCIAL STATISTICS4 | | | | | | |
INCOME STATEMENT | | | | | | |
Revenue | Rm | 31,241 | 22,717 | 21,781 | 19,331 | 16,554 |
Amortisation and depreciation | Rm | 4,042 | 3,637 | 3,255 | 3,104 | 2,363 |
Net operating profit | Rm | 6,490 | 2,700 | 4,215 | 4,254 | 3,367 |
Profit for the year | Rm | 3,271 | 538 | 1,507 | 1,698 | 2,980 |
Profit for the year attributable to owners of Sibanye | Rm | 3,702 | 717 | 1,552 | 1,692 | 2,980 |
Basic earnings per share | cents | 402 | 79 | 186 | 260 | 297,960,000 |
Diluted earnings per share | cents | 401 | 78 | 182 | 255 | 297,960,000 |
Headline earnings per share | cents | 270 | 74 | 170 | 355 | 297,790,000 |
Dividend per share | cents | 175 | 72 | 125 | 37 | 73,130,000 |
Weighted average number of shares | ’000 | 921,733 | 912,038 | 835,936 | 650,621 | 1 |
Diluted weighted average number of shares | ’000 | 923,894 | 917,709 | 854,727 | 664,288 | 1 |
Number of shares in issue at end of period | ’000 | 929,004 | 916,140 | 898,840 | 735,079 | 1 |
STATEMENT OF FINANCIAL POSITION | | | | | | |
Property, plant and equipment | Rm | 27,240 | 22,132 | 22,704 | 15,151 | 16,376 |
Cash and cash equivalents | Rm | 968 | 717 | 563 | 1,492 | 292 |
Total assets | Rm | 41,721 | 28,266 | 27,922 | 19,995 | 19,698 |
Net assets/(liabilities) | Rm | 16,697 | 14,985 | 14,986 | 9,423 | (9,673) |
Stated share capital | Rm | 21,735 | 21,735 | 21,735 | 17,246 | – |
Borrowings5 | Rm | 8,974 | 3,804 | 3,170 | 1,991 | 4,220 |
Total liabilities | Rm | 25,024 | 13,281 | 12,936 | 10,572 | 29,371 |
| |
Sibanye Annual Financial Report 2016 | 77 |
| | | | | | |
| | 2016 | 2015 | 2014 | 2013 | 2012 |
STATEMENT OF CASH FLOWS | | | | | | |
Cash from operating activities | Rm | 4,406 | 3,515 | 4,053 | 6,360 | 2,621 |
Cash used in investing activities | Rm | (9,444) | (3,340) | (4,309) | (3,072) | (3,126) |
Cash from/(used in) financing activities | Rm | 5,446 | (21) | (673) | (2,088) | 434 |
Net increase/(decrease) in cash and cash equivalents | Rm | 408 | 155 | (930) | 1,201 | (71) |
OTHER FINANCIAL DATA | | | | | | |
EBITDA6 | Rm | 10,532 | 6,337 | 7,469 | 7,358 | 5,730 |
Net debt7 | Rm | 6,293 | 1,362 | 1,506 | 499 | 3,928 |
Net debt to EBITDA8 | ratio | 0.60 | 0.21 | 0.20 | 0.07 | 0.69 |
Net asset value per share | R | 17.97 | 16.36 | 16.67 | 12.80 | (9,672,700.00) |
Average exchange rate9 | R/US$ | 14.68 | 12.75 | 10.82 | 9.60 | 8.19 |
Closing exchange rate10 | R/US$ | 13.69 | 15.54 | 11.56 | 10.34 | 8.57 |
SHARE DATA | | | | | | |
Ordinary share price – high | R | 70.23 | 32.26 | 29.52 | 16.30 | n/a11 |
Ordinary share price – low | R | 21.98 | 13.66 | 12.34 | 6.73 | n/a11 |
Ordinary share price at year end | R | 25.39 | 22.85 | 22.55 | 12.30 | n/a11 |
Average daily volume of shares traded | ’000 | 6,165 | 3,024 | 2,869 | 4,755 | n/a11 |
Market capitalisation at year end | Rbn | 23.6 | 20.9 | 20.3 | 9.04 | n/a11 |
1 Sibanye presents the financial measures “total cash cost”, “total cash cost per kilogram” and “total cash cost per ounce” which have been determined using industry standards promulgated by the Gold Institute and are not IFRS measures. The Gold Institute was a non-profit international industry association of miners, refiners, bullion suppliers and manufacturers of gold products that ceased operation in 2002, which developed a uniform format for reporting production costs on a per ounce basis. The Gold Institute has now been incorporated into the National Mining Association. The guidance was first adopted in 1996 and revised in November 1999. An investor should not consider these items in isolation or as alternatives to cost of sales, net operating profit, profit before tax, profit for the year, cash from operating activities or any other measure of financial performance presented in accordance with IFRS. While the Gold Institute provided definitions for the calculation of total cash costs, the calculation of total cash cost per kilogram and the calculation of total cash cost per ounce, these may vary significantly among gold mining companies, and by themselves do not necessarily provide a basis for comparison with other gold mining companies. Total cash costs is defined as cost of sales as recorded in profit or loss, less amortisation and depreciation and off-site (i.e. central) general and administrative expenses (including head office costs) plus royalties and production taxes. Total cash cost per kilogram is defined as the average cost of producing a kilogram of gold, calculated by dividing the total cash costs in a period by the total gold sold over the same period. Management considers total cash cost and total cash cost per kilogram to be a measure of the on-going costs of production. For a reconciliation of operating costs to total cash cost, see Overview–Management’s discussion and analysis of the financial statements–2016 financial performance compared with 2015 and 2014–Cost of sales–Operating costs – Cost of sales less amortisation and depreciation.
2 Sibanye presents the financial measures “All-in sustaining cost”, “All-in cost”, “All-in sustaining cost per kilogram”, “All-in sustaining cost per ounce”, “All-in cost per kilogram” and “All-in cost per ounce”, which were introduced during the year ended 31 December 2013 by the World Gold Council (the Council). Despite not being a current member of the Council, Sibanye adopted the principles prescribed by the Council. The Council is a non-profit association of the world’s leading gold mining companies established in 1987 to promote the use of gold from industry, consumers and investors and is not a regulatory organisation. The Council has worked with its member companies to develop a metric that expands on IFRS measures such as cost of goods sold and currently accepted non-IFRS measures to provide relevant information to investors, governments, local communities and other stakeholders in understanding the economics of gold mining operations related to expenditures, operating performance and the ability to generate cash flow from operations. This is especially true with reference to capital expenditure associated with developing and maintaining gold mines, which has increased significantly in recent years and is reflected in this metric.
All-in sustaining cost, All-in cost, All-in sustaining cost per kilogram, All-in sustaining cost per ounce, All-in cost per kilogram and All-in cost per ounce metrics are intended to provide additional information only, do not have any standardised meaning prescribed by IFRS and should not be considered in isolation or as alternatives to cost of sales, profit before tax, profit for the year, cash from operating activities or any other measure of financial performance presented in accordance with IFRS. All-in sustaining cost, All-in cost, All-in sustaining cost per kilogram, All-in sustaining cost per ounce, All-in cost per kilogram and All-in cost per ounce as presented in this document may not be comparable to other similarly titled measures of performance of other companies. Other companies may calculate these measures differently as a result of differences in the underlying accounting principles, policies applied and accounting frameworks such as in US GAAP. Differences may also arise related to definitional differences of sustaining versus development capital activities based upon each company’s internal policies.
Total All-in cost excludes income tax, costs associated with merger and acquisition activities, working capital, impairments, financing costs, one-time severance charges and items needed to normalise earnings.
All-in cost is made up of All-in sustaining cost, being the cost to sustain current operations, given as a sub-total in the All-in cost calculation, together with corporate and major capital expenditure growth.
For a reconciliation of operating costs to All-in cost, see Overview–Management’s discussion and analysis of the financial statements–2016 financial performance compared with 2015 and 2014–Cost of sales–All-in cost.
3 All-in cost margin is defined as revenue minus All-in cost divided by revenue.
4 The selected historical consolidated financial data set out above have been derived from Sibanye’s consolidated financial statements for those periods and as of those dates which have been prepared in accordance with IFRS.
5 Borrowings of R7,221 million that have recourse to Sibanye excludes the Burnstone Debt. Borrowings also exclude related-party loans.
6 Earnings before interest, taxes, depreciation and amortisation (EBITDA) is defined as net operating profit before depreciation and amortisation. EBITDA may not be comparable to similarly titled measures of other companies. Management believes that EBITDA is used by investors and analysts to evaluate companies in the mining industry. EBITDA is not a measure of performance under IFRS and should be considered in addition to, and not as a substitute for, other measures of financial performance and liquidity reported in accordance with IFRS.
7 Net debt represents borrowings and bank overdraft less cash and cash equivalents. Borrowings are only those borrowings that have recourse to Sibanye and therefore exclude the Burnstone Debt. Borrowings also exclude related-party loans. Net debt excludes Burnstone cash and cash equivalents.
8 Net debt to EBITDA ratio is defined as net debt as at the end of a reporting period divided by EBITDA of the last 12 months ending on the same reporting date.
| |
Sibanye Annual Financial Report 2016 | 78 |
9 The average exchange rate during the relevant period as reported by I-Net Bridge. The average exchange rate for the period through 28 March 2017 was R13.21/US$. The following table sets forth the high and low exchange rates for each month during the previous six months.
| | |
Month ended | High | Low |
30 September 2016 | 14.58 | 13.44 |
31 October 2016 | 14.35 | 13.46 |
30 November 2016 | 14.42 | 13.24 |
31 December 2016 | 14.13 | 13.45 |
31 January 2017 | 13.79 | 13.24 |
28 February 2017 | 13.45 | 12.87 |
Through 28 March 2017 | 13.31 | 12.42 |
10 The closing exchange rate at period end. The closing exchange on 28 March 2017, as reported by I-Net Bridge, was R12.98/US$. Fluctuations in the exchange rate between the rand and the US dollar will affect the US dollar equivalent of the price of the ordinary shares on the JSE, which may affect the market price of the ADRs on the NYSE. These fluctuations will also affect the US dollar amounts received by owners of ADRs on the conversion of any dividends paid in rand on the ordinary shares.
11 Sibanye was previously a wholly owned subsidiary of Gold Fields Limited (Gold Fields). The Company separated from Gold Fields in February 2013 to become an independent and publicly traded company.
| |
Sibanye Annual Financial Report 2016 | 79 |
The following discussion and analysis should be read together with Sibanye’s consolidated financial statements including the notes, which appear elsewhere in this annual financial report. Certain information contained in the discussion and analysis set forth below includes forward-looking statements that involve risks and uncertainties. See Forward-looking statements for a discussion of important factors that could cause actual results to differ materially from the results described in or implied by the forward-looking statements contained in this annual financial report.
INTRODUCTION
The Sibanye Group is an independent, South African domiciled precious metals mining group, which currently owns and operates gold and uranium operations and projects throughout the Witwatersrand Basin in South Africa, as well as PGM operations in the Bushveld Igneous Complex in South Africa and the Great Dyke in Zimbabwe. The Group currently owns and operates four underground and surface gold operations, namely Driefontein, Kloof and Cooke in the West Witwatersrand region and Beatrix in the southern Free State province. The Group also owns and operates underground and surface PGM operations, including the Rustenburg Operations in South Africa, a 50% interest in the Kroondal Operations in South Africa and a 50% interest in the Mimosa Operations, a PGM joint venture in Zimbabwe.
In addition to its mining activities, the Group owns and manages significant extraction and processing facilities at its gold and uranium operations, where gold-bearing ore is treated and processed to produce gold doré.
According to estimates based on the best information available to its management, Sibanye is the largest producer of gold in South Africa and one of the ten largest globally, and Sibanye’s PGM operations (which were acquired during 2016), taken together, were the fifth largest producer of PGM in the world, based on annual production in 2016.
In 2016, Sibanye produced 47,034kg (1.51Moz) (2015: 47,775kg (1.54Moz) and 2014: 49,432kg (1.59Moz)) of gold and delivered attributable production of 420,763oz (4E).
During the year, Sibanye recognised profit of R3,271 million (2015: R538 million and 2014: R1,507 million), of which R3,702 million (2015: R717 million and 2014: R1,552 million) is attributable to the owners of Sibanye.
At 31 December 2016, Sibanye had gold mineral reserves of 28.7Moz (2015: 31.0Moz and 2014: 28.4Moz), uranium mineral reserves of 113.2Mlb (2015: 113.8Mlb and 2014: 102.5Mlb) and maiden 4E PGM mineral reserves of 23.2Moz.
The following financial review provides stakeholders with greater insight into the financial performance and position of the Group during the periods indicated.
FACTORS AFFECTING SIBANYE’s PERFORMANCE
COMMODITY PRICES
Sibanye’s revenues are primarily derived from the sale of the gold and PGMs that it produces. Sibanye does not generally enter into forward sales, commodity derivatives or other hedging arrangements in order to establish a price in advance of the sale of its production. As a result it is normally fully exposed to changes in commodity prices. Gold and PGM hedging however could be considered under one or more of the following circumstances: to protect cash flows at times of significant capital expenditures; financing projects; or to safeguard the viability of higher cost operations, see note 29.2: Risk management activities to the consolidated financial statements.
The market price of gold has historically been volatile and is affected by numerous factors over which Sibanye has no control, such as general supply and demand, speculative trading activity and global economic drivers. Further, over the period from 2014 to 2016, the gold price has declined from an average price of US$1,265/oz to US$1,250/oz. Should the gold price decline below Sibanye’s unit production cost the Group may experience losses and, should this situation remain for an extended period, Sibanye may be forced to curtail or suspend some or all of its projects, operations and/or reduce operational capital expenditure. Sibanye might not be able to recover any losses incurred during, or after, such events. A sustained period of significant gold price volatility may also adversely affect Sibanye’s ability to evaluate the feasibility of undertaking new capital projects or continuing existing operations or to make other long-term strategic decisions.
The volatility of, and recent decline in, the price of gold is illustrated in the gold price table below (which shows the annual high, low and average of the London afternoon fixing price of gold).
| | | |
| US$/oz1 |
Gold | High | Low | Average |
2011 | 1,895 | 1,319 | 1,571 |
2012 | 1,792 | 1,540 | 1,669 |
2013 | 1,694 | 1,192 | 1,409 |
2014 | 1,385 | 1,142 | 1,265 |
2015 | 1,296 | 1,049 | 1,159 |
2016 | 1,366 | 1,077 | 1,250 |
2017 (through 28 March 2017) | 1,258 | 1,151 | 1,218 |
1 Rounded to the nearest US dollar.
On 28 March 2017, the London afternoon fixing price of gold was US$1,257/oz.
| |
Sibanye Annual Financial Report 2016 | 80 |
Table of Contents
MANAGEMENT'S DISCUSSION AND ANALYSIS OF THE FINANCIAL STATEMENTS continued
Historically, platinum, palladium and rhodium prices have been subject to wide fluctuations and are affected by numerous factors beyond Sibanye’s control, including international macroeconomic conditions and outlook, levels of supply and/or demand, any actual or potential threats to the stability of supply and/or demand, inventory levels maintained by users and producers, actions of participants in the commodities markets and currency exchange rates, particularly the rand to the US dollar. Further, between 2014 and 2016, the average platinum price has decreased from US$1,385/oz to US$990/oz.
In addition, the introduction of platinum, palladium and rhodium exchange-traded funds (ETFs) have added a further element of unpredictability and volatility to the pricing environment and may increase volatility in PGM prices, as investors may purchase shares in ETFs at times of rising prices, adding to the upward pressure on prices, and sell during periods of falling prices, potentially increasing the fall in prices. The market prices of platinum, palladium, rhodium and other PGMs have been, and may in the future be, subject to rapid short-term changes.
| | | |
| US$/oz1 |
Platinum | High | Low | Average |
2011 | 1,906 | 1,372 | 1,720 |
2012 | 1,726 | 1,385 | 1,552 |
2013 | 1,736 | 1,304 | 1,487 |
2014 | 1,514 | 1,181 | 1,385 |
2015 | 1,287 | 831 | 1,053 |
2016 | 1,178 | 821 | 990 |
2017 (through 28 March 2017) | 1,028 | 934 | 982 |
1 Rounded to the nearest US dollar.
On 28 March 2017, the London market price of platinum was US$952/oz.
EXCHANGE RATE
Sibanye’s operations (with the exception of Mimosa) are all located in South Africa and its revenues are equally sensitive to changes in the US dollar gold and PGM (4E) basket prices and the rand/US dollar exchange rate (the exchange rate). Depreciation of the rand against the US dollar results in Sibanye’s revenues and operating margins increasing. Conversely, should the rand appreciate against the US dollar, revenues and operating margins would decrease. The impact on profitability of any change in the exchange rate can be substantial. Furthermore, the exchange rates obtained when converting US dollars to rand are set by foreign exchange markets, over which Sibanye has no control. The relationship between currencies and commodities, which includes the gold and PGM (4E) basket prices, is complex and changes in exchange rates can influence commodity prices and vice versa.
As a general rule, Sibanye does not enter into long-term currency hedging arrangements and is exposed to the spot market exchange rate. Sibanye’s operating costs are primarily denominated in rand and forward cover could be considered for significant expenditures based in foreign currency or those items which have long lead times to production or delivery. No foreign exchange hedging contracts were entered into in 2016.
COSTS
Sibanye’s operating costs (being cost of sales less amortisation and depreciation) comprise mainly labour and contractor costs, power and water, and consumable stores which include, inter alia, explosives, timber, cyanide and other consumables. Sibanye expects that its operating costs, particularly the input costs noted above, are likely to continue to increase in the near future and will be driven by inflation, general economic trends, market dynamics and other regulatory changes. In order to restrict these cost inputs, there is a continuous restructuring programme throughout the Group to improve efficiencies and productivity. Cost saving initiatives, especially with reference to reducing the impact of electricity consumption, have been specifically successful.
The South African inflation rate or Consumer Price Index (CPI) was 6.6% in 2016 (2015: 4.5% and 2014: 6.1%). Mining inflation has historically been higher than CPI driven by above inflation wage increases and more recently increases in electricity tariffs, which increased 12.69% effective 1 April 2015.
Sibanye’s operations are labour intensive. Labour represented 45%, 45% and 47% of operating costs during 2016, 2015 and 2014, respectively.
An agreement signed by the gold operations with all unions in 2015 expires on 30 June 2018. At the assets acquired from Anglo American Platinum Limited (Anglo American Platinum) (the Rustenburg Operations), a three-year wage agreement was signed and became effective from 1 July 2016, prior to their acquisition. At Kroondal, the current wage agreement expires in July 2017 and negotiations for a new agreement is expected to begin in April 2017.
Despite above inflation increases in electricity tariffs, power and water comprised 18%, 19% and 19% of operating costs in 2016, 2015 and 2014, respectively. During 2013 Eskom applied to the National Energy Regulator of South Africa for an average annual tariff increase of 16% for a five-year period as of 1 April 2013, of which an increase of 8% was approved. However, in addition to the 8%, a further increase of 4.69% was approved effective from 1 April 2015 and further increases are expected in the future to meet the growing cost of the service provider, Eskom.
The effect of the abovementioned increases, especially being above the average inflation rate, has adversely affected and, may continue to adversely affect, the profitability of Sibanye’s operations. Further, Sibanye’s operating costs are primarily denominated in rand, while revenues from gold and PGM sales are in US dollars. Generally when inflation is high the rand tends to devalue, thereby
| |
Sibanye Annual Financial Report 2016 | 81 |
Table of Contents
MANAGEMENT'S DISCUSSION AND ANALYSIS OF THE FINANCIAL STATEMENTS continued
increasing rand revenues, and potentially offsetting any increase in costs. However, there can be no guarantee that any cost saving measures or the effects of any potential devaluation will offset the effects of increased inflation and production costs.
PRODUCTION
Sibanye’s revenues are driven by its production levels and the price it realises from the sale of gold, PGMs and associated co- and by-products, as discussed above. Production can be affected by a number of factors including industrial action, safety related work stoppages, mining grades and other mining related incidents. These factors could have an impact on production levels in the future.
In recent years, the South African mining industry has experienced increased union unrest. The entry of new unions such as AMCU, which has become a significant rival to the traditionally dominant NUM, has resulted in more frequent industrial disputes, including violent protests, intra-union violence and clashes with police authorities. Sibanye’s gold operations experienced very little disruption to production as a result of industrial action during 2014, 2015 and 2016. In the first half of 2014, however the South African platinum majors experienced a five month wage strike, which impacted among others the South African operations acquired by Sibanye as part of the Rustenburg Operations Acquisition.
Sibanye’s operations are also subject to South African health and safety laws and regulations that impose various duties on Sibanye’s mines while granting the authorities’ powers to, among other things, close or suspend operations and order corrective action relating to health and safety matters. During 2016, Sibanye’s gold operations experienced 171 work stoppages (2015: 109 and 2014: 77). The platinum operations experienced 35 work stoppages.
Sibanye’s gold operations are in their mature life stage and have encountered lower mining grades and yields. Sibanye’s platinum operations are at steady state production levels.
Sibanye’s key focus is to maintain profitable operations and sustain current production levels for a longer period than had previously been envisaged, through an increased focus on productivity. Furthermore, focus will be on realising the extensive reserves and resources potential that still exists.
ROYALTIES AND MINING TAX
South African mining operations pay a royalty tax. The formula for calculating royalties takes into account the profitability of individual operations. The royalty formula is detailed in note 8.1: Royalties to the consolidated financial statements.
Under South African tax legislation, gold mining companies and non-gold mining companies are taxed at different rates. Sibanye’s gold operations are subject to the gold tax formula on their respective mining incomes. The formula calculating tax payable, which is detailed in note 8.2: Mining and income tax to the consolidated financial statements, is affected by the profitability of the applicable mining operation. In addition, these operations are ring fenced, so each operation is taxed separately and, as a result, taxable losses and capital expenditure at one of the operations cannot be used to reduce taxable income from another operation. Depending on the profitability of the operations, the tax rate can vary significantly from year to year.
CAPITAL EXPENDITURE
Sibanye will continue to invest capital in new and existing infrastructure and possible growth opportunities. Therefore, management will be required to consider, on an ongoing basis, the capital expenditure necessary to achieve its sustainable production objectives against other demands on cash.
As part of its strategy, Sibanye may investigate the potential exploitation of mineralisation below its current infrastructure limits as well as other capital-intensive projects. Management expects that Sibanye’s dividend policy will not, however, be affected by its capital expenditure.
In 2016, Sibanye’s total capital expenditure was R4,151 million (2015: R3,345 million and 2014: R3,251 million). Sibanye expects to spend approximately R4.9 billion on capital in 2017, excluding any acquisitions.
The actual amount of capital expenditure will depend on a number of factors, such as production volumes, the commodity prices and general economic conditions and may differ from the amount forecast above. Some of these factors are outside of the control of Sibanye.
RECENT PLATINUM ACQUISITIONS
AQUARIUS ACQUISITION
On 6 October 2015 Sibanye announced a cash offer of US$0.195 per share for the entire issued share capital of Aquarius Platinum Limited (Aquarius) (the Aquarius Transaction), valuing Aquarius at US$294 million. The transaction was subject to the fulfilment of various conditions precedent which were completed on 12 April 2016, when Sibanye paid R4,301.5 million to the Aquarius shareholders and obtained control (100%) of Aquarius.
Results of Aquarius are presented for the nine months ended 31 December 2016 following the completion of the acquisition, see note 12.1: Aquarius acquisition to the consolidated financial statements.
| |
Sibanye Annual Financial Report 2016 | 82 |
Table of Contents
MANAGEMENT'S DISCUSSION AND ANALYSIS OF THE FINANCIAL STATEMENTS continued
THE RUSTENBURG OPERATIONS ACQUISITION
On 9 September 2015, Sibanye announced that it had entered into written agreements with Rustenburg Platinum Mines Limited (RPM), a wholly owned subsidiary of Anglo American Platinum to acquire the Bathopele, Siphumelele (including Khomanani), and Thembelani (including Khuseleka) mining operations, two concentrating plants, an on-site chrome recovery plant, the Western Limb Tailings Retreatment Plant, associated surface infrastructure and related assets and liabilities on a going concern basis, including normalised levels of working capital (the Rustenburg Operations) (the Rustenburg Operations Transaction).
The purchase consideration comprises an upfront payment of R1.5 billion at the closing of the Rustenburg Operations Transaction (Closing) and a deferred payment calculated as being equal to 35% of the distributable free cash flow generated by the Rustenburg Operations over a six year period from the later of Closing or 1 January 2017 (Deferred Payment), subject to a minimum payment of R3.0 billion. In addition to the Deferred Payment, which allows for a favourable extended payment period; should the Rustenburg Operations generate negative distributable free cash flows in either 2016, 2017 or 2018, RPM will be required to pay up to R267 million per annum to ensure that the free cash flow for the relevant year is equal to zero.
On 19 October 2016, Sibanye obtained consent in terms of section 11 of the Mineral and Petroleum Resources Development Act for the transfer of the mining right and prospecting right pursuant to the Rustenburg Operations Transaction, and control of the Rustenburg Operations on this date.
Results of the Rustenburg Operations are presented for the two months ended 31 December 2016 following the completion of the acquisition, see note 12.2: The Rustenburg Operations acquisition to the consolidated financial statements.
ACQUISITION COSTS
Sibanye incurred R157 million on acquisition related costs in 2016 (2015: R26 million and 2014: R112 million).
Sibanye has pursued and may continue to pursue growth opportunities that allow it to leverage its existing processing capacity and infrastructure and to extend its operating life. Such growth may continue to occur through the acquisition of other companies and assets, development projects, or by entering into joint ventures. Sibanye may incur acquisition and integration related costs with regard to any operations or entities that it acquires or seeks to acquire in the future.
2016 FINANCIAL PERFORMANCE COMPARED WITH 2015 and 2014
Group profit increased by 508% to R3,271 million in 2016 from R538 million in 2015 (2014: R1,507 million). The reasons for this increase are discussed below.
The primary factors explaining the movements in net profit are set out in the table below.
| | | | | |
Figures in million - SA rand | 2016 | 2015 | % change 2016/2015 | 2014 | % change 2015/2014 |
Revenue | 31,241 | 22,717 | 38 | 21,781 | 4 |
Cost of sales | (24,751) | (20,017) | (24) | (17,566) | (14) |
Net operating profit | 6,490 | 2,700 | 140 | 4,215 | (36) |
Finance expense | (903) | (562) | (61) | (400) | (41) |
Share-based payments | (496) | (274) | (81) | (418) | 34 |
Loss on financial instruments | (1,033) | (230) | (349) | (108) | (113) |
Gain/(loss) on foreign exchange differences | 220 | (359) | 161 | (63) | (470) |
Share of results of equity-accounted investees after tax | 13 | 116 | (89) | (471) | 125 |
Impairments | (1,381) | - | (100) | (275) | 100 |
Gain on acquisition | 2,428 | - | 100 | - | - |
Transaction costs | (157) | (26) | (504) | (112) | 77 |
Net loss on derecognition of financial guarantee asset and liability | - | (158) | 100 | - | (100) |
Reversal of impairment | - | - | - | 474 | (100) |
Net other movements | (120) | 109 | (210) | (76) | 243 |
Profit before royalties and tax | 5,061 | 1,316 | 285 | 2,766 | (52) |
Royalties | (547) | (401) | (36) | (431) | 7 |
Profit before tax | 4,514 | 915 | 393 | 2,335 | (61) |
Mining and income tax | (1,243) | (377) | (230) | (828) | 54 |
Profit for the year | 3,271 | 538 | 508 | 1,507 | (64) |
| |
Sibanye Annual Financial Report 2016 | 83 |
Table of Contents
MANAGEMENT'S DISCUSSION AND ANALYSIS OF THE FINANCIAL STATEMENTS continued
REVENUE
| |
Revenue increased by 38% to R31,241 million in 2016 from R22,717 million in 2015. This included first time revenue of R3,739 million from the platinum operations, Aquarius and the Rustenburg Operations, acquired during 2016. Revenue from the Gold Division increased by 21% to R27,501 million in 2016 from R22,717 million in 2015 driven by the average rand gold price, which increased by 23% partly offset by the level of gold sold, which decreased by 2%. The decrease in the gold sold to 46,905kg in 2016 from 47,775kg in 2015, was mainly due to the cumulative impact of operational disruptions relating to engineering issues, power outages and more significantly as a result of the closure of the Cooke 4 shaft in September 2016, due to continued poor production performance. Gold production from the operations is shown in the graph below. The increase in the average rand gold price was due to an increase in the average realised US dollar gold price to US$1,242/oz in 2016 from US$1,160/oz in 2015 and the 15% weaker rand of R14.68/US$ in 2016 compared with R12.75/US$ in 2015. | Gold sold (kg) 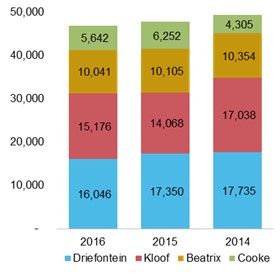
|
Revenue increased by 4% to R22,717 million in 2015 from R21,781 million in 2014 driven by the average rand gold price, which increased by 8% partly offset by the level of gold produced and sold, which decreased by 3%. The decrease in the gold produced to 47,775kg in 2015 from 49,432kg in 2014 was mainly due to the cumulative impact of operational disruptions and underground fires at Kloof during the quarter ended 31 March 2015, as well as the disruptive effect of periodic load curtailments by the state utility, Eskom during the quarters ended 31 March and 30 June 2015. Productivity and cost trends improved throughout the remainder of the year but it was not possible to recoup the production lost earlier in the year. The increase in the average rand gold price was due to the 18% weaker rand of R12.75/US$ in 2015 compared with R10.82/US$ in 2014. However, this was partly offset by the decrease in the average realised US dollar gold price to US$1,160/oz in 2015 from US$1,267/oz in 2014.
COST OF SALES
Cost of sales, which consist of operating costs and amortisation and depreciation, increased by 24% to R24,751 million in 2016 from R20,017 million in 2015, with the incorporation of Aquarius and the Rustenburg Operations for nine and two months respectively, which together accounted for R3,591 million of this increase. Cost of sales increased by 14% to R20,017 million in 2015 from R17,566 million in 2014, with the incorporation of Cooke for 12 months, which accounted for R3,683 million of this increase.
The primary drivers of cost of sales are set out in the table below.
| | | | | |
Figures in million - SA rand | 2016 | 2015 | % change 2016/2015 | 2014 | % change 2015/2014 |
Salaries and wages | 9,276 | 7,345 | (26) | 6,665 | (10) |
Consumable stores | 5,243 | 3,996 | (31) | 3,481 | (15) |
Utilities | 3,709 | 3,128 | (19) | 2,753 | (14) |
Mine contracts | 2,105 | 1,458 | (44) | 1,136 | (28) |
Other | 2,770 | 2,758 | - | 2,403 | (15) |
Ore reserve development (ORD) costs capitalised | (2,394) | (2,305) | (4) | (2,127) | (8) |
Operating costs | 20,709 | 16,380 | (26) | 14,311 | (14) |
- Gold Division, excluding Cooke | 14,361 | 13,402 | (7) | 12,618 | (6) |
- Cooke | 2,985 | 2,978 | - | 1,693 | (76) |
- Platinum Division | 3,363 | - | (100) | - | - |
Amortisation and depreciation | 4,042 | 3,637 | (11) | 3,255 | (12) |
- Gold Division, excluding Cooke | 3,043 | 2,932 | (4) | 2,947 | 1 |
- Cooke | 771 | 705 | (9) | 308 | (129) |
- Platinum Division | 228 | - | (100) | - | - |
| | | | | |
Total cost of sales | 24,751 | 20,017 | (24) | 17,566 | (14) |
| | | | | |
– Gold Division, excluding Cooke | 17,404 | 16,334 | (7) | 15,565 | (5) |
– Cooke | 3,756 | 3,683 | (2) | 2,001 | (84) |
– Platinum Division | 3,591 | - | (100) | - | - |
The analysis that follows provides a more detailed discussion of cost of sales, together with the total cash cost, All-in sustaining cost and All-in cost.
| |
Sibanye Annual Financial Report 2016 | 84 |
Table of Contents
MANAGEMENT'S DISCUSSION AND ANALYSIS OF THE FINANCIAL STATEMENTS continued
OPERATING COSTS – COST OF SALES LESS AMORTISATION AND DEPRECIATION
Operating costs increased by 26% to R20,709 million in 2016 from R16,380 million in 2015, or just less than 6% excluding operating costs at the platinum operations of R3,363 million, and increased by 14% in 2015 from R14,311 million in 2014, or just over 6% excluding Cooke. The increase in operating costs excluding the platinum operations in 2016 was due to above inflation wage and electricity tariffs, increased maintenance costs and consumable stores, and additional crews and contractors to improve productivity. These increases were partly offset by ongoing cost-saving initiatives and further restructuring across the group which included the closure of Cooke 4 shaft in September 2016.
The increase in operating costs excluding Cooke in 2015 was due to above inflation wage increases, increased electricity tariffs, increased maintenance costs and inflationary increases in consumable stores, as well as additional crews to improve productivity. These increases were partly offset by ongoing cost-saving initiatives, which included further restructuring across the group – including reduced number of contractors, improved efficiencies and programmes aimed at reducing electricity costs.
The table below presents a reconciliation from cost of sales at the gold operations to total cash cost.
| | | | | | | |
| | 2016 |
| | Total Gold | Driefontein | Kloof | Beatrix | Cooke | Corporate |
Cost of sales | Rm | 21,161 | 6,580 | 6,232 | 4,571 | 3,756 | 22 |
Deduct: Amortisation and depreciation | Rm | (3,815) | (1,013) | (1,191) | (818) | (771) | (22) |
Operating costs | Rm | 17,346 | 5,567 | 5,041 | 3,753 | 2,985 | - |
Adjusted for: | Rm | | | | | | |
General and admin costs | Rm | (189) | (68) | (64) | (35) | (22) | - |
Royalties1 | Rm | 528 | 205 | 194 | 113 | 16 | - |
Total cash cost2 | Rm | 17,685 | 5,704 | 5,171 | 3,831 | 2,979 | - |
Gold sold | kg | 46,905 | 16,046 | 15,176 | 10,041 | 5,642 | |
| ‘000oz | 1,508.0 | 515.9 | 487.9 | 322.8 | 181.4 | |
Total cash cost2 | R/kg | 377,034 | 355,416 | 340,762 | 381,625 | 527,916 | |
| US$/oz | 799 | 753 | 722 | 809 | 1,119 | |
| | | | | | | |
| | 2015 |
| | Total Gold | Driefontein | Kloof | Beatrix | Cooke | Corporate |
Cost of sales | Rm | 20,017 | 6,377 | 5,806 | 4,130 | 3,683 | 21 |
Deduct: Amortisation and depreciation | Rm | (3,637) | (1,143) | (1,029) | (739) | (705) | (21) |
Operating costs | Rm | 16,380 | 5,234 | 4,777 | 3,391 | 2,978 | - |
Adjusted for: | Rm | | | | | | |
General and admin costs | Rm | (174) | (57) | (53) | (36) | (28) | - |
Royalties1 | Rm | 401 | 197 | 98 | 89 | 17 | - |
Total cash cost2 | Rm | 16,607 | 5,374 | 4,822 | 3,444 | 2,967 | - |
Gold sold | kg | 47,775 | 17,350 | 14,068 | 10,105 | 6,252 | |
| ‘000oz | 1,536.0 | 557.8 | 452.3 | 324.9 | 201.0 | |
Total cash cost2 | R/kg | 347,613 | 309,764 | 342,764 | 340,792 | 474,584 | |
| US$/oz | 848 | 756 | 836 | 831 | 1,158 | |
| | | | | | | |
| | 2014 |
| | Total Gold | Driefontein | Kloof | Beatrix | Cooke | Corporate |
Cost of sales | Rm | 17,566 | 6,041 | 5,824 | 3,673 | 2,001 | 27 |
Deduct: Amortisation and depreciation | Rm | (3,255) | (1,129) | (1,322) | (469) | (308) | (27) |
Operating costs | Rm | 14,311 | 4,912 | 4,502 | 3,204 | 1,693 | - |
Adjusted for: | Rm | | | | | | |
General and admin costs | Rm | (147) | (56) | (55) | (36) | - | - |
Royalties1 | Rm | 431 | 166 | 175 | 82 | 8 | - |
Total cash cost2 | Rm | 14,595 | 5,022 | 4,622 | 3,250 | 1,701 | - |
Gold sold | kg | 49,432 | 17,735 | 17,038 | 10,354 | 4,305 | |
| ‘000oz | 1,589.3 | 570.2 | 547.8 | 332.9 | 138.4 | |
Total cash cost2 | R/kg | 295,246 | 283,129 | 271,282 | 313,888 | 395,168 | |
| US$/oz | 849 | 814 | 780 | 902 | 1,136 | |
The average exchange rate for the year ended 31 December 2016 was R14.68/US$ (2015: R12.75/US$ and 2014: R10.82/US$).
1 Royalties are included as part of total cash cost but are reflected below operating profit in profit or loss.
2 For information on how Sibanye has calculated total cash cost, total cash cost per kilogram and total cash cost per ounce, see Overview–Five year financial performance–Footnote 1.
| |
Sibanye Annual Financial Report 2016 | 85 |
Table of Contents
MANAGEMENT'S DISCUSSION AND ANALYSIS OF THE FINANCIAL STATEMENTS continued
Total cash cost per kilogram for the Gold Division increased by 8% to an average of R377,034/kg in 2016 from R347,613/kg in 2015, and increased by 18% in 2015 from R295,246/kg in 2014. The increase in 2016 was mostly due to the 2% decrease in production and inflationary increases from the operations as detailed above. In US dollar terms, total cash cost per ounce decreased by 6% to US$799/oz from US$848/oz primarily due to the 15% weaker rand/US dollar exchange rate partly offset by the decrease in production and increase in costs, mentioned above.
The increase in 2015 was mostly due to the 3% decrease in production and an increase in unit costs at Cooke. In US dollar terms, total cash cost per ounce decreased marginally to US$848/oz from US$849/oz primarily due to the 18% weaker rand/US dollar exchange rate partly offset by the decrease in production and increase in unit costs at Cooke mentioned above.
AMORTISATION AND DEPRECIATION
Amortisation and depreciation increased by 11% to R4,042 million from R3,637 million in 2015, increased by 12% to R3,637 million in 2015 from R3,255 million in 2014. The increase in 2016 was due to the inclusion of the platinum operations, which added R228 million, and amortisation and depreciation at Kloof due to the increased production in 2016.
The increase in 2015 was due to the inclusion of Cooke for 12 months, which added R397 million, and amortisation and depreciation at Beatrix, which increased by R270 million due to accelerated depreciation of 2 shaft of R65 million and an increase in the mine’s overall rate of depreciation due to the reversal of the R474 million impairment at the West Section late in 2014. These increases were partly offset by a decrease in amortisation and depreciation at Kloof due to the lower production in 2015 and a reduction stemming from the impairment of the Python plant in 2014.
ALL-IN COST
All-in cost per ounce, was introduced in 2013 by the members of the World Gold Council. Sibanye has adopted the principle prescribed by the Council. This non-IFRS measure provides more transparency into the total costs associated with gold mining.
The All-in cost per ounce metric provides relevant information to investors, governments, local communities and other stakeholders in understanding the economics of gold mining. This is especially true with reference to capital expenditure associated with developing and maintaining gold mines, which has increased significantly in recent years and is reflected in this new metric.
Total All-in cost excludes income tax, costs associated with merger and acquisition activities, working capital, impairments, financing costs, one-time severance charges and items needed to normalise earnings.
All-in cost is made up of All-in sustaining cost, being the cost to sustain current operations, given as a sub-total in the All-in cost calculation, together with corporate and major capital expenditure associated with growth.
The table below presents a reconciliation from operating costs at the gold operations to All-in sustaining cost and All-in cost.
| | | | | | | |
| | 2016 |
| | Total Gold | Driefontein | Kloof | Beatrix | Cooke | Corporate |
Operating costs | Rm | 17,346 | 5,567 | 5,041 | 3,753 | 2,985 | - |
Plus: | | | | | | | |
Community costs1 | Rm | 80 | 16 | 20 | 27 | 17 | - |
Share-based payments2 | Rm | 39 | 16 | 14 | 9 | - | - |
Royalties3 | Rm | 528 | 205 | 194 | 113 | 16 | - |
Rehabilitation4 | Rm | 141 | (29) | 44 | 23 | 100 | 3 |
ORD5 | Rm | 2,394 | 779 | 913 | 543 | 159 | - |
Sustaining capital expenditure6 | Rm | 614 | 219 | 261 | 85 | 49 | - |
Less: | | | | | | | |
By-product credit7 | Rm | (28) | (9) | (7) | (8) | (4) | - |
All-in sustaining cost8 | Rm | 21,114 | 6,764 | 6,480 | 4,545 | 3,322 | 3 |
Plus: | | | | | | | |
Group exploration growth and other capital expenditure | Rm | 1,052 | 54 | 130 | 5 | 41 | 822 |
All-in cost8 | Rm | 22,166 | 6,818 | 6,610 | 4,550 | 3,363 | 825 |
Gold sold | kg | 46,905 | 16,046 | 15,176 | 10,041 | 5,642 | |
| ‘000oz | 1,508.0 | 515.9 | 487.9 | 322.8 | 181.4 | |
All-in sustaining cost8 | R/kg | 450,152 | 421,501 | 427,036 | 452,754 | 588,745 | |
| US$/oz | 954 | 893 | 905 | 960 | 1,248 | |
All-in cost8 | R/kg | 472,585 | 424,872 | 435,609 | 453,232 | 595,959 | |
| US$/oz | 1,002 | 901 | 923 | 961 | 1,263 | |
| |
Sibanye Annual Financial Report 2016 | 86 |
Table of Contents
MANAGEMENT'S DISCUSSION AND ANALYSIS OF THE FINANCIAL STATEMENTS continued
| | 2015 |
| | Total Gold | Driefontein | Kloof | Beatrix | Cooke | Corporate |
Operating costs | Rm | 16,380 | 5,234 | 4,777 | 3,391 | 2,978 | - |
Plus: | | | | | | | |
Community costs1 | Rm | 41 | 14 | 9 | 15 | 3 | - |
Share-based payments2 | Rm | 274 | 35 | 27 | 24 | - | 188 |
Royalties3 | Rm | 401 | 197 | 98 | 89 | 17 | - |
Rehabilitation4 | Rm | 138 | 23 | 23 | 17 | 75 | - |
ORD5 | Rm | 2,305 | 727 | 841 | 510 | 227 | - |
Sustaining capital expenditure6 | Rm | 654 | 249 | 226 | 86 | 93 | - |
On-mine exploration | Rm | 18 | 14 | 1 | 1 | 2 | - |
Less: | | | | | | | |
By-product credit7 | Rm | (27) | (8) | (6) | (6) | (7) | - |
All-in sustaining cost8 | Rm | 20,184 | 6,485 | 5,996 | 4,127 | 3,388 | 188 |
Plus: | | | | | | | |
Group exploration and other | Rm | 9 | - | - | - | - | 9 |
Corporate cost and growth capital | Rm | 386 | 18 | 64 | - | 17 | 287 |
All-in cost8 | Rm | 20,579 | 6,503 | 6,060 | 4,127 | 3,405 | 484 |
Gold sold | kg | 47,775 | 17,350 | 14,068 | 10,105 | 6,252 | |
| ‘000oz | 1,536.0 | 557.8 | 452.3 | 324.9 | 201.0 | |
All-in sustaining cost8 | R/kg | 422,472 | 373,752 | 426,223 | 408,422 | 541,843 | |
| US$/oz | 1,031 | 912 | 1,040 | 996 | 1,322 | |
All-in cost8 | R/kg | 430,746 | 374,790 | 430,751 | 408,422 | 544,658 | |
| US$/oz | 1,051 | 914 | 1,051 | 996 | 1,329 | |
| | | | | | | |
| | 2014 |
| | Total | Driefontein | Kloof | Beatrix | Cooke | Corporate |
Operating costs | Rm | 14,311 | 4,912 | 4,502 | 3,204 | 1,693 | - |
Plus: | | | | | | | |
Community costs1 | Rm | 37 | 12 | 11 | 14 | - | - |
Share-based payments2 | Rm | 418 | 69 | 58 | 46 | - | 245 |
Royalties3 | Rm | 431 | 166 | 175 | 82 | 8 | - |
Rehabilitation4 | Rm | 138 | 39 | 33 | 18 | 48 | - |
ORD5 | Rm | 2,127 | 684 | 880 | 446 | 117 | - |
Sustaining capital expenditure6 | Rm | 975 | 465 | 356 | 102 | 52 | - |
Less: | | | | | | | |
By-product credit7 | Rm | (24) | (10) | (7) | (7) | - | - |
All-in sustaining cost8 | Rm | 18,413 | 6,337 | 6,008 | 3,905 | 1,918 | 245 |
Plus: | | | | | | | |
Group exploration and other | Rm | 16 | - | - | 9 | 6 | 1 |
Corporate cost and growth capital | Rm | 150 | - | - | - | 61 | 89 |
All-in cost8 | Rm | 18,579 | 6,337 | 6,008 | 3,914 | 1,985 | 335 |
Gold sold | kg | 49,432 | 17,735 | 17,038 | 10,354 | 4,305 | |
| ‘000oz | 1,589.3 | 570.2 | 547.8 | 332.9 | 138.4 | |
All-in sustaining cost8 | R/kg | 372,492 | 357,333 | 352,624 | 377,101 | 445,645 | |
| US$/oz | 1,071 | 1,027 | 1,014 | 1,084 | 1,281 | |
All-in cost8 | R/kg | 375,854 | 357,333 | 352,624 | 378,008 | 461,045 | |
| US$/oz | 1,080 | 1,027 | 1,014 | 1,087 | 1,325 | |
The average exchange rate for the year ended 31 December 2016 was R14.68/US$ (2015: R12.75/US$ and 2014: R10.82/US$).
1 Community costs includes costs related to community development.
2 Share-based payments includes share-based payments compensation cost to support Sibanye’s corporate structure not directly related to current gold production. Share-based payments are calculated based on the fair value at initial recognition and do not include the fair value adjustment of the cash-settled share-based payment liability to the reporting date fair value.
3 Royalties is the royalty on refined minerals payable to the South African government.
4 Rehabilitation includes the interest charge related to the environmental rehabilitation obligation and the amortisation of the related capitalised rehabilitation costs recorded as an asset. The interest charge related to the environmental rehabilitation obligation and the amortisation of the capitalised rehabilitation costs do not reflect annual cash outflows and are calculated in accordance with IFRS. The interest charge and amortisation reflect the periodic costs of rehabilitation associated with current gold production and are therefore included in the measure.
5 ORD are those capital expenditures that allow access to reserves that are economically recoverable in the future, including, but not limited to, crosscuts, footwalls, return airways and box holes which will avail gold production or reserves.
6 Sustaining capital expenditure are those capital expenditures that are necessary to maintain current gold production and execute the current mine plan. Sustaining capital costs are relevant to the All-in cost metric as these are needed to maintain Sibanye’s current operations and provide improved transparency related to Sibanye’s ability to finance these expenditures.
| |
Sibanye Annual Financial Report 2016 | 87 |
Table of Contents
MANAGEMENT'S DISCUSSION AND ANALYSIS OF THE FINANCIAL STATEMENTS continued
7 By-product credit—The All-in cost metric is focused on the cost associated with producing and selling a kilogram of gold, and therefore the metric captures the benefit of mining other metals when gold is produced and sold. In determining the All-in cost, the costs associated with producing and selling a kilogram of gold is reduced by the benefit received from the sale of silver, recognised as product sales, which is extracted and processed along with the gold produced. This is relevant to the All-in cost metric as it aids in the investor’s analysis of the profitability of producing a kilogram of gold, without the need to consider multiple metal prices.
8 For information on how Sibanye has calculated All-in sustaining cost, All-in cost, All-in sustaining cost per kilogram, All-in sustaining cost per ounce, All-in cost per kilogram and All-in cost per ounce, see Overview–Five year financial performance–Footnote 2.
All-in sustaining cost, a sub-set of All-in cost increased by 7% to R450,152/kg (US$954/oz) in 2016 from R422,472/kg (US$1,031/oz) in 2015, and increased by 13% to R422,472/kg (US$1,031/oz) in 2015 from R372,492/kg (US$1,071/oz) in 2014. The increase in 2016 was as a result of the effect of fixed costs on the lower production at Driefontein but more significantly due to continued underperformance at Cooke 4 shaft, subsequently closed, which increased 9% year on year from an already high cost of R541,843/kg in 2015. The increase in 2015 was as a result of the effect of fixed costs on the lower production at Driefontein and Beatrix but more significantly due to the 17% decrease at Kloof, together with increased labour costs and the increase in the electricity tariff, as well as the full year impact of higher cost Cooke production, which was 45% higher in 2015 than in 2014, primarily due to the fact that 2014 had only seven months of production.
All-in cost increased by 10% to R472,585/kg (US$1,002/oz) in 2016 from R430,746/kg (US$1,051/oz) in 2015, and increased by 15% to R430,746/kg (US$1,051/oz) in 2015 from R375,854/kg (US$1,080/oz) in 2014. The increase in 2016 was mainly due to the doubling of expenditure to R746 million on growth projects at Driefontein and Kloof as well as the Burnstone project. The increase in 2015 included corporate expenditure of R287 million, which relates to capital expenditure at Burnstone of R272 million and corporate expenditure of R15 million.
NET OPERATING PROFIT
As a result of the factors discussed above, net operating profit increased by 140% to R6,490 million in 2016 from R2,700 million in 2015 and decreased by 36% in 2015 from R4,215 million in 2014.
FINANCE EXPENSE
Finance expense increased by 61% to R903 million in 2016 from R562 million in 2015, and increased by 41% in 2015 from R400 million in 2014. Included in finance expense in 2016 was R428 million interest on borrowings (2015: R248 million and 2014: R188 million), R141 million unwinding of the Burnstone Debt (2015: R102 million and 2014: R43 million), R291 million environmental rehabilitation liability accretion expense (2015: R198 million and 2014: R162 million), and R43 million sundry interest charges (2015: R14 million and 2014: R7 million).
The increase in interest on borrowings in 2016 was due to the increase in the average indebtedness and effective interest rate year-on-year. Sibanye’s average gross debt outstanding, excluding the Burnstone Debt, was approximately R4.8 billion in 2016 compared with approximately R2.2 billion in 2015. The increase in environmental rehabilitation liability accretion expense was primarily due to the inclusion of the platinum operations, which added R62 million.
The increase in interest on borrowings in 2015 was due to the increase in the average indebtedness and effective interest rate year-on-year. Sibanye’s average gross debt outstanding, excluding the Burnstone Debt, was approximately R2.2 billion in 2015 compared with approximately R2.0 billion in 2014. The increase in environmental rehabilitation liability accretion expense was primarily due to the incorporation of Cooke and Burnstone for 12 months, which added R25 million, and new disturbances.
SHARE-BASED PAYMENTS
The share-based payments expense increased by 81% to R496 million in 2016 from R274 million in 2015, and decreased by 34% in 2015 from R418 million in 2014. The share-based payments expense consists of R172 million relating to equity-settled share options granted under the Sibanye Gold Limited 2013 Share Plan (SGL Share Plan), Gold Fields Limited 2012 Share Plan and Gold Fields Limited 2005 Share Plan (2015: R119 million and 2014: R176 million), R84 million relating to instruments granted under the Sibanye Gold 2013 Phantom Share Scheme (the SGL Phantom Scheme) (2015: R155 million and 2014: R242 million) and R240 million relating to share-based payment on BEE transaction.
The increase in the share-based payment expense in 2016 was due to the increase in the SGL Share Plan expense as a result of the fair value of each option granted under the scheme increasing with the appreciation of Sibanye’s share price, and the share-based payment on BEE transaction which was recognised as part of the Rustenburg Operations acquisition which represents the BEE shareholders attributable value over the expected life of mine partly offset by the decrease in the SGL Phantom Scheme expense as a result of the number of performance shares that vested on 1 March 2015, with no new allocations in 2015 or 2016.
The decrease in the share-based payment expense in 2015 was mainly due to the number of performance shares that vested on 1 March 2015, with no new significant allocations in 2015.
LOSS ON FINANCIAL INSTRUMENTS
The loss on financial instruments of R1,033 million in 2016 compared with R230 million in 2015 and R108 million in 2014. The loss on financial instruments primarily consists of R1,070 fair value loss relating to SGL Phantom Scheme options (2015: R87 million and 2014: R202 million) and R29 million (2015: R163 million and 2014: Rnil) loss on revised estimated cash flows of the Burnstone Debt, partly offset by R11 million fair value gain on investments under the environmental rehabilitation obligation funds (2015: R8 million and 2014: R63 million), R41 million fair value gain on the Cooke hedges and R21 million fair value gain on the purchase of concentrate debtor acquired on acquisition of the Rustenburg Operations.
| |
Sibanye Annual Financial Report 2016 | 88 |
Table of Contents
MANAGEMENT'S DISCUSSION AND ANALYSIS OF THE FINANCIAL STATEMENTS continued
The cash-settled share instruments are valued at each reporting date based on the fair value of the instrument at that reporting date. The difference between the reporting date fair value and the initial recognition fair value of these cash settled share options is included in loss/gain on financial instruments in profit or loss. The appreciation in Sibanye’s share price for the six months ended 30 June 2016 of approximately 120%, resulted in a fair value loss of R1,181 million. The depreciation in the share price for the six months ended 31 December 2016 of approximately 49%, resulted in a fair value gain of R111 million.
GAIN/LOSS ON FOREIGN EXCHANGE DIFFERENCES
The gain on foreign exchange differences of R220 million in 2016 compared with a loss of R359 million in 2015 and a loss of R63 million in 2014. The gain on foreign exchange differences in 2016 was mainly due to exchange rate gains on the Burnstone Debt of R224 million (2015: R412 million loss and 2014: R89 million loss) and US$350 million revolving credit facility of R192 million, partly offset by the effect of exchange rate fluctuation on other financial assets and financial liabilities of R196 million (2015: R53 million and 2014: R26 million).
SHARE OF RESULTS OF EQUITY-ACCOUNTED INVESTEES AFTER TAX
The profit from share of results of associates of R13 million in 2016 (2015: R116 million and 2014: R471 million loss) was primarily due to share of profits of R115 million relating to Sibanye’s attributable share in Mimosa and losses of R117 million relating to its 33.1% interest in Rand Refinery.
IMPAIRMENTS
Impairments were R1,381 million in 2016, Rnil in 2015 and R275 million in 2014.
Despite joint efforts of stakeholders, the Cooke 4 underground mine and Ezulwini Gold and Uranium processing plant (the Cooke 4 Operation) was unable to meet required production and cost targets, and continued to operate at a loss. As a result a decision was taken during the six months ended 30 June 2016 to fully impair the Cooke 4 Operation’s mining assets by R817 million.
Due to a decrease in the rand gold price from 30 June 2016 and continued losses, a decision was taken during the six months ended 31 December 2016, to impair the goodwill allocated to the Cooke cash-generating unit (CGU) by R201 million and the Cooke 1, 2 and 3 mining assets by R355 million. For additional information on the impairments, see note 7: Impairments to the consolidated financial statements.
The impairment in 2014 related to a R155 million impairment of the Python plant at Kloof, which was decommissioned in July 2014 due to process design flaws, and the R120 million impairment of investment in Rand Refinery.
GAIN ON ACQUISITION
A gain on acquisition of R2,428 million arose on the acquisition of the Rustenburg Operations and is attributable to the fact that Anglo American Platinum has repositioned its portfolio by among others exiting certain assets. The Rustenburg Operations Transaction represented an attractively priced entry for Sibanye into the PGM sector. For additional information on the Rustenburg Operations acquisition and related gain on acquisition, see note 12.2: The Rustenburg Operations acquisition to the consolidated financial statements.
TRANSACTION COSTS
The transaction costs were R157 million in 2016 compared with R26 million in 2015 and R112 million in 2014. The transaction costs in 2016 related to the Aquarius and Rustenburg Operations acquisitions of R93 million (2015: R16 million) and R64 million (2015: R10 million), respectively. The transaction costs in 2014 related to the finalisation of the Cooke and Burnstone acquisitions of R82 million and R30 million, respectively.
NET LOSS ON DERECOGNITION OF FINANCIAL GUARANTEE ASSET AND LIABILITY
On 24 April 2015, Sibanye was released as guarantor by the note holders of Gold Fields’ US$1 billion bond, resulting in a net loss on derecognition of the financial guarantee asset and financial guarantee liability of R158 million.
REVERSAL OF IMPAIRMENT
Due to the positive results of a restructuring process at the Beatrix West Section it has subsequently returned to profitability. As a result a decision was taken at 31 December 2014 to reverse the impairment by R474 million.
ROYALTIES
Royalties increased by 36% to R547 million in 2016 from R401 million in 2015 and decreased by 7% in 2015 from R431 million in 2014. The increased royalty in 2016 was mainly due to the increase in gold revenue. The decreased royalty in 2014 was mainly due to the decrease in earnings before interest and taxes.
The rate of royalty tax payable as a percentage of revenue is set out in the table below.
| |
Sibanye Annual Financial Report 2016 | 89 |
Table of Contents
MANAGEMENT'S DISCUSSION AND ANALYSIS OF THE FINANCIAL STATEMENTS continued
| | | |
% | 2016 | 2015 | 2014 |
Driefontein | 2.2 | 2.4 | 2.1 |
Kloof | 2.2 | 1.5 | 2.3 |
Beatrix | 1.9 | 1.8 | 1.8 |
Cooke | 0.5 | 0.6 | 0.5 |
Kroondal | 0.5 | - | - |
Rustenburg Operations | 0.5 | - | - |
Average for Group | 1.7 | 1.8 | 2.0 |
MINING AND INCOME TAX
Mining and income tax increased by 230% to R1,243 million in 2016 from R377 million in 2015 and decreased by 54% in 2015 from R828 million in 2014. The table below indicates Sibanye’s effective tax expense rate in 2016, 2015 and 2014.
| | | | |
| | 2016 | 2015 | 2014 |
Mining and income tax | Rm | 1,243 | 377 | 828 |
Effective tax rate | % | 27.5 | 41.2 | 35.5 |
In 2016, the effective tax expense rate of marginally lower than the South African statutory company tax rate of 28% mainly due to the tax effect of the following:
| · | | R161 million reduction related to the mining tax formula rate adjustment; |
| · | | R680 million non-taxable gain on acquisition; |
The above were offset by the following:
| · | | R116 million non-deductible charges related to share-based payments; |
| · | | R52 million non-deductible loss on foreign exchange differences; |
| · | | R35 million non-deductible amortisation and depreciation; |
| · | | R66 million non-deductible impairments; |
| · | | R60 million deferred tax charge on increase of the long-term expected tax rate; |
| · | | R430 million assessed losses and other deductible temporary differences not recognised; and |
| · | | R61 million net non-taxable income and non-deductible expenditure. |
In 2015, the effective tax expense rate of 41% was higher than the South African statutory company tax rate of 28% mainly due to the tax effect of the following:
| · | | R33 million non-deductible charges related to share-based payments; |
| · | | R26 million non-deductible amortisation and depreciation; |
| · | | R29 million deferred tax charge on increase of long-term expected tax rate; and |
| · | | R267 million assessed losses and other deductible temporary differences not recognised. |
The above were offset by the following:
| · | | R130 million reduction related to the mining tax formula rate adjustment; |
| · | | R18 million non-taxable gain on foreign exchange differences; |
| · | | R33 million non-taxable share of results of equity-accounted investees; and |
| · | | R55 million non-taxable gain on derecognition of financial guarantee liability. |
In 2014, the effective tax expense rate of 36% was higher than the South African statutory company tax rate of 28% mainly due to the tax effect of the following:
| · | | R49 million non-deductible charges related to share-based payments; |
| · | | R132 million non-taxable share of results of equity-accounted investees; |
| · | | R19 million non-deductible amortisation and depreciation; |
| · | | R34 million non-deductible impairments; and |
| · | | R66 million assessed losses and other deductible temporary differences not recognised. |
The above was offset by the following:
| · | | R112 million reduction related to the mining tax formula rate adjustment; and |
| · | | R14 million net non-taxable income and non-deductible expenditure |
PROFIT FOR THE YEAR
As a result of the factors discussed above, the profit in 2016 was R3,271 million compared with R538 million in 2015 and R1,507 million in 2014. Of this, R3,702 million (2015: R717 million and 2014: R1,552 million) is attributable to the owners of Sibanye.
The following table depicts contributions from various segments to the profit.
| |
Sibanye Annual Financial Report 2016 | 90 |
Table of Contents
MANAGEMENT'S DISCUSSION AND ANALYSIS OF THE FINANCIAL STATEMENTS continued
Ontroi | | | |
Figures in million - SA rand | 2016 | 2015 | 2014 |
Gold | 1,186 | 538 | 1,507 |
Driefontein | 1,744 | 1,089 | 938 |
Kloof | 1,615 | 510 | 839 |
Beatrix | 760 | 356 | 870 |
Cooke | (1,957) | (699) | (188) |
Corporate (and reconciling items) | (976) | (718) | (952) |
Platinum | 2,085 | - | - |
Kroondal | 91 | - | - |
Platinum Mile | 18 | - | - |
Mimosa | 115 | | |
Rustenburg Operations | 2,278 | - | - |
Corporate (and reconciling items) | (417) | - | - |
LIQUIDITY AND CAPITAL RESOURCES
CASH FLOW ANALYSIS
Net cash generated in 2016 was R408 million compared with R154 million in 2015 and R930 million utilised in 2014.
The principal factors explaining the changes in net cash flow for the year are set out in the table below.
| | | | | |
Figures in million - SA rand | 2016 | 2015 | % change 2016/2015 | 2014 | % change 2015/2014 |
Net cash from operating activities | 4,406 | 3,515 | 25 | 4,053 | (13) |
Dividends paid | (1,612) | (658) | (145) | (1,005) | 34 |
Additions to property, plant and equipment | (4,151) | (3,345) | (24) | (3,251) | (3) |
Free cash flow1 | 1,866 | 829 | 125 | 1,807 | (54) |
Net borrowings raised/(repaid) | 5,446 | (21) | (26,033) | (673) | 97 |
1 One of the most important drivers to sustain and increase shareholder value is free cash flow generation as that determines the cash available for dividends and other investing activities. Free cash flow is defined as net cash from operating activities before dividends, less additions to property, plant and equipment.
CASH FLOWS FROM OPERATING ACTIVITIES
Cash from operating activities increased to R4,406 million in 2016 from R3,515 million in 2015 and decreased in 2015 from R4,053 million in 2014. The items contributing to the increase in 2016 and decrease in 2015 are indicated in the table below.
| | |
Figures in million - SA rand | 2016 | 2015 |
Increase/(decrease) in cash generated by operations1 | 3,706 | (951) |
(Increase)/decrease in cash-settled share-based payments paid2 | (1,476) | 124 |
Decrease/(increase) in investment in working capital | 430 | (882) |
Increase in interest paid | (181) | (66) |
(Increase)/decrease in royalties paid3 | (161) | 255 |
(Increase)/decrease in tax paid3 | (520) | 691 |
(Increase)/decrease in dividends paid4 | (954) | 347 |
Other | 46 | (55) |
Increase/(decrease) in cash flows from operating activities | 890 | (537) |
1 The increase in cash generated by operations in 2016 was mainly due to the increase in the average realised US dollar gold price to US$1,242/oz in 2016 from US$1,160/oz in 2015 and the 15% weaker rand of R14.68/US$ in 2016 compared with R12.75/US$ in 2015. The decrease in cash generated by operations in 2015 was mainly due to higher operating costs.
2 Approximately 70% of cash-settled instruments vested during the year resulting in an increase in the cash-settled share-based payments paid.
3 The increase in royalties and tax paid in 2016 was due to increased revenue.
4 The dividend declared and paid in 2016 related to the final dividend of 90 cents per share (cps) or R825 million in respect of the six months ended 31 December 2015 (2014: 62cps or R567.1 million) and the interim dividend of 85cps or R785 million in respect of the six months ended 30 June 2016 (2015: 10cps or R91.3 million).
CASH FLOWS FROM INVESTING ACTIVITIES
Cash used in investing activities increased to R9,444 million in 2016 from R3,340 million in 2015 and decreased in 2015 from R4,309 million in 2014. The increase in cash from investing activities in 2016 was mainly due the acquisitions of Aquarius and the Rustenburg Operations in 2016 for R5,802 million. The decrease in cash from investing activities in 2015 was mainly due the acquisitions of Wits Gold, Cooke and Burnstone in 2014 for R616 million and the loan advanced to Rand Refinery in 2014 of R385 million.
Capital expenditure increased by 24% to R4,151 million in 2016 from R3,345 million in 2015 and increased by 3% in 2015 from R3,251 million in 2014. Capital expenditure at the individual mines is shown in the table below.
| |
Sibanye Annual Financial Report 2016 | 91 |
Table of Contents
MANAGEMENT'S DISCUSSION AND ANALYSIS OF THE FINANCIAL STATEMENTS continued
Ontroi | | | |
Figures in million - SA rand | 2016 | 2015 | 2014 |
Gold | 3,824 | 3,345 | 3,251 |
Driefontein | 1,052 | 994 | 1,149 |
Kloof | 1,304 | 1,130 | 1,236 |
Beatrix | 628 | 597 | 548 |
Cooke | 249 | 337 | 230 |
Corporate | 591 | 287 | 88 |
Platinum | 327 | - | - |
Kroondal | 176 | - | - |
Rustenburg Operations | 149 | - | - |
Platinum Mile and Corporate | 2 | - | - |
CASH FLOWS FROM FINANCING ACTIVITIES
Cash from financing activities increased to R5,446 million in 2016 from R21 million used in 2015 and cash used in financing activities decreased in 2015 from R673 million in 2014.
On 4 April 2016, Sibanye drew down R1,330 million under the R4.5 billion Facilities and US$145 million (R2,218 million) under the US$350 million revolving credit facility (RCF) to fund the acquisition of Aquarius. On various dates during 2016, Sibanye made further additional drawdowns of R606 million and repaid R650 million under the R4.5 billion Facilities, and repaid US$45 million (R653 million) under the US$350 million RCF. On 15 November 2016, Sibanye cancelled and refinanced the R4.5 billion Facilities by drawing R3.2 billion under the R6.0 billion RCF. Sibanye made additional drawdowns of R1.9 billion under the R6.0 billion RCF to fund the upfront cash payment for the acquisition of the Rustenburg Operations and for other working capital requirements.
On various dates during 2015, Sibanye made additional drawdowns of R1,000 million and repaid R1,021 million under the R4.5 billion Facilities.
In 2014, Sibanye repaid R656 million debt assumed through the acquisitions of Wits Gold and Cooke. On various dates during 2014, Sibanye made additional drawdowns of R500 million and repaid R900 million under the R4.5 billion Facilities. On 18 December 2014, Sibanye borrowed a further R385 million to fund its portion of the Rand Refinery loan, increasing its debt under the facility to just below R2.0 billion.
NET INCREASE/(DECREASE) IN CASH AND CASH EQUIVALENTS
As a result of the above, net cash generated in 2016 amounted to R408 million compared with R155 million in 2015 and R930 million utilised in 2014.
Total Group cash and cash equivalents amounted to R968 million at 31 December 2016 (2015: R717 million and 2014: R563 million).
STATEMENT OF FINANCIAL POSITION
BORROWINGS
Total debt (short- and long-term) excluding R1,753 million attributable to the Burnstone project, which has no recourse to Sibanye’s balance sheet, increased to R7,221 million at 31 December 2016 from R1,995 million at 31 December 2015 (2014: R2,036 million).
At 31 December 2016, Sibanye had committed unutilised banking facilities of R4.3 billion available under the R6.0 billion RCF and US$350 million RCF.
For a description of borrowings, see note 23: Borrowings to the consolidated financial statements.
WORKING CAPITAL AND GOING CONCERN ASSESSMENT
As at 31 December 2016, the Group’s current assets exceeded its current liabilities by R1,466.6 million (2015: current liabilities exceeded current assets by R2,596.6 million) and during the year then ended Sibanye generated cash from operating activities of R4,405.5 million (2015: R3,515.3 million).
Sibanye has entered into a definitive agreement to acquire all of the outstanding common stock of Stillwater Mining Company (Stillwater) for US$18.00 per share, or US$2,200 million (approximately R30 billion) in cash (the Stillwater Transaction). The consideration represents a premium of 23% to Stillwater’s prior day closing share price, and 20% to Stillwater’s 20-day volume-weighted average closing share price. Sibanye has obtained a US$2,650 million bridge loan facility from a syndicate of banks initially led by Citibank and HSBC which will be utilised only to fund the Stillwater acquisition, refinance existing indebtedness at Stillwater, and pay certain related fees, costs and expenses (see note 23.6: Acquisition bridge facilities to the consolidated financial statements). Together with cash on hand, the bridge loan facility is sufficient to fully fund the Stillwater Transaction and is expected to close in the second quarter of 2017.
Post-closing of the Stillwater Transaction, Sibanye expects to raise in the capital markets new equity (of between US$750 million and US$1,300 million) and long-term debt (of between US$1,600 million and US$1,050 million), primarily through a proposed rights offer and a bond issue. Both the rights offer and bond issue are envisaged to be underwritten by some of the bridge facility arranging and funding banks, negotiation of which is ongoing, with the objective of maintaining a strong balance sheet and its dividend policy, and preserving its long-term financial flexibility. To enhance its capital structure and financing mix, Sibanye will also evaluate additional financing structures,
| |
Sibanye Annual Financial Report 2016 | 92 |
Table of Contents
MANAGEMENT'S DISCUSSION AND ANALYSIS OF THE FINANCIAL STATEMENTS continued
which may include, among others, streaming facilities and the issuance of warrants and convertible bonds, all of which will be assessed considering prevailing market conditions, exchange rates and commodity prices. Consistent with its long-term strategy, Sibanye plans to deleverage over time to its targeted leverage (net debt to EBITDA ratio) of no greater than 1.0x EBITDA.
The bridge loan facility currently provides for the equity refinancing to be concluded by 31 October 2017 with the balance to be refinanced within 1 year of closing of the Stillwater Transaction. The bridge loan facility, as well as Sibanye’s existing facilities, permit a leverage ratio of 3.0x through to 31 October 2017, and 2.5x thereafter. The leverage ratio provides for pro forma adjustments to include EBITDA from acquired businesses in the calculation.
Sibanye’s leverage ratio post the conclusion of the Stillwater Transaction and prior to the proposed rights offer is expected to peak at no more than 2.2x EBITDA. Cash generated from operations and the proceeds of the proposed rights offer is expected to reduce Sibanye’s leverage ratio to below 2.2x by 31 December 2017, with the targeted leverage ratio of no greater than 1.0x EBITDA achieved shortly after 31 December 2018.
Aside from the bridge loan facility, the Group has further committed unutilised debt facilities of R4.3 billion at 31 December 2016 (2015: R6.2 billion).
The directors believe that the cash generated by its operations, the Stillwater Transaction bridge loan facility and the remaining balance of the Group’s revolving credit facilities will enable the Group to continue to meet its obligations as they fall due. If the Stillwater Transaction is not successful, the directors believe that the cash generated by its operations and the remaining balance of the Group’s revolving credit facilities will enable the Group to continue to meet its obligations as they fall due. The consolidated financial statements for the year ended 31 December 2016, therefore, have been prepared on a going concern basis.
Off balance sheet arrangements and contractual commitments
At 31 December 2016, Sibanye had no off balance sheet items. For a description of Sibanye’s contractual commitments, see the following notes to the consolidated financial statements.
| |
Contractual commitments | Note per the consolidated financial statements |
Environmental rehabilitation obligation | 24 – Environmental rehabilitation obligation |
Commercial commitments | 30 – Commitments |
Contingent liabilities | 31 – Contingent liabilities |
Debt | |
– capital | 23 – Borrowings |
– interest | 29.2 – Risk management activities |
These contractual commitments for expenditure, together with other expenditure and liquidity requirements, will be met from internal cash flow and, to the extent necessary, from the existing facilities.
CRITICAL ACCOUNTING POLICIES AND ESTIMATES
Sibanye’s significant accounting policies are fully described in the various notes to its consolidated financial statements. Some of Sibanye’s accounting policies require the application of significant judgements and estimates by management that can affect the amounts reported in the consolidated financial statements.
These judgements and estimates are based on management’s best knowledge of the relevant facts and circumstances, having regard to previous experience, but actual results may differ from the amounts included in the consolidated financial statements.
For Sibanye’s significant accounting policies that are subject to significant judgements, estimates and assumptions, see the following notes to the consolidated financial statements:
| |
Significant accounting policy | Note per the consolidated financial statements |
Basis of preparation | 1 – Accounting policies |
Consolidation | 1 – Accounting policies |
Revenue | 3 – Revenue |
Royalties, mining and income tax, and deferred tax | 8 – Royalties, mining and income tax, and deferred tax |
Property, plant and equipment | 11 – Property, plant and equipment |
Business combinations | 12 – Acquisitions |
Goodwill | 13 – Goodwill |
Equity-accounted investments | 14 – Equity accounted investments |
Environmental rehabilitation obligation funds | 16 – Environmental rehabilitation obligation funds |
Financial assets and financial liabilities | 17 – Financial assets and financial liabilities |
Inventories | 18 – Inventories |
Borrowings | 23 – Borrowings |
Environmental rehabilitation obligation | 24 – Environmental rehabilitation obligation |
Contingent liabilities | 31 – Contingent liabilities |
| |
Sibanye Annual Financial Report 2016 | 93 |
The directors are responsible for the preparation and fair presentation of the consolidated financial statements of Sibanye, comprising the consolidated statement of financial position at 31 December 2016, and consolidated income statement and consolidated statements of comprehensive income, changes in equity and cash flows for the year then ended, and the notes to the consolidated financial statements, which include a summary of significant accounting policies, and other explanatory notes, in accordance with IFRS, as issued by the International Accounting Standards Board (IASB), the South African Institute of Chartered Accountants (SAICA) Financial Reporting Guides issued by the Accounting Practices Committee and Financial Reporting Pronouncements issued by the Financial Reporting Standards Council, as well as the requirements of the South African Companies Act and the JSE Listings Requirements.
In addition, the directors are responsible for preparing the directors’ report.
The directors consider that, in preparing the consolidated financial statements, they have used the most appropriate accounting policies, consistently applied and supported by reasonable and prudent judgements and estimates, and that all IFRS standards that they consider to be applicable have been complied with for the financial year ended 31 December 2016. The directors are satisfied that the information contained in the consolidated financial statements fairly presents the results of operations for the year and the financial position of the Group at year end. The directors are responsible for the information included in the annual financial report, and are responsible for both its accuracy and its consistency with the consolidated financial statements.
The directors have responsibility for ensuring that accounting records are kept. The accounting records should disclose with reasonable accuracy the financial position of the Group to enable the directors to ensure that the consolidated financial statements comply with the relevant legislation.
The Group operated in a well-established control environment, which is well documented and regularly reviewed. This incorporates risk management and internal control procedures, which are designed to provide reasonable assurance that assets are safeguarded and the material risks facing the business are being controlled.
The directors have made an assessment of the ability of the Company and its subsidiaries to continue as going concerns and have no reason to believe that Sibanye and its subsidiaries will not be going concerns in the year ahead.
Sibanye has adopted a Code of Ethics, applicable to all directors and employees, which is available on Sibanye’s website.
The Group’s external auditors, KPMG Inc. audited the consolidated financial statements. For their report, see Accountability–Report of independent registered public accounting firm.
The consolidated annual financial statements were approved by the Board of Directors and are signed on its behalf by:
Neal Froneman
Chief Executive Officer
Charl Keyter
Chief Financial Officer
30 March 2017
COMPANY SECRETARY'S CONFIRMATION
In terms of section 88(2)(e) of the Companies Act 71 of 2008, as amended, I certify that the Company has lodged with the Companies and Intellectual Property Commission all such returns as are required to be lodged by a public company in terms of the Companies Act, and that all such returns are true, correct and up to date.
Cain Farrel
Company Secretary
30 March 2017
| |
Sibanye Annual Financial Report 2016 | 94 |
The Group has adopted high standards of accountability, transparency and integrity in the running of the business and reporting to shareholders and other stakeholders.
The approach to corporate governance is guided by the principles of fairness, accountability, responsibility and transparency. Special attention has been given to providing stakeholders and the financial investment community with clear, concise, accurate and timely information about the Group’s operations and results; reporting to shareholders on an integrated basis on Sibanye’s financial and sustainable performance; ensuring appropriate business and financial risk management; ensuring that no director, management official or other employee of the Sibanye Group deals directly or indirectly in Sibanye shares on the basis of unpublished price-sensitive information regarding the Sibanye Group, or otherwise during any prohibited period; and recognition of the Group’s social responsibility to provide assistance and development support to the communities in which it operates and to deserving institutions at large.
Our governance structures, processes and policies support our strategy execution and underpin our business model. Sibanye views good corporate governance as being fundamental to the long-term sustainability of the company and to value creation for all stakeholders. It is essential too in establishing relationships with stakeholders that are based on respect and goodwill.
ROLE OF THE BOARD
The Sibanye Board of Directors, which has overall accountability for the long-term sustainability of the business, ensures that our corporate governance is aligned with best practice guidelines, and is aligned with our commitment to enabling the improvement of lives through our business activities, and that we our business activities are conducted with integrity, in line with Sibanye’s CARES values and Code of Ethics.
Collectively, the 13-member Board provides sound, independent, strategic guidance and leadership, with due consideration for the interests of all stakeholders. It is ultimately responsible for achievement of the Group’s strategic objective, and for overseeing Sibanye’s operating and financial performance, and for Sibanye’s corporate governance framework which guides the business. In so doing, it advises on the setting of strategic objectives and targets and reviews and monitors progress.
The Board oversees the governance framework and its integration within the company in order to achieve an ethical culture, effective internal controls, strategic outcomes, policy approval and disclosure.
COMPLIANCE
Sibanye has its primary listing on the JSE. It is registered with the Securities and Exchange Commission (SEC) in the United States of America (US) where its ordinary shares are listed on the New York Stock Exchange (NYSE) in the form of an American Depositary Receipt (ADR) programme administered by Bank of New York Mellon (BNYM). As a result, the Group is subject to compliance with the JSE Listings Requirements, and the disclosure and corporate governance requirements of the NYSE. In 2016, the Group complied with all applicable governance requirements as well as with all the mandatory specific governance requirements contained in paragraph 3.84 of the JSE Listing Requirements.
The Group applies the principles contained in King III and has implemented the King III principles and recommendations across the Group. All 75 King III principles are recorded in the compliance schedule on Sibanye’s website, detailing the principles and the corresponding explanations. The one exception is the King III recommendation that employment contracts should not compensate executives for severance because of change of control (although this does not preclude payments for retaining key executives during a period of uncertainty).
BOARD
The Board of Directors’ Charter (Charter) outlines the objectives and responsibilities of the Board, see –Board of director’s charter. Likewise, all Board sub-committees operate in accordance with written terms of reference, which are regularly reviewed on an annual basis by the various sub-committees. The Board takes ultimate responsibility for the Group’s adherence to sound corporate governance standards and sees to it that all business judgements are made with reasonable care, skill and diligence.
The Company’s Memorandum of Incorporation (MOI) requires no fewer than four and no more than 15 members on the Board of Directors. The Board currently comprises 13 members – eight of these are independent non-executive directors, three non-independent non-executive directors and the two executive directors holding the positions of Chief Executive Officer (CEO) and Chief Financial Officer (CFO). The Board, advised by the Nominating and Governance Committee, ensures that the candidates for election as independent non-executive directors are reputable, competent and experienced and are willing to devote the necessary time to the role.
Sibanye has a stable and diverse Board with appropriate and strong skill sets. The Company’s policy aims to promote gender diversity at Board level. Currently, out of thirteen Board members, one is a woman. The Board, through the Nominating and Governance Committee, is currently interviewing black female candidates to fill a vacant position.
The roles of the Chairman of the Board and the CEO are separate. Independent non-executive director Sello Moloko was the Chairman of the Board and Neal Froneman the CEO for the period under review.
The executive directors and the Company Secretary keep the Board informed of all developments in the Group.
For additional information on the Board and its members see Accountability–Board and executive committee.
| |
Sibanye Annual Financial Report 2016 | 95 |
MEMBERSHIP AND ATTENDANCE OF BOARD MEETINGS
| | | | | | | |
| | Date |
| | | 23/2 | 24/5 | 23/8 | 17/10 | 8/11 |
Sello Moloko (Chairman) | | | x | x | x | x | x |
Chris Chadwick | | | x | x | x | x | x |
Robert Chan | | | x | x | x | x | x |
Tim Cumming | | | x | x | x | x | x |
Barry Davison | | | x | x | x | x | x |
Neal Froneman | | | x | x | x | x | x |
Charl Keyter | | | x | x | x | x | x |
Rick Menell | | | x | x | x | – | x |
Nkosemntu Nika | | | x | x | x | x | x |
Keith Rayner | | | x | x | x | x | x |
Sue van der Merwe | | | x | x | x | x | x |
Jerry Vilakazi | | | x | x | – | x | x |
Jiyu Yuan | | | x | x | x | x | – |
KEY AREAS OF BOARD DELIBERATION IN 2016
As we execute our strategy and respond to mitigate our material issues, we are cognisant of the governance aspects that can enable or impede our progress. The strength of our leadership team lies in its agility and ability to respond to market opportunities, such as recently diversifying our portfolio to include platinum group metals. In developing Sibanye’s strategy, the Board takes into account associated risks and ensures alignment with Sibanye’s CARES values and the overall purpose of superior value creation for all. The Board ensures that the strategy is cascaded and managed through specialised teams such as our Gold Executive Committee, Platinum Executive Committee and the Safe Technology team.
The following were among the most important topics considered by the Board and the sub-committees during the course of the year.
Safety: As employee safety is of critical importance to Sibanye, the regression in safety performance in the first half of 2016 after several years of consistent improvement caused grave concern to the Board. As a result a full review of Sibanye’s safety strategy and procedures was undertaken to improve safety performance and prevent accidents. More assertive safety leadership structures were put in place and “safety” was launched as a separate and distinct value. In so doing, Sibanye reaffirmed its commitment to the health and safety of employees.
Mining Charter revisions: A revised draft Mining Charter was unexpectedly gazetted by the then recently appointed Minister of Mineral Resources in April 2016. There had been no significant prior consultation and the draft Charter contained several amendments which were of significant concern to the mining industry. While a 30-day period for public comment typically follows gazetting of regulations such as this, in the wake of significant stakeholder resistance, the final version of the amended Charter has still to be passed. Although the ownership aspect of the Charter remained prominent, subsequent consultations took place on all elements of the Charter. The process was led by the Chamber of Mines on behalf of the mining industry. Business inputs into consultations were being marginalised with pressure to promulgate a final version prior to 31 October 2016 when the Department of Trade and Industry’s generic broad based black economic empowerment (BBBEE) codes came into force in the absence of a mining sector specific charter. Legal challenges were pursued to ensure that vested rights were maintained from previous Mining Charter cycles, in relation to the continued consequences of historical empowerment as well as to address the legal validity of a new Charter that may be promulgated. Limited progress had been achieved in developing the revised Mining Charter into a form that would not inhibit business competitiveness while providing a framework for effective empowerment through transformation.
Acquisitions: The Board played a key role in advising, monitoring and approving the repositioning of Sibanye as a multi-commodity miner with the acquisitions of the Aquarius and certain Anglo American Platinum assets in 2016. These were followed by the proposed acquisition of Stillwater, the successful completion of which will position Sibanye among the top global precious metals companies with a Tier 1 asset in a stable mining jurisdiction.
Purpose statement: The Board oversaw and approved an all-encompassing statement encapsulating Sibanye’s reason for operating and purpose. This statement, “Sibanye’s mining improves lives”, links our vision and values and is in line with our concept of an inclusive, modernised mining industry, founded on humanity and recognised as a key contributor to socio-economic development.
Cooke 4: Given the unprofitability of the Cooke 4 Operation, the Board approved it being placed on care and maintenance in July 2016. The suspension of operations at Cooke 4 did however contribute to reduced production for the group as a whole in 2016. The majority of the workforce was transferred to fill vacancies at other Sibanye operations with retrenchments being minimised as far as possible.
Section 54 stoppages: Having noted the high number of Section 54 notices issued to the Platinum Division’s Kroondal mine by the Mines Health and Safety Inspectorate (MHSI) in 2016, the Board approved the issuing of a legal claim against the DMR, the Minister of Mineral Resources and officials in the MHSI for financial losses incurred as a result of what were unjustified Section 54 stoppages.
Silicosis: The Board reviewed the judgement of the High Court of South Africa, Gauteng Division on 31 May 2016, in the class action proceedings that had been brought by a number of applicants against a number of mines relating to silicosis and tuberculosis. The Court granted certification of a consolidated class action comprising two separate classes, namely silicosis and pulmonary tuberculosis.
Operational plan for 2017: Having reviewed and assessed the 2017 operational plan and vision for 2018, these were approved by the Board.
| |
Sibanye Annual Financial Report 2016 | 96 |
Strategy: The Board had a strategy session in 2016 and was satisfied with the progress made by the company in becoming a multi-commodity resources company.
BOARD EFFECTIVENESS AND PERFORMANCE MANAGEMENT
In line with King III’s recommendations, the Board conducted a rigorous evaluation of the independence of directors and an internal assessment of the effectiveness of the Board and its sub-committees. An external consultant was also appointed to independently review the Board’s effectiveness. The outcome of the independent assessment revealed that all the necessary structures and processes for an effective Board are established and functioning well. The Board had fulfilled its role and responsibilities and had discharged its accountability to the company and its shareholders and other stakeholders in an exemplary manner.
The Chairman is appointed annually by the Board which, with the assistance of the Nominating and Governance Committee, carried out a rigorous review of the Chairman’s performance and independence during 2016. The Board concluded that there were no factors that impaired his independence and appointed the Chair for another year.
The performance of the Company Secretary was evaluated by the Board. The Board was satisfied with his competence, qualifications, experience and maintaining an arms-length relationship with the Board.
SUCCESSION MANAGEMENT
At Sibanye, succession planning is based on the strategic direction of the company, business requirements and readiness of the candidate.
Sibanye favours an integrated approach to succession management. For this reason, a phased approach to succession planning was adopted, starting with evaluations of the executive vice presidents followed by evaluations of senior vice presidents.
Following these evaluations, critical roles were identified and the competencies required for executive positions finalised. These were then incorporated into the Sibanye Leadership Development Framework.
Assessments to identify potential, readiness and development areas have been completed for all executive vice presidents, senior vice presidents and vice presidents.
ROTATION AND RETIREMENT FROM THE BOARD
In accordance with the MOI, one third of the directors shall retire from office at each Annual General Meeting (AGM). The first to retire are those directors appointed as additional members of the Board, followed by the longest-serving members. The Board, assisted by the Nominating and Governance Committee, can recommend the eligibility of retiring directors (subject to availability and their contribution to the business) for re-appointment. Retiring directors can be immediately re-elected by the shareholders at the AGM.
Chris Chadwick, Robert Chan, Tim Cumming, Charl Keyter and Sello Moloko retire by rotation at the upcoming AGM to be held on 23 May 2017, and have indicated that they are available for election or re-election
Barry Davison, Neal Froneman, Rick Menell, Keith Rayner and Jerry Vilakazi retire by rotation in 2018.
REMUNERATION
The Board obtains independent advice before making recommendations to shareholders for the remuneration of non-executive directors. The remuneration is paid in accordance with a special resolution approved by the shareholders within the previous two years.
Non-executive directors only receive remuneration due to them as members of the Board. Directors serving on Board sub-committees receive additional remuneration. For details of the directors’ remuneration packages as well as those of the prescribed officers, see Annual financial statements–Notes to the consolidated financial statements–Note 32: Related-party transactions.
BOARD OF DIRECTORS’ CHARTER
In 2016, the Board reviewed and re-assessed the adequacy of the Charter. This document compels directors to promote the vision of the Group, while upholding sound principles of corporate governance. Directors’ responsibilities under the Charter include:
| · | | determining the Group’s Code of Ethics and conducting the Group’s affairs in a professional manner, upholding the core values of integrity, transparency and enterprise; |
| · | | evaluating, determining and ensuring the implementation of corporate strategy and policy; |
| · | | determining compensation, development, skills development and other relevant policies for employees; |
| · | | developing and setting best-practice disclosure and reporting practices that meet the needs of all stakeholders; |
| · | | authorising and controlling capital expenditure and reviewing investment capital and funding proposals; |
| · | | constantly updating the risk management systems, including setting management expenditure authorisation levels and exposure limit guidelines; and |
| · | | reviewing executive succession planning and endorsing senior executive appointments, organisational changes and general remuneration policies. |
In this regard, the Board is guided by the Audit Committee, the Risk Committee, the Nominating and Governance Committee, the Remuneration Committee, and Safety, Health and Sustainable Development Committee.
The Board considers that this annual financial report and associated reports comply in all material respects with the relevant statutory requirements of the various regulations governing disclosure and reporting by Sibanye; and that the consolidated financial statements
| |
Sibanye Annual Financial Report 2016 | 97 |
comply in all material respects with IFRS, the SAICA Financial Reporting Guides issued by the Accounting Practices Committee and Financial Reporting Pronouncements issued by the Financial Reporting Standards Council, the Companies Act and the JSE Listings Requirements. As such, the Board has approved the content of the annual financial report, including the consolidated financial statements on 30 March 2017.
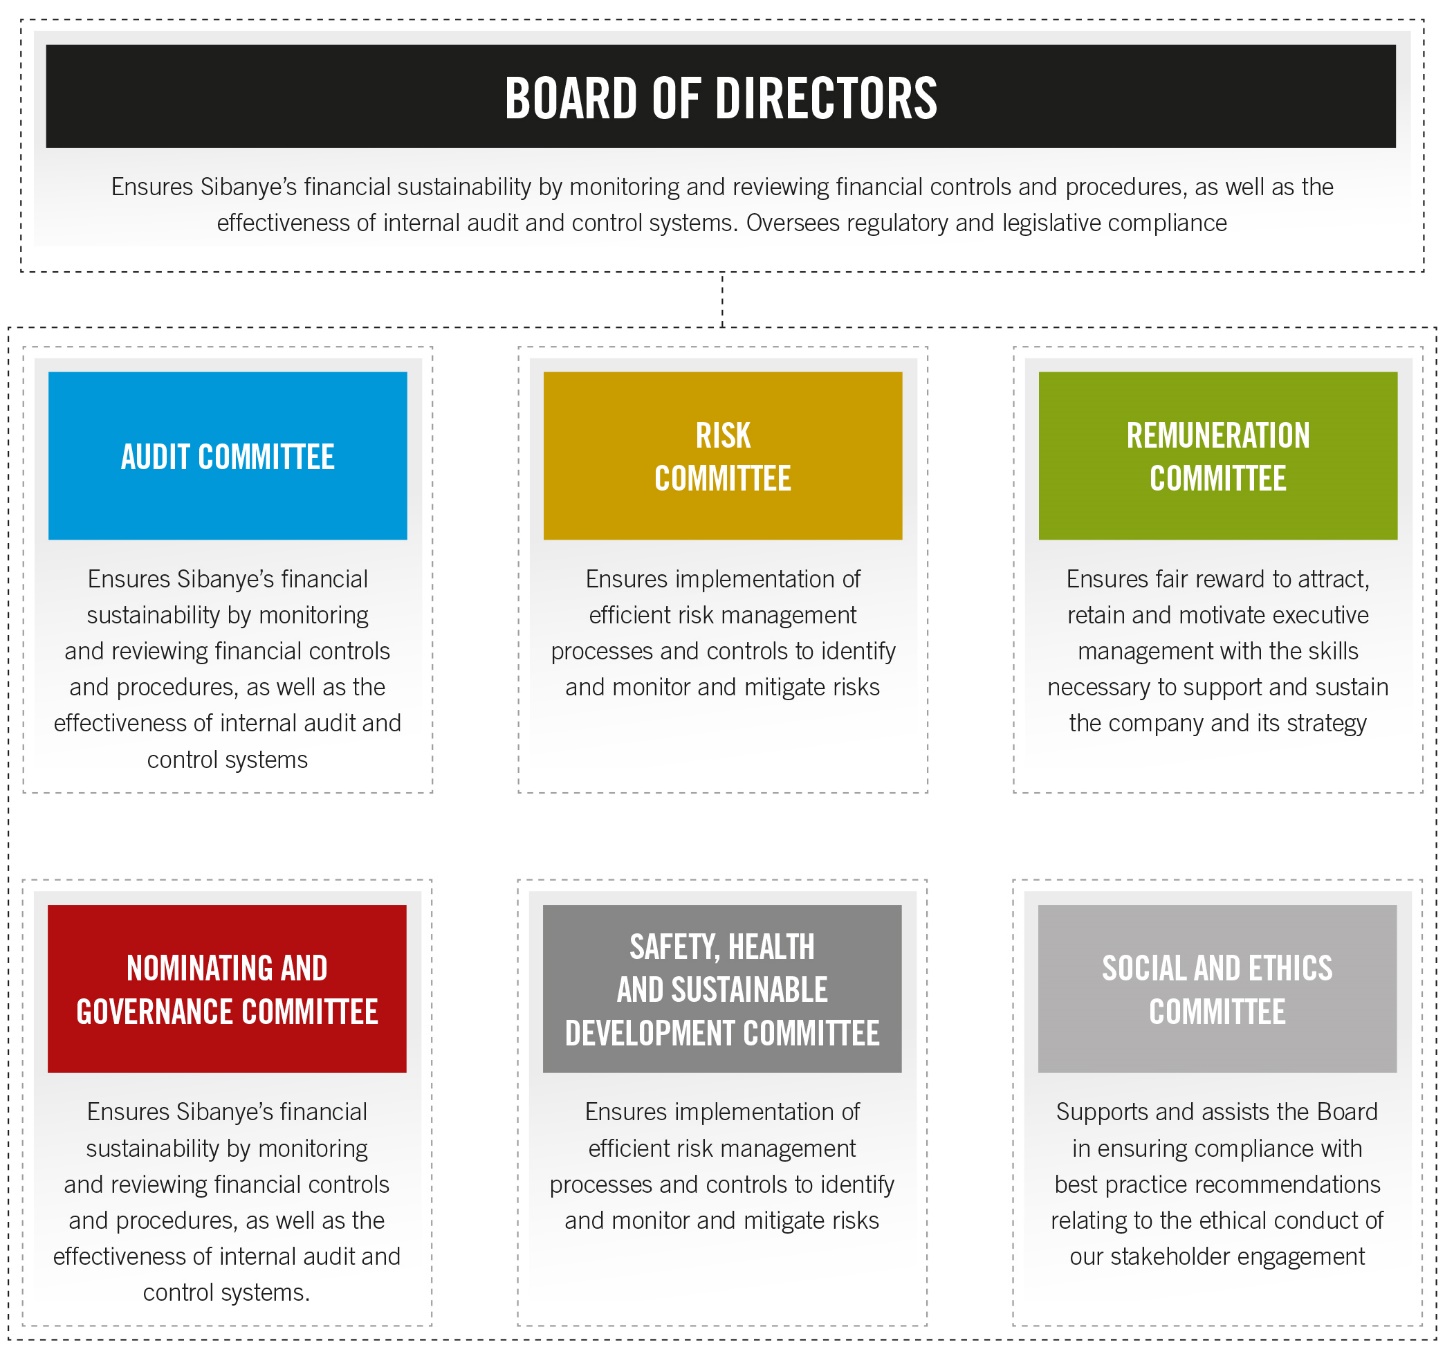
BOARD SUB-COMMITTEES
The Board has formed the following committees in compliance with good corporate governance:
| · | | Nominating and Governance Committee; |
| · | | Safety, Health and Sustainable Development Committee; and |
| · | | Social and Ethics Committee (to comply with the statutory requirements of the Companies Act). |
All these committees are composed of a majority of independent non-executive directors except for Risk Committee of which Chris Chadwick, Robert Chan and Jiyu Yuan are also members. All these committees are exclusively composed of non-executive directors except the Safety, Health and Sustainable Development Committee of which the CEO is also a member. The committees are all chaired by an independent non-executive director and operate in accordance with written terms of reference which have been approved by the Board.
| |
Sibanye Annual Financial Report 2016 | 98 |
AUDIT COMMITTEE
This committee monitors and reviews Sibanye’s accounting controls and procedures, including the effectiveness of its information systems and other systems of internal control; the effectiveness of the internal audit function; reports of both external and internal auditors; interim reports, the annual report on SEC Form 20-F, the consolidated annual financial statements; the accounting policies of Sibanye and any proposed revisions thereto; external audit findings and reports, and the approval thereof; and compliance with applicable legislation and requirements of regulatory authorities and Sibanye’s Code of Ethics.
The CFO’s expertise was evaluated by the Audit Committee. The committee was satisfied that the incumbent has the appropriate expertise and experience to carry out his duties as the financial director of the Group and that he was supported by qualified competent senior staff.
The committee reviewed and assessed the independence of the external auditors, including their confirmation in writing that the criteria for independence as set out in the rules of the Independent Regulatory Board for Auditors and international bodies have been followed. The committee is satisfied that KPMG Inc. is independent of the Group and is accredited by the JSE.
Sibanye’s CFO and internal and external auditors as well as senior management attend all the Audit Committee meetings and have unrestricted access to the Chairman of this committee. The Audit Committee, in turn, communicates freely with other members of the Board not serving as members of the Audit Committee. To perform its functions effectively, the Audit Committee meets at least quarterly, but more frequently if required.
The Sarbanes-Oxley Act requires the Board to identify an audit committee financial expert from within its ranks or to determine that the Audit Committee does not have a financial expert. The Board has resolved that the committee’s Chair, Keith Rayner, is the Audit Committee’s financial expert. Further, the Board of Directors believes that the members of the Audit Committee collectively possess the knowledge and experience to oversee and assess the performance of Sibanye’s management and auditors, the quality of Sibanye’s disclosure controls, the preparation and evaluation of Sibanye’s financial statements and Sibanye’s financial reporting. Sibanye’s Board of Directors also believes that the members of the Audit Committee collectively possess the understanding of audit committee functions necessary to diligently execute their responsibilities.
Membership and attendance of the Audit Committee
| | | Date |
| | | 22/2 | 10/3 | 23/5 | 22/8 | 7/11 |
Keith Rayner (Chairman) | | | | x | x | x | x | x |
Rick Menell | | | | x | x | x | x | x |
Nkosemntu Nika | | | | x | x | x | x | x |
Sue van der Merwe | | | | x | x | x | x | x |
KEY FOCUS AREAS IN 2016
| · | | Interim and annual financial reporting |
| · | | Acquisitions – integration, synergies and assessing related risks |
| · | | IT issues – integration of platinum assets, cyber security |
| · | | JSE proactive monitoring process relating to financial reporting |
| · | | Internal control environment and systems, and controls over financial reporting |
| · | | New regulatory developments |
Report back
The Audit Committee is responsible for governance and internal controls. It routinely focuses on financial and operating updates, the internal audit report, IT governance, quarterly crime reports and controls over financial reporting attestation status reports. All reports from the Group external auditor are also presented to the Audit Committee. The Audit Committee is also mandated by the Board to approve the Integrated Annual Report and the Annual Financial Statements. In 2016 the focus was on the successful integration into the company of those mining operations acquired during the year, particularly as related to governance.
The Audit Committee was also involved in the management of risks related to the security of information and approved the Combined Assurance guideline report.
The Audit Committee also evaluated and noted its approval of the CFO’s performance.
RISK COMMITTEE
This committee is responsible for ensuring that management implements appropriate risk management processes and controls. The total process of risk management, which includes the related systems of internal control, is the responsibility of the Board. Management is accountable to the Board for designing, implementing and monitoring an integrated process of risk management into the daily activities of Sibanye. The Board, through the Risk Committee, ensures that management implements appropriate risk management processes and controls. The responsibilities of the committee include:
| |
Sibanye Annual Financial Report 2016 | 99 |
| · | | reviewing the effectiveness and efficiency of the Enterprise Risk Management system within the Company and being assured that material risks are identified and that appropriate risk management processes are in place, including the formulation and subsequent updating of appropriate Company policies; |
| · | | reviewing the adequacy of the risk management charter, policy and plan; |
| · | | reviewing the parameters of the Company’s risk/reward strategy, in terms of the risk appetite and tolerance relative to reward and ensuring that risks are quantified where practicable; |
| · | | regularly receiving a register of the Company’s key risks and potential material risk exposures from management, reviewing and approving mitigations strategies, and reporting to the Board any material changes and/or divergence to the risk profile of the Company; |
| · | | monitoring the implementation of operational and corporate risk management plans; |
| · | | reviewing the insurance and other risk transfer arrangements, and considering whether appropriate coverage is in place; |
| · | | reviewing the business contingency planning process within the Group and being assured that material risks are identified and that appropriate contingency plans are in place; |
| · | | conducting a formal risk assessment at least once a year, which should be continually reviewed, updated and applied; and |
| · | | ensuring that a combined assurance model is applied to provide a coordinated approach to assurance activities. |
MEMBERSHIP AND ATTENDANCE OF THE RISK COMMITTEE
| | |
| Date |
| 23/5 | 7/11 |
Rick Menell (Chairman) | x | x |
Chris Chadwick | x | x |
Robert Chan | x | x |
Tim Cumming | x | x |
Keith Rayner | x | x |
Jiyu Yuan | x | – |
KEY FOCUS AREAS IN 2016
| · | | Enterprise risk management |
| · | | Combined assurance framework |
| · | | Assessment of risk management effectiveness and maturity review |
REPORT BACK
The Risk Committee approved the risk management policy, risk framework, risk committee charter and the risk plan. Having assessed the risk of cyber intrusions in particular, the committee concluded that the risk was low. A dedicated resource was appointed to manage cyber risk full time.
The committee also approved the business continuity plan, as well as the enterprise risk management and the biannual strategic risk register. The top 10 risks to the company and mitigation actions were reviewed in detail, together with the Sibanye’s risk tolerance and risk appetite levels.
In addition, the Risk Committee ensured that the Company complied with all applicable legislative requirements and approved the combined assurance approach as well as insurance cover for the business.
NOMINATING AND GOVERNANCE COMMITTEE
This committee is responsible for ensuring that new directors undergo an appropriate induction process; recommending to the Board the need for Board participation in continuing education programmes; identifying and recommending to the Board successors to the Chairman and CEO; developing the approach of Sibanye to matters of corporate governance; and making recommendations to the Board concerning such matters.
| |
Sibanye Annual Financial Report 2016 | 100 |
MEMBERSHIP AND ATTENDANCE OF THE NOMINATING AND GOVERNANCE COMMITTEE
| | | | |
| Date |
22/2 | 23/5 | 22/8 | 7/11 |
Sello Moloko (Chairman) | x | x | x | x |
Barry Davison | x | x | x | x |
Rick Menell | x | x | x | x |
Nkosemntu Nika | x | x | x | x |
Jerry Vilakazi | x | x | x | x |
KEY FOCUS AREAS IN 2016
| · | | Leadership development and succession planning |
| · | | Gender diversity on the board |
| · | | Board and sub-committee effectiveness assessments |
REPORT BACK
The Nominating and Governance Committee focussed on leadership development and management succession planning. The committee determined that critical roles had been identified and that the competencies required for executive positions had been finalised and incorporated into the Leadership Development Framework. Assessments to identify potential, readiness and development areas were completed for all executive vice presidents, senior vice presidents and vice presidents.
Having identified the need for gender diversity at Board level, the CVs of possible candidates identified were reviewed.
The committee also appointed an external consultant to assess the Board and evaluate its performance. It was determined that all the necessary structures and processes for an effective board were established and were functioning well, and that the Board had fulfilled its role and responsibilities, and discharged its accountability to the Company and its shareholders and other stakeholders, in an exemplary manner.
The committee also reviewed the fees paid to non-executive directors as well as the re-election of committee members.
REMUNERATION COMMITTEE
This committee is responsible for determining Sibanye’s remuneration policy and the practices needed to attract, retain and motivate high-performing executives who are demonstrably aligned with Sibanye’s corporate objectives and business strategy; and for ensuring that remuneration levels relative to other comparable companies are pitched at the desired level taking relative performance into account. The Remuneration Committee also reviews, on behalf of the Board, both the remuneration levels of senior executives and management share-incentive schemes and the related performance criteria and measurements. To perform these functions the Remuneration Committee meets quarterly, or more frequently if required.
MEMBERSHIP AND ATTENDANCE OF THE REMUNERATION COMMITTEE
| Date |
| 22/2 | 23/5 | 22/8 | 7/11 |
Tim Cumming (Chairman) | | x | x | x | x |
Barry Davison | | x | x | x | x |
Sello Moloko | | x | x | x | x |
Nkosemntu Nika | | x | x | x | x |
Keith Rayner | | x | x | x | x |
KEY FOCUS AREAS IN 2016
| · | | Executive changes in the Platinum Division |
| · | | Incorporation of the Platinum Division into the 2016 incentive target framework |
REPORT BACK
The Remuneration Committee assessed revisions to the share plan implementation arrangements. It also approved the incorporation of the Platinum Division into the incentive framework as well as the annual incentive scheme.
SAFETY, HEALTH AND SUSTAINABLE DEVELOPMENT COMMITTEE
This committee reviews adherence to occupational health, safety and environmental standards by Sibanye. The committee seeks to minimise mining-related accidents, to ensure that Sibanye’s operations are in compliance with all environmental regulations and to establish policy in respect of HIV/Aids and health matters.
| |
Sibanye Annual Financial Report 2016 | 101 |
MEMBERSHIP AND ATTENDANCE OF THE SAFETY, HEALTH AND SUSTAINABLE DEVELOPMENT COMMITTEE
| Date |
22/2 | 23/5 | 22/8 | 7/11 |
Barry Davison (Chairman) | x | x | x | x |
Chris Chadwick | x | x | x | x |
Neal Froneman | x | x | x | x |
Rick Menell | x | x | x | x |
Sello Moloko | x | x | x | x |
Sue van der Merwe | x | x | x | x |
KEY FOCUS AREAS IN 2016
| · | | Launch of re-invigorated safety campaign |
| · | | Revamped safety initiatives |
| · | | New regulations (safety, health, environment and social) and compliance with standards |
REPORT BACK
The committee reviewed Sibanye’s safety strategy and the inclusion of safety as a value in Sibanye’s CARE values which was subsequently amended to CARES. The committee focussed on safety performance and the actions necessary to ensure this improved, as well as reviewing all fatal accidents and the actions implemented to prevent their recurrence.
The committee also reviewed Sibanye’s health and wellbeing policies as well as our approach to sustainable development, including environmental and social and community issues.
The committee commended Sibanye on all its efforts to improve safety - the changes in management, its commitment to safety through visible felt leadership, and the safety launches at all operations to engender renewed commitment from employees and organised labour.
SOCIAL AND ETHICS COMMITTEE
This committee is responsible for discharging its statutorily imposed duties as outlined in section 72 of the Companies Act and the applicable regulations, which include monitoring Sibanye’s activities in relation to relevant legislation, other legal requirements and prevailing codes of best practice regarding:
| · | | social and economic development; |
| · | | good corporate citizenship; |
| · | | the environment, health and public safety and the impact on Sibanye’s activities, products and services; |
| · | | labour and employment legislation. |
The Social and Ethics Committee must bring any matters relating to this monitoring to the attention of the Board and report to shareholders at the AGM. The Board seeks the assistance of the Social and Ethics Committee in ensuring that Sibanye complies with best practice recommendations in respect of social and ethical management.
MEMBERSHIP AND ATTENDANCE OF THE SOCIAL AND ETHICS COMMITTEE
| | | | |
| Date |
| 22/2 | 23/5 | 22/8 | 7/11 |
Jerry Vilakazi (Chairman) | x | x | x | x |
Robert Chan | x | x | x | x |
Tim Cumming | x | x | x | x |
Barry Davison | x | x | x | x |
Rick Menell | x | x | x | x |
Sello Moloko | x | x | – | x |
Keith Rayner | x | x | x | x |
| |
Sibanye Annual Financial Report 2016 | 102 |
KEY FOCUS AREAS IN 2016
| · | | United Nations Global Compact (UNGC) principles |
| · | | International Council on Mining and Metals (ICMM) principles |
REPORT BACK
The Social and Ethics Committee reviewed progress of new employment equity plans and Sibanye’s compliance with the UNGC principles, human rights requirements, the International Labour Organization and contributions to employee education development.
The fraud response plan was approved. Other matters on the committee’s agenda were compliance with the Consumer Protection Act and Sibanye’s continued commitment to facilitating and encouraging responsible material and product stewardship. The focus was on re-using and recycling to reduce waste disposal and incorporating supply chain aspects in so doing.
The committee also assessed Sibanye’s compliance with its Social and Labour Plans, and the Mining Charter scorecard.
CODE OF ETHICS
Sibanye is committed to the conduct of its business in an ethical and fair manner, to the promotion of a corporate culture which is non-sectarian and apolitical and which is socially and environmentally responsible. This is achieved by living Sibanye’s core values which are: commitment, accountability, respect, enabling and safety.
In pursuing these principles, Sibanye requires its employees, officers and directors alike to adhere to and be bound by the Sibanye Code of Ethics. The Audit Committee is responsible for ensuring compliance with the Code of Ethics, which was rolled out to employees in the Platinum Division during 2016.
Breaches of the Code of Ethics will result in disciplinary action, which could result in the termination of employment or office or criminal prosecution. The Code of Ethics can be found on the corporate website: www.sibanyegold.co.za.
TRANSITION TO KING IV
The next iteration of the South African Corporate Governance Code, King IV™ was issued in November 2016. King IV™ involves the application of 16 core principles as opposed to the 75 principles in King III. Furthermore, its recommendations on corporate governance are more focused and practical with increased emphasis on the outputs and outcomes of governance structures. Sibanye welcomes the enhancements in the code and is fully committed to applying King IV™ in all respects for application in the relevant financial year, after guidance on its adoption is issued by the JSE. We have started work on understanding the new application and reporting requirements, and will implement the necessary internal processes and reporting systems to meet our 2018 King IV™ application and reporting commitments.
jse CORPORATE GOVERNANCE practices COMPARED with nyse LISTING standards
Sibanye’s corporate governance practices are regulated by the JSE Listings Requirements. The following is a summary of the significant ways in which South Africa’s corporate governance standards and Sibanye’s corporate governance practices differ from those followed by domestic companies under the NYSE Listing Standards.
The NYSE Listing Standards require that the non-management directors of US listed companies meet at regularly scheduled executive sessions without management. The JSE Listing Requirements do not require such meetings of listed company non-executive directors. Sibanye’s non-management directors meet regularly without management.
The NYSE Listing Standards require US listed companies to have a nominating/corporate governance committee composed entirely of independent directors. The JSE Listings Requirements do not require the appointment of such a committee, however if such a committee is appointed it must stipulate that all members of this committee must be non-executive directors, the majority of whom must be independent and the chair must be the chair of the Board, if independent, or must be the lead independent director, if the Board chair is not independent. Sibanye has a Nominating and Governance Committee which is currently comprised of five non-executive directors, all of whom are independent under the JSE Listings Requirements and chaired by the Chairman of Sibanye, as required by the JSE Listings Requirements.
The NYSE Listing Standards require US listed companies to have a compensation committee composed entirely of independent directors. The JSE Listings Requirements merely require the appointment of such a committee. Sibanye has appointed a Remunerations (or Compensation) Committee, currently comprised of five board members, all of whom are independent under the JSE Listings Requirements.
The NYSE Listings Standards require US listed companies to have an audit committee composed entirely of independent directors. The Companies Act requires that the Audit Committee be approved by shareholders on an annual basis at a company’s AGM. The Companies Act and the JSE Listings Requirements also require an audit committee composed entirely of independent directors. Sibanye has appointed an Audit Committee, currently comprised of four board members, all of whom are independent non-executive, as defined under the Companies Act and the JSE Listings Requirements. One of these non-executive directors is also a non-executive director of Gold Fields, the former parent of Sibanye; however, Sibanye believes he satisfies the requirements of Rule 10A-3 under the US Securities Exchange Act of 1934 and applicable NYSE Listing Standards.
| |
Sibanye Annual Financial Report 2016 | 103 |
BOARD
Sibanye’s ability to deliver on its purpose, mission and strategic objectives is underpinned by the quality and expertise of its leadership. The Board of Directors provides sound, ethical leadership and strategic guidance and ensures that the principles of good corporate governance are the foundation of all that we do.
The Board of Directors is led by an independent, non-executive chairman. There are 13 members in all, the majority of whom are independent. Collectively, the directors have the breadth and depth of skills, knowledge and experience required to make a positive contribution to ensuring that Sibanye delivers on its strategic goals.
CHAIRMAN and independent non-executive DIRECTOR
SELLO MOLOKO (51)
BSc (Hons) and Postgraduate Certificate in Education, University of Leicester
Advanced Management Programme, University of Pennsylvania Wharton School
Sello Moloko was appointed non-executive Chairman on 1 January 2013. Sello is a founder and the executive Chairman of the Thesele Group Proprietary Limited and Chairman of Alexander Forbes Group Holdings Limited. He has an established career in financial services, including periods as an executive director at Brait Asset Managers as well as CEO of Old Mutual Asset Managers until 2004. Prior to Sibanye, he served as a director of several listed companies including Gold Fields from February 2011 to December 2012. He is a trustee of the Nelson Mandela Foundation. Sello’s other directorships include Sycom Property Fund Managers Limited and Acucap Properties Limited.
executive DIRECTORS
NEAL FRONEMAN (57)
Chief Executive Officer and Chairman of the Executive Committee
BSc Mech Eng (Ind Opt), University of the Witwatersrand
BCompt, University of South Africa
PrEng
Neal Froneman was appointed executive director and CEO of Sibanye on 1 January 2013. His career in technical, operations management and corporate development positions spans more than 30 years during which time he worked at Gold Fields of South Africa Limited, Harmony Gold Mining Company Limited (Harmony) and JCI Limited. In April 2003, Neal was appointed CEO of Aflease Gold Limited (Aflease Gold), which, through a series of reverse take-overs, became Gold One International Limited (Gold One) in May 2009. He was primarily responsible for the creation of Uranium One Incorporated (Uranium One) from the Aflease Gold uranium assets. During this period, he was CEO of Aflease Gold and Uranium One until his resignation from Uranium One in February 2008. He held the CEO position at Gold One until his appointment at Sibanye. He is also a non-executive director of 17 Perissa Proprietary Limited, Delview Three Proprietary Limited, Forestry Services Proprietary Limited and Ultimate Marine Ventures Limited. In May 2016, he was elected to serve as a Vice President of the Chamber of Mines of South Africa (Chamber of Mines).
CHARL KEYTER (43)
Chief Financial Officer
BCom, University of Johannesburg
MBA, North-West University
ACMA and CGMA
Charl Keyter was appointed a director on 9 November 2012, and executive director and CFO on 1 January 2013. Previously, he was Vice President and Group Head of International Finance at Gold Fields. Charl has more than 20 years’ mining experience, having begun his career at Gold Fields in February 1995. He is also a non-executive director of Oil Recovery and Maintenance Services Proprietary Limited.
Non-independent non-executive DIRECTORS
CHRISTOPHER CHADWICK (48)
BCompt (Hons) (CTA), University of South Africa
CA(SA)
Christopher (Chris) Chadwick was appointed as a non-executive director on 16 May 2014. Having completed his articles at Deloitte Touche Tohmatsu Limited in 1991, the earlier part of his career was spent with Comair Limited, the largest privately owned airline in South Africa, where he assisted in growing the company tenfold over a period of four years. After financial executive roles in the advertising, fast-moving consumer goods and services industries, Christopher moved into the information technology industry where he assumed financial and strategic directorships for five years. He spent another four years at an investment holding group where he was involved in corporate development and finance across many different sectors. Christopher joined Gold One in July 2008 as a director, having been closely involved in the creation of Gold One through the reverse take-over of Australian-listed BMA Gold Limited.
| |
Sibanye Annual Financial Report 2016 | 104 |
ROBERT Tze Leung CHAN (70)
BSc (Economics) (Hons), University of London
MBA, University of Liverpool
Robert Chan was appointed as a non-executive director on 16 May 2014. He is an experienced banker with over 39 years’ experience in commercial and investment banking, having worked in London, Malaysia and Singapore. He retired from the United Overseas Bank Limited (United Overseas Bank) on 31 December 2011 after 35 years’ service (25 years as CEO of United Overseas Bank, Hong Kong). Robert has served as an independent non-executive director of Noble Group Limited since 1996. He is an independent non-executive director of Hutchison Port Holdings Trustees Pte Limited, Trustee Manager of Hutchison Port Holdings Trust, a business trust listed in Singapore, as well as Quam Limited, which is listed in Hong Kong. He is currently non-executive Chairman of The Hour Glass (HK) Limited. He is also a Fellow of the Hong Kong Institute of Directors.
JIYA YUAN (55)
Mining Engineering, Xi’an University of Architecture and Technology
Jiyu Yuan was appointed a non-executive director on 12 May 2015. He has 33 years of experience as a mining engineer in China and Peru. He is currently a director of Gold One and a general manager of Shouxin Peru Mine Company Limited. Previously, Jiyu served as a general manager at Xinjiang Mine Development Limited of Baiyin Nonferrous Group Company Limited (Baiyin), General Manager, at Changba Lead and Zinc Mine of Baiyin, Director in the Mine Department of Baiyin and Senior Engineer at Northwest Research Institute of Mining and Metallurgy.
independent non-executive DIRECTORS
TIMOTHY CUMMING (59)
BSc (Hons) (Engineering), University of Cape Town
BA (PPE)
MA (Oxford)
Timothy (Tim) Cumming was appointed as a non-executive director on 21 February 2013. He is the founder and executive director of Scatterlinks Proprietary Limited, a South African-based company providing mentoring and coaching services to senior business executives as well as leadership and strategic advisory services to companies. He was previously involved with the Old Mutual Group in various capacities: CEO of Old Mutual Investment Group (South Africa) Proprietary Limited; Executive Vice President: Director of Global Business Development of Old Mutual Asset Management for Old Mutual (US) Holdings Inc; Managing Director: Head of Corporate Segment at Old Mutual (South Africa); Strategy Director of Old Mutual Emerging Markets and Interim CEO of Old Mutual Investment Group (South Africa). He was also executive director and Head of Investment Research (Africa) for HSBC Securities (Africa), General Manager at Allan Gray Limited and independent non-executive director of Nedgroup Investments Limited. Tim started his career as an engineer and management trainee at the Anglo American Corporation of South Africa Limited (Anglo American). He worked on a number of diamond mines and was Resident Engineer at Anglo American’s gold mines in Welkom, South Africa. He is also a trustee of the Woodside Endowment Trust and chairs the Investment Committee of the Mandela Rhodes Foundation.
BARRY DAVISON (71)
BA (Law and Economics), University of the Witwatersrand
Graduate Commerce Diploma, Birmingham University
CIS Diploma in Advanced Financial Management and Advanced Executive Programme, University of South Africa
Barry Davison was appointed as a non-executive director on 21 February 2013. He has more than 40 years’ experience in the mining industry and served as Executive Chairman of Anglo American Platinum, Chairman of Anglo American’s Platinum Division, and Ferrous Metals and Industries Division, and was an executive director of Anglo American. He has been a director of a number of listed companies, including Nedbank Group Limited, Kumba Resources Limited, Samancor Limited and the Tongaat-Hulett Group Limited.
RICHARD MENELL (61)
BA (Hons), MA (Natural Sciences, Geology), Trinity College, University of Cambridge
MSc (Mineral Exploration and Management), Stanford University
Richard (Rick) Menell was appointed as a non-executive director on 1 January 2013. He has over 35 years’ experience in the mining industry and has been a director of Gold Fields since 8 October 2008. Previously, he occupied the positions of President and Member of the Chamber of Mines; President and CEO of TEAL Exploration & Mining Inc; Chairman of Anglovaal Mining Limited and Avgold Limited; Chairman of Bateman Engineering Proprietary Limited; Deputy Chairman of Harmony and of African Rainbow Minerals Limited. He has also been a director of Telkom Group Limited, Standard Bank of South Africa Limited, and Mutual and Federal Insurance Company Limited. He is currently a non-executive director and Chairman of Credit Suisse Securities Johannesburg Proprietary Limited, and non-executive director
| |
Sibanye Annual Financial Report 2016 | 105 |
of Gold Fields and The Weir Group plc. Rick is a trustee of the Carrick Foundation. He is co-Chairman of the City Year South Africa Citizen Service Organisation, and Chairman and trustee of the Palaeontological Scientific Trust.
NKOSEMNTU NIKA (58)
BCom, University of Fort Hare
BCompt (Hons), University of South Africa
Advanced Management Programme, INSEAD
CA(SA)
Nkosemntu Nika was appointed as a non-executive director on 21 February 2013. He is currently an independent non-executive director of Scaw South Africa Proprietary Limited and Chairman of the Audit and Risk Committee of Foskor Proprietary Limited. He also serves as non-executive director of Trollope Mining Services Proprietary Limited and Coega Dairies Proprietary Limited, and executive chairman of Mavala Holdings Proprietary Limited. He was previously CFO and Finance Director of PetroSA (SOC) Limited (PetroSA) and Executive Manager: Finance at the Development Bank of Southern Africa. He has held various internal auditing positions at Eskom Holdings (SOC) Limited, Shell Company of South Africa Limited (Shell) and Anglo American. He was also a non-executive Board member of the Industrial Development Corporation of South Africa Limited and chaired its Audit and Risk Committee and Governance and Ethics Committee.
KEITH RAYNER (60)
BCom, Rhodes University
CTA
CA(SA)
Keith Rayner was appointed as a non-executive director on 1 January 2013. Keith is CEO of KAR Presentations, an advisory and presentation corporation specialising in corporate finance and regulatory advice and presentations covering, inter alia, the JSE Listings Requirements, Financial Markets Act, Companies Act, governance, takeover law, corporate action strategy, valuation theory and practice, IFRS and various directors’ courses. He is an independent non-executive director of Ecponent Limited, and a non-executive director of Nexus Intertrade Proprietary Limited, 2Quins Engineered Business Information Proprietary Limited, Sabi Gold Proprietary Limited, Keidav Properties Proprietary Limited and Appropriate Process Technologies Proprietary Limited. He is a member of the JSE Limited’s Issuer Regulation Advisory Committee, a fellow of the Institute of Directors in South Africa (IOD), a non-broking member of the Institute of Stockbrokers in South Africa and a member of the Investment Analysts Society. He is a past member of the SAMREC/SAMVAL working group, the Takeover Regulation Panel’s rewrite committee, the IOD’s CRISA committee and the South African Institute of Chartered Accountants Accounting Practices Committee.
SUSAN VAN DER MERWE (62)
BA, University of Cape Town
Susan (Sue) van der Merwe was appointed as a non-executive director on 21 February 2013. She served as a member of Parliament for 18 years until October 2013, and held various positions, including Deputy Minister of Foreign Affairs from 2004 to 2010. She is currently a member of the National Executive Committee of the African National Congress (ANC). She has participated in various civil society organisations and currently serves as a trustee and Chair of the Kay Mason Foundation, which is a non-profit organisation assisting disadvantaged scholars in Cape Town. Susan was appointed to the National Council of the South African Institute of International Affairs in 2014.
JERRY VILAKAZI (56)
BA, University of South Africa
MA, Thames Valley University
MA, University of London
MBA, California Coast University
Jerry Vilakazi was appointed a non-executive director on 1 January 2013. He is Chairman of Palama Investment Holdings Proprietary Limited, which he co-founded to facilitate investments in strategic sectors. He is a past CEO of Business Unity South Africa. Prior to this, he was Managing Director of the Black Management Forum. In 2009, Jerry was appointed to the Presidential Broad-based Black Economic Empowerment Advisory Council and, in 2010, he was appointed as a Commissioner of the National Planning Commission, and completed both terms in 2015. He was previously appointed Public Service Commissioner in 1999 and has played a critical role in shaping major public service policies in post-1994 South Africa. Jerry was Chairman of the Mpumalanga Gambling Board from 2006 to 2015 and the State Information Technology Agency (SOC) Proprietary Limited until end of the term in 2015. He previously held the position of Chairman of Netcare Limited and holds non-executive directorships in Blue Label Telecoms Limited, Palama Industrial and Saatchi & Saatchi SA. He is also a former non-executive director of Pretoria Portland Cement Limited.
| |
Sibanye Annual Financial Report 2016 | 106 |
EXECUTIVE committee
The Executive Committee drives and oversees implementation of Sibanye’s strategy. The committee has nine members, two of whom are executive directors and meets on a regular basis to discuss and make decisions on the strategic and operating issues facing Sibanye.
ORGANISATIONAL RESTRUCTURING
With effect from 1 January 2016, Sibanye revised its organisational structure in order to ensure that it is optimally positioned for its entry into the PGM mining sector in 2016.
Sibanye has re-structured into two separate, commodity-specific divisions – the Gold Division and the Platinum Division – that focus on operational delivery. Sibanye’s Group Services functions provide all non-core, production support services required by the two operating divisions, thereby eliminating any duplication of support and management services so as to achieve cost and efficiency advantages.
The internal restructuring will ensure a sustained focus on the delivery of safe, cost-effective production as Sibanye diversifies and transforms into a multi-commodity business, while striving to minimise operational disruptions. The restructuring also allows for operations management to be positioned closer to the mining face so as to promote operational effectiveness.
As at the end of the year, 31 December 2016, Sibanye was structured as follows:
Gold Division
The structure of this division is mostly unchanged. Wayne Robinson remains the CEO of the Gold Division. The executive management team supporting Wayne, is Adam Mutshinya as Senior Vice President: Human Capital, Pieter Henning, formerly Vice President: Finance, appointed as Senior Vice President: Finance for the division and Corne Strydom, formerly Vice President: Driefontein, appointed as Senior Vice President: Organisational Effectiveness.
Platinum Division
The Platinum Division’s executive management team is aligned with that of the Gold Division. Robert van Niekerk, previously Executive Vice President: Organisational Effectiveness at Sibanye, is CEO of the Platinum Division, with Bheki Khumalo appointed as Senior Vice President: Human Capital, Dawie van Aswegen appointed as Senior Vice President: Technical Services and Kevin Robertson appointed as Senior Vice President: Organisational Effectiveness. This follows the appointment, in 2015, of Justin Froneman as Senior Vice President: Finance and Shadwick Bessit, previously Senior Vice President: Underground Operations, Kloof and Driefontein, as Senior Vice President: Mining.
Group executive
At a group-level, the Executive Committee oversees implementation of and drives Sibanye’s strategy. This committee is headed up by the CEO, Neal Froneman, and comprise executive director Charl Keyter (CFO) and prescribed officers Hartley Dikgale (General Counsel and Regulatory Affairs), Dawie Mostert (Commercial Services), Themba Nkosi (Human Capital), Wayne Robinson (Gold and Uranium Division), Richard Stewart (Business Development), Robert van Niekerk (Platinum Division) and John Wallington (Corporate Affairs and Sustainability). The Executive Committee is complemented by members of the CEO’s Office, which houses key strategic functions including Protection Services (Nash Lutchman), Investor Relations (James Wellsted) and Strategy (George Ashworth).
Sibanye’s revised leadership structures aims to facilitate the seamless transition of Sibanye into a multi-commodity business, and in particular to facilitate the effective integration of the Rustenburg and Aquarius operations into the Platinum Division.
At 28 March 2017, the membership of Sibanye’s Executive Committee is as follows:
| |
Membership of the Executive Committee | |
Neal Froneman (CEO) | Wayne Robinson |
Charl Keyter (CFO) | Richard Stewart |
Hartley Dikgale | Robert van Niekerk |
Dawie Mostert | John Wallington2 |
Themba Nkosi1 | |
1 Appointed as a prescribed officer on 4 July 2016.
2 Appointed as a prescribed officer on 1 February 2016.
HARTLEY DIKGALE (56)
Executive Vice President: General Counsel and Regulatory Affairs
BIuris, University of the North
LLB, HDip (Company Law), University of the Witwatersrand
LLM, Vista University
Hartley Dikgale is an admitted advocate of the High Court of South Africa and has more than 30 years of corporate experience as a business executive. He has served on more than 20 boards of directors of listed and unlisted companies. He was introduced to the mining sector in 2004 when he was appointed to the Board of Pamodzi Gold Limited as a non-executive director. He has worked for, among others, Sanlam Limited, Old Mutual, the Independent Communications Authority of South Africa, Rand Water Board and Pamodzi Investment
| |
Sibanye Annual Financial Report 2016 | 107 |
Holdings Proprietary Limited. In recent years (from 2010 to 2012), Hartley has worked for Rand Uranium Proprietary Limited (Rand Uranium) in an executive capacity as Senior Vice President: General Counsel. When Gold One acquired Rand Uranium, Hartley joined Gold One as Senior Vice President: General Counsel from 2012 to 2013. Hartley joined Sibanye in May 2013 where he served in a similar capacity until he was recently appointed as the Executive Vice President: General Counsel and Regulatory Affairs.
DAWIE MOSTERT (47)
Executive Vice President: Commercial Services
Diploma in Labour Relations
MDP (Adv Labour Law)
MBA, University of South Africa
Dawie Mostert, who has more than 20 years’ experience in the mining industry, was appointed on 1 January 2013 as Senior Vice President: Organisational Effectiveness, focused on introducing new operating and business models in support and directing the turnaround at Sibanye. With Sibanye adopting value creation as its strategic intent and consequently entering PGM mining sector, he accepted the position and role as Executive Vice President: Commercial Services. Prior to joining Sibanye, he served as Vice President: Commercial Services at Gold One in 2012 and Vice President: Human Capital at Great Basin Gold from 2006 to 2012. Prior to joining Great Basin Gold in 2006, he was Executive: Organisational Development and Employee Relations at Harmony from 2002 to 2006. Dawie joined Harmony in 1996 as part of the acquisition transformational team and was appointed Mine Manager at the then Elandsrand mine from 2001 to 2002.
THEMBA NKOSI (43)
Executive Vice President: Human Capital
BA Hons (Employment Relations), University of Johannesburg
BTech, Human Resources – Peninsula Technikon
Human Resources Executive Program – University of Michigan
Themba Nkosi was appointed on 1 August 2016. He has more than 20 years’ experience in human resources, corporate affairs, communication and stakeholder engagement. Prior to joining Sibanye, he was Head: Human Resources, Transformation and Corporate Communications at ArcelorMittal from March 2015. He previously occupied several senior management positions at ArcelorMittal (from June 2009 to June 2016) and Human Resources Director for Sub-Saharan Africa at the PepsiCo Group (from April 2004 to March 2009).
WAYNE ROBINSON (54)
Divisional CEO: Gold and Uranium
BSc (Mechanical Engineering), University of Natal
BSc (Mining Engineering), University of the Witwatersrand
PrEng
South African Mine Manager’s Certificate of Competency (Metalliferous)
South African Mechanical Engineer’s Certificate of Competency
Wayne Robinson was appointed as Divisional CEO: Gold and Uranium after serving as Senior Vice President: Underground Operations – Beatrix and Cooke from June 2014. Wayne has worked in the South African gold and platinum mining sectors for more than 25 years with experience in underground mine management. Prior to joining Sibanye, he was the Executive Vice President of Cooke Operations and served on Gold One’s Executive Committee from 2012 to 2014. He held senior management positions at Eastern Platinum Limited from 2006 to 2012, at Richards Bay Minerals, from 2005 to 2006 and at Gold Fields, after qualifying as a mechanical and mining engineer.
| |
Sibanye Annual Financial Report 2016 | 108 |
RICHARD STEWART (41)
Executive Vice President: Business Development
BSc (Hons), PhD (Geology), University of the Witwatersrand
MBA, Warwick Business School (UK)
PrSciNat
Richard Stewart has over 17 years’ experience in South Africa’s geological and mining industries, and is a Fellow of the Geological Society of South Africa. Prior to joining Sibanye in 2014, he served on the Gold One Executive Committee (from August 2009 to April 2014) with the most recent appointment at Gold One as Executive Vice President: Technical Services and was also CEO of Goliath Gold Limited (from January 2013 to April 2014). Prior to that he held management positions at the Council for Scientific and Industrial Research Mining Technology division, Shango Solutions (where he remains a director), Uranium One and was an Investment Consultant for African Global Capital Proprietary Limited.
ROBERT VAN NIEKERK (52)
Divisional CEO: Platinum
National Higher Diploma (Metalliferous Mining), Technikon Witwatersrand
BSc (Mining Engineering), University of the Witwatersrand
South African Mine Manager’s Certificate of Competency
Robert van Niekerk was recently appointed to this position in November 2016 after serving as Executive Vice President: Organisational Effectiveness from January 2016 and Senior Vice President: Organisational Effectiveness from February 2013. Prior to joining Sibanye (in February 2013), he was the Senior Vice President and Group Technical Head of Mining at Gold Fields Limited from November 2011. He previously occupied several senior operational and executive management positions at Harmony Gold Mining Company Limited, Anglo American Platinum, Uranium One Incorporated and Gold One International Limited. Robert began his mining career in 1982 at Barlows as a Learner Official and progressed through the ranks at a number of South African underground and surface mining operations.
JOHN WALLINGTON (59)
Executive Vice President: Corporate Affairs and Sustainability
BSc (Mining Engineering), University of the Witwatersrand
South African Mine Manager’s Certificate of Competency
Senior Executive Management Programme, London School of Business
John Wallington was appointed to this position in February 2016. Prior to joining Sibanye, he served as the CEO of Coal of Africa and for Anglo American Coal. He has over 30 years’ experience in the coal exploration and mining industry.
| |
Sibanye Annual Financial Report 2016 | 109 |
The Audit Committee has formal terms of reference which are updated on an annual basis. The Board is satisfied that the Audit Committee has complied with these terms, and with its legal and regulatory responsibilities as set out in the Companies Act, King III and the JSE Listings Requirements.
The Audit Committee consisted of four independent non-executive directors throughout the financial year. For membership and attendance at meetings, see Accountability–Corporate governance report–Board sub-committees–Audit Committee.
The Board believes that the members collectively possess the knowledge and experience to supervise Sibanye’s financial management, internal and external auditors, the quality of Sibanye’s financial controls, the preparation and evaluation of Sibanye’s consolidated financial statements and Sibanye’s financial reporting.
The Board has established and maintains internal controls and procedures, which are reviewed on a regular basis. These are designed to manage the risk of business failures and to provide reasonable assurance against such failures. However, this is not a guarantee that such risks are eliminated.
It is the duty of the Audit Committee, inter alia, to monitor and review:
| · | | the effectiveness of the internal audit function; findings and the appointment of external auditors; reports of both internal and external auditors; |
| · | | evaluation of the performance of the CFO; |
| · | | the governance of information technology (IT) and the effectiveness of the Group’s information systems; |
| · | | interim and annual financial and operating reports, the consolidated annual financial statements and all other widely distributed financial documents; |
| · | | the Form 20‑F filing with the SEC; |
| · | | accounting policies of the Group and proposed revisions; |
| · | | compliance with applicable legislation, requirements of appropriate regulatory authorities and Sibanye’s Code of Ethics; |
| · | | the integrity of the annual financial report and associated reports (by ensuring that its content is reliable and recommending it to the Board for approval); and |
| · | | policies and procedures for preventing and detecting fraud. |
Internal and external auditors have unrestricted access to the Audit Committee, the Audit Committee Chairman and the Chairman of the Board, ensuring that auditors are able to maintain their independence. Both the internal and external auditors report at Audit Committee meetings. The Audit Committee also meets with both internal and external auditors separately without other invitees being present. Management may attend the Audit Committee meetings by invitation.
The Audit Committee is responsible for recommending the appointment of an independent firm of external auditors to the Board who will in turn recommend the appointment to the shareholders.
The Audit Committee is also responsible for determining that the designated appointee has the necessary independence, experience, qualifications and skills, and that audit and other fees are reviewed and approved.
The Audit Committee has reviewed and assessed the independence of the external auditor, and has confirmed in writing that the criteria for independence, as set out in the rules of the Independent Regulatory Board for Auditors and international bodies, have been followed. The Audit Committee is satisfied that KPMG Inc. is independent of the Group. The following aggregate audit, audit-related fees, tax fees and all other fees were billed by our external auditors (KPMG Inc.) for 2016, 2015 and 2014:
| | | | |
Figures in million - SA rand | | 2016 | 2015 | 2014 |
Audit fees1 | | 24.8 | 19.0 | 16.1 |
Audit-related fees2 | | 4.1 | 3.0 | 1.2 |
Tax fees3 | | 0.1 | 0.2 | – |
All other fees4 | | 8.9 | 0.8 | – |
Total | | 37.9 | 23.0 | 17.3 |
1 Audit fees consist of fees billed for the annual audit of Sibanye’s consolidated financial statements, audit of the Group’s internal controls over financial reporting in accordance with section 404 of the Sarbanes-Oxley Act and the audit of statutory financial statements of the Company’s subsidiaries, including fees billed for assurance and related services that are reasonably related to the performance of the audit or reviews of the Company’s financial statements that are services that only an external auditor can reasonably provide.
2 Audit-related fees consist of the review of documents filed with regulatory authorities, consultations concerning financial accounting and reporting standards, review of security controls and operational effectiveness of systems, and due diligence related to acquisitions.
3Tax fees include fees billed for tax compliance, tax advice, tax planning and other tax-related services.
4 All other fees consist of fees for all other services not included under audit fees, audit related fees or tax fees.
The Audit Committee determines the nature and extent of non-audit services that the firm can provide and pre-approves all permitted non-audit assignments by the Group’s independent auditor. In accordance with the SEC rules regarding auditor independence, the Audit Committee has established policies and procedures for audit and non-audit services provided by an independent auditor. The rules apply to Sibanye and its consolidated subsidiaries engaging any accounting firms for audit services and the auditor who audits the accounts filed with the SEC (the external auditor) for permissible non-audit services. When engaging the external auditor for permissible non-audit services (audit related services, tax services, and all other services), pre-approval is obtained prior to the commencement of the services.
The Audit Committee approves the annual audit plan presented by the external auditors and monitors progress against the plan. The audit plan provides the Audit Committee with the necessary assurance on risk management, internal control environments and IT governance. The Audit Committee recommends that KPMG Inc. is reappointed for the 2017 financial year with Jacques Erasmus as the designated group audit engagement partner.
| |
Sibanye Annual Financial Report 2016 | 110 |
The Audit Committee has satisfied itself that both KPMG Inc. and Jacques Erasmus are accredited in terms of the JSE Listings Requirements.
The internal control systems of the Group are monitored by internal auditors who report their findings and recommendations to the Audit Committee and to senior management. The Audit Committee determines the purpose, authority and responsibility of the internal audit function (Internal Audit) in an Internal Audit Charter. The internal audit function is headed by the Vice President: Internal Audit, who may be appointed or dismissed by the Audit Committee. The Audit Committee is satisfied that the incumbent Vice President: Internal Audit has the requisite skills and experience and that she is supported by a sufficient staff complement with appropriate skills and training.
Sibanye’s Internal Audit operates in accordance with the International Standards for the Professional Practice of Internal Auditing as prescribed by the Institute of Internal Auditors. The internal audit activities carried out during the year were identified through a combination of the Sibanye Risk Management framework and the risk-based methodologies adopted by Internal Audit. The Audit Committee approves the annual internal audit assurance plan presented by Internal Audit and monitors progress against the plan.
Internal Audit reports deficiencies to the Audit Committee every quarter together with recommended remedial actions, which are then followed up. Internal Audit provided the Audit Committee with a written report, which assessed as adequate the internal controls over financial reporting, IT governance and the risk management process during 2016.
The Audit Committee is responsible for IT governance on behalf of the Board and reviews the report of the IT Senior Manager at each meeting.
The Audit Committee evaluated the expertise and performance of the CFO during 2016. It is satisfied that he has the appropriate expertise and experience to carry out his duties as the CFO of the Group, and is supported by qualified and competent senior staff.
AUDIT COMMITTEE STATEMENT
Based on information from, and discussions with, management and external auditors, the Audit Committee has no reason to believe that there were any material breakdowns in the design and operating effectiveness of internal financial controls during the year and that the financial records may be relied upon as the basis for preparation of the consolidated financial statements.
The Audit Committee has considered and discussed this annual financial report and associated reports with both management and the external auditors.
During this process, the Audit Committee:
| · | | evaluated significant judgements and reporting decisions; |
| · | | determined that the going-concern basis of reporting is appropriate; |
| · | | evaluated the material factors and risks that could impact on the annual financial report and associated reports; |
| · | | evaluated the completeness of the financial and sustainability discussion and disclosures; and |
| · | | discussed the treatment of significant and unusual transactions with management and the external auditors. |
The Audit Committee considers that the annual financial report complies in all material respects with the statutory requirements of the various regulations governing disclosure and reporting of the consolidated annual financial statements and that the consolidated annual financial statements comply in all material respects with IFRS, as issued by the IASB, the SAICA Financial Reporting Guides issued by the Accounting Practices Committee and Financial Reporting Pronouncements issued by the Financial Reporting Standards Council, as well as the requirements of the South African Companies Act and the JSE Listings Requirements. The Audit Committee has recommended to the Board that the consolidated annual financial statements be adopted and approved by the Board.
Keith Rayner CA(SA)
Chairman: Audit Committee
30 March 2017
| |
Sibanye Annual Financial Report 2016 | 111 |
The directors have pleasure in submitting this report and the consolidated annual financial statements of Sibanye for the year ended 31 December 2016.
PROFILE
BUSINESS OF THE GROUP
The Sibanye Group is an independent, South African domiciled precious metals mining group, which currently owns and operates gold and uranium operations and projects throughout the Witwatersrand Basin in South Africa, as well as PGM operations in the Bushveld Igneous Complex in South Africa and the Great Dyke in Zimbabwe. The Group currently owns and operates four underground and surface gold operations, namely Driefontein, Kloof and Cooke in the West Witwatersrand region and Beatrix in the southern Free State province. The Group also owns and operates underground and surface PGM operations, including the Rustenburg Operations in South Africa, a 50% interest in the Kroondal Operations in South Africa and a 50% interest in the Mimosa Operations, a PGM joint venture in Zimbabwe.
At 31 December 2016, Sibanye had gold mineral reserves of 28.7Moz (2015: 31.0Moz and 2014: 28.4Moz), uranium mineral reserves of 113.2Mlb (2015: 113.8Mlb and 2014: 102.5Mlb) and maiden 4E PGM mineral reserves of 23.2Moz.
REVIEW OF OPERATIONS
For a review of Sibanye’s operations, see Overview–Management’s discussion and analysis of the financial statements–2016 financial performance compared with 2015 and 2014.
FINANCIAL RESULTS
The information on the financial position of the Group for the year ended 31 December 2016 is set out in the consolidated annual financial statements including the notes, which appear elsewhere in this annual financial report. The income statement for the Group shows a profit of R3,271 million for the year ended 31 December 2016 compared with R538 million in 2015.
DIRECTORATE
COMPOSITION OF THE BOARD
There were no changes to the composition of the Board.
For the membership of the Board and its sub-committees, see Accountability–Corporate governance report–Board and Accountability–Corporate governance report–Board sub-committees.
ROTATION OF DIRECTORS
Directors retiring in terms of the Company’s MOI are Chris Chadwick, Robert Chan, Tim Cumming, Charl Keyter and Sello Moloko.
All the directors are eligible and offer themselves for re-election.
The directors of various subsidiaries of the Company comprise some of the executive officers and one of the executive directors, where appropriate.
DIRECTORS’ AND OFFICERS’ DISCLOSURE OF INTERESTS IN CONTRACTS
As of the date of this report, none of the directors, officers or major shareholders of Sibanye or, to the knowledge of Sibanye’s management, their families, had any interest, direct or indirect, in any transaction during the last fiscal year or in any proposed transaction which has affected or will materially affect Sibanye or its investment interests or subsidiaries. None of the directors or officers of Sibanye or any associate of such director or officer is currently or has been at any time during the past fiscal year materially indebted to Sibanye.
For related party information, see Annual financial statements–Notes to the consolidated financial statements–Note 32: Related-party transactions.
FINANCIAL AFFAIRS
DIVIDEND POLICY
Sibanye‘s dividend policy is to return at least 25% to 35% of normalised earnings to shareholders and after due consideration of future requirements the dividend may be increased beyond these levels. Normalised earnings are defined as profit for the year excluding gains and losses on foreign exchange differences and financial instruments, non-recurring items, and share of results of equity-accounted investees after tax.
For the year under review, the Group paid a total dividend of R1,611 million compared with R658 million in 2015.
On 23 February 2017, a final dividend in respect of the six months ended 31 December 2016 of 60 SA cents per share was approved by the Board, resulting in a total dividend of 145 SA cents per share for the year ended 31 December 2016.
| |
Sibanye Annual Financial Report 2016 | 112 |
BORROWING POWERS
In terms of Clause 4 of the Company’s MOI, the borrowing powers of the Company are unlimited. As at 31 December 2016, the borrowings of the Company and the Group, excluding the Burnstone Debt, was R7,219 million (2015: R1,962 million) and R7,221 million (2015: R1,995 million), respectively, see Annual financial statements–Notes to the consolidated financial statements–Note 23: Borrowings.
Sibanye is subject to financial and other covenants and restrictions under its credit facilities from time to time. Such covenants may include restrictions on Sibanye incurring additional financial indebtedness and obligations to maintain certain financial covenant ratios for as long as any amount is outstanding under such facilities.
SIGNIFICANT ANNOUNCEMENTS
Sibanye and the Waterberg Coal Group terminate discussions – 25 February 2016
Sibanye and Waterberg Coal Company Limited, Firestone Energy Limited, Sekoko Resources Proprietary Limited and Sekoko Coal Proprietary Limited (collectively the Waterberg Coal Group) were unable to agree on revised terms post completion of the due diligence, and accordingly all discussions were terminated.
FInalisation announcement of the Aquarius Transaction – 22 March 2016
In accordance with the implementation agreement signed in October 2015, Sibanye and Aquarius agreed that the conditions fulfilment date was set as 24 March 2016. On the conditions fulfilment date, the parties confirmed that all of the conditions required for the transaction to proceed were satisfied and exchanged executed copies of the amalgamation agreement, as well as other documentation required for the transaction to become effective. For additional information of the acquisition of Aquarius, see Annual financial statements–Notes to the consolidated financial statements–Note 12.1: Aquarius acquisition.
Sibanye boosts education with a R6.2 million facility in the Free State – 5 July 2016
Sibanye financed and delivered a state-of-the-art, multi-purpose hall, to the Free State Department of Education as per its Social and Labour Plan agreements. The project is a R6.2 million investment that will benefit learners and community members in and around the town of Theunissen in the Free State, within the Masilonyana Local Municipality.
SIBANYE GOLD ENTERS INTO FURTHER SECTION 189 CONSULTATIONS ON THE FUTURE OF THE COOKE 4 OPERATION – 11 July 2016
In September 2014, due to historical operational underperformance, Sibanye entered into a period of consultation with relevant stakeholders which, in November 2014, resulted in the stakeholders agreeing to implement specific measures to return the operation to profitability and thereby minimise job losses. Despite intense monitoring and interventions by a joint management and labour committee over the 17 months since the previous section 189 consultation was concluded, the Cooke 4 Operation continued to fall short of production targets and losses continued to accumulate.
In view of the sustained losses at the Cooke 4 Operation and considering the extensive efforts to improve productivity and reduce the operation’s cost structures, Sibanye gave notice in terms of section 189A of the Labour Relations Act 66 of 1995.
For additional information of the impairment of the Cooke 4 Operation’s mining assets, see Annual financial statements–Notes to the consolidated financial statements–Note 7: Impairments.
Sibanye takes ownership of the Rustenburg Platinum Mines and implements management changes – 1 November 2016
On 19 October 2016, Sibanye announce that the acquisition, by Sibanye Rustenburg Platinum Mines Proprietary Limited (SRPM) from RPM, of the Rustenburg Operations, was unconditional. This followed, amongst other things, the granting of consent in terms of section 11 of the Mineral and Petroleum Resources Development Act, 2002 for the sale by RPM of the Mining Right and the Prospecting Right to SRPM.
The acquisition of the Rustenburg Operations became effective on 1 November 2016. The Rustenburg Operations Transaction was fully implemented, following settlement of the initial upfront purchase price of R1.5 billion in cash, from Sibanye’s existing cash resources and debt facilities.
The BBBEE ownership of SRPM was also agreed and implemented with effect from 1 November 2016 such that Sibanye holds 74% of SRPM, with the remaining 26% held through Newshelf 1335 Proprietary Limited (BBBEE SPV). The shareholders of BBBEECo SPV are Rustenburg Mine Employees Trust (30.4%), Rustenburg Mine Community Development Trust (24.8%) Bakgatla-Ba-Kgafela Investment Holdings (24.8%) and Siyanda Resources Proprietary Limited (20.0%).
For additional information of the acquisition of the Rustenburg Operations, see Annual financial statements–Notes to the consolidated financial statements–Note 12.2: The Rustenburg Operations acquisition.
| |
Sibanye Annual Financial Report 2016 | 113 |
SIBANYE ANNOUNCES PROPOSED ACQUISITION OF STILLWATER MINING COMPANY – 9 December 2016
Sibanye reached a definitive agreement to acquire Stillwater for US$18 per share in cash, or US$2.2 billion in aggregate (approximately R30 billion). The consideration represents a premium of 23% to Stillwater’s prior day closing share price, and 20% to Stillwater’s 20‑day volume-weighted average closing share price.
GOING CONCERN
The consolidated financial statements have been prepared using appropriate accounting policies, supported by reasonable judgements and estimates. The directors believe that the Group has adequate resources to continue as a going concern for the foreseeable future. For further details on the Group’s liquidity position at 31 December 2016 and potential impact of the Stillwater Transaction on the Group’s liquidity position, see Annual financial statements–Notes to the consolidated financial statements–Note 29.2: Risk management activities–Liquidity risk.
SPECIAL RESOLUTIONS PASSED BY SUBSIDIARY COMPANIES
The following special resolutions were passed by subsidiary companies during the year ended 31 December 2016:
1.SPECIAL RESOLUTION PASSED BY SIbanye Resources Proprietary Limited, SIbanye Rustenburg PLatinum Mines Proprietary Limited, Sibanye Platinum Proprietary Limited and Newshelf 1335 Proprietary Limited
Special resolution passed by the sole shareholder of the subsidiary companies listed below, in terms of sections 16(1) and 16(5)(a) of the Companies Act that the directors of the company propose to the shareholder of the company that the existing MOI of the company be replaced in its entirety by a new MOI.
| · | | Sibanye Resources Proprietary Limited; |
| · | | Sibanye Rustenburg Platinum Mines Proprietary Limited; |
| · | | Sibanye Platinum Proprietary Limited; and |
| · | | Newshelf 1335 Proprietary Limited. |
2.SPECIAL RESOLUTION PASSED BY Kroondal Operations Proprietary Limited and Kroondal Operations Corporate Services Proprietary Limited
Special resolution passed by the sole shareholder of the subsidiary companies listed below, in terms of sections 16(1), 16(5)(a) and 57(2)(a) of the Companies Act that the directors of the company propose to the shareholder of the company that the name of the company be changed, and existing MOI of the company be replaced in its entirety by a new MOI.
| · | | Kroondal Operations Proprietary Limited; and |
| · | | Kroondal Operations Corporate Services Proprietary Limited. |
3. SPECIAL RESOLUTION PASSED BY Sibanye PLatinum INTERNATIONAL Holding Mines Proprietary Limited
Special resolution passed by the sole shareholder of Sibanye Platinum International Holding Mines Proprietary Limited, in terms of section 57(2)(a) of the Companies Act that the directors of the company propose to the shareholder of the company that the name of the company be changed.
4.SPECIAL RESOLUTION PASSED BY VARIOUS SUBSIDIARY COMPANIES
Special resolution passed by the majority shareholder of the subsidiary companies listed below, approving that the directors of the company may at any time and from time to time during the two years from the passing hereof authorise the company, in terms of and subject to the provisions of section 45(3)(b) of the Companies Act, to provide any type of direct or indirect financial assistance as defined in section 45(1) of the Companies Act, to any company or corporation that is related or inter-related to the company, on such terms and conditions and for such amounts as the directors may determine.
| · | | Bushbuck Ventures Proprietary Limited; |
| · | | Living Gold Proprietary Limited; |
| · | | Newshelf 1114 Proprietary Limited; and |
| · | | Oryx Ventures Proprietary Limited. |
| |
Sibanye Annual Financial Report 2016 | 114 |
5. SPECIAL RESOLUTION PASSED BY VARIOUS SUBSIDIARY COMPANIES
Special resolution passed by the sole shareholder of the subsidiary companies listed below, approving that the directors of the company may at any time and from time to time during the two years from the passing hereof authorise the company in terms of and subject to the provisions of section 45(3)(b) of the Companies Act, to provide any type of direct or indirect financial assistance as defined in section 45(1) of the Companies Act, to any company or corporation that is related or inter-related to the company, on such terms and conditions and for such amounts as the directors may determine.
| · | | Agrihold Proprietary Limited; |
| · | | Ezulwini Mining Company Proprietary Limited; |
| · | | Golden Hytec Farming Proprietary Limited; |
| · | | Golden Oils Proprietary Limited; |
| · | | Kroondal Operations Proprietary Limited; |
| · | | K2013164354 Proprietary Limited; |
| · | | M Janse van Rensburg Proprietary Limited; |
| · | | Milen Mining Proprietary Limited; |
| · | | Sibanye Gold Academy Proprietary Limited; |
| · | | Puma Gold Proprietary Limited; |
| · | | Rand Uranium Proprietary Limited; |
| · | | Sibanye Gold Eastern Operations Proprietary Limited; |
| · | | Sibanye Gold Nursing College Proprietary Limited; |
| · | | Sibanye Gold Protection Services Limited; |
| · | | Sibanye Gold Shared Services Proprietary Limited; |
| · | | Sibanye Resources Proprietary Limited; |
| · | | Sibanye Rustenburg Platinum Mines Resources Proprietary Limited; |
| · | | Sibanye Solar PV Proprietary Limited; |
| · | | Sibanye Uranium Proprietary Limited; |
| · | | St Helena Hospital Proprietary Limited; |
| · | | West Driefontein Gold Mining Company Proprietary Limited; |
| · | | Witwatersrand Consolidated Gold Resources Proprietary Limited; and |
| · | | Witwatersrand Deep Investments Proprietary Limited. |
LITIGATION
The Group provides occupational healthcare services to its employees through its existing facilities at the various operations. There is a risk that the cost of providing such services could increase in the future depending upon changes in the nature of underlying legislation and the profile of employees. Any such increased cost has not yet been quantified. The costs are however also mitigated by advances in technology relating to occupational health. The Group is monitoring developments in this regard.
The principal health risks associated with Sibanye’s mining operations in South Africa arise from occupational exposure to silica dust, noise, heat and certain hazardous chemicals. The most significant occupational diseases affecting Sibanye’s workforce include lung diseases (such as silicosis, tuberculosis, a combination of the two and chronic obstructive airways disease (COAD) as well as noise induced hearing loss. The Occupational Diseases in Mines and Works Act, 78 of 1973, or ODMWA, governs the compensation paid to mining employees who contract certain illnesses, such as silicosis. Recently, the South African Constitutional Court ruled that a claim for compensation under ODMWA does not prevent an employee from seeking compensation from its employer in a civil action under common law (either as individuals or as a class). While issues, such as negligence and causation, need to be proved on a case by case basis, it is possible that such ruling could expose Sibanye to individual or class action claims related to occupational hazards and diseases (including silicosis). If Sibanye were to face a significant number of such claims and the claims were suitably established against it, the payments of compensation for the claims could have a material adverse effect on Sibanye’s results of operations and financial position. In addition, Sibanye may incur significant additional costs arising out of these issues, including costs relating to the payment of fees, levies or other contributions in respect of compensatory or other funds established (if any) and expenditures arising out of its efforts to resolve any outstanding claims or other potential action.
On 21 August 2012, a court application was served on a group of respondents that included Sibanye (the August Respondents). On 21 December 2012, a further court application was issued and was formally served on a number of respondents, including Sibanye (the December Respondents) and, again on 10 January 2013, both the August Respondents and the December Respondents (together the Respondents), on behalf of current and former mine workers, and their dependents, of, amongst others, Sibanye and who allegedly contracted silicosis and/or other occupational lung diseases (OLD) (the Class). The court application of 21 August 2012 and 21 December 2012 are together referred to below as the Applications.
Sibanye filed a notice of its intention to oppose the applications and its attorneys to defend the claims.
| |
Sibanye Annual Financial Report 2016 | 115 |
These Applications requested that the court:
1. As a first phase, certify a class action to be instituted by the applications on behalf of the class, as defined.
2. As a second phase, split the class, as defined into smaller classes based on common legal and factual issues. The Respondents are of the view that the definition of the class in the first phase and the proposed process involving the second phase are contrary to South African legal precedent.
3. In the last phase, bring action wherein they will attempt to hold the respondents liable for silicosis and other OLD and resultant consequences.
The Applications do not identify the number of claims that may be instituted against the Respondents or the quantum of damages that the applicants may seek.
The Applications were heard during the weeks of 12 and 19 October 2015. Judgement was handed down certifying a class action to be instituted.
Anglo American South Africa, Anglo Gold Ashanti Limited (AngloGold Ashanti), Gold Fields, Harmony and Sibanye announced in November 2014 that they have formed a gold mining industry working group to address issues relating to the compensation and medical care for OLD in the gold mining industry in South Africa. Essentially, the companies are seeking a comprehensive and sustainable solution which deals both with the legacy compensation issues and future legal frameworks which, while being fair to employees, also ensures the future sustainability of companies in the industry.
The companies have engaged all stakeholders on these matters, including government, organised labour, other mining companies and legal representatives of claimants who have filed legal suits against the companies. These legal proceedings are being defended.
On 13 May 2016, the High court ruled in favour of the applicants and found that there were sufficient common issues to certify two industry-wide classes: (i) a silicosis class comprising current and former mine workers who have contracted silicosis and the dependents of mine workers who have died of silicosis; and (ii) a tuberculosis class comprising current and former mine workers who have worked on the mines for a period of not less than two years and who have contracted pulmonary tuberculosis and the dependents of deceased mine workers who died of pulmonary tuberculosis. The High court ordered a two-stage process in the class action: (i) resolve common issues and allow individuals to opt out, and (ii) allow the individuals to opt in to the class to make claims against the Respondents. The High court also decided that claims for general damages will transmit to the estate of the deceased mine worker who dies after the date of filing of the certification application.
On 3 June 2016, Sibanye and the other Respondents filed an application with the High Court for leave to appeal to the Supreme Court of Appeal. Arguments in the application for leave to appeal were heard on 23 June 2016. On 24 June 2016, leave to appeal was (i) granted in respect of the transferability of general damages claims but (ii) denied in respect of certification of silicosis and tuberculosis classes. On 15 July 2016, Sibanye and the other Respondents each filed petitions with the supreme Court of Appeal for leave to appeal against the certification of the two separate classes for silicosis and tuberculosis.
On 21 September 2016, the Supreme Court of Appeal granted the Respondents leave to appeal against all aspects of the class certification judgement of the High Court delivered in May 2016. The appeal record has been filed.
At this stage, Sibanye can neither quantify the potential liability from the action due to the inherent legal and factual uncertainties with respect to the pending claims and other claims not yet filed against the Group nor can the length of time until finalisation or quantum be estimated.
ADMINISTRATION
Cain Farrel was appointed Company Secretary of Sibanye with effect from 1 January 2013.
With effect from 11 February 2013, Computershare Investor Services Proprietary Limited became the Company’s South African transfer secretaries and Capita Asset Services became the United Kingdom registrars of the Company.
AUDITORS
The Audit Committee has recommended to the Board that KPMG Inc. continues in office in accordance with section 90(1) of the Companies Act and in terms of the JSE Listings Requirements. Jacques Erasmus is the designated group audit engagement partner, accredited by the JSE, for Sibanye.
SUBSIDIARY COMPANIES
For details of major subsidiary companies in which the Company has a direct or indirect interest, see Annual financial statements–Notes to the consolidated financial statements–Note 1.3: Consolidation.
| |
Sibanye Annual Financial Report 2016 | 116 |
AUTHORISED AND ISSUED
At the shareholder’s meeting held on 21 November 2012 (Gold Fields being the sole shareholder) the Company’s authorised and issued share capital each consisting of 1,000 par value shares of R1.00 each was converted into 1,000 ordinary shares with no par value. The authorised share capital was increased by the creation of a further 999,999,000 ordinary no par value shares, each ranking pari passu in all respects with the existing no par value shares in the Company’s share capital so as to result in the Company’s authorised share capital being 1,000,000,000 ordinary no par value shares. As at 31 December 2012 the authorised share capital was 1,000,000,000 ordinary no par value shares and the issued share capital was 1,000 ordinary no par value shares.
On 1 February 2013, prior to the unbundling of Sibanye from Gold Fields on 18 February 2013, Gold Fields subscribed for a further 731,647,614 shares in Sibanye for R17,246 million.
The authorised share capital was increased to 2,000,000,000 during the year ended 31 December 2015 and as of 31 December 2015, the authorised share capital was 2,000,000,000 ordinary no par value shares and the issued share capital was 916,140,552 ordinary no par value shares.
During 2016, the Company issued 12,863,790 shares as part of the Sibanye Gold Limited 2013 Share Plan.
As at 31 December 2016, the authorised share capital was 2,000,000,000 ordinary no par value shares and the issued share capital was 929,004,342 ordinary no par value shares.
In terms of the general authority granted at the shareholder’s meeting on 24 May 2016, the authorised but unissued ordinary share capital of the Company representing not more than 5% of the issued share capital of the Company as at 31 December 2015, after setting aside so many ordinary shares as may be required to be allotted and issued pursuant to the share incentive scheme, was placed under the control of the directors.
This authority expires at the next AGM where shareholders will be asked to place under the control of the directors the authorised but unissued ordinary share capital of the Company representing not more than 5% of the issued share capital of the Company from time to time.
REPURCHASE OF SHARES
The Company has not exercised the general authority granted to buy back shares from its issued ordinary share capital granted at the shareholders’ meeting held on 24 May 2016.
At the next AGM, shareholders will be asked to approve the general authority for the acquisition by the Company, or a subsidiary of the Company, of its own shares.
| |
Sibanye Annual Financial Report 2016 | 117 |
TO THE BOARD OF DIRECTORS AND STOCKHOLDERS
Sibanye Gold Limited
We have audited the accompanying consolidated statements of financial position of Sibanye Gold Limited (Sibanye) and its subsidiaries as of 31 December 2016, 2015 and 2014, and the related consolidated income statements and consolidated statements of other comprehensive income, changes in equity, and cash flows for each of the years then ended. We also have audited Sibanye’s internal control over financial reporting as of 31 December 2016, based on criteria established in Internal Control – Integrated Framework (2013) issued by the Committee of Sponsoring Organizations of the Treadway Commission (COSO). Sibanye’s management is responsible for these consolidated financial statements, for maintaining effective internal control over financial reporting, and for its assessment of the effectiveness of internal control over financial reporting, included in the accompanying “Management’s Report on Internal Control over Financial Reporting”. Our responsibility is to express an opinion on these consolidated financial statements and an opinion on Sibanye’s internal control over financial reporting based on our audits.
We conducted our audits in accordance with the standards of the Public Company Accounting Oversight Board (United States). Those standards require that we plan and perform the audits to obtain reasonable assurance about whether the financial statements are free of material misstatement and whether effective internal control over financial reporting was maintained in all material respects. Our audits of the consolidated financial statements included examining, on a test basis, evidence supporting the amounts and disclosures in the financial statements, assessing the accounting principles used and significant estimates made by management, and evaluating the overall financial statement presentation. Our audit of internal control over financial reporting included obtaining an understanding of internal control over financial reporting, assessing the risk that a material weakness exists, and testing and evaluating the design and operating effectiveness of internal control based on the assessed risk. Our audits also included performing such other procedures as we considered necessary in the circumstances. We believe that our audits provide a reasonable basis for our opinions.
A company’s internal control over financial reporting is a process designed to provide reasonable assurance regarding the reliability of financial reporting and the preparation of financial statements for external purposes in accordance with generally accepted accounting principles. A company’s internal control over financial reporting includes those policies and procedures that (1) pertain to the maintenance of records that, in reasonable detail, accurately and fairly reflect the transactions and dispositions of the assets of the company; (2) provide reasonable assurance that transactions are recorded as necessary to permit preparation of financial statements in accordance with generally accepted accounting principles, and that receipts and expenditures of the company are being made only in accordance with authorisations of management and directors of the company; and (3) provide reasonable assurance regarding prevention or timely detection of unauthorised acquisition, use, or disposition of the company’s assets that could have a material effect on the financial statements.
Because of its inherent limitations, internal control over financial reporting may not prevent or detect misstatements. Also, projections of any evaluation of effectiveness to future periods are subject to the risk that controls may become inadequate because of changes in conditions, or that the degree of compliance with the policies or procedures may deteriorate.
In our opinion, the consolidated financial statements referred to above present fairly, in all material respects, the financial position of Sibanye and subsidiaries as of 31 December 2016, 2015 and 2014, and the results of their operations and their cash flows for each of the years then ended, in conformity with International Financial Reporting Standards as issued by the International Accounting Standards Board. Also in our opinion, Sibanye maintained, in all material respects, effective internal control over financial reporting as of 31 December 2016, based on criteria established in Internal Control – Integrated Framework (2013) issued by the Committee of Sponsoring Organizations of the Treadway Commission (COSO) .
Sibanye acquired Aquarius Platinum Limited and its subsidiaries in April 2016, and the Rustenburg Operations in October 2016 (together, the Acquired Businesses). Management has excluded from its assessment of the effectiveness of Sibanye’s internal control over financial reporting as of 31 December 2016, the Acquired Businesses’ internal control over financial reporting associated with approximately 47% of consolidated total assets (including 7% of consolidated total assets related to acquisition accounting adjustments to property, plant and equipment and goodwill at the respective acquisition dates that was included within the assessment) and approximately 12% of consolidated revenues, included in the consolidated financial statements of Sibanye and its subsidiaries as of and for the year ended 31 December 2016. Our audit of internal control over financial reporting of Sibanye also excluded an evaluation of the internal control over financial reporting of the Acquired Businesses.
/s/ KPMG Inc.
Johannesburg, South Africa
6 April 2017
| |
Sibanye Annual Financial Report 2016 | 118 |
CONSOLIDATED INCOME STATEMENT
FOR THE YEAR ENDED 31 DECEMBER 2016
| | | | |
Figures in million - SA rand | Notes | 2016 | 2015 | 2014 |
Revenue | 3 | 31,240.7 | 22,717.4 | 21,780.5 |
Cost of sales | 4 | (24,751.0) | (20,017.0) | (17,566.1) |
Net operating profit | | 6,489.7 | 2,700.4 | 4,214.4 |
Interest income | 14,16 | 331.4 | 257.0 | 183.2 |
Finance expense | 5 | (903.1) | (561.8) | (400.0) |
Share-based payments | 6 | (496.2) | (274.4) | (417.9) |
Loss on financial instruments | 6 | (1,032.8) | (229.5) | (107.7) |
Gain/(loss) on foreign exchange differences | | 219.6 | (359.4) | (63.3) |
Share of results of equity-accounted investees after tax | 14 | 13.3 | 116.0 | (470.7) |
Other income | | 131.9 | 125.7 | 155.9 |
Other costs | | (490.6) | (227.9) | (265.0) |
Impairments | 7 | (1,381.1) | - | (275.1) |
Gain on disposal of property, plant and equipment | 11 | 95.4 | 58.7 | 9.5 |
Gain on acquisition | 12 | 2,428.0 | - | - |
Restructuring costs | | (187.7) | (104.8) | (160.3) |
Transaction costs | | (157.0) | (25.7) | (111.6) |
Net loss on derecognition of financial guarantee asset and liability | | - | (158.3) | - |
Reversal of impairment | 11 | - | - | 474.1 |
Profit before royalties and tax | | 5,060.8 | 1,316.0 | 2,765.5 |
Royalties | 8.1 | (546.6) | (400.6) | (430.5) |
Profit before tax | | 4,514.2 | 915.4 | 2,335.0 |
Mining and income tax | 8.2 | (1,243.2) | (377.2) | (828.1) |
Profit for the year | | 3,271.0 | 538.2 | 1,506.9 |
Attributable to: | | | | |
Owners of Sibanye | | 3,701.6 | 716.9 | 1,551.5 |
Non-controlling interests | | (430.6) | (178.7) | (44.6) |
Earnings per share attributable to owners of Sibanye | | | | |
Basic earnings per share - cents | 9.1 | 402 | 79 | 186 |
Diluted earnings per share - cents | 9.2 | 401 | 78 | 182 |
The accompanying notes form an integral part of these consolidated financial statements.
CONSOLIDATED STATEMENT OF OTHER COMPREHENSIVE INCOME
FOR THE YEAR ENDED 31 DECEMBER 2016
| | | | |
Figures in million - SA rand | | 2016 | 2015 | 2014 |
Profit for the year | | 3,271.0 | 538.2 | 1,506.9 |
Other Comprehensive income | | | | |
Items that may be reclassified to profit or loss | | | | |
Foreign currency translation | | (131.4) | - | - |
Other comprehensive income, net of tax | | (131.4) | - | - |
Total comprehensive income | | 3,139.6 | 538.2 | 1,506.9 |
Attributable to: | | | | |
Owners of Sibanye | | 3,570.2 | 716.9 | 1,551.5 |
Non-controlling interests | | (430.6) | (178.7) | (44.6) |
| |
Sibanye Annual Financial Report 2016 | 119 |
CONSOLIDATED STATEMENT OF FINANCIAL POSITION
AS AT 31 DECEMBER 2016
| | | | |
Figures in million - SA rand | Notes | 2016 | 2015 | 2014 |
ASSETS | | | | |
Non-current assets | | 34,018.1 | 25,515.0 | 25,981.4 |
Property, plant and equipment | 11 | 27,240.7 | 22,132.4 | 22,704.0 |
Goodwill | 13 | 936.0 | 736.7 | 736.7 |
Equity-accounted investments | 14 | 2,157.4 | 167.5 | 69.4 |
Environmental rehabilitation obligation funds | 16 | 3,100.5 | 2,413.9 | 2,192.8 |
Other receivables | 17.1 | 355.3 | 1.3 | 1.4 |
Financial guarantee asset | | - | - | 225.5 |
Deferred tax assets | 8.3 | 228.2 | 63.2 | 51.6 |
| | | | |
Current assets | | 7,703.2 | 2,750.7 | 1,940.5 |
Inventories | 18 | 676.8 | 405.9 | 327.7 |
Trade and other receivables | 19 | 5,747.9 | 1,627.4 | 992.8 |
Other receivables | 17.1 | 310.6 | - | - |
Financial guarantee asset | | - | - | 57.1 |
Cash and cash equivalents | 20 | 967.9 | 717.4 | 562.9 |
| | | | |
Total assets | | 41,721.3 | 28,265.7 | 27,921.9 |
| | | | |
EQUITY AND LIABILITIES | | | | |
Equity attributable to owners of Sibanye | | 16,679.7 | 14,875.0 | 14,656.3 |
Stated share capital | 21 | 21,734.6 | 21,734.6 | 21,734.6 |
Other reserves | | 2,978.8 | 2,938.2 | 2,819.1 |
Accumulated loss | | (8,033.7) | (9,797.8) | (9,897.4) |
| | | | |
Non-controlling interests | 22 | 17.7 | 109.8 | 329.6 |
Total equity | | 16,697.4 | 14,984.8 | 14,985.9 |
| | | | |
Non-current liabilities | | 18,787.3 | 7,933.6 | 9,365.4 |
Borrowings | 23 | 8,221.5 | 1,808.3 | 2,615.8 |
Environmental rehabilitation obligation | 24 | 3,982.2 | 2,411.0 | 2,486.8 |
Post-retirement healthcare obligation | | 16.3 | 16.3 | 15.1 |
Share-based payment obligations | 6.4 | 246.5 | 136.6 | 378.4 |
Other payables | 17.2 | 1,613.7 | - | - |
Deferred tax liabilities | 8.3 | 4,707.1 | 3,561.4 | 3,869.3 |
| | | | |
Current Liabilities | | 6,236.6 | 5,347.3 | 3,570.6 |
Borrowings | 23 | 752.3 | 1,995.3 | 554.2 |
Share-based payment obligations | 6.4 | 235.2 | 463.0 | 20.8 |
Trade and other payables | 25 | 5,180.5 | 2,759.4 | 2,714.6 |
Tax and royalties payable | 28 | 68.6 | 129.6 | 84.0 |
Financial guarantee liability | | - | - | 197.0 |
| | | | |
Total equity and liabilities | | 41,721.3 | 28,265.7 | 27,921.9 |
The accompanying notes form an integral part of these consolidated financial statements.
| |
Sibanye Annual Financial Report 2016 | 120 |
CONSOLIDATED STATEMENT OF CHANGES IN EQUITY
FOR THE YEAR ENDED 31 DECEMBER 2016
| | | | | | | | |
| | | Share- | Foreign | | Equity | | |
| | Stated | based | currency | | attributable | Non- | |
| | share | payment | translation | Accumulated | to owners | controlling | Total |
Figures in million - SA rand | Notes | capital | reserve | reserve | loss | of Sibanye | interests | equity |
Balance at 31 December 2013 | | 17,245.8 | 2,643.3 | - | (10,467.9) | 9,421.2 | 2.2 | 9,423.4 |
Total comprehensive income for the year | | - | - | - | 1,551.5 | 1,551.5 | (44.6) | 1,506.9 |
Profit for the year | | - | - | - | 1,551.5 | 1,551.5 | (44.6) | 1,506.9 |
Other comprehensive income | | - | - | - | - | - | - | - |
Share-based payments | 6 | - | 175.8 | - | - | 175.8 | - | 175.8 |
Dividends paid | 10 | - | - | - | (1,005.2) | (1,005.2) | - | (1,005.2) |
Shares issued | 21 | 4,488.8 | - | - | - | 4,488.8 | - | 4,488.8 |
Acquisition of subsidiary with non-controlling interests | 12 | - | - | - | - | - | 396.2 | 396.2 |
Transaction with non-controlling interests | 22 | - | - | - | 24.2 | 24.2 | (24.2) | - |
Balance at 31 December 2014 | | 21,734.6 | 2,819.1 | - | (9,897.4) | 14,656.3 | 329.6 | 14,985.9 |
Total comprehensive income for the year | | - | - | - | 716.9 | 716.9 | (178.7) | 538.2 |
Profit for the year | | - | - | - | 716.9 | 716.9 | (178.7) | 538.2 |
Other comprehensive income | | - | - | - | - | - | - | - |
Share-based payments | 6 | - | 119.1 | - | - | 119.1 | - | 119.1 |
Dividends paid | 10 | - | - | - | (658.4) | (658.4) | - | (658.4) |
Transaction with non-controlling interests | 22 | - | - | - | 41.1 | 41.1 | (41.1) | - |
Balance at 31 December 2015 | | 21,734.6 | 2,938.2 | - | (9,797.8) | 14,875.0 | 109.8 | 14,984.8 |
Total comprehensive income for the year | | - | - | (131.4) | 3,701.6 | 3,570.2 | (430.6) | 3,139.6 |
Profit for the year | | - | - | - | 3,701.6 | 3,701.6 | (430.6) | 3,271.0 |
Other comprehensive income | | - | - | (131.4) | - | (131.4) | - | (131.4) |
Share-based payments | 6 | - | 172.0 | - | - | 172.0 | - | 172.0 |
Dividends paid | 10 | - | - | - | (1,610.6) | (1,610.6) | (1.3) | (1,611.9) |
Acquisition of subsidiary with non-controlling interests | 12 | - | - | - | - | - | 12.9 | 12.9 |
Transaction with non-controlling interests | 22 | - | - | - | (326.9) | (326.9) | 326.9 | - |
Balance at 31 December 2016 | | 21,734.6 | 3,110.2 | (131.4) | (8,033.7) | 16,679.7 | 17.7 | 16,697.4 |
The accompanying notes form an integral part of these consolidated financial statements.
| |
Sibanye Annual Financial Report 2016 | 121 |
CONSOLIDATED STATEMENT OF CASH FLOWS
FOR THE YEAR ENDED 31 DECEMBER 2016
| | | | |
Figures in million - SA rand | Notes | 2016 | 2015 | 2014 |
CASH FLOWS FROM OPERATING ACTIVITIES | | | | |
Cash generated by operations | 26 | 9,836.3 | 6,130.4 | 7,081.4 |
Post-retirement health care payments | | (1.2) | (0.1) | (2.4) |
Cash-settled share-based payments paid | 6 | (1,518.6) | (42.2) | (166.6) |
Change in working capital | 27 | (237.6) | (668.0) | 214.5 |
| | 8,078.9 | 5,420.1 | 7,126.9 |
Interest received | | 112.2 | 117.3 | 68.5 |
Interest paid | | (441.1) | (260.2) | (194.0) |
Royalties paid | 28.1 | (555.9) | (395.4) | (650.1) |
Tax paid | 28.2 | (1,176.7) | (656.3) | (1,347.1) |
Dividends paid | 10 | (1,611.9) | (658.4) | (1,005.2) |
Guarantee fee received | | - | 9.6 | 53.6 |
Guarantee release fee | | - | (61.4) | - |
Net cash from operating activities | | 4,405.5 | 3,515.3 | 4,052.6 |
| | | | |
CASH FLOWS FROM INVESTING ACTIVITIES | | | | |
Additions to property, plant and equipment | 11 | (4,151.1) | (3,344.8) | (3,250.8) |
Proceeds on disposal of property, plant and equipment | 11 | 99.4 | 65.1 | 22.6 |
Investment in subsidiaries | 12 | (5,801.5) | - | (415.3) |
Cash acquired on acquisition of subsidiaries | 12 | 494.2 | - | 38.1 |
Loan advanced to equity-accounted investee | 14 | (10.1) | (3.0) | (384.6) |
Loan repaid by equity-accounted investee | 14 | - | 20.9 | - |
Contributions to environmental rehabilitation obligation funds | 16 | (74.7) | (77.8) | (69.3) |
Payment of environmental rehabilitation obligation | | - | (0.3) | (10.9) |
Loans granted to subsidiaries prior to acquisition | | - | - | (238.6) |
Net cash used in investing activities | | (9,443.8) | (3,339.9) | (4,308.8) |
| | | | |
CASH FLOWS FROM FINANCING ACTIVITIES | | | | |
Loans raised | 23 | 17,280.5 | 1,552.0 | 1,623.6 |
Loans repaid | 23 | (11,834.7) | (1,572.9) | (2,296.9) |
Net cash from/(used in) financing activities | | 5,445.8 | (20.9) | (673.3) |
| | | | |
Net increase/(decrease) in cash and cash equivalents | | 407.5 | 154.5 | (929.5) |
Effect of exchange rate fluctuations on cash held | | (157.0) | - | - |
Cash and cash equivalents at beginning of the year | | 717.4 | 562.9 | 1,492.4 |
Cash and cash equivalents at end of the year | 20 | 967.9 | 717.4 | 562.9 |
The accompanying notes form an integral part of these consolidated financial statements.
| |
Sibanye Annual Financial Report 2016 | 122 |
Table of Contents
NOTES TO THE CONSOLIDATED FINANCIAL STATEMENTS
FOR THE YEAR ENDED 31 DECEMBER 2016
1. ACCOUNTING POLICIES
The principal accounting policies applied in the preparation of these consolidated financial statements are set out below. Where an accounting policy is specific to a note, the policy is described in the note which it relates to. These policies have been consistently applied to all the periods presented, however the accounting policies have been expanded for the Platinum Group Metals (PGM) assets (due to the Aquarius and the Rustenburg Operations acquisitions).
1.1 REPORTING ENTITY
Sibanye Gold Limited (Sibanye, the Group or the Company) is a South African focused gold and platinum producer, listed on the Main Board of the JSE Limited (JSE) and New York Stock Exchange (NYSE). Sibanye’s Gold Division consists of Driefontein, Kloof, Beatrix and Cooke operations. Sibanye’s Platinum Division consists of the newly acquired 50% owned operations of Kroondal and Mimosa, Platinum Mile and the Rustenburg Operations. Sibanye’s Gold and Platinum divisions as well as a number of service company subsidiaries are, collectively referred to as the Group.
1.2 BASIS OF PREPARATION
The consolidated financial statements for the year ended 31 December 2016 have been prepared on a going concern basis in accordance with International Financial Reporting Standards (IFRS), as issued by the International Accounting Standards Board (IASB), the South African Institute of Chartered Accountants Financial Reporting Guides issued by the Accounting Practices Committee and Financial Reporting Pronouncements issued by the Financial Reporting Standards Council, as well as the requirements of the South African Companies Act and JSE Listings Requirements. The consolidated annual financial statements have been prepared under the historical cost convention, except for financial assets and financial liabilities (including derivative instruments), which are measured at fair value through profit or loss.
STANDARDS, INTERPRETATIONS AND AMENDMENTS TO PUBLISHED STANDARDS EFFECTIVE FOR THE YEAR ENDED 31 DECEMBER 2016
During the financial year, the following new and revised accounting standards and amendments to standards became effective and had no significant impact on the Group’s financial statements:
| | |
Pronouncement | Title | Effective date |
IAS 1 Presentation of Financial Statement (Amendment) | Disclosure Initiative | 1 January 2016 |
Amendments to IAS 16 Property, Plant and Equipment and IAS 38 Intangible Assets | Clarification of Acceptable Methods of Depreciation and Amortisation | 1 January 2016 |
Amendments to 4 standards | Improvements to IFRSs 2012-2014 cycle | 1 January 2016 |
During the financial year, the following new and revised accounting standards and amendments to standards became effective and had an impact on the Group’s financial statements:
| | |
Pronouncement | Title | Effective date |
IFRS 11 Joint Arrangement (Amendment) | Accounting for Acquisitions of Interests in Joint Operations
The amendments add new guidance on how to account for the acquisition of an interest in a joint operation that constitutes a business which specify the appropriate accounting treatment for such acquisitions.
The impacts have been applied to the Aquarius acquisition and related acquisition method of accounting. | 1 January 2016 |
STANDARDS, INTERPRETATIONS AND AMENDMENTS TO PUBLISHED STANDARDS WHICH ARE NOT YET EFFECTIVE
Certain new standards, amendments and interpretations to existing standards have been published that apply to the Group’s accounting periods beginning on or after 1 January 2017 but have not been early adopted by the Group. The standards, amendments and interpretations that are applicable to the Group are:
| |
Sibanye Annual Financial Report 2016 | 123 |
Table of Contents
NOTES TO THE CONSOLIDATED FINANCIAL STATEMENTS continued
FOR THE YEAR ENDED 31 DECEMBER 2016
| | |
Pronouncement | Title | Effective date1 |
IFRS 2 Share-based payment
(Amendments) | Classification and Measurement of Share-based Payment Transactions The amendments clarify three main areas: • The effects of vesting conditions on measurement of a cash-settled share-based payment transaction. • The classification of a share-based payment transaction with net settlement features for withholding tax obligations. • The accounting where a modification to the terms and conditions of a share-based payment transaction changes its classification from cash-settled to equity-settled. | 1 January 2018 |
IFRS 9 Financial instruments (New standard) | IFRS 9 arises from a three-part project to replace IAS 39 Financial Instruments: Recognition and Measurement. IFRS 9 addresses the classification, measurement and derecognition of financial assets and financial liabilities, introduces new rules for hedge accounting, and a new impairment model for financial assets. The Group has performed a preliminary assessment of the potential impact of adoption of IFRS 9 based on its positions at 31 December 2016, which is subject to changes arising from further detailed analyses or additional reasonable and supportable information being made available to the Group in the future. Overall, the Group does not expect that the new guidance, if applied at 31 December 2016, would have had a significant impact on its balance sheet. The Group expects to continue measuring environmental rehabilitation obligation funds at fair value. Financial assets, and trade and other receivables are held to collect contractual cash flows and have contractual cash flows that are solely payments of principal and interest. The Group therefore expects that these will continue to be measured at amortised cost under IFRS 9. The Group however will analyse the contractual cash flow characteristics of those instruments in more detail before concluding whether all those instruments meet the criteria for amortised cost measurement under IFRS 9. There will be no impact on the Group’s accounting for financial liabilities, as the new requirements only affect the accounting for financial liabilities that are designated at fair value through profit or loss and the Group does not have any such liabilities. IFRS 9 requires the Group to record expected credit losses on all of its loans and trade receivables, either on a 12-month or lifetime basis. The Group expects to apply the simplified approach and record lifetime expected losses on all trade receivables. The Group is assessing the extent of this impact, but, in general, expects that the application of the expected credit loss model will result in earlier recognition of credit losses. The new standard also introduces expanded disclosure requirements and changes in presentation. These are expected to change the nature and extent of the Group’s disclosures about its financial instruments particularly in the year of the adoption of the new standard. The Group does not intend to adopt IFRS 9 before the effective date. | 1 January 2018 |
| |
Sibanye Annual Financial Report 2016 | 124 |
Table of Contents
NOTES TO THE CONSOLIDATED FINANCIAL STATEMENTS continued
FOR THE YEAR ENDED 31 DECEMBER 2016
| | |
Pronouncement | Title | Effective date 1 |
IFRS 15 Revenue from Contracts with Customers (New standard) | IFRS 15 will supersede the current revenue recognition guidance including IAS 18 Revenue, IAS 11 Construction Contracts and the related interpretation when it becomes effective. IFRS 15 establishes a single comprehensive five-step model to account for revenue arising from contracts with customers and is based on the core principle that revenue is recognised when control of a good or service transfers to a customer. The Group has performed a preliminary assessment of the potential impact of IFRS 15, which is subject to changes arising from a more detailed ongoing analysis. Revenue from gold sales is currently recognised when the gold is delivered to the refinery, which is taken to be the point in time at which the related risks and rewards of ownership transfers. Revenue is recognised at this point provided that the revenue and costs can be measured reliably, the recovery of the consideration is probable and there is no continuing management involvement. The Group expects that the revenue from gold sales will still be recognised when the gold is delivered to the refinery, as this is when control is considered to be transferred. Revenue from PGM concentrate sales is currently recognised when the risks and rewards of ownership of the mine product are passed to the buyer pursuant to a sale contract. The Group expects that the revenue from PGM concentrate sales will still be recognised when the concentrate is delivered to the customer, as this is when control is considered to be transferred. The Group is performing more detailed assessments of the impact resulting from the application of IFRS 15 and expects to disclose additional information before it adopts IFRS 15. The Group does not intend to adopt IFRS 15 before the effective date. | 1 January 2018 |
IFRS 16 Leases (New standard) | IFRS 16 replaces the previous lease standard IAS 17 Leases and related interpretations. IFRS 16 has one model for lessees which will result in almost all leases being recognised on balance sheet as the distinction between operating and finance leases is removed. The only exceptions are short-term and low-value leases. At the commencement date of a lease, a lessee will recognise a liability to make lease payments (i.e. the lease liability) and an asset representing the right to use the underlying asset during the lease term (i.e. the right-of-use asset). The Group plans to assess the potential effect of IFRS 16 on its consolidated financial statements in 2017. The Group does not intend to adopt IFRS 16 before the effective date. | 1 January 2019 |
IAS 7 Statements of Cash Flows (Amendment) | Disclosure initiative The amendments require entities to disclose information about changes in financing liabilities. | 1 January 2017 |
IAS 12 Income Taxes (Amendment) | Recognition of Deferred Tax Assets for Unrealised Losses The amendments clarify the requirements on recognition of deferred tax assets for unrealised losses on debt instruments measured at fair value. | 1 January 2017 |
1 Effective date refers to annual period beginning on or after said date.
SIGNIFICANT ACCOUNTING JUDGEMENTS AND ESTIMATES
Use of estimates: The preparation of the financial statements requires the Group’s management to make estimates and assumptions that affect the reported amounts of assets and liabilities and disclosure of contingent assets and liabilities at the date of the financial statements, and the reported amounts of revenues and expenses during the reporting period. The determination of estimates requires the exercise of judgement based on various assumptions and other factors such as historical experience, current and expected economic conditions, and in some cases actuarial techniques. Actual results could differ from those estimates.
The more significant areas requiring the use of management estimates and assumptions relate to Mineral Reserves that are the basis of future cash flow estimates and unit-of-production depreciation and amortisation calculations, impairments, reversal of
| |
Sibanye Annual Financial Report 2016 | 125 |
Table of Contents
NOTES TO THE CONSOLIDATED FINANCIAL STATEMENTS continued
FOR THE YEAR ENDED 31 DECEMBER 2016
impairments, revenue recognition, joint arrangements, write-downs of inventory to net realisable value, deferred tax, borrowings, environmental, reclamation and closure obligations, and contingent liabilities.
Estimates and judgements are continually evaluated and are based on historical experience and other factors, including expectations of future events that are believed to be reasonable under the circumstances.
The estimates and assumptions that have a significant risk of causing a material adjustment to the carrying amounts of assets and liabilities within the financial period are discussed under the relevant note of the item affected.
1.3 CONSOLIDATION
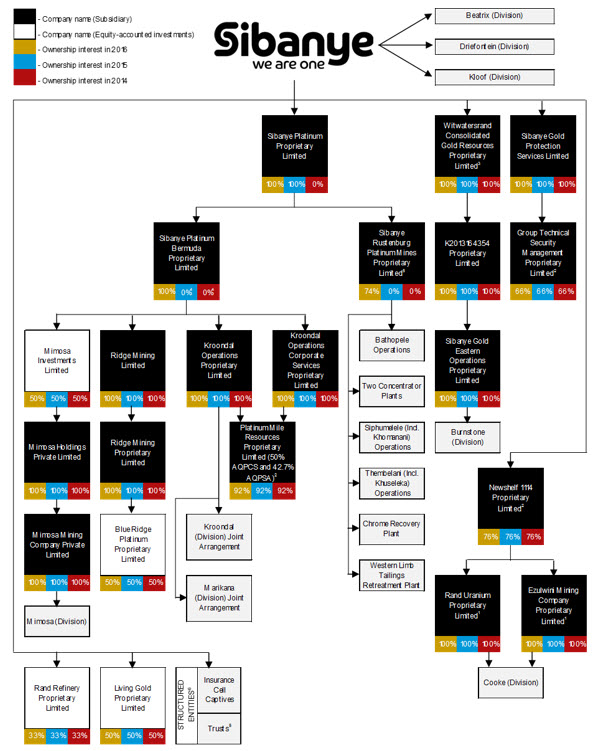
| |
Sibanye Annual Financial Report 2016 | 126 |
Table of Contents
NOTES TO THE CONSOLIDATED FINANCIAL STATEMENTS continued
FOR THE YEAR ENDED 31 DECEMBER 2016
1 Rand Uranium Proprietary Limited (Rand Uranium) and Ezulwini Mining Company Proprietary Limited (Ezulwini) together own a number of underground and surface mining operations. These operations report to the Group’s chief operating decision maker (the Executive Committee) as a separate segment, namely Cooke.
2 The non-controlling interests in the statement of changes in equity relates to the attributable share of accumulated profits of the Newshelf 1114 Proprietary Limited (Newshelf 1114) group, Goldfields Technical Security Management Proprietary Limited (GTSM) and Platinum Mile Resources Proprietary Limited (Platinum Mile) (refer to note 22).
3 Witwatersrand Consolidated Gold Resources Proprietary Limited (Wits Gold) has ceded and pledged its shares in K2013164354 Proprietary Limited (K2013) (a dormant entity) and K2013 has ceded and pledged it shares in Sibanye Gold Eastern Operations Proprietary Limited (SGEO) in favour of the lenders of the Burnstone Debt (refer to note 23.4).
4 In terms of the Aquarius Transaction (refer to note 12.1) Sibanye acquired all of the shares in Aquarius Platinum Limited (Aquarius), and Sibanye Platinum Bermuda Proprietary Limited and Aquarius were amalgamated. Aquarius’ ownership in its subsidiaries remained unchanged.
5 In terms of the Rustenburg Operations Transaction (refer to note 12.2) a 26% stake in Sibanye Rustenburg Platinum Mines Proprietary Limited (SRPM) was acquired through Newshelf 1335 Proprietary Limited (BBBEE SPV). The shareholders of BBBEE SPV are Rustenburg Mine Employees Trust (30.4%), Rustenburg Mine Community Development Trust (24.8%) Bakgatla-Ba-Kgafela Investment Holdings (24.8%) and Siyanda Resources Proprietary Limited (20.0%). The Rustenburg Mine Employees Trust and the Rustenburg Mine Community Development Trust are controlled and consolidated by Sibanye.
6 The Group has no current or contractual obligation to provide financial support to any of its structured entities.
SUBSIDIARIES
Subsidiaries are all entities over which the Group exercises control. The Group controls an entity when it is exposed to, or has rights to, variable returns from its involvement with the entity and has the ability to affect those returns through its power over the entity. Subsidiaries are consolidated from the date on which control is obtained by the Group until the date on which control ceases.
Inter-company transactions, balances and unrealised gains on transactions between Group companies are eliminated. Unrealised losses are also eliminated. Accounting policies of subsidiaries have been changed where necessary to ensure consistency with the policies adopted by the Group.
STRUCTURED ENTITIES
Structured entities are those entities that have been designed so that voting (or similar) rights are not the dominant factor in deciding who controls the entity. Structured entities controlled by the Group are consolidated.
TRANSACTIONS WITH SHAREHOLDERS OF SIBANYE
Transactions with owners in the capacity as equity participants are not recognised in profit or loss, but instead are recognised in equity with a corresponding change in assets or liabilities.
1.4 FOREIGN CURRENCIES
FUNCTIONAL AND PRESENTATION CURRENCY
Items included in the financial statements of each of the Group’s entities are measured using the currency of the primary economic environment in which the entity operates (the functional currency) which is South African rand. The consolidated financial statements are presented in South African rand, which is the Group’s presentation currency.
TRANSACTIONS AND BALANCES
Foreign currency transactions are translated into the functional currency using the exchange rates prevailing at the dates of the transactions. Translation of monetary assets and liabilities into the functional currency is done as at 31 December 2016. Foreign exchange gains and losses resulting from the settlement of such transactions and from the translation of monetary assets and liabilities denominated in foreign currencies, are recognised in profit or loss.
FOREIGN OPERATIONS
The results and financial position of all the Group entities (none of which has the currency of a hyperinflationary economy) that have a functional currency different from the presentation currency are translated into the presentation currency as follows:
| · | | Assets and liabilities are translated at the exchange rate ruling at the reporting date. Equity items are translated at historical rates. The income and expenses are translated at the average exchange rate for the year, unless this average was not a reasonable approximation of the rates prevailing on the transaction dates, in which case these items were translated at the rate prevailing on the date of the transaction. Exchange differences on translation are accounted for in other comprehensive income. These differences will be recognised in profit or loss upon realisation of the underlying operation. |
| · | | On consolidation, exchange differences arising from the translation of the net investment in foreign operations (i.e. the reporting entity’s interest in the net assets of that operation), and of borrowings and other currency instruments designated as hedges of such investments, are taken to other comprehensive income. When a foreign operation is sold, exchange differences that were recorded in other comprehensive income are recognised in profit or loss as part of the gain or loss on disposal. If the Group disposes of part of its interest in a subsidiary but retains control, then the relevant proportion of the cumulative amount is reattributed to non-controlling interests. When the Group disposes of only part of an associate or joint venture while retaining significant influence or joint control, the relevant proportion of the cumulative amount is reclassified to profit or loss. |
| |
Sibanye Annual Financial Report 2016 | 127 |
Table of Contents
NOTES TO THE CONSOLIDATED FINANCIAL STATEMENTS continued
FOR THE YEAR ENDED 31 DECEMBER 2016
| · | | Goodwill and fair value adjustments arising on the acquisition of a foreign operation are treated as assets and liabilities of the foreign operation and are translated at each reporting date at the closing rate. |
1.5 COMPARATIVES
Where necessary comparative periods may be adjusted to conform to changes in presentation.
With effect from 1 April 2016, since acquisition of Aquarius, the Group changed the reconciliation of the Group’s income tax to the South African statutory company tax rate of 28% to better reconcile the effective tax of both the Gold and Platinum divisions. The Group’s income tax was previously reconciled to the maximum South African gold mining tax rate of 34%. The previous comparative periods’ reconciliation has been changed to conform to the current year’s presentation. This change has no effect on financial performance, financial position and cash flows.
| |
Sibanye Annual Financial Report 2016 | 128 |
Table of Contents
NOTES TO THE CONSOLIDATED FINANCIAL STATEMENTS continued
FOR THE YEAR ENDED 31 DECEMBER 2016
2. SEGMENT REPORTING
ACCOUNTING POLICY
Operating segments are reported in a manner consistent with the internal reporting provided to the chief operating decision maker and is based on individual mining operations. The chief operating decision maker, who is responsible for allocating resources and assessing performance of the operating segments, has been identified as the Executive Committee that makes strategic decisions.
| | | | | | | | | | | | | |
Figures in million - SA rand | Group | Total
Gold | Driefontein | Kloof | Beatrix | Cooke | Corporate
and
reconciling
items1 | Total
Platinum | Kroondal2 | Platinum
Mile2 | Mimosa2 | Rustenburg
Operations3 | Corporate
and
reconciling
items1 |
31 December 2016 | | | | | | | | | | | | | |
Revenue | 31,240.7 | 27,501.3 | 9,401.1 | 8,890.9 | 5,883.9 | 3,362.2 | (36.8) | 3,739.4 | 1,973.3 | 131.1 | 1,223.2 | 1,656.0 | (1,244.2) |
Underground revenue | 28,026.5 | 24,608.4 | 8,105.3 | 8,012.6 | 5,626.9 | 2,900.4 | (36.8) | 3,418.1 | 1,973.3 | - | 1,223.2 | 1,465.8 | (1,244.2) |
Surface revenue | 3,214.2 | 2,892.9 | 1,295.8 | 878.3 | 257.0 | 461.8 | - | 321.3 | - | 131.1 | - | 190.2 | - |
Operating costs4 | (20,709.1) | (17,346.0) | (5,566.6) | (5,041.0) | (3,753.4) | (2,985.0) | - | (3,363.1) | (1,689.8) | (90.8) | (969.0) | (1,582.5) | 969.0 |
Underground operating costs | (18,800.6) | (15,655.1) | (4,852.1) | (4,609.4) | (3,567.4) | (2,626.2) | - | (3,145.5) | (1,689.8) | - | (969.0) | (1,455.7) | 969.0 |
Surface operating costs | (1,908.5) | (1,690.9) | (714.5) | (431.6) | (186.0) | (358.8) | - | (217.6) | - | (90.8) | - | (126.8) | - |
Operating profit5 | 10,531.6 | 10,155.3 | 3,834.5 | 3,849.9 | 2,130.5 | 377.2 | (36.8) | 376.3 | 283.5 | 40.3 | 254.2 | 73.5 | (275.2) |
Amortisation and depreciation | (4,041.9) | (3,814.7) | (1,012.9) | (1,190.7) | (818.0) | (770.8) | (22.3) | (227.2) | (136.2) | (1.2) | (223.7) | (58.6) | 192.5 |
Net operating profit | 6,489.7 | 6,340.6 | 2,821.6 | 2,659.2 | 1,312.5 | (393.6) | (59.1) | 149.1 | 147.3 | 39.1 | 30.5 | 14.9 | (82.7) |
Interest income | 331.4 | 289.6 | 70.8 | 62.3 | 34.1 | 32.5 | 89.9 | 41.8 | 12.0 | (9.0) | 0.5 | 8.2 | 30.1 |
Finance expense | (903.1) | (806.2) | (143.1) | (156.0) | (77.6) | (75.8) | (353.7) | (96.9) | (1.4) | - | (11.2) | (26.2) | (58.1) |
Share-based payments | (255.9) | (255.9) | (16.5) | (13.7) | (9.1) | - | (216.6) | - | - | - | - | - | - |
Net other costs6 | (1,158.6) | (1,029.3) | (226.1) | (187.9) | (170.5) | (115.0) | (329.8) | (129.3) | (65.8) | (0.6) | 187.7 | (92.2) | (158.4) |
Non-recurring items7 | 557.3 | (1,548.5) | (20.8) | 15.7 | (12.6) | (1,423.9) | (106.9) | 2,105.8 | (1.3) | - | - | 2,354.6 | (247.5) |
Royalties | (546.6) | (528.0) | (204.8) | (194.3) | (113.2) | (15.7) | - | (18.6) | - | - | (82.9) | (8.3) | 72.6 |
Current taxation | (1,111.8) | (1,111.3) | (472.3) | (422.0) | (223.0) | (1.1) | 7.1 | (0.5) | - | - | (22.8) | - | 22.3 |
Deferred taxation | (131.4) | (164.5) | (64.3) | (148.5) | 19.4 | 35.3 | (6.4) | 33.1 | - | (11.6) | 13.1 | 27.0 | 4.6 |
Profit for the year | 3,271.0 | 1,186.5 | 1,744.5 | 1,614.8 | 760.0 | (1,957.3) | (975.5) | 2,084.5 | 90.8 | 17.9 | 114.9 | 2,278.0 | (417.1) |
Attributable to: | | | | | | | | | | | | | - |
Owners of the parent | 3,701.6 | 1,619.4 | 1,744.5 | 1,614.8 | 760.0 | (1,523.1) | (976.8) | 2,082.2 | 90.8 | 15.6 | 114.9 | 2,278.0 | (417.1) |
Non-controlling interest holders | (430.6) | (432.9) | - | - | - | (434.2) | 1.3 | 2.3 | - | 2.3 | - | - | - |
Sustaining capital expenditure | 1,010.5 | 683.5 | 218.5 | 261.2 | 84.8 | 48.9 | 70.1 | 327.0 | 175.8 | 1.3 | 159.8 | 148.7 | (158.6) |
Ore reserve development | 2,394.4 | 2,394.4 | 779.0 | 912.9 | 542.9 | 159.6 | - | - | - | - | - | - | - |
Growth projects | 746.3 | 746.3 | 54.1 | 130.1 | 0.7 | 40.7 | 520.7 | - | - | - | - | - | - |
Total capital expenditure | 4,151.2 | 3,824.2 | 1,051.6 | 1,304.2 | 628.4 | 249.2 | 590.8 | 327.0 | 175.8 | 1.3 | 159.8 | 148.7 | (158.6) |
1 Corporate and reconciling items represents the items to reconcile segment data to consolidated financial statement totals.
2 The performance of Kroondal, Platinum Mile and Mimosa is for the nine months ended 31 December 2016 since acquisition (refer to note 12.1). The Mimosa segment information reflects the financial information provided to the chief operating decision maker. In the consolidated financial statements this operating segment is accounted for using the equity method which differs from the measures used by the chief operating decision maker.
3 Rustenburg Operations’ performance is for two months ended 31 December 2016 since acquisition (refer to note 12.2).
4 Operating costs is defined as cost of sales before amortisation and depreciation.
5 Operating profit is defined as revenue minus operating cost.
6 Net other costs consists of loss on financial instruments, loss on foreign exchange differences, other income and other costs as detailed in profit or loss. Corporate and reconciling items net other costs includes the share of results equity-accounted investees after tax as detailed in profit or loss.
7 Non-recurring items consists of share-based payment on BEE transaction, impairment, gain on disposal of property, plant and equipment, gain on acquisition, transaction costs and restructuring costs as detailed in profit or loss.
| |
Sibanye Annual Financial Report 2016 | 129 |
Table of Contents
NOTES TO THE CONSOLIDATED FINANCIAL STATEMENTS continued
FOR THE YEAR ENDED 31 DECEMBER 2016
| | | | | | |
Figures in million - SA rand | Group | Driefontein | Kloof | Beatrix | Cooke | Corporate and reconciling items1 |
31 December 2015 | | | | | | |
Revenue | 22,717.4 | 8,236.0 | 6,691.4 | 4,815.5 | 2,974.5 | - |
Underground revenue | 20,515.0 | 7,284.1 | 6,112.8 | 4,555.7 | 2,562.4 | - |
Surface revenue | 2,202.4 | 951.9 | 578.6 | 259.8 | 412.1 | - |
Operating costs2 | (16,380.4) | (5,234.2) | (4,777.2) | (3,391.0) | (2,978.0) | - |
Underground operating costs | (14,940.8) | (4,681.2) | (4,454.9) | (3,184.5) | (2,620.2) | - |
Surface operating costs | (1,439.6) | (553.0) | (322.3) | (206.5) | (357.8) | - |
Operating profit3 | 6,337.0 | 3,001.8 | 1,914.2 | 1,424.5 | (3.5) | - |
Amortisation and depreciation | (3,636.6) | (1,142.6) | (1,029.3) | (739.4) | (704.6) | (20.7) |
Net operating profit | 2,700.4 | 1,859.2 | 884.9 | 685.1 | (708.1) | (20.7) |
Interest income | 257.0 | 67.5 | 50.6 | 31.3 | 27.1 | 80.5 |
Finance expense | (561.8) | (147.7) | (150.1) | (57.2) | (61.3) | (145.5) |
Share-based payments | (274.4) | (35.1) | (27.6) | (23.5) | - | (188.2) |
Net other costs4 | (575.1) | (77.9) | (60.4) | (47.3) | (30.1) | (359.4) |
Non-recurring items5 | (230.1) | (2.9) | 7.2 | (8.4) | (31.8) | (194.2) |
Royalties | (400.6) | (196.8) | (98.4) | (88.7) | (16.7) | - |
Current taxation | (696.7) | (430.8) | (97.4) | (153.4) | - | (15.1) |
Deferred taxation | 319.5 | 53.4 | 0.9 | 18.0 | 122.0 | 125.2 |
Profit for the year | 538.2 | 1,088.9 | 509.7 | 355.9 | (698.9) | (717.4) |
Attributable to: | | | | | | |
Owners of the parent | 716.9 | 1,088.9 | 509.7 | 355.9 | (519.9) | (717.7) |
Non-controlling interest holders | (178.7) | - | - | - | (179.0) | 0.3 |
Sustaining capital expenditure | 668.9 | 249.2 | 225.6 | 86.1 | 92.9 | 15.1 |
Ore reserve development | 2,304.9 | 727.0 | 840.6 | 510.4 | 226.9 | - |
Growth projects | 371.0 | 18.0 | 63.7 | - | 17.6 | 271.7 |
Total capital expenditure | 3,344.8 | 994.2 | 1,129.9 | 596.5 | 337.4 | 286.8 |
1 Corporate represents the items to reconcile segment data to consolidated financial statement totals. This does not represent a separate segment as it does not generate mining revenue.
2 Operating costs is defined as cost of sales before amortisation and depreciation.
3 Operating profit is defined as revenue minus operating cost.
4 Net other costs consists of loss on financial instruments, loss on foreign exchange differences, other income and other costs as detailed in profit or loss. Corporate and reconciling items net other costs includes the share of results of equity-accounted investees after tax as detailed in profit or loss.
5 Non-recurring items consists of gain on disposal of property, plant and equipment, transaction costs, restructuring costs and net loss on derecognition of financial guarantee asset and liability as detailed in profit or loss.
| |
Sibanye Annual Financial Report 2016 | 130 |
Table of Contents
NOTES TO THE CONSOLIDATED FINANCIAL STATEMENTS continued
FOR THE YEAR ENDED 31 DECEMBER 2016
| | | | | | |
Figures in million - SA rand | Group | Driefontein | Kloof | Beatrix | Cooke1 | Corporate and reconciling items2 |
31 December 2014 | | | | | | |
Revenue | 21,780.5 | 7,829.4 | 7,502.8 | 4,566.3 | 1,882.0 | - |
Underground revenue | 19,908.7 | 7,200.2 | 6,887.3 | 4,228.8 | 1,592.4 | - |
Surface revenue | 1,871.8 | 629.2 | 615.5 | 337.5 | 289.6 | - |
Operating costs3 | (14,311.4) | (4,912.3) | (4,502.3) | (3,204.0) | (1,692.8) | - |
Underground operating costs | (13,032.2) | (4,427.6) | (4,087.0) | (3,052.1) | (1,465.5) | - |
Surface operating costs | (1,279.2) | (484.7) | (415.3) | (151.9) | (227.3) | - |
Operating profit4 | 7,469.1 | 2,917.1 | 3,000.5 | 1,362.3 | 189.2 | - |
Amortisation and depreciation | (3,254.7) | (1,129.3) | (1,322.3) | (468.4) | (308.3) | (26.4) |
Net operating profit | 4,214.4 | 1,787.8 | 1,678.2 | 893.9 | (119.1) | (26.4) |
Interest income | 183.2 | 48.3 | 42.7 | 24.5 | 14.7 | 53.0 |
Finance expense | (400.0) | (152.8) | (132.6) | (41.8) | (56.5) | (16.3) |
Share-based payments | (417.9) | (69.1) | (58.2) | (45.9) | - | (244.7) |
Net other costs5 | (750.8) | (86.3) | (56.6) | (65.9) | (10.9) | (531.1) |
Non-recurring items6 | (63.4) | (95.1) | (152.0) | 469.4 | (17.9) | (267.8) |
Royalties | (430.5) | (165.5) | (174.5) | (82.1) | (8.4) | - |
Current taxation | (879.2) | (339.2) | (379.6) | (153.9) | - | (6.5) |
Deferred taxation | 51.1 | 9.8 | 71.3 | (128.5) | 10.3 | 88.2 |
Profit for the year | 1,506.9 | 937.9 | 838.7 | 869.7 | (187.8) | (951.6) |
Attributable to: | | | | | | |
Owners of the parent | 1,551.5 | 937.9 | 838.7 | 869.7 | (143.2) | (951.6) |
Non-controlling interest holders | (44.6) | - | - | - | (44.6) | - |
Sustaining capital expenditure | 991.5 | 465.3 | 355.7 | 101.9 | 51.7 | 16.9 |
Ore reserve development | 2,126.5 | 683.6 | 879.8 | 446.1 | 117.0 | - |
Growth projects | 132.8 | - | - | - | 61.2 | 71.6 |
Total capital expenditure | 3,250.8 | 1,148.9 | 1,235.5 | 548.0 | 229.9 | 88.5 |
1 Cooke’s performance is for the seven months ended 31 December 2014 since acquisition.
2 Corporate represents the items to reconcile segment data to consolidated financial statement totals. This does not represent a separate segment as it does not generate mining revenue.
3 Operating costs is defined as cost of sales before amortisation and depreciation.
4 Operating profit is defined as revenue minus operating cost.
5 Net other costs consists of loss on financial instruments, loss on foreign exchange differences, other income and other costs as detailed in profit or loss. Corporate and reconciling net other costs includes the share of results of equity-accounted investees after tax as detailed in profit or loss.
6 Non-recurring items consists of impairments, reversal of impairment, gain on disposal of property, plant and equipment, transaction costs and restructuring costs as detailed in profit or loss.
| |
Sibanye Annual Financial Report 2016 | 131 |
Table of Contents
NOTES TO THE CONSOLIDATED FINANCIAL STATEMENTS continued
FOR THE YEAR ENDED 31 DECEMBER 2016
3. REVENUE
SIGNIFICANT ACCOUNTING JUDGEMENTS AND ESTIMATES
The determination of PGM concentrate sales revenue from the time of initial recognition of the sale on a provisional basis through to final pricing requires management to continuously re-estimate the fair value of the price adjustment feature. Management determines this with reference to estimated forward prices using consensus forecasts.
ACCOUNTING POLICY
Revenue is recognised to the extent that it is probable that economic benefits will flow to the Group and the amount of revenue can be reliably measured.
Revenue arising from gold sales is recognised at the fair value of the consideration received or receivable, once the significant risks and rewards of ownership have passed to the buyer. These criteria are typically met when the gold is delivered to the refinery. The price of gold is determined by market forces.
Revenue arising from PGM concentrate sales is recognised when risks and rewards of ownership of the mine product are passed to the buyer pursuant to a sales contract. The sales price is determined on a provisional basis at the date of delivery. Adjustments to the sale price occur based on movements in the metal market price up to the date of final pricing. Final pricing is based on the monthly average market price in the month of settlement. The period between provisional invoicing and final pricing is typically between two and four months. Revenue on provisionally priced sales is initially recorded at the estimated fair value of the consideration receivable. The revenue adjustment mechanism embedded within provisionally priced sales arrangements has the characteristics of a commodity derivative. Accordingly, the fair value of the final sales price adjustment is re-estimated continuously and changes in fair value recognised as an adjustment to revenue in profit or loss and trade receivables in the statement of financial position. In all cases, fair value is determined with reference to estimated forward prices using consensus forecasts.
| | | | |
Figures in million - SA rand | | 2016 | 2015 | 2014 |
Revenue from: | | | | |
Gold mining activities | | 27,501.3 | 22,717.4 | 21,780.5 |
Platinum mining activities | | 3,739.4 | - | - |
Total revenue | | 31,240.7 | 22,717.4 | 21,780.5 |
4. COST OF SALES
ACCOUNTING POLICY
The following accounting policies relates to some costs that are included in cost of sales:
Short-term employee benefits
Short-term employee benefits are expensed as the related service is provided. A liability is recognised for the amount expected to be paid if the Group has a present legal or constructive obligation to pay this amount as a result of past service provided by the employee and the obligation can be reliably estimated.
Pension and provident funds
The Group operates a defined contribution retirement plan and contributes to a number of industry-based defined contribution retirement plans. The retirement plans are funded by payments from employees and Group companies.
Contributions to defined contribution funds are expensed as incurred.
| | | | |
Figures in million - SA rand | Notes | 2016 | 2015 | 2014 |
Salaries and wages | | (9,276.1) | (7,345.0) | (6,664.9) |
Consumable stores | 18 | (5,243.2) | (3,995.7) | (3,480.4) |
Utilities | | (3,709.0) | (3,128.2) | (2,753.3) |
Mine contracts | | (2,105.3) | (1,457.9) | (1,136.4) |
Other | | (2,769.9) | (2,758.5) | (2,402.9) |
Ore reserve development costs capitalised | 11 | 2,394.4 | 2,304.9 | 2,126.5 |
Operating costs | | (20,709.1) | (16,380.4) | (14,311.4) |
Amortisation and depreciation | 11 | (4,041.9) | (3,636.6) | (3,254.7) |
Total cost of sales | | (24,751.0) | (20,017.0) | (17,566.1) |
All employees are members of various defined contribution retirement plans. The cost of providing retirement benefits for the year amounted to R626.0 million (2015: R691.1 million and 2014: R558.5 million).
| |
Sibanye Annual Financial Report 2016 | 132 |
Table of Contents
NOTES TO THE CONSOLIDATED FINANCIAL STATEMENTS continued
FOR THE YEAR ENDED 31 DECEMBER 2016
5. FINANCE EXPENSE
ACCOUNTING POLICY
Finance expense comprises interest on borrowings, post-retirement healthcare obligation and environmental rehabilitation obligation offset by borrowing costs capitalised on qualifying assets.
Interest payable on borrowings is recognised in profit or loss over the term of the borrowings using the effective interest method. Cash flows from interest paid are classified under operating activities in the statement of cash flows.
| | | | |
Figures in million - SA rand | Notes | 2016 | 2015 | 2014 |
Interest charge on: | | | | |
Borrowings - interest paid | 23 | (427.5) | (247.9) | (187.7) |
Borrowings - unwinding of amortised cost | 23 | (141.4) | (102.3) | (43.3) |
Environmental rehabilitation obligation | 24 | (291.4) | (197.9) | (161.5) |
Post-retirement healthcare obligation | | (1.2) | (1.4) | (1.2) |
Other | | (41.6) | (12.3) | (6.3) |
Total finance expense | | (903.1) | (561.8) | (400.0) |
6. SHARE-BASED PAYMENTS
ACCOUNTING POLICY
The Group operates an equity-settled compensation plan in which certain employees of the Group participate. The fair value of the equity-settled instruments is measured by reference to the fair value of the equity instrument granted.
Fair value is based on market prices of the equity-settled instruments granted, if available, taking into account the terms and conditions upon which those equity-settled instruments were granted. Fair value of equity-settled instruments granted is estimated using appropriate valuation models and appropriate assumptions at the grant date. Non-market vesting conditions (service period prior to vesting) are not taken into account when estimating the fair value of the equity-settled instruments at grant date. Market conditions are taken into account in determining the fair value at grant date.
The grant date fair value of the equity-settled instruments is recognised as an employee benefit expense over the vesting period based on the Group’s estimate of the number of instruments that will eventually vest, with a corresponding increase in the share-based payment reserve. Vesting assumptions for non-market conditions are reviewed at each reporting date to ensure they reflect current expectations.
The Group also operates a cash-settled compensation plan in which certain employees of the Group participate. In terms of the Rustenburg Operations acquisition, the Group issued cash-settled instruments to BEE shareholders. The grant date fair value of the cash-settled instruments is equal to the value of the equity-settled instrument granted on the same grant date.
The grant date fair value of the cash-settled instruments is recognised as an employee benefit expense or share-based payment on BEE transaction over the vesting period based on the Group’s estimate of the number of instruments that will eventually vest, with a corresponding increase in the share-based payment obligation. At each reporting date the obligation is remeasured to the fair value of the instrument, to reflect the potential outflow of cash resources to settle the liability, with a corresponding adjustment to gain or loss on financial instrument in profit or loss. Vesting assumptions for non-market conditions are reviewed at each reporting date to ensure they reflect current expectations.
Where the terms of an equity-settled or a cash-settled award are modified, the originally determined expense is recognised as if the terms had not been modified. In addition, an expense is recognised for any modification, which increases the total fair value of the share-based payment arrangement, or is otherwise beneficial to the participant as measured at the date of the modification.
| | | | |
Figures in million - SA rand | Notes | 2016 | 2015 | 2014 |
Sibanye Gold Limited 2013 Share Plan | 6.1 | (172.1) | (119.1) | (175.8) |
Performance shares | | (145.5) | (96.2) | (147.7) |
Bonus shares | | (26.6) | (22.9) | (28.1) |
Sibanye Gold Limited Phantom Share Scheme | 6.2 | (83.8) | (155.3) | (242.1) |
Performance shares | | (83.8) | (136.4) | (138.7) |
Bonus shares | | - | (17.7) | (96.7) |
Phantom share dividends | | - | (1.2) | (6.7) |
Share-based payment on BEE transaction | 6.3 | (240.3) | - | - |
Total share-based payments | | (496.2) | (274.4) | (417.9) |
6.1 SIBANYE GOLD LIMITED 2013 SHARE PLAN
On 21 November 2012 the shareholder of Sibanye approved the adoption of the Sibanye Gold Limited 2013 Share Plan (SGL Share Plan) with effect from the date of listing. The SGL Share plan provides for two methods of participation, namely Performance Shares (PS) and the Bonus Shares (BS). This plan seeks to attract, retain, motivate and reward participating employees on a basis which seeks to align the interest of such employees with those of the shareholders.
| |
Sibanye Annual Financial Report 2016 | 133 |
Table of Contents
NOTES TO THE CONSOLIDATED FINANCIAL STATEMENTS continued
FOR THE YEAR ENDED 31 DECEMBER 2016
BONUS SHARES
The Remuneration Committee makes an annual award of forfeitable shares to the executive directors, prescribed officers, senior vice presidents and vice presidents. These are referred to as Bonus Shares. The size of this Bonus Share award depends on the individual’s annual cash bonus, which is determined by actual performance against predetermined targets.
The face value of the Bonus Share award is equal to two-thirds of the actual annual cash bonus and is allocated in the form of restricted forfeitable shares. The Bonus Shares vest in two equal parts at nine months and eighteen months after the award date. Dividends are payable on the Bonus Shares during the holding period.
PERFORMANCE SHARES
The Remuneration Committee makes an annual award of conditional shares to the executive directors, prescribed officers, senior vice presidents and vice presidents. These are referred to as Performance Shares. The number of Performance Shares awarded to an employee is based on the employee’s annual guaranteed pay and their grade combined with a factor related to their assessed performance rating for the prior year and using the relevant share price calculation at the offer date.
Previously, the actual number of Performance Shares which could vest from previous awards was determined by Sibanye’s share price performance measured against the performance of Harmony Gold Mining Company Limited and Pan African Resources plc over a performance period of three years. The number of Performance Shares which finally vested was based on the relative change in the Sibanye share price compared to the respective change in the share prices of the other two peer-group companies, with discretion allowed due to the small sample size. For any Performance Share award to be settled by executives, an internal company performance target was required to be met before the external relative measure is applied.
This threshold performance criterion for vesting of any Performance Shares was set at the achievement of at least 85% of Sibanye’s expected gold production over the three-year measurement period as set out in the business plans of Sibanye as approved by the Board. Only once this internal measure had been achieved, would the external measure (Sibanye’s share price performance measured against the abovementioned companies) be applied to determine the scale of the vesting of awards of Performance Shares.
Various concerns were expressed by representatives of the investor community relating to the performance conditions applicable on the vesting of Performance Shares. Specifically, concerns were expressed that:
| · | | a peer group comprising only two other companies was not sufficiently robust for the evaluation of Sibanye’s performance over the vesting period; and |
| · | | the condition of an 85% threshold as an internal target for gold produced over the three year period under which the Performance Shares would not vest was insufficiently stretching. |
A review was conducted to identify appropriate adjustments to the implementation policy that would appropriately address these concerns and provide for enhanced alignment with shareholder interests. The decisions resulting from this review and the revised policy, inter alia, are disclosed below. These were applicable for all Performance Share awards from 1 March 2016 onwards.
Annual conditional awards of Performance Shares continue to be made to the executive directors, prescribed officers, senior vice presidents and vice presidents, and this element will be the primary form of share-based long term incentivisation.
Performance Shares vest no earlier than the third anniversary of their award, to the extent that Sibanye has met specified performance criteria over the intervening period. Essentially the number of shares that vest will depend on the extent to which Sibanye’s has performed over the intervening three year period relative to two particular performance criteria, Total Shareholder Return and Return on Capital Employed. These are considered to be the most widely acceptable vesting performance measures suited to aligning the outcome of long term share incentive awards with shareholders’ interests. This change will result in a possible vesting percentage ranging from 0% in the case of very poor performance to 100% vesting of the awarded Performance Shares in the event of having achieved stretched performance outcomes.
FOR ALLOCATIONS FROM MARCH 2016 ONWARDS
The performance criteria used to govern the vesting performance shares are determined by the Remuneration Committee and communicated in award letters to participants. The following two performance conditions, applied with the indicated weightings, were implemented for determining the vesting of future awards effective from March 2016 onwards.
Total Shareholder Return (TSR) – 70% Weighting
Total shareholder return (TSR) will be measured against a benchmark of eight mining and resource companies, a few of which can be deemed direct competitors, but collectively they can be deemed to be an alternative investment portfolio for Sibanye’s Shareholders. TSR is generally recognised as the most faithful indicator of shareholder value creation. It is used extensively internationally and increasingly in South Africa, sometimes as a single metric but most often as one of two or three weighted performance metrics. In a few cases an absolute target is set, but most often it is targeted in relation to a peer or comparator group of “like” companies.
Percentage vesting is determined based on a peer group curve that is constructed on a market capitalisation weighted basis. The annual TSR (TSRANN) is determined for each of the companies in the peer group. The peer group companies are sorted from lowest to highest TSRANN. The average market capitalisation based on daily closing price is determined for each company, and each peer company is assigned its proportion of the overall average market capitalisation of the peer group. The peer company
| |
Sibanye Annual Financial Report 2016 | 134 |
Table of Contents
NOTES TO THE CONSOLIDATED FINANCIAL STATEMENTS continued
FOR THE YEAR ENDED 31 DECEMBER 2016
TSR curve is plotted at the midpoint of each company’s percentage of peer group market capitalisation on a cumulative basis above the worse performing companies in the peer group. In the event that one or more of the peer companies become ineligible for comparison, a peer company curve based on the companies remaining in the peer group will be utilised.
The cumulative position of Sibanye’s TSRANN is then mapped onto the TSR curve for the peer group to determine the percentile at which Sibanye performed over the vesting period. The performance curve governing vesting is:
| |
TSR element of performance conditions | |
Percentile on peer group TSR curve | % vesting |
0% | 0% |
10% | 0% |
20% | 0% |
30% | 5% |
40% | 20% |
50% | 35% |
60% | 55% |
70% | 75% |
80% | 90% |
90% | 100% |
100% | 100% |
The eight peer group comparator companies for TSR comprises of similar market capitalisation companies reflective of the expected positioning of Sibanye over the short to medium term as a value driven multi-commodity resources company with a specific focus on gold and platinum and are set out in the table below:
|
Peer group companies for TSR comparison |
AngloGold Ashanti Limited (AngloGold Ashanti) |
Anglo American Platinum Limited |
Gold Fields Limited (Gold Fields) |
Impala Platinum Holdings Limited |
Northam Platinum Limited |
Exxaro Resources Limited |
Harmony Gold Mining Company Limited (Harmony) |
African Rainbow Minerals Limited |
Return on capital employed (ROCE) – 30% Weighting
Return on capital employed (ROCE) is a profitability ratio that measures how efficiently a company generates profits from its capital employed. This measure has been adopted as there has been a shift toward “excess returns” – “excess returns” provide a more central role in determining the current and potential value of a business. There is an increased focus on measuring and forecasting returns earned by businesses on both investments made in the past and expected future investments. For Sibanye, ROCE is to be evaluated against the company’s cost of capital (Ke). A minimum threshold on the performance scale for ROCE is set as equalling the cost of capital, Ke, which would lead to the ROCE element contributing 0% towards the performance condition. Delivering a return that exceeds Ke by 6% or more would be regarded as a superior return representing the maximum 100% on the performance scale and full vesting in respect of the ROCE element. The performance curve governing vesting will be as follows:
| |
ROCE element of performance condition | |
Annual ROCE | % vesting |
≤Ke | 0% |
Ke + 1% | 16.7% |
Ke + 2% | 33.3% |
Ke + 3% | 50.0% |
Ke + 4% | 66.7% |
Ke + 5% | 83.3% |
Ke + 6% | 100% |
The overall performance condition will be determined by adding 70% of the Total Shareholder return element to 30% of the Return on Capital Employed element. Furthermore should the board, at its sole discretion, determine that there is evidence of extreme environmental, social and governance (ESG) malpractice during the Vesting Period, up to 20% of the Performance Shares that would otherwise settle on vesting may be forfeited.
As indicated, the performance criteria described above govern vesting of all awards effective from 1 March 2016. Should any further adjustment be made they will govern future offers but will not be applied retrospectively.
| |
Sibanye Annual Financial Report 2016 | 135 |
Table of Contents
NOTES TO THE CONSOLIDATED FINANCIAL STATEMENTS continued
FOR THE YEAR ENDED 31 DECEMBER 2016
The inputs to the models for options granted during the year were as follows:
| | |
Performance | | |
shares | | Bonus |
(PS) | | Shares (BS) |
| 2016 | MONTE CARLO SIMULATION | 2016 |
| – weighted average historical volatility (based on a statistical analysis of the share price on a | |
| 55.12% | weighted moving average basis for the expected term of the option) | 55.15% |
| 3 | – expected term (years) | n/a |
n/a | – expected term (months) | 9 or 18 |
| 3.75% | – expected dividend yield | 3.75% |
| 8.51% | – weighted average three-year risk-free interest rate (based on SA interest rates) | 7.78% |
n/a | – marketability discount | 1.60%/0.69% |
| 50.81 | – weighted average fair value | 54.27/53.02 |
FOR ALLOCATIONS UP TO FEBRUARY 2016
The Remuneration Committee makes an annual conditional award of PS to the CEO, CFO, senior vice presidents and vice presidents. The number of PS awarded to an employee is based on the employee’s annual guaranteed remuneration, grade and performance. The actual number of PS which vest is determined by Sibanye’s share price performance measured against the performance of a peer group, being Harmony Gold Mining Company Limited (Harmony), Pan African Resources PLC and Gold One International Limited (Gold One) (subsequently delisted), over a performance period of three years. This peer group is determined and approved by the Remuneration Committee. The PS, which vest, are based on the relative change in the Sibanye share price compared to the respective share prices of the individual companies within the peer group and with discretion allowed due to the small sample size. For any PS award to be settled to executives, an internal company performance target is required to be met before the external relative measure is applied. The target performance criterion is set at 85% of Sibanye’s expected gold production over the three-year measurement period as set out in the business plans of Sibanye as approved by the Board. Only once the internal measure has been achieved, will the external measure (Sibanye’s share price performance measured against the abovementioned peer group) be applied to determine the scale of the vesting of awards of PS.
The Remuneration Committee makes an annual conditional award of BS to each executive director and senior executive. The size of the award depends on the individual’s annual cash bonus, which is determined by actual performance against predetermined targets. Restricted BS are allocated on the ratio of two-thirds of an individual’s annual bonus. The BS vest in two equal parts at nine months and 18 months after the award date. Dividends are payable on the BS during the holding period.
The fair value of the above PS equity instruments granted during the period were valued using the Monte Carlo Simulation model. For the BS equity instruments, a future trading model is used to estimate the loss in value to the holders of bonus shares due to trading restrictions. The actual valuation is developed using a Monte Carlo analysis of the future share price of Sibanye.
The inputs to the models for options granted during the years ended 31 December 2015 and 2014 were as follows:
| | | | |
Performance | | Bonus |
shares (PS) | | Shares (BS) |
| 2014 | 2015 | MONTE CARLO SIMULATION | 2015 | 2014 |
| | – weighted average historical volatility (based on a statistical analysis of the share price on a | | |
| 56.4% | 42.3% | weighted moving average basis for the expected term of the option) | 42.3% | 56.4% |
| 3 | 3 | – expected term (years) | n/a | n/a |
n/a | n/a | – expected term (months) | 9 - 18 | 9 - 18 |
| 4.7% | 4.9% | – expected dividend yield | 4.9% | 4.7% |
| 5.7% | 6.4% | – weighted average three-year risk-free interest rate (based on SA interest rates) | 6.4% | 5.7% |
n/a | n/a | – marketability discount | 2.1% | 2.2% |
| 38.61 | 37.41 | – weighted average fair value | 25.56 | 24.94 |
The compensation cost related to awards not yet recognised under the plan at 31 December 2016 amounts to R247.0 million and is to be spread over 3 years. 4,250,887 options that had vested were exercisable as at 31 December 2016.
At the Annual General Meeting the directors of Sibanye were authorised to issue and allot all or any of such shares required for the plans, but in aggregate all plans may not exceed 70,619,126 (10%) of the total issued ordinary share capital of the Company. An individual participant may also not be awarded an aggregate of shares from all or any such plans exceeding 7,061,913 (1%) of the Company’s total issued ordinary share capital. The unexercised options and shares under all plans represented 15,112,493 (2%) of the total issued ordinary share capital of Sibanye at 31 December 2016.
| |
Sibanye Annual Financial Report 2016 | 136 |
Table of Contents
NOTES TO THE CONSOLIDATED FINANCIAL STATEMENTS continued
FOR THE YEAR ENDED 31 DECEMBER 2016
OPTIONS GRANTED, EXERCISED AND FORFEITED UNDER THIS PLAN
| | | | | | |
Performance shares (PS) | | Bonus Shares (BS) |
| 2014 | 2015 | 2016 | Number of instruments | 2016 | 2015 | 2014 |
| 28,083,703 | 23,289,262 | 9,398,072 | Outstanding at beginning of the year | 417,266 | 595,012 | 1,135,455 |
| | | Movement during the year: | | | |
| 2,953,057 | 3,059,058 | 5,103,184 | Granted during the year | 504,739 | 862,702 | 1,275,979 |
| (5,567,771) | (16,690,497) | (3,832,758) | Exercised and released | (667,063) | (1,010,209) | (1,672,579) |
| (2,179,727) | (259,751) | (57,719) | Forfeited | (4,115) | (30,239) | (143,843) |
| 23,289,262 | 9,398,072 | 10,610,779 | Outstanding at end of the year | 250,827 | 417,266 | 595,012 |
DIRECTORS AND PRESCRIBED OFFICERS’ EQUITY-SETTLED INSTRUMENTS
The directors and prescribed officers of Sibanye held the following equity-settled instruments in the above Sibanye Gold Limited 2013 Share Plan at 31 December 2016:
| | | | | | |
| 2015 | Instruments granted | Equity-settled instruments exercised during the year | 2016 |
| Number of instruments | Number of instruments | Number of instruments | Average
price | Share
proceeds
(rand) | Number of instruments |
Executive directors | | | | | | |
Neal Froneman | 2,579,432 | 1,186,314 | 2,344,312 | 38.73 | 90,805,896 | 1,421,434 |
Charl Keyter | 708,026 | 669,348 | 779,014 | 23.93 | 18,644,698 | 598,360 |
Prescribed officers | | | | | | |
Hartley Dikgale | 294,164 | 265,242 | 271,171 | 23.42 | 6,351,537 | 288,235 |
Dawie Mostert | 322,685 | 309,584 | 287,038 | 24.21 | 6,949,764 | 345,231 |
Jean Nel¹ | - | 166,151 | - | - | - | 166,151 |
Themba Nkosi² | - | 67,666 | - | - | - | 67,666 |
Wayne Robinson | 157,030 | 195,770 | 28,118 | 24.41 | 686,257 | 324,682 |
Richard Stewart | 319,368 | 188,623 | 23,821 | 22.02 | 524,481 | 484,170 |
Robert van Niekerk | 576,956 | 518,251 | 649,287 | 23.58 | 15,311,318 | 445,920 |
John Wallington³ | - | 126,740 | - | - | - | 126,740 |
1 Appointed as a prescribed officer on 13 April 2016, and resigned as a prescribed officer on 1 November 2016 and will forfeit the instruments granted after his notice period.
2 Appointed as a prescribed officer on 4 July 2016.
3 Appointed as a prescribed officer on 1 February 2016.
6.2 SIBANYE GOLD LIMITED 2013 PHANTOM SHARE SCHEME
On 14 May 2013 Sibanye’s Remuneration Committee limited the issuance of share options for the 2013 allocation under the SGL Share Plan to senior management only. Middle and certain senior management, who previously participated in the equity-settled share option scheme, now participate in a cash-settled share scheme, the Sibanye Gold 2013 Phantom Share Scheme (the SGL Phantom Scheme). Notwithstanding that the SGL Phantom Scheme is not subject to compliance with the JSE Listings Requirements as it is a purely cash-settled remuneration scheme, the SGL Share Plan rules apply, in all material aspects, to the SGL Phantom Scheme, other than the issue of new shares to participants.
Details of the phantom shares granted under this scheme to employees are detailed below:
| | | | | | |
Performance shares (PS) | | Bonus Shares (BS) |
| 2014 | 2015 | 2016 | Number of instruments | 2016 | 2015 | 2014 |
| 16,429,766 | 22,212,627 | 20,198,875 | Outstanding at beginning of the year | - | 1,731,262 | 6,529,404 |
| | | Movement during the year: | | | |
| 7,119,727 | - | - | Granted during the year | - | - | 3,604,577 |
| (125,932) | (773,814) | (14,275,138) | Vested and paid | - | (1,668,503) | (8,076,789) |
| (1,210,934) | (1,239,938) | (622,111) | Forfeited | - | (62,759) | (325,930) |
| 22,212,627 | 20,198,875 | 5,301,626 | Outstanding at end of the year | - | - | 1,731,262 |
The grant date fair value of the above PS and BS cash-settled instruments granted during the year were valued using the Monte Carlo Simulation model and a future trading model, respectively, as with the equity settled instruments above. As the cash-settled and equity-settled instruments are issued on the same day the grant date fair value assumptions of the cash-settled instruments is the same as for the equity-settled instruments.
The fair value of the cash-settled instruments at reporting date, used to value the share-based payment obligation, is determined using the same assumptions as for the grant date valuation. However, the respective models take into account the actual share data of the peer group for the period from the grant date to the reporting date.
The compensation cost related to awards not yet recognised under the scheme at 31 December 2016 amounts to R11.2 million and is to be spread over 3 months.
| |
Sibanye Annual Financial Report 2016 | 137 |
Table of Contents
NOTES TO THE CONSOLIDATED FINANCIAL STATEMENTS continued
FOR THE YEAR ENDED 31 DECEMBER 2016
6.3 SHARE-BASED PAYMENT ON BEE TRANSACTION
The share-based payment on BEE transaction amounted to R240.3 million. In terms of the Rustenburg Operations Transaction (refer to note 12.2) a 26% equity stake in SRPM was acquired by the BBBEE SPV (the BBBEE Transaction) by a vendor financed facility from Sibanye Platinum Proprietary Limited (Sibanye Platinum), on the following terms:
| · | | Interest at up to 0.2% above Sibanye’s highest cost of debt; |
| · | | Post payment of the annual Deferred Payment to Rustenburg Platinum Mines Limited (RPM) and in respect of any repayment by SRPM of shareholder loans or the distribution of dividends, 74% will be paid to Sibanye Platinum and 26% to BBBEE SPV; |
| · | | Of the 26% payment to BBBEE SPV, 85% will be used to service the facility owing by BBBEE SPV to Sibanye Platinum; |
| · | | The remaining 15% of any such payment or 100%, once the facility owing by BBBEE SPV to Sibanye Platinum is repaid, will be declared by BBBEE SPV as a dividend to the BBBEE SPV shareholders; and |
| · | | The facility will be capped at R3,500 million. |
The IFRS 2 expense has been limited to 44.8% of the 26% interest relating to Bakgatla-Ba-Kgafela Investment Holdings and Siyanda Resources Proprietary Limited, as the Rustenburg Mine Community Trust and Rustenburg Mine Employees Trust are controlled and consolidated by Sibanye. The 44.8% interest was based on the expected discounted future cash flows of the expected PGM reserves and costs to extract the PGMs.
6.4 SHARE-BASED PAYMENT OBLIGATIONS
Reconciliation of the share-based payment obligations:
| | | | |
Figures in million - SA rand | | 2016 | 2015 | 2014 |
Balance at beginning of the year | | 599.6 | 399.2 | 121.4 |
Share-based payments expense | | 83.8 | 155.3 | 242.1 |
Share-based payment on BEE transaction | | 240.3 | - | - |
Fair value loss on obligations1 | | 1,076.6 | 87.3 | 202.3 |
Cash-settled share-based payments paid2 | | (1,518.6) | (42.2) | (166.6) |
Balance at end of the year | | 481.7 | 599.6 | 399.2 |
| | | | |
Reconciliation of the non-current and current portion of the share-based payment obligations: | | | | |
Share-based payment obligations | | 481.7 | 599.6 | 399.2 |
Current portion of share-based payment obligations | | (235.2) | (463.0) | (20.8) |
Non-current portion of share-based payment obligations | | 246.5 | 136.6 | 378.4 |
1 The fair value adjustment at reporting date is included in loss on financial instruments in profit or loss and not as part of share-based payments expense. The appreciation in Sibanye’s share price for the six months ended 30 June 2016 of approximately 120%, resulted in a fair value loss of R1,181.1 million. The depreciation in the share price for the six months ended 31 December 2016 of approximately 49%, resulted in a fair value gain of R110.7 million.
2 Payments made during the year relates to vesting of shares to employees and proportionate vesting of shares to employees and proportionate vesting of shares to employees that have left the Group in good faith.
7. IMPAIRMENTS
| | | | |
Figures in million - SA rand | Notes | 2016 | 2015 | 2014 |
Impairment of property, plant and equipment | 11 | (1,171.7) | - | (155.5) |
Impairment of goodwill | 13 | (201.3) | - | - |
Impairment of loan to equity-accounted investee | | (8.1) | - | - |
Impairment of investment in equity-accounted investee | 14 | - | - | (119.6) |
Total impairments | | (1,381.1) | - | (275.1) |
IMPAIRMENT OF COOKE 4
Despite intense monitoring and interventions by a joint management and labour committee since the previous section 189 consultation was concluded, the Cooke 4 Operation continued to fall short of production targets and losses continued to accumulate. In view of the sustained losses at the Cooke 4 Operation and considering the extensive efforts to improve productivity and reduce the operation’s cost structures, Sibanye gave notice in terms of section 189 of the Labour Relations Act 66 of 1995. As a result a decision was taken during the six months ended 30 June 2016 to fully impair the Cooke 4 Operation’s mining assets by R816.7 million. This impairment was based on negative cash flow projections for the remainder of the life of mine.
| |
Sibanye Annual Financial Report 2016 | 138 |
Table of Contents
NOTES TO THE CONSOLIDATED FINANCIAL STATEMENTS continued
FOR THE YEAR ENDED 31 DECEMBER 2016
IMPAIRMENT OF GOODWILL, AND COOKE 1, 2 AND 3 MINING ASSETS
As a result of a decrease in the rand gold price from 30 June 2016 and continued losses, a decision was taken during the six months ended 31 December 2016, to impair the goodwill allocated to the Cooke cash-generating unit (CGU) by R201.3 million and the Cooke 1, 2 and 3 mining assets by R355.0 million. The impairment was based on the estimated fair value less cost to sell over the life of mine calculated as expected discounted cash flows from the expected gold reserves and costs to extract the gold.
8. ROYALTIES, AND MINING AND INCOME TAX, and deferred tax
SIGNIFICANT ACCOUNTING JUDGEMENTS AND ESTIMATES
The Group is subject to income tax in South Africa. Significant judgement is required in determining the liability for income tax due to the complexity of legislation. There are many transactions and calculations for which the ultimate tax determination is uncertain during the ordinary course of business. The Group recognises liabilities for anticipated tax audit issues based on estimates of whether additional taxes will be due. Where the final tax outcome of these matters is different from the amounts that were initially recorded, such differences will impact the income tax and deferred tax provisions in the period in which such determination is made.
The Group recognises the net future tax benefit related to deferred tax assets to the extent that it is probable that the deductible temporary differences will reverse in the foreseeable future. Assessing the recoverability of deferred tax assets requires the Group to make significant estimates related to expectations of future taxable income. Estimates of future taxable income are based on forecast cash flows from operations and the application of existing tax laws in South Africa. To the extent that future cash flows and taxable income differ significantly from estimates, the ability of the Group to realise the net deferred tax assets recorded at the reporting date could be impacted.
The Group’s gold mining operations are taxed on a variable rate that increases as the profitability of the operation increases. The deferred tax rate used to calculate deferred tax is based on the current estimate of future profitability when the temporary differences will reverse based on tax rates and laws that have been enacted or substantively enacted at the reporting date. Depending on the profitability of the operations, the deferred tax rate can consequently be significantly different from year to year. Calculating the future profitability of the operations is inherently uncertain and could materially change over time.
Additionally, future changes in tax laws in South Africa could limit the ability of the Group to obtain tax deductions in future periods.
ACCOUNTING POLICY
Income tax comprises current and deferred tax. Current tax and deferred tax is recognised in profit or loss except to the extent that it relates to a business combination, or items recognised directly in equity or in other comprehensive income.
Current tax is measured on taxable income at the applicable statutory rate enacted or substantively enacted at the reporting date.
Deferred tax is provided on temporary differences existing at each reporting date between the tax values of assets and liabilities and their carrying amounts. Substantively enacted tax rates are used to determine future anticipated effective tax rates which in turn are used in the determination of deferred tax.
Deferred tax is not recognised for:
| · | | temporary differences on the initial recognition of assets or liabilities in a transaction that is not a business combination and that affects neither accounting nor taxable profit or loss; |
| · | | temporary differences related to investments in subsidiaries, and interest in associates and joint ventures to the extent that the Group is able to control the timing of the reversal of the temporary differences and it is probable that they will not reverse in the foreseeable future; and |
| · | | taxable temporary differences arising on the initial recognition of goodwill. |
These temporary differences are expected to result in taxable or deductible amounts in determining taxable profits for future periods when the carrying amount of the asset is recovered or the liability is settled. The principal temporary differences arise from depreciation of property, plant and equipment, provisions, unutilised capital allowances and tax losses carried forward.
Deferred tax assets and liabilities are offset if there is a legally enforceable right to offset current tax liabilities and assets, and they relate to taxes levied by the same tax authority on the same taxable entity, or on different tax entities, but they intend to settle current tax liabilities and assets on a net basis or their tax assets and liabilities will be realised simultaneously.
Deferred tax assets relating to the carry forward of unutilised tax losses and/or unutilised capital allowances are recognised to the extent it is probable that future taxable profit will be available against which the unutilised tax losses and/or unutilised capital allowances can be recovered. Deferred tax assets are reviewed at each reporting date and are adjusted if recovery is no longer probable.
| |
Sibanye Annual Financial Report 2016 | 139 |
Table of Contents
NOTES TO THE CONSOLIDATED FINANCIAL STATEMENTS continued
FOR THE YEAR ENDED 31 DECEMBER 2016
8.1 ROYALTIES
The Mineral and Petroleum Resource Royalty Act 2008 (Royalty Act) imposes a royalty on refined (mineral resources that have undergone a comprehensive level of beneficiation such as smelting and refining as defined in Schedule 1 of the Royalty Act) and unrefined (mineral resources that have undergone limited beneficiation as defined in Schedule 2 of the Royalty Act) minerals payable to the State. The royalty in respect of refined minerals (which include gold refined to 99.5% and above and platinum) is calculated by dividing earnings before interest and taxes (EBIT) by the product of 12.5 times gross revenue calculated as a percentage, plus an additional 0.5%. EBIT refers to taxable mining income (with certain exceptions such as no deduction for interest payable and foreign exchange losses) before assessed losses but after capital expenditure. A maximum royalty of 5% of mining revenue has been introduced on refined minerals. The effective rate of royalty tax payable for the year ended 31 December 2016 was approximately 1.9% (2015: 1.8% and 2014: 2.0%) of gold mining revenue and 0.5% of platinum mining revenue.
| | | | |
Figures in million - SA rand | Notes | 2016 | 2015 | 2014 |
Current year charge - gold revenue | | (528.0) | (400.6) | (430.5) |
Current year charge - platinum revenue | | (18.6) | - | - |
Total royalties | 28.1 | (546.6) | (400.6) | (430.5) |
8.2 MINING AND INCOME TAX
The components of mining and income tax are the following:
| | | | |
Figures in million - SA rand | Notes | 2016 | 2015 | 2014 |
Mining tax | | (1,031.6) | (665.6) | (847.9) |
Non-mining tax | | (83.9) | (16.0) | (24.8) |
Company and capital gain tax | | 3.7 | (15.1) | (6.5) |
Total current tax | 28.2 | (1,111.8) | (696.7) | (879.2) |
Deferred tax | 8.3 | (131.4) | 319.5 | 51.1 |
Total mining and income tax | | (1,243.2) | (377.2) | (828.1) |
Reconciliation of the Group’s mining and income tax to the South African statutory company tax rate of 28%:
| | | | |
Figures in million - SA rand | | 2016 | 2015 | 2014 |
South African statutory tax rates | | | | |
Mining tax1 | | Y=34-170/X | Y=34-170/X | Y=34-170/X |
Non-mining tax2 | | 28.0% | 28.0% | 28.0% |
Company tax rate | | 28.0% | 28.0% | 28.0% |
| | | | |
Tax on profit before tax at maximum South African statutory company tax rate | | (1,264.0) | (256.3) | (653.8) |
South African mining tax formula rate adjustment | | 160.9 | 129.5 | 111.5 |
Non-deductible share-based payments | | (115.5) | (33.3) | (49.2) |
(Non-deductible loss)/non-taxable gain on foreign exchange differences | | (52.1) | 17.8 | 5.4 |
Non-taxable share of results of equity-accounted investees | | 3.7 | 32.5 | (131.8) |
Non-deductible amortisation and depreciation | | (35.0) | (25.7) | (19.1) |
Non-deductible impairments | | (65.6) | - | (33.5) |
Non-taxable gain on acquisition | | 679.8 | - | - |
Net other non-taxable income and non-deductible expenditure | | (65.6) | (0.9) | 8.7 |
Change in estimated deferred tax rate3 | | (59.8) | (28.8) | - |
Deferred tax assets not recognised | | (430.0) | (267.1) | (66.3) |
Non-taxable gain on derecognition of financial guarantee liability | | - | 55.1 | - |
Mining and income tax | | (1,243.2) | (377.2) | (828.1) |
1 Gold mining tax is determined according to a formula which takes into account the profit and revenue attributable to mining operations. Mining taxable income is determined after the deduction of all mining capital expenditure, with the provision that this cannot result in an assessed loss. Capital expenditure amounts not deducted are carried forward as unredeemed capital expenditure to be deducted from future mining income. Accounting depreciation is ignored for the purpose of calculating mining tax. In the formula above, Y is the percentage rate of tax payable and X is the ratio of mining profit, after the deduction of redeemable capital expenditure, to mining revenue expressed as a percentage.
2 Non-mining income consists primarily of interest income.
3 The change in the estimated long term deferred tax rate, as a result of applying the mining tax formula as described in footnote 1, at which the temporary differences will reverse amounted to a tax charge of R59.8 million for the year ended 31 December 2016 (2015: R28.8 million).
| |
Sibanye Annual Financial Report 2016 | 140 |
Table of Contents
NOTES TO THE CONSOLIDATED FINANCIAL STATEMENTS continued
FOR THE YEAR ENDED 31 DECEMBER 2016
8.3. DEFERRED TAX
The detailed components of the net deferred tax liabilities which result from the differences between the amounts of assets and liabilities recognised for financial reporting and tax purposes in different accounting periods are:
| | | | |
Figures in million - SA rand | Notes | 2016 | 2015 | 2014 |
Included in the statement of financial position as follows: | | | | |
Deferred tax assets | | (228.2) | (63.2) | (51.6) |
Deferred tax liabilities | | 4,707.1 | 3,561.4 | 3,869.3 |
Net deferred tax liabilities | | 4,478.9 | 3,498.2 | 3,817.7 |
| | | | |
Reconciliation of the deferred tax balance: | | | | |
Balance at beginning of the year | | 3,498.2 | 3,817.7 | 3,699.6 |
Deferred tax recognised in profit or loss | 8.2 | 131.4 | (319.5) | (51.1) |
Deferred tax on acquisition of subsidiaries | 12 | 849.3 | - | 169.2 |
Balance at end of the year | | 4,478.9 | 3,498.2 | 3,817.7 |
| | | | |
Deferred tax liabilities | | | | |
Mining assets | | 6,157.1 | 4,822.8 | 5,202.8 |
Environmental rehabilitation obligation funds | | 729.6 | 575.3 | 472.7 |
Other | | 128.6 | 14.9 | 97.4 |
Gross deferred tax liabilities | | 7,015.3 | 5,413.0 | 5,772.9 |
| | | | |
Deferred tax assets | | | | |
Environmental rehabilitation obligation | | (1,041.0) | (612.3) | (630.1) |
Other provisions | | (546.3) | (341.6) | (228.5) |
Tax losses and unredeemed capital expenditure | | (890.1) | (812.6) | (995.5) |
Share-based payment obligation | | (59.0) | (148.3) | (101.1) |
Gross deferred tax assets | | (2,536.4) | (1,914.8) | (1,955.2) |
| | | | |
Net deferred tax liabilities | | 4,478.9 | 3,498.2 | 3,817.7 |
At 31 December 2016, the Group had the following estimated amounts available for set-off against future income:
| | | | |
Figures in million - SA rand | | 2016 | 2015 | 2014 |
Tax losses | | | | |
Wits Gold | | 64.6 | 84.4 | 84.9 |
Burnstone | | - | 155.3 | 422.5 |
Ezulwini | | 2,561.2 | 1,481.0 | 1,186.7 |
Other | | 19.0 | 31.3 | 43.2 |
Total gross tax losses | | 2,644.8 | 1,752.0 | 1,737.3 |
Other deductible temporary differences | | | | |
Burnstone | | 10,012.6 | 9,009.0 | 7,175.1 |
Ezulwini | | 2,909.1 | 2,778.8 | 2,754.1 |
Ridge Mining Services Proprietary Limited | | 643.9 | - | - |
Other | | 55.6 | - | - |
Total gross tax losses and other deductible temporary differences | | 16,266.0 | 13,539.8 | 11,666.5 |
Deferred tax assets not recognised | | | | |
Wits Gold | | 18.1 | 23.6 | 23.8 |
Burnstone | | 2,803.5 | 2,566.0 | 2,127.3 |
Ezulwini | | 1,531.7 | 1,192.7 | 1,103.4 |
Ridge Mining Services Proprietary Limited | | 180.3 | - | - |
Other | | 20.9 | 8.8 | 12.1 |
Total deferred tax assets not recognised | | 4,554.5 | 3,791.1 | 3,266.6 |
These deductions are available to be utilised against income generated by the relevant tax entity and do not expire unless the tax entity concerned ceases to operate for a period of longer than one year. Under South African mining tax ring-fencing legislation, each tax entity is treated separately and as such these deductions can only be utilised by the tax entities in which the deductions have been generated.
9. EARNINGS PER SHARE
ACCOUNTING POLICY
Earnings per share (EPS) is calculated based on the profit attributable to owners of Sibanye divided by the weighted average number of ordinary shares in issue during the year. A diluted EPS is presented when the inclusion of ordinary shares that may be issued in the future has a dilutive effect on EPS.
Headline EPS is calculated by dividing the headline earnings attributable to owners of Sibanye by the weighted average number of ordinary shares in issue during the year.
| |
Sibanye Annual Financial Report 2016 | 141 |
Table of Contents
NOTES TO THE CONSOLIDATED FINANCIAL STATEMENTS continued
FOR THE YEAR ENDED 31 DECEMBER 2016
9.1 BASIC EARNINGS PER SHARE
Basic EPS is calculated by dividing the profit attributable to owners of Sibanye by the weighted average number of ordinary shares in issue during the year.
| | | | |
| | 2016 | 2015 | 2014 |
Weighted average number of shares | | | | |
Ordinary shares in issue (’000) | | 929,004 | 916,140 | 898,840 |
Adjustment for weighting of ordinary shares in issue (’000) | | (7,271) | (4,102) | (62,904) |
Weighted average number of shares (’000) | | 921,733 | 912,038 | 835,936 |
Profit attributable to owners of Sibanye (SA rand million) | | 3,701.6 | 716.9 | 1,551.5 |
Basic EPS (cents) | | 402 | 79 | 186 |
9.2 DILUTED EARNINGS PER SHARE
Diluted EPS is calculated by dividing the profit attributable to owners of Sibanye by the diluted number of ordinary shares in issue during the year.
Dilutive shares are the number of potentially dilutive ordinary shares that could be issued as a result of share options granted to employees under the share option schemes referred to in note 6.
| | | | |
| | 2016 | 2015 | 2014 |
Weighted average number of shares | | | | |
Weighted average number of shares (’000) | | 921,733 | 912,038 | 835,936 |
Potential ordinary shares (’000) | | 2,161 | 5,671 | 18,791 |
Diluted weighted average number of shares (’000) | | 923,894 | 917,709 | 854,727 |
Diluted basic EPS (cents) | | 401 | 78 | 182 |
9.3 HEADLINE EARNINGS PER SHARE
Reconciliation of profit attributable to owners of Sibanye to headline earnings:
| | | | |
Figures in million - SA rand | | Notes | Gross | Net of tax |
31 December 2016 | | | | |
Profit attributable to owners of Sibanye | | | | 3,701.6 |
Gain on disposal of property, plant and equipment | | 11 | (95.4) | (68.7) |
Impairments | | 7 | 1,381.1 | 1,281.7 |
Gain on acquisition | | | (2,428.0) | (2,428.0) |
Headline earnings | | | | 2,486.6 |
Headline EPS - cents | | | | 270 |
31 December 2015 | | | | |
Profit attributable to owners of Sibanye | | | | 716.9 |
Gain on disposal of property, plant and equipment | | 11 | (58.7) | (42.3) |
Headline earnings | | | | 674.6 |
Headline EPS - cents | | | | 74 |
31 December 2014 | | | | |
Profit attributable to owners of Sibanye | | | | 1,551.5 |
Gain on disposal of property, plant and equipment | | | (9.5) | (6.8) |
Impairments | | | 275.1 | 233.1 |
Reversal of impairment | | | (474.1) | (360.3) |
Headline earnings | | | | 1,417.5 |
Headline EPS - cents | | | | 170 |
9.4 DILUTED HEADLINE EARNINGS PER SHARE
Diluted headline EPS is calculated by dividing the headline earnings attributable to owners of Sibanye by the diluted weighted average number of ordinary shares in issue during the year.
| | | | |
| | 2016 | 2015 | 2014 |
Diluted headline EPS - cents | | 269 | 74 | 166 |
| |
Sibanye Annual Financial Report 2016 | 142 |
Table of Contents
NOTES TO THE CONSOLIDATED FINANCIAL STATEMENTS continued
FOR THE YEAR ENDED 31 DECEMBER 2016
10. DIVIDENDS
ACCOUNTING POLICY
Dividends are recognised only when such dividends are declared.
Cash flows from dividends paid are classified under operating activities in the statement of cash flows.
| | | | | |
Figures in million - SA rand | | | 2016 | 2015 | 2014 |
Dividend declared and paid | | | 1,610.6 | 658.4 | 1,005.2 |
Dividend per share - cents | | | 175 | 72 | 125 |
The dividend declared and paid relates to the final dividend of 90 SA cents per share or R825.4 million in respect of the six months ended 31 December 2015 declared 24 February 2016 and the interim dividend of 85 SA cents per share or R785.2 million in respect of the six months ended 30 June 2016 declared on 24 August 2016.
11. PROPERTY, PLANT AND EQUIPMENT
SIGNIFICANT ACCOUNTING JUDGEMENTS AND ESTIMATES
Carrying value of property, plant and equipment
All mining assets are amortised using the units-of-production method where the mine operating plan calls for production from proved and probable Mineral Reserves.
Mobile and other equipment are depreciated over the shorter of the estimated useful life of the asset or the estimate of mine life based on proved and probable Mineral Reserves.
The calculation of the units-of-production rate of amortisation could be impacted to the extent that actual production in the future is different from current forecast production based on proved and probable Mineral Reserves. This would generally result from the extent that there are significant changes in any of the factors or assumptions used in estimating Mineral Reserves.
These factors could include:
| · | | Changes in proved and probable Mineral Reserves; |
| · | | Differences between actual commodity prices and commodity price assumptions; |
| · | | Unforeseen operational issues at mine sites; |
| · | | Changes in capital, operating, mining, processing and reclamation costs, discount rates and foreign exchange rates; and |
| · | | Changes in Mineral Reserves could similarly impact the useful lives of assets depreciated on a straight-line basis, where those lives are limited to the life of the mine. |
The recoverable amounts of cash-generating units (CGUs) and individual assets have been determined based on the higher of value-in-use calculations and fair value less cost to sell. These calculations require the use of estimates and assumptions. It is reasonably possible that the gold and PGM price assumptions may change which may then impact the Group estimated life of mine determinant and may then require a material adjustment to the carrying value of property, plant and equipment.
The Group reviews and tests the carrying value of assets when events or changes in circumstances suggest that the carrying amount may not be recoverable by comparing expected future cash flows to these carrying values. Assets are grouped at the lowest level for which identifiable cash flows are largely independent of cash flows of other assets and liabilities. If there are indications that impairment may have occurred, estimates are prepared of expected future cash flows of each group of assets. Expected future cash flows used to determine the value in use and fair value less costs to sell of property, plant and equipment are inherently uncertain and could materially change over time. They are significantly affected by a number of factors including reserves and production estimates, together with economic factors such as spot and future gold and PGM prices, discount rates, foreign currency exchange rates, estimates of costs to produce reserves and future capital expenditure.
Pre-production
The Group assesses the stage of each mine construction project to determine when a mine moves into the production stage. The criteria used to assess the start date are determined based on the unique nature of each mine construction project. The Group considers various relevant criteria to assess when the mine is substantially complete, ready for its intended use and moves into the production stage. Some of the criteria would include, but are not limited to the following:
| · | | the level of capital expenditure compared to the construction cost estimates; |
| · | | ability to produce metal in saleable form (within specifications); and |
| · | | ability to sustain commercial levels of production of metal. |
When a mine construction project moves into the production stage, the capitalisation of certain mine construction costs ceases and costs are expensed, except for capitalisable costs related to mining asset additions or improvements, underground mine development or ore reserve development.
Mineral Reserves estimates
| |
Sibanye Annual Financial Report 2016 | 143 |
Table of Contents
NOTES TO THE CONSOLIDATED FINANCIAL STATEMENTS continued
FOR THE YEAR ENDED 31 DECEMBER 2016
Mineral Reserves are estimates of the amount of product that can be economically and legally extracted from the Group’s properties. In order to calculate the reserves, estimates and assumptions are required about a range of geological, technical and economic factors, including but not limited to quantities, grades, production techniques, recovery rates, production costs, transport costs, commodity demand, commodity prices and exchange rates.
Estimating the quantity and grade of the Mineral Reserves requires the size, shape and depth of orebodies to be determined by analysing geological data such as the logging and assaying of drill samples. This process may require complex and difficult geological judgements and calculations to interpret the data.
The Group is required to determine and report, inter alia, on the Mineral Reserves in accordance with the South African Code for Reporting of Exploration Results, Mineral Resources and Mineral Reserves (SAMREC).
Estimates of Mineral Reserves may change from period to period due to the change in economic assumptions used to estimate Mineral Reserves and due to additional geological data becoming available during the course of operations. Changes in reported proven and probable reserves may affect the Group’s financial results and position in a number of ways, including the following:
| · | | Asset carrying values may be affected due to changes in estimated cash flows; |
| · | | Depreciation and amortisation charges to profit or loss may change as these are calculated on the units-of production method, or where the useful lives of assets change; |
| · | | Decommissioning site restoration and environmental provisions may change where changes in ore reserves affect expectations about the timing or cost of these activities; and |
| · | | The carrying value of deferred tax assets may change due to changes in estimates of the likely recovery of the tax benefits. |
ACCOUNTING POLICY
Mineral and surface rights
Mineral and surface rights are recorded at cost less accumulated amortisation and accumulated impairment losses. When there is little likelihood of a mineral right being exploited, or the carrying amount has exceeded its recoverable amount, impairment is recognised in profit or loss in the year that such determination is made.
Mine development and infrastructure
Mining assets, including mine development and infrastructure costs and mine plant facilities, are recorded at cost less accumulated depreciation and accumulated impairment losses.
These costs which include the purchase price of assets used in the construction of the mine, expenditure incurred to evaluate and develop new ore bodies, to define mineralisation in existing ore bodies and to establish or expand productive capacity, are capitalised until commercial levels of production are achieved, at which times the costs are amortised as set out below.
Development of ore bodies includes the development of shaft systems and waste rock removal that allows access to reserves that are economically recoverable in the future. Subsequent to this, costs are capitalised if the criteria for recognition as an asset are met. Access to individual orebodies exploited by the Group is limited to the time span of the respective mining leases.
Land
Land is shown at cost and is not depreciated.
Other assets
Non-mining assets are recorded at cost less accumulated depreciation and accumulated impairment losses. These assets include the assets of the mining operations not included in mine development and infrastructure, borrowing costs, mineral and surface rights, land and all the assets of the non-mining operations.
Amortisation and depreciation of mining assets
Amortisation and depreciation is determined to give a fair and systematic charge in profit or loss taking into account the nature of a particular ore body and the method of mining that ore body. To achieve this, the following calculation methods are used:
| · | | Mining assets, including mine development and infrastructure costs, mine plant facilities and evaluation costs, are amortised over the life of the mine using the units-of-production method, based on estimated proved and probable Mineral Reserves above infrastructure. |
| · | | Proved and probable Mineral Reserves reflect estimated quantities of economically recoverable reserves, which can be recovered in future from known mineral deposits. |
| · | | Certain mining plant and equipment included in mine development and infrastructure is depreciated on a straight-line basis over their estimated useful lives. |
Depreciation of non-mining assets
Non-mining assets are recorded at cost and depreciated on a straight-line basis over their current expected useful lives to their residual values as follows:
| |
Sibanye Annual Financial Report 2016 | 144 |
Table of Contents
NOTES TO THE CONSOLIDATED FINANCIAL STATEMENTS continued
FOR THE YEAR ENDED 31 DECEMBER 2016
| · | | Furniture and equipment: 1 - 10 years |
The assets’ useful lives, depreciation methods and residual values are reassessed at each reporting date and adjusted if appropriate.
Impairment
Recoverability of the carrying values of long-term assets or CGUs of the Group are reviewed whenever events or changes in circumstances indicate that such carrying value may not be recoverable. To determine whether a long-term asset or CGU may be impaired, the higher of value in use (defined as: the present value of future cash flows expected to be derived from an asset or CGU) or fair value less costs to sell (defined as: the price that would be received to sell an asset in an orderly transaction between market participants at the measured rate, less the costs of disposal) is compared to the carrying value of the asset/unit.
A CGU is defined by the Group as the smallest identifiable group of assets that generates cash inflows that are largely independent of the cash inflows from other assets or groups of assets. Generally for the Group this represents an individual operating mine, including mines which are part of a larger mine complex. The costs attributable to individual shafts of a mine are impaired if the shaft is closed.
Impairment losses are recognised in profit or loss. Impairment recognised in respect of a CGU is allocated first to goodwill to that particular CGU and thereafter to the individual assets in the CGU.
When any infrastructure is closed down or placed on care and maintenance during the year, any carrying value attributable to that infrastructure is impaired. Expenditure incurred on care and maintenance is recognised in profit or loss.
When the review of the events or changes in circumstances of an asset or CGU that was previously impaired indicate that such historical carrying value is recoverable, the impairment is reversed. The impairment is only reversed to such an amount that the new carrying amount does not exceed the historical carrying amount. Reversal of impairment losses are recognised in profit or loss. Reversal of impairment recognised in respect of a CGU is allocated to the individual assets in the CGU.
Derecognition of property, plant and equipment
Property, plant and equipment is derecognised on disposal or closure of a shaft when no future economic benefits are expected from its use or disposal. Any gain or loss on derecognition of an item of property, plant and equipment (calculated as the net proceeds from disposal and the carrying amount of the item) is recognised in profit or loss.
Exploration and evaluation expenditure
All exploration and evaluation expenditure, prior to obtaining the legal rights to explore a specific area, is recognised in profit or loss. After the legal rights to explore are obtained, exploration and evaluation expenditure, comprising the costs of acquiring prospecting rights and directly attributable exploration expenditure, is capitalised as a separate class of property, plant and equipment or intangible assets, on a project-by-project basis, pending determination of the technical feasibility and commercial viability.
The technical feasibility and commercial viability of extracting a mineral resource is generally considered to be determinable through a feasibility study and when proven reserves are determinable to exist. Upon determination of proven reserves, exploration and evaluation assets attributable to those reserves are first tested for impairment and then reclassified from exploration and evaluation assets to another appropriate class of property, plant and equipment. Subsequently, all cost directly incurred to prepare an identified mineral asset for production is capitalised to mine development assets. Amortisation of these assets commences once these assets are available for use, which is expected to be when the mine is in commercial production. These assets will be measured at cost less accumulated amortisation and impairment losses.
| |
Sibanye Annual Financial Report 2016 | 145 |
Table of Contents
NOTES TO THE CONSOLIDATED FINANCIAL STATEMENTS continued
FOR THE YEAR ENDED 31 DECEMBER 2016
| | | | | |
Figures in million - SA rand | Notes | Total | Mine
development,
infrastructure
and
other | Land, mineral
rights and
rehabilitation | Exploration
and evaluation
assets |
31 December 2016 | | | | | |
Cost | | | | | |
Balance at beginning of the year | | 57,431.7 | 51,919.9 | 3,591.5 | 1,920.3 |
Additions | | 4,151.1 | 4,065.7 | 3.7 | 81.7 |
Change in estimates of rehabilitation assets | 24 | 472.5 | - | 472.5 | - |
Disposals | | (67.8) | (65.9) | (1.9) | - |
Assets acquired on acquisition of subsidiaries | 12 | 5,702.3 | 3,984.7 | 1,648.6 | 69.0 |
Balance at end of the year | | 67,689.8 | 59,904.4 | 5,714.4 | 2,071.0 |
Accumulated depreciation, amortisation and impairment | | | | |
Balance at beginning of the year | | 35,299.3 | 33,978.1 | 1,321.2 | - |
Amortisation and depreciation | 4 | 4,041.9 | 3,656.7 | 385.2 | - |
Impairment | 7 | 1,171.7 | 770.3 | 401.4 | - |
Disposals | | (63.8) | (63.2) | (0.6) | - |
Balance at end of the year | | 40,449.1 | 38,341.9 | 2,107.2 | - |
Carrying value at end of the year | | 27,240.7 | 21,562.5 | 3,607.2 | 2,071.0 |
| | | | | |
Figures in million - SA rand | Notes | Total | Mine
development,
infrastructure
and other | Land, mineral
rights and
rehabilitation | Exploration
and evaluation
assets |
31 December 2015 | | | | | |
Cost | | | | | |
Balance at beginning of the year | | 54,404.9 | 48,637.6 | 3,882.3 | 1,885.0 |
Additions | | 3,344.8 | 3,303.5 | 6.0 | 35.3 |
Change in estimates of rehabilitation assets | 24 | (273.4) | - | (273.4) | - |
Disposals | | (44.6) | (21.2) | (23.4) | - |
Balance at end of the year | | 57,431.7 | 51,919.9 | 3,591.5 | 1,920.3 |
Accumulated depreciation, amortisation and impairment | | | | |
Balance at beginning of the year | | 31,700.9 | 30,650.2 | 1,050.7 | - |
Amortisation and depreciation | 4 | 3,636.6 | 3,358.4 | 278.2 | - |
Disposals | | (38.2) | (30.5) | (7.7) | - |
Balance at end of the year | | 35,299.3 | 33,978.1 | 1,321.2 | - |
Carrying value at end of the year | | 22,132.4 | 17,941.8 | 2,270.3 | 1,920.3 |
| | | | | |
Figures in million - SA rand | Notes | Total | Mine
development,
infrastructure
and other | Land, mineral
rights and
rehabilitation | Exploration
and evaluation
assets |
31 December 2014 | | | | | |
Cost | | | | | |
Balance at beginning of the year | | 43,970.8 | 42,362.5 | 1,364.0 | 244.3 |
Additions | | 3,250.8 | 3,231.2 | 1.1 | 18.5 |
Change in estimates of rehabilitation assets | 24 | 131.5 | - | 131.5 | - |
Disposals | | (68.1) | (66.1) | (2.0) | - |
Assets acquired on acquisition of subsidiaries | | 7,119.9 | 3,110.0 | 2,387.7 | 1,622.2 |
Balance at end of the year | | 54,404.9 | 48,637.6 | 3,882.3 | 1,885.0 |
Accumulated depreciation, amortisation and impairment | | | | |
Balance at beginning of the year | | 28,819.8 | 27,942.0 | 877.8 | - |
Amortisation and depreciation | 4 | 3,254.7 | 3,054.0 | 200.7 | - |
Impairment | 7 | 155.5 | 155.5 | - | - |
Reversal of impairment | | (474.1) | (448.1) | (26.0) | - |
Disposals | | (55.0) | (53.2) | (1.8) | - |
Balance at end of the year | | 31,700.9 | 30,650.2 | 1,050.7 | - |
Carrying value at end of the year | | 22,704.0 | 17,987.4 | 2,831.6 | 1,885.0 |
| |
Sibanye Annual Financial Report 2016 | 146 |
Table of Contents
NOTES TO THE CONSOLIDATED FINANCIAL STATEMENTS continued
FOR THE YEAR ENDED 31 DECEMBER 2016
12. ACQUISITIONS
SIGNIFICANT ACCOUNTING JUDGEMENTS AND ESTIMATES
Expected future cash flows used to determine the fair value of, inter alia, property, plant and equipment and contingent consideration are inherently uncertain and could materially change over time. The fair value is significantly affected by a number of factors including reserves and production estimates, together with economic factors such as the expected commodity price, foreign currency exchange rates, and estimates of production costs, future capital expenditure and discount rates.
ACCOUNTING POLICY
Business combinations
The acquisition method of accounting is used to account for business combinations by the Group. The consideration transferred for the acquisition of a business is the fair value of the assets transferred, the liabilities incurred and the equity interests issued by the Group. The consideration transferred includes the fair value of any asset or liability resulting from a contingent consideration arrangement. Any contingent consideration is measured at fair value at the date of acquisition. Acquisition-related costs are expensed as incurred. Identifiable assets acquired and liabilities and contingent liabilities assumed in a business combination are measured initially at their fair values at the acquisition date. On an acquisition-by-acquisition basis, the Group recognises any non-controlling interest in the acquiree either at fair value or at the non-controlling interest’s proportionate share of the acquiree’s net assets. Subsequently, the carrying amount of non-controlling interest is the amount of the interest at initial recognition plus the non-controlling interest’s share of the subsequent changes in equity, plus or minus changes in the portion of interest of the equity of the subsidiary not attributable, directly or indirectly, to Sibanye shareholders.
The excess of the consideration transferred, the amount of any non-controlling interest in the acquiree and the acquisition-date fair value of any previous equity interest in the acquiree over the fair value of the identifiable net assets acquired is recorded as goodwill. If this is less than the fair value of the net assets of the subsidiary acquired in the case of a bargain purchase, the difference is as a gain recognised directly in profit or loss.
12.1 AQUARIUS ACQUISITION
On 6 October 2015 Sibanye announced a cash offer of US$0.195 per share for the entire issued share capital of Aquarius (the Aquarius Transaction), valuing Aquarius at US$294 million. The transaction was subject to the fulfilment of various conditions precedent which were completed on 12 April 2016.
On 12 April 2016, Sibanye paid R4,301.5 million to the Aquarius shareholders and obtained control (100%) of Aquarius.
The acquisition has a strong strategic and financial rationale for Sibanye, both as a stand-alone transaction and particularly when considered in conjunction with the Rustenburg Operations acquisition. These acquisition will result in significant value creation through the realisation of synergies between the PGM assets in Rustenburg area, thereby enhancing Sibanye’s platinum portfolio.
For the nine months ended 31 December 2016, Aquarius contributed revenue of R2,104.4 million and a profit of R223.6 million to the Group’s results.
CONSIDERATION
| | |
Figures in million - SA rand | | 2016 |
Cash | | 4,301.5 |
Total consideration | | 4,301.5 |
ACQUISITION RELATED COSTS
The Group incurred acquisition related costs of R84.7 million on advisory and legal fees. These costs are recognised as transaction costs in profit or loss in 2016.
| |
Sibanye Annual Financial Report 2016 | 147 |
Table of Contents
NOTES TO THE CONSOLIDATED FINANCIAL STATEMENTS continued
FOR THE YEAR ENDED 31 DECEMBER 2016
IDENTIFIABLE ASSETS ACQUIRED AND LIABILITIES ASSUMED
The following table summarises the recognised fair value of assets acquired and liabilities assumed at the acquisition date:
| | |
Figures in million - SA rand | Notes | 2016 |
Property, plant and equipment | 11 | 1,680.8 |
Equity-accounted investments | 14 | 2,066.7 |
Environmental rehabilitation obligation funds | 16 | 151.9 |
Non-current other receivables | | 108.4 |
Inventories | | 155.0 |
Trade and other receivables | | 908.9 |
Cash and cash equivalents | | 494.1 |
Deferred tax | 8.3 | 49.2 |
Environmental rehabilitation obligation | 24 | (630.0) |
Non-current other payables | 17.2 | (32.4) |
Trade and other payables | | (1,025.6) |
Tax and royalties payable | | (13.2) |
Total fair value of identifiable net assets acquired | | 3,913.8 |
The fair value of assets and liabilities excluding property, plant and equipment, and environmental rehabilitation obligation approximate their carrying value. The fair value of property, plant and equipment was based on the expected discounted cash flows of the expected PGM reserves and costs to extract the PGMs discounted at a weighted average cost of capital (WACC) of 9.0% for Kroondal and Platinum Mile, and 15.0% for Mimosa, and an average PGM (4E) basket price of R14,700/oz.
GOODWILL
Goodwill arising from the acquisition has been recognised as follows:
| | |
Figures in million - SA rand | | 2016 |
Consideration | | 4,301.5 |
Fair value of identifiable net assets | | (3,913.8) |
Non-controlling interests, based on their proportionate interest in the recognised amounts of the assets and liabilities | 12.9 |
Goodwill | | 400.6 |
The goodwill is attributable to the synergies between the PGM assets in the Rustenburg area. The allocation of goodwill has been provisionally allocated to the Kroondal and Rustenburg Operations CGUs. None of the goodwill recognised is expected to be deducted for tax purposes.
12.2 THE RUSTENBURG OPERATIONS ACQUISITION
On 9 September 2015, Sibanye announced that it had entered into written agreements with RPM, a wholly owned subsidiary of Anglo American Platinum Limited (Anglo American Platinum) to acquire the Bathopele, Siphumelele (including Khomanani), and Thembelani (including Khuseleka) mining operations, two concentrating plants, an on-site chrome recovery plant, the Western Limb Tailings Retreatment Plant, associated surface infrastructure and related assets and liabilities on a going concern basis (the Rustenburg Operations) (the Rustenburg Operations Transaction).
The purchase consideration comprises an upfront payment of R1.5 billion at the closing of the Rustenburg Operations Transaction (Closing) and a deferred payment calculated as being equal to 35% of the distributable free cash flow (as defined in the agreements) generated by the Rustenburg Operations over a six year period from the later of Closing or 1 January 2017 (Deferred Payment), subject to a minimum payment of R3.0 billion. In addition to the Deferred Payment, which allows for a favourable extended payment period; should the Rustenburg Operations generate negative distributable free cash flows in either 2016, 2017 or 2018, RPM will be required to pay up to R267 million per annum to ensure that the free cash flow for the relevant year is equal to zero.
On 19 October 2016, Sibanye obtained consent in terms of section 11 of the Mineral and Petroleum Resources Development Act for the transfer of the mining right and prospecting right pursuant to the Rustenburg Operations Transaction. Sibanye obtained control (88.4%) of the Rustenburg Operations on this date.
For the two months ended 31 December 2016, the Rustenburg Operations contributed revenue of R1,656.0 million and a loss of R150.0 million to the Group’s results.
The purchase price allocation has been prepared on a provisional basis in accordance with IFRS 3 Business Combinations. The values measured on a provisional basis include, inter alia, deferred tax and the process to determine the effective date tax valuations.
If new information obtained within one year of the acquisition date, about facts and circumstances that existed at the acquisition date, identifies adjustments to the below amounts, or any additional provisions that existed at the date of acquisition, then the accounting for the acquisition will be revised.
Consideration
The consideration paid is as follows:
| |
Sibanye Annual Financial Report 2016 | 148 |
Table of Contents
NOTES TO THE CONSOLIDATED FINANCIAL STATEMENTS continued
FOR THE YEAR ENDED 31 DECEMBER 2016
| | |
Figures in million - SA rand | Notes | 2016 |
Cash | | 1,500.0 |
Deferred Payment1 | 17 | 1,553.3 |
True-up amount2 | | 65.1 |
Total consideration | | 3,118.4 |
1 The Deferred Payment was based on 35% of the expected distributable free cash flow generated by the Rustenburg Operations over an extended payment period from 1 January 2017, subject to a minimum payment of R3.0 billion discounted at a cost of debt of 9.5%
2 The upfront purchase price was adjusted after Closing (i.e. the true-up amount) for actual Closing cash of the Rustenburg Operations in excess of the estimated Closing cash of the Rustenburg Operations and actual Closing working capital of the Rustenburg Operations in excess of the targeted Closing working capital of the Rustenburg Operations (in essence, representing a normalised level of working capital).
Acquisition related costs
The Group incurred acquisition related costs of R63.9 million on advisory and legal fees. These costs are recognised as transaction costs in profit or loss.
Identifiable assets acquired and liabilities assumed
The following table summarises the provisional fair value of assets acquired and liabilities assumed at the acquisition date:
| | |
Figures in million - SA rand | Notes | 2016 |
Property, plant and equipment | 11 | 4,021.5 |
Environmental rehabilitation obligation funds | 16 | 280.7 |
Non-current other receivables | | 220.9 |
Inventories | | 80.4 |
Trade and other receivables | | 2,991.6 |
Current financial assets | | 242.0 |
Cash and cash equivalents | | 0.1 |
Deferred tax | 8.3 | (898.5) |
Environmental rehabilitation obligation | 24 | (79.8) |
Trade and other payables | | (1,312.5) |
Total fair value of identifiable net assets acquired | | 5,546.4 |
The fair value of assets and liabilities excluding property, plant and equipment, and environmental rehabilitation obligation approximate their carrying value. The fair value of property, plant and equipment was based on the expected discounted cash flows of the expected PGM reserves and costs to extract the PGMs discounted at a WACC of 9.2% and an average PGM (4E) basket price of R14,725/oz.
Gain on acquisition
A gain on acquisition has been recognised as follows:
| | |
Figures in million - SA rand | | 2016 |
Consideration | | 3,118.4 |
Fair value of identifiable net assets | | (5,546.4) |
Gain on acquisition | | (2,428.0) |
The excess of the fair value of the net assets acquired over the consideration is recognised immediately in profit or loss as a gain on acquisition. The gain on acquisition is attributable to the fact that Anglo American Platinum has repositioned its portfolio by among others exiting certain assets. The Rustenburg Operations Transaction represented an attractively priced entry for Sibanye into the PGM sector.
13. GOODWILL
SIGNIFICANT ACCOUNTING JUDGEMENTS AND ESTIMATES
Goodwill is tested for impairment on an annual basis. Expected future cash flows used to determine the recoverable amount of property, plant and equipment and goodwill are inherently uncertain and could materially change over time. The recoverable amount is significantly affected by a number of factors including reserves and production estimates, together with economic factors such as the expected commodity price, foreign currency exchange rates, and estimates of production costs, future capital expenditure and discount rates.
An individual operating mine does not have an indefinite life because of the finite life of its reserves. The allocation of goodwill to an individual mine will result in an eventual goodwill impairment due to the wasting nature of the mine.
ACCOUNTING POLICY
Goodwill is stated at cost less accumulated impairment losses. In accordance with the provisions of IAS 36 Impairment of Assets, the Group performs its annual impairment review of goodwill at each financial year end or whenever there are impairment indicators to establish whether there is any indication of impairment to goodwill. A write-down is made if the carrying amount
| |
Sibanye Annual Financial Report 2016 | 149 |
Table of Contents
NOTES TO THE CONSOLIDATED FINANCIAL STATEMENTS continued
FOR THE YEAR ENDED 31 DECEMBER 2016
exceeds the recoverable amount. Impairment losses on goodwill are not reversed. Gains and losses on the disposal of an entity include the carrying amount of goodwill allocated to the entity sold.
Goodwill is allocated to CGUs for the purpose of impairment testing. The allocation is made to those CGUs or groups of CGUs that are expected to benefit from the business combination in which the goodwill arose.
| | | | |
Figures in million - SA rand | Notes | 2016 | 2015 | 2014 |
Balance at beginning of the year | | 736.7 | 736.7 | - |
Goodwill on acquisition of Aquarius | 12.1 | 400.6 | - | - |
Impairment | 7 | (201.3) | | |
Goodwill on acquisition of Cooke | | - | - | 736.7 |
Balance at end of the year | | 936.0 | 736.7 | 736.7 |
The goodwill arose on the acquisition of Cooke and Aquarius. The goodwill on acquisition of Cooke was attributable to the synergies at the Group’s other operations, the underlying assets of Cooke and West Rand Tailings Retreatment Project (WRTRP). At year end the goodwill on acquisition of Cooke is allocated to Beatrix R103.9 million, Driefontein R166.9 million, Kloof R165.5 million, and WRTRP R99.1 million CGUs where it is tested for impairment. The goodwill on acquisition of Aquarius is attributable to the synergies between the PGM assets in the Rustenburg area. The goodwill has been provisionally allocated to the Kroondal and Rustenburg Operations CGUs.
None of the goodwill recognised is expected to be deducted for tax purposes.
In line with the accounting policy, the recoverable amount was determined by reference to “fair value less costs to sell” being the higher of “value in use” and “fair value less cost to sell”, based on the cash flows over the life of the CGUs and discounted to present value at an appropriate discount rate.
The Group’s estimates and assumptions used in the 31 December 2016 calculation include:
| | | | | | |
Platinum | | | | Gold |
| 2015 | 2016 | | | | 2016 | 2015 |
| | | Long-term gold price | R/kg | 570,000 | 550,000 |
- | 14,725 | R/4Eoz | Long-term PGM (4E) basket price | R/4Eoz | | |
- | 15.7 | % | Nominal discount rate | % | 12.51 | 11.4 - 14.7 |
- | 6.0 | % | Inflation rate | % | 6.0 | 6.0 |
- | 8 - 26 | years | Life of mine | years | 7 - 20 | 8 - 27 |
1 Nominal discount rate for WRTRP of 13.5% (2015: 17.2%).
The annual life-of-mine plan that takes into account the following:
| · | | Proved and probable ore reserves of the CGUs; |
| · | | Resources are valued using appropriate price assumptions; |
| · | | Cash flows are based on the life-of-mine plan; and |
| · | | Capital expenditure estimates over the life-of-mine plan. |
During the six months ended 31 December 2016, the goodwill allocated to the Cooke CGU was impaired by R201.3 million (refer to note 7).
There were no other events or changes in circumstances that suggest that the carrying amount of a CGU may not be recoverable.
The recoverable amounts of the Driefontein, Kloof, Beatrix and WRTRP CGUs are significantly higher than their carry values, therefore a reasonably possible adverse change in the abovementioned assumptions would not likely result in an adjustment to the carrying values.
The recoverable amounts of the Kroondal and the Rustenburg Operations CGUs approximates their carrying values due to the fair value recognised on the acquisition (refer to note 12), therefore any reasonably possible adverse change in the abovementioned assumptions compared to the fair value assumptions used at acquisition (refer to note 12) could result in impairment.
| |
Sibanye Annual Financial Report 2016 | 150 |
Table of Contents
NOTES TO THE CONSOLIDATED FINANCIAL STATEMENTS continued
FOR THE YEAR ENDED 31 DECEMBER 2016
14. EQUITY-ACCOUNTED INVESTMENTS
SIGNIFICANT ACCOUNTING JUDGEMENTS AND ESTIMATES
Joint arrangements
Judgement is required to determine when the Group has joint control, which requires an assessment of the relevant activities and when the decisions in relation to those activities require unanimous consent. The Group has determined that the relevant activities for its joint arrangements are those relating to the operating and capital decisions of the arrangement, such as: the approval of the capital expenditure programme for each year, and appointing, remunerating and terminating the key management personnel or service providers of the joint arrangement. The considerations made in determining joint control are similar to those necessary to determine control over subsidiaries.
Judgement is also required to classify a joint arrangement as either a joint operation or a joint venture. Classifying the arrangement requires the Group to assess their rights and obligations arising from the arrangement. Specifically, it considers:
| · | | The structure of the joint arrangement – whether it is structured through a separate vehicle. |
| · | | When the arrangement is structured through a separate vehicle, the Group also considers the rights and obligations arising from: |
- the legal form of the separate vehicle; and
- the terms of the contractual arrangement.
This assessment often requires significant judgement, and a different conclusion on joint control and also whether the arrangement is a joint operation or a joint venture may materially impact the accounting.
ACCOUNTING POLICY
The Group’s interest in equity-accounted investees comprise interests in associates and joint ventures.
Associates are those entities in which the Group has significant influence, but not control or joint control, over the financial and operating policies. Joint ventures are arrangements in which the Group has joint control, whereby the Group has rights to the net assets of the arrangement, rather than rights to its assets and obligations for it liabilities.
Interests in associates and joint ventures are accounted for using the equity method. The interests are initially recognised at cost using the same principles as with business combinations. Subsequent to initial recognition, the consolidated financial statements include the Group’s share of profit or loss and other comprehensive income of equity-accounted investees until the date on which significant influence or joint control ceases.
Results of associates and joint ventures are equity-accounted using the results of their most recent audited annual financial statements or unaudited management accounts. Any losses from associates are brought to account in the consolidated financial statements until the interest in such associates is written down to zero. The interest includes any long-term interests that in substance, form part of the entity’s net investment in the equity-accounted investee, for example long-term receivables for which settlement is neither planned nor likely to occur in the foreseeable future. Thereafter, losses are accounted for only insofar as the Group is committed to providing financial support to such associates.
The carrying value of an equity-accounted investment represents the cost of the investment, including goodwill, the proportionate share of the post-acquisition retained earnings and losses, any other movements in reserves, any impairment losses and loans to or from the equity-accounted investee. The carrying value together with any long-term interests that in substance form part of the net investment in the equity-accounted investee is assessed annually for existence of indicators of impairment and if such exist, the carrying amount is compared to the recoverable amount, being the higher of value in use or fair value less costs to sell. If an impairment in value has occurred, it is recognised in the period in which the impairment arose. Indicators of impairment include a significant or prolonged decline in the investments fair value below its carrying value.
The Group holds the following equity-accounted investments:
| | | | |
Figures in million - SA rand | Notes | 2016 | 2015 | 2014 |
Rand Refinery | 14.1 | 72.4 | 148.7 | 55.1 |
Mimosa | 14.2 | 2,049.3 | - | - |
Other equity-accounted investments | | 35.7 | 18.8 | 14.3 |
Total equity-accounted investments | | 2,157.4 | 167.5 | 69.4 |
MATERIAL EQUITY-ACCOUNTED INVESTMENTS
14.1 RAND REFINERY
Sibanye has a 33.1% interest in Rand Refinery, a company incorporated in the Republic of South Africa, which is involved in the refining of bullion and by-products sourced from, inter alia, South African and foreign gold producing mining companies. Rand Refinery is accounted for using the equity method.
Rand Refinery recognised losses during the year as a result of inefficiencies in processing by-product stockpiles.
The carrying value of Rand Refinery remains an area of estimation and uncertainty.
| |
Sibanye Annual Financial Report 2016 | 151 |
Table of Contents
NOTES TO THE CONSOLIDATED FINANCIAL STATEMENTS continued
FOR THE YEAR ENDED 31 DECEMBER 2016
The equity-accounted investment in Rand Refinery movement for the year is as follows:
| | | | |
Figures in million - SA rand | Notes | 2016 | 2015 | 2014 |
Balance at beginning of the year | | 148.7 | 55.1 | 270.1 |
Share of results of equity-accounted investee after tax1 | | (116.5) | 114.5 | (480.0) |
Interest on the loan to equity-accounted investee capitalised | | 40.2 | - | - |
Loan (repaid by)/advanced to equity-accounted investee | | - | (20.9) | 384.6 |
Impairment | 7 | - | - | (119.6) |
Balance at end of the year | | 72.4 | 148.7 | 55.1 |
1 Rand Refinery changed to a 31 August year end (from a 30 September year end). Rand Refinery is equity accounted based on its results for the period ended 30 November.
On 18 December 2014, Rand Refinery drew down R1.029 billion under a R1.2 billion subordinated shareholders loan (the Facility), with Sibanye’s proportional share being R384.6 million. Amounts drawn down under the Facility are repayable within two years from the first draw down date. If the loan is not repaid within two years, it will automatically convert into equity in Rand Refinery. Interest under the Facility is at JIBAR plus a margin of 3.5%. Sibanye has subordinated all claims it might have against Rand Refinery as part of the Facility agreement. During the year Rand Refinery paid Rnil (2015: R37.3 million and 2014: R1.2 million) interest on the loan.
The Group’s interest in the summarised financial statements of Rand Refinery are:
| | | | |
Figures in million - SA rand | Notes | 2016 | 2015 | 2014 |
Revenue | | 903.0 | 1,021.0 | 377.0 |
Total comprehensive (loss)/income | | (352.0) | 346.0 | (299.0) |
Non-current assets | | 636.0 | 708.0 | 526.0 |
Current assets | | 419.0 | 512.0 | 346.0 |
Non-current liabilities | | (1,095.0) | (992.0) | (24.0) |
Current liabilities | | (467.0) | (383.0) | (1,349.0) |
Net liabilities (100.0%) | | (507.0) | (155.0) | (501.0) |
Reconciliation of the total investment in associate with attributable net assets: | | | |
Net liabilities (33.1%) | | (168.2) | (51.7) | (166.2) |
Dividend received | | (8.2) | (8.2) | (8.2) |
Fair value adjustment1 | | (35.5) | (35.5) | (35.5) |
Impairment | 7 | (119.6) | (119.6) | (119.6) |
Loan to equity-accounted investee | | 403.9 | 363.7 | 384.6 |
Total investment in Rand Refinery | | 72.4 | 148.7 | 55.1 |
1 The investment in equity-accounted investee was fair valued at 1 July 2002, the date when significant influence was obtained.
14.2 MIMOSA
Sibanye has a 50% interest in Mimosa Investments Limited (Mimosa), which owns and operates the Mimosa Mine.
The equity-accounted investment in Mimosa movement for the year is as follows:
| | | | |
Figures in million - SA rand | | | Notes | 2016 |
Balance at the beginning of the year | | | | - |
Share of results of equity-accounted investee after tax | | | | 114.9 |
Foreign currency translation | | | | (132.3) |
Equity-accounted investment on acquisition of subsidiaries | | | 12 | 2,066.7 |
Balance at end of the year | | | | 2,049.3 |
1 The share of results of equity-accounted investee after tax includes R265.0 million relating to the subsequent recovery of the Reserve Bank of Zimbabwe (RBZ) bond notes.
| |
Sibanye Annual Financial Report 2016 | 152 |
Table of Contents
NOTES TO THE CONSOLIDATED FINANCIAL STATEMENTS continued
FOR THE YEAR ENDED 31 DECEMBER 2016
The Group’s interest in the summarised financial statements of Mimosa are:
| | | | |
Figures in million - SA rand | | | | 2016 |
Revenue | | | | 2,446.4 |
Depreciation and amortisation | | | | (447.4) |
Interest income | | | | 1.0 |
Finance expense | | | | (22.4) |
Income tax | | | | (185.1) |
Profit or loss | | | | 229.8 |
Other comprehensive income | | | | (264.6) |
Total comprehensive income | | | | (34.8) |
Non-current assets | | | | 4,079.0 |
Property, plant and equipment | | | | 4,079.0 |
Current assets | | | | 2,259.5 |
Cash and cash equivalents | | | | 191.2 |
Other current assets | | | | 2,068.3 |
Non-current liabilities | | | | (1,131.2) |
Non-current financial liabilities | | | | (141.2) |
Other non-current liabilities | | | | (990.0) |
Current liabilities | | | | (900.1) |
Current financial liabilities | | | | (762.2) |
Other current liabilities | | | | (137.9) |
Net assets (100.0%) | | | | 4,307.2 |
Reconciliation of the total investment in associate with attributable net assets: | | |
Net assets (50.0%) | | | | 2,153.6 |
Reconciling items1 | | | | (104.3) |
Total investment in Mimosa | | | | 2,049.3 |
1 The reconciling items include the difference between the carrying amount and fair value of the Mimosa’s identifiable assets and liabilities on acquisition less accumulated amortisation, the remaining impairment of the RBZ bond notes, and foreign exchange differences on translation of assets and liabilities of the foreign joint venture.
Repatriation of funds from Zimbabwe is subject to regulatory approval in Zimbabwe.
15. INTERESTS IN JOINT OPERATIONS
ACCOUNTING POLICY
A joint operation is a joint arrangement in which the parties that share joint control have rights to the assets, and obligations for the liabilities, relating to the arrangement.
In relation to the Group’s interests in joint operations, the following are recognised in the financial statements:
| · | | the Group’s share of the jointly controlled assets, classified according to the nature of the assets; |
| · | | any liabilities that the Group has incurred; |
| · | | the Group’s share of any liabilities incurred jointly with the other ventures in relation to the joint operation; |
| · | | any income from the sale or use of the Group’s share of the output of the joint operation, together with the Group’s share of any expenses incurred by the joint operation; and |
| · | | any expenses that the Group has incurred in respect of its interest in the joint operation. |
The Group’s interests in joint operations includes a 50% interest in two joint operations each referred to as the “Notarial Pooling and Sharing Agreements”. The principal activities of the joint operations are to extend the Kroondal mine over the boundary of the properties covering the Kroondal mine and expand the Marikana mine operations through mineral rights contributed by Anglo American Platinum through its subsidiary, RPM.
The Group’s share of the assets, liabilities, revenue and expenses of the joint operations which are included in the consolidated financial statements, are as follows:
Kroondal Mine
| | | | |
Figures in million - SA rand | | | | 2016 |
Foreign exchange loss | | | | (67.8) |
Profit before tax | | | | 90.8 |
Profit for the year | | | | 90.8 |
Non-current assets | | | | 1,296.1 |
Current assets | | | | 1,208.1 |
Current liabilities | | | | (288.7) |
Net assets (50.0%) | | | | 2,215.5 |
| |
Sibanye Annual Financial Report 2016 | 153 |
Table of Contents
NOTES TO THE CONSOLIDATED FINANCIAL STATEMENTS continued
FOR THE YEAR ENDED 31 DECEMBER 2016
16. ENVIRONMENTAL REHABILITATION OBLIGATION FUNDS
ACCOUNTING POLICY
The Group’s rehabilitation obligation funds includes equity-linked investments that are fair valued at each reporting date. The fair value is calculated with reference to underlying equity instruments using industry valuation techniques and appropriate models. While Sibanye’s management believes that these assumptions are appropriate, the use of different assumptions could have a material impact on the fair value of the investments.
Annual contributions are made to dedicated environmental rehabilitation obligation funds to fund the estimated cost of rehabilitation during and at the end of the life of the relevant mine. The amounts contributed to these funds are included under non-current assets and are measured at fair value through profit or loss. Interest earned on monies paid to rehabilitation funds is accrued on a time proportion basis and is recorded as interest income.
In addition, bank guarantees are provided for funding shortfalls of the environmental rehabilitation obligations.
| | | | |
Figures in million - SA rand | Notes | 2016 | 2015 | 2014 |
Balance at beginning of the year | | 2,413.9 | 2,192.8 | 1,588.1 |
Contributions | | 74.7 | 77.8 | 69.3 |
Interest income | | 168.2 | 134.8 | 98.5 |
Fair value adjustment1 | | 11.1 | 8.5 | 62.7 |
Environmental rehabilitation obligation funds on acquisition of subsidiaries | 12 | 432.6 | - | 374.2 |
Balance at end of the year | | 3,100.5 | 2,413.9 | 2,192.8 |
| | | | |
Environmental rehabilitation obligation funds comprise of the following: | | | |
Restricted cash2 | | 352.3 | 341.8 | 301.5 |
Funds | | 2,748.2 | 2,072.1 | 1,891.3 |
1 The environmental rehabilitation trust fund includes equity-linked investments that are fair valued at each reporting date.
2 The funds are set aside to serve as collateral against the guarantees made to the Department of Minerals and Resources (DMR) for environmental rehabilitation obligations.
17. OTHER RECEIVABLES AND OTHER PAYABLES
SIGNIFICANT ACCOUNTING JUDGEMENTS AND ESTIMATES
Expected future cash flows used to determine the fair value of the other receivables and other payables (namely the Anglo financial assets and Deferred Payment, and rates and taxes receivable) are inherently uncertain and could materially change over time. They are significantly affected by a number of factors including reserves and production estimates, together with economic factors such as the expected commodity price, foreign currency exchange rates, and estimates of production costs, future capital expenditure and discount rates.
ACCOUNTING POLICY
Other receivables and other payables are initially recognised at fair value. Subsequent to initial recognition other receivables and other payables are measured at amortised cost.
17.1 OTHER RECEIVABLES
| | | | |
Figures in million - SA rand | | 2016 | 2015 | 2014 |
Anglo American Platinum financial assets | | 469.7 | - | - |
Right of recovery receivable | | 112.4 | - | - |
Rates and taxes receivable | | 82.4 | - | - |
Other | | 1.4 | 1.3 | 1.4 |
Total other receivables | | 665.9 | 1.3 | 1.4 |
| | | | |
Reconciliation of the non-current and current portion of the other receivables | | | |
Other receivables | | 665.9 | 1.3 | 1.4 |
Current portion of other receivables | | (310.6) | - | - |
Non-current portion of other receivables | | 355.3 | 1.3 | 1.4 |
| |
Sibanye Annual Financial Report 2016 | 154 |
Table of Contents
NOTES TO THE CONSOLIDATED FINANCIAL STATEMENTS continued
FOR THE YEAR ENDED 31 DECEMBER 2016
17.2 OTHER PAYABLES
| | | | |
Figures in million - SA rand | | 2016 | 2015 | 2014 |
Deferred Payment | 12 | 1,577.4 | - | - |
Right of recovery payable | | 36.3 | - | - |
Total other payables | | 1,613.7 | - | - |
| | | | |
Reconciliation of the non-current and current portion of the other payables | | | |
Other payables | | 1,613.7 | - | - |
Current portion of other payables | | - | - | - |
Non-current portion of other payables | | 1,613.7 | - | - |
ANGLO AMERICAN PLATINUM FINANCIAL ASSET AND DEFERRED PAYMENT
In terms of the Rustenburg Operations Transaction (refer to note 12.2) the purchase consideration includes a Deferred Payment, subject to a minimum payment of R3.0 billion. In addition to the Deferred Payment, which allows for a favourable extended payment period; should the Rustenburg Operations generate negative distributable free cash flows in either 2016, 2017 or 2018, RPM will be required to pay up to R267 million per annum to ensure that the free cash flow for the relevant year is equal to zero
RIGHT OF RECOVERY RECEIVABLE AND PAYABLE
Based on the first and second Notarial Pooling and Sharing agreements (PSAs) with Anglo American Platinum, Aquarius Platinum (South Africa) Proprietary Limited (AQPSA) holds a contractual right to recover 50% of the rehabilitation obligation relating to environmental rehabilitation resulting from PSA operations from RPM, where this rehabilitation relates to property owned by AQPSA. Likewise RPM holds a contractual right to recover 50% of the rehabilitation obligation relating to environmental rehabilitation resulting from PSA operations from AQPSA, where the rehabilitation relates to property owned by RPM. With respect to the opencast section of the Marikana mine that is on AQPSA property, RPM have limited their contractual liability to approximately R150 million, being a negotiated liability in terms of an amendment to the second PSA.
18. INVENTORIES
SIGNIFICANT ACCOUNTING JUDGEMENTS AND ESTIMATES
Net realisable value tests are performed at least annually and represent the estimated future sales price of the product based on prevailing spot commodity prices at the reporting date, less estimated costs to complete production and bring the product to sale. Future commodity price fluctuations could negatively impact the valuation of inventory. If any inventories are expected to be realised in the long-term horizon, estimated future sales prices are used for valuation purposes.
ACCOUNTING POLICY
Inventory is valued at the lower of cost and net realisable value. The Group values ore stockpiles, uranium-in-process and gold-in-process when it can be reliably measured. Cost is determined on the following basis:
| · | | PGM concentrate awaiting further processing, reef ore stockpiles and uranium stockpiles are valued using weighted average cost. Cost includes production, amortisation, depreciation and related administration costs; and |
| · | | Consumable stores are valued at weighted average cost after appropriate provision for surplus and slow-moving items. |
| | | | |
Figures in million - SA rand | | 2016 | 2015 | 2014 |
Consumable stores1 | | 481.7 | 277.5 | 274.9 |
Uranium finished goods and uranium-in-process2 | | 100.4 | 128.4 | 52.8 |
Ore stockpiles | | 51.8 | - | - |
Gold-on-hand | | 42.9 | - | - |
Total inventories | | 676.8 | 405.9 | 327.7 |
1 The cost of consumable stores consumed during the year and included in operating cost amounted to R5,243.2 million (2015: R3,995.7 million and 2014: R3,480.4 million).
2 Although the uranium finished goods and uranium-in-process was presented under current assets, management does not expect that all this inventory will be realised within 12 months from the reporting date.
During the year ended 31 December 2016, the Group recognised a net realisable value write down of R93.3 million on its uranium finished goods and uranium-in-process inventory. The write down is disclosed as part of cost of sales.
| |
Sibanye Annual Financial Report 2016 | 155 |
Table of Contents
NOTES TO THE CONSOLIDATED FINANCIAL STATEMENTS continued
FOR THE YEAR ENDED 31 DECEMBER 2016
19. TRADE AND OTHER RECEIVABLES
ACCOUNTING POLICY
Trade and other receivables are initially recognised at fair value and subsequently carried at amortised cost less allowance for impairment. Estimates made for impairment are based on a review of all outstanding amounts at year end. Irrecoverable amounts are written off during the period in which they are identified.
Trade receivables include actual invoiced sales of PGM concentrate as well as sales not yet invoiced for which deliveries have been made and the risks and rewards of ownership have passed. The receivable amount calculated for the PGM concentrate delivered but not yet invoiced is recorded at the fair value of the consideration receivable at the date of delivery. At each subsequent reporting date the receivable is restated to reflect the fair value movements in the pricing mechanism which is considered to represent an embedded derivative. Foreign exchange movements subsequent to the recognition of a sale are recognised as a foreign exchange gain or loss in profit or loss.
| | | | |
Figures in million - SA rand | | 2016 | 2015 | 2014 |
Trade receivables - gold sales | | 658.1 | 933.4 | 383.4 |
Trade receivables - platinum sales | | 4,001.9 | - | - |
Other trade receivables | | 306.5 | 108.4 | 177.6 |
Payroll debtors | | 154.7 | 109.5 | 87.3 |
Interest receivable | | 6.6 | 7.8 | 13.5 |
Financial assets | | 5,127.8 | 1,159.1 | 661.8 |
Prepayments | | 298.1 | 123.7 | 68.9 |
Value added tax | | 322.0 | 344.6 | 262.1 |
Total trade and other receivables | | 5,747.9 | 1,627.4 | 992.8 |
20. CASH AND CASH EQUIVALENTS
ACCOUNTING POLICY
Cash and cash equivalents comprise cash on hand, demand deposits and short-term, highly liquid investments readily convertible to known amounts of cash and subject to insignificant risk of changes in value and are measured at amortised cost which is deemed to be fair value as they have a short-term maturity.
| | | | |
Figures in million - SA rand | | 2016 | 2015 | 2014 |
Cash at the bank and on hand | | 967.9 | 717.4 | 562.9 |
Total cash and cash equivalents | | 967.9 | 717.4 | 562.9 |
21. STATED SHARE CAPITAL
ACCOUNTING POLICY
Ordinary share capital
Ordinary shares are classified as equity. Incremental costs directly attributable to the issue of ordinary shares are recognised as a deduction from equity, net of any tax effects.
| | | | |
Figures in thousand | Notes | 2016 | 2015 | 2014 |
Authorised number of shares | | 2,000,000 | 2,000,000 | 1,000,000 |
| | | | |
Reconciliation of issued number of shares | | | | |
Number of shares in issue at beginning of the year | | 916,140 | 898,840 | 735,079 |
Shares issued under SGL Share Plan | | 12,864 | 17,300 | 6,866 |
Shares issued as consideration for the acquisition of Cooke | | - | - | 156,895 |
Number of shares in issue at end of the year | | 929,004 | 916,140 | 898,840 |
The authorised share capital was increased to 2,000,000,000 during the year ended 31 December 2015.
In terms of the general authority granted by the shareholders of the Company on 24 May 2016, the Board may issue authorised but unissued ordinary share capital representing not more than 5% of the issued share capital of the Company at 31 December 2015 in accordance with the memorandum of incorporation and the Companies Act.
All the Sibanye ordinary shares rank pari passu in all respects, there being no conversion or exchange rights attached thereto, and all of the ordinary shares will have equal rights to participate in capital, dividend and profit distributions by the Company.
| |
Sibanye Annual Financial Report 2016 | 156 |
Table of Contents
NOTES TO THE CONSOLIDATED FINANCIAL STATEMENTS continued
FOR THE YEAR ENDED 31 DECEMBER 2016
22. NON-CONTROLLING INTERESTS
ACCOUNTING POLICY
Non-controlling interests
The Group recognises any non-controlling interest in an acquiree either at fair value or at the non-controlling interest’s proportionate share of the acquiree’s net assets on an acquisition by acquisition basis. Subsequently, the carrying amount of non-controlling interest is the amount of the interest at initial recognition plus the non-controlling interest’s subsequent share of changes in equity.
Transactions with non-controlling interests
The Group treats transactions with non-controlling interests as transactions with equity owners of the Group. For purchases from non-controlling interests, the difference between any consideration paid and the relevant share acquired of the carrying value of net assets of the subsidiary is recorded in equity. Gains or losses on disposals to non-controlling interests where control is not lost are also recorded in equity. Where control is lost over a subsidiary, the gains or losses are recognised in profit or loss.
The Group’s non-controlling interests relates to the following subsidiaries:
| | | | |
Figures in million - SA rand | | 2016 | 2015 | 2014 |
Non-controlling interests of Newshelf 1114 | | - | 107.3 | 327.4 |
Non-controlling interests of GTSM | | 3.4 | 2.5 | 2.2 |
Non-controlling interest of Platinum Mile | | 14.3 | - | - |
Total non-controlling interests | | 17.7 | 109.8 | 329.6 |
NEWSHELF 1114
Sibanye has a 76% interest in Newshelf 1114, a company incorporated in the Republic of South Africa, which is involved in the mining of gold and uranium. The investment was acquired on 15 May 2014.
The current balance of 24% not owned by Sibanye forms part of the Newshelf 1114 BEE structure. Non-controlling interest takes into account any portion of the equity of Newshelf 1114 which is indirectly attributable to the shareholders of Sibanye as a result of funding provided by Sibanye.
The Newshelf 1114 BEE partners have no voting rights until it has fully repaid the loan owed to Sibanye.
The non-controlling interests of Newshelf 1114 consists of:
| | | | |
Figures in million - SA rand | Notes | 2016 | 2015 | 2014 |
Balance at beginning of the year | | 107.3 | 327.4 | - |
Non-controlling interest of the share of profits and losses of subsidiaries | 2 | (434.2) | (179.0) | (44.6) |
Transactions with Sibanye1 | | 326.9 | (41.1) | (24.2) |
Fair value of non-controlling interest on acquisition of Cooke | | - | - | 396.2 |
Total non-controlling interests | | - | 107.3 | 327.4 |
1 The transactions with Sibanye relate to the interest on funding from Sibanye. On acquisition of the Cooke Operations, the amount recognised as non-controlling interests represented the BEE consortium’s proportionate share of the net assets at acquisition date after considering the loan amount due and payable to Sibanye. As the recoverable amount of the Cooke CGU is lower than its carrying value, the BEE consortium’s proportionate share of the net fair value at 31 December 2016 is not sufficient to fund the BEE consortium’s attributable loss, and therefore the non-controlling interest was limited to zero.
Summarised financial information of the Newshelf 1114 group:
| | | | |
Figures in million - SA rand | | 2016 | 2015 | 2014 |
Total revenue of the Newshelf 1114 group | | 3,362.2 | 2,974.5 | 1,881.9 |
Total comprehensive income of the Newshelf 1114 group | | (1,957.3) | (744.9) | (187.8) |
| | | | |
Non-current assets | | 3,409.4 | 5,278.6 | 5,579.8 |
Current assets | | 199.1 | 395.5 | 219.0 |
Non-current liabilities | | (5,644.6) | (5,496.5) | (5,203.0) |
Current-liabilities | | (936.8) | (1,143.5) | (816.8) |
Net liabilities (100.0%) | | (2,972.9) | (965.9) | (221.0) |
| |
Sibanye Annual Financial Report 2016 | 157 |
Table of Contents
NOTES TO THE CONSOLIDATED FINANCIAL STATEMENTS continued
FOR THE YEAR ENDED 31 DECEMBER 2016
23. BORROWINGS
SIGNIFICANT ACCOUNTING JUDGEMENTS AND ESTIMATES
Expected future cash flows used to determine the fair value of borrowings (namely the Burnstone Debt) are inherently uncertain and could materially change over time. They are significantly affected by a number of factors including reserves and production estimates, together with economic factors such as the expected commodity price, foreign currency exchange rates, and estimates of production costs, future capital expenditure and discount rates.
ACCOUNTING POLICY
Borrowings are recognised initially at fair value, net of transaction costs incurred, where applicable and subsequently measured at amortised cost using the effective interest method.
Borrowings are classified as current liabilities unless the Group has an unconditional right to defer settlement of the liability for at least 12 months after the reporting date.
| | | | |
Figures in million - SA rand | Notes | 2016 | 2015 | 2014 |
R6.0 billion revolving credit facility | 23.1 | 5,100.0 | - | - |
US$350 million revolving credit facility | 23.2 | 1,369.0 | - | - |
R4.5 billion Facilities | 23.3 | - | 1,961.6 | 1,979.5 |
Burnstone Debt | 23.4 | 1,752.6 | 1,808.3 | 1,134.4 |
Other borrowings | 23.5 | 749.5 | - | - |
Franco-Nevada liability | | 2.7 | 33.7 | 56.1 |
Total borrowings | | 8,973.8 | 3,803.6 | 3,170.0 |
Reconciliation of the non-current and current portion of the borrowings: | | | |
Borrowings | | 8,973.8 | 3,803.6 | 3,170.0 |
Current portion of borrowings | | (752.3) | (1,995.3) | (554.2) |
Non-current portion of borrowings | | 8,221.5 | 1,808.3 | 2,615.8 |
The current portion of borrowings will be repaid out of operational cash flows or it will be refinanced by utilising available Group facilities.
23.1 R6.0 BILLION REVOLVING CREDIT FACILITY
On 15 November 2016, Sibanye cancelled and refinanced the R4.5 billion Facilities by drawing R3.2 billion under the R6.0 billion revolving credit facility (RCF). The purpose of the facility was to refinance the R4.5 billion Facilities, finance ongoing capital expenditure, working capital and general corporate expenditure requirements which may include the financing of future acquisitions of business combinations.
| | | | |
Terms of the R6.0 billion RCF |
Facility: | R6.0 billion |
Interest rate: | JIBAR |
Interest rate margin: | 2.4% |
Term of loan: | Three years |
Borrowers: | Sibanye, SRPM and Kroondal |
Security and/or guarantors: | The facility is unsecured and guaranteed by Sibanye, Rand Uranium, SRPM and Kroondal. |
| | | | |
Figures in million - SA rand | Notes | 2016 | 2015 | 2014 |
Loans raised | | 5,100.0 | - | - |
Balance at end of the year | | 5,100.0 | - | - |
| |
Sibanye Annual Financial Report 2016 | 158 |
Table of Contents
NOTES TO THE CONSOLIDATED FINANCIAL STATEMENTS continued
FOR THE YEAR ENDED 31 DECEMBER 2016
23.2 US$350 MILLION REVOLVING CREDIT FACILITY
On 24 August 2015 Sibanye entered into a US$300 million syndicated RCF agreement. On 15 February 2016 the facility increased to US$350 million. The purpose of the facility was to finance ongoing capital expenditure, working capital and general corporate expenditure requirements which may include the financing of future acquisitions of business combinations.
| | | | |
Terms of the US$350 million RCF |
Facility: | US$350 million RCF (31 December 2015: US$300 million RCF) |
Interest rate: | LIBOR |
Interest rate margin: | 2% per annum |
Utilisation Fees | Where the total outstanding loans under the RCF fall within the range of the percentage of the total loan as set out below, Sibanye shall pay a utilisation fee equal to the percentage per annum set out opposite such percentage range. |
| % of the total loans | Utilisation fee |
| Less than or equal to 33⅓% | 0.15% |
| Greater than 33⅓% and less than or equal to 66⅔% | 0.30% |
| Greater than 66⅔% | 0.50% |
Term of loan: | Three years |
Borrowers: | Sibanye, SRPM and Kroondal |
Security and/or guarantors: | The facility is unsecured and guaranteed by Sibanye, Rand Uranium, SRPM and Kroondal. |
| | | | |
Figures in million - SA rand | | 2016 | 2015 | 2014 |
Loans raised | | 2,771.5 | - | - |
Loans repaid | | (1,211.6) | - | - |
Gain on foreign exchange differences | | (190.9) | - | - |
Balance at end of the year | | 1,369.0 | - | - |
23.3 R4.5 BILLION FACILITIES
Sibanye entered into the R4.5 billion Facilities on 13 December 2013. The R4.5 billion Facilities was used to refinance the unbundling bridge loan facilities.
| | | | |
Terms of the R4.5 billion Facilities |
Facility: | R2.5 billion revolving credit facility (RCF) |
| 2.0 billion term loan facility (Term Loan) |
Interest rate: | JIBAR |
Interest rate margin: | RCF: 2.85% |
| Term Loan: 2.75% |
Term of loan: | Three years |
Repayment period: | The Term Loan will be repaid in equal six-monthly instalments of R250 million, with the R750 million balance and any amounts outstanding under the RCF due for settlement on final maturity, being 13 December 2016. |
Security and/or guarantors: | The Facilities are unsecured and guaranteed by Rand Uranium and Ezulwini. |
Cancellation: | These facilities were cancelled and repaid on 15 November 2016. |
| | | | |
Figures in million - SA rand | Notes | 2016 | 2015 | 2014 |
Balance at beginning of the year | | 1,961.6 | 1,979.5 | 1,990.9 |
Loans raised | | 1,936.4 | 1,000.0 | 884.6 |
Loans repaid | | (3,900.0) | (1,020.9) | (900.0) |
Unwinding of amortised cost | 5 | 2.0 | 3.0 | 4.0 |
Balance at end of the year | | - | 1,961.6 | 1,979.5 |
Reconciliation of facilities: | | | | |
Term loan | | - | 998.0 | 1,494.9 |
RCF | | - | 963.6 | 484.6 |
| |
Sibanye Annual Financial Report 2016 | 159 |
Table of Contents
NOTES TO THE CONSOLIDATED FINANCIAL STATEMENTS continued
FOR THE YEAR ENDED 31 DECEMBER 2016
23.4 BURNSTONE DEBT
SGEO has bank debt of US$178.1 million (R1,883.9 million) (the Burnstone Debt) outstanding as part of the net assets acquired on 1 July 2014.
Terms of the Burnstone Debt
| | | | |
Facility: | A1: US$0.2 million |
| A2: US$7.8 million |
| A3: US$51.0 million |
| A4: US$119.1 million |
Interest rate: | A1 and A2: Interest free |
| A3 and A4: Interest free until 1 July 2017, then at London Interbank Offered Rate (LIBOR) |
Interest rate margin: | A3 and A4: 4% from 1 July 2017 |
Term of loan: | No fixed term |
Repayment period: | A1: Repaid on 1 July 2014 |
| A2: From 1 July 2017 the first 50% of Burnstone’s free cash flow (as defined in the settlement agreement) will be used to repay the Wits Gold Loan and the balance of 50% to repay A2 |
| A3 and A4: On settlement of A2. 90% of Burnstone’s free cash flow will be used to repay the Wits Gold Loan and the balance of 10% to repay the Burnstone Debt. On settlement of the Wits Gold Loan and interest, 30% of Burnstone’s free cash flow will be used to repay the Burnstone Debt and the balance will be distributed to Wits Gold. |
| The Bank Lenders will continue to participate in 10% of Burnstone’s free cash flow after the Burnstone Debt has been repaid in full to a maximum amount of US$63.0 million under a revenue participation agreement. |
Security: | The Burnstone Debt is fully secured against the assets of Burnstone (of R2.0 billion) and there is no recourse to the Sibanye Group. The security package includes a cession over the bank accounts, insurance policies’ proceeds, special and general notarial bonds over movable assets and mortgage bonds over property. |
The Burnstone Debt facilities of US$178.1 million (R1,883.9 million) were initially recognised at the acquisition fair value using level 2 (refer note 29) assumptions, being R1,007.6 million, in terms of IFRS 3. The expected free cash flows to repay the loan as detailed above were based on the estimates and assumptions to determine the fair value:
| · | | A US$ swap forward curve adjusted with the 4% interest rate margin above; |
| · | | The annual life-of-mine (LOM) plan that takes into account the following: |
- Proved and probable ore reserves of Burnstone;
- Cash flows are based on the life-of-mine plan of 22 years; and
- Capital expenditure estimates over the life-of-mine plan.
| | | | |
Figures in million - SA rand | Notes | 2016 | 2015 | 2014 |
Balance at beginning of the year | | 1,808.3 | 1,134.4 | - |
Unwinding of amortised cost | 5 | 139.4 | 99.3 | 39.3 |
(Gain)/loss on foreign exchange differences | | (224.4) | 412.1 | 89.4 |
Loss on revised estimated cash flows1 | | 29.3 | 162.5 | - |
Borrowings on acquisition of subsidiary | | - | - | 1,007.6 |
Loans repaid | | - | - | (1.9) |
Balance at end of the year | | 1,752.6 | 1,808.3 | 1,134.4 |
1 At 31 December 2016, the expected free cash flows expected to repay the loan as detailed above were revised as a result of:
• Revised proven and probable reserves;
• Revised cash flows over the LOM plan as a result of:
◦ Revised forecast costs and capital expenditure; and
◦ Revised gold prices (2016: R570,000/kg) (2015:R550,000/kg) and exchange rates (2016: R13.68/US$) (2015: R15.00/US$).
In terms of IAS 39 AG8 the carrying value of the Burnstone Debt increased by R29.3 million (2015: R162.5 million), recognised as part of loss on financial instruments in profit or loss.
23.5 OTHER BORROWINGS
SHORT-TERM CREDIT FACILITIES
Sibanye has uncommitted loan facilities with various banks to fund capital expenditure and working capital requirements at its operations. These facilities have no fixed terms, are short-term in nature and interest rates are market related.
| | | | |
Figures in million - SA rand | | 2016 | 2015 | 2014 |
Loans raised | | 7,472.6 | 552.0 | 739.0 |
Loans repaid | | (6,723.1) | (552.0) | (739.0) |
Balance at end of the year | | 749.5 | - | - |
| |
Sibanye Annual Financial Report 2016 | 160 |
Table of Contents
NOTES TO THE CONSOLIDATED FINANCIAL STATEMENTS continued
FOR THE YEAR ENDED 31 DECEMBER 2016
23.6 ACQUISITION BRIDGE FACILITIES
STILLWATER BRIDGE FACILITY
On 9 December 2016 Sibanye obtained a US$2.65 billion bridge facility (Bridge Facility) to finance the purchase of Stillwater Mining Company Limited (Stillwater), to refinance existing indebtedness at Stillwater and to pay certain related fees, costs and expenses.
| | | | |
Terms of the Stillwater Bridge Facilities |
Facility: | A: US$750 million bridge to equity |
| B: US$300 million bridge to cash |
| C: US$1.6 billion bridge to debt |
Interest rate: | LIBOR |
Interest rate margin: | Months 1 - 3: 3.25% per annum |
| Months 4 - 6: 4.25% per annum or 5.25% per annum if Net debt to EBITDA > 2.0x |
| Months 7 - 9: 5.25% per annum or 6.25% per annum if Net debt to EBITDA > 2.0x |
| Months 10 - 12: 6.25% per annum or 7.25% per annum if Net debt to EBITDA > 2.0x |
Term of loan: | Facility A and B: Earlier of nine months from completion of the Stillwater acquisition and 31 October 2017 |
| Facility C: 364 days from completion of the Stillwater acquisition |
Borrowers: | Sibanye and Thor Mergeco Inc |
Security and/or guarantors: | The facility is unsecured and guaranteed by Sibanye, Thor Mergeco Inc and Kroondal. Rand Uranium and SRPM must accede as guarantors before completion of the Stillwater acquisition. |
The Bridge Facility can only be drawn on completion of the Stillwater transaction which is expected to be in in the second quarter of 2017, thus the facility was undrawn as at 31 December 2016.
AQUARIUS BRIDGE FACILITY
On 5 October 2015 Sibanye entered into a US$300 million acquisition bridge facility agreement for the purpose of providing funding, if required for the Aquarius acquisition. No funds were drawn under the facility and the facility was cancelled on 23 March 2016.
23.7 THE EXPOSURE TO INTEREST RATE CHANGES AND THE CONTRACTUAL REPRICING DATES
The exposure of the Group’s borrowings to interest rate changes and the contractual repricing dates at the reporting dates are as follows:
| | | | |
Figures in million - SA rand | | 2016 | 2015 | 2014 |
Floating rate with exposure to change in JIBAR | | 5,849.5 | 1,961.6 | 1,979.5 |
Floating rate with exposure to change in LIBOR | | 3,121.6 | 1,808.3 | 1,134.4 |
Non-current borrowings exposed to interest rate changes | | 8,971.1 | 3,769.9 | 3,113.9 |
| | | | |
The Group has the following undrawn borrowing facilities: | | | | |
Committed | | 4,322.5 | 6,198.4 | 2,015.4 |
Uncommitted | | 200.5 | 548.0 | 548.0 |
Total undrawn facilities | | 4,523.0 | 6,746.4 | 2,563.4 |
| | | | |
All of the above facilities have floating rates. The undrawn | | | | |
committed facilities have the following expiry dates: | | | | |
– within one year | | - | 1,536.4 | - |
– later than one year and not later than two years | | 3,422.5 | - | 2,015.4 |
– later than two years and not later than three years | | 900.0 | 4,662.0 | - |
Total undrawn committed facilities | | 4,322.5 | 6,198.4 | 2,015.4 |
23.8 CAPITAL MANAGEMENT
The Group’s primary objective with regards to managing its capital is to ensure that there is sufficient capital available to support the funding requirements of the Group, including capital expenditure, in a way that: optimises the cost of capital; maximises shareholders’ returns; and ensures that the Group remains in a sound financial position.
There were no changes to the Group’s overall capital management approach during the current year.
The Group manages and makes adjustments to the capital structure as and when borrowings mature or as and when funding is required. This may take the form of raising equity, market or bank debt or hybrids thereof. Opportunities in the market are also monitored closely to ensure that the most efficient funding solutions are implemented.
| |
Sibanye Annual Financial Report 2016 | 161 |
Table of Contents
NOTES TO THE CONSOLIDATED FINANCIAL STATEMENTS continued
FOR THE YEAR ENDED 31 DECEMBER 2016
The Group monitors capital using the ratio of net external debt to earnings before interest, taxes, depreciation and amortisation (EBITDA), but does not set absolute limits for this ratio. The Group is comfortable with a ratio of net debt to EBITDA of one times or lower.
| | | | |
Figures in million - SA rand | Notes | 2016 | 2015 | 2014 |
Borrowings1 | 23 | 7,221.2 | 1,995.3 | 2,035.6 |
Cash and cash equivalents2 | 20 | 928.4 | 633.4 | 529.6 |
Net debt3 | | 6,292.8 | 1,361.9 | 1,506.0 |
EBITDA4 | | 10,531.6 | 6,337.0 | 7,469.1 |
Net debt to EBITDA (Ratio)5 | | 0.60 | 0.21 | 0.20 |
1 Borrowings are only those borrowings that have recourse to Sibanye. Borrowings thus exclude the Burnstone Debt (refer to note 23.4).
2 Cash and cash equivalents exclude cash of Burnstone.
3 Net debt excludes Burnstone Debt and Burnstone cash.
4 EBITDA is net operating profit before depreciation and amortisation.
5 Net debt to EBITDA ratio is defined as net debt as at the end of a reporting period divided by EBITDA of the 12 months ended on the same reporting date.
24. ENVIRONMENTAL REHABILITATION OBLIGATION
SIGNIFICANT ACCOUNTING JUDGEMENTS AND ESTIMATES
The Group’s mining and exploration activities are subject to various laws and regulations governing the protection of the environment. The Group recognises management’s best estimate for asset retirement obligations in the period in which they are incurred. Actual costs incurred in future periods could differ materially from the estimates. Additionally, future changes to environmental laws and regulations, life of mine estimates and discount rates could affect the carrying amount of this provision.
ACCOUNTING POLICY
Provisions are recognised when the Group has a present obligation, legal or constructive resulting from past events and it is probable that an outflow of resources embodying economic benefits will be required to settle the obligation and a reliable estimate can be made of the amount of the obligation.
Long-term environmental obligations are based on the Group’s environmental management plans, in compliance with applicable environmental and regulatory requirements.
The estimated costs of rehabilitation are reviewed annually and adjusted as appropriate for changes in legislation, technology or other circumstances. Cost estimates are not reduced by the potential proceeds from the sale of assets or from plant clean up at closure.
Based on disturbances to date, the net present value of expected rehabilitation cost estimates is recognised and provided for in full in the financial statements. The estimates are reviewed annually and are discounted using a risk-free rate that is adjusted to reflect the current market assessments of the time value of money and the risks specific to the obligation.
Annual changes in the provision consist of finance costs relating to the change in the present value of the provision and inflationary increases in the provision estimate, as well as changes in estimates. Changes in estimates are capitalised or reversed against the relevant asset to the extent that it meets the definition of dismantling and removing the item and restoring the site on which it is located. Costs that relate to an existing condition caused by past operations and do not have a future economic benefit are recognised in profit or loss. If a decrease in the liability exceeds the carrying amount of the asset, the excess is recognised immediately in profit or loss. The present value of environmental disturbances created are capitalised to mining assets against an increase in the environmental rehabilitation obligation.
Rehabilitation projects undertaken, included in the estimates are charged to the provision as incurred. The cost of ongoing current programmes to prevent and control environmental disturbances is charged against income as incurred. The unwinding of the discount due to the passage of time is recognised as finance cost, and the capitalised cost is amortised over the remaining lives of the mines.
| | | | |
Figures in million - SA rand | Notes | 2016 | 2015 | 2014 |
Balance at beginning of the year | | 2,411.0 | 2,486.8 | 1,660.7 |
Interest charge1 | 5 | 291.4 | 197.9 | 161.5 |
Payment of environmental rehabilitation obligation | | - | (0.3) | (10.9) |
Change in estimates2 | 11 | 472.5 | (273.4) | 131.5 |
Charge to profit or loss | | 97.5 | - | - |
Environmental rehabilitation obligation on acquisition of subsidiaries | 12 | 709.8 | - | 544.0 |
Balance at end of the year | | 3,982.2 | 2,411.0 | 2,486.8 |
1 The provision is calculated based on the discount rates of 8.5% – 10.2% (2015: 8.5% - 10.2% and 2014: 7.2% - 8.6%).
2 Changes in estimates are defined as changes in reserves and corresponding changes in life of mine, changes in discount rates, and changes in laws and regulations governing environmental matters. In 2016 the environmental rehabilitation obligation acquired was calculated based on the weighted average cost of capital in terms of IFRS 3 for acquisition purposes. Subsequent to initial recognition the provision was recalculated based on the risk free rate of interest in terms of IAS 37 Provisions, Contingent Liabilities and Contingent Assets. The resulting change in estimate during 2016 was R157.4 million and R197.6 million related to Aquarius and the Rustenburg Operations, respectively (2014: R153.1 million).
| |
Sibanye Annual Financial Report 2016 | 162 |
Table of Contents
NOTES TO THE CONSOLIDATED FINANCIAL STATEMENTS continued
FOR THE YEAR ENDED 31 DECEMBER 2016
The Group’s mining operations are required by law to undertake rehabilitation works as part of their ongoing operations. The Group makes contributions into environmental rehabilitation obligation funds (refer to note 16) and holds guarantees to fund the estimated costs.
25. TRADE AND OTHER PAYABLES
ACCOUNTING POLICY
Trade and other payables are recognised initially at fair value and subsequently measured at amortised cost using the effective interest method.
Provision is made for employee entitlement benefits accumulated as a result of employees rendering services up to the reporting date. Liabilities arising in respect of wages and salaries, annual leave and other benefits due to be settled within twelve months of the reporting date are measured at rates which are expected to be paid when the liability is settled.
All other employee entitlement liabilities are measured at the present value of estimated payments to be made in respect of services rendered up to reporting date.
| | | | |
Figures in million - SA rand | | 2016 | 2015 | 2014 |
Trade creditors | | 1,121.3 | 508.7 | 542.6 |
Accruals and other creditors | | 1,971.4 | 873.3 | 923.9 |
Payroll creditors | | 867.7 | 797.8 | 748.4 |
Leave pay accrual | | 1,110.7 | 553.8 | 482.5 |
Other | | 109.4 | 25.8 | 17.2 |
Total trade and other payables | | 5,180.5 | 2,759.4 | 2,714.6 |
26. CASH GENERATED BY OPERATIONS
| | | | |
Figures in million - SA rand | Notes | 2016 | 2015 | 2014 |
Profit for the year | | 3,271.0 | 538.2 | 1,506.9 |
Royalties | 8.1 | 546.6 | 400.6 | 430.5 |
Mining and income tax | 8.2 | 1,243.2 | 377.2 | 828.1 |
Interest income | | (331.4) | (257.0) | (183.2) |
Finance expense | 5 | 903.1 | 561.8 | 400.0 |
Profit before interest, royalties and tax | | 5,632.5 | 1,620.8 | 2,982.3 |
Non-cash and other adjusting items: | | | | |
Amortisation and depreciation | 4 | 4,041.9 | 3,636.6 | 3,254.7 |
Share-based payments | 6 | 496.2 | 274.4 | 417.9 |
Loss on financial instruments | | 1,094.6 | 229.5 | 107.7 |
(Gain)/loss on foreign exchange differences | | (418.0) | 420.1 | 82.7 |
Share of results of equity-accounted investees after tax | 14 | (13.3) | (116.0) | 470.7 |
Impairments | 7 | 1,381.1 | - | 275.1 |
Gain on acquisition | | (2,428.0) | - | - |
Reversal of impairment | | - | - | (474.1) |
Net loss on derecognition of financial guarantee asset and liability | | - | 158.3 | - |
Other | | 49.3 | (93.3) | (35.6) |
Total cash generated by operations | | 9,836.3 | 6,130.4 | 7,081.4 |
27. CHANGE IN WORKING CAPITAL
| | | | |
Figures in million - SA rand | | 2016 | 2015 | 2014 |
Inventories | | (35.5) | (78.2) | (62.6) |
Trade and other receivables | | (220.0) | (634.6) | 166.7 |
Trade and other payables | | 17.9 | 44.8 | 110.4 |
Total change in working capital | | (237.6) | (668.0) | 214.5 |
28. ROYALTIES AND TAX PAID
28.1 Royalties paid
| | | | |
Figures in million - SA rand | Notes | 2016 | 2015 | 2014 |
Royalties payable at beginning of the year | | 25.6 | 20.4 | 240.0 |
Royalties | 8.1 | 546.6 | 400.6 | 430.5 |
Royalties paid | | (555.9) | (395.4) | (650.1) |
Royalties payable at end of the year | | 16.3 | 25.6 | 20.4 |
| |
Sibanye Annual Financial Report 2016 | 163 |
Table of Contents
NOTES TO THE CONSOLIDATED FINANCIAL STATEMENTS continued
FOR THE YEAR ENDED 31 DECEMBER 2016
28.2 Tax paid
| | | | |
Figures in million - SA rand | Notes | 2016 | 2015 | 2014 |
Tax payable at beginning of the year | | 104.0 | 63.6 | 527.2 |
Current tax | 8.2 | 1,111.8 | 696.7 | 879.2 |
Tax payable on acquisition of subsidiaries | 12 | 13.2 | - | 4.3 |
Tax paid | | (1,176.7) | (656.3) | (1,347.1) |
Tax payable at end of the year | | 52.3 | 104.0 | 63.6 |
29. FAIR VALUE OF FINANCIAL ASSETS AND FINANCIAL LIABILITIES, AND RISK MANAGEMENT
ACCOUNTING POLICY
Financial instruments recognised in the statement of financial position include cash and cash equivalents, trade and other receivables, borrowings, and trade and other payables.
The Group initially recognises loans and receivables on the date they originate. All other financial assets (including assets designated at fair value through profit or loss) are recognised initially on trade date, which is the date that the Group becomes a party to the contractual provisions of the instrument. The Group derecognises a financial asset when the contractual rights to the cash flows in a transaction in which substantially all the risks and rewards of the ownership of the financial asset are transferred. The Group derecognises a financial liability when its contractual obligations are discharged, cancelled or expired. Any interest in such transferred financial asset that is created or retained by the Group is recognised as a separate asset or liability. The particular recognition and measurement methods adopted are disclosed in the individual policy statements associated with each item.
A financial asset not classified at fair value through profit or loss is assessed at each reporting date to determine whether there is objective evidence that it is impaired. A financial asset is impaired if there is objective evidence of impairment as a result of one or more events that occurred after the initial recognition of the asset and those event(s) had an impact on the estimated future cash flows of that asset, that can be estimated reliably. Impairment losses are recognised through profit or loss.
On derecognition of a financial asset or liability, the difference between the carrying amount of the asset or liability and the sum of the consideration received and cumulative gains recognised in equity is recognised in profit or loss.
Refer to the relevant notes for the accounting policies of the following financial assets and financial liabilities:
| · | | Environmental rehabilitation obligation funds |
| · | | Other receivables and other payables |
| · | | Trade and other receivables |
| · | | Cash and cash equivalents |
| · | | Trade and other payables |
29.1 ACCOUNTING CLASSIFICATIONS AND MEASUREMENT OF FAIR VALUES
The following methods and assumptions were used to estimate the fair value of each class of financial instrument:
| · | | Trade and other receivables/payables, and cash and cash equivalents |
The carrying amounts approximate fair values due to the short maturity of these instruments.
| · | | Investments and environmental rehabilitation obligation funds |
The fair value of publicly traded instruments is based on quoted market values. The environmental rehabilitation obligation funds are stated at fair value based on the nature of the funds’ investments.
The fair value of borrowings approximates its carrying amounts as the impact of credit risk is included in the measurement of carrying amounts.
The fair value of financial instruments is estimated based on ruling market prices, volatilities and interest rates at 31 December 2016. All derivatives are carried on the statement of financial position at fair value.
The Group uses the following hierarchy for determining and disclosing the fair value of financial instruments:
| · | | Level 1: unadjusted quoted prices in active markets for identical asset or liabilities; |
| · | | Level 2: inputs other than quoted prices in level 1 that are observable for the asset or liability, either directly (as prices) or indirectly (derived from prices); and |
| · | | Level 3: inputs for the asset or liability that are not based on observable market data (unobservable inputs). |
| |
Sibanye Annual Financial Report 2016 | 164 |
Table of Contents
NOTES TO THE CONSOLIDATED FINANCIAL STATEMENTS continued
FOR THE YEAR ENDED 31 DECEMBER 2016
The following tables set out the Group's significant financial instruments measured at fair value by level within the fair value hierarchy:
| | | | | | | | |
| Carrying value | Fair Value |
Figures in million - SA rand | Fair value through profit or loss | Loans and other receivables | Other financial liabilities | Total | Level 1 | Level 2 | Level 3 | Total |
31 December 2016 | | | | | | | | |
Financial assets | | | | | | | | |
Measured at fair value: | | | | | | | | |
- Environmental rehabilitation obligation funds1 | 3,100.5 | - | - | 3,100.5 | 2,630.6 | 469.9 | - | 3,100.5 |
Not measured at fair value: | | | | | | | | |
- Other receivables2 | - | 665.9 | - | 665.9 | | | | - |
Financial liabilities | | | | | | | | |
Not measured at fair value: | | | | | | | | |
- Other payables2 | - | - | (1,613.7) | (1,613.7) | | | | - |
- Borrowings | - | - | (8,973.8) | (8,973.8) | | | | |
31 December 2015 | | | | | | | | |
Financial assets | | | | | | | | |
Measured at fair value: | | | | | | | | |
- Environmental rehabilitation obligation funds1 | 2,413.9 | - | - | 2,413.9 | 2,073.7 | 340.2 | - | 2,413.9 |
Financial liabilities | | | | | | | | |
Not measured at fair value: | | | | | | | | |
- Borrowings | - | - | 3,803.6 | 3,803.6 | | | | |
1 Environmental rehabilitation obligation funds comprises interest-bearing short-term investments valued using quoted market prices.
2 Other receivables and other payables are initially recognised at fair value. The non-recurring fair value measurement is a level 3 measurement as per the fair value hierarchy.
29.2 RISK MANAGEMENT ACTIVITIES
In the normal course of its operations, the Group is exposed to market risks, including commodity price, foreign currency, interest rate, liquidity and credit risk associated with underlying assets, liabilities and anticipated transactions. In order to manage these risks, the Group has developed a comprehensive risk management process to facilitate control and monitoring of these risks.
CONTROLLING AND MANAGING RISK IN THE GROUP
Sibanye has policies in areas such as counterparty exposure, hedging practices and prudential limits which have been approved by Sibanye’s Board of Directors (the Board). Management of financial risk is centralised at Sibanye's treasury department (Treasury), which acts as the interface between Sibanye’s Operations and counterparty banks. Treasury manages financial risk in accordance with the policies and procedures established by the Board and executive committee.
The Board has approved dealing limits for money market, foreign exchange and commodity transactions, which Treasury is required to adhere to. Among other restrictions, these limits describe which instruments may be traded and demarcate open position limits for each category as well as indicating counterparty credit-related limits. The dealing exposure and limits are checked and controlled each day and reported to the CFO.
The objective of Treasury is to manage all financial risks arising from the Group’s business activities in order to protect profit and cash flows. Treasury activities of Sibanye and its subsidiaries are guided by the Treasury Policy, the Treasury Framework as well as domestic and international financial market regulations. Treasury activities are currently performed within the Treasury Framework with appropriate resolutions from the Board, which are reviewed and approved annually by the Audit Committee.
The financial risk management objectives of the Group are defined as follows:
| · | | Liquidity risk management: the objective is to ensure that the Group is able to meet its short-term commitments through the effective and efficient management of cash and usage of credit facilities. |
| · | | Currency risk management: the objective is to maximise the Group’s profits by minimising currency fluctuations. |
| · | | Funding risk management: the objective is to meet funding requirements timeously and at competitive rates by adopting reliable liquidity management procedures. |
| · | | Investment risk management: the objective is to achieve optimal returns on surplus funds. |
| · | | Interest rate risk management: the objective is to identify opportunities to prudently manage interest rate exposures. |
| · | | Counterparty exposure: the objective is to only deal with approved counterparts that are of a sound financial standing and who have an official credit rating. The Group is limited to a maximum investment of 2.5% of the financial institutions’ equity, which is dependent on the institutions’ credit rating. The credit rating used is Fitch Ratings’ short-term credit rating for financial institutions. |
| |
Sibanye Annual Financial Report 2016 | 165 |
Table of Contents
NOTES TO THE CONSOLIDATED FINANCIAL STATEMENTS continued
FOR THE YEAR ENDED 31 DECEMBER 2016
| · | | Commodity price risk management: commodity risk management takes place within limits and with counterparts as approved in the treasury framework. |
CREDIT RISK
Credit risk represents risk that an entity will suffer a financial loss due to the other party of a financial instrument not discharging its obligation.
The Group has reduced its exposure to credit risk by dealing with a number of counterparties. The Group approves these counterparties according to its risk management policy and ensures that they are of good credit quality.
The carrying value of the financial assets represents the combined maximum credit risk exposure of the group.
Trade receivables are reviewed on a regular basis and an allowance for impairment is raised when they are not considered recoverable. Trade receivables comprise banking institutions purchasing commodities. These receivables are currently in a sound financial position and no impairment has been recognised.
Receivables that are past due but not impaired total R11.7 million (2015: R5.4 million and 2014: R19.4 million). At 31 December 2016, receivables of R2.6 million (2015: R1.9 million and 2014: R0.3 million) are considered impaired and are provided for.
Concentration of credit risk on cash and cash equivalents and non-current assets is considered minimal due to the abovementioned investment risk management and counterparty exposure risk management policies.
LIQUIDITY RISK
In the ordinary course of business, the Group receives cash proceeds from its operations and is required to fund working capital and capital expenditure requirements. The cash is managed to ensure surplus funds are invested to maximise returns whilst ensuring that capital is safeguarded to the maximum extent possible by investing only with top financial institutions.
Uncommitted borrowing facilities are maintained with several banking counterparties to meet the Group’s normal and contingency funding requirements.
The following are contractually due, undiscounted cash flows resulting from maturities of financial liabilities including interest payments:
| | | | |
Figures in million - SA rand | Total | Within one
year | Between
one and
five years | After five years |
31 December 2016 | | | | |
Trade and other payables | 4,069.8 | 4,069.8 | - | - |
Borrowings | | | | |
- Capital | 9,557.3 | - | 7,325.1 | 2,232.2 |
- Interest | 1,443.2 | - | 312.9 | 1,130.3 |
Total | 15,070.3 | 4,069.8 | 7,638.0 | 3,362.5 |
31 December 2015 | | | | |
Trade and other payables | 2,205.6 | 2,205.6 | - | - |
Borrowings1 | | | | |
- Capital | 4,871.7 | 1,970.7 | 113.9 | 2,787.1 |
- Interest | 1,872.7 | 168.7 | 52.9 | 1,651.1 |
Total | 8,950.0 | 4,345.0 | 166.8 | 4,438.2 |
1 Borrowings - JIBAR and LIBOR at 31 December 2015 adjusted by specific facility agreement of 2.75% and 4.00%, respectively.
Working capital and going concern assessment
As at 31 December 2016, the Group’s current assets exceeded its current liabilities by R1,466.6 million (2015: current liabilities exceeded current assets by R2,596.6 million) and during the year then ended Sibanye generated cash from operating activities of R4,405.5 million (2015: R3,515.3 million).
Sibanye has entered into a definitive agreement to acquire all of the outstanding common stock of Stillwater for US$18.00 per share, or US$2,200 million (approximately R30 billion) in cash (the Stillwater Transaction). The consideration represents a premium of 23% to Stillwater’s prior day closing share price, and 20% to Stillwater’s 20-day volume-weighted average closing share price. Sibanye has obtained a US$2,650 million bridge facility from a syndicate of banks initially led by Citibank and HSBC only to fund the Stillwater acquisition, refinance existing indebtedness at Stillwater, and pay certain related fees, costs and expenses (refer to note 23.6). Together with cash on hand, the Bridge Facility is sufficient to fully fund the Stillwater Transaction and is expected to close in the second quarter of 2017.
Post-closing of the Stillwater Transaction, Sibanye expects to raise in the capital markets new equity (of between US$750 million and US$1,300 million) and long-term debt (of between US$1,600 million and US$1,050 million), primarily through a proposed rights offer and a bond issue. Both the rights offer and bond issue are envisaged to be underwritten by some of the bridge facility arranging and funding banks, negotiation of which is ongoing, with the objective of maintaining a strong balance sheet and its dividend policy, and preserving its long-term financial flexibility. To enhance its capital structure and financing mix, Sibanye will also evaluate additional financing structures, which may include, among others, streaming facilities and the issuance of warrants and convertible bonds, all of which will be assessed considering prevailing market conditions, exchange rates and commodity
| |
Sibanye Annual Financial Report 2016 | 166 |
Table of Contents
NOTES TO THE CONSOLIDATED FINANCIAL STATEMENTS continued
FOR THE YEAR ENDED 31 DECEMBER 2016
prices. Consistent with its long-term strategy, Sibanye plans to deleverage over time to its targeted leverage (net debt to EBITDA ratio) of no greater than 1.0x EBITDA.
The Bridge Facility currently provides for the equity refinancing to be concluded by 31 October 2017 with the balance to be refinanced within 1 year of closing of the Stillwater Transaction. The Bridge Facility, as well as Sibanye’s existing facilities, permit a leverage ratio of 3.0x through to 31 October 2017, and 2.5x thereafter. The leverage ratio provides for pro forma adjustments to include EBITDA from acquired businesses in the calculation.
Sibanye’s leverage ratio post the conclusion of the Stillwater Transaction and prior to the proposed rights offer is expected to peak at no more than 2.2x EBITDA. Cash generated from operations and the proceeds of the proposed rights offer is expected to reduce Sibanye’s leverage ratio to below 2.2x by 31 December 2017, with the targeted leverage ratio of no greater than 1.0x EBITDA achieved shortly after 31 December 2018.
Aside from the Bridge Facility, the Group has further committed unutilised debt facilities of R4.3 billion at 31 December 2016 (2015: R6.2 billion).
The directors believe that the cash generated by its operations, the Stillwater Transaction Bridge Facility and the remaining balance of the Group’s revolving credit facilities will enable the Group to continue to meet its obligations as they fall due. If the Stillwater Transaction is not successful, the directors believe that the cash generated by its operations and the remaining balance of the Group’s revolving credit facilities will enable the Group to continue to meet its obligations as they fall due. The consolidated financial statements for the year ended 31 December 2016, therefore, have been prepared on a going concern basis.
MARKET RISK
The Group is exposed to market risks, including foreign currency, commodity price and interest rate risk associated with underlying assets, liabilities and anticipated transactions. Following periodic evaluation of these exposures, the Group may enter into derivative financial instruments to manage some of these exposures (refer to sensitivity analysis further in this note).
SENSITIVITY ANALYSIS
The sensitivity analysis shows the effects of reasonable possible changes of relevant risk variables on profit or loss or shareholders’ equity. The Group is exposed to commodity price, currency and interest rate risks. The effects are determined by relating the reasonable possible change in the risk variable to the balance of financial instruments at period end date.
The amounts generated from the sensitivity analyses are forward-looking estimates of market risks assuming certain adverse or favourable market conditions occur. Actual results in the future may differ materially from those projected results and therefore should not be considered a projection of likely future events and gains/losses.
Foreign currency sensitivity
General and policy
In the ordinary course of business, the Group enters into transactions, such as gold sales and PGM sales, denominated in foreign currencies, primarily US dollar. Although this exposes the Group to transaction and translation exposure from fluctuations in foreign currency exchange rates, the Group does not generally hedge this exposure, although it could be considered for significant expenditures based in foreign currency or those items which have long lead times to produce or deliver. Also, the Group on occasion undertakes currency hedging to take advantage of favourable short-term fluctuations in exchange rates when management believes exchange rates are at unsustainably high levels.
Currency risk only exists on account of financial instruments being denominated in a currency that is not the functional currency and being of a monetary nature. This includes but is not limited to US$350 million RCF (refer note 23.2), Franco-Nevada liability and Burnstone Debt (refer to note 23.4).
Foreign currency economic hedging experience
As at 31 December 2016, 2015 and 2014 there were no material foreign currency contract positions. As of 28 March 2017 there were no material foreign currency positions.
During the years ended 31 December 2016, 2015 and 2014, no forward cover was taken out to cover various commitments of Sibanye’s operations.
Foreign currency sensitivity analysis
Sibanye’s operations are all located in South Africa except for Mimosa, which is located in Zimbabwe and its revenues are equally sensitive to changes in the US dollar gold price and the rand/US dollar exchange rate (the exchange rate). Depreciation of the rand against the US dollar results in Sibanye’s revenues and operating margin increasing. Conversely, should the rand appreciate against the US dollar, revenues and operating margins would decrease. The impact on profitability of any change in the exchange rate can be substantial. Furthermore, the exchange rates obtained when converting US dollars to rand are set by foreign exchange markets over which Sibanye has no control. The relationship between currencies and commodities, which includes the gold price, is complex and changes in exchange rates can influence commodity prices and vice versa.
A sensitivity analysis of the mark-to-market valuation has not been performed as there were no material foreign currency contracts as of 28 March 2017.
| |
Sibanye Annual Financial Report 2016 | 167 |
Table of Contents
NOTES TO THE CONSOLIDATED FINANCIAL STATEMENTS continued
FOR THE YEAR ENDED 31 DECEMBER 2016
Commodity price sensitivity
The market price of commodities has a significant effect on the results of operations of the Group and the ability of the Group to pay dividends and undertake capital expenditures. The gold and PGM basket prices has historically fluctuated widely and is affected by numerous industry factors over which the Group does not have any control. The aggregate effect of these factors on the gold and PGM basket prices, all of which are beyond the control of the Group, is impossible for the Group to predict.
Commodity price hedging policy
As a general rule, the Group does not enter into forward sales, derivatives or other hedging arrangements to establish a price in advance for future gold and PGM production. Commodity hedging could, however, be considered in future under one or more of the following circumstances: to protect cash flows at times of significant capital expenditure; financing projects or to safeguard the viability of higher cost operations.
To the extent that it enters into commodity hedging arrangements, the Group seeks to use different counterparty banks consisting of local and international banks to spread risk. None of the counterparties is affiliated with, or related to parties of the Group.
Commodity price hedging experience
During the year ended 31 December 2016, Sibanye entered into the following sale of gold forward agreements to:
| · | | sell forward 22,100 ounces of Cooke’s gold effective from 1 February 2016 to 23 December 2016 at an average price of R18,777/oz.; and |
| · | | sell forward 13,700 additional ounces of Cooke’s gold effective from 1 June 2016 to 21 December 2016 at an average price of R20,309/oz. |
As at 31 December 2016, 2015 and 2014 no commodity price derivative instruments were entered into.
Commodity price contract position
As of 31 December 2016, 2015 and 2014, Sibanye had no outstanding commodity price contracts.
Interest rate sensitivity
General
The Group’s income and operating cash flows are dependent of changes in market interest rates. The Group’s interest rate risk arises from long-term borrowings.
As at 31 December 2016, the Group’s total borrowings amounted to R8,973.8 million (2015: R3,803.6 million and R3,170.0 million). The Group generally does not undertake any specific action to cover its exposure to interest rate risk, although it may do so in specific circumstances. Refer to note 23 for all the borrowings and the relevant interest rates per facility.
The portion of Sibanye’s interest-bearing borrowings at period end that is exposed to interest rate fluctuations is R8,971.1 million (2015: R3,769.9 million and 2014: R3,113.9 million). This debt is normally rolled for periods between one and three months and is therefore exposed to the rate changes in this period.
R5,849.5 million (2015: R1,961.6 million and 2014: R 1,979.5 million) of the total borrowings at the end of the period is exposed to changes in the JIBAR rate and R3,121.6 million (2015: R1,808.3 million and 2014: R1,134.4 million) is exposed to changes in the LIBOR rate. The relevant interest rates for each facility are described in note 25.
The table below summarises the effect of a change in finance expense on the Group’s profit or loss had JIBAR and LIBOR differed as indicated. The analysis is based on the assumption that the applicable interest rate increased/decreased with all other variables held constant. All financial instruments with fixed interest rates that are carried at amortised cost are not subject to the interest rate sensitivity analysis.
Interest rate sensitivity analysis
| | | | | | |
| Change in interest expenses for a change in interest rate |
Figures in million - SA rand | -1.5% | -1.0% | -0.5% | 0.5% | 1.0% | 1.5% |
31 December 2016 | | | | | | |
- JIBAR | 45.6 | 30.4 | 15.2 | (15.2) | (30.4) | (45.6) |
- LIBOR1 | - | - | - | (13.6) | (27.2) | (40.8) |
Change in finance expense | 45.6 | 30.4 | 15.2 | (28.8) | (57.6) | (86.4) |
31 December 2015 | | | | | | |
- JIBAR | 35.4 | 23.6 | 11.8 | (11.8) | (23.6) | (35.4) |
- LIBOR1 | - | - | - | (4.6) | (9.2) | (13.8) |
Change in finance expense | 35.4 | 23.6 | 11.8 | (16.4) | (32.8) | (49.2) |
1 No interest rate sensitivity analysis has been performed for a reduction in LIBOR due to LIBOR being less than 0.5%, a decrease in LIBOR would have no impact on the Group’s profit or loss.
| |
Sibanye Annual Financial Report 2016 | 168 |
Table of Contents
NOTES TO THE CONSOLIDATED FINANCIAL STATEMENTS continued
FOR THE YEAR ENDED 31 DECEMBER 2016
30. COMMITMENTS
| | | | | |
Figures in million - SA rand | | Notes | 2016 | 2015 | 2014 |
Capital expenditure | | | | | |
- Authorised | | | 3,757.4 | 3,052.6 | 4,717.4 |
Kloof | | | 1,256.0 | 1,307.7 | 1,851.0 |
Driefontein | | | 780.4 | 725.5 | 1,177.1 |
Beatrix | | | 130.0 | 120.3 | 270.8 |
Cooke | | | 207.2 | 194.1 | 650.5 |
Burnstone | | | 704.0 | 705.0 | 768.0 |
Kroondal | | | 260.7 | - | - |
Platinum Mile | | | 5.0 | - | - |
Rustenburg Operations | | | 413.0 | - | - |
Other | | | 1.1 | - | - |
- Contracted for | | | 321.2 | 294.4 | 350.5 |
Other guarantees | | | 55.5 | 55.5 | 55.5 |
Commitments will be funded from internal sources and to the extent necessary from borrowings. This expenditure primarily relates to hostel upgrades, mining activities and infrastructure.
31. contingent liabilities
SIGNIFICANT ACCOUNTING JUDGEMENTS AND ESTIMATES
Contingencies can be either possible assets or possible liabilities arising from past events which, by their nature, will only be resolved when one or more future events not wholly within the control of the Group occur or fail to occur or for contingent liabilities where a present obligation arising from a past event exists but is not recognised because either it is not probable that an out-flow of resources embodying economic benefits will be required to settle the obligation or the amount of the obligation cannot be determined with sufficient reliability. The assessment of such contingencies inherently involves the exercise of significant judgement and estimates of the outcome of future events.
POST CLOSURE WATER MANAGEMENT LIABILITY
The Group has identified a risk of potential long-term Acid Mine Drainage (AMD) and other groundwater pollution issues which are currently being experienced by peer mining groups. AMD relates to the acidification and contamination of naturally occurring water resources by pyrite-bearing ore contained in underground mines and in rock dumps, tailings dams and pits on the surface. The Group has not been able to reliably determine the financial impact that AMD might have on the Group, nor the timing of possible out flow, however, the Group has adopted a proactive approach by initiating projects such as Sibanye Amanzi (long-term water management strategy), the acquisition and development of innovative treatment technologies; and the development of regional mine closure models to predict water quality impacts. The Group operates a comprehensive water quality monitoring program, including bio-monitoring, as an early detection of potential AMD.
No adjustment for the effects that may result from AMD and other groundwater pollution issues, if any, have been made in the consolidated financial statements other than in the environmental rehabilitation obligation (refer to note 24).
OCCUPATIONAL HEALTHCARE SERVICES
The Group provides occupational healthcare services to its employees through its existing facilities at the various operations. There is a risk that the cost of providing such services could increase in the future depending upon changes in the nature of underlying legislation and the profile of employees. Any such increased cost cannot be quantified. The costs are however also mitigated by advances in technology relating to occupational health. The Group is monitoring developments in this regard.
The principal health risks associated with Sibanye’s mining operations in South Africa arise from occupational exposure to silica dust, noise, heat and certain hazardous chemicals. The most significant occupational diseases affecting Sibanye’s workforce include lung diseases (such as silicosis, tuberculosis, a combination of the two and chronic obstructive airways disease (COAD) as well as noise induced hearing loss. The Occupational Diseases in Mines and Works Act, 78 of 1973 (ODMWA), governs the compensation paid to mining employees who contract certain illnesses, such as silicosis. The South African Constitutional Court has ruled that a claim for compensation under ODMWA does not prevent an employee from seeking compensation from its employer in a civil action under common law (either as individuals or as a class). While issues, such as negligence and causation, need to be proved on a case-by-case basis, it is possible that such ruling could expose Sibanye to individual or class action claims related to occupational hazards and diseases (including silicosis). If Sibanye were to face a significant number of such claims and the claims were suitably established against it, the payments of compensation for the claims could have a material adverse effect on Sibanye’s results of operations and financial position. In addition, Sibanye may incur significant additional costs arising out of these issues, including costs relating to the payment of fees, levies or other contributions in respect of compensatory or other funds established (if any) and expenditures arising out of its efforts to resolve any outstanding claims or other potential action.
| |
Sibanye Annual Financial Report 2016 | 169 |
Table of Contents
NOTES TO THE CONSOLIDATED FINANCIAL STATEMENTS continued
FOR THE YEAR ENDED 31 DECEMBER 2016
On 21 August 2012, a court application was served on a group of respondents that included Sibanye (the August Respondents). On 21 December 2012, a further court application was issued and was formally served on a number of respondents, including Sibanye (the December Respondents) and, again on 10 January 2013, both the August Respondents and the December Respondents (together the Respondents), on behalf of current and former mine workers, and their dependents, of, amongst others, Sibanye and who allegedly contracted silicosis and/or other occupational lung diseases (OLD) (the Class). The court application of 21 August 2012 and 21 December 2012 are together referred to below as the Applications.
Sibanye filed a notice of its intention to oppose the applications and its attorneys to defend the claims.
These Applications requested that the court:
| 1. | | As a first phase, certify a class action to be instituted by the applicants on behalf of the class, as defined. |
| 2. | | As a second phase, possibly split the class, as defined into smaller classes based on common legal and factual issues. The Respondents are of the view that the definition of the class in the first phase and the proposed process involving the second phase are contrary to South African legal precedent. |
| 3. | | In the last phase, bring an action wherein they will attempt to hold the respondents liable for silicosis and other OLD and resultant consequences. |
The Applications do not identify the number of claims that may be instituted against the Respondents or the quantum of damages that the applicants may seek.
The Applications were heard during the weeks of 12 and 19 October 2015. Judgement was handed down certifying a class action to be instituted.
Anglo American South Africa, AngloGold Ashanti, Gold Fields, Harmony and Sibanye announced in November 2014 that they have formed a gold mining industry working group to address issues relating to the compensation and medical care for OLD in the gold mining industry in South Africa. Essentially, the companies are seeking a comprehensive and sustainable solution which deals both with the legacy compensation issues and future legal frameworks which, while being fair to employees, also ensures the future sustainability of companies in the industry.
The companies have engaged all stakeholders on these matters, including government, organised labour, other mining companies and legal representatives of claimants who have filed legal suits against the companies. These legal proceedings are being defended.
On 13 May 2016, the High court ruled in favour of the applicants and found that there were sufficient common issues to certify two industry-wide classes: (i) a silicosis class comprising current and former mine workers who have contracted silicosis and the dependents of mine workers who have died of silicosis; and (ii) a tuberculosis class comprising current and former mine workers who have worked on the mines for a period of not less than two years and who have contracted pulmonary tuberculosis and the dependents of deceased mine workers who died of pulmonary tuberculosis. The High court ordered a two-stage process in the class action: (i) resolve common issues and allow individuals to opt out, and (ii) allow the individuals to opt in to the class to make claims against the Respondents. The High court also decided that claims for general damages will transmit to the estate of the deceased mine worker who dies after the date of filing of the certification application.
On 3 June 2016, Sibanye and the other Respondents filed an application with the High Court for leave to appeal to the Supreme Court of Appeal. Arguments in the application for leave to appeal were heard on 23 June 2016. On 24 June 2016, leave to appeal was (i) granted in respect of the transferability of general damages claims but (ii) denied in respect of certification of silicosis and tuberculosis classes. On 15 July 2016, Sibanye and the other Respondents each filed petitions with the supreme court of Appeal for leave to appeal against the certification of the two separate classes for silicosis and tuberculosis.
On 21 September 2016, the Supreme Court of Appeal granted the Respondents leave to appeal against all aspects of the class certification judgement of the High Court delivered in May 2016. The appeal record has been filed.
At this stage, Sibanye can neither quantify the potential liability from the action due to the inherent legal and factual uncertainties with respect to the pending claims and other claims not yet filed against the Group nor can the length of time until finalisation or quantum be estimated.
STILLWATER TRANSACTION TERMINATION FEE
If the Stillwater Transaction agreement is terminated in certain circumstances, inter alia, Sibanye shareholder approval not have been obtained at the general meeting (on 25 April 2017), Sibanye shall pay to Stillwater an amount in cash equal to US$33.0 million plus the reasonable and documented out-of-pocket fees and expenses incurred by the Stillwater in connection with the contemplated transaction.
The Board recommend that Sibanye shareholders vote in favour of the Stillwater Transaction and accordingly, no adjustment for the effects that may result from the termination has been made in the consolidated financial statements.
32. RELATED-PARTY TRANSACTIONS
Sibanye entered into related-party transactions with Rand Refinery, and its subsidiaries during the year as detailed below. The transactions with these related parties are generally conducted with terms comparable to transactions with third parties, however in certain circumstances such as related-party loans, the transactions were not at arm’s length.
| |
Sibanye Annual Financial Report 2016 | 170 |
Table of Contents
NOTES TO THE CONSOLIDATED FINANCIAL STATEMENTS continued
FOR THE YEAR ENDED 31 DECEMBER 2016
RAND REFINERY
Rand Refinery, in which Sibanye holds a 33.1% interest, has an agreement with the Group whereby it refines all the Group’s gold production. No dividends were received during the years ended 31 December 2016, 2015 and 2014. For the year ending 31 December 2016, the group paid refining fees to Rand Refinery and received interest (refer to note 14.1 for the loan to Rand Refinery).
The table below details the transactions and balances between the Group and its related-parties:
| | | | | |
Figures in million - SA rand | | Notes | 2016 | 2015 | 2014 |
Rand Refinery | | | | | |
Refining fees paid | | | (44.4) | (30.8) | (30.6) |
Interest income | | 14.1 | 40.2 | 37.3 | 1.2 |
Loan receivable | | 14.1 | 403.9 | 363.7 | 384.6 |
KEY MANAGEMENT REMUNERATION
The executive directors and prescribed officers were paid the following remuneration during the year:
Figures in thousands – SA Rand | Salary | Annual bonus accrued for 2016 paid in 2017 | Share proceeds and dividends on Bonus Shares | Pension scheme total contribu-tions | Expense allowance | 2016 | 2015 |
Executive directors | | | | | | | |
Neal Froneman | 7,791 | 4,180 | 91,758 | 863 | 135 | 104,727 | 19,886 |
Charl Keyter | 4,292 | 2,090 | 19,266 | 605 | 46 | 26,299 | 13,119 |
Prescribed officers | | | | | | | |
Hartley Dikgale | 2,840 | 1,245 | 6,577 | 187 | – | 10,849 | 5,368 |
Dawie Mostert | 2,886 | 1,288 | 7,176 | 361 | – | 11,711 | 5,974 |
Jean Nel1 | 3,460 | 1,622 | – | – | – | 5,082 | – |
Themba Nkosi2 | 1,549 | 1,227 | – | 175 | – | 2,951 | – |
Wayne Robinson | 3,772 | 1,365 | 745 | 298 | – | 6,180 | 6,180 |
Richard Stewart | 3,067 | 1,353 | 574 | 337 | – | 5,331 | 5,152 |
Robert van Niekerk | 3,852 | 1,626 | 15,835 | 422 | – | 21,725 | 15,734 |
John Wallington3 | 3,134 | 1,264 | – | 550 | – | 4,948 | – |
Total | 36,643 | 17,260 | 141,921 | 3,798 | 181 | 199,803 | 71,410 |
1Appointed as a prescribed officer on 13 April 2016 and resigned as a prescribed officer on 1 November 2016.
2Appointed as a prescribed officer on 4 July 2016.
3Appointed as a prescribed officer on 1 February 2016.
| |
Sibanye Annual Financial Report 2016 | 171 |
Table of Contents
NOTES TO THE CONSOLIDATED FINANCIAL STATEMENTS continued
FOR THE YEAR ENDED 31 DECEMBER 2016
The non-executive directors were paid the following fees during the year:
| | | | | | | |
Figures in thousands – SA Rand | Directors’ fees | Committee fees | Expense allowance | 2016 | 2015 |
Non-executive directors | | | | | |
Chris Chadwick | 857 | 242 | – | 1,099 | 1,047 |
Robert Chan | 857 | 242 | 270 | 1,369 | 1,047 |
Tim Cumming | 857 | 433 | 47 | 1,337 | 1,278 |
Barry Davison | 857 | 554 | – | 1,411 | 1,387 |
Rick Menell | 857 | 715 | 30 | 1,602 | 1,535 |
Sello Moloko | 1,621 | – | – | 1,621 | 1,544 |
Nkosemntu Nika | 857 | 403 | – | 1,260 | 1,200 |
Keith Rayner | 857 | 673 | – | 1,530 | 1,420 |
Sue van der Merwe | 857 | 282 | – | 1,139 | 1,085 |
Jerry Vilakazi | 857 | 312 | – | 1,169 | 1,113 |
Jiyu Yuan | 857 | 121 | – | 978 | 604 |
| 10,191 | 3,977 | 347 | 14,515 | 13,263 |
The directors’ and prescribed officers’ share ownership at 31 December 2016 was:
| | |
| | |
| Number of shares |
| 2016 | 2015 |
Executive directors | | |
Neal Froneman1 | 804,402 | 164,832 |
Charl Keyter1 | 469,954 | 227,898 |
Non-executive directors | | |
Sello Moloko1 | 46,000 | - |
Chris Chadwick1 | 88 | 88 |
Tim Cumming1 | 100 | 100 |
Barry Davison1 | 500,000 | 500,000 |
Rick Menell1 | 44,800 | 44,800 |
Keith Rayner1 | 45,000 | 60,000 |
Sue van der Merwe1 | 424 | - |
Total share ownership by directors | 1,910,768 | 997,718 |
Prescribed officers | | |
Hartley Dikgale2 | 175,215 | - |
Themba Nkosi1 | 367 | - |
Richard Stewart1 | 12,854 | - |
Total share ownership by directors and prescribed officers | 2,099,204 | 997,718 |
1Share ownership at the date of this report is unchanged.
2Share ownership at the date of this report is 271,798 ordinary shares.
33. EVENTS AFTER REPORTING DATE
There were no events that could have a material impact on the financial results of the Group after 31 December 2016, other than those disclosed below.
FINAL DIVIDEND DECLARED
On 23 February 2017 a final dividend in respect of the six months ended 31 December 2016 of 60 SA cents per share was approved by the Board resulting in a total dividend of 145 SA cents per share for the year ended 31 December 2016. This dividend is not reflected in these financial statements. The final dividend will be subject to Dividend Withholding Tax.
| |
Sibanye Annual Financial Report 2016 | 172 |
| | | | |
REGISTERED SHAREHOLDER SPREAD AT 31 DECEMBER 2016 |
| Number of holders | % of total shareholders | Number of shares1 | % of issued capital2 |
1—1,000 shares | 14,177 | 78.71 | 2,499,255 | 0.27 |
1,001—10,000 shares | 2,773 | 15.40 | 8,983,613 | 0.97 |
10,001 – 100,000 shares | 740 | 4.11 | 25,096,607 | 2.70 |
100,001—1,000,000 shares | 228 | 1.27 | 70,989,811 | 7.64 |
1,000,001 shares and above | 94 | 0.52 | 821,435,056 | 88.42 |
Total | 18,012 | 100 | 929,004,342 | 100 |
1 As of 28 March 2017, the issued share capital of Sibanye consisted of 929,004,342 ordinary shares.
2 To our knowledge: (1) Sibanye is not directly or indirectly owned or controlled (a) by another entity or (b) by any foreign government; and (2) there are no arrangements the operation of which may at a subsequent date result in a change in control of Sibanye. To the knowledge of Sibanye’s management, there is no controlling shareholder of Sibanye.
| | | | |
PUBLIC AND NON-PUBLIC SHAREHOLDINGS AT 31 DECEMBER 2016 |
| Number of holders | % of total shareholders | Number of shares | % of issued capital |
Non-public shareholders | 12 | 0.07 | 21,034,437 | 2.26 |
●Directors | 9 | 0.05 | 1,910,768 | 0.21 |
●Share trust | 1 | 0.01 | 13,525,394 | 1.45 |
●Own holding | 2 | 0.01 | 5,598,275 | 0.60 |
Public shareholders | 18,000 | 99.93 | 907,969,905 | 97.74 |
Total | 18,012 | 100 | 929,004,342 | 100.00 |
| | |
FOREIGN CUSTODIANS ABOVE 3% AT 31 DECEMBER 2016 | | |
| Number of shares | % |
Bank of New York Depositary Receipts | 203,448,530 | 21.89 |
State Street Bank and Trust Company | 75,193,879 | 8.09 |
J.P. Morgan Chase Bank NA | 40,935,855 | 4.40 |
| | | | |
BENEFICIAL SHAREHOLDER CATEGORIES AT 31 DECEMBER 2016 |
| Number of holders | % of total shareholders | Number of shares | % of issued capital |
Other | 17,023 | 94.51 | 221,464,023 | 23.84 |
ADR | 70 | 0.39 | 203,448,530 | 21.90 |
Unit Trusts/ Mutual Funds | 329 | 1.83 | 161,938,257 | 17.43 |
Pension Funds | 235 | 1.30 | 152,600,017 | 16.43 |
Sovereign Wealth | 33 | 0.18 | 40,906,485 | 4.40 |
Custodians | 71 | 0.39 | 39,622,560 | 4.27 |
Private Investor | 131 | 0.73 | 29,652,509 | 3.19 |
Trading Position | 31 | 0.17 | 26,690,283 | 2.87 |
Insurance Companies | 23 | 0.13 | 24,882,169 | 2.68 |
Exchange-Traded Fund | 23 | 0.13 | 16,714,171 | 1.80 |
Corporate Holding | 3 | 0.02 | 6,700,576 | 0.72 |
Charity | 8 | 0.04 | 867,577 | 0.09 |
Medical Aid Scheme | 10 | 0.06 | 701,490 | 0.08 |
University | 4 | 0.02 | 684,840 | 0.07 |
Foreign Government | 3 | 0.02 | 639,352 | 0.07 |
Hedge Fund | 5 | 0.03 | 607,360 | 0.07 |
Local Authority | 6 | 0.03 | 505,490 | 0.05 |
Investment Trust | 2 | 0.01 | 254,187 | 0.03 |
Directors & Employees | 1 | 0.01 | 75,000 | 0.01 |
Stockbrokers | 1 | 0.01 | 49,466 | 0.01 |
Total | 18,012 | 100.00 | 929,004,342 | 100.00 |
| |
Sibanye Annual Financial Report 2016 | 173 |
The tables below show the change in the percentage ownership of Sibanye’s major shareholders, to the knowledge of Sibanye’s management, between 31 December 2014 and 31 December 2016.
| | | | | | |
INVESTMENT MANAGEMENT BENEFICIAL SHAREHOLDINGS ABOVE 3%1 |
| 2016 | 2015 | 2014 |
Number of shares | % | Number of shares | % | Number of shares | % |
Public Investment Corporation (SOC) Limited | 76,941,387 | 8.28 | 76,599,424 | 8.36 | 71,372,617 | 7.94 |
Van Eck Associates Corporation | 53,555,603 | 5.76 | 65,030,159 | 7.10 | 45,569,180 | 5.07 |
Old Mutual Plc | 51,099,720 | 5.50 | 34,870,880 | 3.81 | 47,870,156 | 5.33 |
BlackRock Inc | 34,764,380 | 3.74 | 11,100,898 | 1.22 | 12,283,252 | 1.37 |
Allan Gray Proprietary Limited | 4,428,112 | 0.48 | 75,903,026 | 8.29 | 89,681,047 | 9.98 |
Dimensional Fund advisors | 22,462,462 | 2.42 | 46,107,899 | 4.71 | 37,800,158 | 4.21 |
Investec | 9,026,558 | 0.97 | 29,818,210 | 3.25 | 29,171,028 | 3.25 |
1 A list of the investment managers holding, to the knowledge of Sibanye’s management, directly or indirectly, 3% or more of the issued share capital of Sibanye as of 28 March 2017 is set forth below:
| | |
| Number of shares | % |
Public Investment Corporation (SOC) Limited | 80,455,889 | 8.66 |
Van Eck Associates Corporation | 55,152,707 | 5.94 |
Old Mutual Plc | 35,650,804 | 3.83 |
BlackRock Inc | 34,724,999 | 3.74 |
BENEFICIAL SHAREHOLDINGS ABOVE 3%1 |
| 2016 | 2015 | 2014 |
Number of shares | % | Number of shares | % | Number of shares | % |
Gold One | 185,386,079 | 19.96 | 185,386,079 | 20.24 | 178,004,754 | 19.80 |
Government Employees Pension Fund (PIC) | 83,435,716 | 8.98 | 77,297,776 | 8.44 | 74,234,416 | 8.26 |
1 A list of the individuals and organisations holding, to the knowledge of Sibanye’s management, directly or indirectly, 3% or more of the issued share capital of Sibanye as of 28 March 2017 is set forth below:
| | |
| Number of shares | % |
Gold One | 185,386,079 | 19.96 |
Government Employees Pension Fund (PIC) | 80,455,889 | 8.66 |
Sibanye’s ordinary shares are subject to dilution as a result of any non-pre-emptive share issuance, including upon the exercise of Sibanye’s outstanding share options, issues of shares by the Board in compliance with BEE legislation or in connection with acquisitions.
The principal non-United States trading market for the ordinary shares of Sibanye is the JSE Limited, on which they trade under the symbol “SGL”. Sibanye’s American depositary shares (ADSs) trade in the United States on the NYSE under the symbol “SBGL”. The ADRs representing the ADSs were issued by the Bank of New York Mellon (BNYM) as Depositary. Each ADS represents four ordinary shares.
No public takeover offers by third parties have been made in respect of Sibanye’s shares or by Sibanye in respect of other companies’ shares during the last and current fiscal year.
| |
Sibanye Annual Financial Report 2016 | 174 |
SIBANYE GOLD LIMITED Incorporated in the Republic of South Africa Registration number 2002/031431/06 Share code: SGL Issuer code: SGL ISIN – ZAE E000173951 LISTINGS JSE: SGL NYSE: SBGL WEBSITE www.sibanyegold.co.za REGISTERED OFFICE Libanon Business Park 1 Hospital Street (off Cedar Avenue) Libanon Westonaria 1780 South Africa (Private Bag X5, Westonaria, 1780, South Africa) Tel: +27 11 278 9600 Fax: +27 11 278 9863 INVESTOR ENQUIRIES James Wellsted Senior Vice President: Investor Relations Sibanye Gold Limited Tel: +27 83 453 4014 +27 11 278 9656 E-mail: james.wellsted@sibanyegold.co.za COMPANY SECRETARY Cain Farrel Tel: +27 10 001 1122 Fax: +27 11 278 9863 E-mail: cain.farrel@sibanyegold.co.za | DIRECTORS Sello Moloko1 (Chairman) Neal Froneman (CEO) Charl Keyter (CFO) Chris Chadwick2 Robert Chan2 Timothy Cumming1 Barry Davison1 Rick Menell1 Nkosemntu Nika1 Keith Rayner1 Susan van der Merwe1 Jerry Vilakazi Jiyu Yuan2 1 Independent non-executive 2 Non-executive JSE SPONSOR JP Morgan Equities South Africa (Proprietary) Limited (Registration number: 1995/011815/07) 1 Fricker Road, Illovo, Johannesburg, 2196 Private Bag X9936, Sandton, 2196, South Africa OFFICE OF THE UNITED KINGDOM SECRETARIES St James’s Corporate Services Limited Suite 31, Second Floor 107 Cheapside London EC2V 6DN United Kingdom Tel: +44 20 7796 8644 Fax: +44 20 7796 8645 AUDITORS KPMG Inc. KPMG Crescent 85 Empire Road Parktown 2193 Johannesburg South Africa Tel: +27 11 647 7111 | AMERICAN DEPOSITARY RECEIPT TRANSFER AGENT BNY Mellon Shareowner Services PO Box 358516 Pittsburgh, PA 15252-8516 US Toll Free: +1 888 269 2377 Tel: +1 201 680 6825 Email: shrrelations@bnymellon.com Kim Schwarz Vice President, Relationship Manager BNY Mellon Depositary Receipts Direct Line: +1 212 815 2852 Mobile: +1 347 515 0068 Fax: +1 212 571 3050 Email: kimberly.schwarz@bnymellon.com TRANSFER SECRETARIES SOUTH AFRICA Computershare Investor Services (Proprietary) Limited Ground Floor 70 Marshall Street Johannesburg 2001 PO Box 61051 Marshalltown 2107 Tel: +27 11 370 5000 Fax: +27 11 688 5248 TRANSFER SECRETARIES UNITED KINGDOM Capita Asset Services The Registry 34 Beckenham Road Beckenham Kent BR3 4TU England Tel: 0871 664 0300 (calls cost 10p a minute plus network extras, lines are open 8:30 to 17:00, Monday to Friday) or +44 20 8639 3399 (overseas) Fax: +44 20 8658 3430 E-mail: ssd@capitaregistrars.com |
| |
Sibanye Annual Financial Report 2016 | 175 |
RISK FACTORS
In addition to the other information included in this annual report, the considerations listed below could have a material adverse effect on our business, financial condition or results of operations, resulting in a decline in the trading price of Sibanye’s ordinary shares or ADRs. The risks set forth below comprise all material risks currently known to us. These factors should be considered carefully, together with the information and financial data set forth in this document.
Risks related to Sibanye’s business
CHANGES IN THE MARKET PRICE FOR GOLD AND PGMS, WHICH IN THE PAST HAVE FLUCTUATED WIDELY, AFFECT THE PROFITABILITY OF SIBANYE’S GOLD AND PGM MINING OPERATIONS AND THE CASH FLOWS GENERATED BY THOSE OPERATIONS.
Sibanye’s revenues from its gold and platinum mining operations are primarily derived from the sale of gold and PGMs that they produce. Sibanye does not generally enter into commodity derivatives or other hedging arrangements in order to establish a price in advance of the sale of its gold or PGM production. As a result, it is fully exposed to changes in the gold and PGM prices, which could lead to reduced revenue should the gold or PGM price decline. For example, during the year ended 31 December 2016, the gold price fluctuated between US$1,077/oz and US$1,366/oz. During the year ended 31 December 2016, the platinum and palladium price fluctuated between US$821/oz and US$1,178/oz, and US$485/oz and US$770/oz, respectively.
The market price for gold has historically been volatile and is affected by numerous factors over which Sibanye has no control, such as general supply and demand, speculative trading activity and global economic drivers. During the period from the beginning of 2014 to 31 December 2016, the gold price has declined from a high price of US$1,385/oz in 2014 to a low price of US$1,077/oz in 2016. The market price for PGMs has been similarly volatile. Should the gold or PGM price decline below Sibanye’s production costs, it may experience losses and, should this situation remain for an extended period, Sibanye may be forced to curtail or suspend some or all of its projects, operations and/or reduce operational capital expenditures. Sibanye might not be able to recover any losses incurred during, or after, such events. A sustained period of significant gold or PGM price volatility may also adversely affect Sibanye’s ability to undertake new capital projects or to make other long-term strategic decisions. The use of lower gold and PGM prices in reserve calculations and LoM plans could also result in material impairments of Sibanye’s investment in gold or PGM mining properties or a reduction in its reserve estimates and corresponding restatements of its reserves and increased amortisation, reclamation and closure charges.
Exchange-traded funds for PGMs have been introduced in recent years that enable more investors to participate in the PGM markets, potentially resulting in more metal being held in inventory. The overhang from these significant investment holdings of palladium and platinum makes it more difficult to predict accurately future supply and demand for these metals and may contribute to added PGM price volatility.
Any of the above could have a material adverse effect on Sibanye’s business, operating results and financial condition. See “―Risks related to South Africa”.
BECAUSE GOLD AND PGMS ARE GENERALLY SOLD IN US DOLLARS, WHILE THE MAJORITY OF SIBANYE’S GOLD AND A SUBSTANTIAL AMOUNT OF SIBANYE’S PGM PRODUCTION COSTS ARE DENOMINATED IN RAND, SIBANYE’S OPERATING RESULTS AND FINANCIAL CONDITION WILL BE MATERIALLY HARMED IF THERE IS A MATERIAL CHANGE IN THE VALUE OF THE RAND.
Gold and PGMs are principally sold throughout the world in US dollars, but Sibanye’s costs of production at its operations in South Africa are primarily incurred in Rand. Recent volatility in the Rand has made our costs and results of operations less predictable than when exchange rates are more stable. In recent years, the Rand has experienced significant devaluation against the US dollar falling from R10.34/US$ as at 31 December 2013 to R15.54/US$ as at 31 December 2015, before strengthening again to R13.69/US$ as at 31 December 2016. Any significant recovery or appreciation of the Rand against the US dollar would increase our operating costs in US dollar terms, which could materially adversely affect our operating results and financial condition from the South African operations. Conversely, a further weakening of the Rand may result in higher inflation in South Africa, which would increase the prices Sibanye pays for products and services. Any of the above could have a material adverse effect on Sibanye’s business, operating results and financial condition.
SIBANYE’S OPERATIONS AND PROFITS HAVE BEEN AND MAY BE ADVERSELY AFFECTED BY LABOUR UNREST AND UNION ACTIVITY.
Organised labour dynamics in the mining sector, particularly in South Africa, are volatile and uncertain and as such, they have had, and may in the future have, a material adverse impact on our operations, production and financial performance. A recent increase in union activity and labour unrest in South Africa has resulted in more frequent industrial disputes and extended negotiations that have, along with other factors, negatively affected South Africa’s sovereign debt rating and subsequently the credit ratings of the country’s leading mining companies. While widespread strikes in the gold mining industry have not occurred since 2012, the South African platinum industry was subject to a five-month strike in 2014, which resulted in a 56% decrease in production at Aquarius’s Platinum Mile operation in its fiscal year ended 30 June 2014, as well as 167,000oz of total lost production at the Rustenburg Operations during the length of the strike. In addition, AMCU called a brief strike at the Kroondal Operations during May 2016, which was later interdicted by the Labour Court of South Africa on the basis that it was unprotected. In October 2015, Sibanye concluded a three-year labour agreement with NUM, UASA and Solidarity, but AMCU, which currently has minority recognition status at Beatrix and Kloof and majority status at Driefontein, rejected, and continued to
reject, further alternative offers made by Sibanye. Despite the acceptance of the labour agreement by NUM, UASA and Solidarity, and the extension thereof to all other employees, during March 2016, AMCU threatened industrial action should a higher wage not be agreed. This was averted by Sibanye entering into an agreement with AMCU for a marginally higher wage. NUM has expressed its dissatisfaction with this development and there can therefore be no guarantee that further strikes, work stoppages or other disruptions will not occur.
Furthermore, rivalry between unions, such as AMCU and NUM, may destabilise labour relations in the mining sector. For example, on 5 February 2015, a conflict occurred between AMCU and NUM members at Beatrix, resulting in injuries to nine Sibanye employees. Operations at Beatrix were temporarily suspended as a result of the incident, and only resumed on 9 February 2015 after Sibanye and the rival unions agreed to commit to maintaining peaceful co-existence and a safe working environment for employees. On 11 July 2016, the Company announced that it had given notice in terms of Section 189A of the Labour Relations Act 66 of 1995 and a 60-day consultation process was entered into with trade unions and affected employees at its Cooke 4 operation. This Section 189A process was completed without any material incidents of unrest, leading to the cessation of mining operations at the Cooke 4 operation and the redeployment of the majority of affected employees to other Sibanye operations. In addition, on 27 January 2017, the Company announced that it entered into a Section 189A consultation process at its South African platinum operations. This consultation could result in the retrenchment of approximately 330 employees, which may lead to future labour unrest.
In the United States, Stillwater’s employees located at the Stillwater Mine and the Columbus processing facilities are covered by a collective bargaining agreement with the United Steel Workers Local 11-001 (USW Local 11-0001) entered into in 2015. This agreement expires on 2 June 2019 with a limited re-negotiation (for wages only) in 2017. Stillwater’s employees at the East Boulder Mine are covered by a separate collective bargaining agreement with USW Local 11-0001, which expires 31 December 2019 with a limited re-negotiation (for wages only) in 2017. As the majority of Stillwater’s workforce in the United States is unionised, Stillwater, an independent company whose acquisition by Sibanye remains subject to conditions precedent, is subject to a risk of strikes and other labour disputes at its US operations, and its ability to alter labour costs is restricted by the fact that unionised employees are party to collective bargaining agreements.
In the event that further industrial relations-related interruptions were to occur at any of Sibanye’s operations, other mines’ operations or in other industries that impact its operations, or increased employment-related costs due to union or employee activity, these may have a material adverse effect on its business, production levels, production targets, results of operations, financial condition, reputation and future prospects. In addition, lower levels of mining activity can have a longer-term impact on production levels and operating costs, which may affect operating life. Mining conditions can deteriorate during extended periods without production and Sibanye will not re-commence mining until health and safety conditions are considered appropriate to do so.
SIBANYE’S MINERAL RIGHTS ARE SUBJECT TO LEGISLATION, WHICH COULD IMPOSE SIGNIFICANT COSTS AND BURDENS AND WHICH IMPOSE CERTAIN OWNERSHIP REQUIREMENTS, THE INTERPRETATION OF WHICH ARE THE SUBJECT OF DISPUTE.
Our operations in South Africa are subject to legislation regulating mineral rights. This includes BBBEE legislation designed to effect the entry and participation of HDSAs into the mining industry and increase their participation in the South African economy.
The Mineral and Petroleum Resources Development Act (MPRDA) came into effect on 1 May 2004. The MPRDA provides that the mineral resources of South Africa are the common heritage of the South African people with the South African government acting as custodian in order to, among other things, promote equitable access to the nation’s mineral resources by South Africans, expand opportunities for HDSAs who wish to participate in the South African mining industry and advance social and economic development. As custodian, the South African government exercises regulatory control over the exploitation of mineral resources and does so by exercising the power to grant the rights required to prospect and mine for minerals. Mining companies were required to apply for the right to mine and/or prospect and to convert existing mining rights to ���new order” mining rights. In order to qualify for these rights, applicants need to satisfy the DMR that the grant of such rights will advance the open-ended broad-based socio-economic empowerment requirements of the Mining Charter published pursuant to the MPRDA. In order to provide guidance on the fulfilment of these broad-based socio-economic empowerment requirements to the mining industry, the DMR published the Mining Charter, which also became effective on 1 May 2004. The current requirement is 26% HDSA ownership of mining assets. In 2010, the DMR introduced the Amended Mining Charter containing guidelines envisaging, among other things, that mining companies should achieve a minimum of 40% of HDSA demographic representation by 2014 at executive management (board) level, senior management (executive committee) level, core and critical skills, middle management level and junior management level.
On 31 March 2015, the Chamber of Mines reported that the DMR believes that empowerment transactions by mining companies concluded after 2004 where the HDSA ownership level has fallen due to HDSA disposal of assets or for other reasons should not be included in the calculation of HDSA ownership for the purposes of, among other things, the 26% HDSA ownership guidelines under the Mining Charter. The position of Sibanye is consistent with that of the Chamber of Mines and is that such historical empowerment transactions should be included in the calculation of HDSA ownership. The DMR and the Chamber of Mines jointly agreed to approach the South African courts to seek a declaratory order which will provide a ruling on the interpretation of relevant legislation and the status of the Mining Charter. The Chamber of Mines and the DMR filed papers in court and the matter was placed on the role to be heard on 15 March 2016. In February 2016, an application was filed by a third party to consolidate the application by the Chamber of Mines and the DMR with its own application for a declaratory order on the empowerment aspects of the Mining Charter. The Chamber of Mines opposed the consolidation of these applications on the basis that, amongst other things, the right to relief in the respective applications does not depend substantially on the same questions of law and/or fact. On 3 May 2016, the court refused to consolidate the two applications.
If the DMR were to prevail in court, Sibanye may be required to undertake further transactions in order to increase their HDSA ownership, which would result in the dilution of ownership levels of the existing Shareholders and could also have a negative impact on the financial indebtedness of Sibanye. In such event, Sibanye may be required to maintain a minimum HDSA ownership level indefinitely. On 15 April 2016, the DMR published the New Draft Mining Charter which seeks to, among other things, increase and maintain HDSA equity ownership in mining companies which would result in the dilution of existing Shareholders. Under the New Draft Mining Charter, current holders of mining rights will have a three year transitional period from the coming into effect of the New Draft Mining Charter to align themselves with the new ownership requirements. Where empowerment transactions have been concluded and empowerment partners have sold their shares and exited the structure, new empowerment transactions will need to be concluded for mining right holders to be compliant with the New Draft Mining Charter. Having first been introduced in the Amended Mining Charter, it is also proposed that HDSA entrepreneurs, communities and employees are brought into the ownership structure and all hold a mining equity stake of no less than 5% each. The New Draft Mining Charter was open for public comment for a thirty day period, and the DMR is currently in the process of reviewing the submissions that it received. The DMR’s review is likely to result in the New Draft Mining Charter undergoing revisions in the coming months. From 18 July 2016 to 31 October 2016, the DMR invited all those who made written submissions on the New Draft Mining Charter to make presentations and thereafter conclude the public commentary process. Sibanye presented on 18 July 2016.
Any adjustment to the ownership structure of Sibanye’s mining assets in order to meet BBBEE requirements could have a material adverse effect on the value of Sibanye’s shares. Further, Sibanye may in the future incur significant costs or have to issue additional shares as a result of changes in the interpretation of existing laws and guidelines or the imposition of new laws relating to HDSA ownership requirements, which may have a material adverse effect on Sibanye’s business, operating results and financial condition.
In terms of section 47 of the MPRDA, the Minister may suspend or cancel existing mining rights, or under section 23(3) of the MPRDA, refuse to grant applications for new mining rights by mining companies, including Sibanye, should such holders of mining rights be deemed not to be in compliance with the requirements of the MPRDA as read with South Africa’s mining industry empowerments requirements. However, it is this very issue which also forms part of the court application by the Chamber of Mines. If the Minister were to determine that Sibanye is not in compliance with the requirements of the MPRDA and its empowerment requirements, Sibanye may be required to engage in remedial steps, including changes to management and actions that require Shareholder approval.
There is no guarantee that any steps that have already been taken, or that Sibanye might take in the future, will ensure the successful renewal of Sibanye’s existing mining rights or the granting of applications for new mining rights.
An amendment to the MPRDA, namely the MPRDB, was passed by both the National Assembly and the South African National Council of Provinces (NCOP) on 27 March 2014. In January 2015, the President referred the MPRDB back to Parliament for reconsideration and on 1 November 2016, a revised version of the MPRDB was passed by the National Assembly and referred to the NCOP. On 3 March 2017, the National Assembly passed certain minor amendments to the MPRDB. The National Assembly has referred the MPRDB to the NCOP where the Select Committee will receive comments on the MPRDB by 22 March 2017.
POWER STOPPAGES, FLUCTUATIONS AND USAGE CONSTRAINTS IN SOUTH AFRICA MAY FORCE SIBANYE TO HALT OR CURTAIL OPERATIONS.
Electricity supply in South Africa has been constrained over the past decade and there have been multiple power disruptions. There is uncertainty as to whether the national power supply utility, Eskom, will be able to meet demand for power supply in the future. In June 2016, Eskom made an assurance that it had adequate capacity to supply projected national electricity demands for the next six years. Such statements have, however, historically proven to be unreliable and accordingly there is a lack of confidence in Eskom’s assurance of supply. As a result, it is possible that power disruptions may continue indefinitely. In addition to supply constraints, labour unrest in South Africa has before, and may in future, disrupt the supply of coal to power stations operated by Eskom and result in curtailed supply. For example, on 10 August 2016, Eskom failed to reach a wage agreement with NUM, which led to a 2‑day strike. Further, in the first quarter of fiscal 2014, rain impacted coal supply and constrained Eskom’s ability to provide power. In November 2014, Eskom declared a power emergency and required large industrial users, including Sibanye, to reduce their electricity usage by 10% for five hours as part of a broader electricity usage reduction programme. Despite the fact that Eskom has adopted a policy of asking households to reduce usage before asking industrial users to do so in order to reduce the economic impact of such disruptions, Eskom has warned that power constraints will continue.
The Department of Energy is developing a power conservation programme in an attempt to improve the reliability of power supply in South Africa. However, there can be no assurance that this programme will provide sufficient supply for the needs of the country or for Sibanye to run its operations at full capacity or at all. While Sibanye has backup generating capacity, this is insufficient for all operations during emergencies at all its mines and also occurs at a significantly higher cost than electricity supplied by Eskom.
Any further disruption or decrease in the electrical power supply available to Sibanye’s South African-based operations could have a material adverse effect on its business, operating results and financial condition.
POWER COST INCREASES IN SOUTH AFRICA MAY ADVERSELY AFFECT SIBANYE’S RESULTS OF OPERATIONS.
Sibanye’s mining operations in South Africa depend upon electrical power generated by the national power supply utility, Eskom. See “―Power stoppages, fluctuations and usage constraints in South Africa may force Sibanye to halt or curtail operations”. Eskom holds a monopoly on power supply in the South African market. In fiscal 2014, Eskom applied to the
National Energy Regulator of South Africa, or NERSA, for tariff increases and NERSA granted Eskom an average tariff increase of 12.69% effective 1 April 2015, being 8% plus 4.69% due to the clawing back by Eskom of prudent costs from the RCA for the three-year period from April 2010 to March 2013. On 1 March 2016, NERSA gave permission for Eskom to raise rates by an additional 9.4%, being 3.51% plus 5.89% due to the 2016 RCA adjustment for the 2014 fiscal year, in order to make up a cash flow shortfall. On 16 August 2016, the North Gauteng High Court overturned NERSA’s 2016 RCA adjustment decision. On 17 November 2016, the North Gauteng High Court granted Eskom’s and NERSA’s appeal to the Supreme Court of Appeal, which is currently pending. On 23 February 2017, NERSA granted an average tariff increase of 2.2% effective 1 April 2017, the lower percentage increase due to revenue base adjustments in previous years as a result of the approved RCA adjustments. Eskom will not be allowed to make any RCA applications until the matter is resolved in the Supreme Court of Appeal. However, NERSA has indicated that Eskom can make an application for relief in terms of section 4 of the Electricity Regulation Act if Eskom foresees any cash flow risks and implications thereof on its financial stability. The outcome of the Supreme Court of Appeal’s judgement, and possibly the outcome of a further appeal to the Constitutional Court, will likely have notable impacts on the cost of electricity. Should Sibanye experience further power tariff increases, its business operating results and financial condition may be adversely impacted.
DUE TO THE NATURE OF DEEP LEVEL MINING AND THE EXTENSIVE ENVIRONMENTAL FOOTPRINT OF SIBANYE’S OPERATIONS, ENVIRONMENTAL HAZARDS, INDUSTRIAL ACCIDENTS, MINING ACCIDENTS AND POLLUTION MAY RESULT IN OPERATIONAL DISRUPTIONS SUCH AS STOPPAGES WHICH COULD RESULT IN INCREASED PRODUCTION COSTS AS WELL AS FINANCIAL AND REGULATORY LIABILITIES.
Mining by its nature involves significant risks and hazards, including environmental hazards, as well as industrial and mining accidents. These include, for example, seismic events, fires, cave-ins and blockages, flooding, discharges of gases and toxic substances, contamination of water, air or soil resources, unusual and unexpected rock formation affecting ore or wall rock characteristics, ground or slope failures, rock bursts, wild fires, flooding, radioactivity and other accidents or conditions resulting from mining activities including, among other things, blasting and the transport, storage and handling of hazardous materials.
We have experienced and continue to remain at risk of experiencing environmental and other industrial hazards, as well as industrial and mining accidents, and we are more susceptible, particularly at our South African operations, than other mining operations to certain of these risks due to mining at depth. Furthermore, there are risks that relevant regulators, such as the DMR, the Mine Safety and Health Administration (MSHA) or the Occupational Safety and Health Administration (OHSA), may impose fines and work stoppages (known as Section 54 stoppages in South Africa) for non-compliant mining operating procedures and activities, which will reduce or halt production until lifted. The occurrence of any of these events could delay or halt production, increase production costs and result in financial and regulatory liability for Sibanye, which could have a material adverse effect on its business, operating results and financial condition. Also see “―Sibanye’s operations are subject to environmental, health and safety regulations, which could impose additional costs and compliance requirements, and Sibanye has faced, and may face further, claims and liability for breaches, or alleged breaches, of such regulations and other applicable laws”.
In addition, the relevant environmental authorities may issue administrative directives and compliance notices to enforce the provisions of the relevant statutes (especially National Environmental Management Act, 1998 (Act No 107 of 1998) (NEMA), the National Water Act, 1998 (Act No 36 of 1998) (National Water Act) and the Waste Act in South Africa) to take specific anti-pollution measures, continue with those measures and/or to complete those measures. The authorities may also order the suspension of part or all of Sibanye’s operations if there is non-compliance with legislation. Contravention of some of these statutes may also constitute a criminal offense and an offender may be liable for a fine or imprisonment, or both.
Seismic activity is of particular concern in the underground mining environment, particularly in South Africa as a consequence of the extent and extreme depth of mining. Seismic events have caused death and injury to employees and contractors and may result in safety-related stoppages. Seismic activity may also cause a loss of mining equipment, damage to, or destruction of mineral properties or production facilities, monetary losses, environmental damages and potential legal liabilities.
As a result, the occurrence of any of these events may have a material adverse effect on Sibanye’s business, operating results and financial condition.
TO THE EXTENT THAT SIBANYE SEEKS TO EXPAND FURTHER THROUGH ACQUISITIONS, IT MAY EXPERIENCE DELAYS OR OTHER ISSUES IN EXECUTING ACQUISITIONS OR MANAGING AND INTEGRATING THE ACQUISITIONS WITH ITS EXISTING OPERATIONS.
Sibanye has pursued and may continue to pursue growth opportunities through acquisitions in order to enhance or sustain its ability to pay an industry leading dividend and to allow it to consolidate operations, increase scale and implement best practices across operations. For example, in 2014, Sibanye completed the acquisitions of Wits Gold, Cooke and, through the Wits Gold acquisition, Burnstone.
Sibanye has also entered and may continue to seek to enter mining sectors related to its existing operations through acquisitions or other business combination transactions. For example, during 2016, Sibanye concluded the Rustenburg Operations acquisition and the Aquarius acquisition. See “―Risks related to the Acquisitions”. Further growth may occur through the acquisition of other companies and assets, development projects, or by entering into joint ventures.
The Stillwater Acquisition, which remains subject to conditions precedent, is expected to conclude during the second quarter of 2017 and is expected to expand Sibanye’s operations to new geographies in which Sibanye has no prior operational experience. As an operator of mines in the United States, Sibanye will be exposed to increased US reporting requirements with which it may have difficulties complying. In addition, Sibanye has limited experience with the MSHA, which oversees and enforces regulations pertaining to the health and safety of workers at Stillwater’s operations.
Sibanye also intends to fund the Stillwater Acquisition through a US$2.65 billion bridge loan facility (the Bridge Loan Facility) and then to refinance the acquisition through capital markets transactions or other structures. If Sibanye is unable to conclude such refinancing transactions or such transactions are delayed, Sibanye will incur additional costs and be exposed to additional risks which may have a material adverse effect on Sibanye’s business, operating results and financial position. For example, the margin of the Bridge Loan Facility increases by 1% every 90 days, resulting in higher required interest payments should the refinance be delayed. Additionally, the Bridge Loan Facility has maturity dates ranging from 31 October 2017 to 364 days after the closing date of the Stillwater Acquisition. Should Sibanye be unable to refinance the relevant tranche of the Bridge Loan Facility before the relevant date, as applicable, it would be in default of the Bridge Loan Facility agreement, which would also trigger default provisions in Sibanye’s other financing agreements. In such an event, Sibanye will immediately seek to secure from its lenders an amendment or waiver of the Bridge Loan Facility or other relevant facilities. However, this would likely incur significant cost to Sibanye in the form of additional fees payable to the lenders, increased interest rates under the Bridge Loan Facility and/or additional restrictions on corporate actions, and could adversely affect or delay implementation of Sibanye’s strategic priorities. There is also no guarantee that such an attempt to refinance would ultimately prove to be successful.
Should Sibanye fail to conclude the Stillwater Acquisition, whether due to lack of receipt of regulatory approval, lack of shareholder approval, or other forces beyond Sibanye’s control, it would be subject to the payment of a termination fee equal to US$33.0 million plus reimbursement expenses of up to US$10.0 million. A failure to conclude the Stillwater Acquisition may also adversely impact the price of Sibanye shares.
Any future acquisitions or joint ventures may change the scale of Sibanye’s business and operations and may expose it to new geographical, geological, commodity, political, social, labour, operational, financial, legal, regulatory and contractual risks. Further, the acquisition of any assets that produce commodities other than gold or PGMs will expose Sibanye to the risk of operating in an environment and market with which its management has less experience. In addition, to the extent Sibanye participates in the development of a project through a joint venture or any other multi-party commercial structure, there could be disagreements, legal or otherwise, or divergent interests or goals amongst the parties, which could jeopardise the success of the project. There can be no assurance that any acquisition or joint venture, including the acquisitions of Stillwater (which remains subject to conditions precedent), the Rustenburg Operations, Aquarius, Cooke, Wits Gold and Burnstone, or the acquisition of any new mining assets or operations, will achieve the results intended, and, as such, could have a material adverse effect on Sibanye’s business, operating results and financial condition.
Sibanye faces intense competition for the acquisition of attractive mining properties. From time to time, Sibanye evaluates the acquisition of ore reserves, development properties or operating mines, either as stand-alone assets or as part of existing companies. The decision to acquire these properties may be based on a variety of factors, including historical operating results, estimates and assumptions regarding the extent of the ore reserve, cash and other operating costs, gold and other mineral prices, projected economic returns and evaluations of existing or potential liabilities associated with the relevant property and its operations and how these factors may change in future. Other than historical operating results, these factors are uncertain and could have an impact on revenue, cash and other operating costs, as well as the process used to estimate the ore reserve.
The integration of any acquired assets requires management capacity. There can be no assurance that Sibanye’s current management team has sufficient capacity, nor that it can acquire additional skills to supplement that capacity, to integrate any acquired or new assets and operations into the Group and to realise cost and operational efficiencies at the acquired assets or maintain those at the existing operations.
TO THE EXTENT THAT SIBANYE SEEKS TO FURTHER EXPAND ITS CURRENT MINING OPERATIONS, IT MAY EXPERIENCE PROBLEMS ASSOCIATED WITH MINERAL EXPLORATION OR DEVELOPING MINING PROJECTS.
In order to expand its operations and reserve base organically, Sibanye relies on its existing exploration programmes and investigates, and may continue to investigate, the exploitation of mineralisation below the current mining levels and infrastructure limits at its operations. Sibanye is currently undertaking brownfields exploration at selected operations in South Africa. Brownfields exploration aimed at the depth extensions of Sibanye’s Beatrix operations is currently underway. Projects of this nature are generally capital intensive, have a long lead time and are subject to risks relating to the location of economic ore bodies, the development of appropriate extractive processes, the receipt of necessary governmental permits and regulatory approvals and the extension of mining and processing facilities at the mining site.
Further, in cases where Sibanye explores the production of commodities other than gold or PGMs, Sibanye may be exposed to further risk of operating in an environment and market with which its management has less experience.
There can be no assurance that any exploration or expansion projects will be successful, partially or at all, and the failure of Sibanye to expand its reserves through such projects could have a material adverse effect on its business, operating results and financial condition.
SIBANYE’S MINERAL RESERVES ARE ESTIMATES BASED ON A NUMBER OF ASSUMPTIONS, WHICH, IF CHANGED, MAY REQUIRE SIBANYE TO LOWER ESTIMATED MINERAL RESERVES.
The mineral reserves of Sibanye are estimates based on assumptions regarding, among other things, Sibanye’s costs, expenditures, commodity prices, exchange rates, metallurgical and mining recovery assumptions, which may prove inaccurate due to a number of factors, many of which are beyond our control. In the event that we adversely revise any of the assumptions that underlie our mineral reserves, this may result in a revision of mineral reserves. In addition, mineral reserve estimates depend to some extent on statistical inferences drawn from limited drillings sample, which may prove to be unreliable or unrepresentative. Should Sibanye encounter mineralisation or formations at any of its mines or projects different from those predicted by drilling, sampling and similar examinations, mineral reserve estimates may have to be adjusted and mining plans may have to be altered. Any downward revision in Sibanye’s mineral reserves and, over the longer term, any failure to replace
reserve ounces as they are mined may have a material adverse effect on its business, operating results, life of operations and financial condition.
DUE TO AGEING INFRASTRUCTURE AT OUR GOLD MINING OPERATIONS, UNPLANNED BREAKDOWNS AND STOPPAGES MAY RESULT IN PRODUCTION DELAYS, INCREASED COSTS AND INDUSTRIAL ACCIDENTS.
Nearly all of our operating shafts and processing plants at our gold and PGM operations, including those of our recently acquired assets, are relatively mature. Maintaining this infrastructure requires skilled human resources, capital allocation, management and regular, planned maintenance. Once a shaft or a processing plant has reached the end of its intended lifespan or needs modification to comply with the applicable regulatory standards, more than normal maintenance and care is required. Due to the mature infrastructure at our mining operations, unplanned breakdowns, statutory mandated modifications and stoppages may result in production delays, increased costs and industrial accidents. Although we have a comprehensive maintenance strategy in place, incidents resulting in production delays, increased costs or industrial accidents may occur. There is also a risk that delays in procuring critical spares for major repairs may result in disruptions to production. Such incidents may have a material adverse effect on our business, operating results and financial condition.
ACTUAL AND POTENTIAL SUPPLY CHAIN SHORTAGES AND INCREASES IN THE PRICES OF PRODUCTION INPUTS MAY HAVE A MATERIAL ADVERSE EFFECT ON SIBANYE’S OPERATIONS AND PROFITS.
Sibanye’s results of operations may be affected by the availability and pricing of raw materials and other essential production inputs, including, for example, explosives, fuel, steel, cyanide and other reagents required at our mining operations. The price and quality of raw materials may be substantially affected by changes in global supply and demand, along with weather conditions, governmental controls and other factors. A sustained interruption in the supply of any of these materials would require Sibanye to find acceptable substitute suppliers and could require Sibanye to pay higher prices for such materials. The prices of certain of Sibanye’s production inputs are impacted by, among other things, the prices of oil and steel which may be volatile. Any significant increase in the prices of these materials will increase Sibanye’s operating costs and affect production considerations.
OUR BUSINESS IS SUBJECT TO HIGH FIXED COSTS WHICH MAY IMPACT ITS PROFITABILITY.
The mining industry, particularly the gold and PGM mining industry, is generally labour intensive and characterised by high fixed costs on a short term operating basis. The majority of operating costs of each mine do not vary significantly with the production rate and, therefore, a relatively small change in productivity as a result of, for example, strikes or other work stoppages could have a disproportionate effect on operating and financial results. Costs are generally significantly more stable than revenues, the latter being driven by commodity price and exchange rates which can be volatile. Accordingly, changes in revenues due to commodity price or exchange rate movements could have a material adverse effect on Sibanye’s growth or financial performance. Above inflation increases in fixed costs such as labour or electricity costs may cause parts of Sibanye’s resources to become uneconomical to mine and lead to the closure of marginal shafts or other areas at its operations. This would impact on planned production levels and declared reserves and could have a material adverse effect on our business, operating results and financial condition. See “Annual Financial Report—Overview—Management’s discussion and analysis of the financial statements—Factors affecting Sibanye’s performance—Costs”.
THEFT OF GOLD, PGM AND PRODUCTION INPUTS, AS WELL AS ILLEGAL ARTISANAL MINING, MAY OCCUR ON SOME OF SIBANYE’S PROPERTIES. THESE ACTIVITIES ARE DIFFICULT TO CONTROL, CAN DISRUPT SIBANYE’S BUSINESS AND CAN EXPOSE SIBANYE TO LIABILITY.
Sibanye has experienced illegal and artisanal mining activities and theft of precious metals bearing materials (which may be by employees or third parties). The activities of illegal and artisanal miners could lead to reduction of mineral reserves, potentially affecting the economic viability of mining certain areas and shortening the lives of the operations as well as causing possible operational disruption, project delays, disputes with illegal miners and communities, pollution or damage to property for which Sibanye could potentially be held responsible, leading to fines or other costs. Rising gold or PGM prices may result in an increase in gold or PGM theft. The occurrence of any of these events could have a material adverse effect on Sibanye’s business, operating results and financial condition.
SOCIAL UNREST, SICKNESS OR NATURAL OR MAN-MADE DISASTER AT INFORMAL SETTLEMENTS IN THE VICINITY OF SOME OF SIBANYE’S OPERATIONS MAY DISRUPT ITS BUSINESS OR MAY LEAD TO GREATER SOCIAL OR REGULATORY IMPOSITIONS ON SIBANYE.
There are a number of informal settlements located in the vicinity of some of Sibanye’s operations. These settlements are populated by mining company employees (including Sibanye employees), the families of mining company employees and other people. As at 31 December 2016, 63% of Sibanye’s workforce opted to receive a “living out allowance” and management believes that a portion of these individuals reside in informal settlements. In recent years, the size of these settlements has grown substantially. Poor living conditions in these settlements may lead to the spread of disease or other health hazards, which may increase absences or affect the productivity of employees. The population of such settlements or the surrounding communities may also demand jobs, social services or infrastructure from the local mining operations, including Sibanye. Any such demands or other demands from these communities may lead to increased costs or regulatory burdens on Sibanye. Such demands may also lead to protests or other actions which may hinder Sibanye’s ability to operate.
Any of the above factors could have a material adverse effect on Sibanye’s business, reputation, operating results and financial condition.
BECAUSE OUR OPERATIONS ARE REGIONALLY CONCENTRATED, DISRUPTIONS IN THESE REGIONS COULD HAVE A MATERIAL ADVERSE IMPACT ON THE OPERATIONS.
Our headquarters and the majority of our gold mining operations are located in the north western and south western margins of the Witwatersrand Basin in South Africa, and our South African platinum operations are located in the Western Bushveld Complex in close proximity to the town of Rustenburg in the North West Province. The operations of Stillwater (the acquisition of which remains subject to conditions precedent) are concentrated in Montana. As a result, any adverse economic, political or social conditions affecting these regions or surrounding regions, as well as natural disasters or coordinated strikes or other work stoppages, could have a material adverse effect on Sibanye’s business, operating results and financial condition. See “―Risks related to South Africa”.
IF WE LOSE SENIOR MANAGEMENT OR ARE UNABLE TO HIRE AND RETAIN SUFFICIENT TECHNICALLY SKILLED EMPLOYEES OR SUFFICIENT HDSA REPRESENTATION IN MANAGEMENT POSITIONS IN SOUTH AFRICA, OUR BUSINESS MAY BE MATERIALLY ADVERSELY AFFECTED.
Our ability to operate or expand effectively depends largely on the experience, skills and performance of our senior management team and technically skilled employees. However, the global mining industry, especially in South Africa, including Sibanye, continues to experience a shortage of qualified senior management and technically skilled employees. We may be unable to hire or retain (due to departure or unavailability) appropriate senior management, technically skilled employees or other management personnel, or we may have to pay higher levels of remuneration than we currently intend in order to do so. In the United States, Sibanye expects to depend on management and other key personnel to be retained following the Stillwater Acquisition (which remains subject to conditions precedent). A loss of key management or other personnel at these operations could prevent Sibanye from capitalising on business opportunities in the United States, as prior to the Stillwater Acquisition, Sibanye does not have any operational experience with the acquired assets or in the United States.
Additionally, as a condition of our mining rights in South Africa, we must ensure sufficient HDSA participation in our management and core and critical skills and failure to do so could result in fines or the loss or suspension of our mining rights. If we are unable to hire or retain appropriate management and technically skilled personnel or are unable to obtain sufficient HDSA representation in management positions, or if there are not sufficient succession plans in place, this could have a material adverse effect on our business, including production levels, operating results and financial position.
SIBANYE’S INSURANCE COVERAGE MAY NOT ADEQUATELY SATISFY ALL POTENTIAL CLAIMS IN THE FUTURE.
Sibanye has an insurance programme, including partial self-insurance. However, it may become subject to liability against which it has not been insured, cannot insure or is insufficiently insured, including those relating to past mining activities. Sibanye’s existing property and liability insurance contains specific exclusions and limitations on coverage. For example, should Sibanye be subject to any regulation or criminal fines or penalties, these amounts would not be covered under its insurance programme. Should Sibanye suffer a major loss, which is insufficiently covered, future earnings could be affected. In addition, certain classes of insurance may not continue to be available at economically acceptable premiums. As a result, in the future, Sibanye’s insurance coverage may not fully cover the extent of claims against it or any cross-claims made.
SIBANYE UTILISES INFORMATION TECHNOLOGY AND COMMUNICATIONS SYSTEMS, THE FAILURE OF WHICH COULD SIGNIFICANTLY IMPACT ITS OPERATIONS AND BUSINESS.
Sibanye utilises and is reliant on various information technology and communications systems, in particular SAP, payroll and time and attendance applications. Damage or interruption to Sibanye’s information technology and communications systems, whether due to accidents, human error, natural events or malicious acts, may lead to important data being irretrievably lost or damaged, thereby adversely affecting Sibanye’s business, operating results and financial condition.
These systems may be subject to security breaches (e.g. cyber-crime or activists) or other incidents that can result in misappropriation of funds, increased health and safety risks to people, disruption to our operations, environmental damage, loss of intellectual property, disclosure of commercially or personally sensitive information, legal or regulatory breaches and liability, other costs and reputational damage. While no material losses related to cyber security breaches have been discovered, given the increasing sophistication and evolving nature of this threat, we cannot rule out the possibility of them occurring in the future. An extended failure of critical system components, caused by accidental, or malicious actions, including those resulting from a cyber security attack, could result in a significant environmental incident, commercial loss or interruption to operations.
SIBANYE IS SUBJECT TO RISKS ASSOCIATED WITH LITIGATION AND REGULATORY PROCEEDINGS.
As with most large corporations, Sibanye is involved, from time to time, as a party to various lawsuits, arbitrations, regulatory proceedings or other disputes. Litigation, arbitration, regulatory proceedings and other types of disputes involve inherent uncertainties and, as a result, Sibanye faces risks associated with adverse judgements or outcomes in these matters. Even in cases where Sibanye may ultimately prevail on the merits of any such dispute, Sibanye may face significant costs defending its rights, lose certain rights or benefits during the pendency of any such litigation, arbitration, regulatory proceeding or other dispute, or suffer reputational damage as a result of its involvement therewith. Sibanye is currently engaged in a number of legal and regulatory proceedings, including as described under “Annual Financial Report—Accountability—Directors’ report—Litigation”. There can be no assurance as to the outcome of any litigation, arbitration, regulatory proceeding or other dispute, and the adverse determination of material litigation could have a materially adverse effect on Sibanye’s business, operating results and financial condition. Also see “―Sibanye’s operations are subject to environmental, health and safety regulations,
which could impose additional costs and compliance requirements, and Sibanye has faced, and may face further, claims and liability for breaches, or alleged breaches, of such regulations and other applicable laws”.
AN ACTUAL OR ALLEGED BREACH OR BREACHES IN GOVERNANCE PROCESSES, OR FRAUD, BRIBERY AND CORRUPTION MAY LEAD TO PUBLIC AND PRIVATE CENSURE, REGULATORY PENALTIES, LOSS OF LICENSES OR PERMITS AND IMPACT NEGATIVELY UPON OUR EMPOWERMENT STATUS AND MAY DAMAGE SIBANYE’S REPUTATION.
The legal and regulatory framework in which Sibanye operates is complex, and its governance and compliance policies and processes may not prevent potential breaches of law or accounting or other governance practices. Sibanye’s operating and ethical codes, among other standards and guidance, may not prevent instances of fraudulent behaviour and dishonesty, nor guarantee compliance with legal and regulatory requirements.
To the extent that Sibanye suffers from any actual or alleged breach or breaches of relevant laws (including South African anti-bribery and corruption legislation or the US Foreign Corrupt Practices Act of 1977) under any circumstances, they may lead to regulatory and civil fines, litigation, public and private censure, loss of operating licenses or permits and impact negatively upon Sibanye’s empowerment status and may damage its reputation. The occurrence of any of these events could have a material adverse effect on Sibanye’s business, operating results and financial condition.
TITLE TO SIBANYE’S PROPERTIES MAY BE UNCERTAIN AND SUBJECT TO CHALLENGE.
Certain of Sibanye’s properties may be subject to the rights or the asserted rights of various community stakeholders, including indigenous people. The presence of those stakeholders may have an impact on Sibanye’s ability to develop or operate its mining interests. For example, in South Africa, the Extension of Security of Tenure Act (1997), the Restitution of Land Rights Act (1994) and the Prevention of Illegal Eviction from and Unlawful Occupation of Land Act (1998) and the Labour Tenants Act (1996) provide for various landholding rights. Such legislation is complex, difficult to predict and outside of Sibanye’s control, and could therefore negatively affect the business results of new or existing projects. Where consultation with stakeholders is statutorily or otherwise mandated, relations may not remain amicable and disputes may lead to reduced access to properties or delays in operations. Title to Sibanye’s properties, particularly undeveloped ones, may also be defective or subject to challenge. Title review does not necessarily preclude third parties from contesting ownership.
The properties of Stillwater (the acquisition of which remains subject to conditions precedent) include a number of unpatented mining and mill site claims. The validity of unpatented mining claims on public lands is often uncertain, and possessory rights of claimants may be subject to challenge.
In addition, Stillwater pays annual maintenance fees and has obtained mineral title reports and legal opinions for some of the unpatented mining claims or mill sites making up portions of its properties, in accordance with applicable laws. However, Sibanye cannot be certain that applicable laws will not be changed nor that Stillwater’s possessory rights to any of its unpatented claims may not be deemed defective and challenged.
As a result, any such legislation could change the cost of holding unpatented mining claims and could significantly affect the ability to develop ore reserves located on unpatented mining claims. All of the foregoing could adversely affect the economic and financial viability of future mining operations at such mines. Although it is impossible to predict at this point what any legislated royalties might be, enactment could adversely affect the potential for development of such federal unpatented mining claims.
SIBANYE’S OPERATIONS ARE SUBJECT TO ENVIRONMENTAL, HEALTH AND SAFETY REGULATIONS, WHICH COULD IMPOSE ADDITIONAL COSTS AND COMPLIANCE REQUIREMENTS, AND SIBANYE HAS FACED, AND MAY FACE FURTHER, CLAIMS AND LIABILITY FOR BREACHES, OR ALLEGED BREACHES, OF SUCH REGULATIONS AND OTHER APPLICABLE LAWS.
Sibanye’s operations are subject to various environmental and health and safety laws, regulations, permitting requirements and standards in South Africa. For example, Sibanye is required to fund environmental rehabilitation costs by making contributions into South African environmental trust funds and with insurance guarantees. Sibanye has and may in the future incur significant costs to comply with environmental and health and safety requirements imposed under existing or new legislation, regulations or permit requirements, or to comply with changes in existing laws and regulations or the manner in which they are applied. For example, the regulations which determine the extent of financial provision required to fund environmental rehabilitation costs were recently revised in GNR 1147 of 20 November 2015. These regulations now expressly require financial provision to be set aside for annual rehabilitation. They also place an emphasis on the need for adequate provision for latent and post closure impacts, an impact which mines often did not fully provide for in the past. The regulations have been strongly opposed by the mining industry generally. The reason for doing so is a perception that they substantially increase the amount of financial provision now required and that they are unduly burdensome to new mining entrants. There is also a concern about the ambiguity in some of the provisions, and how they can be operationalised within the prescribed transitional timeframes. In an attempt to address this issue, the DEA has issued a clarification note and is engaging with industry to address their concerns. There are likely to be amendments to these regulations in the near or mid-term future in order to clarify these issues.
Sibanye has and may in the future also be subject to litigation and other costs as well as actions by authorities relating to environmental and health and safety matters, including mine closures, the suspension of operations and prosecution for industrial accidents as well as significant penalties and fines for non-compliance. In addition, there can be no assurance that unions will not take action in response to industrial accidents, which could lead to losses in Sibanye’s production and negatively affect Sibanye’s reputation. Any additional stoppages in production or increased costs associated with such incidents, could have a material adverse effect on Sibanye’s business, operating results and financial condition.
As environmental laws and regulations are becoming more complex and stringent, Sibanye's environmental management plans and/or programmes and other environmental licenses may be the subject of increasingly strict interpretation or enforcement or become more comprehensive, and could result in increased capital or operating expenditure or financial or other penalties and/or the suspension or loss of Sibanye’s rights. The occurrence of any of these risks could have a material adverse effect on Sibanye’s business, financial condition, results of operations and prospects.
The principal health risks associated with Sibanye’s mining operations arise from occupational exposure and community environmental exposure to silica dust, noise and certain hazardous substances, including toxic gases and radioactive particulates. The most significant occupational diseases affecting Sibanye’s workforce include lung diseases (such as silicosis, tuberculosis, a combination of the two and COAD) as well as NIHL. Employees have sought and may continue to seek compensation for certain illnesses, such as silicosis, from their employer under workers compensation and also, at the same time, in a civil action under common law (either as individuals or as a class). Such actions may also arise in connection with the alleged incidence of such diseases in communities proximate to Sibanye’s mines.
Two suits have been filed against Sibanye and several South African mining companies on behalf of current and former gold mine workers and the dependents of gold mine workers who have contracted or died from silicosis or tuberculosis. A consolidated application for certification of these classes was granted by the High Court in Johannesburg on 13 May 2016. The certification of the class means that the claimants are able to sue the mining companies as a class. The class will, however, still have to prove its claim as required by the law. If a significant number of individual claims were suitably established against Sibanye, the payment of damages for the claims could have a material adverse effect on Sibanye’s business, reputation, results of operations and financial position. Various Respondents to the class action certification application filed an Application for Leave to Appeal the class action certification application judgement. Heads of Arguments were exchanged by the parties and the matter was argued before Judge Majopelo, Judge Valli and Acting Judge Windell on 23 June 2016. An oral judgement was handed down in the Application for Leave to Appeal on 24 June 2016, whereby Leave to Appeal to the Supreme Court of Appeal against the transmissibility of general damages was granted and the Leave to Appeal the Certification of the Class Action was denied. Following the refusal to grant Leave to Appeal the Certification of the Class Action, various Respondents filed applications for Leave to Appeal in the Supreme Court of Appeal on 15 July 2016. The Supreme Court of Appeal granted Leave to Appeal the Certification of the Class Action on 19 September 2016. No date has been allocated for the hearing of the appeal when the mining companies will be afforded the opportunity to present arguments in opposition to the certification. It is expected that the appeal will be heard over five days in July or August 2017. Further, any new regulations, potential litigations or any changes to health and safety laws which increase the burden of compliance or the penalties for non-compliance may cause Sibanye to incur further significant costs and could have a material adverse effect on Sibanye’s business, operating results and financial position.
Regulators, such as the DMR, can and do issue, in the ordinary course of operations, instructions, such as Section 54 orders, following safety incidents or accidents to partially or completely halt operations at affected mines. Historically, Section 54 orders have been more prevalent in the PGM industry and as such, the Rustenburg Operations and Aquarius are at a heightened risk of being affected by stoppages resulting from such orders. In addition, South Africa’s deputy Mineral Resources Minister has stated that the ministry may increase sanctions, including closures, for mines in which fatalities occur because of violations of health and safety rules. In fiscal 2016, Sibanye’s gold operations experienced 171 work stoppages (2015: 109 and 2014: 77) in the gold and uranium division and 35 Section 54 orders in the platinum division (for the full 2016 year) It is Sibanye’s policy to halt production at its operations when serious accidents occur in order to rectify dangerous situations and, if necessary, retrain workers. In addition, there can be no assurance that unions will not take industrial action in response to such accidents which could lead to losses in Sibanye’s production. Any additional stoppages in production, or increased costs associated with such incidents, could have a material adverse effect on Sibanye’s business, operating results and financial condition. Such incidents may also negatively affect Sibanye’s reputation with, among others, employees, unions and regulators.
In the United States, the business of Stillwater (the acquisition of which remains subject to conditions precedent) is subject to extensive federal, state and local environmental controls and regulations, including regulations associated with the implementation of the Clean Air Act, Clean Water Act, Resource Conservation and Recovery Act, Metal Mine Reclamation Act and numerous permit stipulations as documented in the Record of Decision for each operating entity, including those relating to the protection of threatened and endangered species under the Endangered Species Act. The body of environmental laws is continually changing and, as a general matter, is becoming more restrictive. Compliance with these regulations requires Stillwater to obtain permits issued by federal, state, provincial and local regulatory agencies. Failure to comply with applicable environmental laws, regulations and permitting requirements, whether now or in the future, may result in enforcement actions, including orders issued by regulatory or judicial authorities, causing operations to cease or to be curtailed, and may include corrective measures requiring capital expenditures, installation of additional equipment or remedial actions. Non-renewal of permits, the inability to secure new permits, or the imposition of additional conditions could eliminate or severely restrict Stillwater’s ability to conduct its operations.
Stillwater’s existing mining operations in the United States are located adjacent to the Absaroka-Beartooth Wilderness Area and are situated approximately 30 miles from the northern boundary of Yellowstone National Park. There can be no assurance that future political or regulatory efforts will not further restrict or seek to terminate Stillwater’s operations in this sensitive area. In addition, environmental hazards or damage may exist on mineral properties held by Stillwater that were caused by previous owners or operators or that may have occurred naturally, and that are unknown to Sibanye at the present time. In some cases, assuming Sibanye completes the Stillwater Acquisition, Sibanye could be required to remedy such damage.
Stillwater’s mining activities are also subject to extensive laws and regulations governing occupational health and safety, including mine safety, toxic substances and other matters. The costs associated with compliance with such laws and regulations are substantial. Stillwater employs various measures in its operating facilities in an effort to protect the health and safety of its workforce. Underground mines in the US, including the Stillwater and East Boulder mines, are continuously inspected by MSHA, which inspections often lead to notices of violation. Any such mines could be subject to a temporary or extended shut down as a result of a violation alleged by MSHA. Possible future laws and regulations, or more restrictive interpretations of current laws and regulations by governmental authorities, could cause additional expense, capital expenditures, restrictions on or suspensions of operations and delays in the development of new properties.
Stillwater is required to post and maintain surety for its reclamation obligations, which are substantial. Such reclamation obligations generally increase over time as costs rise and the physical extent of mining operations expands. Failure to secure and maintain adequate surety coverage could result in the operating permits of such mines being revoked and mining operations terminated.
SIBANYE IS SUBJECT TO THE IMPOSITION OF VARIOUS REGULATORY COSTS, SUCH AS MINING TAXES AND ROYALTIES, CHANGES TO WHICH MAY HAVE A MATERIAL ADVERSE EFFECT ON SIBANYE’S OPERATIONS AND PROFITS.
In recent years, governments, communities, non-governmental organisations and trade unions in several jurisdictions have sought and, in some cases, have implemented greater cost imposts on the mining industry, including through the imposition of additional taxes and royalties. Such resource nationalism, whether in the form of cost imposts, interference in project management, mandatory social investment requirements, local content requirements or creeping expropriation could impact the global mining industry and Sibanye’s business, operating results and financial condition.
In South Africa, the ANC has adopted two recommended approaches to interacting with the mining industry. While the ANC has rejected the possibility of mine nationalisation for now, the first approach contemplates, among other things, greater state intervention in the mining industry, including the revision of existing royalties, the imposition of new taxes and an increase in the South African government’s holdings in mining companies. The second approach contemplates the South African government taking a more active role in the mining sector, including through the introduction of a state mining company to be involved in new projects either through partnerships or individually.
The adopted policies may impose additional restrictions, obligations, operational costs, taxes or royalty payments on mining companies, including Sibanye, any of which could have a material adverse effect on Sibanye’s business, operating results and financial condition.
The South African President has appointed the Davis Tax Committee to look into and review the current mining tax regime. The committee’s first interim report on mining, which was released for public comment on 13 August 2015, proposed no changes to the royalty regime but recommended the discontinuation of the upfront capital expenditure write-off regime in favour of an accelerated capital expenditure depreciation regime. In addition, the report recommended retaining the so called “gold formula” for existing gold mines only, as new gold mines would be unlikely to be established in circumstances where profits are marginal or where gold mines would conduct mining of the type intended to be encouraged by the formula. The committee also recommended the phasing out of additional capital allowances available to gold mines in order to bring the gold mining corporate income tax regime in line with the tax system applicable to all taxpayers. A further report is awaited from the committee after receiving public comment.
REGULATION OF GHG EMISSIONS AND CLIMATE CHANGE ISSUES MAY MATERIALLY ADVERSELY AFFECT SIBANYE’S OPERATIONS.
Energy is a significant input and cost to Sibanye’s mining and processing operations. Regulatory initiatives to curb carbon emissions could increase Sibanye’s energy, production and transport costs, specifically costs relating to its energy-intensive assets and assets that emit significant amounts of GHGs. For example, the South African government plans to introduce a carbon tax. The carbon tax was intended to come into effect from 1 January 2015 but, in order to align the framework of the proposed carbon tax with the desired reduction outcomes, the implementation of the carbon tax was postponed in order to allow sufficient time for consultation on draft legislation and the implementation process. In November 2015, the South African National Treasury published for comment a draft carbon tax bill with a view to the implementation of the tax by January 2017. This time-frame has subsequently changed to be mid 2017 or January 2018, following the anticipated publication of a revised draft carbon tax bill in early 2017. In June 2016, the South African National Treasury published the draft regulations on the “Carbon Offset”. The Carbon Offset is one of the allowances proposed in terms of the draft carbon tax bill which reduces the potential liability of taxpayers under the carbon tax. A further iteration of this draft is anticipated to be released in mid-2017. In addition, the DEA is also considering the imposition of so-called “carbon budgets” on entities in identified high-emitting industries, including mining. These budgets are intended to operate as statutory limits for CO2e, the exceedance of which may entail a fine or other punitive measures. The proposed legislative mechanisms to impose a “carbon budget” are still under consideration. In the meantime, the DEA is in the process of gathering the relevant information from emitting companies which in turn will be used to inform the size of the carbon budget. In terms of the current draft carbon tax bill, companies which also participate in the carbon budget system will be eligible for a 5% tax free allowance under the carbon tax. While many aspects of the proposed carbon tax remain uncertain, the financial implications of government’s proposed carbon tax for Sibanye, in today’s terms, at the 2016 carbon footprint and at an anticipated rate of R120/t of CO2e, would be between approximately R4 million and R25 million per annum on the premise that electricity (i.e. Scope 2 emissions) is excluded. In the event that electricity (Scope 2 emissions) is included in the tax, liability can increase to between approximately R249 million and R271 million per annum. In its current form, the potential net effect of tax free exemptions under the draft carbon tax bill is to reduce tax liability to between 60% to 90% of total emissions. In other words, Sibanye’s final liability will be significantly informed by the extent it is able to make use of the available tax free exemptions. Since these may be revised in a further iteration of the bill, this estimated liability is subject to change. The mining industry has raised concerns through the Chamber of Mines at various forums, including the Davis Tax Committee, on the potential negative financial impact of the tax, particularly in relation to marginal mining operations. In an attempt to address these concerns, the South African National Treasury has proposed that revenue will be spent on sustainable interventions or that there will be other measures to make the tax revenue neutral, for example a reduction in the fossil fuel electricity levy or support for free basic electricity. For more information, see “―Environmental and regulatory matters―Environmental”.
In the United States, the business of Stillwater (the acquisition of which remains subject to conditions precedent) is subject to legislative and regulatory initiatives that are underway to limit GHG emissions. The US Congress has considered legislation that would control GHG emissions through a “cap and trade” program and several US states have already implemented programs to reduce GHG emissions. In addition, The US Supreme Court determined in a 2007 ruling that GHG emissions are "air pollutants" within the meaning of the federal Clean Air Act (CAA), and in response the US Environmental Protection Agency (EPA) promulgated an endangerment finding paving the way for regulation of GHG emissions under the CAA. In 2010, the EPA issued
a final rule, known as the “Tailoring Rule,” that makes certain large stationary sources and modification projects subject to permitting requirements for GHG emissions under the CAA. In June 2014, the US Supreme Court invalidated portions of the federal Tailoring Rule, but the ruling upheld the EPA's authority to require new or modified facilities that already are subject to permitting requirements for conventional pollutants to comply with Best Available Control Technologies (BACT) for GHGs, as well. In 2015, the EPA rescinded the portions of the Tailoring Rule that had been overturned by the Supreme Court. However, the EPA indicated that new or modified sources subject to permitting for conventional pollutants will be required to access BACT for GHG if the new source or the modification will result in an annual increase of 75,000 tons per year of CO2e. During 2016, US legislative and regulatory initiatives to limit GHG emissions were primarily focused through the Clean Power Planning Rule which is intended to limit emissions from power generating facilities.
In 2009, the EPA issued a final rule requiring the reporting of GHGs from specified large GHG emission sources in the US beginning in 2011. Given the higher level of air quality emissions, the Stillwater Mine holds a Title V Major Air Quality Permit. As a result, Stillwater is required to annually calculate the GHG emissions from the Stillwater Mine and compare these amounts against reporting thresholds. However, Stillwater is not required to report GHG emissions at this time, given current levels are below reporting thresholds. Additionally, the assessment of GHG emissions is becoming an increasingly important part of US National Environmental Policy Act (NEPA) assessments, and as a result Stillwater may be required to mitigate its GHG emissions in connection with any future NEPA review.
Nevertheless, regulation of GHG emissions is relatively new, and a great deal of debate continues to ensue. The Clean Power Plan remains subject to a stay imposed by the US Supreme Court pending a review and decision from the US District of Columbia Circuit Court of Appeals. The Trump administration’s proposed changes for the leadership of the EPA indicate that the regulation of GHGs may be less of a priority and it remains unclear as to whether the new administration will continue to defend the Clean Power Plan. However, numerous states have indicated that they may move forward with increased GHG regulation and their own defence of the Clean Power Plan. As a result, further regulatory, legislative and judicial developments are difficult to predict. Due to the uncertainties surrounding the regulation of and other risks associated with GHG emissions, Sibanye cannot predict the financial impact of future US GHG regulations and related developments on the Stillwater operations.
There can be no assurance that Sibanye will be able to meet its voluntary targets relating to GHG emissions or comply with targets that may be imposed upon the mining industry by external regulators. Furthermore, additional, new and/or different regulations in this area, such as the imposition of lower limits than those currently contemplated, could be enacted, all of which could have a material adverse effect on Sibanye’s business, financial condition, results of operations and prospects. Furthermore, the potential physical impacts of climate change on Sibanye’s operations are highly uncertain and may adversely impact the cost, production and financial performance of Sibanye’s operations.
RISKS RELATED TO SOUTH AFRICA
ECONOMIC, POLITICAL OR SOCIAL INSTABILITY AFFECTING THE REGIONS WHERE SIBANYE OPERATES MAY HAVE A MATERIAL ADVERSE EFFECT ON SIBANYE’S OPERATIONS AND PROFITS.
Sibanye is a South African domiciled company with the majority of its operations located within South Africa. Changes to or increased instability in the economic, political or social environment in South Africa or in surrounding countries could create uncertainty which discourages investment in the region and may affect an investment in Sibanye. High levels of unemployment and a shortage of critical skills in South Africa, despite increased government expenditure on education and training, remain issues and deterrents to foreign investment. The volatile and uncertain labour environment, which severely impacts on the local economy and investor confidence, has led and may lead to further downgrades in national credit ratings, making investment more expensive and difficult to secure. See “―Risks related to Sibanye’s business—Sibanye’s operations and profits have been and may be adversely affected by labour unrest and union activity” and “―A further downgrade of South Africa’s credit rating may have an adverse effect on Sibanye’s ability to secure financing”. This may restrict Sibanye’s future access to international financing and could have a material adverse effect on Sibanye’s business, operating results and financial condition.
In addition, while the South African government has stated that it does not intend to nationalise mining assets or mining companies, certain new smaller political parties have stated publicly and in the media that the government should embark on a programme of nationalisation. Any threats, or actual proceedings, to nationalise any of Sibanye’s assets, could halt or curtail operations, resulting in a material adverse effect on Sibanye’s business, operating results and financial condition and could cause the value of Sibanye’s securities to decline rapidly and dramatically, possibly causing investors to lose the entirety of their respective investments.
A FURTHER DOWNGRADE OF SOUTH AFRICA’S CREDIT RATING MAY HAVE AN ADVERSE EFFECT ON SIBANYE’S ABILITY TO SECURE FINANCING.
Prior to 2017, the challenges facing the mining industry and other sectors, among other factors, had resulted in the downgrading of South Africa’s sovereign credit rating to one level above non-investment grade, or junk, by Standard & Poor’s and Fitch Ratings. However, on April 3, 2017, Standard & Poor’s downgraded South Africa’s sovereign credit rating to non-investment grade (BB+) with a negative outlook due to, among other things, political and economic uncertainty caused by changes in the government cabinet in South Africa. South Africa’s sovereign credit rating also suffered downgrades in fiscal 2015. As of April 3, 2017, Moody’s South African sovereign credit rating was Baa2 with a negative outlook and Fitch Ratings’ was BBB- with a negative outlook, two and one notches above non-investment grade, respectively. On April 3, 2017, Moody’s announced that it had put South Africa’s sovereign credit rating on a watch for a possible downgrade.
Further downgrading of South Africa’s sovereign credit rating to non-investment grade status by Moody’s or Fitch Ratings may adversely affect the South African mining industry, including Sibanye, by making it more difficult to obtain external financing or could result in any such financing being available only at greater cost or on more restrictive terms than might otherwise be
available. A downgrade to non-investment grade status by either of these two agencies may have a material adverse effect on the South African economy as many pension funds and other large investors are required by internal rules to sell bonds once two separate agencies rate them as non-investment grade. Any such negative impact on the South African economy may adversely affect the South African mining industry and Sibanye’s business, operating results and financial condition.
SIBANYE’S FINANCIAL FLEXIBILITY COULD BE MATERIALLY CONSTRAINED BY SOUTH AFRICAN EXCHANGE CONTROL REGULATIONS.
South Africa’s Exchange Control Regulations restrict the export of capital from South Africa, the Republic of Namibia and the Kingdoms of Lesotho and Swaziland, known collectively as the CMA. Transactions between South African residents (including companies) and non-residents of the CMA are subject to exchange controls enforced by the SARB. As a result, Sibanye’s ability to raise and deploy capital outside the CMA is restricted. These restrictions could hinder Sibanye’s financial and strategic flexibility, particularly its ability to raise funds outside South Africa.
HIV/AIDS, TUBERCULOSIS AND OTHER CONTAGIOUS DISEASES POSE RISKS TO SIBANYE IN TERMS OF LOST PRODUCTIVITY AND INCREASED COSTS.
The prevalence of HIV/AIDS in South Africa poses risks to Sibanye in terms of potentially reduced productivity and increased medical and other costs. Compounding this are the concomitant infections, such as tuberculosis, that can accompany HIV illness, particularly during the latter stages, and cause additional healthcare-related costs. If there is a significant increase in the incidence of HIV/AIDS infection and related diseases among the workforce, this may have a material adverse effect on Sibanye’s business, operating results and financial condition.
Additionally, the spread of contagious diseases such as respiratory diseases is exacerbated by communal housing and close quarters. The spread of such diseases could impact employees’ productivity, treatment costs and, therefore, operational costs.
SIBANYE’S OPERATIONS ARE SUBJECT TO WATER USE REGULATION, WHICH COULD IMPOSE SIGNIFICANT COSTS AND BURDENS.
Sibanye’s operations are subject to regulatory controls on their usage and disposal of water and waste. Under South African law, mining operations are subject to water use licenses and/or authorisations that govern each operation’s water usage and that require, among other things, mining operations to achieve and maintain certain water quality limits regarding all water discharges. Kloof currently operates under a new order water use license. The Driefontein water use license was issued on 9 March 2017 and the new conditions are in the process of being reviewed. Beatrix currently operates under a pre-existing permit of indefinite length; however, it has submitted an application for a license under the current regime. The Rand Uranium section of the Cooke operations was issued a water license in November 2013 which defines the water management regulatory requirements for the Cooke surface operations, as well as for the Cooke 1, 2 and 3 underground mining operations. The Ezulwini Mining Company (Proprietary) Limited (Cooke 4) was issued a new order water use license in June 2015 and a request was made for changes to some of the conditions. The Aquarius operations currently operate under a water license issued by DWS on 17 March 2016. Sibanye expects to incur significant expenditure to achieve and maintain compliance with the license requirements at each of its operations. Any failure on Sibanye’s part to achieve or maintain compliance with the requirements of these licenses with respect to any of its operations could result in Sibanye being subject to substantial claims, penalties, fees and expenses; significant delays in operations; or the loss of the relevant water use license, which could curtail or halt production at the affected operation. Any of the above could have a material adverse effect on Sibanye’s business, operating results and financial condition. For example, Aquarius has been continually engaging with the DWS for several years regarding the issue of a water use licence for Kroondal’s West-West Pit. This was initially refused by the DWS on the basis that the liner design did not fulfil the Department’s engineered design requirements. The water use license was issued once the DWS was satisfied with the revised design.
Sibanye has identified a risk of potential long-term AMD issues which are currently being experienced by peer mining groups. AMD relates to the acidification and contamination of naturally occurring water resources by pyrite-bearing ore contained in underground mines and in rock dumps, tailings dams and pits on the surface. Should Sibanye’s current preventative measures not be successful such that Sibanye were to experience any AMD issues, it could result in failure to comply with its water use license requirements and could expose Sibanye to potential liabilities.
RISKS RELATED TO THE ACQUISITIONS
SIBANYE MAY FACE CHALLENGES IN THE INTEGRATION OF STILLWATER’S BUSINESS, THE RUSTENBURG OPERATIONS AND AQUARIUS’ BUSINESS FOLLOWING COMPLETION OF THE ACQUISITIONS, WHICH COULD DISRUPT ITS CURRENT OPERATIONS OR RESULT IN HIGHER COSTS OR WORSE OVERALL PERFORMANCE THAN WE ANTICIPATE.
If we are unable to integrate Stillwater’s business (the acquisition of which remains subject to conditions precedent), the Rustenburg Operations, or Aquarius’ business with our own operations in a timely and cost-effective manner, the potential benefits of the Acquisitions, including the estimated revenue and cost synergies we expect to achieve, may not be realised. In particular, if the effort we devote to the integration of our businesses with those of Stillwater, the Rustenburg Operations and Aquarius diverts more management time or other resources from carrying out our operations than we originally planned, our ability to maintain and increase revenues as well as manage our costs could be impaired. Furthermore, our capacity to expand other parts of our existing businesses may be impaired.
Any of the above could have a material adverse effect on Sibanye’s business, operating results and financial condition.
OUR GROWTH STRATEGY, INCLUDING THE ACQUISITIONS AND REORGANISATION OF OUR BUSINESS, MAY NOT BE SUCCESSFUL.
Prior to the Rustenburg Operations acquisition and the Aquarius acquisition, our core businesses were primarily related to owning and operating four underground and surface gold operations, as well as operating extraction and processing facilities for treatment of gold-bearing ore before it is refined. As noted in “―Risks Related to Sibanye’s business—Changes in the market price for gold and PGMs, which in the past have fluctuated widely, affect the profitability of Sibanye’s gold and PGM mining operations and the cash flows generated by those operations”, these operations have experienced significant volatility during the recent past.
Following the Rustenburg Operations acquisition and the Aquarius acquisition, key components of our strategy have been to reorganise the Group’s operations into a PGM division and a gold and uranium division, and to potentially grow our operations through expansion into further markets. Our growth strategy requires significant investment and places strain on our financial and management resources, as well as our compliance systems, as our management team will be required to support and oversee operations in an industry where they may have limited or no experience while at the same time ensuring that our management systems are suitable for our expanding operations. We cannot assure you that we will be able to achieve the objectives our management anticipates or that our management will be able to manage any such processes successfully. Failure to achieve such objectives or any significant weakening of our overall management controls could have a material adverse effect on our business, operating results and financial condition.
IF ANY OF STILLWATER, THE RUSTENBURG OPERATIONS OR AQUARIUS DOES NOT PERFORM IN LINE WITH OUR EXPECTATIONS, WE MAY BE REQUIRED TO WRITE-DOWN THE CARRYING VALUE OF OUR INVESTMENT, WHICH COULD AFFECT OUR ABILITY TO PAY DIVIDENDS.
Under IFRS, we are required to test the carrying value of long-term assets or cash-generating units for impairment at least annually and more frequently if we have reason to believe that our expectations for the future cash flows generated by these assets may no longer be valid. If the results of operations and cash flows generated by Stillwater (the acquisition of which remains subject to conditions precedent), the Rustenburg Operations or Aquarius are not in line with our expectations, we may be required to write-down the carrying value of the investment. Any write-down could materially affect our business, operating results, operations and financial condition.
WE MAY DISCOVER CONTINGENT OR OTHER LIABILITIES WITHIN STILLWATER, THE RUSTENBURG OPERATIONS OR AQUARIUS OR OTHER FACTS OF WHICH WE ARE NOT AWARE THAT COULD EXPOSE SIBANYE TO LOSS.
Although Sibanye has received certain representations, warranties and indemnities regarding Stillwater (the acquisition of which remains subject to conditions precedent), the Rustenburg Operations and Aquarius under the terms of the Stillwater Merger Agreement, the Rustenburg acquisition agreements and the Aquarius acquisition agreements, respectively, and it has conducted general due diligence in connection with the Acquisitions, such due diligence was necessarily limited. There can be no assurance that Sibanye identified all the liabilities of, and risks associated with, the Acquisitions or that it will not be subject to unknown liabilities of, and risks associated with, the Acquisitions, including liabilities and risks that may become evident only after Sibanye has been involved in the operational management of the Acquisitions. Sibanye may incur losses in excess of this maximum amount or the matters giving rise to the losses may not be recoverable against the warranties or indemnities or at all.
SIBANYE’S OPERATIONS IN ZIMBABWE ARE SUBJECT TO RULES AND REGULATIONS THAT LIMIT THEIR ABILITY TO EXPORT UNREFINED PLATINUM OR TO REMIT REVENUE GENERATED OUT OF THE COUNTRY; SUCH RULES AND REGULATIONS MAY ALSO IMPACT THE OWNERSHIP STRUCTURE OF THESE OPERATIONS.
One of Sibanye’s joint ventures, the Mimosa Operations, is located in Zimbabwe. The Mimosa Operations delivered attributable production for the nine months ended 31 December 2016, since acquisition, of 91,076oz (4E) and contributed a profit of R115 million to Sibanye’s profit for the year ended 31 December 2016. Under Zimbabwean exchange control legislation, up to 50% of the revenue generated from Sibanye’s Zimbabwe operations must be retained in the country. Sibanye is limited in its ability to remit profits from Zimbabwe to South Africa. Further, due to the short supply of US dollars in Zimbabwe, the funds retained in Zimbabwe create increased exposure to economic and inflationary risks.
Furthermore, a number of years ago, the Government of Zimbabwe announced that a 15% royalty would be imposed on the export of unrefined platinum beginning in January 2017. The implementation date has been deferred a number of times, the most recent of which was until January 2018. If such royalty is imposed, it could have a material adverse effect on Sibanye’s business, operating results and financial condition.
Mimosa has commissioned feasibility studies to explore expanding its smelter operations in Zimbabwe. The construction of such facilities would be subject to several challenges including, amongst other things, the time required, the substantial capital expenditure and a lack of adequate infrastructure.
The Zimbabwean Empowerment Act, promulgated in 2008, requires the transfer of a 51% shareholding in all foreign-owned companies to indigenous Zimbabweans. On 12 April 2016, in a statement clarifying the Empowerment Act, Zimbabwe’s President announced that foreign mines could retain ownership control as long as 75% of the gross value of exploited resources are retained in Zimbabwe. The President’s statements clarifying the Empowerment Act have yet to be codified into law. Although Sibanye currently exceeds the proposed 75% threshold, there can be no guarantee that it will continue to do so in the future or that this interpretation will remain in force. Any of the above could have a material adverse effect on the Mimosa Operations.
SOCIAL, POLITICAL AND ECONOMIC UNCERTAINTY AND INSTABILITY IN ZIMBABWE AND TARGETED SANCTIONS AGAINST CERTAIN ZIMBABWEAN ENTITIES MAY AFFECT FUTURE FOREIGN INVESTMENT IN THE COUNTRY.
Zimbabwe’s social, political and economic climate is currently highly uncertain, with the economy having been in decline since 1999. Many sectors, including the health sector, have virtually collapsed. There is a general shortage of clean water owing to non-functional facilities and a lack of chemicals.
Zimbabwe is the subject of targeted sanctions by the US, EU and the UK. The sanctions are limited in scope, targeting only designated individuals and entities, including certain members of the government, who are deemed to be undermining democratic institutions and processes in Zimbabwe.
In terms of the Minerals Marketing Corporation Act, 1983 (MMCZ Act), the Mineral Marketing Corporation of Zimbabwe (MMCZ) is the sole legal exporter of all minerals mined in Zimbabwe and is entitled to a commission in relation to all sales, as an agent to the mining companies, which is stipulated by the MMCZ Act. The Mimosa Operations paid MMCZ US$2.1 million in fiscal 2016. The MMCZ is an entity specifically sanctioned by the US Office of Foreign Assets Control and listed on its Specially Designated Nationals list. Under the sanctions, MMCZ’s assets are blocked and US persons are prohibited from dealing with the entity. There is no requirement, legal or otherwise, for MMCZ to be involved in the Mimosa Operations management or operations and Sibanye has no contractual or other relationship with MMCZ outside of the MMCZ Act requirements.
Continued economic and political uncertainty in Zimbabwe and targeted sanctions against certain Zimbabwean entities may affect future foreign investment in the country and may lead to the imposition of further exchange controls, restrictions on the ownership of Sibanye’s assets and its ability to raise funds for or operate its business and export minerals and metals from Zimbabwe. Should such events occur, they may have an adverse effect on Sibanye’s business and operations in Zimbabwe as well as their financial condition.
RISKS RELATED TO SIBANYE’S SHARES AND ADRS
SHAREHOLDERS OUTSIDE SOUTH AFRICA MAY NOT BE ABLE TO PARTICIPATE IN FUTURE ISSUES OF SECURITIES (INCLUDING ORDINARY SHARES) CARRIED OUT BY OR ON BEHALF OF SIBANYE.
Securities laws of certain jurisdictions may restrict Sibanye’s ability to allow participation by certain shareholders in future issues of securities (including ordinary shares) carried out by or on behalf of Sibanye. In particular, holders of Sibanye securities who are located in the United States (including those who hold ordinary shares or ADRs) may not be able to participate in securities offerings by or on behalf of Sibanye unless a registration statement under the Securities Act is effective with respect to such securities or an exemption from the registration requirements of the Securities Act is available thereunder.
Securities laws of certain other jurisdictions may also restrict Sibanye’s ability to allow the participation of all holders in such jurisdictions in future issues of securities carried out by Sibanye. Holders who have a registered address or are resident in, or who are citizens of, countries other than South Africa should consult their professional advisers as to whether they require any governmental or other consent or approvals or need to observe any other formalities to enable them to participate in any offering of Sibanye securities.
INVESTORS IN THE UNITED STATES AND OTHER JURISDICTIONS OUTSIDE SOUTH AFRICA MAY HAVE DIFFICULTY BRINGING ACTIONS, AND ENFORCING JUDGEMENTS, AGAINST SIBANYE, THE DIRECTORS AND THE EXECUTIVE OFFICERS BASED ON THE CIVIL LIABILITIES PROVISIONS OF THE FEDERAL SECURITIES LAWS OR OTHER LAWS OF THE UNITED STATES OR ANY STATE THEREOF OR UNDER THE LAWS OF OTHER JURISDICTIONS OUTSIDE SOUTH AFRICA.
Sibanye is incorporated in South Africa. All of the directors and executive officers reside outside of the United States. Substantially all of the assets of these persons and substantially all of the assets of Sibanye are located outside the United States. As a result, it may not be possible for investors to enforce against these persons or Sibanye a judgement obtained in a United States court predicated upon the civil liability provisions of the federal securities or other laws of the United States or any state thereof. In addition, investors in other jurisdictions outside South Africa may face similar difficulties.
Investors should be aware that it is the policy of South African courts to award compensation for the loss or damage actually sustained by the person to whom the compensation is awarded. Although the award of punitive damages is generally unknown to the South African legal system, it does not mean that such awards are necessarily contrary to public policy. Whether a judgement is contrary to public policy will depend on the facts of each case. Exorbitant, unconscionable or excessive awards will generally be contrary to public policy and contractually stipulated penalties are subject to and limited by the provisions of the Conventional Penalties Act, 1962. South African courts cannot enter into the merits of a foreign judgement and cannot act as a court of appeal or review over the foreign court. South African courts will usually implement their own procedural laws and, where an action based on an international contract is brought before a South African court, the capacity of the parties to the contract will usually be determined in accordance with South African law. However, a South African court may, in certain circumstances, show expert evidence in relation to the law of the jurisdiction which governs the contract in question. It is doubtful whether an original action based on United States federal securities laws or the laws of other jurisdictions outside South Africa may be brought before South African courts. Further, a plaintiff who is not resident in South Africa may be required to provide security for costs in the event of proceedings being initiated in South Africa. In addition, the Rules of the High Court of South Africa require that documents executed outside South Africa must be authenticated for the purpose of use in South Africa.
Investors should also be aware that a foreign judgement is not directly enforceable in South Africa, but only constitutes a cause of action. Such a judgement will be enforced by South African courts only if certain conditions are met.
SIBANYE MAY NOT PAY DIVIDENDS OR MAKE SIMILAR PAYMENTS TO ITS SHAREHOLDERS IN THE FUTURE DUE TO VARIOUS FACTORS AND ANY DIVIDEND PAYMENTS MAY BE SUBJECT TO WITHHOLDING TAX.
Sibanye’s current dividend policy is to return at least 25 to 35 % of normalised earnings to Shareholders. Sibanye may pay cash dividends only if funds are available for that purpose. Whether funds are available depends on a variety of factors, including the amount of cash available and Sibanye’s capital expenditures on both existing infrastructure as well as on exploration and other projects and other cash requirements existing at the time. Under South African law, Sibanye will be entitled to pay a dividend or similar payment to its Shareholders only if it meets the solvency and liquidity tests set out in the Companies Act, and is permitted to do so in terms of the Memorandum of Incorporation. Given these factors and the Board’s discretion to declare cash dividends or other similar payments, dividends may not be paid in the future. It should be noted that a 20% withholding tax is required to be withheld on dividends paid by, among others, certain South African resident companies (including Sibanye), to any person. Withholding taxes have been in effect from 1 April 2012 and the percentage was increased on 22 February 2017 from 15% to 20%.
The withholding tax on dividends is subject to domestic exemptions or relief in terms of an applicable double taxation treaty. The application of such domestic exemptions or relief in terms of an applicable double taxation treaty is subject to the making of certain declarations and undertakings by the beneficial owner of the dividends and providing the same to the Company or regulated intermediary making payment of the dividend. See “―Additional Information—Taxation—Certain South African Tax Considerations—Withholding Tax on Dividends” and “―Additional Information—Financial information—Dividend policy and dividend distributions”.
SIBANYE’S NON-SOUTH AFRICAN SHAREHOLDERS FACE ADDITIONAL INVESTMENT RISK FROM CURRENCY EXCHANGE RATE FLUCTUATIONS SINCE ANY DIVIDENDS WILL BE PAID IN RAND.
Dividends or distributions with respect to Sibanye’s shares have historically been paid in Rand. The US dollar or other currency equivalent of future dividends or distributions with respect to Sibanye’s shares, if any, will be adversely affected by potential future reductions in the value of the Rand against the US dollar or other currencies. In the future, it is possible that there will be changes in South African Exchange Control Regulations such that dividends paid out of trading profits will not be freely transferable outside South Africa to Shareholders who are not residents of the CMA. See “―Additional Information—South African Exchange Control limitations affecting security holders”.
SIBANYE’S SHARES ARE SUBJECT TO DILUTION AS A RESULT OF ANY NON-PRE-EMPTIVE SHARE ISSUANCE, INCLUDING UPON THE EXERCISE OF SIBANYE’S OUTSTANDING SHARE OPTIONS, ISSUES OF SHARES BY THE BOARD IN COMPLIANCE WITH BBBEE LEGISLATION OR IN CONNECTION WITH ACQUISITIONS, AND A LARGE VOLUME OF SALES OF SIBANYE’S SHARES, OR THE PERCEPTION THAT SUCH LARGE SALES MAY OCCUR, COULD ADVERSELY AFFECT THE TRADING PRICE OF SIBANYE’S SHARES.
Shareholders’ equity interests in Sibanye will be diluted to the extent of future exercises or settlements of rights under the Sibanye Limited 2013 Share Plan and any additional rights. Sibanye shares are also subject to dilution in the event that the Board is required to issue new shares in compliance with applicable BBBEE legislation. See “―Risks related to Sibanye’s business—Sibanye’s mineral rights are subject to legislation, which could impose significant costs and burdens and which impose certain ownership requirements, the interpretation of which are the subject of dispute”.
Further, the issuance of shares in connection with any acquisition (whether in the form of consideration or otherwise) may result in dilution to existing Shareholders. For example, on 15 May 2014, Sibanye concluded the acquisition of Cooke. As consideration for the acquisition, Sibanye issued 156,894,754 new Sibanye shares at R28.61, representing 17% of Sibanye’s issued share capital on a fully diluted basis.
The Newshelf 1114 Empowerment Partner has a put option in respect of their 24% shareholding in Newshelf 1114 which allows them to acquire shares in Sibanye, subject to certain conditions. These conditions include in particular confirmation by the DMR that implementation of the put option will not detrimentally affect the empowerment status of Newshelf 1114. If the Newshelf 1114 Empowerment Partner exercises this put option, Sibanye must acquire its shares in Newshelf 1114 based on the net attributable fair value of the underlying assets and liabilities of the Newshelf 1114 group by issuing the number of shares in Sibanye determined on the basis of the 30 day VWAP of Sibanye on the JSE. The Newshelf 1114 Empowerment Partner’s net attributable fair value will be adjusted by the original subscription loan still due by the Newshelf 1114 Empowerment Partner on acquiring the 24% shareholding in 2013. The subscription loan balance at 31 December 2016 was R613.1 million. The option can be exercised until 8 February 2018.
A large volume of sales of Sibanye’s shares by this partner or another Shareholder, all at once or in blocks, could decrease the prevailing market price of Sibanye’s shares and could impair Sibanye’s ability to raise capital through the sale of equity securities in the future. Additionally, even if substantial sales are not affected, the mere perception of the possibility of these sales could decrease the market price of Sibanye’s shares and could have a negative effect on Sibanye’s ability to raise capital in the future. Further, anticipated downward pressure on Sibanye’s ordinary share price due to actual or anticipated sales of shares could cause some institutions or individuals to engage in short sales of Sibanye’s shares, which may itself cause the price of the shares to decline.
RESERVES OF SIBANYE AS OF 31 DECEMBER 2016
Introduction
Sibanye reports its mineral reserves in accordance with SAMREC, the South African Code for the reporting of Mineral Asset Valuation and other relevant international codes such as the SEC’s Industry Guide 7. Only the reserves at each of our operations and exploration projects as of 31 December 2016, which qualify as reserves for purposes of the SEC’s Industry Guide number 7, are presented in the tables below. In accordance with the requirements imposed by the JSE, we report our reserves using the terms and definitions of the SAMREC Code (2016 edition). Mineral or ore reserves, as defined under the SAMREC Code, are divided into categories of proved and probable reserves and are expressed in terms of tons to be processed at mill feed head grades, allowing for estimated mining dilution, mining recovery and other factors.
GOLD DIVISION
Geology
Our operations consist of deep level underground gold mines located along the northern and southwestern margins of the Witwatersrand Basin in South Africa. These properties include the Driefontein, Kloof and Cooke operations along the northern margin and the Beatrix operation along the southwestern margin. These mines are typical of the many Witwatersrand Basin operations, which have been the primary contributors to South Africa’s production of a significant portion of the world’s recorded gold output since 1886.
The Witwatersrand Basin comprises a 6,000-meter vertical thickness of sedimentary rocks, extending laterally for some 350 kilometres northeast to southwest by some 120 kilometres northwest to southeast, generally dipping at shallow angles toward the centre of the Witwatersrand Basin. The Witwatersrand Basin outcrops at its northern extent near Johannesburg, but to the west, south and east it is overlaid by up to 4,000 meters of volcanic and sedimentary rocks. The Witwatersrand Basin is Archaean in age, meaning the sedimentary rocks are of the order of 2.8 billion years old.
Gold mineralisation occurs within laterally extensive quartz pebble conglomerate beds called reefs, which are developed above unconformable surfaces near the basin margin. As a result of faulting and primary controls on mineralisation processes, the goldfields are not continuous and are characterised by the presence or dominance of different reef units. The reefs are generally less than two meters in thickness and are widely considered to represent laterally extensive braided fluvial deposits or unconfined flow deposits, which formed along the flanks of alluvial fan systems around the edge of an inland sea. Dykes and sills of diabase or dolerite composition are developed within the Witwatersrand Basin and are associated with several intrusive and extrusive events.
Gold generally occurs in native form, often associated with pyrite, carbon and uranium. Pyrite and gold within the reefs display a variety of forms, some obviously indicative of detrital transport within the depositional system and others suggesting crystallisation within the reef itself.
As early as 1923, the presence of uranium was noted in the Witwatersrand reefs. It was found that on average the reefs contain about 0.03% uranium and as a by-product of gold relatively low uranium grades can be recovered. Notwithstanding different opinions as to the origin of the uranium in the reefs, most theories accept localisation of both gold and uranium a function of sedimentary textures. Metal concentrations are directly related to the reefs. Exploration programmes and eventual evaluation of gold and uranium according to a placer philosophy, prove to be highly successful.
The most fundamental controls of gold and uranium distribution are the primary sedimentary features such as facies variation and channel directions. Consequently, the modeling of sedimentary features within the reefs and the correlation of payable grades within certain facies is key to in situ reserve estimation, as well as effective operational mine planning and grade control.
Block Model Estimation and Reserving Process
Underground reserves are based on an estimated block model of the ore body, which is derived from surface drilling, underground drilling, surface three-dimensional reflection seismics, ore body facies modeling, structural modeling, underground mapping, underground channel sampling and geostatistical estimation. The reefs are initially explored by drilling from the surface on an approximately 500-meter to 2,000-meter grid. Once underground access is available, definition drilling is undertaken on an approximately 30-meter to 90-meter grid. Underground channel sampling perpendicular to the reef is undertaken at three-meter intervals in development areas and five-meter intervals at stope faces. Estimation is constrained within both geologically homogenous structural and facies zones, and is generally derived from either ordinary or simple kriged small-scale grids. Areas close to current workings will have smaller block sizes ranging from 10-meter to 50-meter and is generally derived from either ordinary or simple kriging. Areas further away will have blocks sizes ranging from 50 meters to 420 meters, and is estimated using simple Kriging in combination with declustered averaging or Sichel “t” techniques.
Surface low grade rock dumps (SRD) are estimated based on bulk samples taken at regular intervals, and historical processing results. Surface tailings (TSF) have been estimated using a regular, closely spaced drill pattern (100m × 100m). Volume estimates are determined by land and aerial surveys conducted on a regular basis.
Reserves are reported using pay limits, to reflect both the cost structures and required margins relevant to each mining operation. Pay limit is defined as the grade at which an ore body can be mined without profit or loss, and is calculated using an appropriate metal price, working cost and modifying factors. Modifying factors used to calculate the pay limit grades include adjustments to mill delivered amounts, due to dilution incurred in the course of mining. Modifying factors applied in estimating reserves are based on historical achievements, but may incorporate minor adjustments for planned operational improvements. Tonnage and grade include some mineralisation below the selected pay limit to ensure that the reserve comprises blocks of adequate size and continuity. Reserves also take into account cost levels at each operation and are derived from a strategic and operational planning process that is embedded at each operation. Reserves on the operating mines are supported by cyclical
mine plans, and the project reserves are derived from detailed pre-feasibility or feasibility studies compiled for each project respectively.
Reserve Classification Methodology
The reserve estimates are initially categorised according to the measured, indicated and inferred classification assigned to the block models. The measured confidence category is converted to proved reserves and indicated to probable reserves. The inferred confidence category has too low a confidence to be converted to reserves and is excluded.
The confidence classification applied to the block model uses a combination of the quality of the Kriged estimates and the confidence in the geological interpretation (drill spacing, continuity of ore body, structural confidence, and confidence in extrapolation or interpolation of facies types). The lower of the two confidence estimates is accepted as the final classification.
The quality of the Kriged estimate is benchmarked using the 90% lower confidence limit on the estimates. The Kriging variance is used in conjunction with the estimated value to calculate the 90% lower confidence limit for each block. The 90% lower confidence limit value estimate is then divided by the estimate and expressed as a percentage. Blocks with a value of greater than 50% are considered to have measured confidence (assuming that the geological confidence is also good enough). Blocks with values of between 20% and 50% are considered to have indicated confidence, and block with values of less than 20% are classified as inferred confidence. The geological confidence is assigned by the geologists, and is based on their subjective judgement. The confidence could be down-graded by the geologists based on the level of ore body complexity. Blocks classified as measured confidence are generally adjacent to closely spaced sampling and generally pierced by a relatively dense irregular pattern of boreholes. Blocks classified as indicated confidence are generally adjacent to blocks classified as measured confidence. In cases where the mining engineer deems it necessary, he may downgrade the classification from proved to probable based on expected mining complexity.
GOLD ORE RESERVE STATEMENT AS OF 31 DECEMBER 20161, 2
As of 31 December 2016, Sibanye had aggregate proved and probable gold reserves of approximately 28.7Moz as set forth in the following table.
| | | | | | | | |
| | 2016 | | 2015 |
| | Tons | | Grade | | Gold | | Gold |
| | (Mt) | | (g/t) | | (Moz) | | (Moz) |
Operations | | | | | | | | |
Beatrix | | | | | | | | |
Proved (AI)3 | | 15.8 | | 4.0 | | 2.048 | | 2.389 |
Probable (AI) | | 20.2 | | 2.6 | | 1.675 | | 1.875 |
Total (AI) | | 36.0 | | 3.2 | | 3.723 | | 4.264 |
Probable (BI)4 | | — | | — | | — | | — |
Total underground | | 36.0 | | 3.2 | | 3.723 | | 4.264 |
Driefontein | | | | | | | | |
Proved (AI) | | 20.7 | | 6.6 | | 4.420 | | 4.133 |
Probable (AI) | | 5.8 | | 4.0 | | 0.737 | | 1.846 |
Total (AI) | | 26.5 | | 6.1 | | 5.157 | | 5.980 |
Probable (BI) | | 8.8 | | 6.0 | | 1.694 | | 2.122 |
Total underground | | 35.3 | | 6.0 | | 6.851 | | 8.102 |
Kloof | | | | | | | | |
Proved (AI) | | 18.4 | | 7.9 | | 4.700 | | 4.857 |
Probable (AI) | | 6.2 | | 5.9 | | 1.184 | | 1.024 |
Total (AI) | | 24.6 | | 7.4 | | 5.884 | | 5.881 |
Probable (BI) | | 2.5 | | 7.2 | | 0.556 | | 0.502 |
Total underground | | 27.1 | | 7.4 | | 6.450 | | 6.383 |
Cooke | | | | | | | | |
Proved (AI) | | 4.3 | | 5.3 | | 0.728 | | 1.014 |
Probable (AI) | | 0.6 | | 4.8 | | 0.097 | | 0.457 |
Total underground | | 4.9 | | 5.2 | | 0.826 | | 1.471 |
Probable (BI) | | — | | — | | — | | — |
Total underground | | 4.9 | | 5.2 | | 0.826 | | 1.471 |
Total underground operations | | 103.2 | | 5.4 | | 17.849 | | 20.219 |
Current SRD and TSF | | | | | | | | |
Beatrix (Probable) | | 4.5 | | 0.4 | | 0.052 | | 0.062 |
Driefontein (Probable) | | 4.0 | | 0.6 | | 0.076 | | 0.094 |
Kloof (Probable) | | 11.9 | | 0.5 | | 0.200 | | 0.163 |
Randfontein Surface (Proved) | | 4.5 | | 0.3 | | 0.047 | | 0.052 |
Total SRD and TSF | | 24.8 | | 0.5 | | 0.375 | | 0.372 |
Total (excluding projects) | | | | | | | | |
Beatrix | | 40.5 | | 2.9 | | 3.775 | | 4.326 |
Driefontein | | 39.2 | | 5.5 | | 6.926 | | 8.196 |
Kloof | | 39.0 | | 5.3 | | 6.650 | | 6.546 |
Cooke | | 9.4 | | 2.9 | | 0.872 | | 1.523 |
Total (excluding projects) | | 128.1 | | 4.4 | | 18.224 | | 20.591 |
Projects | | | | | | | | |
Underground projects (Probable) | | | | | | | | |
Burnstone (Probable) | | 17.5 | | 3.8 | | 2.137 | | 1.799 |
De Bron Merriespruit (Probable) | | 15.4 | | 4.3 | | 2.112 | | 2.112 |
Total underground projects | | 32.9 | | 4.0 | | 4.248 | | 3.911 |
Surface projects | | | | | | | | |
WRTRP (Probable) | | 677.3 | | 0.3 | | 6.222 | | 6.486 |
Total surface projects | | 677.3 | | 0.3 | | 6.222 | | 6.486 |
Total projects | | 710.2 | | 0.5 | | 10.470 | | 10.397 |
| | | | | | | | |
Total underground (including projects) | | 136.1 | | 5.0 | | 22.097 | | 24.130 |
Total surface (including projects) | | 702.1 | | 0.3 | | 6.597 | | 6.858 |
Total mineral reserves | | 838.2 | | 1.1 | | 28.694 | | 30.988 |
1 Managed, unless otherwise stated.
2
| 1. | | Quoted as mill delivered metric tons and Run-of-Mine (RoM) grades, inclusive of all mining dilutions and gold losses except mill recovery. Metallurgical recovery factors have not been applied to the reserve figures. The metallurgical recovery is the ratio, expressed as a percentage, of the mass of the specific mineral product actually recovered from ore treated at the plant to its total specific mineral content before treatment. The approximate metallurgical factors for gold are as follows: (i) Driefontein Plants (DP1-Underground feed 97%, DP 2 SRD feed 82% and DP 3 SRD feed 81%), (ii) Kloof Plants (KP1 SRD feed 88%, KP 2 Underground feed 98%), (iii) Beatrix Plants (BP1 Underground feed 96%, BP1 SRD feed 86%, BP2 Underground feed 95%, BP2 SRD feed 86%), (iv) Cooke Doornkop Plant Underground feed 96%, Ezulwini Plant Underground Feed 96%, Ezulwini Plant SRD feed 90%, Cooke Plant TSF feed 58%, (v) De Bron Merriespruit underground utilising BP1 96%, (vi) WRTRP TSF feed 53%% and (vii) Burnstone 96%. |
| 2. | | A gold price of R490,000/kg (US$1,200/oz at an exchange rate of R12.70/US$) was applied in valuing the ore reserve. The gold price used for reserves is the approximate three-year trailing average, calculated on a monthly basis, of the London afternoon fixing price of gold. These prices are approximately 14% higher in Rand terms than the prices used for the 31 December 2015 declaration. |
| 3. | | Mine dilution relates to the difference between the mill tonnage and the stope face tonnage and includes other sources stopping (which is waste that is broken on the mining horizon, other than on the stope face), development to mill and tonnage discrepancy (which is the difference between the tonnage expected on the basis of the mine’s measuring methods and the tonnage accounted for by the plant). The mine dilution factors are as follows: (i) Driefontein 29%; (ii) Kloof 33%; (iii) Beatrix 23%, (iv) Cooke 17%%, (v) De Bron Merriespruit (Down Dip mine design) 48% and (vi) Burnstone 14%. |
| 4. | | The mining recovery factor relates to the proportion or percentage of planned and scheduled reserves against total potentially available reserves at the gold price used for the declaration of reserves, with all modifying factors, mining constraints and pillar discounts applied. The mining recovery factors are as follows: (i) Driefontein 53%; (ii) Kloof 120%; (iii) Beatrix 47%, (iv) Cooke 18%, (v) De Bron Merriespruit 89%%, (vi) Burnstone 102% and (vii) |
WRTRP 100%. Where the percentage is low, there is significant resource potential on the operation, and where it is more than 100% it is a function of low-grade incremental mining and planned decreases in pay limits. |
| 5. | | The pay limit varies per operation and per shaft, depending on the respective costs, depletion schedule, ore type and dilution. The following are the average pay limits applied in the underground planning process: (i) Driefontein 1,230cm.g/t, (ii) Kloof 1,560cm.g/t, (iii) Beatrix 720cm.g/t and (iv) Cooke 980cm g/t. |
| 6. | | Totals may not sum due to rounding. |
| 7. | | A mine call factor based on historic performance and incorporating any planned improvements is applied to the mineral reserves. The following mine call factors have been applied: Driefontein 87%, Kloof 81%, Beatrix 85%, Cooke 83%, DBM 81% and Burnstone 88%.. |
| 8. | | The WRTRP (assessing the potential for extraction of gold and uranium from Sibanye’s West Wits Line and the adjacent Cooke TSFs) is based on a Definitive Feasibility Study. The 31 December 2016 reserves are based on the DFS, but have been updated with deposition to the active TSF’s during 2016. |
3 Above infrastructure (AI) reserves relate to mineralisation which is located at a level at which an operation currently has infrastructure sufficient to allow mining operations to occur.
4 Below infrastructure (BI) reserves relate to mineralisation which is located at a level at which an operation currently does not have infrastructure sufficient to allow mining operations to occur, but where the operation has made plans to install additional infrastructure in the future which will allow mining to occur at that level.
GOLD PRICE SENSITIVITY
The amount of gold mineralisation that we can economically extract, and therefore can classify as reserves, is sensitive to fluctuations in the price of gold. The following table indicates our reserves at different gold prices that are 10% above and below the US$1,200/oz (R490,000/kg) gold price used to estimate our attributable reserves; however, the reserve sensitivities are not based on detailed depletion schedules and should be considered on a relative and indicative basis only.
| | | | | | |
(Moz)1 | | R441,000/kg | | R490,000/kg | | R539,000/kg |
Driefontein | | 6.369 | | 6.926 | | 7.569 |
Kloof | | 6.195 | | 6.650 | | 6.996 |
Beatrix | | 2.696 | | 3.775 | | 3.968 |
Cooke | | 0.766 | | 0.872 | | 0.954 |
WRTRP | | - | | 6.222 | | 6.222 |
De Bron Merriespruit | | - | | 2.112 | | 2.207 |
Burnstone | | 1.431 | | 2.137 | | 2.240 |
Total | | 17.456 | | 28.694 | | 30.156 |
1 Driefontein, Kloof, Beatrix and Cooke operations’ reserves include Run-of-Mine ore stockpiles, tailings and SRD.
Our attributable gold reserves decreased from 31.0Moz at 31 December 2015 to 28.7Moz at 31 December 2016, as set forth in the following table:
| | |
| | Gold |
| | (Moz) |
Life of Mine 31 December 2015 | | 30.988 |
2016 depletion | | (1.600) |
Post depletion Life of Mine | | 29.388 |
Changes in geology structure at operations | | (0.240) |
Changes in estimation models at operations | | (0.236) |
Technical factors (Mine Call Factor, percentage waste mining, etc) | | (0.017) |
Specific inclusions: | | |
Extension of Beisa Central and Beatrix 4 shaft | | 0.184 |
Burnstone Project inclusion of additional areas | | 0.338 |
White areas and general additions | | 0.898 |
Secondary reefs at Driefontein 8 shaft and Kloof 2 shaft and Cooke 3 shaft | | 0.620 |
Additional SRD’s at Driefontein, Kloof and Beatrix | | 0.204 |
Specific exclusions: | | |
Overbank area at Driefontein 5 shaft | | (0.574) |
Tail management, pay limit changes and unpay exclusions | | (1.089) |
WRTRP unpay exclusions | | (0.265) |
Closure of Cooke 4 shaft | | (0.518) |
Total | | 28.694 |
URANIUM ORE RESERVE STATEMENT AS OF 31 DECEMBER 20161, 2
As of 31 December 2016, we had probable uranium reserves of approximately 113.2Mlb as set forth in the following table:
| | | | | | | | |
| | 2016 | | 2015 |
| | Tons | | Grade | | U3O8 | | U3O8 |
| | (Mt) | | (kg/t) | | (Mlb) | | (Mlb) |
Operations | | | | | | | | |
Beatrix | | | | | | | | |
Proved (AI) | | — | | — | | — | | — |
Probable (AI) | | 10.2 | | 0.711 | | 16.060 | | 11.654 |
Total underground | | 10.2 | | 0.711 | | 16.060 | | 11.654 |
Cooke | | | | | | | | |
Proved (AI) | | — | | — | | — | | 2.056 |
Probable (AI) | | — | | — | | — | | 1.017 |
Total underground | | — | | — | | — | | 3.073 |
Total underground operations | | 10.2 | | 0.711 | | 16.060 | | 14.727 |
Total (excluding projects) | | | | | | | | |
Beatrix | | 10.2 | | 0.711 | | 16.060 | | 11.654 |
Cooke | | — | | — | | — | | 3.073 |
Total (excluding projects) | | 10.2 | | 0.711 | | 16.060 | | 14.727 |
Projects | | | | | | | | |
Surface projects | | | | | | | | |
WRTRP (Probable) | | 677.3 | | 0.065 | | 97.166 | | 99.088 |
Total surface | | 677.3 | | 0.065 | | 97.166 | | 99.088 |
Total projects | | 677.3 | | 0.065 | | 97.166 | | 99.088 |
Total underground and surface | | 687.5 | | 0.075 | | 113.226 | | 113.814 |
1 Managed, unless otherwise stated.
2
| a. | | Quoted as mill delivered metric tons and Run-of-Mine (RoM) grades, inclusive of all mining dilutions and uranium losses except mill recovery. Metallurgical recovery factors have not been applied to the reserve figures. The metallurgical recovery is the ratio, expressed as a percentage, of the mass of the specific mineral product actually recovered from ore treated at the plant to its total specific mineral content before treatment. The approximate metallurgical factor is 67% for Beatrix Beisa Project and 47% for WRTRP. |
| b. | | A uranium price of R1,260/per kilogram ($45/lb at an exchange rate of R12.70/US) was applied in valuing the ore reserve. The uranium price used for reserves relates to the three year average long term contract price of $47/lb. The reserve price is approximately 10% higher in South African Rand terms than the price used for the 31 December 2015 declaration. |
| c. | | For the South African operations, mine dilution relates to the difference between the mill tonnage and the stope face tonnage and includes other sources stopping (which is waste that is broken on the mining horizon, other than on the stope face), development to mill and tonnage discrepancy (which is the difference between the tonnage expected on the basis of the mine’s measuring methods and the tonnage accounted for by the plant). The mine dilution factors are as follows: Beatrix Beisa Project 20%. |
| d. | | The mining recovery factor relates to the proportion or percentage of ore mined from the defined ore body at the gold price used for the declaration of reserves. This percentage will vary from mining area to mining area and reflects planned and scheduled reserves against total potentially available reserves (at the gold price used for the declaration of reserves), with all modifying factors, mining constraints and pillar discounts applied. The mining recovery factors for the operations with uranium reserves are as follows: Beatrix 66%. |
| e. | | Uranium is mined as a co-product and as such the pay-limit does not apply. |
| f. | | Totals may not sum due to rounding. |
| g. | | A mine call factor based on historic performance and planned improvements are applied to the mineral reserves. The following mine call factor has been applied: Beatrix Beisa Project 90%. |
| h. | | AI: Above infrastructure reserves relate to mineralisation which is located at a level at which an operation currently has infrastructure sufficient to allow mining operations to occur. |
PLATINUM DIVISION
CAUTIONARY NOTE
Sibanye acquired Aquarius in April 2016 and announced on 9 September, 2015 that it had entered into a series of agreements to acquire the Rustenburg Operations from RPM. The transaction, transferring Rustenburg Operations to Sibanye was concluded in November 2016. Neither Aquarius nor Anglo American Platinum, the previous owner of the Rustenburg Operations, was listed on the NYSE and therefore, neither was required to, nor did, comply with the requirements of the SEC’s Industry Guide 7 at the time of publishing their Mineral Reserves on 30 June 2015 and 31 December 2015, respectively. Accordingly, the following 4E PGM Reserve Statement as of 31 December 2016 does not include Mineral Reserve information for the operations of Aquarius or the Rustenburg Operations as at 30 June 2015 or 31 December 2015, respectively.
Investors should also be aware that the following reserve statement does not include the reserves information regarding the Mimosa operation for any period due to the fact that the reserves of the Mimosa operation have not been prepared in accordance with the SEC’s Industry Guide 7. Sibanye expects to prepare Industry Guide 7-compliant reserve information for the Mimosa operation in the future.
Investors are cautioned that the following reserve statement may not be comparable to Sibanye’s reserve statement declared in South Africa or Sibanye’s reserve statement in subsequent years.
GEOLOGY
Kroondal and Rustenburg (South Africa operations)
The Kroondal and Rustenburg Mining operations are located within the Western Limb of the Bushveld Complex (BC). The BC is the world’s largest known layered mafic-ultramafic intrusive complex covering an area of approximately 67,000km2, contains 85% of all known PGM resources and is the source of over half of current world PGM production. This massive mafic-ultramafic layered intrusion and its associated suite of granitoid rocks intruded into the Transvaal Supergroup within the Kaapvaal Craton. The Proterozoic (2.6Ga to 2.058Ga) BC is divided into the basal Rustenburg Layered Suite (RLS) of ultramafic to mafic rocks,
the overlying Lebowa Granite Suite (LGS) and the felsic extrusive rocks of the Rashoop Granophyre Suite (RGS). It is the RLS that is host to the PGMs at Kroondal and Rustenburg operations. The critical zone of the RLS is host to the Merensky and UG2 reefs, the economic mineralisation exploited at Rustenburg platinum operations. At Kroondal operations only the UG2 reef is exploited, the Merensky reef was mined out at the time of acquisition by Sibanye.
The persistence of the Merensky Reef and UG2 Reef in the Kroondal and Rustenburg Platinum Lease Area has been confirmed mainly by extensive surface and underground drilling as well as 3D seismic surveys. The only aberration to this pattern is in the vicinity of the two major dunite pipes, the Brakspruit and Townlands pipes.
The Merensky Reef is, in most instances, well defined and typically consists of a pegmatoidal feldspathic pyroxenite layer, bounded on the top and bottom by thin chromitite layers. A notable feature of the Merensky Reef is the regularity of thickness, within limits of 5 cm to 60 cm, over large areas. However, variation does occur and the pegmatoidal feldspathic reef can vary locally in thickness, from a few centimeters up to approximately 1.5 meters. The Merensky Reef contains economically important base metal sulphide (BMS) and PGM mineralisation. Mineralisation of the Merensky Reef generally occurs in the pegmatoidal feldspathic pyroxenite and to a limited extent in the hangingwall and footwall, with highest PGM concentration peaking at the chromitite stringers.
The UG2 Reef, which is consistently developed throughout the RLS, is rich in chromitite but with lower gold, copper and nickel values as compared to that of the Merensky Reef. The UG2 Reef average thickness varies between 55 cm and 75 cm, and comprises a single, well developed chromitite layer. Within the Rustenburg Lease Area, the UG2 Reef occurs vertically between 90 m and 150 m below the Merensky Reef and dips in a northerly direction. The UG2 Reef is more prone to undulations than the Merensky Reef resulting in rolling reef.
As at all other platinum mines, the Merensky Reef and the UG2 Reef are affected by structural and other geological features, including potholes and Iron Rich Ultramafic Pegmatoids (IRUPs), which result in geological losses and impact on mining.
Mimosa (Non-South Africa operations – Zimbabwe)
Mimosa PGM mineralisation occurs in the Great Dyke in Zimbabwe. The Great Dyke is a long (550km) and narrow (11km), 2.5 billion year old layered igneous intrusion which bisects Zimbabwe in a north-north easterly direction. The Great Dyke is divided vertically into a lower ultramafic sequence, dominated from the base upwards by cyclic repetitions of dunite and/or serpentinite, hartzburgite and pyroxenite and an upper mafic unit consisting of gabbro and gabbro-norite and repetitions of dunite and/or serpentinite, hartzburgite and pyroxenite.
Economic PGM (platinum, palladium, rhodium, iridium and ruthenium along with gold, copper, cobalt and nickel) mineralisation occurs within the Main Sulphide Zone (MSZ), which is generally 10m to 20m from the top of the Ultramafic Sequence. Because it lies just below the Mafic Sequence, the PGM resources coincide with the four main erosional remnants of these rocks. The MSZ is typically 2 meters to 3 meters thick, but is locally up to 20 meters thick with a marked decrease in grade with thickening of the zone. Areas of very thick, uneconomic MSZ are mainly restricted to the axis of the Darwendale and Musengezi chambers.
BLOCK MODEL ESTIMATION AND RESERVING PROCESS
Underground reserves are based on an estimated block model of the ore body, which is derived from surface drilling, underground drilling, surface three-dimensional reflection seismics, ore body facies modeling, structural modeling, underground mapping, underground channel sampling and geostatistical estimation to create the Mineral Resource models. The Resource models are then converted using modifying factors to generate Mineral Reserves.
At Rustenburg operations, modelling is completed using Datamine Software. Both MRM and borehole data are imported and rigorously validated in Datamine. The validated data files were regressed and then composited over the different Reef elements. Geostatistical data per Reef element is investigated and modelled using the “Snowden Supervisor” software package; and the modelling parameters ware then imported back into Datamine.
Estimation by ordinary kriging is done for elements with sufficient data and ID (Inverse distance to the power of two) estimates for elements with limited data.
At Kroondal operations, modeling is completed using Surpac Software. Data from Visual Geobase database is used to create the Surpac Database which is used for modeling to create the resource models. Variograms are modelled for true width, 4E cmgt (UG2L and UG2), density and prill split. A kriging neighbourhood analysis is carried out to determine the number of samples that should be used to estimate a block. The slope of regression is used to assess the quality of estimate. The slope of regression of the estimate versus the number of informing samples is plotted for each block size. Estimation is done using ordinary kriging into an 80x80m block size model, using the variogram parameters derived above. 30 composites are used to estimate each block.
At Mimosa operations, Surpac Software is also utilised to create the Resource models. Geological ore body modeling is done by extracting XYZ points at the base of the platinum peak for all holes that have been selected for creation of the platinum peak surface. These holes are displayed in Surpac together with the ore body limits. A triangulated surface of the platinum peak is generated through triangulation. The platinum peak surface is then copied 0.45m up and 1.55m down. The top and bottom surfaces are triangulated to produce a geological solid which is then validated. Tonnage and grade estimations are done using boreholes with a consistent metal profile only in Surpac software by creating a block model. The block model is then constrained to a 2 metre wide mining slice extending to 0.45m above and 1.55m below the base of the platinum peak datum using a solid model. The main blocks are 2m high and 12.5m by 12.5m wide. Sub-blocking is done at 6.25m × 6.25m × 1m. Grades for each block within the slice are then estimated by inverse distance method varying search radii based on the platinum variogram, but limiting the number of holes to a minimum of 3 and a maximum of 7.
The results of this process is a Resource Model with Mineral Resources classified into Measured, Indicated and Inferred in order of decreasing geological confidence respectively.
RESERVE CLASSIFICATION METHODOLOGY
The reserve estimates are derived from the Resource Models initially categorised according to the measured, indicated and inferred classification assigned to the block models. The measured confidence category is converted to proved reserves and indicated to probable reserves. The inferred confidence category has too low a confidence to be converted to reserves and is excluded.
The confidence classification applied to the block model uses a combination of the quality of the kriged estimates and the confidence in the geological interpretation (drill spacing, continuity of ore body, structural confidence, and confidence in extrapolation or interpolation of facies types). The lower of the two confidence estimates is accepted as the final classification.
Various modifying factors are applied at the different operations to convert the Mineral resources to Mineral reserves with an approved Life of Mine in accordance with guidelines of the SAMREC Code (2016) and SEC guidelines. A key aspect to the conversion of the Mineral Resources to Mineral Reserves is economic viability which utilizes approved projected metal prices for the PGMs. This will then be used to demonstrate economic viability of their extraction hence declaration as Mineral Reserves.
4E PGM ORE RESERVE STATEMENT AS OF 31 DECEMBER 2016
As of 31 December 2016, Sibanye declared maiden 4E PGM reserves, excluding Mimosa, of approximately 21.5Moz as set forth in the following table:
| | | | 2016 | | |
| | Tons | | Grade | | 4E PGM |
| | (Mt) | | (g/t) | | (Moz) |
Kroondal (50% attributable) (South African operation) | | | | | | |
UG2 | Proved | | 21.01 | | 2.67 | | 1.80 |
Probable | | 5.75 | | 2.64 | | 0.49 |
| Total | | 26.76 | | 2.66 | | 2.29 |
Rustenburg (excluding tailings) (South African operations) | | | | | | |
MR | Proved | | 9.57 | | 5.20 | | 1.60 |
Probable | | 0.80 | | 4.87 | | 0.13 |
| Total | | 10.38 | | 5.18 | | 1.73 |
UG2 | Proved | | 113.57 | | 3.71 | | 13.56 |
Probable | | 5.88 | | 4.10 | | 0.78 |
| Total | | 119.46 | | 3.73 | | 14.34 |
Combined | Proved | | 123.15 | | 3.83 | | 15.17 |
Probable | | 6.68 | | 4.19 | | 0.90 |
| Total | | 129.83 | | 3.85 | | 16.07 |
Tailings | | | | | | | |
Combined | Proved | | 0.00 | | 0.00 | | 0.00 |
Probable | | 90.38 | | 1.08 | | 3.14 |
| Total | | 90.38 | | 1.08 | | 3.14 |
Total | | | | | | |
Combined | Proved | | 144.16 | | 3.66 | | 16.97 |
Probable | | 102.81 | | 1.37 | | 4.53 |
| Total | | 246.97 | | 2.71 | | 21.50 |
1 A platinum price of R15,500/oz (US$1,222/oz), palladium price of R9,100/oz (US$717/oz), rhodium price of R10,000/oz (US$787/oz) and gold price of R15,200/oz (US$1,200/oz) (at an exchange rate of R12.70/US$) was applied in valuing the ore reserve. The prices used for reserves is the approximate three-year trailing average metal prices.
CORPORATE GOVERNANCE
The Competent Persons that take responsibility for the reporting of mineral reserves are the respective operation (per mining unit) or project based Mineral Resource Manager or Manager Geology. The details of all the personnel who approved the mineral reserves are listed in the respective Competent Person’s Reports for the specific operation.
Corporate Governance on the overall compliance of the company’s figures and responsibility for the generation of a Group consolidated statement has been overseen by the Technical Services team listed below. This team, who consent to the disclosure of the 31 December 2016 Mineral Reserve Statement, are permanent employees of Sibanye, and function independently of the operating mines and projects.
| | | | | | |
Competent Person | | Title | | Qualifications | | Years |
Gold Division | | | | | | |
Gerhard Janse van Vuuren
PLATO PMS 243 | | Vice President: Mine Technical Services | | B Tech (MRM); GDE (Mining Engineering); MBA; MSCC | | 28 |
Johan van Eeden
SACNASP 400043/092 | | Group Geologist | | MSc (Geology) | | 32 |
Leon Tolmay
SAIMM 7041403 | | Group Evaluator | | NHD (Mine Survey); GDE (Mining Engineering); MSCC | | 39 |
Steven Wild
SAIMM 706556 | | Group Mine Planner | | GDE Mining Engineering; NHD MRM | | 20 |
Werner de Klerk
PLATO PMS233 | | Group Surveyor | | GDE Mining Engineering; MSCC and ND Survey | | 33 |
Chris Opperman
SAIMM 706906 | | Mineral Resource Manager | | ND Mine Survey; LDP; MAP | | 35 |
Gerhard Backer
ECSA H875664 | | Mineral Resource Manager | | BEng; Mining Engineering; MMCC | | 34 |
| | | | | | |
Competent Person | | Title | | Qualifications | | Years |
Stephan Stander
SACNASP 40089/96 | | Mineral Resource Manager | | Bsc Hons Geology; GDE Mining; BCom; MB:;DPL PM | | 14 |
Charl Labuschagne
SACNASP 400237/08 | | Mineral Resource Manager | | GDE (Mining Engineering); BSc (Hons) (Geology); MSc ENV Management | | 19 |
Masigan Tandree
SAIMM 706330 | | Mineral Resource Manager | | ND Mine Survey; MSCC GDE (Mining) | | 19 |
Manie Keyser
SACNASP 400284/06 | | Mineral Resource Manager | | MEng (Mining Engineering); GDE; NHD MRM; ND Survey | | 23 |
Lance Madondo
SACNASP 200016/09 | | Mineral Resource Manager | | BSc Geology | | 12 |
Stephanus Louw
SAIMM 707018 | | Mineral Resource Manager | | MMCC | | 35 |
Hansie Engelbrecht
SAIMM 706905 | | Mineral Resource Manager | | GDE (Mining Engineering); NHD Mine Survey; MCSS | | 34 |
Shadrack Dekeda
SAIMM 703902 | | Mineral Resources Manager | | B Tech MRM; MSCC | | 15 |
Ian Davidson
SAIMM 706805 | | Mineral Resource Manager | | BSc (Hons) (Geology) | | 34 |
Quartus Meyer
SACNASP 4006388 | | Project Geologist | | MSc Geology; Pr.Sci.Nat | | 31 |
M Greenhalgh
SAIMM 704826 | | Group Sampler | | GDE Mining Engineering | | 32 |
Platinum Division | | | | | | |
Andrew Brown
SAIMM 705060 | | VP Mine Technical Services | | M.Sc. (Mining Engineering); MSAIMM | | 32 |
Leonard Changara
SACNASP 400089/08 | | Resource Geologist | | M.Sc. (Geology); B.Sc. Hons (Geology); B.Sc. Gen (Geology & Mathematics); Pr.Sci.Nat; GSSA | | 18 |
Etienne Malherbe
SACNASP 400131/08 | | Resource Geologist | | BSc. Hons (Geology), Pr.Sci.Nat. | | 21 |
Brian Smith
SAIMM PMS0218 | | Chief Surveyor | | NHD (Mine Survey),
MSCC 1775
M.Eng MRM
PLATO, MSAIMM, | | 30 |
Gawie van Heerden
SAIMM 702828 | | Planning, LoM and Mineral Resources | | M.Eng. (Mining Engineering); B.Eng. (Hons.) (MOT); MMCC; MSAIMM; Pr.Eng (ECSA) | | 19 |
ENVIRONMENTAL AND REGULATORY MATTERS
Environmental
Sibanye’s operations are subject to various laws and regulations relating to the protection of the environment, and Section 24 of South Africa’s Constitution of 1996 grants the country’s people the right to an environment that is not harmful to human health or well-being, and to the protection of that environment for the benefit of present and future generations through reasonable legislation and other measures. The Constitution and the NEMA, as well as various other related pieces of legislation enacted and implemented since 1996, grant legal standing to a wide range of interest groups to institute legal proceedings to enforce their environmental rights, which are enforceable against private entities as well as the South African government.
South African environmental legislation commonly requires businesses whose operations may have an impact on the environment to obtain environmental authorisations, permits, licences and other approvals for those operations, and to comply with the conditions of approval prescribed in these environmental approvals. The Government’s constitutional mandate is to protect the environment, hence the rationale behind environmental authorisations is to ensure that companies with activities that are reasonably expected to have environmental impacts, assess the extent of the environmental impacts emanating from their business activities, as well as to put reasonable and practicable mitigation measures in place to manage and mitigate these impacts.
The most critical and applicable environmental legislation for the mining industry in South Africa remains the MPRDA and the NEMA, each with its own specific Regulations and amendments. From 08 December 2014, the “One Environmental System”, which was a significant step change for the mining industry insofar as the regulatory regime for environmental issues was concerned, came into force following the promulgation of legislation creating the new regime on 2 September 2014. In terms of the “One Environmental System” (OES), the Minister of Mineral Resources (and thus by delegation, the prescribed officials of the DMR) became the competent authority to grant environmental authorisations under the NEMA framework for listed activities pertaining to prospecting/mining operations, a responsibility which was previously administered by the Department of Environmental Affairs (DEA). From that point, environmental authorisations replaced the traditional environmental management programme (EMP) reports for all prospecting and mining projects (with existing MPRDA-approved EMP reports remaining valid until formally requested to convert). However, the DEA remains the appeal authority on all DMR-issued environmental authorisations. Company directors, in their personal capacity, may be held liable under provisions of NEMA for any environmental degradation and/or the remediation thereof.
In terms of the 2014 NEMA Amendment Act, the Minister of Mineral Resources is obliged to appoint environmental mineral resource inspectors to monitor the compliance of mining companies, as well as the enforcement of provisions insofar as it relates to prospecting, exploration, mining or production. The training of these inspectors is underway, and there are already a number of inspectors active in the field. There is general consensus in the mining industry that, whilst the intent of the OES had been noble, the practical implementation thereof thus far has been challenging, specifically insofar as the Government’s adherence to the timeframes for issuing environmental authorisations is concerned. Through the Chamber of Mines and other industry associations, the mining industry is working closely with Government to improve this system.
The Regulations on Financial Provisioning, issued on 20 November 2015 under auspices of the “One Environmental System”, remain controversial and largely untenable to industry. As a result of widespread criticism from industry, Government issued a Regulation in October 2016, deferring the implementation date for the November 2015 Regulations on Financial Provisioning to February 2019, with the unstated objective of reviewing the Regulations on Financial Provisioning well before the anticipated commencement date. The Department of Environmental Affairs, who is the custodian for the development of NEMA-related laws and regulations, has started with the review process and industry is part of the review process.
To date, neither legislation nor the actual implementation of a carbon tax, has been finalised and/or introduced. Post the release of draft Carbon Tax Bill for public comment, in November 2015, it was widely anticipated that the carbon tax would have been introduced on 1 January 2017. This did not happen and industry is awaiting further guidance from Government on the issue, including the promulgation of the much-anticipated Carbon Tax Act. In parallel, the mining industry has raised concerns through the Chamber of Mines at various forums, including the Davis Tax Commission, on the potential negative financial impact of the carbon tax, particularly in relation to marginal mining operations. Insofar as the design of the carbon tax is concerned: it requires the calculation of tax liability to be based on the volume of fossil fuel input which results in Scope 1 greenhouse gas emissions, and for such liability to commence at R120/t of CO2e, increasing by 10% per annum. The design also anticipates a tax free threshold of 60% and various allowances that would permit a tax liable entity to further mitigate its liability. Such allowances include an increased tax free threshold for trade exposed sectors and the use of carbon offsets against a carbon tax liability. The National Treasury has alluded that electricity may not be taxed during the first phase until 2020. While many aspects of the proposed carbon tax remain uncertain, the financial implications of government’s proposed carbon tax for Sibanye, in today’s terms, the 2016 carbon footprint and at an anticipated rate of R120/t of CO2e, would be between approximately R4 million and R25 million per annum on the premise that electricity (i.e. Scope 2 emissions) is excluded. In the event that electricity (Scope 2 emissions) is included in the tax, liability can increase to between approximately R249 million and R271 million per annum.
The National Environmental Management Waste Act, 2008 (Act No 59 of 2008) (the Waste Act) commenced on 1 July 2009 with the exception of certain sections relating to contaminated land, which came into force on 2 May 2014. Responsible waste management has become a priority for the DEA. On 2 June 2014, amendments to the Waste Act were published, which stated that as of 8 December 2014, residue deposits and residue stockpiles would be brought within the Waste Act’s scope of operation and as such, residue stockpiles and residue deposits are now subject to regulation under the Waste Act and waste management licenses for activities relating to their establishment and reclamation will need to be obtained. In addition, Regulations regarding the Planning and Management of Residue Deposits and Stockpiles (MRDS), were published on 24 July 2015. Due to the onerous nature and the anticipated financial impact these Regulations would have on industry with little or no benefit to the environment from a pollution control/containment perspective, industry has constantly argued both from a technical and legal perspective, that there was sufficient regulation in legislation other than the Waste Act to regulate MRDS (under a different definition than the current “hazardous waste” under the Waste Act), that MRDS be statutory excluded from the Waste Act and its amendments, and to rather provide for the management of MRDS under a NEMA amendment. The
Department of Environmental Affairs has indicated that industry’s comments would be considered in the drafting of the revised Regulations. Engagement with the government in relation to this issue is ongoing.
With regards to the requirements of the Waste Act, applications for waste management licences for all of the relevant waste management activities have been made. Sibanye currently has two waste disposal facilities at each of its Beatrix and Driefontein operations. Pursuant to the requirements of the Waste Act, these facilities will need to be managed in accordance with the Waste Act and, if necessary, rehabilitated.
Sibanye undertakes activities which are regulated by the National Nuclear Regulator Act, 1999 (Act No 47 of 1999) (the NNR Act). The NNR Act requires Sibanye to obtain authorisation from the National Nuclear Regulator (NNR) and undertake activities in accordance with the conditions of such authorisations. During the reporting period, both internal and external audits and inspections were conducted. These audits and inspections, conducted by the NNR Inspectorate, registered an average compliance index of 85.8% which is higher than the benchmark of 80%. Each of Sibanye’s mining operations possesses and maintains a Certificate of Registration (CoR) as required by the NNR Act.
Although traditionally weak, the enforcement of environmental laws under South Africa’s comprehensive environmental regulatory framework, has experienced rapid improvement. Three separate legislative acts, including the NEMA (for the mining industry enforced by the DMR), the MPRDA (enforced by the DMR) and the National Water Act (enforced by the Department of Water and Sanitation) all make provisions for the appointment of environmental management inspectors, which have sweeping authority and mandates to enforce environmental legislation. Some of the new environmental laws and regulations have been viewed as “disabling” and as having a negative impact on the growth and development of the mining industry. To date, Sibanye’s approach has been to work with Government and to positively influence new and emerging legislation as far as possible in the interest of the industry as well as in the interest of the environment.
Health and Safety
Health and safety performance on mines is regulated by the South African Mine Health and Safety Act, 1996 (Act No 29 of 1996) (MHSA). The MHSA, among others, requires the mining companies as employers and their contractors to ensure that their operating and non-operating mines maintain a safe and healthy working environment, confers on the employees the right to refuse to perform hazardous work or enter into an unsafe working place, and describes the powers and functions of the Mine Health and Safety Inspectorate (MHSI), within the jurisdiction of the DMR and as part of the process of enforcement.
As legally required, all employees are represented in formal joint management/worker health and safety committees, through their representatives, to help monitor and advise on occupational health and safety programmes.
In terms of the MHSA, an employer is obligated, among others, to ensure that mines are designed, constructed and equipped to provide conditions for safe operation and a healthy working environment, and the mines are commissioned, operated, maintained and decommissioned so that employees can perform their work without endangering their health and safety or that of any other person. Every employer must ensure that people who are not employees, but who may be directly affected by the activities at a mine, are not exposed to any health and safety hazards. The MHSA authorises the inspectors in the MHSI, upon identifying certain health and safety hazards, to restrict or stop, partially or wholly, operations at any mine or a workplace, and require an employer to take steps to address the said health and safety hazards before such restriction or stoppage can be lifted.
The principal health risks associated with mining operations in South Africa arise from occupational exposure to silica dust, noise, heat and certain hazardous chemicals. The most significant occupational diseases affecting our workforce include lung diseases such as silicosis, tuberculosis (TB), a combination of both, and chronic obstructive airways disease (COAD) as well as noise induced hearing loss (NIHL).
The Occupational Diseases in Mines and Works Act, 1973 (Act No 78 of 1973) (ODMWA) governs compensation paid to mining employees who contract certain occupational illnesses, such as silicosis. The South African Constitutional Court has ruled that a claim for compensation under ODMWA does not prevent an employee from seeking compensation from an employer in a civil action under common law (either as individuals or as a class). For information on pending silicosis-related litigation involving Sibanye see “Annual Financial Report—Annual financial statements—Notes to the consolidated financial statements–Note 31: Contingent liabilities—Occupational healthcare services”.
A failure to comply with MHSA is a criminal offence for which an employer, or any responsible person, may be charged and, if successfully prosecuted, be fined or imprisoned, or both. The MHSI also has the power to impose administrative fines upon an employer in the event of a breach of the Mine Health and Safety Act. The maximum administrative fine that may be imposed is R1 million per offence.
Mineral Rights
THE MPRDA
The MPRDA came into effect on 1 May 2004. The MPRDA consists of two parts, namely the Act itself and the Transitional Provisions contained in Schedule II to the Act. In terms of the MPRDA, the mineral and petroleum resources of South Africa belong to the nation and the state (as custodian of the nation’s resources), which is entitled to grant prospecting and mining rights.
Under the MPRDA, prospecting rights may be granted for an initial maximum period of five years and can be renewed once upon application for a further period not exceeding three years. Mining rights are valid for a maximum period of 30 years, and can be renewed upon application for further periods, each of which may not exceed 30 years. A wide range of factors and principles, including proposals relating to BEE and social responsibility, will be considered by the Minister of Mineral Resources when exercising his discretion whether to grant these applications. A prospecting or mining right can be suspended or cancelled if the holder conducts mining operations in breach of the MPRDA, a term or condition of the right or an environmental management plan, or if the holder of the right submits false, incorrect or misleading information to the DMR. The MPRDA sets out a process which must be followed before the Minister of Mineral Resources is entitled to suspend or cancel the prospecting
or mining right. In November 2006, the DMR approved the conversion of Sibanye’s mining licences under the old regulatory regime at Kloof, Driefontein and Beatrix into rights under the new regime. All of Sibanye’s mines have received their new-order mining rights.
The MPRDA empowered the Minister of Mineral Resources to develop the Mining Charter to set the framework, targets and timetable for effecting entry of HDSAs into the mining industry and to allow such South Africans to benefit from the exploitation of South Africa’s mineral resources.
Among other things, the Mining Charter stated that mining companies agreed to achieve 26% HDSA ownership of South African mining industry assets within 10 years (i.e. by the end of 2014). Ownership can comprise active involvement, through HDSA-controlled companies (where HDSAs own at least 50% plus one share of the company and have management control), strategic joint ventures or partnerships (where HDSAs own at least 25% plus one vote of the joint venture or partnership interest and there is joint management and control) or collective investment vehicles, the majority ownership of which is HDSA based, or passive involvement, particularly through broad-based vehicles such as employee stock option plans. The Mining Charter also required mining companies to submit annual, audited reports on progress toward their commitments, as part of an ongoing review process.
Following a review, the DMR released the Amended Mining Charter on 13 September 2010. Amendments to the Mining Charter in the Amended Mining Charter included, among other things, the requirement by mining companies to: (i) facilitate local beneficiation of mineral commodities; (ii) procure a minimum of 40% of capital goods, 70% of services and 50% of consumable goods from HDSA suppliers (i.e. suppliers in which a minimum of 25% + 1 vote of their share capital must be owned by HDSAs) by 2014 (exclusive of non-discretionary procurement expenditure); (iii) ensure that multinational suppliers of capital goods contribute a minimum of 0.5% of their annual income generated from South African mining companies into a social development fund from 2010 towards the socio-economic development of South African communities; (iv) achieve a minimum of 40% HDSA demographic representation by 2014 at top management (board) level, senior management (executive committee) level, middle management level, junior management level and core and critical skills; (v) invest up to 5% of annual payroll in essential skills development activities; and (vi) implement measures to improve the standards of housing and living conditions for mineworkers by converting or upgrading mineworkers’ hostels into family units, attaining an occupancy rate of one person per room and facilitating home ownership options for all mineworkers in consultation with organised labour, all of which was to be achieved by 2014. In addition, mining companies are required to monitor and evaluate their compliance to the Amended Mining Charter and must submit annual compliance reports to the DMR. The Scorecard for the Broad-Based Socio-Economic Empowerment Charter for the South African Mining Industry attached to the Amended Mining Charter (the Scorecard) made provision for a phased-in approach for compliance with the above targets over the five year period ended 2014. For measurement purposes, the Scorecard allocates various weightings to the different elements of the Amended Mining Charter. Failure to comply with the provisions of the Amended Mining Charter will amount to a breach of the MPRDA and may result in the cancellation or suspension of a mining company’s existing mining rights. In light of the Amended Mining Charter, the status of the Mining Charter is unclear although such charter appears to have been replaced by the Amended Mining Charter.
In accordance with the MPRDA, on 29 April 2009 the DMR published the Code relating to the socio-economic transformation of the mining industry. The current industry position is that the DMR does not apply the Codes and that mining companies are subject only to the provisions of the MPRDA and the Amended Mining Charter.
In the same vein as the 2009 review, during the course of fiscal 2014, the DMR appointed a private entity to conduct Amended Mining Charter compliance audits on its behalf, in respect of a number of mining companies. Mining companies were required to complete questionnaires and templates as a means of reporting on their compliance with fiscal 2014 targets as set in the Amended Mining Charter. However, it is generally understood that the DMR disregarded or abandoned this audit process. It is therefore unclear what the status of the process is and what the outcomes were. It is also unclear whether or not the information provided during this audit process will be considered or used by the DMR for any purpose in the future. It appears that the information gathering mechanism has been substituted by the DMR’s own formal request for information and data on Amended Mining Charter compliance in terms of section 29 of the MPRDA. The DMR directed mining companies to populate an electronic reporting template, but this template has raised a number of concerns due to its inflexible approach towards the assessment of compliance with the Amended Mining Charter. The template applies a mechanical process in that it asks specific questions and requires the completion of certain information, without making provision for the detailing of complex facts or historical transactions entered into in pursuance of meeting the Mining Charter HDSA ownership element.
With the 2014 HDSA ownership target date contemplated in the Amended Mining Charter having passed, the DMR’s application of the Amended Mining Charter and its assessment of compliance therewith in respect of the ownership element is concerning. There are concerns in the mining industry that the approach followed by the DMR poses a risk of government action against many mining entities, which will threaten security of tenure, in that government may order the suspension or cancelation of mining rights in instances of deemed non-compliance with the requirements of the Amended Mining Charter.
Specifically, on 31 March 2015, the Chamber of Mines reported that the DMR believes that empowerment transactions by mining companies concluded after 2004 where the HDSA ownership level has fallen due to HDSA disposal of assets or for other reasons, should not be included in the calculation of HDSA ownership for the purposes of, among other things, the 26% HDSA ownership guideline under the Mining Charter. The position of Sibanye is consistent with that of the Chamber of Mines, and is that such empowerment transactions should be included in the calculation of HDSA ownership. The DMR and the Chamber have agreed to approach the South African courts to seek a declaratory order which will provide a ruling on the relevant legislation and the status of the Mining Charter. The Chamber of Mines and the DMR filed papers in court and the matter was placed on the role to be heard on 15 March 2016. In February 2016, an application was filed by a third party to consolidate the application by the Chamber of Mines and the DMR with its own application for a declaratory order on the empowerment aspects of the Mining Charter. The Chamber of Mines opposed the consolidation of these applications on the basis that, amongst other things, the right to relief in the respective applications does not depend substantially on the same questions of law and/or fact. On 3 May 2016, the court refused to consolidate the two applications.
If the DMR were to prevail in court, Sibanye may be required to undertake further transactions in order to increase their HDSA ownership, which would result in the dilution of ownership levels of the existing Shareholders and could also have a negative impact on the financial indebtedness of Sibanye. In such event, Sibanye may be required to maintain a minimum HDSA ownership level indefinitely. On 15 April 2016, the DMR published the New Draft Mining Charter which seeks to, among other
things, increase and maintain HDSA equity ownership in mining companies which would result in the dilution of existing Shareholders. Under the New Draft Mining Charter, current holders of mining rights will have a three year transitional period from the coming into effect of the New Draft Mining Charter to align themselves with the new ownership requirements. Where empowerment transactions have been concluded and empowerment partners have sold their shares and exited the structure, new empowerment transactions will need to be concluded for mining right holders to be compliant with the New Draft Mining Charter. Having first been introduced in the Amended Mining Charter, it is also proposed that HDSA entrepreneurs, communities and employees are brought into the ownership structure and all hold a mining equity stake of no less than 5% each. The New Draft Mining Charter was open for public comment for a thirty day period, and the DMR is currently in the process of reviewing the submissions that it received. The DMR’s review is likely to result in the New Draft Mining Charter undergoing revisions in the coming months. From 18 July 2016 to 31 October 2016, the DMR invited all those who made written submissions on the New Draft Mining Charter to make presentations and thereafter conclude the public commentary process. Sibanye presented on 18 July 2016.
The Mineral and Petroleum Resources Development Amendment Act, 2008 (the MPRDAA) was assented to by the President on 19 April 2009 and was to come into effect on a date to be proclaimed by the President. From 19 April 2009 to 31 May 2013, the fate of the MPRDAA was unclear and it was thought that the government would not proceed with the MPRDAA. On 31 May 2013, it was published in the government gazette that the MPRDAA would come into effect 7 June 2013. This proclamation was amended by a further proclamation dated 6 June 2013 such that only certain sections of the MPRDAA took effect as of 7 June 2013. Because Sibanye is already the holder of mining rights in respect of its mines, the amendments introduced by the MPRDAA have limited impact on the current regulation of its operations.
In December 2012, the first draft of the MPRDB was published for comment. While the stated purpose of the MPRDB is, among other things, to remove ambiguities and enhance sanctions, the MPRDB has been criticised by stakeholders in the mining industry. Comments on the MPRDB were submitted and a second draft, known as the Mineral and Petroleum Resources Development Amendment Bill B15-2013 (MPRDB 2013) was published on 31 May 2013. A further revised version of the MPRDB 2013, the Mineral and Petroleum Resources Development Amendment Bill B15B-2013 (the Revised MPRDB 2013) was approved by the National Assembly of Parliament on 12 March 2014 and by the National Council of Provinces on 27 March 2014. The President must now assent to the Revised MPRDB 2013 if he finds it to be in accordance with the Constitution of South Africa. If the President assents to the Revised MPRDB 2013, it will become an Act of Parliament and will come into effect on a date to be proclaimed by the President. It is unclear whether the President will assent to the Revised MPRDB in 2013 in its current form or whether the Bill will be subject to further amendment. At the investing in Africa Mining Indaba conference held in February 2016, the Minister of Mineral Resources indicated that the MPRDB would be finalised in the first half of 2016.
THE BBBEE ACT AND THE BBBEE AMENDMENT ACT
The BBBEE Act established a national policy on broad-based black economic empowerment with the objective of increasing the participation of HDSAs in the economy. The BBBEE Act provides for various measures to promote black economic empowerment, including empowering the Minister of Trade and Industry to issue the BBBEE Codes of Good Practice (BBBEE Codes), with which organs of state and public entities and parties interacting with them or obtaining rights and licenses from them would be required to comply. There has been some debate as to whether or to what extent the mining industry was subject to the BBBEE Act and the policies and codes provided for thereunder. On 24 October 2014, the BBBEE Amendment Act, No. 46 of 2013 was brought into operation. The BBBEE Amendment Act inserted a new provision in the BBBEE Act, whereby the BBBEE Act would trump the provisions of any other law in South Africa which conflicts with the provisions of the BBBEE Act, provided such conflicting law was in force immediately prior to the effective date of the BBBEE Amendment Act. The BBBEE Amendment Act also stipulates that this provision would only be effective one year after the BBBEE Amendment Act is brought into effect. This provision came into effect on 24 October 2015 and, on 27 October 2015, the Minister for Trade and Industry published a government gazette notice declaring an exemption in favour of the DMR from applying the requirements contained in section 10(1) of the BBBEE Act for a period of 12 months. The exemption can be read as confirmation that the Department of Trade and Industry sees the BBBEE codes as “applicable” to the Mining Industry after the exemption was lifted on 27 October 2016. In any event, the DMR is likely to continue implementing the Mining Charter and it is unlikely that the DMR will begin applying the BBBEE Act and BBBEE codes in administering the MPRDA.
This raises the question of whether the BBBEE Act and the BBBEE Codes may overrule the Mining Charter in the future. There is no clarity on this point at this stage. The revised Broad-Based Black Economic Empowerment Codes of Good Practice (the Revised BEE Codes) became available for voluntary use on 11 October 2013 and became effective on 1 May 2015 but are still under consideration and are not yet in force. Entities may elect to be measured under the Revised BEE Codes immediately. Both the BBBEE Amendment Act and the Revised BEE Codes expressly stipulate that where an economic sector in South Africa has a Sector Code in place for BEE purposes, companies in that sector must comply with the Sector Code. For purposes of the BBBEE Act, the Mining Charter is not a Sector Code. It is not clear at this stage how the Mining Charter and Code relate to each other. The government may designate the Mining Charter as a Sector Code, in which case it will be under the auspices of the BBBEE Act. On the other hand, the Mining Charter may remain a stand-alone document under the auspices of the MPRDA and may be subject to the trumping provision discussed above. This uncertainty may be resolved through either government clarification or judicial attention. On 17 February 2016, the Minister of Trade and Industry published a gazette notice which repealed and confirmed the validity of a number of Sector Codes. The omission of the Mining Charter from the notice can be interpreted as confirmation that the Mining Charter is not contemplated as a Sector Code. This supports the interpretation BBBEE Act did not intend to trump the Mining Charter. While it remains to be seen how this will be interpreted, it appears that the BBBEE Act and the BEE Codes will not overrule the Mining Charter in the future.
THE ROYALTY ACT
The Mineral and Petroleum Resources Royalty Act, No. 28 of 2008 (the Royalty Act) imposes a royalty on refined and unrefined minerals payable to the South African government.
The royalty in respect of refined minerals (which include gold and platinum) is calculated by dividing earnings before interest and taxes (EBIT) by the product of 12.5 times gross revenue calculated as a percentage, plus an additional 0.5%. EBIT refers to
taxable mining income (with certain exceptions such as no deduction for interest payable and foreign exchange losses) before assessed losses but after capital expenditure. A maximum royalty of 5% of revenue has been introduced for refined minerals.
Sibanye currently pays a royalty based on the refined minerals royalty calculation as applied to its gross revenue.
The South African President has appointed the Davis Tax Review Committee to look into and review the current mining tax regime. The Committee’s First Interim Report on Mining, which was relapsed for public comment on 13 August 2015, proposed no changes to the royalty regime but recommended the discontinuation of the upfront capital expenditure write-off regime in favour of an accelerated capital expenditure depreciation regime. In addition, the report recommended retaining the so called “gold formula” for existing gold mines only, as new gold mines would be unlikely to be established in circumstances where profits are marginal or where gold mines would conduct mining of the type intended to be encouraged by the formula. The Committee also recommended to phase out the additional capital allowances available to gold mines in order to bring the gold mining corporate income tax regime in line with the tax system applicable to all taxpayers. A further report is awaited from the committee after receiving public comment.
Exchange Controls
South African law provides for Exchange Control Regulations which, among other things, restrict the outward flow of capital from the CMA. The Exchange Control Regulations, which are administered by the Financial Surveillance Department of the SARB, are applied throughout the CMA and regulate international transactions involving South African residents, including companies. The South African government has committed itself to gradually relaxing exchange controls and various relaxations have occurred in recent years.
SARB approval is required for Sibanye and its subsidiaries to receive and/or repay loans to non-residents of the CMA. Funds raised outside of the CMA by any future Sibanye non-South African resident subsidiaries (whether through debt or equity) can be used for overseas expansion, subject to any conditions imposed by the SARB. Sibanye and its South African subsidiaries would, however, require SARB approval in order to provide guarantees for the obligations of any of Sibanye’s subsidiaries with regard to funds obtained from non-residents of the CMA. Debt raised outside the CMA by any future Sibanye non-South African subsidiaries must be repaid or serviced by those foreign subsidiaries. Absent SARB approval, income earned in South Africa by Sibanye and its South African subsidiaries cannot be used to repay or service such foreign debts. Unless specific SARB approval has been obtained, income earned by any future Sibanye foreign subsidiaries cannot be used to finance the operations of another foreign subsidiary.
Transfers of funds from South Africa for the purchase of shares in offshore entities or for the creation or expansion of business ventures offshore require exchange control approval. However, if the investment is a new outward foreign direct investment where the total cost does not exceed R500 million per company per calendar year, the investment application may, without specific SARB approval, be processed by an authorised dealer, subject to all existing criteria and reporting obligations.
Sibanye must obtain approval from the SARB regarding any capital-raising involving a currency other than the Rand. In connection with its approval, it is possible that the SARB may impose conditions on Sibanye’s use of the proceeds of any such capital-raising, such as limits on Sibanye’s ability to retain the proceeds of the capital-raising outside South Africa or requirements that Sibanye seeks further SARB approval prior to applying any such funds to a specific use.
FINANCIAL INFORMATION
Dividend Policy and Dividend Distributions
Sibanye may make distributions from time to time, provided that any such distribution is pursuant to an existing legal obligation of Sibanye or a court order or has been authorised by resolution of the Board (save in the case of a pro rata distribution to all shareholders (except one which results in shareholders holding shares in an unlisted entity which requires the sanction of an ordinary resolution), cash dividends paid out of retained income, capitalisation issues or scrip dividends incorporating an election to receive either capitalisation shares or cash), and provided further that:
| · | | dividends be paid to shareholders registered as at a date subsequent to the date of declaration or date of confirmation of the dividend, whichever is the later; |
| · | | it reasonably appears that Sibanye will satisfy the ‘solvency and liquidity’ test as set out in the Companies Act immediately after completing the proposed distribution; and |
| · | | no obligation is imposed by Sibanye, if it is a distribution of capital, that such capital be used to subscribe for shares in Sibanye. |
Sibanye must complete any such distribution fully within 120 business days after the Board acknowledges that the ‘solvency and liquidity’ test has been applied as aforesaid, failing which it must again comply with the above.
Sibanye must hold all unclaimed distributions due to the shareholders of Sibanye in trust subject to the laws of prescription, and accordingly may release any distributions once the prescriptive period in relation to those dividends has expired.
All dividends paid by Sibanye prior to the Spin-off were historically paid to Gold Fields. After the Spin-off, the Board adopted a new dividend policy to return at least 25% to 35% of normalised earnings. Sibanye defines normalised earnings as profit for the year excluding gains and losses on foreign exchange, financial instruments, non-recurring items and share of result of associates after royalties and taxation.
A final dividend in respect of the six months ended 31 December 2016 of 60 Rand cents per share, subject to a 20% withholding tax, was declared resulting in a total dividend of 145 Rand cents per share for fiscal 2016.
Under South African law, Sibanye will be entitled to pay a dividend or similar payment to its shareholders only if it meets the solvency and liquidity tests set out in the Companies Act, and we are permitted to do so in terms of the Memorandum of Incorporation.
There is no arrangement under which future dividends are waived or agreed to be waived.
THE LISTING
As of 4 April 2017, the issued share capital of Sibanye consisted of 930,056,784 ordinary shares.
Listing Details
As of 31 December 2016, 280 record holders of Sibanye’s ordinary shares, holding an aggregate of 323,263,787 ordinary shares (35%), were listed as having addresses in the United States.
JSE Trading History
The tables below show the high and low closing prices in Rand and the average daily volume of trading activity on the JSE for Sibanye’s ordinary shares for the periods indicated.
The following table sets out ordinary share trading information on a yearly basis for the last four fiscal years since the shares began trading on 11 February 2013, as reported by I-Net Bridge, a South African financial information service:
| | Ordinary share price | | Average daily trading volume (number of ordinary shares) |
Year ended | | High (R/share) | | Low (R/share) | |
31 December 2013 | | 16.30 | | 6.73 | | 4,754,958 |
31 December 2014 | | 29.52 | | 12.34 | | 2,868,842 |
31 December 2015 | | 32.26 | | 13.66 | | 3,024,491 |
31 December 2016 | | 70.23 | | 21.98 | | 6,165,133 |
through 4 April 2017 | | 32.79 | | 24.01 | | 6,128,253 |
The following table sets out ordinary share trading information on a quarterly basis for the periods indicated in Sibanye’s two most recent full financial years, as reported by I-Net Bridge:
| | Ordinary share price | | Average daily trading
volume (number of ordinary shares) |
Quarter ended | | High (R/share) | | Low (R/share) | |
31 March 2015 | | 32.26 | | 21.75 | | 2,674,968 |
30 June 2015 | | 28.87 | | 18.75 | | 2,668,716 |
30 September 2015 | | 20.78 | | 13.66 | | 3,200,103 |
31 December 2015 | | 25.06 | | 16.46 | | 3,526,479 |
31 March 2016 | | 61.20 | | 24.57 | | 8,106,968 |
30 June 2016 | | 60.37 | | 43.46 | | 4,156,655 |
30 September 2016 | | 70.23 | | 46.48 | | 4,952,352 |
31 December 2016 | | 47.83 | | 21.98 | | 7,514,997 |
31 March 2017 | | 31.15 | | 24.01 | | 6,089,544 |
The following table sets out ordinary share trading information on a monthly basis for each of the last six months, as reported by I-Net Bridge:
| | Ordinary share price | | Average daily trading value (number of ordinary shares) |
Month ended | | High (R/share) | | Low (R/share) | |
31 October 2016 | | 47.83 | | 36.75 | | 6,810,356 |
30 November 2016 | | 39.49 | | 29.13 | | 6,240,155 |
31 December 2016 | | 29.35 | | 21.98 | | 9,769,944 |
31 January 2017 | | 30.55 | | 25.59 | | 5,720,369 |
28 February 2017 | | 31.15 | | 26.31 | | 6,781,484 |
31 March 2017 | | 30.16 | | 24.01 | | 5,812,904 |
On 4 April 2017, the closing price of the ordinary shares on the JSE was R28.70.
NYSE Trading History
The tables below show the high and low closing prices in US dollars and the average daily volume of trading activity on the NYSE for the periods indicated.
The following table sets out ordinary share trading information on a yearly basis for the last four fiscal years since the shares began trading on 11 February 2013, as reported by Bloomberg:
| | | | | | |
| | ADS price | | |
Year ended | | High ($/ADS) | | Low ($/ADS) | | Average daily trading volume (number of ADSs) |
31 December 2013 | | 7.47 | | 2.65 | | 887,984 |
31 December 2014 | | 11.09 | | 4.69 | | 844,925 |
31 December 2015 | | 11.35 | | 4.21 | | 1,122,803 |
31 December 2016 | | 20.78 | | 6.16 | | 1,666,327 |
through 4 April 2017 | | 20.78 | | 6.41 | | 1,740,075 |
The following table sets out ADS trading information on a quarterly basis for the periods indicated, as reported by Bloomberg:
| | $/ADS) | | ) | | ) |
| | ADS price | | |
Year ended | | High ($/ADS) | | Low ($/ADS) | | Average daily trading volume (number of ADSs) |
| | | | | | |
31 March 2015 | | 11.35 | | 7.52 | | 1,162,621 |
30 June 2015 | | 9.68 | | 6.20 | | 852,273 |
30 September 2015 | | 6.80 | | 4.21 | | 1,339,318 |
31 December 2015 | | 7.27 | | 4.60 | | 1,134,637 |
31 March 2016 | | 15.71 | | 6.16 | | 1,843,201 |
30 June 2016 | | 16.35 | | 11.47 | | 1,556,359 |
30 September 2016 | | 20.78 | | 13.64 | | 1,380,049 |
31 December 2016 | | 13.94 | | 6.41 | | 1,897,603 |
31 March 2017 | | 9.40 | | 7.45 | | 2,133,038 |
The following table sets out ADS trading information on a monthly basis for each of the last six months, as reported by Bloomberg:
| | $/ADS) | | ) | | ) |
| | ADS price | | |
Year ended | | High ($/ADS) | | Low ($/ADS) | | Average daily trading volume (number of ADSs) |
31 October 2016 | | 13.94 | | 10.75 | | 1,388,379 |
30 November 2016 | | 11.68 | | 8.31 | | 1,794,128 |
31 December 2016 | | 8.47 | | 6.41 | | 2,510,303 |
31 January 2017 | | 9.06 | | 7.59 | | 2,078,349 |
28 February 2017 | | 9.27 | | 7.91 | | 2,128,898 |
31 March 2017 | | 9.40 | | 7.45 | | 2,184,014 |
On 4 April 2017, the closing price of Sibanye’s ADSs quoted on the NYSE was US$9.70.
ADDITIONAL INFORMATION
Memorandum of Incorporation
A summary of Sibanye’s Memorandum of Incorporation can be found in the 2012 Annual Report on Form 20-F filed on 26 April 2013.
Material Contracts
The following are material contracts not entered into in the ordinary course of business that were entered into, novated or amended by Sibanye in the period under review.
R6.0 BILLION REVOLVING CREDIT FACILITY
See “Annual Financial Report—Annual financial statements—Notes to the consolidated financial statements—Note 23.1: R6.0 Billion Revolving Credit Facility”.
STILLWATER BRIDGE FACILITIES
See “Annual Financial Report—Annual financial statements—Notes to the consolidated financial statements—Note 23.6: Acquisition Bridge Facilities—Stillwater Bridge Facility”.
STILLWATER ACQUISITION
On 9 December 2016, Sibanye and Stillwater entered into an Agreement and Plan of Merger (Merger Agreement) with Thor US Holdco Inc. (US Holdco) and Thor Mergco Inc., an indirect wholly owned subsidiary of Sibanye (Merger Sub).
The Merger Agreement provides that, among other things and subject to the terms and conditions therein, (1) Merger Sub will be merged with and into Stillwater and (2) at the effective time of the merger, each outstanding share of common stock of Stillwater, par value US$0.01 per share (Stillwater Shares) (other than Stillwater Shares owned by Stillwater, Sibanye or their respective subsidiaries or Stillwater Shares with respect to which appraisal rights are validly exercised and not lost in accordance with Delaware law) will be converted into the right to receive US$18.00 per share in cash without interest.
The closing of the merger is subject to (1) the adoption of the Merger Agreement by the holders of a majority of the outstanding Stillwater Shares, (2) the approval of the merger by the holders of a majority of Sibanye’s shares present and voting, (3) the approval of the related issuance of shares by Sibanye in a rights offering by the holders of at least 75% of Sibanye’s shares present and voting, (4) Committee on Foreign Investment in the United States clearance and (5) other customary conditions. The closing of the merger is not subject to a financing condition.
The Merger Agreement also contains termination rights, including that either Stillwater or Sibanye may terminate the Merger Agreement if the merger is not completed on or prior to June 30, 2017, subject to extension in certain circumstances. Sibanye is required to pay Stillwater a break-up fee of US$33.0 million plus reimbursement of expenses up to US$10.0 million in the event that the merger agreement is terminated in certain circumstances, including the failure to obtain Sibanye shareholder or certain other approvals. Stillwater is required to pay Sibanye a break-up fee of US$16.5 million plus reimbursement of expenses up to US$10 million in the event the merger agreement is terminated in certain circumstances, including if Stillwater’s Board of Directors changes its recommendation in favor of the merger and in certain other events.
The parties expect the closing to occur in the first half of 2017.
DEPOSIT AGREEMENT
In connection with the establishment of an ADR facility in respect of Sibanye’s shares, Sibanye entered into a deposit agreement with BNYM in respect of Sibanye’s shares among Sibanye, BNYM and all owners and holders from time to time of ADRs issued thereunder (the Deposit Agreement).
This summary is subject to and qualified in its entirety by reference to the Deposit Agreement, including the form of ADRs attached thereto. Terms used in this section and not otherwise defined will have the meanings set forth in the Deposit Agreement. Copies of the Deposit Agreement are available for inspection at the Corporate Trust Office of the Depositary, located at 101 Barclay Street, New York, New York 10286. BNYM’s principal executive office is located at One Wall Street, New York, New York 10286.
AMERICAN DEPOSITARY SHARES
Each ADS represents four shares (or a right to receive four shares) deposited with the principal Johannesburg offices of either of FirstRand Bank, Societe Generale (ZA) or Standard Bank of South Africa, as custodians for the Depositary. Each ADS also represents any other securities, cash or other property which may be held by BNYM under the Deposit Agreement.
You may hold ADSs either (A) directly (i) by having an American Depositary Receipt, also referred to as an ADR, which is a certificate evidencing a specific number of ADSs, registered in your name, or (ii) by having ADSs registered in your name in the Direct Registration System (or DRS) or (B) indirectly by holding a security entitlement in ADSs through your broker or other financial institution. If you hold ADSs directly, you are a registered ADS holder, also referred to as an ADS holder. This description assumes you are an ADS holder. If you hold the ADSs indirectly, you must rely on the procedures of your broker or other financial institution to assert the rights of ADS holders described in this section. You should consult with your broker or financial institution to find out what those procedures are.
The DRS is a system administered by The Depository Trust Company (or the DTC) pursuant to which the Depositary may register the ownership of uncertificated ADSs, which ownership shall be evidenced by periodic statements sent by the Depositary to the registered holders of uncertificated ADSs.
South African law governs shareholder rights. BNYM will be the holder of the shares underlying your ADSs. As a registered holder of ADSs, you will have ADS holder rights. A deposit agreement among Sibanye, BNYM and you, as an ADS holder, and all other persons indirectly holding ADSs sets out ADS holder rights, as well as the rights and obligations of the Depositary. New York law governs the Deposit Agreement and the ADSs.
The following is a summary of the material provisions of the Deposit Agreement. For more complete information, you should read the entire Deposit Agreement and the form of ADR.
SHARE DIVIDENDS AND OTHER DISTRIBUTIONS
HOW WILL YOU RECEIVE DIVIDENDS AND OTHER DISTRIBUTIONS ON THE ORDINARY SHARES?
BNYM will pay to you the cash dividends or other distributions it or the custodian receives on the ordinary shares or other deposited securities, after deducting its fees and expenses. You will receive these distributions in proportion to the number of ordinary shares your Sibanye ADRs represent.
Cash
BNYM will convert any cash dividend or other cash distribution Sibanye pays on the ordinary shares other than any dividend or distribution paid in US dollars, into US dollars. If that is not possible or if any government approval is needed and cannot be obtained, the Deposit Agreement allows BNYM to distribute the foreign currency only to those ADR holders to whom it is possible to do so. It will hold the foreign currency it cannot convert for the account of the ADR holders who have not been paid. It will not invest the foreign currency and it will not be liable for any interest.
Before making a distribution, BNYM will deduct any withholding taxes that must be paid. It will distribute only whole US dollars and US cents and will round fractional amounts to the nearest whole cent. If the exchange rates fluctuate during a time when BNYM cannot convert the foreign currency, you may lose some or all of the value of the distribution.
Shares
BNYM may, and will if Sibanye so requests, distribute new ADRs representing any ordinary shares Sibanye distributes as a dividend or capitalisation issue. BNYM will only distribute whole ADRs. It will sell ordinary shares which would require it to issue a fractional ADR and distribute the net proceeds to the holders entitled to those ordinary shares. If BNYM does not distribute additional cash or ADRs, each ADR will also represent the new ordinary shares. BNYM may sell a portion of the distributed shares sufficient to pay its fees and expenses in connection with the distribution.
Rights to purchase additional ordinary shares
If Sibanye offers holders of securities any rights, including rights to subscribe for additional ordinary shares, BNYM may make these rights available to you. Sibanye must first instruct BNYM to do so and furnish it with satisfactory evidence that it is legal to do so. If Sibanye does not furnish this evidence and/or give these instructions, and BNYM determines that it is practical to sell the rights, BNYM may sell the rights and distribute the proceeds to holders’ accounts. BNYM will allow rights that are not distributed or sold to lapse. In that case, you will receive no value for them.
If BNYM makes rights available to you, upon instruction from you it will exercise the rights and purchase the ordinary shares on your behalf. BNYM will then deposit the ordinary shares and deliver ADSs to the persons entitled to them. It will only exercise rights if you pay BNYM the exercise price and any other charges the rights require you to pay.
US securities laws may restrict the sale, deposit, cancellation and transfer of the ADSs issued after exercise of rights. For example, you may not be able to trade these ADSs freely in the United States. In this case, BNYM may deliver the ADRs under a separate restricted deposit agreement, which will contain the same provisions as the Deposit Agreement except for changes needed to put the necessary restrictions in place. BNYM will not offer you rights unless those rights and the securities to which the rights relate are either exempt from registration or have been registered under the Securities Act of 1933 with respect to a distribution to all ADR holders.
Other Distributions
BNYM will send to you anything else Sibanye distributes on deposited securities by any means BNYM thinks is legal, fair and practical. If it cannot make the distribution in that way, BNYM may decide to sell what Sibanye distributed-for example by public or private sale-and distribute the net proceeds, in the same way as it does with cash, or it may decide to hold what Sibanye distributed, in which case ADSs will also represent the newly distributed property. BNYM may sell a portion of the distributed securities or property sufficient to pay its fees and expenses in connection with the distribution.
BNYM is not responsible if it decides that it is unlawful or impractical to make a distribution available to any ADR holder. Sibanye will have no obligation to take any other action to permit the distribution of ADRs, shares, rights or anything else to ADR holders. This means that you may not receive the distribution Sibanye makes on its ordinary shares or any value for them if it is illegal or impractical for Sibanye to make them available to you.
DEPOSIT, WITHDRAWAL AND CANCELLATION
HOW ARE ADRS ISSUED?
BNYM will deliver the ADRs that you are entitled to receive in the offer against deposit of the underlying ordinary shares. BNYM will deliver additional ADRs if you or your broker deposit ordinary shares with the custodian. You must also deliver evidence satisfactory to BNYM of any necessary approvals of the governmental agency in South Africa, if any, which is responsible for regulating currency exchange at that time. If required by BNYM, you must in addition deliver an agreement transferring your rights as a shareholder to receive dividends or other property. Upon payment of its fees and of any taxes or charges, BNYM will register the appropriate number of ADRs in the names you request and will deliver the ADRs to the persons you request.
How do ADR holders cancel ADRs and obtain ordinary shares?
You may submit a written request to withdraw ordinary shares and turn in your ADRs evidencing your ADSs at the Corporate Trust Office of BNYM. Upon payment of its fees and of any taxes or charges, such as stamp taxes or stock transfer taxes, BNYM will deliver the deposited securities underlying the ADSs to an account designated by you at the office of the custodian. At your request, risk and expense, BNYM may deliver at its Corporate Trust Office any dividends or distributions with respect to the deposited securities represented by the ADSs, or any proceeds from the sale of any dividends, distributions or rights, which may be held by BNYM.
How do ADS holders interchange between certificated ADSs and uncertificated ADSs?
You may surrender your ADR to the Depositary for the purpose of exchanging your ADR for uncertificated ADSs. The Depositary will cancel that ADR and will send to the ADS holder a statement confirming that the ADS holder is the registered holder of uncertificated ADSs. Alternatively, upon receipt by the Depositary of a proper instruction from a registered holder of uncertificated ADSs requesting the exchange of uncertificated ADSs for certificated ADSs, the Depositary will execute and deliver to the ADS holder an ADR evidencing those ADSs.
RECORD DATES
Whenever any distribution of cash or rights, change in the number of ordinary shares represented by ADRs or notice of a meeting of holders of ordinary shares or ADRs is made, BNYM will fix a record date for the determination of the owners entitled to receive the benefits, rights or notice.
VOTING RIGHTS
HOW DO YOU VOTE?
If you are an ADR holder on a record date fixed by BNYM, you may instruct BNYM how to exercise the voting rights of the ordinary shares represented by your ADRs. Otherwise, you will not be able to exercise your right to vote unless you withdraw the ordinary shares. However, you may not know about the meeting far enough in advance to withdraw the shares. If Sibanye asks for your instructions, BNYM will notify you of the upcoming meeting and arrange to deliver certain materials to you. The materials will: (1) include all information included with the meeting notice sent by Sibanye to BNYM; (2) explain how you may instruct BNYM to vote the ordinary shares or other deposited securities underlying your ADRs as you direct if you vote by mail or by proxy; and (3) include a voting instruction card and any other information required under South African law that Sibanye and BNYM will prepare. For instructions to be valid, BNYM must receive them on or before the date specified in the instructions. BNYM will try, to the extent practical, subject to applicable law and the provisions of the by-laws of Sibanye, to vote or have its agents vote the underlying shares as you instruct. BNYM will only vote, or attempt to vote, as you instruct. However, if we give notice to BNYM on or before the first date when we give notice, by publication or otherwise, of any meeting of holders of ordinary shares, and if BNYM does not receive your voting instructions, BNYM will give a proxy to vote your ordinary shares to a designated representative of Sibanye, unless Sibanye informs BNYM that: (1) it does not want the proxy issued; (2) substantial opposition exists; or (3) the matter materially and adversely affects the rights of holders of ordinary shares.
Sibanye cannot assure that you will receive the voting materials in time to ensure that you can instruct BNYM to vote your ordinary shares. In addition, BNYM and its agents are not responsible for failing to carry out voting instructions or for the manner of carrying out voting instructions. This means that you may not be able to exercise your right to vote and there may be nothing you can do if your ordinary shares are not voted as you requested.
INSPECTION OF TRANSFER BOOKS
BNYM will keep books for the registration and transfer of ADRs. These books will be open at all reasonable times for inspection by you, provided that you are inspecting the books for a purpose related to Sibanye or the Deposit Agreement or the ADRs.
FEES AND EXPENSES
BNYM, as Depositary, will charge any party depositing or withdrawing ordinary shares or any party surrendering ADRs or to whom ADRs are issued:
| | |
Persons depositing or withdrawing shares or ADS holders must pay | | For |
$5.00 (or less) per 100 Sibanye ADRs (or portion of 100 Sibanye ADRs) | | Issuance of Sibanye ADRs, including issuances resulting from a distribution of ordinary shares or rights or other property or cancellation of Sibanye ADRs for the purpose of withdrawal, including if the deposit agreement terminates |
$.05 (or less) per ADR (or portion thereof) | | Any cash distribution pursuant to the Deposit Agreement |
A fee equivalent to the fee that would be payable if securities distributed to you had been ordinary shares and those ordinary shares had been deposited for issuance of ADRs | | Distribution of securities distributed to holders of deposited securities which are distributed by BNYM to Sibanye’s ADR holders |
$.05 (or less) per ADRs per calendar year | | Depositary services |
Registration or transfer fees | | Transfer and registration of shares on Sibanye’s share register to or from the name of BNYM or its agent when you deposit or withdraw ordinary shares |
Expenses of BNYM | | Cable, telex and facsimile transmissions (when expressly provided in the deposit agreement) converting foreign currency to US dollars |
Taxes and other governmental charges BNYM or the custodian have to pay on any ADR or share underlying an ADR, for example, stock transfer taxes, stamp duty or withholding taxes | | As necessary |
Any charges incurred by BNYM or its agents for servicing the deposited securities | | As necessary |
The Depositary collects its fees for delivery and surrender of ADSs directly from investors depositing shares or surrendering ADSs for the purpose of withdrawal or from intermediaries acting for them. The Depositary collects fees for making distributions to investors by deducting those fees from the amounts distributed or by selling a portion of distributable property to pay the fees. The Depositary may collect its annual fee for depositary services by deduction from cash distributions or by directly billing investors or by charging the book-entry system accounts of participants acting for them. The Depositary may generally refuse to provide fee-attracting services until its fees for those services are paid.
From time to time, the Depositary may make payments to Sibanye to reimburse and/or share revenue from the fees collected from ADR holders, or waive fees and expenses for services provided, generally relating to costs and expenses arising out of establishment and maintenance of the ADR programme. In performing its duties under the Deposit Agreement, the Depositary may use brokers, dealers or other service providers that are affiliates of the Depositary and that may earn or share fees or commissions.
PAYMENT OF TAXES
You will be responsible for any taxes or other governmental charges payable on your ADRs or on the deposited securities underlying your ADRs. BNYM may deduct the amount of any taxes owed from any payments to you. It may also restrict or refuse the transfer of your Sibanye ADRs or restrict or refuse the withdrawal of your underlying deposited securities until you pay any taxes owed on your Sibanye ADRs or underlying securities. It may also sell deposited securities to pay any taxes owed.
You will remain liable if the proceeds of the sale are not enough to pay the taxes. If BNYM sells deposited securities, it will, if appropriate, reduce the number of Sibanye ADRs held by you to reflect the sale and pay to you any proceeds, or send to you any property, remaining after it has paid the taxes.
RECLASSIFICATIONS, RECAPITALISATIONS AND MERGERS
| | |
If Sibanye | | Then |
Reclassifies, splits up or consolidates any of the Sibanye ordinary shares | | |
Distributes securities on any of the Sibanye ordinary shares that are not distributed to you | | The cash, ordinary shares or other securities received by BNYM will become new deposited securities under the Deposit Agreement. Each Sibanye ADR will automatically represent the right to receive a proportional interest in the new deposited securities. |
Recapitalises, reorganises, merges, consolidates, sells its assets, or takes any similar action | | BNYM may, and will if Sibanye asks it to, deliver new Sibanye ADRs representing the new deposited securities or ask you to surrender your outstanding Sibanye ADRs in exchange for new Sibanye ADRs identifying the new deposited securities |
AMENDMENT AND TERMINATION
HOW MAY THE DEPOSIT AGREEMENT BE AMENDED?
Sibanye may agree with BNYM to amend the Deposit Agreement and the ADRs without your consent for any reason. If the amendment adds or increases fees or charges, except for taxes and governmental charges or prejudices an important right of Sibanye ADR holders, it will only become effective 30 days after BNYM notifies you of the amendment. At the time an amendment becomes effective, you are considered, by continuing to hold your ADRs, to agree to the amendment and to be bound by the agreement as amended. However, no amendment will impair your right to receive the deposited securities in exchange for your Sibanye ADRs.
HOW MAY THE DEPOSIT AGREEMENT BE TERMINATED?
BNYM will terminate the Deposit Agreement if Sibanye asks it to do so, in which case it must notify you at least 30 days before termination. BNYM may also terminate the agreement after notifying you if BNYM informs Sibanye that it would like to resign and Sibanye does not appoint a new depositary bank within 90 days.
If any Sibanye ADRs remain outstanding after termination, BNYM will stop registering the transfer of Sibanye ADRs, will stop distributing dividends to Sibanye ADR holders, and will not give any further notices or do anything else under the Deposit Agreement other than:
collect dividends and distributions on the deposited securities, sell rights and other property offered to holders of deposited securities; and deliver ordinary shares and other deposited securities upon cancellation of Sibanye’s ADRs. At any time after four months after termination of the Deposit Agreement, BNYM may sell any remaining deposited securities by public or private sale. After that, BNYM will hold the money it received on the sale, as well as any cash it is holding under the Deposit Agreement for the pro rata benefit of the Sibanye ADR holders that have not surrendered their Sibanye ADRs. It will not invest the money and has no liability for interest. BNYM’s only obligations will be to account for the money and cash. After termination, Sibanye’s only obligations will be with respect to indemnification of, and to pay specified amounts to, BNYM.
LIMITATIONS ON OBLIGATIONS AND LIABILITY
The Deposit Agreement expressly limits the obligations of Sibanye and BNYM. It also limits the liability of Sibanye and BNYM. Sibanye and BNYM:
are only obligated to take the actions specifically set forth in the Deposit Agreement without negligence or bad faith;
are not liable if either of them is prevented or delayed by law, any provision of the Sibanye by-laws or circumstances beyond their control from performing their obligations under the Deposit Agreement;
| · | | are not liable if either of them exercises or fails to exercise discretion permitted under the Deposit Agreement; |
| · | | have no obligation to become involved in a lawsuit or proceeding related to the ADRs or the Deposit Agreement on your behalf or on behalf of any other party; and |
| · | | may rely upon any advice of or information from any legal counsel, accountants, any person depositing ordinary shares, any Sibanye ADR holder or any other person whom they believe in good faith is competent to give them that advice or information. |
In the Deposit Agreement, Sibanye and BNYM agree to indemnify each other under specified circumstances.
REQUIREMENTS FOR DEPOSITARY ACTIONS
Before BNYM will deliver or register the transfer of a Sibanye ADR, make a distribution on a Sibanye ADR, or permit withdrawal of ordinary shares, BNYM may require:
| · | | production of satisfactory proof of the identity of the person presenting ordinary shares for deposit or Sibanye ADRs upon withdrawal, and of the genuineness of any signature; and |
| · | | compliance with regulations BNYM may establish, consistent with the Deposit Agreement, including presentation of transfer documents. |
BNYM may refuse to deliver, transfer, or register transfer of Sibanye ADRs generally when the transfer books of BNYM are closed or at any time if BNYM or Sibanye thinks it advisable to do so.
YOUR RIGHT TO RECEIVE THE ORDINARY SHARES UNDERLYING YOUR ADRS
You have the right to cancel your Sibanye ADRs and withdraw the underlying ordinary shares at any time, except:
| · | | due to temporary delays caused by BNYM or Sibanye closing its transfer books, the transfer of ordinary shares being blocked in connection with voting at a shareholders’ meeting, or Sibanye paying dividends; |
| · | | when you or other ADR holders seeking to withdraw ordinary shares owe money to pay fees, taxes and similar charges; or |
| · | | when it is necessary to prohibit withdrawals in order to comply with any laws or governmental regulations that apply to Sibanye ADRs or to the withdrawal of ordinary shares or other deposited securities. |
This right of withdrawal may not be limited by any provision of the Deposit Agreement.
PRE-RELEASE OF SIBANYE ADRS
In certain circumstances, subject to the provisions of the Deposit Agreement, BNYM may deliver Sibanye ADRs before deposit of the underlying ordinary shares. This is called a pre-release of Sibanye ADRs. BNYM may also deliver ordinary shares prior to the receipt and cancellation of pre-released Sibanye ADRs (even if those Sibanye ADRs are cancelled before the pre-release transaction has been closed out). A pre-release is closed out as soon as the underlying ordinary shares are delivered to BNYM.
BNYM may receive Sibanye ADRs instead of ordinary shares to close out a pre-release. BNYM may pre-release Sibanye ADRs only under the following conditions: (1) before or at the time of the pre-release, the person to whom the pre-release is being made must represent to BNYM in writing that it or its customer owns the ordinary shares or Sibanye ADRs to be deposited; (2) the pre-release must be fully collateralised with cash or collateral that BNYM considers appropriate; and (3) BNYM must be able to close out the pre-release on not more than five business days’ notice. The pre-release will be subject to whatever indemnities and credit regulations BNYM considers appropriate. In addition, BNYM will limit the number of Sibanye ADRs that may be outstanding at any time as a result of pre-release.
DIRECT REGISTRATION SYSTEM
In the Deposit Agreement, all parties to the Deposit Agreement acknowledge that the DRS and Profile Modification System (Profile) will apply to uncertificated ADSs upon acceptance thereof to DRS by DTC. DRS is the system administered by DTC pursuant to which the Depositary may register the ownership of uncertificated ADSs, which ownership shall be evidenced by periodic statements sent by the Depositary to the registered holders of uncertificated ADSs. Profile is a required feature of DRS which allows a DTC participant, claiming to act on behalf of a registered holder of ADSs, to direct the Depositary to register a transfer of those ADSs to DTC or its nominee and to deliver those ADSs to the DTC account of that DTC participant without receipt by the Depositary of prior authorisation from the ADS holder to register that transfer.
In connection with and in accordance with the arrangements and procedures relating to DRS/Profile, the parties to the Deposit Agreement understand that the Depositary will not verify, determine or otherwise ascertain that the DTC participant which is claiming to be acting on behalf of an ADS holder in requesting registration of transfer and delivery described in the paragraph above has the actual authority to act on behalf of the ADS holder (notwithstanding any requirements under the Uniform Commercial Code). In the Deposit Agreement, the parties agree that the Depositary’s reliance on and compliance with instructions received by the Depositary through the DRS/Profile System and in accordance with the Deposit Agreement, shall not constitute negligence or bad faith on the part of the Depositary.
SHAREHOLDER COMMUNICATIONS; INSPECTION OF REGISTER OF HOLDERS OF ADSS
The Depositary will make available for your inspection at its office all communications that it receives from us as a holder of deposited securities that Sibanye makes generally available to holders of deposited securities. The Depositary will send you copies of those communications if Sibanye asks it to. You have a right to inspect the register of holders of ADSs, but not for the purpose of contacting those holders about a matter unrelated to our business or the ADSs.
GOVERNING LAW
The Deposit Agreement is governed by the law of the State of New York.
SOUTH AFRICAN EXCHANGE CONTROL LIMITATIONS AFFECTING SECURITY HOLDERS
The discussion below relates to exchange controls in force as of the date of this annual report. These controls are subject to change at any time without notice. It is not possible to predict whether existing exchange controls will be abolished, continued or amended by the South African government in the future. Investors are urged to consult a professional adviser as to the exchange control implications of their particular investments.
Acquisitions of shares or assets of South African companies by non-South African purchasers solely for a cash consideration equal to the fair value of the shares or assets will generally be permitted by the SARB pursuant to South African Exchange Control Regulations. An acquisition of shares or assets of a South African company by a non-South African purchaser may be refused by the SARB in other circumstances, such as if the consideration for the acquisition is shares in a non-South African company or if the acquisition is financed by a loan from a South African lender. Denial of SARB approval for an acquisition of shares or assets of a South African company may result in the transaction not being able to be completed. Subject to this limitation, there are no restrictions on equity investments in South African companies and a foreign investor may invest freely in the ordinary shares and ADRs of Sibanye.
There are no exchange control restrictions on the remittance in full of dividends declared out of trading profits to non-residents of the CMA by Sibanye, provided the share certificates held by non-resident Sibanye shareholders have been endorsed with the words “non-resident”. The same endorsement, however, will not be applicable to ADRs of Sibanye held by non-resident shareholders.
Under South African Exchange Control Regulations, the ordinary shares and ADRs representing ordinary shares of Sibanye are freely transferable outside South Africa between persons who are not residents of the CMA, provided such transfer is reported to the SARB and, where new share certificates are issued, such certificates are endorsed with the words “non-resident”. The same endorsement, however, will not be applicable to ADRs of Sibanye held by non-resident shareholders. Additionally, where ordinary shares are sold on the JSE on behalf of shareholders of Sibanye who are not residents of the Common Monetary Area, the proceeds of such sales will be freely exchangeable into foreign currency and remittable to them. In such case no share certificates need to be endorsed as the shares on the JSE have been dematerialised.
TAXATION
CERTAIN SOUTH AFRICAN TAX CONSIDERATIONS
The discussion in this section sets out the material South African tax consequences of the purchase, ownership and disposition of Sibanye’s ordinary shares or ADSs under current South African law. Changes in the law may alter the tax treatment of Sibanye’s ordinary shares or ADSs, possibly on a retroactive basis.
The following summary is not a comprehensive description of all of the tax considerations that may be relevant to a decision to purchase, own or dispose of Sibanye’s ordinary shares or ADSs and does not cover tax consequences that depend upon your
particular tax circumstances. In particular, the following summary addresses tax consequences for holders of ordinary shares or ADSs who are not residents of, or who do not carry on business in, South Africa and who hold ordinary shares or ADSs as capital assets (that is, for investment purposes). For the purposes of the income tax treaty between South Africa and the United States and South African tax law, a United States resident that owns Sibanye ADSs will be treated as the owner of the Sibanye ordinary shares represented by such ADSs. Sibanye recommends that you consult your own tax adviser about the consequences of holding Sibanye’s ordinary shares or ADSs, as applicable, in your particular situation.
Withholding Tax on Dividends
It should be noted that the withholding tax on dividends declared by South African resident companies to non-resident shareholders or non-resident ADS holders was introduced with effect from 1 April 2012 and the percentage was increased on 22 February 2017 from 15% to 20%. Generally, under the terms of the reciprocal tax treaty entered into between South Africa and the United States (the Treaty) the withholding tax on dividends may be reduced to 5% of the gross amount of the dividends if the beneficial owner of the shares is a company holding directly at least 10% of the voting stock of the company paying the dividends and to 15% of the gross amount of the dividends in all other cases, provided certain requirements in terms of the Treaty are met. The reduction of the rate of the withholding tax on dividends in terms of the Treaty is subject to the beneficial owner of the dividends making certain declarations and undertakings and providing same to the company or regulated intermediary making payment of the dividend.
Income Tax and Capital Gains Tax
Non-resident holders of ordinary shares or ADSs should not be subject to income or capital gains tax in South Africa with respect to the disposal of those ordinary shares or ADSs unless those ordinary shares or ADSs are attributable to a permanent establishment of the non-resident in South Africa or where the non-resident holds 20% or more of the ordinary shares or ADSs of which 80% or more of the market value of the ordinary shares or ADSs are directly or indirectly derived from immovable property (including prospecting and/or mining rights) located in South Africa.
As Sibanye operates in the mining sector, it is highly probable that 80% or more of the market value of the ordinary shares or ADSs are directly or indirectly derived from immovable property located in South Africa. In the instances where non-resident shareholders hold 20% or more of the ordinary shares or ADSs and dispose of the same, the purchaser of the ordinary shares or ADSs will be obliged to withhold a percentage (between 5% and 10%, depending on the nature of the seller) of the purchase consideration for the ordinary shares or ADSs payable to the non-resident shareholders and pay such amount over to the South African Revenue Service within 14 days where the purchaser is a South African resident or within 28 days where the purchaser is a non-resident. The taxing right of the capital gain could, however, be awarded to the specific jurisdiction of the seller (and not South Africa) depending on the wording and application of the applicable Double Taxation Treaty.
Securities Transfer Tax
No Securities Transfer Tax (STT) is payable in South Africa with respect to the issue of a security.
STT is charged at a rate of 0.25% on the taxable amount of the transfer of every security issued by a company or a close corporation incorporated in South Africa, or a company incorporated outside South Africa but listed on an exchange in South Africa, subject to certain exemptions.
The word “transfer” is broadly defined and includes the transfer, sale, assignment or cession or disposal in any other manner of a security. The cancellation or redemption of a security is also regarded as a transfer unless the company is being liquidated. However, the transfer of a security that does not result in a change in beneficial ownership is not regarded as a transfer.
STT is levied on the taxable amount of a security. The taxable amount of a listed security is the greater of the consideration given for the security declared by the transferee or the closing price of that security. The taxable amount of an unlisted security is the greater of the consideration given for the acquisition of the security or the market value of an unlisted security. In the case of a transfer of a listed security, either the member, the participant or the person to whom the security is transferred is liable for the tax. The tax must be paid by the 14th day of the month following the transfer. The liability for tax with respect to the transfer of listed securities lies with the party facilitating the transfer or the recipient of the security.
Interest withholding tax
Interest withholding tax has been introduced into the South African tax regime with effect from 1 March 2015. Although not specifically applicable to non-resident shareholders or non-resident ADS holders, interest withholding tax will be levied at a rate of 15% on any interest paid for the benefit of any foreign person to the extent that the interest is regarded as being from a source within South Africa. There is, however, a specific exemption from interest withholding tax on any interest incurred on a listed debt (i.e. debt listed on a recognised exchange). Any interest withholding tax may further be reduced by the applicable Double Taxation Treaty.
Davis Tax Committee
The Davis Tax Committee has been established to review the current South African mining tax regime and to consider input from the industry on practical elements not currently taken into account by the mining tax legislation. No update has been provided on the status of the outcome of the Davis Tax Committee’s investigations. This does not currently affect any non-resident shareholders or non-resident ADS holders, although it could have an indirect effect in future depending on the findings of the Davis Tax Committee and the impact thereof on the mining tax regime in South Africa.
US FEDERAL INCOME TAX CONSIDERATIONS
The following discussion summarises the material US federal income tax consequences of the acquisition, ownership and disposition of ordinary shares and ADRs by a US Holder. As used herein, the term “US Holder” means a beneficial owner of ordinary shares or ADRs that is for US federal income tax purposes:
| · | | a citizen or resident of the United States; |
| · | | a corporation created or organised under the laws of the United States or any State within the United States; |
| · | | an estate the income of which is subject to US federal income tax without regard to its source; or |
| · | | a trust if a court within the United States is able to exercise primary supervision over the administration of the trust and one or more US persons have the authority to control all substantial decisions of the trust, or the trust has validly elected to be treated as a domestic trust for US federal income tax purposes. |
The US federal income tax treatment of a partner in an entity or arrangement treated as a partnership for US federal income tax purposes that holds ordinary shares or ADRs will depend upon the status of the partner and the activities of the partnership. If you are an entity or arrangement treated as a partnership for US federal income tax purposes, you should consult your tax adviser concerning the US federal income tax consequences to you and your partners of the acquisition, ownership and disposition of ordinary shares or ADRs by you.
This summary only applies to US Holders that hold ordinary shares or ADRs as capital assets. This summary is based upon:
| · | | the current federal income tax laws of the United States, including the Internal Revenue Code of 1986, as amended (the Code), its legislative history, and existing and proposed regulations promulgated thereunder; |
| · | | current US Internal Revenue Service (the IRS) practice and applicable US court decisions; and |
| · | | the income tax treaty between the United States and South Africa (the Treaty) |
| · | | all as of the date hereof and all subject to change at any time, possibly with retroactive effect. |
This summary assumes that the obligations of the Depositary under the Deposit Agreement and any related agreements will be performed in accordance with their terms.
This summary is of a general nature and does not address all US federal income tax consequences that may be relevant to you in light of your particular situation. For example, this summary does not apply to:
| · | | investors that own (directly, indirectly, or by attribution) 5% or more of Sibanye’s stock (by vote or value); |
| · | | investors liable for the alternative minimum tax or the net investment income tax; |
| · | | individual retirement accounts and other tax-deferred accounts; |
| · | | tax-exempt organisations; |
| · | | dealers in securities or currencies; |
| · | | investors that hold ordinary shares or ADRs as part of straddles, hedging transactions or conversion transactions for US federal income tax purposes; |
| · | | persons that have ceased to be US citizens or lawful permanent residents of the United States; |
| · | | investors that hold ordinary shares or ADRs in connection with a trade or business conducted outside the United States; |
| · | | US citizens or lawful permanent residents living abroad; or |
| · | | investors whose functional currency is not the US dollar. |
Sibanye does not believe that it should be treated as, and does not expect to become, a passive foreign investment company (PFIC) for US federal income tax purposes, but Sibanye’s possible status as a PFIC must be determined annually and therefore may be subject to change. If Sibanye were to be treated as a PFIC, US Holders of ordinary shares or ADRs would be required (i) to pay a special US addition to tax on certain distributions and gains on sale and (ii) to pay tax on any gain from the sale of ordinary shares or ADRs at ordinary income (rather than capital gains) rates in addition to paying the special addition to tax on this gain. Additionally, dividends paid by Sibanye would not be eligible for the reduced rate of tax described below under “Taxation of Dividends”. The remainder of this discussion assumes that Sibanye is not a PFIC for US federal income tax purposes. You should consult your own tax advisers regarding the potential application of the PFIC regime.
The summary of US federal income tax consequences set out below is for general information only. You are urged to consult your tax advisers as to the particular tax consequences to you of acquiring, owning and disposing of the ordinary shares or ADRs, including your eligibility for the benefits of the Treaty and the applicability and effect of state, local, non-US and other tax laws and possible changes in tax law.
US HOLDERS OF ADRS
For US federal income tax purposes, a US Holder of ADRs generally will be treated as the owner of the corresponding number of underlying ordinary shares held by the Depositary for the ADRs, and references to ordinary shares in the following discussion refer also to ADRs representing the ordinary shares.
Deposits and withdrawals of ordinary shares by US Holders in exchange for ADRs will not result in the realisation of gain or loss for US federal income tax purposes. Your tax basis in withdrawn ordinary shares will be the same as your tax basis in the ADRs surrendered, and your holding period for the ordinary shares will include the holding period of the ADRs.
TAXATION OF DIVIDENDS
Distributions paid out of Sibanye’s current or accumulated earnings and profits (as determined for US federal income tax purposes), before reduction for any South African withholding tax paid by Sibanye with respect thereto, will generally be taxable to you as dividend income, and will not be eligible for the dividends received deduction allowed to corporations. Distributions that exceed Sibanye’s current and accumulated earnings and profits will be treated as a non-taxable return of capital to the extent of your basis in the ordinary shares and thereafter as capital gain. However, we do not maintain calculations of our earnings and profits in accordance with US federal income tax accounting principles. You should therefore assume that any distribution by us with respect to the shares will be reported as ordinary dividend income. You should consult your own tax advisers with respect to the appropriate US federal income tax treatment of any distribution received from us.
Dividends paid by Sibanye generally will be taxable to non-corporate US Holders at the reduced rate normally applicable to long-term capital gains, provided that either (i) Sibanye qualifies for the benefits of the Treaty, or (ii) with respect to dividends paid on the ADRs, the ADRs are considered to be “readily tradable” on the NYSE. You will be eligible for this reduced rate only if you are an individual, and have held the ordinary shares or ADRs for more than 60 days during the 121‑day period beginning 60 days before the ex-dividend date.
For US federal income tax purposes, the amount of any dividend paid in Rand will be included in income in a US dollar amount calculated by reference to the exchange rate in effect on the date the dividends are received by you or the depositary (in the case of ADRs), regardless of whether they are converted into US dollars at that time. If you or the Depositary, as the case may be, convert dividends received in Rand into US dollars on the day they are received, you generally will not be required to recognise foreign currency gain or loss in respect of this dividend income.
EFFECT OF SOUTH AFRICAN WITHHOLDING TAXES
As discussed in “—Certain South African Tax Considerations—Withholding Tax on Dividends”, under current law, South Africa imposes a withholding tax of 20% on dividends paid by Sibanye. A US Holder will generally be entitled, subject to certain limitations, to a foreign tax credit against its US federal income tax liability, or a deduction in computing its US federal taxable income, for South African income taxes withheld by Sibanye.
US Holders that receive payments subject to this withholding tax will be treated, for US federal income tax purposes, as having received the amount of South African taxes withheld by Sibanye, and as then having paid over the withheld taxes to the South African taxing authorities. As a result of this rule, the amount of dividend income included in gross income for US federal income tax purposes by a US Holder with respect to a payment of dividends may be greater than the amount of cash actually received (or receivable) by the US Holder from Sibanye with respect to the payment.
For purposes of the foreign tax credit limitation, foreign source income is classified in one of two “baskets”, and the credit for foreign taxes on income in any basket is limited to US federal income tax allocable to that income. Dividends paid by Sibanye generally will constitute foreign source income in the “passive income” basket.
The rules governing foreign tax credits are complex. You should consult your tax adviser concerning the foreign tax credit implications of the payment of South African withholding taxes.
TAXATION OF A SALE OR OTHER DISPOSITION
Your tax basis in an ordinary share or ADR will generally be its US dollar cost. The US dollar cost of an ordinary share purchased with foreign currency will generally be the US dollar value of the purchase price on the date of purchase or, in the case of ordinary shares traded on an established securities market, as defined in the applicable Treasury Regulations, that are purchased by a cash basis taxpayer (or an accrual basis taxpayer that so elects), on the settlement date for the purchase. Such an election by an accrual basis taxpayer must be applied consistently from year to year and cannot be revoked without the consent of the IRS.
Upon a sale or other disposition of ordinary shares or ADRs, other than an exchange of ADRs for ordinary shares and vice versa, you will generally recognise capital gain or loss for US federal income tax purposes equal to the difference between the amount realised and your adjusted tax basis in the ordinary shares or ADRs. This capital gain or loss will be long-term capital gain or loss if your holding period in the ordinary shares or ADRs exceeds one year. However, regardless of your actual holding period, any loss may be treated as long-term capital loss to the extent you receive a dividend that qualifies for the reduced rate described above under “Taxation of Dividends” and also exceeds 10% of your basis in the ordinary shares. The deductibility of capital losses is subject to significant limitations. Any gain or loss will generally be US source.
The amount realised on a sale or other taxable disposition of ordinary shares for an amount in foreign currency generally will be the US dollar value of such amount on the settlement date, in the case of a cash basis US Holder, or the trade date in the case of an accrual basis US Holder, of such sale or other taxable disposition. On the settlement date, an accrual basis US Holder generally will recognise US source foreign currency gain or loss (taxable as ordinary income or loss) equal to any difference between the US dollar value of the amount received based on the exchange rates in effect on the trade date and the settlement date. However, in the case of ordinary shares traded on an established securities market, accrual basis US Holders may elect to determine the US dollar value of the amount realised on the sale or other taxable disposition of the ordinary shares based on the exchange rate in effect on the settlement date, and no exchange gain or loss will be recognised on such date.
Foreign currency received on the sale or other disposition of an ordinary share will have a tax basis equal to its US dollar value on the settlement date. Foreign currency that is purchased will generally have a tax basis equal to the US dollar value of the foreign currency on the date of purchase. Any gain or loss recognised on a sale or other disposition of a foreign currency (including its use to purchase ordinary shares or upon exchange for US dollars) will be US source ordinary income or loss.
To the extent you incur Securities Transfer Tax in connection with a transfer or withdrawal of ordinary shares as described under “Certain South African Tax Considerations—Securities Transfer Tax” above, such securities transfer tax will not be a creditable tax for US foreign tax credit purposes.
BACKUP WITHHOLDING AND INFORMATION REPORTING
Payments of dividends and other proceeds with respect to ordinary shares or ADRs by US persons will be reported to you and to the IRS as may be required under applicable regulations. Backup withholding may apply to these payments if you fail to provide an accurate taxpayer identification number or certification of exempt status or fail to comply with applicable certification requirements. Some holders
are not subject to backup withholding. You should consult your tax adviser as to your qualification for an exemption from backup withholding and the procedure for obtaining an exemption.
FOREIGN FINANCIAL ASSET REPORTING
US taxpayers that own certain foreign financial assets, including equity of foreign entities, with an aggregate value that exceeds $50,000 at the end of the taxable year or $75,000 at any time during the taxable year may be required to file an information report with respect to such assets with their tax returns. Sibanye’s ordinary shares and ADRs are expected to constitute foreign financial assets subject to these requirements unless they are held in an account at a financial institution (in which case, the account may be reportable if maintained by a foreign financial institution). You should consult your tax adviser regarding the application of the rules relating to foreign financial asset reporting.
DOCUMENTS ON DISPLAY
Sibanye will also file annual and special reports and other information with the SEC. You may read and copy any reports or other information on file at the SEC’s public reference room at the following location:
100 F Street, N.E.
Washington, D.C. 20549
Please call the SEC at 1-800-SEC-0330 for further information on the public reference room. The SEC filings are also available to the public from commercial document retrieval services. Sibanye’s SEC filings may also be obtained electronically via the EDGAR system on the website maintained by the SEC at http://www.sec.gov.
The above information may also be obtained at the registered office of Sibanye and can be accessed at http://www.sibanyegold.co.za.
Subsidiary Information
Not applicable.
Refining and Marketing
Sibanye has appointed Rand Refinery Proprietary Limited (Rand Refinery) to refine all of Sibanye’s South African-produced gold. Rand Refinery is a private company in which Sibanye holds a 33.1% interest, with the remaining interests held by other South African gold producers. Since 1 October 2004, up to the Spin-off date, Gold Fields’ treasury department arranged the sale of all the gold production from Sibanye’s operations. As from the Spin-off, Rand Refinery advises Sibanye’s department of treasury (Treasury) on a daily basis of the amount of gold available for sale. Treasury, then sells the gold at a price benchmarked against the London afternoon fixing price. Two business days after the sale of gold, Sibanye deposits an amount in US dollars equal to the value of the gold at the London afternoon fixing price into Rand Refinery’s nominated US dollar account. Rand Refinery deducts refining charges payable by Sibanye relating to such amount of gold and deposits the balance of the proceeds into the nominated US dollar account of Sibanye.
CERTAIN INFORMATION AS AT 4 APRIL 2017
EXCHANGE RATES
For the average exchange rates for the five most recent financial years, and the high and low exchange rates for each month during the previous six months, see “Annual Financial Report—Overview—Five-year financial performance—Footnote 9”. The average exchange rate for 2017 through 4 April 2017, as reported by I-Net Bridge, was R13.23/US$.
The following table sets forth the high and low exchange rates for the month ended 31 March 2017 through 4 April 2017:
| | |
| | |
Month ended | High | Low |
31 March 2017 | 13.44 | 12.42 |
Through 4 April 2017 | 13.69 | 13.59 |
The closing exchange on 4 April 2017, as reported by I-Net Bridge, was R13.59/US$.
COMMODITY PRICES
The volatility of commodity prices is illustrated in “Annual Financial Report—Overview—Management’s discussion and analysis of the financial statements—Factors affecting Sibanye’s performance—Commodity prices”. The annual high, low and average of the commodity prices for 2017 through 4 April 2017 is illustrated in the table below:
| | | |
| US$/oz1 |
2017 (through 4 April 2017) | High | Low | Average |
Gold | 1,258 | 1,151 | 1,220 |
Platinum | 1,028 | 934 | 980 |
1 Rounded to the nearest US dollar.
On 4 April 2017, the London afternoon fixing price of gold was US$1,258/oz and the the London market price of platinum was US$960/oz.
Foreign currency SENSITIVITY
In the ordinary course of business, the Group enters into transactions, such as gold sales and PGM sales, denominated in foreign currencies, primarily US dollar. See “Annual Financial Report—Annual financial statements—Notes to the consolidated financial statements—Note 29.2: Risk management activities—Sensitivity analysis”.
FOREIGN CURRENCY ECONOMIC HEDGING EXPERIENCE
As of 4 April 2017 there were no material foreign currency positions.
Foreign currency sensitivity analysis
A sensitivity analysis of the mark-to-market valuation has not been performed as there were no material foreign currency contracts as of 4 April 2017.
CONTROLS AND PROCEDURES
| (a) | | Disclosure Controls and Procedures: |
Sibanye has carried out an evaluation, under the supervision and with the participation of management, including the Chief Executive Officer and Chief Financial Officer of Sibanye, of the effectiveness of the design and operation of Sibanye’s disclosure controls and procedures (as defined in Exchange Act Rule 13a‑15(e)) as of the end of the period covered by this annual report. Based upon that evaluation, Sibanye’s Chief Executive Officer and Chief Financial Officer concluded that, as of 31 December 2016, Sibanye’s disclosure controls and procedures were effective.
(b)Management’s Report on Internal Control over Financial Reporting:
Sibanye’s management is responsible for establishing and maintaining adequate internal control over financial reporting. The Securities Exchange Act of 1934 defines internal control over financial reporting in Rule 13a‑15(f) and 15d‑15(f) as a process designed by, or under the supervision of, the company’s principal executive and principal financial officers and effected by the company’s board of directors, management and other personnel, to provide reasonable assurance regarding the reliability of financial reporting and the preparation of financial statements for external purposes in accordance with generally accepted accounting principles and includes those policies and procedures that:
| · | | pertain to the maintenance of records that in reasonable detail accurately and fairly reflect the transactions and dispositions of the assets of the company; |
| · | | provide reasonable assurance that transactions are recorded as necessary to permit preparation of financial statements in accordance with generally accepted accounting principles, and that receipts and expenditures of the company are being made only in accordance with authorisations of management and directors of the company; and |
| · | | provide reasonable assurance regarding prevention or timely detection of unauthorised acquisition, use or disposition of the company’s assets that could have a material effect on the consolidated financial statements. |
Because of its inherent limitations, internal control over financial reporting may not prevent or detect misstatements. Also, projections of any evaluation of effectiveness to future periods are subject to risk that controls may become inadequate because of changes in conditions, or that the degree of compliance with the policies or procedures may deteriorate.
Sibanye acquired Aquarius in April 2016, and the Rustenburg Operations in October 2016 (together, the Acquired Businesses). Management has excluded from its assessment of internal control over financial reporting as of 31 December 2016, the Acquired Businesses’ internal control over financial reporting associated with approximately 47% of consolidated total assets (including 7% of consolidated total assets related to acquisition accounting adjustments to property, plant and equipment, and goodwill at the respective acquisition dates that was included within the assessment) and approximately 12% of consolidated revenues, included in the consolidated financial statements as of and for the year ended 31 December 2016.
Sibanye’s management assessed the effectiveness of its internal control over financial reporting as of 31 December 2016. In making this assessment, Sibanye’s management used the criteria set forth in Internal Control -Integrated Framework (2013) issued by the Committee of Sponsoring Organizations of the Treadway Commission (COSO). Based upon its assessment, Sibanye’s management concluded that, as of 31 December 2016, its internal control over financial reporting is effective based upon those criteria.
KPMG Inc., an independent registered public accounting firm that audited the consolidated financial statements included in this annual report on Form 20-F, has issued an attestation report on the effectiveness of Sibanye’s internal control over financial reporting as of 31 December 2016.
(c)Attestation Report of the Registered Public Accounting Firm:
See Annual Financial Report—Accountability—Report of independent registered public accounting firm.
(d)Changes in Internal Control Over Financial Reporting:
There has been no change in Sibanye’s internal control over financial reporting that occurred during fiscal 2016 that has materially affected, or is reasonably likely to materially affect, Sibanye’s internal control over financial reporting.
EXHIBITS
The following instruments and documents are included as Exhibits to this annual report.
| | |
No. | | Exhibit |
1.1 | | Memorandum of Incorporation of Sibanye.1 |
2.1 | | Form of Deposit Agreement among Sibanye, BNYM, as depositary, and the owners and beneficial owners from time to time of ADRs.2 |
2.2 | | Form of ADR.2 |
2.3 | | The Sibanye 2013 Share Plan, adopted 21 November 2012.1 |
2.4 | | Trust Deed among Orogen, as issuer; Gold Fields, GFIMSA, GFO and GFH, as guarantors; and Citicorp Trustee Company Limited, as trustee, dated 7 October 2010 in relation to the Notes.1 |
4.1 | | R4.5 billion term and revolving credit facilities agreement between Bank of China Limited Johannesburg Branch, FirstRand Bank, ABSA Bank Limited, J.P. Morgan Chase Bank, N.A., Johannesburg Branch, Standard Bank, Nedbank, the Financial Institutions listed in Schedule 1, Opiconsivia Trading 305 (RF) Proprietary Limited and Sibanye dated 10 December 2013.3 |
4.2 | | First Addendum to the R4.5 billion term and revolving credit facilities agreement between Bank of China Limited Johannesburg Branch, FirstRand Bank, ABSA Bank Limited, J.P. Morgan Chase Bank, N.A., Johannesburg Branch, Standard Bank, Nedbank, the Financial Institutions listed in Schedule 1, Opiconsivia Trading 305 (RF) Proprietary Limited and Sibanye dated 13 March 2014.3 |
4.3 | | Second Addendum to the R4.5 billion term and revolving credit facilities agreement between Bank of China Limited Johannesburg Branch, FirstRand Bank, ABSA Bank Limited, J.P. Morgan Chase Bank, N.A., Johannesburg Branch, Standard Bank, Nedbank, the Financial Institutions listed in Schedule 1, Opiconsivia Trading 305 (RF) Proprietary Limited and Sibanye dated 12 May 2014.4 |
4.4 | | Third Addendum to the R4.5 billion term and revolving credit facilities agreement between Bank of China Limited Johannesburg Branch, FirstRand Bank, ABSA Bank Limited, J.P. Morgan Chase Bank, N.A., Johannesburg Branch, Standard Bank, Nedbank, the Financial Institutions listed in Schedule 1, Opiconsivia Trading 305 (RF) Proprietary Limited and Sibanye dated 22 July 2014.4 |
4.5 | | Fourth Addendum to the R4.5 billion term and revolving credit facilities agreement between Bank of China Limited Johannesburg Branch, FirstRand Bank, ABSA Bank Limited, J.P. Morgan Chase Bank, N.A., Johannesburg Branch, Standard Bank, Nedbank, the Financial Institutions listed in Schedule 1, Opiconsivia Trading 305 (RF) Proprietary Limited and Sibanye dated 14 August 2014.4 |
4.6 | | Fifth Addendum to the R4.5 billion term and revolving credit facilities agreement between Bank of China Limited Johannesburg Branch, FirstRand Bank, ABSA Bank Limited, J.P. Morgan Chase Bank, N.A., Johannesburg Branch, Standard Bank, Nedbank, the Financial Institutions listed in Schedule 1, Opiconsivia Trading 305 (RF) Proprietary Limited and Sibanye dated 6 October 2014.4 |
4.7 | | Amended and Restatement Agreement of the R4.5 billion term and revolving credit facilities agreement between Bank of China Limited Johannesburg Branch, FirstRand Bank, ABSA Bank Limited, J.P. Morgan Chase Bank, N.A., Johannesburg Branch, Standard Bank, Nedbank, the Financial Institutions listed in Schedule 1, Opiconsivia Trading 305 (RF) Proprietary Limited and Sibanye dated 6 October 2015.5 |
4.8 | | Cession and Pledge in Security by Sibanye Gold Limited (as Pledgor) in favor of Opiconsivia Trading 305 Proprietary Limited (as Debt Guarantor), dated 22 August 2013.3 |
4.9 | | Addendum to the Cession and Pledge in Security by Sibanye Gold Limited (as Pledgor) in favor of Opiconsivia Trading 305 Proprietary Limited (as Debt Guarantor), dated 10 December 2013.3 |
4.10 | | Cession in Security by Sibanye Gold Limited (as Pledgor) in favor of Opiconsivia Trading 305 Proprietary Limited (as Debt Guarantor), dated 22 August 2013.3 |
4.11 | | Cession in Security by Sibanye Gold Limited (as Pledgor) in favor of Opiconsivia Trading 305 Proprietary Limited (as Debt Guarantor), dated 22 October 2013.3 |
4.12 | | Cession in Security by Sibanye Gold Limited (as Pledgor) in favor of Opiconsivia Trading 305 Proprietary Limited (as Debt Guarantor), dated 15 August 2014.4 |
4.13 | | Notorial General Bond by Sibanye Gold Limited in favor of Opiconsivia Trading 305 Proprietary Limited (as Debt Guarantor), registered 24 October 2013.3 |
4.14 | | Merger Agreement between Sibanye, Gold One International Limited, and Newshelf 1114 Proprietary Limited dated 20 August 2013.3 |
4.15 | | First Addendum to the Merger Agreement between Sibanye, Gold One International Limited, and Newshelf 1114 Proprietary Limited dated 26 September 2013.3 |
4.16 | | Second Addendum to the Merger Agreement between Sibanye, Gold One International Limited, and Newshelf 1114 Proprietary Limited dated 17 February 2014.3 |
4.17 | | Third Addendum to the Merger Agreement between Sibanye, Gold One International Limited, and Newshelf 1114 Proprietary Limited dated 24 March 2014.3 |
4.18 | | Fourth Addendum to the Merger Agreement between Sibanye, Gold One International Limited, and Newshelf 1114 Proprietary Limited dated 30 April 2014.4 |
4.19 | | Fifth Addendum to the Merger Agreement between Sibanye, Gold One International Limited, and Newshelf 1114 Proprietary Limited dated 6 May 2014.4 |
4.20 | | Sixth Addendum to the Merger Agreement between Sibanye, Gold One International Limited, and Newshelf 1114 Proprietary Limited dated 15 May 2014.4 |
4.21 | | Indemnity Agreement among Orogen, Gold Fields, GFO, GFH and Sibanye, in respect of Sibanye’s obligations under the Notes, dated 20 December 2012.1 |
4.22 | | Cession in Security Agreement among Sibanye, ABSA Bank Limited, Nedbank, Standard Bank, FirstRand Bank and JP Morgan Chase Bank, N.A., Johannesburg Branch, dated 20 December 2012.1 |
| | |
No. | | Exhibit |
4.23 | | Agreement between Neal Froneman and Sibanye, dated 7 December 2012.1 |
4.24 | | Agreement between Charl Keyter and Sibanye, dated 7 December 2012.1 |
4.25 | | Term Loan Facility Agreement between SGEO (previously Southgold Exploration Proprietary Limited), the Financial Institutions listed in Schedule 1, Credit Suisse AG, Standard Chartered Bank and Purple Rain Security SPV (RF) Proprietary Limited, dated 17 April 2014.4 |
4.26 | | First Amendment to the Term Loan Facility Agreement between SGEO (previously Southgold Exploration Proprietary Limited), the Financial Institutions listed in Schedule 1, Credit Suisse AG, Standard Chartered Bank and Purple Rain Security SPV (RF) Proprietary Limited, dated 26 June 2014.4 |
4.27 | | Second Amendment to the Term Loan Facility Agreement between SGEO (previously Southgold Exploration Proprietary Limited), the Financial Institutions listed in Schedule 1, Credit Suisse AG, Standard Chartered Bank and Purple Rain Security SPV (RF) Proprietary Limited, dated 1 July 2014.4 |
4.28 | | Third Amendment to the Term Loan Facility Agreement between SGEO (previously Southgold Exploration Proprietary Limited), the Financial Institutions listed in Schedule 1, Credit Suisse AG, Standard Chartered Bank and Purple Rain Security SPV (RF) Proprietary Limited, dated 8 July 2014.4 |
4.29 | | Cession and Pledge in Security amongst Witwatersrand Consolidated Gold Resources Limited, K2013164354 Proprietary Limited and Purple Rain Security SPV (RF) Proprietary Limited, dated 2 April 2014.4 |
4.30 | | Cession in Security by SGEO (previously Southgold Exploration Proprietary Limited) in favour of Purple Rain Security SPV (RF) Proprietary Limited, dated 2 April 2014.4 |
4.31 | | Sale and Purchase Agreement between Rustenburg Platinum Mines Limited, Sibanye Rustenburg Platinum Mines Proprietary Limited and Sibanye Gold Limited, signed on 8 September 2015.5 |
4.32 | | Implementation Agreement between Sibanye Gold Limited and Sibanye Platinum Bermuda Proprietary Limited and Aquarius Platinum Limited, signed on 6 October 2015.5 |
4.33 | | Revolving Facility Agreement between Sibanye Gold Limited, Bank of America Merrill Lynch International Limited and HSBC Bank plc, dated 24 August 2015.5 |
4.34 | | $350 million Bridge Facility Agreement between Sibanye Gold Limited and HSBC Bank plc, dated 5 October 2015.5 |
4.35 | | Revolving Credit Facility Agreement between ABSA Bank Limited (acting through its Corporate and Investment Banking Division), Bank of China Limited, Johannesburg Branch, FirstRand Bank Limited (acting through its Rand Merchant Bank Division), Nedbank Limited, The Standard Bank of South Africa Limited and Sibanye, dated 15 November 2016. |
4.36 | | US$2.65 billion Acquisition Bridge Facilities Agreement with Citibank, HSBC ABSA Bank Limited (acting through its Corporate and Investment Banking Division), Barclays Bank PLC, Banca IMI S.P.A., London branch, Credit Suisse International, FirstRand Bank Limited (acting through its Rand Merchant Bank Division), J.P. Morgan Limited, Mizuho Bank Europe N.V., Morgan Stanley Bank International Limited, Royal Bank of Canada, Societe Generale, the Bank of Nova Scotia, The Bank of Tokyo-Mitsubishi UFJ, Ltd., The Standard Bank of South Africa Limited, BNP Paribas, Nedbank Limited, London Branch and Sibanye, dated 9 December 2016. |
4.37 | | Merger Agreement between Sibanye, Thor US Holdco Inc., Thor Mergeco Inc. and Stillwater Mining Company, dated 9 December 2016. |
8.1 | | List of subsidiaries of the registrant. |
12.1 | | Certification of Chief Executive Officer. |
12.2 | | Certification of Chief Financial Officer. |
13.1 | | Certification of Chief Executive Officer. |
13.2 | | Certification of Chief Financial Officer. |
1Filed as an exhibit to the registration statement on Form 20-F (File No. 001-35785), filed by Sibanye with the Securities and Exchange Commission on 16 January 2013.
2 Filed as an exhibit to the registration statement on Form 20-F (File No. 001-35785), filed by Sibanye with the Securities and Exchange Commission on 1 February 2013.
3 Filed as an exhibit to the annual report on Form 20-F (File No. 001-35785), filed by Sibanye with the Securities and Exchange Commission on 29 April 2014.
4 Filed as an exhibit to the annual report on Form 20-F (File No. 001-35785), filed by Sibanye with the Securities and Exchange Commission on 24 March 2015.
5 Filed as an exhibit to the annual report on Form 20-F (File No. 001-35785), filed by Sibanye with the Securities and Exchange Commission on 21 March 2016.
SIGNATURES
The registrant hereby certifies that it meets all of the requirements for filing on Form 20‑F and that it has duly caused and authorised the undersigned to sign this annual report on its behalf.
| | | |
SIBANYE GOLD LIMITED | | |
| | |
/s/ Charl Keyter | | |
Name: | Charl Keyter | | |
Title: | Chief Financial Officer | | |
Date: | 6 April 2017 | | |