As filed with the Securities and Exchange Commission on 30 March 2018
UNITED STATES
SECURITIES AND EXCHANGE COMMISSION
Washington, D.C. 20549
Form 20-F
(Mark One)
☐REGISTRATION STATEMENT PURSUANT TO SECTION 12(b) OR 12(g) OF THE SECURITIES EXCHANGE ACT OF 1934
or
☒ ANNUAL REPORT PURSUANT TO SECTION 13 OR 15(d) OF THE SECURITIES EXCHANGE ACT OF 1934
For the fiscal year ended 31 December 2017
or
☐TRANSITION REPORT PURSUANT TO SECTION 13 OR 15(d) OF THE SECURITIES EXCHANGE ACT OF 1934
For the transition period from to
or
☐SHELL COMPANY REPORT PURSUANT TO SECTION 13 OR 15(d) OF THE SECURITIES EXCHANGE ACT OF 1934
Date of event requiring this shell company report
For the transition period from to
Commission file number: 001-35785
Sibanye Gold Limited
(Exact name of registrant as specified in its charter)
Republic of South Africa
(Jurisdiction of incorporation or organization)
Libanon Business Park
1 Hospital Street (off Cedar Avenue)
Libanon, Westonaria, 1780
South Africa.
011-27-11-278-9600
(Address of principal executive offices)
With copies to:
Charl Keyter
Chief Financial Officer
Sibanye Gold Limited
Tel: 011-27-11-278-9700
Fax: 011-27-11-278-9863
Libanon Business Park
1 Hospital Street (off Cedar Avenue)
Libanon, Westonaria, 1780
South Africa
(Name, Telephone, E-mail and/or Facsimile number and Address of Company Contact Person)
and
Thomas B. Shropshire, Jr.
Linklaters LLP
Tel: 011-44-20-7456-3223
Fax: 011-44-20-7456-2222
One Silk Street
London EC2Y 8HQ
United Kingdom
Securities registered or to be registered pursuant to Section 12(b) of the Act
Title of Each Class
Ordinary shares of no par value each
American Depositary Shares, each representing four ordinary shares | Name of Each Exchange on Which Registered
New York Stock Exchange*
New York Stock Exchange |
*Not for trading, but only in connection with the registration of the American Depositary Shares pursuant to the requirements of the Securities and Exchange Commission. Securities registered or to be registered pursuant to Section 12(g) of the Act None (Title of Class) Securities for which there is a reporting obligation pursuant to Section 15(d) of the Act None (Title of Class) Indicate the number of outstanding shares of each of the issuer’s classes of capital or common stock
as of the close of the period covered by the Annual Report 2,168,721,220 ordinary shares of no par value each |
Indicate by check mark if the registrant is a well-known seasoned issuer, as defined in Rule 405 of the Securities Act: Yes ☒ No ☐ If this report is an annual or transition report, indicate by check mark if the registrant is not required to file reports pursuant to Section 13 or 15(d) of the Securities Exchange Act of 1934. Yes ☐ No ☒ Note – Checking the box above will not relieve any registrant required to file reports pursuant to Section 13 or 15(d) of the Securities Exchange Act of 1934 from their obligations under those Sections. Indicate by check mark whether the registrant (1) has filed all reports required to be filed by Section 13 or 15(d) of the Securities Exchange Act of 1934 during the preceding 12 months (or for such shorter period that the registrant was required to file such reports), and (2) has been subject to such filing requirements for the past 90 days. Yes ☒ No ☐ Indicate by check mark whether the registrant has submitted electronically and posted on its corporate Web site, if any, every Interactive Data File required to be submitted and posted pursuant to Rule 405 of Regulation S-T (§232.405 of this chapter) during the preceding 12 months (or for such shorter period that the registrant was required to submit and post such files)*. Yes ☐ No ☐ Indicate by check mark whether the registrant is a large accelerated filer, an accelerated filer, a non-accelerated filer, or an emerging growth company. See definition of “large accelerated filer,” “accelerated filer,” and “emerging growth company” in Rule 12b-2 of the Exchange Act. (Check one): Large accelerated filer ☒ Accelerated filer ☐ Non-accelerated filer ☐ Emerging growth company ☐ If an emerging growth company that prepares its financial statements in accordance with U.S. GAAP, indicate by check mark if the registrant has elected not to use the extended transition period for complying with any new or revised financial accounting standards† provided pursuant to Section 13(a) of the Exchange Act. ☐ † The term “new or revised financial accounting standard” refers to any update issued by the Financial Accounting Standards Board to its Accounting Standards Codification after April 5, 2012. Indicate by check mark which basis of accounting the registrant has used to prepare the financial statements included in this filing: |
U.S. GAAP ☐ | International Financial Reporting Standards as issued by the International Accounting Standards Board ☒ | Other ☐ |
If “Other” has been checked in response to the previous question, indicate by check mark which financial statement item the registrant has elected to follow: Item 17 ☐ Item 18 ☐ If this is an annual report, indicate by check mark whether the registrant is a shell company (as defined in Rule 12b-2 of the Exchange Act). Yes ☐ No ☒ (APPLICABLE ONLY TO ISSUERS INVOLVED IN BANKRUPTCY PROCEEDINGS DURING THE PAST FIVE YEARS) Indicate by check mark whether the registrant has filed all documents and reports required to be filed by Sections 12, 13 or 15(d) of the Securities Exchange Act of 1934 subsequent to the distribution of securities under a plan confirmed by a court. Yes ☐ No ☐ |
* This requirement does not apply to the registrant
| | | | | | |
Item | | Form 20-F Caption | | Location in this document | | Page |
1 | | Identity of directors, senior management and advisers | | NA | | NA |
2 | | Offer statistics and expected timetable | | NA | | NA |
3 | | Key information | | | | |
| | (a) Selected financial data | | Annual Financial Report—Overview—Five-year financial performance | | 124-127 |
| | (b) Capitalisation and indebtedness | | NA | | NA |
| | (c) Reasons for the offer | | NA | | NA |
| | (d) Risk factors | | Further Information—Risk factors | | 220-237 |
4 | | Information on the Company | | | | |
| | (a) History and development of the Company | | Integrated Annual Report—Introduction—Corporate profile | | 12-14 |
| | | | Further Information—Additional information—Memorandum of incorporation | | 276 |
| | | | Annual Financial Report—Administrative details—Administrative and corporate information | | 219 |
| | | | Integrated Annual Report—View from the top—Perspective from the Chair | | 20-21 |
| | | | Integrated Annual Report—View from the top—Chief Executive’s review | | 22-25 |
| | | | Integrated Annual Report—View from the top—Chief Financial Officer’s report | | 26-27 |
| | | | Integrated Annual Report—Performance review—Delivering value from operations, projects and technology | | 35-46 |
| | | | Annual Financial Report—Overview—Five-year financial performance | | 124-127 |
| | | | Annual Financial Report—Overview—Management’s discussion and analysis of the financial statements—Recent platinum acquisitions | | 131-132 |
| | | | Annual Financial Report—Annual financial statements—Notes to the consolidated financial statements—Note 13: Acquisitions | | 188-191 |
| | (b) Business overview | | Annual Financial Report—Overview—Management’s discussion and analysis of the financial statements—Introduction | | 128 |
| | | | Integrated Annual Report—Introduction—Corporate profile | | 12-14 |
| | | | Annual Financial Report—Overview—Management’s discussion and analysis of the financial statements—2017 financial performance compared with 2016 and 2015 | | 132-141 |
| | | | Annual Financial Report—Overview—Five-year financial performance | | 124-127 |
| | | | Annual Financial Report—Overview—Management’s discussion and analysis of the financial statements—Costs | | 130 |
| | | | Integrated Annual Report—View from the top—Perspective from the Chair | | 20-21 |
| | | | Further Information—Environmental and regulatory matters | | 268-272 |
| | (c) Organisational structure | | Integrated Annual Report—Introduction—Corporate profile | | 12-14 |
| | | | Annual Financial Report—Annual financial statements—Notes to the consolidated financial statements—Note 1.3: Consolidation | | 165 |
| | (d) Property, plant and equipment | | Integrated Annual Report—Introduction—Corporate profile | | 12-14 |
| | | | Integrated Annual Report—Performance review—Delivering value from operations, projects and technology | | 35-46 |
| | | | Further Information—Additional information—Sibanye-Stillwater’s mining operations | | 238-254 |
| | | | Further Information—Reserves of Sibanye-Stillwater as of 31 December 2017 | | 255-263 |
| |
Sibanye-Stillwater | Form 20-F 2017 | 1 |
| | | | | | |
Item | | Form 20-F Caption | | Location in this document | | Page |
| | | | Further Information—Environmental and regulatory matters | | 268-272 |
| | | | Annual Financial Report—Annual financial statements—Notes to the consolidated financial statements—Note 12: Property, plant and equipment | | 184-187 |
4A | | Unresolved staff comments | | NA | | NA |
5 | | Operating and financial review and prospects | | | | |
| | (a) Operating results | | Annual Financial Report—Overview—Management’s discussion and analysis of the financial statements | | 128-144 |
| | | | Annual Financial Report—Annual financial statements—Consolidated income statement | | 157 |
| | | | Annual Financial Report—Annual financial statements—Consolidated statement of financial position | | 158 |
| | | | Annual Financial Report—Annual financial statements—Consolidated statement of cash flows | | 160 |
| | | | Annual Financial Report—Annual financial statements—Notes to the consolidated financial statements—Note 24: Borrowings and derivative financial instrument | | 199-205 |
| | | | Annual Financial Report—Annual financial statements—Notes to the consolidated financial statements—Note 30: Fair value of financial assets and financial liabilities, and risk management | | 208-213 |
| | | | Annual Financial Report—Annual financial statements—Notes to the consolidated financial statements—Note 31: Commitments | | 214 |
| | (b) Liquidity and capital resources | | Annual Financial Report—Overview—Management’s discussion and analysis of the financial statements—Liquidity and capital resources | | 141-142 |
| | (c) Research and development, patents and licences, etc. | | NA | | NA |
| | (d) Trend information | | Annual Financial Report—Overview—Management’s discussion and analysis of the financial statements | | 128-144 |
| | (e) Off-balance sheet arrangements | | Annual Financial Report—Overview—Management’s discussion and analysis of the financial statements—Off balance sheet arrangements and contractual commitments | | 143 |
| | (f) Tabular disclosure of contractual obligations | | Annual Financial Report—Overview—Management’s discussion and analysis of the financial statements—Off balance sheet arrangements and contractual commitments | | 143 |
| | (g) Safe harbour | | Forward-looking statements | | 8 |
6 | | Directors, senior management and employees | | | | |
| | (a) Directors and senior management | | Integrated Annual Report—Leadership and governance—Board and Executive Committee | | 107-108 |
| | | | Further Information—Directors and Senior Management | | 264-267 |
| | (b) Compensation | | Integrated Annual Report—Leadership and governance—Remuneration report | | 109-122 |
| | | | Annual Financial Report—Annual financial statements—Notes to the consolidated financial statements—Note 33: Related-party transactions | | 214-216 |
| | (c) Board practices | | Integrated Annual Report—Accountability—Corporate governance report—Our Board, Governance Structures and Processes | | 95-103 |
| | | | Integrated Annual Report—Leadership and governance—Remuneration report—Executive directors’ contracts of employment | | 115 |
| | (d) Employees | | Integrated Annual Report—Performance overview—Superior value for the workforce | | 47-58 |
| |
Sibanye-Stillwater | Form 20-F 2017 | 2 |
| | | | | | |
Item | | Form 20-F Caption | | Location in this document | | Page |
| | (e) Share ownership | | Annual Financial Report—Annual financial statements—Notes to the consolidated financial statements—Note 33: Related-party transactions | | 214-216 |
| | | | Annual Financial Report—Annual financial statements—Notes to the consolidated financial statements—Note 6: Share-based payments | | 172-177 |
7 | | Major Shareholders and Related Party Transactions | | | | |
| | (a) Major shareholders | | Annual Financial Report—Administrative details—Shareholder information | | 217-218 |
| | | | Further Information—The listing | | 274-275 |
| | (b) Related party transactions | | Annual Financial Report—Accountability—Directors’ report—Directors’ and officers’ disclosure of interests in contracts | | 150-151 |
| | | | Annual Financial Report—Annual financial statements—Notes to the consolidated financial statements—Note 33: Related-party transactions | | 214-216 |
| | (c) Interests of experts and counsel | | NA | | NA |
8 | | Financial information | | | | |
| | (a) Consolidated statements and other financial information | | Annual Financial Report—Overview—Management’s discussion and analysis of the financial statements | | 128-144 |
| | | | Annual Financial Report—Annual financial statements | | 157-216 |
| | | | Annual Financial Report—Director’s Report—Litigation | | 154-155 |
| | | | Annual Financial Report—Accountability—Directors’ report—Financial affairs—Dividend policy | | 151 |
| | | | Further Information—Additional information—Dividend policy and dividend distributions | | 273 |
| | (b) Significant changes | | NA | | NA |
9 | | The Offer and listing | | | | |
| | (a) Listing details | | Further Information—The listing | | 274-275 |
| | (b) Plan of distribution | | NA | | NA |
| | (c) Markets | | Further Information—The listing | | 274-275 |
| | (d) Selling shareholders | | NA | | NA |
| | (e) Dilution | | NA | | NA |
| | (f) Expenses of the issue | | NA | | NA |
10 | | Additional information | | | | |
| | (a) Share capital | | NA | | NA |
| | (b) Memorandum and articles of association | | Further Information—Additional information—Memorandum of Incorporation | | 276 |
| | (c) Material contracts | | Further Information—Additional information—Material contracts | | 276-277 |
| | (d) Exchange controls | | Further Information—Additional information—South African Exchange Control limitations affecting Security holders | | 282 |
| | | | Further Information—Environmental and regulatory matters—Exchange Controls | | 272 |
| | (e) Taxation | | Further Information—Additional information—Taxation | | 282-285 |
| | (f) Dividends and paying agents | | NA | | NA |
| | (g) Statement by experts | | NA | | NA |
| | (h) Documents on display | | Further Information—Additional information—Documents on display | | 285 |
| | (i) Subsidiary information | | NA | | NA |
11 | | Quantitative and qualitative disclosures about market risk | | Annual Financial Report—Annual financial statements—Notes to the consolidated financial statements—Note 30.2: Risk management activities | | 209-213 |
12 | | Description of securities other than equity securities | | | | |
| |
Sibanye-Stillwater | Form 20-F 2017 | 3 |
| | | | | | |
Item | | Form 20-F Caption | | Location in this document | | Page |
| | (a) Debt securities | | NA | | NA |
| | (b) Warrants and rights | | NA | | NA |
| | (c) Other securities | | NA | | NA |
| | (d) American depositary shares | | Further Information—Additional information—American depositary shares | | 277-282 |
13 | | Defaults, dividend arrearages and delinquencies | | NA | | NA |
14 | | Material modifications to the rights of security holders and use of proceeds | | NA | | NA |
15 | | Controls and procedures | | Further Information—Controls and procedures | | 287 |
16A | | Audit Committee financial expert | | Annual Financial Report—Accountability—Corporate governance report—Board committees—Audit Committee | | 98 |
16B | | Code of ethics | | Annual Financial Report—Accountability—Corporate governance report—Code of ethics | | 92 |
| | | | Statement of responsibility by the Board of Directors | | 145 |
16C | | Principal accountant fees and services | | Annual Financial Report—Accountability—Report of the Audit Committee—Auditor independence and fees | | 148 |
16D | | Exemptions from the listing standards for audit committees | | NA | | NA |
16E | | Purchase of equity securities by the issuer and affiliated purchasers | | None | | |
16F | | Change in registrant’s certifying accountant | | NA | | NA |
16G | | Corporate governance | | Further Information—Additional information—JSE corporate governance practices compared with NYSE Listing Standards | | 286 |
16H | | Mine safety disclosure | | NA | | NA |
17 | | Financial statements | | NA | | NA |
18 | | Financial statements | | Financial Information—Report of independent registered public accounting firm | | 156 |
| | | | Annual Financial Report—Annual financial statements—Consolidated income statement | | 157 |
| | | | Annual Financial Report—Annual financial statements—Consolidated statement of other comprehensive income | | 157 |
| | | | Annual Financial Report—Annual financial statements—Consolidated statement of financial position | | 158 |
| | | | Annual Financial Report—Annual financial statements—Consolidated statement of changes in equity | | 159 |
| | | | Annual Financial Report—Annual financial statements—Consolidated statement of cash flows | | 160 |
| | | | Annual Financial Report—Annual financial statements—Notes to the consolidated financial statements | | 161-216 |
19 | | Exhibits | | Exhibits | | 288-289 |
| |
Sibanye-Stillwater | Form 20-F 2017 | 4 |
Historical Consolidated Financial Statements
Sibanye Gold Limited (trading as Sibanye-Stillwater (Sibanye-Stillwater)), a South African domiciled global, precious metals mining company, which produces a mix of metals that includes gold and the platinum group metals (PGMs). Sibanye-Stillwater owns and operates a portfolio of high-quality operations and projects, which are grouped into two regions: the southern Africa region and the United States region. See Annual Financial Report—Overview—Management’s discussion and analysis of financial statements—Introduction.
Accordingly, the books of account of the Group (as defined below) are maintained in South African Rand and the Group’s annual financial statements are prepared in accordance with International Financial Reporting Standards (IFRS), as issued by the International Accounting Standards Board, as prescribed by law. These financial statements are distributed to shareholders and are submitted to the Johannesburg Stock Exchange (JSE) and the New York Stock Exchange (NYSE).
The consolidated financial statements of Sibanye-Stillwater as at and for the fiscal years ended 31 December 2017, 2016 and 2015 (the Consolidated Financial Statements) have been prepared using the historical results of operations, assets and liabilities attributable to Sibanye-Stillwater and all of its subsidiaries (the Sibanye-Stillwater Group, or the Group). The Consolidated Financial Statements have been prepared under the historical cost convention, except for financial assets and financial liabilities (including derivative financial instruments), which are measured at fair value through profit or loss or through the mark to market reserve in equity.
Non-IFRS Measures
The financial information in this annual report includes certain measures that are not defined by IFRS, including “adjusted earnings before interest, tax, depreciation and amortization” (adjusted EBITDA), “normalised earnings”, “operating cost”, “All-in sustaining cost”, “All-in sustaining cost margin”, “All-in cost”, “All-in cost margin”, “headline earnings per share”, “free cash flow” and “net debt” (each as defined below or in Annual Financial Report—Overview—Five-year financial performance. These measures are not measures of financial performance or cash flows under IFRS and may not be comparable to similarly titled measures of other companies. These measures have been included for the reasons described below or in Annual Financial Report—Overview—Five-year financial performance and should not be considered by investors as alternatives to costs of sales, net operating profit, profit before taxation, cash from operating activities or any other measure of financial performance presented in accordance with IFRS.
Operating costs is defined as the average cost of production and calculated by dividing the cost of sales, before amortisation and depreciation in a period by the tonnes milled/treated in the same period, and operating cost per kilogram (and ounce) is calculated by dividing the cost of sales, before amortisation and depreciation in a period by the gold produced in the same period. Free cash flow is defined as cash flows from operating activities before dividends paid, less additions to property, plant and equipment. Management considers free cash flow to be an indicator of cash available for repaying debt, funding exploration and paying dividends.
See Annual Financial Report—Overview—Five-year financial performance—Group operating statistics—Footnote 1, Annual Financial Report—Overview—Five-year financial performance—Group operating statistics—Footnote 2, Annual Financial Report—Overview—Five-year financial performance—Group operating statistics—Footnote 3, Annual Financial Report—Overview—Five-year financial performance—Group operating statistics—Footnote 4, Annual Financial Report—Overview—Five-year financial performance—Group financial statistics—Footnote 4 and Annual Financial Report—Overview—Five-year financial performance— Group financial statistics—Footnote 5 for more information.
Conversion Rates
Certain information in this annual report presented in Rand has been translated into US dollars. Unless otherwise stated, the conversion rate for these translations is R12.36/US$1.00 which was the closing rate on 31 December 2017. By including the US dollar equivalents, Sibanye-Stillwater is not representing that the Rand amounts actually represent the US dollar amounts shown or that these amounts could be converted into US dollars at the rates indicated.
The Acquisitions of STILLWATER, the Rustenburg Operations and Aquarius
On 9 December 2016, Sibanye-Stillwater announced it had reached a definitive agreement to acquire Stillwater Mining Company (Stillwater) for US$18 per share in cash, or US$2,200 million in aggregate (the Stillwater Transaction). On 25 April 2017, at the shareholders meeting of Sibanye-Stillwater, the Sibanye-Stillwater shareholders approved the proposed Stillwater Transaction by voting in favour of the various resolutions to give effect to the Stillwater Transaction and at the shareholders meeting of Stillwater, the requisite majority of Stillwater shareholders resolved to approve the Stillwater Transaction. Sibanye-Stillwater obtained control of Stillwater on this date. The effective date of the implementation of the Stillwater Transaction was 4 May 2017, when Sibanye-Stillwater took over legal ownership of Stillwater.
On 9 September 2015, Sibanye-Stillwater announced that it entered into an agreement with Rustenburg Platinum Mines Limited (RPM), a wholly owned subsidiary of Anglo American Platinum Limited (Anglo American Platinum) to acquire the Bathopele, Siphumelele (including Khomanani), and Thembelani (including Khuseleka) mining operations, two concentrating plants, an on-site chrome recovery plant, the Western Limb Tailings Retreatment Plant, associated surface infrastructure and related assets and liabilities on a going concern basis (the Rustenburg operations) (the Rustenburg operations Transaction). On 19 October 2016, Sibanye-Stillwater obtained consent in terms of section 11 of the Mineral and Petroleum Resources Development Act for the transfer of the mining right and prospecting right pursuant to the Rustenburg operations Transaction, and control of the Rustenburg operations on this date. The effective date of the implementation of the transaction was 1 November 2016, when Sibanye-Stillwater took over legal ownership and management of the Rustenburg operations.
On 6 October 2015, Sibanye-Stillwater announced a cash offer of US$0.195 per share for the entire issued share capital of Aquarius Platinum Limited (Aquarius) (the Aquarius Transaction and, together with the Rustenburg operations Transaction and the Stillwater Transaction, the Acquisitions). Aquarius owns stakes in the Kroondal mine and Platinum Mile retreatment facilities near Rustenburg in South Africa and the Mimosa joint venture with Impala Platinum in Zimbabwe. The Aquarius Transaction was subject to the fulfilment of various conditions precedent which were completed on 12 April 2016, when Sibanye-Stillwater paid R4,301.5 million to the Aquarius shareholders and obtained control of Aquarius.
| |
Sibanye-Stillwater | Form 20-F 2017 | 5 |
market information
This annual report includes industry data about Sibanye-Stillwater’s markets obtained from industry surveys, industry publications, market research and other publicly available third-party information. Industry surveys and industry publications generally state that the information they contain has been obtained from sources believed to be reliable but that the accuracy and completeness of such information is not guaranteed. Sibanye-Stillwater and its advisers have not independently verified this data.
In addition, in many cases statements in this annual report regarding the gold and PGM mining industry, and Sibanye-Stillwater’s position in these industries have been made based on internal surveys, industry forecasts, market research, as well as Sibanye-Stillwater’s own experiences. While these statements are believed by Sibanye-Stillwater to be reliable, they have not been independently verified.
| |
Sibanye-Stillwater | Form 20-F 2017 | 6 |
In this annual report, all references to “we”, “us” and “our” refer to the Sibanye-Stillwater and the Sibanye-Stillwater Group, as applicable.
In this annual report, all references to “fiscal 2018” and “2018” are to the fiscal year ending 31 December 2018, all references to “fiscal 2017” and “2017” are to the audited fiscal year ended 31 December 2017, all references to “fiscal 2016” and “2016” are to the audited fiscal year ended 31 December 2016, and all references to “fiscal 2015” and “2015” are to the audited fiscal year ended 31 December 2015.
In this annual report, all references to “South Africa” are to the Republic of South Africa, all references to the “United States” and “US” are to the United States of America, its territories and possessions and any state of the United States and the District of Columbia, all references to the “United Kingdom” and “UK” are to the United Kingdom of Great Britain and Northern Ireland, all references to “Zimbabwe” are to the Republic of Zimbabwe, all references to “Canada” are to the Dominion of Canada and all references to “Argentina” are to the Republic of Argentina.
In this annual report, all references to the “DMR” are references to the South African Department of Mineral Resources, the government body responsible for regulating the mining industry in South Africa.
In this annual report, gold and PGM production figures are provided in kilograms, which are referred to as “kg”, or in troy ounces, which are referred as “ounces” or “oz”. Ore grades are provided in grams per metric ton, which are referred to as “grams per ton” or “g/t.” All references to “tons”, “tonnes” or “t” in this annual report are to metric tons.
In this annual report, “R”, “Rand” and “rand” refer to the South African Rand and “Rand cents” and “SA cents” refers to subunits of the South African Rand, “$”, “US$”, “US dollars” and “dollars” refer to United States dollars and “US cents” refers to subunits of the US dollar, “£”, “GBP” and “pounds sterling” refer to British pounds and “pence” refers to the subunits of the British pound.
This annual report contains references to the “total recordable injury frequency rate” (TRIFR). TRIFR includes the total number of fatalities, lost time injuries, medically treated injuries and restricted work injuries per million man hours.
| |
Sibanye-Stillwater | Form 20-F 2017 | 7 |
This annual report contains forward-looking statements within the meaning of Section 27A of the Securities Act and Section 21E of the US Securities Exchange Act of 1934, as amended (the Exchange Act) with respect to our financial condition, results of operations, business strategies, operating efficiencies, competitive position, growth opportunities for existing services, plans and objectives of management, markets for stock and other matters.
These forward-looking statements, including, among others, those relating to our future business prospects, revenues and income, the potential benefit of the Acquisitions (including statements regarding growth, cost savings, benefits from and access to international financing and financial re-ratings), PGM pricing expectations, levels of output, supply and demand, information relating to the Sibanye-Stillwater’s underground Blitz PGM project adjacent to the east of the existing Stillwater Mine designed to explore, define and extract the PGM resource along the far eastern extent of the J-M Reef (Blitz Project), and estimations or expectations of enterprise value, adjusted EBITDA and net asset values wherever they may occur in this annual report and the exhibits to this annual report, are necessarily estimates reflecting the best judgement of our senior management and involve a number of risks and uncertainties that could cause actual results to differ materially from those suggested by the forward-looking statements. As a consequence, these forward-looking statements should be considered in light of various important factors, including those set forth in this annual report. Important factors that could cause actual results to differ materially from estimates or projections contained in the forward-looking statements include, without limitation:
| · | | changes in the market price of the minerals that it mines and sells; |
| · | | fluctuations in exchange rates, currency devaluations, inflation and other macro-economic monetary policies; |
| · | | the occurrence of labour disruptions and industrial actions; |
| · | | changes in relevant government regulations, particularly environmental, tax, health and safety regulations and new legislation affecting water, mining, mineral rights and business ownership, including any interpretation thereof which may be subject to dispute; |
| · | | power disruption, constraints and cost increases; |
| · | | the outcome and consequence of any potential or pending litigation or regulatory proceedings or environmental, health or safety issues; |
| · | | the occurrence of temporary stoppages of mines for safety incidents and unplanned maintenance; |
| · | | the occurrence of hazards associated with underground and surface mining; |
| · | | failure of Sibanye-Stillwater to comply with various lender covenants and restrictions and difficulties in obtaining additional financing or refinancing; |
| · | | the ability to achieve anticipated efficiencies and other cost savings in connection with, and the ability to successfully integrate, past and future acquisitions, as well as at existing operations; |
| · | | operating in new geographies and regulatory environments where Sibanye-Stillwater had no previous experience; |
| · | | Sibanye-Stillwater’s ability to implement its strategy and any changes thereto; |
| · | | Sibanye-Stillwater’s future financial position, plans, strategies, objectives, capital expenditures, projected costs and anticipated cost savings and financing plans; |
| · | | changes in assumptions underlying Sibanye-Stillwater’s estimation of its current mineral reserves; |
| · | | supply chain shortages and increases in the price of production inputs; |
| · | | economic, business, political and social conditions in South Africa, Zimbabwe, the United States and elsewhere; |
| · | | the ability of Sibanye-Stillwater to comply with requirements that it operates in a sustainable manner; |
| · | | failure of Sibanye-Stillwater’s information technology and communications systems; |
| · | | the success of Sibanye-Stillwater’s business strategy, exploration and development activities; |
| · | | the availability, terms and deployment of capital or credit; |
| · | | Sibanye-Stillwater’s ability to hire and retain senior management or sufficient technically skilled employees, as well as its ability to achieve sufficient representation of HDSAs in its management positions; |
| · | | the adequacy of Sibanye-Stillwater’s insurance coverage; |
| · | | uncertainty regarding the title to Sibanye-Stillwater’s properties; |
| · | | social unrest, sickness or natural or man-made disaster at informal settlements in the vicinity of Sibanye-Stillwater’s African operations; |
| · | | the impact of HIV, tuberculosis and other contagious diseases; and |
The foregoing factors and others described under “Risk Factors” should not be construed as exhaustive. There are other factors that may cause our actual results to differ materially from the forward-looking statements. Moreover, new risk factors emerge from time to time and it is not possible for us to predict all such risk factors. We cannot assess the impact of all risk factors on our business or the extent to which any factor, or combination of factors, may cause actual results to differ materially from those contained in any forward-looking statements. Given these risks and uncertainties, you should not place undue reliance on forward-looking statements as a prediction of actual results.
We undertake no obligation to update publicly or release any revisions to these forward-looking statements to reflect events or circumstances after the date of this annual report or to reflect the occurrence of unanticipated events.
| |
Sibanye-Stillwater | Form 20-F 2017 | 8 |
| |
Sibanye-Stillwater | Form 20-F 2017 | 9 |
| |
Sibanye-Stillwater | Integrated Annual Report 2017 | 10 |
This integrated report covers the operational, financial and non-financial performance of the operations and activities of Sibanye Gold Limited, trading as Sibanye-Stillwater. It provides stakeholders with transparent insight into our strategy, our business and performance, and the progress made in delivering on our strategic objectives and our commitment to creating stakeholder value during the year to 31 December 2017. This report, which includes sustainable development- related information, is the primary report in our 2017 suite of reports and takes note of any material events since year-end and the date of approval by the Board.
SCOPE AND BOUNDARY
The scope and boundary of this report have been amended to take into account the regional organisational restructuring undertaken following the significant transformation the Group has undergone in the past two years (see Corporate profile) in order to ensure continued delivery on its strategic operating objectives.
Sibanye-Stillwater’s operating assets are grouped regionally as follows:
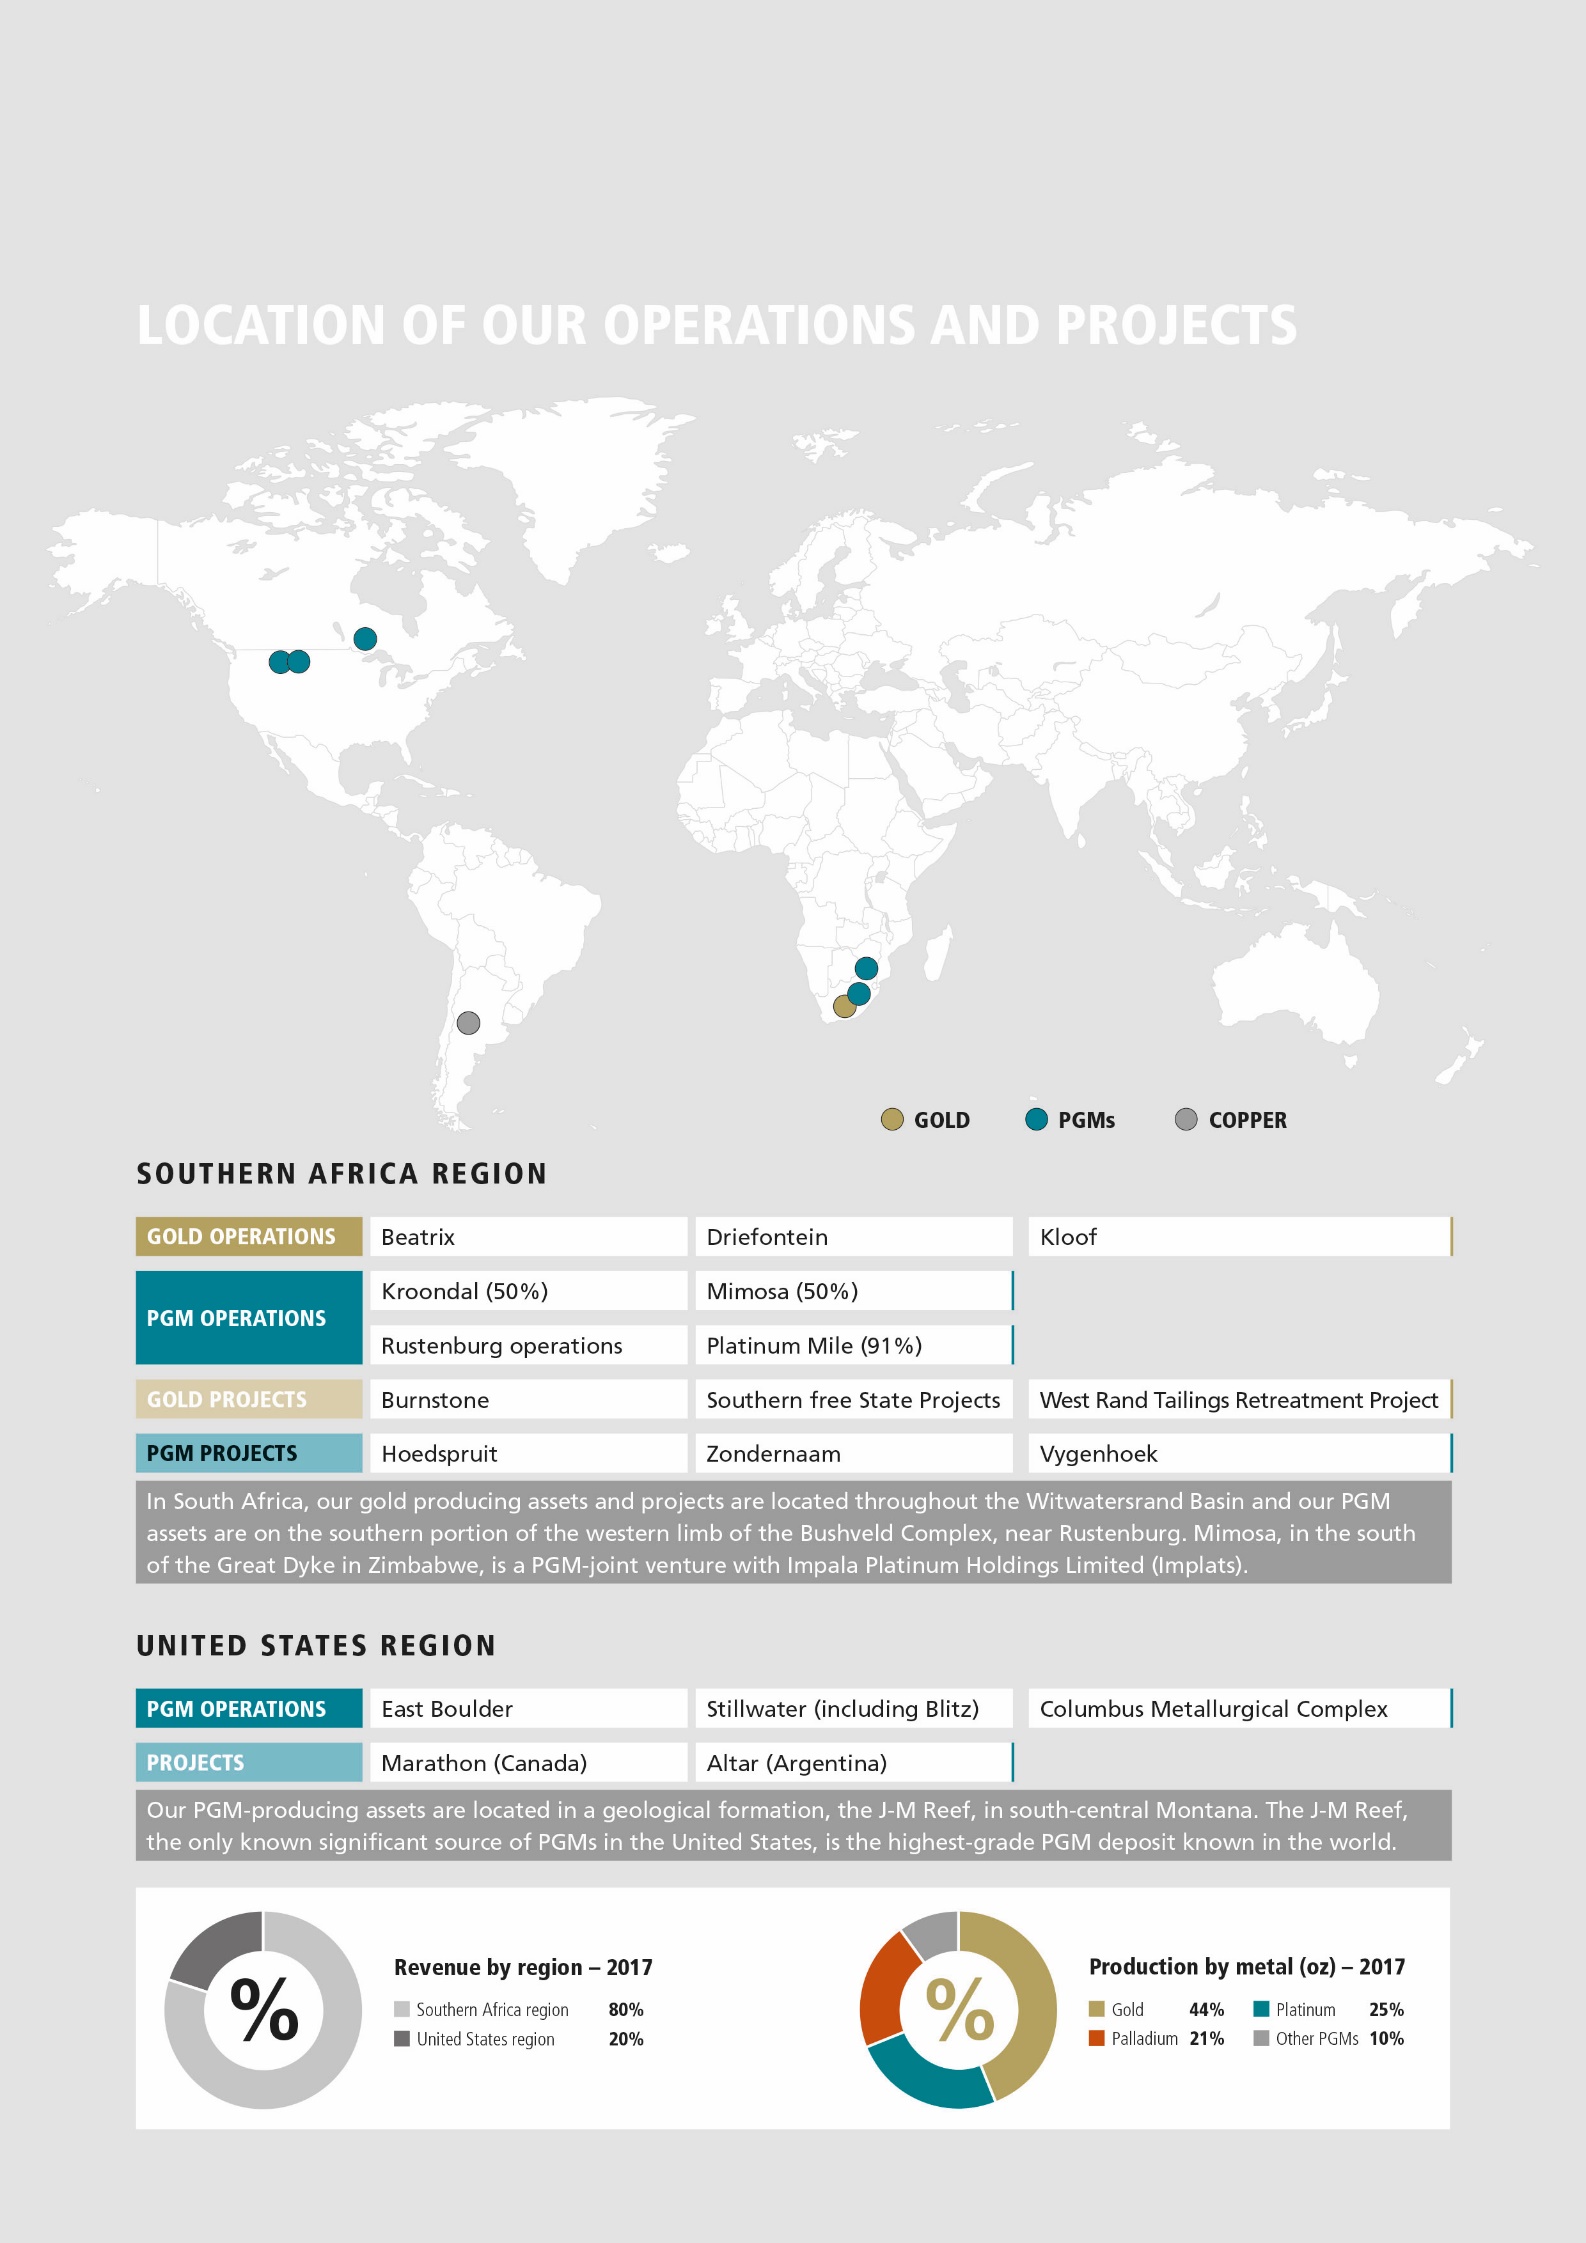
Southern Africa (SA) region – gold and platinum group metal (PGM) mining operations and projects
United States (US) region – PGM mining operations and projects. Annual comparative data is provided where applicable. For the 2017 financial year, annual data is provided where possible by region, type of operation and at group level.
Note that the annual data provided at group-level for 2013 to 2015 is now comparable to that for the SA region’s gold operations for 2016 and 2017. Where data for previous years has been restated, this is indicated.
The 2016 data reported for the Platinum Division is now comparable to that reported for the SA region’s PGM operations, with Kroondal, Mimosa and Platinum Mile included for nine months of 2016 and the Rustenburg operation for two months. These operations were included for the full 12 months in 2017.
The US region’s PGM assets are those of the Stillwater Mining Company (Stillwater) which were acquired effective May 2017 and are included for eight months of the year (unless otherwise specified).
REPORTING PHILOSOPHY
In this integrated report, our primary report, the information provided is intended to inform stakeholders about Sibanye-Stillwater’s operating and financial performance and progress made in delivering on our strategy. While the principal audience for this report is investors and shareholders, we recognise that there are other stakeholders who have varied and specific information requirements, many of which we aim to fulfil, particularly as we do not produce a separate sustainable development report. Instead all non-financial reporting is either included in this integrated report or is available on the website, where referenced.
We have endeavoured to build on the information provided in the 2016 integrated report. This report describes what we accomplished in 2017 to create value, to improve lives and to achieve our strategic objectives. In so doing, we give an account of the impact of our activities and, more importantly, of those factors and risks, both in the external environment and internally, that have had an impact on our ability to achieve our strategic objectives and to create superior value in the past year. The process to determine the most material of these is described in –View from the top–Managing our material risks.
This report is intended to enable stakeholders to determine whether the material issues identified will affect the sustainability of Sibanye-Stillwater’s business and its ability to create and sustain value in the short, medium and long term.
APPROVAL AND ASSURANCE
Sibanye-Stillwater’s internal audit function provides an objective evaluation of the Group’s internal control processes and systems that have been devised to mitigate business risks and has ensured the accuracy of the information presented in these reports.
See Further Information—Controls and procedures for managements attestation on the effectiveness of Sibanye-Stillwater’s internal control over financial reporting as of 31 December 2017.
| |
Sibanye-Stillwater | Integrated Annual Report 2017 | 11 |
Sibanye-Stillwater, an independent, global, precious metals mining company, produces a unique mix of metals that includes gold and PGMs.
Globally, Sibanye-Stillwater, is the third largest producer of platinum and palladium, and features among the world’s top gold producing companies.
Domiciled in South Africa, Sibanye-Stillwater owns and operates a portfolio of high-quality operations and projects, which are located and managed in two regions: the Southern Africa (SA) region and the United States (US) region.
TRANSFORMING OUR COMPANY
Since its establishment in 2013, the company has transformed itself, geographically and by metal produced. From being a South African gold mining company, Sibanye-Stillwater is now an internationally competitive, diversified precious metals miner producing gold and PGMs. With the formal acquisition of Stillwater in May 2017, Sibanye Gold Limited was rebranded as Sibanye-Stillwater.
Our planned growth momentum continued in 2017 with the announcements towards year-end of the proposed acquisition of Lonmin plc (Lonmin), one of the largest PGM producers in South Africa, and the vending of certain of Sibanye-Stillwater’s surface gold tailings facilities and processing assets into DRDGOLD Limited (DRDGOLD), a world leader in the field, for a 38% shareholding.
OUR VALUE-CREATION JOURNEY
2013 | 2016 | 2017 | 2018 |
South African gold mining company with mature, short-life operations | Entry into the Southern African PGM sector | Becoming a global, precious metals miner | Our value-creation journey continues |
Implemented our operating model and reduced costs to: – improve flexibility and quality of mining – increase reserves – extend operating life – reduce debt/gearing – deliver consistent industry-leading returns | Value-accretive acquisitions at a low point in the PGM price cycle Innovative financing of strategic growth enhances value Implemented our operating model at the newly acquired PGM assets Consolidation synergies yielding superior value | Stillwater acquisition leads to creation of a globally competitive, South African- based mining company Successful refinancing of the bridge loan and US$1 billion rights offer, the US$1.05 billion bond issue and the US$450 million convertible bond | • Awaiting formal approval of: – Proposed acquisition of Lonmin – Planned partnership with DRDGOLD on retreatment of surface gold tailings |
ENTERPRISE VALUE1 R10 billion | ENTERPRISE VALUE1 R32 billion | ENTERPRISE VALUE1 R58 billion | |
1 Enterprise value, or EV, is a measure of a company’s total value, often used as a more comprehensive alternative to equity market capitalisation. Enterprise value is calculated as the market capitalisation plus debt and minority interests and preferred shares, minus total cash and cash equivalents. It is calculated as at 31 December of each year.
| |
Sibanye-Stillwater | Integrated Annual Report 2017 | 12 |
location of our operations and projects
LISTINGS
Sibanye-Stillwater has its primary listing on the JSE, South Africa, where it is included in the FTSE/JSE Responsible Investment Index. The company is also listed on the NYSE, with its shares quoted as American Depositary Receipts (ADRs). For further details, see Shareholder information as well as our corporate website, www.sibanyestillwater.com.
At 31 December 2017, Sibanye-Stillwater’s market capitalisation was R34.3 billion (US$2.7 billion) and 2016: R23.6 billion (US$1.7 billion).
| |
Sibanye-Stillwater | Integrated Annual Report 2017 | 13 |
OUR PRODUCTS
GOLD | PLATINUM GROUP METALS | BY-PRODUCTS |
In our SA region, Sibanye-Stillwater mines, extracts and processes gold-bearing ore to produce a beneficiated product, doré, which is then refined further at Rand Refinery Proprietary Limited (Rand Refinery) into gold bars with a purity of at least 99.5% in accordance with the London Bullion Market Association’s standards of Good Delivery. Sibanye-Stillwater holds a 33% interest in Rand Refinery, one of the largest global refiners of gold, and the largest in Africa, which then markets and sells the refined gold on international markets to customers around the world. The main sources of demand for gold are as a store of value (such as central bank holdings), as an investment (exchange traded funds, bars and coins), for jewellery and for various industrial purposes | At our PGM operations in South Africa and Zimbabwe, the primary PGMs produced are platinum, palladium and rhodium, which together with the gold occurring as a co- product, are referred to as 4E (3PGM+Au), by ratio approximately 58% platinum (Pt), 32% palladium (Pd), 8% rhodium (Rh) and 2% gold (Au). The PGM-bearing ore mined here is processed to produce PGMs-in- concentrate, which is currently processed further by third parties. The US operations primarily produce palladium and platinum (78% Pd and 22% Pt), which are referred to as 2E (or 2PGM). The PGM-bearing ore mined is processed, smelted and refined to produce a PGM-rich filter cake. A third party refines the filter cake further. The major sources of demand for PGMs are for autocatalytic convertors and jewellery. Together, these two areas account for around 72% of platinum demand while, for palladium, autocatalytic convertors account for 80% of demand for that metal.* | At our PGM operations, the minor PGMs – iridium and ruthenium – are produced as co-products. They, together with the three primary PGMs, are referred to as 6E (5PGM+Au). In addition, at the SA PGM operations, nickel, copper and chrome, among other minerals, are produced as by-products. |
| * Source: Johnson Matthey | |
| |
Sibanye-Stillwater | Integrated Annual Report 2017 | 14 |
OUR CORE PURPOSE
Sibanye-Stillwater’s mining improves lives
OUR VALUE PROPOSITION
| | |
Employees By providing employment, Sibanye-Stillwater enables those employed to earn an income, acquire skills and, with training and development, to advance in a work environment where their safety, health and wellbeing are priorities. | Shareholders Sibanye-Stillwater delivers value to shareholders by delivering superior returns through capital appreciation, spurred by operational efficiency, cost- efficient capital management and acquisitive growth. | In living our values, we show that we care about safe production, our stakeholders, our environment, our company and our future. Our approach is holistic. We are focused on delivery on all strategic imperatives critical to Sibanye-Stillwater’s long-term success |
Communities Sibanye-Stillwater contributes to communities, broader society (including suppliers), and the economy by investing in socio-economic development initiatives, employing those who reside in the vicinity of our operations and through preferential local procurement. | Government Sibanye-Stillwater contributes directly to the national fiscus by way of taxes and royalties paid, enabling government to provide social infrastructure and services. We also contribute indirectly through the payment by employees of personal income tax and of municipal rates and taxes. | 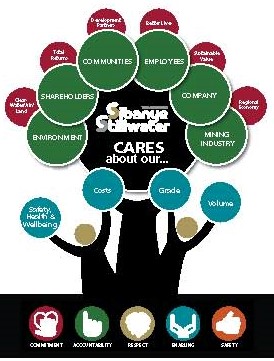
|
OUR VISION
Superior value creation for all our stakeholders through the responsible mining and beneficiation of our mineral resources.
OUR STRATEGY
In order to deliver on our vision to create superior value and improve lives, Sibanye-Stillwater aims to deliver sustained, positive cash flows to ensure robust profitability throughout the commodity cycle.
| |
Sibanye-Stillwater | Integrated Annual Report 2017 | 15 |
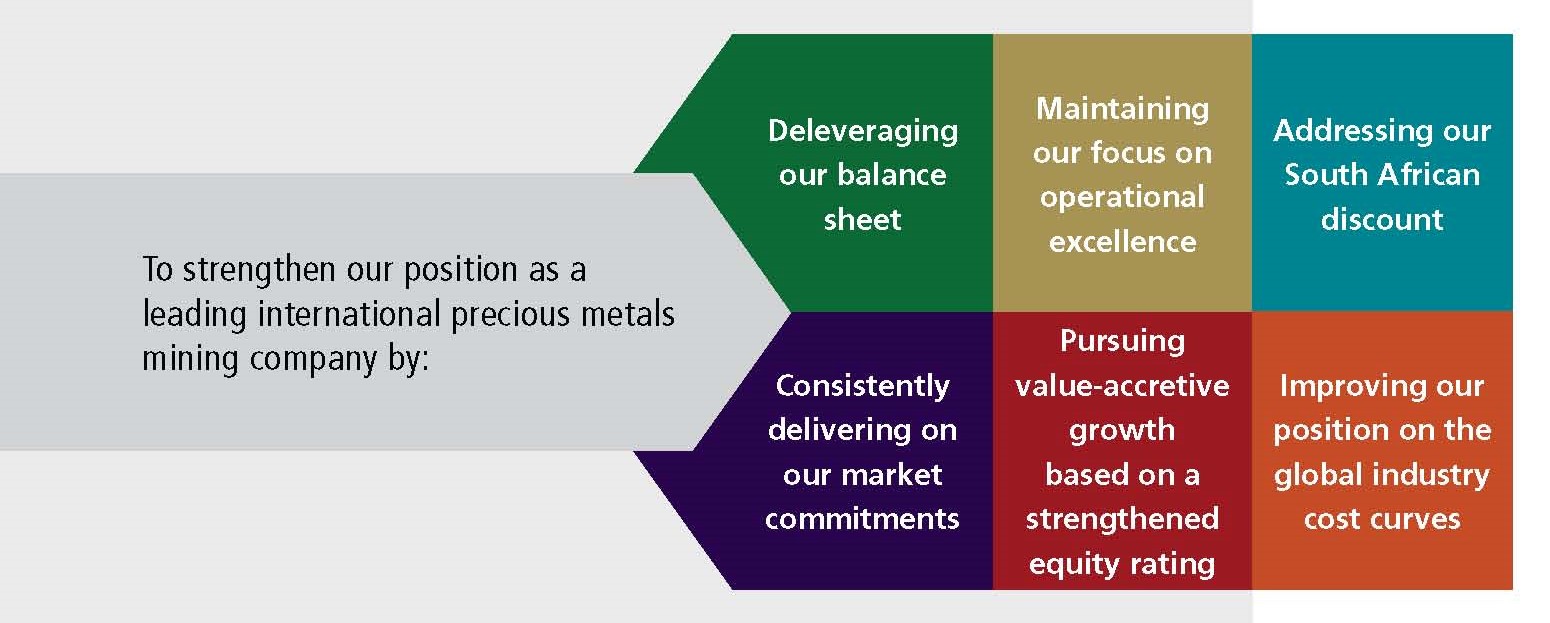
OUR THREE-YEAR STRATEGIC GOAL
OUR FOUR-STEP VALUE-ACCRETIVE PGM STRATEGY
APRIL 2016 | NOVEMBER 2016 | MAY 2017 | 2018 |
AQUARIUS | RUSTENBURG
OPERATIONS | STILLWATER | PROPOSED ACQUISITION OF LONMIN1 |
• Our first entry into the PGM sector was the acquisition of Aquarius Platinum Limited (Aquarius) and its Kroondal, Platinum Mile and Mimosa assets in Southern Africa • Aquarius managed efficient and productive assets • Since acquisition, these assets have increased their levels of operational performance | • Acquired the Rustenburg operation, located adjacent to Aquarius’ Kroondal mine, from Anglo American Platinum • A smart transaction structured to reduce risk and aligned with our outlook for the platinum price • Enabled realisation of significant synergies with Aquarius assets and Sibanye-Stillwater • Costs and operational synergies of more than R1 billion were achieved within 14 months, exceeding plan both in extent and time (R800m over three-four years) | • Acquired high-grade, low-cost assets and a world-class growth project • A palladium producer primarily, providing upside to a robust market • Facilitated geographic, commodity and currency diversification • Significant growth potential from the lower East Boulder and lower Blitz projects as well as from the 12.2km mineralised section between the Stillwater and East Boulder mines | • Proposed acquisition announced on 14 December 2017 • Located adjacent to our current PGM operations in South Africa • Potential to realise significant synergies • Given its smelting and refining facilities, this acquisition is aligned with our mine-to-market strategy for the SA region • Replacement value of smelting and refining facilities significantly exceeds acquisition cost • Sizeable resource provides long-term optionality from advanced brownfield and greenfield project pipeline • Subject to Competition Commission and shareholder approval |
At the end of 2016, Sibanye-Stillwater’s PGM (4E) Mineral Reserves totalled 23.2Moz | | At the end of 2017, PGM assets totalled: 2E: Mineral Reserves of 21.9Moz 4E: Mineral Reserves of 22.4Moz | Lonmin has a PGM Mineral Reserve of 31.8Moz (as at 30 September 2017) |
1 The full announcement is available at www.sibanyestillwater.com/investors/transactions/lonmin
| |
Sibanye-Stillwater | Integrated Annual Report 2017 | 16 |
Sibanye-Stillwater has a portfolio of gold and PGM assets that will enable it to sustainably conduct its business as a precious metals miner for many years. We conduct our business in a world in which various external factors have an impact, whether positive or negative, on the viability of our business.
Managing these factors and their related risks is vital to our business continuity. In addition, our mining activities have an impact on:
the environment, people, employees and local communities, and broader society. We build and maintain relationships with stakeholders to minimise and manage our risk. Our CARES values, governance framework and code of ethics, which speak to our role as a responsible corporate citizen, underpin all that we do.
| | |
OUR ASSETS | OUR PRIMARY BUSINESS ACTIVITIES | WE CREATE VALUE |
To ensure sustainable value creation, Sibanye-Stillwater has established a unique, global, diversified and long-life portfolio of precious metal assets. Sibanye-Stillwater is: • a top three global producer of platinum and palladium • the largest primary producer of palladium globally • a leading recycler of PGMs globally • the largest gold producer in South Africa | • Mining underground and surface resources • Processing and refining ore mined • PGM recycling • Sale of end products • Acquiring new, value-accretive assets • Supported by: – Community and social development initiatives – Environmental management and land rehabilitation | • Identifying value-accretive acquisition opportunities that are innovatively financed to optimise value for stakeholders • Focusing on safety, productivity, cost discipline and optimising operating capital so as to contribute to positive cash flows and, ultimately, to value creation • Investing in value-accretive organic growth projects to extend operating lives and optimise return on capital |
ATTRIBUTABLE OUTPUT 2017 VERSUS 2016 |
Gold (000oz) 2017: 1,403 2016: 1,512 | PGM (4E) (000oz) 2017: 1,194 2016: 412 | PGM (2E) (000oz) 2017: 376 |
OPERATING CONTEXT AND RISK | ENGAGING WITH STAKEHOLDERS | GOVERNANCE |
• Robust processes and systems are in place to identify and manage those factors likely to have a significant impact on our ability to create value • These systems and processes are supported by internal controls that ensure our response to mitigate any impact is effective and timely • Our top material risks have been identified, together with corresponding opportunities, see Material risks and opportunities | • Stakeholder engagement is critical both to the stability and sustainability of our business • Developing and maintaining constructive, positive relationships with stakeholders helps to ensure we maintain our social licence to operate | • Our strong, principled governance framework, underpinned by our values, is aimed at ensuring: • the long-term viability of our business to sustain value creation • that we conduct our business ethically for the benefit of all stakeholders (see Corporate governance) |
ATTRIBUTABLE OUTPUT 2017 VERSUS 2016 |
Platinum (000oz) 2017: 780 2016: 239 | Palladium (000oz) 2017: 663 2016: 136 | Chrome (000t) 2017: 736 2016: 274 |
| |
Sibanye-Stillwater | Integrated Annual Report 2017 | 17 |
CAPITAL RESOURCES USED, OUTCOMES AND IMPACTS – 2017
Various capital resources are used and affected during the conduct of our mining activities and in producing gold and PGMs. These capital resources, which are interdependent, are critical sustaining business and creating value
In 2017, Sibanye-Stillwater…
... used: | … did the following: | … achieved these milestones | … created value: |
HUMAN AND INTELLECTUAL CAPITAL |
A skilled, motivated workforce, supported by training and development and relevant technologies, enhances our operational efficiency; we have a framework of policies, systems and processes in place to ensure employee safety, health and wellbeing | • Employed 66,472 (2016: 74,531) people (including contractors) – decline in total employee numbers from 2016 was due to cost optimisation undertaken that included retrenchment and downscaling of selected gold and PGM operations in the SA region • Prioritised employee engagement at newly-acquired assets • Initiated safety awareness campaigns and enhanced monitoring of safety compliance | • Improved safety performance: Fatalities: 11 (2016: 14) LTIFR: 5.78 per million hours worked (2016: 6.26) • 79.6 hours of training and skills development on average per employee in the SA region • Improved gender diversity: 13% of employees are female (2016: 12%) • Successfully implemented our organisational model and rolled out our values at newly acquired operations • Wage agreements finalised at Kroondal, Stillwater and East Boulder • Continued to progress the executive leadership development programme to ensure solid effective leadership | • Paid salaries and wages paid to employees totaling R18.5bn (2016: R9.3bn) equivalent to 42% of cost of sales before amortisation and depreciation • Spent R549m on training and development across the Group (2016: R403m), including R17.3m (US$1.3m) in the US region. The increase is mainly due to inclusion of SA PGM operations for 12 months in 2017 versus partial inclusion in 2016 • Began second phase of the Care for iMali indebtedness programme at the SA gold operations and by year-end, had reduced illegal garnishee deductions by R1.34m since 2015 • Improved health and wellbeing of employees – 12% decline in TB incidence (new and relapse) in the SA region |
FINANCIAL CAPITAL | | | |
Funds operating expenses, training and development, acquisition of natural resources and mining infrastructure, land rehabilitation, socio- economic initiatives and enhances the performance of manufactured capital. Availability of financial capital – is achieved through ensuring the right combination of equity, debt and operating cash flows –its efficient management is critical | • Had cash and cash equivalents of R968m at the beginning of the year • Acquired Stillwater for US$2.2bn (R29.3bn at R13.31/US$) • Raised US$2.65 billion bridge loan to conclude acquisition. • Net debt: adjusted EBITDA of 2.6 times following refinancing • Began the year with an enterprise value of R32bn | • Generated revenue of R46bn from sales of metals produced (2016: R31bn) • Incurred cost of sales of R36bn (2016: R25bn) • Capital expenditure of R6.1bn (2016: 4.1bn) for the Group • Bridge loan successfully refinance through a US$1 billion equity rights issue, US$1.05 billion corporate bonds and US$450 million convertible instruments, thereby ensuring a more appropriate capital structure • Debt of R26.0bn (2016: R6.3bn) | • Had cash and cash equivalents of R2,062m at year end • Acquisitions and capital restructuring has better positioned the company to unlock and create future value • Ended the year with an enterprise value of R58bn |
| |
Sibanye-Stillwater | Integrated Annual Report 2017 | 18 |
... used: | … did the following: | … achieved these milestones | … created value: |
NATURAL CAPITAL | | | |
Sustainable operations profitably accessing/ exploiting natural resources – economically viable ore-bodies – is fundamental to the sustainability of our business. In addition, natural resources – land, water, air – are impacted by our mining and processing activities | • Acquired PGM reserves (2E) of 21.903Moz with the Stillwater acquisition • Deposited 39.36Mt of waste (2016: 32.61Mt) • Replaced a substantial portion of depleted Mineral Reserves in the SA region, a result of mining and the removal of Cooke, under a tighter set of economic parameters, thus maintaining a sustainable production profile • Completed almost 20km of ore reserve development across the Group • Energy consumption was higher at 6.01TWh (2016: 4.72TWh), largely due to inclusion of SA PGM operations for full year, and acquisition of US PGM operations | • Mined/milled 36.08Mt of ore in total • Reported a 37% reduction in environmental incidents • Reduced energy intensity and GHG emissions by 43% and 41% respectively – the reduction was due to Cooke being placed on care and maintenance, the inclusion of SA PGM operations for a full year and acquisition of US PGM operations • Potable water consumption of 20,838Ml in the SA region (2016: 19,663Ml) | • With the acquisition of Stillwater have increased 2E PGM Mineral Reserves by 21.903Moz • DRDGOLD transaction establishes a commercial vehicle suited to securing long-term environmentally friendly tailings deposition on the West Rand |
SOCIAL AND RELATIONSHIP CAPITAL |
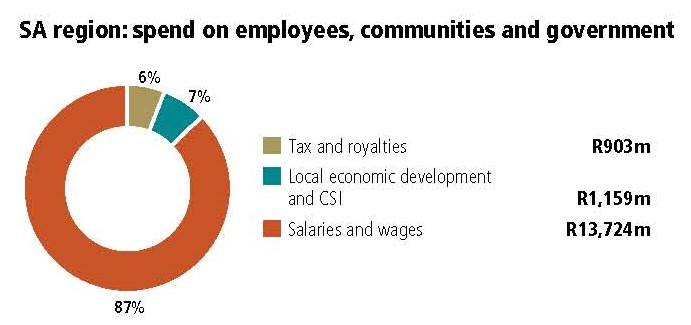
Given mining’s impact, stakeholder alignment is essential for operational sustainability and our ability to continue to deliver value to all our stakeholders. Honest, transparent stakeholder engagement ensures that we earn and maintain our social and legal licences to operate | • Engaged with key stakeholders on: – Mining Charter – Proposed acquisitions – Occupational lung disease – Community development – Safety • Continued with remaining SLP projects | • The Good Neighbour Agreement in force in the US region is a good example of how co-operation with stakeholders can be beneficial to maintaining a social licence to operate – aspects of which will be applied in the SA region • Enterprise development centres being established in the SA region | • Paid R903m to governments in taxes and royalties (2016: R1,733m) • Invested R1,161m in socio-economic development, of which R1,159m was in the SA region (2016: R656m) • Procurement spend of R24.7bn • BEE procurement spend in the SA region of R10.6bn or 79% of discretionary spend (2016: R7.6bn or 77% respectively) |
MANUFACTURED CAPITAL | | | |
Acquiring, maintaining and developing the infrastructure (plant, property and equipment) required by a mining company and optimised processes are essential to cost-efficient operations | • Spent R1.3bn at group level on sustaining capital, including maintenance, of which R1.1bn was in the SA region • Spent R593m on growth projects in the SA region • Acquisition of the Stillwater and East Boulder mines, the Blitz project and the Columbus Metallurgical Complex • Announced proposed acquisition of additional PGM assets (Lonmin) and of potential gold tailings retreatment partnership with DRDGOLD | • Blitz project commissioned three months ahead of schedule • Repositioned and diversified the Group geographically, operationally and with regard to product mix • Invested R13m in research and development • Invested R395m on further development of Burnstone | • Created a unique, leading, global precious metals producer • Became a top three global PGM producer • Plans in place to establish a full mine-to-market pipeline for PGM operations in the SA region |
| |
Sibanye-Stillwater | Integrated Annual Report 2017 | 19 |
It is a privilege to once again present this integrated report on behalf of the Sibanye-Stillwater Board to all of our stakeholders.
In recent years, the Company has undergone a significant strategic evolution from a single commodity, gold mining company with its asset base entirely located in South Africa, into a geographically diversified, uniquely positioned, international precious metals company.
Change of this magnitude is never easy and is often accompanied by periods of discomfort and uncertainty, and this has indeed been the case for Sibanye-Stillwater. The rapid execution of our strategy and growth to become a leading global PGM producer has resulted in the Group having to temporarily take on levels of debt that are well above those which have historically been maintained.
This rapid acquisition growth strategy and the resultant impact on the capital structure of the Group were carefully considered by management and the Board. While uncontrollable exogenous factors, such as the recent strength in the rand, present challenges, the Board is confident that, given the inherent flexibility of the broader Sibanye-Stillwater Group, there are no immediate material risks that cannot be dealt with. We are confident that management has sufficient operational and financial levers at its disposal to weather an extended period of rand strength, and that the Group is uniquely positioned to benefit substantially under more constructive market conditions and to deliver superior and sustainable value for shareholders and all other stakeholders.
One of the challenges identified by the Board during this period of rapid growth and change is maintaining the focus on safe delivering of operational targets and integration synergies. As a significant employer in South Africa, the safety of our employees is a priority and despite the improved safety performance across the Group in 2017, the recent spate of fatalities in 2018 is of concern. The Board has asked senior management to review the circumstances leading to these incidents and to take appropriate action. We are confident that there is proper focus on this aspect and plans are being made to mitigate future incidents.
In the CEO’s review, Neal Froneman provides significant detail on the transformative nature and benefits already accruing from recent acquisitions, as well as the strategic rationale of pending transactions, which were recently announced. The Group financial and operational performance for 2017 and outlook are also covered in detail elsewhere, so I will avoid repetition and provide a higher level overview on the company and the current operating environment.
It is not only Sibanye-Stillwater that has recently undergone significant change, but also the political and economic environment in which we operate.
South Africa has experienced a marked political shift, with the election in December 2017 of Cyril Ramaphosa as ANC president, in a tightly contested ANC elective and policy conference. It is still too early to ascertain what the effects will be of this change in leadership and possible political direction in the ANC on the fortunes of the country. Swift and decisive actions taken by the ANC in early 2018, most importantly resulting in the early resignation of the incumbent South African President Jacob Zuma, and apparent commitments to dealing with corruption and to stimulating investment and economic growth in South Africa, have been positively received by the market.
For the South African mining industry in particular, the appointment of Gwede Mantashe as Minister of Mineral Resources in February 2018 has been broadly welcomed. The mining industry’s relationship with the previous Minister was largely hostile and unproductive, and the appointment of a Minister with significant mining experience and a greater understanding of the dynamics of the industry is encouraging. The public recognition by Mr Ramaphosa of the critical importance of the mining industry to the success of the country also suggests a different approach to that which has stifled investment in the sector in recent years.
In February this year, the Chamber of Mines, on behalf of its members, agreed jointly with the Department of Mineral Resources (DMR) to postpone its court application, which was due to be heard by the High Court on 19 February 2018 in respect of the Reviewed Mining Charter that had been gazetted by the previous Minister of Mineral Resources, Mosebenzi Zwane, in June 2016. The postponement followed engagement with President Ramaphosa during which he indicated his commitment to resolving the impasse over the Mining Charter and to facilitating a process to develop a new Mining Charter that included all stakeholders and that was in the interests of the industry and the country as a whole.
Ideally, a new well-designed Mining Charter that is agreed on and supported by all parties in an inclusive process must be finalised as soon as possible. The mining industry believes that this inclusive process should involve meaningful engagement and negotiation with representation across a broad range of stakeholders, including government, business, labour and communities.
The South African mining industry, represented by the SA region: spend on employees, communities and government, Chamber of Mines, including our own Sibanye-Stillwater, remains ready and willing to play its part in building the South African mining industry and economy, while recommitting to further transformational progress and growth, to ensure the industry’s sustainability.
Despite publicly and in a forthright manner raising our concerns on the political and socio-economic outlook for South Africa under the previous regime, Sibanye-Stillwater has remained a proudly South African company and a mining champion, even as it has begun to reposition itself to be competitive in the global industry. In the five years since Gold Fields unbundled three mature, labour-intensive high-cost South African gold mines, which were perceived by the market as nearing the end of their operating lives, Sibanye-Stillwater has become the lowest cost producer of the major gold producers in South Africa, as well as a top three global PGM producer.
In this time, we have significantly extended the operating lives of our gold assets and newly-integrated PGM assets, thus maintaining sustainable, valuable employment. In addition we have invested over R15 billion (increasing potentially to R20 billion should the Lonmin transaction be approved) in growing our gold and PGM portfolio in the Southern Africa region and, in 2016, we committed in excess of about R3.5 billion towards capital to growth projects. This is in addition to the significant contribution of about R16 billion made in 2017 to the local economy in salaries and wages paid, local economic development expenditure, local procurement and the payment of state taxes and royalties. This is 37% more than we spent in 2016.
| |
Sibanye-Stillwater | Integrated Annual Report 2017 | 20 |
The Group currently employs more than 65,000 people in South Africa and should the Lonmin transaction be approved, will employ more than 85,000 people in South Africa. It would mark Sibanye-Stillwater as one of the largest employers in the country. As highlighted elsewhere in this report, given the multiplier effect that each job has in the economy, more than 1.4 million South Africans are beneficiaries (direct and indirect) of the jobs provided by Sibanye-Stillwater. Moreover, Sibanye-Stillwater is one of the state-owned utility Eskom’s largest consumers of electricity and therefore is critical to the ongoing viability of that financially troubled entity.
Sibanye-Stillwater’s fortunes are therefore inextricably linked to those of South Africa. Recent political events, which are generally perceived as positive for the South African mining industry, should have positive consequences for the Group. At this stage, these potential benefits are unquantifiable and have not yet been positively reflected in the relative ratings of South African mining companies. The positivity and euphoria following the recent political changes have, however, resulted in significant appreciation in the rand, which, assisted by US dollar weakness, appreciated by 10%, from an average of R13.3/US$ for 2017 to current levels of approximately R11.90/US$.
This recent relative strength in the currency is negatively impacting revenues and margins across the South African mining industry. While certain commodity prices have rebounded strongly in 2018, in some cases totally offsetting the stronger rand, precious metal prices in general have been less fortunate, with the dollar price of gold currently flat year-on-year. Despite the exceptional price gains for palladium and rhodium, the average South African basket price has only increased marginally owing to continued weakness in the platinum price.
The outlook for gold remains relatively muted, with expectations of the US Federal Reserve raising rates in the US, capping upside in 2018. Gold demand remains relatively firm, however, and the spectre of rising global inflation is likely to provide ongoing support below US$1,300/oz in our view. The outlook for PGMs is more positive. Supply deficits in palladium are expected to be sustained for some time while rhodium should benefit from higher loadings on catalysts, which will offset the negative impact that declining diesel vehicle sales are having. Platinum is expected to remain in surplus in 2018, albeit lower than in 2017, which should help to maintain current price levels in 2018. Thereafter, the platinum market is expected to return to deficit as supply from South Africa continues to decline with positive consequences for the price.
The recent rand strength, if sustained, and its impact on operating margins and cash flows in the SA region in 2018, will be offset partly by the already tangible diversification benefits being delivered by the US PGM operations. These are generating substantial operating cash flows, which will be further boosted by the Blitz project as this ramps up to full production in 2021.
As previously mentioned, management has at its disposal, and has already begun to apply, various operational and financial levers to weather and manage an extended period of rand strength. These include a full review of non-essential capital expenditure as well as of the operations, assessing innovative ways to significantly reduce debt and management’s forgoing salary increases in the short term. This review, once completed and acted on, will help to better position Sibanye-Stillwater to continue delivering value to all stakeholders. The Board is confident that the current environment, while challenging, does not pose a material risk to the sustainability of our business.
Sibanye-Stillwater has embraced the outcomes-based philosophy of King IV and begun the process of aligning our corporate governance structures and practices with the principles of King IV. While this process is still underway, we have nevertheless substantially adopted the disclosure requirements recommended by King IV to the extent possible in this integrated report. We are cognisant of our responsibilities, particularly given our Sibanye-Stillwater CARES values, to be ethical and to act responsibly in all that we do and in delivering on our strategy.
RECOGNITION
I would like to extend my thanks to those directors who resigned from the Board during the year – Messrs Christopher Chadwick, Robert Chan and Jiyu Yuan. Their support and contributions to Board deliberations were useful and insightful. I take this opportunity too, to welcome Mrs Savannah Danson, who joined our Board in May 2017.
Following what has been a highly successful 2017, we embark on 2018 full of confidence in the sustainability of our operations. I am personally grateful for the unstinting efforts of all our people to make ours the great company that it is. In particular, I extend my thanks to our CEO, Neal Froneman, and his team for leading the transformation of the company. Their strategic inputs have been invaluable in developing and transforming Sibanye-Stillwater to enable us to continue contributing to the welfare of all our stakeholders.
Sello Moloko
Chairman
29 March 2018
| |
Sibanye-Stillwater | Integrated Annual Report 2017 | 21 |
2017 will be recognised as a landmark year in the history of the company. Over the course of the past two years, primarily in 2017, the Group has fundamentally changed, from a gold mining company with its asset base located entirely in South Africa, into a geographically diversified, international precious metals company.
This transformation has been achieved in a relatively short, three-year period since we first expressed our interest in the PGM industry. In this time, we have established Sibanye-Stillwater as one of the top three global producers of platinum and palladium, while retaining our position as a leading global gold producer.
We have conclusively diversified our commodity mix as well as diversifying the geographical concentration of our operations. This has significantly reduced risk across the Group and is already delivering tangible benefits. To reflect the fundamental change in the Group, we have rebranded as Sibanye-Stillwater, which retains the value of both the Sibanye and Stillwater brands and better reflects our larger, internationally diversified profile.
What has remained constant through this period of change is our commitment to our core purpose, vision and CARES values. Our core purpose that “Our mining improves lives” captures the essence of how we operate, uplifting our employees’ and communities’ quality of life and contributing positively to broader society and the economy, not only through our operating activities, but also through the products we produce. PGMs, in particular, contribute through their superior catalytic properties to a cleaner and healthier environment. Our corporate vision of “creating superior value for all our stakeholders” and CARES values underpin our decisions and actions.
SAFETY
Safety is our principal value and we continue to focus significant effort and attention as well as resources on ensuring that our employees are able to work in a safe and conducive environment. Following a regression in our safety performance in the first half of 2016, we adopted a revised safety strategy in the SA region in the latter half of 2016 that was rolled out across all operations during 2017.
There was a significant improvement in all the main safety indicators across the region during 2017, with the SA region’s serious injury frequency rate (SIFR) improving by 14% to 3.59 per million hours worked, and the lost-time injury frequency rate (LTIFR) improving by 13% to 5.76 per million hours. Safety improvements continued through the year, with the SA gold operations, in the December 2017 quarter, recording their first fatality free quarter since March 2015.
We have now restored our leading position, among both gold and South African PGM peer companies, as the benchmark on most safety indices in the gold and PGM sectors.
Despite these improvements there were regrettably 11 fatalities in the SA region during 2017. These incidents have been thoroughly investigated and preventative action taken and rolled out where appropriate. On behalf of the Board and management, I extend my deepest condolences to the families, friends and colleagues of these employees: Sphampano Machenene, Mxolisi Cekiso, Mbuze Ncobela, Seabata Khetla, Andile Nkwenkwe, Nkosinathi Marumo, Thandisile Deku Rangwaga, Puseletso Molobogeng Mashego, Geraldo Sitoe, Sibongile Ganithuli and Moagisi Selaotswe. Consistent with our practice and policies, the families of the deceased have received, and will continue to receive, appropriate support from the company.
In the US region, the total recordable injury frequency rate (TRIFR) for 2017 was a record low of 12.7 per million hours worked, an improvement on the 12.9 reported for 2016 TRIFR. The East Boulder mine was free from lost day and serious injuries for the entire year and the US region reported no contractor injuries for the entire year.
ORGANISATIONAL RESTRUCTURING FOR EFFECTIVE DELIVERY
The significant increase in size and geographic spread of the company has required us to revise and restructure the organisation to ensure strategic alignment and delivery, role clarity and a continued focus on operational excellence.
During 2017, we transformed from a commodity-focused divisional structure, to a geographically regionalised structure, with separate regionally-focused executive teams in each region, namely, the SA region and the US region. These well-defined geographic regions are led by strong executive teams, which clearly understand the specific regional social and cultural issues, and are primarily responsible for continued delivery of operational and strategic goals. Strategy, finance, new business and other non-operational functions are the responsibility of the corporate office, which ensures that the regional leadership teams are able to focus on operational integration and delivery.
In the SA region, Robert van Niekerk was appointed Executive Vice President: SA region, where he is supported by a strong and experienced team. Robert has served as an executive of the Group since 2013, and has played a key role in improving organisational effectiveness, most recently driving the successful integration of the SA PGM operations. In the US region, Chris Bateman, previously CFO of Stillwater since 2014, was appointed as Executive Vice President: US region. He is also supported in this role by a regional executive team.
The effectiveness of this approach is evident in the successful integration of the SA PGM operations in 2017, which has exceeded expectations, and the efficient integration of the Stillwater operations, which have maintained operational consistency. Continued operational delivery and the successful integration of new acquisitions during periods of rapid growth and change, endorses the current organisational structure and operating model, which we are confident is appropriate for our current and future requirements.
2017 IN REVIEW – A YEAR OF OPPORTUNITY AND DELIVERY
Strategic review
Sibanye-Stillwater’s rapid and comprehensive growth into the top ranks of the global PGM industry appears to have surprised many market observers and commentators. This corporate transformation has been swift, but has been consistent with our clearly communicated strategy to pursue growth in the sector. Moreover, we have consistently said that accomplishing this strategy involved four steps, which would result in us becoming a leading mine-to-market producer. After successfully reducing operating costs and stabilising our gold operations during 2013, our strategic focus shifted to profitably growing and sustaining the business beyond the life of our gold assets. Opportunities for meaningful, value
| |
Sibanye-Stillwater | Integrated Annual Report 2017 | 22 |
accretive growth in the South African gold industry were limited and it was clear that alternative options were necessary in order to ensure the sustainability of the Group in the long term.
In early 2014, after having completed detailed research on the PGM industry and the fundamental outlook for PGM supply and demand, we signalled our intent to grow in the industry. At the time, the strategic rationale was clearly communicated to the market, as summarised below:
• Low PGM prices and escalating input costs (labour and utilities) had put balance sheets under strain, creating opportunities for value-accretive acquisitions
• The industry had avoided necessary restructuring of loss- making production
• The SA PGM sector offered a number of consolidation opportunities
• The PGM industry operating environment shares many similarities with the gold industry:
– medium depth, tabular, hard rock mining
– labour-intensive (mainly utilising conventional mining methods)
There was a clear opportunity to leverage Sibanye-Stillwater’s successful South African operating model and experience to unlock value with long-term PGM supply and demand fundamentals remaining robust.
This rationale has since been justified and endorsed, by the meaningful growth Sibanye-Stillwater has delivered in the PGM sector over the past three years, as well as by the successful integration of these acquisitions into the Group.
SA PGM operations – successful integration
The integration of the Aquarius and Rustenburg operations, acquired in 2016, has exceeded our expectations. Since acquisition, the SA PGM operations have consistently delivered improving production and financial results, with integration synergies significantly exceeding expectations. Approximately R1 billion in cost savings and operational synergies have been realised in the first 14 months of incorporation, well ahead of initial expectations of R800 million over a three- to four-year time frame.
Production from the SA PGM operations in 2017 of 1.19m4Eoz, was higher than guidance for the year, with all-in sustaining cost (AISC) of R10,399/4Eoz (US$782/4Eoz) also better than anticipated. As a result, together with a marginally higher average 4E PGM basket price, the SA PGM operations contributed 18% or R1.6 billion (US$120 million) to Group adjusted EBITDA in their first full year of incorporation. This is a remarkable result from assets which, before being part of Sibanye-Stillwater, had been delivering significant and sustained losses for many years.
Early in 2017, we conducted a review of the SA PGM operations with a view to potentially rationalising loss making production at the conventional shafts. Due to the strong operational performance being delivered by all the SA PGM operations, coupled with the realisation of synergies, all of the shafts were found to be contributing to group profitability and the threatened closures were averted.
US PGM operations – clear diversification benefits
The acquisition of Stillwater which was announced in December 2016 and concluded in May 2017, is a transformative transaction and the US PGM operations are already making a noticeable financial contribution to the Group. The integration of the US PGM operations has proceeded smoothly, with the operating performance steady and the critical Blitz project being commissioned three months ahead of plan.
The transaction was also well timed, with the palladium price increasing by more than 60% from acquisition on 4 May 2017 to 31 December 2017. The palladium price increase has particularly benefited the profitability of the US PGM operations, which produce a PGM basket comprising about 78% palladium and 22% platinum.
The US PGM operations contributed R2.1 billion (US$161 million) (24%) to Group adjusted EBITDA for the eight months since acquisition. Notably, given the recent strength in the rand, which has impacted margins of all of our South African operations, this has provided welcome diversification and supports the timing of the acquisition at what we believe to be a low point in the palladium price cycle. At the 2018 average to date 2E PGM basket price of approximately US$1,035/2Eoz, Stillwater is generating an AISC margin of over 35%.
The rationale for the transaction is further supported by a detailed, independent competent persons’ report (CPR), released in November 2017, which valued the US operations at US$2.73 billion, which is higher than the US$2.24 billion acquisition price (including transaction fees of US$40 million). The CPR is available on the Sibanye-Stillwater website at: www.sibanyestillwater.com/investors/documents-circulars.
Proposed Lonmin transaction – a value-accretive, logical fourth step
We have for some time, clearly signalled the importance of becoming a “mine-to-market” producer in South Africa and our intention to conclude a “fourth step” in our PGM strategy. The proposed acquisition of Lonmin, announced on 14 December 2017, will, if successful, complete that fourth strategic step.
The proposed integration of Lonmin will add a commercially attractive smelting and refining business and sizeable PGM Mineral Reserves and Resources, which provide significant optionality to higher PGM prices. A detailed due diligence of Lonmin has identified R730 million in annual overhead cost savings and a further R780 million in processing synergies which could be realised in full by 20211. The successful conclusion of this transaction will bring greater stability to Lonmin as well as to communities in the Rustenburg region.
1For further information relating to the synergies expected from the Lonmin acquisition, refer to page 17 and pages 58 – 60 for detail on the offer/ announcement dated 14 December 2017, available at www.sibanyestillwater.com/investors/transactions/lonim/documents
SA gold operations
The year under review was a period in which the gold price essentially remained in a phase of consolidation, after a steep decline from Brexit related peaks in mid-2016. During 2017, gold’s spot price in London averaged $1,254/oz, which was flat year-on-year. In rand terms, the average price received of R536,378/kg was 9% lower than the average received for 2016. Adjusted EBITDA for our gold operations for the year ended
| |
Sibanye-Stillwater | Integrated Annual Report 2017 | 23 |
31 December 2017 declined by 46% to R5.3 billion (US$399 million), owing to a 7% decline in production to 43,634kg (1.4Moz) and a 9% decline in the average gold price received to R536,378/kg (US$1,254/oz). Our consistent focus has been to maintain operations that can be mined profitably and sustainably to deliver equitable benefits to all stakeholders over several years. There can, unfortunately, be no place in our strategy for supporting persistently unprofitable operations with revenues from profitable ones nor, by the same token, can we consider not mothballing unprofitable mining sections that have little prospect of being turned to profitable account. Such operations are typically those placed on care and maintenance programmes should they have the prospect of an eventual return to profitable account.
In this regard, after numerous attempts to address losses at the Cooke operations and Beatrix West mine, we entered into Section 189 consultations with relevant stakeholders, which resulted in the cessation of underground mining at the Cooke operations at the end of October 2017 and an agreement to suspend capital investment at Beatrix West. Beatrix West will continue operating its underground working and surface processing with fewer employees. Should the section return to loss in any three-month period, there will be no alternative but to place it on care and maintenance. The cessation of mining at the Cooke underground operations, while resulting in a reduction in gold production, is expected to reduce AISC for the SA gold operations in 2018 by approximately R15,000/kg (US$36/oz) (in 2017 terms). Early decisive action taken to address these loss-making operations has resulted in the SA gold operations being better positioned for the prevailing rand environment than they were in 2017.
Proposed DRDGOLD transaction – immediate value and long-term optionality
In addition to decisively addressing costs and loss making operations, we continue to assess alternative ways in which we can realise additional value from our operations and assets. In November 2017, a proposal was announced to vend certain gold surface assets on the West Rand to DRDGOLD, a leading specialist in recovering gold from mine residues. The arrangement, which was awaiting ratification by DRDGOLD’s shareholders as the year closed, will involve DRDGOLD issuing shares equivalent to 38% of its enlarged issued capital to Sibanye-Stillwater. Sibanye-Stillwater will also retain an option to increase its shareholding to a majority shareholding within a 24-month period. Through this transaction, Sibanye-Stillwater will realise immediate value from the West Rand Tailings Retreatment Project (WRTRP) (equivalent to 38% of DRDGOLD’s market capitalisation) and retain optionality to the project’s upside through this exposure, without the need to incur significant capital investment.
Capital management
Sibanye-Stillwater maintains a prudent approach to capital management, with preservation of long-term financial flexibility as a key priority. In order to conclude the transformative Stillwater acquisition, a conscious and deliberate decision was taken to temporarily increase Group debt.
The US$2.65 billion bridge loan raised for the Stillwater transaction was successfully refinanced five months after the conclusion of the transaction, via an oversubscribed US$1billion rights issue, the issue of US$1.05 billion in corporate bonds and a US$450 million convertible bond. Net debt (excluding the Burnstone Debt and including the US$450 million convertible derivative instrument) at 31 December 2017 was R23,176 million (US$1,875 million). There was a 7% reduction in net debt to adjusted EBITDA to 2.6x, compared to 2.7x at 30 June 2017
Near term liquidity is not a concern, with committed unutilised debt facilities of R3,653 million (US$296 million) at 31 December 2017. In order to manage liquidity, the Group is currently refinancing and potentially upsizing its US$350 million revolving credit facility (RCF), which matures on 23 August 2018. This will increase available RCF facilities by about US$250 million, providing additional balance sheet flexibility and terms and conditions are anticipated to mirror those of the current facility. The support for this refinancing is again a significant vote of confidence in the outlook for the Group by leading financial institutions.
Our balance sheet is now structured with appropriate levels of permanent capital and of long- and medium-term debt. Reducing balance sheet leverage is, however, a key strategic focus for the Group, and in addition to utilising cash generated from its operations, the Group is assessing various options at its disposal to ensure responsible management of its debt. As previously mentioned, these may include options such as entering into streaming agreements, inventory financing and utilising other low cost financial instruments.
The focus on deleveraging has, however, affected available funds for distribution as cash dividends. We remain committed to our vision of delivering superior return to all our stakeholders and, in this regard, the Board approved the issue of capitalisation shares in order to ensure delivery of ongoing value for shareholders. Two capitalisation shares for every 100 shares held were approved for the six months ended 30 June 2017 with a further four capitalisation shares for every 100 shares held approved at year end. The Board and management of Sibanye-Stillwater remains committed to its dividend policy and will resume cash dividends as soon as it is deemed prudent by the Board. In the interim, the issue of no par value capitalisation shares is intended to ensure that shareholders continue to benefit from an enhanced exposure to the Group.
2018 OUTLOOK
The political environment in South Africa has recently undergone substantial change. While structural changes are yet to be seen, general sentiment around the country’s prospects for economic stability and growth is more positive. This has notably reflected in the strength of the local currency, which has appreciated by 6% against the dollar in 2018 to date and, remarkably, by 18% since the beginning of 2017. At the same time, dollar-denominated precious metal prices have increased and, while the rand will continue to impact on industry margins, overall spot prices are generally higher than at the same time in 2017. While the political and regulatory outlook appears more positive, and suggests upside for the beleaguered South African mining industry, we continue to adopt a cautious and measured approach.
Focus in 2018
Sibanye-Stillwater’s development and growth has been rapid and, consequently, the strategic imperative for 2018 is one of consolidation.
Our strategic priorities for the year are to:
•reduce the Group’s financial leverage as soon as possible
•maintain our focus on operational excellence in order to achieve consistent and sustainable delivery on production and costs
| |
Sibanye-Stillwater | Integrated Annual Report 2017 | 24 |
•drive down costs
•embedding the employee value proposition
•continue with the integration and optimisation of recently acquired operations
•address the current market discount to intrinsic value
Restructuring of our SA gold operations in 2017 and realisation of significant synergies at our SA PGM operations, together with the diversification benefits already being realised from our US PGM operations, have ensured that the Group is better positioned to withstand a sustained period of low prices, and significantly geared to any increase in commodity prices or depreciation of the rand. We are, however, cognisant of the risks posed should the economic environment deteriorate further and, in this regard, have initiated a detailed review across our operations. This review is at an advanced stage and we are confident in our ability to manage our mining assets sustainably and profitably throughout the market cycle.
As discussed in the capital management section, we have already made significant progress evaluating various financial options, which would allow us to significantly reduce debt. These options do not include raising equity capital.
Sibanye-Stillwater has undergone significant change and done so under challenging circumstances at what we believe to be a low point in the commodity price cycle. We are convinced that Sibanye-Stillwater offers fundamental value and is strategically positioned to benefit from any upside in precious metals prices.
RECOGNITION
Sibanye-Stillwater understands the importance of engaged, positive and confident leaders and the active development of a winning culture. And we believe the calibre of our employees will make possible the building of that sort of culture.
I have been fortunate to have enjoyed the unwavering support of all of my colleagues throughout the Group during a period of rapid change and development for Sibanye-Stillwater. But for them, we would not have succeeded in our efforts, and I extend my heartfelt thanks to them all. I remain confident that they will continue to contribute fully to our company’s future progress.
Neal Froneman
Chief Executive Officer
29 March 2018
| |
Sibanye-Stillwater | Integrated Annual Report 2017 | 25 |
HIGHLIGHTS
• Revenue of R45.9 billion, up 47% from 2016 following the inclusion of the Aquarius and Rustenburg operations for 12 months and Stillwater operations for eight months
• Realised synergies of R1 billion in 14 months at the SA PGM operations – well ahead of our stated target of R800 million over three to four years
• SA gold operations successfully restructured for sustainability
• US Tax reforms – Federal tax rate reduced from 35% to 21%
• US$1 billion rights offer concluded in May 2017 – almost five times oversubscribed
• US$1.05 billion corporate bonds issued in June 2017 comprising two tranches: a US$500 million five-year (non-call 2) note that carries a 6.125% coupon and a US$550 million eight-year (non-call 4) note that carries a 7.125% coupon
• A US$450 million six-year convertible bond issued in September 2017 that carries a 1.875% coupon
• Production and cost guidance achieved
OVERVIEW 2017
Sibanye-Stillwater has, over the past two years, moved from being a gold only company to a uniquely positioned, global, geographically diversified, precious metals producer. The year 2017 was dominated by the acquisition and integration of Stillwater Mining Company (Stillwater) and associated financing of the transaction.
The first step in the financing of the Stillwater acquisition for cash was the syndication of the US$2.65 billion loan, which launched in January 2017 and was oversubscribed by more than US$1 billion. The second step involved the take-out of the bridge financing through a US$1 billion rights offer, a US$1.05 billion dual tranche corporate bond and a US$450 million senior unsecured guaranteed convertible bond. We were very pleased with the support we received through multiple times oversubscription on all three financing alternatives. We further believe that the pricing on both the debt instruments was competitive despite the release of Mining Charter 3 on the eve of the launch of the US$1.05 billion dual tranche corporate bond.
Our rapid growth in the PGM sector, which started with the acquisitions of Aquarius Platinum Limited (Aquarius) and the Rustenburg operations in 2016, followed by the acquisition of Stillwater in 2017, has introduced a significant debt component into the business. Net debt at the end of the year, following the purchase consideration of Stillwater of R28.8 billion, increased from R6.3 billion in 2016 to R23.2 billion in 2017. Our main leverage ratio of net debt: adjusted EBITDA increased from 0.6 times at the end of 2016 to 2.6 times at the end of 2017.
From an operational perspective, the 2017 financial year was negatively impacted by a 9% lower rand gold price received. The impact of the lower rand gold price received, together with lower gold output at Driefontein, Beatrix and Cooke, resulted in reduced revenue from the gold operations of R4.0 billion during 2017. The average basket price received at the SA region’s PGM operations was marginally higher at R12,534/4Eoz in 2017, compared with R12,209/4oz in 2016. The marginally higher 4E basket price received and the inclusion of the Aquarius and Rustenburg assets for a full year resulted in revenue from the SA PGM operations increasing by R9.5 billion. The US PGM operations (Stillwater assets) were included in our results from May 2017 and contributed US$688 million (R9.1 billion) in revenue.
Cost performance at the SA PGM operations was particularly pleasing during 2017. The AISC per 4Eoz at Kroondal, Platinum Mile and Rustenburg reduced year on year following an intensive effort to drive the synergy cost savings identified. After accounting for inflation, the AISC reduced by R570/4Eoz, R578/4Eoz and R886/4Eoz respectively at Kroondal, Platinum Mile and Rustenburg. Unit costs at Mimosa, a 50% equity-accounted investment reduced from US$765/4Eoz in 2016 to US$735/4Eoz in 2017. Unit costs at the SA Gold operations were primarily affected by the unsustainably high costs associated with the Cooke operations. These were placed on care and maintenance at the end of October 2017, following a Section 189 labour rationalisation process. The AISC (excluding the Cooke operations), amounted to R468,060/kg in 2017 compared with R450,152/kg in 2016, a 4% increase year on year. The AISC at the US PGM operations for 2017 was in line with 2016 at US$651/2Eoz.
Capital expenditure increased from R4.2 billion in 2016 to R6.1 billion in 2017. Capital expenditure at the SA gold operations declined from R3.8 billion in 2016 to R3.4 billion, mainly due to lower expenditure at the Burnstone project, and a decision to stop capital expenditure at the Cooke operations based on their profitability. Capital expenditure at the SA region’s PGM operations increased from R0.3 billion in 2016 to R1.0 billion in 2017, mainly due to the inclusion of the Aquarius and Rustenburg operations for the full year. Capital expenditure at the US PGM operations for the eight months was US$124 million (R1.7 billion) of which US$67 million (R0.9 billion) was spent on the Blitz project.
For management’s explanation of factors that have affected the Group’s financial condition and results of operations for the historical periods covered by the financial statements, and management’s assessment of factors and trends which are anticipated to have a material effect on the Group’s financial condition and results of operations in future periods, see Annual Financial Report—Overview—Management’s discussion and analysis of the financial statements.
FOCUS AREAS – 2018
The deleveraging of the company will be the primary focus through cash flow generation, earnings growth and alternative financing solutions which may include pipeline financing and metal streams. In order to maintain adequate liquidity, the refinancing and upsizing of the US$350 million RCF, maturing on 23 August 2018, to US$600 million, has been launched. The facility has been fully syndicated with a group of eight international banks having provided commitment letters. The facility documentation is expected to be executed by the end of March 2018. The terms and conditions largely mirror the current US$350 million RCF which is US$92 million drawn as at 31 December 2017. On successful completion an additional US$250 million (R3,000 million) of committed unutilised financing would be available.
The debt maturity profile for the group is illustrated in figure 1. An indicative deleveraging profile using various commodity prices and exchange rates is shown in figure 2 and indicates the estimated time frame under the various assumptions for us to reach our internal target of 1 times net debt: adjusted EBITDA.
| |
Sibanye-Stillwater | Integrated Annual Report 2017 | 26 |
In addition, the recent strong performance of the rand against the dollar continues, putting pressure on our SA gold and PGM operations. We are well within our current net debt to EBITDA covenant of 3.5 times which reverts back to 2.5 times after the end of 2018. Regional management is in the process of replanning these operations to enable us to operate and meet our commitments in a sustained low rand commodity price environment.
ACKNOWLEDGEMENT
I continue to be supported by a strong and diligent finance team across the Sibanye-Stillwater group. The group has been able to mitigate some of the adverse consequences relating to the volatile global environment in which we operate, through proactive responses by the financial team. We continue to provide relevant, qualitative information and reporting to all our stakeholders that reflect our objectives and values. I would like to take this opportunity to thank the financial team for their unwavering support and look forward to 2018.
Charl Keyter
Chief Financial Officer
29 March 2018
| |
Sibanye-Stillwater | Integrated Annual Report 2017 | 27 |
The management of our material risks entails identifying those variables, both in our external operating environment and within the company, and understanding how they might impact Sibanye-Stillwater’s ability to deliver on our strategy and achieve our strategic objectives.
Action plans are then developed and steps taken to mitigate and manage the risks identified. Simultaneously, this process enables us to identify potential opportunities for which action plans are developed and implemented, to enable Sibanye-Stillwater to fully benefit from them.
SUMMARY OF TOP 10
MATERIAL RISKS
For the 2017 year, the company identified and monitored the following top 10 material risks for the Group. As a result of recent acquisitions, which have diversified the Group geographically and in terms of the commodities produced (and hence revenue sources), there has a been a significant shift in the material risks facing the company. Diversification has reduced the potential impact of some risks which were previously considered material, but by increasing its global reach and commodity mix, additional complexities have been introduced. Further detail on each risk and mitigation measures, see —View from the top—Perspective from the Chair.
| | | |
Ranking | Description | Comparison with risks 2016 | |
1 | Failure to optimally integrate regional acquisitions and ensure ongoing operational delivery on targets | Incorporates the following risks from 2016: Delivery on operational plans Operating cost management | (1) (6) |
2 | Ability to access, service and repay debt due to external and internal factors which may impact on cash flow | Incorporates the following risks from 2016: Delivery on operational plans Operating cost management Optimising business case efficiencies for acquisitions Functional infrastructure | (1) (6) (3) (10) |
3 | Adverse regulatory changes and socio-political instability | Incorporates the following risks from 2016: Macro-economic trend management Political stability Labour relations | (7) (8) (9) |
4 | Further deterioration in South African rating and potential adverse impact on valuations and cost of financing | New risk1 | |
5 | Cost and impact of ensuring governance, regulatory, legal and accounting compliance across multiple regions and additional requirements of multi- commodity production | New risk1 | |
6 | Maintaining and obtaining operating licences and other permits in uncertain political and regulatory environments | Incorporates the following risk from 2016: Regulatory compliance and commitments relating to the MPRDA, Mining Charter and SLPs | (5) |
7 | Safety, health and environmental incidents | Incorporates the following risk from 2016: Health and safety compliance | (2) |
8 | Unrealistic expectations for business to uplift communities in South Africa | New risk1 | |
9 | Under-delivery on operational targets owing to external factors | Incorporates the following risk from 2016: Combatting/addressing product theft and illegal mining | (4) |
10 | Maintaining positive relations with employees and creating alignment with business strategy and goals | New risk1 | |
1 New risks dues to changing business environment
ENTERPRISE RISK MANAGEMENT
During 2017, Sibanye-Stillwater embarked on a process to update our risk management framework to take into account the recommendations of the Committee of Sponsoring Organisations of the Treadway Commission (COSO), the updated ISO 31000:2018 – risk management framework, and the King IV Report on Corporate Governance for South Africa, 2016 (King IV). The updated risk management framework was adopted in September 2017. In aligning with King IV, risk management has been integrated with and linked directly to our strategy and our ability to achieve our strategic objectives. Our risk management process has also been expanded to consider opportunities as well as risks.
Risk management is a continuous, proactive and dynamic process designed to identify, understand, manage and communicate those risks and opportunities that may have an impact on Sibanye-Stillwater’s achieving its strategic business objectives. The group-wide risk assessment process was enhanced to ensure that our strategic objectives are included at all levels of risk determination, to ensure congruency across the company.
| |
Sibanye-Stillwater | Integrated Annual Report 2017 | 28 |
An annual independent review of Sibanye-Stillwater’s updated enterprise risk management framework, practices and systems and their effectiveness was conducted by an external assurance provider, PwC, during 2017. The review confirmed that our risk management framework is compliant with King IV, ISO 31000 and COSO.
In line with its duties and responsibilities, the Board of Directors monitored, reviewed, provided feedback on and approved the components – the related framework, practices and systems – and the process of enterprise risk management.
As part of its ongoing monitoring of risk management, the Board deliberated on and agreed acceptable appetite and risk tolerance levels for key performance areas. Our risk appetite refers to the amount of risk we are willing to take to achieve our strategic objectives and takes into account revenue growth, earnings sustainability, environmental impact, employee well-being, health, safety, the environment, human resources, business plan delivery, licence to operate, ethics and governance.
DETERMINING OUR MATERIAL RISKS AND OPPORTUNITIES
Sibanye-Stillwater considers a risk and/or an opportunity to be material if it substantially affects the group’s ability to create and sustain value in the short, medium and long term. The process to identify the material risks and opportunities facing Sibanye-Stillwater is three-pronged and involves understanding and taking into account:
•Our external operating environment
•Internal factors that may adversely affect business performance
•Stakeholder attitudes, concerns and expectations (see Stakeholder engagement)
Due understanding and consideration of these factors allows management to identify the most relevant issues which may impact the Group’s ability to achieve its strategic and business objectives and create value for all our stakeholders over time. Management evaluates the likelihood and potential impact of material issues occurring, from multiple perspectives, including strategic, financial and operational viewpoints. This results in the most material issues being prioritised and appropriate response plans being developed.
DETERMINING OUR MATERIAL RISKS
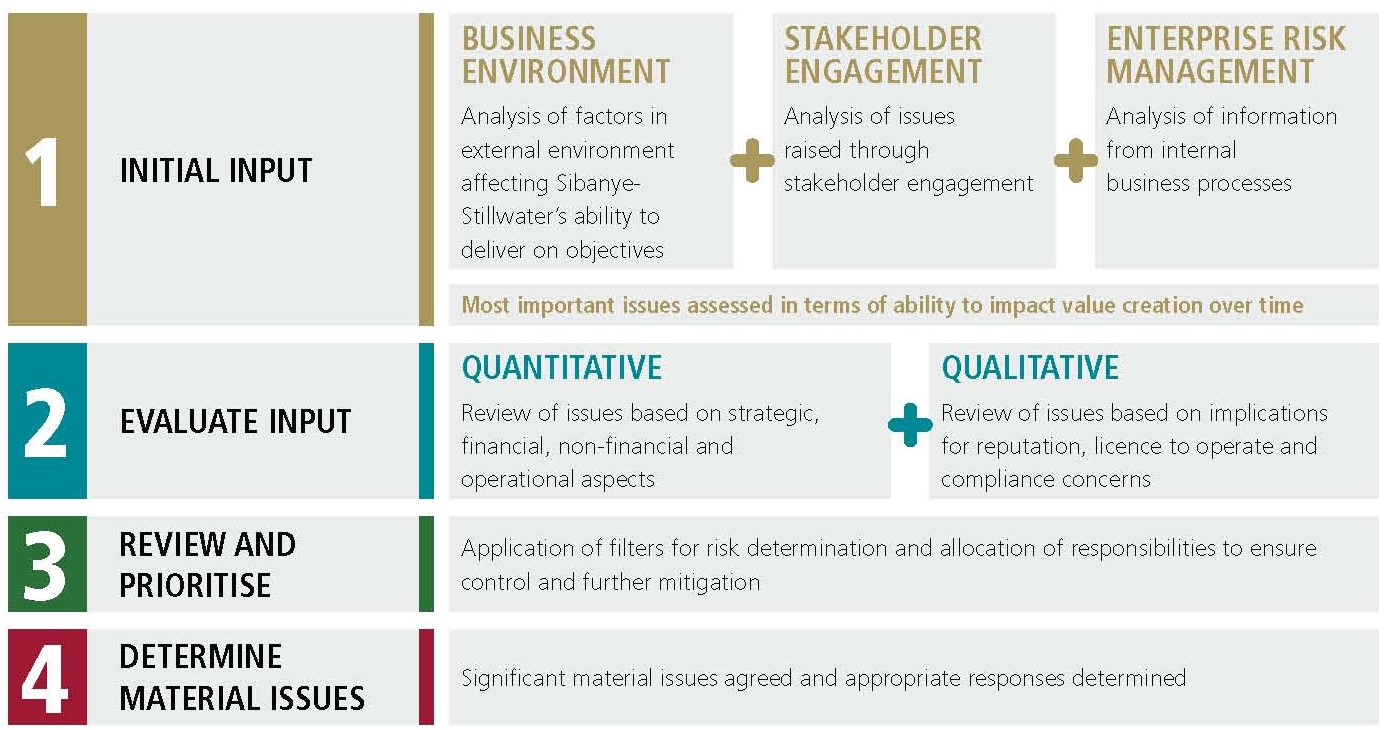
OUR OPERATING ENVIRONMENT – EXTERNAL AND INTERNAL
NEW OPERATING CONTEXT
Our operating context has changed significantly over the past few years. Sibanye-Stillwater now operates across geographical regions and produces a more diverse commodities mix, which have had an impact on our risks and opportunities.
Sibanye-Stillwater’s diversification into the PGM sector, and establishing a significant operational presence in the United States, has already delivered clear benefits in 2017. While maintaining the Group’s gold exposure, which provides a solid underpin, the Group enjoyed the counter-balancing effect of exposure to both platinum and palladium as market price trends for the two metals diverged. The South African mining industry is currently facing severe margin pressure due to the strong rand, and Sibanye-Stillwater’s US PGM operations provide welcome diversification away from the strong rand and positive exposure to the elevated palladium price.
| |
Sibanye-Stillwater | Integrated Annual Report 2017 | 29 |
Our view on the outlook for the precious metals we produce is covered in the Chairman’s perspective earlier in this report, along with the possible impacts of the recent political shift in South Africa, on the economy, the local mining industry and the Group. The strategic and operational benefits of recent and pending acquisitions is covered in more detail in the CEO’s review, with relevant financial aspects discussed in the CFO’s report.
Operational and executive management, the Risk Committee and the Board continually identify, prioritise and monitor all risks and materials issues throughout the year. As a result of the significantly different external and internal context in which the Group now operates, a specific strategic review of risks and opportunities was conducted in the last quarter of 2017 to take into account Sibanye-Stillwater’s new organisational structure and positioning, and evaluate how the company’s risk profile had evolved.
The strategic review identified the following adjustments, emerging risks and opportunities:
| · | | The change in our operating footprint has secured geographic diversification as well as increased exposure to PGM markets, and to palladium in particular. This has reduced the risks related to regional concentration of assets and single commodity and currency exposure. Sibanye-Stillwater now has a natural hedge against exchange rate fluctuations and is exposed to a wider basket of commodity prices than previously. This provides greater certainty in relation to operational cash flow generation. |
| · | | The US region represents a relatively low risk environment from most perspectives, with environmental management and associated commitments to local communities representing the most critical focus area. Environmental permitting is the primary risk to the realisation of further mining brownfields growth opportunities at the US PGM operations, although the Stillwater operations have previously secured permits that provide for steady production and ramp up over a life in excess of 30 years. |
| · | | While recent political changes in South Africa have resulted in substantial strengthening of the South African rand, which is placing short-term pressure on margins from the SA region’s operations, the risks related to any adverse implications for business effectiveness due to unfavourable regulation and policy as well as disruption due to social unrest are potentially much reduced. An improved policy and regulatory environment improves, have positive implications for industry investment and growth, which will bring benefits to all stakeholders in the long term. The spectre of sustained rand strength, does however necessitate revision of operating plans and consideration of alternative mechanisms for managing debt, including from forward commodity sales and streaming, pipeline inventory financing, reductions in working capital and disposals of non-core assets. |
| · | | The announced transaction with DRDGOLD provides Sibanye-Stillwater with immediate realisation of value and a lower risk exposure to the value potential of the surface tailings resources on the West Rand, as well as the broader scope of DRDGOLD operations. |
| · | | The proposed transaction to acquire Lonmin may provide Sibanye-Stillwater with lower cost processing options and other synergies and enhanced direct access to global PGM metal markets, which will contribute modestly to reducing the company’s commodity price risk exposure. The risk relating to potential changes in the inherent value of Lonmin prior to the acquisition taking place is adequately catered for by the requirement for a positive vote by Sibanye-Stillwater shareholders shortly prior to consummation of the transaction. This includes whatever outcomes may be reached around the allegations of non-compliance with social and labour plans (SLPs). While the Lonmin transaction will increase Sibanye-Stillwater’s exposure to communities in the Rustenburg district, a more substantial presence, coupled with effective methodologies for community engagement, are considered adequate to manage this risk effectively to the benefit of all stakeholders. |
STAKEHOLDER ENGAGEMENT AND RISK MITIGATION
Effective and ongoing stakeholder engagement is essential for the Group to identify potentially material issues and risks and manage stakeholder expectations. Positive, transparent stakeholder engagement is a two-way process. It enables Sibanye-Stillwater to better manage and mitigate our risks and issues, by reducing their impact and likelihood. Similarly, it also enables us to take advantage of opportunities when these present themselves.
Constructive, meaningful relationships with stakeholders are vital to retaining our social and legal licence to operate.
A comprehensive communications strategy is in place to oversee stakeholder engagement and manage expectations. As a responsible corporate citizen, Sibanye-Stillwater fosters and maintains constructive engagement with all stakeholders in order to deliver on our vision and strategy, to maintain our licences to operate, and ultimately for our long-term success and sustainability.
| |
Sibanye-Stillwater | Integrated Annual Report 2017 | 30 |
STAKEHOLDER AND RELATED CONCERNS
Stakeholders | Focus of engagement |
Investors, market analysts and providers of capital | • Operating and financial performance • Delivery on strategic objectives • Managing and guiding shareholder expectations and forecasts • Engagement with rating agencies and bond investors Related risks: (1), (2), (3), (4), (6), (7) |
Employees and organised labour | • People@Sibanye-Stillwater initiative – refer to Superior value for the workforce for further detail • Safety and health • Operating, financial safety and environmental targets • Motivate participation in optimisation of processes and systems • Training and development, and skills retention • Wage negotiations • Labour relations environment • Indebtedness Related risks: (1), (3), (5), (6), (7), (8) and (10) |
Communities and consultative forums | • Community expectations • Employment opportunities • Local procurement and enterprise development and related opportunities • Local economic development • Environmental impacts of mining • Illegal mining • Legacy health concerns Related risks: (3), (4), (5), (6), (7), (8), (10) |
Regulators and government – national, provincial and local | • Close collaboration with local municipalities and other community structures is an important aspect of socio-economic development project planning and implementation • Employee safety and health • Section 54 safety-related stoppages • Environmental compliance • Mining licences, particularly regulatory compliance with SLP commitments and Mining Charter targets, including procurement, transformation, mine community development, housing and living conditions • Legacy health issues (silicosis and the mining industry’s Working Group on Occupational Lung Disease OLD) Related risks: (3), (5), (6) and (7) |
Suppliers and contractors (business partners) | • Cost management and improving productivity • Mining licence commitments in terms of preferential procurement and Mining Charter targets, especially as related to the development and growth of SMMEs and skills enhancement Related risks: (1), (2), (5), (6) |
Chamber of Mines and peers | • Issues of major concern to the industry as a whole, for example, the discussions and negotiations around the release of the reviewed Mining Charter in mid-2017 and other legislation pending such as the proposed • carbon tax and amendments to the financial provisions of the National Environment Act, 107 of 1998 (NEMA) • Safety and health, and in particular silicosis and OLD • Industry-wide labour relations • Wage negotiations • Illegal mining and theft, as an industry-wide issue Related risks: (1), (3), (4), (5), (6), (7), (8), (9) |
| |
Sibanye-Stillwater | Integrated Annual Report 2017 | 31 |
TOP 10 RISKS AND RELATED MITIGATING ACTIONS IN 2017
RANKING METHODOLOGY
| | Description | Mitigating action | Residual risk rating | Risk tolerance | Source of risk |
1 | Failure to optimally integrate regional acquisitions and ensure ongoing operational delivery on targets | The geographic expansion of the Group with the acquisition of the US operations could impact the ongoing delivery on regional business, operational and growth targets. Management capacity and focus was a primary concern | • Organisational structure changed from commodity focus to regional focus • Capacity added where appropriate in the regions • Strategic and operational planning processes implemented • Frequent and regular reviews of strategic and operational plans | Medium | • Achievement of targets for business and operational plans | INTERNAL |
2 | Ability to access, service and repay debt due to external and internal factors which may impact on cash flow | Servicing and reducing debt is a primary focus of the Group. This may be affected by poor operational delivery due to internal factors or due to external disruptions. The ability to service debt is also affected by fluctuations in external revenue drivers such as currencies and commodity prices | • Frequent and regular reviews and tracking of operational performance • Cash and balance sheet management including mechanisms for accelerating revenue such as commodity sales, reductions in working capital and disposals of non-core assets • Revenue management through currency and commodity hedging • Appropriate capital structure/management • Financial risk mitigation measures | Medium | • Achievement of targets for business and operational plans • Achieving planned deleveraging trajectory | EXTERNAL AND INTERNAL |
3 | Adverse regulatory changes and socio-political instability | Adverse changes in the South African regulatory environment, political instability and social instability could disrupt operations and affect investor confidence | • Regular and transparent stakeholder engagement • Legal challenge through Chamber of Mines to potential adverse legislation • Comprehensive detailed training and monitoring of compliance with laws and regulations | Medium | • Compliance with key laws and with the legal and social requirements for the SLPs and Mining Charter targets • Repeal of Mining Charter 3 | EXTERNAL |
4 | Further deterioration in South African rating and potential adverse impact on valuations and cost of financing | South African rating downgrades negatively impacting on cost of financing and adding to discount applied to South African companies by the market. Lower share price rating negatively impacts on growth | • Conservative debt management • Regular interaction with investment banks on market conditions • Regular shareholder interaction and engagement | Medium | • Achievement of targets for business and operational plans | INTERNAL AND EXTERNAL |
| |
Sibanye-Stillwater | Integrated Annual Report 2017 | 32 |
| | Description | Mitigating action | Residual risk rating | Risk tolerance | Source of risk |
5 | Cost and impact of ensuring governance, regulatory, legal and accounting compliance across multiple regions and additional requirements of multi- commodity production | Our changed geographical landscape has resulted in exposure to different legislative, governance and compliance requirements. Rapid regulatory changes in countries where we operate can affect operating costs | • Comprehensive detailed training on and monitoring of compliance with laws and regulations • Regular engagement with regulators and national authorities • Cost containment | Medium | • Compliance with key laws and with the legal and social requirements for the SLPs and Mining Charter targets • Achievement of business and operational plans | EXTERNAL |
6 | Maintaining and obtaining operating licences and other permits in uncertain political and regulatory environments | Our legal and social licences to operate may be impacted by policy and regulatory changes. In the South Africa region, these licences for our operations are exposed to the uncertainty around the Mining Charter | • Comprehensive detailed training on and monitoring of compliance with laws and regulations • Regular engagement with regulators and national authorities | Medium | • Compliance with key laws, and with the legal and social requirements for SLPs and Mining Charter targets | EXTERNAL |
7 | Safety, health and environmental incidents | Mining operations can affect the safety and health of employees. In addition, mining activity can adversely impact the natural environment | • A robust safety strategy and policies aligned with our overall strategy are in place • Ongoing monitoring of compliance with these policies • Ongoing stringent environmental monitoring and compliance • Health and safety auditing to ensure compliance | Medium | • Improved safety statistics compared to prior periods and better than industry norms • Low tolerance for activities that may have a significant adverse effect on the natural environment | INTERNAL |
8 | Unrealistic expectations for business to uplift communities in South Africa | Social instability and increased unemployment could result in community activism in the areas where we operate | • Effective implementation and management of stakeholder engagement strategy • Strengthen partnerships with stakeholders to assist with better delivery on Sibanye-Stillwater’s commitments | Medium | • Compliance with key laws, and with the legal and social requirements for SLPs and Mining Charter targets | EXTERNAL |
| |
Sibanye-Stillwater | Integrated Annual Report 2017 | 33 |
| | Description | Mitigating action | Residual risk rating | Risk tolerance | Source of risk |
9 | Under-delivery on operational targets owing to external factors | External factors including cyber-attacks, natural disasters, theft of product and assets, community unrests that could affect the achievement of business and operational targets | • Stakeholder engagement strategy in place • Early detection warning systems to minimise disruptions • Business continuity plans in place to minimise business and system disruptions • Insurance cover | Medium | • Achievement of targets for business and operational plans • Compliance with key laws and with the legal and social requirements for SLPs and Mining Charter targets | EXTERNAL |
10 | Maintaining positive relations with employees and creating alignment with business strategy and goals | Employees not aligned with company vision and values may result in poor productivity, a high employee turnover ratio and the lack of motivation. In extreme cases employee dissatisfaction can result in strikes, sabotage of operations and an increase in fraud and illegal mining | • The People@Sibanye initiative is aimed at promoting a people-centric culture • Ongoing employee engagement and feedback • Talent pool identification and development | Medium | Employee capacity cover ratio applied for scarce and critical skills in place | INTERNAL |
Action plans have been compiled for all risks should tolerance levels be exceeded. Such instances are reported to the Risk Committee, which monitors all aspects of our risks
| |
Sibanye-Stillwater | Integrated Annual Report 2017 | 34 |
OPERATIONS
APPROACH
Sibanye-Stillwater is uniquely positioned to deliver, tangible value to all of its stakeholders, consistent with our vision and values. The SA and US regions have developed effective strategies to sustain and improve operational and financial delivery with strong leadership teams in place to lead the execution of our strategy.
PERFORMANCE
The strong operating and cost performance across the expanded Group during 2017, particularly in the second half of the year, reinforced the appropriateness of the decision to restructure the business regionally in order to ensure role clarity and sustainable operational delivery.
Operating highlights of the year included the smooth integration of the US operations into the Group. In addition, the ongoing integration of the PGM operations in the SA region, and that of the Rustenburg operations in particular, exceeded expectations. The gold operations in the SA region were restructured to ensure their sustainability.
In total, Sibanye-Stillwater produced 1.8Moz of PGMs (platinum, palladium, rhodium, gold, ruthenium and iridium) and 1.4Moz of gold (2016: 0.5Moz and 1.5Moz, respectively).
SA REGION
Both the gold and PGM operations in the SA region delivered annual production above guidance and costs below the guided range.
Gold operations
Gold produced declined 7% year-on-year to 43,634kg (2016: 47,034kg), primarily due to the cessation of underground operations at Cooke. The SA gold operations recorded an AISC of R482,693/kg (US$1,128/oz), as compared with R450,152/kg (US$954/oz) in 2016.
Underground production from the Cooke operations decreased by 52% to 2,338kg, 75,200oz (2016: 4,853kg, 156,000oz) as a result of Cooke 4 shaft being placed on care and maintenance towards the end of September 2016, and at the Cooke 1, 2 and 3 shafts being placed on care and maintenance at the end of October 2017. This will negatively impact the gold production in 2018, but is expected to favourably affect AISC for the gold operations in 2018.
At Beatrix, underground gold production decreased by 8% to 8,859kg, 284,800oz (2016: 9,601kg, 308,700oz), primarily due to re-planning at the Beatrix West shaft. The reduction allowed greater flexibility, reduced costs and addressed constraints underground. Given the Section 189 consultations, the remainder of Beatrix shafts experienced restrictions in filling their critical labour complement, which impacted production volumes. Gold production from surface sources decreased by 47% to 232kg, 7,500oz (2016: 440kg, 14,100oz) due to a similar decline in throughput as surface sources were depleted.
Underground production at Driefontein of 13,262kg; 426,400oz (2016: 13,920kg, 447,600oz) was 5% lower year-on-year, due to an 8% decline in yield partially offset by a 4% increase in throughput. The decrease in grade was primarily due to lower grades at the Driefontein 5 and 8 shafts, which were expected and in line with plan. Gold production from surface sources decreased by 21% to 1,742kg (2016: 2,210kg), in line with the decline in yield owing to depletion of the higher-grade surface resources. Surface throughput remained steady at 3.9Mt.
Kloof delivered another strong performance with underground production increasing by 8% to 14,826kg; 476,700oz (2016: 13,704kg, 440,600oz) and surface production by 7% to 1,606kg; 51,600oz (2016: 1,506kg, 48,400oz). Higher underground mining volumes resulted in an 8% increase in ore milled to 2.2Mt. Surface throughput increased by 34% to 3.6Mt, owing to the greater volumes of Venterspost surface material treated at the Ezulwini plant, post the closure of Cooke 4.
PGM operations
The integration of the Rustenburg operations exceeded expectations by consistently delivering solid production and improving financial results. Cost savings of over R1 billion were achieved from synergies realised in the first 14 months of incorporation, well ahead of initial expectations of savings of R800 million over three to four years. The SA PGM operations contributed R1.6 billion (US$120 million) (18%) to the Group adjusted EBITDA in 2017 on the back of effective cost management, boosted by improving PGM prices The SA PGM operations reported attributable 4E PGM production of 1.2Moz (2016: 0.4Moz). The year on year increase was a result of both Kroondal and Rustenburg being included for a full 12 months in 2017. Attributable production of 4E PGM at Kroondal was higher at 241,225oz, another record performance since it started mining in 2001 and 35% higher than in 2016, while 4E PGM production at Rustenburg for the year was 809,527oz. Attributable 4E PGM production at Mimosa increased by 36% to 124,153oz.
The SA PGM operations had an AISC of R10,399/4Eoz (US$782/4Eoz), which is in the lower half of the industry cost curve
US REGION
The executive team for the US region has been finalised and is now well placed to oversee and to ensure continued delivery.
PGM operations
The US PGM operations, comprising the Stillwater mine (including the Blitz project), the East Boulder mine and the Columbus Metallurgical Complex (made up of the recycling operations, smelter, base metals refinery and analytical laboratory) were incorporated into the Sibanye-Stillwater Group effective from 4 May 2017.
| |
Sibanye-Stillwater | Integrated Annual Report 2017 | 35 |
Our ownership of the US region assets has coincided with the palladium price rising by more than 60% since the acquisition was announced in December 2016. The integration of the US PGM operations has proceeded smoothly, with steady operating results and the critical Blitz project being commissioned three months ahead of plan. The US PGM operations contributed R2.1 billion (US$161 million) (24%) to Group adjusted EBITDA in the eight months since acquisition. Notably, the recent strength in the rand, which has impacted the margins of all the SA region mining operations, has provided welcome diversification and supported the fortuitous timing of the acquisition.
A detailed, independent competent person’s report (CPR) released in November 2017 values the US assets at approximately US$2.73 billion, which exceeds the US$2.24 billion acquisition price (including transaction fees of US$40 million) and supports the rationale for the transaction.
The US PGM operations recorded an AISC of US$651/2Eoz for the eight months in 2017.
For the eight months under Sibanye-Stillwater’s control, the US PGM operations sustained their operating performance and reported 2E PGM production of 376,356oz. This compares favourably with mined 2E PGM production of approximately 363,874oz for the same period in 2016 and the 2017 guidance. East Boulder delivered record 2E PGM production of 93,725oz during the eight-month period while Stillwater contributed 282,631oz, which includes production of approximately 7,000oz by the Blitz project which was commissioned three months ahead of schedule. The Columbus Metallurgical Complex processed a record of 860,711oz (mined: 383,142oz and recycled: 477,569oz, including ounces tolled) during the eight months in 2017. This performance was supported by strong growth in volumes at the recycling operation during this period with a record average of feed material being processed of 24.2 tonnes/day compared with 23.0 tonnes/day in 2016
US region: PGM production and recycling for May – December 2017
| |
Mined 2E production | Ounces |
Stillwater1 | 228,268 |
East Boulder | 148,088 |
Total mined | 376,356 |
Recycling 3E2 | |
Columbus Metallurgical Complex | |
– PGM fed | 517,148 |
– PGM sold | 377,793 |
PGM tolled returned | 108,728 |
| 1 | | Includes 7,000oz produced by the Blitz project |
| 2 | | Recycling production includes rhodium |
| |
Sibanye-Stillwater | Integrated Annual Report 2017 | 36 |
SA region – Gold operations 2017
| | Gold operations | Driefontein | Kloof | Beatrix | Cooke |
Production | | | | | | |
Ore milled | 000t | 19,030 | 6,042 | 5,844 | 3,515 | 3,722 |
Underground | 000t | 7,575 | 2,137 | 2,177 | 2,737 | 524 |
Surface | 000t | 11,455 | 3,905 | 3,667 | 778 | 3,198 |
Yield | g/t | 2.29 | 2.48 | 2.86 | 2.59 | 0.83 |
Underground | g/t | 5.19 | 6.21 | 6.81 | 3.24 | 4.46 |
Surface | g/t | 0.38 | 0.45 | 0.45 | 0.30 | 0.24 |
Gold produced | kg | 43,634 | 15,004 | 16,432 | 9,091 | 3,107 |
| 000oz | 1,403 | 482 | 528 | 292 | 100 |
Underground | kg | 39,285 | 13,262 | 14,826 | 8,859 | 2,338 |
| 000oz | 1,263 | 426 | 477 | 285 | 75 |
Surface | kg | 4,349 | 1,742 | 1,606 | 232 | 769 |
| 000oz | 140 | 56 | 52 | 8 | 25 |
Gold sold | kg | 43,763 | 15,088 | 16,466 | 9,091 | 3,118 |
| 000oz | 1,407 | 485 | 529 | 292 | 100 |
Price and costs | | | | | | |
Gold price received | R/kg | 536,378 | 535,319 | 537,167 | 536,333 | 537,684 |
| US$/oz | 1,254 | 1,251 | 1,256 | 1,254 | 1,257 |
Adjusted EBITDA margin 1 | % | 23 | 23 | 34 | 19 | (31) |
All-in sustaining cost 2 | R/kg | 482,693 | 487,951 | 430,572 | 502,761 | 673,445 |
| US$/oz | 1,128 | 1,141 | 1,007 | 1,175 | 1,574 |
All-in cost 2 | R/kg | 501,620 | 490,893 | 439,506 | 503,036 | 677,197 |
| US$/oz | 1,173 | 1,148 | 1,027 | 1,176 | 1,583 |
Capital expenditure | | | | | | |
Ore reserve development | Rm | 2,288 | 876 | 876 | 482 | 54 |
Sustaining capital | Rm | 531 | 235 | 210 | 63 | 9 |
Corporate and projects 3 | Rm | 591 | 44 | 147 | 1 | 12 |
Total | Rm | 3,410 | 1,156 | 1,234 | 546 | 74 |
| US$m | 256 | 87 | 93 | 41 | 6 |
Average exchange rates for 2017 was R13.31/US$ Figures may not add as they are rounded independently
1 Adjusted EBITDA margin is calculated by dividing adjusted EBITDA by revenue
2 All-in cost excludes income tax, costs associated with merger and acquisition activities, working capital, impairments, financing costs, one-time severance charges and items needed to normalise earnings. All-in cost is made up of All-in sustaining cost, being the cost to sustain current operations, given as a sub-total in the All-in cost calculation, together with corporate and major capital expenditure associated with growth. All-in sustaining cost per kilogram (and ounce) and All-in cost per kilogram (and ounce) are calculated by dividing the All-in sustaining cost and All-in cost, respectively, in a period by the total gold sold in the same period
3 Corporate project expenditure in 2017 was R402 million (US$30 million), the majority of which related to the Burnstone project
| |
Sibanye-Stillwater | Integrated Annual Report 2017 | 37 |
SA and US regions – PGM operations 2017
| | | | | | | | |
| Group | Total | Kroondal | SA region Mimosa | Plat Mile | Rustenburg | US region Total |
Production (attributable) 6 | | |
Ore milled | 000t | 27,051 | 26,196 | 3,778 | 1,385 | 8,050 | 12,983 | 855 |
Underground | 000t | 13,116 | 12,261 | 3,778 | 1,385 | | 7,098 | 855 |
Surface | 000t | 13,935 | 13,935 | | | 8,050 | 5,885 | |
Plant head grade | g/t | 2.50 | 2.09 | 2.42 | 3.58 | 0.65 | 2.72 | 15.01 |
Underground | g/t | | 3.30 | 2.42 | 3.58 | | 3.70 | 15.01 |
Surface | g/t | | 1.02 | | | 0.65 | 1.52 | |
Plant recoveries | % | 72.37 | 68.06 | 81.91 | 77.87 | 11.62 | 71.41 | 91.00 |
Underground | % | | 83.42 | 81.91 | 77.87 | | 84.99 | 91.00 |
Surface | % | | 24.25 | | | 11.62 | 31.58 | |
Yield | g/t | 1.81 | 1.42 | 1.99 | 2.79 | 0.08 | 1.94 | 13.69 |
Underground | | | 2.75 | 1.99 | 2.79 | | 3.15 | 13.69 |
Surface | | | 0.25 | | | 0.08 | 0.48 | |
PGM production (4E – 2E) | 000oz | 1,571 | 1,194 | 241 | 124 | 19 | 810 | 376 |
Underground | | 1,460 | 1,084 | 241 | 124 | | 719 | 376 |
Surface | | 110 | 110 | | | 19 | 91 | |
PGM sales (4E – 2E) | 000oz | 1,550 | 1,194 | 241 | 124 | 19 | 810 | 355 |
Price and costs 2 | | |
Average PGM basket price | R/oz | 12,477 | 12,534 | 12,564 | 12,572 | 12,679 | 12,505 | 12,330 |
received 3 | US$/oz | 938 | 942 | 944 | 945 | 953 | 940 | 927 |
Adjusted EBITDA margin 4 | % | | 12 | 15 | 31 | 27 | 11 | 23 |
All-in sustaining cost 5 | R/oz | 9,959 | 10,399 | 10,176 | 9,781 | 6,696 | 10,554 | 8,707 |
| US$/oz | 748 | 782 | 765 | 735 | 503 | 793 | 651 |
All-in cost 5 | R/oz | 10,582 | 10,401 | 10,176 | 9,781 | 6,815 | 10,554 | 11,097 |
| US$/oz | 795 | 782 | 765 | 735 | 512 | 793 | 821 |
Capital expenditure | | |
Ore reserve development | Rm | 1,004 | 465 | | | | 465 | 539 |
Sustaining capital | Rm | 572 | 568 | 191 | 223 | 11 | 366 | 227 |
Corporate and projects | Rm | 891 | 2 | | | 2 | | 888 |
Total | Rm | 2,466 | 1,035 | 191 | 223 | 13 | 831 | 1,654 |
| US$m | 202 | 78 | 14 | 17 | 1 | 62 | 124 |
Average exchange rate for 2017 was R13.31/US$ Figures may not add due to rounding
1 The US PGM operations’ results for 2017 are for eight months since acquisition. The US PGM operations’ underground production is converted to metric tonnes and kilograms, and performance is translated into SA rand. In addition to the US PGM operations’ underground production, the operation treats recycling material which is excluded from the statistics shown, except for adjusted EBITDA margin
2 The Group and total SA PGM operations’ unit cost benchmarks exclude the financial results of Mimosa, which is equity accounted, and excluded from revenue and cost of sales
3 The average PGM basket price is the PGM revenue per 4E/2E ounce, prior to a purchase of concentrate adjustment
4 Adjusted EBITDA margin is calculated by dividing adjusted EBITDA by revenue
5 All-in cost excludes income tax, costs associated with merger and acquisition activities, working capital, impairments, financing costs, one-time severance charges and items needed to normalise earnings. All-in cost is made up of All-in sustaining cost, being the cost to sustain current operations, given as a sub-total in the all-in cost calculation, together with corporate and major capital expenditure associated with growth. All-in sustaining cost per ounce (and kilogram) and all-in cost per ounce (and kilogram) are calculated by dividing the all-in sustaining cost and all-in cost, respectively, in a period, by the total 4E/2E PGM production in the same period
6 Kroondal and Mimosa represent 50% attributable production, while Platinum Mile is 91.7% owned and 100% incorporated
| |
Sibanye-Stillwater | Integrated Annual Report 2017 | 38 |
SA region – Gold operations 2016 (comparative data)
| | Total SA gold | Driefontein | Kloof | Beatrix | Cooke |
Production | |
Ore milled | 000t | 20,181 | 5,971 | 4,676 | 4,333 | 5,201 |
Underground | 000t | 8,084 | 2,055 | 2,009 | 2,862 | 1,158 |
Surface | 000t | 12,097 | 3,916 | 2,667 | 1,471 | 4,043 |
Yield | g/t | 2.33 | 2.70 | 3.25 | 2.32 | 1.09 |
Underground | g/t | 5.21 | 6.77 | 6.82 | 3.35 | 4.19 |
Surface | g/t | 0.41 | 0.56 | 0.56 | 0.30 | 0.20 |
Gold produced | kg | 47,034 | 16,130 | 15,210 | 10,041 | 5,653 |
| 000oz | 1,512.2 | 518.6 | 489.0 | 322.8 | 181.7 |
Underground | kg | 42,078 | 13,920 | 13,704 | 9,601 | 4,853 |
| 000oz | 1,352.9 | 447.6 | 440.6 | 308.7 | 156.0 |
Surface | kg | 4,956 | 2,210 | 1,506 | 440 | 800 |
| 000oz | 159.3 | 71.1 | 48.4 | 14.1 | 25.7 |
Gold sold | kg | 46,905 | 16,046 | 15,176 | 10,041 | 5,642 |
| 000oz | 1,508.0 | 515.9 | 487.9 | 322.8 | 181.4 |
Price and costs | | | | | | |
Gold price received | R/kg | 586,319 | 585,884 | 585,853 | 585,997 | 595,923 |
| US$/oz | 1,242 | 1,242 | 1,242 | 1,242 | 1,263 |
Adjusted EBITDA margin 1 | % | 36 | 40 | 43 | 35 | 9 |
All-in sustaining cost 2 | R/kg | 450,152 | 421,501 | 427,036 | 452,754 | 588,748 |
| US$/oz | 954 | 893 | 905 | 960 | 1,248 |
All-in cost 2 | R/kg | 472,585 | 424,872 | 435,609 | 453,232 | 595,959 |
| US$/oz | 1,002 | 901 | 923 | 961 | 1,263 |
Capital expenditure | | | | | | |
Ore reserve development | Rm | 2,394.4 | 779.0 | 912.9 | 542.9 | 159.6 |
Sustaining capital | Rm | 683.5 | 218.5 | 261.2 | 84.8 | 48.9 |
Corporate and projects 3 | Rm | 746.3 | 54.1 | 130.1 | 0.7 | 40.7 |
Total | Rm | 3,824.2 | 1,051.6 | 1,304.2 | 628.4 | 249.2 |
| US$m | 260.5 | 71.6 | 88.8 | 42.8 | 17.0 |
Average exchange rates for 2016 was R14.68/US$ Figures may not add due to rounding
1 Adjusted EBITDA margin is calculated by dividing adjusted EBITDA by revenue
2 All-in cost excludes income tax, costs associated with merger and acquisition activities, working capital, impairments, financing costs, one-time severance charges and items needed to normalise earnings. All-in cost is made up of All-in sustaining cost, being the cost to sustain current operations, given as a sub-total in the All-in cost calculation, together with corporate and major capital expenditure associated with growth. All-in sustaining cost per kilogram (and ounce) and All-in cost per kilogram (and ounce) are calculated by dividing the All-in sustaining cost and All-in cost, respectively, in a period by the total gold sold in the same period
3 Corporate project expenditure in 2016 was R521 million (US$35 million), the majority of which related to the Burnstone project
| |
Sibanye-Stillwater | Integrated Annual Report 2017 | 39 |
SA region – PGM operations 2016 (comparative data)
| | Total SA region | Kroondal | Mimosa | Plat Mile | Rustenburg |
Production (attributable) 6 | |
Ore milled | 000t | 11,611 | 2,733 | 1,012 | 5,669 | 2,198 |
Underground | 000t | 4,949 | 2,733 | 1,012 | | 1,204 |
Surface | 000t | 6,663 | | | 5,669 | 994 |
Plant head grade | g/t | 1.72 | 2.48 | 3.57 | 0.65 | 2.69 |
Underground | g/t | 2.99 | 2.48 | 3.57 | | 3.65 |
Surface | g/t | 0.73 | | | 0.65 | 1.53 |
Plant recoveries | % | 66.45 | 81.73 | 78.44 | 11.54 | 72.42 |
Underground | % | 81.76 | 81.73 | 78.44 | | 84.54 |
Surface | % | 19.11 | | | 12.69 | 37.42 |
Yield | g/t | 1.13 | 2.03 | 2.80 | 0.08 | 2.69 |
Underground | | 2.44 | 2.03 | 2.80 | | 3.09 |
Surface | | 0.15 | | | 3.57 | 0.57 |
PGM production (4E – 2E) | 000oz | 420.8 | 178.2 | 91.1 | 13.7 | 137.8 |
Underground | | 388.8 | 178.2 | 91.1 | | 119.5 |
Surface | | 32.0 | | | 13.7 | 18.3 |
PGM sales (4E – 2E) | 000oz | 420.8 | 178.2 | 91.1 | 13.7 | 137.8 |
Price and costs 1 | | | | | | |
Average PGM basket price received 2 | R/oz | 12,209 | 12,409 | 12,206 | 12,497 | 11,910 |
| US$/oz | 832 | 846 | 832 | 852 | 811 |
Adjusted EBITDA margin 3 | % | 9 | 13 | 37 | 30 | 5 |
All-in sustaining cost 4 | R/oz | 10,403 | 10,264 | 11,222 | 6,947 | 10,925 |
| US$/oz | 709 | 699 | 765 | 473 | 744 |
All-in cost 4, 5 | R/oz | 10,403 | 10,264 | 11,222 | 6,947 | 10,925 |
| US$/oz | 709 | 699 | 765 | 473 | 744 |
Capital expenditure | | | | | | |
Sustaining capital | Rm | 325.7 | 175.8 | 159.8 | 1.3 | 148.7 |
Corporate and projects | Rm | 1.3 | | | | |
Total | Rm | 327.0 | 175.8 | 159.8 | 1.3 | 148.7 |
| US$m | 22.3 | 12.0 | 10.9 | 0.1 | 10.1 |
Average exchange rates for 2016 was R14.68/US$ Figures may not add as they are rounded independently
1 The total SA PGM operations’ unit cost benchmarks exclude the financial results of Mimosa, which is equity accounted, and excluded from revenue and cost of sales
2 The average PGM basket price is the PGM revenue per 4E/2E ounce, prior to a purchase of concentrate adjustment.
3 Adjusted EBITDA margin is calculated by dividing adjusted EBITDA by revenue
4 All-in cost excludes income tax, costs associated with merger and acquisition activities, working capital, impairments, financing costs, one-time severance charges and items needed to normalise earnings. All-in cost is made up of All-in sustaining cost, being the cost to sustain current operations, given as a sub-total in the all-in cost calculation, together with corporate and major capital expenditure associated with growth. All-in sustaining cost per ounce (and kilogram) and all-in cost per ounce (and kilogram) are calculated by dividing the all-in sustaining cost and all-in cost, respectively, in a period, by the total 4E/2E PGM production in the same period
5 The comparatives for 2016 have been revised retrospectively in terms of IFRS 3 Business Combinations after acquisition-accounting of the Rustenburg operations was finalised
6 Kroondal and Mimosa represent 50% attributable production, while Platinum Mile is 91% owned and 100% incorporated. For 2016, Kroondal, Mimosa and Platinum Mile represent 9 months, while Rustenburg operations represent 2 months
| |
Sibanye-Stillwater | Integrated Annual Report 2017 | 40 |
FUTURE FOCUS
The development and growth of the Group has been rapid and the strategic imperative for 2018 will be consolidation. Strategic priorities from an operational perspective are to:
• maintain our focus on operational excellence in order to ensure consistent and sustainable delivery on production and costs
• drive down costs in order to enhance competitiveness
• continue the integration and optimisation of recently acquired operations in the SA region in particular:
• The proposed transfer of certain gold surface assets on the West Rand to DRDGOLD, for a 38% stake in that company with an option to acquire a majority stake, will enable us to realise immediate value from the West Rand Tailings Retreatment Project (WRTRP) while providing future optionality without the need to incur significant capital investment. The DRDGOLD transaction is expected to close after the end of March 2018
• The proposed acquisition of Lonmin, announced on 14 December 2017 and which remains subject to the successful completion of various conditions precedent, will enable the realisation of significant synergies with their incorporation into Sibanye-Stillwater’s SA PGM operations. The fundamental outlook for PGMs continues to improve and we are confident that Sibanye-Stillwater is strongly positioned to deliver significant value in the near term
Our guidance for 2018 is as follows:
| | | |
| Production | All-in sustaining costs | Capital expenditure |
SA region | | | |
Gold operations | 38,500kg – 40,000kg (1,24Mox – 1.29Moz) | 475,000/kg – 495,000/kg (US$1,130/oz – US$1,180/0z) | R2,500 million (US$268 million) |
PGM operations (4E PGM) | 1.10Moz – 1.50Moz | R10,750/oz – R11,250/oz (US$825/oz – US$860/oz) | R1,500 million (US$115 million) |
US region | | | |
PGM operations (2E PGM) | 0.58Moz – 0.61Moz | US$650/oz – US$690/oz | US$220 million |
US dollar costs are based on an average exchange rate of R13.05/US$
PROJECTS
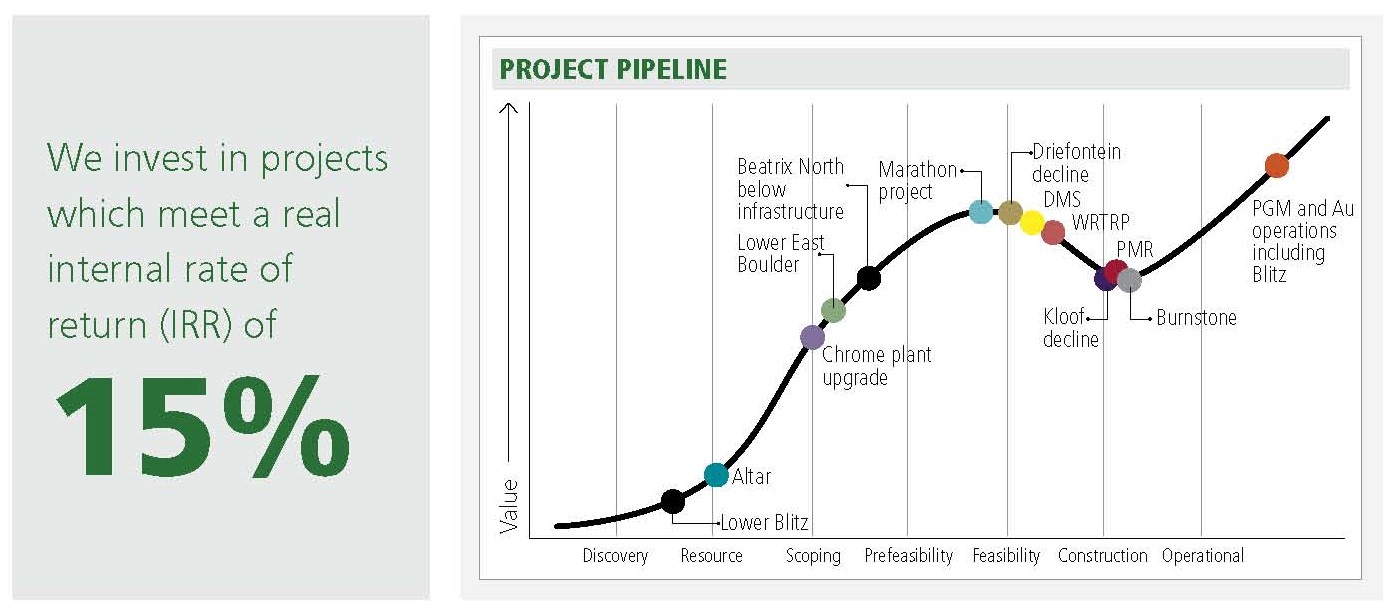
Expenditure on organic growth projects during 2017 was R1,482 million (US$111.8m) (2016: R746 million (US$51 million)) which represents R888 million for the Blitz project in the US region and R593 million in the SA region, of which R387 million was for the Burnstone project
SA REGION
GOLD OPERATIONS
Burnstone
Burnstone is located in the South Rand Goldfield of the Witwatersrand Basin near the town of Balfour, approximately 75km east of Johannesburg in the Mpumalanga province of South Africa.
| |
Sibanye-Stillwater | Integrated Annual Report 2017 | 41 |
Sibanye-Stillwater acquired the Burnstone assets in July 2014, comprising two shaft complexes, namely the surface portal and mechanised vehicle access decline and the vertical shaft (shaft bottom at 495m below surface), as well as a 125,000tpm gold processing plant, the tailings storage facility and surface infrastructure to support a producing operation, albeit with areas still to be constructed.
Burnstone had previously produced approximately 38,000oz of gold before being placed on care and maintenance in mid-2012.
The Burnstone project feasibility study was approved by the Board for project execution in November 2015. The project is planned with a six-year build-up to steady-state production by 2022, then averaging 125,000oz annually for seven years until the end of 2028. Thereafter a seven-year period of decreasing but profitable production supports an initial 20-year life-of- mine plan, yielding some 1.9Moz of gold production from the feasibility resource of 5.7Moz. This initial life of mine (LoM) plan was limited to approximately 60% of the total Burnstone resource of 8.9Moz as the mine design and schedule in the feasibility study was limited to mineable reserves within a 3km radius of the shaft infrastructure. During steady-state production period the potential of the 3.2Moz resource excluded from the initial LoM plan will be evaluated.
Burnstone re-evaluated and declared 1.934Moz of Mineral Reserves as at 31 December 2017.
In 2017, the following advances were made at Burnstone at a cost of R395 million (US$29.7m).
• Delivered 5,073 metres of access development
• Shaft Tip 3 construction was completed
• Conventional raise development crews were initiated
During the latter part of 2017, numerous water intersections (fissure water) were intercepted. These intersections delayed development, however, a comprehensive water handling plan has been implemented to minimise any delays in production going forward.
Kloof decline
The feasibility study for the Kloof below infrastructure decline project was approved by the Board for project execution in November 2015. The Kloof decline project plan yields approximately 0.57Moz of additional gold to that of the current LoM plan and is anticipated to extend the operating life of the Kloof operations to 2034.
In 2017, the following advances were made at Kloof at a cost of R117 million (US$8.8m):
• Delivered 181.6m of development
• Delivered 247.1m of development in decline
Driefontein decline
A feasibility study completed in 2015 confirmed that mining below current infrastructure has the potential to extend Driefontein’s operating life from 2028 to 2042, producing an additional 2.1Moz of gold. The feasibility study project capital was estimated at R1,126 million in 2017 terms.
The feasibility study for the Driefontein below infrastructure decline project was approved by the Board for project execution in November 2015. Capital expenditure of R298.9 million (US$22.5m) was initially approved in 2017. However, following a cash conservation strategy at the SA Gold operations, only R37 million (US$2.8m) was spent on 275 metres of development.
The project team have subsequently completed a contract adjudication exercise for an accelerated mine plan by a specialist mining and construction contractor. This will be motivated for the Board’s consideration in August 2018.
West Rand Tailings Retreatment Project
The West Rand Tailings Retreatment Project (WRTRP) is a large- scale, long-life surface tailings retreatment opportunity, the economic viability of which was secured through the acquisition of the Cooke assets by Sibanye-Stillwater in 2014. The combined WRTRP reserves amount to 677.3Mt of the historic Driefontein, Kloof and Cooke tailings storage facilities (TSFs), containing estimated gold and uranium mineral reserves of 6.2Moz and 97.2Mlb, respectively.
The definitive feasibility study for this project as well as the front-end engineering design was completed during the fourth quarter of 2016, rendering the WRTRP construction ready.
On 22 November 2017, Sibanye-Stillwater announced that it would vend selected assets of the WRTRP into DRDGOLD for 38% shareholding in the company. For more information on the transaction, refer to: www.sibanyestillwater.com/investors/transactions/drdgold.
Southern Free State Projects
The Southern Free State (SOFS) projects include Sibanye-Stillwater’s Wits Gold mining right and prospecting right holdings in the Free State goldfields of the Witwatersrand Basin.
The Wits Gold mining right consolidating the De Bron Merriespruit, Bloemhoek, Hakkies and Robijn projects into one mining right has been approved for a period of 23 years and was executed in June 2017. This mining right is contiguous to the north-east of the Beatrix mining right. Sibanye-Stillwater acquired the De Bron Merriespruit and Bloemhoek projects in December 2013 on its acquisition of Wits Gold.
All required environmental studies to support the motivation of a consolidation of the Beatrix and Wits Gold mining rights under one licence were completed in 2017. The environmental permitting process and updated environment management programme (EMP) for the envisaged mining right consolidation will be pursued after the Beatrix mining right renewal application has been submitted in Q4 2018. The Beatrix mining right expires in February 2019.
Gold Mineral Reserves for the De Bron Merriespruit project were reviewed in December 2015 with the mine design and schedule re-planned in line with revised geological and estimation models. The revised design and updated costing supports the Mineral Reserve for this project, which remains at 2.1Moz.
| |
Sibanye-Stillwater | Integrated Annual Report 2017 | 42 |
An initial desktop study performed in Q4 2015 evaluated the potential economic viability of a Beatrix North decline shaft system below infrastructure, accessing both Beatrix resources and the southern portion of the Bloemhoek resources. This would result in an extension of the current Beatrix life of mine. Drilling of two exploration holes DWV 12 and DWV 14 were completed in the Beatrix reserve area in April 2017 confirming the Beatrix VS5 reef geological structure, specifically the location and orientation of the Stuirmanspan fault and east- west trending Boundary fault, facies distribution, gold grades and the decline positioning.
The core logging and assay results revealed channel widths varying between 312cm and 344cm with the higher grades concentrated in the bottom 180cm and 80cm of the channels respectively.
An additional two exploration holes are planned in the Bloemhoek southern reserve area to confirm facies distribution and orebody grades.
A detailed feasibility study for this project will be completed in 2018.
The Beisa project at Beatrix West has not been included in the 2018 Mineral Reserve as the access shaft for the project is via Beatrix 4 shaft, which remains subject to a Section189 process. The principle driver for the Beisa project remains an increase in the future uranium price.
SA PGM OPERATIONS
Dense media separation
In 2016, Sibanye-Stillwater acquired Aquarius, as well as Anglo American Platinum’s Rustenburg assets, which included four underground PGM operations, surface tailing retreatment plant, the concentrator plants and associated surface infrastructure. At the time of the acquisition, Aquarius was successfully operating dense media separation (DMS) plants at its Kroondal concentrator plants, for the pre-concentration of mined UG2 ore. A third DMS plant, located at Marikana had been placed on care and maintenance. Rustenburg’s Waterval UG2 concentrator does not have a DMS plant. The two sites are 12.5km from each other.
In 2017, Sibanye-Stillwater commissioned a feasibility study to relocate the Marikana DMS plant to the Waterval UG2 concentrator and for its commissioning. The study was completed in September 2017 and subsequently approved. This brownfields project includes the stripping and relocation of the Marikana DMS plant to the Waterval UG2 concentrator.
Chrome pant optimisation
The Waterval chrome plant, which is part of the Rustenburg operation’s complex, treats 400,000t/month of feed from the Rustenburg UG2 plant. The Waterval chrome plant achieves chrome recoveries of between 10% and 12%. The plant’s milling process produces very fine chrome particles and a material quantity of chrome is dumped into the tailings dam. A study is underway for the recovery of portion of that fine chrome concentrate.
Two technologies are being investigated, both of which have the potential to increase recoveries by at least 5%. Test work on the technologies has been conducted with promising results. A decision will be made in 2018 on whether this project is viable.
Platinum Mile plant upgrade
Platinum Mile currently treats Sibanye-Stillwater tailings material arising from the concentrators. The tailing product is a mixture of underground ore, e-Feed (Waterval tailing dams) and smelter slag flotation plant tailings. A feasibility study, completed in July 2017, successfully concluded that additional retention time through the implementation of additional float cells would improve recoveries translating to a potential additional ounces annually. A phased approach, constructing the flotation section, within the existing Platinum Mile Resources facility has been initiated.
This capital budget estimate of R37.5 million, covering the installation of four new flotation cells and associated infrastructure, for 2018 was approved by the Sibanye-Stillwater Board in 2017. Project to be constructed in 2018.
US REGION
MARATHON PROJECT
Marathon is a PGM-copper property in northern Ontario, Canada, adjacent to Lake Superior.
The Marathon properties are located 10km north of the town of Marathon, Ontario, on the eastern margin of the Coldwell Complex, a Proterozoic layered intrusion. The palladium, platinum and copper mineralisation occurs principally in the Two Duck Lake gabbro. The known zones of significant mineralisation have a total north-south strike length of approximately 3km and dip 30° to 40° toward the west. The mineralisation has a true thickness ranging from 4m to 100m.
The feasibility study, which was completed and updated in 2014, provided the following core information about economic viability.
The project did not provide an attractive return to shareholders, resulting in a pause to permitting and all development activities. The project reverted back to an exploration stage project to search for higher grade feeder type copper-PGM mineralisation that could be the source of the lower grade mineralisation currently defined at Marathon. Discovery of higher grade mineralisation via successful exploration could enhance project economics in the future.
During the eight months ended 31 December 2017, since Sibanye-Stillwater acquired Stillwater inclusive of this project, US$1.8 million was spent on the project to advance the following:
During 2017, approximately 6,000m of diamond drilling tested three target areas in search of feeder structures and to test low sulphidation PGM mineralisation. Although high-grade feeders were not intercepted during 2017, the results provide valuable information for exploration vectoring.
Trails and surface trenches were also extended and sampled during 2017 at the Boyer Lake area within the prospective intrusive lithologies of the Coldwell Complex. In addition, minimum environmental baseline data was collected in 2017.
| |
Sibanye-Stillwater | Integrated Annual Report 2017 | 43 |
The budget for 2018 is US$1.1 million to maintain the project during the year.
ALTAR PROJECT
Altar is a copper-gold property in San Juan province, Argentina. It is located in the Andes Mountains, approximately 10km from the Argentina-Chile border, and approximately 180km west of the city of San Juan.
In October 2011, Stillwater acquired Peregrine Metals Limited, a Canadian exploration company, whose principal asset was the Altar project. The property consists of eight wholly-owned mining concessions and five optioned mining concessions. Seven of these mining concessions are subject to production royalties, including a 1% net smelter royalty, and four other concessions are subject to a 2% net smelter royalty.
Altar, an exploration-stage project, is primarily a copper-gold porphyry deposit with potential for discrete peripheral gold system targets. The Altar deposit currently exhibits open mineralisation in most directions. During 2016, 4,931m were drilled on eight holes plus one hole extension. The 2016 drilling resulted in the discovery of a new copper-gold porphyry stock southeast of the Quebrada de la Mina (QDM) gold Mineral Resource.
During the eight months ended 31 December 2017, US$1.7 million was spent on the project to advance the following:
A total of 5,631m of HQ size diamond drilling was performed between January and April 2017 to further test the 2016 discovery of the Quebrada de la Mina QDM-radio-porphyry copper-gold mineralisation. Drilling further defined the QDM- radio-porphyry to 1,000m depth, open in all directions. In addition to diamond drilling, surface prospecting and collection of environmental baseline data continued to maintain the project status.
The budget for 2018 is US$6.1million, earmarked to drill 6,000m on QDM-radio-porphyry, Altar-East and Altar-Central plus continue with surface geophysics, talus fine geochemistry, and environmental baseline data collection during the year. Drilling in 2018 is intended to test depth extension of all three areas by an additional 400-500m.
LOWER EAST BOULDER
Lower East Boulder is an area directly underneath the existing East Boulder mine. The boundary is defined at the top by existing 6,500 rail level and extends down 2,500ft to a planned muck haul level on the 4,000 level. The proposed strike length of project area is 25,000ft directly below the existing East Boulder mine. Limited deep drilling in 2015 and 2016 demonstrated ore grade intercepts down to 3,850 level.
For the eight months ended 31 December 2017, there was no spending on drilling in lower East Boulder area. There is no budgeted spending in 2018 to advance the study of the lower East Boulder area.
LOWER BLITZ
The Lower Blitz project area is an area directly underneath the Blitz project. The boundary is defined at the top by existing 5,000 rail level and extends down 1,500ft to a planned muck haul level on at the 3,500 level. The proposed strike length of project area is 20,000ft directly below the Blitz Project. No deep drilling has been completed in this area to date.
For the eight months ended 31 December 2017, there was no spending on drilling in Lower Blitz area. There is no budgeted spending in 2018 for advancing the study of the Lower Blitz area.
TECHNOLOGICAL INNOVATION AND MODERNISATION
STRATEGY DEVELOPMENTS 2017
Sibanye-Stillwater established a Safe Technology and Innovation Department (STID) in 2014 and defined three strategic pillars with respect to its strategy, namely, safely optimising current mining horizons, capitalising on legacy mining and developing a safe, innovative mining method for the future. The pillars are designed as a multifaceted approach to technology and structured to create short, medium and long term value in the following ways:
• Harnessing technology to improve safety and optimise the cost-effectiveness of current mining will improve current production as well as reduce pay limits, enhancing our ability to maintain sustained delivery at a higher rate for a longer period
• Capitalising on legacy mining, in the short term, intends to return value, inherent to legacy assets, by enabling the return to old areas that are otherwise inaccessible by conventional means and recovering ore bearing material through sweeping and vamping. A longer-term value driver would be the ability to bring the otherwise sterilised resources contained within stability pillars to book by applying technology that is able to safely extract the same
• Developing a safe, innovative mining method for the future will allow Sibanye-Stillwater to consider mining ore bodies that are otherwise technically impractical as a result of depth or economic viability
The mine of the future (MoTF) vision has five general requirements (mechanised, automated, connected, dynamic and efficient) which, in part, or unison, will result in a mining operation with the following characteristics:
• Safe
• Environmentally conscious
• Highly efficient, yielding maximum return on capital employed
• Dynamic and able to respond rapidly to both internal and external stimulus
• Transparent, creating greater insight and enabling more proactive management
• Highly-skilled workforce, creating more attractive employment opportunities
• Promotion of secondary industry with sectoral transfer of skills, equipment and technology
| |
Sibanye-Stillwater | Integrated Annual Report 2017 | 44 |
The STID has identified more than 40 projects that fit within the scope of the MoTF vision. To ensure that resources are allocated as efficiently as possible, the department continuously ranks all projects based on impact, cost and complexity (potential return versus lead time to adopt), reserve applicability (how much of the organisation is able to adopt the technology) and interdependence (whether a project is dependent on, or contributes to, another project, programme or portfolio).
Throughout the continuous ranking process, a common theme has emerged in that “connected” projects are generally very highly ranked. The STID has thus embarked on a process of “digital understanding” in order to ascertain the organisation’s “digital status”, determine technology gaps in operational information technology and identify quick-win and high-impact initiatives to pursue in 2018.
DIGITAL MINING
Information technology is progressing at an unprecedented rate and, with the advent of high-speed data transfer, an exponential increase in computing power and cloud storage, allows organisations to understand their operational data, both in extreme detail, and at a high level of cross-functional integration.
Millions of quantitative data points can now be combined across processes and, in conjunction with qualitative data, to generate vast data sets. Once established, organisations can use advanced analytics to understand the information in a way that is not achievable through conventional analysis, and which was not possible in the past. An example of this would be stochastic mine modelling, while complex, in short, an ore body model can be mined in a million different ways in order to optimise the mine plan. Data can now be considered a contributing asset and leveraged to realise significant returns.
SIBANYE-STILLWATER’S DIGITAL JOURNEY
Despite a general misperception that conventional mining operations are not data rich environments, the STID hypothesised in 2016 that our operations are in fact data rich and that we could embark on explorative analytical initiatives without requiring additional infrastructure. This hypothesis was confirmed during the digital understanding process. However, two significant gaps were identified with respect to Sibanye-Stillwater’s current operations, subterranean communication infrastructure and data source integration.
Several different communication paradigms exist throughout the mining industry, ranging from no communication to full coverage. While some of Sibanye-Stillwater’s operations such as Bathopele exist on the full coverage end of the spectrum, the majority of the gold operations as well as the conventional platinum operations have limited coverage. In short, a substantial component of the value chain operates without digital data sources.
In order to address this issue, the STID has refined the latent data concept established in 2016, performed comprehensive market research and determined a clear path to researching and developing cost-effective, operationally applicable, communication infrastructure. The scope was to include several different communication mediums, including advancement in fibre technology, co-axial data transfer, multi-frequency wireless access as well as the original latent data transfer concept including the fourth generation personnel tag, which is capable of enabling mesh networking, effectively turning any employee into a wireless router. The outcome of the programme will be a suite of technology that may be applied to any operation, considering current state, flexibility and cost. The project is expected to be completed in 2018.
Regarding integration, both the international and South African technology markets are made up of single focus suppliers and service providers. Consequently, mines deal with a number of different suppliers or service providers for different technologies, depending on their requirements, posing a substantial challenge when considering data compatibility and integration.
There are several seemingly unidimensional technology products available that offer multidimensional data advantages. An example of this is the proximity detection system that records all aspects related to the movement as well as interactions between machinery and personnel. Sibanye-Stillwater has used this information to understand the risk profile of trackless machinery at its operations in order to mitigate the production impact that may result from implementation of revised regulations associated with proximity detection and collision avoidance. The information can also be used to understand driver behaviour and intervene in at-risk behaviour through positive coaching, potentially eliminating a risk before it transpires.
An element of integration is required to fully realise the benefits of these multi-dimensional data sources. However, a problem arises when these data sources are proprietary in nature and supplied by separate companies. The absence of collaboration has resulted in an inability to efficiently consolidate data. While significant value is still attainable through advanced analytics, Sibanye-Stillwater will only be able to fully realise the benefit of existing data once its integration has been resolved.
Sibanye-Stillwater has partnered with the University of the Witwatersrand to establish the Sibanye-Stillwater Digital Mining Laboratory. Supported by a R15 million contribution over three years, the laboratory will not only continue developing the future of mining engineering, but act as a stage gate with respect to the assessment of digital technologies, in particular, the ability to integrate across products and processes, before it is adopted by Sibanye-Stillwater. The STID is confident that current university infrastructure, combined with the support given, will create a pivotal facility that will assist in accelerating industry understanding of digital technologies as well as accelerating the development and adoption of digital enablers.
MINING PHAKISA AND THE NEWLY-ESTABLISHED MINING PRECINCT’S INNOVATION HUB – AN UPDATE
Supported by government’s commitment under the banner of the Mining Phakisa, the new established Mining Precinct and Innovation Hub has progressed rapidly and established several work streams and steering committees with support from participating mining companies in the following areas:
• Non-explosive rock breaking and mechanisation
• Longevity of current mining
• Advanced ore body knowledge
• Real time information management
| |
Sibanye-Stillwater | Integrated Annual Report 2017 | 45 |
Sibanye-Stillwater actively participates in all of these steering committees and has taken a lead role by serving as chair of the steering committees on advanced ore body knowledge and longevity of current mining. These steering committees are overseen by the Innovation Hub’s governing innovation team on which Sibanye-Stillwater serves as chair.
STOPE MECHANISATION PROGRAMME
Both the MT1000 multi-drill and MT100 sweeper and dozer prototypes were delivered and tested in 2017.
MECHANISED PILLAR EXTRACTION
The mechanised pillar extraction project using prototype raise- boring technology has been temporarily suspended. The phase two feasibility study showed that, while the concept and technology are feasible, it would only be economically viable to extract a fraction of the original estimated resource of 2.2Moz in this manner. The project therefore scored low in the reserve applicability index and, coupled with its high cost and complexity, as well as extensive lead time to adopt, the decision was made to allocate resources to a more economically viable project.
ADVANCED TRANSPORT PROGRAMME
Recent developments in battery technology have inspired several amendments to the advanced transport programme. Increased capacity, efficiency and fast-charging developments have drastically reduced the need for on-board generation. As a result, the hybrid locomotive has been redesigned to include newly-developed batteries and a smaller on board diesel power generation unit. Two additional projects are being considered to increase the efficiency of the Group’s lead acid battery locomotives as well as to develop a conversion package to convert diesel locomotives to battery locomotives without the need for additional infrastructure.
Owing to reduced on-board generating capacity and the logistical complexity of delivering compressed natural gas underground, this aspect has been put on hold.
CURRENT MINING IMPROVEMENT PROGRAMME
All previously reported projects progressed well through their initial short-term trial phases in 2017. They have all been approved for scaled-operational refinement in 2018.
| |
Sibanye-Stillwater | Integrated Annual Report 2017 | 46 |
APPROACH
Sibanye-Stillwater’s corporate purpose is unequivocal: “our mining improves lives”, and this defines the way our business activities are conducted. As a labour intensive business, this is of particular relevance to our many employees, their families and the communities in which they live.
Sibanye-Stillwater is a significant employer, providing jobs for more than 65,000 people globally, whose lives and those of their families are critically aligned with and improved, by the success of the Group. Sibanye-Stillwater provides sustainable employment and rewarding career growth opportunities as well as opportunities for personal development. We pay competitive salaries that in addition to a basic wage, include significant variable incentives and other benefits, which enable our employees to provide for their families and indirectly, the broader community. It is estimated that in South Africa specifically, each person employed in mining indirectly supports 10 direct dependents and up to seven additional indirect dependents. This suggests that Sibanye-Stillwater’s business in South Africa benefits close on 1.2 million people. In many countries, the mining sector plays a vital role in the on-going development of many local communities. Mining communities benefit from the mines in various ways, including:
• Employment
• Local economic development
• Provision of infrastructure
• The creation of upstream and downstream industries which supply goods and services to the mines
• Increased local economic activity due to wages and salaries being spent at community businesses
Furthermore, our employees contribute to the national fiscus and to local governments by paying tax on income earned and rates and taxes as residents in municipalities.
PEOPLE@SIBANYE-STILLWATER
• Sibanye-Stillwater employees play an integral part in ensuring successful delivery on our operational targets and strategy. Our People@Sibanye-Stillwater human resources model is designed to help us achieve our business strategy and promote a values-based organisation. This model aims to ensure that Sibanye-Stillwater is an employer of choice and drives our purpose
• To this end, the People@Sibanye-Stillwater initiative seeks to:
• create value for employees and provide rewarding careers
• ensure that Sibanye-Stillwater embrace and implement the spirit of true transformation
• ensure that employees are engaged and understand their contribution to the company
• develop leadership capacity to enable meaningful engagement, in order to connect with and motivate employees
• embed our CARES values so that employees embrace and live them
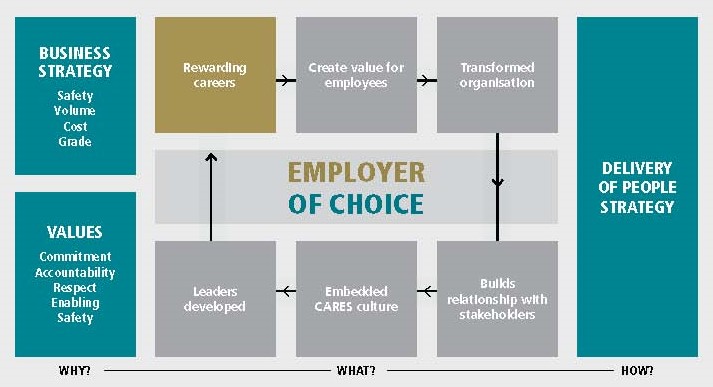
| |
Sibanye-Stillwater | Integrated Annual Report 2017 | 47 |
OVERVIEW 2017
HUMAN RESOURCES STRATEGY REVISED
The Group-wide human resources strategic framework is aligned with the Group’s purpose, vision and strategy and revised to include a holistic, integrated approach to managing employees throughout the different stages of their careers. This includes, inter alia, attracting quality employees, suitable and relevant training and development, on-going performance management and career development, and mobility, retention and exit management.
This revision involved an in-depth analysis of the service delivery model and resourcing of the human resources function, its policies, systems and processes. A strategic road map was developed to unlock human resource value in the next three years. A key aspect of the strategic road map was the updating of our policies and practices and to this end, 90% of policies were refined. The revised policies will be implemented and re- communicated in 2018.
ORGANISATIONAL AND LEADERSHIP DEVELOPMENT
The revised, holistic integrated human resource strategy is aimed at attracting and retaining the right people with the right skills and capabilities. We have defined training programmes to build leadership capability and nurture talent. We believe that competent leaders will play a crucial role in the ongoing success of Sibanye-Stillwater by embedding our values and culture, creating more engaged and aligned employees and assisting in building constructive relationships with stakeholders.
Improved organisational efficiency involves aligning our strategic objectives, people and processes. Our key priority is to ensure that employees are empowered and have the skills and tools necessary to enable them to conduct their jobs as efficiently as possible, within a conducive work environment, where leaders set the example by living the values of the company. To address this priority, we reviewed the following:
• Talent management: The overwhelming majority of our employees reside in South Africa, and as such, a region specific career growth model, based on performance; leadership ability; qualifications, technical experience and business knowledge; and potential and culture fit, was designed and approved in this region. This model will be rolled out in 2018.
SA region: Talent pool 1
| | |
| 2017 | 2016 |
Talent pool size (A – D Band) | 1,282 | 2,691 |
Successors promoted | 105 | 108 |
| 1 | | Employees identified as potential leaders for development |
| 2 | | 2016 focused on D Band employees only |
• On-boarding framework: This framework, developed to promote sustainable and innovative practices to support the human resources strategy, aims to integrate new employees and those in new positions so that they become productive as speedily as possible. This framework will help ensure that newly appointed employees are successful and will promote employee engagement and retention.
Phase one of an on-boarding survey was conducted in 2017 to determine imbalances between occupational demands on the individuals and the resources available to help them cope with these demands. Results indicated that workplace demands on employees are high which may be due to inadequate resourcing and a lack of role clarity. The second phase of this survey will be rolled out in 2018.
• Psychometric assessments: Psychometric assessments for all employees up to the E-lower band level are now conducted in-house by a registered psychologist. Executive assessments are outsourced. The new assessment system was successfully rolled-out and integrated with relevant human resource processes (recruitment and selection, talent management, succession planning and development). Employees are assessed against the leadership competency framework which will highlight growth areas to be developed to improve the quality of our leadership. Comprehensive psychometric assessment data is used to indicate potential matches with our leadership framework and values, as well as the likelihood of an individual being successful in a specific job. This data will be used in compiling employee development plans.
Psychometric assessments also aid the internal talent management process. The annual talent review was held in November 2017. These reviews will be held quarterly in 2018 when career opportunities and risks in core disciplines will be identified.
• Leadership development: A leadership competency framework aimed at promoting leadership capability has been crafted and the first module of an executive development programme completed. In 2017, 52 employees from the SA gold operations attended the leadership development programme at Gordon Institute of Business Science (GIBS) and another 131 attended corporate education programmes. Candidates from the SA PGM operations will be included in this programme from 2018.
• Executive succession planning: Executive development and succession processes form the basis of our integrated talent management framework. The executive development programme will coach executives on how to lead teams and enable people, which is vital to organisational development. Sibanye-Stillwater believes that developing competent and able leaders, with the correct critical skill sets, is essential to the future success of the business and will provide a competitive advantage, enabling delivery on our business goals. The development of a pool of effective and aligned leaders will be vital for the ongoing transformation of Sibanye-Stillwater into a modern mining company and to ensure the competitiveness and sustainability of our business, particularly in these challenging and complex social and economic times. To this end, we have partnered with Duke Corporate Education, a global leader in customised executive education, to deliver an executive leadership development programme that encompasses coaching, leading for impact, strategy, transformation and stakeholder engagement.
| |
Sibanye-Stillwater | Integrated Annual Report 2017 | 48 |
Embedding our corporate culture
Cultural transformation underpins organisational, leadership and functional development. While our corporate values have been rolled out throughout the company, much remains to be done to embed the culture fully, particularly at the newly-acquired assets. The recognition and rewards policy includes different categories of rewards including: Living the CARES values and embracing diversity.
In the US region, the corporate values were rolled out in the second half of 2017. In addition, to ensure continuity, three executives, including the CEO, are involved in planning for and implementing the strategy. The focus is to identify talent and those with the necessary leadership skills to advance the business.
OUR WORKFORCE AND ITS CHARACTERISTICS
During 2017, we focused extensively on optimising our workforce to improve profitability and productivity, to prolong operating lives and to ensure longer-term job security for our employees. Sibanye-Stillwater’s total workforce as at 31 December 2017 was 66,472 (2016: 74,531), including contractors – in the SA region and 1,970 in the US region and 55 corporate office employees. The decline is largely a result of restructuring during the past year in the SA region, including the cessation of mining at the Cooke underground operations.
Following the Stillwater acquisition, the Group was restructured on a regional basis in order to ensure the focus on operational delivery in the regions, which have different operational and environmental characteristics. A separate corporate office has been established to focus on strategic and broader group issues, leaving the regions to focus on operational delivery.
Sibanye-Stillwater workforce by operation as at 31 December
| 2017 | 2016 | 2015 |
Permanent employees | Contractors | Total | Permanent employees | Contractors1 | Total | Permanent employees | Contractors1 | Total |
SA REGION | | |
Beatrix | 7,084 | 925 | 8,009 | 7,884 | 1,671 | 9,555 | 7,618 | 1,362 | 8,980 |
Driefontein | 10,969 | 1,495 | 12,464 | 10,941 | 1,648 | 12,589 | 10,772 | 949 | 11,721 |
Kloof | 9,581 | 1,487 | 11,068 | 9,858 | 1,319 | 11,177 | 10,192 | 941 | 11,133 |
Burnstone | 237 | 298 | 535 | 241 | 336 | 577 | 122 | – | 122 |
Cooke | 717 | 542 | 1,259 | 3,788 | 1,624 | 5,412 | 5,236 | 2,084 | 7,320 |
Gold – total | 28,588 | 4,747 | 33,335 | 32,712 | 6,598 | 39,310 | 33,940 | 5,336 | 39,276 |
Kroondal (100%) | 5,715 | 2,849 | 8,564 | 6,021 | 4,378 | 10,399 | | | |
Rustenburg | 13,194 | 2,049 | 15,243 | 14,891 | 3,114 | 18,005 | | | |
PGM* – total | 18,909 | 4,898 | 23,807 | 20,912 | 7,492 | 28,404 | | | |
Regional services 4 | 2,262 | 1,349 | 3,611 | 3,054 | 1,018 | 4,072 | 3,054 | 1,018 | 4,072 |
SA Other 3 | 1,867 | 1,827 | 3,694 | 2,731 | 190 | 2,921 | 2,731 | 190 | 2,921 |
SA region – total | 51,626 | 2,821 | 64,447 | 58,644 | 15,887 | 74,531 | 39,725 | 6,544 | 46,269 |
US REGION | | |
Stillwater | 863 | 333 | 1,196 | |
East Boulder | 409 | 54 | 463 |
Metallurgical | | | |
Complex | 179 | 64 | 243 |
Regional services ** | 54 | 6 | 60 |
US Other *** | 8 | 0 | 8 |
US region – total | 1,513 | 457 | 1,970 | |
Corporate office ² | 55 | – | 55 | |
Group – total | 53,194 | 13,278 | 66,472 | 58,644 | 15,887 | 74,531 | 39,725 | 6,544 | 46,269 |
* The PGM operations are those operations under management. For 2016, Kroondal is included for the nine months from April to December 2016 and the Rustenburg operation for two months, November and December 2016. For 2017, these operations are included for the full year
** Regional services for the US include executive management located in the Columbus, Montana and Littleton, Colorado offices
*** US other represents people employed at Marathon (2 employees) and Altar (6 employees) exploration projects as part of the US region, while there were no contractors at 31 December 2017
1 Contractors excludes ‘free’ contractors (those who receive a fee for service irrespective of the number of contractor employees on site – they are not compensated on a fee-per-head basis but on a fee for the service or work performed)
2 Corporate office includes executive management since September 2017
| |
Sibanye-Stillwater | Integrated Annual Report 2017 | 49 |
3 Other includes Protection Services, Shared Services, the Sibanye-Stillwater Academy, Health Services and Property
4 Regional services includes the executive management of SA region as well as employees providing a service to the SA region and not reflected in other
Gender diversity of permanent employees – gender (%)
| | |
| MALE | FEMALE |
SA region | 87% (45,080) | 13% (6,546) |
US region | 92% (1,399) | 8% (114) |
Corporate office | 55% (30) | 45% (25) |
Group | 87% (46,509) | 13% (6,685) |
WORKFORCE COMPOSITION 2017
Type of employee by region
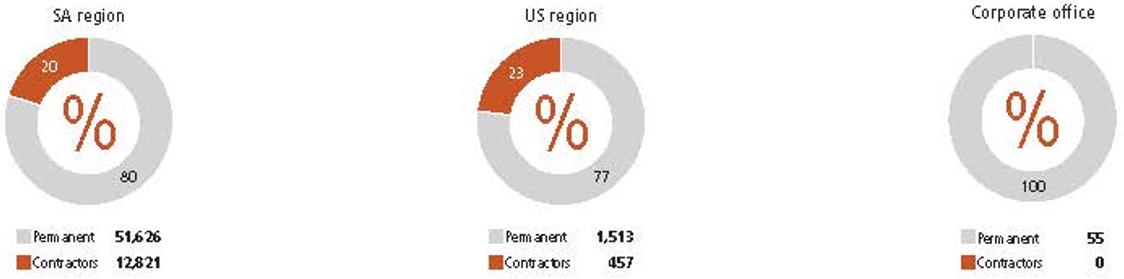
Workforce breakdown by age
| | | | | | | | | | | | |
| 2017 | 2016 | 2015 |
SA region | Payment
employee | Contractors | Total | % | Permanent
employees | Contractors | Total | % | Permanent
employees | Contractors | Total | % |
Younger than 30 years | 4,034 | 3,694 | 7,728 | 12 | 5,913 | 4,561 | 10,473 | 14 | 5,251 | 1,890 | 7,141 | 15 |
Between 30 and 50 years | 37,275 | 7,738 | 45,013 | 70 | 41,636 | 9,536 | 51,172 | 69 | 27,017 | 3,805 | 30,822 | 67 |
Older than 50 years | 10,317 | 1,389 | 11,706 | 18 | 11,095 | 1,791 | 12,886 | 17 | 7,457 | 849 | 8,306 | 18 |
US Region | Payment
employee | % | | | | | | | | | | |
Younger than 30 years | 157 | 10 | | | | | | | | | | |
Between 30 and 50 years | 848 | 56 | | | | | | | | | | |
Older than 50 years | 508 | 34 | | | | | | | | | | |
SECTION 189 PROCESSES – COOKE, BEATRIX AND THE PGM OPERATIONS
A major focus of employee engagement during 2017 was to address the strategic challenges resulting from low commodity prices, and underperforming operations, which negatively impacted the profitability and sustainability of the SA region.
In terms of the Labour Relations Act and to address these challenges, two Section 189 processes were instituted during 2017 – one at the SA PGM operations and one at the gold operations.
Consultations for both processes were held under the auspices of the Commission for Conciliation, Mediation and Arbitration (CCMA). The SA gold operations’ consultations lasted 85 days while those for the SA PGM operations lasted 89 days.
Initially at the SA gold operations, the jobs of 7,500 mine employees and 3,000 contractors were at risk. Through constructive and meaningful dialogue and engagement, the parties agreed on initiatives which saved 3,000 jobs, limiting the social impact of the restructuring somewhat. The loss- making Cooke operations were placed on care and maintenance and certain mining crews were transferred to the Driefontein and Kloof operations to replace contractor crews. At Beatrix, measures were implemented to contain costs and enhance productivity and the sustainability of the Beatrix West shaft in particular. It was agreed that Beatrix West would continue operating as long as it remained profitable (in terms of all-in
| |
Sibanye-Stillwater | Integrated Annual Report 2017 | 50 |
sustaining costs) on average, over any continuous three-month period. This resulted in some 1,600 employees retaining their jobs. Additional measures agreed to reduced the number of involuntary retrenchments to less than 2,000 employees.
At the SA PGM operations, the aim of the Section 189 process was to eliminate duplicated positions following the consolidation of the Rustenburg operation and Kroondal within Sibanye-Stillwater. While 332 employees were at risk, ultimately just 17 employees were retrenched, 65 employees opted for voluntary separation and 218 employees were transferred internally.
Absenteeism
Absenteeism is a major issue affecting productivity and hence the profitability and sustainability of the operations in South Africa. To address the negative impact of unplanned absences on productivity and costs, several initiatives have been implemented over the past five years.
Absenteeism at the SA PGM operations reduced to 15% in 2017 from 20% in 2016, while the gold operation had an absenteeism rate of 15.7% up from 15.1% due to higher than usual absenteeism at the Cooke operations before closing the underground operation. For further information, see Health and wellbeing.
US REGION
In recent years, before the acquisition of the US assets, productivity levels in the region had improved significantly and the aim is to maintain these levels.
Wages and salaries are significantly higher in the US region where the operations are highly mechanised with a small, highly skilled workforce. The workforce, which resides in the vicinity of the operations, is bussed to and from work daily.
The employee turnover rate – 0.47% in 2017 – in the region is low. Strong unions and strict labour laws in the state of Montana protect employees. There is no official retirement age.
EMPLOYEE RELATIONS AND VALUE CREATED
Union representation
The mining sectors in both South Africa and the United States are unionised.
At the end of 2017, around 93% (2016: 92%) of our total permanent workforce in South Africa was unionised. Currently in South Africa, four unions are recognised by Sibanye-Stillwater, namely AMCU, NUM, Solidarity and UASA, and in the United States, employees belong to the United Steel Workers International Union (USW). Formal employee engagement structures are in place – from shaft and operational levels to those at management level. A human resources forum meets quarterly and works with structures at the operations. In addition, there are leadership forums, one for the gold operations and one for the PGM operations in the SA region. The CEO meets with union leadership on an ad hoc basis.
Union representation 2017 – South Africa
| | | | |
| Gold operations | PGM operations | Services and other | South Africa |
| Membership | Representation (%) | Membership | Representation (%) | Membership | Representation (%) | Total
% |
Total | 28,735 | 95 | 17,576 | 93 | 3,609 | 86 | 93 |
| |
Sibanye-Stillwater | Integrated Annual Report 2017 | 51 |
Annual comparison of union membership – SA region
| 2017 | 2016 |
Total | PGM | Gold | Services | Total | PGM | Gold | Services |
Membership | | | | | | | | |
AMCU | 26,687 | 12,335 | 13,651 | 701 | 29,988 | 13,720 | 15,343 | 925 |
NUM | 17,133 | 2,859 | 11,992 | 2,282 | 18,816 | 2,776 | 13,318 | 2,722 |
UASA | 3,183 | 1,937 | 853 | 393 | 3,676 | 2,271 | 965 | 440 |
Solidarity | 1,242 | 445 | 564 | 233 | 1,257 | 394 | 594 | 269 |
Non-unionised | 3,381 | 1,333 | 1,528 | 520 | 4,907 | 1,572 | 2,492 | 664 |
Total | 51,626 | 18,909 | 28,588 | 4,129 | 58,644 | 20,733 | 32,712 | 5,020 |
Membership respresentation | | | | | | | | |
AMCU | 52 | 65 | 48 | 16 | 51 | 66 | 47 | 18 |
NUM | 33 | 15 | 42 | 55 | 32 | 13 | 41 | 54 |
UASA | 6 | 10 | 3 | 10 | 6 | 11 | 3 | 9 |
Solidarity | 2 | 2 | 2 | 6 | 2 | 2 | 2 | 6 |
Non-unionised | 7 | 8 | 5 | 13 | 9 | 8 | 7 | 13 |
Total | 100 | 100 | 100 | 100 | 100 | 100 | 100 | 100 |
Union representation 2017 – US region (%)*
| | | | | | | | |
| | | | | Stillwater (including Blitz | Columbus Metallurgical Complex | East Boulder | Administrative support staff |
USW | | | | | 80 | 61 | 77 | 0 |
Non-unionised | | | | | 20 | 39 | 23 | 100 |
Total | | | | | 100 | 100 | 100 | 100 |
At the US region operations, 1,163 of the 1,513 employees belong to a union. The 1,163 employees are represented by the USW (Local 11-001), for which there are two contracts. At Stillwater/Columbus Metallurgical Complex, 845 employees have union representation and at East Boulder, 318 employees.
Strikes in 2017
There were no wage-related strikes in the SA region in 2017. There was a strike at the Cooke operations in June 2017 due to a restriction on food being taken underground related to efforts to combat illegal mining. This led to a 15-day strike and 181,680 hours of lost production.
Salaries and wages
Given the volatility of metal prices, managing the total cost of employment is essential in managing productivity.
In 2017, the basic monthly wage rate ranged from R8,012 for a Category 4 employee to R11,445 for a Category 8 employee. The corresponding total monthly fixed earnings ranged from R12,954 to R17,184 respectively, with total average monthly earnings varying between R16,015 and R22,709 respectively. Gross wages paid in 2017 in the SA region were R13.7 billion (2016: R9.3 billion), with the increase primarily due to the acquisition growth of the Group.
In the US region, gross wages and salaries paid for the 8 months as part of the Group totalled US$114.7 million (R1.5 billion).
Wage negotiations
During the year, wage negotiations were successfully concluded at Kroondal in the SA region and at the PGM operations in the US region.
At Kroondal, a three-year wage agreement was signed with all three unions (AMCU, NUM and Solidarity). The agreement, effective from 1 July 2017, includes an annual increase of R1,000 a month for three years for Category B employees (lower category employees) with inflation-related annual increases agreed for Category A employees. Medical aid subsidies will also increase. Combined, these increases represent an average escalation of about 7% in Kroondal’s total wage bill and helped to align wage scales here with those at Bathopele – both Kroondal and Bathopele are mechanised operations. This will contribute to business continuity and promote certainty regarding Kroondal’s integration within Sibanye-Stillwater.
Optimal production performance continued at Kroondal throughout the wage negotiations with yet another production record being set in the same month as the wage negotiations were concluded. This reflects the high level of employee trust prevailing at the operation.
While still owned by Anglo American Platinum, a three-year wage agreement was signed at the Rustenburg operations and became effective from 1 July 2016, prior to their acquisition.
| |
Sibanye-Stillwater | Integrated Annual Report 2017 | 52 |
The wage agreement signed by the South African gold operations with all unions in 2015 expires on 30 June 2018 and the next round of wage negotiations in the sector is due to begin shortly.
In the US region, a two-year wage agreement was signed with the USW, the representative union at the Stillwater mine in Montana. In terms of the agreement there was a 2% general wage increase for all job categories effective from 2 June 2017 to 1 January 2018, and a 1% increase, effective from 1 January 2018 to 1 June 2018. An annual increase of 2% was agreed for the second year of the agreement, from 2 June 2018 to 1 June 2019.
Negotiations with the USW regarding East Boulder were concluded towards year-end 2017. A new four-year wage contract was signed that included a two-year extension. The next wage negotiations will be in December 2021. The agreed wage increases were a 1% increase effective 1 January 2018 and a US$1,000 bonus that was paid by 1 February 2018, followed by annual increases of 2% for 2019, 2.5% in 2020 and 2% in 2021.
Employee share ownership scheme – SA region
By the end of 2017, 22,269 employees (2016: 24,523) were participants in our employee share ownership plan, the Thusano Trust, which was established in 2010 when employees of Gold Fields acquired 13,524,365 Gold Fields shares, in line with a collective agreement between the NUM, UASA, Solidarity and Sibanye (previously GFI Mining South Africa Proprietary Limited). The shares were allocated to employees in Paterson employment bands A, B and C, according to their years of service.
With the unbundling of Gold Fields and the creation of Sibanye Gold Limited in 2013, Sibanye employees were allocated an equal number of shares in each company.
With the acquisition of the Rustenburg operations during 2016, Sibanye-Stillwater concluded a 26% broad-based BEE transaction through a subsidiary. In terms of this transaction, Rustenburg Mine Employees Trust now has a shareholding of 30.4%, Rustenburg Mine Community Development Trust 24.8%, Bakgatla-ba-Kgafela Investment Holdings 24.8% and Siyanda Resources Proprietary Limited 20%.
Matshediso programme
At Sibanye-Stillwater, we endeavour to create meaning beyond the workplace. The Matshediso programme assists the dependants and families of employees who have been disabled or fatally injured as a result of a mine accident and aims to help break the cycle of poverty and to secure the future of those directly affected. In 2017, R761,100 (2016: R685,600) was paid to beneficiaries.
The Matshediso programme was revised in 2017 and certain benefits improved. Enhanced benefits include an increased allowance for education and schooling, school uniforms, stationery and transport, among others. In addition, the programme allows for an automatic bursary/internship to be awarded in an area of study of the dependant’s choice at a recognised tertiary institution, subject to the minimum acceptance requirements being met. This applies to all dependants.
Addressing Indebtedness
Our Care for iMali programme to fight indebtedness has been very successful and we continue to roll it out to community members as well. For more information, refer to the Care for iMali fact sheet on www.sibanyestillwater.com
SA REGION – TRANSFORMATION, INCLUDING THE MINING CHARTER
Our aim is for our workforce to be diverse and demographically representative of the areas in which we operate – in both the SA and US regions. In South Africa, this is a legislative requirement in terms of the Mining Charter and the Employment Equity Act. Establishing a workforce that broadly reflects the country’s demographics remains one of our business and social imperatives and we strive to go beyond compliance to be a fully transformed and inclusive company.
A Transformation Steering Committee was established under the auspices of the Head of Human Resources. The main focus of this committee is to drive the transformation agenda across the business and to develop and implement an integrated approach that includes all elements of transformation – employment equity, gender equality, enterprise development and preferential procurement, and constructive community engagement and development.
We have implemented diverse initiatives to identify, develop, retain and attract historically disadvantaged South African (HDSA) talent. We have exceeded the transformation targets set by the 2014 Mining Charter. Employment equity has improved from less than 40% five years ago to more than 45% at the end of 2017, while women employed has increased to 13% from 11%.
Currently around 70% of the workforce at the SA region’s operations is migrant, with 30% of the total workforce at the gold operations and 20% at the PGM operations being foreigners. Employees who are not from the local community near the mines are deemed to be migrant. Around 37% of employees reside locally, which includes some migrant employees residing locally.
LOCALISATION AND COMMUNITY RECRUITMENT
Unemployment remains a challenge in South Africa and in the communities surrounding our mines. To help address the situation, our recruitment and human resources development strategies have become more locally focused.
The recruitment function has been incorporated into a centralised human resources services centre. We also consult more closely with local government and community leaders on recruitment to manage expectations responsibly. Certain gold operations have signed memoranda of understanding with local government and community leaders on fair and transparent recruitment processes. These recruitment practices have been extended to our PGM operations and new employees are increasingly being drawn from local communities.
While we continue to employ more people from local communities, we strive to continue supporting labour-sending areas where mine remittances are often the sole source of income for impoverished communities.
| |
Sibanye-Stillwater | Integrated Annual Report 2017 | 53 |
Given the labour-optimisation initiatives undertaken in 2017, a moratorium on recruitment was put in place for the better part of the year. External recruitment was significantly reduced which affected the number of new recruits from local communities.
Local community recruitment – SA region
| 2017 | 2016 | 2015 | 2014 |
PGM | Gold | PGM* | Gold | Gold | Gold |
Appointments – total | 502 | 2,239 | – | 4,017 | 4,363 | 841 |
Local recruitment: | 401 | 936 | – | 2,877 | 3705 | 640 |
Local community members employed (%) | 80% | 42% | – | 72% | 85% | 76% |
| * | | A moratorium on recruitment was in place |
The recruitment strategy in the US region is focused on replacing attrition as well as adding personnel for the Blitz expansion. Most employment positions are filled from within local communities, while technical and management positions are recruited from US universities and the US mining industry.
In the US region, Stillwater and the Columbus Metallurgical Complex, together with all support offices, are located in Stillwater County, Montana, while East Boulder is in Sweet Grass County. In all, 92% of employees reside in Montana, and 45% in the same county as the operation at which they are employed.
US region: distribution of employees by Montana county*
3 | |
County | No. of employees |
Stillwater | 540 |
Yellowstone | 420 |
Sweet Grass | 148 |
Park | 155 |
Carbon | 121 |
Other locations** | 121 |
* As at 31 December 2017
** Excludes 8 employees at the Marathon and Altar projects based in Argentina and Canada
WOMEN IN MINING AND GENDER EQUITY
Our approach to women in mining (WIM) and gender equity focuses on establishing a working environment and culture that supports and proactively attracts women at all levels, and which accelerates gender equity through employee development and improved communication, promoting awareness and understanding of gender diversity and equity, and removing gender-related barriers to make the working environment more conducive for women. In reviewing our human resources policies, ensuring that they are gender neutral was a priority.
Women representation in our workforce overall improved slightly to 13% in 2017 with 10% of core mining roles being held by women. The moratorium on recruitment posed a challenge to our efforts to increase the overall level of women representation. In 2017, a particular focus of executive assessments and succession planning was to increase female representation in middle management.
Women employed (%)
| 2017 | 2016 | 2015 | 2014 | 2013 |
Group | US region | SA region | SA region | SA region |
Total | PGM | Gold | PGM | Total | Gold | PGM | Gold | Gold | Gold |
Representation | 13% | 8% | 10% | 14% | 11% | 7.2% | 13.6% | 6.6% | 5.2% | 3.5% |
Sexual harassment is a serious matter that disrupts harmony in the workplace, violates our values and will not be tolerated. Awareness and understanding of sexual harassment play a pivotal role in preventing sexual harassment in the workplace and, to this end, regular awareness campaigns are conducted. Sexual harassment is also addressed in employee “return from leave” refresher induction training. A sexual harassment policy governs the procedures to be followed in dealing with incidences of sexual harassment. Sibanye-Stillwater recognises the seriousness of sexual harassment and the sensitivities around it, as well as the negative impact it can have in the workplace. As a result, a special priority sexual misconduct unit has been tasked with handling all sexual harassment cases reported.
| |
Sibanye-Stillwater | Integrated Annual Report 2017 | 54 |
Women in core mining positions (%)
| 2017 | |
US region | SA region |
PGM | Total | PGM | GoOld |
Number | 30 | 4,474 | 2,463 | 2,311 |
Representation | 26% | 10% | 13% | 7.8% |
| | 4,774 of total workforce (10%) |
Recruitment by category
| | | | | | | | | | | | | | | | | | |
| SA region | 2017 Gold | 2017 PGM | 2016 3 Gold | 2015 Gold | 2014 Gold |
| Total | WIM | % | Total | WIM | % | Total | WIM | % | Total | WIM | % | Total | WIM | % | Total | WIM | % |
Management 1 | 147 | 25 | 17 | 109 | 18 | 17 | 38 | 7 | 18 | 88 | 7 | 8 | 88 | 18 | 20 | 16 | 3 | 19 |
Senior manager 2 | 14 | – | – | 14 | | – | – | – | – | 8 | | – | 9 | | – | – | – | – |
Core and critical | 2,442 | 392 | 16 | 1,924 | 327 | 17 | 518 | 65 | 13 | 3,687 | 538 | 15 | 3,957 | 809 | 20 | 754 | 83 | 11 |
Total | 2,718 | 473 | 17 | 2,008 | 345 | 17 | 710 | 128 | 18 | 4,017 | 545 | 14 | 4,363 | 827 | 19 | 841 | 86 | 10 |
| 1 | | Management is D and EL positions |
| 2 | | Senior management is EU and above |
| 3 | | A moratorium on recruitment at the SA PGM operations was in place for 2016 |
HUMAN RESOURCE DEVELOPMENT
The SA region academy is committed to developing the knowledge, skills, attitudes and behaviours of its employees to achieve the desired levels of performance for organisational, personal and broader social objectives through various training methods, ranging from classroom teaching, self-learning, learner peer group discussions and experiential learning. Our skills development initiatives are also extended to our host communities, in line with organisational requirements.
In 2017, Sibanye-Stillwater invested R532 million (2016: R403 million) in human resource development in the SA region – representing 8.33 million hours of training. This was equivalent to 79.6 training hours per employee (2016: 88.96). The total number of employees and community members attending one or more of our training programmes increased by 26,011, from 78,636 in 2016 to 104,647 in 2017. The reduction is a result of the streamlined learning and development delivery process, aimed at maintaining training quality while significantly reducing the duration of the short to medium length training courses.
Training and development
Most of our human resource development programmes are conducted under the auspices of the Sibanye-Stillwater Academy. These programmes, which include skills training and development, adult education and training as well as study assistance bursaries, learnerships and portable skills training, are directed at both Sibanye-Stillwater employees and members of host communities. The academy is fully accredited by the national Mining Qualifications Authority (MQA) Sector Education and Training Authority (SETA) and its programmes have been approved by a number of SETAs. Satellite campuses are located at various operations, and managed centrally by the Academy.
Having completed the second five-year Social and Labour Plan (SLP) cycle in 2016, the SA region drew on past lessons and achievements, and embarked on a revised and more tailored approach to developing an HRD plan for the SLP cycle for the five-year period from 2017 to 2021. In the new plan, particular emphasis was placed on developing specific critical skills required in terms of our strategy, with a continued emphasis on identifying employees with potential for succession, and cultivating an enabling environment for employees to progress and be absorbed into the talent pipeline needed to sustain our business into the future. The HRD targets set in the plan are more realistic and aligned with the actual skills requirements and take into account the many factors affecting demand for skills, including the demographic profile of the workforce, life-of-mine projections and employee turnover rates at each operation.
This approach will help to realise greater returns from investment in training and development, and enable a greater number of vacant posts to be filled from the internal talent pipeline, thus promoting positive employee career progression paths. This can be observed in the resourcing statistics for positions filled internally during 2017 (55% in the SA region as a whole 79% at the gold operations and 30% at the PGM operations). We expect the rate of internal resourcing at the PGM operations to increase from 2018 and onwards as talent pools are boosted.
Learnerships and bursaries
To attract new high-potential talent from local communities and among school leavers, Sibanye-Stillwater allocates learnership and study assistance bursary opportunities. Traditionally, we have made provision for young community members to enter mining and engineering occupational learnership qualification programmes or to pursue tertiary qualifications through a range of bursaries allocated for studies in core mining-related disciplines.
In addition, in 2017, Sibanye-Stillwater implemented a new integrated work and tertiary study programme, providing an opportunity for learners to alternate university attendance with structured on-the-job exposure and experience. The aim is to accommodate high-potential learners and
| |
Sibanye-Stillwater | Integrated Annual Report 2017 | 55 |
enhance their readiness for the work environment and for senior roles, two to three years sooner than is the case with the standard bursar and internship approach.
The inaugural group of 11 learners on the integrated study programme completed the first year of their academic studies in 2017, collectively achieving 41 distinctions.
In 2017, the SA region invested R37.7million (2016: R14.2 million) in bursaries for 121 bursars, with 11 taking up permanent employment (2016: 20).Sibanye-Stillwater also partners with the MQA to provide additional opportunities for young South Africans, who are not beneficiaries of industry-funded sponsorship, to gain work experience through practical work programmes and internships.
During 2017:
• 176 third-year university students attended a two-month vocational work programme in preparation for their final year of studies, which they will enter in 2018 (2016: 40). As a result of the “fees-must-fall” campaign at many South African universities, only company bursars were accommodated for vocational work
• 162 students in total (2016: 130) attended internship programmes, with 50 learners completing a one-year practical work programme, while another 15 students began the first year of a two-year graduate development programme
Sibanye-Stillwater also invests in education and research programmes at universities. We have strategic partnerships with the University of Johannesburg and the University of the Witwatersrand. These partnerships were consolidated further during 2017, when sponsorship agreements were concluded with each institution for a combined value of R30 million over the next three years. Sibanye-Stillwater also contributed R3.6 million (2016: R2.5 million) in 2017 – R2.5 million from the SA gold operations and R1.1 million from the SA PGM operations – to the Minerals Education Trust Fund, established by the Chamber of Mines, to assist universities to offer competitive salaries, and so attract and retain top academic talent.
Adult education and training
Following the incorporation of the SA PGM operations into the SA region, 43% of employees in the region had qualifications equivalent to adult education and training level 3 and higher in 2017 – 62% for the SA gold operations (70% in 2016) and 24% for the SA PGM operations.
The adult education and training strategy was revised during 2017 for implementation in 2018. The revision is intended to improve the process to select students with potential for the programme, and to provide more focused monitoring of progress made and advancement into available occupational learnerships once students have attained the requisite levels of numeracy and literacy. Similar processes have been implemented at the PGM operations.
In 2017, 11 employees (2016: 16) who had attended adult education and training moved into the learnership pipeline, and eight apprentices who had completed their learnerships were permanently employed by Sibanye-Stillwater.
SA REGION – PGM OPERATIONS
The PGM operations in South Africa have been fully integrated into the company from a training and development perspective, and a talent/succession strategy developed for these operations. All psychometric assessments for D level and lower employees at these operations are conducted internally by a registered psychologist, a move which has yielded cost savings. The Sibanye-Stillwater Academy training courses have been adapted for the PGM operations while adult education and training is centralised.
For the more mechanised PGM operations, Bathopele and Kroondal, training programmes are being integrated and centralised using simulation machines. Burnstone, planned as a mechanised mine, will also make use of these training facilities.
Portable skills training
Our portable skills training equips employees with practical skills that will be useable beyond the mining industry and will stand them in good stead for life after mining. We offer training to community members in skills facilitating employment and entrepreneurship. In addition to training, recognised by the South African Qualifications Authority, in the mechanical, electrical and construction trades, training is also provided in agriculture, clothing and textile manufacturing.
SA region: Human resource development: Training spend (R million)
| | |
| 2017 Actual | 2016 Actual |
Beatrix | 73 | 59 |
Cooke | 23 | 34 |
Driefontein | 132 | 118 |
Kloof | 111 | 109 |
Kroondal* | 59 | – |
Rustenburg** | 134 | – |
Total | 532 | 320 |
* Kroondal not included in 2016 Integrated Annual Report, no SLP in place
** Rustenburg operations not included in the 2016 Integrated Annual Report
| |
Sibanye-Stillwater | Integrated Annual Report 2017 | 56 |
SA region: Human resource development – 2017
| | | |
| Expenditure (Rm) | No. of Learners | Total no. of training hours |
Internships | 38 | 162 | 326,592 |
Bursaries | 11 | 121 | 243,936 |
AET (employees) | 28 | 719 | 258,840 |
AET (community) | 9 | 238 | 107,100 |
Engineering learnerships | 32 | 241 | 485,856 |
Mining learnerships | 62 | 332 | 669,312 |
Portable skills (employees) | 2 | 24 | 1,152 |
Portable skills (community) | 5 | 123 | 11,808 |
Leadership development | 15 | 162 | 6,480 |
Core skills training | 314 | 96,430 | 6,171,520 |
Coaches/mentors training | 0.2 | 159 | 1,272 |
Employee indebtedness | 7 | 5,684 | 45,472 |
Academic support and research | 3 | – | – |
Other | 6 | 252 | 2,016 |
Total | 532 | 104,647 | 8,331,356 |
HUMAN RESOURCE DEVELOPMENT – FOCUS AREAS:
| · | | Sibanye-Stillwater has identified a significant shortage of employees who have achieved the minimum educational qualifications for entry into the engineering learnership programmes. We have introduced a study assistance programme for employees to attend Department of Education-registered national certificate courses (N-course studies). Employees can apply for a financial grant to attend these N-courses on a part-time or full-time study basis, which upon completion, will make them eligible to apply for the formal learnership programmes |
| · | | Quarterly and annual talent reviews monitor progress made on succession |
| · | | Implementation of the revised adult education and training strategy |
| · | | Approval of the maths and science project funding model and budget – The Maths and Science Centre in the West Wits area is aimed at improving the lives of teachers and learners by providing assistance and training to help improve learners’ results for grades 10 to 12 in maths and science. This intervention will also support the growth of Sibanye-Stillwater’s talent pool as well as building teacher competencies in these subjects |
| · | | Implementation of the revised Matshediso programme. The revised programme encompasses the following per dependant annually: |
| | |
Benefits | 2017 policy | 2016 policy |
Host schools | 5,000 | 2,500 |
Boarding schools | 10 000 | N/A |
Uniform, stationery, text books and transport | 2,000 | N/A |
Extra classes at host schools | 500 | N/A |
Study opportunities | Automatic bursary/internship awarded for study of the child’s choice at a recognised tertiary institution (minimum requirements applicable) | Bursary opportunities only in care mining disciplines, including finance (minimum requirements applicable) |
Training in financial management
Additional training on home ownership, debt counselling and coaching is provided by financial coaches at all operations. All garnishee orders received are validated and managed, and employees are informed of new garnishee orders received.
Excessive instalment deductions are negotiated to assist employees to take home at least 30% of their earnings. Savings of R1.34 million in illegal deductions have been achieved on behalf of employees – R1.28 million at the SA gold operations and R68,000 at the SA PGM operations – since implementation of the second phase of the Care for iMali indebtedness programme in 2015.
See case study for further information and progress made in 2017 regarding this initiative
US REGION – HUMAN RESOURCE DEVELOPMENT AND TRAINING
Training in the US region includes induction and annual refresher training, miner 3, compliance and professional training. Total spend for the eight months May to December 2017 was US$1.3 million (R17.3 million). In terms of leadership development, 230 salaried employees participated in a proprietary five-module leadership development training programme addressing the tenets of communication, business sense, teamwork, visionary leadership and character. Another six employees participated in the educational assistance programme in 2017 whereby the US region reimbursed 75% of the costs (tuition, fees, books) for their continuing education.
| |
Sibanye-Stillwater | Integrated Annual Report 2017 | 57 |
NUTRITION
The diets and nutritional value (kilojoule count) of meals provided to miners residing in single accommodation complexes at the SA operations are regulated by the Mining Charter. Residents receive four meals a day as well as a nutritious mid- shift snack. A registered dietician conducts quarterly rotational audits and confirms and monitors that the menu offered to residents provides sufficient kilojoules and complies with the Ming Charter’s prescriptions. The quarterly audits include inspections of the kitchens and related infrastructure, hygiene and menus.
HUMAN RIGHTS
Our employees, including security personnel, are trained to uphold human rights and respect all cultures and customs. Regular refresher training is provided in terms of our human rights policies and recruitment procedures and when employees return from leave Training of security employees was again included in our Workplace Skills Plan for 2017, which guides our approach to training and development needs in the workplace. The Workplace Skills Plan is published annually, in line with the requirements of the Skills Development Act, 1998 (Act No 97 of 1998) and the Labour Relations Act, 1995 (Act No 66 of 1995). It is compiled jointly by the employer, employee representatives and non-unionised employees.
Our human resources policies also address human rights, as well as child/forced labour at all operations, employment equity and employee relations, including discipline and recognition. Our suppliers are encouraged to abide by these policies too. For more information on our policies, including that on human rights, refer to www.sibanyestillwater.com
GOVERNANCE
– Human resource performance is monitored by Sibanye-Stillwater’s internal audit function
– Externally, for the South Africa operations, the regulator monitors compliance with various legislation including:
• Mineral and Petroleum Resources Development Act (MPRDA) – Department of Mineral Resources (DMR)
• Broad-Based Black Economic Empowerment (BBBEE) – Department of Trade and Industry
• Employment legislation – Department of Labour
– External audits of certain Mining Charter indicators are conducted by internal and external auditors and the DMR
– Psychometric assessment tools used comply with the Health Professions Council of South Africa
– Frequent remuneration benchmark studies are conducted. Auditors, PwC, prepare formal reviews twice a year with monthly reviews being compiled. This enables almost continuous benchmarking. Any discrepancies are reported to the Board. See remuneration report
– Shaft committees report quarterly on all employee concerns to the operations committees which in turn report to leadership committees and in turn to the Social and Ethics, Remuneration, and Nominations committees
– Every South African operation has an SLP forum and an employment equity forum which meet quarterly and a skills development committee which meets monthly. These forums are attended by representatives from the unions, the Academy and management.
– The CCMA monitors compliance with labour legislation governing fair employment practices and disputes.
– Various courts adjudicate on compliance with various labour laws and disputes.
FUTURE FOCUS
| · | | In the coming year, our focus will be on further developing our economic value proposition for employees and delivering a rewarding career experience that will include, inter alia: |
| · | | Implementation of the career growth model across the SA region |
| · | | Continued implementation of the Sibanye-Stillwater operating model at the SA PGM operations |
| · | | Implementation of an integrated strategic workforce plan in the SA region |
| · | | Executive leadership development |
| · | | Launch of the SA region’s employee value proposition |
| · | | Establishing a positive and engaging culture |
| · | | Building management capability |
In the US region, focus will be on the following aspects of the economic value proposition:
| · | | Ensuring quality manpower recruitment to meet operational needs |
| · | | Continuing salaried leadership development, focused on role clarity and developing skills |
| · | | Ongoing development of succession planning |
| |
Sibanye-Stillwater | Integrated Annual Report 2017 | 58 |
APPROACH TO SAFETY, HEALTH AND WELLBEING
| |
The safety, health and wellbeing of our employees, the most vital of our stakeholders, is paramount. In addressing these three aspects, our approach is based on Sibanye Stillwater’s CARES values –commitment, accountability, respect, enabling and safety – and our safety, health and wellbeing tree. Our approach to safety in particular and the journey to achieve our goal of zero harm is a continuous process. This process involves constantly refreshing, revitalising and renewing safety campaigns and messages. Safety remains one of our top 10 risks and ensuring the safety of employees in the workplace is a moral imperative. SAFETY PERFORMANCE 2017 The benefit of the revised safety strategy adopted in the SA region in the latter half of 2016 and rolled out across the operations during 2017, is evident in improvements in all the main safety indicators across the region for the six months ended 31 December 2017. Compared with the same period in 2016, the SA region’s serious injury frequency rate (SIFR) improved by 14% to 3.59 per million hours with the lost-time injury frequency rate (LTIFR) improving by 13% to 5.76 per million hours worked. The SA region’s gold operations had recorded 85 fatality-free days by year-end, the longest run in our history. Its safety performance compared well with that of peers with similar operations in the sector, as did the SA region’s PGM operations regarding fatalities and serious injuries. | 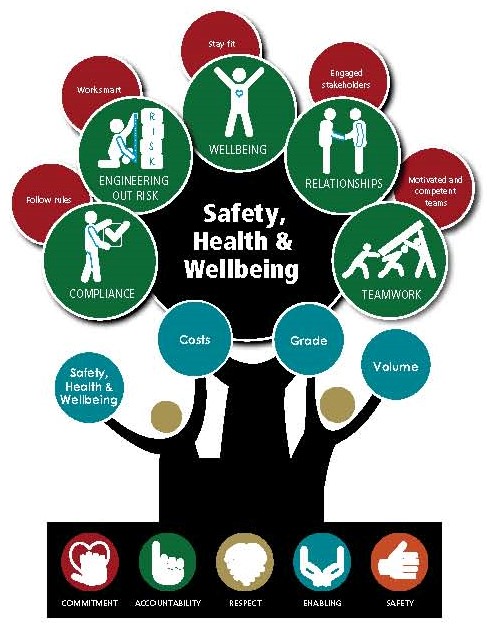
|
| | | | | | |
SA region – safety performance 2017 |
Company | FIFR | FIFR Ranking | SIFR | SIFR Ranking | LTIFR | LDIFR Ranking |
Gold operations | 0.09 | 1 | 4.11 | 1 | 6.32 | 1 |
Gold peer 1 | 0.11 | 2 | 5.00 | 3 | 10.08 | 3 |
Gold peer 2 | 0.15 | 3 | 4.18 | 2 | 7.07 | 2 |
PGM operations | 0.04 | 1 | 2.59 | 1 | 4.69 | 2 |
PGM peer 1 | 0.10 | 3 | 4.86 | 3 | 7.37 | 3 |
PGM peer 2 | 0.05 | 2 | 3.00 | 2 | 4.27 | 1 |
Source: Industry Working Group | | | | | | |
Despite the improved performance during the year, it is with deep regret that Sibanye-Stillwater reports the death of 11 employees during 2017 (2016: 14), all in the SA region – nine employees at the gold operations and two at the PGM operations (2016: 12 and two, respectively).
| |
Sibanye-Stillwater | Integrated Annual Report 2017 | 59 |
In memoriam – 2017
| | | | |
Date | Name | Operation | Occupation | Cause |
14 January 3 February 13 April 16 May 6 June 26 July | Sphampano Machenene Mxolisi Cekiso Mbuze Ncobela Seabata Khetla Andile Nkwenkwe Nkosinathi Marumo | Beatrix Beatrix Kloof Beatrix Driefontein Burnstone | Miner Rock drill operator Team leader Locomotive operator Rock drill operator Labourer | Rail-bound equipment Collapsed “plug” in ore pass Fall of ground Rail-bound equipment Fall of ground Trackless vehicle accident |
15 August 4 September 5 September 20 September 10 November | Thandisile Deku Rangwaga Puseletso Molobogeng Mashego Geraldo Sitoe Sibongile Ganithuli Moagisi Selaotswe | Kloof Driefontein Kloof Rustenburg Rustenburg | Mine sweeper Stoping team Locomotive operator Team supervisor Sweeper | Fall of ground Scraper winch Rail-bound equipment Rail bound equipment Trackless vehicle accident |
Initially, the positive safety performance continued into 2018, with the entire SA region being fatality free for January 2018. Sadly, four recent fatalities at our SA gold operations in February 2018, brought to an end a 3.8 million fatality-free shift period at the SA gold operations and 3.6 million fatality-free shifts at the SA region as a whole.
Safety incidents are of concern to all of us. We are actively investigating what caused these incidents and will take necessary action to prevent them from occurring again. The Board and management of Sibanye-Stillwater extend their deepest condolences to the families, friends and colleagues of Ngobeni Solly Dumisani (Special Team Leader, Kloof), Dube Chicco Elmon (Winch Operator, Kloof), Mating Matela (General Miner, Driefontein) and Mncwazi Zanempi (Artisan Assistant, Driefontein). Our journey towards zero harm continues.
For comparative purposes, the US operations’ total reportable injury frequency rate (TRIFR), measured per million hours worked, for the year was a record low of 12.7, an improvement on the 12.9 recorded for 2016. The East Boulder mine was free from lost day and serious injuries for the entire year and the US region reported no contractor injuries for the entire year. The SIFR is a new metric for the US region and has been calculated retrospectively to 2013. It should be noted that this is the combination of lost-time incidents and medically-reportable injuries. It does not reflect the SA region’s similarly named TRIFR
SAFETY ACHEVEMENTS 2017
SA region
Four million fatality-free shifts: | PGM operations |
Three million fatality free shifts | Gold operations (achieved 4 January 2019) |
| Kroonal (Kopaneng) |
Two million fatality-free shifts: | Kroondal (Simunye) |
| Driefontein 2 and 4 |
One million fatality-free shifts: | Beatrix |
| Driefontein 5 |
In addition, Beatrix and Driefontein were recognised at the annual Mine SAFE awards in August 2017. They were placed second and third, respectively for having recorded the most improved safety performance during 2016/17.
US region
• Achieved 1.84 million fatality-free shifts
• Base Metals Refinery achieved 500,000 hours worked without a lost-time injury
• During 2017, East Boulder received the Montana Mining Association’s Safe Work Practices Award for 2016
| |
Sibanye-Stillwater | Integrated Annual Report 2017 | 60 |
Safety performance statistics
| | | | | | | | | | |
| 2017 | 2016 | | 2015 | 2014 | 2013 |
| Group | US region 1 | SA region | Group | SA region | | | |
| PGM | PGM | Gold | PGM | Gold | Gold | Gold | Gold |
Fatalities | 11 | 0 | 2 | 9 | 14 | 2 | 12 | 7 | 12 | 9 |
Fatal injury frequency rate * | 0.07 | 0 | 0.04 | 0.09 | 0.10 | 0.09 | 0.11 | 0.06 | 0.12 | 0.10 |
Lost-time injury frequency rate * | 5.78 | 7.73 | 4.69 | 6.32 | 6.62 | 4.84 | 6.99 | 6.74 | 5.87 | 6.13 |
Serious injury frequency rate * | 3.59 | 2.42 | 2.59 | 4.11 | 4.16 | 2.88 | 4.42 | 4.68 | 3.88 | 3.50 |
Medically treated injury frequency rate ** | 2.60 | 24.65 | 2.44 | 2.24 | 3.85 | 5.72 | 3.47 | 3.60 | 3.37 | 4.32 |
No. of Section 54 work stoppages | 230 | na | 26 | 204 | 226 | 55 | 171 | 109 | 77 | 55 |
No. of production shifts lost owing to Section 54 stoppages | 238 | na | 49 | 189 | 402 | 245 | 157 | 70 | 99 | 35 |
No. of internal work stoppages *** | 46,232 | na | 2,559 | 43,673 | 21,849 | 2,044 | 19,805 | 18,642 | 16,423 | 10,383 |
1 For the period May – December 2017
* Per million hours worked
** Also referred to as treat-and-return injury frequency rate (TRIFR). Includes certain minor injuries. MTIFR is based on the Bird model safety pyramid. Sibanye-Stillwater expects and encourages a higher rate than in other categories
** Internal stoppages and the related close outs are an integral part of Sibanye-Stillwater’s risk management strategy (any person can stop a task or workplace until arrangements have been made to reduce high risk)
Note: Group data for 2016 includes the gold and PGM operations from the relevant dates of acquisition during the year while that for 2017 includes
the PGM operations in the United States region from May 2017
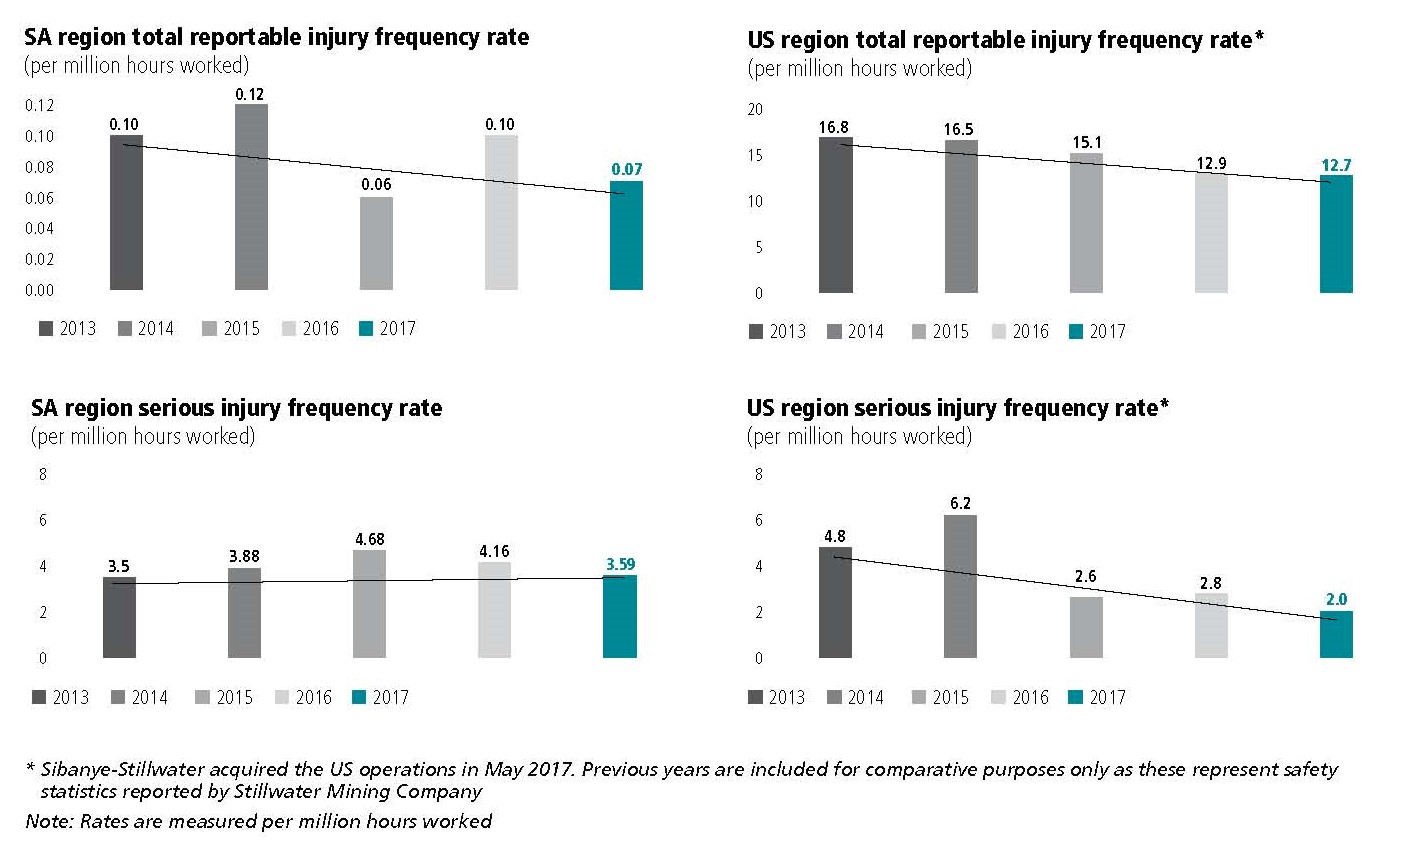
| |
Sibanye-Stillwater | Integrated Annual Report 2017 | 61 |
BEATRIX POWER FAILURE IN FEBRUARY 2018 – KEY FACTS
• At 2am on 1 February 2018, a violent storm destroyed main and backup Eskom power lines that feed the Beatrix 1, 3 and 4 shafts, causing a total power outage
• Back-up power was quickly restored to Beatrix 4 shaft where 272 employees were safely brought to surface
• Emergency generators hoisted another 64 employees to surface at 1 shaft
• Damage to critical technical equipment meant 955 employees at 3 shaft could not immediately be brought to surface. They remained in a safe and well-ventilated area where we were able to communicate with them, provide food, water and medical assistance
• Water and 1.2 tonnes of food was provided to employees while they were waiting underground
• Although all employees could have been evacuated at any time through the secondary escape way, it was agreed that in the interest of safety, employees should remain at 3 shaft until power was restored. At no point were employees in danger and management was in total control of the situation throughout
• Eskom restored power at 2:30 am on 2 February 2018 and the remaining 955 employees were hoisted to surface
• For further details on this, see the case study on the Beatrix power failure available on www.sibanyestillwater.com
In line with the theme of ‘saving lives’, the second phase of the Sharp! Sharp! campaign was launched, based on the slogan I will not look the other way – an extension of the previous year’s slogan, I am safe! We are safe! Phepha mina! Phepha zonke! This campaign, rolled out at miner level at all gold and PGM operations in 2017, will encourage accountability for safety incidents or substandard conditions. The Pinagare industrial theatre has played a key role in the roll-out of safety messages and campaigns
ADDRESSING OUR SAFETY PERFORMANCE IN THE SA REGION
Key themes underlying our safety campaigns in 2017 were zero harm and saving lives. Addressing and improving safety is a continuous process. Work begun in 2016 on the Sharp! Sharp! safety campaign to embed a culture of safety within Sibanye-Stillwater continued into 2017, with this campaign now well-entrenched within the SA region, where its roll-out at the gold and PGM operations was completed. While an inordinate amount of time is spent on safety training at our South African operations, improved safety performance benefits Sibanye-Stillwater’s overall performance and the achievement of our strategic objectives.
In addition to the Sharp! Sharp! campaign’s 12-point safety plan, a top five action plan was compiled for the SA PGM operations, focusing on the five main causes of accidents at these operations. They are conveyors, trackless mining equipment, falls of ground, explosives and material handling. A similar action plan is being designed for the gold operations, based on six key areas: falls of ground, rail-bound equipment, slip and fall, material handling, winches and rigging, and eye injuries.
PROMOTING OUR SAFETY MESSAGE
Industrial theatre has proven to be a successful medium for communicating safety messages. Industrial theatre groups were established initially in the Rustenburg area by unemployed people who have now established a formal company, Pinagare. Sibanye-Stillwater briefs the theatre group on a particular safety theme to be promoted and a ‘play’ incorporating song and dance to tell a story is choreographed on the subject. Industrial theatre, which is very well received by employees delivering an immediate buy-in from employees, has been used extensively and successfully at Kroondal in the past. It is currently being used at the gold mines where the logistics are different and more challenging with the larger numbers of employees (ie the audience) at these operations.
Four major focus areas of safety-related work in 2017 were:
Learning from fatal accidents
Sharing the critical lessons learnt from fatal accidents throughout the organisation and applying the necessary controls to prevent future incidents of a similar nature is critical in reducing the incidence of fatalities. So too is identifying high- potential hazards that warrant an immediate stop-and-fix action. Formal monthly close-out meetings following a fatal accident ensure that any resulting revisions to standards and controls, re- engineering and training are rolled out across the organisation. All such remedial actions are actively monitored, with all levels being involved, from mine overseer to mine management to executive management. Internal processes are supported by bi-monthly meetings at the MHSC, with peers in the sector, and the DMR, in line with efforts to secure tripartite commitment to more effective safety management processes across the sector, and to facilitate the sharing of information and lessons learnt.
Improving our safety culture
To insure continuous improvement in safety and health, we acknowledge that on culture needs to improve in order to achieve this.
In November 2017, the Safety Culture Transformation Process, an initiative supported by the Board and Executive management commenced at Kloof 3 and 4 shafts. Culture surveys have been concluded at these shafts and the findings are being evaluated for incorporation into the next phase. There has been ongoing parallel engagement with leadership at all levels in the gold operations, focussed on creating the belief that fatals and injuries can be eliminated.
Involved leadership
Allied to this is the implementation of visible-felt leadership, the principle of which is being entrenched throughout the organisation, from executive and senior management level to supervisory level at the stope face. In line with this, the second phase of training to embed a culture of safety at Sibanye-Stillwater includes roll-out of a leadership engagement tool kit.
| |
Sibanye-Stillwater | Integrated Annual Report 2017 | 62 |
Integrating safety
A multi-disciplinary integrated safety management system, Syncromine, is being implemented. This system, which involves human resources, rock engineering, occupational health, hygiene and mineral resource management, will link the workplace, technology and people. Implementation has begun with all the gold operations online. Roll-out at the PGM operations is to begin at Kroondal. A steering committee is in place to oversee this process which is IT-dependent and to ensure all necessary training is conducted. The short-term focus is to ensure that the mineral resource management and rock engineering disciplines are closely involved in the planning phase. This system will assist with improved compliance and optimised production planning
ADDRESSING OUR SAFETY PERFORMANCE IN THE US REGION
The US region is fully committed to the slogan “Everyone goes home safe – every day”, which is familiar to all employees and is being integrated into the culture of the business. It is also a part of the GET (guide, educate and train) safety and health management system that is being implemented at all sites in the US region.
Cross pollination of safety regimens between the US and SA regions has begun in the form of the sharing of systems and reports, and in-depth discussions on safety
US region: Injuries by category
| |
| 2017* |
Rockfall | 3 |
Struck by objects (tools, equipment etc.) | 8 |
Caught in/between | 3 |
Strains | 3 |
Operating equipment | 1 |
Operating jackleg | 3 |
Eye injuries | 3 |
Chemical burns | 1 |
Slip/trip/fall | 2 |
* For the period May – December 2017
During 2017, there were several initiatives to improve safety performance in the US region. East Boulder implemented a peer-to-peer workplace safety assessment as a tool to educate, communicate and create a heightened level of safety awareness.
While safety performance has been sound, several challenges exist, moving into 2018. With the J-M Reef ore body being narrow veined, most mining is accomplished through the use of pneumatic jackleg drilling. These drills accounted for approximately 25% of injuries in 2017. Stillwater received its first two drill-handling units and East Boulder received seven more units to continue reducing pneumatic jackleg drilling at the face. A jackleg drill weighs approximately 57kg, causing physical strain and exposure to injury. The new drill handling units are innovative, zero-gravity platforms on which jackleg drills can be mounted, allowing the operator to perform drilling work more safely, with far less strain and reduced exposure to falling material.
All employees receive regular safety training with new employees undergoing initial training and other employees receiving refresher training. The Blitz project expansion, which involves both increased staffing and infrastructure development on mine as well as downstream to the Metallurgical Complex has potential safety implications including the additional safety training required and the performance of new employees while construction activities are underway and non-routine tasks are more common
SAFETY TARGETS
For the SA region, targets for lagging indicators (injury frequency rates) for 2018 will be based on “cluster benchmarks” being set for similar operations. We will endeavour to maintain the significant improvements made in safety performance during 2017, while targeting an overall improvement of between 10% and 15% for all indicators.
In the US region, the safety goal remains everyone goes home safe – every day. On our continued path to zero harm, the 2018 goal is to reduce reportable injuries by 10%.
GOVERNANCE
Strict internal controls, procedures and systems are in place to ensure safe operations and that everyone goes home safely at the end of their working day.
In the SA region, the first line of responsibility is operational.
The mine overseer is responsible for SA safety tracking and monitoring performance. Reports are presented to management, which in turn report to executive management and ultimately to the Social and Ethics committee and to the Board. Internal audit and the new multi-disciplinary Pivot system monitor various parameters.
As required by the South African Mine Health and Safety Act all employees are represented in formal joint management-worker health and safety committees to ensure that our occupational health and safety programmes are agreed and effective.
In addition to internal monitoring, Sibanye-Stillwater’s safety performance is also monitored by several external agencies such as DMR safety inspectors, who conduct unscheduled audits.
In the US region, the joint health and safety committees meet monthly at each operation and at the metallurgical complex to address safety concerns. Both salaried and bargain unit employees co-operate on daily safety audits (risk assessments of production activities). There are two
| |
Sibanye-Stillwater | Integrated Annual Report 2017 | 63 |
such audit teams at Stillwater while, at East Boulder, peer-to-peer workplace assessments have been conducted to date with a safety audit team to be established during 2018.
Operationally, the vice president/general manager at each site assumes the first line of responsibility, and is supported by the safety department. The operations and safety departments submit regular reports and communicate directly with executive management so that they are kept fully informed.
The Federal Mine Safety and Health Act of 1977 of the United States established the Mine Safety and Health Administration (MSHA) which regulates operations at Stillwater and East Boulder through Title 30 of the Code of Federal Regulations. This regulation includes quarterly external inspections of all facilities by the MSHA.
The Occupational Safety and Health Act of 1970 established the Occupational Safety and Health Administration which regulates the metallurgical complex through Title 29 of the Code of Federal Regulations. Other United States’ governmental divisions such as the Bureau of Alcohol, Tobacco, Firearms and Explosives, the Nuclear Regulatory Commission, and the Department of Homeland Security also regulate operations in the interests of public security.
FUTURE FOCUS
The focus in 2018 the SA region will be on the continued roll-out of the behaviour-based training programme as well as finalising implementation of the integrated safety management system. The theme for 2018, “Let’s make this year our safest year yet”, will be supported by the roll-out of our safety culture transformation programme.
The roll out plan for the gold operations has been finalised, targeting 15 Shafts across the Kloof, Driefontein and Beatrix operations over a period of approximately 18 months.
Overall, the focus will remain on improving safety performance by 10% annually and fostering a culture of zero harm to employees.
In the SA region, safety regulations for trackless mechanised mining machinery aimed at preventing collisions are being introduced. The first milestone related to proximity detection was met in June 2017 with further impending regulatory requirements scheduled for June 2018 and December 2019. A group wide collision management risk assessment has been conducted which informs the related operational strategy for future implementation.
In the US region, the focus in 2018 will include the continued implementation of the drill handling units that began in 2016. These units allow the US region to improve workplace safety by moving away from conventional pneumatic jackleg drilling.
Given the high incidence of hand injuries in the United States region, the US PGM operations are implementing a compulsory impact and cut resistant glove policy in the workplace, with exceptions noted. Other operations will be observing and noting the results. Stillwater and East Boulder will both continue implementation of the Newtrax system that will aid equipment and employee location, prevent collisions and facilitate emergency evacuations.
At group level, there will be further cross pollination of information, procedures and systems between the US and SA regions, particularly at the mechanised operations in each region. This sharing of information will benefit both regions as operations learn from each other. A group-wide collision management risk assessment is to be conducted which will inform the related operational strategies to be implemented by the end of June 2018.
HEALTH
APPROACH
As with safety, our health model is based on Sibanye-Stillwater’s health and safety policies and the proactive, effective management of employee health and wellbeing. The aim is to provide accessible primary healthcare so as to prevent, detect early and manage diseases, and ultimately prevent progression to disability. The early identification of health risks together with timely interventions and stringent application of the mandatory code of practice on the minimum standards of fitness to perform work at a mine are critical in ensuring that employees are fit, competent and healthy to perform their work.
Sibanye-Stillwater’s healthcare model enables employees to optimise their health throughout their lives by helping them to make informed healthcare decisions. Healthy lifestyles are encouraged and this is supported by community infrastructure projects that provide access to affordable, quality healthcare. Strong interdependent relationships with local stakeholders, including the Department of Health, facilitate the integration of regional healthcare systems to ensure the effective use of resources.
A range of healthcare products, including medical aid schemes and statutory insurance benefits for occupational injuries and diseases, are available. Employees are given a choice in selecting their medical aid cover and can choose either the company-funded product or one of several designated medical schemes, including Sibanye-Stillwater’s own in-house medical scheme. Medical schemes and options are chosen carefully in terms of strict criteria so that employees receive benefits at an affordable cost.
PERFORMANCE 2017
ADDRESSING HEALTHCARE IN THE SA REGION
While the focus in the initial three-year roll-out of our proactive healthcare model, our Road map to health, was on optimising resources, improving efficiencies and providing excellent clinical care, this was expanded in 2017 to include excellence in disease prevention and wellness.
Our Road map to health began with an emphasis on clinic-based preventative healthcare rather than curative hospital-based care. These clinics, which are situated on-site at the shafts and at the single-room accommodation complexes, close to the workplace, facilitate easy and
| |
Sibanye-Stillwater | Integrated Annual Report 2017 | 64 |
immediate access to healthcare. As a result, the need for hospital beds on site for those suffering from acute and chronic illnesses has fallen to zero compared with 870 since 2013. In cases where employees require hospitalisation an appropriate contracted facility provides the services. There has also been a corresponding decline in those needing home-based care – from 109 people in 2014 to 22 in 2017. Our home-based tuberculosis (TB) care programme caters for post-employment care of occupational TB and includes contact screening, clinical management as well as an uninterrupted supply of medication.
The number of recently retrenched employees requiring post employment TB care has reduced from 34 in 2014 to 21 in 2017.
In addition, our transformed healthcare system has led to a decline in deaths, medical incapacitation rates and hospitalisation. Screening for TB and HIV testing increased and clinical metrics for both programmes improved (the TB rate continues to decline and HAART adherence has increased to 95%).
In 2017, a rate of 15.7% of days lost due to absenteeism was recorded at the gold operations and services, a slight increase on the 15.1% and 15.4% recorded in 2016 and 2015, respectively. The increase relates to higher absentee numbers at the Cooke operations during the year while these operations were still operational facing closure. At the SA PGM operations, initiatives similar to those at the SA gold operations are being implemented to manage absenteeism.
The total absenteeism rate for the SA PGM operations has reduced to 15% in 2017 from 20% in 2016 and the sick leave to absenteeism rate has also declined from 6.62% to 4.69% in 2017.
Our healthcare model has earned national and international recognition from the global Chief Medical Officers (CMO) Network and the Department of Health with the publication of case studies on developing a national case management framework based on the Sibanye-Stillwater model.
FOCUS ON WELLNESS
Our Road map to health has been expanded to include wellness so as to prevent disease and to promote wellbeing for life. Our wellness programme takes into account both physical, social and mental health. Early in the year, Sibanye-Stillwater successfully participated in a global employee wellness initiative aimed at encouraging participants to increase their levels of physical activity and fitness. In all, around 1,900 people from seven companies in nine countries participated. Of these 452 were from Sibanye-Stillwater. The four-week challenge, run under the auspices of the CMO Network, promoted a better understanding of the health concerns of working people and how to address them. Results indicated that at the end of the challenge, there had been a statistically significant improvement in participants’ physical health and mental wellbeing. The challenge highlighted the positive role of cardio-respiratory fitness in particular in preventing disease.
An initiative, My wellness (an application developed by Technogym), focused on improving levels of cardio-respiratory fitness, will be rolled out at all South African operations early in 2018. Sibanye-Stillwater’s information and communication technology function is assisting with the customisation of software and programming necessary to monitor people’s activity and fitness levels for use on mobile phones. The aim of this initiative is to make taking care of one’s health a way of life. It incorporates safety aspects and extends beyond the workplace, to the home and to the world at large. In so doing, employees are encouraged to take greater responsibility for their health and quality of life.
The application will be available worldwide, including the US region. We will be able to use this platform to run corporate challenges globally and track employee health indefinitely.
INTEGRATION OF THE SA PGM OPERATIONS INTO SIBANYE-STILLWATER’S HEALTH MODEL
Good progress was made with the integration of the SA PGM operations into the group healthcare systems. The compulsory health offering includes voluntary counselling and testing for HIV/Aids. There are four critical areas in this offering. They are: emergency medical services, occupational health, primary healthcare and wellness, and case management.
The healthcare system inherited at these operations was predominantly medical aid-based. During the open period for medical schemes, when members review their options, Sibanye-Stillwater will take the opportunity to run initiatives informing employees of the benefits of the various schemes available to enable employees to make informed choices for healthcare funding.
An unfortunate consequence of membership of medical schemes is, owing to confidentiality, the lack of data on HIV/Aids and occupational diseases. Management is investigating amending contracts with these schemes to enable access to this unlinked anonymous data which is important in planning and budgeting.
Partnerships with the medical schemes in the running and financing of clinics in the Rustenburg area in the vicinity of the SA PGM operations have continued. Strategically in this area, we aim to address healthcare equity by improving access to healthcare for employees’ families, many of whom remain vulnerable.
In addition, to promote health, nutritional supplements (Future life and a traditional beverage -mageu) are being provided to employees at the SA PGM operations as part of the mid-shift feeding programme. In addition to the provision of safe drinking water the SA PGM operations have included a food at work programme whereby employees can purchase a nutritious meal on mine, which is part of the Group’s fundamental principle of ensuring a healthy, fit, competent and safe productive workforce.
HEALTH MANAGEMENT
Healthcare management continued to focus on disease and case management, including lifestyle diseases (hypertension, diabetes and asthma) as well as infectious diseases such as HIV/Aids and TB, and the management of occupational diseases in particular silicosis and noise-induced hearing loss.
| |
Sibanye-Stillwater | Integrated Annual Report 2017 | 65 |
HIV/Aids and TB
Retention rates for highly-active antiretroviral treatment (HAART) are currently 95% across the SA region, in line with our aim to ensure employees remain healthy and productive. Results at Beatrix, which previously had the worst retention rates, were particularly pleasing. Here the HAART retention rate increased from 72% in 2016 to more than 98% in 2017.
At the SA PGM operations, just over 1% of those employees tested for HIV/Aids tested positive, which is well below the national prevalence rate of 7.1% (Stats SA 2012/2013, population aged 15-24). We suspect that due to predominant external provision of medical scheme funded healthcare, the data may not reflect the true picture of below national rates for HIV. The rate for the year at the gold operations was 10.2%. In addition, one would speculate that this trend is expected in that employees who have already been diagnosed HIV positive and are enrolled on formalised disease management programmes do not retest.
Simultaneously, the rates of TB have continued to decline, again especially at Beatrix where much focus has been on ensuring compliance to both TB and HIV protocols. This has been accomplished by strict adherence to follow up consultations and active laboratory monitoring of patients by partnering with a research laboratory and integrating electronic systems.
In addition, our transformed healthcare system has led to a decline in deaths, medical incapacitation rates and hospitalisation. Screening for TB and HIV testing increased and clinical metrics for both programmes improved – the TB rates continue to decline, with a reduction of 25% in cases observed at the Gold operations and a reduction of 12 % for the SA region as a whole, while the HAART adherence rate at one year has increased to 95%.
Silicosis
Sibanye-Stillwater is participating in industry efforts to develop and maintain a database of former employees and is tracing people who have left the company’s employ. These efforts relate to work being done by the SA gold industry working group on occupational lung diseases (OLD), such as silicosis, which is allied to the Department of Health’s Project Ku-Riha. This project is aimed at ensuring that claims for compensation by mineworkers with OLD are paid speedily and efficiently. Sibanye-Stillwater is one of seven South African mining companies participating in the gold industry working group.
To date, 1,986 Sibanye-Stillwater claimants received R33.9 million in payouts, of the total R250 million paid by the Compensation Commissioner for Occupational Diseases industry wide in 2017. In 2018, we will embark on a joint initiative with AngloGold Ashanti and Harmony to contact former employees and their dependents in the West Wits region.
In addition, as part of the implementation of section 189 of the Labour Relations Act retrenchment process, a specific form, known as the V12 Form has to be completed in which a person’s contact details are provided for future benefit medical examination as mandated by Occupational Diseases in Mines and Works Act (ODMWA). In addition, those people receiving treatment who are retrenched receive three-months’ treatment on their departure and their medical history is transferred to a clinic of their choice, within the Southern African Development Community (SADC). This applies to clinics beyond South Africa’s borders. Policies and procedures are in place in case of retrenchment to ensure that the needs of those who are on HIV/ Aids and TB treatment programmes are taken into account. In fact, Sibanye-Stillwater ensures that retrenched employees are formally registered on a post-employment programme which ensures continuity of care, drug supply, laboratory screening and ongoing medical support until treatment has been completed.
South Africa – healthcare funding (R million)
| 2017 | 2016 | 2015 | 2014 |
Regional total | SA region | Group | SA region | Sa region | SA region |
| PGM | Gold | PGM | Gold | Gold | Gold |
Medical schemes | 714 | 404 | 310 | 679 | 400 | 278 | 296 | 282 |
Company funded | 324 | 21 | 303 | 336 | 31 | 305 | 323 | 357 |
Compensation for occupational injuries and diseases* (Rand Mutual Assurance | | | | | | | | |
Company) | 191 | | | 178 | 52 | 125 | 115 | 106 |
Total* | 1,229 | 425 | 613 | 1,193 | 483 | 709 | 733 | 745 |
* Healthcare funding costs exclude Occupational Diseases and Mine Act Dust Levies for both Gold and PGM operations
South Africa – how employee healthcare is funded
No. of employees | 2017 | 2016 | 2015 |
Regional total | SA total | Groupl | SA region | SA region |
| PGM | Gold | PGM | Gold | Gold |
Principal medical scheme members | 30,854 | 22,465 | 8,389 | 28,555 | 20,624 | 7,931 | 8,416 |
Company funded employees | 30,696 | 21 | 30,675 | 32,677 | | 32,677 | 31,419 |
Total employees | 61,550 | | | 61,232 | | 39,835 | |
% Employees on medical schemes | 50% | | | 47% | | 21% | |
| |
Sibanye-Stillwater | Integrated Annual Report 2017 | 66 |
South Africa – medical conditions under management
| | | | | | | |
| 2017 | 2016 | 2015 |
| Regionaltotal | SA region | Group | SA region | Sa region |
| | PGM | Gold | | PGM | Gold | Gold |
Chronic medical conditions (schemes) | 13,532 | 8,546 | 4,986 | 13,242 | 8,451 | 4,791 | 4,700 |
Chronic medical conditions (company) | 8,978 | – | 8,978 | 9,790 | – | 9,790 | 8,814 |
Total | 22,510 | 8,546 | 13,964 | 23,032 | 8,451 | 14,581 | 13,514 |
South Africa – HIV/Aids and voluntary counselling and testing (VCT) and HAART
| | | | | | | | |
| 2017 | 2016 | 2015 | | |
| Regional total | SA region | Group | SA region | SA region | SA region |
| | PGM | Gold | Total | PGM | Gold | Gold | Gold |
VCT offered | 51,116 | 25,008 | 26,114 | 54,541 | 27,226 | 27,225 | 23,538 | – |
VCT conducted | 20,326 | 9,932 | 10,394 | 28,171 | 16,728 | 11,989 | 8,505 | 5,590 |
HIV-positive | 1,168 | 113 | 1,055 | 2,284 | 2,248 | 1,634 | 1,929 | 1,169 |
Proportion of workforce tested | 29% | 40% | 23% | 39% | 62% | 25% | 18% | 13% |
New recipients of HAART 1 | 843 | Unknown | 843 | 928 | Unknown | 928 | 875 | 548 |
Cat 3-8 employees on HAART | 5,688 | 0 | 5,688 | 5,561 | Unknown | 5,561 | 5,023 | 4,604 |
HAART patients who are employees 4 | 9,761 | 3,133 | 6,628 | 9,925 | 3,545 | 6,380 | 5,750 | 5,283 |
Employees who have left HAART 2programme | 46 | 0 | 46 | 86 | Unknown | 86 | 127 | 57 |
HIV prevalence 3 | 6% | 1% | 10% | 8% | 4% | 13% | 22% | 21% |
1 Entry-level mining employees (Category 3-8) employees
2 Employees who left the HAART programme within 12 months of starting antiretroviral therapy. These include those retrenched employees with ill- health, and any other labour-related terminations.
3 The prevalence rate reported is based on the number of employees testing positive as a percentage of the total number of employees tested in a given period and not as a percentage of the total workforce
4 HAART patience alive and on treatment
South Africa – TB: number of new and retreatment cases
| | 2017 | 2016 | 2015 | 2014 |
SA region | SA region | SA region | SA region | SA region |
Total | PGM | Gold | Total | PGM* | Gold | Gold | Gold |
TB | 623 | 148 | 475 | 707 | 73 | 634 | 744 | 832 |
Cardio-respiratory TB | 570 | 148 | 422 | 618 | 73 | 545 | 679 | 715 |
New cases of drug resistant TB | 28 | 0 | 28 | 24 | Unknown | 24 | 29 | |
New cases of multi drug resistant TB | 17 | 0 | 17 | 16 | Unknown | 16 | 14 | 34 |
* Health data for the Platinum Division (Kroondal and the Rustenburg operations) covers the entire 12 months of 2016. Tuberculosis data collection for the Rustenburg operations has been improved with inputs from the medical administrators. Sibanye-Stillwater is currently in discussions with the Medical Bureau of Occupational Diseases regarding outstanding payments for dust levies due prior to the acquisition of the Rustenburg operations
| |
Sibanye-Stillwater | Integrated Annual Report 2017 | 67 |
South Africa – occupational health management
| | 2017 | 2016 | 2015 | 2014 |
SA region | | SA region | SA region | SA region |
Total | PGM | Gold | Total | PGM* | Gold | Gold | Gold |
Medical surveillance and certificate of fitness examinations – total | 138,173 | 52,852 | 85,321 | 140,359 | 52,408 | 87,946 | 84,022 | 72,082 |
Employees | 87,084 | 21,673 | 65,411 | 108,135 | 39,145 | 68,990 | 69,294 | 63,338 |
Contractors | 51,089 | 31,179 | 19,910 | 32,219 | 13,263 | 18,956 | 14,738 | 8,744 |
Days lost due to health related absenteeism | 826,475 | 321,104 | 505,371 | 817,075 | 340,408 | 476,667 | 478,568 | 414,424 |
South Africa – occupational diseases – number of cases reported
| | 2017 SA region | | 2016 | | 2015 | 2014 |
| SA regions | SA region | SA region | SA region |
| PGM | Gold | Total | PGM | Gold | Gold | Gold |
Silicosis 1 | 261 | 68 | 193 | 240 | 89 | 151 | 186 | 264 |
Chronic obstructive airways disease 2 | 50 | 13 | 37 | 46 | 16 | 30 | 57 | 45 |
Noise-induced hearing loss 3 | 193 | 100 | 93 | 188 | 62 | 126 | 105 | 138 |
Employees and contractors at risk | 61,873 | 24,931 | 36,942 | 67,466 | 26,884 | 40,582 | 37,850 | 36,361 |
1 Number of cases reported includes both new and resubmission cases. Exposure to free silica (SiO), also known as crystalline quartz, found across a broad range of industries, including mining, cement manufacturing and quarrying, reaches the small airways of the lungs and forms tiny nodules (pulmonary fibroses), resulting in silicosis
2 Chronic obstructive airways disease (COAD) is characterised by chronically poor airflow, resulting in shortness of breath, coughing and sputum production. Long-term exposure to smoking, and particulates associated with air pollution as well as genetic predisposition, cause an inflammatory response in the lungs, resulting in a narrowing of the small airways and breakdown of lung tissue, known as emphysema or chronic bronchitis
3 Number of cases reported. Diagnosis of noise-induced hearing loss (NIHL) is made on assessment of the percentage hearing loss from baseline audiograms with NIHL defined as a shift in excess of 10% that has manifest over a prolonged period after repeated exposure to noise levels in excess of 85dBA
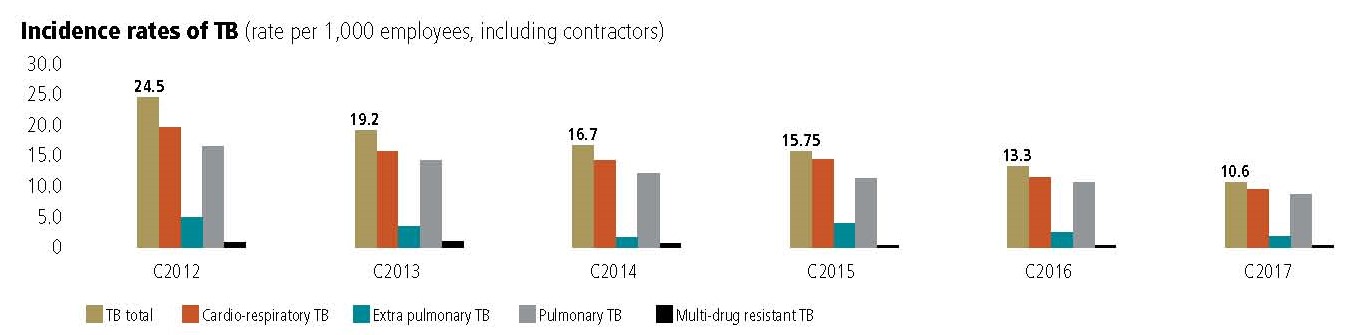
Diesel particulate matter at the SA PGM operations
The International Agency for Research on Cancer in June 2012 declared diesel exhaust to be a Group 1 Human carcinogen.
Currently in South Africa there are no regulatory limits to control exposure to diesel particulate matter (DPM), the Mine Health and Safety Act (MHSA) does however oblige mining companies to conduct risk assessments and institute mitigation measures for any health and safety risk. All operations (gold and PGM) currently have DPM sampling programmes in place to assess levels of personal exposure, this is compared to a benchmark of 0.2mg/m3 total carbon as recommended by the Chamber of Mines (this is in preparation for future alignment with the limit in the USA of 0.16 mg/m3 (TC)). We have adopted the NIOSH 5040 methods for DPM analysis. At the mechanised sections at our PGM operations, lower sulphur diesel is being used (50ppm), and ventilation for dilution and vehicle maintenance are the primary controls, while diesel particulate filtration is also being considered. At the SA gold operations, much older diesel engines are in use and dilution ventilation with diesel engine maintenance are the primary controls.
Impact of social factors on health
A pilot study has been conducted at Beatrix, a high-burden health region, to help identify the social determinants of health (SDH). These include variables such as the circumstances in which people are born, grow up, live, work, the systems in place to deal with illness and a wider set of forces and systems shaping the conditions of daily life. These forces and systems include economic policies, development agendas, social norms, social policies and political systems (World Health Organisation’s (WHO’s) definition of the SDH). For the study, 93 people were interviewed and the results are currently being validated by the universities of Pretoria and the Witwatersrand. A particular aspect of this study will be to understand employees’ perceptions of their own health and health practices, reasons for stress and coping mechanisms as well as participation levels in wellbeing activities.
| |
Sibanye-Stillwater | Integrated Annual Report 2017 | 68 |
Sibanye-Stillwater is also investigating stress factors in the work environment that may affect health and treatment retention rates. This will help us create a deeper understanding of employees’ circumstances and behaviours which will better help us to develop policies which may effectively address certain SDH
United Nations Sustainable Development Goals
Work is currently being undertaken to align Sibanye-Stillwater’s health roadmap with the United Nations Sustainable Development Goals 2015-2030, and in particular goal 3, good health and well-being (SDGs). Goal 3 relates to universal access to good healthcare and equity in healthcare. Sibanye-Stillwater is well placed to meet the targets related to these goals which are:
• Compulsory employee membership of medical aid schemes which includes cover for spouses (mothers) and child care benefits. This will help to ensure access to universal health care, to reduce both mother and child mortality rates and to provide universal access to sexual and reproductive healthcare, among other health-related services. Through our association with medical aid schemes, we support research into and the development of vaccines for those diseases most affecting our employees and communities. While all employees have the right to join a medical aid scheme, only 50% of the workforce are covered by such schemes
• Our alignment with national HIV/Aids and TB milestones, as well as the work we are doing to meet the United Nations 90- 90-90 Aids and TB targets by 2020, will contribute to efforts to end these diseases
• The My wellness programme will help indirectly to reduce the incidence of premature death as a result of non-communicable diseases, to combat substance and alcohol abuse, and also to encourage improved, safer behaviour on the roads and so reduce death and injuries as a result of road traffic accidents. This ties in too with our safety value – I am healthy and fit to do my work. Allied to this initiative is our smoking policy aimed at making the workplace safer and healthier
• Our health and safety practices are aligned with the Mine Health and Safety Council’s (MHSC) milestones to substantially reduce deaths and illness owing to occupational exposures to substances hazardous to health ,and safety risks
• Our investment in developing the expertise and knowledge of health and wellness personnel
• The early detection, reduction and management of health risks are integral to our health model
The targets set out in these goals are to be met by 2024. We have developed responses to these MHSC milestones and are implementing them in the South African operations. These interventions are continuously improved upon as newer methods and technologies become available.
Health has adopted the SDGs which replace the Millennium development goal of the World Health Organisation (WHO).
HEALTHCARE IN THE US REGION
There are no major work related healthcare concerns among employees in the US region.
Noise in the US region is addressed through the Hearing Conservation Program. Employees whose workplace exposes them to certain levels of noise are enrolled in this program. They are given training about the effects of noise on hearing loss, physiological issues, and PPE and its use and limitations.
Employees enrolled in the Hearing Conservation program are given yearly audiograms to monitor any noise induced hearing loss.
DIESEL PARTICULATE MATTER
Emissions from the extensive use of diesel-powered machinery in an underground mining environment, if not properly managed and mitigated, can lead to health hazards for underground mining. We employ various measures to reduce those exposures and ensure we comply fully with the strict limits on diesel particulate matter (DPM) exposure for underground miners set by the US Department of Labor’s Mine Safety and Health Administration. Enhancements to ventilation systems and modification of certain mining practices that tend to create concentrations of DPM have played an important role to maintain DPM levels within regulatory limits. So, too, has the choice of fuels for the equipment used underground.
All underground engines have been fitted with diesel particulate filters which studies have shown to be highly effective in reducing particulate matter, carbon monoxide and unburned hydrocarbon emissions from engines fueled by ultra-low sulfur diesel.
All heavy underground equipment is fitted with 100% efficient diesel particulate filters, light equipment below a certain horsepower (such as man-trip trucks) are fitted with 50-55% efficient filters.
INTERNATIONAL DEVELOPMENTS
Within the business community, Sibanye-Stillwater has raised its health profile and publically committed to improving the health of employees internationally by influencing stakeholders through the CMO Network. To this end, Sibanye-Stillwater has committed to addressing four broad issues relating to the workplace health which include antimicrobial resistance, obesity, mobility and mental health. A write-up of a case study on mental health involving Sibanye-Stillwater has been distributed by the CMO Network globally. The case study unpacks our multidisciplinary approach to mental health issues as well as recognising the impact of social determinants on employee wellbeing
During 2017, much progress was made internationally affirming Sibanye-Stillwater’s commitment to global health issues. We participated in work streams leading to the WHO’s global ministerial conference on ending TB in the sustainable development era which was signed off by 122 health ministers in Moscow at the end of 2017.The Moscow declaration marks a turning point in the development of a global strategy to address the TB epidemic and lays the foundation for the development of a global strategy to address the TB epidemic and for an accelerated political response in advance of the United Nations High Level Meeting (UN HLM) on TB in 2018.
| |
Sibanye-Stillwater | Integrated Annual Report 2017 | 69 |
HEALTH GOVERNANCE
SA REGION
In addition to internal monitoring, Sibanye-Stillwater’s health activities are monitored by several external agencies. These include:
• Registrar for Medical Schemes
• Department of Health audits of our primary healthcare, occupational health facilities and pharmacies (all of which are licensed)
• DMR (conducts ad hoc and annual audits of mine health, safety and surveillance systems
• Audits and reviews relating to the Compensation for Occupational Injuries and Diseases Act and the Occupational Diseases in Mines and Works Act, Mine Health and Safety Act and health related acts
• Annual KPMG audits of health statistics and reporting of specific indicators
• Chamber of Mines health policy commitments and reporting
US REGION
• Mine Safety and Health Administration
• Occupations Safety and Health Administration
• KPMG audits of health statistics and reporting of specific indicators
• Montana Department of Labor and Industry – Employment Relations Division
• US Department of Labor – Employee Benefits Security Administration
• US Department of Health and Human Services
• Blue Cross Blue Shield of Montana (a healthcare services company)
• Brokers and actuaries at HUB International – health and welfare plan consultants
• Benefit Plan Committee
FUTURE FOCUS IN 2018
The focus in the SA region will be on:
• increasing our effectiveness in preventing disease and disability, and on promoting fitness and health
• continuing alignment with the SDGs
• improving processes and quality standards towards accreditation with OSHAS 18001 and ISO 45001
• continued support of the human resources and safety functions
• enhancing regional synergies with the Department of Health
In the US region an assessment of alignment of the region with the SDGs and goal 3 in particular will established and expanded if required
| |
Sibanye-Stillwater | Integrated Annual Report 2017 | 70 |
APPROACH
Stakeholder engagement is key to the delivery of our community development programmes. It enables us to understand the needs and the priorities of our communities.
Our stakeholder engagement framework is aligned with King IV and those United Nations’ SDG relating to stakeholder engagement. In engaging with stakeholders and communities in particular, we also bear in mind the ICMM’s sustainability framework, which is intended to enhance mining’s contribution to society.
GOVERNANCE
Governed by the community development policy, our socio- economic development programmes and corporate social responsibility initiatives are overseen by the Community Development Steering Committee, which reports to the executive-led Sustaining our Social Licence to Operate Committee. This committee provides policy direction, oversight on regulatory compliance and monitors the impact of the company`s socio-economic development programmes. It also makes decisions on regulatory compliance concerning projects with an investment threshold exceeding R100,000. Both of these committees report to the Social and Ethics Committee and to the Safety and Health Committee.
Oversight of stakeholder engagement is assigned to the Social Licence to Operate Committee, as well as to the SLP forums at operations (which include unions and management).
Community engagement is an evolving, dynamic process aimed at establishing partnerships for sharing value created. In our SA region, there has been a notable increase in community activism, aggravated where government has not delivered on its infrastructure and service delivery commitments. As in the SA region, we endeavour to be a trusted partner to host communities in the US region.
The US region has a long history of environmental and social collaboration with local communities and interest groups that is rooted in the Good Neighbours Agreement (GNA), an innovative framework for protecting the natural environment while encouraging responsible economic development. The GNA legally binds Sibanye-Stillwater to certain commitments and holds it to higher standards than federal and state regulations require. These commitments include regular, transparent, and productive interaction with all affected stakeholders, primarily the three local stakeholder organisations—Northern Plains Resource Council, Stillwater Protective Association, and Cottonwood Resource Council.
In addition to the GNA, Montana’s Hard Rock Mining Impact Act also binds the US region. Under this law, developers of large-scale hard-rock mines in Montana are required to prepare an impact plan that identifies the local government services and facilities necessary because of the mineral development. In the impact plan, the developer must identify and commit to pay all increased local government capital and net operating costs that will result from the development. The developer may also provide non-financial assistance to the affected local government units. The US region complied with these requirements at the time of initial developments and continues to comply with related ongoing state and local reporting requirements.
SA REGION
In 2017, engagement with communities remained challenging, particularly in the Rustenburg area, largely due to historical expectations from these communities, lack of initial clarity regarding Sibanye-Stillwater’s processes and programmes and inadequate dispute resolution mechanisms.
Community protests, a result of unfulfilled promises and unrealistic expectations, were heightened by the broader, external political environment then prevailing in South Africa. The lack of trust between Sibanye-Stillwater and communities was further compounded by the Chamber of Mines’ engagement, on behalf of the industry, on the redrafted Mining Charter.
Sibanye-Stillwater has taken steps to improve the effectiveness of its community engagement and to take into account the growing overlap between communities and employees as frequently employees and their families reside in host communities. Previously, community issues and concerns were addressed as they arose. Improved, more regular, structured engagement has enabled improved understanding of communities’ concerns and expectations. This has enabled us to prioritise the actions required to address and resolve issues.
We aim to engage effectively with communities and a significant effort has been made to increase our understanding of community concerns, which we prioritise and manage regularly.
A review of our local economic development programmes conducted in early 2017 was aimed at, among other matters, determining whether Sibanye-Stillwater was actually improving lives by assessing the efficacy of our SLPs and related projects. The study highlighted communities’ requests for transparent, honest engagement, founded on the principles of free, prior and informed consent (FPIC). This entails communicating with communities so that they are sufficiently informed in good time, and given the opportunity to approve or reject potential projects. This is increasingly becoming best practice in the extractive sector globally and is now being used as the basis for our community engagement.
In the process we have identified four priorities in support of our social closure strategy (refer to Social impact management plans below), namely, opportunities for local procurement and enterprise development, skills development, education, community safety and health. During 2017, there were operational disruptions in the Free State and in Merafong, Gauteng, around procurement and employment issues. We continued to engage with local structures to ensure visibility of our programmes and processes so as to manage expectations. Furthermore, procurement information sessions were facilitated to enable Sibanye-Stillwater to share its enterprise and supplier development strategy with local businesses. The Community Engagement Forum was used to engage and update local business on various issues such as recruitment, bursaries and community learnerships and local economic development projects.
| |
Sibanye-Stillwater | Integrated Annual Report 2017 | 71 |
There were challenges with local communities relating to perceptions towards Sibanye-Stillwater’s approach to illegal mining and its decision to place the Cooke operations on care and maintenance. Community concerns related to the adverse socio-economic impacts of retrenchment at the Cooke operations and of illegal mining. There was resistance to the local provision of housing for protection service personnel employed to combat illegal mining as they had not been recruited locally, especially given the recent retrenchments. In order to address this we continued to engage with concerned stakeholders to provide clarity on the operating challenges that led to the decision to suspend mining operations at Cooke.
ILLEGAL MINING – ITS IMPACT ON COMMUNITIES
In addition to the negative impact on value that illegal mining has on our business, this also affects communities. Illegal mining has social, environmental and health impacts. It compromises the communities – from a health and safety perspective, environmentally and ethically. Illegal miners blasting out tunnels in residential areas, is hazardous and damages houses. There are allegedly human rights abuses, and increased violence and criminalisation. Both communities and employees are compromised, through collusion and coercion. See www.sibanyestillwater.com for additional information on illegal mining and its consequences.
SOCIAL AND LABOUR PLANS
Of the SA gold operations, currently, only Beatrix has an approved SLP for the third cycle, from 2017 to 2021. The SLPs for the other gold operations have been submitted and we await final approval. Certain SLP projects are a continuation and extension of projects from previous SLPs. We are also addressing the backlog of projects from the SLPs for 2012 to 2016.
The current SLP for the Rustenburg operation, which runs from 2016 to 2020, has been submitted and approval is pending. At Kroondal, certain projects committed to, are almost complete. These are an early childhood development centre and a community brick-making plant. Some backlogs in the Kroondal area have been identified and will run these projects concurrently with the Rustenburg SLP.
For the Rustenburg operation, SLP project implementation has begun. Two obstetric and maternity ambulances were delivered to the provincial Department of Health and scholar patrols equipment was provided to 10 schools in the Rustenburg area. Regarding infrastructure projects, scoping and ordering procedures are underway.
In spite of operational restructuring and the Cooke operations being placed on care and maintenance, we will continue to support host communities. As the Cooke and Kloof operations have the same host communities in the Rand West City Local Municipality, they will continue to benefit from Kloof’s SLP local economic development programme.
SIBANYE COMMUNITY DEVELOPMENT TRUST
A new community trust, aims to enhancing the impact of socio-economic projects on communities by augmenting and optimising our community development programmes. The trust will enable us to facilitate regional development programmes in collaboration with other stakeholders by optimizing our SLP projects and other value-adding development initiatives. It will promote the use of local suppliers to unlock, create and share value in the communities.
The trust is being set up by Sibanye-Stillwater, which will be the principal funder. Suppliers and other corporates will also contribute to funding. The trust, to be implemented in 2018, will have six trustees, all of whom will be employees of Sibanye-Stillwater.
CONTRIBUTING TO ALTERNATIVE ECONOMIC ACTIVITIES
Sibanye-Stillwater is committed to developing host communities and those in labour-sending areas. Our particular focus is to leverage land-holdings to create jobs, promote black economic empowerment and facilitate comprehensive local socio- economic development.
We have reviewed the impact and sustainability of the various projects implemented to date, and acknowledge the difficulties encountered, from which we have learnt. Among our successes is the “You reap what you sow” agricultural project, a co-operative that has functioned independently since February 2017, secured various markets and has repositioned itself in the market. The co-operative mentors and supports other agricultural co-operatives and offers practical experience. Market days are held where the farmers sell their produce. This project, which is nearing completion with funding for the first extended closeout plan having been paid in December 2017, has helped to establish beneficial relationships with the community and sustainable livelihoods.
Our Aredirisaneng agricultural co-operative was less successful. The land initially allocated to this project is infested with weeds, which will take around 18 months to eradicate. The project is being reassessed for turnaround and the cooperative will be incorporated into our outgrower model for phase 2.
Sibanye-Stillwater’s vision is to improve the welfare of local communities by aiding the establishment of an agricultural and associated agricultural input and processing cluster, as a sustainable alternative economic activity to mining.
The project is being viewed holistically and proposals are being sought that ensure both high value, financially profitable agriculture production, as well as increased food security and opportunities for youth. The portfolio of projects that will be considered include school gardens, household gardens, small and larger-scale farms and out-growers. The aim is to make agriculture a vital part of the community and to engender a “culture of the land” in the area.
Sibanye-Stillwater is acutely aware of the need to establish appropriate institutions to co-ordinate, support and sustain the process to develop and agri-industrial cluster. One such institution would have capacity to prepare land for agricultural development as well as to invest in the selected agricultural enterprises.
Sibanye-Stillwater is collaborating with a government task team convened under the auspices of the Mining Phakisa, made up of, inter alia, the Presidency (Department of Planning Monitoring and Evaluation), National Treasury, Department of Trade and Industry, Department of Agriculture Forestry and Fisheries, the Public Investment Corporation, relevant provincial departments and local authorities, and agricultural experts to advise
| |
Sibanye-Stillwater | Integrated Annual Report 2017 | 72 |
on and facilitate agricultural skills development and the establishment of this cluster. While Sibanye-Stillwater will facilitate this project and provide the land and water on a negotiated basis, the project will be stakeholder-driven. Sibanye-Stillwater has identified 15,000 hectares of land within the West Rand District Municipality which could be made available for this project. The Public Investment Corporation, together with the Land Bank, Industrial Development Corporation and the Development Bank of South Africa are collaborating around how a specialised funding structure can be established to support the project.
AGRICULTURAL ALLIANCE PROJECT
In 2013, Sibanye-Stillwater and Gold Fields entered into a collaborative partnership to implement community-based projects within Rand West City Municipality. The initial phase, completed in 2015, was limited in geographical area. The intention had been to expand into the rest of the region in subsequent phases of implementation with a clear focus on job creation. The inaugural pilot project, an agricultural project, would have seen community members benefit from capacity building and being empowered.
This project was an opportunity for a public-private partnership to unlock value and co-operate at regulatory level. Given that the first phase of the project involved establishing a fully representative community engagement platform, it enabled communication that promoted understanding of community needs, expectations and socio-economic dynamics. In addition, local co-operatives were set up to provide various services to the community.
Phase 2 of the alliance project was intended to sustain local co- operatives and agricultural activities in particular.
The success of this project depends on community co-operation and buy-in. New agricultural ventures have been proposed with government, through Mining Phakisa, included in project planning and implementation. The Department of Agriculture will provide advice and mentoring support. Approval of the new project is being awaited. Other stakeholders involved in this project are the Land Bank and Presidency office through Mining Phakisa and the PIC.
SOCIAL IMPACT MANAGEMENT PLANS
It is very important that social impact management plans be developed for all Sibanye-Stillwater operations. These plans should be concurrent with and integrated into the SLPs. Following the Section 189 process at the Cooke operations, work began on development of a social impact management plan. These plans, to be used as guidelines for each operation, involve managing and mitigating the effects of mine closures on communities. They will take into account likely social impacts of closure such as unemployment, limited job mobility owing to a lack of skills diversity among retrenched employees, a decline in economic activity, despair, alcohol and substance abuse, depression and suicide, among others.
To mitigate these impacts, these plans will focus on sustainable socio-economic and local economic development. They will promote employment in alternative industries, alternative skills training, psychological counselling and continued healthcare for those on chronic medication. In developing these plans, we will engage with other stakeholders concerned such as the departments of Labour and Mineral Resources, municipalities and other mining houses.
The Cooke social impact management plan provides details of training and procurement initiatives undertaken to assist retrenched employees to find alternative employment. Similar plans are to be drawn up for our other operations, the first of which will be that for Kroondal.
Socio-economic development expenditure – South Africa (R million)
| | | | roup | | | | | |
| 2017 | 2016 | | 2015 | 2014 | 2013 |
| | |
| Total SA region | Gold | PGM | Group | Gold | PGM | Gold | Gold | Gold |
Local economic development | 24 | 13 | 11 | 59 | 47 | 12 | 27 | 24 | 17 |
Training | 532 | 340 | 193 | 393 | 321 | 72 | 384 | 353 | 316 |
Infrastructure | 586 | 425 | 161 | 181 | 181 | 0 | 197 | 649 | 699 |
Health | 3 | 3 | 0 | 4 | 4 | 0 | 6 | 5 | 5 |
Enterprise development | 1 | 0.5 | 0.5 | 0 | 0 | 0 | 0 | 3 | 2 |
Education | 3 | 3 | 0 | 4 | 4 | 0 | 62 | 10 | 1 |
Sport, conservation and environment | 0 | 0 | 0 | 0.4 | 0.4 | 0 | 1 | 10 | 9 |
Donations | 10 | 8 | 2 | 15 | 12 | 3 | 14 | 1 | 1 |
Total | 1,159 | 792 | 367 | 656 | 569 | 87 | 691 | 1,055 | 1,050 |
US REGION
Community engagement in this region is conducted largely under the auspices of the Good Neighbour Agreement (GNA). This agreement is unique within the mining industry and provides an innovative framework for protecting the natural environment while encouraging responsible economic development. Parties to the GNA are the US operations and three local stakeholder organisations. This agreement provides a forum for communities to communicate on how they are affected by mining operations and for the mines to communicate on planned operational changes
| |
Sibanye-Stillwater | Integrated Annual Report 2017 | 73 |
and how these may or may not affect communities. This agreement relates to the operations’ impact on the environment and employee concerns as well as the impact on the local economy.
The US region sponsors community and employee dependant scholarship programmes. In May 2017 (Spring Semester), the Community Scholarship Programme funded 19 individual high school seniors at a cost of US$19,000 and for the Fall Semester 2017, 71 recipients were sponsored at a cost of US$35,500.
In addition, 16 employee dependent high school seniors were awarded a US$1,000 scholarship each in May 2017.
Major community concerns in the US region are sustainable employment, responsible economic development, which includes environmental protection, and traffic management. Initial community concerns following the acquisition by the then Sibanye of the US operations, centred mainly around what, if any, changes would be made. They were assured that it was “business as usual” and no significant changes to the operations or operational strategy/management were being proposed.
Community interaction includes participation in various community groups, fund-raising events, environmental organisations, annual community celebrations, local governmental meetings, and local donations. These community groups and events include Fishtail Family Fun Days, Boulder River Watershed Association, Billings Clinic Foundation, Stillwater Protective Association, Red Lodge Fun Run, Stillwater County Commissioners, Boys & Girls Club, Sweet Grass County Chamber of Commerce, and many others.
The main philanthropic/social activities and related expenditure was as follows:
| | |
Community projects | (31%) | US$60,050 |
Youth activities | (27%) | US$53,125 |
Education | (19%) | US$37,760 |
Emergency services | (15%) | US$28,750 |
Cultural | (8%) | US$15,100 |
Total | | US$194,785* |
| * | | For the period May – December 2017 |
The Stillwater and East boulder mines have similar community issues, although different communities are affected by their operations. These communities are Stillwater: Nye, Fishtail, Absarokee, Columbus; East Boulder: Big Timber, Livingston and Reedpoint. These operations make a significant contribution to their local communities. Sibanye-Stillwater provides in excess of 50% of the taxable incomes for Stillwater County, Sweet Grass County, and the Town of Columbus – total tax payments in 2017 were US$16.6 million. The employment base would be significantly impacted, as would local suppliers such as gas stations, grocery stores and department stores. In payroll alone, Sibanye-Stillwater infuses more than US$100 million annually into the South-Central Montana economy.
PROCUREMENT AND ENTERPRISE DEVELOPMENT – PERFORMANCE 2017
In 2017, a rigorous programme was implemented to consolidate the supply chains and procurement for all managed Sibanye-Stillwater operations, gold and PGM, in the SA region so as to optimise and rationalise procurement and to ensure that we achieve and benefit from economies of scale. This programme involved:
• consolidating and standardising contracts
• improving the effectiveness of transaction processes
• avoiding and reducing costs
Project 180, which involved converting all supply-chain contracts to the SAP system and a key aspect of this programme, was implemented in the South Africa region to enhance and align systems to support the supply chain and improve efficiencies.
In addition, a strategic commodity team and an engineering and processing team have been created to assist in optimising contracts so as to reduce costs. The overall aim is to improve efficiencies within the supply chain.
Procurement also has a role to play in promoting transformation through socio-economic development and enterprise development. Localised procurement is being closely monitored in order to address ongoing community concerns that they are not being granted procurement contracts.
In engaging with communities, Sibanye-Stillwater has come to understand the desperate need for enterprise development and procurement opportunities on the part of communities.
A team has been appointed specifically to address community legacy procurement issues, to assist and mentor suppliers and to facilitate understanding of the procurement process.
Enterprise development centres (EDC) are in the pipeline to be set up and remain a continued key focus area for 2018. In Theunisseun we have a room at the Masilonyana Municipality and we are using Virginia property office as a temporary EDC.
We are also in the process of finalising an EDC in the middle of Rustenburg. The next region of focus will be in the Witwatersrand to support the Driefontein, Kloof and Cooke mines.
| |
Sibanye-Stillwater | Integrated Annual Report 2017 | 74 |
OWNER MAINTENANCE OF EQUIPMENT AND MACHINES IN SA REGION
Sibanye-Stillwater owns a large number of Sandvik and Atlas Copco equipment and machinery. Currently a full- time employee team maintains the Sandvik fleet. The Atlas Copco fleet has not yet moved to owner maintenance and is being maintained still by Atlas Copco under contract. “Owner maintenance” refers to the maintenance of machinery by Sibanye-Stillwater rather than the original equipment manufacturer (OEM).
The following underground equipment is on the owner- maintenance programme:
| · | | Low-profile drill rigs and |
It is estimated that potential savings will amount to R400 million over a four-year period, following the move to owner- maintenance of the Sandvik fleet. This fleet was transferred to the owner maintenance programme on 1 August 2017 and by the end of December 2017, total savings of R87.7 million had been realised. This included savings of R61.8 million on capital expenditure and R25.8 million on operational expenditure.
The objective of this programme is to:
| · | | Extend/prolong the operating lives of machines and so, reduce capital replacement costs, the main driver of this programme |
| · | | Reduce/limit machinery maintenance costs |
| · | | Improve efficiencies and ensure sustained cost savings. |
This initiative was undertaken in partnership with the operations and supports efforts to ensure that safety, cost controls, grade and volume targets are met. This is achieved through proper maintenance, resulting in good availability of machines that are fit for purpose and safe to operate, thereby enabling delivery on production targets. This owner maintenance initiative brings the maintenance and production teams together to achieve a common goal.
PROCUREMENT 2017
Procurement on goods, services and capital totalled R22.2 billion in 2017 in the SA region and R2.45 billion (US$184.3 million) in the US region.
In the SA region, R10.6 billion (2016: R7.6 billion) of our discretionary procurement was with BEE entities in South Africa – R5.7 billion (2016: R4.9 billion) of which was spent by the gold operations and R4.9 billion (2016: R2.7 billion) by the SA PGM* operations. This was equivalent to 79% (2016: 77%) of total discretionary procurement spend in the region.
* Kroondal is in a joint venture with Anglo American Platinum and covers 50% of the costs, R1.272 billion for 2017.
In the US region, approximately R851 million (US$63.9 million) was spent on the procurement of goods and services within the state of Montana, equivalent to 34.65% of total procurement in the US region.
| | | |
| Capital goods target: 40%Cons | Consumables target: 40% | Service target: 40% |
Gold operations | | | |
Beatrix | 72% | 82% | 65% |
Cooke 4 | 69% | 54% | 83% |
Cooke 1, 2 and 3 | 72% | 58% | 66% |
Driefontein | 74% | 78% | 77% |
Kloof | 86% | 83% | 72% |
PGM operations | | | |
Kroondal | 87% | 91% | 86% |
Rustenburg | 75% | 71% | 79% |
Total SA region | 81% | 78% | 79% |
1 The Mining Charter’s procurement targets apply to procurement that “excludes non-discretionary procurement expenditure”, i.e. expenditure that cannot be influenced by a mining company, such as procurement from the public sector and state enterprises. The procurement targets thus apply to discretionary expenditure over which Sibanye-Stillwater has influence.
| |
Sibanye-Stillwater | Integrated Annual Report 2017 | 75 |
GOVERNANCE
Supply chain governance is critical, and especially so in relation to contracts with community members. Good governance methodology protects both Sibanye-Stillwater and the community. A tender committee meets monthly – weekly if necessary – depending on the value of a contract to be agreed. The DMR conducts annual audit reviews to monitor performance on BEE procurement targets.
Internally, procurement and the supply chain function reports to the Social Sustainable Licence to Operate Committee and is subject to internal and external audits of specific indicators and controls.
The supply chain function in the US region reports administratively to the Head of Finance, US region, and is subject to internal control as designed and documented by the US region in its critical process documentation for the purchasing and payables cycle.
FUTURE FOCUS
Roll out of the enterprise development policy, in the SA region:
Sibanye-Stillwater believes in the significant role of the SMME sector in our economy, and are committed to supporting sustainable development initiatives in partnership with government, business, civil society and the community concerned.
The purpose of this policy is to ensure that:
| · | | A robust, consistent and transparent approached is applied to enterprise and supplier development (ESD) |
| · | | Sibanye-Stillwater’s commercial risk associated with ESD is actively managed |
| · | | New and compliant suppliers are identified and developed |
| · | | Existing SMMEs are developed to enable them to become registered suppliers |
| · | | Existing suppliers who do not comply with Sibanye-Stillwater’s enterprise development policy and EDC requirements are assisted with compliance |
In all enterprise development transactions, meeting Sibanye-Stillwater’s requirements in terms of pricing, quality and risk of the goods, works or services concerned, is non- negotiable.
All transactions are subject to Sibanye-Stillwater’s Delegation of Authority Policy and must comply with all relevant legislation.
Roll out of Phakamani in the SA region:
Phakamani is an external organisation that was engaged on a trial basis in two areas for five months during 2017 to provide financial and other assistance to emerging SMMEs which are contracted to provide products or services to Sibanye-Stillwater. Phakamani provides and administers low-interest working capital and term loans to the SMMEs, as well as business and technical support, to increase the probability of success for these new SMMEs and ensure their sustainability.
The trial was a success, with 17 of our suppliers receiving financial assistance in 2017. Sibanye-Stillwater is to roll out the Phakamani programme across the entire SA region in 2018, making the service available to all community suppliers and SMMEs.
| |
Sibanye-Stillwater | Integrated Annual Report 2017 | 76 |
APPROACH TO ENVIRONMENTAL MANAGEMENT
At Sibanye-Stillwater we manage, limit and attempt to mitigate any environmental impacts caused by our mining activities.
We apply the duty of care principle as outlined in national environmental legislation, while striving to maintain the highest environmental standards. We comply with all relevant legislation governing the use of resources, most notably water, responsible waste management, conservation of biodiversity, and post- mining land use for socio economic closure, both in southern Africa and in the United States.
The Sibanye-Stillwater Environmental Policy was aligned with the Sibanye-Stillwater operating model during 2017. A new environmental vision, Environmental Vision 2020, was crafted and has been implemented for the SA region in 2017, taking into account the structural and organisational changes following the acquisition of the SA PGM assets and their integration within the company. Internal organisational restructuring included amalgamating the previously-separate environmental and water management departments into one, integrated environmental function for the SA region.
The new Environmental Vision 2020 covers all the Sibanye-Stillwater mining operations across different jurisdictions and supports superior value creation for all stakeholders. Components of the vision, where applicable, will be applied to the US region. This vision, and the related policy, aim to improve lives though responsible environmental management practices and include, inter alia, verifiable compliance, risk management and environmental and water footprint management in anticipation of post mining socio-economic closure.
APPROACH TO ENVIRONMENTAL MANAGEMENT IN THE UNITED STATES REGION
The US region has a long history of environmental and social collaboration with local communities and interest groups that is rooted in the Good Neighbours Agreement (GNA), which is an innovative framework for protecting the natural environment while encouraging responsible economic development. The GNA legally binds the Company to certain commitments and holds the Company to higher standards than federal and state regulations require. These commitments include regular, transparent, and productive interaction with all affected stakeholders, primarily the three local stakeholder organisations—Northern Plains Resource Council, Stillwater Protective Association, and Cottonwood Resource Council.
These organisations generally speak for local residents who live in the areas immediately adjacent to the mines. Representatives of the organisations meet regularly with the Company to discuss operations, future planning, and other issues, including direct impacts on local communities, such as traffic volumes. This framework provides a mechanism for the general public to voice concerns and to become informed on our operations. Under this framework, the US region has generally been able to achieve a greater level of certainty related to external risks and has generally avoided certain litigation that is more common among our mining peers in the region.
PERFORMANCE 2017
The Environmental focus during the year has been characterised by the development of action plans following the alignment of the respective SA gold and SA PGM teams around a common purpose and vision. Delivery of the strategic objectives will only be effective if the purpose and vision are translated into useable operational plans supported by enabling technologies. This has remained our focus, creating the platform for execution and delivery in 2018. During the year 25 key environmental procedures between our SA gold and SA PGM operations were revised and merged. This together with training is an important step to ensuring a common approach to the application of environmental standards across the Group.
Environmental awareness training is an integral aspect of communication with employees who are encouraged to abide by and deliver on our various water and environmental management procedures. Regular environmental communication sessions are held at the operations to emphasise that responsible environmental management is the duty of each Sibanye-Stillwater employee. The Sibanye-Stillwater leadership and line management commit to the implementation of the environmental management policies and procedures, through effective and visible felt leadership on environmental management issues. The environmental management sessions also highlight the environmental impact of mining activities as well as impressing on employees the importance of compliance with environmental legislation pertaining to various environmental aspects such as water, air and waste.
This integrated and aligned approach has also seen significant progress in the improvement of overall compliance as well as water conservation and demand management initiatives.
The environmental team has been proactive in reviewing and commenting on legislative policy and regulatory changes including financial provisions for closure and Carbon tax, through the Chamber of Mines. These regulatory changes have been identified as a risk to our business as discussed below. The current action plans, developed as part of the vision alignment, have been developed to mitigate these risks.
| |
Sibanye-Stillwater | Integrated Annual Report 2017 | 77 |
ENVIRONMENTAL RISKS
The most significant environmental risks have been integrated into Sibanye-Stillwater’s enterprise-wide risk management process. These top risks and associated mitigation action plans and strategies in the SA region are as follows:
| |
Risk | Mitigating action plans and strategies |
Environmental impact on water catchment areas | Context: Sibanye-Stillwater conducts mining operations in accordance with mining legislation including the National Water Act and our water use licence (WUL). As part of our daily operations Sibanye-Stillwater has permitted discharges into a number of catchments. As responsible corporate citizens we are duty bound to understand the impact of our mining on the various catchment areas: • Ongoing and comprehensive water monitoring programmes (our sampling and monitoring programme has 865 sampling points – Au-435; Pt-430) and we report regularly on the results, as required by the Department of Water and Sanitation (DWS) • A dedicated compliance team focuses solely on ensuring that we understand any compliance gaps, and put in place action plans to address any deviations from the acceptable limits prescribed in the WUL • Increased use of technology and systems to pro-actively assist us with compliance management. PIVOT is the Sibanye-Stillwater incident management system • Participation and involvement in catchment forums, as constituted by the DWS for the different catchments. These forums are mostly attended by all DWS sub-directorates, DMR, National Nuclear Regulator (NNR), Gauteng Department of Agriculture and Rural Development (GDARD), Department of Environmental Affairs (DEA) as well as major water users, NGOs, local and district municipalities, Rand Water and any other affected or interested party |
Compliance with permits and authorisations | Context: Sibanye-Stillwater’s operations in the SA region are governed by three acts – these are the MPRDA, the National Environmental Management Act 107 of 1998 (NEMA) and the National Water Act of 1998 (NWA). Licences and authorisations are granted with a myriad of stringent conditions. We operate in a dynamic environment and must comply with all conditions in order to retain our licence to operate. Applications for amendments as a result of changes in mining activities take time to authorise. • Application are made for amendments to Environmental Authorisations (EA), Environmental Management Programmes (EMPs), Atmospheric Emissions Licences (AELs), WULs, etc. to authorise listed and other activities, as well as to re-negotiate more realistic and achievable licence conditions • Scheduled internal inspections and reports constantly gauge compliance levels • Occurrence management procedures in place to log, manage, report on and action environmental occurrences (including non-conformances, incidents and complaints) • Scheduled internal and external WUL and EMP audits to assess compliance and rectify where needed • Extensive and comprehensive environmental monitoring to measure compliance levels and benchmark against permit conditions |
| |
Sibanye-Stillwater | Integrated Annual Report 2017 | 78 |
Risk | Mitigating action plans and strategies |
Impact of new and emerging legislation (where the ‘voice’ of industry has had little influence) on Sibanye-Stillwater’s operations and long-term sustainability | Context: Environmental legislation in South Africa is constantly evolving, and complying may have material impacts on how Sibanye-Stillwater conducts its business, for example, the revised November 2017 NEMA Regulations on financial provisions (FP) for rehabilitation and closure. The main points of contention with the revised FP Regulations are: • The proposed inclusion of 15% VAT on financial provisions for closure • The proposed inclusion of CPI+2% for the same financial provisions • The onerous auditing and reporting requirements In order to influence the context and content of the proposed revised FP Regulations, the following are being implemented: • Pro-active advocacy and engagement with Government when drafting new legislation, to actively influence the final outcomes, which include litigation options • The Chamber of Mines, in close cooperation with Business Unity South Africa (BUSA), is spearheading the mining industry’s comments on and influence into the draft FP Regulations, on behalf of and with inputs from the respective mining companies |
Reliance on municipal water and the significant costs to the operations | Context: Sibanye-Stillwater purchases municipal drinking water at significant expense. Sibanye-Stillwater purchased 18,284Ml of water at a total cost of R230.9 million for 2017. To address this: • Sibanye-Stillwater has embarked upon a municipal water independence strategy, assuming that our water use licence applications (WULAs) will be successful where needed • The construction of water treatment facilities to substitute municipal potable water supply, with long term supply to municipalities as a socially sustainable closure strategy is being investigated • Sibanye-Stillwater is implementing initiatives to reduce consumption and cost including: – Increasing treatment capacity of Driefontein Water Treatment facility to achieve monthly saving of R1.2 million by end of Q3 2018 – Engagement with water supply authorities supplying Kloof 3 shaft to renegotiate tariffs for monthly cost saving of R337,000 by Q4 2018 – Blending Facility at Kloof 10 Shaft to substitute localised potable water consumption with 30%, assuming current water quality does not deteriorate – Centralised Kloof Water Treatment Facility to supply full consumption of 13.98ML/d at 50% of current supply cost of R14.14m3 from municipality – Investigate possibility of borehole supply to Cooke plant to substitute current potable water cost of approximately R550,000 a month – All initiatives are subject to timeous approvals from necessary regulatory bodies |
Particular environmental risks in the US region include water and air quality management which are discussed in the relevant sections below
ENVIRONMENTAL COMPLIANCE
ENVIRONMENTAL COMPLIANCE
Significant progress was made in delivering on our environmental commitments in the past year in the SA region. In addition to the Environmental Vision 2020 and strategy developed early in 2017, headway was made on the development of the multi-disciplinary environmental incident management system which will be rolled out to the SA region during 2018.
While all environmental incidents are considered serious, Sibanye-Stillwater publicly reports on level 3 (short-term impact), level 4 (medium-term impact) and level 5 (long-term impact) environmental incidents.
All incidents are recorded, investigated and classified with steps taken to mitigate potential impacts and prevent any reoccurrence. Incidents are classified, monitored and reported internally on a monthly basis. A concerted effort was made to standardise and align the definitions and classification of environmental incidents across the SA gold and SA PGM operations in the SA region, and more recently in the US region. In the SA region, this has resulted in a more effective approach to the closing out of incidents and correctly reporting to the regulators as per the WUL and GN704 (regulations promulgated in terms of the National Water Act No 36 of 1998) requirements.
In 2017, in the SA region, no level 4 or 5 incidents were recorded, with a respectable 37% decrease in the number of level 3 incidents. Twelve level 3 incidents were reported during the year, of which nine were reported at the gold operations and three at the SA PGM operations. All but two of these incidents have been closed out as they required long lead time action.
| |
Sibanye-Stillwater | Integrated Annual Report 2017 | 79 |
The decline in incidents reported followed the introduction of a more pro-active approach to identify potential hotspots and the causes of such incidents. In addition to in-depth root cause analyses, there was detailed planning on implementing the most effective corrective and preventative action plans. In particular, operations were advised on what preventative measures were to be implemented to prevent spillages or a level 2 incident from becoming a level 3. This led to a more proactive approach to water balance management, including real-time monitoring of dam levels and spillage predictions, taking into account short-and medium-term weather forecasts, cleaning of silted dams during the dry season to create more storage capacity and improving return pump capacities. Constant liaison with and advice to the operations was crucial in achieving this success, as well as their willingness and ability to implement these measures.
In the US region, a total of six level 3 and higher environmental incidents are reported of which three were carried over from previous years as reoccurring events. Two of the three new incidents recorded in 2017 were subsequently closed out while the remaining event will be closed later this year.
Above average rainfall in the SA region during the year resulted in spillages mostly at the return water dams. These spillages accounted for nine of the twelve level 3 incidents. Following a root cause analysis, a proactive approach to water balance management, including real-time monitoring of dam levels, cleaning of silted dams during the dry season to create more storage capacity and improving return pump capacities was instituted. The remaining level 3 incidents relate to cattle mortalities, as a result of a slurry spill due to pipe vandalism and mine water spills from various sources.
Twenty-two major non-conformance notices were issued during 2017, largely related to exceedances of the dust fall out limits as measured by our dust monitoring programmes. The dust exceedances largely relate to the increase in transportation of surface material for retreatment and footprint rehabilitation (largely at the SA PGM operations). An air quality assessment has begun to identify high risk areas and activities as well as to recommend effective dust abatement measures.
A further two major non-conformance notices were issued for water quality compliance at Cooke, details of which follow in Water quality compliance.
For further detail on these incidents, refer to the Environmental incidents summary on the website at www.sibanyestillwater.com
DUST (SA REGION)
Dust management forms an integral part of the Sibanye-Stillwater environmental policy statement where the company commits to proactive air quality management using nationally prescribed methodologies. Control of dust from tailings storage facilities (TSFs) is a key focus as TSFs have been identified as a significant contributor of PM10 emissions (particulate matter with a size diameter of 10 micrometers or less. Dust particles of this size are small enough to get into the lungs). Particular attention is paid to those tailings facilities where the volume of wind-borne dust has reached higher-than-normal levels during the year.
Six dust complaints were received during 2017 compared with three dust complaints in 2016. Contributing factors to the higher number of complaints in 2017 is the increase in surface activities and the comparatively hotter and drier weather conditions that experienced during 2017. All dust complaints were recorded and investigated. Effective dust suppression measures were implemented to reduce the observed dust levels.
AIR QUALITY COMPLIANCE
Sibanye-Stillwater (SA region) has a requirement to standardise air quality monitoring across all operations.
Following comprehensive internal and external environmental compliance monitoring audits, one instance of air quality non- compliance with Sibanye-Stillwater’s air emissions protocols was observed. An internal audit inspection of the Cooke metallurgical gold plant found that the Cooke plant kilns and smelter had been operating without an approved atmospheric emissions licence. An action plan was immediately instituted and the authorities notified. An application for a provisional atmospheric emissions licence has been lodged.
All operations holding atmospheric emissions licences completed the annual reporting of emissions on the National Atmospheric Emissions Inventory System, as required, by 31 March 2017. In addition, the gold operations submitted reports on the National Atmospheric Emissions Inventory System under the “mines and quarries category”. The registrations of the PGM operations on the National Atmospheric Emissions Inventory was completed in 2017 and reporting of 2017 emissions is scheduled to be completed by 31 March 2018. Registration and reporting on emissions from the Cooke plant will also be completed by 31 March 2018. New regulations were promulgated in April 2017 regarding registration and reporting on greenhouse gasses at company-level. To this effect, Sibanye-Stillwater has submitted its application for registration as a data provider. The first report will be completed and submitted by 31 March 2018.
In the US region, environmental compliance is aimed at reducing environmental impacts by implementing compliance plans and innovative technologies that allow operation well within regulatory requirements. Progress continues on environmental support of mine expansion in the US region.
WATER QUALITY COMPLIANCE
Sibanye-Stillwater’s vision for water management is to create value for all stakeholders through the optimal management of the water resource and our water infrastructure, ensuring water safety, security and regulatory compliance by the effective use of knowledge and innovative technology.
During 2017, procedures were developed to drive the water management vision. In addition, all water use licences were reviewed to identify the need for amendments to achieve total compliance.
Overall water quality compliance with our licenced mine water discharges was good, with the exception of our Cooke operations where compliance with the discharge limits remains a challenge. Action plans have been put in place to achieve optimal pH control at the underground settlers to ensure effective and consistent metal removal. During 2017, a new water use licence (WUL) application for the Cooke operations was submitted requesting more realistic and achievable WUL limits. The proposed revision to the licence conditions will better reflect the water quality complexities of the Cooke discharge basin. The request for a revised WUL follows the success at Driefontein where there has been improved
| |
Sibanye-Stillwater | Integrated Annual Report 2017 | 80 |
water quality limit compliance, as a result of an amendment to the WUL. Water quality discharge compliance into the Wonderfonteinspruit improved from 70.3% to 95.5%. The Cooke WUL is expected to be issued in 2018.
The waste water treatment works also achieved good compliance, however nutrient and bacteriological compliance with unrealistic WUL limits remains a challenge. Sibanye-Stillwater has applied to amend the erroneous WUL limits and has instituted more stringent operational controls and monitoring to achieve better compliance.
All the operations in the SA region have valid WUL or old order water use authorisations.
LAND MANAGEMENT, REHABILITATION AND CLOSURE
LAND MANAGEMENT
To mitigate impacts that may arise from mining operations, Sibanye-Stillwater’s activities are monitored constantly in terms of EMPs, approved by the DMR. In the interests of legal requirements, sustainable development, land and waste management, alien vegetation initiatives and Biodiversity Action Plans (BAPs) will be developed for all our operations.
BAPs have been completed for the PGM, Kloof and Driefontein operations. Biodiversity assessments and BAPs for the remaining operations will be completed during 2018.
Currently alien and invasive vegetation is removed through a local economic development projects to ensure continuous compliance with the EMPs.
Heritage assessments are conducted for the development of all EMPs. The assessments are then conducted on an ad-hoc basis should a special need be identified including, demolition, closure or new project development.
No protected areas were identified within the South African operations as per the Protected Areas Act (No. 57 of 2003), however, ecologically important areas such as ridges, wetlands and cave systems have been identified and will be managed as required.
WASTE MANAGEMENT
The enforcement of sound waste management practices including monthly waste management meetings with waste contractors as well as visible felt leadership sessions on waste management opportunities continued to see improvements at our SA operations. Large quantities of scrap metal, old and obsolete pipes, unused metalliferous equipment as well as old timber was removed and disposed of by the salvage and reclamation teams, which contributed to on-site waste reduction initiatives and house-keeping practices. There was also a focus on the correct storage of hazardous waste within the appropriately bunded areas at the various operations. A draft group-wide hazardous waste management procedure has been developed and will be signed off for implementation in 2018. The income from recycling scrap steel in 2017 increased by 27.4% compared to 2016. The total domestic waste volume to landfill reduced significantly with the Kroondal realising a 28.6% reduction.
Waste management (Mt)
| 2017 | 2016 | | 2015 | 2014 | 2013 |
Group | United States 1 | | | Group | SA regionSA region SA region SA region |
PGM | PGM | Gold | PGM 3 | Gold | Gold | Gold | Gold |
Tailings deposited TSFs | 32.70 | 0.39 | 17.05 | 15.26 | 26.16 | 10.7 | 15.46 | 14.31 | 15.73 | 13.11 |
Tailings into pits | 3.27 | 0 | 0 | 3.27 | 4.02 | 0 | 4.02 | 4.20 | 3.79 | – |
Waste rock | 3.39 | 0.87 | 2.52 1 | 0 | 2.40 | 2.22 | 0.18 | 7.14 | 0.60 | 0.76 |
Recycled waste 2 | 11.45 | 0 | 0 | 11.45 | 12.09 | 0 | 12.09 | 11.34 | 11.96 | 13.29 |
Total mining waste | 39.36 | 1.260 | 19.57 | 18.53 | 32.61 | 12.92 | 19.69 | 25.65 | 20.12 | 13.87 |
| 1 | | For the period May to December 2017 |
| 2 | | Gold-bearing material such as waste rock dumps are retreated at the plant |
| 3 | | The 2016 SA PGM operations represent nine months for Kroondal and two months from the Rustenburg operations |
WEST RAND TAILINGS RETREATMENT PROJECT
Sibanye-Stillwater announced on 22 November 2017 that it had entered into various agreements with DRDGOLD in terms of which, Sibanye-Stillwater will exchange selected surface gold processing assets and TSF for c.265 million newly issued DRDGOLD shares. Once the transaction has been concluded, Sibanye-Stillwater will hold 38% of DRDGOLD’s issued share capital.
The transaction will allow Sibanye-Stillwater to immediately crystallise c.R1.3 billion in value from the plant infrastructure and TSFs that form part of the West Rand Tailings Retreatment Project (WRTRP), while retaining upside to future growth in DRDGOLD. Partnering with DRDGOLD to further develop the WRTRP presents an opportunity to grow an international, industry-leading, surface retreatment business. Sibanye-Stillwater’s stakeholders in the region also stand to benefit from the future development of this long-life surface reclamation project. The DRDGOLD transaction is expected to close after the end of March 2018
| |
Sibanye-Stillwater | Integrated Annual Report 2017 | 81 |
WASTE MANAGEMENT IN THE US REGION
Several strategies are employed to reduce the amount of waste generated by the US operations. For example, at the Metallurgical Complex’s smelter, solution from the scrubber that is used to reduce air emissions is treated in a process that converts the SO2 to synthetic gypsum, which is then sold for use in agricultural operations. While, slag produced from the smelting process is returned to the mines for reprocessing rather than stockpiled at the Complex. Whereas, at the mines, the volume of surface tailings is minimised with a substantial portion of tailings being returned to the mine for use underground as backfill and for stabilisation purposes. About half of the US region’s tailings are generally used as backfill each year.
The Group also minimises hazardous waste generation across US operations by optimising purchasing decisions on the front end. A committee comprised of environmental, safety, and operational employees screen new products being considered for use at Company facilities with the goal of identifying and avoiding products harmful to human health or the environment and instead purchasing safer, environmentally friendly alternatives. This process has reduced the volume of hazardous materials purchased and stocked on site.
CLOSURE PLANNING AND LIABILITY ASSESSMENT
The legislative context for closure and rehabilitation provisioning changed in November 2015, with the introduction of Regulation 1147 (R1147), which effectively replaced the MPRDA regulations and brought the entire regime of financial provisioning for closure under the auspices of the National Environmental Management Act (NEMA, 1998) as part of an overhaul of NEMA legislation. Owing to pressure and resistance from industry at large, implementation of R1147 was suspended in October 2016 (for 39 months from the date of promulgation, until February 2019). Draft regulations were finally published on 10 October 2017, effectively replacing R1147 and subsequent amendments. The draft regulations will significantly influence the quantum of Sibanye-Stillwater’s closure provisions with the first-time inclusion of residual impacts (a significant step-change from the MPRDA), the inclusion of both a pre VAT (CPI+2% and 15% VAT) and onerous auditing and reporting requirements. Despite the parallel process to influence and change the revised draft FP regulations to more favourable terms, Sibanye-Stillwater has begun aligning processes to meet the designated target date of February 2019.
PLANNING FOR MINE CLOSURE IN THE SA REGION
Ahead of the planned implementation of the Financial Provisioning Regulations in February 2019, much preparatory work has been done to clarify, confirm and align definitions for planning around mine closures, closure methodologies and the calculation of liability provisions. The aim is to compile a sustainable mine closure solution, the end objective of which is a sustainable socio-economic closure solution with due consideration of the water management cost of mine closure.
Closure of Ezulwini
Ezulwini Mining Company (EMC), a wholly-owned subsidiary of Sibanye-Stillwater, operates the Ezulwini Mine (alternatively known as Cooke 4 Shaft) on the West Rand where active mining has ceased. The pumping operation, necessary to remove 68ML/ day of fissure water from the underground workings, however continues. Sibanye-Stillwater has applied to the DMR for the closure of the underground workings.
The proposed solution is to allow the natural re-watering of the underground workings and the consequent recovery of the Gemsbokfontein West dolomitic compartment, which will reinstate the natural flow of the Gemsbokfontein eye into the Wonderfonteinspruit with good quality dolomitic water. To achieve the closure objectives, it was necessary to isolate the Gemsbokfontein West compartment by installing three concrete plugs between Cooke 3 and Ezulwini. Construction of these plugs began in May 2017 and their completion is planned for the middle of 2018. Five plugs, between South Deep and Ezulwini, were installed by Gold Fields’ South Deep mine between 2003 and 2005, as part of an earlier closure of Ezulwini. Extensive investigation into the stability and predicted long-term operating performance of the plugs, as well as the barrier pillars between both South Deep and Ezulwini and Cooke 3 and Ezulwini, indicated that the probability of failure of the plugs and pillars is small enough to be considered negligible.
On the strength of the findings of these investigations, an application under NEMA and the NWA was submitted to the regulators for authorisation to re-water the mine workings and aquifer. This involved specialist impact studies, risk assessments and two rounds of public participation, with input from neighbouring mines, communities, regulators and NGOs being received. A decision is expected during 2018, in line with the legislated Basic Assessment Process.
2017 closure liability and rehabilitation
The key focus of the 2017 closure liability assessment for the SA region was to align closure costs for the PGM operations, acquired during 2016, with those of Sibanye-Stillwater’s various gold operations. The 2017 closure liability provided for a closure framework that includes the compilation of concurrent rehabilitation plans and risk assessments for all operations as per the requirements of GN1147. These plans will be strictly managed and delivered to reduce the overall closure liability over time.
The total liability for the SA region is R6.9 billion as at 31 December 2017 (2016: R6.2 billion) as follows:
| · | | PGM operations – R2.7 billion (2016: R2.1 billion) |
| · | | Gold operations – R4.2 billion (2016: R4.1 billion) |
The 2017 assessment is the culmination of a five-year project to refine the model for the gold operations to an acceptable level of accuracy and detail to be used in concurrent rehabilitation planning at the different operations. This resulted in a net increase (1.6%) in the annual liability costs, comprising market related increases in demolition rates, but also decreases in closure liabilities as a result of the reworking of Surface Rock Dumps and the demolition of redundant infrastructure.
A different approach and assessment methodology had been used previously to assess closure liabilities at the PGM operations. Alignment with the Sibanye-Stillwater model resulted in a 33.6% increase in the 2017 liability costs for these operations. The main contributors to the
| |
Sibanye-Stillwater | Integrated Annual Report 2017 | 82 |
increase are amongst others, the use of to-date demolition unit rates used in the assessment, the inclusion of detailed actions required, as well as the application and costing of rehabilitation strategies as defined and developed over the past five years at the gold operations.
VAT on closure provisions
Towards the end of 2016 Pre-Directives (Notices of Intention to issue a Compliance Notice) were issued by the DMR: Gauteng region to three of our SA gold operations, directing those them to include and provide for a then-14% Value Added Tax (VAT) in their closure liability calculations. In January 2017, and as directed by the pre-directive, Sibanye-Stillwater, supported by strong legal arguments, submitted comprehensive responses/representations to the DMR on this contentious issue, including a tax advisory from PwC Tax Advisory Services and an official VAT Ruling from the South African Revenue Service (SARS) applied for in December 2016. Both these documents concurred and confirmed that:
| · | | Contributions by Sibanye-Stillwater to the environmental trust funds are not subject to VAT |
| · | | Reimbursement of rehabilitation expenditure incurred is not subject to tax provided it relates to a taxable supply made by Sibanye-Stillwater |
| · | | Sibanye-Stillwater is entitled to deduct input tax, in respect of the VAT on rehabilitation expenses incurred by it in the course of conducting its mining operations and paid by the Trust or Guardrisk on behalf of Sibanye-Stillwater. |
Despite representation, formal letters and submissions the DMR has not formally responded and so the VAT issue remains unresolved. The issue has further complications for Sibanye-Stillwater in that the DMR has been withholding key environmental authorisations in lieu of payment of VAT, including authorisations for the WRTRP.
The total area under management by Sibanye-Stillwater at the gold operations in 2017 was 50,316ha of which the total of land disturbed by mining and related activities was 17,359ha. At the SA PGM operations, a total area of 24,368ha are managed and disturbed by mining and related activities.
LAND RECLAMATION IN THE US REGION
Since their inception, mines in the US region have embraced interim reclamation of mine disturbances. Waste rock and tailings are non-acid generating and meet all applicable regulatory standards, such that soils and vegetation are unlikely to be affected at final reclamation and closure. This non-acidic waste, in conjunction with interim reclamation practices, substantially minimises potential impacts to air and water resources while re-establishing forage and biological diversity that benefit wildlife and maintain the visual integrity of the sites. For example, at the Stillwater mine’s Hertzler tailings site, we have collaborated with regulatory authorities to improve the tailings embankment design, which allows for concurrent reclamation with significant visual appearance and revegetation benefits. When final closure occurs, the design will reduce final reclamation costs, help re-establish productive wildlife habitat, and maintain the visual integrity of the site and functionality.
Reclamation and closure bonds are required at both US region mines to ensure adequate resources exist to fund reclamation activities at closure. These amounts are adjusted every five years following a collaborative review by the Company and its regulatory agencies. In 2017, the reclamation and closure bond amount for the Stillwater mine was US$24.30 million, including that of the Benbow portal, while the bond amount for the East Boulder mine was US$18.00 million.
In addition to responsible closure and reclamation, the Company employs conservation easements on nearly 40% of its owned land. These legal mechanisms protect scenic vistas, enhance wildlife habitat, and preserve wildlife migration corridors, all while maintaining Montana’s rural character and fostering biodiversity and healthy forests
Land under management and rehabilitated in the US region – as at 31 December 2017 (Hectares)
| | | | |
| Total and/or permitted | Disturbed | Undisturbed | Rehabilitated / reclaimed |
East Boulder | 132.7 | 86.0 | 46.7 | 20.4 |
Stillwater | 424.9 | 356.3 | 68.6 | 207.1 |
Metallurgical Complex | 82.6 | 13.0 | 69.6 | 0 |
Total | 640.2 | 455.3 | 184.9 | 227.5 |
WATER MANAGMENT
WATER MANAGEMENT SYSTEMS AND FOOTPRINT
Sibanye-Stillwater recognises water as a critical resource, and considers an integrated approach to the management of its water footprint and its water systems infrastructure as a key component of its business strategy. Efficient water management is vital in terms of preservation, consumption and cost.
Our Southern African water footprint in terms of water withdrawn, consumed and purchased is detailed below. The Group water footprint in the SA region increased significantly following the acquisitions of the PGM operations. Water intensity, a measure of the amount of water used per tonne treated, improved largely as a result of the efficient use of water by the PGM operations – to 1.31kl/tonne in 2017 compared with 1.71kl/tonne in 2016. Less water is used at the PGM operations than at the gold operations as a result of the dry nature of the mines, the substantial number of domestic consumers on the gold mines and the Beatrix evaporation pans, which evaporate excess fissure water. The water intensity for the gold operations increased year on year as a result of the decrease in tonnes processed.
| |
Sibanye-Stillwater | Integrated Annual Report 2017 | 83 |
Sibanye-Stillwater’s water footprint – our water usage
| 2017 | 2016 |
Group | US region* | SA region | Group | SA region |
PGM | PGM | Gold | PGM** | Gold |
Water withdrawal (ML) | 125,135 | 2,447 | 13,831 | 108,857 | 111,693 | 4,376 | 107,317 |
Water discharged (ML) | 70,586 | 1714 | 0 | 68,872 | 65,833 | 0 | 65,833 |
Water used** (ML) | 54,548 | 733 | 13,831 | 39,984 | 45,860 | 4,376 | 41,484 |
Total water purchased (ML) | 20,933 | 94 | 8,937 | 11,902 | 15,027 | 2,674 | 12,353 |
Water purchased from water services authorities (%) | 38 | 13 | 65 | 30 | 33 | 61 | 30 |
Volumes treated (Mt) | 41.83 | 1.9 | 20.90 | 19.03 | 26.80 | 6.60 | 20.20 |
Intensity (kl/tonne treated) | 1.31 | 0.43 | 0.66 | 2.10 | 1.71 | 0.66 | 2.05 |
| * | | for the period May to December 2017 |
** The figures for 2016 includes Kroondal from April 2016 and Rustenburg operations from November 2016
“Total purchased” includes “Potable water purchased” and “Municipal sewage effluent purchased” at Rustenburg operations. “Water withdrawal” Includes all water abstracted from ground water sources and total purchased.
“Water discharged” is all water discharged into the environment at licenced discharge points. “Water used” is water withdrawal – water discharged.
“Volumes treated” is all dry tonnes processed in Sibanye-Stillwater metallurgical plants and concentrators. “Intensity” is water used/volumes treated.
Note: Water used = total abstracted (withdrawn) minus water discharged (assume “abstracted” refers to water withdrawal in table above.
Perhaps be consistent)
In the SA region, the water management control system has been extended to include continuous water quality data and flow metering for process control. By year-end, an automated water metering system had been successfully deployed across the West Rand and at Beatrix in the Free State province. Approximately 220 potable water meters are now being used to monitor water consumption continuously and to identify the location of water leaks. Leaks detected at Driefontein and Cooke have resulted in monthly savings of more than R2 million. The intention is to fully integrate the system across all operations to minimise water losses across the Southern African footprint. This system is to be rolled out at the SA PGM operations by the third quarter of 2018. Through the implementation of the water metering system, it has also been established that there is substantial scope to reduce water consumption at specific consumption points.
The strategy to monitor and manage the Sibanye-Stillwater water footprint is aligned with our strategy to be independent of municipal water and improve our water security and reduce our dependence on external suppliers of potable water. There are two primary advantages to being water independent:
| · | | It will allow the operations to generate potable water from already available underground fissure sources more cheaply than it costs to purchase drinking water from municipal supplies |
| · | | It will reduce the load on municipal supplies significantly and allow them to make provision for the shortfalls predicted in the future |
During 2017, a business case for potable water independence was developed, concept designs were done, proposals were invited, and purchase equities prepared. The project entails the interim upgrade by adding a 5Ml/d membrane softening facility. Completion is expected in 2018.
WATER COST SAVING INITIATIVES
Potable water conservation and water demand management
While Sibanye-Stillwater advances the critical water independence strategy, water cost saving initiatives initiated during 2017 will continue. The table that follows compares 2017 potable water consumption with that of previous years and indicates the savings achieved.
Total potable water purchased 2015 - 2017
| | | |
Potable water purchased (Ml) | 2017 | 2016 | 2015 |
Beatrix | 2,881 | 2,758 | 3,201 |
Cooke | 2,123 | 2,692 | 4,112 |
Driefontein | 2,210 | 1,657 | 1,726 |
Kloof | 4,688 | 5,247 | 5,755 |
Kroondal | 1,744 | 2,333 | |
Rustenburg | 4,637 | 4,977 | |
Total – Gold operations | 11,902 | 12,353 | 14,794 |
Total – PGM operations | 6,382 | 7,309 | |
Total – SA region | 18,284 | 19,663 | 14,794 |
The figures for 2016 includes the Kroondal and Rustenburg operations from January 2016.
Following the installation of bulk water meters to improve water conservation and water demand the drinking water purchased has reduced across the SA footprint. The gold operations saw a 451Ml reduction despite substantial increases in the Driefontein and Beatrix operation.
| |
Sibanye-Stillwater | Integrated Annual Report 2017 | 84 |
Driefontein and Beatrix consumption increased by 33% and 4.5% respectively following production demands. The substantial decrease observed at the Cooke operation (569 Ml or 21.1% year on year) and Kloof operation (559 Ml or 10.7% year on year) followed the implementation of effective leak management interventions and improved use of process (return water) and effective offset of purchased water to available fissure water.
The increased pumping capacity between the Marikana return water dam and the Kroondal return water dams, enabled the Kroondal operation to withdraw more water from the Marikana pits, resulting in a reduction of 588 Ml (26%) for total water purchased1.
1 To determine this impact, the consumption for 12 months in 2016 was compared with 12 months in 2017 even though Sibanye-Stillwater only acquired Kroondal in April 2016.
Potable water treatment cost minimisation
Sibanye-Stillwater continues to operate two potable water treatment facilities which softens hard underground fissure to SANS241 potable standards.
Driefontein consumed a total of 9,097 Ml of Potable water of which 2,210Ml was purchased from Merafong Municipality and the rest supplied from underground fissure water treated by sand filter and ion exchange treatment facility. This treatment facility enabled potable water to be obtained at a substantially lower cost and affected a cost saving of R40.1 million during 2017 Another treatment facility, in this case a crystal actor treatment plant, is operated at Cooke 4. This operations consumed a total of 1,133 Ml of which 126 Ml was purchased from a Rand Water Board source. The crystal actor affected a cost saving of R 4.9 Million in operational cost during 2017.
Review of municipal water charges, water resource management systems and costs
Sibanye-Stillwater receives water from Rand Water, Sedibeng Water, Rand West Local Municipality, Merafong Local Municipality and Rustenburg Local Municipality. A substantial component of water cost control and management is the review and reconciliation of invoices from municipalities and other water supply authorities for purchased water and water resource management charges. Invoice irregularities have been identified. A process has been instituted to reconcile invoices received with volumes purchased and to resolve issues, administrative delays and inefficiencies.
Optimisation of the number of water monitoring control points
During 2017, more opportunities were identified to reduce the number of water quality monitoring points and in so doing, reduce the number of compliance samples. To realise such cost savings, a new integrated monitoring programme will be developed with support from the DWS. This initiative will continue into 2018.
Update on water management operations
Sibanye-Stillwater’s Environmental Department provides operational and contracts management support for several water management facilities, including: surface water potable water treatment plants, the Western Basin Acid Mine Drainage (AMD) treatment facility, a mud dewatering plant (MUM), underground settlers, cold lime softening plants, cooling water treatment plants, underground potable water plants, wastewater (sewage) treatment plants and new technology pilot plants. The 2017 highlights include:
| · | | Successful re-commissioning of the MUM project to treat underground mud from Cooke 1 and 2 shafts. Some 800 tonnes of mud was dewatered and treated at the Ezulwini metallurgical plant during 2017. |
| · | | Successful commissioning of the 250m3/day WRTRP water treatment pilot plant. The pilot plant treats return water from a tailings facility to potable standards while simultaneously ensuring the waste stream is of stable composition for disposal on the tailings facility. |
| · | | Sibanye-Stillwater successfully converted some of their underground settlers at Cooke 1, Cooke 2 and Cooke 4 into cold lime softening units so as to enable the removal of metals and uranium from the settled water being discharged into the environment. |
| · | | AMD treatment facility: Alkaline tailings from the Cooke surface reclamation project has had the desirable effect of neutralising acidic water in the Western Basin, following deposition into the pits. This has reduced the acidity of the basin and improved the discharge quality of the water. |
| · | | Western Basin Treatment Facility: The treatment plant which treats AMD increased the treatment rate to 35-40ML/day during the first quarter of 2017. This increased treatment rate has lowered the water table in the Western Basin by 3.5m; the deepest level since the decant from the Western Basin started in 2002. |
Water management in the US region
Water is generally not a scarce resource in the US region, however management of excess mine water, its treatment and disposal, remain a primary focus. Related to this is management of water in tailings facilities. Water treatment facilities are employed at the mines and portal sites to remove nitrogen added to mine water and waste rock from blasting operations. The water treatment facilities employ a biological treatment process to remove enough nitrogen so that the treated water can be disposed of either through land application disposal, percolation, or deep well injection. These facilities, which are reviewed and optimised continually, are to be expanded in the near future.
| |
Sibanye-Stillwater | Integrated Annual Report 2017 | 85 |
AIR QUALITY – ENERGY AND EMISSIONS MANAGEMENT
Sibanye-Stillwater monitors and measures its emissions from direct fuel sources such as diesel (scope 1), emissions from indirect fuel sources such as purchased electricity (scope 2) and indirect emissions associated with purchased materials.
Energy consumption (TWh)
| 2017 | 2016 | 2015 | 2014 | 2013 |
SA region | 5.77 | 4.72 | 4.23 | 4.27 | 3.78 |
Gold operations | 4.16 | 4.16 | 4.23 | 4.27 | 3.78 |
Beatrix | 0.63 | 0.66 | 0.65 | 0.65 | 0.66 |
Cooke | 0.54 | 0.58 | 0.59 | 0.63 | – |
Driefontein | 1.50 | 1.44 | 1.47 | 1.47 | 1.56 |
Kloof | 1.47 | 1.46 | 1.50 | 1.53 | 1.55 |
PGM operations | 1.61 | 0.56 | | | |
Kroondal | 0.36 | 0.35 | | | |
Rustenburg | 1.24 | 0.21 | | | |
US region* | 0.24 | |
Stillwater (includes the Columbus Metallurgical Complex) | 0.19 | |
East Boulder | 0.53 |
Group total | 6.01 | 4.72 | 4.23 | 4.27 | 3.78 |
| * | | for the period May to December 2017 |
| * | | Includes Bursntone’s consumptions of 0.03TWh |
Nitrogen and sulphur oxide emissions
The volumes of materials consumed have a direct bearing on our scope 1 and scope 3 carbon emissions and also on emissions of nitrogen oxides and sulphur oxides
| 2017 | 2016 | 2015 | 2014 | 2013 |
Nitrogen oxides (tonnes) | | | | | |
SA region | 1,126 | 887 | 618 | 19,901 | 14,618 |
US region* | 105 | | | | |
Total | 1,231 | 887 | 618 | 19,901 | 14,618 |
Sulphur oxides (tonnes) | 605 | | | | |
SA region | 667 | 499 | 632 | 464 |
US region* | 6 | | | | |
Total | 611 | 667 | 499 | 632 | 464 |
| * | | for the period January to December 2017 |
Nitrogen oxide and sulphur oxide emissions for the Southern Africa region are derived by the multiplication of fuels (diesel, petrol, liquid petroleum gas, coal, helicopter fuel and paraffin) by the corresponding emission factors. Nitrogen oxides and sulphur oxides are monitored as key indicators of emissions from combustion of fuels.
The increase in nitrogen oxides from 2016 to 2017 is attributed to the increased volumes of diesel consumed in 2017 by the PGM operations which are accounted for the full year in 2017 as compared with 2016 when consumptions were pro rata from the dates of acquisitions – Kroondal from April 2016 and Rustenburg operation from November 2016.
The decrease in sulphur oxides from 2016 to 2017 is attributable to the reduced volume of coal used (reduced from 22 533 tonnes in 2016 to 15 017 tonnes in 2017). Coal is used at our Beatrix operation for comfort heating at the high density residences. One of the two boilers was out of order for a period during 2017, resulting in lower coal consumption. Currently there are no regulated limits for sulphur oxide emissions.
Air emissions management in the US region
The US region continues to leverage technology to reduce air emissions and exceed state and federal standards. Air emissions at the Metallurgical Complex are generally well controlled. Sulphur dioxide (SO) is the primary constituent affecting air quality at processing facilities in the region. At these facilities, gasses released from smelting operations are routed through a state-of-the-art, dual alkaline, gas/liquid scrubbing system, which removes approximately 99.8% of SO. In 2017, only 2.6t of the Income Tax Act, which makes provision for businesses to claim a deduction against taxable income on energy efficiency savings of R0.95 per kWh saved.
| |
Sibanye-Stillwater | Integrated Annual Report 2017 | 86 |
During 2017, six projects from the gold operations were registered with the South African National Energy Development Institute. These projects have realised tax certificates totalling R180 million. These tax certificates make it possible for the respective deductions to be made from taxable income. In addition, PwC has been tasked with exploring opportunities on a broader facility-based approach for Section 12L eligibility. If successful, the facility-based applications could realise tax certificates amounting to approximately R149 million. The SA region’s PGM operations are also exploring potential opportunities from the Section 12L incentive.
Energy and carbon management
The South African government is looking to implement measures such as carbon budgets and carbon tax to encourage the reduction of carbon emissions. The National Treasury released the second draft carbon tax bill in December 2017 for comment. The full implications of this draft bill are being assessed and comments were submitted on 9 March 2018. The financial implications of the first draft carbon tax bill had been estimated to be between approximately R4 million and R25 million annually on the premise that purchased electricity (scope 2) emissions are excluded. In the event that purchased electricity (scope 2) emissions are included, the annual tax liability could increase to between approximately R249 million and R271 million.
Sibanye-Stillwater is opposed to the introduction of a carbon tax on the basis that the incremental cost negatively affects the economic viability of marginal operations, which in turn impacts employment.
Sibanye-Stillwater continually seeks to actively reduce its carbon emissions by, among others, the implementation of energy efficiency projects. Such projects also provide added benefits including the tax incentive opportunity presented by Section 12L is estimated the array will produce about 144,000kWh annually, which is enough electricity to power 13 homes.
Energy management in the US region
To increase operational efficiency and reduce energy consumption, steps have been taken to implement more efficient management of the ventilation systems and the supply and management of compressed air at the East Boulder and Stillwater mines. In addition, energy efficient lighting systems have been installed across the operations.
In the area of electricity consumption, the US region began purchasing a portion of its electricity as renewable hydropower from Energy Keepers, Inc. (EKI), a Native American tribal entity, which operates a three-unit hydroelectric facility on the Flathead River in northwest Montana. EKI is the first tribally-owned major hydroelectric operator in the US.
In addition to this hydroelectric source, a new solar panel array at the Metallurgical Complex was commissioned in December 2017. This array has a peak output of 100kW and will provide electricity to power the main office building at the Complex. It is estimated the array will produce about 144,000kWh annually, which is enough electricity to power 13 homes.
Energy reduction initiatives
The gold operations spent R39.3 million on energy efficiency initiatives during 2017. This resulted in energy savings of 9.7MW.
Some of the key initiatives implemented at the gold operations were aimed at optimising the main ventilation fans by installing medium-voltage variable-speed drives on drive motors, improved turbine availability and efficiency, optimising cooling cars, the installation of localised air conditioning units underground, and regarding pumping, various efficiency projects are underway, including the installation of heat pumps and closed-loop cooling systems.
The SA region’s PGM operations continued with the compressed air optimisation project in 2017. Two performance assessments of twelve to cover the three year project period, were completed with very positive results. So far, the project has saved more than 3 700 MWh. This equates to a R3-million saving for the 2017 financial year. The compressed air project, an integrated demand management project, was partially funded by Eskom in support of energy efficiency initiatives.
| |
Sibanye-Stillwater | Integrated Annual Report 2017 | 87 |
Energy intensity (GJ/tonne milled)
| 2017 | 2016 | 2015 | 2014 | 2013 |
SA region | 0.60 | 0.68 | 1.02 | 0.98 | 1.05 |
Gold operations | 0.79 | 0.79 | 1.02 | 0.98 | 1.05 |
Beatrix | 0.78 | 0.69 | 0.73 | 0.69 | 0.70 |
Cooke | 0.53 | 0.43 | 0.76 | 0.77 | – |
Driefontein | 0.91 | 0.89 | 1.03 | 1.09 | 1.08 |
Kloof | 0.94 | 1.15 | 1.56 | 1.36 | 1.36 |
PGM operations | 0.22 | 0.45 | | | |
Kroondal | 0.21 | 0.51 | | | |
Rustenburg | 0.22 | 0.38 | | | |
US region* | 0.95 | |
Stillwater (includes the Metallurgical Complex | 1.40 | |
East Boulder | 0.49 |
Group total | 0.69 | 0.68 | 1.02 | 0.98 | 1.05 |
| * | | or the period May to December 2017 |
SOLAR ENERGY
A prefeasibility study completed in 2014 confirmed a solar photovoltaic plant could supply carbon-neutral electricity as an economic, competitive alternative to carbon-intensive grid-supplied power. A 150MW photovoltaic plant is planned for development on a site strategically placed between the Driefontein and Kloof mining complexes on the West Rand. Photovoltaic generation from a site adjacent to Sibanye-Stillwater’s mining operations represents a partial solution to securing alternative electricity supply and allows the power generated to be injected directly into the mine’s electrical reticulation.
Given regulatory delays, highlighted as the largest risk to the project in the 2016 IAR, the planned operation of the first phase of 50MW has been moved out to the second half of 2019. Despite these delays, significant progress was made in 2017 towards project execution. Two Environmental Authorisations in terms of the National Environmental Act were provisionally granted by the Department of Environmental Affairs, together with a Water Use Authorisation in terms of the National Water Act from the Department of Water and Sanitation. Rezoning of the land was also approved by the Rand West City Local Municipality. Combined, these approvals allow for construction of the plant and associated infrastructure on the project site. The geotechnical studies and basic engineering design have been completed in support of the project.
To execute the project, Sibanye-Stillwater has elected to run a competitive tender process to appoint a project developer who will build, own and operate the project, and sell power back to Sibanye-Stillwater through a power purchase agreement (PPA). This approach has a minimal upfront capital requirement for Sibanye-Stillwater and allows capital to be prioritised for core mining projects. The tender was successfully concluded in 2017, enabling a significant forecasted return to Sibanye-Stillwater over the course of the agreement.
Eskom, as the local grid operator, has provided provisional technical approval of the plant’s interconnection, as required by the Electricity Regulation Act. The commercial terms of their statutory connection and operations monitoring function are still being negotiated. With approval from the Department of Energy, Sibanye-Stillwater and the preferred project developer are in the process of applying for a generation licence from the National Energy Regulator which is required to operate the plant.
In 2018, the final milestones will be obtained, allowing the construction phase to begin in the second half of the year. The terms of the power purchase agreement are currently being concluded with the preferred project developer. The agreement is expected to be executed in H1 2018, subject to final Board approval. Financial close will be reached once the final regulatory approvals are granted, allowing construction to begin. Although the project team carefully monitors and manages these, energy sector uncertainty and regulatory approvals remain the biggest implementation risk to the project.
This technology and approach to utility-scale private power supply are being adopted at a rapid pace globally, with Sibanye-Stillwater leading the charge in Africa. Once completed, this project will be the single largest private off take plant on the African continent. The project team is
| |
Sibanye-Stillwater | Integrated Annual Report 2017 | 88 |
confident that the project will be a success and provide a suitable solution to alternative energy supply while deriving commercial benefit. Initial estimates are that it will reduce our carbon consumption by around 120,000t CO2e per 50MW phase.
CARBON EMISSIONS
Scope 1 and scope 2 (direct emissions) carbon inventory (000t CO2e)
| | | | | | | | | | |
| 2017 | 2016 | 2015 | 2014 | 2013 |
| Group | US region* | SA region | Group | SA region | SA region | SA region | SA region |
| | PGM | PGM | Gold | | PGM | Gold | Gold | Gold | Gold |
Scope 1 (excluding fugitive mine methane) | 196 | 32 | 43 | 121 | 116 | 18 | 99 | 94 | 110 | 62 |
Scope 1 (fugitive mine methane) | 565 | na | na | 565 | 596 | | 596 | 650 | 660 | 572 |
Scope 2 | 5,837 | 183 | 1,573 | 4,081 | 4,720 | 557 | 4,163 | 4,272 | 4,405 | 3,774 |
Scope 3 | 2,539 | 544 | 980 | 1,016 | 1,029 | 180 | 849 | 867 | 863 | 634 |
CO2e intensity (per tonne milled) | 0.13 | 0.01 | 0.06 | 0.25 | 0.22 | 0.12 | 0.24 | 0.25 | 0.28 | 0.32 |
* for the period January to December 2017 in accordance with the World Resources Institute, greenhouse gas protocol
Not all entities include all categories of scope 3 emissions as the newly acquired entities such as Rustenburg PGM and Stillwater are still obtaining information on certain categories to be reported in the future
Emissions from at least nine of the 15 Scope 3 categories have been included as follows:
1 Purchased goods and services: emissions associated with the extraction and production
2 Capital goods: emissions associated with the production of purchased company-owned vehicles
3 Fuel- and energy-related emissions not included in Scope 1 or Scope 2: emissions associated with the extraction, production and transportation of diesel, petrol, liquid petroleum, gas, coal, blasting agents, oxyacetylene and grid electricity
4 Upstream transportation and distribution: emissions associated with the transportation and distribution of purchased commodities
5 Waste generated in operations: emissions associated with the disposal and treatment of Sibanye-Stillwater’s solid waste and waste water in facilities owned or operated by third parties (such as municipal landfills and wastewater treatment facilities)
6 Employee commuting: emissions associated with the transportation of Sibanye-Stillwater’s employees between their homes and work sites
7 Downstream transportation and distribution: CO2 e emissions associated with transportation of product from Sibanye-Stillwater
8 Processing of sold products: CO2 e emissions associated with smelting and refining
9 End-of-life treatment of sold products: CO2 e emissions associated with smelting to repurpose the product
10 Downstream leased assets are applicable to the SA region only: CO2 e emissions associated with the leasing of houses to mineworkers where emissions are generated from electricity use
11 Investments: are applicable to the Southern Africa region only
12 Business travel in the US region was not tracked and therefore not included
The following Scope 3 categories have not been included:
• Franchises: Sibanye-Stillwater does not have any franchises
• Use of sold products: emissions associated with the use of products sold are deemed insignificant as only processing and end-of-life treatment of products sold are expected to have significant associated emissions
• Upstream leased assets: no significant upstream leased assets have been identified
Purchased electricity formed the bulk of Sibanye-Stillwater’s carbon emissions, accounting for 91%. The continuation of energy efficiency projects and the implementation of the planned solar PV project is expected to further reduce emissions from purchased electricity.
The South African National Treasury aims to encourage companies to gradually revise their fuel inputs, production techniques and processes by encouraging investments into energy efficient and low carbon technologies. The lower emissions will be incentivised further on the introduction of a carbon tax. The first phase of implementation has been extended from 2020 to 2022. The carbon tax will be introduced at a rate R120 per tonne of CO2 equivalent and increased annually by the consumer price inflation plus 2%.The 60% tax-free threshold and allowances for trade exposure, performance and offsets have been retained from the first draft with revised specifications. The full implications are being assessed and detailed comments will be submitted to National Treasury during the commenting period,
Given the recent incorporation of the US region, base year emissions are currently under review. This will form the basis for our new company-wide targets.
| |
Sibanye-Stillwater | Integrated Annual Report 2017 | 89 |
MATERIALS CONSUMED
A range of materials is consumed in the conduct of our business, the use of which we optimise so as to reduce both costs and consumption.
Materials consumed
| | | | | | | | | | |
| 2017 | 2016 | 2015 | 2014 | 2013 |
| Group | US region* | SA region | Group | SA region | SA region | SA region | SA region |
| | PGM | PGM | Gold | | PGM | Gold | Gold | Gold | Gold |
Timber | 102,543 | 263 | 878 | 101,402 | 110,606 | 82 | 110,524 | 163,722 | 104,468 | 110,524 |
Cyanide | 7,552 | na | na | 7,552 | 11,967 | na | 11,967 | 11,924 | 11,758 | 11,967 |
Explosives | 31,942 | 3,893 | 22,140 | 5,902 | 13,814 | 7,046 | 6,768 | 7,854 | 4,175 | 6,768 |
Hydrochloric acid | 4,469 | 0.4 | na | 4,469 | 4,414 | na | 4,414 | 3,773 | 3,579 | 4,414 |
Caustic soda | 3,378 | 204 | na | 3,174 | 2,674 | na | 2,674 | 3,421 | 2,947 | 2,674 |
Lime | 72,378 | na | na | 72, 378 | 76,556 | na | 76,556 | 68,128 | 39,843 | 76,556 |
Cement3 | 60,706 | 16,459 | 4 3,459 | 40,788 | 44,378 | 1,513 | 42,865 | 41,101 | 38,579 | 42,865 |
Diesel (kL) | 26,065 | 7,344 | 4 8,979 | 5,943 | 10,422 | 3,325 | 7,097 | 6,410 | 6,274 | 7,097 |
Lubricating and | | | | | | | | | | |
hydraulic oil (kL) | 7,639 | 565 | 4 4,280 | 1,411 | 7,777 | 7,777 | | | | |
Grease (kg) | 212,102 | 11 | 4 26,130 | 186,953 | 19 | 19 | | | | |
1 For the period January to December 2017, of which May to December 2017 were consumed by Sibanye-Stillwater
2 PGM data for 2016 include operations under management – Kroondal (50%) is included for the nine months from April to December 2016 and Rustenburg operation for two months (November and December 2016)
3 Includes all categories of cement and cement mixtures
4 Represents five months for the Rustenburg operations and 12 months for Kroondal
* Group total includes four months (January to April 2017) of Stillwater materials consumed before these operations were under our ownership
GOVERNANCE
Sound governance on environmental issues remains the backbone of our efforts to achieve our Environmental Vision 2020, and to achieve and remain legally compliant. At Sibanye-Stillwater, our environmental policies (such as our Water Management Policy, Carbon Management Policy, among others), our environmental vision and operating procedures govern our environmental activities, performance and reporting. In the Southern Africa region, internal environmental monitoring, site inspections, and audits are conducted at pre-determined frequencies in order to assess legal compliance at operational level, as well as to gauge the implementation and achievement of environmental targets, objectives and programmes. In addition, external audits are conducted by third parties related to our:
| · | | Water use licences (WULs) |
| · | | Environmental Management Plans (EMPs) |
| · | | Any other environmental permit, licence or approval, where external and third-party auditing is a condition of approval |
External auditors also review and monitor data and the Department of Water & Sanitation (DWS) and DMR conduct regulatory inspections, as does the National Nuclear Regulator (NNR) and the Trans-Caledon Tunnel Authority.
Internal environmental reporting is as follows:
| · | | Monthly operational environmental performance reports to all operational vice presidents and senior operational staff |
| · | | Monthly NEHS (natural environment, health and safety) meeting (executive committee) at which non-conformances and principal indicators, as assured by external auditors, are discussed |
| · | | Quarterly report into the social and ethics, audit and risk committees, where material environmental issues are reported, and where oversight on these is sought from these board committees |
| · | | Ad hoc performance and issues-based reports to relevant staff to highlight specific environmental issues and mitigation measures |
Other initiatives implemented to strengthen environmental governance at our operations include the following:
| · | | The compilation and maintenance of an Environmental Risk Register, as part of the enterprise-wide risk management (ERM) system, highlighting material environmental risks, their potential impact on the business and how they can be mitigated |
| · | | The re-introduction of an environmental management system aligned to the principles of ISO 14001 |
| · | | Effective environmental stakeholder engagement as part of environmental governance |
| |
Sibanye-Stillwater | Integrated Annual Report 2017 | 90 |
Externally, the US region’s operations are governed by a multitude of permits issued by the Montana Department of Environmental Quality, the United States Forest Service, and the Environmental Protection Agency. Routine (generally annual) reporting to the agencies is done for operating and other primary permits, as are regular agency inspections.
In addition to these regulatory relationships, we engage frequently with the Good Neighbour stakeholders to address planned operational activities, as well as to report any environmental incidents. The Good Neighbours undertake audits of certain components of the applicable agreement at various times.
FUTURE FOCUS
In the SA region:
| · | | Responsible compliance with all legal, regulatory and generally accepted standards applicable to our mining operations in different jurisdictions |
| · | | Ensuring that water abstracted, used, stored and / or discharged is compliant with legal and regulatory requirements |
| · | | Proactive environmental incident management supported by enabling technologies and comprehensive reporting, in order to minimise or prevent pollution |
| · | | Implementation of sound environmental management practices and systems, and the development of fit-for-purpose environmental standards and procedures that promote continual improvement |
| · | | Proactive air quality management using nationally prescribed methodologies |
| · | | Efficient and responsible use of natural resources including water and energy, and the responsible management of all waste and effluent streams emanating from our mining operations |
| · | | Implementation of a sustainable closure strategy, and concurrent rehabilitation for the environmentally responsible and effective socio-economic closure of our mining operations |
| · | | Continual assessment of our water, land and carbon footprint – developing resource conservation programmes to effectively manage and reduce our footprint |
| · | | Developing environmental training and awareness programmes for employees and communities |
| · | | Communicating openly and transparently with all our stakeholders insofar as our environmental impacts and environmental management programmes are concerned |
| · | | Providing water that is safe and secure (available) for our people, machinery, infrastructure and the environment |
| · | | Hands-on supervision of water management contracts, thereby ensuring the efficient operation of water infrastructure |
| · | | Crafting and implementation of a municipal water independence strategy |
In the US region from an environmental perspective, the focus in 2018 will be on:
| · | | Continued mining, waste, and water management strategies that meet or exceed regulatory requirements, including the GNA |
| · | | Developing a long-term environmental strategy, including that related to water, tailings, waste, and air, and traffic management to support the long-term operations plans |
| · | | Achieving zero annual externally reportable and reduced internally reportable environmental incidents |
| · | | Enabling the sustained production of the operation plan’s business goals |
| · | | Enabling the retention of the No.1 position in the PGM recycling industry with a planned sustained throughput |
| · | | Maintaining healthy relationships with the GNA and other external stakeholders |
| · | | Ensuring that the Environmental Team is fully resourced and strategically aligned to meet the US region’s strategic goals |
| |
Sibanye-Stillwater | Integrated Annual Report 2017 | 91 |
Strong, ethical corporate governance, based on the principles of accountability, transparency, competence, responsibility, fairness and integrity, is fundamental to the long-term sustainability of our business and to sustained value creation for all stakeholders. These principles which are implicit in our CARES values are applied in the management of our business and in reporting to shareholders and other stakeholders. Our governance structures, processes and policies, together with our code of ethics, underpin execution of our strategy and support our business model.
A major focus in the past year was ensuring compliance with the King IV Report on Corporate Governance for South Africa, 2016 (King IV). Its recommendations on corporate governance are more focused and practical with greater emphasis on the outputs and outcomes of governance structures. A gap analysis between King III and King IV was undertaken in the beginning of 2017 and certain new recommendations were identified. These were addressed during the course of 2017 and are disclosed in the Integrated Annual Report. Sibanye-Stillwater has embraced the outcomes-based philosophy of King IV and begun the process of aligning our corporate governance structures with the principles of King IV. While this process is still underway, we have nevertheless substantially adopted the disclosure requirements recommended by King IV to the extent possible in this integrated report. We have embedded the required disclosures throughout the report, demonstrating that our governance is integrated in the business.
ETHICAL AND EFFECTIVE LEADERSHIP
ETHICS IN ACTION
Our corporate governance framework is underpinned by our policy statements on corporate governance, ethics and human rights. Together these aim to promote an organizational culture that is non-sectarian, apolitical, and socially and environmentally responsible.
Code of Ethics
Our Code of Ethics requires that Board members and employees of Sibanye-Stillwater conduct themselves ethically, honestly and fairly. This code, together with our human rights policy statement, is based on our core CARES values, providing the foundation on which the integrity of our organisational culture is built. Our code and policies are dynamic, evolving as we strive for ever higher standards.
Our Code of Ethics incorporates the following principles:
| · | | fairness and integrity in all business dealings, including the ethical handling of actual or apparent conflicts of interest between personal and professional relationships |
| · | | respect for the human rights and dignity of all |
| · | | acceptance of diverse cultures, religions, race, disability, gender and sexual orientation |
| · | | conduct of business activities in a manner that is free of bribery and corruption |
| · | | conduct of business in a safe and responsible manner and without causing harm |
| · | | honesty and accountability |
| · | | adherence to sound standards of corporate governance and applicable laws |
| · | | commitment to co-operating with relevant stakeholders to achieve public policy, laws, regulations and procedures that promote and contribute to sustainable development |
In promoting ethical behaviour, the code of ethics also addresses conflicts of interest, confidentiality, bribery, political contributions, accountability and insider trading, among others. The code of ethics is currently being updated to include the US region. Sibanye-Stillwater provides training on ethics for employees and those employees returning from leave, business partners and Board members during induction. At each Board meeting, directors declare in writing any conflict of interest. Whenever a director or the Company Secretary deals in Sibanye-Stillwater shares, these dealings are announced on the Stock Exchange News Service (SENS).
Governance and management of ethics
Ethics awareness initiative
In light of the heightened focus on ethical behaviour by companies, the increased pressure and scrutiny on the company and its employees and the continued changes in regulations such as King IV, UK Bribery Act, US Foreign Corrupt Practices Act, etc. Sibanye-Stillwater has decided to refresh and increase its efforts around ethics awareness, training and learning.
Sibanye-Stillwater has therefore engaged Ernst & Young to assist with the development and roll out of an ethics awareness programme, due to their in-depth understanding of the mining industry coupled with an ethics roadmap approach and insight that serves to address the focus on awareness and communication.
This programme is being rolled out across the entire business ranging from the miners, contractors, middle management, senior management, Board, suppliers as well as those people entering and exiting the business.
The overall objective of the programme is to ensure that all employees, contractors and suppliers are aware of, familiar with and trained on, Sibanye-Stillwater’s values, ethics, guiding principles and associated governance practices. By increasing the ethics consciousness, it will serve to contribute to embedding ethical actions, behaviours and daily practices in activities of the company and its people.
Additionally, the King IV Code on Corporate Governance specifically talks about ethical leadership and the role of the Board, as well as establishing organisational ethics as part of the programme. The Board and management will be engaged on King IV ethical considerations during the training and kept up to date on the programme. This will assist the Board and management in discharging their duties and to demonstrate their commitment to these governance principles and imperatives. Ethics training will be customised to cater for the various categories of employees, management and the Board and delivered in a tailored manner.
| |
Sibanye-Stillwater | Integrated Annual Report 2017 | 92 |
There will also be ongoing learning, training and awareness campaigns beyond the initial training to ensure that the topic of ethical behaviour is reinforced, remains top of mind and is well understood.
The Code of Ethics applies to all at Sibanye-Stillwater, with the Board being ultimately accountable. The Board, as the custodian of corporate governance, has overall responsibility for ensuring that the company’s ethics are managed effectively. Its charter, along with the Code of Ethics, requires the Board to build and sustain an ethical corporate culture, in which it is assisted by certain sub-committees. The Audit Committee is accountable for ensuring group-wide compliance with the Code of Ethics, while the Social and Ethics Committee assists in ensuring that Sibanye-Stillwater complies with best practice recommendations on social and ethical management.
Our Code of Ethics, related policies and governance structures govern our interaction with suppliers and encourage the reporting of contraventions and non-compliance with relevant legislation and regulations and include procedures to address corruption and bribery. These procedures include a toll-free line, managed by an independent third party (i.e. Deloitte; Toll free number 0800 001 987) that guarantees anonymity. This enables employees, suppliers and customers to report any irregularities and misconduct without fear of victimisation. The toll-free number is used for reporting any concerns, including non-compliance.
A total of 638 incidents (2016: 520) relating to dishonesty were reported at Sibanye-Stillwater’s SA gold operations during 2017 and led to 537 (2016: 387) employees, including contractors, being charged and disciplined in terms of our Code of Ethics.
Many of the incidents reported involved monetary theft or dishonesty and assisting illegal miners. The increase in incidents and arrests reported followed several initiatives aimed at combatting illegal mining.
At Sibanye-Stillwater’s PGM operations in South Africa, 71 such incidents were reported with 44 employees who had been implicated being prosecuted in terms of our Code of Ethics.
Our Code of Ethics is also used to guide stakeholder engagement as well as the ethical conduct of our business partners and associates. The monitoring of procurement-related conflict of interest is important. Plans are underway to ensure that all suppliers are similarly bound by our Code of Ethics and that they in turn conduct themselves as responsible corporate citizens.
Given the numerous transactions undertaken by Sibanye-Stillwater in recent years, every effort was made to ensure that no director, management official or other employee of Sibanye-Stillwater was able to benefit directly or indirectly on the basis of unpublished price- sensitive information.
In terms of the Code of Ethics, Sibanye-Stillwater does not, as a general rule, make political donations, either in cash or in kind. As a result, there were no political donations made in 2017.
RESPONSIBLE CORPORATE CITIZENSHIP
The Code of Ethics commits Sibanye-Stillwater, its Board and employees to promoting a socially and environmentally responsible culture.
In terms of its Charter, the Board, when making decisions, takes into account the impact of Sibanye-Stillwater’s operations on society and the environment, in conjunction with assessing the financial impact. The Board oversees management’s development and implementation of policies and programmes incorporating the principles of corporate responsibility.
The Board in turn ensures that the company is a responsible corporate citizen. Given the importance of the mining industry to the South African economy, and to host and labour-sending communities in particular, our corporate citizenship responsibilities are significant. Corporate citizenship underpins our corporate strategy as well as our reputation in terms of our workforce, our relationships with communities, and our environmental management and performance. The specific governance of these socio-economic areas are detailed in the relevant sections of this integrated report:
Workplace: Superior value for the workforce; Safety and health focus
Economy: Remuneration report
Social: Social upliftment and community development
Environment: Minimising our environmental impact
In line with our commitment to good corporate citizenship, Sibanye-Stillwater ensures compliance with all taxation laws and regulations in the jurisdictions in which we operate.
Sibanye-Stillwater currently has no operating subsidiaries in tax havens. It is also not Sibanye-Stillwater’s intention to start operating in tax havens in the near future.
Tax governance
Sibanye-Stillwater Group’s tax strategy is aligned to the Group’s overall strategy of “superior value creation” as an organisation. In maintaining a competitive advantage, the Group recognises the importance and necessity of implementing an effective and efficient tax risk management framework that will promote governance, address tax risk and create superior value. The Group’s Tax Strategy provides a Board approved tax governance framework through which the Group’s tax obligations and associated risk are managed, reported and monitored. The framework is based on good corporate tax citizenship and is aligned to the principles of King IV. The Group tax strategy is supported by the Group tax policy which is an operational document detailing processes and policies to ensure the effective implementation and compliance to the Group tax strategy.
The Board is ultimately accountable for tax governance and must provide oversight of how tax is managed within the organisation by managing key stakeholders’ concerns, overall tax risk and delegating authority for the management of tax. The Board is supported by the Risk and Executive Committees in discharging this obligation.
| |
Sibanye-Stillwater | Integrated Annual Report 2017 | 93 |
Overview of the tax landscape
Sibanye-Stillwater contributes directly to tax authorities and other regulators by way of taxes borne and taxes paid in the jurisdictions in which the Group operates, enabling governments to provide social infrastructure and services.
In order to effectively deal with uncertainty in the tax landscape in the jurisdictions in which the Group operates and meet objectives and stakeholder expectations, the Group follows a continuous, proactive and dynamic process to monitor both local and international tax developments and to identify, understand, manage and communicate tax risks that may impact the Group’s objectives as set out in the Enterprise Risk Management Framework (ERMF).
In monitoring all tax positions, the Group further monitors developments in the international tax landscape, and with specific reference to the Base Erosion and Profit Shifting (BEPS) programme.
The Group, in response and in adherence to the BEPS programme, and the South African Revenue Service (SARS) Country-by-Country (CbC) Reporting requirement, submitted its CbC report for the 31 December 2016 year of assessment on 28 February 2018.
The Group acknowledges that the continued focus on the extractive industry, influenced by political changes and the complexity of the operating environment, may give rise to a challenging fiscal environment.
Sibanye-Stillwater’s approach to tax
The Group, in meeting its overall objective of value creation, strives to arrange its tax affairs in an effective and efficient manner and to act in good faith by always remaining compliant with current laws in all jurisdictions in which it operates and taking into account financial and reputational risk.
The Group adopts a conservative approach to tax risk management, understanding its responsibility to pay its fair share of tax. Tax risk is considered in every commercial decision, aligned to the Group’s overall strategy that tax positions assumed should have a high prospect of success in case of a review by tax authorities.
THE GROUP’S APPROACH TO TAX GOVERNANCE IS BASED ON THE FOLLOWING KEY PRINCIPLES
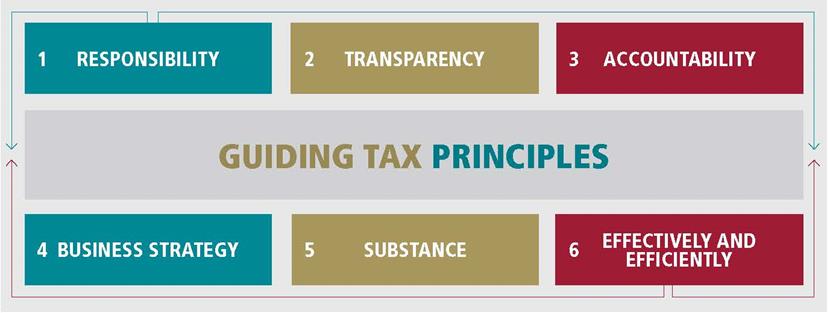
Transparency – The Group seeks to build open, transparent and constructive relationships with Tax Authorities, other regulators and other relevant stakeholders, both internally and externally and all communications are conducted in a professional, courteous and timely manner in order to minimise the risk of challenge, dispute or damage to the Group’s credibility and reputation.
| · | | Responsibility – The Group pro-actively seeks to apply professional care and judgement, taking ownership of actions and acting honestly and with integrity while aligning actions within reasonable expectation of all relevant stakeholders. |
| · | | Accountability – The Group is confident that it understands its roles and responsibilities in identifying and mitigating tax risks, enabling the Group to meet its tax obligations. |
| · | | Fairness – The Group understands its responsibility to pay its fair share of tax. |
| · | | Substance – The Group understands that all transactions must have a business purpose and commercial rationale that supports the Group’s value creation activities. |
| · | | Effectiveness and efficiency – Group Tax, as a business partner, commits to manage the tax affairs of the Group in an effective and efficient manner. |
| |
Sibanye-Stillwater | Integrated Annual Report 2017 | 94 |
VALUE CREATION AND REPORTING
The Board is committed to good governance whilst directing and managing the Group to achieve its strategic objectives. We actively integrate our stakeholder engagement, material risk and opportunity evaluation, strategy, business model and performance to create value for our shareholders and stakeholders. We commit to transparent reporting that focuses on:
| · | | reporting on our strategy and value creation process in compliance with the requirements of the exchanges on which we are listed and best practice |
| · | | providing stakeholders and the financial investment community with clear, concise, accurate and timely information on Sibanye-Stillwater’s operations and results |
| · | | reporting integrated information to shareholders on Sibanye-Stillwater’s financial and sustainable performance |
Our suite of annual reports includes this integrated report, which is our primary report, a mineral resource and reserve report, the financial report and a company financial report. All reports are reviewed and approved by the Audit Committee on behalf of the Board.
OUR BOARD, GOVERNANCE STRUCTURES AND PROCESSES
GOVERNANCE FRAMEWORK
In implementing our strategy and responding appropriately to mitigate material issues, we acknowledge that governance aspects may enable or impede our progress. The strength of our leadership team lies in its agility and ability to respond to market opportunities, such as recent geographic and product diversifications. In developing Sibanye-Stillwater’s strategy, the Board takes into account associated risks and ensures alignment with Sibanye-Stillwater’s CARES values and the overall purpose of superior value creation for all. Ultimately, the Board’s role is to protect value.
The Board ensures that the strategy is cascaded and managed through the Corporate Executive Management comprising the CEO, CFO, heads of the SA region and US region, Business Development and Organisational Effectiveness. The heads of the regions oversee that the governance framework is applied in the respective regions and report to the Corporate Executive Management. The latter reports to the Board.
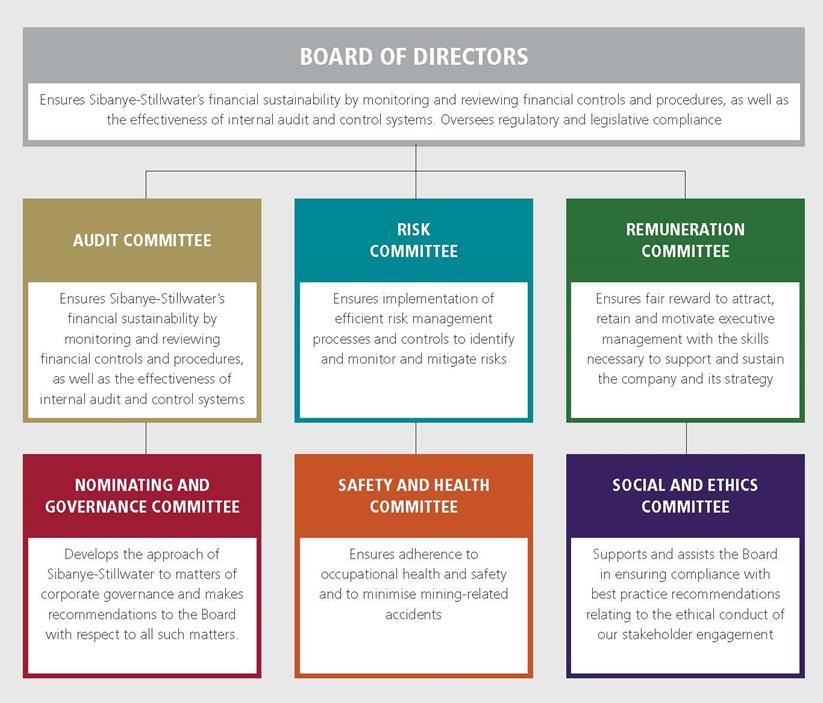
| |
Sibanye-Stillwater | Integrated Annual Report 2017 | 95 |
KEY AREAS OF BOARD DELIBERATION IN 2017
| · | | Successfully completed the acquisition of the Stillwater Mining Company, which transaction was transformative in creating a globally competitive precious metals mining company. |
| · | | Successfully completed a US$1 billion rights offer, a US$1.05 billion bond issues and issued US$450 million convertible bonds. |
| · | | Approved the proposed sale of selected assets from the WRTRP to DRDGOLD in exchange for equity in DRDGOLD. |
| · | | Placed Cooke 1, 2 and 3 on care and maintenance and converted the Ezulwini Gold Plant into a profitable surface rock dump treatment operation. The plant has the ability to form a central processing infrastructure for a larger West Rand cluster once the DRDGOLD transaction is completed. |
| · | | Approved the proposed acquisition of Lonmin which would be an all-share offer via a scheme of arrangement. This transaction aligns with Sibanye-Stillwater’s mine-to-market strategy in South Africa and adds commercially attractive smelting and refining. |
Planned areas of focus for 2018
| · | | To consolidate and strengthen Sibanye-Stillwater’s competitive position as a leading international precious metals mining company and to reduce current levels of debt to a more nominal position. |
BOARD CHARTER
Sibanye-Stillwater’s ability to deliver on its purpose, mission and strategic objectives is underpinned by the quality and expertise of its leadership. The Board provides sound, effective, ethical leadership and strategic guidance, ensuring that the principles of good governance are the foundation of all that we do and ensuring appropriate business and financial risk management is in place. In addition, given our responsibilities as a corporate citizen, the Board and the various sub-committees, oversee the provision of assistance and development support to host communities and deserving institutions.
Its charter sets out the Board’s responsibilities, authority and mandate. The Board, which has ultimate responsibility for our adherence to sound corporate governance practice, ensures that all business decisions are made from an informed, ethical position, with all reasonable care, skill and diligence, in line with our CARES values. The charter requires the Board to consider the impact of Sibanye-Stillwater’s operations and activities on broader society and the environment, in addition to its financial performance. The Board is duty bound to ensure that management develops and implements policies and programmes aligned with Sibanye-Stillwater’s role as a responsible corporate citizen. The Board charter is reviewed annually and was revised to align with King IV.
The charter requires the Board to establish and sustain an ethical corporate culture, one that is regularly assessed and monitored and reported on.
The Board which acts in the best interests of the company, in line with its charter, informs and improves the business strategy, which is aligned to the Group’s overall purpose, our value drivers and stakeholders’ legitimate interests and expectations. In reviewing the strategy, the Board also takes into account inherent risks and the need to achieve sustainable outcomes.
The Board steers strategic direction and planning, approves policy, oversees and monitors delivery on Sibanye-Stillwater’s strategy and ensures accountability.
The Board is satisfied that it has fulfilled its responsibilities in accordance with the charter.
BOARD COMPOSITION AND CHANGES DURING THE YEAR
Appointments to the Board are based on skill, expertise, and experience required to provide Sibanye-Stillwater with a sustainable, ethical strategy that takes into account the short- and long-term impacts on the economy, society and the environment as well as internal and external stakeholders.
The Sibanye-Stillwater Board, which is chaired by an independent non-executive director, currently comprises 11 directors, following the resignation during the year of three non-independent directors. Christopher Chadwick resigned effective 23 May 2017 as he was no longer a representative of Gold One Group on the Sibanye-Stillwater Board. Robert Tze-leung Chan and Jiyu Yuan, the Gold One Group representatives on the Sibanye-Stillwater Board, resigned on 18 September 2017. Their resignation followed a strategic review conducted by Gold One who confirmed that these resignations in no way affected their strategy regarding their shareholding in Sibanye-Stillwater or their continued support of the Group as its largest shareholder.
In line with our policy on gender and diversity, Savannah Danson was appointment as an additional independent director on 23 May 2017.
| |
Sibanye-Stillwater | Integrated Annual Report 2017 | 96 |
Board composition and characteristics
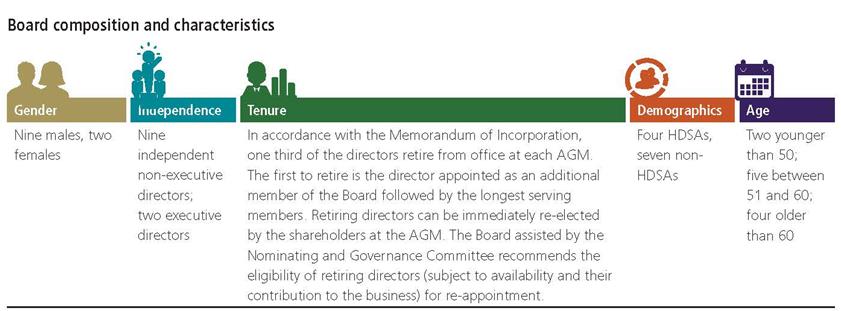
The Board has concluded that it has the appropriate mix of knowledge, skills, experience, diversity and Independence.
GENDER DIVERSITY POLICY
The Company’s policy aims to promote gender diversity at Board level. Currently, out of eleven Board members, two are women. Savannah Danson, was appointed on the Board in May 2017 as an independent non-executive director.
BOARD EFFECTIVENESS AND PERFORMANCE EVALUATIONS
During the year the Board received training from the Company Secretary on the impact and application of King IV.
In line with King IV’s recommendations, the Board conducted a rigorous evaluation of the independence of directors and an internal assessment of the effectiveness of the Board and its committees. An external consultant was also appointed to independently review the Board’s effectiveness at the beginning of 2017. The outcome of the independent assessment revealed that all the necessary structures and processes for an effective Board are established and functioning well. The Board had fulfilled its role and responsibilities and had discharged its accountability to the company and its shareholders and other stakeholders in an exemplary manner. In November 2017, the Board reviewed the composition of the Board, its attributes and succession following the expansion and diversification of the company and concluded that there was a need for an additional director with PGM experience. Accordingly, the Board mandated the CEO to search for a suitable candidate.
The Chairman is appointed annually by the Board which, with the assistance of the Nominating and Governance Committee, carried out a rigorous review of the Chairman’s performance and independence during 2017. The Board concluded that there were no factors that impaired his independence and appointed the Chair for another year. The performance of the Company Secretary was evaluated by the Board. The Board was satisfied with his competence, qualifications, experience and maintaining an arms-length relationship with the Board. In addition, all Directors have full access to the services and advice of the Group Company Secretary in all aspects of the Board’s mandate and operations of the Group, the Board is satisfied that these arrangements are effective.
In addition to the quarterly interactions through Board meetings and regular engagement with the Chairman and Board members, the CEO’s performance is formally evaluated by the Remuneration Committee and the Board on an annual basis through a combination of delivery on:
| · | | Board-approved KPIs for operational and financial performance of the company, and |
| · | | Strategic objectives that reflect progress on the Board-approved business strategy for the company as reflected on the CEO’s individual scorecard. |
Operational and financial delivery targets for the company and the CEO’s performance contract for delivery on agreed strategic imperatives are approved by the Board at the start of each annual performance cycle in the context of the Board review of the company’s strategic plan. A formal evaluation is performed at year end which includes external audit of the performance, particularly on those targets which include quantitative measures. The Board is satisfied that the CEO has provided a high level of strategic leadership to the business balancing the shorter term imperatives to deliver stakeholder value while positioning the company for longer term strategic success.
The notice period stipulated in the CEO’s employment contract related to termination is six months. Conditions on termination are depended on circumstances under which termination takes place. Refer to the Remuneration Report which contains information specifically on the change of control terms applicable to the current Executive Director incumbents.
The Board is satisfied that the evaluation process set out above improves the performance and effectiveness of the Board.
| |
Sibanye-Stillwater | Integrated Annual Report 2017 | 97 |
Board meetings
Seven Board meetings were held during 2017. This included a strategy session.
| | | | | | | | |
Member | Date appointed | Meeting 1 | Meeting 2 | Meeting 3 | Meeting 4 | Meeting 5 | Meeting 6 | Meeting 7 |
Independent non-executive directors | | | | | | | |
Sello Moloko (Chairman) | 1 January 2013 | ✔ | ✔ | ✔ | ✔ | ✔ | ✔ | ✔ |
Timothy Cumming | 21 February 2013 | ✔ | ✔ | ✔ | ✔ | ✔ | ✔ | ✔ |
Savannah Danson 1 | 23 May 2017 | ✘ | ✘ | ✘ | ✔ | ✔ | ✔ | ✔ |
Barry Davison | 21 February 2013 | ✔ | ✔ | ✔ | ✔ | ✔ | ✔ | ✔ |
Rick Menell | 1 January 2013 | ✔ | ✔ | ✔ | ✔ | ✔ | ✔ | ✔ |
Nkosemntu Nika | 21 February 2013 | ✔ | ✔ | ✔ | ✔ | ✔ | ✔ | ✔ |
Keith Rayner | 1 January 2013 | ✔ | ✔ | ✔ | ✔ | ✔ | ✔ | ✔ |
Susan van der Merwe | 21 February 2013 | ✔ | ✔ | ✔ | ✔ | ✔ | ✔ | ✔ |
Jerry Vilakazi | 1 January 2013 | ✔ | ✔ | ✔ | ✔ | ✔ | ✔ | ✔ |
Non-independent non-executive directors |
Chris Chadwick 2 | 16 May 2014 | ✔ | ✔ | ✘ | ✘ | ✘ | ✘ | ✘ |
Robert Chan 3 | 16 May 2014 | ✔ | ✔ | ✔ | ✔ | ✘ | ✘ | ✘ |
Jiyu Yuan 3 | 12 May 2015 | ✔ | ✔ | ✘ | ✔ | ✘ | ✘ | ✘ |
Executive directors | | | | | | | | |
Neal Froneman | 1 January 2013 | ✔ | ✔ | ✔ | ✔ | ✔ | ✔ | ✔ |
Charl Keyter | 1 January 2013 | ✔ | ✔ | ✔ | ✔ | ✔ | ✔ | ✔ |
| 1 | | Chadwick resigned on 23 May 2017 and therefore did not attend the last five meetings. |
| 2 | | Chan and Yuan resigned on 18 September 2017 and therefore did not attend the last three meetings. |
BOARD COMMITTEES
The Board is supported by the following committees. All committees, including the Board, fulfilled their responsibilities in accordance with their terms of reference. Below is a summary of each committee, its remit, its membership and meetings, the main areas of focus in 2017 and planned areas of focus for 2018.
AUDIT COMMITTEE
This committee monitors and reviews Sibanye-Stillwater’s accounting controls and procedures, including the effectiveness of its information systems and other systems of internal control; the effectiveness of the internal audit function; reports of both external and internal auditors; interim reports, the annual report on SEC Form 20-F, the consolidated annual financial statements; the accounting policies of Sibanye-Stillwater and any proposed revisions thereto; external audit findings and reports, and the approval thereof; and compliance with applicable legislation and requirements of regulatory authorities and Sibanye-Stillwater’s Code of Ethics.
Sibanye-Stillwater’s CFO and internal and external auditors as well as senior management attend all Audit Committee meetings and have unrestricted access to the Chairman of this committee. The Audit Committee, in turn, communicates freely with other members of the Board not serving as members of the Audit Committee. To perform its functions effectively, the Audit Committee meets at least quarterly, but more frequently if required.
In compliance with Sarbanes-Oxley Act, the Board has identified Audit Committee chair, Keith Rayner, as that committee’s financial expert. In addition, the Board believes that the members of this committee collectively possess the necessary knowledge and experience to oversee and assess the performance of Sibanye-Stillwater’s management and auditors, the quality of our disclosure controls, the preparation and evaluation of the financial statements and our financial reporting. The Board also believes that the members of the Audit Committee collectively possess an understanding of the audit committee functions necessary to diligently execute their responsibilities.
The Audit Committee oversight on the combined assurance model for the Group ensured that significant risks and material issues received the requisite assurance to ensure enhanced value to the company and optimise reliance from assurance providers. The combined assurance model adopted relies on the five levels of defence, and the reporting from the five levels of defence through to the committees of the board, assurance on the significant risks and material issues were provided. Upon consolidation of the output from the various committees, the Audit Committee formed its opinion on the reliance of internal reporting, external reporting and the effectiveness of the control environment. The Audit Committee through its mandate approves assurance activities in the Group as a result ensures adequate assurance coverage of significant risks and material issues
| |
Sibanye-Stillwater | Integrated Annual Report 2017 | 98 |
Membership of and attendance at Audit Committee meetings – 2017
| | | | | | |
Member | Meeting 1 | Meeting 2 | Meeting 3 | Meeting 4 | Meeting 5 | Meeting 6 |
Keith Rayner (Chairman) | ✔ | ✔ | ✔ | ✔ | ✔ | ✔ |
Savannah Danson 1 | ✘ | ✘ | ✘ | ✘ | ✔ | ✔ |
Rick Menell | ✔ | ✔ | ✔ | ✔ | ✔ | ✔ |
Nkosemntu Nika | ✔ | ✔ | ✔ | ✔ | ✔ | ✔ |
Susan van der Merwe | ✔ | ✔ | ✔ | ✔ | ✔ | ✔ |
1 Danson did not attend the first four meetings as she was only appointed on 20 June 2017.
Key focus areas and report back – 2017
The Audit Committee focused on and is satisfied that it has discharged its duties with regard to the following areas of key focus for the financial year ended 31 December 2017:
| · | | Ensuring that there are established appropriate financial reporting procedures in compliance with the JSE Listings Requirements and other listed jurisdictions and that those procedures are operating, resulting in compliance with all periodic financial reporting requirements during the financial year in all jurisdictions where Sibanye equity or debt securities are listed |
| · | | Being delegated responsibility to approve the issue of all Group periodic financial reports by the board, and fully discharging such responsibilities |
| · | | Ensuring correct accounting and integration of acquisitions |
| · | | Ensuring all IT issues were properly dealt with including system integration for acquisitions and that all cyber security reviews were satisfactory completed |
| · | | Examining the JSE 2017 and 2018 proactive monitoring reports and noting key accounting issues for consideration with respect to periodic financial reporting on an ongoing basis |
| · | | Engaging regularly with Internal Audit and the SOX department, and being satisfied as a result thereof that internal controls are effective and that all recording and reporting requirements are being correctly effected |
| · | | Engaging with the CFO to discuss important financial and governance issues when appropriate |
| · | | reviewing new amendments to various laws, including changes to IFRS, affecting the group and ensuring compliance with same or noting thereof |
| · | | Ensuring that a combined assurance model is applied and is effective in providing a coordinated approach to risk and assurance activities |
| · | | Reviewing the Audit Committee charter and ensuring compliance with the Companies Act, JSE Listings Requirements and King IV requirements |
| · | | Performing the External Auditor Suitability Review in accordance with the JSE Listings Requirements, consequently recommending the incumbent external audit firm and engagement partner for re-appointment to the Board, which concurred, resulting in the re- appointment resolution being included in the notice of AGM |
| · | | Performing a review of independence of the external audit firm and engagement partner in compliance with the Companies Act and being satisfied therewith |
| · | | Evaluating the CFO’s performance in compliance with the JSE Listings Requirements and being satisfied with respect thereto |
For the full Audit Committee Report, refer to the Annual Financial Report—Audit Committee Report.
FUTURE FOCUS
In 2018, the Audit Committee will be focusing on discharging its normal duties with a particular focus on reducing current debt levels. The Committee will also specifically focus on the accounting treatment for the proposed sale of selected assets from the WRTRP to DRDGOLD and the accounting treatment for the proposed acquisition of Lonmin, provided both transactions become unconditional and close during the financial year.
RISK COMMITTEE
While the entire risk management process, including related systems of internal control, is the responsibility of the Board, this committee is responsible for ensuring that management implements appropriate risk management processes and controls. Management is accountable to the Board for designing, implementing and monitoring an integrated process of risk management into the daily activities of Sibanye-Stillwater. The Board, through the Risk Committee, ensures that management implements appropriate risk management processes and controls. The committee’s responsibilities include:
| · | | Reviewing the effectiveness and efficiency of the Sibanye-Stillwater’s enterprise risk management system and being assured that material risks are identified and that appropriate risk management processes are in place, including the formulation and subsequent updating of appropriate Company policies |
| · | | Reviewing the adequacy of the Risk Committee’s charter, policy and plan |
| · | | Reviewing the parameters of the Company’s risk/reward strategy, in terms of the risk appetite and tolerance relative to reward and ensuring that risks are quantified where practicable |
| · | | Regularly receiving a register of the Company’s key risks and potential material risk exposures from management, reviewing and approving mitigations strategies, and reporting to the Board any material changes to and/or divergence from the risk profile of the Company |
| |
Sibanye-Stillwater | Integrated Annual Report 2017 | 99 |
| · | | Monitoring the implementation of operational and corporate risk management plans |
| · | | Reviewing the insurance and other risk transfer arrangements, and considering whether appropriate coverage is in place |
| · | | Reviewing the business contingency planning process within the Group and being assured that material risks are identified and that appropriate contingency plans are in place |
| · | | Conducting a formal risk assessment at least once a year, which should be continually reviewed, updated and applied. |
Membership of and attendance at Risk Committee meetings – 2017
| | | |
Member | Meeting 1 | Meeting 2 | Meeting 3 |
Rick Menell (Chairman) | ✔ | ✔ | ✔ |
Tim Cumming | ✔ | ✔ | ✔ |
Chris Chadwick 1 | ✘ | ✘ | ✘ |
Robert Chan 2 | ✔ | ✘ | ✘ |
Keith Rayner | ✔ | ✔ | ✔ |
Jiyu Yuan 2 | ✘ | ✘ | ✘ |
1 Resigned on 23 May 2017 2 Resigned on 18 September 2017 | | | |
Key focus areas and report back – 2017
The Risk Committee focused on and is satisfied that it has discharged its duties with regard to the following areas of key focus for the financial year ended 31 December 2017:
| · | | Approval of the risk management policy, risk framework, risk committee charter and the risk plan and ensuring compliance with the King IV principles and practices |
| · | | Assessing the risk of cyber intrusions, the committee concluded that the risk was low. A dedicated resource was appointed to manage cyber risk on a full time basis |
| · | | Approval of the business continuity plan, as well as the enterprise risk management and the biannual strategic risk register. The top 10 risks to the company and mitigation actions were reviewed in detail, together with the Sibanye-Stillwater’s risk tolerance and risk appetite levels |
| · | | Ensuring that the Company complied with all applicable legislative requirements |
| · | | Approval of the combined assurance model |
| · | | Ensuring adequate insurance cover for the business |
FUTURE FOCUS
In 2018 the Risk Committee will be focusing on further maturing the enterprise risk management framework for the company.
NOMINATING AND GOVERNANCE COMMITTEE
This committee is responsible for ensuring that new directors undergo an appropriate induction process; recommending to the Board the need for Board participation in continuing education programmes; identifying and recommending to the Board successors to the Chairman and CEO; developing the approach of Sibanye-Stillwater to matters of corporate governance; and making recommendations to the Board concerning such matters.
Membership of and attendance at Nominating and Governance Committee meetings
| | | |
Member | Meeting 1 | Meeting 2 | Meeting 3 |
Sello Moloko (Chairman) | ✔ | ✔ | ✔ |
Barry Davison | ✔ | ✔ | ✔ |
Rick Menell | ✔ | ✘ | ✔ |
Nkosemntu Nika | ✔ | ✔ | ✔ |
Jerry Vilakazi | ✔ | ✔ | ✔ |
Key focus areas and report back – 2017
The Nominating and Governance Committee focused on and is satisfied that it has discharged its duties with regard to the following areas of key focus for the financial year ended 31 December 2017:
| · | | Ensuring leadership development and management succession planning. The committee determined that critical roles had been identified and that the competencies required for executive positions had been finalised and incorporated into the Leadership Development Framework. Assessments to identify potential, readiness and development areas were completed for all executive vice presidents, senior vice presidents and vice presidents |
| |
Sibanye-Stillwater | Integrated Annual Report 2017 | 100 |
| · | | Having identified the need for gender diversity at Board level, Savannah Danson was appointed as an independent non-executive director in May 2017 |
| · | | Appointment of an external consultant to assess the Board and evaluate its performance. It was determined that all the necessary structures and processes for an effective Board were established and were functioning well, and that the Board had fulfilled its role and responsibilities, and discharged its accountability to the Company and its shareholders and other stakeholders, in an exemplary manner |
| · | | Review and amendment of the Nominating and Governance Committee charter and ensuring compliance with the King IV principles and practices |
| · | | Reviewed the fees paid to non-executive directors and recommended the increase to be included in the required resolution in the Notice of AGM |
| · | | Review the composition of committee members and recommend the re-election of the Audit Committee members in the required resolutions in the Notice of AGM |
FUTURE FOCUS
During 2018, the committee will be focusing on the following:
| · | | appointing an additional member to the Board with PGM experience |
| · | | rotating members on the Board committees |
| · | | engaging an external provider to benchmark non-executive directors’ fees |
REMUNERATION COMMITTEE
This committee is responsible for determining Sibanye-Stillwater’s remuneration policy and the practices needed to attract, retain and motivate high-performing executives who are demonstrably aligned with Sibanye-Stillwater’s corporate objectives and business strategy; and for ensuring that remuneration levels relative to other comparable companies are pitched at the desired level taking relative performance into account. The Remuneration Committee also reviews, on behalf of the Board, both the remuneration levels of senior executives and management share-incentive schemes and the related performance criteria and measurements. To perform these functions, the Remuneration Committee meets quarterly, or more frequently if required.
Membership of and attendance at Remuneration Committee meetings – 2017
| | | | |
Member | Meeting 1 | Meeting 2 | Meeting 3 | Meeting 4 |
Tim Cumming (Chairman) | ✔ | ✔ | ✔ | ✔ |
Savannah Danson 1 | ✘ | ✘ | ✔ | ✔ |
Barry Davison | ✔ | ✔ | ✔ | ✔ |
Sello Moloko | ✔ | ✔ | ✔ | ✔ |
Nkosemntu Nika | ✔ | ✔ | ✔ | ✔ |
Keith Rayner | ✔ | ✔ | ✔ | ✔ |
1 Danson was appointed on 23 May 2017 | | | | |
An external advisor attended one of the meetings in regard to the review of executive remuneration post the Sibanye-Stillwater regionalisation
Key focus areas and report back – 2017
The Remuneration Committee focused on and is satisfied that it has discharged its duties with regard to the following areas of key focus for the financial year ended 31 December 2017:
| · | | Submission of a resolution to shareholders at the 2017 AGM to replace the 2013 Sibanye Share Plan, which was passed by shareholders |
| · | | Review and approval of executive remuneration post the Sibanye-Stillwater regionalisation exercise |
| · | | Review and amendment of the Remuneration Committee charter and ensuring compliance with the JSE Listings Requirements and King IV principles and practices |
| · | | Market parity of executive remuneration in line with the company’s growth and transformation to an international operating footprint |
| · | | Executive remuneration philosophy and policy to cater for United States-domiciled executive management |
| · | | Short-term incentive frameworks reflecting strategic delivery imperatives across the expanded company, see —Remunerations report |
FUTURE FOCUS
In 2018, the Remuneration Committee will consider further refinement of the remuneration framework to reinforce the alignment of executive remuneration with shareholder interests. This will include specific consideration of the position to be taken around minimum shareholding requirements for executive management, which have not as yet been adopted at Sibanye-Stillwater. Furthermore, as Sibanye-Stillwater evolves as an international precious metals producer, the performance conditions applicable to conditional shares will be reviewed to ensure that it continues to reflect the delivery of superior value to shareholders.
| |
Sibanye-Stillwater | Integrated Annual Report 2017 | 101 |
SAFETY AND HEALTH COMMITTEE
This committee reviews adherence to occupational health and safety. The committee seeks to minimise mining-related accidents.
Membership of and attendance at Safety and Health Committee meetings – 2017
| | | | |
Member | Meeting 1 | Meeting 2 | Meeting 3 | Meeting 4 |
Barry Davison (Chairman) | ✔ | ✔ | ✔ | ✔ |
Chris Chadwick 1 | ✔ | ✘ | ✘ | ✘ |
Neal Froneman | ✔ | ✔ | ✔ | ✔ |
Rick Menell | ✔ | ✘ | ✔ | ✔ |
Sello Moloko | ✔ | ✔ | ✔ | ✔ |
Susan van der Merwe | ✔ | ✔ | ✔ | ✔ |
1 Chadwick resigned on 23 May 2017 | | | | |
Key focus areas and report back – 2017
The Safety and Health Committee focused on and is satisfied that it has discharged its duties with regard to the following areas of key focus for the financial year ended 31 December 2017:
| · | | Learning from fatal accidents and putting preventative processes in place to avoid any future accidents |
| · | | Introduced the theme of ‘saving lives’ and engaged with leadership at all levels in the organization, including unions and associates, to commit to ‘not looking the other way’ |
| · | | Engaged an external expert to work with operational management and internal project resources to improve the safety culture |
| · | | The revised safety strategy that was rolled out across the SA region contributed to an improvement in the main safety indicators |
| · | | Key themes of the safety strategy were zero harm and saving lives |
| · | | In the US region, several initiatives were undertaken to improve safety performance. At East Boulder, a peer-to-peer work place safety assessment was implemented to educate, communicate and create a heightened level of safety awareness. |
Future focus
The focus area in 2018 for the SA region will be the implementation of a multi-disciplinary integrated safety system. The system involves human resources, rock engineering, occupational health, hygiene and mineral resource management which will link the workplace, technology and people. The system will assist with improved compliance with standards and optimised production planning. In the US region the focus will be on the reduction of pneumatic jackleg drills at the face and replacing them with new drill handling units which were innovative, zero gravity and on which jackleg drills can be mounted, allowing the operator to perform drilling work more safely.
SOCIAL AND ETHICS COMMITTEE
This committee is responsible for discharging its statutorily imposed duties as outlined in section 72 of the Companies Act and the applicable regulations, which include monitoring Sibanye-Stillwater’s activities in relation to relevant legislation, other legal requirements and prevailing codes of best practice regarding:
| · | | Social and economic development |
| · | | Good corporate citizenship |
| · | | The environment, health and public safety and the impact on Sibanye-Stillwater’s activities, products and services |
| · | | Labour and employment legislation. |
The Social and Ethics Committee must bring any matters relating to this monitoring to the attention of the Board and report to shareholders at the AGM. The Board seeks the assistance of the Social and Ethics Committee in ensuring that Sibanye-Stillwater complies with best practice recommendations in respect of social and ethical management.
| |
Sibanye-Stillwater | Integrated Annual Report 2017 | 102 |
Membership of and attendance at Social and Ethics committee meetings – 2017
| | | | |
| | | | |
Member | Meeting 1 | Meeting 2 | Meeting 3 | Meeting 4 |
Jerry Vilakazi (Chairman) | ✔ | ✔ | ✔ | ✔ |
Robert Chan 1 | ✔ | ✔ | ✔ | ✘ |
Tim Cumming | ✔ | ✔ | ✔ | ✔ |
Barry Davison | ✔ | ✔ | ✔ | ✔ |
Rick Menell | ✔ | ✘ | ✔ | ✔ |
Sello Moloko | ✔ | ✔ | ✔ | ✔ |
Keith Rayner | ✔ | ✔ | ✔ | ✔ |
1 Chan resigned 18 September 2017 | | | | |
Key focus areas and report back – 2017
The Social and Ethics Committee focused on and is satisfied that it has discharged its duties with regard to the following areas of key focus for the financial year ended 31 December 2017:
| · | | Reviewed compliance with the United Nations Global Compact (UNGC) principles |
| · | | Reviewed compliance with the International Council on Mining and Metals (ICMM) principles |
| · | | Reviewed with Employment equity |
| · | | Reviewed progress on compliance with the Broad-Based Black Economic Empowerment Act |
| · | | Reviewed environmental management and social issues, in both the SA region and the US region |
| · | | Approved the agri-economy strategy and social labour plan agriculture projects for the SA region |
| · | | Further reviewed Sibanye-Stillwater’s compliance with the UNGC principles, human rights requirements, the International Labour Organization and contributions to employee education development |
| · | | Other matters on the agenda were compliance with the Consumer Protection Act and Sibanye-Stillwater’s continued commitment to facilitating and encouraging responsible material and product stewardship. The focus is on re-using and recycling to reduce waste disposal and incorporating supply chain aspects in so doing |
FUTURE FOCUS
The focus areas for 2018 will be continuous improvement on employment equity issues, minimal backlog in social infrastructure, and supply chain labour plan targets for the Group’s employment equity plans and joint ventures.
FUNCTIONAL GOVERNANCE
This section makes disclosure of our functional governance segments for which the Board has overall responsibility, which responsibility has largely been delegated to the various Board committees and to the executive, and should be read together with the relevant referenced reports noted in each functional segment.
RISK AND OPPORTUNITY
| |
Which committees have oversight | Where else discussed in our report |
Audit Committee | Material risks and opportunities (includes risk management) |
Risk Committee | Audit Committee chairmans’ report Risk committee report |
Our risk management framework and processes involve the systematic application of management policies, procedures and practices. It sets out the requirements for effective oversight of risks, including identifying, assessing, evaluating, mitigating risks as well as the reporting of risks. This process also includes communicating, consulting and establishing the context for risk, and for opportunity.
This risk management framework is supported by Sibanye-Stillwater’s enterprise risk management system. Operationally, internal audit works closely with the risk management team.
Risk management is a continuous, proactive and dynamic process designed to identify, understand, manage and communicate risks that may have a negative impact on Sibanye-Stillwater’s ability to achieve its business objectives.
Sibanye-Stillwater’s risk-management framework and processes, including related policies, procedures and practices, is reviewed annually by the Risk Committee, prior to approval by the Board.
The Audit Committee Chair is a member of the Risk Committee, with the Risk Committee Chair being a member of the Audit Committee. This ensures that the Audit and Risk Committees can effectively discharge their duties through obtaining all relevant information through this process.
The risk management framework is aligned with the King IV code and the ISO 31000 standards as well as complying with the Sarbanes- Oxley Act (SOX) of 2002.
| |
Sibanye-Stillwater | Integrated Annual Report 2017 | 103 |
The Board is satisfied that Sibanye-Stillwater’s governance, risk management, compliance, internal control as well as internal audit processes operated effectively for 2017. Business activities were managed within approved risk-tolerance and risk-appetite levels. Primary controls were implemented and continuous reviews undertaken to refine and improve them.
The most significant risks and opportunities identified and considered in 2017 are discussed in the section Managing our material risks of this report.
In line with its duties and responsibilities, the Board of Directors monitored, reviewed, provided feedback on and approved the components – the related framework, practices and systems –and the process of enterprise risk management. As part of its ongoing monitoring of risk management, the Board deliberated on and agreed acceptable appetite and risk tolerance levels for key performance areas. Our risk appetite refers to the amount of risk we are willing to take to achieve our strategic objectives and takes into account revenue growth, earnings sustainability, environmental impact, employee well-being, health, safety, the environment, human resources, business plan delivery, licence to operate, ethics and governance.
The effectiveness of the enterprise risk management process was audited by PwC and no adverse findings were noted.
INFORMATION AND COMMUNICATION TECHNOLOGY
| |
Which committees have oversight | Where else discussed in our report |
Audit Committee | Technological innovation and modernisation |
Risk Committee | Audit Committee chairmans’ report Material risks and opportunities |
Technological innovation is an important aspect of our drive to deliver value by improving efficiencies and productivity at our deep-level gold mining operations. The Safety and Health Committee has oversight of mining technology and innovation. For further information on what was accomplished in the past year, see Technological innovation and modernisation.
The governance and management of information and related communication technologies (ICT) have become increasingly critical, particularly given the risks associated with information security. The aim of Sibanye-Stillwater’s ICT function is to apply innovative technology to enhance operational and knowledge performance to enable continuous business improvement.
Our ICT security strategy aims to minimise risk exposure and to mitigate the risks associated with system and information breaches. Sibanye-Stillwater has in place an approved ICT charter aligned with King IV and COBIT 4, an IT governance framework and supporting toolset that bridges the gap between control requirements, technical issues and business risks, and facilitates policy development and good practice for IT control within the company.
An ICT risk governance framework and strategy incorporating organizational culture, policy and practices has been compiled with the following objectives:
| · | | To provide strategic direction and to align ICT with the strategic and operational objectives |
| · | | To oversee the delivery of and optimise the value derived from the ICT function |
| · | | To ensure that the necessary processes are in place to effectively manage ICT risks, including the assessment of potential risks |
| · | | To ensure the effective management of ICT resources while maintaining adequate capability and infrastructure to support current and expected future ICT business requirements |
| · | | To monitor ITC performance in terms of compliance and strategic ITC objectives, including the delivery of value to the business |
The King III ITC compliance schedule was updated to align with the principles of King IV. These principles include taking responsibility for governance; having an approved ICT policy in place; delegating responsibility for implementation and execution of effective technology and information management systems, and ensuring there is continuous oversight of ICT systems and processes.
Operationally, executive management, and the CFO in particular, provide high-level direction for and approve Sibanye-Stillwater’s ICT strategy. Each region has an appointed ICT manager. Oversight is provided by the Audit Committee with ultimate responsibility resting with the Board.
Cyber risk is strategic rather than operational (our mines will not stop operating should the ICT systems go down with a loss of information potentially leading to regulatory penalties and reputational harm. To help mitigate this risk and enhance ICT performance, we have made significant investments (R14 million) to upgrade and redesign our ICT domain architecture. This has included integrating SAP technology and installing dedicated protection systems.
We have identified the top ICT-related risks, together with likely impacts and plans for mitigation. These risks have implications for security, individual and corporate privacy and reputation, business continuity, outsourcing and compliance. The top three ICT risks identified are:
| · | | Cyber security threats caused by hacking and denial of service attacks, could result in the failure of our ICT systems and possible leakage of confidential business information. This could affect business continuity and thus our ability to deliver on strategic and operational objectives. Controls have been put in place to prevent and/or mitigate the consequences of a breach of our ICT systems |
| · | | Non-compliance with ICT policies and procedures. To address this risk there is focused communications on the ICT policies and procedures. An internal control framework has been established and regular monitoring of user and system compliance is undertaken to identify anomalies |
| · | | Disruptions to business continuity and/or failure to recover business information in the event of a disaster. To mitigate such an eventuality, regular and frequent back-ups are stored off-site with back-up and restore procedures in place for all critical business functions |
In 2017, major accomplishments were:
| · | | Completing the integration of the Rustenburg operations and Kroondal’s human resources and financial systems into the corporate ICT infrastructure |
| · | | Establishment of a security operations centre to deliver 24/7 ICT security, time and attendance and network monitoring to the group. This is |
| |
Sibanye-Stillwater | Integrated Annual Report 2017 | 104 |
operated in conjunction with an external security centre |
| · | | Establishment of a global call centre |
| · | | Design and construction of the new Sibanye-Stillwater domain architecture and start of user migration |
| · | | Start integration of the US region’s ICT infrastructure with that of the group. This is scheduled for completion by August 2018. The ICT infrastructure will be included initially in the domain infrastructure |
| · | | A “crown jewels” asset assessment was begun in order to determine and prioritise the information to be protected. This involved classifying the information stored and determining what is critical, where it is housed and in turn identifying key information systems. The information identified includes personal (human resource, medical and biographical) information as well as financial, pricing, intellectual, strategic and operational information |
| · | | A dedicated Protection of Personal Information (POPI) project is underway to review the storage and keeping of information and records, both electronically and hard copies. |
Quarterly vulnerability assessments and random, independent tests by internal audit demonstrated the effectiveness of our systems in detecting hacking attacks.
Plans for 2018 include implementation of the next phase of the “crown jewels” asset assessment. This will include a business impact assessment, a review of recovery procedures, and aligning security controls with information sensitivity. In addition, should the Lonmin acquisition be approved by shareholders, work will begin on the integration of that company into Sibanye-Stillwater’s ICT infrastructure.
The globalisation of Sibanye-Stillwater has led to the opportunity to implement a cloud-based ICT system, as part of the realigned strategy for a global company. Work has also begun on planning for the conversion of the corporate domain infrastructure to a cloud- based ICT system. The plan is to have transferred the US region to the cloud-based system by 2020. Cloud-based systems enable the outsourcing of data storage with safety ensured by the supplier and help to reduce the administrative burden in relation to business continuity and data recovery.
Increased user mobility and the use of mobile devices are also influencing the profile of cyber risk and will be included in forthcoming ICT planning.
REGULATORY COMPLIANCE
| |
Which committees have oversight | Where else discussed in our report |
Audit Committee | Technological innovation and modernisation |
Risk Committee | Audit Committee chairmans’ report Material risks and opportunities |
Nominating and Governance Committee | Housing and accommodation |
Safety and Health Committee | Minimising our environmental impact |
Social and Ethics Committee | Social upliftment and community development |
Through the Compliance Department, led by the Compliance Officer, for the SA region, Sibanye-Stillwater subscribes to a zero- tolerance policy with regard to non-compliance with laws, regulations, supervisory and other requirements. A Compliance Officer has also been appointed for the US region.
The Compliance Department facilitates communication and education to ensure departments are aware and informed of laws, regulations, supervisory and other requirements. The Compliance Department provides continuous monitoring and assistance regarding compliance assurance activities, using a risk-based approach.
Compliance risk comprises two elements: regulatory risk and reputational risk. Regulatory risk in this context includes the penalties that Sibanye-Stillwater and its operating entities may incur if they do not comply with all defined statutory, regulatory, supervisory and other requirements. Reputational risk is risk that Sibanye-Stillwater is exposed to, for example possible loss, resulting from damages to Sibanye-Stillwater’s reputation.
Compliance with legislation is the responsibility of functional departments. The Compliance Department assists by simplifying legislation and making management aware of changes or pending changes in legislation and regulations. The Compliance Department’s mandate is to facilitate the management of compliance risk by means of the effective distribution of the compliance methodology, and to provide advice and guidance relating to compliance issues of a strategic nature.
The drafting of a regulatory risk profile forms part of the compliance function and follows a scientific method in terms of assessing impact and deriving a defined profile.
The compliance universe, which consists of the relevant laws, regulations, supervisory and other requirements, was utilised as a point of departure in drafting the profiles. Subsequently, 262 regulatory requirements having a bearing on Sibanye-Stillwater, were identified.
In order to get to the aggregated risk exposure value of the applicable and assessed requirements, severity and probability values had to be assessed in order to determine which of the requirements resided in the medium to high risk categories.
Compliance risk profile sessions are held with business on a bi-annual basis, and are conducted with the main objective of assigning accountability and responsibility for all relevant compliance commitments, and to furnish the business with fit for purpose regulatory risk profiles, which highlight areas of improvement, based on management self-assessments. Any non-compliance can be reported through the toll free number, 0800 001 987.
There were no material or repeated regulatory penalties, sanctions or fines for contraventions of, or non-compliance with, statutory obligations in 2017. There was no new major legislation, except for developing legislation, such as:
| · | | the Protection of Personal Information Act (to safeguard personal information) |
| |
Sibanye-Stillwater | Integrated Annual Report 2017 | 105 |
| · | | Cybercrimes and Cybersecurity Bill 2017 (possible loss of information that might potentially lead to regulatory penalties and reputational harm. Controls have been put in place to prevent and/or mitigate the consequences of a breach of our ICT systems) |
| · | | New Mining Charter (subject to latest negotiations) |
| · | | Carbon Tax Bill 2017 (financial impact) |
Amendments to the JSE Listings Requirements included: the adoption of King IV; the new auditor accreditation model; the requirements for gender diversity and race diversity policies; a non-binding resolution on remuneration; an increase in the general authority to issue shares for cash; and the introduction of a non-renounceable rights offer.
REMUNERATION
Which committees have oversight | Where else discussed in our report |
Remuneration Committee | Remuneration report |
Sibanye-Stillwater’s ability to attract, motivate and retain those with the talent and skills necessary, particularly at executive and senior management levels, to enable delivery on our strategic vision in the short, medium and long term, hinges on our remuneration policy and practices. It is thus essential to motivate and reward individual, team and operational performances to enable us to deliver on our strategic objectives, with reasonably equitable remuneration underpinning our remuneration philosophy.
Detailed information on Sibanye-Stillwater’s remuneration philosophy, policies and implementation of remuneration and significant developments of the past year as well as intentions of the coming year, is available in the full remuneration report. See also the summary of the Remuneration Committee in this corporate governance section
ASSURANCE
Which committees have oversight | Where else discussed in our report |
Audit Committee | Statement of assurance |
Risk Committee | Approval and assurance |
Internal Audit
The internal audit function objectively and independently assures the operating effectiveness of the control environment. The Vice President Internal Audit is independent and reports into the Audit Committee Chair. The department predominantly utilises in house resources to perform its internal audits. A risk based internal audit plan that was linked to the combined assurance approach was used during the year. This ensured that there was adequate co-ordination of internal and external audit assurances over the strategic and material issues in the company. Reporting to the Audit Committee was done on a quarterly basis and the Vice President Internal Audit met with the Audit Committee in private on a quarterly basis.
The independence and conformance to the Institute of Internal Auditors Professional Practices Framework, Standards and Ethics was externally assessed during 2017. No adverse findings were raised and the internal audit department received a Generally Compliant rating which is the highest rating that can be bestowed on an Internal Audit function.
RELATIONSHIPS AND CORPORATE CITIZENSHIP
hief | |
Which committees have oversight | Where else discussed in our report |
Social and Ethics Committee | Stakeholder engagement |
Safety and Health Committee | Social and community upliftment Superior value for our workforce Safety and health focus Minimising our environmental impact |
For further information on Sibanye-Stillwater’s activities relating to its relationships with stakeholders and its role as a corporate citizen, see —View from the top—Managing our material risks, which includes a discussion on stakeholder engagement as well as —Performance review—Social upliftment and community development.
| |
Sibanye-Stillwater | Integrated Annual Report 2017 | 106 |
Sibanye-Stillwater’s ability to deliver on its purpose, mission and strategic objectives is underpinned by the quality and expertise of its leadership. The Board of Directors provides sound, ethical leadership and strategic guidance and ensures that the principles of good corporate governance are the foundation of all that we do.
The Board of Directors is led by an independent, non-executive chairman. There are 11 members in all, nine of whom are independent non-executive directors. Collectively, the directors have the breadth and depth of skills, knowledge and experience required to make a positive contribution to ensuring that Sibanye-Stillwater delivers on its strategic goals.
BOARD
| | |
CHAIRMAN SELLO MOLOKO (52) BSc (Hons) and Postgraduate Certificate in Education, Advanced Management Programme Appointed non-executive chairman of the Board on 1 January 2013. Chairman: Nomination and Governance Committee Member: Remuneration Committee Safety and Health Committee Social and Ethics Committee EXECUTIVE DIRECTORS NEAL FRONEMAN (58) Chief Executive Officer BSc Mech Eng (Ind Opt), BCompt, Pr Eng Appointed an executive director and CEO on 1 January 2013. Chairman: Executive Committee Member: Safety and Health Committee CHARL KEYTER (44) Chief Financial Officer BCom, MBA, ACMA and CGMA Appointed a director on 9 November 2012, and executive director and CFO on 1 January 2013. Member: Executive Committee | INDEPENDENT NON-EXECUTIVE DIRECTORS TIMOTHY CUMMING (60) BSc (Hons) (Engineering), BA (PPE), MA Appointed as a non-executive director on 21 February 2013. Chairman: Remuneration Committee Member: Risk Committee Social and Ethics Committee SAVANNAH DANSON (49) BA (Hons) Communication Science and Finance, MBA, Strategic Planning and Finance Appointed as a non-executive director on 23 May 2017. Member: Audit Committee Remuneration Committee BARRY DAVISON (72) BA (Law and Economics), Graduate Commerce Diploma, CIS Diploma in Advanced Financial Management and Advanced Executive Programme Appointed as a non-executive director on 21 February 2013. Chairman: Safety and Health Committee Member: Nominating and Governance Committee Remuneration Committee Social and Ethics Committee RICHARD MENELL (62) MA (Natural Sciences, Geology), MSc (Mineral Exploration and Management), Appointed as a non-executive director on 1 January 2013. Chairman: Risk Committee Member: Audit Committee Social and Ethics Committee Nominating and Governance Committee Safety and Health Committee | NKOSEMNTU NIKA (60) BCom, BCompt (Hons), Advanced Management Programme, CA (SA) Appointed as a non-executive director on 21 February 2013. Member: Audit Committee Nominating and Governance Committee Remuneration Committee KEITH RAYNER (61) BCom, CTA, CA (SA) Appointed as a non-executive director on 1 January 2013. Chairman: Audit Committee Member: Remuneration Committee Risk Committee Social and Ethics Committee SUSAN VAN DER MERWE (63) BA Appointed as a non-executive director on 21 February 2013. Member: Audit Committee Safety and Health Committee JERRY VILAKAZI (57) BA, MA, MBA Appointed as a non-executive director on 1 January 2013. Chairman: Social and Ethics Committee Member: Nominating and Governance Committee |
| |
Sibanye-Stillwater | Integrated Annual Report 2017 | 107 |
For detailed curriculum vitae of members of the Board, see Further Information—Directors and senior management.
TERMS OF OFFICE:
The following directors retire by rotation at the upcoming annual general meeting on 30 May 2018, and have indicated they are available for election or re-election: Savannah Danson, Richard Menell, Keith Rayner and Jerry Vilakazi.
EXECUTIVE MANAGEMENT
Sibanye-Stillwater’s executive management team and prescribed officers drive and oversee implementation of strategy. The team includes two executive directors
PRESCRIBED OFFICERS
The executive management teams, which include prescribed officers, meet regularly to discuss, plan and make decisions on the strategic and operating issues facing Sibanye-Stillwater. As at 29 March 2018, the prescribed officers were as follows:
| · | | NEAL FRONEMAN (58): Chief Executive Officer |
| · | | CHARL KEYTER (44): Chief Financial Officer |
| · | | ROBERT VAN NIEKERK (53): EVP: Head of SA region |
| · | | CHRIS BATEMAN (52): EVP: Head of US region |
| · | | HARTLEY DIKGALE (57): EVP: Head of legal and regulatory affairs (SA region) |
| · | | DAWIE MOSTERT (48): EVP: Organisational effectiveness |
| · | | THEMBA NKOSI (44): EVP: Head of human resources (SA region) |
| · | | WAYNE ROBINSON (55): EVP: Head of operations (SA region) |
| · | | RICHARD STEWART (42): EVP: Head of business development |
EVP: Executive vice president
For detailed curriculum vitae of the prescribed officers, see Further Information—Directors and senior management
In line with the revised leadership structure, the corporate Group executives are supported by two regional executive management teams. Sibanye-Stillwater’s revised leadership structure is intended to facilitate the group’s seamless transition to a global multi-commodity business.
SA REGION – EXECUTIVE
Robert van Niekerk, Head of SA region Wayne Robinson, Head of operations Hartley Dikgale, Head of legal and regulatory
Thabisile Phumo, Head of stakeholder relations Kevin Robertson, Head of business improvement Themba Nkosi, Head of human resources
Pieter Henning, Head of finance
Nash Lutchman, Head of protection services
Bheki Khumalo, Head of organisational development and communication
US REGION – EXECUTIVE
Chris Bateman, Head of US region
Ken Kluksdahl, Head of operations
Kris Koss, Head of human resources and safety
Justin Froneman, Head of finance
Heather McDowell, Head of legal, environmental and government affairs
| |
Sibanye-Stillwater | Integrated Annual Report 2017 | 108 |
Sibanye-Stillwater’s remuneration report has been structured in three parts, in line with King IV. This report comprises a background statement; an overview of the main provisions of the remuneration policy; and an implementation section containing details of remuneration awarded to individual members of the Board and Group Executive Committee members during the reporting period.
The year 2017 was noteworthy due to the transformation of Sibanye-Stillwater from a gold and platinum producer with an exclusively South African production footprint into an international precious metals operator with operations across two continents. These significant changes, and the consequent Group leadership reorganisation, resulted in a need for considerable adjustment to the associated remuneration practices. In particular, a revision of Group remuneration policies to accommodate employment across multiple jurisdictions was required.
PART 1: REPORT FROM THE CHAIRMAN OF THE REMUNERATION COMMITTEE
The company’s Remuneration Report has been structured in three parts in line with King IV, comprising a background statement; an overview of the main provisions of the main provisions of the remuneration policy; and an implementation section containing details of remuneration awarded to individual members of the Board and Group Executive Committee members during the reporting period.
The year 2017 was noteworthy due to the transformation of Sibanye-Stillwater from a gold and platinum producer with an exclusively South Africa production footprint into an international precious metals operator with operations across two continents. These significant changes, and the consequent Group leadership reorganisation, resulted in a need for considerable adjustment to the associated remuneration practices. In particular, a revision of Group remuneration policies to accommodate employment across multiple jurisdictions was required.
The terms of reference of the remuneration committee were reviewed and changed during 2017 to ensure compliance with the King IV governance framework. The previous terms of reference were already largely compliant to King IV.
The Remuneration Committee supports the Board in discharging its responsibilities for setting and administering remuneration policies in alignment with the Company’s long-term interests. The Remuneration Committee is responsible for, inter alia:
| · | | considering and recommending remuneration policies for all employment levels in the Company with a particular focus on the remuneration of Sibanye-Stillwater’s Executive Directors and the Group Executive Committee (Group EXCO). The approved remuneration policies are reported in Sibanye-Stillwater’s Integrated Annual Report in accordance with applicable rules and regulations. |
| · | | advising the Board on the remuneration policy of Sibanye-Stillwater in respect of Executive Directors and Group EXCO members and recommending the remuneration payable and conditions of employment to be offered by Sibanye-Stillwater to its Executive Directors and Group EXCO members. |
| · | | acting in accordance with the authority delegated by the Board, as recorded in its terms of reference (available at https://www. sibanyestillwater.com/about-us/corporate-governance), and is accountable to the Board. To this end the Committee must make recommendations for approval by the Board. |
Specific material matters attended to by the Remuneration Committee during 2017 pertained to addressing the effects of the transformation of Sibanye-Stillwater, and the associated implications for the company’s executive leadership. Following the acquisition of Stillwater Mining Company, the company’s organisational structure was revised to a regional structure with accountability for the delivery of safe production targets delegated to two regional Executive Committees, with central support and strategic development and delivery being the responsibility of the Group Executive Committee.
With due consideration of the significant organisational changes, the Remuneration Committee, supported by independent advice from an external consultant, PwC, reviewed the market parity of executive remuneration against an updated benchmark group of peer companies, in order to ensure appropriate remuneration of Executive Directors and Group Executive Committee members.
The Remuneration Committee is satisfied that the remuneration level and target remuneration mix for Executive Directors and Group Executive Committee members is fair, based on recommendations from an independent reputable source and is appropriately benchmarked to the markets in which Sibanye-Stillwater operates.
A revised senior management incentive plan was approved for use in future cycles effective from the 2018 cycle. While similar to previous plans and honouring the company’s remuneration philosophy and principles, the revised plan caters for alignment with remuneration norms in the United States and provides for customisation of short-term operational delivery targets to reflect the strategic imperatives across different territories and different commodities being produced. The Remuneration Committee is satisfied that remuneration paid is appropriately linked to the performance of the company through the implementation of these arrangements.
Approval was obtained from shareholders at the 2017 Annual General Meeting for the establishment of the 2017 Share Plan providing for a maximum of 40,000,000 new shares to be issued. The plan was approved with 91.9% of the voted shares in favour. The share capital approved for issue under the 2017 Share Plan represents only 1.8% of the company’s issued share capital following the successful execution of the company’s fully subscribed rights offer in June 2017, and is therefore not sustainable without the authorisation to issue shares being increased to a proposed level of 86,748,850, which is to be requested at the forthcoming Annual General Meeting.
To align with King IV, shareholders will also be afforded the opportunity to pass two separate non-binding advisory votes, one on the policy report and the other on the implementation report. In the event that either or both have been voted against by 25% or more of the voting rights exercised by shareholders, the company commits to implement measures including engagement with dissenting shareholders and publication of how the objections and concerns will be addressed. In 2017, 96.8% of shares voted were in favour of the advisory endorsement of the company’s remuneration policy.
The Remuneration Committee is tasked with ensuring appropriate remuneration to retain and reward performance of management, taking into account various internal and external factors which affect the performance. The Remuneration Committee is satisfied that Sibanye-Stillwater’s remuneration policies are fair, responsible and transparent, and promote delivery on the company’s long-term strategic objectives as well as attainment of more specific short-, medium- and long-term targets.
The drivers of incentive pay are structured to secure an effective balance between delivery of shorter term value and securing sustainability and growth in the longer term through an appropriate mix of delivery against operational and strategic targets. In addition, relative returns delivered on the stock market are a significant factor in determining incentives, in order to promote alignment with long-term investors in the company.
| |
Sibanye-Stillwater | Integrated Annual Report 2017 | 109 |
Central to both the short- and long-term reward design is a focus on responsible, sustainable outcomes while actively discouraging excessive risk taking. The overall framework promotes responsible management of the business with a measured appetite for considered strategic risk. On balance, the Remuneration Committee considers that the remuneration policies provide strong alignment between remuneration and the delivery of key performance indicators as well as consistent and sustained shareholder value over a meaningful time frame.
With the above in mind, the Remuneration Committee has been structured as an independent committee which provides appropriate review and oversight in a transparent manner with the use of independent experts as and when required. The Remuneration Committee is comprised of Independent Non-Executive Directors and retains objectivity and independence from management in its decision making.
The Remuneration Committee is satisfied that Sibanye-Stillwater has, throughout the 2017 year, complied with its Remuneration Policy and no deviations have been noted.
PART 2: REMUNERATION PHILOSOPHY, POLICY AND FRAMEWORK
Through its remuneration philosophy, Sibanye–Stillwater seeks to attract and retain key talent and ensure that the Group is viewed both by current and prospective leaders as an organisation that provides a positive performance environment, a workplace with upstanding ethics and morals and an opportunity to earn a good living. From a retention perspective, key consideration and focus are placed upon the enablement of individual growth, compelling career development and enhancement, as well as a reasonable work-life balance.
Sibanye-Stillwater’s remuneration policies and practices are market competitive to enable the attraction, retention and motivation of talented and skilled people especially at executive and senior management levels, to enable the company to deliver on its core purpose, vision and strategy. Our remuneration structures are annually benchmarked against relevant peer groups on a territory specific basis to ensure reasonable external parity and a competitive total remuneration potential.
The key principles underpinning Sibanye-Stillwater’s remuneration approach are to:
| · | | support the execution of the Group’s business strategy by providing rewards that attract, motivate and retain talent and skills necessary for Sibanye-Stillwater to deliver on its strategic vision, particularly at executive and senior management levels |
| · | | promote sustained achievement of strategic objectives and positive outcomes in the short, medium and long term |
| · | | progressively reduce excessive historical income disparities across employment levels |
| · | | facilitate the deployment of people, as necessary, across the Group’s operations |
| · | | disclose information on the company’s remuneration practice meaningfully and transparently, such that shareholders and other stakeholders are in a position to make an informed assessment of the company’s remuneration policy and implementation practice |
REMUNERATION ELEMENTS
Pay element | Description | Alignment to remuneration philosophy |
Guaranteed remuneration | Base salary and allowances including provision for medical and retirement | Market median guaranteed pay providing the foundational element of the remuneration mix |
Cash bonus (STI) | Annual incentive payment based on a combination of operational delivery and execution of approved business strategy | Performance based reward providing immediate recognition for superior performance |
Forfeitable shares (retention element of STI) | Deferred component of annual incentive with exposure to share price appreciation over a medium term time frame | Retention based on recent historical performance that incorporates alignment with delivery of value to shareholders |
Conditional shares (LTI) | Long term incentive linked to recent personal performance primarily rewarding sustained delivery of superior shareholder value | Retention with a strong performance component rewarding sustained delivery by the company of superior shareholder value over the long term |
TARGET REMUNERATION MIX
The company’s policy provides for the following remuneration mix for management for on-target performance. In line with the scope and influence of each level of management, there is a progressive increase in the weighting towards long-term incentives with an emphasis on delivery of sustained value to shareholders at the more senior levels. The value of forfeitable share awards in the target remuneration mix is the value at award date without the impact of potential share appreciation over the vesting periods. The value of the conditional shares in the target remuneration mix is determined at the expected “fair value” of the on target award that accounts for projected market movement and level of the performance condition that is expected to apply on vesting.
| |
Sibanye-Stillwater | Annual Financial Report 2017 | 110 |
Remuneration structure mix (% of total potential remuneration)
| | bonus | res | res | |
Role | Guaranteed pay | Cash bonus | Forfeitable shares | Conditional shares | Total |
Chief Executive Officer | 34.9 | 22.7 | 15.1 | 27.2 | 100.0 |
Chief Financial Officer | 36.8 | 22.1 | 14.7 | 26.5 | 100.0 |
Executive Vice President (or prescribed officer) | 39.4 | 21.7 | 14.5 | 24.4 | 100.0 |
Senior Vice President | 41.1 | 20.5 | 13.7 | 24.7 | 100.0 |
Vice President – SA-based | 46.6 | 18.6 | 12.4 | 22.4 | 100.0 |
Vice President – US-based | 54.7 | 21.9 | 14.6 | 8.8 | 100.0 |
E lower | 62.5 | 37.5 | 0.0 | 0.0 | 100.0 |
D upper | 66.7 | 33.3 | 0.0 | 0.0 | 100.0 |
D lower | 71.4 | 28.6 | 0.0 | 0.0 | 100.0 |
COMPOSITION OF TOTAL REMUNERATION PACKAGE – EXECUTIVE DIRECTORS AND SENIOR EXECUTIVES
The range of potential incentive pay per rand of guaranteed pay is illustrated below for the Executive Directors and Prescribed Officers who are considered to constitute executive management as per King IV. The “maximum on award” represents the implications of the highest possible performance rating from the previous performance cycle with fair value of the conditional shares awarded over the vesting period. Maximum potential on vesting represents maximum awards with the highest possible performance condition applied to the conditional shares at vesting although not incorporating the possible effects of share price appreciation over the vesting period.
Range of performance related pay
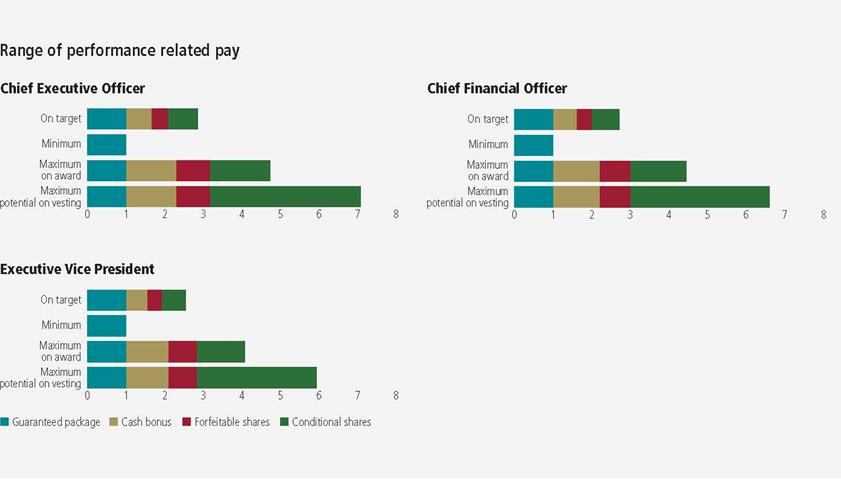
GUARANTEED REMUNERATION
The benchmark utilised for determining guaranteed remuneration by job level and discipline is a market median level obtained through independent remuneration survey databases for peer mining companies with differentiation by territory. For such purpose, the Company made use of peer group and survey data supplied by Mercer for the US region and PwC for the SA region, backed by independent advice and support from external consultants. Guaranteed remuneration levels are reviewed annually against market benchmarks to remain competitive with sustained high performance individuals warranting a target guaranteed remuneration up to and around the 75th percentile of the market.
PERFORMANCE-BASED INCENTIVES
Short- and long-term incentives are based on the achievement of specific performance targets, which include key operational and strategic indicators (KPIs). These are aligned with the Company’s strategic objectives as well as the delivery of shareholder value through linkage with shareholder returns.
| |
Sibanye-Stillwater | Annual Financial Report 2017 | 111 |
SHORT-TERM CASH BONUS
Short-term incentives are awarded following assessment of the annual performance of the operating unit or area of accountability against targets as well as the individual performance goals achieved during the year under review. Factors assessed include delivery of operational results in line with the Group’s plan as provided by the Board, as well as performance against the targets as set out in individual performance contracts. If stretch targets are achieved, the maximum cash bonus is capped at twice the on-target bonus percentage, with no bonus applicable for performance that falls below the indicated threshold levels.
The Remuneration Committee approves, at the start of each performance cycle, the key performance indicators, target performance levels and ranges that will be used to determine the quality of the company’s delivery from operations. Overall Group operational delivery is a weighted aggregate of the performance of the major operating areas of the business. The Remuneration Committee and the Audit Committee also approve respectively the individual scorecards of the CEO and the CFO that reflect strategic business imperatives for the company. In turn, the CEO develops specific individual objectives, aligned with the organisation’s strategic objectives, with those who report directly to him (executive management) at the beginning of each year. On conclusion of each cycle, the committee reviews the performance determinations of the Executive Directors and executive management as the basis of approving short-term incentive payments and long-term incentive awards.
The table below details the 2018 KPIs for the key focus areas for each major operating area within Sibanye-Stillwater.
KPI | Weight | Metric | Weight |
|
SA REGION (81% contribution to total company) |
SA gold operations (51% contribution to Southern Africa Region) |
Safety | 25% | Fatal Injury Frequency Rate per million hours | 50% |
Serious Injury Frequency Rate per million hours | 50% |
Production | 30% | Gold produced (kg) | 100% |
Costs | 30% | Operating cost per ton milled from underground (R/ton) | 100% |
Sustainability | 15% | Primary on reef development (including Burnstone) (m) | 50% |
Primary off reef development (including Burnstone) (m) | 50% |
SA PGM operations (49% contribution to Southern Africa Region) |
Safety | 25% | Number of fatal injuries | 50% |
Serious Injury Frequency Rate per million hours | 50% |
Production | 30% | Ounces produced ('000 4E oz) | 100% |
Costs | 30% | Operating cost including ORD before credits and direct costs of by product per 4E ounce produced (R/4E oz) | 100% |
Sustainability | 15% | Primary on reef development (m) | 50% |
Primary off reef development (m) | 50% |
US REGION (19% contribution to total company) |
Safety | 25% | All Injury Frequency Rate per 200,000 hours | 100% |
Production | 25% | Returnable 2E PGM produced ('000 oz) | 50% |
Tonnes milled ('000 tons) | 50% |
Costs | 25% | All In Sustaining Cost ($/2E oz) | 75% |
Recycling operations EBITDA ($ million) | 25% |
Sustainability | 25% | Linear development (including Blitz capital development) ('000 ft) | 25% |
Diamond drilling ('000 ft) | 25% |
Blitz ventilation raise completion date | 25% |
Blitz TBM/Benbow/56E combined linear development ('000 ft) | 12.5% |
Stillwater Water Treatment Project completion date | 12.5% |
| |
Sibanye-Stillwater | Annual Financial Report 2017 | 112 |
LONG-TERM INCENTIVES – CONDITIONAL SHARE AWARDS
Forfeitable Shares and Conditional Shares are awarded to Vice President and above employees providing a combination of retention and alignment with delivery of value to shareholders. Both categories of share are subject to the conditions in the Sibanye 2017 Share Plan, the salient features of which were set out in the notice of Sibanye-Stillwater’s Annual General Meeting of 2017.
The face value of the Forfeitable Share award is two-thirds of the annual cash incentive and is allocated in the form of restricted forfeitable shares. The Forfeitable Shares vest in two equal tranches at nine months and eighteen months from the award date.
The value of Conditional Shares awarded to an employee is based on the employee’s annual guaranteed remuneration and grade combined with a factor related to their assessed performance for the relevant period. The award represents the maximum number of shares that may vest at the scheduled vesting on the third anniversary of the award date dependent on the extent to which the performance conditions have been met - which are designed to be aligned to shareholders’ interests.
The awards of both Forfeitable and Conditional Shares are forfeited in the event of resignation or termination for cause, with a pro-rata vesting applicable in the case of no-fault separations.
Based on concerns that had been expressed by investors relating to the performance conditions previously applicable to the vesting of Conditional Shares, these were substantially amended with effect from the March 2016 awards of Conditional Shares. The proportion of shares awarded that vest now depends on the extent to which Sibanye-Stillwater has performed over the intervening three year period relative to two performance criteria – total shareholder return and return on capital employed. These are widely accepted measures that reflect the extent to which shareholder interests are being met. The vesting percentage ranges from 0% to 100% of the shares awarded.
At the last Annual General Meeting in May 2017, 96.8% of shares voted were in favour of the Company’s remuneration practices, which is reflective of general satisfaction with the updated performance conditions.
Total shareholder return – applicable to 70% of the Conditional Shares awarded
Total shareholder return (TSR), which is a composite measure of share price appreciation and dividends paid to shareholders, is widely recognised as one of the most appropriate indicators of shareholder value delivery. It is used extensively internationally and increasingly in South Africa, sometimes as a single metric and often as one of two or three weighted performance metrics. In a few cases an absolute target is set, but most often it is targeted in relation to a peer or comparator group of “like” companies.
TSR is measured against an appropriate peer group of eight mining and resource companies that might provide alternative investment options to Sibanye-Stillwater’s shareholders. The eight peer comparator companies for TSR comprise similar market capitalisation companies that occupy similar strategic positioning to Sibanye-Stillwater as value driven multi-commodity resources companies listed on the JSE with a primary focus on precious metals, as set out below:
Peer companies for TSR comparison
African Rainbow Minerals Limited
Anglo American Platinum Limited
AngloGold Ashanti Limited Exxaro
Resources Limited
Gold Fields Limited
Harmony Gold Mining Company
Limited Impala Platinum Holdings
Limited Northam Platinum Limited
The performance condition is determined based on the cumulative curve of the peer company TSRs over the vesting period that assigns each peer company a weighting in accordance with its market capitalisation. The percentile at which Sibanye-Stillwater’s TSR falls on this curve is determined. Based on this percentile, the percentage of awarded shares that will vest is determined using the table below, with linear interpolation between the levels quoted
| |
Sibanye-Stillwater | Annual Financial Report 2017 | 113 |
Vesting percentage relationship to relative TSR performance
| |
Percentile on peer group TSR curve | % vesting |
0% | 0 |
10% | 0 |
20% | 0 |
30% | 5 |
40% | 20 |
50% | 35 |
60% | 55 |
70% | 75 |
80% | 90 |
90% | 100 |
100% | 100 |
Return on capital employed – applicable to 30% of the Conditional Shares awarded
Return on capital employed (ROCE) is a metric that measures how effectively a company generates profits from its capital employed. There is an increased focus on measuring the returns earned by businesses on the capital investment deployed over and above the steady low risk returns typically available on financial markets. For Sibanye-Stillwater, ROCE is evaluated against the cost of capital (Ke), which includes an equity risk premium over the risk free rate. A minimum threshold on the performance scale for ROCE is set as equalling the cost of capital, Ke, which would lead to 0% for the ROCE performance condition. Delivering a return that exceeds Ke by 6% or more would be regarded as a superior return representing the maximum 100% on the performance scale and full vesting in respect of the ROCE element. The performance curve governing vesting is linear between these limits as follows:
Vesting percentage relative to ROCE outcomes
| |
ROCE element of performance condition (30%) Annual ROCE | % vesting |
≤Ke | 0 |
Ke + 1% | 16.7 |
Ke + 2% | 33.3 |
Ke + 3% | 50.0 |
Ke + 4% | 66.7 |
Ke + 5% | 83.3 |
Ke + 6% | 100 |
ESG over-ride
Should the board determine that there is evidence of material and significant environmental, social and governance (ESG) malpractice during the vesting period for Conditional Shares, up to 20% of the Conditional Shares that would otherwise vest may be forfeited. No ESG over-ride was warranted in the case of the early pro-rata vestings that have already taken place in respect of no fault separations by participants.
As indicated, the performance criteria described above govern vesting of all awards effective from March 2016, with the first scheduled vesting under these performance criteria taking place in March 2019. Should any further adjustment be made they will govern future awards, but will not be applied retrospectively.
NON-EXECUTIVE DIRECTOR FEES
In terms of Sibanye-Stillwater’s Memorandum of Incorporation, the fees for the services of Non-Executive Directors are determined by the Company’s shareholders at a general meeting. Updated Non-Executive Director fees were set effective from 1 June 2017 at the 2017 Annual General Meeting with 99.5% of the shares voted cast in favour of the updated schedule of fees. The revised fees, which are detailed overleaf and are paid monthly, represented a 6.6% inflationary increase, which was in line with changes in the South African CPI over the previous year, although the nominal increases were at a higher level to accommodate the implications of changes in VAT legislation.
| |
Sibanye-Stillwater | Annual Financial Report 2017 | 114 |
| | |
| 2016
Annual fees
(without provision for
VAT liabilities) | 2017
Annual fees
(including provision for
VAT liabilities) |
Chairman of the Board | R1,653,750 | R2,009,703 |
Chairman of the Audit Committee | R316,418 | R384,524 |
Chairmen of the Nominating and Governance Committee, Risk Committee, Remuneration Committee, Social and Ethics Committee and Safety, Health and Sustainable Development Committee (excluding the Chairman of the Board) | R195,143 | R237,146 |
Members of the Board (excluding the Chairman of the Board) | R874,283 | R1,062,464 |
Members of the Audit Committee (excluding the Chairman of the Board) | R164,273 | R199,631 |
Members of the Nominating and Governance Committee, Risk Committee, Remuneration Committee, Social and Ethics Committee, and Safety and Health Committee (excluding the Chairman of the Board) | R123,480 | R150,058 |
EXECUTIVE DIRECTORS’ CONTRACTS OF EMPLOYMENT
The employment of an executive director will continue until terminated upon (i) 24 or 12 months’ notice by either party for the CEO and CFO, respectively, or (ii) retirement of the relevant executive director (currently provided for at age 65 in the contract). Sibanye-Stillwater can also terminate the executive director’s employment summarily for any reason recognised by law as justifying summary termination.
Except for the two current executive directors, none of the prescribed officers have entered into employment contracts that provide for any compensation for severance because of “change of control”.
The service agreements of the two current executive directors contain “change of control” conditions, which are set out for information below. These contracts and conditions will be honoured until they terminate. However, any future appointments of executive directors will be made without provision for any compensation for severance because of “change of control”.
The employment contracts for the two current executive directors provide that, in the event of the relevant executive director’s employment being terminated solely as a result of a “change of control” as defined below, within 12 months of the “change of control”, the executive director is entitled to:
| · | | payment of an amount equal to twice his gross remuneration package, or two and a half times in the case of the CEO |
| · | | payment of an amount equal to the average of the incentive bonuses paid to the executive director during the previous two completed financial years |
| · | | any other payments and/or benefits due under the contracts |
| · | | payment of any annual incentive bonus he has earned during the financial year notwithstanding that the financial year is incomplete |
| · | | an entitlement to awards, in terms of the Sibanye Gold Limited Incentive Scheme, shall accelerate on the date of termination of employment and settle with the full number of shares previously awarded. The employment contracts further provide that these payments cover any compensation or damages the executive director may have under any applicable employment legislation |
A “change of control” for the above is defined as the acquisition by a third party or concerned parties of 30% or more of Sibanye ordinary shares. In the event of the consummation of an acquisition, merger, consolidation, scheme of arrangement or other reorganisation, whether or not there is a change of control, if the executive director’s services are terminated, the “change of control” provisions summarised above also apply
| |
Sibanye-Stillwater | Annual Financial Report 2017 | 115 |
PART 3: IMPLEMENTATION OF SIBANYE-STILLWATER’S REMUNERATION POLICY – 2017
For the year ended 31 December 2017, the Group performance used for determining short-term incentives was determined using the following matrix for operational delivery from Sibanye-Stillwater’s major operating areas, with the rating based on where actual performance fell between the threshold, on target and maximum levels
KPI | Weight-ing | Parameter | Sub-weight | Thres-hold | On Tar-get | Maxi-mum | Ach-ieved | Rat-ing |
0% | 100% | 200% |
SA Region (85% contribution to company) |
SA gold operations (63% contribution to SA region) |
Safety | 15% | FIFR (per million hours) | 50% | 0.108 | 0.097 | 0.092 | 0.086 | 200.0 |
SIFR (per million hours) | 50% | 4.42 | 3.98 | 3.76 | 4.12 | 67.9 |
Volume | 15% | Primary on-reef development (m) | 25% | 11,127 | 13,090 | 13,745 | 9,994 | 0.0 |
Primary off-reef development (m) | 25% | 34,110 | 40,130 | 42,136 | 38,274 | 69.2 |
Area mined (000 m2) | 50% | 1,033 | 1,216 | 1,276 | 1,118 | 46.7 |
Cost | 20% | Operating cost per underground tonne milled (R/tonne) | 100% | 2,071 | 1,801 | 1,711 | 2,112 | 0.0 |
Quality | 20% | Gold produced (kg) | 100% | 39,178 | 46,092 | 48,397 | 43,633 | 64.4 |
Overall SA gold operations | 55.8 |
SA PGM operations (37% contribution to SA region) |
Safety | 15% | FIFR (per million man hours) | 50% | 0.11 | 0.099 | 0.094 | 0.036 | 200.0 |
SIFR (per million man hours) | 50% | 3.04 | 2.74 | 2.58 | 2.59 | 197.4 |
Volume | 15% | Primary on-reef development (m) | 25% | 15,853 | 18,651 | 19,584 | 19,504 | 191.5 |
Primary off-reef development (m) | 25% | 10,247 | 12,055 | 12,658 | 15,602 | 200.0 |
Area mined (000 m2) | 50% | 1,796 | 2,113 | 2,219 | 2,211 | 192.9 |
Cost | 20% | Operating cost per 4E oz (R/oz) | 100% | 13,162 | 11,445 | 10,873 | 10,755 | 200.0 |
Quality | 20% | 4E production ('000 oz) | 100% | 1,035 | 1,217 | 1,278 | 1,313 | 200.0 |
Overall SA PGM operations | 198.5 |
Overall SA Region | 108.6 |
United States Region (15% contribution to company) |
Safety | 15% | All injury frequency rate (with contractors per 200 000 man hours) | 75% | 2.47 | 2.29 | 2.23 | 2.61 | 0. |
Number of MSHA significant and substantial citations per month | 25% | 4.22 | 3.67 | 3.48 | 4 | 40.0 |
Volume | 15% | Total development (excl Blitz) (ft) | 50% | 34,779 | 40,916 | 42,962 | 38,883 | 66.9 |
Decline and drive capital development (Benbow, TBM and 56E) at Blitz (ft) | 25% | 6,157 | 7,243 | 7,605 | 4,681 | 0.0 |
Month of first production ounces from Blitz | 25% | Dec | Nov | Oct | Sept | 200.0 |
Cost | 20% | All-in sustaining cost per mined ounces (excl recycling credits) ($/2Eoz) | 75% | 736 | 640 | 608 | 651 | 88.5 |
Met complex costs, $/ton of concentrate+catalyst fed | 25% | 1,191 | 1,036 | 984 | 985 | 198.5 |
Quality | 20% | 2E mine production (concentrator output shipped to refinery) ('000 oz) | 75% | 327.3 | 385 | 404.3 | 376.4 | 85.0 |
Recycling throughput (US ton/day) | 25% | 20.4 | 24 | 25.2 | 26.7 | 200.0 |
Overall US region | 85.7 |
Overall Sibanye-Stillwater | 105.2 |
The percentage achieved for each metric is based on the actual result compared with the set targets. If the target is achieved, a rating of 100% is assigned. At worse than threshold, the rating is 0%, up to a maximum rating of 200% at better than maximum. At actual performance between the defined levels, the bonus is proportionally calculated on a linear scale
EXECUTIVE DIRECTORS AND PRESCRIBED OFFICERS’ REMUNERATION
In the current cycle, certain changes have been made to the reporting practice for executive remuneration in the interests of improved clarity and transparency and to align with the expected protocols under King IV. Two perspectives are provided, the first being a Single Total Figure of Remuneration that reflects earnings attributable to the performance delivered during the relevant cycle, and the second being earnings received by each incumbent during the cycle.
In previous remuneration reports, only the short-term cash incentive was reported on an accrued basis with forfeitable and conditional shares reported in the year that they vested to the participant. In the current report, both the short-term cash incentive and forfeitable share awards, which are in proportion to the cash incentive with deferred vesting, are reported on an accrued basis in the Single Total Figure of Remuneration. Conditional shares continue to be reported on vesting. To determine cash earnings in the cycle, the accruals are removed with accruals from previous cycles being added back in. Market movements on equity settled instruments are superimposed. This has required the restatement of executive remuneration for the 2016 cycle for comparison purposes
| |
Sibanye-Stillwater | Annual Financial Report 2017 | 116 |
Remuneration paid to Sibanye-Stillwater Executive Directors and Prescribed Officers for the year ended 31 December 2017
| | | | | | | | | | | | | |
2017 (R000) |
| Salary | Pension scheme
total contribution | Cash bonus accrued | Accrual of Forfeitable
Share award | Special cash bonus accrued | Conditional Share proceeds | Other benefits | Termination/separation benefits | Total single figured of
remuneration | Less Amounts accrued of
remuneration | Plus Amount of previous
accruals settled in 2017 | Adjustments for market
movements on accruals settled | Total cash remuneration |
Executive directors | | | | | | | | | | | | | |
Neal Froneman | 10,265 | 1,103 | 9,418 | 6,278 | 5,741 | 22,775 | 174 | - | 55,754 | -21,437 | 7,460 | -1,809 | 39,968 |
| 5,501 | 758 | 4,614 | 3,076 | 3,16 | 7,834 | 35 | - | 24,978 | -10,85 | 3,753 | -919 | 16,962 |
Prescribed officers | | | | | | | | | | | | | |
Hartley Dikgale | 3,749 | 258 | 2,291 | 1,528 | - | 4,455 | - | - | 12,281 | -3,819 | 2,130 | -480 | 10,112 |
Dawie Mostert | 3,634 | 496 | 2,578 | 1,718 | - | 4,495 | - | - | 12,921 | -4,296 | 2,242 | -521 | 10,346 |
Themba Nkosi | 3,509 | 276 | 2,372 | 1,582 | - | - | - | - | 7,739 | -3,954 | 1,636 | -180 | 5,241 |
Wayne Robinson | 4,287 | 348 | 2,328 | 1,552 | - | 1,295 | - | - | 9,81 | -3,88 | 2,474 | -602 | 7,802 |
Richard Stewart | 3,731 | 414 | 2,829 | 1,896 | 2,096 | 1,045 | - | - | 12,001 | -6,811 | 2,360 | -551 | 6,999 |
Robert van Niekerk | 4,517 | 489 | 4,492 | 2,995 | - | 6,540 | - | - | 19,033 | -7,487 | 2,875 | -686 | 13,735 |
John Wallington 1 | 1,772 | 313 | 1,309 | 872 | - | - | - | - | 4,266 | -2,181 | 1,264 | - | 3,349 |
Chris Bateman 2 | 4,023 | 148 | 2,628 | 1,743 | - | - | 483 | - | 9,025 | -4,372 | - | - | 4,653 |
Total | 44,988 | 4,603 | 34,859 | 23,230 | 10,997 | 48,439 | 692 | - | 167,808 | -69,087 | 26,194 | -5,748 | 119,167 |
| 1 | | Ceased being a Prescribed Officer on 30 June 2017 |
| 2 | | Became a Prescribed Officer on 1 July 2017. Remuneration paid in US dollars was converted at the average exchange rate of R13.41/US$ for the six-month period ending 31 December 2017 |
The corresponding information for the period ended 31 December 2016 is presented below:
| |
Sibanye-Stillwater | Annual Financial Report 2017 | 117 |
| | | | | | | | | | | | |
2016 (R000) |
| Salary | Pension scheme
total contribution | Cash bonus accrued | Accrual of Forfeitable
Share award | Conditional Share proceeds | Other benefits | Termination/separation benefits | Total single figured of
remuneration | Less Amounts accrued of
remuneration | Plus Amount of previous
accruals settled in 2017 | Adjustments for market
movements on accruals settled | Total cash remuneration |
Executive directors | | | | | | | | | | | | |
Neal Froneman | 7,769 | 863 | 4,180 | 2,787 | 91,138 | 135 | – | 106,872 | -6,967 | 9,257 | -1,377 | 107,785 |
Charl Keyter | 4,234 | 605 | 2,090 | 1,394 | 18,052 | 91 | – | 26,466 | -3,484 | 4,638 | -687 | 26,933 |
Prescribed officers | | | | | | | | | | | | |
Hartley Dikgale | 2,802 | 187 | 1,245 | 830 | 6,094 | – | - | 11,158 | -2,075 | 2,31 | -344 | 11,049 |
Dawie Mostert | 2,87 | 361 | 1,288 | 859 | 6,336 | – | - | 11,714 | -2,147 | 2,578 | -392 | 11,753 |
Jean Nel 3 | 3,46 | – | 1,622 | – | – | – | - | 5,082 | -1,622 | – | – | 3,46 |
Themba Nkosi 4 | 1,549 | 175 | 1,227 | 818 | – | – | - | 3,769 | -2,045 | – | – | 1,724 |
Wayne Robinson | 3,679 | 298 | 1,365 | 910 | – | – | - | 6,252 | -2,275 | 3,111 | -463 | 6,625 |
Richard Stewart | 3,033 | 337 | 1,352 | 902 | – | – | - | 5,624 | -2,254 | 2,646 | -391 | 5625 |
Robert van Niekerk | 3,8 | 422 | 1,626 | 1,084 | 15,085 | – | - | 22,017 | -2,71 | 3,478 | -518 | 22,267 |
John Wallington 5 | 3,117 | 550 | 1,264 | 842 | – | – | - | 5,773 | -2,106 | – | – | 3,667 |
Total | 36,313 | 3,798 | 17,259 | 10,426 | 136,705 | 226 | - | 204,727 | -27,685 | 28,018 | -4,172 | 200,888 |
| 1 | | Became a prescribed officer on 13 April 2016 and ceased being a prescribed officer on 1 November 2016 |
| 2 | | Became a Prescribed Officer on 4 July 2016 |
| 3 | | Became a Prescribed Officer on 1 February 2016 |
EXECUTIVE DIRECTORS AND PRESCRIBED OFFICERS’ EQUITY-SETTLED INSTRUMENTS
The Executive Directors and Prescribed Officers of Sibanye-Stillwater held the following equity-settled instruments, in the form of Conditional and Forfeitable Shares, through the Sibanye 2013 and 2017 Share Plans as at 31 December 2017. These holdings do not reflect any shareholdings held by them in a private capacity.
The equity-settled instruments exercised by executive managers during 2017 comprised the eighteen month vesting tranche of forfeitable shares awarded on 1 March 2016, the nine month vesting tranche of Forfeitable shares awarded on 1 March 2017 and the three year vesting of Conditional shares awarded on 3 March 2014.
The performance condition applicable to the vesting of the Conditional Shares was determined through consideration of Sibanye-Stillwater’s ranking among a peer group comprising Harmony and Pan African based on average daily share price appreciation over the vesting period. That performance condition remained applicable to the March 2014 awards despite it being replaced with effect from the March 2016 awards with a more robust performance condition that reflected Sibanye-Stillwater’s revised market positioning and better addressed emerging shareholder expectations. Sibanye-Stillwater’s performance was the best among the peers with an average daily share price appreciation of 0.082% compared to Harmony with 0.067% and Pan African with 0.050%. As a result, the approved arrangement for performance on the Conditional Shares that vested in March 2017 resulted in an additional performance award equal to the original award.
Certain capitalisation events during the course of 2017 triggered additional awards to participants on shares that remained unvested when those events took place. In accordance with the rules of the relevant share plans, the additional awards maintain the value to the participant of unvested awards. The rights issue of May 2017 resulted in supplementary awards on 23 May 2017 only in respect of unvested awards of conditional shares. Since the participants holding unvested forfeitable shares already hold the right to exercise the rights associated with those shares in the event of a rights offer, the share plan rules do not provide for additional awards on unvested forfeitable shares under these circumstances. The capitalisation issue of October 2017 resulted in capitalisation awards on 6 October 2017 in respect of all unvested awards of both forfeitable and conditional shares. All of the additional awards were made on the identical terms to the corresponding primary award, including the scheduled vesting date and, in the case of conditional shares, the performance period and the performance condition applicable on vesting. The supplementary and capitalisation awards are reflected against the corresponding primary award.
In line with the updated disclosure of equity settled instruments, both the face value and fair value of share awards is presented. The “face value at award date” represents the value of the full number of awarded shares determined at the ruling market price at the time of the award. The “fair value at award date” moderates this value by taking into account the projected market movement of the share price over the vesting period and, in the case of conditional shares, the level of the performance condition that would be expected to arise at the end of the vesting period. This value is determined through application of an actuarial model based on market conditions at the award date. The “fair value at 31 December 2017” is the result of performing the equivalent calculation updated to take into account market conditions at 31 December 2017.
| |
Sibanye-Stillwater | Annual Financial Report 2017 | 118 |
The fair value of the primary award at the award date was unaffected by any of the performance, supplementary and capitalisation awards as the performance condition on vesting is taken into account in the determination of fair value and both the supplementary and capitalisation awards are set at a level that preserves the value of the original award.
| | | | | | | | | | | |
| Award date | Award price | Vesting | Equity settled instruments
at 31 December 2016 | Number of shares awarded during
2017 inclusive of performance,
supplementary and capitalisation
awards | Equity settled instruments
forfeited during 2017 | Equity-settled instruments
exercised during 2017 | Equity settled instruments at 31
December 2017 | Face value at award date (R000) | Fair value at award date (R000) | Fair value at 31 December 2017
(R000) |
EXECUTIVE DIRECTORS | | | | | | | | | | |
Neal Froneman | Conditional Share Awards | | | | | | | | |
| 3 March 2014 | R0.00 | 3 March 2017 | 453,142 | 453,142 | - | 906,284 | - | 9,851 | 17,496 | - |
| 2 March 2015 | R0.00 | 2 March 2018 | 346,961 | 190,154 | - | - | 537,115 | 10,400 | 12,983 | 7,144 |
| 1 March 2016 | R0.00 | 1 March 2019 | 587,89 | 322,196 | - | - | 910,086 | 33,166 | 12,54 | 4,914 |
| 1 March 2017 | R0.00 | 1 March 2020 | – | 2,011,752 | - | - | 2,011,752 | 35,716 | 31,28 | 20,359 |
| Forfeitable Share Awards | | | | | | | | |
| 1 March 2016 | R0.00 | 1 September 2017 | 33,441 | – | - | 33,441 | – | 1,887 | 1,886 | – |
| 1 March 2016 | R0.00 | 1 December 2017 | – | 51,715 | - | 51,715 | – | 1,393 | 1,285 | – |
| 1 March 2016 | R0.00 | 1 September 2018 | – | 51,716 | – | – | 51,716 | 1,393 | 1,248 | 816 |
Total | | | | 1,421,434 | 3,080,675 | - | 991,44 | 3,510,669 | 93,806 | 78,717 | 33,233 |
Charl Keyter | Conditional Share Awards | | | | | | | | |
| 3 March 2014 | R0.00 | 3 March 2017 | 155,86 | 155,86 | – | 311,72 | – | 3,388 | 6,018 | – |
| 2 March 2015 | R0.00 | 2 March 2018 | 158,253 | 86,732 | – | – | 244,985 | 4,744 | 5,922 | 3,258 |
| 1 March 2016 | R0.00 | 1 March 2019 | 267,135 | 146,405 | – | – | 413,540 | 15,070 | 5,698 | 2,233 |
| 1 March 2017 | R0.00 | 1 March 2020 | – | 1,019,482 | – | – | 1,019,482 | 18,099 | 15,851 | 10,317 |
| Forfeitable Share Award |
| 1 March 2016 | R0.00 | 1 September 2017 | 17,112 | – | – | 17,112 | – | 965 | 965 | – |
| 1 March 2017 | R0.00 | 1 December 2017 | – | 25,861 | – | 25,861 | – | 697 | 642 | – |
| 1 March 2017 | R0.00 | 1 September 2018 | – | 25,861 | – | – | 25,861 | 697 | 624 | 408 |
Total | | | | 598,36 | 1,460,201 | – | 354,693 | 1,703,868 | 43,661 | 35,721 | 16,217 |
| |
Sibanye-Stillwater | Annual Financial Report 2017 | 119 |
| | | | | | | | | | | |
| Award date | Award price | Vesting | Equity settled instruments
at 31 December 2016 | Number of shares awarded during
2017 inclusive of performance,
supplementary and capitalisation
awards | Equity settled instruments
forfeited during 2017 | Equity-settled instruments
exercised during 2017 | Equity settled instruments at 31
December 2017 | Face value at award date (R000) | Fair value at award date (R000) | Fair value at 31 December 2017
(R000) |
PRESCRIBED OFFICERS | | | | | | | | | | |
Hartley Dikgale | Conditional Share Awards | | | | | | | | |
| 3 March 2014 | R0.00 | 3 March 2017 | 88,304 | 88,304 | – | 176,608 | – | 1,920 | 3,409 | – |
| 2 March 2015 | R0.00 | 2 March 2018 | 67,235 | 36,849 | – | – | 104,084 | 2,015 | 2,516 | 1,384 |
| 1 March 2016 | R0.00 | 1 March 2019 | 124,373 | 68,163 | – | – | 192,536 | 7,016 | 2,653 | 1,040 |
| 1 March 2017 | R0.00 | 1 March 2020 | – | 580,521 | – | – | 580,521 | 10,306 | 9,026 | 5,875 |
| Forfeitable Share Awards | | | | | | | | |
| 1 March 2016 | R0.00 | 1 September 2017 | 8,323 | – | – | 8,323 | – | 470 | 469 | – |
| 1 March 2016 | R0.00 | 1 December 2017 | – | 15,403 | – | 15,403 | – | 415 | 383 | – |
| 1 March 2016 | R0.00 | 1 September 2018 | – | 15,404 | – | – | 15,404 | 415 | 372 | 243 |
Total | | | | 288,235 | 804,644 | – | 200,334 | 892,545 | 22,557 | 18,828 | 8,542 |
Dawie Mostert | Conditional Share Awards | | | | | | | | |
| 3 March 2014 | R0.00 | 3 March 2017 | 89,442 | 89,442 | – | 178,884 | – | 1,944 | 3,453 | – |
| 2 March 2015 | R0.00 | 2 March 2018 | 86,336 | 47,317 | – | – | 133,653 | 2,588 | 3,231 | 1,778 |
| 1 March 2016 | R0.00 | 1 March 2019 | 160,161 | 87,777 | – | – | 247,938 | 9,035 | 3,416 | 1,339 |
| 1 March 2017 | R0.00 | 1 March 2020 | – | 581,610 | – | – | 581,610 | 10,326 | 9,043 | 5,886 |
| Forfeitable Share Awards | | | | | | | | |
| 1 March 2016 | R0.00 | 1 September 2017 | 9,292 | – | – | 9,292 | – | 524 | 524 | – |
| 1 March 2017 | R0.00 | 1 December 2017 | – | 15,937 | – | 15,937 | – | 429 | 396 | – |
| 1 March 2017 | R0.00 | 1 September 2018 | – | 15,938 | – | – | 15,938 | 429 | 385 | 252 |
Total | | | | 345,231 | 838,021 | - | 204,113 | 979,139 | 25,275 | 20,448 | 9,255 |
Themba Nkosi | Conditional Share Awards | | | | | | | | |
| 1 September 2016 | R0.00 | 1 September 2019 | 67,666 | 37,085 | – | – | 104,751 | 3,850 | 1,443 | 566 |
| 1 March 2017 | R0.00 | 1 March 2020 | – | 520,136 | – | – | 520,136 | 9,234 | 10,274 | 6,069 |
| Forfeitable Share Awards | | | | | | | | |
| 1 March 2016 | R0.00 | 1 September 2017 | – | 15,183 | – | 15,183 | – | 409 | 377 | – |
| 1 March 2017 | R0.00 | 1 December 2017 | – | 15,185 | – | – | 15,185 | 409 | 367 | 240 |
Total | | | | 67,666 | 587,589 | - | 15,183 | 640,072 | 13,902 | 8,831 | 5,503 |
Wayne Robinson | Conditional Share Awards | | | | | | | | |
| 2 June 2014 | R0.00 | 2 June 2017 | 47,296 | 31,907 | – | 79,203 | – | 1,335 | 1,826 | – |
| 2 March 2015 | R0.00 | 2 March 2018 | 93,209 | 51,083 | – | – | 144,292 | 2,794 | 3,488 | 1,919 |
| 1 March 2016 | R0.00 | 1 March 2019 | 172,584 | 94,586 | – | – | 267,170 | 9,736 | 3,681 | 1,443 |
| 1 March 2017 | R0.00 | 1 March 2020 | – | 652,656 | – | – | 652,656 | 11,587 | 8,087 | 5,264 |
| Forfeitable Share Awards | | | | | | | | |
| 1 March 2016 | R0.00 | 1 September 2017 | 11,593 | – | – | 11,593 | – | 654 | 654 | – |
| 1 March 2017 | R0.00 | 1 December 2017 | – | 16,889 | – | 16,889 | – | 455 | 420 | – |
| 1 March 2017 | R0.00 | 1 September 2018 | – | 16,890 | – | – | 16,890 | 455 | 408 | 267 |
Total | | | | 324,682 | 864,011 | - | 107,685 | 1,081,008 | 27,016 | 10,274 | 6,069 |
| |
Sibanye-Stillwater | Annual Financial Report 2017 | 120 |
| | | | | | | | | | | |
| Award date | Award price | Vesting | Equity settled instruments
at 31 December 2016 | Number of shares awarded during
2017 inclusive of performance,
supplementary and capitalisation
awards | Equity settled instruments
forfeited during 2017 | Equity-settled instruments
exercised during 2017 | Equity settled instruments at 31
December 2017 | Face value at award date (R000) | Fair value at award date (R000) | Fair value at 31 December 2017
(R000) |
Richard Stewart | Conditional Share Awards | | | | | | | | |
| 2 June 2014 | R0.00 | 2 June 2017 | 39,339 | 26,540 | - | 65,879 | - | 1,110 | 1,519 | - |
| 2 March 2015 | R0.00 | 2 March 2018 | 77,884 | 45,685 | - | - | 123,569 | 2,335 | 2,914 | 1,604 |
| 3 November 2015 | R0.00 | 3 November 2018 | 188,195 | 103,141 | - | - | 291,336 | 3,113 | 7,042 | 3,875 |
| 1 March 2016 | R0.00 | 1 March 2019 | 168,881 | 92,556 | - | - | 261,437 | 9,527 | 3,602 | 1,412 |
| 1 March 2017 | R0.00 | 1 March 2020 | - | 779,114 | - | - | 779,114 | 13,832 | 12,114 | 7,885 |
| Forfeitable Share Awards | | | | | - | | | |
| 1 March 2016 | R0.00 | 1 September 2017 | 9,871 | - | - | 9,871 | - | 557 | 557 | - |
| 1 March 2017 | R0.00 | 1 December 2017 | - | 16,732 | - | 16,732 | - | 451 | 417 | - |
| 1 March 2017 | R0.00 | 1 September 2018 | - | 16,733 | - | - | 16,733 | 451 | 404 | 264 |
Total | | | | 484,170 | 1,077,501 | - | 92,482 | 1,469,189 | 31,375 | 28,568 | 15,039 |
Robert van Niekerk | Conditional Share Awards | | | | | | | | |
| 3 March 2014 | R0.00 | 3 March 2017 | 130,797 | 130,797 | - | 261,594 | - | 2,843 | 5,050 | - |
| 2 March 2015 | R0.00 | 2 March 2018 | 116,899 | 64,067 | - | - | 180,966 | 3,504 | 4,374 | 2,407 |
| 1 March 2016 | R0.00 | 1 March 2019 | 185,702 | 101,775 | - | - | 287,477 | 10,476 | 3,961 | 1,552 |
| 1 March 2017 | R0.00 | 1 March 2020 | - | 765,144 | - | - | 765,144 | 13,584 | 11,897 | 7,743 |
| 1 September 2017 | R0.00 | 1 September 2020 | - | 111,676 | - | - | 111,676 | 2,303 | 2,635 | 1,130 |
| Forfeitable Share Awards | | | | | - | | | |
| 1 March 2016 | R0.00 | 1 September 2017 | 12,522 | - | - | 12,522 | - | 706 | 706 | - |
| 1 March 2017 | R0.00 | 1 December 2017 | - | 20,119 | - | 20,119 | - | 542 | 500 | - |
| 1 March 2017 | R0.00 | 1 December 2017 | - | 20,120 | - | - | 20,120 | 542 | 486 | 317 |
Total | | | | 445,920 | 1,213,698 | - | 294,235 | 1,365,383 | FALSE | 29,609 | 13,150 |
John Wallington | Conditional Share Awards | | | | | | | | |
| 1 March 2016 | R0.00 | 1 March 2019 | 126,740 | 65,613 | - | - | - | 7,150 | 2,703 | - |
| 1 March 2017 | R0.00 | 1 March 2020 | – | 581,690 | - | – | - | 10,534 | 8,225 | - |
| Forfeitable Share Awards | | | | | - | | | |
| 1 March 2017 | R0.00 | 1 December 2017 | - | 15,328 | - | - | - | 421 | 381 | - |
| 1 March 2017 | R0.00 | 1 September 2018 | - | 15,328 | - | - | - | 421 | 370 | - |
Total | | | | 126,740 | 677,959 | - | - | - | 18,526 | 11,679 | - |
Chris Bateman | Conditional Share Awards | | | | | | | | |
| 1 September 2017 | R0.00 | 1 September 2020 | - | 413,920 | - | - | 413,920 | 8,537 | 9,768 | 4,189 |
Total | | | | - | 413,920 | - | - | 413,920 | 8,537 | 9,768 | 4,189 |
¹ Ceased being a Prescribed Officer on 30 June 2017
² Become a Prescribed Officer on 1 July 2017
| |
Sibanye-Stillwater | Annual Financial Report 2017 | 121 |
NON-EXECUTIVE DIRECTORS’ FEES
Remuneration paid to Sibanye-Stillwater non-executive directors during the year ended 31 December 2017
| | | | | |
Name | Directors’ fees | Committee fees | Expense allowance | 2017 | 2016 |
R’000 | R’000 | R’000 | R’000 | R’000 |
Chris Chadwick 1 | 345 | 97 | – | 442 | 1,099 |
Robert Chan 2 | 718 | 203 | 277 | 1,199 | 1,369 |
Tim Cumming | 908 | 459 | 61 | 1,428 | 1,337 |
Barry Davison | 908 | 587 | 60 | 1,555 | 1,411 |
Savannah Danson 3 | 544 | 201 | – | 745 | – |
Rick Menell | 908 | 681 | 21 | 1,610 | 1,602 |
Sello Moloko | 1,717 | – | 8 | 1,725 | 1,621 |
Nkosemntu Nika | 874 | 411 | – | 1,286 | 1,260 |
Keith Rayner | 908 | 637 | – | 1,544 | 1,530 |
Sue van der Merwe | 908 | 315 | – | 1,223 | 1,139 |
Jerry Vilakazi | 897 | 327 | – | 1,224 | 1,169 |
Jiyu Yuan 2 | 718 | 101 | – | 820 | 978 |
Total | 10,354 | 4,021 | 427 | 14,802 | 14,515 |
| 2 | | Resigned 18 September 2017 |
| |
Sibanye-Stillwater | Annual Financial Report 2017 | 122 |
| |
Sibanye-Stillwater | Annual Financial Report 2017 | 123 |
| | | | | | |
| | 2017 | 2016 | 2015 | 2014 | 2013 |
GROUP OPERATING STATISTICS | | | | | | |
SA GOLD OPERATIONS | | | | | | |
Production | | | | | | |
Ore milled | ’000t | 19,030 | 20,181 | 19,861 | 18,235 | 13,624 |
Gold produced | kg | 43,634 | 47,034 | 47,775 | 49,432 | 44,474 |
| ’000oz | 1,403 | 1,512 | 1,536 | 1,589 | 1,430 |
Gold sold | kg | 43,763 | 46,905 | 47,775 | 49,432 | 44,474 |
| ’000oz | 1,407 | 1,508 | 1,536 | 1,589 | 1,430 |
Price and costs | | | | | | |
Gold price | R/kg | 536,378 | 586,319 | 475,508 | 440,615 | 434,663 |
| US$/oz | 1,254 | 1,242 | 1,160 | 1,267 | 1,408 |
Operating cost1 | R/t | 937 | 862 | 825 | 785 | 879 |
| R/kg | 408,773 | 450,152 | 342,857 | 289,509 | 269,213 |
All-in sustaining cost2 | R/kg | 482,693 | 450,152 | 422,472 | 372,492 | 354,376 |
| US$/oz | 1,128 | 954 | 1,031 | 1,071 | 1,148 |
All-in sustaining cost margin3 | % | 10 | 23 | 11 | 15 | 18 |
All-in cost2 | R/kg | 501,620 | 472,585 | 430,746 | 375,854 | 354,376 |
| US$/oz | 1,173 | 1,002 | 1,051 | 1,080 | 1,148 |
All-in cost margin4 | % | 6 | 19 | 9 | 15 | 18 |
Capital expenditure | | | | | | |
Total capital expenditure | Rm | 3,410 | 3,824 | 3,345 | 3,251 | 2,902 |
SA PGM OPERATIONS | | | | | | |
Production | | | | | | |
Ore milled | ’000t | 26,196 | 11,612 | - | - | - |
Platinum produced | kg | 21,616 | 7,423 | - | - | - |
| ‘000oz | 695 | 239 | - | - | - |
Palladium produced | kg | 11,577 | 4,235 | - | - | - |
| ‘000oz | 372 | 136 | - | - | - |
4E PGM produced | kg | 37,148 | 13,087 | - | - | - |
| ‘000oz | 1,194 | 421 | - | - | - |
4E PGM sold | kg | 37,148 | 13,087 | - | - | - |
| ‘000oz | 1,194 | 421 | - | - | - |
Price and costs5 | | | | | | |
Average basket price | R/4Eoz | 12,534 | 12,209 | - | - | - |
| US$/4Eoz | 942 | 832 | - | - | - |
Operating cost1 | R/t | 467 | 373 | - | - | - |
| R/4Eoz | 10,831 | 7,993 | - | - | - |
All-in sustaining cost2,6 | R/4Eoz | 10,399 | 10,404 | - | - | - |
| US$/4Eoz | 782 | 709 | - | - | - |
All-in sustaining cost margin3,6 | % | 16 | 8 | - | - | - |
All-in cost2,6 | R/4Eoz | 10,401 | 10,404 | - | - | - |
| US$/4Eoz | 782 | 709 | - | - | - |
All-in cost margin4,6 | % | 16 | 8 | - | - | - |
Capital expenditure | | | | | | |
Total capital expenditure | Rm | 1,035 | 327 | | | |
| |
Sibanye-Stillwater | Annual Financial Report 2017 | 124 |
| | 2017 | 2016 | 2015 | 2014 | 2013 |
US PGM OPERATIONS | | | | | | |
Production | | | | | | |
Ore milled | ’000t | 855 | - | - | - | - |
Platinum produced | kg | 2,651 | - | - | - | - |
| ‘000oz | 85 | - | - | - | - |
Palladium produced | kg | 9,055 | - | - | - | - |
| ‘000oz | 291 | - | - | - | - |
2E PGM produced | kg | 11,706 | - | - | - | - |
| ‘000oz | 376 | - | - | - | - |
2E PGM sold | kg | 11,050 | - | - | - | - |
| ‘000oz | 355 | - | - | - | - |
Price and costs | | | | | | |
Average basket price | R/2Eoz | 12,330 | - | - | - | - |
| US$/2Eoz | 927 | - | - | - | - |
Operating cost1 | R/t | 3,081 | - | - | - | - |
| US$/2Eoz | 526 | - | - | - | - |
All-in sustaining cost2 | R/2Eoz | 8,707 | - | - | - | - |
| US$/2Eoz | 651 | - | - | - | - |
All-in sustaining cost margin3 | % | 29 | - | - | - | - |
All-in cost2 | R/2Eoz | 11,097 | - | - | - | - |
| US$/2Eoz | 821 | - | - | - | - |
All-in cost margin4 | % | 10 | - | - | - | - |
Capital expenditure | | | | | | |
Total capital expenditure | Rm | 1,654 | - | - | - | - |
| US$m | 124 | | | | |
1 Operating cost is the average cost of production, and operating cost per tonne is calculated by dividing the cost of sales, before amortisation and depreciation in a period by the tonnes milled in the same period and operating cost per kilogram (and ounce) is calculated by dividing the cost of sales, before amortisation and depreciation in a period by the gold or platinum group metal (PGM) produced in the same period.
2 Sibanye-Stillwater presents the financial measures “All-in sustaining cost”, “All-in cost”, “All-in sustaining cost per kilogram”, “All-in sustaining cost per ounce”, “All-in cost per kilogram” and “All-in cost per ounce”, which were introduced during the year ended 31 December 2013 by the World Gold Council (the Council). Despite not being a current member of the Council, Sibanye-Stillwater adopted the principles prescribed by the Council. The Council is a non-profit association of the world’s leading gold mining companies established in 1987 to promote the use of gold from industry, consumers and investors and is not a regulatory organisation. The Council has worked with its member companies to develop a metric that expands on International Financial Reporting Standards (IFRS) measures such as cost of goods sold and currently accepted non-IFRS measures to provide relevant information to investors, governments, local communities and other stakeholders in understanding the economics of gold mining operations related to expenditures, operating performance and the ability to generate cash flow from operations. This is especially true with reference to capital expenditure associated with developing and maintaining gold mines, which has increased significantly in recent years and is reflected in this metric.
All-in sustaining cost, All-in cost, All-in sustaining cost per kilogram, All-in sustaining cost per ounce, All-in cost per kilogram and All-in cost per ounce metrics are intended to provide additional information only, do not have any standardised meaning prescribed by IFRS and should not be considered in isolation or as alternatives to cost of sales, profit before tax, profit for the year, cash from operating activities or any other measure of financial performance presented in accordance with IFRS. All-in sustaining cost, All-in cost, All-in sustaining cost per kilogram, All-in sustaining cost per ounce, All-in cost per kilogram and All-in cost per ounce as presented in this document may not be comparable to other similarly titled measures of performance of other companies. Other companies may calculate these measures differently as a result of differences in the underlying accounting principles, policies applied and accounting frameworks such as in US GAAP. Differences may also arise related to definitional differences of sustaining versus development capital activities based upon each company’s internal policies.
Total All-in cost excludes income tax, costs associated with merger and acquisition activities, working capital, impairments, financing costs, one-time severance charges and items needed to normalise earnings.
All-in cost is made up of All-in sustaining cost, being the cost to sustain current operations, given as a sub-total in the All-in cost calculation, together with corporate and major capital expenditure growth.
For a reconciliation of cost of sales, before amortisation and depreciation to All-in cost, see –Overview–Management’s discussion and analysis of the financial statements–2017 financial performance compared with 2016 and 2015–Cost of sales–All-in cost.
3 All-in sustaining cost margin is defined as revenue minus All-in sustaining cost divided by revenue.
4 All-in cost margin is defined as revenue minus All-in cost divided by revenue.
5 The total SA PGM operations unit cost benchmarks (including capital expenditure) exclude the financial results of Mimosa, which is equity accounted, and excluded from revenue and cost of sales.
6 The comparative for 2016 have been revised retrospectively after the acquisition accounting of the Rustenburg operations was finalised in terms of IFRS 3 Business Combinations.
| |
Sibanye-Stillwater | Annual Financial Report 2017 | 125 |
| | | | | | |
| | | Revised1 | | | |
| | 2017 | 2016 | 2015 | 2014 | 2013 |
GROUP FINANCIAL STATISTICS2 | | | | | | |
INCOME STATEMENT | | | | | | |
Revenue | Rm | 45,912 | 31,241 | 22,717 | 21,781 | 19,331 |
Cost of sales, before amortisation and depreciation | Rm | 36,483 | 20,709 | 16,380 | 14,311 | 11,973 |
Amortisation and depreciation | Rm | 5,700 | 4,042 | 3,637 | 3,255 | 3,104 |
(Loss)/profit for the year | Rm | (4,433) | 3,043 | 538 | 1,507 | 1,698 |
(Loss)/profit for the year attributable to owners of Sibanye-Stillwater | Rm | (4,437) | 3,473 | 717 | 1,552 | 1,692 |
Basic earnings per share1 | cents | (229) | 225 | 47 | 106 | 133 |
Diluted earnings per share1 | cents | (229) | 225 | 47 | 105 | 131 |
Headline earnings per share1 | cents | (12) | 162 | 44 | 97 | 181 |
Dividend per share | cents | 60 | 175 | 72 | 125 | 37 |
Weighted average number of shares1 | ’000 | 1,933,850 | 1,544,650 | 1,534,955 | 1,458,853 | 1,273,538 |
Diluted weighted average number of shares1 | ’000 | 1,933,850 | 1,546,811 | 1,540,626 | 1,477,644 | 1,287,205 |
Number of shares in issue at end of period | ’000 | 2,168,721 | 929,004 | 916,140 | 898,840 | 735,079 |
STATEMENT OF FINANCIAL POSITION | | | | | | |
Property, plant and equipment | Rm | 51,445 | 27,240 | 22,132 | 22,704 | 15,151 |
Cash and cash equivalents | Rm | 2,062 | 968 | 717 | 563 | 1,492 |
Total assets | Rm | 76,072 | 41,721 | 28,266 | 27,922 | 19,995 |
Net assets | Rm | 23,998 | 16,469 | 14,985 | 14,986 | 9,423 |
Stated share capital | Rm | 34,667 | 21,735 | 21,735 | 21,735 | 17,246 |
Borrowings3 | Rm | 25,650 | 8,974 | 3,804 | 3,170 | 1,991 |
Total liabilities | Rm | 52,074 | 25,252 | 13,281 | 12,936 | 10,572 |
STATEMENT OF CASH FLOWS | | | | | | |
Cash from operating activities | Rm | 2,741 | 4,406 | 3,515 | 4,053 | 6,360 |
Cash used in investing activities | Rm | (28,144) | (9,444) | (3,340) | (4,309) | (3,072) |
Cash from/(used in) financing activities | Rm | 26,807 | 5,446 | (21) | (673) | (2,088) |
Net increase/(decrease) in cash and cash equivalents | Rm | 1,403 | 408 | 155 | (930) | 1,201 |
OTHER FINANCIAL DATA | | | | | | |
Adjusted EBITDA4 | Rm | 9,045 | 10,270 | 6,235 | 7,360 | 7,262 |
Net debt5 | Rm | 23,176 | 6,293 | 1,362 | 1,506 | 499 |
Net debt to adjusted EBITDA6 | ratio | 2.56 | 0.60 | 0.21 | 0.20 | 0.07 |
Net asset value per share | R | 11.07 | 17.73 | 16.36 | 16.67 | 12.82 |
Average exchange rate7 | R/US$ | 13.31 | 14.68 | 12.75 | 10.82 | 9.60 |
Closing exchange rate8 | R/US$ | 12.36 | 13.69 | 15.54 | 11.56 | 10.34 |
SHARE DATA | | | | | | |
Ordinary share price – high | R | 33.26 | 70.23 | 32.26 | 29.52 | 16.30 |
Ordinary share price – low | R | 14.15 | 21.98 | 13.66 | 12.34 | 6.73 |
Ordinary share price at year end | R | 15.78 | 25.39 | 22.85 | 22.55 | 12.30 |
Average daily volume of shares traded | ’000 | 9,080 | 6,165 | 3,024 | 2,869 | 4,755 |
Market capitalisation at year end | Rbn | 34.2 | 23.6 | 20.9 | 20.3 | 9.0 |
1 The comparatives for 2016 have been revised retrospectively in terms of IFRS 3 after the acquisition accounting of the Rustenburg operations was finalised, and the earnings per share and weighted average number of shares calculations for 2013 to 2016 have been adjusted retrospectively as required by IAS 33 Earnings per Share to reflect the bonus elements of the rights issue and capitalisation issues.
2 The selected historical consolidated financial data set out above have been derived from Sibanye-Stillwater’s consolidated financial statements for those periods and as of those dates which have been prepared in accordance with IFRS. Headline earnings per share is calculated in terms of the guidance issued by the South African Institute of Chartered Accountants (SAICA), see –Annual financial statements–Notes to the consolidated financial statements–note 10.3: Headline earnings per share.
3 Borrowings of R25,206 million that have recourse to Sibanye-Stillwater exclude the Burnstone Debt and include the derivative financial instrument related to the US$450 million Convertible Bond.
4 The adjusted EBITDA (earnings before interest, taxes, depreciation and amortisation) is based on the formula included in the facility agreements for compliance with the debt covenant formula. Adjusted EBITDA may not be comparable to similarly titled measures of other companies. Adjusted EBITDA is not a measure of performance under IFRS and should be considered in addition to, and not as a substitute for, other measures of financial performance and liquidity.
For a reconciliation of (loss)/profit before royalties and tax to adjusted EBITDA, see –Annual financial statements–Notes to the consolidated financial statements–note 24.10: Capital Management.
5 Net debt represents borrowings and bank overdraft less cash and cash equivalents. Borrowings are only those borrowings that have recourse to Sibanye-Stillwater, and, therefore, exclude the Burnstone Debt and include the deriative financial instument. Net debt excludes cash of Bursntone.
6 Net debt to adjusted EBITDA (ratio) is defined as net debt as at the end of a reporting period divided by adjusted EBITDA of the last 12 months ending on the same reporting date.
| |
Sibanye-Stillwater | Annual Financial Report 2017 | 126 |
7 The average exchange rate during the relevant period as reported by I-Net Bridge. The average exchange rate for the period through 23 March 2018 was R11.98/US$. The following table sets forth the high and low exchange rates for each month during the previous six months.
| | |
Month ended | High | Low |
30 September 2017 | 13.71 | 12.75 |
31 October 2017 | 14.35 | 13.24 |
30 November 2017 | 14.57 | 13.55 |
31 December 2017 | 13.81 | 12.24 |
31 January 2018 | 12.55 | 11.79 |
28 February 2018 | 12.17 | 11.51 |
Through 23 March 2018 | 12.11 | 11.67 |
8 The closing exchange rate at period end. The closing exchange on 23 March 2018, as reported by I-Net Bridge, was R11.86/US$. Fluctuations in the exchange rate between the rand and the US dollar will affect the US dollar equivalent of the price of the ordinary shares on the JSE, which may affect the market price of the American Depositary Receipts (ADRs) on the NYSE. These fluctuations will also affect the US dollar amounts received by owners of ADRs on the conversion of any dividends paid in rand on the ordinary shares.
| |
Sibanye-Stillwater | Annual Financial Report 2017 | 127 |
The following discussion and analysis should be read together with Sibanye-Stillwater’s consolidated financial statements including the notes, which appear elsewhere in this annual financial report. Certain information contained in the discussion and analysis set forth below includes forward-looking statements that involve risks and uncertainties. See Forward-looking statements for a discussion of important factors that could cause actual results to differ materially from the results described in or implied by the forward-looking statements contained in this annual financial report.
INTRODUCTION
Sibanye Gold Limited, trading as Sibanye-Stillwater (Sibanye-Stillwater or the Group), an independent, global, precious metals mining company, produces a mix of metals that includes PGMs. According to estimates based on the best information available to its management, globally, Sibanye-Stillwater, is the third largest producer of platinum and palladium, and features among the world’s top gold producing companies.
Domiciled in South Africa, Sibanye-Stillwater currently owns and operates a portfolio of high-quality operations and projects, which are grouped into two regions: the Southern Africa (SA) region and the United States (US) region, see Integrated Annual Report–Introduction–Corporate profile–Location of our operations and projects.
In our SA region, Sibanye-Stillwater mines, extracts and processes gold-bearing ore to produce a beneficiated product, doré, which is then refined further at Rand Refinery Proprietary Limited (Rand Refinery) into gold bars with a purity of at least 99.5% in accordance with the London Bullion Market Association’s standards of Good Delivery. Sibanye-Stillwater holds a 33% interest in Rand Refinery, one of the largest global refiners of gold, and the largest in Africa, which then markets and sells the refined gold on international markets to customers around the world.
At our SA PGM operations in South Africa and Zimbabwe, the primary PGMs produced are platinum, palladium and rhodium, which together with the gold occurring as a co-product, are referred to as 4E (3PGM+Au), by ratio approximately 58% platinum (Pt), 32% palladium (Pd), 8% rhodium (Rh) and 2% gold (Au). The PGM-bearing ore mined here is processed to produce PGMs in-concentrate, which is currently processed further by third parties.
The US operations primarily produce palladium and platinum (78% Pd and 22% Pt), which are referred to as 2E (or 2PGM). The PGM-bearing ore mined is processed, smelted and refined to produce a PGM-rich filter cake. A third party refines the filter cake further.
The major areas of demand for PGMs are for autocatalytic convertors and jewellery. Together, these two areas account for around 72% of platinum demand, while for palladium, autocatalytic convertors account for 80% of demand for that metal.
At our PGM operations in both regions, the minor PGMs – iridium and ruthenium – are produced as co-products. They, together with the three primary PGMs, are referred to as 6E (5PGM+Au). In addition, nickel, copper and chrome, among other minerals, are by-products at these operations.
In 2017, Sibanye-Stillwater produced 43,634kg (1.40Moz) (2016: 47,034kg (1.51Moz) and 2015: 47,775kg (1.54Moz)) of gold and delivered attributable PGM production of 1.19Moz (4E) (2016: 0.421oz (4E)) and 0.38Moz (2E).
During the year, Sibanye-Stillwater recognised a loss of R4,433 million (2016: profit of R3,043 million and 2015: profit of R538 million), of which R4,437 million (2016: R3,473 million and 2015: R717 million) is attributable to the owners of Sibanye-Stillwater.
At 31 December 2017, Sibanye-Stillwater had gold mineral reserves of 25.7Moz (2016: 28.7Moz and 2015: 31.0Moz), uranium mineral reserves of 96.1Mlb (2016: 113.2Mlb and 2015: 113.8Mlb), 4E PGM mineral reserves of 22.4Moz (2016: 23.2Moz) and 2E PGM mineral reserves of 21.9Moz.
The following financial review provides stakeholders with greater insight into the financial performance and position of the Group during the periods indicated.
FACTORS AFFECTING SIBANYE-STILLWATER’s PERFORMANCE
COMMODITY PRICES
Sibanye-Stillwater’s revenues are primarily derived from the sale of the gold and PGMs that it produces. Sibanye-Stillwater does not generally enter into forward sales, commodity derivatives or other hedging arrangements in order to establish a price in advance of the sale of its production. As a result it is normally fully exposed to changes in commodity prices. Gold and PGM hedging, however, could be considered under one or more of the following circumstances: to protect cash flows at times of significant capital expenditures; financing projects; or to safeguard the viability of higher cost operations, see –Annual financial statements–Notes to the consolidated financial statements–Note 30.2: Risk management activities.
The market price of gold has historically been volatile and is affected by numerous factors over which Sibanye-Stillwater has no control, such as general supply and demand, speculative trading activity and global economic drivers. Further, over the period from 2015 to 2017, the gold price has fluctuated between a high price of US$1,366/oz to a low price US$1,049/oz. Should the gold price decline below the SA gold operations’ unit production cost the Group may experience losses and, should this situation remain for an extended period, Sibanye-Stillwater may be forced to curtail or suspend some or all of its SA gold operations, projects and/or reduce sustaining capital expenditure. Sibanye-Stillwater might not be able to recover any losses incurred during, or after, such events. A sustained period of significant gold price volatility may also adversely affect Sibanye-Stillwater’s ability to evaluate the feasibility of undertaking new capital projects or continuing existing operations or to make other long-term strategic decisions.
The volatility of, and recent decline in, the price of gold is illustrated in the gold price table below (which shows the annual high, low and average of the London afternoon fixing price of gold).
| |
Sibanye-Stillwater | Annual Financial Report 2017 | 128 |
Table of Contents
MANAGEMENT'S DISCUSSION AND ANALYSIS OF THE FINANCIAL STATEMENTS continued
| | | |
| US$/oz1 |
Gold | High | Low | Average |
2012 | 1,792 | 1,540 | 1,669 |
2013 | 1,694 | 1,192 | 1,409 |
2014 | 1,385 | 1,142 | 1,265 |
2015 | 1,296 | 1,049 | 1,159 |
2016 | 1,366 | 1,077 | 1,250 |
2017 | 1,351 | 1,149 | 1,257 |
2018 (through 23 March 2018) | 1,360 | 1,308 | 1,329 |
1 Rounded to the nearest US dollar.
On 23 March 2018, the London afternoon fixing price of gold was US$1,347/oz.
Historically, platinum, palladium and rhodium prices have been subject to wide fluctuations and are affected by numerous factors beyond Sibanye-Stillwater’s control, including international macroeconomic conditions and outlook, levels of supply and/or demand, any actual or potential threats to the stability of supply and/or demand, inventory levels maintained by users and producers, actions of participants in the commodities markets and currency exchange rates, particularly the rand to the US dollar. Further, between 2015 and 2017, the average platinum price has decreased from US$1,053/oz to US$950/oz.
In addition, the introduction of platinum, palladium and rhodium exchange-traded funds (ETFs) have added a further element of unpredictability and volatility to the pricing environment and may increase volatility in PGM prices, as investors may purchase shares in ETFs at times of rising prices, adding to the upward pressure on prices, and sell during periods of falling prices, potentially increasing the fall in prices. The market prices of platinum, palladium, rhodium and other PGMs have been, and may in the future be, subject to rapid short-term changes.
The volatility of, and recent decline in, the price of platinum is illustrated in the platinum price table below (which shows the annual high, low and average of the London market price of platinum).
| | | |
| US$/oz1 |
Platinum | High | Low | Average |
2012 | 1,726 | 1,385 | 1,552 |
2013 | 1,736 | 1,304 | 1,487 |
2014 | 1,514 | 1,181 | 1,385 |
2015 | 1,287 | 831 | 1,053 |
2016 | 1,178 | 821 | 990 |
2017 | 1,046 | 884 | 950 |
2018 (through 23 March 2018) | 1,025 | 927 | 979 |
1 Rounded to the nearest US dollar.
On 23 March 2018, the London market price of platinum was US$947/oz.
The volatility of the price of palladium is illustrated in the palladium price table below (which shows the annual high, low and average of the London market price of palladium).
| | | |
| US$/oz1 |
Palladium | High | Low | Average |
2012 | 722 | 565 | 648 |
2013 | 774 | 643 | 725 |
2014 | 911 | 702 | 805 |
2015 | 831 | 524 | 680 |
2016 | 770 | 470 | 624 |
2017 | 1,067 | 706 | 886 |
2018 (through 23 March 2018) | 1,132 | 976 | 1,053 |
1 Rounded to the nearest US dollar.
On 23 March 2018, the London market price of palladium was US$1,046/oz.
EXCHANGE RATE
Sibanye-Stillwater’s SA Gold and PGM operations (with the exception of Mimosa) are all located in South Africa, and its revenues are equally sensitive to changes in the US dollar gold and PGM (4E) basket prices, and the rand/US dollar exchange rate (the exchange rate). Depreciation of the rand against the US dollar results in Sibanye-Stillwater’s revenues and operating margins increasing. Conversely, should the rand appreciate against the US dollar, revenues and operating margins would decrease. The impact on profitability of any change in the exchange rate can be substantial. Furthermore, the exchange rates obtained when converting US dollars to rand are set by foreign exchange markets, over which Sibanye-Stillwater has no control. The relationship between currencies and commodities, which includes the gold and PGM (4E) basket prices, is complex, and changes in exchange rates can influence commodity prices and vice versa.
As a general rule, Sibanye-Stillwater does not enter into long-term currency hedging arrangements and is exposed to the spot market exchange rate. Sibanye-Stillwater’s SA Gold and PGM operations’ costs are primarily denominated in rand and forward cover could be considered for significant expenditures based in foreign currency or those items which have long lead times to production or delivery, see –Annual financial statements–Notes to the consolidated financial statements–Note 30.2: Risk management activities.
| |
Sibanye-Stillwater | Annual Financial Report 2017 | 129 |
Table of Contents
MANAGEMENT'S DISCUSSION AND ANALYSIS OF THE FINANCIAL STATEMENTS continued
COSTS
Sibanye-Stillwater’s cost of sales, before amortisation and depreciation comprise mainly labour and contractor costs, power and water, and consumable stores which include, inter alia, explosives, timber, cyanide and other consumables. Sibanye-Stillwater expects that its cost of sales, particularly the input costs noted above, are likely to continue to increase in the near future and will be driven by inflation, general economic trends, market dynamics and other regulatory changes. In order to restrict these cost inputs, there is a continuous restructuring programme throughout the Group to improve efficiencies and productivity. Cost saving initiatives, especially with reference to reducing the impact of electricity consumption at the SA gold Operations, have been specifically successful.
The South African inflation rate or Consumer Price Index (CPI) was 5.2% in 2017 (2016: 6.6% and 2015: 4.5%). Mining inflation has historically been higher than CPI driven by above inflation wage increases and more recently increases in electricity tariffs.
Sibanye-Stillwater’s operations are labour intensive. Labour represented 42%, 45% and 45% of cost of sales, before amortisation and depreciation during 2017, 2016 and 2015, respectively.
An agreement signed by the SA gold operations with all unions in 2015 expires on 30 June 2018 and the next round of wage negotiations in the sector is due to begin shortly. While still owned by Anglo American Platinum Limited (Anglo American Platinum), a three-year wage agreement was signed at the Rustenburg operations and became effective from 1 July 2016 prior to the acquisition.
During the year, wage negotiations were successfully concluded at Kroondal in the SA region and at the PGM operations in the US region.
At Kroondal, a three-year wage agreement was signed with all three unions (AMCU, NUM and Solidarity). The agreement, effective from 1 July 2017, includes an annual increase of R1,000 a month for three years for Category B employees (lower category employees) with inflation-related annual increases agreed for Category A employees. Medical aid subsidies will also increase. Combined, these increases represent an average escalation of about 7% in Kroondal’s total wage bill and helped to align wage scales here with those at Bathopele – both Kroondal and Bathopele are mechanised operations. This will contribute to business continuity and promote certainty regarding Kroondal’s integration within Sibanye-Stillwater.
Optimal production performance continued at Kroondal throughout the wage negotiations with yet another production record being set in the same month as the wage negotiations were concluded. This reflects the high level of employee trust prevailing at the operation.
In the US region, a two-year wage agreement was signed with the United Steel Workers International Union (USW), the representative union at the Stillwater mine in Montana. In terms of the agreement there was a 2% general wage increase for all job categories effective from 2 June 2017 to 1 January 2018, and a 1% increase, effective from 1 January 2018 to 1 June 2018. An annual increase of 2% was agreed for the second year of the agreement, from 2 June 2018 to 1 June 2019. Negotiations with the USW regarding East Boulder were concluded towards year-end 2017. A new four-year wage contract was signed that included a two-year extension. The next wage negotiations will be in December 2021. The agreed wage increases were a 1% increase effective 1 January 2018 and a $1,000 bonus that was paid by 1 February 2018, followed by annual increases of 2% for 2019, 2.5% in 2020 and 2% in 2021.
Despite above inflation increases in electricity tariffs, power and water comprised 14%, 18% and 19% of cost of sales, before amortisation and depreciation in 2017, 2016 and 2015, respectively.
The effect of the abovementioned increases, especially being above the average inflation rate, has adversely affected and, may continue to adversely affect, the profitability of Sibanye-Stillwater’s SA Gold and PGM operations. Further, Sibanye-Stillwater’s SA Gold and PGM operations’ costs are primarily denominated in rand, while revenues from gold and PGM sales are in US dollars. Generally when inflation is high the rand tends to devalue, thereby increasing rand revenues, and potentially offsetting any increase in costs. However, there can be no guarantee that any cost saving measures or the effects of any potential devaluation will offset the effects of increased inflation and production costs.
PRODUCTION
Sibanye-Stillwater’s revenues are driven by its production levels and the price it realises from the sale of gold, PGMs and associated co- and by-products, as discussed above. Production can be affected by a number of factors including industrial action, safety related work stoppages, mining grades and other mining related incidents. These factors could have an impact on production levels in the future.
In recent years, the South African mining industry has experienced increased union unrest. The entry of new unions such as AMCU, which has become a significant rival to the traditionally dominant NUM, has resulted in more frequent industrial disputes, including violent protests, intra-union violence and clashes with police authorities. There were no wage-related strikes in the SA region in 2017. There was a strike at the Cooke operations in June 2017 due to a restriction on food being taken underground related to efforts to combat illegal mining. This led to a 15-day strike and 181,680 hours of lost production.
Sibanye-Stillwater’s SA Gold and PGM operations are also subject to South African health and safety laws and regulations that impose various duties on Sibanye-Stillwater’s mines while granting the authorities’ powers to, among other things, close or suspend operations and order corrective action relating to health and safety matters. During 2017, Sibanye-Stillwater’s SA gold operations experienced 204 work stoppages (2016: 171 and 2015: 109). The SA PGM operations experienced 26 work stoppages (2016: 55).
Sibanye-Stillwater’s SA gold operations are in their mature life stage and have encountered lower mining grades and yields. Sibanye-Stillwater’s SA PGM operations are at steady state production levels.
Sibanye-Stillwater’s key focus is to maintain profitable operations and sustain current production levels for a longer period than had previously been envisaged, through an increased focus on productivity. Furthermore, focus will be on realising the extensive reserves and resources potential that still exists.
ROYALTIES AND MINING TAX
South African mining operations pay a royalty tax. The formula for calculating royalties takes into account the profitability of individual operations. The royalty formula is detailed in –Annual financial statements–Notes to the consolidated financial statements–Note 9.1: Royalties.
| |
Sibanye-Stillwater | Annual Financial Report 2017 | 130 |
Table of Contents
MANAGEMENT'S DISCUSSION AND ANALYSIS OF THE FINANCIAL STATEMENTS continued
Under South African tax legislation, gold mining companies and non-gold mining companies are taxed at different rates. Sibanye-Stillwater’s SA gold operations are subject to the gold tax formula on their respective mining incomes. The formula calculating tax payable, which is detailed in –Annual financial statements–Notes to the consolidated financial statements–Note 9.2: Mining and income tax, is affected by the profitability of the applicable mining operation. In addition, these operations are ring fenced, so each operation is taxed separately and, as a result, taxable losses and capital expenditure at one of the operations cannot be used to reduce taxable income from another operation. Depending on the profitability of the operations, the tax rate can vary significantly from year to year.
On 22 December 2017, new federal tax reform legislation was enacted in the United States, resulting in significant changes from previous tax law and from January 2018 the federal corporate income tax rate reduced to 21% from 35%. The rate change resulted in a decrease in our US region net deferred tax liabilities at 31 December 2017 of R2,532 million with a corresponding deferred tax benefit. Our federal income tax expense for periods beginning in 2018 will be based on the new rate, see –Annual financial statements–Notes to the consolidated financial statements–note 9.2: Mining and income tax.
CAPITAL EXPENDITURE
Sibanye-Stillwater will continue to invest capital in new and existing infrastructure and possible growth opportunities. Therefore, management will be required to consider, on an ongoing basis, the capital expenditure necessary to achieve its sustainable production objectives against other demands on cash.
As part of its strategy, Sibanye-Stillwater may investigate the potential exploitation of mineralisation below its current infrastructure limits as well as other capital-intensive projects.
In 2017, Sibanye-Stillwater’s total capital expenditure was R6,099 million (2016: R4,151 million and 2015: R3,345 million). Sibanye-Stillwater expects to spend approximately R7.7 billion on capital in 2018, excluding any acquisitions.
The actual amount of capital expenditure will depend on a number of factors, such as production volumes, the commodity prices and general economic conditions and may differ from the amount forecast above. Some of these factors are outside of the control of Sibanye-Stillwater.
RECENT PLATINUM ACQUISITIONS
Stillwater acquisition
On 9 December 2016, Sibanye-Stillwater announced it had reached a definitive agreement to acquire Stillwater Mining Company (Stillwater) for US$18 per share in cash, or US$2,200 million in aggregate (the Stillwater Transaction). On 25 April 2017, at the shareholders meeting of Sibanye-Stillwater, the Sibanye-Stillwater shareholders approved the proposed Stillwater Transaction by voting in favour of the various resolutions to give effect to the Stillwater Transaction and at the shareholders meeting of Stillwater, the requisite majority of Stillwater shareholders resolved to approve the Stillwater Transaction. Sibanye-Stillwater obtained control (100%) of Stillwater on this date.
Results of Stillwater are presented for the eight months ended 31 December 2017 following the completion of the acquisition, see –Annual financial statements–Notes to the consolidated financial statements–Note 13.1: Stillwater acquisition.
The Rustenburg operations acquisition
On 9 September 2015, Sibanye-Stillwater announced that it had entered into written agreements with Rustenburg Platinum Mines Limited (RPM), a wholly owned subsidiary of Anglo American Platinum to acquire the Bathopele, Siphumelele (including Khomanani), and Thembelani (including Khuseleka) mining operations, two concentrating plants, an on-site chrome recovery plant, the Western Limb Tailings Retreatment Plant, associated surface infrastructure and related assets and liabilities on a going concern basis, including normalised levels of working capital (the Rustenburg operations) (the Rustenburg operations Transaction).
The purchase consideration comprises an upfront payment of R1.5 billion at the closing of the Rustenburg operations Transaction (Closing) and a deferred payment calculated as being equal to 35% of the distributable free cash flow generated by the Rustenburg Operations over a six year period from the later of Closing or 1 January 2017 (Deferred Payment), subject to a minimum payment of R3.0 billion. In addition to the Deferred Payment, which allows for a favourable extended payment period; should the Rustenburg operations generate negative distributable free cash flows in either 2016, 2017 or 2018, RPM will be required to pay up to R267 million per annum to ensure that the free cash flow for the relevant year is equal to zero.
On 19 October 2016, Sibanye-Stillwater obtained consent in terms of section 11 of the Mineral and Petroleum Resources Development Act (MPRDA) for the transfer of the mining right and prospecting right pursuant to the Rustenburg operations Transaction, and control of the Rustenburg operations on this date.
Results of the Rustenburg operations were presented for the two months ended 31 December 2016 following the completion of the acquisition, see –Annual financial statements–Notes to the consolidated financial statements–Note 13.2: The Rustenburg operations acquisition.
Aquarius acquisition
On 6 October 2015 Sibanye-Stillwater announced a cash offer of US$0.195 per share for the entire issued share capital of Aquarius Platinum Limited (Aquarius) (the Aquarius Transaction), valuing Aquarius at US$294 million. The transaction was subject to the fulfilment of various conditions precedent which were completed on 12 April 2016, when Sibanye-Stillwater paid R4,301.5 million to the Aquarius shareholders and obtained control (100%) of Aquarius.
Results of Aquarius were presented for the nine months ended 31 December 2016 following the completion of the acquisition, see –Annual financial statements–Notes to the consolidated financial statements–Note 13.3: Aquarius acquisition.
| |
Sibanye-Stillwater | Annual Financial Report 2017 | 131 |
Table of Contents
MANAGEMENT'S DISCUSSION AND ANALYSIS OF THE FINANCIAL STATEMENTS continued
Acquisition costs
Sibanye-Stillwater incurred R529 million on acquisition related costs in 2017 (2016: R157 million and 2015: R26 million).
Sibanye-Stillwater has pursued and may continue to pursue growth opportunities that allow it to leverage its existing processing capacity and infrastructure and to extend its operating life. Such growth may continue to occur through the acquisition of other companies and assets, development projects, or by entering into joint ventures. Sibanye-Stillwater may incur acquisition and integration related costs with regard to any operations or entities that it acquires or seeks to acquire in the future.
2017 FINANCIAL PERFORMANCE COMPARED WITH 2016 and 2015
Group profit decreased by 246% to a loss of R4,433 million in 2017 from a profit of R3,043 million (2015: R538 million). The reasons for this decrease are discussed below.
The primary factors explaining the movements in net profit are set out in the table below.
| | | | | |
| | Revised1 | % Change | | % Change |
Figures in million - SA rand | 2017 | 2016 | 2017/2016 | 2015 | 2016/2015 |
Revenue | 45,912 | 31,241 | 47 | 22,717 | 38 |
Cost of sales | (42,182) | (24,751) | 70 | (20,017) | 24 |
Finance expense | (2,972) | (903) | 229 | (562) | 61 |
Share-based payments | (232) | (496) | (53) | (274) | 81 |
Loss on financial instruments | (1,114) | (1,033) | 8 | (230) | 349 |
Gain/(loss) on foreign exchange differences | 292 | 220 | 33 | (359) | (161) |
Share of results of equity-accounted investees after tax | 292 | 13 | 2,146 | 116 | (89) |
Impairments | (4,411) | (1,381) | 219 | - | 100 |
Occupational healthcare expense | (1,107) | - | 100 | - | 100 |
Gain on acquisition | - | 2,179 | (100) | - | 100 |
Restructuring costs | (730) | (188) | 288 | (105) | 79 |
Transaction costs | (552) | (157) | 252 | (26) | 504 |
Net loss on derecognition of financial guarantee asset and liability | - | - | 100 | (158) | (100) |
Net other | (177) | 68 | (360) | 214 | (68) |
(Loss)/profit before royalties and tax | (6,981) | 4,812 | (245) | 1,316 | 266 |
Royalties | (399) | (567) | (30) | (401) | 41 |
(Loss)/profit before tax | (7,380) | 4,245 | (274) | 915 | 364 |
Mining and income tax | 2,947 | (1,202) | (345) | (377) | 219 |
(Loss)/profit for the year | (4,433) | 3,043 | (246) | 538 | 466 |
1 The comparatives for 2016 have been revised retrospectively in terms of IFRS 3 after the acquisition accounting of the Rustenburg operations was finalised.
REVENUE
Revenue increased by 47% to R45,912 million in 2017 from R31,241 million in 2016. This included revenue of R13,276 million from the SA PGM operations, acquired during 2016 and R9,162 million from the US PGM operations, acquired during 2017.
Revenue from the SA gold operations decreased by 15% to R23,474 million in 2017 from R27,501 million in 2016 driven by the average rand gold price, which decreased by 9% and the level of gold sold, which decreased by 7%. The decrease in the gold sold to 43,763kg in 2017 from 46,905kg in 2016, was mainly due to the cessation of the underground operations at Cooke, and lower mined volumes and grades at Beatrix West and Driefontein. Gold production from the operations is shown in the graph below. The decrease in the average rand gold price was due to the 9% stronger rand of R13.31/US$ in 2017 compared with R14.68/US$ in 2016.
Revenue from the SA PGM operations increased by 255% to R13,276 million in 2017 from R3,739 million in 2016 due to the inclusion of revenue from Kroondal and the Rustenburg operations for the full year in 2017. The revenue from Kroondal increased to R2,862 million in 2017 from R1,973 million for nine months in 2016 and the Rustenburg operations increased to R10,221 million in 2017 from R1,656 million for two months in 2016.
| |
Gold sold (kg) 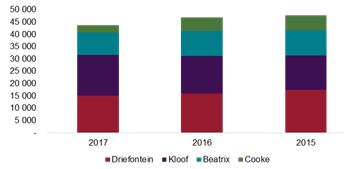
| 4E/2E PGM sold (oz) 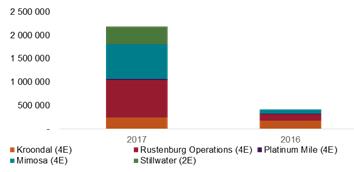
|
| |
Sibanye-Stillwater | Annual Financial Report 2017 | 132 |
Table of Contents
MANAGEMENT'S DISCUSSION AND ANALYSIS OF THE FINANCIAL STATEMENTS continued
Revenue increased by 38% to R31,241 million in 2016 from R22,717 million in 2015. This included first time revenue of R3,739 million from the platinum operations, Aquarius and the Rustenburg operations, acquired during 2016. Revenue from the Gold Division increased by 21% to R27,501 million in 2016 from R22,717 million in 2015 driven by the average rand gold price, which increased by 23% partly offset by the level of gold sold, which decreased by 2%. The decrease in the gold sold to 46,905kg in 2016 from 47,775kg in 2015, was mainly due to the cumulative impact of operational disruptions relating to engineering issues, power outages and more significantly as a result of the closure of the Cooke 4 shaft in September 2016, due to continued poor production performance. The increase in the average rand gold price was due to an increase in the average realised US dollar gold price to US$1,242/oz in 2016 from US$1,160/oz in 2015 and the 15% weaker rand of R14.68/US$ in 2016 compared with R12.75/US$ in 2015.
COST OF SALES
Cost of sales increased by 70% to R42,182 million in 2017 from R24,751 million in 2016, with the incorporation of Aquarius and the Rustenburg operations for the full year in 2017, and Stillwater for the eight months, which together accounted for R17,205 million of this increase. Cost of sales, which consist of operating costs and amortisation and depreciation, increased by 24% to R24,751 million in 2016 from R20,017 million in 2015, with the incorporation of Aquarius and the Rustenburg operations for nine and two months respectively, which together accounted for R3,590 million of this increase.
The primary drivers of cost of sales are set out in the table below.
| | | | | |
Figures in million - SA rand | 2017 | 2016 | % Change
2017/2016 | 2015 | % Change
2016/2015 |
Salaries and wages | 15,323 | 9,276 | 65 | 7,345 | 26 |
Consumable stores | 8,789 | 5,243 | 68 | 3,996 | 31 |
Utilities | 4,930 | 3,709 | 33 | 3,128 | 19 |
Mine contracts | 2,957 | 2,105 | 40 | 1,458 | 44 |
Recycling | 4,377 | - | 100 | - | 100 |
Other | 3,398 | 2,770 | 23 | 2,758 | 0 |
Ore reserve development costs capitalised | (3,292) | (2,394) | 38 | (2,305) | 4 |
Cost of sales, before amortisation and depreciation | 36,482 | 20,709 | 76 | 16,380 | 26 |
- SA gold operations, excluding Cooke | 15,918 | 14,361 | 11 | 13,402 | 7 |
- Cooke | 1,961 | 2,985 | (34) | 2,978 | 0 |
- SA PGM operations | 11,591 | 3,363 | 245 | - | 100 |
- US PGM operations | 7,012 | - | 100 | - | - |
| | | | | |
Amortisation and depreciation | 5,700 | 4,042 | 41 | 3,637 | 11 |
- SA gold operations, excluding Cooke | 3,252 | 3,044 | 7 | 2,932 | 4 |
- Cooke | 256 | 771 | (67) | 705 | 9 |
- SA PGM operations | 761 | 227 | 235 | - | 100 |
- US PGM operations | 1,431 | - | 100 | - | - |
| | | | | |
Total cost of sales | 42,182 | 24,751 | 70 | 20,017 | 24 |
- SA gold operations, excluding Cooke | 19,170 | 17,405 | 10 | 16,334 | 7 |
- Cooke | 2,217 | 3,756 | (41) | 3,683 | 2 |
- SA PGM operations | 12,352 | 3,590 | 244 | - | 100 |
- US PGM operations | 8,443 | - | 100 | - | - |
The analysis that follows provides a more detailed discussion of cost of sales, together with the total cash cost, All-in sustaining cost and All-in cost.
Cost of sales, before amortisation and depreciation
Cost of sales, before amortisation and depreciation increased by 76% to R36,482 million in 2017 from R20,709 million in 2016. This included cost of sales, before amortisation and depreciation of R11,591 million from the SA PGM operations, acquired during 2016 and R7,012 million from the US PGM operations, acquired during 2017. Cost of sales, before amortisation and depreciation at the SA gold operations increased by 3% to R17,879 million in 2017 from R17,346 million due to above inflation increases in wages and utilities partly offset by the cessation of the underground operations at Cooke.
Cost of sales, before amortisation and depreciation increased by 26% to R20,709 million in 2016 from R16,380 million in 2015, or just less than 6% excluding cost of sales, before amortisation and depreciation at the SA PGM operations of R3,363 million. The increase in cost of sales, before amortisation and depreciation excluding the SA PGM operations in 2016 was due to above inflation wage and electricity tariffs, increased maintenance costs and consumable stores, and additional crews and contractors to improve productivity. These increases were partly offset by ongoing cost-saving initiatives and further restructuring across the group which included the closure of Cooke 4 shaft in September 2016.
Amortisation and depreciation
Amortisation and depreciation increased by 41% to R5,700 million in 2017 from R4,042 million in 2016. This included amortisation and depreciation of R761 million from the SA PGM operations, acquired during 2016 and R1,431 million from the US PGM operations, acquired during 2017. Amortisation and depreciation at the SA gold operations decreased by 8% to R3,508 million in 2017 from R3,815 million in 2016 due to lower production, and impairment of the Cooke underground and Beatrix West mining assets at 30 June 2017.
Amortisation and depreciation increased by 11% to R4,042 million in 2016 from R3,637 million in 2015. The increase in 2016 was due to the inclusion of the PGM operations, which added R227 million, and amortisation and depreciation at Kloof due to the increased production in 2016.
| |
Sibanye-Stillwater | Annual Financial Report 2017 | 133 |
Table of Contents
MANAGEMENT'S DISCUSSION AND ANALYSIS OF THE FINANCIAL STATEMENTS continued
All-in cost
All-in cost per ounce, was introduced in 2013 by the members of the World Gold Council. Sibanye-Stillwater has adopted the principle prescribed by the Council. This non-IFRS measure provides more transparency into the total costs associated with gold mining.
The All-in cost per ounce metric provides relevant information to investors, governments, local communities and other stakeholders in understanding the economics of gold mining. This is especially true with reference to capital expenditure associated with developing and maintaining gold mines, which has increased significantly in recent years and is reflected in this new metric.
Total All-in cost excludes income tax, costs associated with merger and acquisition activities, working capital, impairments, financing costs, one-time severance charges and items needed to normalise earnings.
All-in cost is made up of All-in sustaining cost, being the cost to sustain current operations, given as a sub-total in the All-in cost calculation, together with corporate and major capital expenditure associated with growth.
| |
Sibanye-Stillwater | Annual Financial Report 2017 | 134 |
Table of Contents
MANAGEMENT'S DISCUSSION AND ANALYSIS OF THE FINANCIAL STATEMENTS continued
also
| | | | | | | | | | | | | | |
Figures in million - SA rand | Group | Total SA gold | Driefontein | Kloof | Beatrix | Cooke | Corporate
and re-
conciling
items | Total SA PGM1 | Kroondal | Platinum
Mile | Mimosa | Rustenburg
operations | Corporate and re- conciling items | US PGM Stillwater2 |
31 December 2017 | | | | | | | | | | | | | | |
Cost of sales, before
amortisation and depreciation | Rm | 17,879.2 | 6,203.5 | 5,762.7 | 3,952.5 | 1,960.5 | - | 11,591.8 | 2,395.9 | 129.8 | 1,200.5 | 9,066.1 | (1,200.5) | 2,634.8 |
Plus: | | - | | | | | | - | | | | | | |
Community costs1 | Rm | 31.1 | 6.8 | 16.0 | 7.3 | 1.0 | - | - | - | - | - | - | - | - |
Inventory change | Rm | - | - | - | - | - | - | - | - | - | - | - | - | 103.8 |
Share-based payments2 | Rm | 5.9 | 2.8 | 1.8 | 1.3 | - | - | - | - | - | - | - | - | 4.9 |
Royalties3 | Rm | 325.3 | 77.8 | 189.3 | 44.5 | 13.7 | - | 73.2 | 5.6 | - | 60.4 | 67.6 | (60.4) | - |
Rehabilitation4 | Rm | 101.0 | (31.5) | 40.1 | 25.6 | 65.2 | 1.6 | 31.1 | 48.9 | - | 4.2 | (17.8) | (4.2) | 6.2 |
ORD5 | Rm | 2,288.0 | 876.1 | 876.2 | 482.0 | 53.7 | - | 465.0 | - | - | - | 465.0 | - | 538.6 |
Sustaining capital expenditure6 | Rm | 516.8 | 235.0 | 210.2 | 63.1 | 8.5 | - | 567.6 | 190.5 | 11.0 | 222.5 | 366.1 | (222.5) | 226.9 |
Less: | | | | | | | | | | | | | | |
By-product credit7 | Rm | (23.3) | (8.3) | (6.5) | (5.7) | (2.8) | - | (1,600.1) | (186.1) | (10.6) | (273.2) | (1,403.4) | 273.2 | (238.1) |
All-in sustaining cost8 | Rm | 21,124.0 | 7,362.2 | 7,089.8 | 4,570.6 | 2,099.8 | 1.6 | 11,128.6 | 2,454.8 | 130.2 | 1,214.4 | 8,543.6 | (1,214.4) | 3,277.1 |
Plus: | | | | | | | | | | | | | | |
Group exploration growth and other capital expenditure | Rm | 828.3 | 44.4 | 147.1 | 2.5 | 11.7 | 622.6 | 2.3 | - | 2.3 | - | - | - | 899.6 |
All-in cost8 | Rm | 21,952.3 | 7,406.6 | 7,236.9 | 4,573.1 | 2,111.5 | 624.2 | 11,130.9 | 2,454.8 | 132.5 | 1,214.4 | 8,543.6 | (1,214.4) | 4,176.7 |
Gold sold/4E PGM produced/2E PGM produced | kg | 43,763 | 15,088 | 16,466 | 9,091 | 3,118 | | 33,287 | 7,503 | 605 | 3,862 | 25,179 | (3,862) | 11,706 |
| ‘000oz | 1,407.1 | 485.1 | 529.4 | 292.3 | 100.3 | | 1,070.2 | 241.2 | 19.4 | 124.2 | 809.5 | (124.2) | 376.4 |
All-in sustaining cost8 | R/kg | 482,693 | 487,951 | 430,572 | 502,761 | 673,445 | | | | | | | | |
| R/oz | | | | | | | 10,399 | 10,176 | 6,696 | 9,781 | 10,554 | | 8,707 |
| US$/oz | 1,128 | 1,141 | 1,007 | 1,175 | 1,574 | | 782 | 765 | 503 | 735 | 793 | | 651 |
All-in cost8 | R/kg | 501,620 | 490,893 | 439,506 | 503,036 | 677,197 | | | | | | | | |
| R/oz | | | | | | | 10,401 | 10,176 | 6,815 | 9,781 | 10,554 | | 11,097 |
| US$/oz | 1,173 | 1,148 | 1,027 | 1,176 | 1,583 | | 782 | 765 | 512 | 735 | 793 | | 821 |
Table of Contents
MANAGEMENT'S DISCUSSION AND ANALYSIS OF THE FINANCIAL STATEMENT continued
| | | | | | | | | | | | | |
Figures in million - SA rand | Group | Total SA gold | Driefontein | Kloof | Beatrix | Cooke | Corporate
and re-
conciling
items | Total SA PGM1 | Kroondal | Platinum
Mile | Mimosa | Rustenburg
operations | Corporate and re- conciling items |
31 December 2016 (Revised)9 | | | | | | | | | | | | | |
Cost of sales, before
amortisation and depreciation | Rm | 17,346.0 | 5,566.6 | 5,041.0 | 3,753.4 | 2,985.0 | - | 3,363.1 | 1,689.8 | 90.8 | 969.0 | 1,582.5 | (969.0) |
Plus: | | - | | | | | | - | | | | | |
Community costs1 | Rm | 80.4 | 16.5 | 20.3 | 27.0 | 16.6 | - | - | - | - | - | - | - |
Share-based payments2 | Rm | 39.3 | 16.5 | 13.7 | 9.1 | - | - | - | - | - | - | - | - |
Royalties3 | Rm | 528.0 | 204.8 | 194.3 | 113.2 | 15.7 | - | 38.6 | 10.2 | - | 82.9 | 28.3 | (82.8) |
Rehabilitation4 | Rm | 141.1 | (28.8) | 44.1 | 23.2 | 100.1 | 2.5 | 74.3 | 51.5 | - | 3.2 | 22.8 | (3.2) |
ORD5 | Rm | 2,394.4 | 779.0 | 912.9 | 542.9 | 159.6 | - | - | - | - | - | - | - |
Sustaining capital expenditure6 | Rm | 613.4 | 218.5 | 261.2 | 84.8 | 48.9 | - | 325.8 | 175.8 | 1.3 | 159.8 | 148.7 | (159.8) |
Less: | | | | | | | | | | | | | |
By-product credit7 | Rm | (28.2) | (9.6) | (6.8) | (7.6) | (4.2) | - | (371.9) | (98.1) | 3.0 | (192.7) | (276.8) | 192.7 |
All-in sustaining cost8 | Rm | 21,114.4 | 6,763.5 | 6,480.7 | 4,546.0 | 3,321.7 | 2.5 | 3,429.9 | 1,829.2 | 95.1 | 1,022.2 | 1,505.5 | (1,022.1) |
Plus: | | | | | | | | | | | | | |
Group exploration growth and other capital expenditure | Rm | 1,052.2 | 54.1 | 130.1 | 4.8 | 40.7 | 822.5 | - | - | - | - | - | - |
All-in cost8 | Rm | 22,166.6 | 6,817.6 | 6,610.8 | 4,550.8 | 3,362.4 | 825.0 | 3,429.9 | 1,829.2 | 95.1 | 1,022.2 | 1,505.5 | (1,022.1) |
Gold sold/4E PGM produced | kg | 46,905 | 16,046 | 15,176 | 10,041 | 5,642 | | 10,254 | 5,543 | 425 | 2,833 | 4,286 | (2,833) |
| ‘000oz | 1,508 | 516 | 488 | 323 | 181 | | 330 | 178 | 14 | 91 | 138 | (91) |
All-in sustaining cost8 | R/kg | 450,152 | 421,501 | 427,036 | 452,754 | 588,745 | | | | | | | |
| R/oz | | | | | | | 10,404 | 10,264 | 6,947 | 11,222 | 10,925 | |
| US$/oz | 954 | 893 | 905 | 960 | 1,248 | | 709 | 699 | 473 | 765 | 744 | |
All-in cost8 | R/kg | 472,585 | 424,872 | 435,609 | 453,232 | 595,959 | | | | | | | |
| R/oz | | | | | | | 10,404 | 10,264 | 6,947 | 11,222 | 10,925 | |
| US$/oz | 1,002 | 901 | 923 | 961 | 1,263 | | 709 | 699 | 473 | 765 | 744 | |
| |
Sibanye-Stillwater | Annual Financial Report 2017 | 136 |
Table of Contents
MANAGEMENT'S DISCUSSION AND ANALYSIS OF THE FINANCIAL STATEMENTS continued
| | | | | | | |
Figures in million - SA rand | Group | Total SA gold | Driefontein | Kloof | Beatrix | Cooke | Corporate
and re-
conciling
items |
31 December 2015 | | | | | | | |
Cost of sales, before
amortisation and depreciation | Rm | 16,380.4 | 5,234.2 | 4,777.2 | 3,391.0 | 2,978.0 | - |
Plus: | | - | | | | | |
Community costs1 | Rm | 40.7 | 13.9 | 8.9 | 15.0 | 2.9 | - |
Share-based payments2 | Rm | 274.4 | 35.1 | 27.6 | 23.5 | - | 188.2 |
Royalties3 | Rm | 400.6 | 196.8 | 98.4 | 88.7 | 16.7 | - |
Rehabilitation4 | Rm | 138.3 | 23.1 | 22.9 | 17.3 | 75.0 | - |
ORD5 | Rm | 2,304.9 | 727.0 | 840.6 | 510.4 | 226.9 | - |
Sustaining capital expenditure6 | Rm | 653.8 | 249.2 | 225.6 | 86.1 | 92.9 | - |
On-mine exploration | Rm | 17.3 | 13.9 | 0.6 | 0.9 | 1.9 | - |
Less: | | | | | | | |
By-product credit7 | Rm | (26.8) | (8.6) | (5.7) | (5.8) | (6.7) | - |
All-in sustaining cost8 | Rm | 20,183.6 | 6,484.6 | 5,996.1 | 4,127.1 | 3,387.6 | 188.2 |
Plus: | | | | | | | |
Group exploration growth and other capital expenditure | Rm | 395.3 | 18.0 | 63.7 | - | 17.6 | 296.0 |
All-in cost8 | Rm | 20,578.9 | 6,502.6 | 6,059.8 | 4,127.1 | 3,405.2 | 484.2 |
Gold sold | kg | 47,775.0 | 17,350.0 | 14,068.0 | 10,105.0 | 6,252.0 | |
| ‘000oz | 1,536.0 | 557.8 | 452.3 | 324.9 | 201.0 | |
All-in sustaining cost8 | R/kg | 422,472 | 373,752 | 426,223 | 408,422 | 541,843 | |
| US$/oz | 1,031 | 912 | 1,040 | 996 | 1,322 | |
All-in cost8 | R/kg | 430,746 | 374,790 | 430,751 | 408,422 | 544,658 | |
| US$/oz | 1,051 | 914 | 1,051 | 996 | 1,329 | |
The average exchange rate for the year ended 31 December 2017 was R13.31US$ (2016: R14.68/US$ and 2015: R12.75/US$).
1 Community costs includes costs related to community development.
2 Share-based payments includes share-based payments compensation cost to support Sibanye-Stillwater’s corporate structure not directly related to current production. Share-based payments are calculated based on the fair value at initial recognition and do not include the fair value adjustment of the cash-settled share-based payment liability to the reporting date fair value.
3 Royalties is the royalty on refined minerals payable to the South African government.
4 Rehabilitation includes the interest charge related to the environmental rehabilitation obligation and the amortisation of the related capitalised rehabilitation costs recorded as an asset. The interest charge related to the environmental rehabilitation obligation and the amortisation of the capitalised rehabilitation costs do not reflect annual cash outflows and are calculated in accordance with IFRS. The interest charge and amortisation reflect the periodic costs of rehabilitation associated with current production and are, therefore, included in the measure.
5 ORD are those capital expenditures that allow access to reserves that are economically recoverable in the future, including, but not limited to, crosscuts, footwalls, return airways and box holes which will avail gold production or reserves.
6 Sustaining capital expenditure are those capital expenditures that are necessary to maintain current production and execute the current mine plan. Sustaining capital costs are relevant to the All-in cost metric as these are needed to maintain Sibanye-Stillwater’s current operations and provide improved transparency related to Sibanye-Stillwater’s ability to finance these expenditures.
7 By-product credit—The All-in cost metric is focused on the cost associated with producing and selling a kilogram of gold 4E/2E PGMs, and therefore the metric captures the benefit of mining other metals when gold and 4E/2E PGMs are produced and sold. In determining the All-in cost, the costs associated with producing and selling a kilogram of gold or an ounce of 4E/2E PGMs is reduced by the benefit received from the sale of co-products and by-products, recognised as product sales, which is extracted and processed along with the gold and 4E/2E PGMs produced. At the SA gold operations, the sale of silver is recognised as product sales, and at the PGM operations in both regions, the minor PGMs – iridium and ruthenium – are produced as co-products, which together with the three primary PGMs, are referred to as 6E (5PGM+Au). In addition, nickel, copper and chrome, among other minerals, are by-products at these operations. This is relevant to the All-in cost metric as it aids in the investor’s analysis of the profitability of producing a kilogram of gold or an ounce of 4E/2E PGMs, without the need to consider multiple metal prices.
8 For information on how Sibanye-Stillwater has calculated All-in sustaining cost, All-in cost, All-in sustaining cost per kilogram, All-in sustaining cost per ounce, All-in cost per kilogram and All-in cost per ounce, see –Overview–Five year financial performance–Group operating statistics–Footnote 2.
9 The comparative for 2016 have been revised retrospectively after the acquisition accounting of the Rustenburg operations was finalised in terms of IFRS 3.
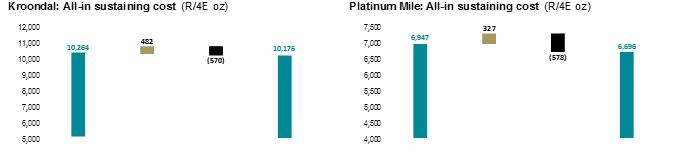
Table of Contents
MANAGEMENT'S DISCUSSION AND ANALYSIS OF THE FINANCIAL STATEMENTS continued
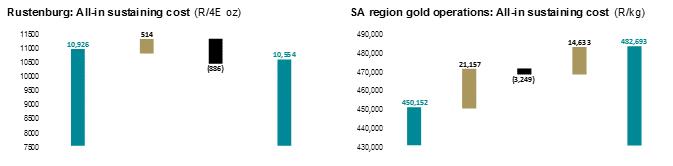
The All-in sustaining cost at Kroondal, Platinum Mile and the Rustenburg operations reduced year on year following an intensive effort to drive the synergy cost savings identified. After accounting for inflation, the All-in sustaining cost at Kroondal, Platinum Mile and the Rustenburg operations reduced in 2017 by R570/4Eoz, R578/4Eoz and R886/4Eoz, respectively. All-in sustaining cost at Mimosa reduced to US$735/4Eoz in 2017 from US$765/4Eoz in 2016. All-in sustaining cost at the SA gold operations were primarily affected by the unsustainably high costs associated with the Cooke operations, which were placed on care and maintenance during the second half of 2017, following a section 189 labour rationalisation process. The All-in sustaining cost amounted to R468,060/kg in 2017, excluding the Cooke operations, compared with R450,152/kg in 2016, a 4% increase year on year.
All-in sustaining cost, a sub-set of All-in cost increased by 7% to R450,152/kg (US$954/oz) in 2016 from R422,472/kg (US$1,031/oz) in 2015. The increase in 2016 was as a result of the effect of fixed costs on the lower production at Driefontein but more significantly due to continued underperformance at Cooke 4 shaft, subsequently closed, which increased 9% year on year from an already high cost of R541,843/kg in 2015.
FINANCE EXPENSE
Finance expense increased by 229% to R2,972 million in 2017 from R903 million in 2016 and increased by 61% to R903 million in 2016 from R562 million in 2015. Included in finance expense in 2017 was R2,092 million interest on borrowings (2016: R428 million and 2015: R248 million), R252 million unwinding of the US$1.05 billion Bond, US$450 million Convertible Bond and Burnstone Debt (2016: R141 million and 2015: R102 million), R357 million environmental rehabilitation liability accretion expense (2016: R291 million and 2015: R198 million), R46 million occupational healthcare liability accretion expense, R148 million unwinding of the Deferred Payment (2016: R24 million) and R76 million sundry interest charges (2016: R19 million and 2015: R14 million).
The increase in interest on borrowings in 2017 was due to the increase in the average indebtedness and effective interest rate year on year. Sibanye-Stillwater’s average gross debt outstanding, excluding the Burnstone Debt and including the derivative financial instrument, was approximately R16.2 billion in 2017 compared with approximately R4.6 billion in 2016. The increase in borrowings was mainly to fund the acquisition of Stillwater. The increase in environmental rehabilitation liability accretion expense was primarily due to the inclusion of the SA PGM operations for the full year and the US PGM operation for eight months, which added R49 million.
The increase in interest on borrowings in 2016 was due to the increase in the average indebtedness and effective interest rate year-on-year. Sibanye-Stillwater’s average gross debt outstanding, excluding the Burnstone Debt, was approximately R4.6 billion in 2016 compared with approximately R2.2 billion in 2015. The increase in environmental rehabilitation liability accretion expense was primarily due to the inclusion of the PGM operations, which added R62 million.
SHARE-BASED PAYMENTS
The share-based payments expense decreased by 53% to R232 million in 2017 from R496 million in 2016, or 9% excluding the share-based payment on BEE transaction, and increased by 81% to R496 million in 2016 from R274 million in 2015. The share-based payments expense consists of R217 million relating to equity-settled share options granted under the Sibanye Gold Limited 2013 Share Plan (SGL Share Plan) (2016: R172 million and 2015: R119 million), and R11 million relating to instruments granted under the Sibanye Gold 2013 Phantom Share Scheme (the SGL Phantom Scheme) (2016: R84 million and 2015: R155 million). The share-based payments expense in 2016 also included R240 million relating to share-based payment on BEE transaction which was recognised as part of the Rustenburg operations acquisition.
The increase in the share-based payment expense in 2016 was due to the increase in the SGL Share Plan expense as a result of the fair value of each option granted under the scheme increasing with the appreciation of Sibanye-Stillwater’s share price, and the share-based payment on BEE transaction which was recognised as part of the Rustenburg operations acquisition which represents the BEE shareholders attributable value over the expected life of mine partly offset by the decrease in the SGL Phantom Scheme expense as a result of the number of performance shares that vested on 1 March 2015, with no new allocations in 2015 or 2016.
LOSS ON FINANCIAL INSTRUMENTS
The loss on financial instruments of R1,114 million in 2017 compared with R1,033 million in 2016 and R230 million in 2015. The loss on financial instruments in 2017 was mainly impacted by the increased profitability at the Rustenburg operations resulting in an increased purchase price based on 35% of future cash flows (loss of R469 million), increased dividend expectations for the 26% BEE partners (loss of R153 million) and a decrease in the Anglo American Platinum receivable which afforded us up to R800 million downside protection (loss of R468 million).
| |
Sibanye-Stillwater | Annual Financial Report 2017 | 138 |
Table of Contents
MANAGEMENT'S DISCUSSION AND ANALYSIS OF THE FINANCIAL STATEMENTS continued
The loss on financial instruments in 2016 primarily consists of R1,070 million fair value loss relating to SGL Phantom Scheme options. The cash-settled share instruments are valued at each reporting date based on the fair value of the instrument at that reporting date. The difference between the reporting date fair value and the initial recognition fair value of these cash settled share options is included in loss/gain on financial instruments in profit or loss. The appreciation in Sibanye-Stillwater’s share price for the six months ended 30 June 2016 of approximately 120%, resulted in a fair value loss of R1,181 million. The depreciation in the share price for the six months ended 31 December 2016 of approximately 49%, resulted in a fair value gain of R111 million.
GAIN/LOSS ON FOREIGN EXCHANGE DIFFERENCES
The gain on foreign exchange differences of R292 million in 2017 compared with R220 million in 2016 and a loss of R359 million in 2015. The gain on foreign exchange differences in 2017 was mainly due to exchange rate gains on the US dollar borrowings, including the US$350 million revolving credit facility (RCF), US$450 million Convertible Bond, derivative financial instrument and Burnstone Debt, of R685 million (2016: R415 million and 2015: loss of R412 million) partly offset by the exchange rate losses on other financial assets and financial liabilities of R339 million (2016: R196 million and 2015: R53 million).
SHARE OF RESULTS OF EQUITY-ACCOUNTED INVESTEES AFTER TAX
The profit from share of results of associates of R292 million in 2017 (2016: R13 million and 2015: R116 million) was primarily due to share of profits of R175 million relating to Sibanye-Stillwater’s attributable share in Mimosa and R124 million relating to its 33.1% interest in Rand Refinery Proprietary Limited.
IMPAIRMENTS
Impairments were R4,411 million in 2017, R1,381 million in 2016 and Rnil in 2015.
Despite joint efforts by all stakeholders, the continued losses and outcome of the Section 189 of the Labour Relations Act 66 of 1995 (S189) process, at the Cooke Operations and Beatrix West mine, led the Group to take a decision to impair the mining assets by R2,792 million (Cooke 1, 2 and 3: R2,187 million and Beatrix West: R604 million) at 30 June 2017.
Following the announcement of the transaction and exchange of selected surface gold processing assets and tailings storage facilities (TSFs) with DRDGOLD Limited (DRDGOLD), Sibanye-Stillwater will retain full ownership of the Cooke and Ezulwini TSFs, and as such, retains full exposure to the low uranium price environment without the higher gold TSF. As a result, a decision was taken to impair the “remaining” West Rand Tailings Retreatment Project (WRTRP) exploration and evaluation assets, and allocated goodwill by R1,344 million at 31 December 2017.
In addition, no expenditure on further exploration for and evaluation of the De Bron-Merriespruit mineral resources is budgeted or planned for 2018. As a result, a decision was taken to impair this exploration and evaluation asset by R227 million at 31 December 2017.
Despite joint efforts of stakeholders, the Cooke 4 underground mine and Ezulwini Gold and Uranium processing plant (the Cooke 4 Operation) was unable to meet required production and cost targets, and continued to operate at a loss. As a result a decision was taken during the six months ended 30 June 2016 to fully impair the Cooke 4 Operation’s mining assets by R817 million.
Due to a decrease in the rand gold price from 30 June 2016 and continued losses, a decision was taken during the six months ended 31 December 2016, to impair the goodwill allocated to the Cooke cash-generating unit (CGU) by R201 million and the Cooke 1, 2 and 3 mining assets by R355 million.
For additional information on the impairments, see –Annual financial statements–Notes to the consolidated financial statements–Note 8: Impairments.
OCCUPATIONAL HEALTHCARE EXPENSE
As a result of the progress made by the Occupational Lung Disease Working Group since 31 March 2017 on a variety of issues, management is now in a position to reliably estimate, within an acceptable range, the Group’s potential share of a possible settlement of the class action claims and related costs. As a result, the Group has provided R1,107 million before tax, for this obligation which impacts negatively on earnings for the period. For additional information on the impairments, see –Annual financial statements–Notes to the consolidated financial statements–Note 26: Occupational healthcare obligation.
RESTRUCTURING COSTS
Maintaining loss-making operations is not sustainable over an extended period. Cross-subsidising loss making operations erodes value, is a drain on cash flow and, as a result, threatens the sustainability and economic viability of other operations. The Group, therefore, continually reviews and assesses the operating and financial performance of the assets. In this regard, with ongoing rand strength impacting on revenues and after numerous attempts to address losses at the Cooke operations and Beatrix West mine, it became necessary to enter into S189 consultations with relevant stakeholders regarding restructuring at the SA gold operations.
Restructuring costs, including voluntary separation packages, of R730 million, were incurred at the SA Gold and PGM operations (2016: R188 million and 2015: R105 million) after the initial restructuring at the SA PGM operations was concluded during June 2017 and following the decision to commence restructuring at the SA gold operations pursuant to ongoing losses experienced at the Cooke operations and Beatrix West mine.
| |
Sibanye-Stillwater | Annual Financial Report 2017 | 139 |
Table of Contents
MANAGEMENT'S DISCUSSION AND ANALYSIS OF THE FINANCIAL STATEMENTS continued
TRANSACTION COSTS
The transaction costs were R552 million in 2017 compared with R157 million in 2016 and R26 million in 2015. The transaction costs in 2017 mainly related to the Stillwater acquisition of R529 million. The transaction costs in 2016 related to the Aquarius and Rustenburg operations acquisitions of R93 million (2015: R16 million) and R64 million (2015: R10 million), respectively.
GAIN ON ACQUISITION
A revised gain on acquisition of R2,179 million arose on the acquisition of the Rustenburg operations and is attributable to the fact that Anglo American Platinum has repositioned its portfolio by among others exiting certain assets. The Rustenburg operations Transaction represented an attractively priced entry for Sibanye-Stillwater into the PGM sector. For additional information on the Rustenburg operations acquisition and related gain on acquisition, see –Annual financial statements–Notes to the consolidated financial statements–Note 13.2: The Rustenburg operations acquisition.
NET LOSS ON DERECOGNITION OF FINANCIAL GUARANTEE ASSET AND LIABILITY
On 24 April 2015, Sibanye-Stillwater was released as guarantor by the note holders of Gold Fields Limited (Gold Fields) US$1 billion bond, resulting in a net loss on derecognition of the financial guarantee asset and financial guarantee liability of R158 million.
ROYALTIES
Royalties decreased by 30% to R399 million in 2017 from R567 million in 2016 and increased by 41% to R567 million in 2016 from R401 million in 2015. The decrease in 2017 and increase in 2016 was mainly due to the respective decrease and increase in revenue and profitability.
The rate of royalty tax payable as a percentage of revenue is set out in the table below.
| | | | |
| | | Revised | |
% | | 2017 | 2016 | 2015 |
Driefontein | | 1.0 | 2.2 | 2.4 |
Kloof | | 2.1 | 2.2 | 1.5 |
Beatrix | | 0.9 | 1.9 | 1.8 |
Cooke | | 0.8 | 0.5 | 0.6 |
Kroondal | | 0.2 | 0.5 | - |
Rustenburg operations | | 0.7 | 1.7 | - |
Group | | 1.1 | 1.8 | 1.8 |
MINING AND INCOME TAX
Mining and income tax decreased by 345% to a credit of R2,947 million in 2017 compared with a charge of R1,202 million in 2016 and increased by 219% to R1,202 million in 2016 from R377 million in 2015. The table below indicates Sibanye-Stillwater’s effective tax expense rate in 2017, 2016 and 2015.
| | | | |
| | | Revised | |
| | 2017 | 2016 | 2015 |
Mining and income tax | Rm | (2,949.1) | 1,202.1 | 377.2 |
Effective tax rate | % | 40.0 | 28.3 | 41.2 |
In 2017, the effective tax rate of 40.0% was higher than the South African statutory company tax rate of 28.0% mainly due to the tax effect of the following:
| · | | R158 million related to the mining tax formula rate adjustment; |
| · | | R2,571 million deferred tax credit on decrease of the long-term expected tax rate; |
The above were offset by the following:
| · | | R166 million non-deductible finance charges; |
| · | | R1,055 million non-deductible impairments; |
| · | | R155 million non-deductible transaction costs; |
| · | | R303 million assessed losses and other deductible temporary differences not recognised; and |
| · | | R170 million net non-taxable income and non-deductible expenditure. |
In 2016, the effective tax expense rate of 28.3% was marginally higher than the South African statutory company tax rate of 28.0% mainly due to the tax effect of the following:
| · | | R116 million non-deductible charges related to share-based payments; |
| · | | R52 million non-deductible loss on foreign exchange differences; |
| · | | R66 million non-deductible impairments; |
| · | | R60 million deferred tax charge on increase of the long-term expected tax rate; |
| · | | R430 million assessed losses and other deductible temporary differences not recognised; |
| · | | R62 million net non-taxable income and non-deductible expenditure. |
| |
Sibanye-Stillwater | Annual Financial Report 2017 | 140 |
Table of Contents
MANAGEMENT'S DISCUSSION AND ANALYSIS OF THE FINANCIAL STATEMENTS continued
The above were offset by the following:
| · | | R161 million reduction related to the mining tax formula rate adjustment; and |
| · | | R610 million non-taxable gain on acquisition. |
In 2015, the effective tax expense rate of 41.2% was higher than the South African statutory company tax rate of 28.0% mainly due to the tax effect of the following:
| · | | R26 million non-deductible amortisation and depreciation; |
| · | | R33 million non-deductible charges related to share-based payments; |
| · | | R29 million deferred tax charge on increase of long-term expected tax rate; and |
| · | | R267 million assessed losses and other deductible temporary differences not recognised. |
The above were offset by the following:
| · | | R130 million reduction related to the mining tax formula rate adjustment; |
| · | | R18 million non-taxable gain on foreign exchange differences; |
| · | | R33 million non-taxable share of results of equity-accounted investees; and |
| · | | R55 million non-taxable gain on derecognition of financial guarantee liability. |
PROFIT FOR THE YEAR
As a result of the factors discussed above, the loss in 2017 was R4,433 million compared with the profit in 2016 and 2015 of R3,043 million and R538 million, respectively.
The following table depicts contributions from various segments to the profit.
| | | | |
| | | Revised | |
Figures in million - SA rand | | 2017 | 2016 | 2015 |
SA gold operations | | | | |
Driefontein | | 413 | 1,745 | 1,089 |
Kloof | | 957 | 1,615 | 510 |
Beatrix | | (419) | 760 | 356 |
Cooke | | (4,602) | (1,957) | (699) |
SA PGM operations | | | | |
Kroondal | | (63) | 89 | - |
Platinum Mile | | 38 | 18 | - |
Mimosa | | 175 | 115 | - |
Rustenburg operations | | (643) | 2,050 | - |
US PGM operations - Stillwater | | 2,028 | - | - |
LIQUIDITY AND CAPITAL RESOURCES
CASH FLOW ANALYSIS
Net cash generated in 2017 was R1,403 million compared with R408 million in 2016 and compared with R154 million in 2015.
The principal factors explaining the changes in net cash flow for the year are set out in the table below.
| | | | | | |
Figures in million - SA rand | | 2017 | 2016 | % Change
2017/2016 | 2015 | % Change
2016/2015 |
Net cash from operating activities | | 2,741 | 4,406 | (38) | 3,515 | 25 |
Dividends paid | | (560) | (1,612) | 65 | (658) | (145) |
Additions to property, plant and equipment | | (6,099) | (4,151) | (47) | (3,345) | (24) |
Free cash flow1 | | (2,798) | 1,866 | (250) | 829 | 125 |
Acquisition of subsidiaries, net of cash acquired | | (25,594) | (5,307) | (382) | - | (100) |
Proceeds on disposal of investments | | 3,605 | - | 100 | - | - |
Net proceeds from shares issued | | 12,932 | - | 100 | - | - |
Net borrowings raised/(repaid) | | 13,874 | 5,446 | 155 | (21) | (26,156) |
1 One of the most important drivers to sustain and increase shareholder value is free cash flow generation as that determines the cash available for dividends and other investing activities. Free cash flow is defined as net cash from operating activities before dividends, less additions to property, plant and equipment.
| |
Sibanye-Stillwater | Annual Financial Report 2017 | 141 |
Table of Contents
MANAGEMENT'S DISCUSSION AND ANALYSIS OF THE FINANCIAL STATEMENTS continued
CASH FLOWS FROM OPERATING ACTIVITIES
Cash from operating activities decreased to R2,741 million in 2017 from R4,406 million in 2016 and increased in 2016 from R3,515 million in 2015. The items contributing to the decrease in 2017 and increase in 2016 are indicated in the table below.
| | | |
Figures in million - SA rand | | 2017 | 2016 |
(Decrease)/increase in cash generated by operations1 | (2,738) | 3,706 |
Decrease/(increase) in cash-settled share-based payments paid2 | 1,085 | (1,476) |
(Increase)/decrease in change in working capital | (285) | 430 |
Increase in interest paid | (1,613) | (181) |
Decrease/(increase) in tax and royalties paid3 | 833 | (681) |
Decrease/(increase) in dividends paid4 | 1,052 | (954) |
Other | 1 | 46 |
(Decrease)/increase in cash flows from operating activities | (1,665) | 890 |
1 The decrease in cash generated by operations in 2017 was mainly due to the decrease in the average realised rand gold price to R536,378/kg in 2017 from R586,319/kg in 2016. The increase in cash generated by operations in 2016 was mainly due to the increase in the average realised US dollar gold price to US$1,242/oz in 2016 from US$1,160/oz in 2015 and the 15% weaker rand of R14.68/US$ in 2016 compared with R12.75/US$ in 2015.
2 Approximately 70% of cash-settled instruments vested during 2016 resulting in an decrease in the cash-settled share-based payments paid in 2017.
3 The decrease in tax and royalties paid in 2017 was due to the decrease in taxable mining income.The increase in tax and royalties paid in 2016 was due to increased revenue.
4 The dividend declared and paid in 2017 related to the final dividend of 60 cents per share (cps) of R558 million in respect of the six months ended 31 December 2016 (2015: 90 cps or R825 million). There was no interim dividend in respect of the six months ended 30 June 2017 (2016: 85cps or R785 million).
CASH FLOWS FROM INVESTING ACTIVITIES
Cash used in investing activities increased to R28,144 million in 2017 from R9,444 million in 2016 and increased in 2016 from R3,340 million in 2015. The increase in cash from investing activities in 2017 was mainly due the acquisition of Stillwater in 2017 for R27,386 million, partly offset by the proceeds on disposal of Stillwater’s marketable securities investments of R3,605 million. The increase in cash from investing activities in 2016 was mainly due the acquisitions of Aquarius and the Rustenburg operations in 2016 for R5,802 million.
Capital expenditure increased by 47% to R6,099 million in 2017 from R4,151 million in 2016 and increased by 24% in 2016 from R3,345 million in 2015. Capital expenditure at the individual mines is shown in the table below.
| | | | |
Figures in million - SA rand | | 2017 | 2016 | 2015 |
SA gold operations | | 3,410 | 3,824 | 3,345 |
Driefontein | | 1,156 | 1,052 | 994 |
Kloof | | 1,234 | 1,304 | 1,130 |
Beatrix | | 546 | 628 | 597 |
Cooke | | 74 | 249 | 337 |
SA PGM operations | | 1,035 | 327 | - |
Kroondal | | 191 | 176 | - |
Rustenburg operations | | 831 | 149 | - |
Platinum Mile | | 13 | 3 | - |
US PGM operations - Stillwater | | 1,654 | - | - |
CASH FLOWS FROM FINANCING ACTIVITIES
Cash from financing activities increased to R26,807 million in 2017 from R5,446 million in 2016 and increased in 2016 from R21 million used in 2015.
During 2017, the acquisition of Stillwater was financed by a US$2.65 billion bridge loan (Stillwater Bridge Facility). The Stillwater Bridge Loan was partially repaid through the US$1 billion rights offer. On 27 June 2017, Sibanye-Stillwater completed a two tranche US$1.05 billion international corporate bond offering. The proceeds of the bond offering were applied to the partial repayment of the Stillwater Bridge Facility raised for the acquisition of Stillwater. The balance was repaid through the issuance of a US$450 million Convertible Bond, which was launched and priced on 19 September 2017. The US$450 million Convertible Bond includes an option component, which is recognised as a derivative financial instrument.
On 4 April 2016, Sibanye-Stillwater drew down R1,330 million under the R4.5 billion Facilities and US$145 million (R2,218 million) under the US$350 million revolving credit facility (RCF) to fund the acquisition of Aquarius. On various dates during 2016, Sibanye-Stillwater made further additional drawdowns of R606 million and repaid R650 million under the R4.5 billion Facilities, and repaid US$45 million (R653 million) under the US$350 million RCF. On 15 November 2016, Sibanye-Stillwater cancelled and refinanced the R4.5 billion Facilities by drawing R3.2 billion under the R6.0 billion RCF. Sibanye-Stillwater made additional drawdowns of R1.9 billion under the R6.0 billion RCF to fund the upfront cash payment for the acquisition of the Rustenburg operations and for other working capital requirements.
On various dates during 2015, Sibanye-Stillwater made additional drawdowns of R1,000 million and repaid R1,021 million under the R4.5 billion Facilities.
NET INCREASE/(DECREASE) IN CASH AND CASH EQUIVALENTS
As a result of the above, net cash generated in 2017 amounted to R1,403 million compared with R408 million in 2016 and R155 million in 2015.
Total Group cash and cash equivalents amounted to R2,062 million at 31 December 2017 (2016: R968 million and 2015: R717 million).
| |
Sibanye-Stillwater | Annual Financial Report 2017 | 142 |
Table of Contents
MANAGEMENT'S DISCUSSION AND ANALYSIS OF THE FINANCIAL STATEMENTS continued
STATEMENT OF FINANCIAL POSITION
BORROWINGS
Total borrowings (short- and long-term) excluding R1,538 million attributable to the Burnstone project, which has no recourse to Sibanye-Stillwater’s balance sheet, and including the R1,094 million derivative financial instrument increased to R25,206 million at 31 December 2017 from R7,221 million at 31 December 2016 (2015: R1,995 million).
At 31 December 2017, Sibanye-Stillwater had committed unutilised banking facilities of R3,653 million available under the R6.0 billion RCF and US$350 million RCF.
For a description of borrowings, see –Annual financial statements–Notes to the consolidated financial statements–Note 24: Borrowings to the consolidated financial statements.
WORKING CAPITAL AND GOING CONCERN ASSESSMENT
For the year ended 31 December 2017, the Group incurred a loss of R4,433 million (2016: profit of R3,043 million). As at 31 December 2017, the Group’s current assets exceeded its current liabilities by R3,567 million (2016: R1,447 million) and during the year then ended the Group generated cash from operating activities of R2,741 million (2016: R4,406 million).
Gold and PGMs are sold in US dollars, and while the majority of the Group’s gold and a substantial amount of the Group’s PGMs costs are denominated in rand, the Group’s results and financial condition may be impacted if there is a material change in the value of the rand.
Subsequent to year end, the average rand/US dollar exchange rate strengthened to R11.68/US$ from the average exchange rate of R13.31/US$ for the year ended 31 December 2017. Management has performed various sensitivities relating to the rand/US dollar exchange rate and the impact on the rand commodity prices. Should a strong rand/US dollar exchange rate persist without a corresponding gain in commodity prices, the Group could consider increasing operational flexibility by adjusting mine plans, reducing capital expenditure and/or selling assets. The Group may also, if necessary, consider options to increase funding flexibility which may include, among others, streaming facilities, prepayment facilities, facility restructuring or, in the event that other options are not deemed preferable or achievable by the Board, an equity capital raise.
The Group currently has committed undrawn debt facilities of R3,653 million at 31 December 2017. In order to maintain adequate liquidity, the refinancing and upsizing of the US$350 million RCF, maturing on 23 August 2018, to US$600 million, has been initiated. The facility has been fully syndicated with a group of eight international banks having provided commitment letters. The facility documentation is expected to be executed by the end of March 2018. The terms and conditions largely mirror the current US$350 million RCF which is US$92 million drawn as at 31 December 2017. On successful completion an additional US$250 million (approximately R3,000 million) of committed unutilised financing would be available.
Sibanye-Stillwater’s leverage ratio (or net debt to adjusted EBITDA) at 31 December 2017 is 2.6. Using the committed unutilised debt facilities could impact on the leverage ratio if used to fund operating losses. As indicated above, management have significant operational and financing flexibility and will continue to manage the operations and capital structure to ensure compliance with debt covenants. The borrowing facilities, permit a leverage ratio of 3.5:1 through to 31 December 2018, and 2.5:1, thereafter, calculated on a quarterly basis. Consistent with its long-term strategy, Sibanye-Stillwater plans to deleverage over time to its targeted leverage ratio of no greater than 1.0:1.
The directors believe that the cash generated by its operations, cash on hand, the committed unutilised debt facilities as well as additional funding opportunities will enable the Group to continue to meet its obligations as they fall due. The consolidated financial statements for the year ended 31 December 2017, therefore, have been prepared on a going concern basis.
Off balance sheet arrangements and contractual commitments
At 31 December 2017, Sibanye-Stillwater had no off balance sheet items. For a description of Sibanye-Stillwater’s contractual commitments, see the following notes to the consolidated financial statements.
| |
Contractual commitments | Note to the consolidated financial statements |
Environmental rehabilitation obligation | 25 – Environmental rehabilitation obligation |
Occupational healthcare obligation | 26 – Occupational healthcare obligation |
Commercial commitments | 31 – Commitments |
Contingent liabilities | 32 – Contingent liabilities |
Debt | |
– capital | 24 – Borrowings |
– interest | 30.2 – Risk management activities |
These contractual commitments for expenditure, together with other expenditure and liquidity requirements, will be met from internal cash flow and, to the extent necessary, from the existing facilities.
CRITICAL ACCOUNTING POLICIES AND ESTIMATES
Sibanye-Stillwater’s significant accounting policies are fully described in the various notes to its consolidated financial statements. Some of Sibanye-Stillwater’s accounting policies require the application of significant judgements and estimates by management that can affect the amounts reported in the consolidated financial statements.
These judgements and estimates are based on management’s best knowledge of the relevant facts and circumstances, having regard to previous experience, but actual results may differ from the amounts included in the consolidated financial statements.
| |
Sibanye-Stillwater | Annual Financial Report 2017 | 143 |
Table of Contents
MANAGEMENT'S DISCUSSION AND ANALYSIS OF THE FINANCIAL STATEMENTS continued
For Sibanye-Stillwater’s significant accounting policies that are subject to significant judgements, estimates and assumptions, see the following notes to the consolidated financial statements:
| |
Significant accounting policy | Note to the consolidated financial statements |
Basis of preparation | 1 – Accounting policies |
Consolidation | 1 – Accounting policies |
Revenue | 3 – Revenue |
Royalties, mining and income tax, and deferred tax | 9 – Royalties, mining and income tax, and deferred tax |
Property, plant and equipment | 12 – Property, plant and equipment |
Business combinations | 13 – Acquisitions |
Goodwill | 14 – Goodwill |
Equity-accounted investments | 15 – Equity accounted investments |
Other receivables and other payables | 18 – Other receivables and other payables |
Inventories | 19 – Inventories |
Borrowings | 24 – Borrowings |
Environmental rehabilitation obligation | 25 – Environmental rehabilitation obligation |
Occupational healthcare obligation | 26 – Occupational healthcare obligation |
Contingent liabilities | 32 – Contingent liabilities |
| |
Sibanye-Stillwater | Annual Financial Report 2017 | 144 |
Table of Contents
MANAGEMENT'S DISCUSSION AND ANALYSIS OF THE FINANCIAL STATEMENTS continued
The directors are responsible for the preparation and fair presentation of the consolidated annual financial statements of Sibanye-Stillwater, comprising the consolidated statement of financial position at 31 December 2017, and consolidated income statement and consolidated statements of comprehensive income, changes in equity and cash flows for the year then ended, and the notes to the consolidated financial statements, which include a summary of significant accounting policies, and other explanatory notes, in accordance with IFRS, as issued by the International Accounting Standards Board (IASB), the SAICA Financial Reporting Guides issued by the Accounting Practices Committee and Financial Reporting Pronouncements issued by the Financial Reporting Standards Council, as well as the requirements of the South African Companies Act, 71 of 2008 (the Companies Act) and the JSE Listings Requirements.
In addition, the directors are responsible for preparing the directors’ report.
The directors consider that, in preparing the consolidated financial statements, they have used the most appropriate accounting policies, consistently applied and supported by reasonable and prudent judgements and estimates, and that all IFRS standards that they consider to be applicable have been complied with for the financial year ended 31 December 2017. The directors are satisfied that the information contained in the consolidated financial statements fairly presents the results of operations for the year and the financial position of the Group at year end. The directors are responsible for the information included in the annual financial report, and are responsible for both its accuracy and its consistency with the consolidated annual financial statements.
The directors have responsibility for ensuring that accounting records are kept. The accounting records should disclose with reasonable accuracy the financial position of the Group to enable the directors to ensure that the consolidated annual financial statements comply with the relevant legislation.
The Group operated in a well-established control environment, which is well documented and regularly reviewed. This incorporates risk management and internal control procedures, which are designed to provide reasonable assurance that assets are safeguarded and the material risks facing the business are being controlled.
The directors have made an assessment of the ability of the Company and its subsidiaries to continue as going concerns and have no reason to believe that Sibanye-Stillwater and its subsidiaries will not be going concerns in the year ahead.
Sibanye-Stillwater has adopted a Code of Ethics, applicable to all directors and employees, which is available on Sibanye-Stillwater’s website at www.sibanyestillwater.com.
The Group’s external auditors, KPMG Inc. audited the consolidated annual financial statements. For their report, see Accountability–Report of independent registered public accounting firm.
The consolidated annual financial statements were approved by the Board of Directors and are signed on its behalf by:
Neal Froneman
Chief Executive Officer
Charl Keyter
Chief Financial Officer
29 March 2018
COMPANY SECRETARY’S CONFIRMATION
In terms of section 88(2)(e) of the Companies Act, as amended, I certify that the Company has lodged with the Companies and Intellectual Property Commission all such returns as are required to be lodged by a public company in terms of the Companies Act, and that all such returns are true, correct and up to date.
Cain Farrel
Company Secretary
29 March 2018
| |
Sibanye-Stillwater | Annual Financial Report 2017 | 145 |
INTRODUCTION
The Audit Committee has formal terms of reference which are updated on an annual basis. The Board is satisfied that the Audit Committee has complied with these terms, and with its legal and regulatory responsibilities as set out in the Companies Act, King IV and the JSE Listings Requirements.
The Audit Committee consisted of four independent non-executive directors from 1 January 2017 to 22 May 2017 and five independent directors from 23 May 2017 to 31 December 2017. For membership, see –Accountability–Directors’ report–Directorate–Composition of the Board and sub-committees.
The Board believes that the members collectively possess the knowledge and experience to supervise Sibanye-Stillwater’s financial management, internal and external auditors, the quality of Sibanye-Stillwater’s financial controls, the preparation and evaluation of Sibanye-Stillwater’s audited consolidated annual financial statements and Sibanye-Stillwater’s periodic financial reporting.
The Board has established and maintains internal controls and procedures, which are reviewed on a regular basis. These are designed to manage the risk of business failures and to provide reasonable assurance against such failures. However, this is not a guarantee that such risks are eliminated.
Responsibility
It is the duty of the Audit Committee, inter alia, to monitor and review:
| · | | the effectiveness of the internal audit function; findings and the appointment of external auditors; reports of both internal and external auditors; |
| · | | evaluation of the performance of the chief financial officer (CFO); |
| · | | the governance of information technology (IT) and the effectiveness of the Group’s information systems; |
| · | | interim and annual financial and operating reports, the audited consolidated annual financial statements and all other widely distributed financial documents; |
| · | | the Form 20‑F filing with the SEC; |
| · | | accounting policies of the Group and proposed revisions; |
| · | | compliance with applicable legislation, requirements of appropriate regulatory authorities and Sibanye-Stillwater’s Code of Ethics; |
| · | | the integrity of the annual financial report and associated reports (by ensuring that its content is reliable and recommending it to the Board for approval); and |
| · | | policies and procedures for preventing and detecting fraud. |
Internal and external auditors have unrestricted access to the Audit Committee, the Audit Committee chairman and the chairman of the Board, ensuring that auditors are able to maintain their independence. Both the internal and external auditors report at Audit Committee meetings. The Audit Committee also meets with both internal and external auditors separately without other invitees being present. Management attend Audit Committee meetings by invitation.
annual financial statements
The Committee has reviewed and is satisfied the accounting policies and financial statements of the Group are appropriate and comply with IFRS, the JSE Listings Requirements and the requirements of the Companies Act.
The significant audit matters considered by the Committee were:
| · | | the Stillwater acquisition and related purchase price accounting; |
| · | | the liquidity risk and ability to access, service and repay debt; |
| · | | the impairment assessment of property, plant and equipment, and goodwill arising from business combinations; |
| · | | the recognition of the occupational healthcare obligation; and |
| · | | the fair value of the derivative financial instrument. |
These matters were addressed as follows:
| · · · |
The impairment assessment of property, plant and equipment, and goodwill arising from business combinations | For the year ended 31 December 2017, management performed an impairment assessment over the property, plant and equipment, and goodwill balance as follows: assessed the recoverable amount (based on the expected discounted cash flows of the expected ore reserves and costs to extract the ore); calculated the fair value for each cash-generating unit (CGU) using a discounted cash flow model; and performed a sensitivity analysis over the fair value calculations, by varying the assumptions used (long-term commodity prices and WACC, i.e. discount rate) to assess the impact on the valuations. Management impaired the Cooke operations and Beatrix West mining assets; the WRTRP exploration and evaluation assets, and allocated goodwill; and De Bron-Merriespruit exploration and evaluation assets by R4,403 million. |
| |
Sibanye-Stillwater | Annual Financial Report 2017 | 146 |
The Stillwater acquisition and related purchase price accounting | For the year ended 31 December 2017, management prepared the purchase price allocation of the Stillwater acquisition as follows: engaged an external valuation expert and US tax specialists to assist with determining the fair value of the assets acquired and liabilities assumed; the external valuation expert calculated the fair value of the property, plant and equipment based on the expected discounted cash flows of the expected ore reserves and costs to extract the ore discounted at a real discount rate; and the US tax specialist determined the long-term tax rate. Management recognised goodwill of R5,874 million, attributable to the talent and skills of Stillwater’s workforce. |
The fair value of the derivative financial instrument | For the year ended 31 December 2017, management engaged a calculation agent to determine the fair value of the derivative financial liability at 26 September 2017 and 31 December 2017. At 26 September 2017, management recognised the derivative financial liability of R1,297 million, and during the period ended 31 December 2017 recognised a gain on the derivative financial liability of R116 million. |
The recognition of the occupational healthcare obligation | As a result of the ongoing work of the Occupational Lung Disease Group (the Working Group), engagements with affected stakeholders and the likely settlement of the occupational healthcare claims, it became possible for management to reasonably estimate its share of the estimated settlement of the class action claims and related costs. The Working Group engaged an actuarial expert to assist with determining the estimated costs of settlement claims and related costs. Management recognised an occupational healthcare obligation of R1,077 million at 30 June 2017. |
The liquidity risk and ability to access, service and repay debt | In order to maintain adequate liquidity, management initiated a process to refinance and upsize the US$350 million RCF, which matures on 23 August 2018, to US$600 million. The US$600 million facility has been fully syndicated with a group of eight international banks having provided commitment letters. The facility documentation is expected to be executed towards the end of March 2018. The terms and conditions largely mirror the current US$350 million RCF. This will increase available RCF facilities by about US$250 million, providing additional balance sheet flexibility. |
Auditor suitability review
In terms of section 90(1) of the Companies Act, each year at its annual general meeting (AGM), the Company must appoint an external audit firm and designated individual partner that comply with the requirements of section 90(2) of the Companies Act and with the JSE Listings Requirements.
The Board delegated to the Audit Committee the authority to review and recommend the Company’s current appointed audit firm and designated individual audit partner for re-appointment to the Board, which would then make a recommendation to the shareholders in the notice of AGM.
Accordingly, in compliance with paragraph 3.84(g)(iii) of the JSE Listings Requirements, the Audit Committee assessed the suitability for re-appointment of the current appointed audit firm, being KPMG Inc., and the designated individual partner, being Henning Opperman (Auditor Suitability Review).
The Auditor Suitability Review performed by the Audit Committee included an examination and review of:
| · | | the results of the most recent Independent Regulatory Board of Auditors (IRBA), International Standard on Quality Control (ISQC) 1, engagement inspection of KPMG Inc. and all audit engagement partners involved with the Sibanye-Stillwater group audit, including the designated individual partner; |
| · | | the results of the most recent firm wide ISQC 1 engagement inspection performed by KPMG Inc. itself, which included a review of all remedial actions effected in terms of the KPMG International review announced in 2017 (KPMG International Report); |
| · | | the results of the most recent firm-wide Public Company Accounting Oversight Board (PCAOB) inspection review of KPMG Inc.; |
| · | | the results of the most recent firm-wide PCAOB inspection review of KPMG International; |
| · | | the Myburg Report which confirmed the findings and recommended remedial actions of the KPMG International Report; and |
| · | | a summary and results of all legal and disciplinary proceedings concluded within the past seven years, which were instituted in terms of any legislation or by any professional body of which the audit firm and/or designated individual auditor are a member or regulator to whom they are accountable, including where the matter is settled by consent order or payment of a fine. |
As part of the Auditor Suitability Review, the Audit Committee met with KPMG Inc.’s independent chairman, chief executive officer, chief operating officer and three audit partners (involved in the group audit of Sibanye-Stillwater) and enquired extensively concerning:
| · | | the sustainability of KPMG Inc., going forward; |
| · | | the culture change being implemented to prevent a recurrence of governance lapses; |
| · | | the remedial actions effected in terms of the KPMG International Report and that all relevant audit persons have been identified and have left KPMG Inc.; and |
| · | | the new client identification and approval system in place which takes account of the risk profile of each proposed client concerned, with a particular emphasis of the review of any proposed state-owned enterprise appointments. |
The Audit Committee notes that the current SAICA investigation, current IRBA engagement inspection and current PCAOB engagement inspection of KPMG Inc. are in process and have not yet been concluded (referred to collectively as Investigation and Inspections).
The Audit Committee has enquired of KPMG Inc. as to whether it believes there may be any problematic findings arising from the investigation and inspections and has been assured that to the best of KPMG Inc.’s knowledge it is not expecting any problematic findings.
| |
Sibanye-Stillwater | Annual Financial Report 2017 | 147 |
Based on the results of the Auditor Suitability Review and a review of the independence of KPMG Inc. and the designated individual audit partner, the Audit Committee is satisfied that there are no current material matters that have not been addressed by KPMG Inc., following the remedial actions effected in 2017 and accordingly recommends that KPMG Inc. be re-appointed as the auditors of the Company and that Henning Opperman be re-appointed as the designated individual partner. The Audit Committee has satisfied itself that both KPMG Inc. and Henning Opperman are accredited in terms of the JSE Listings Requirements. The Board concurred with the recommendation.
The Audit Committee and Board will review the findings of the Investigation and Inspections referred to above when they are individually concluded, and will take any further action deemed appropriate at that time.
In addition, the Audit Committee has recommended to the Board that in order to improve the governance relating to the appointment of an audit firm and designated individual auditor, that such appointment be subject to a full commercial review process every five years.
Auditor independence and fees
The Audit Committee is also responsible for determining that the external audit firm and designated individual partner have the necessary independence, experience, qualifications and skills, and that audit and other fees are reviewed and approved.
The Audit Committee has reviewed and assessed the independence of the external auditor, and has confirmed in writing that the criteria for independence, as set out in the rules of the Independent Regulatory Board for Auditors and international bodies, have been followed. The Audit Committee is satisfied that KPMG Inc. is independent of the Group. The following aggregate audit, audit-related fees, tax fees and all other fees were billed by our external auditors (KPMG Inc.) for 2017, 2016 and 2015:
| | | | |
Figures in million - SA rand | | 2017 | 2016 | 2015 |
Audit fees1 | | 40.1 | 24.8 | 19.0 |
Audit-related fees2 | | 7.1 | 4.1 | 3.0 |
Tax fees3 | | 1.6 | 0.1 | 0.2 |
All other fees4 | | 11.4 | 8.9 | 0.8 |
Total | | 60.2 | 37.9 | 23.0 |
1 Audit fees consist of fees billed for the annual audit of Sibanye-Stillwater’s consolidated financial statements, audit of the Group’s internal controls over financial reporting in accordance with section 404 of the Sarbanes-Oxley Act and the audit of statutory financial statements of the Company’s subsidiaries, including fees billed for assurance and related services that are reasonably related to the performance of the audit or reviews of the Company’s financial statements that are services that only an external auditor can reasonably provide.
2 Audit-related fees consist of the review of documents filed with regulatory authorities, consultations concerning financial accounting and reporting standards, review of security controls and operational effectiveness of systems, and due diligence related to acquisitions.
3 Tax fees include fees billed for tax compliance, tax advice, tax planning and other tax-related services.
4 All other fees consist of fees for all other services not included under audit fees, audit related fees or tax fees.
The Audit Committee determines the nature and extent of non-audit services that the firm can provide and pre-approves all permitted non-audit assignments by the Group’s independent auditor. In accordance with the SEC rules regarding auditor independence, the Audit Committee has established policies and procedures for audit and non-audit services provided by an independent auditor. The rules apply to Sibanye-Stillwater and its consolidated subsidiaries engaging any accounting firms for audit services and the auditor who audits the accounts filed with the SEC (the external auditor) for permissible non-audit services. When engaging the external auditor for permissible non-audit services (audit related services, tax services, and all other services), pre-approval is obtained prior to the commencement of the services.
The Audit Committee approves the annual audit plan presented by the external auditors and monitors progress against the plan. The audit plan provides the Audit Committee with the necessary assurance on risk management, internal control environments and IT governance.
Internal Audit
The internal control systems of the Group are monitored by internal auditors who report their findings and recommendations to the Audit Committee and to senior management. The Audit Committee determines the purpose, authority and responsibility of the internal audit function (Internal Audit) in an Internal Audit Charter. The internal audit function is headed by the Vice President: Internal Audit, who may be appointed or dismissed by the Audit Committee. The Audit Committee is satisfied that the incumbent Vice President: Internal Audit has the requisite skills and experience and that she is supported by a sufficient staff complement with appropriate skills and training.
Sibanye-Stillwater’s Internal Audit operates in accordance with the International Standards for the Professional Practice of Internal Auditing as prescribed by the Institute of Internal Auditors. The internal audit activities carried out during the year were identified through a combination of the Sibanye-Stillwater Risk Management framework and the risk-based methodologies adopted by Internal Audit. The Audit Committee approves the annual internal audit assurance plan presented by Internal Audit and monitors progress against the plan.
Internal Audit reports deficiencies to the Audit Committee every quarter together with recommended remedial actions, which are then followed up. Internal Audit provided the Audit Committee with a written report, which assessed as adequate the internal controls over financial reporting, IT governance and the risk management process during 2017.
The Audit Committee is responsible for IT governance on behalf of the Board and reviews the report of the IT Senior Manager at each Audit Committee meeting.
In accordance with the JSE Listings Requirements, the Audit Committee reports and confirms that it has:
| · | | evaluated the expertise, experience and performance of the Company and Group CFO during 2017 and is satisfied that he has the appropriate expertise and experience to carry out his duties, and is supported by qualified and competent senior staff; |
| · | | ensured that the Company and Group has established appropriate financial reporting procedures in place and that those procedures are operating correctly and that there has been no breach of any required financial reporting for the 2017 financial year; and |
| · | | has performed the Auditor Suitability Review of both the current appointed external audit firm and designated individual partner as detailed above. |
| |
Sibanye-Stillwater | Annual Financial Report 2017 | 148 |
AUDIT COMMITTEE STATEMENT
Based on information from, and discussions with, management and external auditors, the Audit Committee has no reason to believe that there were any material breakdowns in the design and operating effectiveness of internal financial controls during the year and that the financial records may be relied upon as the basis for preparation of the audited consolidated annual financial statements.
The Audit Committee has considered and discussed the audited annual financial statements and associated reports with both management and the external auditors.
During this process, the Audit Committee:
| · | | evaluated significant judgements and reporting decisions; |
| · | | determined that the going-concern basis of reporting is appropriate; |
| · | | evaluated the material factors and risks that could impact on the annual financial report and associated reports; |
| · | | evaluated the completeness of the financial and sustainability discussion and disclosures; and |
| · | | discussed the treatment of significant and unusual transactions with management and the external auditors. |
The Audit Committee considers that the audited annual financial statements comply in all material respects with the statutory requirements of the various laws and regulations governing disclosure and reporting of the audited annual financial statements and that the audited annual financial statements comply in all material respects with IFRS, as issued by the IASB, the SAICA Financial Reporting Guides issued by the Accounting Practices Committee and Financial Reporting Pronouncements issued by the Financial Reporting Standards Council, as well as the requirements of the South African Companies Act and the JSE Listings Requirements. The Audit Committee has recommended to the Board that the audited annual financial statements be adopted and approved by the Board.
Keith Rayner CA(SA)
Chairman: Audit Committee
29 March 2018
| |
Sibanye-Stillwater | Annual Financial Report 2017 | 149 |
The directors have pleasure in submitting this report and the consolidated annual financial statements of Sibanye-Stillwater for the year ended 31 December 2017.
GROUP PROFILE AND LOCATION OF OUR OPERATIONS
Sibanye-Stillwater, an independent, global, precious metals mining company, produces a mix of metals that includes gold and platinum PGMs. Domiciled in South Africa, Sibanye-Stillwater currently owns and operates a portfolio of high-quality operations and projects, which are grouped into two regions: SA region and the US region.
In South Africa, our gold producing assets and projects are located throughout the Witwatersrand Basin and our PGM assets are on the southern portion of the western limb of the Bushveld Complex, near Rustenburg. Mimosa, in the south of the Great Dyke in Zimbabwe, is a PGM-joint venture with Impala Platinum Holdings Limited (Implats).
Our US PGM-producing assets are located in a geological formation, the J-M Reef, in south-central Montana. The J-M Reef, the only known significant source of PGMs in the United States, is the highest-grade PGM deposit known in the world.
At 31 December 2017, Sibanye-Stillwater had gold mineral reserves of 25.7Moz (2016: 28.7Moz and 2015: 31.0Moz), uranium mineral reserves of 96.1Mlb (2016: 113.2Mlb and 2015: 113.8Mlb), 4E PGM mineral reserves of 22.4Moz (2016: 23.2Moz) (at the SA PGM operations) and 2E PGM mineral reserves of 21.9Moz) (at the US PGM operations).
REVIEW OF OPERATIONS
For a review of Sibanye-Stillwater’s operations, see –Overview–Management’s discussion and analysis of the financial statements–2017 financial performance compared with 2016 and 2015.
FINANCIAL RESULTS
The information on the financial position of the Group for the year ended 31 December 2017 is set out in the consolidated annual financial statements including the notes, which appear elsewhere in this annual financial report. The income statement for the Group shows a loss of R4,433 million for the year ended 31 December 2017 compared with a profit of R3,043 million in 2016.
DIRECTORATE
COMPOSITION OF THE BOARD AND SUB-COMMITTEES
On 23 May 2017, Christopher Chadwick resigned as a non-executive director and Savannah Danson was appointed as an independent non-executive director. She is eligible and available for election. On 18 September 2017, Robert Chan and Yuan Jiyu resigned as non-executive directors.
The membership of the Board and its sub-committees is set out in the table below.
Board | Audit | Nominating and governance | Remuneration | Risk | Social and Ethics | Safety, health and sustainable development |
Sello Moloko (chairman) | | Chairman | ü | | ü | ü |
Neal Froneman | | | | | | ü |
Charl Keyter | | | | | | |
Tim Cumming | | | Chairman | ü | ü | |
Savannah Danson | ü | | ü | | | |
Barry Davison | | ü | ü | | ü | Chairman |
Rick Menell | ü | ü | | Chairman | ü | ü |
Nkosemntu Nika | ü | ü | ü | | | |
Keith Rayner | Chairman | | ü | ü | ü | |
Sue van der Merwe | ü | | | | | ü |
Jerry Vilakazi | | ü | | | Chairman | |
ROTATION OF DIRECTORS
Directors retiring in terms of the Company’s Memorandum of Incorporation (MOI) are Savannah Danson, Rick Menell, Keith Rayner and Jerry Vilakazi. All the directors are eligible and offer themselves for re-election.
DIRECTORS’ AND OFFICERS’ DISCLOSURE OF INTERESTS IN CONTRACTS
As of the date of this report, none of the directors, officers or major shareholders of Sibanye-Stillwater or, to the knowledge of Sibanye-Stillwater’s management, their families, had any interest, direct or indirect, in any transaction during the last fiscal year or in any proposed transaction which has affected or will materially affect Sibanye-Stillwater or its investment interests or subsidiaries. None of the directors or officers of Sibanye-Stillwater or any associate of such director or officer is currently or has been at any time during the past fiscal year materially indebted to Sibanye-Stillwater.
| |
Sibanye-Stillwater | Annual Financial Report 2017 | 150 |
For related party information, see –Annual financial statements–Notes to the consolidated financial statements–Note 33: Related-party transactions.
FINANCIAL AFFAIRS
DIVIDEND POLICY
Sibanye-Stillwater‘s dividend policy is to return at least 25% to 35% of normalised earnings to shareholders and after due consideration of future requirements the dividend may be increased beyond these levels. Normalised earnings are defined as profit for the year excluding gains and losses on foreign exchange differences and financial instruments, non-underlying items, and share of results of equity-accounted investees after tax.
For the year under review, the Group paid a total dividend of R560 million compared with R1,611 million in 2016.
Since the final dividend in respect of the six months ended 31 December 2016, which was paid during 2017, no further dividends have been declared by the Group.
BORROWING POWERS
In terms of Clause 4 of the Company’s MOI, the borrowing powers of the Sibanye Gold Limited (the Company) are unlimited. As at 31 December 2017, the borrowings of the Company and the Group, excluding the Burnstone Debt and including the derivative financial instrument, was R11,709 million (2016: R7,219 million) and R25,206 million (2016: R7,221 million), respectively, see –Annual financial statements–Notes to the consolidated financial statements–Note 24: Borrowings.
Sibanye-Stillwater is subject to financial and other covenants and restrictions under its credit facilities from time to time. Such covenants may include restrictions on Sibanye-Stillwater incurring additional financial indebtedness and obligations to maintain certain financial covenant ratios for as long as any amount is outstanding under such facilities.
SIGNIFICANT ANNOUNCEMENTS
Sibanye successfully concludes the acquisition of Stillwater – 4 may 2017
On 9 December 2016, Sibanye-Stillwater announced it had reached a definitive agreement to acquire Stillwater for US$18 per share in cash, or US$2,200 million in aggregate.
On 25 April 2017, at the shareholders meeting of Sibanye-Stillwater, the Sibanye-Stillwater shareholders approved the proposed Stillwater Transaction by voting in favour of the various resolutions to give effect to the Stillwater Transaction and at the shareholders meeting of Stillwater, the requisite majority of Stillwater shareholders resolved to approve the Stillwater Transaction.
On 4 May 2017, all the closing conditions to the Stillwater Transaction were satisfied or waived, and Sibanye concluded the acquisition of Stillwater. For additional information of the acquisition of Stillwater, see –Annual financial statements–Notes to the consolidated financial statements–Note 13.1: Stillwater acquisition.
Sibanye Rights Offer succeeds with excess oversubscription of almost five times – 12 June 2017
The US$1 billion (approximately R13 billion) rights offer, which closed on Friday 9 June 2017, was overwhelmingly supported. The rights offer proceeds were applied to partly refinancing the US$2.65 billion bridge loan facility Sibanye raised to acquire Stillwater, which closed on 4 May 2017. Approximately 97% of shareholders subscribed for approximately 1.2 billion new Sibanye shares in terms of the rights offer resulting in approximately 36 million rights offer shares available for excess applications. Excess applications were received for an additional approximately 5.9 billion new shares (almost five times or 492% more than the rights offer shares available). For additional information of the rights offer, see –Annual financial statements–Notes to the consolidated financial statements–Note 22: Stated share capital and for the adjustment to earnings per share (EPS) see –Annual financial statements–Notes to the consolidated financial statements–Note 10: Earnings per share.
Two year wage agreement secured at Stillwater Operations – 19 June 2017
Sibanye secured a two year wage agreement with the United Steel Workers of America, International Union, the representative union at its Stillwater operations in Montana, US. Negotiations with the United Steel Workers of America, International Union at East Boulder, will take place at year end.
Sibanye successfully completes an oversubscribed, two-tranche US$1.05 billion bond placement – 21 JUNE 2017
On 21 June 2017, Sibanye successfully completed a US$1.05 billion international corporate bond offering, which was approximately two times oversubscribed. The bonds comprise two tranches:
| · | | a US$500 million five-year (non-call 2) note that carries a 6.125% coupon, and |
| · | | a US$550 million eight-year (non-call 4) note that carries a 7.125% coupon. |
The proceeds of the bond offering, which settled on 27 June 2017, were applied to the partial repayment of the bridge loan raised for the acquisition of Stillwater, and follows the highly successful US$1 billion rights issue which closed on 9 June 2017. For additional information of the acquisition of the US$1.05 billion corporate bond, see –Annual financial statements–Notes to the consolidated financial statements–Note 24.3: US$1.05 billion Bond.
| |
Sibanye-Stillwater | Annual Financial Report 2017 | 151 |
Production at Sibanye’s Cooke Operations to resume following conclusion of unprotected strike and successful action against illegal mining – 30 june 2017
On 6 June 2017, despite communication with employees and agreement from the National Union of Mineworkers (NUM), the majority union, employees at Cooke embarked on Illegal and unprotected industrial action (unprotected strike), following the implementation of measures to combat illegal mining which threaten the sustainability of the Cooke operations and pose a significant risk to the safety of employees and the surrounding communities. An interdict against the strike was applied and granted by the Labour Court on 8 June 2017. Despite the interdict and direct communication of the consequences of persisting with the strike, employees did not return to work, and, as a result, dismissal procedures were implemented against striking employees.
Production at the Cooke operations resumed on 3 July 2017.
Sibanye commences consultation on restructuring to ensure sustainability of its gold operations – 3 august 2017
Sibanye entered into consultation with relevant stakeholders in terms of section 189A of the Labour Relations Act, regarding restructuring of its gold operations pursuant to ongoing losses experienced at its Beatrix West and Cooke operations. Losses experienced at these operations negatively affect Group cash flow as well as the sustainability and economic viability of other operations in the Southern Africa region, in this way, posing a threat to more sustainable employment across the region.
For additional information of the impairment of the Cooke operations and Beatrix West mining assets, see –Annual financial statements–Notes to the consolidated financial statements–Note 8: Impairments.
Sibanye-Stillwater launches and prices US$450 million senior unsecured guaranteed convertible bonds – 19 SEPTEMBER 2017
On 19 September 2017, the offering of US$450 million senior unsecured guaranteed convertible bonds due 2023 (US$450 million Convertible Bonds) was launched and priced. The US$450 million Convertible Bonds will pay a coupon of 1.875% per annum, payable semi-annually in arrear in equal instalments on 26 March and 26 September of each year. The initial conversion price is US$1.6580, representing a 35% premium to the volume weighted average price of Sibanye-Stillwater’s shares on the Johannesburg Stock Exchange (JSE) between opening of trading and pricing. The US$450 million Convertible Bonds were issued on 26 September 2017 and payments in respect of US$450 million Convertible Bonds will be guaranteed by Stillwater and Kroondal Operations Proprietary Limited (together, the Guarantors). For additional information of the acquisition of the US$450 million Convertible Bonds, see –Annual financial statements–Notes to the consolidated financial statements–Note 24.4: US$450 million Convertible Bonds.
Cash fraction applicable to the capitalisation issue – 5 OCTOBER 2017
On 29 August 2017, the Board resolved to issue and allot fully paid ordinary shares of no par value (ordinary shares) as a capitalised issue to Sibanye-Stillwater shareholders and American Depositary Receipt (ADR) holders pro rate on the current holding as a ratio of 2 (two) ordinary shares for every 100 ordinary shares held on the record date, being 6 October 2017. If the application of this ratio gave rise to a fraction of an ordinary share, such fraction would be rounded down to the nearest whole number, resulting in whole ordinary shares being allocated with an equivalent cash payment in compensating for the fraction. For the adjustment to EPS see –Annual financial statements–Notes to the consolidated financial statements–Note 10: Earnings per share.
Sibanye-Stillwater signs three year agreement at its Kroondal operations – 9 November 2017
Sibanye-Stillwater signed a three year wage agreement with all three unions at its Kroondal operations. The agreement is effective from 1 July 2017 and includes a R1,000 per month increase year on year for the next three years for the category B employees (lower category employees) with CPI related increases for the next three years for category A employees. Medical aid subsidies will also increase from R300 by R50 per month year on year for three years for category A and B employees. The increase represents an average escalation of about 7% in the wage bill for the Kroondal operations.
Sibanye-Stillwater and DRDGOLD to create an industry-leading surface mining partnership – 22 November 2017
On 22 November 2017, Sibanye-Stillwater announced that it has entered into various agreements with DRDGOLD Limited (DRDGOLD) to exchange selected surface gold processing assets and tailings storage facilities (TSF) for approximately 265 million newly issued DRDGOLD shares (the DRDGOLD Transaction). The implementation of the DRGDOLD Transaction is still subject fulfilment of conditions precedent and is expected to complete during April 2018.
Proposed acquisition of Lonmin by Sibanye-Stillwater – 14 December 2017
On 14 December 2017, Sibanye-Stillwater announced that it had reached agreement with Lonmin plc (Lonmin) on the terms of a recommended all-share offer to acquire the entire issued and to be issued ordinary share capital of Lonmin (the Lonmin Acquisition). It is proposed that the Lonmin Acquisition will be effected by means of a scheme of arrangement between Lonmin and the Lonmin Shareholders under Part 26 of the UK Companies Act. Under the terms of the Lonmin Acquisition, each Lonmin Shareholder will be entitled to receive: 0.967 new Sibanye-Stillwater shares for each Lonmin share. The Lonmin Acquisition is subject to the fulfilment of conditions precedent and is expected to complete during the second half of 2018.
| |
Sibanye-Stillwater | Annual Financial Report 2017 | 152 |
WORKING CAPITAL AND ASSESSMENT GOING CONCERN
The consolidated financial statements have been prepared using appropriate accounting policies, supported by reasonable judgements and estimates. The directors believe that the Group has adequate resources to continue as a going concern for the foreseeable future.
For the year ended 31 December 2017, the Group incurred a loss of R4,433.1 million (2016: profit of R3,042.7 million). As at 31 December 2017, the Group’s current assets exceeded its current liabilities by R3,566.7 million (2016: R1,446.6 million) and during the year then ended the Group generated cash from operating activities of R2,740.7 million (2016: R4,405.5 million).
Gold and PGMs are sold in US dollars, and while the majority of the Group’s gold and a substantial amount of the Group’s PGMs costs are denominated in rand, the Group’s results and financial condition may be impacted if there is a material change in the value of the rand.
Subsequent to year end, the average rand/US dollar exchange rate strengthened to R11.68/US$ from the average exchange rate of R13.31/US$ for the year ended 31 December 2017. Management has performed various sensitivities relating to the rand/US dollar exchange rate and the impact on the rand commodity prices. Should a strong rand/US dollar exchange rate persist without a corresponding gain in commodity prices, the Group could consider increasing operational flexibility by adjusting mine plans, reducing capital expenditure and/or selling assets. The Group may also, if necessary, consider options to increase funding flexibility which may include, among others, streaming facilities, prepayment facilities, facility restructuring or, in the event that other options are not deemed preferable or achievable by the Board, an equity capital raise.
The Group currently has committed undrawn debt facilities of R3,653 million at 31 December 2017. In order to maintain adequate liquidity, the refinancing and upsizing of the US$350 million RCF, maturing on 23 August 2018, to US$600 million, has been initiated. The facility has been fully syndicated with a group of eight international banks having provided commitment letters. The facility documentation is expected to be executed by the end of March 2018. The terms and conditions largely mirror the current US$350 million RCF which is US$92 million drawn as at 31 December 2017. On successful completion an additional US$250 million (approximately R3,000 million) of committed unutilised financing would be available.
Sibanye-Stillwater’s leverage ratio (or net debt to adjusted EBITDA) at 31 December 2017 is 2.6. Using the committed unutilised debt facilities could impact on the leverage ratio if used to fund operating losses. As indicated above, management have significant operational and financing flexibility and will continue to manage the operations and capital structure to ensure compliance with debt covenants. The borrowing facilities, permit a leverage ratio of 3.5:1 through to 31 December 2018, and 2.5:1, thereafter, calculated on a quarterly basis. Consistent with its long-term strategy, Sibanye-Stillwater plans to deleverage over time to its targeted leverage ratio of no greater than 1.0:1.
The directors believe that the cash generated by its operations, cash on hand, the committed unutilised debt facilities as well as additional funding opportunities will enable the Group to continue to meet its obligations as they fall due. The consolidated financial statements for the year ended 31 December 2017, therefore, have been prepared on a going concern basis.
SPECIAL RESOLUTIONS PASSED BY SUBSIDIARY COMPANIES
The following special resolutions were passed by subsidiary companies during the year ended 31 December 2017:
1.SPECIAL RESOLUTION PASSED BY VARIOUS SUBSIDIARY COMPANIES
Special resolution passed by the sole shareholder of the subsidiary companies listed below, in terms of sections 16(1) and 16(5)(a) of the Companies Act that the directors of the company propose to the shareholder of the company that the existing MOI of the company be replaced in its entirety by a new MOI.
| · | | Golden Oils Proprietary Limited; |
| · | | K2013164354 Proprietary Limited; |
| · | | M Janse van Rensburg Proprietary Limited; |
| · | | Milen Mining Proprietary Limited; |
| · | | Puma Gold Proprietary Limited; |
| · | | Sibanye Resources Proprietary Limited; |
| · | | Sibanye Solar PV Proprietary Limited; |
| · | | Sibanye Uranium Proprietary Limited; and |
| · | | Witwatersrand Deep Investments Proprietary Limited. |
2.SPECIAL RESOLUTION PASSED BY BUSHBUCK VENTURES Proprietary Limited and ORYX VENTURES Proprietary Limited
Special resolution passed by the shareholders of the subsidiary companies listed below, in terms of sections 16(1), 16(5)(a) of the Companies Act that the directors of the company propose to the shareholders of the company that the existing MOI of the company be replaced in its entirety by a new MOI.
| · | | Bushbuck Ventures Proprietary Limited; and |
| · | | Oryx Ventures Proprietary Limited. |
| |
Sibanye-Stillwater | Annual Financial Report 2017 | 153 |
3.SPECIAL RESOLUTION PASSED BY VARIOUS SUBSIDIARY COMPANIES
Special resolution passed by the majority shareholder of the subsidiary companies listed below, approving that the directors of the company may at any time and from time to time during the two years from the passing hereof authorise the company, in terms of and subject to the provisions of section 45(3)(b) of the Companies Act, to provide any type of direct or indirect financial assistance as defined in section 45(1) of the Companies Act, to any company or corporation that is related or inter-related to the company, on such terms and conditions and for such amounts as the directors may determine.
| · | | Bushbuck Ventures Proprietary Limited; |
| · | | Newshelf 1114 Proprietary Limited; and |
| · | | Oryx Ventures Proprietary Limited. |
4. SPECIAL RESOLUTION PASSED BY VARIOUS SUBSIDIARY COMPANIES
Special resolution passed by the sole shareholder of the subsidiary companies listed below, approving that the directors of the company may at any time and from time to time during the two years from the passing hereof authorise the company in terms of and subject to the provisions of section 45(3)(b) of the Companies Act, to provide any type of direct or indirect financial assistance as defined in section 45(1) of the Companies Act, to any company or corporation that is related or inter-related to the company, on such terms and conditions and for such amounts as the directors may determine.
| · | | Agrihold Proprietary Limited; |
| · | | Ezulwini Mining Company Proprietary Limited; |
| · | | Golden Hytec Farming Proprietary Limited; |
| · | | Golden Oils Proprietary Limited; |
| · | | Kroondal Operations Proprietary Limited; |
| · | | K2013164354 Proprietary Limited; |
| · | | M Janse van Rensburg Proprietary Limited; |
| · | | Milen Mining Proprietary Limited; |
| · | | Puma Gold Proprietary Limited; |
| · | | Rand Uranium Proprietary Limited; |
| · | | Sibanye Gold Academy Proprietary Limited; |
| · | | Sibanye Gold Eastern Operations Proprietary Limited; |
| · | | Sibanye Gold Nursing College Proprietary Limited; |
| · | | Sibanye Gold Protection Services Limited; |
| · | | Sibanye Gold Shared Services Proprietary Limited; |
| · | | Sibanye Resources Proprietary Limited; |
| · | | Sibanye Rustenburg Platinum Mines Resources Proprietary Limited; |
| · | | Sibanye Solar PV Proprietary Limited; |
| · | | Sibanye Uranium Proprietary Limited; |
| · | | St Helena Hospital Proprietary Limited; |
| · | | West Driefontein Gold Mining Company Proprietary Limited; |
| · | | Witwatersrand Consolidated Gold Resources Proprietary Limited; and |
| · | | Witwatersrand Deep Investments Proprietary Limited. |
LITIGATION
During 2012 and 2014, two court applications were served on Sibanye-Stillwater and its subsidiaries (as well as other mining companies) by various applicants who represent classes of mine workers (and where deceased, their dependents) who were previously employed by or who are employees of, among others, Sibanye-Stillwater or any of its subsidiaries and who allegedly contracted silicosis and/or tuberculosis. The two class actions were consolidated into one application on 17 October 2014. In terms of the consolidated application, the court was asked to allow the class actions to be certified.
On 13 May 2016, the High Court ordered, among other things: (1) the certification of two classes: (a) a silicosis class comprising current and former mine workers who have contracted silicosis and the dependents of mine workers who have died of silicosis; and (b) a tuberculosis class comprising current and former mine workers who have worked on the mines for a period of not less than two years and who have contracted pulmonary tuberculosis and the dependents of deceased mine workers who died of pulmonary tuberculosis; and (2) that the common law be developed to provide that, where a claimant commences suing for general damages and subsequently dies before close of pleadings, the claim for general damages will transmit to the estate of the deceased claimant.
The progression of the classes certified will be done in two phases: (i) a determination of common issues, on an opt-out basis, and (ii) the hearing and determination of individualised issues, on an opt-in basis. In addition, costs were awarded in favour of the claimants. The High Court ruling did not represent a ruling on the merits of the cases brought by the Claimants.
| |
Sibanye-Stillwater | Annual Financial Report 2017 | 154 |
Sibanye-Stillwater and the other respondents believed that the judgment addressed a number of highly complex and important issues, including a far reaching amendment of the common law, that have not previously been considered by other courts in South Africa. The High Court itself found that the scope and magnitude of the proposed claims is unprecedented in South Africa and that the class action would address novel and complex issues of fact and law. The respondents applied for leave to appeal against the judgement because they believed that the court’s ruling on some of these issues is incorrect and that another court may come to a different decision. On 21 September 2016, the Supreme Court of Appeal granted the respondents leave to appeal against all aspects of the class certification judgment of the South Gauteng High Court delivered in May 2016, however the appeal case has since been postponed indefinitely as Sibanye-Stillwater, the other respondents and the claimants representatives have made significant progress in the attempt to have this matter settled out of court. It has to be noted, however, that whatever settlement and whenever it is concluded, will still be subject to approval by court.
For additional information of occupational healthcare obligation recognised, see –Annual financial statements–Notes to the consolidated financial statements–Note 25: Occupational healthcare obligation.
ADMINISTRATION
Cain Farrel was appointed Company Secretary of Sibanye-Stillwater with effect from 1 January 2013.
With effect from 11 February 2013, Computershare Investor Services Proprietary Limited became the Company’s South African transfer secretaries and Capita Asset Services became the United Kingdom registrars of the Company.
AUDITORS
The Audit Committee has recommended to the Board that KPMG Inc. continues in office in accordance with section 90(1) of the Companies Act and in terms of the JSE Listings Requirements. Henning Opperman is the designated group audit engagement partner, accredited by the JSE, for Sibanye-Stillwater.
SUBSIDIARY COMPANIES
For details of major subsidiary companies in which the Company has a direct or indirect interest, see –Annual financial statements–Notes to the consolidated financial statements–Note 1.3: Consolidation.
| |
Sibanye-Stillwater | Annual Financial Report 2017 | 155 |
To the Shareholders and Board of Directors
Sibanye Gold Limited
Opinions on the Consolidated Financial Statements and Internal Control Over Financial Reporting
We have audited the accompanying consolidated statements of financial position of Sibanye Gold Limited (and subsidiaries) (the Company) as of 31 December 2017, 2016 and 2015, the related consolidated income statements, and statements of comprehensive income, changes in equity, and cash flows for each of the three years then ended, and the related notes (collectively, the consolidated financial statements). We also have audited the Company’s internal control over financial reporting as of 31 December 2017, based on criteria established in Internal Control – Integrated Framework (2013) issued by the Committee of Sponsoring Organizations of the Treadway Commission”.
In our opinion, the consolidated financial statements referred to above present fairly, in all material respects, the financial position of the Company as of 31 December 2017, 2016 and 2015, and the results of its operations and its cash flows for each of the three years then ended, in conformity with International Financial Reporting Standards as issued by the International Accounting Standards Board. Also in our opinion, the Company maintained, in all material respects, effective internal control over financial reporting as of 31 December 2017, based on criteria established in Internal Control – Integrated Framework (2013) issued by the Committee of Sponsoring Organizations of the Treadway Commission.
The Company acquired Stillwater Mining Company and subsidiaries (“Stillwater”) in 2017. Management has excluded from its assessment of the Company’s internal control over financial reporting as of 31 December 2017, Stillwater’s internal control over financial reporting associated with approximately 19% of consolidated total assets and approximately 20% of consolidated revenue, included in the consolidated financial statements as of and for the year ended 31 December 2017. Our audit of internal control over financial reporting of the Company also excluded an evaluation of the internal control over financial reporting of Stillwater.
Basis for Opinions
The Company’s management is responsible for these consolidated financial statements, for maintaining effective internal control over financial reporting, and for its assessment of the effectiveness of internal control over financial reporting, included in the accompanying “Management’s Report on Internal Control over Financial Reporting”. Our responsibility is to express an opinion on the Company’s consolidated financial statements and an opinion on the Company’s internal control over financial reporting based on our audits. We are a public accounting firm registered with the Public Company Accounting Oversight Board (United States) (PCAOB) and are required to be independent with respect to the Company in accordance with the U.S. federal securities laws and the applicable rules and regulations of the Securities and Exchange Commission and the PCAOB.
We conducted our audits in accordance with the standards of the PCAOB. Those standards require that we plan and perform the audits to obtain reasonable assurance about whether the consolidated financial statements are free of material misstatement, whether due to error or fraud, and whether effective internal control over financial reporting was maintained in all material respects.
Our audits of the consolidated financial statements included performing procedures to assess the risks of material misstatement of the consolidated financial statements, whether due to error or fraud, and performing procedures that respond to those risks. Such procedures included examining, on a test basis, evidence regarding the amounts and disclosures in the consolidated financial statements. Our audits also included evaluating the accounting principles used and significant estimates made by management, as well as evaluating the overall presentation of the consolidated financial statements. Our audit of internal control over financial reporting included obtaining an understanding of internal control over financial reporting, assessing the risk that a material weakness exists, and testing and evaluating the design and operating effectiveness of internal control based on the assessed risk. Our audits also included performing such other procedures as we considered necessary in the circumstances. We believe that our audits provide a reasonable basis for our opinions.
Definition and Limitations of Internal Control Over Financial Reporting
A company’s internal control over financial reporting is a process designed to provide reasonable assurance regarding the reliability of financial reporting and the preparation of financial statements for external purposes in accordance with generally accepted accounting principles. A company’s internal control over financial reporting includes those policies and procedures that (1) pertain to the maintenance of records that, in reasonable detail, accurately and fairly reflect the transactions and dispositions of the assets of the company; (2) provide reasonable assurance that transactions are recorded as necessary to permit preparation of financial statements in accordance with generally accepted accounting principles, and that receipts and expenditures of the company are being made only in accordance with authorizations of management and directors of the company; and (3) provide reasonable assurance regarding prevention or timely detection of unauthorized acquisition, use, or disposition of the company’s assets that could have a material effect on the financial statements.
Because of its inherent limitations, internal control over financial reporting may not prevent or detect misstatements. Also, projections of any evaluation of effectiveness to future periods are subject to the risk that controls may become inadequate because of changes in conditions, or that the degree of compliance with the policies or procedures may deteriorate.
KPMG Inc. (signed)
We have served as the Company’s auditor since 2010.
85 Empire Road
Parktown
Johannesburg
South Africa
30 March 2018
| |
Sibanye-Stillwater | Annual Financial Report 2017 | 156 |
| | | | |
| | | Revised | Revised |
Figures in million - SA rand | Notes | 2017 | 2016 | 2015 |
Revenue | 3 | 45,911.6 | 31,240.7 | 22,717.4 |
Cost of sales | 4 | (42,182.4) | (24,751.0) | (20,017.0) |
Interest income | 15.1, 17, 18.1 | 415.5 | 331.4 | 257.0 |
Finance expense | 5 | (2,971.8) | (903.1) | (561.8) |
Share-based payments | 6 | (231.9) | (496.2) | (274.4) |
Loss on financial instruments | 6.5, 17, 18, 24.6 | (1,114.4) | (1,032.8) | (229.5) |
Gain/(loss) on foreign exchange differences | | 292.4 | 219.6 | (359.4) |
Share of results of equity-accounted investees after tax | 15 | 291.6 | 13.3 | 116.0 |
Other income | | 300.0 | 131.9 | 125.7 |
Other costs | 7 | (932.7) | (490.6) | (227.9) |
Impairments | 8 | (4,411.0) | (1,381.1) | - |
Occupational healthcare expense | 26 | (1,106.9) | - | - |
Gain on disposal of property, plant and equipment | 12 | 40.7 | 95.4 | 58.7 |
Restructuring costs | | (729.8) | (187.7) | (104.8) |
Transaction costs | | (552.1) | (157.0) | (25.7) |
Gain on acquisition | 13.2 | - | 2,178.6 | - |
Net loss on derecognition of financial guarantee asset and liability | | - | - | (158.3) |
(Loss)/profit before royalties and tax | | (6,981.2) | 4,811.4 | 1,316.0 |
Royalties | 9.1 | (398.5) | (566.6) | (400.6) |
(Loss)/profit before tax | | (7,379.7) | 4,244.8 | 915.4 |
Mining and income tax | 9.2 | 2,946.6 | (1,202.1) | (377.2) |
(Loss)/profit for the year | | (4,433.1) | 3,042.7 | 538.2 |
Attributable to: | | | | |
Owners of Sibanye-Stillwater | | (4,437.4) | 3,473.3 | 716.9 |
Non-controlling interests | | 4.3 | (430.6) | (178.7) |
Earnings per share attributable to owners of Sibanye-Stillwater | | | | |
Basic earnings per share - cents | 10.1 | (229) | 225 | 47 |
Diluted earnings per share - cents | 10.2 | (229) | 225 | 47 |
The accompanying notes form an integral part of these consolidated financial statements.
CONSOLIDATED STATEMENT OF OTHER COMPREHENSIVE INCOME
FOR THE YEAR ENDED 31 DECEMBER 2017
| | | | |
| | | Revised | |
Figures in million - SA rand | | 2017 | 2016 | 2015 |
(Loss)/profit for the year | | (4,433.1) | 3,042.7 | 538.2 |
Other Comprehensive income, net of tax | | | | |
Items that may be reclassified to profit or loss | | (627.2) | (131.4) | - |
Foreign currency translation | | (632.4) | (131.4) | - |
Mark to Market valuation | | 5.2 | - | - |
| | | | |
Total comprehensive income | | (5,060.3) | 2,911.3 | 538.2 |
Attributable to: | | | | |
Owners of Sibanye-Stillwater | | (5,064.6) | 3,341.9 | 716.9 |
Non-controlling interests | | 4.3 | (430.6) | (178.7) |
| |
Sibanye-Stillwater | Annual Financial Report 2017 | 157 |
Table of Contents
CONSOLIDATED STATEMENT OF FINANCIAL POSITION
FOR THE YEAR ENDED 31 DECEMBER 2017
| | | | |
| | | Revised | |
Figures in million - SA rand | Notes | 2017 | 2016 | 2015 |
ASSETS | | | | |
Non-current assets | | 64,067.3 | 34,018.1 | 25,515.0 |
Property, plant and equipment | 12 | 51,444.6 | 27,240.7 | 22,132.4 |
Goodwill | 14 | 6,396.0 | 936.0 | 736.7 |
Equity-accounted investments | 15 | 2,244.1 | 2,157.4 | 167.5 |
Environmental rehabilitation obligation funds | 17 | 3,492.4 | 3,100.5 | 2,413.9 |
Other receivables | 18.1 | 284.0 | 355.3 | 1.3 |
Deferred tax assets | 9.3 | 206.2 | 228.2 | 63.2 |
| | | | |
Current assets | | 12,004.5 | 7,703.2 | 2,750.7 |
Inventories | 19 | 3,526.5 | 676.8 | 405.9 |
Trade and other receivables | 20 | 6,197.6 | 5,747.9 | 1,627.4 |
Other receivables | 18.1 | 35.2 | 310.6 | - |
Tax receivable | 9.4 | 182.8 | - | - |
Cash and cash equivalents | 21 | 2,062.4 | 967.9 | 717.4 |
| | | | |
Total assets | | 76,071.8 | 41,721.3 | 28,265.7 |
| | | | |
EQUITY AND LIABILITIES | | | | |
Equity attributable to owners of Sibanye-Stillwater | | 23,978.4 | 16,451.4 | 14,875.0 |
Stated share capital | 22 | 34,667.0 | 21,734.6 | 21,734.6 |
Other reserves | | 2,569.0 | 2,978.8 | 2,938.2 |
Accumulated loss | | (13,257.6) | (8,262.0) | (9,797.8) |
| | | | |
Non-controlling interests | 23 | 19.8 | 17.7 | 109.8 |
Total equity | | 23,998.2 | 16,469.1 | 14,984.8 |
| | | | |
Non-current liabilities | | 43,635.8 | 18,995.6 | 7,933.6 |
Borrowings | 24 | 23,992.0 | 8,221.5 | 1,808.3 |
Derivative financial instrument | 24 | 1,093.5 | - | - |
Environmental rehabilitation obligation | 25 | 4,678.7 | 3,982.2 | 2,411.0 |
Post-retirement healthcare obligation | | 11.3 | 16.3 | 16.3 |
Occupational healthcare obligation | 26 | 1,152.5 | - | - |
Share-based payment obligations | 6.5 | 422.2 | 246.5 | 136.6 |
Other payables | 18.2 | 3,760.4 | 1,613.7 | - |
Deferred tax liabilities | 9.3 | 8,525.2 | 4,915.4 | 3,561.4 |
| | | | |
Current Liabilities | | 8,437.8 | 6,256.6 | 5,347.3 |
Borrowings | 24 | 1,657.5 | 752.3 | 1,995.3 |
Occupational healthcare obligation | 26 | 0.8 | - | - |
Share-based payment obligations | 6.5 | 12.3 | 235.2 | 463.0 |
Trade and other payables | 27 | 6,690.4 | 5,180.5 | 2,759.4 |
Other payables | 18.2 | 41.9 | - | - |
Tax and royalties payable | 9.4 | 34.9 | 88.6 | 129.6 |
| . | | | |
Total equity and liabilities | | 76,071.8 | 41,721.3 | 28,265.7 |
The accompanying notes form an integral part of these consolidated financial statements.
| |
Sibanye-Stillwater | Annual Financial Report 2017 | 158 |
Table of Contents
CONSOLIDATED STATEMENT OF CHANGES IN EQUITY
FOR THE YEAR ENDED 31 DECEMBER 2017
| | | | | | | | | |
| | | | | | | Equity | | |
| | | Share- | | Foreign | | attributable | | |
| | Stated | based | Mark to | currency | | to owners | Non- | |
| | share | payment | market | translation | Accumulated | of Sibanye- | controlling | Total |
Figures in million - SA rand | Notes | capital | reserve | reserve | reserve | loss | Stillwater | interests | equity |
Balance at 31 December 2014 | | 21,734.6 | 2,819.1 | - | - | (9,897.4) | 14,656.3 | 329.6 | 14,985.9 |
Total comprehensive income for the year | | - | - | - | - | 716.9 | 716.9 | (178.7) | 538.2 |
Profit for the year | | - | - | - | - | 716.9 | 716.9 | (178.7) | 538.2 |
Other comprehensive income | | - | - | - | - | - | - | - | - |
Share-based payments | 6 | - | 119.1 | - | - | - | 119.1 | - | 119.1 |
Dividends paid | 11 | - | - | - | - | (658.4) | (658.4) | - | (658.4) |
Transaction with non-controlling interests | 23 | - | - | - | - | 41.1 | 41.1 | (41.1) | - |
Balance at 31 December 2015 | | 21,734.6 | 2,938.2 | - | - | (9,797.8) | 14,875.0 | 109.8 | 14,984.8 |
Total comprehensive income for the year | | - | - | - | (131.4) | 3,473.3 | 3,341.9 | (430.6) | 2,911.3 |
Profit for the year | | - | - | - | - | 3,473.3 | 3,473.3 | (430.6) | 3,042.7 |
Other comprehensive income | | - | - | - | (131.4) | - | (131.4) | - | (131.4) |
Share-based payments | 6 | - | 172.0 | - | - | - | 172.0 | - | 172.0 |
Dividends paid | 11 | - | - | - | - | (1,610.6) | (1,610.6) | (1.3) | (1,611.9) |
Acquisition of subsidiary with non-controlling interests | 13.3 | - | - | - | - | - | - | 12.9 | 12.9 |
Transaction with non-controlling interests | 23 | - | - | - | - | (326.9) | (326.9) | 326.9 | - |
Balance at 31 December 2016 (Revised) | | 21,734.6 | 3,110.2 | - | (131.4) | (8,262.0) | 16,451.4 | 17.7 | 16,469.1 |
Total comprehensive income for the year | | - | - | 5.2 | (632.4) | (4,437.4) | (5,064.6) | 4.3 | (5,060.3) |
Loss for the year | | - | - | - | - | (4,437.4) | (4,437.4) | 4.3 | (4,433.1) |
Other comprehensive income | | - | - | 5.2 | (632.4) | - | (627.2) | - | (627.2) |
Share-based payments | 6 | - | 217.4 | - | - | - | 217.4 | - | 217.4 |
Dividends paid | 11 | - | - | - | - | (558.2) | (558.2) | (2.2) | (560.4) |
Rights issue | 22 | 12,932.4 | - | - | - | - | 12,932.4 | - | 12,932.4 |
Balance at 31 December 2017 | | 34,667.0 | 3,327.6 | 5.2 | (763.8) | (13,257.6) | 23,978.4 | 19.8 | 23,998.2 |
The accompanying notes form an integral part of these consolidated financial statements.
| |
Sibanye-Stillwater | Annual Financial Report 2017 | 159 |
Table of Contents
CONSOLIDATED STATEMENT OF CASH FLOWS
FOR THE YEAR ENDED 31 DECEMBER 2017
| | | | |
Figures in million - SA rand | Notes | 2017 | 2016 | 2015 |
CASH FLOWS FROM OPERATING ACTIVITIES | | | | |
Cash generated by operations | 28 | 7,097.9 | 9,836.3 | 6,130.4 |
Post-retirement health care payments | | (6.4) | (1.2) | (0.1) |
Cash-settled share-based payments paid | 6.5 | (433.6) | (1,518.6) | (42.2) |
Change in working capital | 29 | (522.3) | (237.6) | (668.0) |
| | 6,135.6 | 8,078.9 | 5,420.1 |
Interest received | | 118.7 | 112.2 | 117.3 |
Interest paid | | (2,053.9) | (441.1) | (260.2) |
Tax and royalties paid | 9.4 | (899.3) | (1,732.6) | (1,051.7) |
Dividends paid | 11 | (560.4) | (1,611.9) | (658.4) |
Guarantee fee received | | - | - | 9.6 |
Guarantee release fee | | - | - | (61.4) |
Net cash from operating activities | | 2,740.7 | 4,405.5 | 3,515.3 |
| | | | |
CASH FLOWS FROM INVESTING ACTIVITIES | | | | |
Additions to property, plant and equipment | 12 | (6,098.8) | (4,151.1) | (3,344.8) |
Proceeds on disposal of property, plant and equipment | 12 | 71.3 | 99.4 | 65.1 |
Acquisition of subsidiaries | 13 | (27,386.4) | (5,801.5) | - |
Cash acquired on acquisition of subsidiaries | 13 | 1,792.2 | 494.2 | - |
Loan advanced to equity-accounted investee | 15 | (13.5) | (10.1) | (3.0) |
Loan repaid by equity-accounted investee | 15 | - | - | 20.9 |
Contributions to environmental rehabilitation obligation funds | 17 | (114.5) | (74.7) | (77.8) |
Proceeds on disposal of Stillwater marketable securities investments acquired | | 3,605.3 | - | - |
Payment of environmental rehabilitation obligation | | - | - | (0.3) |
Net cash used in investing activities | | (28,144.4) | (9,443.8) | (3,339.9) |
| | | | |
CASH FLOWS FROM FINANCING ACTIVITIES | | | | |
Proceeds from shares issued | 22 | 13,438.5 | - | - |
Transaction costs paid on rights issue shares issued | 22 | (506.1) | - | - |
Loans raised | 24 | 69,593.8 | 17,280.5 | 1,552.0 |
Loans repaid | 24 | (55,719.5) | (11,834.7) | (1,572.9) |
Net cash from/(used in) financing activities | | 26,806.7 | 5,445.8 | (20.9) |
| | | | |
Net increase in cash and cash equivalents | | 1,403.0 | 407.5 | 154.5 |
Effect of exchange rate fluctuations on cash held | | (308.5) | (157.0) | - |
Cash and cash equivalents at beginning of the year | | 967.9 | 717.4 | 562.9 |
Cash and cash equivalents at end of the year | 21 | 2,062.4 | 967.9 | 717.4 |
The accompanying notes form an integral part of these consolidated financial statements.
| |
Sibanye-Stillwater | Annual Financial Report 2017 | 160 |
Table of Contents
NOTES TO THE CONSOLIDATED FINANCIAL STATEMENTS
FOR THE YEAR ENDED 31 DECEMBER 2017
1. ACCOUNTING POLICIES
The principal accounting policies applied in the preparation of these consolidated financial statements are set out below. Where an accounting policy is specific to a note, the policy is described in the note which it relates to. These policies have been consistently applied to all the periods presented.
1.1 REPORTING ENTITY
Sibanye Gold Limited, trading as Sibanye-Stillwater (Sibanye-Stillwater or the Group), an independent, global, precious metals mining company, produces a mix of metals that includes gold and platinum group metals (PGMs). Domiciled in South Africa, Sibanye-Stillwater currently owns and operates a portfolio of high-quality operations and projects, which are grouped into two regions: the Southern Africa (SA) region and the United States (US) region.
The SA region houses the gold and PGM operations and projects located in South Africa and Zimbabwe. The underground and surface gold mining operations in South Africa are the Driefontein and Kloof operations in the West Witwatersrand (West Wits) region of Gauteng, and the Beatrix operation in the southern Free State. Sibanye-Stillwater also owns and manages significant gold extraction and processing facilities where ore is treated and beneficiated to produce gold doré. In addition, several organic projects currently underway are aimed at sustaining these gold mining operations into the long term. The PGM assets in the SA region are Kroondal (50%), the Rustenburg operations and the tailings retreatment entity, Platinum Mile (91.7%) in North West Province, and Mimosa (50%) in Zimbabwe.
The US region houses the PGM operations and projects located in the US, Canada and Argentina. These include the East Boulder and Stillwater mining operations and the Blitz project in Montana, in the US, and two exploration-stage projects, Marathon, a PGM-copper porphyry in Ontario, Canada, and Altar, a copper-gold property in San Juan, Argentina. The assets in this region also include the Columbus Metallurgical complex in Montana. This complex houses the concentrator and smelter facilities as well as a base metal refinery which produces a PGM-rich filter cake that is further refined by a third-party precious metal refinery. These processing and metallurgical facilities are also used to process recycled material such as spent autocatalytic convertors and petroleum refinery catalysts.
1.2 BASIS OF PREPARATION
The consolidated financial statements for the year ended 31 December 2017 have been prepared on a going concern basis in accordance with International Financial Reporting Standards (IFRS), as issued by the International Accounting Standards Board, the South African Institute of Chartered Accountants Financial Reporting Guides issued by the Accounting Practices Committee and Financial Reporting Pronouncements issued by the Financial Reporting Standards Council, as well as the requirements of the South African Companies Act and JSE Listings Requirements. The consolidated annual financial statements have been prepared under the historical cost convention, except for financial assets and financial liabilities (including derivative instruments) which are measured at fair value through profit or loss or through the mark to market reserve in equity.
STANDARDS, INTERPRETATIONS AND AMENDMENTS TO PUBLISHED STANDARDS EFFECTIVE FOR THE YEAR ENDED 31 DECEMBER 2017
During the financial year, the following new and revised accounting standards and amendments to standards became effective and had no significant impact on the Group’s financial statements:
| | |
Pronouncement | Details of amendments | Effective date |
IFRS 12 Disclosure of Interests in Other Entities (Amendment) | Annual Improvements 2014-2016 Cycle Clarification of the scope of IFRS 12 with respect to interests in entities classified as held for sale in accordance with IFRS 5 Non-current Assets Held for Sale and Discontinued Operations. | 1 January 2017 |
IAS 7 Statement of Cash Flows (Amendment) | Disclosure Initiative Amendments requiring entities to disclose information about changes in their financing liabilities. | 1 January 2017 |
IAS 12 Income Taxes (Amendment) | Recognition of Deferred Tax Assets for Unrealised Losses Narrow-scope amendment to clarify the requirements on recognition of deferred tax assets for unrealised losses on debt instruments measured at fair value. | 1 January 2017 |
| |
Sibanye-Stillwater | Annual Financial Report 2017 | 161 |
Table of Contents
NOTES TO THE CONSOLIDATED FINANCIAL STATEMENTS continued
FOR THE YEAR ENDED 31 DECEMBER 2017
STANDARDS, INTERPRETATIONS AND AMENDMENTS TO PUBLISHED STANDARDS WHICH ARE NOT YET EFFECTIVE
Certain new standards, amendments and interpretations to existing standards have been published that apply to the Group’s accounting periods beginning on or after 1 January 2018 but have not been early adopted by the Group. The standards, amendments and interpretations that are applicable to the Group are:
| | |
Pronouncement | Details of amendments and estimated impact | Effective date1 |
IFRS 2 Share-based payment (Amendment)2 | Classification and Measurement of Share-based Payment Transactions: A collection of three distinct narrow-scope amendments dealing with classification and measurement of share-based payments. The amendments address: The effects of vesting conditions on the measurement of a cash-settled share-based payment; The accounting requirements for a modification to the terms and conditions of a share-based payment that changes the classification of the transaction from cash-settled to equity-settled; and The classification of share-based payment transactions with net settlement features. | 1 January 2018 |
IFRS 3 Business Combinations (Amendment)2 | Annual Improvements 2015-2017 Cycle Clarification that when an entity obtains control of a business that is a joint operation, it is required to remeasure previously held interests in that business. | 1 January 2019 |
IFRS 9 Financial Instruments (New standard) | IFRS 9 arises from a three-part project to replace IAS 39 Financial Instruments: Recognition and Measurement. IFRS 9 addresses the classification, measurement and derecognition of financial assets and financial liabilities, introduces new rules for hedge accounting, and a new impairment model for financial assets. The Group performed an assessment of the impact of adoption of IFRS 9 calculated that it had no significant impact on its statement of financial position. The new standard also introduces expanded disclosure requirements and changes in presentation. These will change the nature and extent of the Group’s disclosures about its financial instruments which will be provided in the financial statements for the year ending 31 December 2018. | 1 January 2018 |
IFRS 9 Financial instruments (Amendment) | Prepayment Features with Negative Compensation The narrow-scope amendment allows companies to measure particular prepayable financial assets with negative compensation at amortised cost or at fair value through other comprehensive income if a specified condition is met. | 1 January 2019 |
IFRS 11 Disclosure of Interest in Other Entities (Amendment)2 | Annual Improvements 2015-2017 Cycle Clarification that when an entity obtains joint control of a business that is a joint operation, the entity does not remeasure previously held interests in that business. | 1 January 2019 |
IFRS 15 Revenue from Contracts with Customers (New standard) | IFRS 15 will supersede the current revenue recognition guidance including IAS 18 Revenue, IAS 11 Construction Contracts and the related interpretation when it becomes effective. IFRS 15 establishes a single comprehensive five-step model to account for revenue arising from contracts with customers and is based on the core principle that revenue is recognised when control of a good or service transfers to a customer. The Group assessed the “new” recognition of its gold, PGM and chrome sales. There will not be any adjustment as of 1 January 2018 due to the transition to IFRS 15. | 1 January 2018 |
| |
Sibanye-Stillwater | Annual Financial Report 2017 | 162 |
Table of Contents
NOTES TO THE CONSOLIDATED FINANCIAL STATEMENTS continued
FOR THE YEAR ENDED 31 DECEMBER 2017
| | |
Pronouncement | Details of amendments and estimated impact | Effective date 1 |
IFRS 16 Leases (New standard) | IFRS 16 replaces the previous lead standard IAS 17 Leases and related interpretations. IFRS 16 has one model for lessees which will result in almost all leases being recognised on balance sheet as the distinction between operating and finance leases is removed. The only exceptions are short-term and low-value leases. At the commencement date of a lease, a lessee will recognise a liability to make lease payments (i.e. the lease liability) and an asset representing the right to use the underlying asset during the lease term (i.e. the right-of-use asset). Lessees also will be required to remeasure the lease liability upon the occurrence of certain events (e.g. a change in the lease term, a change in future lease payments resulting from a change in an index or rate used to determine those payments). The lessee will generally recognise the amount of the remeasurement of the lease liability as an adjustment to the right-of-use asset. In 2017, the Group assembled a project team to begin the process of assessing the impact of the leases standard. The project team has developed its project plan, established a steering committee, identified key stakeholders, high level education sessions have been completed and the process has begun to gather more information (through the use of interviews and questionnaires) with respect to the population of procurement contracts that will need to be assessed in light of the new requirements. In 2018, the Group plans to continue to assess the potential effect of IFRS 16 on its consolidated financial statements. An area of specific focus already identified relates to certain service contracts which may fall in the scope of IFRS 16. The Group does not intend to adopt IFRS 16 before the effective date. | 1 January 2019 |
IAS 12 Income Taxes (Amendment)2 | Annual Improvements 2015-2017 Cycle Clarification that all income tax consequences of dividends should be recognised in profit or loss, regardless how the tax arises. | 1 January 2019 |
IAS 19 Employee Benefits (Amendment)2 | Plan Amendment, Curtailment or Settlement The amendments require an entity to use the updated assumptions from a remeasurement net defined benefit liability or asset resulting from a plan amendment, curtailment or settlement to determine current service cost and net interest for the remainder of the reporting period after the change to the plan. | 1 January 2019 |
IAS 23 Borrowing Costs (Amendment) 2 | Annual Improvements 2015-2017 Cycle The amendments clarify that if any specific borrowing remains outstanding after the related asset is ready for its intended use or sale, that borrowing becomes part of the funds that an entity borrows generally when calculating the capitalisation rate on general borrowings. | 1 January 2019 |
IAS 28 Investments in Associates and Joint Ventures (Amendment)2 | Annual Improvements 2014-2016 Cycle Clarification that a venture capital organisation, or a mutual fund, unit trust and similar entities may elect, at initial recognition, to measure investments in an associate or joint venture at fair value through profit or loss separately for each associate or joint venture. | 1 January 2018 |
IAS 28 Investments in Associates and Joint Ventures (Amendment)2 | Long-term interest in Associates and Joint Ventures Clarification provided that an entity should apply IFRS 9 to long-term interests in an associate or joint venture that form part of the net investment in the associate or joint venture but to which the equity method is not applied. | 1 January 2019 |
IFRIC 22 Foreign Currency Transactions and Advance Consideration2 | This interpretation addresses the exchange rate to use in transactions that involve advance consideration paid or received in a foreign currency. | 1 January 2018 |
IFRIC 23 Uncertainty over Income Tax Treatments | The interpretation specifies how an entity should reflect the effects of uncertainties in accounting for income taxes. | 1 January 2019 |
1 Effective date refers to annual period beginning on or after said date
2 No impact
| |
Sibanye-Stillwater | Annual Financial Report 2017 | 163 |
Table of Contents
NOTES TO THE CONSOLIDATED FINANCIAL STATEMENTS continued
FOR THE YEAR ENDED 31 DECEMBER 2017
SIGNIFICANT ACCOUNTING JUDGEMENTS AND ESTIMATES
Use of estimates: The preparation of the financial statements requires the Group’s management to make estimates and assumptions that affect the reported amounts of assets and liabilities and disclosure of contingent assets and liabilities at the date of the financial statements, and the reported amounts of revenues and expenses during the reporting period. The determination of estimates requires the exercise of judgement based on various assumptions and other factors such as historical experience, current and expected economic conditions, and in some cases valuation techniques. Actual results could differ from those estimates.
The more significant areas requiring the use of management estimates and assumptions relate to Mineral Reserves (that are the basis of future cash flow estimates and unit-of-production depreciation and amortisation calculations, impairments, and reversal of impairments); revenue recognition; deferred tax; joint arrangements; write-downs of inventory to net realisable value; borrowings; environmental, reclamation and closure obligations; occupational healthcare obligation and contingent liabilities.
Estimates and judgements are continually evaluated and are based on historical experience and other factors, including expectations of future events that are believed to be reasonable under the circumstances.
The estimates and assumptions that have a significant risk of causing a material adjustment to the carrying amounts of assets and liabilities within the financial period are discussed under the relevant note of the item affected.
| |
Sibanye-Stillwater | Annual Financial Report 2017 | 164 |
Table of Contents
NOTES TO THE CONSOLIDATED FINANCIAL STATEMENTS continued
FOR THE YEAR ENDED 31 DECEMBER 2017
1.3 CONSOLIDATION
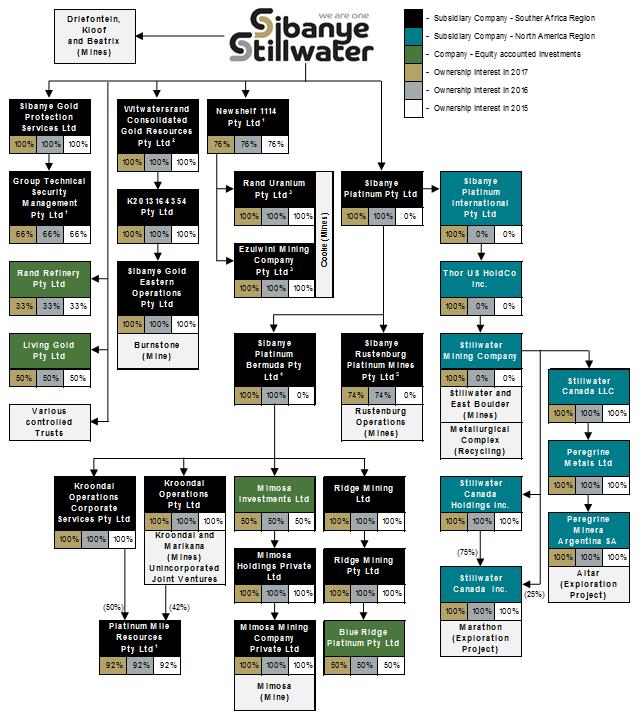
1 The non-controlling interests in the statement of changes in equity relates to the attributable share of accumulated profits of the Newshelf 1114 Proprietary Limited (Newshelf 1114) group, Goldfields Technical Security Management Proprietary Limited (GTSM) and Platinum Mile Resources Proprietary Limited (Platinum Mile) (refer to note 23).
2 Witwatersrand Consolidated Gold Resources Proprietary Limited (Wits Gold) has ceded and pledged its shares in K2013164354 Proprietary Limited (K2013) (a dormant entity) and K2013 has ceded and pledged it shares in Sibanye Gold Eastern Operations Proprietary Limited (SGEO) in favour of the lenders of the Burnstone Debt (refer to note 24.6).
3 Rand Uranium Proprietary Limited (Rand Uranium) and Ezulwini Mining Company Proprietary Limited (Ezulwini) together own a number of underground and surface mining operations. These operations report to the Group’s chief operating decision maker (the Executive Committee) as a separate segment, namely Cooke.
4 In terms of the Aquarius Transaction (refer to note 13.3) Sibanye-Stillwater acquired all of the shares in Aquarius Platinum Limited (Aquarius), and Sibanye Platinum Bermuda Proprietary Limited and Aquarius were amalgamated. Aquarius’ ownership in its subsidiaries remained unchanged.
5 In terms of the Rustenburg operations Transaction (refer to note 13.2) a 26% stake in Sibanye Rustenburg Platinum Mines Proprietary Limited (SRPM) was acquired through Newshelf 1335 Proprietary Limited (BBBEE SPV). The shareholders of BBBEE SPV are Rustenburg Mine Employees Trust (30.4%), Rustenburg Mine Community Development Trust (24.8%) Bakgatla-Ba-Kgafela Investment Holdings (24.8%) and Siyanda Resources Proprietary Limited (20.0%). The Rustenburg Mine Employees Trust and the Rustenburg Mine Community Development Trust are controlled and consolidated by Sibanye-Stillwater.
6 The Group has no current or contractual obligation to provide financial support to any of its structured entities.
| |
Sibanye-Stillwater | Annual Financial Report 2017 | 165 |
Table of Contents
NOTES TO THE CONSOLIDATED FINANCIAL STATEMENTS continued
FOR THE YEAR ENDED 31 DECEMBER 2017
SUBSIDIARIES
Subsidiaries are all entities over which the Group exercises control. The Group controls an entity when it is exposed to, or has rights to, variable returns from its involvement with the entity and has the ability to affect those returns through its power over the entity. Subsidiaries are consolidated from the date on which control is obtained by the Group until the date on which control ceases.
Inter-company transactions, balances and unrealised gains on transactions between Group companies are eliminated. Unrealised losses are also eliminated. Accounting policies of subsidiaries have been changed where necessary to ensure consistency with the policies adopted by the Group.
TRANSACTIONS WITH SHAREHOLDERS OF SIBANYE-STILLWATER
Transactions with owners in the capacity as equity participants are not recognised in profit or loss, but instead are recognised in equity with a corresponding change in assets or liabilities.
1.4 FOREIGN CURRENCIES
FUNCTIONAL AND PRESENTATION CURRENCY
Items included in the financial statements of each of the Group’s entities are measured using the currency of the primary economic environment in which the entity operates (the functional currency). The consolidated financial statements are presented in South African rand, which is the Group’s presentation currency.
TRANSACTIONS AND BALANCES
Foreign currency transactions are translated into the functional currency using the exchange rates prevailing at the dates of the transactions. Monetary assets and liabilities are translated into the functional currency at each reporting date. Foreign exchange gains and losses resulting from the settlement of such transactions and from the translation of monetary assets and liabilities denominated in foreign currencies, are recognised in profit or loss.
FOREIGN OPERATIONS
The results and financial position of all the Group entities (none of which has the currency of a hyperinflationary economy) that have a functional currency different from the presentation currency are translated into the presentation currency as follows:
| · | | Assets and liabilities are translated at the exchange rate ruling at the reporting date. Equity items are translated at historical rates. The income and expenses are translated at the average exchange rate for the year, unless this average was not a reasonable approximation of the rates prevailing on the transaction dates, in which case these items were translated at the rate prevailing on the date of the transaction. Exchange differences on translation are accounted for in other comprehensive income. These differences will be recognised in profit or loss upon realisation of the underlying operation. |
| · | | On consolidation, exchange differences arising from the translation of the net investment in foreign operations (i.e. the reporting entity’s interest in the net assets of that operation), and of borrowings and other currency instruments designated as hedges of such investments, are taken to other comprehensive income. When a foreign operation is sold, exchange differences that were recorded in other comprehensive income are recognised in profit or loss as part of the gain or loss on disposal. If the Group disposes of part of its interest in a subsidiary but retains control, then the relevant proportion of the cumulative amount is reattributed to non-controlling interests. When the Group disposes of only part of an associate or joint venture while retaining significant influence or joint control, the relevant proportion of the cumulative amount is reclassified to profit or loss. |
| · | | Goodwill and fair value adjustments arising on the acquisition of a foreign operation are treated as assets and liabilities of the foreign operation and are translated at each reporting date at the closing rate. |
1.5 COMPARATIVES
Where necessary comparative periods may be adjusted to conform to changes in presentation.
During 2017, the effective date tax valuation was finalised by the Department of Mineral Resources (DMR) and the South African Revenue Services resulting in an increase of R249.4 million in the deferred tax liabilities recognised on acquisition of the Rustenburg operations (refer to note 13.2) and a corresponding decrease in the gain on bargain purchase. The valuation also had an impacted on the deductibility of expenses and taxability of income for the two months ended 31 December 2016, resulting in a decrease of R41.1 million in deferred tax and an increase of R20.0 million in royalties (refer to note 9.1 and 9.2). The consolidated financial statements for the year ended 31 December 2016 (comparatives) have been revised retrospectively in terms of IFRS 3 to reflect the adjustment of initial accounting.
On 14 June 2017, Sibanye-Stillwater raised capital of R12,962.5 million from a rights issue (refer to note 22), when 1,195,787,294 ordinary shares were issued with 9 new ordinary shares issued for every 7 existing ordinary share held. The earnings per share (EPS) calculations have been adjusted retrospectively as required by IAS 33 Earnings per Share. For the calculation of the EPS, the number of shares held prior to 14 June 2017 has been adjusted by a factor of 1.53 to reflect the bonus element of the rights issue.
On 29 August 2017 and 21 February 2018, the Board approved capitalisation issues in the form of 2 (two) and 4 (four) ordinary shares, respectively, for every 100 ordinary shares held. The EPS calculations have been adjusted retrospectively as required by IAS 33.
.
| |
Sibanye-Stillwater | Annual Financial Report 2017 | 166 |
Table of Contents
NOTES TO THE CONSOLIDATED FINANCIAL STATEMENTS continued
FOR THE YEAR ENDED 31 DECEMBER 2017
2. SEGMENT REPORTING
ACCOUNTING POLICY
Operating segments are reported in a manner consistent with the internal reporting provided to the chief operating decision maker and is based on individual mining operations. The chief operating decision maker, who is responsible for allocating resources and assessing performance of the operating segments, has been identified as the executive management team that makes strategic decisions.
CONCENTRATION OF CUSTOMERS
SA gold – Revenue by customer
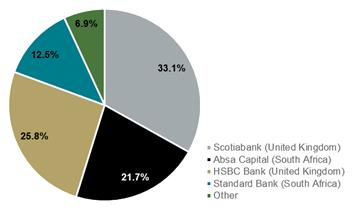
SA PGM – Revenue by customer
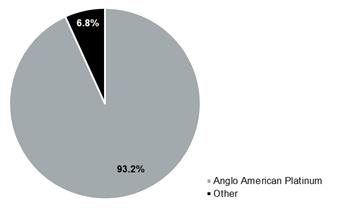
US PGM – Revenue by customer
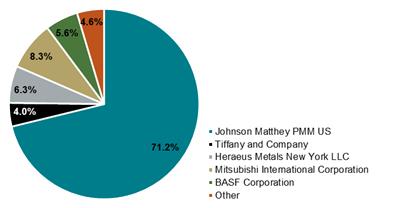
| |
Sibanye-Stillwater | Annual Financial Report 2017 | 167 |
Table of Contents
NOTES TO THE CONSOLIDATED FINANCIAL STATEMENTS continued
FOR THE YEAR ENDED 31 DECEMBER 2017
| | | | | | | | | | | | | | | |
Figures in million - SA rand | Group | Total SA Region | Total SA Gold | Drie-fontein | Kloof | Beatrix | Cooke | Corporate and re- conciling items1 | Total SA PGM | Kroondal | Platinum
Mile | Mimosa | Rustenburg
Operations | Corporate and re- conciling items1 | Total US Region Stillwater2 |
31 December 2017 | | | | | | | | | | | | | | | |
Revenue | 45,911.6 | 36,750.0 | 23,473.6 | 8,076.9 | 8,845.1 | 4,875.8 | 1,676.5 | (0.7) | 13,276.4 | 2,861.5 | 194.1 | 1,687.7 | 10,220.8 | (1,687.7) | 9,161.6 |
Underground | 37,790.3 | 33,168.0 | 21,143.2 | 7,148.1 | 7,985.3 | 4,753.1 | 1,257.4 | (0.7) | 12,024.8 | 2,861.5 | - | 1,687.7 | 9,163.3 | (1,687.7) | 4,622.3 |
Surface | 3,582.0 | 3,582.0 | 2,330.4 | 928.8 | 859.8 | 122.7 | 419.1 | - | 1,251.6 | - | 194.1 | - | 1,057.5 | - | - |
Recycling | 4,539.3 | - | - | - | - | - | - | - | - | - | - | - | - | - | 4,539.3 |
Cost of sales, before amortisation and depreciation | (36,482.7) | (29,471.0) | (17,879.2) | (6,203.5) | (5,762.7) | (3,952.5) | (1,960.5) | - | (11,591.8) | (2,395.9) | (129.8) | (1,200.5) | (9,066.1) | 1,200.5 | (7,011.7) |
Underground | (29,345.3) | (26,710.5) | (16,032.2) | (5,488.9) | (5,109.5) | (3,852.1) | (1,581.7) | - | (10,678.3) | (2,395.9) | - | (1,200.5) | (8,282.4) | 1,200.5 | (2,634.8) |
Surface | (2,760.5) | (2,760.5) | (1,847.0) | (714.6) | (653.2) | (100.4) | (378.8) | - | (913.5) | - | (129.8) | - | (783.7) | - | - |
Recycling | (4,376.9) | - | - | - | - | - | - | - | - | - | - | - | - | - | (4,376.9) |
Amortisation and depreciation | (5,699.7) | (4,268.3) | (3,507.5) | (1,126.5) | (1,404.5) | (696.2) | (256.4) | (23.9) | (760.8) | (239.0) | (2.6) | (211.7) | (514.7) | 207.2 | (1,431.4) |
Interest income | 415.5 | 363.7 | 205.7 | 77.6 | 71.1 | 18.4 | 12.5 | 26.1 | 158.0 | 57.0 | 2.1 | 8.8 | 96.6 | (6.5) | 51.8 |
Finance expense | (2,971.8) | (1,517.7) | (1,182.2) | (220.9) | (246.9) | (128.4) | (76.7) | (509.3) | (335.5) | (90.7) | - | (10.0) | (244.9) | 10.1 | (1,454.1) |
Share-based payments | (231.9) | (227.0) | (227.0) | (2.8) | (1.8) | (1.3) | - | (221.1) | - | - | - | - | - | - | (4.9) |
Net other costs3 | (1,163.1) | (1,132.7) | 10.4 | (8.5) | (14.5) | (48.0) | (320.3) | 401.7 | (1,143.1) | (216.4) | (11.9) | 23.2 | (934.9) | (3.1) | (30.4) |
Non-underlying items4 | (6,759.1) | (6,688.2) | (6,535.8) | (74.9) | (50.4) | (675.3) | (3,664.7) | (2,070.5) | (152.4) | (9.0) | - | - | (134.9) | (8.5) | (70.9) |
Royalties | (398.5) | (398.5) | (325.3) | (77.8) | (189.3) | (44.5) | (13.7) | - | (73.2) | (5.6) | - | (60.4) | (67.6) | 60.4 | - |
Current taxation | (504.2) | (405.3) | (385.4) | (14.8) | (350.1) | (12.4) | - | (8.1) | (19.9) | - | (9.3) | (59.3) | (10.0) | 58.7 | (98.9) |
Deferred taxation | 3,450.8 | 533.8 | 549.2 | (12.0) | 61.4 | 245.3 | 1.5 | 253.0 | (15.4) | (24.8) | (4.3) | (2.8) | 12.7 | 3.8 | 2,917.0 |
Loss for the year | (4,433.1) | (6,461.2) | (5,803.5) | 412.8 | 957.4 | (419.1) | (4,601.8) | (2,152.8) | (657.7) | (62.9) | 38.3 | 175.0 | (643.0) | (165.1) | 2,028.1 |
Attributable to: | | | | | | | | | | | | | | - | |
Owners of the parent | (4,437.4) | (6,465.5) | (5,804.6) | 412.8 | 957.4 | (419.1) | (4,601.8) | (2,153.9) | (660.9) | (62.9) | 35.1 | 175.0 | (643.0) | (165.1) | 2,028.1 |
Non-controlling interest holders | 4.3 | 4.3 | 1.1 | - | - | - | - | 1.1 | 3.2 | - | 3.2 | - | - | - | - |
| | | | | | | | | | | | | | | |
Adjusted EBITDA | 9,045.1 | 6,902.5 | 5,308.5 | 1,841.0 | 3,044.5 | 910.0 | (527.4) | 40.4 | 1,594.0 | 430.9 | 51.7 | 521.4 | 1,112.9 | (522.9) | 2,142.6 |
| | | | | | | | | | | | | | | |
Sustaining capital expenditure | (1,325.6) | (1,098.7) | (531.1) | (235.0) | (210.2) | (63.1) | (8.5) | (14.3) | (567.6) | (190.5) | (11.0) | (222.5) | (366.1) | 222.5 | (226.9) |
Ore reserve development | (3,291.6) | (2,753.0) | (2,288.0) | (876.1) | (876.2) | (482.0) | (53.7) | - | (465.0) | - | - | - | (465.0) | - | (538.6) |
Growth projects | (1,481.6) | (593.3) | (591.0) | (44.4) | (147.1) | (0.5) | (11.7) | (387.3) | (2.3) | - | (2.3) | - | - | - | (888.3) |
Total capital expenditure | (6,098.8) | (4,445.0) | (3,410.1) | (1,155.5) | (1,233.5) | (545.6) | (73.9) | (401.6) | (1,034.9) | (190.5) | (13.3) | (222.5) | (831.1) | 222.5 | (1,653.8) |
1 Corporate and reconciling items represents the items to reconcile segment data to consolidated financial statement totals. This does not represent a separate segment as it does not generate mining revenue.
2 Stillwater’s performance is for eight months ended 31 December 2017 since acquisition (refer to note 13.1).
3 Net other costs consists of loss on financial instruments, gain on foreign exchange differences, other income and other costs as detailed in profit or loss. Corporate and reconciling items net other costs includes the share of results equity-accounted investees after tax as detailed in profit or loss.
4 Non-underlying items consists of impairments, occupational healthcare expense, gain on disposal of property, plant and equipment, restructuring costs and transaction costs as detailed in profit or loss.
| |
Sibanye-Stillwater | Form 20-F 2017 | 168 |
Table of Contents
NOTES TO THE CONSOLIDATED FINANCIAL STATEMENTS continued
FOR THE YEAR ENDED 31 DECEMBER 2017
| | | | | | | | | | | | | |
Figures in million - SA rand | Group Total SA Region | Total SA Gold | Driefontein | Kloof | Beatrix | Cooke | Corporate and re- conciling items2 | Total SA PGM | Kroondal3 | Platinum Mile3 | Mimosa3 | Rustenburg Operations4 | Corporate and re- conciling items2 |
31 December 2016 (Revised)1 | | | | | | | | | | | | | |
Revenue | 31,240.7 | 27,501.3 | 9,401.1 | 8,890.9 | 5,883.9 | 3,362.2 | (36.8) | 3,739.4 | 1,973.3 | 131.1 | 1,223.2 | 1,656.0 | (1,244.2) |
Underground | 28,026.5 | 24,608.4 | 8,105.3 | 8,012.6 | 5,626.9 | 2,900.4 | (36.8) | 3,418.1 | 1,973.3 | - | 1,223.2 | 1,465.8 | (1,244.2) |
Surface | 3,214.2 | 2,892.9 | 1,295.8 | 878.3 | 257.0 | 461.8 | - | 321.3 | - | 131.1 | - | 190.2 | - |
Cost of sales, before amortisation and depreciation | (20,709.1) | (17,346.0) | (5,566.6) | (5,041.0) | (3,753.4) | (2,985.0) | - | (3,363.1) | (1,689.8) | (90.8) | (969.0) | (1,582.5) | 969.0 |
Underground | (18,800.6) | (15,655.1) | (4,852.1) | (4,609.4) | (3,567.4) | (2,626.2) | - | (3,145.5) | (1,689.8) | - | (969.0) | (1,455.7) | 969.0 |
Surface | (1,908.5) | (1,690.9) | (714.5) | (431.6) | (186.0) | (358.8) | - | (217.6) | - | (90.8) | - | (126.8) | - |
Amortisation and depreciation | (4,041.9) | (3,814.7) | (1,012.9) | (1,190.7) | (818.0) | (770.8) | (22.3) | (227.2) | (162.9) | (1.2) | (223.7) | (58.6) | 219.2 |
Interest income | 331.4 | 289.6 | 70.8 | 62.3 | 34.1 | 32.5 | 89.9 | 41.8 | 34.6 | (9.0) | 0.5 | 8.2 | 7.5 |
Finance expense | (903.1) | (806.2) | (143.1) | (156.0) | (77.6) | (75.8) | (353.7) | (96.9) | (70.6) | - | (11.2) | (26.2) | 11.1 |
Share-based payments | (496.2) | (255.9) | (16.5) | (13.7) | (9.1) | - | (216.6) | (240.3) | - | - | - | - | (240.3) |
Net other costs5 | (1,158.6) | (1,029.3) | (226.1) | (187.9) | (170.5) | (115.0) | (329.8) | (129.3) | (1.2) | (0.6) | 187.7 | (92.2) | (223.0) |
Non-underlying items6 | 548.2 | (1,548.5) | (20.8) | 15.7 | (12.6) | (1,423.9) | (106.9) | 2,096.7 | (1.3) | - | - | 2,105.2 | (7.2) |
Royalties | (566.6) | (528.0) | (204.8) | (194.3) | (113.2) | (15.7) | - | (38.6) | (10.2) | - | (82.9) | (28.3) | 82.8 |
Current taxation | (1,111.8) | (1,111.3) | (472.3) | (422.0) | (223.0) | (1.1) | 7.1 | (0.5) | - | - | (22.8) | - | 22.3 |
Deferred taxation | (90.3) | (164.5) | (64.3) | (148.5) | 19.4 | 35.3 | (6.4) | 74.2 | 16.9 | (11.6) | 13.1 | 68.1 | (12.3) |
Profit for the year | 3,042.7 | 1,186.5 | 1,744.5 | 1,614.8 | 760.0 | (1,957.3) | (975.5) | 1,856.2 | 88.8 | 17.9 | 114.9 | 2,049.7 | (415.1) |
Attributable to: | | | | | | | | | | | | | - |
Owners of the parent | 3,473.3 | 1,619.4 | 1,744.5 | 1,614.8 | 760.0 | (1,523.5) | (976.4) | 1,853.9 | 88.8 | 15.6 | 114.9 | 2,049.7 | (415.1) |
Non-controlling interest holders | (430.6) | (432.9) | - | - | - | (433.8) | 0.9 | 2.3 | - | 2.3 | - | - | - |
| | | | | | | | | | | | | |
Adjusted EBITDA | 10,270.4 | 9,920.1 | 3,782.5 | 3,800.7 | 2,085.9 | 290.1 | (39.1) | 350.3 | 262.9 | 39.6 | 446.7 | 76.7 | (475.6) |
| | | | | | | | | | | | | |
Sustaining capital expenditure | (1,010.5) | (683.5) | (218.5) | (261.2) | (84.8) | (48.9) | (70.1) | (327.0) | (175.8) | (1.3) | (159.8) | (148.7) | 158.6 |
Ore reserve development | (2,394.4) | (2,394.4) | (779.0) | (912.9) | (542.9) | (159.6) | - | - | - | - | - | - | - |
Growth projects | (746.3) | (746.3) | (54.1) | (130.1) | (0.7) | (40.7) | (520.7) | - | - | - | - | - | - |
Total capital expenditure | (4,151.2) | (3,824.2) | (1,051.6) | (1,304.2) | (628.4) | (249.2) | (590.8) | (327.0) | (175.8) | (1.3) | (159.8) | (148.7) | 158.6 |
1 Subsequent to the successful integration of the US PGM operations, management has included the corporate and reconciling items directly attributable to the SA PGM operations in the respective operating segments, in line with how the information from these segments is reviewed by and reported to the executive management team. The comparative segment reporting for the year ended 31 December 2016 has been revised to conform to the current presentation.
2 Corporate represents the items to reconcile segment data to consolidated financial statement totals. This does not represent a separate segment as it does not generate mining revenue.
3 The performance of Kroondal, Platinum Mile, and Mimosa is for the nine months ended 31 December 2016 since acquisition (refer to note 13.3). The Mimosa segment information reflects the financial information provided to the chief operating decision maker. In the consolidated financial statements this operating segment is accounted for using the equity method which differs from the measures used by the chief operating decision maker.
4 Rustenburg operations’ performance is for two months ended 31 December 2016 since acquisition (refer to note 13.2).
5 Net other costs consists of loss on financial instruments, gain on foreign exchange differences, other income and other costs as detailed in profit or loss. Corporate and reconciling items net other costs includes the share of results of equity-accounted investees after tax as detailed in profit or loss.
6 Non-underlying items consists of impairments, gain on disposal of property, plant and equipment, restructuring costs, transaction costs and gain on acquisition as detailed in profit or loss.
| |
Sibanye-Stillwater | Form 20-F 2017 | 169 |
Table of Contents
NOTES TO THE CONSOLIDATED FINANCIAL STATEMENTS continued
FOR THE YEAR ENDED 31 DECEMBER 2017
| | | | | | |
Figures in million - SA rand | Group Total SA Gold | Driefontein | Kloof | Beatrix | Cooke | Corporate and reconciling items1 |
31 December 2015 | | | | | | |
Revenue | 22,717.4 | 8,236.0 | 6,691.4 | 4,815.5 | 2,974.5 | - |
Underground | 20,515.0 | 7,284.1 | 6,112.8 | 4,555.7 | 2,562.4 | - |
Surface | 2,202.4 | 951.9 | 578.6 | 259.8 | 412.1 | - |
Cost of sales, before amortisation and depreciation | (16,380.4) | (5,234.2) | (4,777.2) | (3,391.0) | (2,978.0) | - |
Underground | (14,940.8) | (4,681.2) | (4,454.9) | (3,184.5) | (2,620.2) | - |
Surface | (1,439.6) | (553.0) | (322.3) | (206.5) | (357.8) | - |
Amortisation and depreciation | (3,636.6) | (1,142.6) | (1,029.3) | (739.4) | (704.6) | (20.7) |
Interest income | 257.0 | 67.5 | 50.6 | 31.3 | 27.1 | 80.5 |
Finance expense | (561.8) | (147.7) | (150.1) | (57.2) | (61.3) | (145.5) |
Share-based payments | (274.4) | (35.1) | (27.6) | (23.5) | - | (188.2) |
Net other costs2 | (575.1) | (77.9) | (60.4) | (47.3) | (30.1) | (359.4) |
Non-underlying items3 | (230.1) | (2.9) | 7.2 | (8.4) | (31.8) | (194.2) |
Royalties | (400.6) | (196.8) | (98.4) | (88.7) | (16.7) | - |
Current taxation | (696.7) | (430.8) | (97.4) | (153.4) | - | (15.1) |
Deferred taxation | 319.5 | 53.4 | 0.9 | 18.0 | 122.0 | 125.2 |
Profit for the year | 538.2 | 1,088.9 | 509.7 | 355.9 | (698.9) | (717.4) |
Attributable to: | | | | | | |
Owners of the parent | 716.9 | 1,088.9 | 509.7 | 355.9 | (519.9) | (717.7) |
Non-controlling interest holders | (178.7) | - | - | - | (179.0) | 0.3 |
| | | | | | |
Adjusted EBITDA | 6,234.8 | 2,934.4 | 1,865.1 | 1,389.1 | (21.7) | 67.9 |
| | | | | | |
Sustaining capital expenditure | (668.9) | (249.2) | (225.6) | (86.1) | (92.9) | (15.1) |
Ore reserve development | (2,304.9) | (727.0) | (840.6) | (510.4) | (226.9) | - |
Growth projects | (371.0) | (18.0) | (63.7) | - | (17.6) | (271.7) |
Total capital expenditure | (3,344.8) | (994.2) | (1,129.9) | (596.5) | (337.4) | (286.8) |
1 Corporate represents the items to reconcile segment data to consolidated financial statement totals. This does not represent a separate segment as it does not generate mining revenue.
2 Net other costs consists of loss on financial instruments, loss on foreign exchange differences, other income and other costs as detailed in profit or loss. Corporate and reconciling net other costs includes the share of results of equity-accounted investees after tax as detailed in profit or loss.
3 Non-underlying items consists of gain on disposal of property, plant and equipment, restructuring costs, transaction costs and net loss on derecognition of financial guarantee asset and liability as detailed in profit or loss.
3. REVENUE
SIGNIFICANT ACCOUNTING JUDGEMENTS AND ESTIMATES
The determination of PGM concentrate sales revenue from the time of initial recognition of the sale on a provisional basis through to final pricing requires management to continuously re-estimate the fair value of the price adjustment feature. Management determines this with reference to estimated forward prices using consensus forecasts.
ACCOUNTING POLICY
Revenue is recognised to the extent that it is probable that economic benefits will flow to the Group and the amount of revenue can be reliably measured.
Revenue arising from gold sales is recognised at the fair value of the consideration received or receivable, once the significant risks and rewards of ownership have passed to the buyer. These criteria are typically met when the gold is delivered to the refinery. The price of gold is determined by market forces.
Revenue arising from PGM concentrate and metal sales is recognised when risks and rewards of ownership of the mine product are passed to the buyer pursuant to a sales contract. The sales price is determined on a provisional basis at the date of delivery. Adjustments to the sale price occur based on movements in the metal market price up to the date of final pricing. Final pricing is based on the monthly average market price in the month of settlement. The period between provisional invoicing and final pricing is typically between two and four months. Revenue on provisionally priced sales is initially recorded at the estimated fair value of the consideration receivable. The revenue adjustment mechanism embedded within provisionally priced sales arrangements has the characteristics of a commodity derivative. Accordingly, the fair value of the final sales price adjustment is re-estimated continuously and changes in fair value recognised as an adjustment to revenue in profit or loss and trade receivables in the statement of financial position. In all cases, fair value is determined with reference to estimated forward prices using consensus forecasts.
| |
Sibanye-Stillwater | Form 20-F 2017 | 170 |
Table of Contents
NOTES TO THE CONSOLIDATED FINANCIAL STATEMENTS continued
FOR THE YEAR ENDED 31 DECEMBER 2017
Revenue arising from PGM recycling consists of the sales of recycled palladium, platinum and rhodium derived from spent catalytic material. Revenue arising from PGM recycling revenue also includes revenue from toll processing, which is recognised at the time the contained metals are returned to the supplier at a third party refinery.
| | | | |
Figures in million - SA rand | | 2017 | 2016 | 2015 |
Revenue from: | | | | |
Gold mining activities | | 23,473.6 | 27,501.3 | 22,717.4 |
PGM mining activities | | 17,898.7 | 3,739.4 | - |
Recycling activities | | 4,539.3 | - | - |
Total revenue | | 45,911.6 | 31,240.7 | 22,717.4 |
4. COST OF SALES
ACCOUNTING POLICY
The following accounting policies relates to some costs that are included in cost of sales:
Short-term employee benefits
Short-term employee benefits are expensed as the related service is provided. A liability is recognised for the amount expected to be paid if the Group has a present legal or constructive obligation to pay this amount as a result of past service provided by the employee and the obligation can be reliably estimated.
Pension and provident funds
The Group operates a defined contribution retirement plan and contributes to a number of industry-based defined contribution retirement plans. The retirement plans are funded by payments from employees and Group companies.
Contributions to defined contribution funds are expensed as incurred.
| | | | |
Figures in million - SA rand | Notes | 2017 | 2016 | 2015 |
Salaries and wages | | (15,323.0) | (9,276.1) | (7,345.0) |
Consumable stores | 19 | (8,789.4) | (5,243.2) | (3,995.7) |
Utilities | | (4,930.1) | (3,709.0) | (3,128.2) |
Mine contracts | | (2,956.9) | (2,105.3) | (1,457.9) |
Recycling | | (4,376.9) | - | - |
Other | | (3,398.0) | (2,769.9) | (2,758.5) |
Ore reserve development costs capitalised | 12 | 3,291.6 | 2,394.4 | 2,304.9 |
Cost of sales, before amortisation and depreciation | | (36,482.7) | (20,709.1) | (16,380.4) |
Amortisation and depreciation | 12 | (5,699.7) | (4,041.9) | (3,636.6) |
Total cost of sales | | (42,182.4) | (24,751.0) | (20,017.0) |
The SA region employees are members of various defined contribution retirement plans. The cost of providing retirement benefits for the year amounted to R959.9 million (2016: R626.0 million and 2015: R691.1 million).
5. FINANCE EXPENSE
ACCOUNTING POLICY
Finance expense comprises interest on borrowings, environmental rehabilitation obligation, occupational healthcare obligation and Deferred Payment and offset by borrowing costs capitalised on qualifying assets.
Interest payable on borrowings is recognised in profit or loss over the term of the borrowings using the effective interest method. Cash flows from interest paid are classified under operating activities in the statement of cash flows.
| | | | |
Figures in million - SA rand | Notes | 2017 | 2016 | 2015 |
Interest charge on: | | | | |
Borrowings - interest paid | 24 | (2,091.9) | (427.5) | (247.9) |
Borrowings - accrued interest and unwinding of amortised cost | 24 | (251.8) | (141.4) | (102.3) |
Environmental rehabilitation obligation | 25 | (357.1) | (291.4) | (197.9) |
Occupational healthcare obligation | 26 | (46.4) | - | - |
Deferred payment | 18.2 | (148.2) | (24.1) | - |
Other | | (76.4) | (18.7) | (13.7) |
Total finance expense | | (2,971.8) | (903.1) | (561.8) |
| |
Sibanye-Stillwater | Form 20-F 2017 | 171 |
Table of Contents
NOTES TO THE CONSOLIDATED FINANCIAL STATEMENTS continued
FOR THE YEAR ENDED 31 DECEMBER 2017
6. SHARE-BASED PAYMENTS
ACCOUNTING POLICY
The Group operates an equity-settled compensation plan in which certain employees of the Group participate. The fair value of the equity-settled instruments is measured by reference to the fair value of the equity instrument granted.
Fair value is based on market prices of the equity-settled instruments granted, if available, taking into account the terms and conditions upon which those equity-settled instruments were granted. Fair value of equity-settled instruments granted is estimated using appropriate valuation models and appropriate assumptions at the grant date. Non-market vesting conditions (service period prior to vesting) are not taken into account when estimating the fair value of the equity-settled instruments at grant date. Market conditions are taken into account in determining the fair value at grant date.
The grant date fair value of the equity-settled instruments is recognised as an employee benefit expense over the vesting period based on the Group’s estimate of the number of instruments that will eventually vest, with a corresponding increase in the share-based payment reserve. Vesting assumptions for non-market conditions are reviewed at each reporting date to ensure they reflect current expectations.
The Group also operates a cash-settled compensation plan in which certain employees of the Group participate. In terms of the Rustenburg operations acquisition, the Group issued cash-settled instruments to black economic empowerment (BEE) shareholders. The grant date fair value of the cash-settled instruments is equal to the value of the equity-settled instrument granted on the same grant date.
The grant date fair value of the cash-settled instruments is recognised as an employee benefit expense or share-based payment on BEE transaction over the vesting period based on the Group’s estimate of the number of instruments that will eventually vest, with a corresponding increase in the share-based payment obligation. At each reporting date the obligation is remeasured to the fair value of the instrument, to reflect the potential outflow of cash resources to settle the liability, with a corresponding adjustment to gain or loss on financial instrument in profit or loss. Vesting assumptions for non-market conditions are reviewed at each reporting date to ensure they reflect current expectations.
Where the terms of an equity-settled or a cash-settled award are modified, the originally determined expense is recognised as if the terms had not been modified. In addition, an expense is recognised for any modification, which increases the total fair value of the share-based payment arrangement, or is otherwise beneficial to the participant as measured at the date of the modification.
| | | | |
Figures in million - SA rand | Notes | 2017 | 2016 | 2015 |
Sibanye 2017 Share Plan | 6.1 | (9.0) | - | - |
Performance shares | | (9.0) | - | - |
Sibanye Gold Limited 2013 Share Plan | 6.2 | (208.4) | (172.1) | (119.1) |
Performance shares | | (186.3) | (145.5) | (96.2) |
Bonus shares | | (22.1) | (26.6) | (22.9) |
Sibanye Gold Limited Phantom Share Scheme | 6.3 | (11.2) | (83.8) | (155.3) |
Performance shares | | (11.2) | (83.8) | (136.4) |
Bonus shares | | - | - | (17.7) |
Phantom share dividends | | - | - | (1.2) |
Stillwater cash settled scheme | | (3.3) | - | - |
Share-based payment on BEE transaction | 6.4 | - | (240.3) | - |
Total share-based payments | | (231.9) | (496.2) | (274.4) |
6.1 SIBANYE 2017 SHARE PLAN
On 23 May 2017, the shareholders of Sibanye-Stillwater approved the adoption of the Sibanye 2017 Share Plan (2017 Share Plan) with effect for allocations made after this date. The 2017 Share plan provides for two methods of participation, namely Conditional Shares and Forfeitable Shares. This plan seeks to attract, retain, motivate and reward participating employees on a basis which seeks to align the interest of such employees with those of the shareholders. All employees at above Vice President level are eligible to participate in the plan.
FORFEITABLE SHARES
The Remuneration Committee makes an annual award of Forfeitable Shares to eligible participants. The number of shares awarded depends on the individual’s annual cash bonus, which is determined by reference to actual performance against predetermined targets for the preceding cycle, and using the relevant share price calculation at the award date.
The face value of the Forfeitable Share award is equal to two-thirds of the actual annual cash bonus and is allocated in the form of restricted forfeitable shares. The Forfeitable Shares vest in two equal tranches at nine months and 18 months after the award date. Except for the right to dispose, participants have full shareholder rights in the unvested Forfeitable Shares during the vesting period, including the right to receive dividends.
CONDITIONAL SHARES
The Remuneration Committee makes an annual award of Conditional Shares to eligible participants. The number of Conditional Shares awarded to an employee is based on the employee’s annual guaranteed pay and grade combined with a factor related to the employee’s assessed performance rating for the prior year and using the relevant share price calculation at the award date.
| |
Sibanye-Stillwater | Form 20-F 2017 | 172 |
Table of Contents
NOTES TO THE CONSOLIDATED FINANCIAL STATEMENTS continued
FOR THE YEAR ENDED 31 DECEMBER 2017
Performance Shares vest no earlier than the third anniversary of the award, to the extent that Sibanye-Stillwater has met specified performance criteria over the intervening period. Essentially the number of shares that vest will depend on the extent to which Sibanye-Stillwater’s has performed over the intervening three year period relative to two particular performance criteria, Total Shareholder Return (TSR) and Return on Capital Employed (ROCE). These are considered to be the most widely acceptable vesting performance measures suited to aligning the outcome of long-term share incentive awards with shareholders’ interests. This change will result in a possible vesting percentage ranging from 0%, in the case of very poor performance, to 100% vesting of the awarded Performance Shares in the event of having achieved stretched performance outcomes.
The methodology to determine the performance condition that is applied on the vesting of Conditional Shares is approved by the Remuneration Committee. Due to concerns expressed by shareholders during 2015, a review was conducted to identify appropriate adjustments to the methodology for determining the performance condition to be reflective of the Company’s evolving strategic market position and to enhance alignment with shareholder interests. The revised performance condition determination methodology that is applicable to all Conditional Share awards as from 1 March 2016 is described below.
The performance condition comprises two elements that are applied with the indicated weighting.
Total Shareholder Return (TSR) – 70% Weighting
TSR is generally recognised as the most faithful indicator of shareholder value creation. It is used extensively internationally and increasingly in South Africa, sometimes as a single metric but most often as one of two or three weighted performance metrics. In some company share plans, an absolute target is set, but more often it is referenced to a peer or comparator group of “like” companies.
The TSR element is measured against a benchmark of eight peer mining and resource companies that can collectively be deemed to represent an alternative investment portfolio for Sibanye-Stillwater’s shareholders. The eight peer companies for TSR comprises of similar market capitalisation companies reflective of the expected positioning of Sibanye-Stillwater over the short to medium term as a value driven multi-commodity resources company with a specific focus on gold and platinum, and are set out in the table below.
Sibanye-Stillwater’s TSR over the vesting period is compared with the peer group TSR curve constructed on a market capitalisation weighted basis in the following manner. The annualised TSR over the vesting period (TSRANN) is determined for each of the companies in the peer group. The peer group companies are sorted from lowest to highest TSRANN. The average market capitalisation based on daily closing price is determined for each company, and each peer company is assigned its proportion of the overall average market capitalisation of the peer group. The peer company TSR curve is plotted at the midpoint of each company’s percentage of peer group market capitalisation on a cumulative basis above the worse performing companies in the peer group. In the event that one or more of the peer companies become ineligible for comparison, a peer company curve based on the companies remaining in the peer group is utilised.
The cumulative position of Sibanye-Stillwater’s TSRANN is then mapped onto the TSR curve for the peer group to determine the percentile at which Sibanye-Stillwater performed over the vesting period. The performance curve governing vesting is set out in the table below.
| |
TSR element of performance conditions | |
Percentile on peer group TSR curve | % vesting |
0% | 0% |
10% | 0% |
20% | 0% |
30% | 5% |
40% | 20% |
50% | 35% |
60% | 55% |
70% | 75% |
80% | 90% |
90% | 100% |
100% | 100% |
The eight peer group comparator companies for TSR comprises of similar market capitalisation companies reflective of the expected positioning of Sibanye-Stillwater over the short to medium term as a value driven multi-commodity resources company with a specific focus on gold and platinum and are set out in the table below.
|
Peer group companies for TSR comparison |
AngloGold Ashanti Limited (AngloGold Ashanti) |
Anglo American Platinum Limited (Anglo American Platinum) |
Gold Fields Limited (Gold Fields) |
Impala Platinum Holdings Limited |
Northam Platinum Limited |
Exxaro Resources Limited |
Harmony Gold Mining Company Limited (Harmony) |
African Rainbow Minerals Limited |
| |
Sibanye-Stillwater | Form 20-F 2017 | 173 |
Table of Contents
NOTES TO THE CONSOLIDATED FINANCIAL STATEMENTS continued
FOR THE YEAR ENDED 31 DECEMBER 2017
Return On Capital Employed (ROCE) – 30% Weighting
ROCE is a profitability ratio that measures how efficiently a company generates profits from its capital employed. There is an increased focus on measuring the returns earned by businesses on the capital deployed by shareholders over and above the steady low risk returns typically available on financial markets.
For Sibanye-Stillwater, ROCE is evaluated against the company’s cost of capital (Ke). A minimum threshold on the performance scale for ROCE is set as equalling the cost of capital, Ke, which would lead to the ROCE element contributing 0% towards the performance condition. Delivering a return that exceeds Ke by 6% or more would be regarded as a superior return representing the maximum 100% on the performance scale and full vesting in respect of the ROCE element. The performance curve governing vesting is set out in the table below.
ROCE element of performance condition | |
Annual ROCE | % vesting |
≤Ke | 0.00% |
Ke + 1% | 16.7% |
Ke + 2% | 33.3% |
Ke + 3% | 50.0% |
Ke + 4% | 66.7% |
Ke + 5% | 83.3% |
Ke + 6% | 100.00% |
The overall performance condition is determined by adding 70% of the TSR element to 30% of the ROCE element. Furthermore should the Board, at its sole discretion, determine that there is evidence of extreme environmental, social and governance malpractice during the vesting period, up to 20% of the Performance Shares that would otherwise settle on vesting may be forfeited.
As indicated, the performance criteria described above govern vesting of all awards effective from 23 May 2017. Should any further adjustment be made these will govern future awards but will not be applied retrospectively.
The inputs to the models for options granted during the year were as follows:
| | |
Performance | | Bonus |
shares | | Shares |
| 2017 | MONTE CARLO SIMULATION | 2017 |
| 53.96% | Weighted average historical volatility (based on a statistical analysis of the share price on a weighted moving average basis for the expected term of the option) | 53.96% |
3 | Expected term (years) | n/a |
n/a | Expected term (months) | 9 - 18 |
| 4.65% | Expected dividend yield | 4.65% |
| 7.40% | Weighted average three-year risk-free interest rate (based on SA interest rates) | 7.24% |
n/a | Marketability discount | 1.27% / 0.50% |
24.07 | Weighted average fair value | 24.84 / 24.14 |
The compensation cost related to awards not yet recognised under the plan at 31 December 2017 amounts to R48.2 million and is to be spread over three years.
At the annual general meeting (AGM) on 23 May 2017, the directors of Sibanye-Stillwater were authorised to issue and allot all or any of such shares required for the 2017 Share Plan, but in aggregate all plans may not exceed 40,000,000 shares. An individual participant may also not be awarded an aggregate of shares exceeding 4,000,000 shares.
OPTIONS GRANTED, EXERCISED AND FORFEITED UNDER THIS PLAN
| | |
Performance | | Bonus |
shares | | Shares |
| 2017 | Number of instruments | 2017 |
| Movement during the year: | |
2,376,742 | Granted during the year | - |
10,933,066 | Supplementary awards related to the SGL 2013 Plan1 | - |
(105,449) | Exercised and released | - |
(250,471) | Forfeited | - |
12,953,888 | Outstanding at end of the year | - |
6.2 SIBANYE GOLD LIMITED 2013 SHARE PLAN
On 21 November 2012, the shareholders of Sibanye-Stillwater approved the adoption of the Sibanye Gold Limited 2013 Share Plan (SGL Share Plan) with effect from the date of listing. The SGL Share plan provides for two methods of participation, namely Performance Shares and the Bonus Shares. This plan seeks to attract, retain, motivate and reward participating employees on a basis which seeks to align the interest of such employees with those of the shareholders.
| |
Sibanye-Stillwater | Form 20-F 2017 | 174 |
Table of Contents
NOTES TO THE CONSOLIDATED FINANCIAL STATEMENTS continued
FOR THE YEAR ENDED 31 DECEMBER 2017
BONUS SHARES
The Remuneration Committee makes an annual award of forfeitable shares to the executive directors, prescribed officers, senior vice presidents and vice presidents. These are referred to as Bonus Shares. The size of this Bonus Share award depends on the individual’s annual cash bonus, which is determined by actual performance against predetermined targets.
The face value of the Bonus Share award is equal to two-thirds of the actual annual cash bonus and is allocated in the form of restricted forfeitable shares. The Bonus Shares vest in two equal parts at nine months and 18 months after the award date. Dividends are payable on the Bonus Shares during the holding period.
PERFORMANCE SHARES
The Remuneration Committee makes an annual award of conditional shares to the executive directors, prescribed officers, senior vice presidents and vice presidents. These are referred to as Performance Shares. The number of Performance Shares awarded to an employee is based on the employee’s annual guaranteed pay and their grade combined with a factor related to their assessed performance rating for the prior year and using the relevant share price calculation at the offer date.
Performance Shares vest no earlier than the third anniversary of their award, to the extent that Sibanye-Stillwater has met specified performance criteria over the intervening period. Essentially the number of shares that vest will depend on the extent to which Sibanye-Stillwater’s has performed over the intervening three year period relative to two particular performance criteria, TSR and ROCE. These are considered to be the most widely acceptable vesting performance measures suited to aligning the outcome of long-term share incentive awards with shareholders’ interests. This change will result in a possible vesting percentage ranging from 0%, in the case of very poor performance, to 100% vesting of the awarded Performance Shares in the event of having achieved stretched performance outcomes.
FOR ALLOCATIONS FROM MARCH 2016 ONWARDS
The performance criteria used to govern the vesting performance shares are determined by the Remuneration Committee and communicated in award letters to participants. The revised performance conditions, as described in note 6.1, applied with the indicated weightings, were implemented for determining the vesting of future awards effective from March 2016 onwards.
As indicated, the performance criteria described above govern vesting of all awards effective from 1 March 2016. Should any further adjustment be made these will govern future offers but will not be applied retrospectively.
The inputs to the models for options granted during the year were as follows:
| | | | | |
Performance | | | Bonus |
shares | | | Shares |
| 2016 | 2017 | | MONTE CARLO SIMULATION | 2017 | 2016 |
| 55.12% | 53.96% | | Weighted average historical volatility (based on a statistical
analysis of the share price on a weighted moving average
basis for the expected term of the option) | 53.96% | 55.15% |
3 | 3 | | Expected term (years) | n/a | n/a |
n/a | n/a | | Expected term (months) | 9 - 18 | 9 - 18 |
| 3.75% | 4.65% | | Expected dividend yield | 4.65% | 3.75% |
| 8.51% | 7.40% | | Weighted average three-year risk-free interest rate (based on SA interest rates) | 7.24% | 7.78% |
n/a | n/a | | Marketability discount | 1.27% / 0.50% | 1.60% / 0.69% |
50.81 | 24.07 | | Weighted average fair value | 24.84 / 24.14 | 54.27 / 53.02 |
FOR ALLOCATIONS UP TO FEBRUARY 2016
The Remuneration Committee made an annual conditional award of Performance Shares to the chief executive officer, chief financial officer (CFO), senior vice presidents and vice presidents (referred to as Performance Shares). The number of Performance Shares awarded to an employee was based on the employee’s annual guaranteed remuneration, grade and performance. The actual number of Performance Shares which vest was determined by Sibanye-Stillwater’s share price performance measured against the performance of a peer group, being Harmony, Pan African Resources PLC and Gold One International Limited (Gold One) (subsequently delisted), over a performance period of three years. This peer group was determined and approved by the Remuneration Committee. The Performance Shares, which vest, were based on the relative change in the Sibanye-Stillwater share price compared to the respective share prices of the individual companies within the peer group and with discretion allowed due to the small sample size. For any Performance Shares award to be settled to executives, an internal company performance target was required to be met before the external relative measure was applied. The target performance criterion was set at 85% of Sibanye-Stillwater’s expected gold production over the three-year measurement period as set out in the business plans of Sibanye-Stillwater as approved by the Board. Only once the internal measure has been achieved, was the external measure (Sibanye-Stillwater’s share price performance measured against the abovementioned peer group) applied to determine the scale of the vesting of awards of Performance Shares.
The Remuneration Committee makes an annual conditional award of Bonus Shares to each executive director and senior executive. The size of the award depended on the individual’s annual cash bonus, which was determined by actual performance against predetermined targets. Restricted Bonus Shares were allocated on the ratio of two-thirds of an individual’s annual bonus. The Bonus Shares vest in two equal parts at nine months and 18 months after the award date. Dividends are payable on the Bonus Shares during the holding period.
| |
Sibanye-Stillwater | Form 20-F 2017 | 175 |
Table of Contents
NOTES TO THE CONSOLIDATED FINANCIAL STATEMENTS continued
FOR THE YEAR ENDED 31 DECEMBER 2017
The fair value of the above Performance Shares equity instruments granted during the period were valued using the Monte Carlo Simulation model. For the Bonus Shares equity instruments, a future trading model was used to estimate the loss in value to the holders of bonus shares due to trading restrictions. The actual valuation was developed using a Monte Carlo analysis of the future share price of Sibanye-Stillwater.
The inputs to the models for options granted during the year ended 31 December 2015 was as follows:
| | |
Performance | | Bonus |
shares | | Shares |
| 2015 | MONTE CARLO SIMULATION | 2015 |
| | |
| 42.3% | Weighted average historical volatility (based on a statistical analysis of the share price on a weighted moving average basis for the expected term of the option) | 42.3% |
3 | Expected term (years) | n/a |
n/a | Expected term (months) | 9 - 18 |
| 4.9% | Expected dividend yield | 4.9% |
| 6.4% | Weighted average three-year risk-free interest rate (based on SA interest rates) | 6.4% |
n/a | Marketability discount | 2.1% |
37.41 | Weighted average fair value | 25.56 |
The compensation cost related to awards not yet recognised under the plan at 31 December 2017 amounts to R335.5 million and is to be spread over three years. The number of options that had vested and were exercisable as at 31 December 2017 was 1,832,166 options.
At the AGM on 24 May 2016 the directors of Sibanye-Stillwater were authorised to issue and allot all or any of such shares required for the plans, but in aggregate all plans may not exceed 70,619,126 (10%) of the total issued ordinary share capital of the Company. An individual participant may also not be awarded an aggregate of shares from all or any such plans exceeding 7,061,913 (1%) of the Company’s total issued ordinary share capital. The unexercised options and shares under all plans represented 15,112,493 (2%) of the total issued ordinary share capital of Sibanye-Stillwater at 31 December 2016.
OPTIONS GRANTED, EXERCISED AND FORFEITED UNDER THIS PLAN
| | | | | | |
Performance shares | | Bonus Shares |
| 2015 | 2016 | 2017 | Number of instruments | 2017 | 2016 | 2015 |
23,289,262 | 9,398,072 | 10,610,779 | Outstanding at beginning of the year | 250,827 | 417,266 | 595,012 |
| | | Movement during the year: | | | |
3,059,058 | 5,103,184 | 12,851,131 | Granted during the year | 2,421,522 | 504,739 | 862,702 |
(16,690,497) | (3,832,758) | (2,616,050) | Exercised and released | (2,126,415) | (667,063) | (1,010,209) |
(259,751) | (57,719) | (1,466,474) | Forfeited | (99,465) | (4,115) | (30,239) |
9,398,072 | 10,610,779 | 19,379,386 | Outstanding at end of the year | 446,469 | 250,827 | 417,266 |
DIRECTORS AND PRESCRIBED OFFICERS’ EQUITY-SETTLED INSTRUMENTS
The directors and prescribed officers of Sibanye-Stillwater held the following equity-settled instruments in the above 2017 Share Plan and SGL 2013 Share Plan at 31 December 2017:
| | | | | | | |
| 2016 | Instruments granted | Equity-settled instruments
exercised during the year | Instruments forfeited | 2017 |
| Number of instruments | Number of instruments1 | Number of instruments1 | Average
price | Share
proceeds
(rand) | Number of instruments | Number of instruments |
Executive directors | | | | | | | |
Neal Froneman | 1,421,434 | 3,254,046 | 1,164,811 | 22.23 | 25,890,953 | - | 3,510,669 |
Charl Keyter | 598,360 | 1,547,398 | 441,890 | 21.09 | 9,321,625 | - | 1,703,868 |
Prescribed officers | | | | | | | |
Chris Bateman2 | - | 413,920 | - | - | - | - | 413,920 |
Hartley Dikgale | 288,235 | 854,177 | 249,867 | 21.73 | 5,429,285 | - | 892,545 |
Dawie Mostert | 345,231 | 890,147 | 256,239 | 20.56 | 5,269,478 | - | 979,139 |
Jean Nel3 | 166,151 | - | - | - | - | 166,151 | - |
Themba Nkosi | 67,666 | 625,869 | 53,463 | 12.56 | 671,388 | - | 640,072 |
Wayne Robinson | 324,682 | 921,495 | 165,169 | 13.26 | 2,189,959 | - | 1,081,008 |
Richard Stewart | 484,170 | 1,132,375 | 147,356 | 14.39 | 2,120,644 | - | 1,469,189 |
Robert van Niekerk | 445,920 | 1,280,519 | 361,056 | 21.80 | 7,870,624 | - | 1,365,383 |
John Wallington4 | 126,740 | 717,372 | 39,414 | 11.28 | 444,590 | - | 804,698 |
1 Instruments granted and exercised may differ from that presented in the Integrated Annual Report 2017 as the instruments granted and exercised presented above includes the Bonus Shares granted and exercised that relate to the rights offer.
1 Appointed as a prescribed officer on 1 July 2017.
2 Appointed as a prescribed officer on 13 April 2016, and resigned as a prescribed officer on 1 November 2016. Jean forfeited the instruments granted after his notice period in 2017.
3 Resigned as prescribed officer on 30 June 2017.
| |
Sibanye-Stillwater | Form 20-F 2017 | 176 |
Table of Contents
NOTES TO THE CONSOLIDATED FINANCIAL STATEMENTS continued
FOR THE YEAR ENDED 31 DECEMBER 2017
6.3 SIBANYE GOLD LIMITED 2013 PHANTOM SHARE SCHEME
On 14 May 2013, Sibanye-Stillwater’s Remuneration Committee limited the issuance of share options for the 2013 allocation under the SGL Share Plan to senior management only. Middle and certain senior management, who previously participated in the equity-settled share option scheme, participated in a cash-settled share scheme, the Sibanye Gold 2013 Phantom Share Scheme (the SGL Phantom Scheme). Notwithstanding that the SGL Phantom Scheme was not subject to compliance with the JSE Listings Requirements as it was a purely cash-settled remuneration scheme, and the SGL Share Plan rules applied, in all material aspects, to the SGL Phantom Scheme, other than the issue of new shares to participants.
Details of the phantom shares granted under this scheme to employees are detailed below:
| | | | | | |
Performance shares | | Bonus Shares |
| 2015 | 2016 | 2017 | Number of instruments | 2017 | 2016 | 2015 |
22,212,627 | 20,198,875 | 5,301,626 | Outstanding at beginning of the year | - | - | 1,731,262 |
| | | Movement during the year: | | | |
(773,814) | (14,275,138) | (5,178,775) | Vested and paid | - | - | (1,668,503) |
(1,239,938) | (622,111) | (122,851) | Forfeited | - | - | (62,759) |
20,198,875 | 5,301,626 | - | Outstanding at end of the year | - | - | - |
The grant date fair value of the above Performance Shares and Bonus Shares cash-settled instruments granted during the year were valued using the Monte Carlo Simulation model and a future trading model, respectively, as with the equity settled instruments above. As the cash-settled and equity-settled instruments were issued on the same day, the grant date fair value assumptions of the cash-settled instruments were the same as for the equity-settled instruments.
The fair value of the cash-settled instruments at reporting date, used to value the share-based payment obligation, was determined using the same assumptions as for the grant date valuation. However, the respective models take into account the actual share data of the peer group for the period from the grant date to the reporting date.
6.4 SHARE-BASED PAYMENT ON BEE TRANSACTION
In terms of the Rustenburg operations Transaction (refer to note 13.2), a 26% equity stake in SRPM was acquired by the BBBEE SPV (the BBBEE Transaction) by a vendor financed facility from Sibanye Platinum Proprietary Limited (Sibanye Platinum), on the following terms:
| · | | Interest at up to 0.2% above Sibanye-Stillwater’s highest cost of debt; |
| · | | Post payment of the annual Deferred Payment to Rustenburg Platinum Mines Limited (RPM) and in respect of any repayment by SRPM of shareholder loans or the distribution of dividends, 74% will be paid to Sibanye Platinum and 26% to BBBEE SPV; |
| · | | Of the 26% payment to BBBEE SPV, 85% will be used to service the facility owing by BBBEE SPV to Sibanye Platinum; |
| · | | The remaining 15% of any such payment or 100%, once the facility owing by BBBEE SPV to Sibanye Platinum is repaid, will be declared by BBBEE SPV as a dividend to the BBBEE SPV shareholders; and |
| · | | The facility will be capped at R3,500 million. |
The IFRS 2 expense has been limited to 44.8% of the 26% interest relating to Bakgatla-Ba-Kgafela Investment Holdings and Siyanda Resources Proprietary Limited, as the Rustenburg Mine Community Trust and Rustenburg Mine Employees Trust are controlled and consolidated by Sibanye-Stillwater. The 44.8% interest was based on the expected discounted future cash flows of the expected PGM reserves and costs to extract the PGMs.
6.5 SHARE-BASED PAYMENT OBLIGATIONS
| | | | |
Figures in million - SA rand | | 2017 | 2016 | 2015 |
Share based payment on BEE transaction | | 399.5 | 240.3 | - |
Share based payment | | 35.0 | 241.4 | 599.6 |
Balance at end of the year | | 434.5 | 481.7 | 599.6 |
| | | | |
Reconciliation of the share-based payment obligations | | | | |
Balance at beginning of the year | | 481.7 | 599.6 | 399.2 |
Share-based payments expense | | 14.5 | 83.8 | 155.3 |
Share-based payment on BEE transaction | | - | 240.3 | - |
Fair value loss on obligations1 | | 171.5 | 1,076.6 | 87.3 |
Cash-settled share-based payments paid2 | | (433.6) | (1,518.6) | (42.2) |
Share-based payment obligation on acquisition of subsidiary | | 200.4 | - | - |
Balance at end of the year | | 434.5 | 481.7 | 599.6 |
| | | | |
Reconciliation of the non-current and current portion
of the share-based payment obligation: | | | | |
Share-based payment obligations | | 434.5 | 481.7 | 599.6 |
Current portion of share-based payment obligations | | (12.3) | (235.2) | (463.0) |
Non-current portion of share-based payment obligations | | 422.2 | 246.5 | 136.6 |
1 The fair value adjustment at reporting date is included in loss on financial instruments in profit or loss and not as part of share-based payments expense.
2 Payments made during the year relates to vesting of shares to employees.
.
| |
Sibanye-Stillwater | Form 20-F 2017 | 177 |
Table of Contents
NOTES TO THE CONSOLIDATED FINANCIAL STATEMENTS continued
FOR THE YEAR ENDED 31 DECEMBER 2017
7. Other COSTS
| | | | |
Figures in million - SA rand | Note | 2017 | 2016 | 2015 |
Included in other costs are the following: | | | | |
Care and maintenance | | (249.2) | (75.0) | - |
Change in estimate of environmental rehabilitation obligation,
and right of recovery receivable and payable | 25 | (248.9) | (97.5) | - |
8. IMPAIRMENTS
| | | | |
Figures in million - SA rand | Notes | 2017 | 2016 | 2015 |
Impairment of property, plant and equipment | 12 | (4,303.4) | (1,171.7) | - |
Impairment of goodwill | 14 | (99.1) | (201.3) | - |
Impairment of loan to equity-accounted investee | | (8.5) | (8.1) | - |
Total impairments | | (4,411.0) | (1,381.1) | - |
31 DECEMBER 2017
Impairment of Cooke Operations and Beatrix West mining assets
Ongoing losses experienced at the Cooke 1, 2 and 3 Operations and Beatrix West mine negatively affected group cash flow as well as the sustainability and economic viability of other operations in the Southern Africa region. In this regard, after numerous attempts to address the losses, it became necessary to enter into consultations in terms of Section 189 of the Labour Relations Act 66 of 1995 (S189) with relevant stakeholders regarding restructuring at the SA gold operations. As a result a decision was taken during the six months ended 30 June 2017, to impair the Cooke 1, 2 and 3 mining assets by R2,187.8 million and the Beatrix West assets by R603.7 million. These impairments were based on the estimated fair value less cost to sell over the life of mine calculated as expected discounted cash flows from the expected gold reserves and costs to extract the gold.
Impairment of West Rand Tailings Retreatment Project (WRTRP) exploration and evaluation assets, and allocated goodwill
On 22 November 2017, Sibanye-Stillwater announced that it has entered into various agreements with DRDGOLD Limited (DRDGOLD) to exchange selected surface gold processing assets and tailings storage facilities (TSFs) for approximately 265 million newly issued DRDGOLD shares (the DRDGOLD Transaction). Following the implementation of the DRDGOLD Transaction, Sibanye-Stillwater will retain full ownership of the Cooke and Ezulwini TSFs (of 2.4Moz probable gold reserves and 54.26Mlb probable uranium reserves), and, as such, retains full exposure to the low uranium price environment without the higher gold price TSF. As a result a decision was taken during the six months ended 31 December 2017, to impair the WRTRP exploration and evaluation assets, and allocated goodwill by R1,245.1 million and R99.1 million, respectively. These impairments were based on the estimated fair value less cost to sell over the life of mine calculated as expected discounted cash flows from the expected gold and uranium reserves, and costs to extract the gold and uranium.
Impairment of De Bron-Merriespruit exploration and evaluation assets
No expenditure on further exploration for and evaluation of the De Bron-Merriespruit mineral resources is budgeted or planned for 2018. As a result a decision was taken to impair the De Bron-Merriespruit exploration and evaluation asset by R227.1 million.
31 DECEMBER 2016
Impairment of Cooke 4
Despite intense monitoring and interventions by a joint management and labour committee since the previous S189 consultation was concluded, the Cooke 4 Operation continued to fall short of production targets and losses continued to accumulate. In view of the sustained losses at the Cooke 4 Operation and considering the extensive efforts to improve productivity and reduce the operation’s cost structures, Sibanye-Stillwater gave notice in terms of S189. As a result a decision was taken during the six months ended 30 June 2016 to fully impair the Cooke 4 Operation’s mining assets by R816.7 million. This impairment was based on negative cash flow projections for the remainder of the life of mine.
Impairment of Cooke 1, 2 and 3 mining assets, and allocated goodwill
As a result of a decrease in the rand gold price from 30 June 2016 and continued losses, a decision was taken during the six months ended 31 December 2016, to impair the Cooke 1, 2 and 3 mining assets by R355.0 million and the goodwill allocated to the Cooke cash-generating unit (CGU) by R201.3 million. The impairment was based on the estimated fair value less cost to sell over the life of mine calculated as expected discounted cash flows from the expected gold reserves and costs to extract the gold.
| |
Sibanye-Stillwater | Form 20-F 2017 | 178 |
Table of Contents
NOTES TO THE CONSOLIDATED FINANCIAL STATEMENTS continued
FOR THE YEAR ENDED 31 DECEMBER 2017
9. ROYALTIES, MINING AND INCOME TAX, and deferred tax
SIGNIFICANT ACCOUNTING JUDGEMENTS AND ESTIMATES
The Group is subject to income tax in South Africa and the United States. Significant judgement is required in determining the liability for income tax due to the complexity of legislation. There are many transactions and calculations for which the ultimate tax determination is uncertain during the ordinary course of business. The Group recognises liabilities for anticipated tax audit issues based on estimates of whether additional taxes will be due. Where the final tax outcome of these matters is different from the amounts that were initially recorded, such differences will impact the income tax and deferred tax provisions in the period in which such determination is made.
The Group recognises the net future tax benefit related to deferred tax assets to the extent that it is probable that the deductible temporary differences will reverse in the foreseeable future. Assessing the recoverability of deferred tax assets requires the Group to make significant estimates related to expectations of future taxable income. Estimates of future taxable income are based on forecast cash flows from operations and the application of existing tax laws in South Africa. To the extent that future cash flows and taxable income differ significantly from estimates, the ability of the Group to realise the net deferred tax assets recorded at the reporting date could be impacted.
The Group’s gold mining operations are taxed on a variable rate that increases as the profitability of the operation increases. The deferred tax rate used to calculate deferred tax is based on the current estimate of future profitability when the temporary differences will reverse based on tax rates and laws that have been enacted or substantively enacted at the reporting date. Depending on the profitability of the operations, the deferred tax rate can consequently be significantly different from year to year. Calculating the future profitability of the operations is inherently uncertain and could materially change over time.
Additionally, future changes in tax laws in South Africa could limit the ability of the Group to obtain tax deductions in future periods.
ACCOUNTING POLICY
Income tax comprises current and deferred tax. Current tax and deferred tax is recognised in profit or loss except to the extent that it relates to a business combination, or items recognised directly in equity or in other comprehensive income.
Current tax is measured on taxable income at the applicable statutory rate enacted or substantively enacted at the reporting date.
Deferred tax is provided on temporary differences existing at each reporting date between the tax values of assets and liabilities and their carrying amounts. Substantively enacted tax rates are used to determine future anticipated effective tax rates which in turn are used in the determination of deferred tax.
Deferred tax is not recognised for:
| · | | temporary differences on the initial recognition of assets or liabilities in a transaction that is not a business combination and that affects neither accounting nor taxable profit or loss; |
| · | | temporary differences related to investments in subsidiaries, and interest in associates and joint ventures to the extent that the Group is able to control the timing of the reversal of the temporary differences and it is probable that these will not reverse in the foreseeable future; and |
| · | | taxable temporary differences arising on the initial recognition of goodwill. |
These temporary differences are expected to result in taxable or deductible amounts in determining taxable profits for future periods when the carrying amount of the asset is recovered or the liability is settled. The principal temporary differences arise from depreciation of property, plant and equipment, provisions, unutilised capital allowances and tax losses carried forward.
Deferred tax assets and liabilities are offset if there is a legally enforceable right to offset current tax liabilities and assets, and relate to taxes levied by the same tax authority on the same taxable entity, or on different tax entities, but intend to settle current tax liabilities and assets on a net basis or their tax assets and liabilities will be realised simultaneously.
Deferred tax assets relating to the carry forward of unutilised tax losses and/or unutilised capital allowances are recognised to the extent it is probable that future taxable profit will be available against which the unutilised tax losses and/or unutilised capital allowances can be recovered. Deferred tax assets are reviewed at each reporting date and are adjusted if recovery is no longer probable.
9.1 ROYALTIES
Revenue from mineral resources in South Africa are subject to the Mineral and Petroleum Resource Royalty Act 2008 (Royalty Act). The Royalty Act imposes a royalty on refined (mineral resources that have undergone a comprehensive level of beneficiation such as smelting and refining as defined in Schedule 1 of the Royalty Act) and unrefined (mineral resources that have undergone limited beneficiation as defined in Schedule 2 of the Royalty Act) minerals payable to the State. The royalty in respect of refined and unrefined minerals (which include gold refined to 99.5% and above and PGMs) is calculated by dividing earnings before interest and taxes (EBIT) by the product of 12.5 times gross revenue calculated as a percentage, plus an additional 0.5%. EBIT refers to taxable mining income (with certain exceptions such as no deduction for interest payable and foreign exchange losses) before assessed losses but after capital expenditure. A maximum royalty of 5% of mining revenue has been introduced on refined minerals. The effective rate of royalty tax payable for the year ended 31 December 2017 was approximately 1.4% (2016: 1.9% and 2015: 1.8%) of revenue at the SA gold operations and 0.6% (2016: 0.5%) of revenue at the SA PGM operations.
| | | | |
| | | Revised | |
Figures in million - SA rand | | 2017 | 2016 | 2015 |
Current charge on: | | | | |
SA Gold revenue | | (325.2) | (528.0) | (400.6) |
SA PGM revenue | | (73.3) | (38.6) | - |
| |
Sibanye-Stillwater | Form 20-F 2017 | 179 |
Table of Contents
NOTES TO THE CONSOLIDATED FINANCIAL STATEMENTS continued
FOR THE YEAR ENDED 31 DECEMBER 2017
Total royalties | | (398.5) | (566.6) | (400.6) |
9.2 MINING AND INCOME TAX
SOUTH AFRICAN STATUTORY TAX RATES
Gold mining and non-mining tax
Gold mining tax is determined according to a formula which takes into account the profit and revenue attributable to mining operations. Mining taxable income is determined after the deduction of all mining capital expenditure, with the provision that this cannot result in an assessed loss. Capital expenditure amounts not deducted are carried forward as unredeemed capital expenditure to be deducted from future mining income. Accounting depreciation is ignored for the purpose of calculating mining tax. In the formula, Y is the percentage rate of tax payable and X is the ratio of mining profit, after the deduction of redeemable capital expenditure, to mining revenue expressed as a percentage.
Non-mining income consists primarily of interest income, and is taxed at the South African company tax rate of 28%
Company tax rate
Companies, other than gold mining companies are subject to the maximum South African company tax rate of 28%.
UNITED STATES STATUTORY TAX RATES
Stillwater’s US operations were subject to the federal tax rate of 35%. On 22 December 2017, the Tax Cuts and Jobs Act was signed into legislation in the United States and the tax rate changed to 21%.
MINING AND INCOME TAX
The components of mining and income tax are the following:
| | | | |
| | | Revised | |
Figures in million - SA rand | Note | 2017 | 2016 | 2015 |
Current tax | | (504.2) | (1,111.8) | (696.7) |
Mining tax | | (425.2) | (1,031.6) | (665.6) |
Non-mining tax | | (70.6) | (83.9) | (16.0) |
Company and capital gain tax | | (8.4) | 3.7 | (15.1) |
| | | | |
Deferred tax | 9.3 | 3,450.8 | (90.3) | 319.5 |
Deferred tax charge | | 879.7 | (30.5) | 348.3 |
Deferred tax rate adjustment1, 2 | | 2,571.1 | (59.8) | (28.8) |
| | | | |
Total mining and income tax | | 2,946.6 | (1,202.1) | (377.2) |
1 The change in the estimated long term deferred tax rate, as a result of applying the mining tax formula at the SA gold operations, at which the temporary differences will reverse amounted to a deferred tax benefit of R39.6 million for the year ended 31 December 2017 (2016: charge of R59.8 million and 2015: charge of R28.8 million).
2 On 22 December 2017, the Tax Cuts and Jobs Act was signed into legislation in the United States. As a result the Stillwater Group’s deferred tax rate changed from 37.69% to 24.23% and a deferred tax benefit of R2,531.5 million (US$204.8 million) was recognised.
Reconciliation of the Group’s mining and income tax to the South African statutory company tax rate of 28%:
| | | | |
| | | Revised | |
Figures in million - SA rand | | 2017 | 2016 | 2015 |
Tax on loss/(profit) before tax at maximum South African statutory company tax rate | | 2,066.3 | (1,188.5) | (256.3) |
South African gold mining tax formula rate adjustment | | 157.6 | 160.9 | 129.5 |
United States statutory tax rate adjustment | | 57.3 | - | - |
Non-deductible amortisation and depreciation | | (0.9) | (35.0) | (25.7) |
Non-deductible finance charges | | (165.8) | (48.7) | - |
Non-deductible share-based payments | | (58.4) | (115.5) | (33.3) |
Non-taxable gain/(non-deductible loss) on foreign exchange differences | | 45.0 | (52.1) | 17.8 |
Non-taxable share of results of equity-accounted investees | | 81.6 | 3.7 | 32.5 |
Non-deductible impairments | | (1,054.9) | (65.6) | - |
Non-taxable gain on acquisition | | - | 610.0 | - |
Non-deductible transaction costs | | (154.6) | (44.0) | (7.2) |
Net other non-taxable income and non-deductible expenditure | | (294.6) | 62.5 | 6.3 |
Change in estimated deferred tax rate | | 2,571.1 | (59.8) | (28.8) |
Deferred tax assets not recognised | | (303.1) | (430.0) | (267.1) |
Non-taxable gain on derecognition of financial guarantee liability | | - | - | 55.1 |
Mining and income tax | | 2,946.6 | (1,202.1) | (377.2) |
| |
Sibanye-Stillwater | Form 20-F 2017 | 180 |
Table of Contents
NOTES TO THE CONSOLIDATED FINANCIAL STATEMENTS continued
FOR THE YEAR ENDED 31 DECEMBER 2017
9.3 DEFERRED TAX
| | | | |
| | | Revised | |
Figures in million - SA rand | Notes | 2017 | 2016 | 2015 |
Included in the statement of financial position as follows: | | | | |
Deferred tax assets | | (206.2) | (228.2) | (63.2) |
Deferred tax liabilities | | 8,525.2 | 4,915.4 | 3,561.4 |
Net deferred tax liabilities | | 8,319.0 | 4,687.2 | 3,498.2 |
| | | | |
Reconciliation of the deferred tax balance: | | | | |
Balance at beginning of the year | | 4,687.2 | 3,498.2 | 3,817.7 |
Deferred tax recognised in profit or loss | 9.2 | (3,450.8) | 90.3 | (319.5) |
Deferred tax recognised in other comprehensive income | | (27.7) | - | - |
Deferred tax on acquisition of subsidiaries | 13 | 7,486.3 | 1,098.7 | - |
Foreign currency translation | | (376.0) | | |
Balance at end of the year | | 8,319.0 | 4,687.2 | 3,498.2 |
The detailed components of the net deferred tax liabilities which result from the differences between the amounts of assets and liabilities recognised for financial reporting and tax purposes are:
| | | | |
| | | Revised | |
Figures in million - SA rand | | 2017 | 2016 | 2015 |
Deferred tax liabilities | | | | |
Mining assets | | 9,642.6 | 6,365.4 | 4,822.8 |
Environmental rehabilitation obligation funds | | 600.7 | 729.6 | 575.3 |
Other | | 47.5 | 128.6 | 14.9 |
Gross deferred tax liabilities | | 10,290.8 | 7,223.6 | 5,413.0 |
| | | | |
Deferred tax assets | | | | |
Environmental rehabilitation obligation | | (840.7) | (1,041.0) | (612.3) |
Occupational healthcare obligation | | (299.7) | - | - |
Other provisions | | (434.0) | (546.3) | (341.6) |
Tax losses and unredeemed capital expenditure | | (397.4) | (890.1) | (812.6) |
Share-based payment obligation | | - | (59.0) | (148.3) |
Gross deferred tax assets | | (1,971.8) | (2,536.4) | (1,914.8) |
| | | | |
Net deferred tax liabilities | | 8,319.0 | 4,687.2 | 3,498.2 |
At 31 December 2017, the Group had the following estimated amounts not recognised but available for set-off against future income:
| | | | |
Figures in million - SA rand | | 2017 | 2016 | 2015 |
Tax losses | | | | |
Wits Gold | | 64.6 | 64.6 | 84.4 |
Burnstone | | - | - | 155.3 |
Ezulwini | | 2 591.1 | 2 561.2 | 1 481.0 |
Other - SA region | | 15.9 | 19.0 | 31.3 |
Total gross tax losses | | 2 671.6 | 2 644.8 | 1 752.0 |
Other deductible temporary differences | | | | |
Burnstone | | 11 306.8 | 10 012.6 | 9 009.0 |
Ezulwini | | 2 923.7 | 2 909.1 | 2 778.8 |
Ridge Mining Services Proprietary Limited | | 499.5 | 643.9 | - |
Stillwater Canada Inc. | | 1 550.8 | - | - |
Perigrine Minera Argentina SA | | 301.4 | - | - |
Other - SA region | | 54.2 | 55.6 | - |
Other - US region | | 183.3 | 55.6 | - |
Total gross tax losses and other deductible temporary differences | 19 491.3 | 16 321.6 | 13 539.8 |
| | | | |
Deferred tax assets not recognised | | | | |
Wits Gold | | 18.1 | 18.1 | 23.6 |
Burnstone | | 3 165.9 | 2 803.5 | 2 566.0 |
Ezulwini | | 1 544.1 | 1 531.7 | 1 192.7 |
Ridge Mining Services Proprietary Limited | | 139.9 | 180.3 | - |
Stillwater Canada Inc. | | 284.4 | - | - |
Perigrine Minera Argentina SA | | 105.5 | - | - |
Other - SA region | | 19.6 | 20.9 | 8.8 |
Other - US region | | 70.9 | - | - |
Total deferred tax assets not recognised | | 5 348.5 | 4 554.5 | 3 791.1 |
These deductions are available to be utilised against income generated by the relevant tax entity and do not expire unless the tax entity concerned ceases to operate for a period of longer than one year. Under South African mining tax ring-fencing legislation, each tax entity is treated separately and as such these deductions can only be utilised by the tax entities in which the deductions have been generated.
| |
Sibanye-Stillwater | Form 20-F 2017 | 181 |
Table of Contents
NOTES TO THE CONSOLIDATED FINANCIAL STATEMENTS continued
FOR THE YEAR ENDED 31 DECEMBER 2017
9.4 TAX AND ROYALTIES PAYABLE
| | | | |
| | | Revised | |
Figures in million - SA rand | Notes | 2017 | 2016 | 2015 |
Included in the statement of financial position as follows: | | | |
Tax receivable | | (182.8) | - | - |
Tax and royalties payable | | 34.9 | 88.6 | 129.6 |
Net tax and royalties (receivable)/payable | | (147.9) | 88.6 | 129.6 |
| | | | |
Reconciliation of the net tax and royalties (receivable)/payable balance: | | | | |
Balance at beginning of the year | | 88.6 | 129.6 | 84.0 |
Royalties and current tax | 9.1, 9.2 | 902.7 | 1,678.4 | 1,097.3 |
Tax and royalties paid | | (899.3) | (1,732.6) | (1,051.7) |
Tax payable on acquisition of subsidiaries | 13 | (260.4) | 13.2 | - |
Foreign currency translation | | 20.5 | - | - |
Balance at end of the year | | (147.9) | 88.6 | 129.6 |
10. EARNINGS PER SHARE
ACCOUNTING POLICY
EPS is calculated based on the profit attributable to owners of Sibanye-Stillwater divided by the weighted average number of ordinary shares in issue during the year. A diluted EPS is presented when the inclusion of ordinary shares that may be issued in the future has a dilutive effect on EPS.
Headline EPS is calculated by dividing the headline earnings attributable to owners of Sibanye-Stillwater by the weighted average number of ordinary shares in issue during the year.
10.1 BASIC EARNINGS PER SHARE
Basic EPS is calculated by dividing the profit attributable to owners of Sibanye-Stillwater by the weighted average number of ordinary shares in issue during the year.
| | | | |
| | | Revised | Revised |
| Notes | 2017 | 2016 | 2015 |
Weighted average number of shares | | | | |
Ordinary shares in issue (’000) | | 2,168,721 | 929,004 | 916,140 |
Bonus element of the rights issue (’000) | 22 | - | 493,645 | 493,645 |
Bonus element of the capitalisation issue (’000) | 34 | 86,749 | 129,272 | 129,272 |
Adjustment for weighting of ordinary shares in issue (’000) | | (321,620) | (7,271) | (4,102) |
Weighted average number of shares (’000) | | 1,933,850 | 1,544,650 | 1,534,955 |
Profit attributable to owners of Sibanye-Stillwater (SA rand million) | | (4,437.4) | 3,473.3 | 716.9 |
Basic EPS (cents) | | (229) | 225 | 47 |
10.2 DILUTED EARNINGS PER SHARE
Diluted EPS is calculated by dividing the profit attributable to owners of Sibanye-Stillwater by the diluted number of ordinary shares in issue during the year.
Dilutive shares are the number of potentially dilutive ordinary shares that could be issued as a result of share options granted to employees under the share option schemes (refer to note 6) or as a result of the conversion of the US$450 million Convertible Bond (refer to note 24.4). At 31 December 2017, both of these were anti-dilutive.
| | | | |
| | | Revised | Revised |
| | 2017 | 2016 | 2015 |
Diluted weighted average number of shares | | | | |
Weighted average number of shares (’000) | | 1,933,850 | 1,544,650 | 1,534,955 |
Potential ordinary shares (’000) | | - | 2,161 | 5,671 |
Diluted weighted average number of shares (’000) | | 1,933,850 | 1,546,811 | 1,540,626 |
Diluted basic EPS (cents) | | (229) | 225 | 47 |
| |
Sibanye-Stillwater | Form 20-F 2017 | 182 |
Table of Contents
NOTES TO THE CONSOLIDATED FINANCIAL STATEMENTS continued
FOR THE YEAR ENDED 31 DECEMBER 2017
10.3 HEADLINE EARNINGS PER SHARE
Reconciliation of (loss)/profit attributable to owners of Sibanye-Stillwater to headline earnings:
| | | | |
Figures in million - SA rand | | Notes | Gross | Net of tax |
31 December 2017 | | | | |
Loss attributable to owners of Sibanye-Stillwater | | | | (4,437.4) |
Gain on disposal of property, plant and equipment | | 12 | (40.7) | (29.3) |
Impairments | | 8 | 4,411.0 | 4,242.8 |
Headline earnings | | | | (223.9) |
Headline EPS - cents | | | | (12) |
31 December 2016 (Revised) | | | | |
Profit attributable to owners of Sibanye-Stillwater | | | | 3,473.3 |
Gain on disposal of property, plant and equipment | | 12 | (95.4) | (68.7) |
Impairments | | 8 | 1,381.1 | 1,281.7 |
Gain on acquisition | | 13.2 | (2,178.6) | (2,178.6) |
Headline earnings | | | | 2,507.7 |
Headline EPS - cents | | | | 162 |
31 December 2015 (Revised) | | | | |
Profit attributable to owners of Sibanye-Stillwater | | | | 716.9 |
Gain on disposal of property, plant and equipment | | 12 | (58.7) | (42.3) |
Headline earnings | | | | 674.6 |
Headline EPS - cents | | | | 44 |
10.4 DILUTED HEADLINE EARNINGS PER SHARE
Diluted headline EPS is calculated by dividing the headline earnings attributable to owners of Sibanye-Stillwater by the diluted weighted average number of ordinary shares in issue during the year.
| | | | |
| | | Revised | Revised |
| | 2017 | 2016 | 2015 |
Diluted headline EPS - cents | | (12) | 162 | 44 |
11. DIVIDENDS
ACCOUNTING POLICY
Dividends are recognised only when such dividends are declared.
Dividends withholding tax is a tax on shareholders receiving dividends and is applicable to all dividends paid. The Group withholds dividend tax on behalf of its shareholders at a rate of 15% on dividends paid before 22 February 2017 and 20% on dividends paid after this date. Amounts withheld are not recognized as part of the Group’s tax charge but rather as part of the dividend paid, recognised directly in equity.
Cash flows from dividends paid are classified under operating activities in the statement of cash flows.
| | | | |
Figures in million - SA rand | | 2017 | 2016 | 2015 |
Dividend declared and paid1 | | 558.2 | 1,610.6 | 658.4 |
Dividend per share - cents | | 60 | 175 | 72 |
1 The dividend declared and paid relates to the final dividend of 60 SA cents per share or R558.2 million in respect of the six months ended 31 December 2016 declared on 23 February 2017.
DIVIDEND POLICY
Sibanye-Stillwater’s dividend policy is to return at least 25% to 35% of normalised earnings to shareholders and after due consideration of future requirements the dividend may be increased beyond these levels. Management, therefore, considers normalised earnings in determining what value will be distributed to shareholders. Management believes normalised earnings provides useful information to investors regarding the extent to which results of operations may affect shareholder returns. Normalised earnings is defined as earnings attributable to the owners of Sibanye-Stillwater excluding gains and losses on financial instruments and foreign exchange differences, impairments, gain on disposal of property, plant and equipment, occupational healthcare expense, restructuring costs, transactions costs, share-based payment on BEE transaction, gain on acquisition, other business development costs, share of results of equity-accounted investees, after tax, and changes in estimated deferred tax rate.
| |
Sibanye-Stillwater | Form 20-F 2017 | 183 |
Table of Contents
NOTES TO THE CONSOLIDATED FINANCIAL STATEMENTS continued
FOR THE YEAR ENDED 31 DECEMBER 2017
Reconciliation of (loss)/profit attributable to the owners of Sibanye-Stillwater to normalised earnings:
| | | | |
Figures in million - SA rand | | 2017 | 2016 | 2015 |
(Loss)/profit attributable to the owners of Sibanye-Stillwater | | (4,437.4) | 3,473.3 | 716.9 |
Adjusted for: | | | | |
Loss on financial instruments | | 1,114.4 | 1,032.8 | 229.5 |
(Gain)/loss on foreign exchange differences | | (292.4) | (219.6) | 359.4 |
Impairments | | 4,411.0 | 1,381.1 | - |
Occupational healthcare expense | | 1,106.9 | - | - |
Gain on disposal of property, plant and equipment | | (40.7) | (95.4) | (58.7) |
Restructuring costs | | 729.8 | 187.7 | 104.8 |
Transaction costs | | 552.1 | 157.0 | 25.7 |
Share-based payment on BEE transaction | | - | 240.3 | - |
Gain on acquisition | | - | (2,178.6) | - |
Net loss on derecognition of guarantee asset and liability | | - | - | 158.3 |
Other | | 52.7 | 72.4 | 44.1 |
Tax effect of the items adjusted above | | (813.4) | (419.4) | (244.2) |
Change in estimated deferred tax rate | | (2,571.1) | 59.8 | 28.8 |
Share of results of equity-accounted investees after tax | | (291.6) | (13.3) | (116.0) |
Normalised earnings | | (479.7) | 3,678.1 | 1,248.6 |
12. PROPERTY, PLANT AND EQUIPMENT
SIGNIFICANT ACCOUNTING JUDGEMENTS AND ESTIMATES
Carrying value of property, plant and equipment
All mining assets are amortised using the units-of-production method where the mine operating plan calls for production from proved and probable Mineral Reserves.
Mobile and other equipment are depreciated over the shorter of the estimated useful life of the asset or the estimate of mine life based on proved and probable Mineral Reserves.
The calculation of the units-of-production rate of amortisation could be impacted to the extent that actual production in the future is different from current forecast production based on proved and probable Mineral Reserves. This would generally result from the extent that there are significant changes in any of the factors or assumptions used in estimating Mineral Reserves.
These factors could include:
| · | | Changes in proved and probable Mineral Reserves; |
| · | | Differences between actual commodity prices and commodity price assumptions; |
| · | | Unforeseen operational issues at mine sites; |
| · | | Changes in capital, operating, mining, processing and reclamation costs, discount rates and foreign exchange rates; and |
| · | | Changes in Mineral Reserves could similarly impact the useful lives of assets depreciated on a straight-line basis, where those lives are limited to the life of the mine. |
The recoverable amounts of CGUs and individual assets have been determined based on the higher of value-in-use calculations and fair value less cost to sell. These calculations require the use of estimates and assumptions. It is reasonably possible that the gold and PGM price assumptions may change which may then impact the Group estimated life of mine determinant and may then require a material adjustment to the carrying value of property, plant and equipment.
The Group reviews and tests the carrying value of assets when events or changes in circumstances suggest that the carrying amount may not be recoverable by comparing expected future cash flows to these carrying values. Assets are grouped at the lowest level for which identifiable cash flows are largely independent of cash flows of other assets and liabilities. If there are indications that impairment may have occurred, estimates are prepared of expected future cash flows of each group of assets. Expected future cash flows used to determine the value in use and fair value less costs to sell of property, plant and equipment are inherently uncertain and could materially change over time. They are significantly affected by a number of factors including reserves and production estimates, together with economic factors such as spot and future gold and PGM prices, discount rates, foreign currency exchange rates, estimates of costs to produce reserves and future capital expenditure.
Pre-production
The Group assesses the stage of each mine construction project to determine when a mine moves into the production stage. The criteria used to assess the start date are determined based on the unique nature of each mine construction project. The Group considers various relevant criteria to assess when the mine is substantially complete, ready for its intended use and moves into the production stage. Some of the criteria would include, but are not limited to the following:
| · | | the level of capital expenditure compared to the construction cost estimates; |
| · | | ability to produce metal in saleable form (within specifications); and |
| · | | ability to sustain commercial levels of production of metal. |
| |
Sibanye-Stillwater | Form 20-F 2017 | 184 |
Table of Contents
NOTES TO THE CONSOLIDATED FINANCIAL STATEMENTS continued
FOR THE YEAR ENDED 31 DECEMBER 2017
When a mine construction project moves into the production stage, the capitalisation of certain mine construction costs ceases and costs are expensed, except for capitalisable costs related to mining asset additions or improvements, underground mine development or ore reserve development.
Mineral Reserves estimates
Mineral Reserves are estimates of the amount of product that can be economically and legally extracted from the Group’s properties. In order to calculate the reserves, estimates and assumptions are required about a range of geological, technical and economic factors, including but not limited to quantities, grades, production techniques, recovery rates, production costs, transport costs, commodity demand, commodity prices and exchange rates.
Estimating the quantity and grade of the Mineral Reserves requires the size, shape and depth of orebodies to be determined by analysing geological data such as the logging and assaying of drill samples. This process may require complex and difficult geological judgements and calculations to interpret the data.
The Group is required to determine and report, inter alia, on the Mineral Reserves in accordance with the South African Code for Reporting of Exploration Results, Mineral Resources and Mineral Reserves (SAMREC).
Estimates of Mineral Reserves may change from period to period due to the change in economic assumptions used to estimate Mineral Reserves and due to additional geological data becoming available during the course of operations. Changes in reported proven and probable reserves may affect the Group’s financial results and position in a number of ways, including the following:
| · | | Asset carrying values may be affected due to changes in estimated cash flows; |
| · | | Depreciation and amortisation charges to profit or loss may change as these are calculated on the units-of production method, or where the useful lives of assets change; |
| · | | Decommissioning site restoration and environmental provisions may change where changes in ore reserves affect expectations about the timing or cost of these activities; and |
| · | | The carrying value of deferred tax assets may change due to changes in estimates of the likely recovery of the tax benefits. |
ACCOUNTING POLICY
Mineral and surface rights
Mineral and surface rights are recorded at cost less accumulated amortisation and accumulated impairment losses. When there is little likelihood of a mineral right being exploited, or the carrying amount has exceeded its recoverable amount, impairment is recognised in profit or loss in the year that such determination is made.
Mine development and infrastructure
Mining assets, including mine development and infrastructure costs and mine plant facilities, are recorded at cost less accumulated depreciation and accumulated impairment losses.
These costs which include the purchase price of assets used in the construction of the mine, expenditure incurred to evaluate and develop new ore bodies, to define mineralisation in existing ore bodies and to establish or expand productive capacity, are capitalised until commercial levels of production are achieved, at which times the costs are amortised as set out below.
Development of ore bodies includes the development of shaft systems and waste rock removal that allows access to reserves that are economically recoverable in the future. Subsequent to this, costs are capitalised if the criteria for recognition as an asset are met. Access to individual orebodies exploited by the Group is limited to the time span of the respective mining leases.
Land
Land is shown at cost and is not depreciated.
Other assets
Non-mining assets are recorded at cost less accumulated depreciation and accumulated impairment losses. These assets include the assets of the mining operations not included in mine development and infrastructure, borrowing costs, mineral and surface rights, land and all the assets of the non-mining operations.
| |
Sibanye-Stillwater | Form 20-F 2017 | 185 |
Table of Contents
NOTES TO THE CONSOLIDATED FINANCIAL STATEMENTS continued
FOR THE YEAR ENDED 31 DECEMBER 2017
Amortisation and depreciation of mining assets
Amortisation and depreciation is determined to give a fair and systematic charge in profit or loss taking into account the nature of a particular ore body and the method of mining that ore body. To achieve this, the following calculation methods are used:
| · | | Mining assets, including mine development and infrastructure costs, mine plant facilities and evaluation costs, are amortised over the life of the mine using the units-of-production method, based on estimated proved and probable Mineral Reserves above infrastructure. |
| · | | Proved and probable Mineral Reserves reflect estimated quantities of economically recoverable reserves, which can be recovered in future from known mineral deposits. |
| · | | Certain mining plant and equipment included in mine development and infrastructure is depreciated on a straight-line basis over their estimated useful lives. |
| · | | For certain shafts, which have a short life and/or are marginal, the depreciation is accelerated based on an adjustment to the reserves for accounting purposes. |
Depreciation of non-mining assets
Non-mining assets are recorded at cost and depreciated on a straight-line basis over their current expected useful lives to their residual values as follows:
| · | | Furniture and equipment: 1 - 10 years |
The assets’ useful lives, depreciation methods and residual values are reassessed at each reporting date and adjusted if appropriate.
Impairment
Recoverability of the carrying values of long-term assets or CGUs of the Group are reviewed whenever events or changes in circumstances indicate that such carrying value may not be recoverable. To determine whether a long-term asset or CGU may be impaired, the higher of value in use (defined as: the present value of future cash flows expected to be derived from an asset or CGU) or fair value less costs to sell (defined as: the price that would be received to sell an asset in an orderly transaction between market participants at the measured rate, less the costs of disposal) is compared to the carrying value of the asset/unit.
A CGU is defined by the Group as the smallest identifiable group of assets that generates cash inflows that are largely independent of the cash inflows from other assets or groups of assets. Generally for the Group this represents an individual operating mine, including mines which are part of a larger mine complex. The costs attributable to individual shafts of a mine are impaired if the shaft is closed.
Impairment losses are recognised in profit or loss. Impairment recognised in respect of a CGU is allocated first to goodwill to that particular CGU and thereafter to the individual assets in the CGU.
When any infrastructure is closed down or placed on care and maintenance during the year, any carrying value attributable to that infrastructure is impaired. Expenditure incurred on care and maintenance is recognised in profit or loss.
When the review of the events or changes in circumstances of an asset or CGU that was previously impaired indicate that such historical carrying value is recoverable, the impairment is reversed. The impairment is only reversed to such an amount that the new carrying amount does not exceed the historical carrying amount. Reversal of impairment losses are recognised in profit or loss. Reversal of impairment recognised in respect of a CGU is allocated to the individual assets in the CGU.
Derecognition of property, plant and equipment
Property, plant and equipment is derecognised on disposal or closure of a shaft when no future economic benefits are expected from its use or disposal. Any gain or loss on derecognition of an item of property, plant and equipment (calculated as the net proceeds from disposal and the carrying amount of the item) is recognised in profit or loss.
Exploration and evaluation expenditure
All exploration and evaluation expenditure, prior to obtaining the legal rights to explore a specific area, is recognised in profit or loss. After the legal rights to explore are obtained, exploration and evaluation expenditure, comprising the costs of acquiring prospecting rights and directly attributable exploration expenditure, is capitalised as a separate class of property, plant and equipment or intangible assets, on a project-by-project basis, pending determination of the technical feasibility and commercial viability.
The technical feasibility and commercial viability of extracting a mineral resource is generally considered to be determinable through a feasibility study and when proven reserves are determinable to exist. Upon determination of proven reserves, exploration and evaluation assets attributable to those reserves are first tested for impairment and then reclassified from exploration and evaluation assets to another appropriate class of property, plant and equipment. Subsequently, all cost directly incurred to prepare an identified mineral asset for production is capitalised to mine development assets. Amortisation of these assets commences once these assets are available for use,
| |
Sibanye-Stillwater | Form 20-F 2017 | 186 |
Table of Contents
NOTES TO THE CONSOLIDATED FINANCIAL STATEMENTS continued
FOR THE YEAR ENDED 31 DECEMBER 2017
which is expected to be when the mine is in commercial production. These assets will be measured at cost less accumulated amortisation and impairment losses.
| | | | | |
Figures in million - SA rand | Notes | Total | Mine development, infrastructure and other | Land, mineral
rights and
rehabilitation | Exploration
and evaluation
assets |
31 December 2017 | | | | | |
Cost | | | | | |
Balance at beginning of the year | | 67,689.8 | 59,904.4 | 5,714.4 | 2,071.0 |
Additions1 | | 6,140.6 | 5,979.1 | 95.3 | 66.2 |
Change in estimates of rehabilitation assets | 25 | (187.8) | - | (187.8) | - |
Disposals | | (142.3) | (134.1) | (7.9) | (0.3) |
Assets acquired on acquisition of subsidiaries | 13.1 | 29,948.6 | 11,513.6 | 17,115.2 | 1,319.8 |
Foreign currency translation | | (1,728.2) | (733.8) | (921.3) | (73.1) |
Balance at end of the year | | 101,720.7 | 76,529.2 | 21,807.9 | 3,383.6 |
Accumulated depreciation, amortisation and impairment | | | | |
Balance at beginning of the year | | 40,449.1 | 38,341.9 | 2,107.2 | - |
Amortisation and depreciation1 | 4 | 5,741.6 | 5,067.6 | 674.0 | - |
Impairment | 8 | 4,303.4 | 1,504.6 | 1,300.3 | 1,498.5 |
Disposals | | (111.7) | (534.2) | 422.5 | - |
Foreign currency translation | | (106.3) | (71.0) | (33.0) | (2.3) |
Balance at end of the year | | 50,276.1 | 44,308.9 | 4,471.0 | 1,496.2 |
Carrying value at end of the year | | 51,444.6 | 32,220.3 | 17,336.9 | 1,887.4 |
1 During the year, amortisation and depreciation on assets used in the development of the Burnstone project was capitalised. As a result, additions includes non-cash additions (or amortisation and depreciation capitalised) of R41.8 million.
| | | | | |
Figures in million - SA rand | Notes | Total | Mine
development,
infrastructure
and other | Land, mineral
rights and
rehabilitation | Exploration
and evaluation
assets |
31 December 2016 | | | | | |
Cost | | | | | |
Balance at beginning of the year | | 57,431.7 | 51,919.9 | 3,591.5 | 1,920.3 |
Additions | | 4,151.1 | 4,065.7 | 3.7 | 81.7 |
Change in estimates of rehabilitation assets | 25 | 472.5 | - | 472.5 | - |
Disposals | | (67.8) | (65.9) | (1.9) | - |
Assets acquired on acquisition of subsidiaries | 13.2, 13.3 | 5,702.3 | 3,984.7 | 1,648.6 | 69.0 |
Balance at end of the year | | 67,689.8 | 59,904.4 | 5,714.4 | 2,071.0 |
Accumulated depreciation, amortisation and impairment | | | | |
Balance at beginning of the year | | 35,299.3 | 33,978.1 | 1,321.2 | - |
Amortisation and depreciation | 4 | 4,041.9 | 3,656.7 | 385.2 | - |
Impairment | 8 | 1,171.7 | 770.3 | 401.4 | - |
Disposals | | (63.8) | (63.2) | (0.6) | - |
Balance at end of the year | | 40,449.1 | 38,341.9 | 2,107.2 | - |
Carrying value at end of the year | | 27,240.7 | 21,562.5 | 3,607.2 | 2,071.0 |
| | | | | |
Figures in million - SA rand | Notes | Total | Mine
development,
infrastructure
and other | Land, mineral
rights and
rehabilitation | Exploration
and evaluation
assets |
31 December 2015 | | | | | |
Cost | | | | | |
Balance at beginning of the year | | 54,404.9 | 48,637.6 | 3,882.3 | 1,885.0 |
Additions | | 3,344.8 | 3,303.5 | 6.0 | 35.3 |
Change in estimates of rehabilitation assets | 25 | (273.4) | - | (273.4) | - |
Disposals | | (44.6) | (21.2) | (23.4) | - |
Balance at end of the year | | 57,431.7 | 51,919.9 | 3,591.5 | 1,920.3 |
Accumulated depreciation, amortisation and impairment | | | | |
Balance at beginning of the year | | 31,700.9 | 30,650.2 | 1,050.7 | - |
Amortisation and depreciation | 4 | 3,636.6 | 3,358.4 | 278.2 | - |
Disposals | | (38.2) | (30.5) | (7.7) | - |
Balance at end of the year | | 35,299.3 | 33,978.1 | 1,321.2 | - |
Carrying value at end of the year | | 22,132.4 | 17,941.8 | 2,270.3 | 1,920.3 |
| |
Sibanye-Stillwater | Form 20-F 2017 | 187 |
Table of Contents
NOTES TO THE CONSOLIDATED FINANCIAL STATEMENTS continued
FOR THE YEAR ENDED 31 DECEMBER 2017
13. ACQUISITIONS
SIGNIFICANT ACCOUNTING JUDGEMENTS AND ESTIMATES
Expected future cash flows used to determine the fair value of, inter alia, property, plant and equipment and contingent consideration are inherently uncertain and could materially change over time. The fair value is significantly affected by a number of factors including reserves and production estimates, together with economic factors such as the expected commodity price, foreign currency exchange rates, and estimates of production costs, future capital expenditure and discount rates.
ACCOUNTING POLICY
Business combinations
The acquisition method of accounting is used to account for business combinations by the Group. The consideration transferred for the acquisition of a business is the fair value of the assets transferred, the liabilities incurred and the equity interests issued by the Group. The consideration transferred includes the fair value of any asset or liability resulting from a contingent consideration arrangement. Any contingent consideration is measured at fair value at the date of acquisition. Acquisition-related costs are expensed as incurred. Identifiable assets acquired and liabilities and contingent liabilities assumed in a business combination are measured initially at their fair values at the acquisition date. On an acquisition-by-acquisition basis, the Group recognises any non-controlling interest in the acquiree either at fair value or at the non-controlling interest’s proportionate share of the acquiree’s net assets. Subsequently, the carrying amount of non-controlling interest is the amount of the interest at initial recognition plus the non-controlling interest’s share of the subsequent changes in equity, plus or minus changes in the portion of interest of the equity of the subsidiary not attributable, directly or indirectly, to Sibanye-Stillwater shareholders.
The excess of the consideration transferred, the amount of any non-controlling interest in the acquiree and the acquisition-date fair value of any previous equity interest in the acquiree over the fair value of the identifiable net assets acquired is recorded as goodwill. If this is less than the fair value of the net assets of the subsidiary acquired in the case of a bargain purchase, the difference is a gain recognised directly in profit or loss.
13.1 STILLWATER ACQUISITION
On 9 December 2016, Sibanye-Stillwater announced it had reached a definitive agreement to acquire Stillwater Mining Company (Stillwater) for US$18 per share in cash, or US$2,200 million in aggregate (the Stillwater Transaction). On 25 April 2017, at the shareholders meeting of Sibanye-Stillwater, the Sibanye-Stillwater shareholders approved the proposed Stillwater Transaction by voting in favour of the various resolutions to give effect to the Stillwater Transaction and at the shareholders meeting of Stillwater, the requisite majority of Stillwater shareholders resolved to approve the Stillwater Transaction. Sibanye-Stillwater obtained control (100%) of Stillwater on this date. The effective date of the implementation of the Stillwater Transaction was 4 May 2017, when Sibanye-Stillwater took over legal ownership of Stillwater.
For the eight months ended 31 December 2017, Stillwater contributed revenue of US$688.3 million (R9,161.6 million) and a profit of US$152.4 million (R2,028.1 million) to the Group’s results.
The purchase price allocation (PPA) has been prepared on a provisional basis in accordance with IFRS 3. If new information obtained within one year of the acquisition date, about facts and circumstances that existed at the acquisition date, identifies adjustments to the below amounts or any additional provisions that existed at the date of acquisition, then the accounting for the acquisition will be revised.
Subsequent to the date of the acquisition, the Group received new information relating to exploration and evaluation assets that existed at acquisition date and adjustments were made to the provisional calculation of the fair values resulting in a decrease of USS$9.4 million (R123.7 million) in the fair value of property, plant and equipment, a decrease of US$3.6 million (R46.7 million) to the net deferred tax liabilities, and an increase of US$5.8 million (R77.0 million) in the reported value of goodwill. Accordingly, the PPA has been restated as required by IFRS 3.
CONSIDERATION
The consideration paid is as follows:
| | | | |
Figures in million | | Note | US dollar | SA rand |
Cash | | | 2,080.7 | 27,174.5 |
Liability raised in respect of dissenting shareholders | | 18.2 | 104.5 | 1,364.3 |
Settlement of share-based payment awards (cash) | | | 16.2 | 211.9 |
Total consideration | | | 2,201.4 | 28,750.7 |
ACQUISITION RELATED COSTS
The Group incurred acquisition related costs of R528.5 million on advisory and legal fees. These costs are recognised as transaction costs in profit or loss.
| |
Sibanye-Stillwater | Form 20-F 2017 | 188 |
Table of Contents
NOTES TO THE CONSOLIDATED FINANCIAL STATEMENTS continued
FOR THE YEAR ENDED 31 DECEMBER 2017
IDENTIFIABLE ASSETS ACQUIRED AND LIABILITIES ASSUMED
The following table summarises the recognised fair value of assets acquired and liabilities assumed at the acquisition date:
| | | | |
Figures in million | | Notes | US dollar | SA rand |
Property, plant and equipment | | 12 | 2,293.2 | 29,948.6 |
Other non-current assets | | | 6.9 | 90.8 |
Inventories | | | 159.7 | 2,085.4 |
Current investments | | | 278.9 | 3,642.2 |
Cash and cash equivalents | | | 137.2 | 1,792.2 |
Other current assets | | | 37.3 | 487.3 |
Borrowings | | | (454.6) | (5,937.6) |
Environmental rehabilitation obligation | | 25 | (23.9) | (312.1) |
Deferred tax liabilities | | 9.3 | (573.2) | (7,486.3) |
Other non-current liabilities | | | (19.9) | (260.3) |
Trade and other payables | | | (88.1) | (1,150.1) |
Other current liabilities | | | (1.8) | (23.3) |
Total fair value of identifiable net assets acquired | | | 1,751.7 | 22,876.8 |
The fair value of assets and liabilities excluding property, plant and equipment, inventories and borrowings approximate the carrying value. The fair value of property, plant and equipment was based on the expected discounted cash flows of the expected ore reserves and costs to extract the ore discounted at a real discount rate of 8.6% for the Stillwater and East Boulder mines and Columbus metallurgical complex, and 10.3% for the Blitz project, an average platinum price of US$1,375/oz and an average palladium price of US$880/oz. The fair value of borrowings (Convertible Debentures) was based on the settlement price.
GOODWILL
Goodwill arising from the acquisition has been recognised as follows:
| | | | |
Figures in million | | Note | US dollar | SA rand |
Consideration | | | 2,201.4 | 28,750.7 |
Fair value of identifiable net assets | | | (1,751.7) | (22,876.8) |
Goodwill | | 14 | 449.7 | 5,873.9 |
The goodwill is attributable to the talent and skills of Stillwater’s workforce.
The goodwill has been provisionally allocated to the Stillwater CGU. None of the goodwill recognised is expected to be deducted for tax purposes.
13.2 THE RUSTENBURG OPERATIONS ACQUISITION
On 9 September 2015, Sibanye-Stillwater announced that it had entered into written agreements with RPM, a wholly owned subsidiary of Anglo American Platinum to acquire the Bathopele, Siphumelele (including Khomanani), and Thembelani (including Khuseleka) mining operations, two concentrating plants, an on-site chrome recovery plant, the Western Limb Tailings Retreatment Plant, associated surface infrastructure and related assets and liabilities on a going concern basis (the Rustenburg operations) (the Rustenburg operations Transaction).
The purchase consideration comprises an upfront payment of R1.5 billion at the closing of the Rustenburg operations Transaction (Closing) and a deferred payment calculated as being equal to 35% of the distributable free cash flow (as defined in the agreements) generated by the Rustenburg operations over a six year period from the later of Closing or 1 January 2017 (Deferred Payment), subject to a minimum payment of R3.0 billion. In addition to the Deferred Payment, which allows for a favourable extended payment period; should the Rustenburg operations generate negative distributable free cash flows in either 2016, 2017 or 2018, RPM will be required to pay up to R267 million per annum to ensure that the free cash flow for the relevant year is equal to zero.
On 19 October 2016, Sibanye-Stillwater obtained consent in terms of section 11 of the Mineral and Petroleum Resources Development Act for the transfer of the mining right and prospecting right pursuant to the Rustenburg operations Transaction. Sibanye-Stillwater obtained control (88.4%) of the Rustenburg operations on this date.
For the two months ended 31 December 2016, the Rustenburg operations contributed revenue of R1,656.0 million and a loss of R150.0 million to the Group’s results.
At 19 October 2016, the PPA was prepared on a provisional basis in accordance with IFRS 3. During the remeasurement period, the Group received new information relating to deferred tax and the effective date valuations that existed at acquisition date, and adjustments were made to the provisional calculation of the fair values resulting an increase of R249.4 million to the net deferred tax liabilities and a decrease of R249.4 million to the reported gain on acquisition. According, the PPA has been restated as required by IFRS 3.
| |
Sibanye-Stillwater | Form 20-F 2017 | 189 |
Table of Contents
NOTES TO THE CONSOLIDATED FINANCIAL STATEMENTS continued
FOR THE YEAR ENDED 31 DECEMBER 2017
Consideration
The consideration paid is as follows:
| | | | |
Figures in million - SA rand | | | Note | 2016 |
Cash | | | | 1,500.0 |
Deferred Payment1 | | | 18.2 | 1,553.3 |
True-up amount2 | | | | 65.1 |
Total consideration | | | | 3,118.4 |
1 The Deferred Payment was based on 35% of the expected distributable free cash flow generated by the Rustenburg operations over an extended payment period from 1 January 2017, subject to a minimum payment of R3.0 billion discounted at a cost of debt of 9.5%
2 The upfront purchase price was adjusted after Closing (i.e. the true-up amount) for actual Closing cash of the Rustenburg operations in excess of the estimated Closing cash of the Rustenburg operations and actual Closing working capital of the Rustenburg operations in excess of the targeted Closing working capital of the Rustenburg operations (in essence, representing a normalised level of working capital).
Acquisition related costs
The Group incurred acquisition related costs of R63.9 million on advisory and legal fees. These costs are recognised as transaction costs in profit or loss.
Identifiable assets acquired and liabilities assumed
The following table summarises the provisional fair value of assets acquired and liabilities assumed at the acquisition date:
| | | | |
| | | | Revised |
Figures in million - SA rand | | | Notes | 2016 |
Property, plant and equipment | | | 12 | 4,021.5 |
Environmental rehabilitation obligation funds | | | 17 | 280.7 |
Other non-current assets | | | | 220.9 |
Inventories | | | | 80.4 |
Trade and other receivables | | | | 2,991.6 |
Other current assets | | | | 242.0 |
Cash and cash equivalents | | | | 0.1 |
Environmental rehabilitation obligation | | | 25 | (79.8) |
Deferred tax liabilities | | | 9.3 | (1,147.9) |
Trade and other payables | | | | (1,312.5) |
Total fair value of identifiable net assets acquired | | | | 5,297.0 |
The fair value of assets and liabilities excluding property, plant and equipment, and environmental rehabilitation obligation approximate the carrying value. The fair value of property, plant and equipment was based on the expected discounted cash flows of the expected PGM reserves and costs to extract the PGMs discounted at a weighted average cost of capital (WACC) of 9.2% and an average PGM (4E) basket price of R14,725/oz.
Gain on acquisition
A gain on acquisition has been recognised as follows:
| | | | |
| | | | Revised |
Figures in million - SA rand | | | Note | 2016 |
Consideration | | | | 3,118.4 |
Fair value of identifiable net assets | | | | (5,297.0) |
Gain on acquisition | | | 14 | (2,178.6) |
The excess of the fair value of the net assets acquired over the consideration is recognised immediately in profit or loss as a gain on acquisition. The gain on acquisition is attributable to the fact that Anglo American Platinum has repositioned its portfolio by among others exiting certain assets. The Rustenburg operations Transaction represented an attractively priced entry for Sibanye-Stillwater into the PGM sector.
13.3 AQUARIUS ACQUISITION
On 6 October 2015, Sibanye-Stillwater announced a cash offer of US$0.195 per share for the entire issued share capital of Aquarius (the Aquarius Transaction), valuing Aquarius at US$294 million. The transaction was subject to the fulfilment of various conditions precedent which were completed on 12 April 2016.
On 12 April 2016, Sibanye-Stillwater paid R4,301.5 million to the Aquarius shareholders and obtained control (100%) of Aquarius.
The acquisition had a strong strategic and financial rationale for Sibanye-Stillwater, both as a stand-alone transaction and particularly when considered in conjunction with the Rustenburg operations acquisition.
For the nine months ended 31 December 2016, Aquarius contributed revenue of R2,104.4 million and a profit of R223.6 million to the Group’s results.
| |
Sibanye-Stillwater | Form 20-F 2017 | 190 |
Table of Contents
NOTES TO THE CONSOLIDATED FINANCIAL STATEMENTS continued
FOR THE YEAR ENDED 31 DECEMBER 2017
CONSIDERATION
The consideration paid is as follows:
| | | | |
Figures in million - SA rand | | | | 2016 |
Cash | | | | 4,301.5 |
Total consideration | | | | 4,301.5 |
ACQUISITION RELATED COSTS
The Group incurred acquisition related costs of R84.7 million on advisory and legal fees. These costs are recognised as transaction costs in profit or loss in 2016.
IDENTIFIABLE ASSETS ACQUIRED AND LIABILITIES ASSUMED
The following table summarises the recognised fair value of assets acquired and liabilities assumed at the acquisition date:
| | | | |
Figures in million - SA rand | | | Notes | 2016 |
Property, plant and equipment | | | 12 | 1,680.8 |
Equity-accounted investments | | | 15 | 2,066.7 |
Environmental rehabilitation obligation funds | | | 17 | 151.9 |
Other non-current assets | | | | 108.4 |
Inventories | | | | 155.0 |
Trade and other receivables | | | | 908.9 |
Cash and cash equivalents | | | | 494.1 |
Environmental rehabilitation obligation | | | 25 | (630.0) |
Deferred tax liabilities | | | 9.3 | 49.2 |
Other non-current liabilities | | | | (32.4) |
Trade and other payables | | | | (1,025.6) |
Tax and royalties payable | | | | (13.2) |
Total fair value of identifiable net assets acquired | | | | 3,913.8 |
The fair value of assets and liabilities excluding property, plant and equipment, and environmental rehabilitation obligation approximate their carrying value. The fair value of property, plant and equipment was based on the expected discounted cash flows of the expected PGM reserves and costs to extract the PGMs discounted at a WACC of 9.0% for Kroondal and Platinum Mile, and 15.0% for Mimosa, and an average PGM (4E) basket price of R14,700/oz.
GOODWILL
Goodwill arising from the acquisition has been recognised as follows:
| | | | |
Figures in million - SA rand | | | Note | 2016 |
Consideration | | | | 4,301.5 |
Fair value of identifiable net assets | | | | (3,913.8) |
Non-controlling interests, based on their proportionate interest in the recognised amounts of the assets and liabilities | 12.9 |
Goodwill | | | 14 | 400.6 |
The goodwill is attributable to the synergies between the PGM assets in the Rustenburg area. Refer to note 14 for the allocation of goodwill. None of the goodwill recognised is expected to be deducted for tax purposes.
14. GOODWILL
SIGNIFICANT ACCOUNTING JUDGEMENTS AND ESTIMATES
Goodwill is tested for impairment on an annual basis. Expected future cash flows used to determine the recoverable amount of property, plant and equipment and goodwill are inherently uncertain and could materially change over time. The recoverable amount is significantly affected by a number of factors including reserves and production estimates, together with economic factors such as the expected commodity price, foreign currency exchange rates, and estimates of production costs, future capital expenditure and discount rates.
An individual operating mine does not have an indefinite life because of the finite life of its reserves. The allocation of goodwill to an individual mine will result in an eventual goodwill impairment due to the wasting nature of the mine.
ACCOUNTING POLICY
Goodwill is stated at cost less accumulated impairment losses. In accordance with the provisions of IAS 36 Impairment of Assets, the Group performs its annual impairment review of goodwill at each financial year end or whenever there are impairment indicators to establish whether there is any indication of impairment to goodwill. A write-down is made if the carrying amount exceeds the recoverable amount. The recoverable amount is determined by reference to “fair value less costs to sell” being the higher of “value in use” and “fair value less cost to sell”, based on the cash flows over the life of the CGUs and discounted to present value at an appropriate discount rate. Impairment losses on goodwill are not reversed. Gains and losses on the disposal of an entity include the carrying amount of goodwill allocated to the entity sold.
| |
Sibanye-Stillwater | Form 20-F 2017 | 191 |
Table of Contents
NOTES TO THE CONSOLIDATED FINANCIAL STATEMENTS continued
FOR THE YEAR ENDED 31 DECEMBER 2017
Goodwill is allocated to CGUs for the purpose of impairment testing. The allocation is made to those CGUs or groups of CGUs that are expected to benefit from the business combination in which the goodwill arose.
| | | | |
Figures in million - SA rand | Notes | 2017 | 2016 | 2015 |
Balance at beginning of the year | | 936.0 | 736.7 | 736.7 |
Impairment | 8 | (99.1) | (201.3) | |
Goodwill on acquisition of subsidiaries | 13.1, 13.3 | 5,873.9 | 400.6 | - |
Foreign currency translation | | (314.8) | - | - |
Balance at end of the year | | 6,396.0 | 936.0 | 736.7 |
The goodwill arose on the acquisition of Cooke, Aquarius and Stillwater. The goodwill on acquisition of Cooke was attributable to the synergies at the Group’s other operations, and the underlying assets of Cooke and WRTRP. At year end the remaining goodwill from the acquisition of Cooke is allocated to the Beatrix (R103.9 million), Driefontein (R166.9 million) and Kloof (R165.5 million) CGUs where it is tested for impairment.
The goodwill on acquisition of Aquarius is attributable to the synergies between the PGM assets in the Rustenburg area. At year end the goodwill on acquisition of Aquarius is allocated to the Kroondal (R133.5 million) and the Rustenburg operations (R267.1 million) CGUs, where it is tested for impairment. The goodwill on the acquisition of Stillwater is attributable to the premium paid, and the talent and skills of Stillwater’s workforce, and has been provisionally allocated to the Stillwater CGU.
None of the goodwill recognised is expected to be deducted for tax purposes.
The Group’s estimates and assumptions used in the 31 December 2017 impairment testing include:
| | | | | | |
Platinum | | | | Gold |
| 2016 | 2017 | | | | 2017 | 2016 |
| | | Long-term gold price | R/kg | 545,000 | 570,000 |
| 14,725 | 14,270 | R/4Eoz | Long-term PGM (4E) basket price | | | |
| 1,015 | US$/2Eoz | Long-term PGM (2E) basket price | | | |
| 15.7 | 14.5 | % | Nominal discount rate1 | % | 12.1 | 12.5 |
| 6.0 | 5.3 | % | Inflation rate | % | 5.3 | 6.0 |
8 - 26 | 9 - 34 | years | Life of mine | years | 12 - 22 | 7 - 20 |
1 Nominal discount rate for WRTRP of 14.7% (2016: 13.5%).
The annual life-of-mine plan that takes into account the following:
| · | | Proved and probable ore reserves of the CGUs; |
| · | | Resources are valued using appropriate price assumptions; |
| · | | Cash flows are based on the life-of-mine plan; and |
| · | | Capital expenditure estimates over the life-of-mine plan. |
During the six months ended 31 December 2017, the goodwill allocated to the WRTRP was impaired by R99.1 million (see note 8). There were no other events or changes in circumstances that suggest that the carrying amount of a CGU may not be recoverable.
The recoverable amounts of the Driefontein, Kloof, Kroondal, Platinum Mile and Rustenburg operations CGUs are significantly higher than their carry values, therefore a reasonably possible adverse change in the abovementioned assumptions would not likely result in an adjustment to the carrying values.
The recoverable amounts of the Beatrix and Stillwater CGUs approximate their carrying values and, therefore, any reasonably possible adverse change in the abovementioned assumptions could result in further impairment.
15. EQUITY-ACCOUNTED INVESTMENTS
SIGNIFICANT ACCOUNTING JUDGEMENTS AND ESTIMATES
Joint arrangements
Judgement is required to determine when the Group has joint control, which requires an assessment of the relevant activities and when the decisions in relation to those activities require unanimous consent. The Group has determined that the relevant activities for its joint arrangements are those relating to the operating and capital decisions of the arrangement, such as: the approval of the capital expenditure programme for each year, and appointing, remunerating and terminating the key management personnel or service providers of the joint arrangement. The considerations made in determining joint control are similar to those necessary to determine control over subsidiaries.
Judgement is also required to classify a joint arrangement as either a joint operation or a joint venture. Classifying the arrangement requires the Group to assess their rights and obligations arising from the arrangement. Specifically, it considers:
| · | | The structure of the joint arrangement – whether it is structured through a separate vehicle. |
| · | | When the arrangement is structured through a separate vehicle, the Group also considers the rights and obligations arising from: |
- the legal form of the separate vehicle; and
- the terms of the contractual arrangement.
This assessment often requires significant judgement, and a different conclusion on joint control and also whether the arrangement is a joint operation or a joint venture may materially impact the accounting.
| |
Sibanye-Stillwater | Form 20-F 2017 | 192 |
Table of Contents
NOTES TO THE CONSOLIDATED FINANCIAL STATEMENTS continued
FOR THE YEAR ENDED 31 DECEMBER 2017
ACCOUNTING POLICY
The Group’s interest in equity-accounted investees comprise interests in associates and joint ventures.
Associates are those entities in which the Group has significant influence, but not control or joint control, over the financial and operating policies. Joint ventures are arrangements in which the Group has joint control, whereby the Group has rights to the net assets of the arrangement, rather than rights to its assets and obligations for it liabilities.
Interests in associates and joint ventures are accounted for using the equity method. The interests are initially recognised at cost using the same principles as with business combinations. Subsequent to initial recognition, the consolidated financial statements include the Group’s share of profit or loss and other comprehensive income of equity-accounted investees until the date on which significant influence or joint control ceases.
Results of associates and joint ventures are equity-accounted using the results of their most recent audited annual financial statements or unaudited management accounts. Any losses from associates are brought to account in the consolidated financial statements until the interest in such associates is written down to zero. The interest includes any long-term interests that in substance, form part of the entity’s net investment in the equity-accounted investee, for example long-term receivables for which settlement is neither planned nor likely to occur in the foreseeable future. Thereafter, losses are accounted for only insofar as the Group is committed to providing financial support to such associates.
The carrying value of an equity-accounted investment represents the cost of the investment, including goodwill, the proportionate share of the post-acquisition retained earnings and losses, any other movements in reserves, any impairment losses and loans to or from the equity-accounted investee. The carrying value together with any long-term interests that in substance form part of the net investment in the equity-accounted investee is assessed annually for existence of indicators of impairment and if such exist, the carrying amount is compared to the recoverable amount, being the higher of value in use or fair value less costs to sell. If an impairment in value has occurred, it is recognised in the period in which the impairment arose. Indicators of impairment include a significant or prolonged decline in the investments fair value below its carrying value.
The Group holds the following equity-accounted investments:
| | | | |
Figures in million - SA rand | Notes | 2017 | 2016 | 2015 |
Rand Refinery | 15.1 | 198.4 | 72.4 | 148.7 |
Mimosa | 15.2 | 2,012.9 | 2,049.3 | - |
Other equity-accounted investments | | 32.8 | 35.7 | 18.8 |
Total equity-accounted investments | | 2,244.1 | 2,157.4 | 167.5 |
MATERIAL EQUITY-ACCOUNTED INVESTMENTS
15.1 RAND REFINERY
Sibanye-Stillwater has a 33.1% interest in Rand Refinery Proprietary Limited (Rand Refinery), a company incorporated in South Africa, which is involved in the refining of bullion and by-products sourced from, inter alia, South African and foreign gold producing mining companies. Rand Refinery is accounted for using the equity method.
On 18 December 2014, Rand Refinery drew down R1.029 billion under a R1.2 billion subordinated shareholders loan (the Facility), with Sibanye-Stillwater’s proportional share being R384.6 million. Amounts drawn down under the Facility were repayable within two years from the first draw down date. If the loan was not repaid within two years, it would automatically convert into equity in Rand Refinery. During February 2017, Rand Refinery resolved to convert the Facility to redeemable preference shares.
The equity-accounted investment in Rand Refinery movement for the year is as follows:
| | | | |
Figures in million - SA rand | | 2017 | 2016 | 2015 |
Balance at beginning of the year | | 72.4 | 148.7 | 55.1 |
Share of results of equity-accounted investee after tax1 | | 124.5 | (116.5) | 114.5 |
Interest income on loan to equity-accounted investee capitalised | | 1.5 | 40.2 | - |
Loan repaid by equity-accounted investee | | - | - | (20.9) |
Balance at end of the year | | 198.4 | 72.4 | 148.7 |
1 Rand Refinery is equity accounted based on its results for the period ended 30 November.
| |
Sibanye-Stillwater | Form 20-F 2017 | 193 |
Table of Contents
NOTES TO THE CONSOLIDATED FINANCIAL STATEMENTS continued
FOR THE YEAR ENDED 31 DECEMBER 2017
The Group’s interest in the summarised financial statements of Rand Refinery are:
| | | | |
Figures in million - SA rand | Note | 2017 | 2016 | 2015 |
Revenue | | 649.0 | 903.0 | 1,021.0 |
Total comprehensive (loss)/income | | 374.0 | (352.0) | 346.0 |
Non-current assets | | 702.0 | 636.0 | 708.0 |
Current assets | | 669.0 | 419.0 | 512.0 |
Non-current liabilities | | (31.0) | (1,095.0) | (992.0) |
Current liabilities | | (391.0) | (467.0) | (383.0) |
Net assets/(liabilities) (100.0%) | | 949.0 | (507.0) | (155.0) |
Reconciliation of the total investment in Rand Refinery with attributable net assets: | | | | |
Net assets/(liabilities) (33.1%) | | 314.1 | (168.2) | (51.7) |
Dividend received | | (8.2) | (8.2) | (8.2) |
Fair value adjustment1 | | (35.5) | (35.5) | (35.5) |
Impairment | 8 | (119.6) | (119.6) | (119.6) |
Loan to equity-accounted investee | | - | 403.9 | 363.7 |
Redeemable preference shares in excess of 33.1% interest2 | | 47.6 | - | - |
Total investment in Rand Refinery | | 198.4 | 72.4 | 148.7 |
1 The investment in equity-accounted investee was fair valued at 1 July 2002, the date when significant influence was obtained.
2 Sibanye-Stillwater’s proportional share of the Facility was 37.4%. On conversion of the Facility to redeemable preference shares, the Group shares in more than its 33.1% interest of the net assets of Rand Refinery.
15.2 MIMOSA
Sibanye-Stillwater has a 50% interest in Mimosa Investments Limited (Mimosa), which owns and operates the Mimosa mine.
The equity-accounted investment in Mimosa movement for the year is as follows:
| | | | |
Figures in million - SA rand | Note | 2017 | 2016 | 2015 |
Balance at the beginning of the year | | 2,049.3 | - | - |
Share of results of equity-accounted investee after tax | | 175.0 | 114.9 | - |
Equity-accounted investment on acquisition of subsidiaries | 13.3 | - | 2,066.7 | - |
Foreign currency translation | | (211.4) | (132.3) | - |
Balance at end of the year | | 2,012.9 | 2,049.3 | - |
The Group’s interest in the summarised financial statements of Mimosa are:
| | | | |
Figures in million - SA rand | | 2017 | 2016 | 2015 |
Revenue | | 3,375.4 | 2,446.4 | - |
Amortisation and depreciation | | (423.4) | (447.4) | - |
Interest income | | 17.5 | 1.0 | - |
Finance expense | | (20.0) | (22.4) | - |
Income tax | | (245.0) | (185.1) | - |
Profit or loss | | 350.1 | 229.8 | - |
Other comprehensive income | | 72.7 | (264.6) | - |
Total comprehensive income | | 422.8 | (34.8) | - |
Non-current assets | | 4,007.8 | 4,079.0 | - |
Property, plant and equipment | | 4,007.8 | 4,079.0 | - |
Current assets | | 1,916.3 | 2,259.5 | - |
Cash and cash equivalents | | 281.5 | 191.2 | - |
Other current assets | | 1,634.7 | 2,068.3 | - |
Non-current liabilities | | (993.6) | (1,131.2) | - |
Non-current financial liabilities | | (94.2) | (141.2) | - |
Other non-current liabilities | | (899.4) | (990.0) | - |
Current liabilities | | (539.0) | (900.1) | - |
Current financial liabilities | | (487.4) | (762.2) | - |
Other current liabilities | | (51.7) | (137.9) | - |
| | | | |
Net assets (100.0%) | | 4,391.5 | 4,307.2 | - |
Reconciliation of the total investment in Mimosa with attributable net assets: | | | |
Net assets (50.0%) | | 2,195.7 | 2,153.6 | - |
Reconciling items1 | | (182.8) | (104.3) | - |
Total investment in Mimosa | | 2,012.9 | 2,049.3 | - |
1 The reconciling items include the difference between the carrying amount and fair value of the Mimosa’s identifiable assets and liabilities on acquisition less accumulated amortisation, and foreign exchange differences on translation of assets and liabilities of the foreign joint venture. In 2016, the reconciling items also included the remaining impairment of the Reserve Bank of Zimbabwe bond notes.
Repatriation of funds from Zimbabwe is subject to regulatory approval in Zimbabwe.
| |
Sibanye-Stillwater | Form 20-F 2017 | 194 |
Table of Contents
NOTES TO THE CONSOLIDATED FINANCIAL STATEMENTS continued
FOR THE YEAR ENDED 31 DECEMBER 2017
16. INTERESTS IN JOINT OPERATIONS
ACCOUNTING POLICY
A joint operation is a joint arrangement in which the parties that share joint control have rights to the assets, and obligations for the liabilities, relating to the arrangement.
In relation to the Group’s interests in joint operations, the following are recognised in the financial statements:
| · | | the Group’s share of the jointly controlled assets, classified according to the nature of the assets; |
| · | | any liabilities that the Group has incurred; |
| · | | the Group’s share of any liabilities incurred jointly with the other ventures in relation to the joint operation; |
| · | | any income from the sale or use of the Group’s share of the output of the joint operation, together with the Group’s share of any expenses incurred by the joint operation; and |
| · | | any expenses that the Group has incurred in respect of its interest in the joint operation. |
The Group’s interests in joint operations includes a 50% interest in two joint operations each referred to as the “Notarial Pooling and Sharing Agreements”. The principal activities of the joint operations are to extend the Kroondal mine over the boundary of the properties covering the Kroondal mine and expand the Marikana mine operations through mineral rights contributed by Anglo American Platinum through its subsidiary, RPM.
The Group’s share of the assets, liabilities, revenue and expenses of the joint operations which are included in the consolidated financial statements, are as follows:
Kroondal Mine
| | | | |
Figures in million - SA rand | | 2017 | 2016 | 2015 |
Loss on foreign exchange differences | | (94.4) | (67.8) | - |
Profit before tax | | 175.0 | 90.8 | - |
Profit for the year | | 175.0 | 90.8 | - |
Non-current assets | | 1,284.0 | 1,296.1 | - |
Current assets | | 1,400.5 | 1,208.1 | - |
Current liabilities | | (283.2) | (288.7) | - |
Net assets (50.0%) | | 2,401.3 | 2,215.5 | - |
17. ENVIRONMENTAL REHABILITATION OBLIGATION FUNDS
ACCOUNTING POLICY
The Group’s rehabilitation obligation funds includes equity-linked investments that are fair valued at each reporting date. The fair value is calculated with reference to underlying equity instruments using industry valuation techniques and appropriate models. While Sibanye-Stillwater’s management believes that these assumptions are appropriate, the use of different assumptions could have a material impact on the fair value of the investments.
Annual contributions are made to dedicated environmental rehabilitation obligation funds to fund the estimated cost of rehabilitation during and at the end of the life of the relevant mine. The amounts contributed to these funds are included under non-current assets and are measured at fair value through profit or loss. Interest earned on monies paid to rehabilitation funds is accrued on a time proportion basis and is recorded as interest income.
In addition, bank guarantees are provided for funding shortfalls of the environmental rehabilitation obligations.
| | | | |
Figures in million - SA rand | Note | 2017 | 2016 | 2015 |
Balance at beginning of the year | | 3,100.5 | 2,413.9 | 2,192.8 |
Contributions | | 114.5 | 74.7 | 77.8 |
Interest income | | 230.4 | 168.2 | 134.8 |
Fair value gain1 | | 46.5 | 11.1 | 8.5 |
Environmental rehabilitation obligation funds on acquisition of subsidiaries | 13 | 0.5 | 432.6 | - |
Balance at end of the year | | 3,492.4 | 3,100.5 | 2,413.9 |
| | | | |
Environmental rehabilitation obligation funds comprise of the following: | | | |
Restricted cash2 | | 483.8 | 352.3 | 341.8 |
Funds | | 3,008.6 | 2,748.2 | 2,072.1 |
1 The environmental rehabilitation trust fund includes equity-linked investments that are fair valued at each reporting date.
2 The funds are set aside to serve as collateral against the guarantees made to the Department of Minerals and Resources (DMR) for environmental rehabilitation obligations.
| |
Sibanye-Stillwater | Form 20-F 2017 | 195 |
Table of Contents
NOTES TO THE CONSOLIDATED FINANCIAL STATEMENTS continued
FOR THE YEAR ENDED 31 DECEMBER 2017
18. OTHER RECEIVABLES AND OTHER PAYABLES
SIGNIFICANT ACCOUNTING JUDGEMENTS AND ESTIMATES
Expected future cash flows used to determine the fair value of the other receivables and other payables (namely the Anglo American Platinum financial asset and Deferred Payment, and rates and taxes receivable) are inherently uncertain and could materially change over time. The expected future cash flows are significantly affected by a number of factors including reserves and production estimates, together with economic factors such as the expected commodity price, currency exchange rates, and estimates of production costs, future capital expenditure and discount rates.
ACCOUNTING POLICY
Other receivables and other payables are initially recognised at fair value. Subsequent to initial recognition other receivables and other payables are measured at amortised cost.
Reimbursements, such as rehabilitation reimbursements from other parties, are recognised as a separate asset where recovery is virtually certain. The amount recognised is limited to the amount of the provision. If the party that will make the reimbursement cannot be identified, then the reimbursement is generally not virtually certain and cannot be recognised. If the only uncertainty regarding the certainty of the amount relates to recovery, the reimbursement amount qualifies to be recognised as an asset.
18.1 OTHER RECEIVABLES
| | | | |
Figures in million - SA rand | | 2017 | 2016 | 2015 |
Anglo American Platinum financial asset | | - | 469.7 | - |
Right of recovery receivable | | 160.5 | 112.4 | - |
Rates and taxes receivable | | 105.6 | 82.4 | - |
Other | | 53.1 | 1.4 | 1.3 |
Total other receivables | | 319.2 | 665.9 | 1.3 |
| | | | |
Reconciliation of the non-current and current portion of the other receivables: | | | |
Other receivables | | 319.2 | 665.9 | 1.3 |
Current portion of other receivables | | (35.2) | (310.6) | - |
Non-current portion of other receivables | | 284.0 | 355.3 | 1.3 |
The Anglo American Platinum financial asset movement for the year is as follows:
| | | | |
Figures in million - SA rand | Note | 2017 | 2016 | 2015 |
Balance at the beginning of the year | | 469.7 | - | - |
Interest income | | 42.2 | 6.8 | - |
Fair value loss | | (467.5) | - | - |
Payments received | | (44.4) | - | - |
Financial asset on acquistion of subsidiary | 13.2 | - | 462.9 | - |
Balance at end of the year | | - | 469.7 | - |
18.2 OTHER PAYABLES
| | | | |
Figures in million - SA rand | Note | 2017 | 2016 | 2015 |
Deferred Payment | | 2,194.7 | 1,577.4 | - |
Right of recovery payable | | 69.3 | 36.3 | - |
Dissenting shareholder liability | 13.1 | 1,349.7 | - | - |
Other | | 188.6 | - | - |
Total other payables | | 3,802.3 | 1,613.7 | - |
| | | | |
Reconciliation of the non-current and current portion of the other payables: | | | |
Other payables | | 3,802.3 | 1,613.7 | - |
Current portion of other payables | | (41.9) | - | - |
Non-current portion of other payables | | 3,760.4 | 1,613.7 | - |
The Deferred Payment movement for the year is as follows:
| | | | |
Figures in million - SA rand | Notes | 2017 | 2016 | 2015 |
Balance at the beginning of the year | | 1,577.4 | - | - |
Interest charge | 5 | 148.2 | 24.1 | - |
Loss on revised estimated cash flows | | 469.1 | - | - |
Deferred Payment on acquisition of subsidiaries | 13.2 | - | 1,553.3 | - |
Balance at end of the year | | 2,194.7 | 1,577.4 | - |
| |
Sibanye-Stillwater | Form 20-F 2017 | 196 |
Table of Contents
NOTES TO THE CONSOLIDATED FINANCIAL STATEMENTS continued
FOR THE YEAR ENDED 31 DECEMBER 2017
ANGLO AMERICAN PLATINUM FINANCIAL ASSET AND DEFERRED PAYMENT
In terms of the Rustenburg operations Transaction (refer to note 13.2) the purchase consideration includes a Deferred Payment, subject to a minimum payment of R3.0 billion. In addition to the Deferred Payment, which allows for a favourable extended payment period; should the Rustenburg operations generate negative distributable free cash flows in either 2016, 2017 or 2018, RPM will be required to pay up to R267 million per annum to ensure that the free cash flow for the relevant year is equal to zero.
RIGHT OF RECOVERY RECEIVABLE AND PAYABLE
Based on the first and second Notarial Pooling and Sharing agreements (PSAs) with Anglo American Platinum, Kroondal Operations Proprietary Limited (Kroondal Operations) (previously Aquarius Platinum (South Africa) Proprietary Limited (AQPSA)) holds a contractual right to recover 50% of the rehabilitation obligation relating to environmental rehabilitation resulting from PSA operations from RPM, where this rehabilitation relates to property owned by Kroondal Operations. Likewise RPM holds a contractual right to recover 50% of the rehabilitation obligation relating to environmental rehabilitation resulting from PSA operations from Kroondal Operations, where the rehabilitation relates to property owned by RPM. With respect to the opencast section of the Marikana mine that is on Kroondal Operations property, RPM have limited their contractual liability to approximately R150 million, being a negotiated liability in terms of an amendment to the second PSA.
19. INVENTORIES
SIGNIFICANT ACCOUNTING JUDGEMENTS AND ESTIMATES
Net realisable value tests are performed at least annually and represent the estimated future sales price of the product based on prevailing spot commodity prices at the reporting date, less estimated costs to complete production and bring the product to sale. Future commodity price fluctuations could negatively impact the valuation of inventory. If any inventories are expected to be realised in the long-term horizon, estimated future sales prices are used for valuation purposes.
ACCOUNTING POLICY
Inventory is valued at the lower of cost and net realisable value. The Group values ore stockpiles, uranium-in-process and gold-in-process when it can be reliably measured. Cost is determined on the following basis:
| · | | PGM concentrate awaiting further processing, reef ore stockpiles and uranium stockpiles are valued using weighted average cost. Cost includes production, amortisation, depreciation and related administration costs; and |
| · | | Consumable stores are valued at weighted average cost after appropriate provision for surplus and slow-moving items. |
| | | | |
Figures in million - SA rand | | 2017 | 2016 | 2015 |
Consumable stores1 | | 828.7 | 481.7 | 277.5 |
Uranium finished goods and uranium-in-process2 | | 104.4 | 100.4 | 128.4 |
Ore stockpiles and in-process | | 1,955.9 | 51.8 | - |
Gold-on-hand | | - | 42.9 | - |
PGMs-on-hand | | 637.5 | - | - |
Total inventories | | 3,526.5 | 676.8 | 405.9 |
1 The cost of consumable stores consumed during the year and included in operating cost amounted to R8,789.4 million (2016: R5,243.2 million and 2015: R3,995.7 million).
2 Although the uranium finished goods and uranium-in-process was presented under current assets, management does not expect that all this inventory will be realised within 12 months from the reporting date.
During 2017, the Group did not recognise a net realisable value write down of on its uranium finished goods and uranium-in-process inventory (2016: R93.3 million), which was recognised as part of cost of sales.
20. TRADE AND OTHER RECEIVABLES
ACCOUNTING POLICY
Trade and other receivables are initially recognised at fair value and subsequently carried at amortised cost less allowance for impairment. Estimates made for impairment are based on a review of all outstanding amounts at year end. Irrecoverable amounts are written off during the period in which they are identified.
Trade receivables include actual invoiced sales of PGM concentrate as well as sales not yet invoiced for which deliveries have been made and the risks and rewards of ownership have passed. The receivable amount calculated for the PGM concentrate delivered but not yet invoiced is recorded at the fair value of the consideration receivable at the date of delivery. At each subsequent reporting date the receivable is restated to reflect the fair value movements in the pricing mechanism which is considered to represent an embedded derivative. Foreign exchange movements subsequent to the recognition of a sale are recognised as a foreign exchange gain or loss in profit or loss.
| |
Sibanye-Stillwater | Form 20-F 2017 | 197 |
Table of Contents
NOTES TO THE CONSOLIDATED FINANCIAL STATEMENTS continued
FOR THE YEAR ENDED 31 DECEMBER 2017
| | | | |
Figures in million - SA rand | | 2017 | 2016 | 2015 |
Trade receivables - gold sales | | 499.6 | 658.1 | 933.4 |
Trade receivables - PGM sales | | 4,512.4 | 4,001.9 | - |
Other trade receivables | | 431.4 | 306.5 | 108.4 |
Payroll debtors | | 174.1 | 154.7 | 109.5 |
Interest receivable | | 8.5 | 6.6 | 7.8 |
Financial assets | | 5,626.0 | 5,127.8 | 1,159.1 |
Prepayments | | 245.0 | 298.1 | 123.7 |
Value added tax | | 326.6 | 322.0 | 344.6 |
Total trade and other receivables | | 6,197.6 | 5,747.9 | 1,627.4 |
21. CASH AND CASH EQUIVALENTS
ACCOUNTING POLICY
Cash and cash equivalents comprise cash on hand, demand deposits and short-term, highly liquid investments readily convertible to known amounts of cash and subject to insignificant risk of changes in value and are measured at amortised cost which is deemed to be fair value as they have a short-term maturity.
| | | | |
Figures in million - SA rand | | 2017 | 2016 | 2015 |
Cash at the bank and on hand1 | | 2,062.4 | 967.9 | 717.4 |
Total cash and cash equivalents | | 2,062.4 | 967.9 | 717.4 |
1 At 31 December 2017, restricted cash of US$6.2 million (R76.6 million) was held in a money market fund as collateral for the environmental bonding requirements in the US.
7
22. STATED SHARE CAPITAL
ACCOUNTING POLICY
Ordinary share capital
Ordinary shares are classified as equity. Incremental costs directly attributable to the issue of ordinary shares are recognised as a deduction from equity, net of any tax effects.
| | | | |
Figures in thousand | | 2017 | 2016 | 2015 |
Authorised number of shares | | 10,000,000 | 2,000,000 | 2,000,000 |
| | | | |
Reconciliation of issued number of shares: | | | | |
Number of shares in issue at beginning of the year | | 929,004 | 916,140 | 898,840 |
Shares issued under SGL Share Plan | | 1,407 | 12,864 | 17,300 |
Rights issue | | 1,195,787 | - | - |
Capitalisation issue | | 42,523 | - | - |
Number of shares in issue at end of the year | | 2,168,721 | 929,004 | 916,140 |
AUTHORISED AND ISSUED
At the shareholder’s meeting held on 21 November 2012 (when Gold Fields was the sole shareholder), the Company’s authorised and issued share capital of 1,000 par value shares of R1.00 each was converted into 1,000 ordinary shares with no par value. The authorised share capital was increased by the creation of a further 999,999,000 ordinary no par value shares, each ranking pari passu in all respects with the existing no par value shares in the Company’s share capital so as to result in the Company’s authorised share capital being 1,000,000,000 ordinary no par value shares. As at 31 December 2012, the authorised share capital was 1,000,000,000 ordinary no par value shares and the issued share capital was 1,000 ordinary no par value shares.
On 1 February 2013, prior to the unbundling of Sibanye-Stillwater from Gold Fields on 18 February 2013, Gold Fields subscribed for a further 731,647,614 shares in Sibanye-Stillwater for R17,246 million.
During 2015, the Company issued 17,300,356 shares as part of the SGL Share Plan. As of 31 December 2015, the authorised share capital was 2,000,000,000 ordinary no par value shares and the issued share capital was 916,140,552 ordinary no par value shares.
During 2016, the Company issued 12,863,790 shares as part of the SGL Share Plan, and as of 31 December 2016, the authorised share capital was 2,000,000,000 ordinary no par value shares and issued share capital was 929,004,342 ordinary no par value shares.
At the shareholder’s AGM on 25 April 2017, the authorised number of shares was increased to 10,000,000,000 ordinary no par value shares.
On 14 June 2017, Sibanye-Stillwater raised net capital of R12,932.4 million, being proceeds of R13,438.5 million and transactions costs of R506.1 million, from a rights issue, when 1,195,787,294 shares were issued with nine (9) new shares issued for every seven (7) existing shares held, on 4 October 2017, 42,522,524 shares were issued with two (2) capitalisation issue shares for every 100 existing share held, and on various dates during 2017, 1,407,060 shares were issued as part of the SGL Share Plan. As of 31 December 2017, the issued share capital was 2,168,721,220 ordinary no par value shares.
| |
Sibanye-Stillwater | Form 20-F 2017 | 198 |
Table of Contents
NOTES TO THE CONSOLIDATED FINANCIAL STATEMENTS continued
FOR THE YEAR ENDED 31 DECEMBER 2017
In terms of the general authority granted at the shareholder’s AGM on 23 May 2017, the authorised but unissued ordinary share capital of the Company representing not more than 5% of the issued share capital of the Company as at 31 December 2016, after setting aside so many ordinary shares as may be required to be allotted and issued pursuant to the share incentive scheme, was placed under the control of the directors.
This authority expires at the next AGM where shareholders will be asked to place under the control of the directors the authorised but unissued ordinary share capital of the Company representing not more than 5% of the issued share capital of the Company from time to time.
All the Sibanye-Stillwater ordinary shares rank pari passu in all respects, there being no conversion or exchange rights attached thereto, and all of the ordinary shares will have equal rights to participate in capital, dividend and profit distributions by the Company.
REPURCHASE OF SHARES
The Company has not exercised the general authority granted to buy back shares from its issued ordinary share capital granted at the shareholders’ meeting held on 23 May 2017. At the next AGM, shareholders will be asked to approve the general authority for the acquisition by the Company, or a subsidiary of the Company, of its own shares.
23. NON-CONTROLLING INTERESTS
ACCOUNTING POLICY
Non-controlling interests
The Group recognises any non-controlling interest in an acquiree either at fair value or at the non-controlling interest’s proportionate share of the acquiree’s net assets on an acquisition by acquisition basis. Subsequently, the carrying amount of non-controlling interest is the amount of the interest at initial recognition plus the non-controlling interest’s subsequent share of changes in equity.
Transactions with non-controlling interests
The Group treats transactions with non-controlling interests as transactions with equity owners of the Group. For purchases from non-controlling interests, the difference between any consideration paid and the relevant share acquired of the carrying value of net assets of the subsidiary is recorded in equity. Gains or losses on disposals to non-controlling interests where control is not lost are also recorded in equity. Where control is lost over a subsidiary, the gains or losses are recognised in profit or loss.
The Group’s non-controlling interests relates to the following subsidiaries:
| | | | |
Figures in million - SA rand | | 2017 | 2016 | 2015 |
Non-controlling interests of Newshelf 1114 | | - | - | 107.3 |
Non-controlling interests of GTSM | | 4.1 | 3.4 | 2.5 |
Non-controlling interest of Platinum Mile | | 15.7 | 14.3 | - |
Total non-controlling interests | | 19.8 | 17.7 | 109.8 |
24. BORROWINGS and derivative financial instrument
SIGNIFICANT ACCOUNTING JUDGEMENTS AND ESTIMATES
Borrowings
Expected future cash flows used to determine the fair value of borrowings (namely the Burnstone Debt) are inherently uncertain and could materially change over time. They are significantly affected by a number of factors including reserves and production estimates, together with economic factors such as the expected commodity price, foreign currency exchange rates, and estimates of production costs, future capital expenditure and discount rates.
ACCOUNTING POLICY
Borrowings
Borrowings are recognised initially at fair value, net of transaction costs incurred, where applicable and subsequently measured at amortised cost using the effective interest method.
Borrowings are classified as current liabilities unless the Group has an unconditional right to defer settlement of the liability for at least 12 months after the reporting date.
| |
Sibanye-Stillwater | Form 20-F 2017 | 199 |
Table of Contents
NOTES TO THE CONSOLIDATED FINANCIAL STATEMENTS continued
FOR THE YEAR ENDED 31 DECEMBER 2017
Derivative financial instruments
Derivatives are initially recognised at fair value using option pricing methodologies. Any directly attributable transaction costs are recognised in profit or loss as incurred. Subsequent to initial recognition, derivatives are measured at fair value, and changes are generally recognised in profit or loss.
BORROWINGS
| | | | |
Figures in million - SA rand | Notes | 2017 | 2016 | 2015 |
R6.0 billion revolving credit facility | 24.1 | 5,536.4 | 5,100.0 | - |
US$350 million revolving credit facility | 24.2 | 1,137.1 | 1,369.0 | - |
US$1.05 billion Bond | 24.3 | 12,597.7 | - | - |
US$450 million Convertible Bond | 24.4 | 4,357.1 | - | - |
R4.5 billion Facilities | 24.5 | - | - | 1,961.6 |
Burnstone Debt | 24.6 | 1,537.5 | 1,752.6 | 1,808.3 |
Other borrowings | 24.8 | 478.7 | 749.5 | - |
Franco-Nevada liability | | 1.7 | 2.7 | 33.7 |
Stillwater Convertible Debentures | | 3.3 | - | - |
Total borrowings | | 25,649.5 | 8,973.8 | 3,803.6 |
Reconciliation of the non-current and current portion of the borrowings: | | | |
Borrowings | | 25,649.5 | 8,973.8 | 3,803.6 |
Current portion of borrowings | | (1,657.5) | (752.3) | (1,995.3) |
Non-current portion of borrowings | | 23,992.0 | 8,221.5 | 1,808.3 |
The current portion of borrowings will be repaid out of operational cash flows or it will be refinanced by utilising available Group facilities.
DERIVATIVE FINANCIAL INSTRUMENT
| | | | |
Figures in million - SA rand | Note | 2017 | 2016 | 2015 |
Reconciliation of the non-current and current portion of the derivative financial instrument: | | | | |
Derivative financial instrument | 24.4 | 1,093.5 | - | - |
Non-current portion of derivative financial instrument | | 1,093.5 | - | - |
24.1 R6.0 BILLION REVOLVING CREDIT FACILITY
On 15 November 2016, Sibanye-Stillwater cancelled and refinanced the R4.5 billion Facilities (refer to note 24.5) by drawing under the R6.0 billion revolving credit facility (RCF). The purpose of the facility was to refinance the R4.5 billion Facilities, finance ongoing capital expenditure, working capital and general corporate expenditure requirements which may include the financing of future acquisitions of business combinations.
| |
Terms of the R6.0 billion RCF |
Facility: | R6.0 billion |
Interest rate: | JIBAR |
Interest rate margin: | During the Covenant adjustment period, being 30 June 2017 to 31 December 2018, the margin will be based on the following Net debt to adjusted EBITDA ratios: |
| Net debt to adjusted EBITDA ratios | Margin % |
| 0.00:1 – 3.00:1 | 2.40% |
| 3.00:1 – 3.25:1 | 2.65% |
| 3.25:1 – 3.50:1 | 2.90% |
| After the covenant adjustment period the margin will return to 2.4% |
Term of loan: | Three years |
Borrowers: | Sibanye Gold Limited, SRPM and Kroondal Operations |
Security and/or guarantors: | The facility is unsecured and guaranteed by Sibanye Gold Limited, Rand Uranium, SRPM and Kroondal. |
| | | | |
Figures in million - SA rand | | 2017 | 2016 | 2015 |
Balance at beginning of the year | | 5,100.0 | - | - |
Loans raised | | 800.0 | 5,100.0 | - |
Loans repaid | | (363.6) | - | - |
Balance at end of the year | | 5,536.4 | 5,100.0 | - |
| |
Sibanye-Stillwater | Form 20-F 2017 | 200 |
Table of Contents
NOTES TO THE CONSOLIDATED FINANCIAL STATEMENTS continued
FOR THE YEAR ENDED 31 DECEMBER 2017
24.2 US$350 MILLION REVOLVING CREDIT FACILITY
On 24 August 2015, Sibanye-Stillwater entered into a US$300 million syndicated RCF agreement. On 15 February 2016, the facility increased to US$350 million. The purpose of the facility was to finance ongoing capital expenditure, working capital and general corporate expenditure requirements which may include the financing of future acquisitions of business combinations.
Terms of the US$350 million RCF |
Facility | US$350 million RCF (2015: US$300 million RCF) |
Interest rate: | LIBOR |
Interest rate margin | 2% per annum |
Utilisation Fees | Where the total outstanding loans under the RCF fall within the range of the percentage of the total loan as set out below, Sibanye-Stillwater shall pay a utilisation fee equal to the percentage per annum set out opposite such percentage range. |
| % of the total loans | Utilisation fee |
| Less than or equal to 33⅓% | 0.15% |
| Greater than 33⅓% and less than or equal to 66⅔% | 0.30% |
| Greater than 66⅔% | 0.50% |
Term of loan: | Three years |
Borrowers: | Sibanye Gold Limited, SRPM and Kroondal Operations |
Security and/or guarantors: | The facility is unsecured and guaranteed by Sibanye Gold Limited, Rand Uranium, SRPM and Kroondal. |
| | | | |
Figures in million - SA rand | | 2017 | 2016 | 2015 |
Balance at beginning of the year | | 1,369.0 | - | - |
Loans raised | | 1,031.4 | 2,771.5 | - |
Loans repaid | | (1,198.2) | (1,211.6) | - |
Gain on foreign exchange differences | | (65.1) | (190.9) | - |
Balance at end of the year | | 1,137.1 | 1,369.0 | - |
24.3 US$1.05 BILLION BOND
The acquisition of Stillwater was financed by a US$2.65 billion bridge loan (Stillwater Bridge Facility) (refer to note 24.7). On 27 June 2017, Sibanye-Stillwater completed a two tranche US$1.05 billion international corporate bond offering (the Notes) and the proceeds of the bond offering were applied to the partial repayment of the Stillwater Bridge Facility raised for the acquisition of Stillwater.
Terms of the US$1.05 billion Bond |
Facility: | US$500 million 6.125% Senior Notes due 2022 (the 2022 Notes) |
| US$550 million 7.125% Senior Notes due 2025 (the 2025 Notes) |
Interest rate: | 2022 Notes: 6.125% |
| 2025 Notes: 7.125% |
Term of the Notes: | 2022 Notes: Five years |
| 2025 Notes: Eight years |
Issuer: | Stillwater Mining Company |
Guarantors: | Each of the Notes will be fully and unconditionally guaranteed, jointly and severally by the Guarantors (Kroondal Operations, Rand Uranium, SRPM and Sibanye Gold Limited). The Guarantees will rank equally in right of payment to all existing and future senior debt of the Guarantors. |
| | | | |
Figures in million - SA rand | Notes | 2017 | 2016 | 2015 |
Loans raised | | 13,109.5 | - | - |
Interest charge | 5 | 478.1 | - | - |
Accrued interest paid | 5 | (431.5) | - | - |
Unwinding of amortised cost | | 29.7 | - | - |
Foreign currency translation | | (588.1) | - | - |
Balance at end of the year | | 12,597.7 | - | - |
| |
Sibanye-Stillwater | Form 20-F 2017 | 201 |
Table of Contents
NOTES TO THE CONSOLIDATED FINANCIAL STATEMENTS continued
FOR THE YEAR ENDED 31 DECEMBER 2017
24.4 US$450 MILLION CONVERTIBLE BOND
The Stillwater Bridge Facility was partially repaid through the US$1 billion rights offer, the Notes (refer to note 24.3) and existing cash at Stillwater. The balance was repaid through the issuance of a US$450 million Convertible Bond. The convertible bond launched and was priced on 19 September 2017.
| |
Terms of the US$ 450 million Convertible Bond |
Issue size: | US$450 million |
Coupon: | 1.875% |
Maturity date: | 26 September 2023 (six years) |
Conversion premium: | 35% |
Reference share price: | US$1.2281, being the volume weighted average price of a share on the JSE from launch to pricing on 19 September 2017, converted at a fixed exchange rate. |
Initial conversion price: | US$1.6580 |
Issuer: | Sibanye Gold Limited |
Guarantors: | Stillwater Mining Company and Kroondal Operations (together, the Guarantors), 100% subsidiaries of Sibanye Gold Limited. |
The US$450 million Convertible Bond has two components. The option component is recognised as a derivative liability, measured at fair value, with changes in fair value recorded in profit or loss and reported separately in the statement of financial position. The bond component is recognised as a financial liability and measured at amortised cost using the effective interest rate.
CONVERTIBLE BOND AT AMORTISED COST
| | | | |
Figures in million - SA rand | Note | 2017 | 2016 | 2015 |
Loans raised | | 4,634.5 | - | - |
Accrued interest and unwinding of amortised cost | 5 | 80.5 | - | - |
Gain on foreign exchange differences | | (357.9) | - | - |
Balance at end of the year | | 4,357.1 | - | - |
DERIVATIVE FINANCIAL INSTRUMENT
| | | | |
Figures in million - SA rand | | 2017 | 2016 | 2015 |
Derivative financial instrument recognised | | 1,296.6 | - | - |
Gain on financial instruments | | (115.9) | - | - |
Gain on foreign exchange differences | | (87.2) | - | - |
Balance at end of the year | | 1,093.5 | - | - |
24.5 R4.5 BILLION FACILITIES
Sibanye-Stillwater entered into the R4.5 billion Facilities on 13 December 2013. The R4.5 billion Facilities was used to refinance the unbundling bridge loan facilities.
| |
Terms of the R4.5 billion Facilities |
Facility: | R2.5 billion RCF |
| R2.0 billion term loan facility (Term Loan) |
Interest rate: | JIBAR |
Interest rate margin: | RCF: 2.85% |
| Term Loan: 2.75% |
Term of loan: | Three years |
Repayment period: | The Term Loan was repaid in equal six-monthly instalments of R250 million, with the R750 million balance and any amounts outstanding under the RCF due for settlement on final maturity, being 13 December 2016. |
Security and/or guarantors: | The Facilities were unsecured and guaranteed by Rand Uranium and Ezulwini. |
Cancellation: | These facilities were cancelled and repaid on 15 November 2016. |
| | | | |
Figures in million - SA rand | Note | 2017 | 2016 | 2015 |
Balance at beginning of the year | | - | 1,961.6 | 1,979.5 |
Loans raised | | - | 1,936.4 | 1,000.0 |
Loans repaid | | - | (3,900.0) | (1,020.9) |
Unwinding of amortised cost | 5 | - | 2.0 | 3.0 |
Balance at end of the year | | - | - | 1,961.6 |
Reconciliation of facilities: | | | | |
RCF | | - | - | 963.6 |
Term loan | | - | - | 998.0 |
| |
Sibanye-Stillwater | Form 20-F 2017 | 202 |
Table of Contents
NOTES TO THE CONSOLIDATED FINANCIAL STATEMENTS continued
FOR THE YEAR ENDED 31 DECEMBER 2017
24.6 BURNSTONE DEBT
SGEO has bank debt of US$178.1 million (R1,883.9 million) (the Burnstone Debt) outstanding as part of the net assets acquired on 1 July 2014.
Terms of the Burnstone Debt
| |
Facility: | A1: US$0.2 million |
| A2: US$7.8 million |
| A3: US$51.0 million |
| A4: US$119.1 million |
Interest rate: | A1 and A2: Interest free |
| A3 and A4: Interest free until 1 July 2017, then at London Interbank Offered Rate (LIBOR) |
Interest rate margin: | A3 and A4: 4% from 1 July 2017 |
Term of loan: | No fixed term |
Repayment period: | A1: Repaid on 1 July 2014 |
| A2: From 1 July 2017 the first 50% of Burnstone’s free cash flow (as defined in the settlement agreement) will be used to repay the Wits Gold Loan and the balance of 50% to repay A2 |
| A3 and A4: On settlement of A2. 90% of Burnstone’s free cash flow will be used to repay the Wits Gold Loan and the balance of 10% to repay the Burnstone Debt. On settlement of the Wits Gold Loan and interest, 30% of Burnstone’s free cash flow will be used to repay the Burnstone Debt and the balance will be distributed to Wits Gold. |
| The Bank Lenders will continue to participate in 10% of Burnstone’s free cash flow after the Burnstone Debt has been repaid in full to a maximum amount of US$63.0 million under a revenue participation agreement. |
Security: | The Burnstone Debt is fully secured against the assets of Burnstone (of R2.0 billion) and there is no recourse to the Sibanye-Stillwater Group. The security package includes a cession over the bank accounts, insurance policies’ proceeds, special and general notarial bonds over movable assets and mortgage bonds over property. |
The Burnstone Debt facilities of US$178.1 million (R1,883.9 million) were initially recognised at the acquisition fair value using level 2 (refer note 30) assumptions, being R1,007.6 million, in terms of IFRS 3. The expected free cash flows to repay the loan as detailed above were based on the estimates and assumptions to determine the fair value:
| · | | A US$ swap forward curve adjusted with the 4% interest rate margin above; |
| · | | The annual life of mine plan that takes into account the following: |
- Proved and probable ore reserves of Burnstone;
- Cash flows are based on the life-of-mine plan of 18 years; and
- Capital expenditure estimates over the life-of-mine plan.
| | | | |
Figures in million - SA rand | Note | 2017 | 2016 | 2015 |
Balance at beginning of the year | | 1,752.6 | 1,808.3 | 1,134.4 |
Accrued interest and unwinding of amortised cost | 5 | 141.6 | 139.4 | 99.3 |
(Gain)/loss on revised estimated cash flows1 | | (181.7) | 29.3 | 162.5 |
(Gain)/loss on foreign exchange differences | | (175.0) | (224.4) | 412.1 |
Balance at end of the year | | 1,537.5 | 1,752.6 | 1,808.3 |
1 At 31 December 2017, the expected free cash flows expected to repay the loan as detailed above were revised as a result of:
• Revised proven and probable reserves;
• Revised cash flows over the life of mine plan as a result of:
◦ Revised forecast costs and capital expenditure; and
◦ Revised gold prices 2017: R545,000/kg (2016: R570,000/kg and 2015: R550,000/kg) and exchange rates 2017: R12.94/US$ (2016: R13.68/US$S and 2015: R15.00/US$).
In terms of IAS 39 AG8 the carrying value of the Burnstone Debt decreased by R181.7 million (2016: increased by R29.3 million and 2015: increased by R162.5 million), recognised as part of loss on financial instruments in profit or loss.
| |
Sibanye-Stillwater | Form 20-F 2017 | 203 |
Table of Contents
NOTES TO THE CONSOLIDATED FINANCIAL STATEMENTS continued
FOR THE YEAR ENDED 31 DECEMBER 2017
24.7 ACQUISITION BRIDGE FACILITIES
STILLWATER BRIDGE FACILITY
On 9 December 2016, Sibanye-Stillwater obtained a US$2.65 billion bridge facility (Stillwater Bridge Facility) to finance the purchase of Stillwater, to refinance existing indebtedness at Stillwater and to pay certain related fees, costs and expenses.
| |
Terms of the Stillwater Bridge Facilities |
Facility: | A: US$750 million bridge to equity |
| B: US$300 million bridge to cash |
| C: US$1.6 billion bridge to debt |
Interest rate: | LIBOR |
Interest rate margin: | Months 1 - 3: 3.25% per annum |
| Months 4 - 6: 4.25% per annum or 5.25% per annum if Net debt to EBITDA > 2.0x |
| Months 7 - 9: 5.25% per annum or 6.25% per annum if Net debt to EBITDA > 2.0x |
| Months 10 - 12: 6.25% per annum or 7.25% per annum if Net debt to EBITDA > 2.0x |
Term of loan: | Facility A and B: Earlier of nine months from completion of the Stillwater acquisition and 31 October 2017 |
| Facility C: 364 days from completion of the Stillwater acquisition |
Borrowers: | Sibanye Gold Limited and Thor Mergeco Inc |
Security and/or guarantors: | The facility was unsecured and guaranteed by Sibanye Gold Limited, Thor Mergeco Inc, Kroondal Operations, Rand Uranium and SRPM. |
| | | | |
Figures in million - SA rand | | 2017 | 2016 | 2015 |
Loans raised | | 34,000.3 | - | - |
Loans repaid | | (33,304.0) | - | - |
Gain on foreign exchange differences | | (514.5) | | |
Foreign currency translation | | (181.8) | - | - |
Balance at end of the year | | - | - | - |
24.8 OTHER BORROWINGS
SHORT-TERM CREDIT FACILITIES
Sibanye-Stillwater has uncommitted loan facilities with various banks to fund capital expenditure and working capital requirements at its operations. These facilities have no fixed terms, are short-term in nature and interest rates are market related.
| | | | |
Figures in million - SA rand | | 2017 | 2016 | 2015 |
Balance at beginning of the year | | 749.5 | - | - |
Loans raised | | 14,721.5 | 7,472.6 | 552.0 |
Loans repaid | | (14,992.3) | (6,723.1) | (552.0) |
Balance at end of the year | | 478.7 | 749.5 | - |
24.9 THE EXPOSURE TO INTEREST RATE CHANGES AND THE CONTRACTUAL REPRICING DATES
The exposure of the Group’s borrowings to interest rate changes and the contractual repricing dates at the reporting dates are as follows:
| | | | |
Figures in million - SA rand | | 2017 | 2016 | 2015 |
Floating rate with exposure to change in JIBAR | | 6,015.1 | 5,849.5 | 1,961.6 |
Floating rate with exposure to change in LIBOR | | 2,674.6 | 3,121.6 | 1,808.3 |
Non-current borrowings exposed to interest rate changes | | 8,689.7 | 8,971.1 | 3,769.9 |
| | | | |
The Group has the following undrawn borrowing facilities: | | | | |
Committed | | 3,652.5 | 4,322.5 | 6,198.4 |
Uncommitted | | 471.3 | 200.5 | 548.0 |
Total undrawn facilities | | 4,123.8 | 4,523.0 | 6,746.4 |
| | | | |
All of the above facilities have floating rates. The undrawn | | | | |
committed facilities have the following expiry dates: | | | | |
– within one year | | 3,188.9 | - | 1,536.4 |
– later than one year and not later than two years | | 463.6 | 3,422.5 | - |
– later than two years and not later than three years | | - | 900.0 | 4,662.0 |
Total undrawn committed facilities | | 3,652.5 | 4,322.5 | 6,198.4 |
| |
Sibanye-Stillwater | Form 20-F 2017 | 204 |
Table of Contents
NOTES TO THE CONSOLIDATED FINANCIAL STATEMENTS continued
FOR THE YEAR ENDED 31 DECEMBER 2017
24.10 CAPITAL MANAGEMENT
The Group’s primary objective with regards to managing its capital is to ensure that there is sufficient capital available to support the funding requirements of the Group, including capital expenditure, in a way that: optimises the cost of capital; maximises shareholders’ returns; and ensures that the Group remains in a sound financial position.
The Group manages and makes adjustments to the capital structure as and when borrowings mature or as and when funding is required. This may take the form of raising equity, market or bank debt or hybrids thereof. Opportunities in the market are also monitored closely to ensure that the most efficient funding solutions are implemented.
The Group monitors capital using the ratio of net debt to adjusted EBITDA (earnings before interest, taxes, depreciation and amortization), but does not set absolute limits for this ratio.
Net debt to adjusted EBITDA at 31 December 2017 of 2.6 exceeds the Group’s targeted ratio of net debt to adjusted EBITDA of 1.0:1 or lower. Utilising the committed unutilised debt facilities above, will impact on the leverage ratio. The borrowing facilities, permit a leverage ratio of 3.5:1 through to 31 December 2018, and 2.5:1 thereafter, calculated on a quarterly basis. Sibanye-Stillwater plans to deleverage over time back to its targeted leverage ratio of no greater than 1.0:1.
| | | | |
| | | Revised | Revised |
Figures in million - SA rand | Notes | 2017 | 2016 | 2015 |
Borrowings1 | 24 | 25,205.5 | 7,221.2 | 1,995.3 |
Cash and cash equivalents2 | 21 | 2,029.8 | 928.4 | 633.4 |
Net debt3 | | 23,175.7 | 6,292.8 | 1,361.9 |
Adjusted EBITDA4 | | 9,045.1 | 10,270.4 | 6,234.8 |
Net debt to adjusted EBITDA (ratio)5 | | 2.6 | 0.6 | 0.2 |
1 Borrowings are only those borrowings that have recourse to Sibanye-Stillwater. Borrowings, therefore, exclude the Burnstone Debt and include the derivative financial instrument.
2 Cash and cash equivalents exclude cash of Burnstone.
3 Net debt represents borrowings and bank overdraft less cash and cash equivalents. Borrowings are only those borrowings that have recourse to Sibanye-Stillwater and therefore exclude the Burnstone Debt and include the derivative financial instrument. Net debt excludes cash of Burnstone.
4 The adjusted EBITDA calculation included is based on the formula included in the facility agreements for compliance with the debt covenant formula. Adjusted EBITDA may not be comparable to similarly titled measures of other companies. Adjusted EBITDA is not a measure of performance under IFRS and should be considered in addition to, and not as a substitute for, other measures of financial performance and liquidity.
5 Net debt to adjusted EBITDA ratio is defined as net debt as at the end of a reporting period divided by adjusted EBITDA of the 12 months ended on the same reporting date.
Reconciliation of (loss)/profit before royalties and tax to adjusted EBITDA:
| | | | |
| | | Revised | |
Figures in million - SA rand | | 2017 | 2016 | 2015 |
(Loss)/profit before royalties and tax | | (6,981.2) | 4,811.4 | 1,316.0 |
Adjusted for: | | | | |
Amortisation and depreciation | | 5,699.7 | 4,041.9 | 3,636.6 |
Interest income | | (415.5) | (331.4) | (257.0) |
Finance expense | | 2,971.8 | 903.1 | 561.8 |
Share-based payments | | 231.9 | 496.2 | 274.4 |
Loss on financial instruments | | 1,114.4 | 1,032.8 | 229.5 |
(Gain)/loss on foreign exchange differences | | (292.4) | (219.6) | 359.4 |
Share of results of equity-accounted investees after tax | | (291.6) | (13.3) | (116.0) |
Change in estimate of environmental rehabilitation obligation,
and right of recovery receivable and payable | | 248.9 | 97.5 | - |
Gain on disposal of property, plant and equipment | | (40.7) | (95.4) | (58.7) |
Impairments | | 4,411.0 | 1,381.1 | - |
Occupational healthcare expense | | 1,106.9 | - | - |
Restructuring costs | | 729.8 | 187.7 | 104.8 |
Transaction costs | | 552.1 | 157.0 | 25.7 |
Gain on acquisition | | - | (2,178.6) | - |
Net loss on derecognition of financial guarantee asset and liability | | - | - | 158.3 |
Adjusted EBITDA | | 9,045.1 | 10,270.4 | 6,234.8 |
25. ENVIRONMENTAL REHABILITATION OBLIGATION
SIGNIFICANT ACCOUNTING JUDGEMENTS AND ESTIMATES
The Group’s mining and exploration activities are subject to various laws and regulations governing the protection of the environment. The Group recognises management’s best estimate for asset retirement obligations in the period in which they are incurred. Actual costs incurred in future periods could differ materially from the estimates. Additionally, future changes to environmental laws and regulations, life of mine estimates and discount rates could affect the carrying amount of this provision.
| |
Sibanye-Stillwater | Form 20-F 2017 | 205 |
Table of Contents
NOTES TO THE CONSOLIDATED FINANCIAL STATEMENTS continued
FOR THE YEAR ENDED 31 DECEMBER 2017
ACCOUNTING POLICY
Provisions are recognised when the Group has a present obligation, legal or constructive resulting from past events and it is probable that an outflow of resources embodying economic benefits will be required to settle the obligation and a reliable estimate can be made of the amount of the obligation.
Long-term environmental obligations are based on the Group’s environmental management plans, in compliance with applicable environmental and regulatory requirements.
The estimated costs of rehabilitation are reviewed annually and adjusted as appropriate for changes in legislation, technology or other circumstances. Cost estimates are not reduced by the potential proceeds from the sale of assets or from plant clean up at closure.
Based on disturbances to date, the net present value of expected rehabilitation cost estimates is recognised and provided for in full in the financial statements. The estimates are reviewed annually and are discounted using a risk-free rate that is adjusted to reflect the current market assessments of the time value of money and the risks specific to the obligation.
Annual changes in the provision consist of finance costs relating to the change in the present value of the provision and inflationary increases in the provision estimate, as well as changes in estimates. Changes in estimates are capitalised or reversed against the relevant asset to the extent that it meets the definition of dismantling and removing the item and restoring the site on which it is located. Costs that relate to an existing condition caused by past operations and do not have a future economic benefit are recognised in profit or loss. If a decrease in the liability exceeds the carrying amount of the asset, the excess is recognised immediately in profit or loss. The present value of environmental disturbances created are capitalised to mining assets against an increase in the environmental rehabilitation obligation.
Rehabilitation projects undertaken, included in the estimates are charged to the provision as incurred. The cost of ongoing current programmes to prevent and control environmental disturbances is charged against income as incurred. The unwinding of the discount due to the passage of time is recognised as finance cost, and the capitalised cost is amortised over the remaining lives of the mines.
| | | | |
Figures in million - SA rand | Notes | 2017 | 2016 | 2015 |
Balance at beginning of the year | | 3,982.2 | 2,411.0 | 2,486.8 |
Interest charge1 | 5 | 357.1 | 291.4 | 197.9 |
Payment of environmental rehabilitation obligation2 | | (26.9) | - | (0.3) |
Change in estimates charged to profit or loss | 7 | 248.9 | 97.5 | - |
Change in estimates capitalised3 | 12 | (177.7) | 472.5 | (273.4) |
Environmental rehabilitation obligation on acquisition of subsidiaries | 13 | 312.1 | 709.8 | - |
Foreign currency translation | | (17.0) | - | - |
Balance at end of the year | | 4,678.7 | 3,982.2 | 2,411.0 |
1 The provision is calculated based on the discount rates of 7.2% – 9.7% (2016: 7.8% - 9.7% and 2015: 8.5% - 10.2%).
2 The cost of ongoing current programmes to prevent and control environmental disturbances, including reclamation activities, is charged to cost of sales as incurred.
3 Changes in estimates are defined as changes in reserves and corresponding changes in life of mine, changes in discount rates, and changes in laws and regulations governing environmental matters. In 2016 the environmental rehabilitation obligation acquired was calculated based on the weighted average cost of capital in terms of IFRS 3 for acquisition purposes. Subsequent to initial recognition the provision was recalculated based on the risk free rate of interest in terms of IAS 37 Provisions, Contingent Liabilities and Contingent Assets. The resulting change in estimate during 2016 was R157.4 million and R197.6 million related to Aquarius and the Rustenburg operations, respectively.
The Group’s mining operations are required by law to undertake rehabilitation works as part of their ongoing operations. The Group makes contributions into environmental rehabilitation obligation funds (refer to note 17) and holds guarantees to fund the estimated costs.
POST CLOSURE WATER MANAGEMENT LIABILITY
The Group has identified a risk of potential long-term Acid Mine Drainage (AMD) and other groundwater pollution issues which are also being experienced by peer mining groups. AMD relates to the acidification and contamination of naturally occurring water resources by pyrite-bearing ore contained in underground mines and in rock dumps, tailings dams and pits on the surface. The Group has not been able to reliably determine the financial impact that AMD and ground water pollution might have on the Group, nor the timing of possible out flow, however, the Group has adopted a proactive approach by initiating projects which include understanding the mining impacts on the catchments within which the Group operates, the Sibanye Amanzi (long-term water management strategy), the refinement of innovative treatment technologies and the development of regional mine closure models to predict water quality impacts. The Group operates a comprehensive water quality monitoring program, including bio-monitoring, as an early detection of potential AMD.
No adjustment for the effects that may result from AMD and other groundwater pollution issues, if any, have been made in the consolidated financial statements other than in the environmental rehabilitation obligation.
26. OCCUPATIONAL HEALTHCARE OBLIGATION
SIGNIFICANT ACCOUNTING JUDGEMENTS AND ESTIMATES
The Group recognises management’s best estimates to settle any occupational healthcare claims against the Group’s operations. The ultimate outcome of these matters remains uncertain, with a possible failure to reach a settlement or to obtain the requisite court approval for a potential settlement. The provision is consequently subject to adjustment in the future, depending on the progress of the Occupational Lung Disease Group (the Working Group) discussions, stakeholder engagements and the ongoing legal proceedings. Actual costs incurred in future periods could differ materially from the estimates.
Estimates that were used in the assessment include value of benefits, required contributions, timing of payments, tracing pattern, period discount rates, period inflation rates and a 60% take-up rate. These estimates were informed by a professional opinion.
| |
Sibanye-Stillwater | Form 20-F 2017 | 206 |
Table of Contents
NOTES TO THE CONSOLIDATED FINANCIAL STATEMENTS continued
FOR THE YEAR ENDED 31 DECEMBER 2017
ACCOUNTING POLICY
Provisions are recognised when the Group has a present obligation, legal or constructive resulting from past events and it is probable that an outflow of resources embodying economic benefits will be required to settle the obligation and a reliable estimate can be made of the amount of the obligation.
The estimated costs of settlement claims are reviewed at least annually and adjusted as appropriate for changes in cash flow predictions or other circumstances.
Based on estimates to date, the net present value of expected settlement claims is recognised and provided for in full in the financial statements. The estimated cash flows are discounted using a risk-free rate with similar terms to the obligation to reflect the current market assessments of the time value of money.
Annual changes in the provision consist of finance costs relating to the change in the present value of the provision and changes in estimates.
As a result of the ongoing work of the Working Group, engagements with affected stakeholders since 31 March 2017 and the likely settlement, at 30 June 2017 it became possible for Sibanye-Stillwater to reasonably estimate its share of the estimated cost in relation to the Working Group of a possible settlement of the class action claims and related costs. As a result, Sibanye-Stillwater provided an amount of R1,077.2 million for this obligation in the statement of financial position. The estimated costs were reviewed at 31 December 2017 and discounted using a risk-free rate. A change in estimate of R29.7 million was recognised in profit or loss.
| | | | |
Figures in million - SA rand | Note | 2017 | 2016 | 2015 |
Occupational healthcare obligation recognised | | 1,077.2 | - | - |
Interest charge | 5 | 46.4 | - | - |
Change in estimate charge to profit or loss | | 29.7 | - | - |
Balance at the end of the year | | 1,153.3 | - | - |
Reconciliation of the non-current and current portion of the occupational healthcare obligation: | | | |
Occupational healthcare obligation | | 1,153.3 | - | - |
Current portion of occupational healthcare obligation | | (0.8) | - | - |
Non-current portion of occupational healthcare obligation | | 1,152.5 | - | - |
27. TRADE AND OTHER PAYABLES
ACCOUNTING POLICY
Trade and other payables are recognised initially at fair value and subsequently measured at amortised cost using the effective interest method.
Provision is made for employee entitlement benefits accumulated as a result of employees rendering services up to the reporting date. Liabilities arising in respect of wages and salaries, annual leave and other benefits due to be settled within 12 months of the reporting date are measured at rates which are expected to be paid when the liability is settled. Termination benefits are expensed at the earlier of when the Group can no longer withdraw the offer of those benefits and when the Group recognises costs for a restructuring. If benefits are not expected to be settled wholly within 12 months of the reporting date, then they are discounted.
All other employee entitlement liabilities are measured at the present value of estimated payments to be made in respect of services rendered up to reporting date.
| | | | |
Figures in million - SA rand | | 2017 | 2016 | 2015 |
Trade creditors | | 1,728.1 | 1,121.3 | 508.7 |
Accruals and other creditors | | 2,380.6 | 1,971.4 | 873.3 |
Payroll creditors | | 1,253.5 | 867.7 | 797.8 |
Leave pay accrual | | 1,160.5 | 1,110.7 | 553.8 |
Other | | 167.7 | 109.4 | 25.8 |
Total trade and other payables | | 6,690.4 | 5,180.5 | 2,759.4 |
| |
Sibanye-Stillwater | Form 20-F 2017 | 207 |
Table of Contents
NOTES TO THE CONSOLIDATED FINANCIAL STATEMENTS continued
FOR THE YEAR ENDED 31 DECEMBER 2017
28. CASH GENERATED BY OPERATIONS
| | | | |
| | | Revised | |
Figures in million - SA rand | Notes | 2017 | 2016 | 2015 |
(Loss)/profit for the year | | (4,433.1) | 3,042.7 | 538.2 |
Royalties | 9.1 | 398.5 | 566.6 | 400.6 |
Mining and income tax | 9.2 | (2,946.6) | 1,202.1 | 377.2 |
Interest income | | (415.5) | (331.4) | (257.0) |
Finance expense | 5 | 2,971.8 | 903.1 | 561.8 |
(Loss)/profit before interest, royalties and tax | | (4,424.9) | 5,383.1 | 1,620.8 |
Non-cash and other adjusting items: | | | | |
Amortisation and depreciation | 4 | 5,699.7 | 4,041.9 | 3,636.6 |
Share-based payments | 6 | 231.9 | 496.2 | 274.4 |
Loss on financial instruments | | 764.0 | 1,094.6 | 229.5 |
(Gain)/loss on foreign exchange differences | | (546.8) | (418.0) | 420.1 |
Share of results of equity-accounted investees after tax | 15 | (291.6) | (13.3) | (116.0) |
Impairments | 8 | 4,411.0 | 1,381.1 | - |
Occupational healthcare expense | 26 | 1,106.9 | - | - |
Gain on acquisition | | - | (2,178.6) | - |
Net loss on derecognition of financial guarantee asset and liability | | - | - | 158.3 |
Other | | 147.7 | 49.3 | (93.3) |
Total cash generated by operations | | 7,097.9 | 9,836.3 | 6,130.4 |
29. CHANGE IN WORKING CAPITAL
| | | | |
Figures in million - SA rand | | 2017 | 2016 | 2015 |
Inventories | | (937.7) | (35.5) | (78.2) |
Trade and other receivables | | (214.9) | (220.0) | (634.6) |
Trade and other payables | | 630.3 | 17.9 | 44.8 |
Total change in working capital | | (522.3) | (237.6) | (668.0) |
30. FAIR VALUE OF FINANCIAL ASSETS AND FINANCIAL LIABILITIES, AND RISK MANAGEMENT
ACCOUNTING POLICY
Financial instruments recognised in the statement of financial position include cash and cash equivalents, trade and other receivables, borrowings, derivative financial instrument and trade and other payables.
The Group initially recognises loans and receivables on the date these originate. All other financial assets (including assets designated at fair value through profit or loss) are recognised initially on trade date, which is the date that the Group becomes a party to the contractual provisions of the instrument. The Group derecognises a financial asset when the contractual rights to the cash flows in a transaction in which substantially all the risks and rewards of the ownership of the financial asset are transferred. The Group derecognises a financial liability when its contractual obligations are discharged, cancelled or expired. Any interest in such transferred financial asset that is created or retained by the Group is recognised as a separate asset or liability. The particular recognition and measurement methods adopted are disclosed in the individual policy statements associated with each item.
A financial asset not classified at fair value through profit or loss is assessed at each reporting date to determine whether there is objective evidence that it is impaired. A financial asset is impaired if there is objective evidence of impairment as a result of one or more events that occurred after the initial recognition of the asset and those event(s) had an impact on the estimated future cash flows of that asset, that can be estimated reliably. Impairment losses are recognised through profit or loss.
On derecognition of a financial asset or liability, the difference between the carrying amount of the asset or liability and the sum of the consideration received and cumulative gains recognised in equity is recognised in profit or loss.
Refer to the relevant notes for the accounting policies of the following financial assets and financial liabilities:
| · | | Environmental rehabilitation obligation funds |
| · | | Other receivables and other payables |
| · | | Trade and other receivables |
| · | | Cash and cash equivalents |
| · | | Derivative financial instrument |
| · | | Trade and other payables |
| |
Sibanye-Stillwater | Form 20-F 2017 | 208 |
Table of Contents
NOTES TO THE CONSOLIDATED FINANCIAL STATEMENTS continued
FOR THE YEAR ENDED 31 DECEMBER 2017
30.1 ACCOUNTING CLASSIFICATIONS AND MEASUREMENT OF FAIR VALUES
The following methods and assumptions were used to estimate the fair value of each class of financial instrument:
| · | | Trade and other receivables/payables, and cash and cash equivalents |
The carrying amounts approximate fair values due to the short maturity of these instruments.
| · | | Investments and environmental rehabilitation obligation funds |
The fair value of publicly traded instruments is based on quoted market values. The environmental rehabilitation obligation funds are stated at fair value based on the nature of the funds’ investments.
The fair value of borrowings approximates its carrying amounts as the impact of credit risk is included in the measurement of carrying amounts.
The fair value of financial instruments is estimated based on ruling market prices, volatilities and interest rates. All derivatives are carried on the statement of financial position at fair value.
The Group uses the following hierarchy for determining and disclosing the fair value of financial instruments:
| · | | Level 1: unadjusted quoted prices in active markets for identical asset or liabilities; |
| · | | Level 2: inputs other than quoted prices in level 1 that are observable for the asset or liability, either directly (as prices) or indirectly (derived from prices); and |
| · | | Level 3: inputs for the asset or liability that are not based on observable market data (unobservable inputs). |
The following tables set out the Group's significant financial instruments measured at fair value by level within the fair value hierarchy:
| | | | | | | | |
| Carrying value | Fair Value |
Figures in million - SA rand | Fair value through profit or loss | Loans and other receivables | Other financial liabilities | Total | Level 1 | Level 2 | Level 3 | Total |
31 December 2017 | | | | | | | | |
Financial assets | | | | | | | | |
Measured at fair value: | | | | | | | | |
- Environmental rehabilitation obligation funds1 | 3,492.4 | - | - | 3,492.4 | 3,117.6 | 374.8 | - | 3,492.4 |
- Trade receivables - PGM sales | 4,512.4 | - | - | 4,512.4 | 4,512.4 | - | - | 4,512.4 |
Not measured at fair value: | | | | | | | | |
- Other receivables2 | - | 319.2 | - | 319.2 | | | | |
Financial liabilities | | | | | | | | |
Not measured at fair value: | | | | | | | | |
- Other payables2 | - | - | (3,760.4) | (3,760.4) | | | | |
- Borrowings | - | - | (25,649.5) | (25,649.5) | | | | |
Measured at fair value: | | | | | | | | |
- Derivative financial instrument3 | (1,093.5) | - | - | (1,093.5) | | (1,093.5) | | (1,093.5) |
31 December 2016 | | | | | | | | |
Financial assets | | | | | | | | |
Measured at fair value: | | | | | | | | |
- Environmental rehabilitation obligation funds1 | 3,100.5 | - | - | 3,100.5 | 2,630.6 | 469.9 | - | 3,100.5 |
- Trade receivables - PGM sales | 4,001.9 | - | - | 4,001.9 | 4,001.9 | - | - | 4,001.9 |
Not measured at fair value: | | | | | | | | |
- Other receivables2 | - | 665.9 | - | 665.9 | | | | |
Financial liabilities | | | | | | | | |
Not measured at fair value: | | | | | | | | |
- Other payables2 | - | - | (1,613.7) | (1,613.7) | | | | |
- Borrowings | - | - | (8,973.8) | (8,973.8) | | | | |
1 Environmental rehabilitation obligation funds comprises interest-bearing short-term investments valued using quoted market prices.
2 Other receivables and other payables are initially recognised at fair value. The non-recurring fair value measurement is a level 3 measurement as per the fair value hierarchy.
3 The derivative financial instrument is recognised at fair value and valued using option pricing methodologies based on observable quoted inputs.
30.2 RISK MANAGEMENT ACTIVITIES
In the normal course of its operations, the Group is exposed to market risks, including commodity price, foreign currency, interest rate, liquidity and credit risk associated with underlying assets, liabilities and anticipated transactions. In order to manage these risks, the Group has developed a comprehensive risk management process to facilitate control and monitoring of these risks.
| |
Sibanye-Stillwater | Form 20-F 2017 | 209 |
Table of Contents
NOTES TO THE CONSOLIDATED FINANCIAL STATEMENTS continued
FOR THE YEAR ENDED 31 DECEMBER 2017
CONTROLLING AND MANAGING RISK IN THE GROUP
Sibanye-Stillwater has policies in areas such as counterparty exposure, hedging practices and prudential limits which have been approved by Sibanye-Stillwater’s Board of Directors (the Board). Management of financial risk is centralised at Sibanye-Stillwater's treasury department (Treasury), which acts as the interface between Sibanye-Stillwater’s Operations and counterparty banks. Treasury manages financial risk in accordance with the policies and procedures established by the Board and executive committee.
The Board has approved dealing limits for money market, foreign exchange and commodity transactions, which Treasury is required to adhere to. Among other restrictions, these limits describe which instruments may be traded and demarcate open position limits for each category as well as indicating counterparty credit-related limits. The dealing exposure and limits are checked and controlled each day and reported to the CFO.
The objective of Treasury is to manage all financial risks arising from the Group’s business activities in order to protect profit and cash flows. Treasury activities of Sibanye-Stillwater and its subsidiaries are guided by the Treasury Policy, the Treasury Framework as well as domestic and international financial market regulations. Treasury activities are currently performed within the Treasury Framework with appropriate resolutions from the Board, which are reviewed and approved annually by the Audit Committee.
The financial risk management objectives of the Group are defined as follows:
| · | | Liquidity risk management: the objective is to ensure that the Group is able to meet its short-term commitments through the effective and efficient management of cash and usage of credit facilities. |
| · | | Currency risk management: the objective is to maximise the Group’s profits by minimising currency fluctuations. |
| · | | Funding risk management: the objective is to meet funding requirements timeously and at competitive rates by adopting reliable liquidity management procedures. |
| · | | Investment risk management: the objective is to achieve optimal returns on surplus funds. |
| · | | Interest rate risk management: the objective is to identify opportunities to prudently manage interest rate exposures. |
| · | | Counterparty exposure: the objective is to only deal with approved counterparts that are of a sound financial standing and who have an official credit rating. The Group is limited to a maximum investment of 2.5% of the financial institutions’ equity, which is dependent on the institutions’ credit rating. The credit rating used is Fitch Ratings’ short-term credit rating for financial institutions. |
| · | | Commodity price risk management: commodity risk management takes place within limits and with counterparts as approved in the treasury framework. |
CREDIT RISK
Credit risk represents risk that an entity will suffer a financial loss due to the other party of a financial instrument not discharging its obligation.
The Group has reduced its exposure to credit risk by dealing with a number of counterparties. The Group approves these counterparties according to its risk management policy and ensures that they are of good credit quality.
The carrying value of the financial assets represents the combined maximum credit risk exposure of the group.
Trade receivables are reviewed on a regular basis and an allowance for impairment is raised when they are not considered recoverable. Trade receivables comprise banking institutions purchasing commodities. These receivables are currently in a sound financial position and no impairment has been recognised.
Receivables that are past due but not impaired total R9.0 million (2016: R11.7 million and 2015: R5.4 million). At 31 December 2017, receivables of R5.7 million (2016: R2.6 million and 2015: R1.9 million) are considered impaired and are provided for.
Concentration of credit risk on cash and cash equivalents and non-current assets is considered minimal due to the abovementioned investment risk management and counterparty exposure risk management policies.
LIQUIDITY RISK
In the ordinary course of business, the Group receives cash proceeds from its operations and is required to fund working capital and capital expenditure requirements. The cash is managed to ensure surplus funds are invested to maximise returns whilst ensuring that capital is safeguarded to the maximum extent possible by investing only with top financial institutions.
Uncommitted borrowing facilities are maintained with several banking counterparties to meet the Group’s normal and contingency funding requirements.
| |
Sibanye-Stillwater | Form 20-F 2017 | 210 |
Table of Contents
NOTES TO THE CONSOLIDATED FINANCIAL STATEMENTS continued
FOR THE YEAR ENDED 31 DECEMBER 2017
The following are contractually due, undiscounted cash flows resulting from maturities of financial liabilities including interest payments:
| | | | |
Figures in million - SA rand | Total | Within one
year | Between
one and
five years | After five years |
31 December 2017 | | | | |
Trade and other payables | 5,529.9 | 5,529.9 | - | - |
Borrowings | | | | |
- Capital | | | | |
R6.0 billion revolving credit facility | 5,536.4 | - | 5,536.4 | - |
US$350 million revolving credit facility | 1,137.1 | 1,137.1 | - | - |
US$1.05 billion Bond | 12,978.0 | - | - | 12,978.0 |
US$450 million Convertible Bond | 5,562.0 | - | - | 5,562.0 |
Burnstone Debt | 2,102.4 | - | 96.2 | 2,006.2 |
Other borrowings | 478.7 | 478.7 | - | - |
Franco-Nevada liability | 1.7 | 1.7 | - | - |
Stillwater Convertible Debentures | 3.3 | 3.3 | - | - |
- Interest | 9,231.5 | 1,632.3 | 4,672.2 | 2,927.0 |
Total | 42,561.0 | 8,783.0 | 10,304.8 | 23,473.2 |
31 December 2016 | | | | |
Trade and other payables | 4,069.8 | 4,069.8 | - | - |
Borrowings | | | | |
- Capital | | | | |
R6.0 billion revolving credit facility | 5,100.0 | - | 5,100.0 | - |
US$350 million revolving credit facility | 1,369.0 | - | 1,369.0 | - |
Burnstone Debt | 2,338.8 | - | 106.6 | 2,232.2 |
Other borrowings | 749.5 | 749.5 | - | - |
Franco-Nevada liability | 2.7 | 2.7 | - | - |
- Interest | 1,443.2 | - | 312.9 | 1,130.3 |
Total | 15,073.0 | 4,822.0 | 6,888.5 | 3,362.5 |
Working capital and going concern assessment
For the year ended 31 December 2017, the Group incurred a loss of R4,433.1 million (2016: profit of R3,042.7 million). As at 31 December 2017, the Group’s current assets exceeded its current liabilities by R3,566.7 million (2016: R1,446.6 million) and during the year then ended the Group generated cash from operating activities of R2,740.7 million (2016: R4,405.5 million).
Gold and PGMs are sold in US dollars, and while the majority of the Group’s gold and a substantial amount of the Group’s PGMs costs are denominated in rand, the Group’s results and financial condition may be impacted if there is a material change in the value of the rand.
Subsequent to year end, the average rand/US dollar exchange rate strengthened to R11.68/US$ from the average exchange rate of R13.31/US$ for the year ended 31 December 2017. Management has performed various sensitivities relating to the rand/US dollar exchange rate and the impact on the rand commodity prices. Should a strong rand/US dollar exchange rate persist without a corresponding gain in commodity prices, the Group could consider increasing operational flexibility by adjusting mine plans, reducing capital expenditure and/or selling assets. The Group may also, if necessary, consider options to increase funding flexibility which may include, among others, streaming facilities, prepayment facilities, facility restructuring or, in the event that other options are not deemed preferable or achievable by the Board, an equity capital raise.
The Group currently has committed undrawn debt facilities of R3,653 million at 31 December 2017. In order to maintain adequate liquidity, the refinancing and upsizing of the US$350 million RCF, maturing on 23 August 2018, to US$600 million, has been initiated. The facility has been fully syndicated with a group of eight international banks having provided commitment letters. The facility documentation is expected to be executed by the end of March 2018. The terms and conditions largely mirror the current US$350 million RCF which is US$92 million drawn as at 31 December 2017. On successful completion an additional US$250 million (approximately R3,000 million) of committed unutilised financing would be available.
Sibanye-Stillwater’s leverage ratio (or net debt to adjusted EBITDA) at 31 December 2017 is 2.6. Using the committed unutilised debt facilities could impact on the leverage ratio if used to fund operating losses. As indicated above, management have significant operational and financing flexibility and will continue to manage the operations and capital structure to ensure compliance with debt covenants. The borrowing facilities, permit a leverage ratio of 3.5:1 through to 31 December 2018, and 2.5:1, thereafter, calculated on a quarterly basis. Consistent with its long-term strategy, Sibanye-Stillwater plans to deleverage over time to its targeted leverage ratio of no greater than 1.0:1.
The directors believe that the cash generated by its operations, cash on hand, the committed unutilised debt facilities as well as additional funding opportunities will enable the Group to continue to meet its obligations as they fall due. The consolidated financial statements for the year ended 31 December 2017, therefore, have been prepared on a going concern basis.
MARKET RISK
The Group is exposed to market risks, including foreign currency, commodity price and interest rate risk associated with underlying assets, liabilities and anticipated transactions. Following periodic evaluation of these exposures, the Group may enter into derivative financial instruments to manage some of these exposures (refer to sensitivity analysis further in this note).
| |
Sibanye-Stillwater | Form 20-F 2017 | 211 |
Table of Contents
NOTES TO THE CONSOLIDATED FINANCIAL STATEMENTS continued
FOR THE YEAR ENDED 31 DECEMBER 2017
SENSITIVITY ANALYSIS
The sensitivity analysis shows the effects of reasonable possible changes of relevant risk variables on profit or loss or shareholders’ equity. The Group is exposed to commodity price, currency and interest rate risks. The effects are determined by relating the reasonable possible change in the risk variable to the balance of financial instruments at period end date.
The amounts generated from the sensitivity analyses are forward-looking estimates of market risks assuming certain adverse or favourable market conditions occur. Actual results in the future may differ materially from those projected results and therefore should not be considered a projection of likely future events and gains/losses.
Foreign currency sensitivity
General and policy
In the ordinary course of business, the Group enters into transactions, such as gold sales and PGM sales, denominated in foreign currencies, primarily US dollar. Although this exposes the Group to transaction and translation exposure from fluctuations in foreign currency exchange rates, the Group does not generally hedge this exposure, although it could be considered for significant expenditures based in foreign currency or those items which have long lead times to produce or deliver. Also, the Group on occasion undertakes currency hedging to take advantage of favourable short-term fluctuations in exchange rates when management believes exchange rates are at unsustainably high levels.
Currency risk only exists on account of financial instruments being denominated in a currency that is not the functional currency and being of a monetary nature. This includes but is not limited to US$350 million RCF (refer to note 24.2), US$450 million Convertible Bond (refer to note 24.4), Burnstone Debt (refer to note 24.6) and Franco-Nevada liability.
Foreign currency economic hedging experience
As at 31 December 2017, 2016 and 2015 there were no material foreign currency contract positions. As of 23 March 2018, there were no material foreign currency positions.
During May 2017, the Group entered into a various forward exchange contract to acquire US$779.1 million at R13.23/US$ on 15 June 2017 with the proceeds of the rights offer (refer to note 22) to partially repay the Stillwater Bridge facility (refer to note 24.7). The exchange rate on 15 June 2017 was R12.89/US$ and the Group recognised a loss on financial instruments of R283.2 million. During 2016 and 2015, no forward cover was taken out to cover various commitments of Sibanye-Stillwater’s operations.
Foreign currency sensitivity analysis
Sibanye-Stillwater’s operations are all located in South Africa except for Stillwater and Mimosa, which are located in the United States and Zimbabwe, respectively, and its revenues are equally sensitive to changes in the US dollar gold price and the rand/US dollar exchange rate (the exchange rate). Depreciation of the rand against the US dollar results in Sibanye-Stillwater’s revenues and operating margin increasing. Conversely, should the rand appreciate against the US dollar, revenues and operating margins would decrease. The impact on profitability of any change in the exchange rate can be substantial. Furthermore, the exchange rates obtained when converting US dollars to rand are set by foreign exchange markets over which Sibanye-Stillwater has no control. The relationship between currencies and commodities, which includes the gold price, is complex and changes in exchange rates can influence commodity prices and vice versa.
Certain of the Group’s US dollar borrowing facilities have been drawn down by Companies with SA Rand as their functional currency, therefore some of the Groups borrowings are sensitive to changes in the rand/US dollar exchange rate. A one percentage point depreciation in the SA rand closing exchange rate of R12.36/US$ (2016: R13.69/US$ and 2015: R15.54/US$) would have reduced the gain on foreign exchange differences by R81.2 million (2016: R31.2 million and 2015: R18.4 million). A one percentage point appreciation in the exchange rate would have increased the gain on foreign exchange differences by R81.2 million (2016: R31.2 million and 2015: R18.4 million).
The SA region’s revenue is sensitive to changes in the exchange rate, and the Group’s earnings are sensitive to changes in the exchange rate when translating the US regions earnings from its functional currency to the Group’s reporting currency. A one percentage point depreciation in the SA rand average exchange rate for the year ended 31 December 2017 of R13.31/US$ would have increased adjusted EBITDA by approximately R388.9 million. . A one percentage point appreciation in the SA rand average exchange rate for the year ended 31 December 2017 of R13.31/US$ would have decreased adjusted EBITDA by approximately R388.9 million.
A sensitivity analysis of the mark-to-market valuation has not been performed as there were no material foreign currency contracts as of 23 March 2018.
Commodity price sensitivity
The market price of commodities has a significant effect on the results of operations of the Group and the ability of the Group to pay dividends and undertake capital expenditures. The gold and PGM basket prices has historically fluctuated widely and is affected by numerous industry factors over which the Group does not have any control. The aggregate effect of these factors on the gold and PGM basket prices, all of which are beyond the control of the Group, is impossible for the Group to predict.
The Deferred Payment (refer to note 18.2) and Share based payment on BEE transaction (refer to note 6.4 and 6.5) is sensitive to changes in the Rustenburg operations’ 4E basket price. A one percentage point decrease in the R/4Eoz of the Rustenburg operations’ 4E basket price would have decreased the loss on financial instruments by R61.0 million. A one percentage point increase in the R/4Eoz of the Rustenburg operations’ 4E basket price would have increased the loss on financial instruments by R61.0 million.
| |
Sibanye-Stillwater | Form 20-F 2017 | 212 |
Table of Contents
NOTES TO THE CONSOLIDATED FINANCIAL STATEMENTS continued
FOR THE YEAR ENDED 31 DECEMBER 2017
Commodity price hedging policy
As a general rule, the Group does not enter into forward sales, derivatives or other hedging arrangements to establish a price in advance for future gold and PGM production. Commodity hedging could, however, be considered in future under one or more of the following circumstances: to protect cash flows at times of significant capital expenditure; financing projects or to safeguard the viability of higher cost operations.
To the extent that it enters into commodity hedging arrangements, the Group seeks to use different counterparty banks consisting of local and international banks to spread risk. None of the counterparties is affiliated with, or related to parties of the Group.
Commodity price hedging experience
During December 2017, Sibanye-Stillwater entered into the following sale of gold forward agreements to:
| · | | sell forward 17,843 ounces of Cooke’s gold effective from 1 December 2017 to 24 December 2017 at an average price of R19,700/oz.; and |
| · | | sell forward 115,740 ounces of Driefontein, Kloof and Beatrix’s gold effective from 1 January 2018 to 28 December 2018 at an average price of R17,530/oz. |
Commodity price contract position
As of 31 December 2016, 2015 and 2014, Sibanye-Stillwater had no outstanding commodity price contracts.
Interest rate sensitivity
General
The Group’s income and operating cash flows are dependent of changes in market interest rates. The Group’s interest rate risk arises from long-term borrowings.
As at 31 December 2017, the Group’s total borrowings amounted to R25,649.5 million (2016: R8,973.8 million and 2015: R3,803.6 million). The Group generally does not undertake any specific action to cover its exposure to interest rate risk, although it may do so in specific circumstances. Refer to note 24 for all the borrowings and the relevant interest rates per facility.
The portion of Sibanye-Stillwater’s interest-bearing borrowings at period end that is exposed to interest rate fluctuations is R25,644.5 million (2016: R8,971.1 million and 2015: R3,769.9 million). This debt is normally rolled for periods between one and three months and is therefore exposed to the rate changes in this period.
At 31 December 2017, of the total borrowings, R6,015.1 million (2016: R5,849.5 million and 2015: R 1,961.6 million) is exposed to changes in the JIBAR rate and R2,674.6 million (2016: R3,121.6 million and 2015: R1,808.3 million) is exposed to changes in the LIBOR rate. The relevant interest rates for each facility are described in note 24.
The table below summarises the effect of a change in finance expense on the Group’s profit or loss had JIBAR and LIBOR differed as indicated. The analysis is based on the assumption that the applicable interest rate increased/decreased with all other variables held constant. All financial instruments with fixed interest rates that are carried at amortised cost are not subject to the interest rate sensitivity analysis.
Interest rate sensitivity analysis
| | | | | | | | |
| | | Change in interest expenses for a change in interest rate1 |
Figures in million - SA rand | | | -1.5% | -1.0% | -0.5% | 0.5% | 1.0% | 1.5% |
31 December 2017 | | | | | | | | |
- JIBAR | | | 83.0 | 55.4 | 27.7 | (27.7) | (55.4) | (83.0) |
- LIBOR | | | 49.5 | 33.0 | 16.5 | (16.5) | (33.0) | (49.5) |
Change in finance expense | | | 132.5 | 88.3 | 44.2 | (44.2) | (88.3) | (132.5) |
31 December 2016 | | | | | | | | |
- JIBAR | | | 45.6 | 30.4 | 15.2 | (15.2) | (30.4) | (45.6) |
- LIBOR2 | | | - | - | - | (13.6) | (27.2) | (40.8) |
Change in finance expense | | | 45.6 | 30.4 | 15.2 | (28.8) | (57.6) | (86.4) |
1 Interest rate sensitivity analysis is performed on the borrowings balance at 31 December.
2 No interest rate sensitivity analysis has been performed for a reduction in LIBOR due to LIBOR being less than 1%, a decrease in LIBOR would have no impact on the Group’s profit or loss.
| |
Sibanye-Stillwater | Form 20-F 2017 | 213 |
Table of Contents
NOTES TO THE CONSOLIDATED FINANCIAL STATEMENTS continued
FOR THE YEAR ENDED 31 DECEMBER 2017
31. COMMITMENTS
| | | | | |
Figures in million - SA rand | | | 2017 | 2016 | 2015 |
Capital expenditure | | | | | |
Authorised | | | 5,397.3 | 3,757.4 | 3,052.6 |
Kloof | | | 1,200.8 | 1,256.0 | 1,307.7 |
Driefontein | | | 724.5 | 780.4 | 725.5 |
Beatrix | | | 210.1 | 130.0 | 120.3 |
Cooke | | | 195.5 | 207.2 | 194.1 |
Burnstone | | | 445.9 | 704.0 | 705.0 |
Kroondal | | | 69.8 | 260.7 | - |
Platinum Mile | | | 72.3 | 5.0 | - |
Rustenburg operations | | | 2,478.3 | 413.0 | - |
Other | | | 0.1 | 1.1 | - |
Contracted for | | | 346.6 | 321.2 | 294.4 |
Other guarantees | | | 266.7 | 55.5 | 55.5 |
Commitments will be funded from internal sources and to the extent necessary from borrowings. This expenditure primarily relates to hostel upgrades, mining activities and infrastructure.
32. contingent liabilities
SIGNIFICANT ACCOUNTING JUDGEMENTS AND ESTIMATES
Contingencies can be either possible assets or possible liabilities arising from past events which, by their nature, will only be resolved when one or more future events not wholly within the control of the Group occur or fail to occur or for contingent liabilities where a present obligation arising from a past event exists but is not recognised because either it is not probable that an out-flow of resources embodying economic benefits will be required to settle the obligation or the amount of the obligation cannot be determined with sufficient reliability. The assessment of such contingencies inherently involves the exercise of significant judgement and estimates of the outcome of future events.
DISSENTING SHAREHOLDERS
Following the closing of the Stillwater Transaction on 4 May 2017, three Petitions for Appraisal of Stock were filed in the Chancery Court for the State of Delaware. The first action, captioned Blue Mountain Credit Alternatives Master Fund L.P. et al. vs. Stillwater Mining Company, Case No. 2017-0385-JTL, was filed 19 May 2017 on behalf of holders of a purported 4,219,523 shares of common stock of Stillwater. The second action, captioned Brigade Leveraged Capital Structures Fund Ltd. et al. vs. Stillwater Mining Company, Case No. 2017-0389-JTL, was filed 22 May 2017 on behalf of holders of a purported 1,200,000 shares of common stock of Stillwater. The third action, captioned Hillary Shane Revocable Trust, et al. vs. Stillwater Mining Company, Case No. 2017-0400-JTL, was filed 26 May 2017 on behalf of holders of a purported 384,000 shares of common stock of Stillwater.
On 29 August 2017, the three actions were consolidated into a single action, captioned In re Appraisal of Stillwater Mining Company, Case No. 2017-0385-JTL. At this point, the total number of shares of Stillwater common stock for which appraisal has been demanded and not requested to be withdrawn is approximately 5,803,623, inclusive of the shares purportedly held by Petitioners in the three appraisal actions. Each of the three appraisal actions seeks a determination of the fair value of the shares of the common stock of Stillwater under Section 262 of the General Corporation Law of the State of Delaware. Petitioners seek a judgment awarding them, among other things, the fair value of their Stillwater shares plus interest. The current case scheduling order provides for a four-day trial, commencing on 10 December 2018. The parties are currently engaged in discovery. Because the appraisal action is in the early stages, the court’s determination as to fair value of the shares is currently unknown. Accordingly, for accounting purposes only, we have used the merger price of US$18.00 per share in estimating our liability relating to the shares for which appraisal has been demanded (see note 13.1 and 17); however, fair value may ultimately be determined by the court to be equal to, or different from, the merger price.
33. RELATED-PARTY TRANSACTIONS
Sibanye-Stillwater entered into related-party transactions with Rand Refinery, and its subsidiaries during the year as detailed below. The transactions with these related parties are generally conducted with terms comparable to transactions with third parties, however in certain circumstances such as related-party loans, the transactions were not at arm’s length.
RAND REFINERY
Rand Refinery, in which Sibanye-Stillwater holds a 33.1% interest, has an agreement with the Group whereby it refines all the Group’s gold production. No dividends were received during the years ended 31 December 2017, 2016 and 2015. For the year ended 31 December 2017, the group paid refining fees to Rand Refinery and received interest.
| |
Sibanye-Stillwater | Form 20-F 2017 | 214 |
Table of Contents
NOTES TO THE CONSOLIDATED FINANCIAL STATEMENTS continued
FOR THE YEAR ENDED 31 DECEMBER 2017
The table below details the transactions and balances between the Group and its related-parties:
| | | | | |
Figures in million - SA rand | | Notes | 2017 | 2016 | 2015 |
Rand Refinery | | | | | |
Refining fees paid | | | (32.5) | (44.4) | (30.8) |
Interest income | | 15.1 | 1.5 | 40.2 | 37.3 |
Loan receivable | | 15.1 | - | 403.9 | 363.7 |
KEY MANAGEMENT REMUNERATION
The executive directors and prescribed officers were paid the following remuneration during the year:
| | | | | | | |
Figures in thousands - SA rand | Salary1 | Cash bonus accrued for the period ended
31 Dec 2017
paid in 2018 | Shares proceeds and Dividends payments | Pension scheme total contributions | Expense allowance | For the period ended 31 Dec 2017 | For the period ended 31 Dec 2016 |
Executive directors | | | | | | | |
Neal Froneman | 10,265 | 15,158 | 25,956 | 1,103 | 174 | 52,656 | 104,727 |
Charl Keyter | 5,518 | 7,775 | 9,354 | 758 | 35 | 23,440 | 26,299 |
Prescribed officers | | | | | | | |
Chris Bateman2 | 4,506 | 2,615 | - | 148 | - | 7,269 | - |
Hartley Dikgale | 3,886 | 2,176 | 5,448 | 258 | - | 11,768 | 10,849 |
Dawie Mostert | 3,683 | 2,577 | 5,289 | 495 | - | 12,044 | 11,711 |
Themba Nkosi | 3,535 | 2,372 | 686 | 276 | - | 6,869 | 2,951 |
Wayne Robinson | 4,381 | 2,328 | 2,211 | 348 | - | 9,268 | 6,180 |
Richard Stewart | 3,808 | 4,925 | 2,141 | 414 | - | 11,288 | 5,331 |
Robert van Niekerk | 4,547 | 4,492 | 7,896 | 489 | - | 17,424 | 21,725 |
John Wallington3 | 1,772 | 1,309 | 459 | 313 | - | 3,853 | 4,948 |
Total | 45,901 | 45,727 | 59,440 | 4,602 | 209 | 155,879 | 194,721 |
1Salary may differ from that presented in the Integrated Annual Report 2017 as the salary presented above includes expenditure reimbursements.
2Appointed as a prescribed officer on 1 July 2017. Total remuneration of US$0.54 million was converted at the average exchange rate of R13.41/US$ for the six months ended 31 December 2017.
3Resigned as prescribed officer 30 June 2017.
The non-executive directors were paid the following fees during the year:
| | | | | | | |
Figures in thousands - SA rand | | | Directors fees | Committee fees | Expense allowance | 2017 | 2016 |
Chris Chadwick1 | | | 345 | 97 | - | 442 | 1,099 |
Robert Chan2 | | | 718 | 203 | 277 | 1,198 | 1,369 |
Tim Cumming | | | 908 | 459 | 61 | 1,428 | 1,337 |
Barry Davison | | | 908 | 587 | 60 | 1,555 | 1,411 |
Savannah Danson3 | | | 544 | 201 | - | 745 | - |
Rick Menell | | | 908 | 681 | 21 | 1,610 | 1,602 |
Sello Moloko | | | 1,717 | - | 8 | 1,725 | 1,621 |
Nkosemntu Nika | | | 874 | 411 | - | 1,285 | 1,260 |
Keith Rayner | | | 908 | 637 | - | 1,545 | 1,530 |
Sue van der Merwe | | | 908 | 315 | - | 1,223 | 1,139 |
Jerry Vilakazi | | | 897 | 327 | - | 1,224 | 1,169 |
Jiyu Yuan2 | | | 718 | 101 | - | 819 | 978 |
Total | | | 10,353 | 4,019 | 427 | 14,799 | 14,515 |
1Resigned 23 May 2017
2Resigned on 18 September 2017
3Appointed on 23 May 2017
| |
Sibanye-Stillwater | Form 20-F 2017 | 215 |
Table of Contents
NOTES TO THE CONSOLIDATED FINANCIAL STATEMENTS continued
FOR THE YEAR ENDED 31 DECEMBER 2017
The directors’ and prescribed officers’ share ownership at 31 December 2017 was:
| | | | | |
| | Number of shares | % |
| | 2017 | 2016 | 2017 | 2016 |
Executive directors | | | | | |
Neal Froneman1 | | 3,342,087 | 804,402 | 0.15 | 0.09 |
Charl Keyter2 | | 1,212,745 | 469,954 | 0.06 | 0.05 |
Non-executive directors | | | | | |
Tim Cumming3 | | 102 | 100 | - | - |
Barry Davison3 | | 1,507,414 | 500,000 | 0.07 | 0.05 |
Rick Menell3 | | 104,448 | 44,800 | - | - |
Sello Moloko3 | | 107,245 | 46,000 | - | - |
Keith Rayner3 | | 66,339 | 45,000 | - | - |
Sue van der Merwe3 | | 988 | 424 | - | - |
Total share ownership by directors | | 6,341,368 | 1,910,680 | | |
Prescribed officers | | | | | |
Chris Bateman4 | | - | - | - | - |
Hartley Dikgale5 | | 292,785 | 175,215 | 0.01 | 0.02 |
Themba Nkosi3 | | 18,370 | 367 | - | - |
Wayne Robinson6 | | 346 | - | - | - |
Richard Stewart7 | | 102,971 | 12,854 | - | - |
Robert van Niekerk8 | | 176,266 | - | 0.01 | - |
Total | | 6,932,106 | 2,099,116 | | |
1Share ownership at the date of this report is 4,125,184 ordinary shares.
2Share ownership at the date of this report is 1,385,352 ordinary shares.
3Share ownership at the date of this report is unchanged.
4Share ownership at the date of this report is 12,722 ADRs.
5Share ownership at the date of this report is 367,168 ordinary shares.
6Share ownership at the date of this report is 101,997 ordinary shares.
7Share ownership at the date of this report is 187,412 ordinary shares.
8Share ownership at the date of this report is 302,251 ordinary shares.
None of the directors’ immediate families or associates held any direct shareholding in Sibanye-Stillwater’s issued share capital.
34. EVENTS AFTER REPORTING DATE
There were no events that could have a material impact on the financial results of the Group after 31 December 2017, other than those disclosed below.
DRDGOLD TRANSACTION
On 22 November 2017, Sibanye-Stillwater announced the DRDGOLD Transaction. Sibanye has received approval for the DRDGOLD Transaction from the South African competition authorities in accordance with the Competition Act. The implementation of the DRDGOLD Transaction is still subject to the fulfilment of conditions precedent and is expected to complete during April 2018.
LONMIN ACQUISITION
On 14 December 2017, Sibanye-Stillwater announced that it had reached agreement with Lonmin plc (Lonmin) on the terms of a recommended all-share offer to acquire the entire issued and to be issued ordinary share capital of Lonmin (the Lonmin Acquisition). It is proposed that the Lonmin Acquisition will be effected by means of a scheme of arrangement between Lonmin and the Lonmin Shareholders under Part 26 of the UK Companies Act. Under the terms of the Lonmin Acquisition, each Lonmin Shareholder will be entitled to receive: 0.967 new Sibanye-Stillwater shares for each Lonmin share. The Lonmin Acquisition is subject to the fulfilment of conditions precedent and is expected to complete during the second half of 2018.
CAPITALISATION ISSUE
As a result of various temporary factors discussed elsewhere in this report, a final dividend was not declared. Instead, the Board approved a capitalisation issue in the form of 4 (four) new shares for every 100 (one hundred) held. EPS figures have been adjusted retrospectively as required by IAS 33.
| |
Sibanye-Stillwater | Form 20-F 2017 | 216 |
| | | | |
REGISTERED SHAREHOLDER SPREAD AT 31 DECEMBER 2017 |
| Number of holders | % of total shareholders1 | Number of shares2 | % of issued capital1,3 |
1—1,000 shares | 13,507 | 69.92 | 2,101,469 | 0.10 |
1,001—10,000 shares | 4,085 | 21.15 | 13,500,865 | 0.62 |
10,001 – 100,000 shares | 1,164 | 6,03 | 36,003,423 | 1.66 |
100,001—1,000,000 shares | 418 | 2,16 | 130,814,089 | 6.03 |
1,000,001 shares and above | 144 | 0.75 | 1,986,301,374 | 91.59 |
Total | 19,318 | 100.00 | 2,168,721,220 | 100.00 |
1 Figures may not add due to rounding.
2 As of 23 March 2018, the issued share capital of Sibanye-Stillwater consisted of 2,178,647,129 ordinary shares.
3 To our knowledge: (1) Sibanye-Stillwater is not directly or indirectly owned or controlled (a) by another entity or (b) by any foreign government; and (2) there are no arrangements the operation of which may at a subsequent date result in a change in control of Sibanye-Stillwater. To the knowledge of Sibanye-Stillwater’s management, there is no controlling shareholder of Sibanye-Stillwater.
| | | | |
PUBLIC AND NON-PUBLIC SHAREHOLDINGS AT 31 DECEMBER 2017 |
| Number of holders | % of total shareholders1 | Number of shares | % of issued capital1 |
Non-public shareholders | 10 | 0.05 | 23,334.803 | 1.08 |
Directors | 8 | 0.04 | 6,317,884 | 0.29 |
Share trust | 1 | 0.01 | 16,728,885 | 0.77 |
Own holding | 1 | 0.01 | 288,034 | 0.01 |
Public shareholders | 19,308 | 99.94 | 2,145,386,417 | 98.92 |
Total | 19,318 | 100.00 | 2,168,721,220 | 100.00 |
1 Figures may not add due to rounding.
| | |
FOREIGN CUSTODIANS ABOVE 3% AT 31 DECEMBER 2017 | | |
| Number of shares | % |
Bank of New York Depositary Receipts | 566,937,909 | 26.14 |
State Street Bank and Trust Company | 176,103,999 | 8.12 |
Citibank | 78,318,008 | 3.61 |
J.P. Morgan Chase Bank NA | 67,039,472 | 3.09 |
| | | | |
BENEFICIAL SHAREHOLDER CATEGORIES AT 31 DECEMBER 2017 |
| Number of holders | % of total shareholders1 | Number of shares | % of issued capital1 |
Other | 17,921 | 92.77 | 393,161,095 | 18.13 |
Private Investor | 378 | 1.96 | 66,646,779 | 3.07 |
Unit Trusts/ Mutual Funds | 360 | 1.86 | 437,664,045 | 20.18 |
Pension Funds | 285 | 1.48 | 377,254,672 | 17.40 |
Custodians | 104 | 0.54 | 61,521,804 | 2.84 |
ADR | 86 | 0.45 | 555,704,025 | 25.62 |
Trading Position | 40 | 0.21 | 55,719,572 | 2.57 |
Insurance Companies | 34 | 0.18 | 35,562,158 | 1.64 |
Sovereign Wealth | 31 | 0.16 | 108,155,926 | 4.99 |
Exchange-Traded Fund | 27 | 0.14 | 40,373,059 | 1.86 |
Medical Aid Scheme | 10 | 0.05 | 882,906 | 0.04 |
Directors & Employees | 9 | 0.05 | 23,046,769 | 1.06 |
Charity | 8 | 0.04 | 2,436,114 | 0.11 |
University | 8 | 0.04 | 2,470,920 | 0.11 |
Hedge Fund | 6 | 0.03 | 5,470,624 | 0.25 |
Local Authority | 4 | 0.02 | 760,925 | 0.04 |
Foreign Government | 3 | 0.02 | 860,120 | 0.04 |
Corporate Holding | 2 | 0.01 | 634,862 | 0.03 |
Investment Trust | 1 | 0.01 | 302,362 | 0.01 |
Stockbrokers | 1 | 0.01 | 92,483 | 0.00 |
Total | 19,318 | 100.00 | 2,168,721,220 | 100.00 |
1 Figures may not add due to rounding.
| |
Sibanye-Stillwater | Form 20-F 2017 | 217 |
The tables below show the change in the percentage ownership of Sibanye-Stillwater’s major shareholders, to the knowledge of Sibanye-Stillwater’s management, between 31 December 2015 and 31 December 2017.
| | | | | | |
INVESTMENT MANAGEMENT SHAREHOLDINGS MORE THAN 3% AT 31 DECEMBER1 |
| 2017 | 2016 | 2015 |
Number of shares | % | Number of shares | % | Number of shares | % |
Van Eck Associates Corporation | 232,647,340 | 10.73 | 53,555,603 | 5.76 | 65,030,159 | 7.10 |
Public Investment Corporation (SOC) Limited | 190,930,628 | 8.80 | 76,941,387 | 8.28 | 76,599,424 | 8.36 |
Investec | 145,619,201 | 6.71 | 9,026,558 | 0.97 | 29,818,210 | 3.25 |
BlackRock Inc | 92,159,514 | 4.25 | 34,764,380 | 3.74 | 11,100,898 | 1.22 |
Dimensional Fund advisors | 60,314,329 | 2.78 | 22,462,462 | 2.42 | 46,107,899 | 4.71 |
Old Mutual Plc | 30,718,348 | 1.42 | 51,099,720 | 5.50 | 34,870,880 | 3.81 |
Allan Gray Proprietary Limited | 1,840,409 | 0.08 | 4,428,112 | 0.48 | 75,903,026 | 8.29 |
1 A list of the investment managers holding, to the knowledge of Sibanye-Stillwater’s management, directly or indirectly, 3% or more of the issued share capital of Sibanye-Stillwater as of 23 March 2018 is set forth below:
| | |
| Number of shares | % |
Van Eck Associates Corporation | 240,148,644 | 11.07 |
Public Investment Corporation (SOC) Limited | 208,456,423 | 9.61 |
Investec Asset Management | 124,629,938 | 5.75 |
BENEFICIAL SHAREHOLDINGS MORE THAN 3% AT 31 DECEMBER1 |
| 2017 | 2016 | 2015 |
Number of shares | % | Number of shares | % | Number of shares | % |
Gold One | 427,945,215 | 19.73 | 185,386,079 | 19.96 | 185,386,079 | 20.24 |
Government Employees Pension Fund (PIC) | 220,118,742 | 10.15 | 83,435,716 | 8.98 | 77,297,776 | 8.44 |
1 A list of the individuals and organisations holding, to the knowledge of Sibanye-Stillwater’s management, directly or indirectly, 3% or more of the issued share capital of Sibanye-Stillwater as of 23 March 2018 is set forth below:
| | |
| Number of shares | % |
Gold One | 421,489,829 | 19.43 |
Government Employees Pension Fund (PIC) | 212,534,154 | 9.80 |
Sibanye-Stillwater’s ordinary shares are subject to dilution as a result of any non-pre-emptive share issuance, including upon the exercise of Sibanye-Stillwater’s outstanding share options, issues of shares by the Board in compliance with BEE legislation or in connection with acquisitions.
The principal non-United States trading market for the ordinary shares of Sibanye-Stillwater is the JSE Limited, on which they trade under the symbol “SGL”. Sibanye-Stillwater’s American depositary shares (ADSs) trade in the United States on the NYSE under the symbol “SBGL”. The ADRs representing the ADSs were issued by the Bank of New York Mellon (BNYM) as Depositary. Each ADS represents four ordinary shares.
No public takeover offers by third parties have been made in respect of Sibanye-Stillwater’s shares or by Sibanye-Stillwater in respect of other companies’ shares during the last and current fiscal year.
| |
Sibanye-Stillwater | Form 20-F 2017 | 218 |
| 1 (Chairman) 1 1 1 1 1 1 1 1 Independent non-executive | |
SIBANYE GOLD LIMITED TRADING AS SIBANYE-STILLWATER Incorporated in the Republic of South Africa Registration number 2002/031431/06 Share code: SGL Issuer code: SGL ISIN: ZAE E000173951 LISTINGS JSE: SGL NYSE: SBGL WEBSITE www.sibanyestillwater.com REGISTERED AND CORPORATE OFFICE Constantia Office Park Cnr 14th Avenue & Hendrik Potgieter Road Bridgeview House, Ground Floor Weltevreden Park 1709 South Africa Private Bag X5 Westonaria 1780 South Africa Tel: +27 11 278 9600 Fax: +27 11 278 9863 INVESTOR ENQUIRIES James Wellsted Senior Vice President: Investor Relations Cell: +27 83 453 4014 Tel: +27 10 493 6923 Email: james.wellsted@sibanyestillwater.com or ir@sibanyestillwater.com CORPORATE SECRETARY Cain Farrel Tel: +27 10 493 6921 Email: cain.farrel@sibanyestillwater.com | DIRECTORS Sello Moloko1 (Chairman) Neal Froneman (CEO) Charl Keyter (CFO) Savannah Danson1 Timothy Cumming1 Barry Davison1 Rick Menell1 Nkosemntu Nika1 Keith Rayner1 Susan van der Merwe1 Jerry Vilakazi1 1 Independent non-executive JSE SPONSOR JP Morgan Equities South Africa Proprietary Limited (Registration number 1995/011815/07) 1 Fricker Road Illovo Johannesburg 2196 South Africa Private Bag X9936 Sandton 2196 South Africa OFFICE OF THE UNITED KINGDOM SECRETARIES LONDON St James’s Corporate Services Limited Suite 31 Second Floor 107 Cheapside London EC2V 6DN United Kingdom Tel: +44 20 7796 8644 Fax: +44 20 7796 8645 AUDITORS KPMG Inc. KPMG Crescent 85 Empire Road Parktown 2193 Johannesburg South Africa Tel: +27 11 647 7111 | AMERICAN DEPOSITORY RECEIPTS TRANSFER AGENT BNY Mellon Shareowner Services PO Box 358516 Pittsburgh PA15252-8516 US toll-free: +1 888 269 2377 Tel: +1 201 680 6825 Email: shrrelations@bnymellon.com Tatyana Vesselovskaya Relationship Manager BNY Mellon Depositary Receipts Direct Line: +1 212 815 2867 Mobile: +1 203 609 5159 Fax: +1 212 571 3050 Email: tatyana.vesselovskaya@bnymellon.com TRANSFER SECRETARIES SOUTH AFRICA Computershare Investor Services Proprietary Limited Rosebank Towers 15 Biermann Avenue Rosebank 2196 PO Box 61051 Marshalltown 2107 South Africa Tel: +27 11 370 5000 Fax: +27 11 688 5248 TRANSFER SECRETARIES UNITED KINGDOM Link Asset Services The Registry 34 Beckenham Road Beckenham Kent BR3 4TU England Tel: 0871 664 0300 (calls cost 10p a minute plus network extras, lines are open 8.30am – 5pm Mon-Fri) or +44 20 8639 3399 (from overseas) Fax: +44 20 8658 3430 Email: ssd@capitaregistrars.com |
| |
Sibanye-Stillwater | Form 20-F 2017 | 219 |
In addition to the other information included in this annual report, the considerations listed below could have a material adverse effect on our business, financial condition or results of operations, resulting in a decline in the trading price of Sibanye-Stillwater’s ordinary shares or ADRs. The risks set forth below comprise all material risks currently known to us. These factors should be considered carefully, together with the information and financial data set forth in this document.
RISKS RELATED TO SIBANYE-STILLWATER’S BUSINESS
Changes in the market price for gold and PGMs, which in the past have fluctuated widely, affect the profitability of Sibanye-Stillwater’s gold and PGM mining operations and the cash flows generated by those operations
Sibanye-Stillwater’s revenues from its gold and platinum mining operations are primarily derived from the sale of gold and PGMs that they produce. Sibanye-Stillwater does not generally enter into commodity derivatives or other hedging arrangements in order to establish a price in advance of the sale of its gold or PGM production. However, Sibanye-Stillwater may consider commodity derivatives or other hedging from time to time to protect cash flows of marginal assets. As a result, it is generally fully exposed to changes in the gold and PGM prices, which could lead to reduced revenue should the gold or PGM price decline. For example, during the year ended 31 December 2017, the gold price fluctuated between US$1,149/oz and US$1,351/oz. During the year ended 31 December 2017, the platinum and palladium price fluctuated between US$884/oz and US$706/oz, and US$1,046/oz and US$1,061/oz, respectively. In its US recycling business, Sibanye-Stillwater regularly enters into fixed forward sales contracts for metal produced from catalyst recycling, normally making these commitments at the time the catalyst material is purchased. For Sibanye-Stillwater's fixed forward sales related to recycling of catalysts, Sibanye-Stillwater is subject to the customers' compliance with the terms of the agreements, their ability to terminate or suspend the agreements and their willingness and ability to pay.
The market price for gold has historically been volatile and is affected by numerous factors over which Sibanye-Stillwater has no control, such as general supply and demand, speculative trading activity and global economic drivers. Over the period from 2011 to 2017, the gold price has declined from a high price of US$1,895/oz to a low price of US$1,149/oz. The market price for PGMs has been similarly volatile. Should the gold or PGM price decline below Sibanye-Stillwater’s production costs, it may experience losses and, should this situation remain for an extended period, Sibanye-Stillwater may be forced to curtail or suspend some or all of its projects, operations and/or reduce operational capital expenditures. Sibanye-Stillwater might not be able to recover any losses incurred during, or after, such events. A sustained period of significant gold or PGM price volatility may also adversely affect Sibanye-Stillwater’s ability to undertake new capital projects or to make other long-term strategic decisions. The use of lower gold and PGM prices in reserve calculations and LoM plans could also result in material impairments of Sibanye-Stillwater’s investment in gold or PGM mining properties or a reduction in its reserve estimates and corresponding restatements of its reserves and increased amortisation, reclamation and closure charges.
Exchange-traded funds for PGMs have been introduced in recent years that enable more investors to participate in the PGM markets, potentially resulting in more metal being held in inventory. The overhang from these significant investment holdings of palladium and platinum makes it more difficult to predict accurately future supply and demand for these metals and may contribute to added PGM price volatility.
Any of the above could have a material adverse effect on Sibanye-Stillwater’s business, operating results and financial condition.
Because gold and PGMs are generally sold in US Dollars, while the majority of Sibanye-Stillwater’s gold and a substantial amount of Sibanye-Stillwater’s PGM production costs are denominated in Rand, Sibanye-Stillwater’s operating results and financial condition will be materially harmed if there is a material change in the value of the Rand
Gold and PGMs are principally sold throughout the world in US dollars, but Sibanye-Stillwater’s costs of production at its operations in South Africa are primarily incurred in Rand. Recent volatility in the Rand has made our costs and results of operations less predictable than when exchange rates are more stable. In recent years, the Rand has experienced significant devaluation against the US dollar falling from R10.34/US$ as at 31 December 2013 to R15.54/US$ as at 31 December 2015, before strengthening again to R12.36/US$ as at 31 December 2017. Any significant increase or appreciation of the Rand against the US dollar would increase our operating costs in US dollar terms, and reduce revenue in Rand terms, which could materially adversely affect our operating results and financial condition from the South African operations. Conversely, a weakening of the Rand may result in higher inflation in South Africa, which would increase the prices Sibanye-Stillwater pays for products and services. In light of these factors and the likely impact on cash flow, our management regularly re-evaluates its current growth capital expenditure plans. This includes reviewing the planned 2018 capital profile at all operations and projects. Certain projects may be deferred or placed on care and maintenance until commodity prices sustainably improve, and/or exchange rate volatility has subsided. Should a strong Rand/US dollar exchange rate persist without a corresponding gain in commodity prices, the Group may consider increasing operational flexibility by adjusting mine plans, reducing capital expenditure, selling assets and, if necessary, consider options to increase funding flexibility. Also see —Sibanye-Stillwater has a large amount of indebtedness and limited current liquidity, and an increase in the cost of debt or difficulties in obtaining financing could adversely affect Sibanye-Stillwater’s business, operating results and financial condition. All of the above could have a material adverse effect on Sibanye-Stillwater’s business, operating results and financial condition.
Sibanye-Stillwater’s operations and profits have been and may be adversely affected by labour unrest and union activity
Organised labour dynamics in the mining sector, particularly in South Africa, are volatile and uncertain and as such, they have had, and may in the future have, a material adverse impact on our operations, production and financial performance. A recent increase in union activity and labour unrest in South Africa has resulted in more frequent industrial disputes and extended negotiations that have, along with other factors, negatively affected South Africa’s sovereign debt rating and subsequently the credit ratings of the country’s leading mining companies. For example, the Association of Mineworkers and Construction Union (the AMCU) called a brief strike at the Kroondal Operations during May 2016, which was later
| |
Sibanye-Stillwater | Form 20-F 2017 | 220 |
interdicted by the Labour Court of South Africa on the basis that it was unprotected. Between 6 June 2017 and 3 July 2017, despite communication with employees and agreement with NUM, employees at Cooke embarked on an unprotected strike following the implementation of measures to combat illegal mining following signs of collusion between illegal miners and employees. The illegal mining threatened the sustainability of the Cooke operations and posed a significant risk to the safety of employees and the surrounding communities. As a result of assisting illegal miners, 77 employees were arrested. Following a court interdict obtained by Sibanye-Stillwater on 8 June 2017, disciplinary measures were taken against striking employees resulting in the dismissal of 99 employees, 407 employees being placed on final warnings and forfeiting their salaries and a further 869 forfeiting annual leave, in order to compensate for non-productive shifts. Approximately 300kg of planned gold production, equivalent to about R160 million in revenue, was lost at the Cooke operations during the strike. Also see —Theft of gold, PGM and production inputs, as well as illegal artisanal mining, may occur on some of Sibanye-Stillwater’s properties. These activities are difficult to control, can disrupt Sibanye-Stillwater’s business and can expose Sibanye-Stillwater to liability.
In October 2015, Sibanye-Stillwater concluded a three-year labour agreement with NUM, UASA and Solidarity, but AMCU, which currently has minority recognition status at Beatrix and Kloof and majority status at Driefontein, rejected, and continued to reject, further alternative offers made by Sibanye-Stillwater. Despite the acceptance of the labour agreement by NUM, UASA and Solidarity, and the extension thereof to all other employees, during March 2016, AMCU threatened industrial action should a higher wage not be agreed. This was averted by Sibanye-Stillwater entering into an agreement with AMCU for a marginally higher wage. NUM has expressed its dissatisfaction with this development and there can therefore be no guarantee that further strikes, work stoppages or other disruptions will not occur. In November 2017, Sibanye-Stillwater entered into a three-year wage agreement with the AMCU, NUM and Solidarity at the Kroondal Operations effective from 1 July 2017.
Furthermore, rivalry between unions, such as AMCU and NUM, may destabilise labour relations in the mining sector. For example, on 5 February 2015, a conflict occurred between AMCU and NUM members at Beatrix, resulting in injuries to nine Sibanye-Stillwater employees. Operations at Beatrix were temporarily suspended as a result of the incident, and only resumed on 9 February 2015 after Sibanye-Stillwater and the rival unions agreed to commit to maintaining peaceful co-existence and a safe working environment for employees.
In addition, Sibanye-Stillwater undertakes from time to time processes for operational restructuring under Section 189A of the Labour Relations Act 66 of 1995 (Section 189A Processes), which may result in retrenchment of employees and may impact production levels at affected operations. For example, on 26 January 2017, the Company announced that it had entered into a Section 189A consultation process at its South African platinum operations. On 1 November 2017, the Company announced that it concluded a Section 189A Process regarding the proposed restructuring of its gold operations and associated services pursuant to losses at Cooke and Beatrix West. As a result, Beatrix West is expected to remain in operation for as long as it makes a profit, on average, over any continuous three-month period, after accounting for AISC, which will provide employment for approximately 1,640 employees. In the event that Beatrix West becomes loss making, both the underground operation and Beatrix 2 Plant will be put on care and maintenance. Further, the underground mining operation at the Cooke 1, 2 and 3 shafts were placed on care and maintenance from the end of October 2017, while the Cooke surface processing plant will continue to operate for as long as there is sufficient feed material for it to be profitable, subject to various cost cutting measures being implemented. Through the Section 189A Process, 1,510 employees were transferred within the Company and as care and maintenance personnel for the Cooke underground operations. Approximately 2,025 employees were retrenched, with an additional 1,350 electing to take voluntary separation packages. An additional 620 employees have replaced contractors involved in non-critical activities across the Company. In total, 3,601 contractors have been displaced while employment for 3,282 people has been preserved.
Factors that influence the decision to undertake such Section 189A Processes include, among other things, the cost structure of an operation, commodity prices and exchange rates. Restructuring options are currently being reviewed at marginal operations and while no decision has been taken, it should be noted that a low Rand commodity price environment, such as the one currently being experienced, increases the likelihood that Sibanye-Stillwater will determine that undertaking a Section 189A Process at one or more of its operations is advisable. Any currently underway or future Section 189A Process may lead to labour unrest, reduced production levels and reputational harm to Sibanye-Stillwater. There is no guarantee that any such Section 189A Process will provide the costs savings or other benefits anticipated by management.
In the United States, Sibanye-Stillwater’s employees located at the Stillwater Mine and the Columbus processing facilities are covered by a collective bargaining agreement with the United Steel Workers Local 11-001 (USW Local 11-0001) entered into in 2015. This agreement expires on 2 June 2019, and was re-negotiated for wages in June 2017 with employees set to receive a 2% wage increase through January 2018, a 1% increase from January 2018 through June 2018 and a 2% increase in the final year through June 2019. Sibanye-Stillwater’s employees at the East Boulder Mine are covered by a separate collective bargaining agreement with USW Local 11-0001, which was entered into at the end of 2017 and expires in 2021. Under the new agreement, Sibanye-Stillwater’s employees at the East Boulder Mine received a 1% wage increase effective 1 January 2018 with annual increases of 2% in 2019, 2.5% in 2020 and 2% in 2021 as well as a US$1,000 bonus payment which was paid on 1 February 2018. As the majority of Sibanye-Stillwater’s workforce in the United States is unionised, Sibanye-Stillwater is subject to a risk of strikes and other labour disputes at its US operations, and its ability to alter labour costs is restricted by the fact that unionised employees are party to collective bargaining agreements.
In the event that further industrial relations-related interruptions were to occur at any of Sibanye-Stillwater’s operations, other mines’ operations or in other industries that impact its operations, or increased employment-related costs due to union or employee activity, these may have a material adverse effect on its business, production levels, production targets, results of operations, financial condition, reputation and future prospects. In addition, lower levels of mining activity can have a longer-term impact on production levels and operating costs, which may affect operating life. Mining conditions can deteriorate during extended periods without production and Sibanye-Stillwater will not re-commence mining until health and safety conditions are considered appropriate to do so.
Any of the above could have a material adverse effect on Sibanye-Stillwater’s business, operating results and financial condition.
Sibanye-Stillwater’s mineral rights are subject to legislation, which could impose significant costs and burdens and which impose certain ownership requirements, the interpretation of which are the subject of dispute
Our operations in South Africa are subject to legislation regulating mineral rights. This includes BBBEE legislation designed to effect the entry and participation of HDSAs into the mining industry and increase their participation in the South African economy.
| |
Sibanye-Stillwater | Form 20-F 2017 | 221 |
The Mineral and Petroleum Resources Development Act (MPRDA), which came into effect on 1 May 2004, transferred ownership of the mineral resources of South Africa to South African people, with the South African government acting as custodian in order to, among other things, promote equitable access to the nation’s mineral resources by South Africans, expand opportunities for HDSAs who wish to participate in the South African mining industry and advance social and economic development. As custodian, the South African government exercises regulatory control over the exploitation of mineral resources and does so by exercising the power to grant the rights required to prospect and mine for minerals, including through the imposition of terms and conditions. The MPRDA required mining companies to apply for the right to mine and/or prospect and to apply for the conversion of “old order” prospecting rights and mining rights to “new order” mining rights. In order to qualify for these rights, applicants need to satisfy the South African government that the granting of such a right will advance the open-ended broad-based socio-economic empowerment requirements of the Mining Charter published pursuant to the MPRDA (the Mining Charter). The MPRDA also required that mining companies submit social and labour plans, or SLPs, which set out their commitments relating to human resource development, labour planning and socio-economic development planning to the DMR. In order to give content to the broad-based socio-economic empowerment requirements to the mining industry, the DMR published the Mining Charter, which became effective on 1 May 2004. The current Mining Charter required 26% HDSA ownership by the 2014 deadline.
In 2010, the DMR introduced the Amended Mining Charter containing guidelines envisaging, among other things, that mining companies should achieve a minimum of 40% of HDSA demographic representation by 2014 at executive management (board) level, senior management (executive committee) level, core and critical skills, middle management level and junior management level.
On 31 March 2015, the Chamber of Mines (Chamber) reported that the DMR believes that empowerment transactions by mining companies concluded after 2004 where the HDSA ownership level has fallen due to HDSA disposal of shares or for other reasons should not be included in the calculation of HDSA ownership for the purposes of, among other things, the 26% HDSA ownership guidelines under the Mining Charter. The position of the Chamber of Mines (including Sibanye-Stillwater) is that such historical empowerment transactions should be included in the calculation of HDSA ownership.
The DMR and the Chamber jointly agreed to approach the South African courts to seek a declaratory order that will provide a ruling on the relevant legislation and the status of the Mining Charter and the Amended Mining Charter, including clarity on the status of previous empowerment transactions concluded by mining companies and a determination on whether the ownership element of the Mining Charter and the Amended Mining Charter should be a continuous compliance requirement for the duration of the mining right as argued by the DMR, or a once-off requirement as argued by the Chamber, on the “once empowered always empowered” principle. The Chamber and the DMR filed papers in court and the matter (the Main Application) was placed on the roll to be heard on 15 March 2016. In February 2016, an application was filed by a third party, Malan Scholes Inc., to consolidate the Main Application with its own application for a declaratory order on the empowerment aspects of the Mining Charter and the Amended Mining Charter (the Scholes Application). The Chamber opposed the consolidation of these applications on the basis that, amongst other things, the right to relief in the respective applications does not depend substantially on the same questions of law and/or fact. On 3 May 2016, the court refused to consolidate the two applications. On 16 February 2018, the High Court postponed the Mining Charter hearing indefinitely to allow the Chamber and the Government to engage in further discussions on this matter.
If the DMR were to prevail in the Main Application and the “once empowered always empowered” principle is rejected, mining companies, including Sibanye-Stillwater may be required to undertake further empowerment transactions in order to increase their HDSA ownership, which would result in the dilution of existing shareholders and could have a negative impact on the financial indebtedness of Sibanye-Stillwater. In such event, mining companies including Sibanye-Stillwater may be required to maintain a minimum HDSA ownership level indefinitely.
While it remains to be seen whether the Chamber will prevail in the Main Application, on 15 June 2017, the DMR published a new mining charter (the New Mining Charter) which came into effect on the same day. The Chamber launched an urgent application (the Interdict Application) in the High Court of South Africa, Gauteng Division, Pretoria (the Gauteng Division High Court) to interdict the implementation of the New Mining Charter, pending an application by the Chamber (the Chamber Application) to set the New Mining Charter aside on the basis that it was unilaterally developed and imposed on the industry and that the process that was followed by the DMR in developing the New Mining Charter had been seriously flawed. However, the Minister and the Chamber reached an agreement on 13 September 2017 under which the Minister undertook to suspend the New Mining Charter pending the outcome of the Chamber Application. The Chamber Application has been postponed indefinitely by agreement between the DMR and the Chamber on the basis that the Chamber has entered into a new round of discussions with the newly elected President of South Africa, Cyril Ramaphosa, and the new Minister of Mineral Resources, Gwede Mantashe. On 19 February 2018, the Gauteng Division High Court ordered that the DMR and the Chamber must also involve communities affected by mining activities in these new discussions over the New Mining Charter. The involvement of communities in these discussions may delay the process of agreeing on a new Mining Charter. For the time being, existing holders must continue to comply with the provisions of the Mining Charter and are not required to implement any aspect of the suspended New Mining Charter.
In the event that the negotiations on the New Mining Charter fail and the court upholds the New Mining Charter in its current form (if the Chamber Application is again placed on the roll to be heard) then existing and new holders of mining rights will need to comply with the New Mining Charter, which may require, among other things, further issuance of Sibanye-Stillwater shares to comply with the new ownership requirements, limitation on procurement and other activities, changes to management and the payment of additional fees and levies as set out in the New Mining Charter.
Any adjustment to the ownership structure of Sibanye-Stillwater’s mining assets in order to meet BBBEE requirements could have a material adverse effect on the value of Sibanye-Stillwater’s securities. Further, Sibanye-Stillwater may in the future incur significant costs or have to issue additional shares as a result of changes in the interpretation of existing laws and guidelines or the imposition of new laws relating to HDSA ownership requirements, which may have a material adverse effect on Sibanye-Stillwater’s business, operating results and financial condition.
In terms of section 47 of the MPRDA, the Minister of Mineral Resources may suspend or cancel the existing mining rights, or under section 23(3) of the MPRDA, refuse to grant applications for new mining rights by mining companies, including Sibanye-Stillwater, should such holders of mining rights be deemed not to be in compliance with the requirements of the MPRDA as read with South Africa’s mining industry empowerment requirements. However, it is this very issue which also forms part of the Main Application. If the Minister were to determine that Sibanye-Stillwater is not in compliance with the requirements of the MPRDA and its empowerment requirements, Sibanye-Stillwater may be required to engage in remedial steps, including changes to management and actions that require shareholder approval.
| |
Sibanye-Stillwater | Form 20-F 2017 | 222 |
There is currently uncertainty whether mining companies are, in addition to its required compliance with the MPRDA, required to comply with the BBBEE Act, 2003 (the BBBEE Act) and the BBBEE Codes, which apply generally to other industries in South Africa. The MPRDA does not require mining companies to comply with the BBBEE Act and the BBBEE Codes but the former Minister of Mineral Resources has expressed a desire to align the New Mining Charter with the BBBEE Act and the more onerous BBBEE Codes. The current version of the New Mining Charter reflects the former Minister of Mineral Resource’s latest attempts at alignment notwithstanding the questionable need to do so. Accordingly, if brought into effect in its current form, the New Mining Charter could potentially create further uncertainty. For further information, see Further Information—Environmental and regulatory matters—South Africa—The BBBEE Act and the BBBEE Amendment Act.
If the DMR were to determine that Sibanye-Stillwater is not in compliance with the MPRDA, for any reason, including HDSA ownership, Sibanye-Stillwater may challenge such a decision in court. Any such court action may be expensive and there is no guarantee that Sibanye-Stillwater challenge would be successful.
There is no guarantee that any steps Sibanye-Stillwater has already taken or might take in the future will ensure the retention of its existing mining rights, the successful renewal of its existing mining rights, the granting of applications for new mining rights or that the terms of renewals of its rights would not be significantly less favourable than the terms of its current rights. Any further adjustment to the ownership structure of Sibanye-Stillwater’s South African mining assets in order to meet BBBEE requirements could have a material adverse effect on the value of Sibanye-Stillwater’s securities.
In addition, an amendment bill to the MPRDA, namely the MPRDB, was passed by both the National Assembly and the National Council of Provinces (NCOP) on 27 March 2014. In January 2015, the President referred the MPRDB back to Parliament for reconsideration and on 1 November 2016, the Portfolio Committee on Mineral Resources tabled non-substantial revisions to the MPRDB in the National Assembly and a slightly revised version of the MPRDB was passed by the National Assembly and referred to the NCOP. On 3 March 2017, the National Assembly passed certain minor amendments to the MPRDB. The National Assembly has referred the MPRDB to the NCOP where the Select Committee had received comments on the draft legislation. On 16 February 2018, President Ramaphosa announced that the MPRDB was at an advanced stage in Parliament. There is a large degree of uncertainty regarding the changes that will be brought about should the MPRDB be made law. Among other things, the MPRDB seeks to require the consent of the Minister of Mineral Resources for the transfer of any interest in an unlisted company or any controlling interest in a listed company where such companies hold a prospecting right or mining right and to give the Minister of Mineral Resources broad discretionary powers to prescribe the levels required for beneficiation in promoting the beneficiation of minerals.
Any such change in law could have a material adverse effect on Sibanye-Stillwater’s business, operating results and financial condition.
Power Stoppages, Fluctuations and Usage Constraints in South Africa may force Sibanye-Stillwater to halt or curtail operations
Electricity supply in South Africa has been constrained over the past decade and there have been multiple power disruptions. There is uncertainty as to whether the national power supply utility, Eskom, will be able to meet demand for power supply in the future. In June 2016, Eskom made an assurance that it had adequate capacity to supply projected national electricity demands for the next six years. Such statements have, however, historically proven to be unreliable and accordingly there is a lack of confidence in Eskom’s assurance of supply. Although Eskom applied for a 19.9% electricity tariff increase for Eskom’s 2018 to 2019 financial year, the National Energy Regulator of South Africa (NERSA) approved a 5.23% increase for this period. Eskom has expressed concern that this increase may not be adequate to prevent future electricity interruption. In addition to supply constraints, labour unrest in South Africa has before, and may in future, disrupt the supply of coal to power stations operated by Eskom and result in curtailed supply. For example, on 10 August 2016, Eskom failed to reach a wage agreement with NUM, which led to a 2‑day strike. Further, in the first quarter of fiscal 2014, rain impacted coal supply and constrained Eskom’s ability to provide power. Despite the fact that Eskom has adopted a policy of asking households to reduce usage before asking industrial users to do so in order to reduce the economic impact of such disruptions, Eskom has warned that power constraints will continue.
The South African Department of Energy is developing a power conservation programme in an attempt to improve the reliability of power supply in South Africa. However, there can be no assurance that this programme will provide sufficient supply for the needs of the country or for Sibanye-Stillwater to run its operations at full capacity or at all. While Sibanye-Stillwater has backup generating capacity available during power emergencies, this is insufficient for all operations to continue operating as normal, however it is sufficient for safety purposes. This capacity is generated at a significantly higher cost than electricity supplied by Eskom.
Any further disruption or decrease in the electrical power supply available to Sibanye-Stillwater’s South African-based operations could have a material adverse effect on its business, operating results and financial condition.
Power Cost Increases in South Africa may adversely affect Sibanye-Stillwater’s Results of Operations
Sibanye-Stillwater’s mining operations in South Africa depend upon electrical power generated by the state-owned power supply utility, Eskom. See ―Power stoppages, fluctuations and usage constraints in South Africa may force Sibanye-Stillwater to halt or curtail operations. Eskom holds a monopoly on power supply in the South African market, supplying 95% of the country’s electricity needs. Eskom tariffs are regulated by the National Energy Regulator of South Africa (NERSA). Although Eskom applied to NERSA for a 19.9% average increase in electricity tariffs for Eskom’s 2018 to 2019 financial year, NERSA granted Eskom a 5.23% electricity tariff increase for this period. Eskom has indicated that it intends to challenge NERSA’s decision not to grant the requested 19.9% tariff increase. Eskom is expected to submit to NERSA requests for three regulatory clearance account applications for the 2014-2015, 2015-2016 and 2016- 2017 fiscal years, amounting to nearly R66 billion. Should all three applications be granted and liquidated in one year, this could result in approximately a 34% tariff increase. Should Sibanye-Stillwater experience further power tariff increases, its business operating results and financial condition may be adversely impacted.
| |
Sibanye-Stillwater | Form 20-F 2017 | 223 |
Due to the nature of deep level mining and the extensive environmental footprint of Sibanye-Stillwater’s operations, environmental hazards, industrial accidents, mining accidents and pollution may result in operational disruptions such as stoppages which could result in increased production costs as well as financial and regulatory liabilities
Mining by its nature involves significant risks and hazards, including environmental hazards, as well as industrial and mining accidents. These include, for example, seismic events, fires, cave-ins and blockages, flooding, discharges of gasses and toxic substances, contamination of water, air or soil resources, unusual and unexpected rock formation affecting ore or wall rock characteristics, ground or slope failures, rock bursts, wild fires, flooding, radioactivity and other accidents or conditions resulting from mining activities including, among other things, blasting and the transport, storage and handling of hazardous materials. In addition, we operate tailings dams and, while rare, tailings dams on occasion have failed in our industry (for example, in Canada in 2014 at Mount Polley and in Brazil in 2015 at Samarco) for a variety of reasons, including increased weight, the construction material used and design deficiencies. A significant tailings dam failure could have catastrophic consequences and result in material liabilities.
We have experienced and continue to remain at risk of experiencing environmental and other industrial hazards, as well as industrial and mining accidents, and we are more susceptible, particularly at our South African operations, than other mining operations to certain of these risks due to mining at depth. For example, over 900 miners were trapped underground at the Beatrix mine for over 24 hours due to a power outage in 2017. Although there were no reported serious injuries, any future such incidents could have a material adverse effect on Sibanye-Stillwater’s business, operating results and financial condition.
Furthermore, there are risks that relevant regulators, such as the DMR, the Mine Safety and Health Administration (MSHA) or the Occupational Safety and Health Administration (OHSA), may impose fines and work stoppages (known as Section 54 stoppages in South Africa) for non-compliant mining operating procedures and activities, which will reduce or halt production until lifted. The occurrence of any of these events could delay or halt production, increase production costs and result in financial and regulatory liability for Sibanye-Stillwater, which could have a material adverse effect on its business, operating results and financial condition. Also see ―Sibanye-Stillwater’s operations are subject to environmental, health and safety regulations, which could impose additional costs and compliance requirements, and Sibanye-Stillwater has faced, and may face further, claims and liability for breaches, or alleged breaches, of such regulations and other applicable laws.
In addition, the relevant environmental authorities may issue administrative directives and compliance notices to enforce the provisions of the relevant statutes (especially National Environmental Management Act, 1998 (Act No 107 of 1998) (NEMA), the National Water Act, 1998 (Act No 36 of 1998) (National Water Act) and the Waste Act in South Africa, as well as the Clean Air Act, the Clean Water Act, the Resource Conservation and Recovery Act and the Metals Mines Reclamation Act in the United States) to take specific anti-pollution measures, continue with those measures and/or to complete those measures. The authorities may also order the suspension of part or all of Sibanye-Stillwater’s operations if there is non-compliance with legislation. Contravention of some of these statutes may also constitute a criminal offense and an offender may be liable for a fine or imprisonment, or both.
Seismic activity is of particular concern in the underground mining environment, particularly in South Africa as a consequence of the extent and extreme depth of mining. Seismic events have caused death and injury to employees and contractors and may result in safety-related stoppages. Seismic activity may also cause a loss of mining equipment, damage to, or destruction of mineral properties or production facilities, monetary losses, environmental damages and potential legal liabilities.
As a result, the occurrence of any of these events may have a material adverse effect on Sibanye-Stillwater’s business, operating results and financial condition.
Sibanye-Stillwater has a large amount of indebtedness subject to various lender covenants and restrictions, and failure to comply with the covenants or difficulties in obtaining additional financing or refinancing could adversely affect Sibanye-Stillwater’s business, operating results and financial condition
In order to conclude the Stillwater acquisition, Sibanye-Stillwater temporarily increased its debt. The Group raised a US$2.65 billion bridge loan for the Stillwater Acquisition, which was subsequently refinanced through a US$1 billion rights offering, a US$1.05 billion bond offering and a US$450 convertible bond. As a result of the increased borrowing, Sibanye-Stillwater’s leverage ratio increased from 0.6 times as at 31 December 2016 to 2.6 times as at 31 December 2017, and as at 31 December 2017, Sibanye-Stillwater had committed undrawn debt facilities of R3,653 million. Sibanye-Stillwater’s credit facilities contain financial and other covenants and restrictions. Such covenants may include restrictions on Sibanye-Stillwater incurring additional financial indebtedness and obligations to maintain certain financial covenant ratios for as long as any amount is outstanding under such facilities. Specifically, Sibanye-Stillwater’s borrowing facilities, permit a leverage ratio of 3.5:1 through to 31 December 2018, and 2.5:1, thereafter, calculated on a quarterly basis. Although Sibanye-Stillwater plans to deleverage over time to its targeted leverage ratio of no greater than 1.0:1, there can be no guarantee that this will be achieved.
In the near-term, Sibanye-Stillwater expects to manage its liquidity needs from cash generated by its operations, cash on hand, the committed and unutilised debt facilities, as well as additional funding opportunities. Sibanye-Stillwater, if necessary in order to manage its covenants, may also consider options to increase funding flexibility which may include, among others, streaming facilities, prepayment facilities, facility restructuring or in the event that other options are not deemed preferable or achievable by the Board, an equity capital raise. However, there can be no assurance that funding will be available to Sibanye-Stillwater on acceptable terms, if at all, and that any of the measures which Sibanye-Stillwater may undertake to increase liquidity or actively manage its covenants would be successful. If Sibanye-Stillwater’s cost of debt were to increase or if it were to encounter other difficulties in obtaining financing, its sources of funding may not match its financing needs, which could have a material adverse effect on Sibanye-Stillwater’s business, operating results and financial condition.
| |
Sibanye-Stillwater | Form 20-F 2017 | 224 |
To the extent that Sibanye-Stillwater seeks to expand further through acquisitions, it may experience delays or other issues in executing acquisitions or managing and integrating the acquisitions with its existing operations
Sibanye-Stillwater has pursued, is pursuing and may continue to pursue growth opportunities through acquisitions in order to enhance or sustain its ability to pay an industry leading dividend and to allow it to consolidate operations, increase scale and implement best practices across operations. For example, in 2014, Sibanye-Stillwater completed the acquisitions of Wits Gold, Cooke and, through the Wits Gold acquisition, Burnstone.
Sibanye-Stillwater has also entered and may continue to seek to enter mining sectors related to its existing operations through acquisitions or other business combination transactions. For example, between 2016 and 2018, Sibanye-Stillwater concluded the Rustenburg operations acquisition, the Aquarius acquisition and the Stillwater Acquisition. On 14 December 2017, Sibanye-Stillwater announced that it had reached an agreement on the terms of a recommended all-share offer pursuant to which Sibanye-Stillwater, and/or a wholly-owned subsidiary of Sibanye-Stillwater, will acquire the entire issued and to be issued ordinary share capital of Lonmin plc, which operates three platinum mines in South Africa (the Lonmin Acquisition). The Lonmin Acquisition remains subject to conditions precedent. See ―Risks related to the Acquisitions. Further growth may occur through the acquisition of other companies and assets, development projects, or by entering into joint ventures.
The Stillwater Acquisition has expanded Sibanye-Stillwater’s operations to new geographies in which Sibanye-Stillwater has no prior operational experience. As an operator of mines in the United States, Sibanye-Stillwater will be exposed to increased US reporting requirements with which it may have difficulties complying. In addition, Sibanye-Stillwater has limited experience with the MSHA, which oversees and enforces regulations pertaining to the health and safety of workers at Sibanye-Stillwater’s US operations.
Sibanye-Stillwater’s recent acquisitions have led to increased costs related to ensuring governance, regulatory, legal and accounting compliance across multiple regions. Any future acquisitions or joint ventures may change the scale of Sibanye-Stillwater’s business and operations and may expose it to new geographical, geological, commodity, political, social, labour, operational, financial, legal, regulatory and contractual risks. Further, the acquisition of any assets that produce commodities other than gold or PGMs will expose Sibanye-Stillwater to the risk of operating in an environment and market with which its management has less experience. In addition, to the extent Sibanye-Stillwater participates in the development of a project through a joint venture or any other multi-party commercial structure, there could be disagreements, legal or otherwise, or divergent interests or goals amongst the parties, which could jeopardise the success of the project. There can be no assurance that any acquisition or joint venture, including the proposed Lonmin Acquisition (which remains subject to conditions precedent) or the acquisitions of Stillwater, the Rustenburg operations, Aquarius, Cooke, Wits Gold and Burnstone, or the acquisition of any new mining assets or operations, will achieve the results intended, and, as such, could have a material adverse effect on Sibanye-Stillwater’s business, operating results and financial condition.
Sibanye-Stillwater faces intense competition for the acquisition of attractive mining properties. From time to time, Sibanye-Stillwater evaluates the acquisition of ore reserves, development properties or operating mines, either as stand-alone assets or as part of existing companies. The decision to acquire these properties may be based on a variety of factors, including historical operating results, estimates and assumptions regarding the extent of the ore reserve, cash and other operating costs, gold and other mineral prices, projected economic returns and evaluations of existing or potential liabilities associated with the relevant property and its operations and how these factors may change in future. Other than historical operating results, these factors are uncertain and could have an impact on revenue, cash and other operating costs, as well as the process used to estimate the ore reserve.
The integration of any acquired assets requires management capacity. There can be no assurance that Sibanye-Stillwater’s current management team has sufficient capacity, nor that it can acquire additional skills to supplement that capacity, to integrate any acquired or new assets and operations into the Group and to realise cost and operational efficiencies at the acquired assets or maintain those at the existing operations.
To the extent that Sibanye-Stillwater seeks to further expand its current mining operations, it may experience problems associated with mineral exploration or developing mining projects
In order to expand its operations and reserve base organically, Sibanye-Stillwater relies on its existing exploration programmes and investigates, and may continue to investigate, the exploitation of mineralisation below the current mining levels and infrastructure limits at its operations. Sibanye-Stillwater is currently undertaking brownfields exploration at selected operations in South Africa. Brownfields exploration aimed at the depth extensions of Sibanye-Stillwater’s Beatrix operations is currently underway. In addition, ongoing drilling to further refine existing reserves as well as for the definition of future reserves is currently being undertaken at the Blitz Project. Sibanye-Stillwater has also been undertaking exploration activities at the Altar project, a large porphyry-style copper-gold deposit in Argentina and to a lesser extent at its Marathon project, a low grade PGM-Copper-Gold project in Ontario, Canada. Projects of this nature are generally capital intensive, have a long lead time and are subject to risks relating to the location of economic ore bodies, the development of appropriate extractive processes, cost overruns and delays, the receipt of necessary governmental permits and regulatory approvals and the extension of mining and processing facilities at the mining site.
Further, in cases where Sibanye-Stillwater explores the production of commodities other than gold or PGMs, Sibanye-Stillwater may be exposed to further risk of operating in an environment and market with which its management has less experience.
There can be no assurance that any exploration or expansion projects will be successful, partially or at all, and the failure of Sibanye-Stillwater to expand its reserves through such projects could have a material adverse effect on its business, operating results and financial condition.
Sibanye-Stillwater’s mineral reserves are estimates based on a number of assumptions, which, if changed, may require Sibanye-Stillwater to lower estimated mineral reserves
The mineral reserves of Sibanye-Stillwater are estimates based on assumptions regarding, among other things, Sibanye-Stillwater’s costs, expenditures, commodity prices, exchange rates, metallurgical and mining recovery assumptions, which may prove inaccurate due to a number of factors, many of which are beyond our control. For example, at the Stillwater Mine, unexpected geologic conditions, particularly faulting, have been, and can expect to be encountered as mining proceeds. The effect of faulting and its effects on geologic units that are close to the J-M Reef in some areas can result in additional dilution of ore grade during mining operations. In the event that we adversely revise any of the assumptions
| |
Sibanye-Stillwater | Form 20-F 2017 | 225 |
that underlie our mineral reserves, this may result in a revision of mineral reserves. In addition, mineral reserve estimates depend to some extent on statistical inferences drawn from limited drillings sample, which may prove to be unreliable or unrepresentative. Should Sibanye-Stillwater encounter mineralisation or formations at any of its mines or projects different from those predicted by drilling, sampling and similar examinations, mineral reserve estimates may have to be adjusted and mining plans may have to be altered. Any downward revision in Sibanye-Stillwater’s mineral reserves and, over the longer term, any failure to replace reserve ounces as they are mined may have a material adverse effect on its business, operating results, life of operations and financial condition.
Due to the mature infrastructure at our mining operations, unplanned breakdowns, statutory mandated modifications and stoppages may result in production delays, increased costs and industrial accidents
Nearly all of our operating shafts and processing plants at our gold and PGM operations, including those of our recently acquired assets, are relatively mature. Maintaining this infrastructure requires skilled human resources, capital allocation, management and regular, planned maintenance. Once a shaft or a processing plant has reached the end of its intended lifespan or needs modification to comply with the applicable regulatory standards, more than normal maintenance and care is required. Although we have a comprehensive maintenance strategy in place, incidents resulting in production delays, increased costs or industrial accidents may occur. There is also a risk that delays in procuring critical spares for major repairs may result in disruptions to production. Such incidents may have a material adverse effect on our business, operating results and financial condition.
Actual and potential supply chain shortages and increases in the prices of production inputs may have a material adverse effect on Sibanye-Stillwater’s operations and profits
Sibanye-Stillwater’s results of operations may be affected by the availability and pricing of raw materials and other essential production inputs, including, for example, explosives, fuel, steel, cyanide and other reagents required at our mining operations. The price and quality of raw materials may be substantially affected by changes in global supply and demand, along with weather conditions, governmental controls and other factors. A sustained interruption in the supply of any of these materials would require Sibanye-Stillwater to find acceptable substitute suppliers and could require Sibanye-Stillwater to pay higher prices for such materials. The prices of certain of Sibanye-Stillwater’s production inputs are impacted by, among other things, the prices of oil and steel which may be volatile. Any significant increase in the prices of these materials will increase Sibanye-Stillwater’s operating costs and affect production considerations.
Our business is subject to high fixed costs which may impact its profitability
The mining industry, particularly the gold and PGM mining industry, is generally labour intensive and characterised by high fixed costs on a short term operating basis. The majority of operating costs of each mine do not vary significantly with the production rate and, therefore, a relatively small change in productivity as a result of, for example, strikes or other work stoppages could have a disproportionate effect on operating and financial results. Costs are generally significantly more stable than revenues, the latter being driven by commodity price and exchange rates which can be volatile. Accordingly, changes in revenues due to commodity price or exchange rate movements could have a material adverse effect on Sibanye-Stillwater’s growth or financial performance. Above inflation increases in fixed costs such as labour or electricity costs may cause parts of Sibanye-Stillwater’s resources to become uneconomical to mine and lead to the closure of marginal shafts or other areas at its operations. This would impact on planned production levels and declared reserves and could have a material adverse effect on our business, operating results and financial condition. See Annual Financial Report—Overview—Management’s discussion and analysis of the financial statements—Factors affecting Sibanye-Stillwater’s performance—Costs.
Theft of gold, PGM and production inputs, as well as illegal artisanal mining, may occur on some of Sibanye-Stillwater’s properties. These activities are difficult to control, can disrupt Sibanye-Stillwater’s business and can expose Sibanye-Stillwater to liability
Sibanye-Stillwater has experienced illegal and artisanal mining activities and theft of precious metals bearing materials (which may be by employees or third parties) at its South African-based properties. In June 2017, with the agreement of NUM, Sibanye-Stillwater prohibited food being taken underground by employees at Cooke in order to prevent support from being provided to illegal miners by employees, following signs of collusion. After the implementation of these and other measures to combat illegal mining, 472 illegal miners surfaced from underground, and have been arrested. In addition, 77 employees have been arrested for assisting illegal miners at Cooke. Also see —Sibanye-Stillwater’s operations and profits have been and may be adversely affected by labour unrest and union activity. The activities of illegal and artisanal miners could lead to reduction of mineral reserves, potentially affecting the economic viability of mining certain areas and shortening the lives of the operations as well as causing possible operational disruption, project delays, disputes with illegal miners and communities, pollution or damage to property for which Sibanye-Stillwater could potentially be held responsible, leading to fines or other costs. Rising gold or PGM prices may result in an increase in gold or PGM theft expected to be principally at its South African-based mines. The occurrence of any of these events could have a material adverse effect on Sibanye-Stillwater’s business, operating results and financial condition.
Social unrest, sickness or natural or man-made disaster at informal settlements in the vicinity of some of Sibanye-Stillwater’s South African-based operations may disrupt its business or may lead to greater social or regulatory impositions on Sibanye-Stillwater
There are a number of informal settlements located in the vicinity of some of Sibanye-Stillwater’s South African-based operations. These settlements are populated by mining company employees (including Sibanye-Stillwater employees), the families of mining company employees and other people. As at 31 December 2017, 61% of Sibanye-Stillwater’s South African-based workforce opted to receive a “living out allowance” and management expects that a portion of these individuals reside in informal settlements. In recent years, the size of these settlements has grown substantially. Poor living conditions in these settlements may lead to the spread of disease or other health hazards, which may increase
| |
Sibanye-Stillwater | Form 20-F 2017 | 226 |
absences or affect the productivity of employees. The population of such settlements or the surrounding communities may also demand jobs, social services or infrastructure from the local mining operations, including Sibanye-Stillwater. Any such demands or other demands from these communities may lead to increased costs or regulatory burdens on Sibanye-Stillwater. Such demands may also lead to protests or other actions which may hinder Sibanye-Stillwater’s ability to operate.
Any of the above factors could have a material adverse effect on Sibanye-Stillwater’s business, reputation, operating results and financial condition.
Because our operations are regionally concentrated, disruptions in these regions could have a material adverse impact on the operations
The majority of our gold mining operations are located in the north western and south western margins of the Witwatersrand Basin in South Africa, and our South African platinum operations are located in the Western Bushveld Complex in close proximity to the town of Rustenburg in the North West Province. Our US operations are concentrated in Montana. As a result, any adverse economic, political or social conditions affecting these regions or surrounding regions, as well as natural disasters or coordinated strikes or other work stoppages, could have a material adverse effect on Sibanye-Stillwater’s business, operating results and financial condition.
If we lose senior management or are unable to hire and retain sufficient technically skilled employees or sufficient HDSA representation in management positions in South Africa, our business may be materially adversely affected
Our ability to operate or expand effectively depends largely on the experience, skills and performance of our senior management team and technically skilled employees. However, the global mining industry, especially in South Africa, including Sibanye-Stillwater, continues to experience a shortage of qualified senior management and technically skilled employees. We may be unable to hire or retain (due to departure or unavailability) appropriate senior management, technically skilled employees or other management personnel, or we may have to pay higher levels of remuneration than we currently intend in order to do so. In the United States, Sibanye-Stillwater depends on management and other key personnel in order to maintain its operations and support its projects. A loss of key management or other personnel at Sibanye-Stillwater’s US operations could prevent Sibanye-Stillwater from capitalising on business opportunities in the United States, as prior to the Stillwater Acquisition, Sibanye-Stillwater did not have any operational experience with the acquired assets or in the United States.
Additionally, as a condition of our mining rights in South Africa, we must ensure sufficient HDSA participation in our management and core and critical skills and failure to do so could result in fines or the loss or suspension of our mining rights. See ―Risks related to Sibanye-Stillwater’s business—Sibanye-Stillwater’s mineral rights are subject to legislation, which could impose significant costs and burdens and which impose certain ownership requirements, the interpretation of which are the subject of dispute. If we are unable to hire or retain appropriate management and technically skilled personnel or are unable to obtain sufficient HDSA representation in management positions, or if there are not sufficient succession plans in place, this could have a material adverse effect on our business, including production levels, operating results and financial position.
Sibanye-Stillwater’s insurance coverage may not adequately satisfy all potential claims in the future
Sibanye-Stillwater has an insurance programme, including partial self-insurance. However, it may become subject to liability against which it has not been insured, cannot insure or is insufficiently insured, including those relating to past mining activities. Sibanye-Stillwater’s existing property and liability insurance contains specific exclusions and limitations on coverage. For example, should Sibanye-Stillwater be subject to any regulation or criminal fines or penalties, these amounts would not be covered under its insurance programme. Should Sibanye-Stillwater suffer a major loss, which is insufficiently covered, future earnings could be affected. In addition, certain classes of insurance may not continue to be available at economically acceptable premiums. As a result, in the future, Sibanye-Stillwater’s insurance coverage may not fully cover the extent of claims against it or any cross-claims made.
Sibanye-Stillwater utilises information technology and communications systems, the failure of which could significantly impact its operations and business
Sibanye-Stillwater utilises and is reliant on various information technology and communications systems, in particular SAP, payroll and time and attendance applications. Damage or interruption to Sibanye-Stillwater’s information technology and communications systems, whether due to accidents, human error, natural events or malicious acts, may lead to important data being irretrievably lost or damaged, thereby adversely affecting Sibanye-Stillwater’s business, operating results and financial condition.
These systems may be subject to security breaches (e.g. cyber-crime or activists) or other incidents that can result in misappropriation of funds, increased health and safety risks to people, disruption to our operations, environmental damage, loss of intellectual property, disclosure of commercially or personally sensitive information, legal or regulatory breaches and liability, other costs and reputational damage. While no material losses related to cyber security breaches have been discovered, given the increasing sophistication and evolving nature of this threat, we cannot rule out the possibility of them occurring in the future. An extended failure of critical system components, caused by accidental, or malicious actions, including those resulting from a cyber security attack, could result in a significant environmental incident, commercial loss or interruption to operations.
Sibanye-Stillwater is subject to risks associated with litigation and regulatory proceedings
As with most large corporations, Sibanye-Stillwater is involved, from time to time, as a party to various lawsuits, arbitrations, regulatory proceedings or other disputes. Litigation, arbitration, regulatory proceedings and other types of disputes involve inherent uncertainties and, as a result, Sibanye-Stillwater faces risks associated with adverse judgements or outcomes in these matters. Even in cases where Sibanye-Stillwater
| |
Sibanye-Stillwater | Form 20-F 2017 | 227 |
may ultimately prevail on the merits of any such dispute, Sibanye-Stillwater may face significant costs defending its rights, lose certain rights or benefits during the pendency of any such litigation, arbitration, regulatory proceeding or other dispute, or suffer reputational damage as a result of its involvement therewith. Sibanye-Stillwater is currently engaged in a number of legal and regulatory proceedings, including as described under Annual Financial Report—Accountability—Directors’ report—Litigation. There can be no assurance as to the outcome of any litigation, arbitration, regulatory proceeding or other dispute, and the adverse determination of material litigation could have a materially adverse effect on Sibanye-Stillwater’s business, operating results and financial condition. Also see ―Sibanye-Stillwater’s operations are subject to environmental, health and safety regulations, which could impose additional costs and compliance requirements, and Sibanye-Stillwater has faced, and may face further, claims and liability for breaches, or alleged breaches, of such regulations and other applicable laws.
An actual or alleged breach or breaches in governance processes, or fraud, bribery and corruption may lead to public and private censure, regulatory penalties, loss of licenses or permits and impact negatively upon our empowerment status and may damage Sibanye-Stillwater’s reputation
The legal and regulatory framework in which Sibanye-Stillwater operates is complex, and its governance and compliance policies and processes may not prevent potential breaches of law or accounting or other governance practices. Sibanye-Stillwater’s operating and ethical codes, among other standards and guidance, may not prevent instances of fraudulent behaviour and dishonesty, nor guarantee compliance with legal and regulatory requirements.
To the extent that Sibanye-Stillwater suffers from any actual or alleged breach or breaches of relevant laws (including South African anti-bribery and corruption legislation or the US Foreign Corrupt Practices Act of 1977) under any circumstances, they may lead to regulatory and civil fines, litigation, public and private censure, loss of operating licenses or permits and impact negatively upon Sibanye-Stillwater’s empowerment status and may damage its reputation. The occurrence of any of these events could have a material adverse effect on Sibanye-Stillwater’s business, operating results and financial condition.
Title to Sibanye-Stillwater’s properties may be uncertain and subject to challenge
Certain of Sibanye-Stillwater’s properties may be subject to the rights or the asserted rights of various community stakeholders, including indigenous people. The presence of those stakeholders may have an impact on Sibanye-Stillwater’s ability to develop or operate its mining interests. For example, in South Africa, the Extension of Security of Tenure Act (1997), the Restitution of Land Rights Act (1994) and the Prevention of Illegal Eviction from and Unlawful Occupation of Land Act (1998) and the Labour Tenants Act (1996) provide for various landholding rights. Such legislation is complex, difficult to predict and outside of Sibanye-Stillwater’s control, and could therefore negatively affect the business results of new or existing projects. Where consultation with stakeholders is statutorily or otherwise mandated, relations may not remain amicable and disputes may lead to reduced access to properties or delays in operations. Title to Sibanye-Stillwater’s properties, particularly undeveloped ones, may also be defective or subject to challenge. Title review does not necessarily preclude third parties from contesting ownership.
Sibanye-Stillwater’s US properties in Montana include a number of unpatented mining and mill site claims. The validity of unpatented mining claims on public lands is often uncertain, and possessory rights of claimants may be subject to challenge.
In addition, Sibanye-Stillwater pays annual maintenance fees and has obtained mineral title reports and legal opinions for some of the unpatented mining claims or mill sites making up portions of its US properties, in accordance with applicable laws and what Sibanye-Stillwater believes is standard industry practice. However, Sibanye-Stillwater cannot be certain that applicable laws will not be changed nor that Sibanye-Stillwater’s possessory rights to any of its unpatented claims may not be deemed defective and challenged.
As a result, any such legislation could change the cost of holding unpatented mining claims and could significantly affect Sibanye-Stillwater’s ability to develop ore reserves located on unpatented mining claims. All of the foregoing could adversely affect the economic and financial viability of future mining operations at such mines. Although it is impossible to predict at this point what any legislated royalties might be, enactment could adversely affect the potential for development of such federal unpatented mining claims.
Sibanye-Stillwater's US recycling business is dependent on relationships with third-party suppliers and has other credit and operational risks
In the United States, Sibanye-Stillwater sources automotive and industrial catalyst materials from third-parties through both purchase and tolling arrangements. Sibanye-Stillwater has entered into sourcing arrangements for recycled materials with various suppliers, and it depends on those suppliers to provide catalyst and other industrial sources for recycling. Sibanye-Stillwater is subject to the suppliers' compliance with the terms of these arrangements and to their contractual right to terminate or suspend the agreement. Should one or more of these sourcing arrangements be terminated, Sibanye-Stillwater might be unable to source replacement recyclable materials on terms that are acceptable to Sibanye-Stillwater. If Sibanye-Stillwater is unable to source sufficient quantities of recycled materials, the US recycling business would become less profitable, and this loss could negatively affect Sibanye-Stillwater's business and results of operations. Similarly, these suppliers in turn typically source material from various other third-parties in a competitive market, and there can be no assurance of the suppliers' continuing ability or willingness to source material on behalf of Sibanye-Stillwater at current volumes and prices. Any constraint on the suppliers' ability to source material could reduce the profitability of Sibanye-Stillwater's US recycling business.
From time to time, Sibanye-Stillwater may advance cash to third party brokers and suppliers to support the purchase and collection of spent catalyst materials and other industrial sources. These advances are normally made at the time material is ready for shipment or already in transit to Sibanye-Stillwater's facilities. In some cases, Sibanye-Stillwater has a security interest in the materials that the suppliers have procured but for which Sibanye-Stillwater has not yet received. The unsecured portion of these advances is fully at risk.
Sibanye-Stillwater regularly advances money to its established recycling suppliers for catalyst material that Sibanye-Stillwater has physically received and carries in its processing inventories. These advances typically represent some portion of the estimated total value of each shipment until final assays are completed determining the actual PGM content of the shipment. Upon completion of the shipment assays, a final settlement takes place based on the actual value of the shipment. However, pending completion of the assays, the payments are based on the estimated
| |
Sibanye-Stillwater | Form 20-F 2017 | 228 |
PGM content of each shipment, which could vary significantly from the actual PGM content upon assay. Should the estimated PGM content upon assay significantly exceed the actual PGM content, Sibanye-Stillwater may be at risk for a portion of the amount advanced. Should the supplier be unable to settle such an overpayment or seek protection from creditors, Sibanye-Stillwater could incur a loss to the extent of any overpayment.
In its US recycling business, Sibanye-Stillwater regularly enters into fixed forward sales contracts for metal produced from catalyst recycling, normally making these commitments at the time the catalyst material is purchased. For Sibanye-Stillwater's fixed forward sales related to recycling of catalysts, Sibanye-Stillwater is subject to the customers' compliance with the terms of the agreements, their ability to terminate or suspend the agreements and their willingness and ability to pay. The loss of any of these agreements or failure of a counterparty to perform could require Sibanye-Stillwater to sell or purchase the contracted metal in the open market, potentially at a significant loss. Sibanye-Stillwater's revenues for the year ended 31 December 2017, included 10% from recycling sales and tolling fees in the United States.
Many of Sibanye-Stillwater's US recycling suppliers are comparatively small businesses with limited assets and relatively little credit capacity. While Sibanye-Stillwater monitors funds being advanced to such businesses and seeks to limit its exposure to any one supplier, if a problem develops with such a supplier, Sibanye-Stillwater might not be able to fully recover amounts previously advanced to that supplier.
Volumes of recycling materials available in the marketplace fluctuate substantially in response to changes in commodity prices. Lower PGM and steel prices normally reduce the volume of recycling material available in the market, resulting in less earnings and cash flow from the recycling segment, and therefore less economic support for the mining operations. Should it become necessary at any point to reduce or suspend operations at the mines, the proportion of processing costs allocated to the recycling segment would increase substantially. Further, the ability to operate the smelter and refinery without significant volumes of mine concentrates and the contained copper and nickel has never been demonstrated and would likely require modification to the processing facilities. There is no assurance that the recycling facilities can operate profitably in the absence of significant mine concentrates, or that capital would be available to complete necessary modifications to the processing facilities.
For its PGMs mined in the United States, Sibanye-Stillwater's sales arrangements concentrate all its final refining activity and a large portion of its PGM sales from mine production with one entity
Under the terms of Sibanye-Stillwater's agreements with Johnson Matthey, Sibanye-Stillwater utilises Johnson Matthey for all of its precious metals refining services for Sibanye-Stillwater's US operations. In addition, with the exception of certain pre-existing platinum sales commitments to Tiffany & Co., all of Sibanye-Stillwater's current mined palladium and platinum in the United States is committed for sale to Johnson Matthey. Separately, Johnson Matthey has the right to bid on any recycling PGM ounces Sibanye-Stillwater has available in the United States.
This significant concentration of business with Johnson Matthey could leave Sibanye-Stillwater without precious metal refining services in the United States should Johnson Matthey experience significant financial or operating difficulties during the contract period. Under such circumstances, it is not clear that sufficient alternate processing capacity would be available to cover Sibanye-Stillwater's requirements, nor that the terms of any such alternate processing arrangements as might be available would be financially acceptable to Sibanye-Stillwater. Any such disruption in refining services would have a negative effect on Sibanye-Stillwater's ability to generate revenues, profits, and cash flows.
Sibanye-Stillwater’s operations are subject to environmental, health and safety regulations, which could impose additional costs and compliance requirements, and Sibanye-Stillwater has faced, and may face further, claims and liability for breaches, or alleged breaches, of such regulations and other applicable laws
South Africa
Sibanye-Stillwater’s operations are subject to various environmental and health and safety laws, regulations, permitting requirements and standards in South Africa. For example, Sibanye-Stillwater is required to fund environmental rehabilitation costs by making contributions into South African environmental trust funds and with insurance guarantees. Sibanye-Stillwater has and may in the future incur significant costs to comply with environmental and health and safety requirements imposed under existing or new legislation, regulations or permit requirements, or to comply with changes in existing laws and regulations or the manner in which they are applied. These costs could have a material adverse effect on Sibanye-Stillwater's business, results of operations and financial condition.
For example, the regulations which determine the extent of financial provision required to fund environmental rehabilitation costs were recently revised in Government Notice Regulation (GNR) 1147 of 20 November 2015. These regulations now expressly require financial provision to be set aside for annual rehabilitation. They also place an emphasis on the need for adequate provision for latent and post closure impacts, an impact which mines often did not fully provide for in the past. The regulations have been strongly opposed by the mining industry generally. The reason for doing so is a perception that they substantially increase the amount of financial provision now required and that they are unduly burdensome to new mining entrants. There is also a concern about the ambiguity in some of the provisions, and how they can be operationalised within the prescribed transitional timeframes. In an attempt to address this issue, the DEA has issued a clarification note and is engaging with industry to address their concerns. There are likely to be amendments to these regulations in the near or mid-term future in order to clarify these issues.
Sibanye-Stillwater has and may in the future also be subject to litigation and other costs as well as actions by authorities relating to environmental and health and safety matters, including mine closures, the suspension of operations and prosecution for industrial accidents as well as significant penalties and fines for non-compliance. In addition, there can be no assurance that unions will not take action in response to industrial accidents, which could lead to losses in Sibanye-Stillwater’s production and negatively affect Sibanye-Stillwater’s reputation. Any additional stoppages in production or increased costs associated with such incidents, could have a material adverse effect on Sibanye-Stillwater’s business, operating results and financial condition.
As environmental laws and regulations are becoming more complex and stringent, Sibanye-Stillwater’s environmental management plans and/or programmes and other environmental licenses may be the subject of increasingly strict interpretation or enforcement or become more comprehensive, and could result in increased capital or operating expenditure or financial or other penalties and/or the suspension or loss of
| |
Sibanye-Stillwater | Form 20-F 2017 | 229 |
Sibanye-Stillwater’s rights. For example, Sibanye-Stillwater faces increasing challenges and costs to comply with regulations requiring dust control and water quality management at its operations. Sibanye-Stillwater could face material cost overruns in meeting these compliance obligations. The occurrence of any of these risks could have a material adverse effect on Sibanye-Stillwater’s business, financial condition, results of operations and prospects.
The principal health risks associated with Sibanye-Stillwater’s mining operations arise from occupational exposure and community environmental exposure to silica dust, noise and certain hazardous substances, including toxic gases and radioactive particulates. The most significant occupational diseases affecting Sibanye-Stillwater’s workforce include lung diseases (such as silicosis, tuberculosis, a combination of the two and COAD) as well as NIHL. Employees have sought and may continue to seek compensation for certain illnesses, such as silicosis, from their employer under workers compensation and also, at the same time, in a civil action under common law (either as individuals or as a class). Such actions may also arise in connection with the alleged incidence of such diseases in communities proximate to Sibanye-Stillwater’s mines.
Two suits have been filed against Sibanye-Stillwater and several South African mining companies on behalf of current and former gold mine workers and the dependents of gold mine workers who have contracted or died from silicosis or tuberculosis. A consolidated application for certification of these classes was granted by the High Court in Johannesburg on 13 May 2016. The certification of the class means that the claimants are able to sue the mining companies as a class. The class will, however, still have to prove its claim as required by the law. If a significant number of individual claims were suitably established against Sibanye-Stillwater, the payment of damages for the claims could have a material adverse effect on Sibanye-Stillwater’s business, reputation, results of operations and financial position. Various Respondents to the class action certification application filed an Application for Leave to Appeal the class action certification application judgement. Heads of Arguments were exchanged by the parties and the matter was argued before Judge Majopelo, Judge Valli and Acting Judge Windell on 23 June 2016. An oral judgement was handed down in the Application for Leave to Appeal on 24 June 2016, whereby Leave to Appeal to the Supreme Court of Appeal against the transmissibility of general damages was granted and the Leave to Appeal the Certification of the Class Action was denied. Following the refusal to grant Leave to Appeal the Certification of the Class Action, various Respondents filed applications for Leave to Appeal in the Supreme Court of Appeal on 15 July 2016. The Supreme Court of Appeal subsequently granted Leave to Appeal the Certification of the Class Action and on 11 January 2018, the Supreme Court of Appeal granted a postponement of the appeal in an attempt to further settlement discussions between the parties. Sibanye-Stillwater has provisioned R1.2 billion for a possible settlement. Any settlement will be subject to court approval. Further, any new regulations, potential litigations or any changes to health and safety laws which increase the burden of compliance or the penalties for non-compliance may cause Sibanye-Stillwater to incur further significant costs and could have a material adverse effect on Sibanye-Stillwater’s business, operating results and financial position.
Regulators, such as the DMR, can and do issue, in the ordinary course of operations, instructions, such as Section 54 orders, following safety incidents or accidents to partially or completely halt operations at affected mines. Historically, Section 54 orders have been more prevalent in the PGM industry and as such, the Rustenburg operations, Kroondal, Mimosa and Platinum Mile are at a heightened risk of being affected by stoppages resulting from such orders. In addition, South Africa’s deputy Mineral Resources Minister has stated that the ministry may increase sanctions, including closures, for mines in which fatalities occur because of violations of health and safety rules. In fiscal 2017, Sibanye-Stillwater’s gold operations experienced 204 work stoppages (2016: 171 and 2015: 109) at the South African gold operations and 26 Section 54 orders at the South African PGM operations (2016: 55). It is Sibanye-Stillwater’s policy to halt production at its operations when serious accidents occur in order to rectify dangerous situations and, if necessary, retrain workers. In addition, there can be no assurance that unions will not take industrial action in response to such accidents which could lead to losses in Sibanye-Stillwater’s production. Any additional stoppages in production, or increased costs associated with such incidents, could have a material adverse effect on Sibanye-Stillwater’s business, operating results and financial condition. Such incidents may also negatively affect Sibanye-Stillwater’s reputation with, among others, employees, unions and regulators.
United States
In the United States, the business of Sibanye-Stillwater is subject to extensive federal, state and local environmental controls and regulations, including regulations associated with the implementation of the Clean Air Act, Clean Water Act, Resource Conservation and Recovery Act, Metal Mine Reclamation Act and numerous permit stipulations as documented in the Record of Decision for each operating entity, including those relating to the protection of threatened and endangered species under the Endangered Species Act. Properties controlled by Sibanye-Stillwater in Canada and Argentina are subject to analogous federal and provincial controls and regulations in those respective countries. The body of environmental laws is continually changing and, as a general matter, is becoming more restrictive. Compliance with these regulations requires Sibanye-Stillwater to obtain permits issued by federal, state, provincial and local regulatory agencies. Failure to comply with applicable environmental laws, regulations and permitting requirements, whether now or in the future, may result in enforcement actions, including orders issued by regulatory or judicial authorities, causing operations to cease or to be curtailed, and may include corrective measures requiring capital expenditures, installation of additional equipment or remedial actions. Non-renewal of permits, the inability to secure new permits, or the imposition of additional conditions could eliminate or severely restrict Sibanye-Stillwater’s ability to conduct its operations.
Sibanye-Stillwater’s existing mining operations in the United States are located adjacent to the Absaroka-Beartooth Wilderness Area and are situated approximately 30 miles from the northern boundary of Yellowstone National Park. While Sibanye-Stillwater works closely and cooperatively with local environmental organizations, the Montana Department of Environmental Quality and the United States Forest Services, there can be no assurance that future political or regulatory efforts will not further restrict or seek to terminate Sibanye-Stillwater’s operations in this sensitive area. In addition, environmental hazards or damage may exist on mineral properties held by Sibanye-Stillwater that were caused by previous owners or operators or that may have occurred naturally, and that are unknown to Sibanye-Stillwater at the present time. In some cases, Sibanye-Stillwater could be required to remedy such damage.
Sibanye-Stillwater’s US mining activities are also subject to extensive laws and regulations governing occupational health and safety, including mine safety, toxic substances and other matters. The costs associated with compliance with such laws and regulations are substantial. Sibanye-Stillwater employs various measures in its operating facilities in an effort to protect the health and safety of its workforce. Underground mines in the US, including the Stillwater and East Boulder mines, are continuously inspected by MSHA, which inspections can lead to notices of violation. Any of Sibanye-Stillwater’s US mines could be subject to a temporary or extended shut down as a result of a violation alleged by MSHA. Possible
| |
Sibanye-Stillwater | Form 20-F 2017 | 230 |
future laws and regulations, or more restrictive interpretations of current laws and regulations by governmental authorities, could cause additional expense, capital expenditures, restrictions on or suspensions of operations and delays in the development of new properties.
Sibanye-Stillwater is required to post and maintain surety for its reclamation obligations, which are substantial. At 31 December 2017, Sibanye-Stillwater had US$42.6 million of outstanding environmental surety bonds in the United States. Such reclamation obligations generally increase over time as costs rise and the physical extent of mining operations expands. Failure to secure and maintain adequate surety coverage could result in the operating permits of such mines being revoked and mining operations terminated.
In addition to formal regulatory requirements, Sibanye-Stillwater’s US operations were parties to environmental and social collaborations with local communities and interest groups that is rooted in the Good Neighbor Agreement (GNA). The GNA legally binds Sibanye-Stillwater to certain commitments and holds it to higher standards than federal and state regulations require. These commitments include regular, transparent, and productive interaction with all affected stakeholders, which primarily includes three local stakeholder organisations that meet regularly with Sibanye-Stillwater to discuss operations, future planning, and other issues, including direct impacts on local communities, such as traffic volumes. This framework provides a mechanism for the general public to voice concerns and to become informed on operations.
Failure to comply with any of its regulatory or other commitments would have a material adverse effect on Sibanye-Stillwater’s business, operating results and financial condition.
Sibanye-Stillwater is subject to the imposition of various regulatory costs, such as mining taxes and royalties, changes to which may have a material adverse effect on Sibanye-Stillwater’s operations and profits
In recent years, governments, communities, non-governmental organisations and trade unions in several jurisdictions have sought and, in some cases, have implemented greater cost imposts on the mining industry, including through the imposition of additional taxes and royalties. Such resource nationalism, whether in the form of cost imposts, interference in project management, mandatory social investment requirements, local content requirements or creeping expropriation could impact the global mining industry and Sibanye-Stillwater’s business, operating results and financial condition.
In December 2017, during the African National Congress’s (ANC) national conference, the ANC resolved that as a matter of policy, the ANC should pursue the expropriation of land without compensation, provided that such expropriation is carried out without destabilising the agricultural sector, endangering food security or undermining economic growth and job creation. On 27 February 2018, the National Assembly assigned the Constitutional Review Committee (CRC) to review section 25 of South Africa’s Constitution and other relevant clauses to make it possible for the state to expropriate land in the public interest without compensation. The CRC has a deadline until 30 August 2018 to report their findings to the National Assembly. At this stage, it is not clear what recommendations the CRC may make. In the event that the CRC recommends a Constitutional amendment in favour of expropriation, various procedural milestones would need to occur, including a bill amending section 25 of the Constitution approved by a majority of the National Assembly as well as six of the nine provinces of the NCOP and signed by the President, among others.
The MPRDA provides a statutory right of access for the mining right holder to the mining area for the purposes of conducting mining operations and does not require the holder to own the land on which it conducts operations. Once a mining right is granted, a landowner cannot refuse a lawful mining right holder the right to conduct its mining operations. In addition, the landowner is not entitled to compensation from the mining right holder for the use of the land for mining operations conducted in terms of the MPRDA.
In South Africa, the ANC has adopted two recommended approaches to interacting with the mining industry. While the ANC has rejected the possibility of mine nationalisation for now, the first approach contemplates, among other things, greater state intervention in the mining industry, including the revision of existing royalties, the imposition of new taxes and an increase in the South African government’s holdings in mining companies. The second approach contemplates the South African government taking a more active role in the mining sector, including through the introduction of a state mining company to be involved in new projects either through partnerships or individually.
The adopted policies may impose additional restrictions, obligations, operational costs, taxes or royalty payments on mining companies, including Sibanye-Stillwater, any of which could have a material adverse effect on Sibanye-Stillwater’s business, operating results and financial condition.
The South African President has appointed the Davis Tax Committee to look into and review the current mining tax regime. The committee’s first interim report on mining, which was released for public comment on 13 August 2015, proposed no changes to the royalty regime but recommended the discontinuation of the upfront capital expenditure write-off regime in favour of an accelerated capital expenditure depreciation regime. In addition, the report recommended retaining the so called “gold formula” for existing gold mines only, as new gold mines would be unlikely to be established in circumstances where profits are marginal or where gold mines would conduct mining of the type intended to be encouraged by the formula. The committee also recommended the phasing out of additional capital allowances available to gold mines in order to bring the gold mining corporate income tax regime in line with the tax system applicable to all taxpayers. On 13 November 2017, following a period of public comment, the Davis Tax Committee issued its final report which largely reaffirmed its initial recommendations. The South African National Treasury will continue to consider the Davis Tax Committee’s final recommendations. It is not clear at this stage which, if any, of the recommendations will be adopted as legislation.
Regulation of greenhouse gas (GHG) emissions and climate change issues may materially adversely affect Sibanye-Stillwater’s operations
Energy is a significant input and cost to Sibanye-Stillwater’s mining and processing operations, with its principal energy sources being electricity, purchased petroleum products, and natural gas. A number of governments or governmental bodies, including the United Nations Framework Convention on Climate Change, have introduced or are contemplating regulatory changes in response to the potential impact of climate change. Many of these contemplate restricting of GHG in jurisdictions in which Sibanye-Stillwater operates.
The South African government plans to introduce a carbon tax. The carbon tax was intended to come into effect from 1 January 2015 but, in order to align the framework of the proposed carbon tax with the desired reduction outcomes, the implementation of the carbon tax was postponed. The National Treasury published for comment a draft carbon tax bill (the Draft Carbon Tax Bill) with a view to the implementation of the tax by January
| |
Sibanye-Stillwater | Form 20-F 2017 | 231 |
2017. A new draft bill was adopted in August 2017 and the South African parliament released the draft bill in December 2017 for comment and the bill is expected to be enacted before the end of fiscal 2018. The South African government proposed to implement the tax from 1 January 2019 to meet its nationally determined contributions under the 2016 Paris Agreement of the United Nations Framework Convention on Climate Change. The National Treasury has stated that the carbon tax will be designed to ensure that it has no net impact on the electricity price. In June 2016, the South African National Treasury published the draft regulations on the “Carbon Offset”. The Carbon Offset is one of the allowances that carbon tax-liable entities can employ to reduce their tax-related exposure. In addition, the Department of Environmental Affairs (the DEA) is currently working on draft legislation that will impose so-called “carbon budgets” on entities in identified high-emitting industries, including mining, which are intended to operate as statutory limits for carbon dioxide equivalent emissions (or CO2e), emissions in excess of which may entail a fine or other punitive measures. In terms of the current Draft Carbon Tax Bill, companies that participate in the carbon budget system will be eligible for a 5% allowance under the carbon tax. While many aspects of the proposed carbon tax remain uncertain, the direct financial implications of government’s proposed carbon tax for Sibanye-Stillwater, in today’s terms, at the 2016 carbon footprint and at an anticipated rate of R120/t of CO2e, would be between approximately R4 million and R25 million per annum on the premise that electricity (i.e. Scope 2 emissions) is excluded. The potential net effect of proposed allowances is to permit the reduction of a carbon tax by 60% to 95%. In other words, Sibanye-Stillwater’s final liability will be significantly informed by the extent it is able to make use of the full suite of allowances that are built into the carbon tax design.
In addition, a number of other regulatory initiatives are underway in countries in which Sibanye-Stillwater operates that seek to reduce or limit industrial greenhouse gas emissions. These regulatory initiatives will be either voluntary or mandatory and are likely to impact Sibanye-Stillwater’s operations directly or by affecting the cost of doing business, for example by increasing the costs of its suppliers or customers. Inconsistency of regulations particularly between developed and developing countries may affect both Sibanye-Stillwater’s decision to pursue opportunities in certain countries and its cost of operations. For more information, see Further Information―Environmental and regulatory matters―Environmental.
In the United States, Sibanye-Stillwater is subject to legislative and regulatory initiatives that are underway to limit GHG emissions. The US Congress has considered legislation that would control GHG emissions through a “cap and trade” program and several US states have already implemented programs to reduce GHG emissions. In addition, The US Supreme Court determined in a 2007 ruling that GHG emissions are “air pollutants” within the meaning of the federal Clean Air Act (CAA), and in response the US Environmental Protection Agency (EPA) promulgated an endangerment finding paving the way for regulation of GHG emissions under the CAA. In 2010, the EPA issued a final rule, known as the “Tailoring Rule”, that makes certain large stationary sources and modification projects subject to permitting requirements for GHG emissions under the CAA. In June 2014, the US Supreme Court invalidated portions of the federal Tailoring Rule, but the ruling upheld the EPA’s authority to require new or modified facilities that already are subject to permitting requirements for conventional pollutants to comply with Best Available Control Technologies (BACT) for GHGs, as well. In 2015, the EPA rescinded the portions of the Tailoring Rule that had been overturned by the Supreme Court. However, the EPA indicated that new or modified sources subject to permitting for conventional pollutants will be required to access BACT for GHG if the new source or the modification will result in an annual increase of 75,000 tons per year of CO2e. During 2016, US legislative and regulatory initiatives to limit GHG emissions were primarily focused through the Clean Power Planning Rule which is intended to limit emissions from power generating facilities.
In 2009, the EPA issued a final rule requiring the reporting of GHGs from specified large GHG emission sources in the US beginning in 2011. Given the higher level of air quality emissions, the Stillwater Mine holds a Title V Major Air Quality Permit. As a result, Sibanye-Stillwater is required to annually calculate the GHG emissions from the Stillwater Mine and compare these amounts against reporting thresholds. However, Sibanye-Stillwater is not required to report GHG emissions at this time, given current levels are below reporting thresholds. Additionally, the assessment of GHG emissions is becoming an increasingly important part of US National Environmental Policy Act (NEPA) assessments, and as a result Sibanye-Stillwater may be required to mitigate its GHG emissions in connection with any future NEPA review.
Nevertheless, regulation of GHG emissions is relatively new, and a great deal of debate continues to ensue. The Clean Power Plan remains subject to a stay imposed by the US Supreme Court pending a review and decision from the US District of Columbia Circuit Court of Appeals. However, numerous states have indicated that they may move forward with increased GHG regulation and their own defence of the Clean Power Plan. As a result, further regulatory, legislative and judicial developments are difficult to predict. Due to the uncertainties surrounding the regulation of and other risks associated with GHG emissions, Sibanye-Stillwater cannot predict the financial impact of future US GHG regulations and related developments on the Stillwater operations.
There can be no assurance that Sibanye-Stillwater will be able to meet its voluntary targets relating to GHG emissions or comply with targets that may be imposed upon the mining industry by external regulators. Furthermore, additional, new and/or different regulations in this area, such as the imposition of stricter limits than those currently contemplated, could be enacted, all of which could have a material adverse effect on Sibanye-Stillwater’s business, financial condition, results of operations and prospects. Furthermore, the potential physical impacts of climate change on Sibanye-Stillwater’s operations are highly uncertain and may adversely impact the cost, production and financial performance of Sibanye-Stillwater’s operations.
The effect of US tax reform legislation on Sibanye-Stillwater and its subsidiaries, whether adverse or favourable, is uncertain
On 22 December 2017, new federal tax reform legislation, known as the Tax Cuts and Jobs Act, was enacted in the United States, resulting in significant changes from previous US federal tax law. The changes include, among others, a permanent reduction to the US federal corporate income tax rate to 21% from 35%, effective 1 January 2018. However, notwithstanding the reduction in the corporate income tax rate, the overall impact of the Tax Cuts and Jobs Act on Sibanye-Stillwater and its subsidiaries, whether adverse or favourable, is still uncertain and may not become evident for some period of time.
| |
Sibanye-Stillwater | Form 20-F 2017 | 232 |
Risks related to South Africa
Economic, political or social instability affecting the regions where Sibanye-Stillwater operates may have a material adverse effect on Sibanye-Stillwater’s operations and profits
Sibanye-Stillwater is a South African domiciled company with the majority of its operations located within South Africa. Changes to or increased instability in the economic, political or social environment in South Africa or in surrounding countries could create uncertainty which discourages investment in the region and may affect an investment in Sibanye-Stillwater. In February 2018, Jacob Zuma resigned as President of South Africa and was replaced by Cyril Ramaphosa. It is not certain what if any political, economic or social impacts the newly elected President will have on South Africa, or on Sibanye-Stillwater specifically. High levels of unemployment and a shortage of critical skills in South Africa, despite increased government expenditure on education and training, remain issues and deterrents to foreign investment. The volatile and uncertain labour environment, which severely impacts on the local economy and investor confidence, has led and may lead to further downgrades in national credit ratings, making investment more expensive and difficult to secure. See ―Risks related to Sibanye-Stillwater’s business—Sibanye-Stillwater’s operations and profits have been and may be adversely affected by labour unrest and union activity and ―A further downgrade of South Africa’s credit rating may have an adverse effect on Sibanye-Stillwater’s ability to secure financing. This may restrict Sibanye-Stillwater’s future access to international financing and could have a material adverse effect on Sibanye-Stillwater’s business, operating results and financial condition.
In addition, while the South African government has stated that it does not intend to nationalise mining assets or mining companies, certain new smaller political parties have stated publicly and in the media that the government should embark on a programme of nationalisation. Any threats, or actual proceedings, to nationalise any of Sibanye-Stillwater’s assets, could halt or curtail operations, resulting in a material adverse effect on Sibanye-Stillwater’s business, operating results and financial condition and could cause the value of Sibanye-Stillwater’s securities to decline rapidly and dramatically, possibly causing investors to lose the entirety of their respective investments.
A further downgrade of South Africa’s credit rating may have an adverse effect on Sibanye-Stillwater’s ability to secure financing
Prior to 2017, the challenges facing the mining industry and other sectors, among other factors, had resulted in the downgrading of South Africa’s sovereign credit rating to non-investment grade, or junk, by Standard & Poor’s and Fitch Ratings. On 23 November 2017, Standard & Poor’s further downgraded South Africa’s sovereign credit rating to BB with a stable outlook due to, among other things, declining consumption on a per capita basis, economic growth performance that is among the weakest of emerging market sovereigns and income inequality that is among the highest in the world. On 23 November 2017, Fitch Ratings reaffirmed its South Africa’s sovereign credit rating of BB+ with a negative outlook. On 9 June 2017, Moody’s downgraded South Africa’s sovereign credit rating to Baa3 with a negative outlook. On 23 March 2018, Moody’s affirmed its Baa3 sovereign credit rating for South Africa and upgraded its outlook to stable, citing the beginning of reform under President Ramaphosa.
Further downgrading of South Africa’s sovereign credit rating to non-investment grade status by Standard & Poor’s, Moody’s or Fitch Ratings may adversely affect the South African mining industry, including Sibanye-Stillwater, by making it more difficult to obtain external financing or could result in any such financing being available only at greater cost or on more restrictive terms than might otherwise be available. The recent downgrades of South Africa’s sovereign credit rating could also have a material adverse effect on the South African economy as many pension funds and other large investors are required by internal rules to sell bonds once two separate agencies rate them as non-investment grade. Any such negative impact on the South African economy may adversely affect the South African mining industry and Sibanye-Stillwater’s business, operating results and financial condition.
Sibanye-Stillwater’s financial flexibility could be materially constrained by South African Exchange Control Regulations
South Africa’s Exchange Control Regulations restrict the export of capital from South Africa, the Republic of Namibia and the Kingdoms of Lesotho and Swaziland, known collectively as the CMA. Transactions between South African residents (including companies) and non-residents of the CMA are subject to exchange controls enforced by the SARB. As a result, Sibanye-Stillwater’s ability to raise and deploy capital outside the CMA is restricted. These restrictions could hinder Sibanye-Stillwater’s financial and strategic flexibility, particularly its ability to raise funds outside South Africa.
HIV/AIDS, tuberculosis and other contagious diseases pose risks to Sibanye-Stillwater in terms of Lost Productivity and Increased Costs
The prevalence of HIV/AIDS in South Africa poses risks to Sibanye-Stillwater in terms of potentially reduced productivity and increased medical and other costs. Compounding this are the concomitant infections, such as tuberculosis, that can accompany HIV illness, particularly during the latter stages, and cause additional healthcare-related costs. If there is a significant increase in the incidence of HIV/AIDS infection and related diseases among the workforce, this may have a material adverse effect on Sibanye-Stillwater’s business, operating results and financial condition.
Additionally, the spread of contagious diseases such as respiratory diseases is exacerbated by communal housing and close quarters. The spread of such diseases could impact employees’ productivity, treatment costs and, therefore, operational costs.
Sibanye-Stillwater’s operations are subject to Water Use Regulation, which could impose significant costs and burdens
Sibanye-Stillwater’s operations are subject to regulatory controls on their usage and disposal of water and waste. Under South African law, mining operations are subject to water use licenses and/or authorisations that govern each operation’s water usage and that require, among other things, mining operations to achieve and maintain certain water quality limits regarding all water discharges. Kloof currently operates under a new order
| |
Sibanye-Stillwater | Form 20-F 2017 | 233 |
water use license. The Driefontein water use license was issued on 9 March 2017 and an amendment to correct various issues in the licence was submitted to the Department of Water and Sanitation (DWS) on 19 May 2017. The license is currently under review by the DWS. Beatrix currently operates under a pre-existing permit of indefinite length; however, it has submitted an application for a license under the current regime. The Rand Uranium section of the Cooke operations was issued a water license on 22 November 2013 and on 17 July 2015 for the backfill operations. The water license defines the water management regulatory requirements for the Cooke surface operations, as well as for the Cooke 1, 2 and 3 underground mining operations. In 2017, an Integrated Water Use Licence Application (IWULA) has been submitted for Rand Uranium. The Ezulwini Mining Company (Proprietary) Limited (Cooke 4) was issued a new order water use license on 11 June 2015 and a request was made for changes to some of the conditions on 7 September 2015. In 2017, an IWULA was submitted for the proposed partial closure of Ezulwini and a general authorisation was received for the reclamation of impacted wetlands on 2 March 2018. The Aquarius operations currently operates under a water license issued by DWS on 17 March 2016. Burnstone operates under a water use license that was issued on 23 July 2010, and as this license was granted over 7 years ago, an IWULA application is currently underway to ensure all activities are appropriately licenced. Kloof received an updated water use license on 7 July 2016, an amendment to apply for corrections to the water use license was submitted in December 2016 and is currently under review by the DWS. Sibanye-Stillwater expects to incur significant expenditure to achieve and maintain compliance with the license requirements at each of its operations. Any failure on Sibanye-Stillwater’s part to achieve or maintain compliance with the requirements of these licenses with respect to any of its operations could result in Sibanye-Stillwater being subject to substantial claims, penalties, fees and expenses; significant delays in operations; or the loss of the relevant water use license, which could curtail or halt production at the affected operation. Any of the above could have a material adverse effect on Sibanye-Stillwater’s business, operating results and financial condition. For example, Aquarius has been continually engaging with the DWS for several years regarding the issue of a water use licence for Kroondal’s West-West Pit. This was initially refused by the DWS on the basis that the liner design did not fulfil the Department’s engineered design requirements. The water use license was issued once the DWS was satisfied with the revised design.
Sibanye-Stillwater has identified a risk of potential long-term AMD issues which are currently being experienced by peer mining groups. AMD relates to the acidification and contamination of naturally occurring water resources by pyrite-bearing ore contained in underground mines and in rock dumps, tailings dams and pits on the surface. Should Sibanye-Stillwater’s current preventative measures not be successful such that Sibanye-Stillwater were to experience any AMD issues, it could result in failure to comply with its water use license requirements and could expose Sibanye-Stillwater to potential liabilities.
Risks related to Acquisitions
Sibanye-Stillwater may face challenges in the integration of Lonmin’s business (upon successful completion), Stillwater’s business, the Rustenburg Operations and Aquarius’ business following completion of the acquisitions, which could disrupt its current operations or result in higher costs or worse overall performance than we anticipate
If we are unable to integrate Lonmin’s business (the acquisition of which remains subject to conditions precedent), Stillwater’s business, the Rustenburg operations, or Aquarius’ business with our own operations in a timely and cost-effective manner, the potential benefits of these Acquisitions, including the estimated revenue and cost synergies we expect to achieve, may not be realised. In particular, if the effort we devote to the integration of our businesses with those of Lonmin, Stillwater, the Rustenburg operations and Aquarius diverts more management time or other resources from carrying out our operations than we originally planned, our ability to maintain and increase revenues as well as manage our costs could be impaired. Furthermore, our capacity to expand other parts of our existing businesses may be impaired.
Any of the above could have a material adverse effect on Sibanye-Stillwater’s business, operating results and financial condition.
Our growth strategy, including the acquisitions and reorganisation of our business, may not be successful
Prior to the Stillwater acquisition, Rustenburg operations acquisition and the Aquarius acquisition, our core businesses were primarily related to owning and operating four underground and surface gold operations, as well as operating extraction and processing facilities for treatment of gold-bearing ore before it is refined. As noted in ―Risks Related to Sibanye-Stillwater’s business—Changes in the market price for gold and PGMs, which in the past have fluctuated widely, affect the profitability of Sibanye-Stillwater’s gold and PGM mining operations and the cash flows generated by those operations, these operations have experienced significant volatility during the recent past.
Following the Stillwater acquisition, Rustenburg operations acquisition and the Aquarius acquisition, key components of our strategy have been to reorganise the Group’s operations into a PGM division and a gold and uranium division, and to potentially grow our operations through expansion into further markets. Our growth strategy requires significant investment and places strain on our financial and management resources, as well as our compliance systems, as our management team will be required to support and oversee operations in an industry where they may have limited or no experience while at the same time ensuring that our management systems are suitable for our expanding operations. We cannot assure you that we will be able to achieve the objectives our management anticipates or that our management will be able to manage any such processes successfully. Failure to achieve such objectives or any significant weakening of our overall management controls could have a material adverse effect on our business, operating results and financial condition.
If any of Lonmin, Stillwater, the Rustenburg Operations, Aquarius, Wits Gold or Burnstone does not perform in line with our expectations, we may be required to write-down the carrying value of our investment, which could affect our ability to pay dividends
Under IFRS, we are required to test the carrying value of long-term assets or cash-generating units for impairment at least annually and more frequently if we have reason to believe that our expectations for the future cash flows generated by these assets may no longer be valid. If the results of operations and cash flows generated by Lonmin (the acquisition of which remains subject to conditions precedent), Stillwater, the
| |
Sibanye-Stillwater | Form 20-F 2017 | 234 |
Rustenburg operations, Aquarius, Wits Gold or Burnstone are not in line with our expectations, we may be required to write-down the carrying value of the investment. Any write-down could materially affect our business, operating results, operations and financial condition.
We may discover contingent or other liabilities within Lonmin, Stillwater, the Rustenburg Operations or Aquarius or other facts of which we are not aware that could expose Sibanye-Stillwater to loss
Although Sibanye-Stillwater has received certain representations, warranties and indemnities regarding Lonmin (the acquisition of which remains subject to conditions precedent), Stillwater, the Rustenburg operations and Aquarius under the terms of the Lonmin acquisition agreements, Stillwater Merger Agreement, the Rustenburg acquisition agreements and the Aquarius acquisition agreements, respectively, and it has conducted general due diligence in connection with the Acquisitions, such due diligence was necessarily limited. There can be no assurance that Sibanye-Stillwater identified all the liabilities of, and risks associated with, the Acquisitions or that it will not be subject to unknown liabilities of, and risks associated with, the Acquisitions, including liabilities and risks that may become evident only after Sibanye-Stillwater has been involved in the operational management of the Acquisitions. Sibanye-Stillwater may incur losses in excess of this maximum amount or the matters giving rise to the losses may not be recoverable against the warranties or indemnities or at all.
Sibanye-Stillwater’s operations in Zimbabwe are subject to rules and regulations that limit their ability to export unrefined platinum or to remit revenue generated out of the country; such rules and regulations may also impact the ownership structure of these operations
One of Sibanye-Stillwater’s joint ventures, the Mimosa operations, is located in Zimbabwe. The Mimosa operations delivered attributable production for the year ended 31 December 2017 of 124,153oz (4E) and contributed a profit of R175 million. Under Zimbabwean exchange control legislation, up to 80% of the revenue generated from Sibanye-Stillwater’s Zimbabwe operations must be retained in the country. Sibanye-Stillwater is limited in its ability to remit profits from Zimbabwe to South Africa. Further, due to the short supply of US dollars in Zimbabwe, the funds retained in Zimbabwe create increased exposure to economic and inflationary risks.
Furthermore, a number of years ago, the Government of Zimbabwe announced that a 15% royalty would be imposed on the export of unrefined platinum beginning in January 2017. The implementation date has been deferred a number of times, the most recent of which was until 1 January 2019. If such royalty is imposed, it could have a material adverse effect on Sibanye-Stillwater’s business, operating results and financial condition.
Mimosa has commissioned feasibility studies to explore expanding its smelter operations in Zimbabwe. The construction of such facilities would be subject to several challenges including, amongst other things, the time required, the substantial capital expenditure and a lack of adequate infrastructure.
The Zimbabwean Empowerment Act, promulgated in 2008, requires the transfer of a 51% shareholding in all foreign-owned companies to indigenous Zimbabweans. On 12 April 2016, in a statement clarifying the Empowerment Act, Zimbabwe’s former President announced that foreign mines could retain ownership control as long as 75% of the gross value of exploited resources are retained in Zimbabwe. The Zimbabwean Empowerment Act was amended on 1 December 2017 to codify the former President’s statements into law. Although Sibanye-Stillwater currently exceeds the proposed 75% threshold, there can be no guarantee that it will continue to do so in the future or that this interpretation will remain in force. Any of the above could have a material adverse effect on the Mimosa operations.
Social, political and economic uncertainty and instability in Zimbabwe and targeted sanctions against certain Zimbabwean entities may affect future foreign investment in the country
Zimbabwe’s social, political and economic climate is currently highly uncertain, with the economy having been in decline since 1999. Many sectors, including the health sector, have virtually collapsed. There is a general shortage of clean water owing to non-functional facilities and a lack of chemicals.
Zimbabwe is the subject of targeted sanctions by the US, EU and the UK. The sanctions are limited in scope, targeting only designated individuals and entities, including certain members of the government, who are deemed to be undermining democratic institutions and processes in Zimbabwe.
In terms of the Minerals Marketing Corporation Act, 1983 (MMCZ Act), the Mineral Marketing Corporation of Zimbabwe (MMCZ) is the sole legal exporter of all minerals mined in Zimbabwe and is entitled to a commission in relation to all sales, as an agent to the mining companies, which is stipulated by the MMCZ Act. The Mimosa operations paid MMCZ US$2.1 million in fiscal 2017. The MMCZ is an entity specifically sanctioned by the US Office of Foreign Assets Control and listed on its Specially Designated Nationals list. Under the sanctions, MMCZ’s assets are blocked and US persons are prohibited from dealing with the entity. There is no requirement, legal or otherwise, for MMCZ to be involved in the Mimosa operations management or operations and Sibanye-Stillwater has no contractual or other relationship with MMCZ outside of the MMCZ Act requirements.
Continued economic and political uncertainty in Zimbabwe and targeted sanctions against certain Zimbabwean entities may affect future foreign investment in the country and may lead to the imposition of further exchange controls, restrictions on the ownership of Sibanye-Stillwater’s assets and its ability to raise funds for or operate its business and export minerals and metals from Zimbabwe. Should such events occur, they may have an adverse effect on Sibanye-Stillwater’s business and operations in Zimbabwe as well as their financial condition.
| |
Sibanye-Stillwater | Form 20-F 2017 | 235 |
Risks related to Sibanye-Stillwater’s shares and ADRs
Shareholders outside South Africa may not be able to participate in future issues of securities (including ordinary shares) carried out by or on behalf of Sibanye-Stillwater
Securities laws of certain jurisdictions may restrict Sibanye-Stillwater’s ability to allow participation by certain shareholders in future issues of securities (including ordinary shares) carried out by or on behalf of Sibanye-Stillwater. In particular, holders of Sibanye-Stillwater securities who are located in the United States (including those who hold ordinary shares or ADRs) may not be able to participate in securities offerings by or on behalf of Sibanye-Stillwater unless a registration statement under the Securities Act is effective with respect to such securities or an exemption from the registration requirements of the Securities Act is available thereunder.
Securities laws of certain other jurisdictions may also restrict Sibanye-Stillwater’s ability to allow the participation of all holders in such jurisdictions in future issues of securities carried out by Sibanye-Stillwater. Holders who have a registered address or are resident in, or who are citizens of, countries other than South Africa should consult their professional advisers as to whether they require any governmental or other consent or approvals or need to observe any other formalities to enable them to participate in any offering of Sibanye-Stillwater securities.
Investors in the United States and other jurisdictions outside South Africa may have difficulty bringing actions, and enforcing judgements, against Sibanye-Stillwater, the directors and the executive officers based on the civil liabilities provisions of the federal securities laws or other laws of the United States or any state thereof or under the laws of other jurisdictions outside South Africa
Sibanye-Stillwater is incorporated in South Africa. Most of the directors and executive officers reside outside of the United States. Substantially all of the assets of these persons and approximately 50% of the assets of Sibanye-Stillwater are located outside the United States. As a result, it may not be possible for investors to enforce against these persons or Sibanye-Stillwater a judgement obtained in a United States court predicated upon the civil liability provisions of the federal securities or other laws of the United States or any state thereof. In addition, investors in other jurisdictions outside South Africa may face similar difficulties.
Investors should be aware that it is the policy of South African courts to award compensation for the loss or damage actually sustained by the person to whom the compensation is awarded. Although the award of punitive damages is generally unknown to the South African legal system, it does not mean that such awards are necessarily contrary to public policy. Whether a judgement is contrary to public policy will depend on the facts of each case. Exorbitant, unconscionable or excessive awards will generally be contrary to public policy and contractually stipulated penalties are subject to and limited by the provisions of the Conventional Penalties Act, 1962. South African courts cannot enter into the merits of a foreign judgement and cannot act as a court of appeal or review over the foreign court. South African courts will usually implement their own procedural laws and, where an action based on an international contract is brought before a South African court, the capacity of the parties to the contract will usually be determined in accordance with South African law. However, a South African court may, in certain circumstances, show expert evidence in relation to the law of the jurisdiction which governs the contract in question. It is doubtful whether an original action based on United States federal securities laws or the laws of other jurisdictions outside South Africa may be brought before South African courts. Further, a plaintiff who is not resident in South Africa may be required to provide security for costs in the event of proceedings being initiated in South Africa. In addition, the Rules of the High Court of South Africa require that documents executed outside South Africa must be authenticated for the purpose of use in South Africa.
Investors should also be aware that a foreign judgement is not directly enforceable in South Africa, but only constitutes a cause of action. Such a judgement will be enforced by South African courts only if certain conditions are met.
Sibanye-Stillwater may not pay dividends or make similar payments to its shareholders in the future due to various factors and any dividend payments may be subject to withholding tax
Sibanye-Stillwater’s current dividend policy is to return at least 25% to 35% of normalised earnings to Shareholders. Sibanye-Stillwater may pay cash dividends only if funds are available for that purpose. Whether funds are available depends on a variety of factors, including the amount of cash available and Sibanye-Stillwater’s capital expenditures on both existing infrastructure as well as on exploration and other projects and other cash requirements existing at the time. Under South African law, Sibanye-Stillwater will be entitled to pay a dividend or similar payment to its Shareholders only if it meets the solvency and liquidity tests set out in the Companies Act, and is permitted to do so in terms of the Memorandum of Incorporation. Given these factors and the Board’s discretion to declare cash dividends or other similar payments, dividends may not be paid in the future. It should be noted that a 20% withholding tax is required to be withheld on dividends paid by, among others, certain South African resident companies (including Sibanye-Stillwater), to any person. Withholding taxes have been in effect from 1 April 2012 and the percentage was increased on 22 February 2017 from 15% to 20%.
The withholding tax on dividends is subject to domestic exemptions or relief in terms of an applicable double taxation treaty. The application of such domestic exemptions or relief in terms of an applicable double taxation treaty is subject to the making of certain declarations and undertakings by the beneficial owner of the dividends and providing the same to the Company or regulated intermediary making payment of the dividend. See Further Information―Additional information—Taxation—Certain South African tax considerations—Withholding tax on dividends and Further Information—Financial information—Dividend policy and dividend distributions.
Sibanye-Stillwater’s non-South African shareholders face additional investment risk from currency exchange rate fluctuations since any dividends will be paid in Rand
Dividends or distributions with respect to Sibanye-Stillwater’s shares have historically been paid in Rand. The US dollar or other currency equivalent of future dividends or distributions with respect to Sibanye-Stillwater’s shares, if any, will be adversely affected by potential future reductions in the value of the Rand against the US dollar or other currencies. In the future, it is possible that there will be changes in South African
| |
Sibanye-Stillwater | Form 20-F 2017 | 236 |
Exchange Control Regulations such that dividends paid out of trading profits will not be freely transferable outside South Africa to Shareholders who are not residents of the CMA. See Further Information―Additional Information—South African Exchange Control limitations affecting security holders.
Sibanye-Stillwater’s shares are subject to dilution as a result of any non-pre-emptive share issuance, including upon the exercise of Sibanye-Stillwater’s outstanding share options, conversion of convertible bonds, issues of shares by the board in compliance with BBBEE legislation or in connection with acquisitions, and a large volume of sales of Sibanye-Stillwater’s shares, or the perception that such large sales may occur, could adversely affect the trading price of Sibanye-Stillwater’s shares
Shareholders’ equity interests in Sibanye-Stillwater will be diluted to the extent of future exercises or settlements of rights under the Sibanye-Stillwater Limited 2013 Share Plan and any additional rights. Sibanye-Stillwater shares are also subject to dilution in the event that the Board is required to issue new shares in compliance with applicable BBBEE legislation. See ―Risks related to Sibanye-Stillwater’s business—Sibanye-Stillwater’s mineral rights are subject to legislation, which could impose significant costs and burdens and which impose certain ownership requirements, the interpretation of which are the subject of dispute.
On 19 September 2017, Sibanye-Stillwater launched an offering of US$450 million senior unsecured guaranteed convertible bonds due 2023 with the initial conversion ratio of 120,627 ordinary shares per bond (the Convertible Bond). The Convertible Bond has a coupon of 1.875% per annum payable semi-annually in arrear in equal instalments on 26 March and 26 September of each year, commencing on 26 March 2018.
Sibanye-Stillwater cannot predict the timing or amount of conversions of the Convertible Bond or the size or terms of future issuances of equity securities or securities convertible into equity securities or the effect, if any, that future issuances and sales of the securities will have on the market price of Sibanye-Stillwater’s ordinary shares. In addition, the conversion price of the Convertible Bond is subject to adjustment in certain circumstances. Any transaction involving the issuance of previously authorised but unissued common shares, or securities convertible into common shares, would result in dilution, possibly substantial, to shareholders. Exercises of presently outstanding stock options may also result in dilution to shareholders.
The board of directors of Sibanye-Stillwater has the authority to authorise certain offers and sales of the securities without the vote of, or prior notice to, shareholders. Based on the need for additional capital to fund expected expenditures and growth, it is likely that Sibanye-Stillwater will issue the securities to provide such capital. Such additional issuances may involve the issuance of a significant number of common shares at prices less than the current market price.
Sales of substantial amounts of securities, or the availability of the securities for sale, could adversely affect the prevailing market prices for the securities and dilute investors’ earnings per share. A decline in the market prices of the securities could impair Sibanye-Stillwater’s ability to raise additional capital through the sale of additional securities should Sibanye-Stillwater desire to do so.
Further, the issuance of shares in connection with any acquisition (whether in the form of consideration or otherwise) may result in dilution to existing Shareholders. For example, on 15 May 2014, Sibanye-Stillwater concluded the acquisition of Cooke. As consideration for the acquisition, Sibanye-Stillwater issued 156,894,754 new Sibanye-Stillwater shares at R28.61, representing 17% of Sibanye-Stillwater’s issued share capital on a fully diluted basis.
The Newshelf 1114 Empowerment Partner has a put option in respect of their 24% shareholding in Newshelf 1114 which allows them to acquire shares in Sibanye-Stillwater, subject to certain conditions. These conditions include in particular confirmation by the DMR that implementation of the put option will not detrimentally affect the empowerment status of Newshelf 1114. If the Newshelf 1114 Empowerment Partner exercises this put option, Sibanye-Stillwater must acquire its shares in Newshelf 1114 based on the net attributable fair value of the underlying assets and liabilities of the Newshelf 1114 group by issuing the number of shares in Sibanye-Stillwater determined on the basis of the 30 day VWAP of Sibanye-Stillwater on the JSE. The Newshelf 1114 Empowerment Partner’s net attributable fair value will be adjusted by the original subscription loan still due by the Newshelf 1114 Empowerment Partner on acquiring the 24% shareholding in 2013. The subscription loan balance at 31 December 2017 was R691 million. The option can be exercised until 8 February 2021.
A large volume of sales of Sibanye-Stillwater’s shares by this partner or another shareholder, all at once or in blocks, could decrease the prevailing market price of Sibanye-Stillwater’s shares and could impair Sibanye-Stillwater’s ability to raise capital through the sale of equity securities in the future. additionally, even if substantial sales are not affected, the mere perception of the possibility of these sales could decrease the market price of Sibanye-Stillwater’s shares and could have a negative effect on Sibanye-Stillwater’s ability to raise capital in the future. further, anticipated downward pressure on Sibanye-Stillwater’s ordinary share price due to actual or anticipated sales of shares could cause some institutions or individuals to engage in short sales of Sibanye-Stillwater’s shares, which may itself cause the price of the shares to decline.
| |
Sibanye-Stillwater | Form 20-F 2017 | 237 |
Sibanye-Stillwater’s Mining Operations
Southern Africa region
gold operations: beatrix
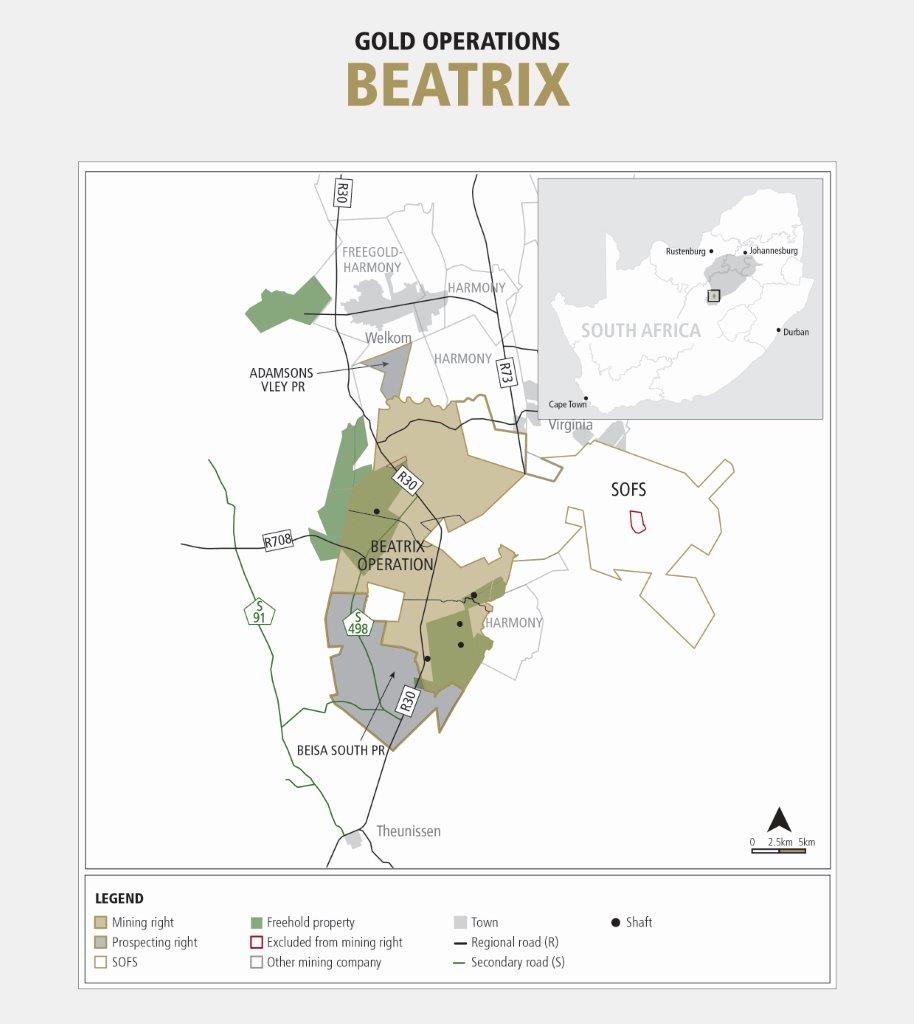
| reef horizons with the deepest operating level some 2,055m below surface (22 Level at 4 Shaft). The principal mining takes place on the Beatrix Reef (BXR). Additional reefs mined include VS5 Reef of the Eldorado Formation (VS5), Aandenk (AAR) and Kalkoenkrans. |
General | Beatrix, a shallow to intermediate level gold mine, has been producing gold since 1983, in the southern portion of the Free State Goldfields. Beatrix is located in the Matjhabeng Magisterial District, near the towns of Welkom and Virginia, approximately 240km south-west of Johannesburg, in the Free State province of South Africa. Before the advent of mining the land was used for agricultural purposes and very little natural vegetation remains. Situated near regional urban centres where it can routinely obtain supplies, the mine has access to the national electricity grid and to water, road and rail infrastructure. The current mine infrastructure consists of three producing shaft complexes. Mining is focused on open ground and pillars (white areas) of differing reef horizons with the deepest operating level some 2,055m below surface (22 Level at 4 Shaft). The principal mining takes place on the Beatrix Reef (BXR). Additional reefs mined include VS5 Reef of the Eldorado Formation (VS5), Aandenk (AAR) and Kalkoenkrans. |
Strategic intent | Optimise the mineral resource Stabilise production profiles at current performance levels Reduce pay limits through quality mining and cost reduction Regional synergies with the Southern Orange Free State (SOFS) project areas – utilise existing Beatrix infrastructure to progress the SOFS project |
Mineralisation characteristics | Auriferous and uraniferous associated with palaeo-placer conglomerates, that are locally termed reefs Laterally continuous with relatively long-range predictability Clear patterns of mineralisation governed by sedimentary characteristics |
| |
Sibanye-Stillwater | Form 20-F 2017 | 238 |
Depositional environment | The palaeo-placer originated from a braided stream environment The deposition was structurally controlled along a basinal edge |
Licence status and holdings | Beatrix has a converted mining right in terms of the Mineral and Petroleum Resources Development Act (MPRDA) with Department of Mineral Resources (DMR) reference number: FS30/5/1/2/2/81 MR (Beatrix mining right) The Beatrix mining right is valid from 7 February 2007 to 6 February 2019 in respect of a mining area totalling 16,835.3369ha All required operating permits for the abovementioned right have been obtained and are in good standing Preparations have begun for the submission of a renewal application for the Beatrix mining right Also under consideration is whether a Section 102 application should be submitted in terms of the MPRDA to include certain prospecting rights (FS30/5/1/1/2(10134) PR and FS30/5/1/1/2(10324) PR), adjacent to the Beatrix, into the Beatrix mining right |
Infrastructure | Three shaft complexes (one sub-shaft) Two mineral processing plants All supporting infrastructure to service an operating gold mine |
Mining method | Scattered conventional breast mining, pillar extraction and surface rock dump (SRD) mining |
Mineral processing | Beatrix makes use of two gold processing plants, both treating underground and surface material No 1 carbon-in-leach (CIL) plant processing underground ore and low-grade SRD material No 2 CIL plant processing underground ore and low-grade SRD mining |
Tailings disposal | Two tailings storage facilities (TSFs) with life of mine (LoM) deposition requirements estimated at 23.9Mt against a combined capacity of 111.2Mt (surplus of 87.3Mt) |
Climate | No extreme climatic conditions are experienced that may affect mining operations (a semi-arid, relatively flat region) |
Environmental/ health and safety | Beatrix’s systems, procedures and training are in line with international best practice The procedures and status of all the programmes that drive environmental, health and safety goals are detailed in the Integrated Annual Report 2017 |
Life of mine | It is estimated that the current Mineral Reserves will sustain the operation until 2029 |
Key developments and brownfield projects (on-mine) | Beatrix has accessed the Vlakpan area allowing for a longer LoM The Vlakpan project comprises ground between 16 and 22 Level to the west of the Beatrix 3 Shaft and 1 Shaft Access to the area is by means of twin haulages and a decline from 1 Shaft A detailed mine design and schedule, based on the current geological interpretation, evaluation and economic parameters, coupled with a detailed engineering layout, cost and cash flow models, have been completed for the project, and as a consequence have been incorporated into the current LoM plan A PFS prior to the Bloemhoek drop down is to be finalised in 2018 to assess the potential of the orebody below the current infrastructure at 3 Shaft, which is part of the Bloemhoek area Additional drilling was completed in 2017 north of the 3 Shaft area inside the Bloemhoek project area, to firm up the structure and grade |
Hoisting and production capacities | Operating shaft | Operational hoisting capacity (ktpm) | Planned production (ktpm)1 |
3 | 192 | 136 |
1 | 138 | 55 |
4SV | 120 | 30 |
| 1 Planned production is five-year hoisted average from 2018 onwards |
| |
Plant capacities | Plant | Design capacity (ktpm) | Current operational capacity (ktpm) | Average recovery factor (%) | Material treated |
1 (CIL) | 233 | 235 | 95.5 | UG |
| | | 83.4 | Surface |
2 (CIP1) | 130 | 130 | 93.0 | UG |
| 1 CIP – Carbon-in-pupl |
| |
Sibanye-Stillwater | Form 20-F 2017 | 239 |
gold operations: driefontein
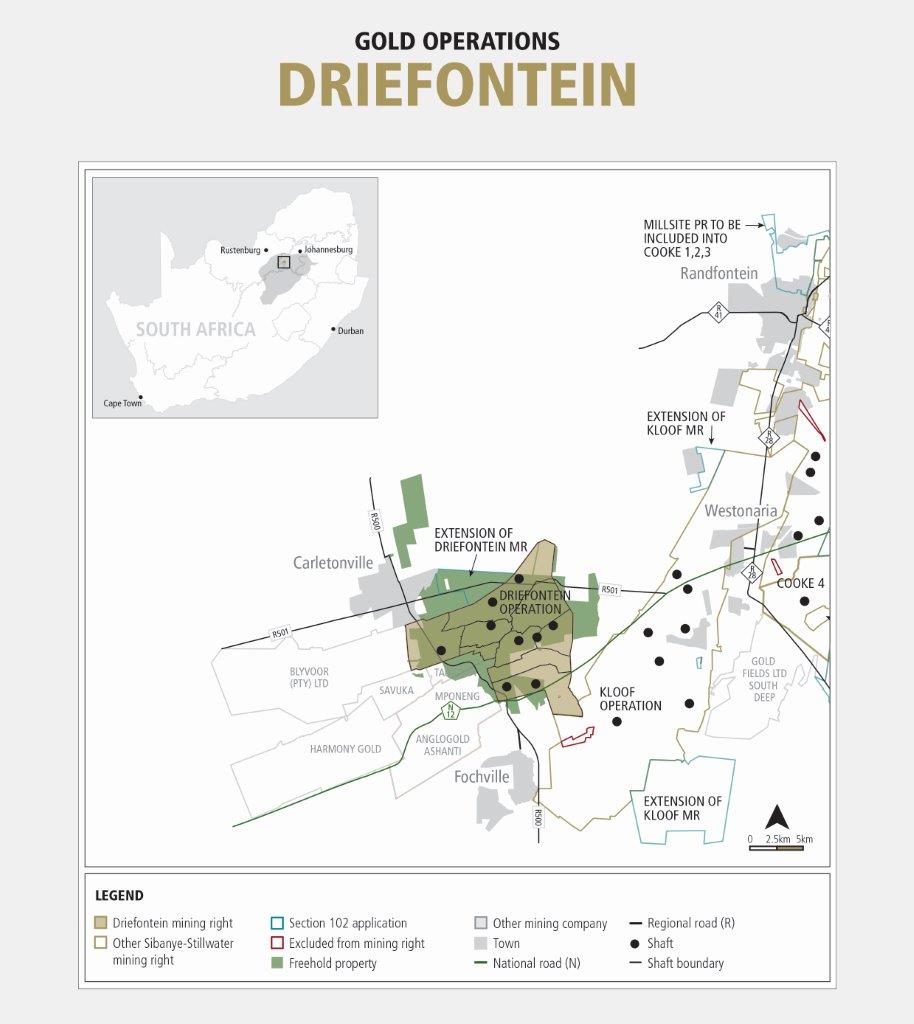
| Ventersdorp Contact Reef (VCR) 32%, the Middlevlei Reef (MVR) 6% and the remainder from surface sources. |
General | Driefontein started production in 1952 and has historically produced more than 108Moz of gold. Driefontein is located in the West Wits Line of the Witwatersrand Basin, near Carletonville, approximately 70km west of Johannesburg in the Gauteng province of South Africa. Topography is characterised by moderately undulating plains, classified as Bankenveld, consisting of grassland with livestock farming widespread in the surrounding areas. Driefontein has access to the extensive national electricity grid and to water, road and rail infrastructure. Located near regional urban centres where it can routinely obtain supplies, the mine was formed from the amalgamation of the East Driefontein and West Driefontein mines in 1999. Driefontein is a large, established, shallow to ultra-deep-level gold mine. The current mine infrastructure consists of six producing shaft complexes that mine open ground and pillars (white areas) with the deepest operating level currently some 3,420m below surface (50 Level at 5 Shaft) and three gold processing plants. The principal mining takes place on the Carbon Leader Reef (CLR), which constitutes almost 62% of the Mineral Reserves, the Ventersdorp Contact Reef (VCR) 32%, the Middlevlei Reef (MVR) 6% and the remainder from surface sources. |
Strategic intent | Optimise the mineral resource Stabilise production profiles at current performance levels Reduce pay limits through quality mining and cost reduction Target secondary reefs on an incremental basis above infrastructure |
Mineralisation characteristics | Auriferous and uraniferous palaeo-placer conglomerates, that are locally termed reefs. Laterally continuous with relatively long-range predictability Clear patterns of mineralisation governed by sedimentary characteristics |
Depositional environment | The palaeo-placer originated from a braided stream environment The deposition was structurally controlled along a basinal edge |
| |
Sibanye-Stillwater | Form 20-F 2017 | 240 |
Licence status and holdings | Driefontein has a converted mining right in terms of the MPRDA with DMR reference number: GP30/5/1/2/2(51) MR (Driefontein mining right), valid from 30 January 2007 to 29 January 2037 in respect of a mining area totalling 8,561.2391ha All required operating permits have been obtained and are in good standing A Section 102 application has been submitted in terms of the MPRDA in order to incorporate the Driefontein 4 TSF area measuring approximately 9086,70ha into the Driefontein mining right, and its application has not been finalised yet. |
Infrastructure | Six shaft operating complexes (4 sub-shafts, one tertiary shaft and one single lift shaft) |
Mining method | Scattered, convetional breast, mini-longwall stoping with closely spaced dip pillars (140m x 40m and 130m x 30m regional pillars) and SRD mining |
Mineral processing | Three gold processing plants and a centralised elution and carbon treatment facility at the No 1 Plant: No 1 CIP plant processing underground ore and low-grade SRD material No 2 CIP plant processing only low-grade SRD material No 3 CIL plant processing only low-grade SRD material |
Tailings disposal | Three TSFs with LoM deposition estimated at 38.5Mt against a combined capacity of 79.4Mt (surplus 40.9Mt) |
Climate | No extreme climate conditions are experienced that may affect mining operations |
Environmental/ health and safety | Driefontein’s systems, procedures and training are in line with international best practice The procedures and status of all the programmes that drive environmental, health and safety goals are detailed in the Integrated Annual Report 2017 |
Life of mine | It is estimated that the current Mineral Reserves will sustain the operation until 2039 |
Key developments and brownfield projects (on-mine) | The following projects are ongoing and have been included in the LoM: The 1 Shaft pillar extraction project PFS, completed by Royal HaskoningDHV in 2013, is included in the LoM production plan, and it is planned to finalise the feasibility study (FS) for this project over the next two years, as investigations are hampered by ventilation constraints for the sub vertical area The Driefontein 5 Shaft drop-down project (below 50 Level) was approved in November 2015 and commenced with development in 2016, with first ore expected in 2021 and peak production of approximately 150Moz expected by 2031 The SRDs at Driefontein are expected to be depleted in 2018. As part of the proposed transaction with DRDGOLD Limited (DRDGOLD), the two surface treatment plants will be used to process the tailings of the West Rand Tailings Retreatment Project (WRTRP) under sale negotiation with DRDGOLD |
| |
Hoisting and production capacities | Operating shaft | Operational hoisting capacity (ktpm) | Planned production (ktpm)1 |
1 | 105 | 32 |
1 SV | 105 | 32 |
1 T | 121 | 32 |
6 SV | 26 | 12 |
2 | 165 | 108 |
4 SV | 57 | 29 |
8 | 60 | 59 |
5 | N/A | N/A |
5 SV | 159 | 65 |
| 1 Planned production is five-year hoisted average from 2018 onwards |
| |
Plant capacities | Plant | Design capacity (ktpm) | Current operational capacity (ktpm) | Average recovery factor (%) | Material treated |
1 (CIP) | 240 | 240 | 96.6 | UG/SRD |
2 (CIP) | 200 | 180 | 83.9 | SRD |
3 (CIL) | 115 | 96 | 80.0 | SRD |
| |
Sibanye-Stillwater | Form 20-F 2017 | 241 |
gold operations: kloof
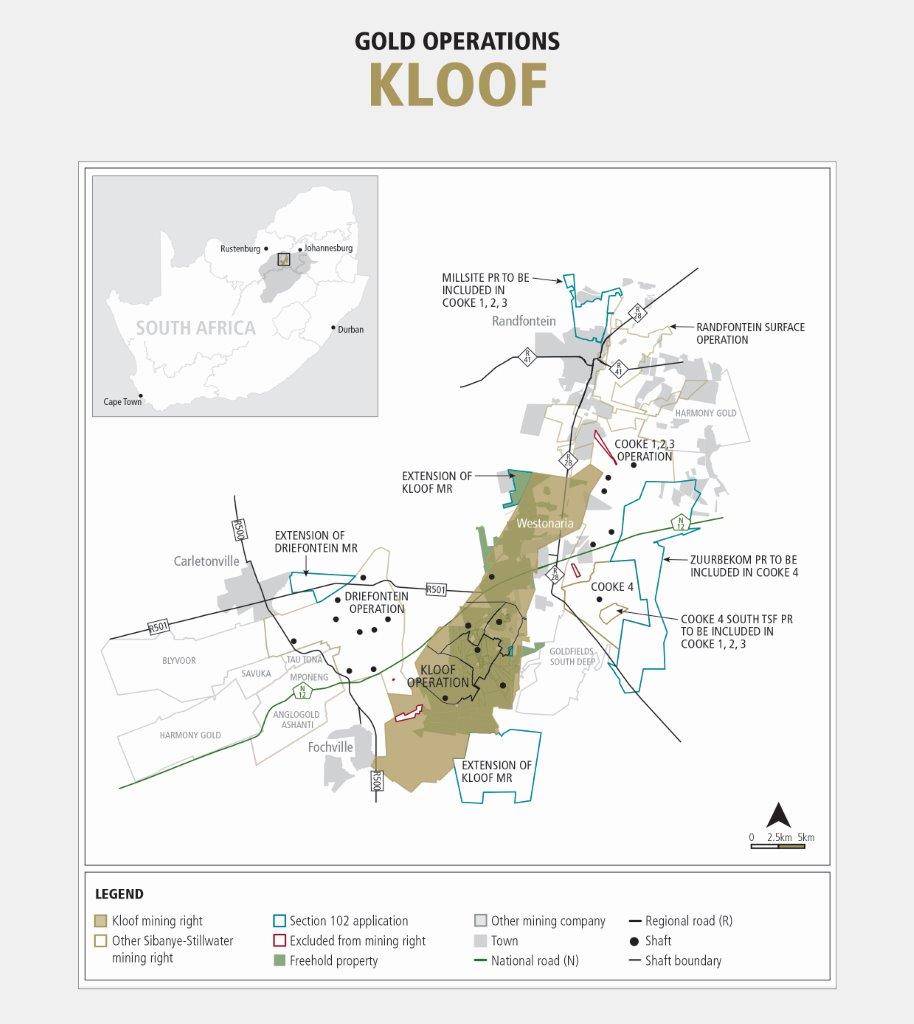
| Kloof Reef (KR) and Libanon Reef |
General | Kloof is a mature high-yield operation, with a LoM extending to 2035. The mine is situated in the Magisterial District of Randwest, some 60km west of Johannesburg in the Gauteng province of South Africa. Kloof is accessed via the N12 highway between Johannesburg and Potchefstroom, close to Westonaria. The mine is situated near regional urban centres where it can routinely obtain supplies, and has access to the national electricity grid and to water, road and rail infrastructure. The area’s topography is relatively flat and the vegetation is classified as Bankenveld, consisting mostly of grassland. Livestock farming predominates in the surrounding area. Kloof is an established, shallow to ultra-deep-level gold mine. Kloof, in its current form, dates from April 2000 when the Venterspost (1939), Libanon (1945), Kloof (1968) and Leeudoorn (1993) mines were amalgamated. The current mine infrastructure consists of five producing shaft complexes that mine open ground and pillars (white areas) with the deepest operating level some 3,347m below surface (45 Level at 4 Shaft), and two gold processing plants. The principal mining takes place on the VCR, with the remainder made up from MVR, Kloof Reef (KR) and Libanon Reef |
Strategic intent | Optimise the mineral resource Stabilise production profiles at current performance levels Reduce pay limits through quality mining and cost reduction Target secondary reefs on an incremental basis above infrastructure Mining of low grade surface reserves to fill the excess metallurgical capacity |
Mineralisation characteristics | Auriferous and uraniferous palaeo-placer conglomerates, that are locally termed reefs Laterally continuous with relatively long-range predictability Clear patterns of mineralisation governed by sedimentary characteristics |
Depositional environment | The palaeo-placer originated from a braided stream environment The deposition was structurally controlled along a basinal edge |
| |
Sibanye-Stillwater | Form 20-F 2017 | 242 |
Licence status and holdings | Kloof has a converted mining right with DMR reference number: GP30/5/1/2/2(66) MR (Kloof mining right) in terms of the MPRDA, valid from 30 January 2007 to 29 January 2027 in respect of a mining area totalling 20,087.0016ha All required operating permits have been obtained and are in good standing Based on the current LoM and prevailing economic conditions, if needed, Kloof will request an extension of the Kloof mining right through a renewal application at the specified time Kloof held a prospecting right with DMR reference number: GP30/5/1/1/2(10096) PR in respect of a small area (24.8823ha) confined within the Kloof mining right boundary, and submitted a Section 102 application to amend the Kloof mining right through the inclusion of the GP30/5/1/1/2(10096) PR In 2015, an additional Section 102 application was submitted to incorporate Venterspost North and Venterspost South TFS as well as the Regional TFS into the Kloof mining right |
Infrastructure | Five operating shaft complexes (five sub-shafts, one tertiary shaft and a single lift shaft) |
Mining method | Scattered conventional breast, mini-longwall stoping with closely spaced dip pillars (110m x 40m) and regional pillars (100m x 35m) Load, haul dump mining of SRDs |
Mineral processing | Two gold plants and a centralised elution and carbon treatment facility at the No 2 Plant |
Tailings disposal | Two TSFs with LoM deposition estimated at 36.2Mt against a combined capacity of 42.7Mt (surplus of 6.5Mt) |
Climate | No extreme climatic conditions are experienced that may affect mining operations |
Environmental/ health and safety | Kloof’s systems, procedures and training are in line with international best practice The procedures and status of all the programmes that drive environmental, health and safety goals are detailed in the Integrated Annual Report 2017 |
Life of mine | It is estimated that the current Mineral Reserves will sustain the operation until 2035 |
Key developments and brownfield projects (on-mine) | The following projects have been included in the Kloof LoM: Kloof has commenced with the development of the Kloof 4 Shaft depth extension project during 2015 and stoping is planned to start in 2023 A major exploration programme, targeting the KR at 8 Shaft, has resulted in additional Mineral Reserves of 0.4Moz |
| |
Hoisting and production capacities | Operating shaft | Operational hoisting capacity (ktpm) | Planned production (ktpm)1 |
Main | 100 | 83 |
8 | 15 | 15 |
3 | 55 | 29 |
4 | 82 | 72 |
7 | 32 | 20 |
4 SV | 57 | 29 |
8 | 60 | 59 |
5 | N/A | N/A |
| 5 SV | 159 | 65 |
| 1 Planned production is five-year hoisted average from 2018 onwards |
| |
Plant capacities | Plant | Design capacity (ktpm) | Current operational capacity (ktpm) | Average recovery factor (%) | Material treated |
| 1 (CIP) | 180 | 180 | 89.4 | Primarily SRD |
| 2 (CIP) | 120 | 167 | 98.4 | Primarily UG |
| |
Sibanye-Stillwater | Form 20-F 2017 | 243 |
gold operations: Cooke
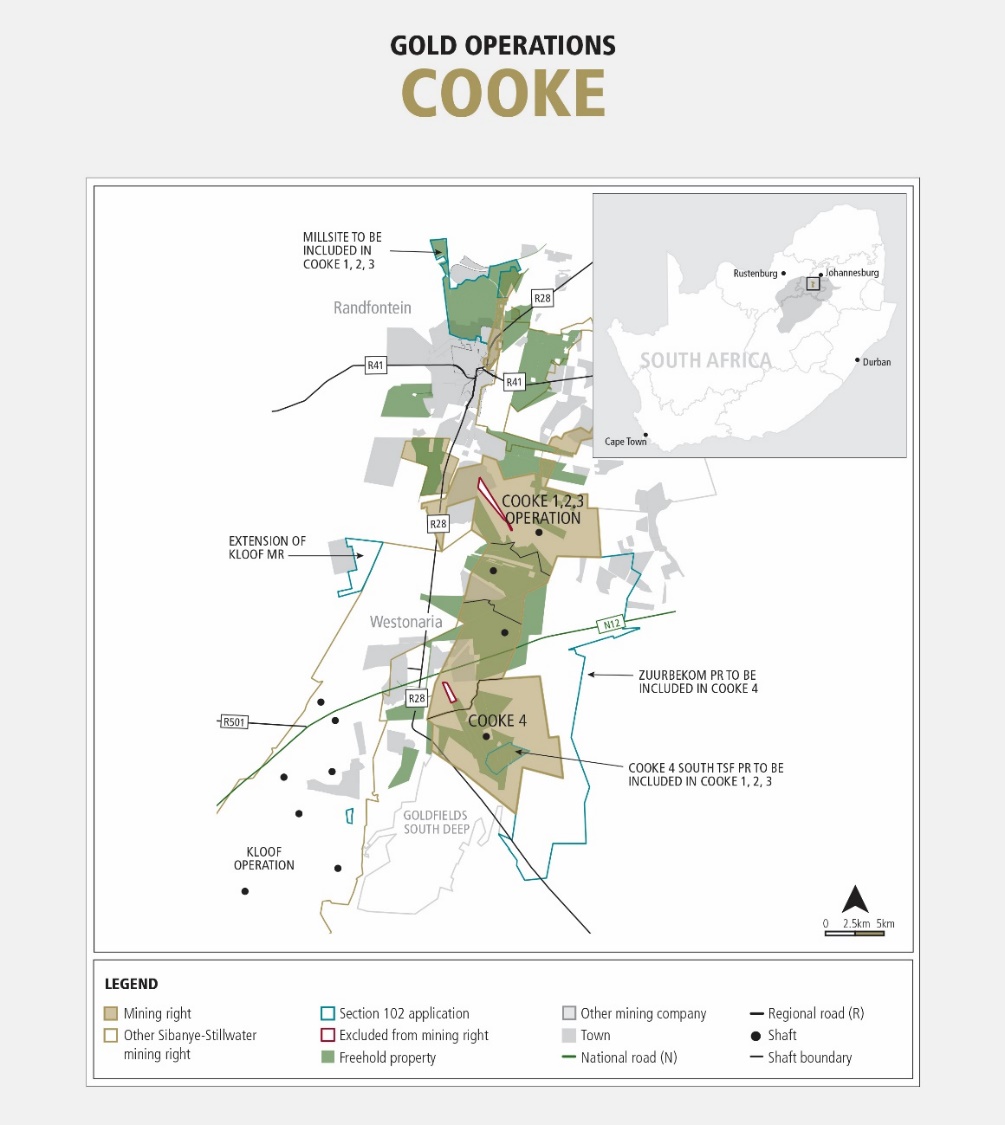
| |
General | Cooke is a large, established, shallow to intermediate-level gold mine which has been producing gold and uranium since 1961. Cooke underground operations are on care and maintenance. The surface mining is located in the West Rand District Municipality of the Gauteng province, South Africa. Cooke shafts are located approximately 30km to 40km south-west of Johannesburg. The sites are accessed via the R28 highway between Randfontein and Westonaria or via the N12 national road between Johannesburg and Potchefstroom and is serviced by a developed network of mining and civil infrastructure with adequate electricity and water supplies. The Randfontein Surface operation (RSO) assets include several TSFs on the West Rand near Randfontein. The topography of the area is relatively flat and the vegetation is classified as Bankenveld consisting of grassland. Livestock farming is widespread in the surrounding area. The underground mine infrastructure, which is on care and maintenance, consists of four shaft complexes that previously mined open ground and pillars (white areas). Cooke 4, previously operated at 1,634m below surface (58 Level at Cooke 4 SV Shaft) and was declared uneconomical for exploitation from August 2016. Cooke 1, 2 and 3 Shafts have also been declared non- economical for exploitation since August 2017. The decision was made to close the underground workings. The principal mining took place on the Middle and Upper Elsburg reefs. The remainder of the mining took place on the secondary reefs, namely the Kimberly Formations and the VCR. The only production currently is from surface TSF. The production from the four Cooke shafts could be hoisted to surface separately. Underground material from Cooke 1,2 and 3 was previously processed at the Doornkop plant, operated by Harmony Gold Mining Company Limited (Harmony), on a toll treatment basis. Cooke 4 production and overflow from the Cooke 3 Shaft was treated at Ezulwini along with ore from SRDs on a toll treatment basis. |
Strategic intent | Focus on profitable TSF reprocessing Operations on care and maintenance Utilising the two metallurgical plants for toll treatment of material |
| |
Sibanye-Stillwater | Form 20-F 2017 | 244 |
Mineralisation characteristics | Auriferous and uraniferous palaeo-placer conglomerates, that are locally termed reefs. Laterally continuous with relatively long-range predictability Clear patterns of mineralisation governed by sedimentary characteristics |
Depositional environment | The palaeo-placer originated from a braided stream environment The deposition was structurally controlled along a basinal edge |
Licence status and holdings | Cooke has the following three separate mining rights in terms of the MPRDA Cooke 1, 2 and 3 with DMR reference number: GP30/5/1/2/2/07 MR (Cooke 1, 2 and 3 mining right), valid from 18 December 2007 to 17 December 2037 and covering a total area of 7,875ha Cooke 4 (Ezulwini) with DMR reference number: GP30/5/1/2/2/38 MR (Ezulwini mining right), valid from 20 November 2006 to 19 November 2036 and covering a total area of 3,718.340ha RSO with DMR reference number: GP30/5/1/2/2/173 MR (RSO mining right) valid from 7 May 2009 to 6 May 2039 with a total area of 3,130.4301ha Ezulwini Mining Company Proprietary Limited (Ezulwini also held a prospecting rights with DMR reference number: GP30/5/1/1/2/10151 PR (Zuurbekom prospecting rights) in respect of a contiguous area (6,842.2541ha) to the east of the Cooke 1, 2 and 3 mining right and Ezulwini mining right. A Section 102 application in terms of the MPRDA was submitted prior to the lapsing of the Zuurbekom prospecting rights to incorporate the Zuurbekom prospecting rights area into the Ezulwini mining right The Cooke 1, 2 and 3 operations (Rand Uranium Proprietary Limited) also held two further prospecting rights. The first prospecting rights located over the Cooke 4 South TSF, measuring 243.542ha and with DMR reference: GP30/5/1/1/2/10055 RPR, and the second prospecting rights located over the Millsite dump complex, measuring approximately 1,240ha and with DMR reference number: GP30/5/1/1/2/10054 RPR A Section 102 application was submitted in 2015 for the GP30/5/1/1/2/10055 RPR and GP30/5/1/1/2/10054 RPR areas to be incorporated into the Cooke 1, 2 and 3 mining right, with a Section 102 application submitted prior to the lapsing of the mentioned PRs, and not yet finalised |
Infrastructure | Four shaft complexes and two metallurgical plants used for treatment of TSF and SRD |
Mining method | Cooke 1, 2 and 3: conventional scattered breast mining and pillar extraction Hydraulic reclamation (water jets), gravity feed to sump pump station and pumped via pipeline to a processing plant Dump, load and haul of SRD |
Mineral processing | Two gold processing plants (one external on a toll treatment arrangement) Uranium processing plant on care and maintenance (at Ezulwini) |
Tailings disposal | Ezulwini South TSF (toll treatment arrangement) Currently RSO tailings are deposited into old underground workings, down old, defunct open- cast mine workings estimated to accommodate all planned residue over the LoM |
Climate | No extreme climate conditions are experienced that affect mining operations |
Environmental/ health and safety | Cooke’s systems, procedures and training are in line with international best practice The procedures and status of all the programmes that drive environmental, health and safety goals are detailed in the Integrated Annual Report 2017 |
Life of mine | It is estimated that the current SRD Mineral Reserves will sustain the surface operation until 2019 |
Key developments and brownfield projects (on-mine) | The gold Mineral Reserves for Cooke 1, 2 and 3 underground have been removed following the shafts being declared uneconomical Cooke 4 is scheduled for rewatering |
Hoisting and production capacities | Operating shaft | Operational hoisting capacity (ktpm) | Planned production (ktpm) |
1 | 15 | 0 |
2 | 28 | 0 |
3 | 54 | 0 |
TSF | 4001 | 385 |
| 1 Reclamation capacity |
| |
Plant capacities | Plant | Design capacity (ktpm) | Current operational capacity (ktpm) | Average recovery factor (%) | Material treated |
| Cooke | 400 | 385 | 56.6 | SRD/TSF |
| Ezulwini1 | 200 | 115 | 95.6 | SRD |
| 1 Used for toll treatment of SRD material |
| |
Sibanye-Stillwater | Form 20-F 2017 | 245 |
PGM operations: Kroondal
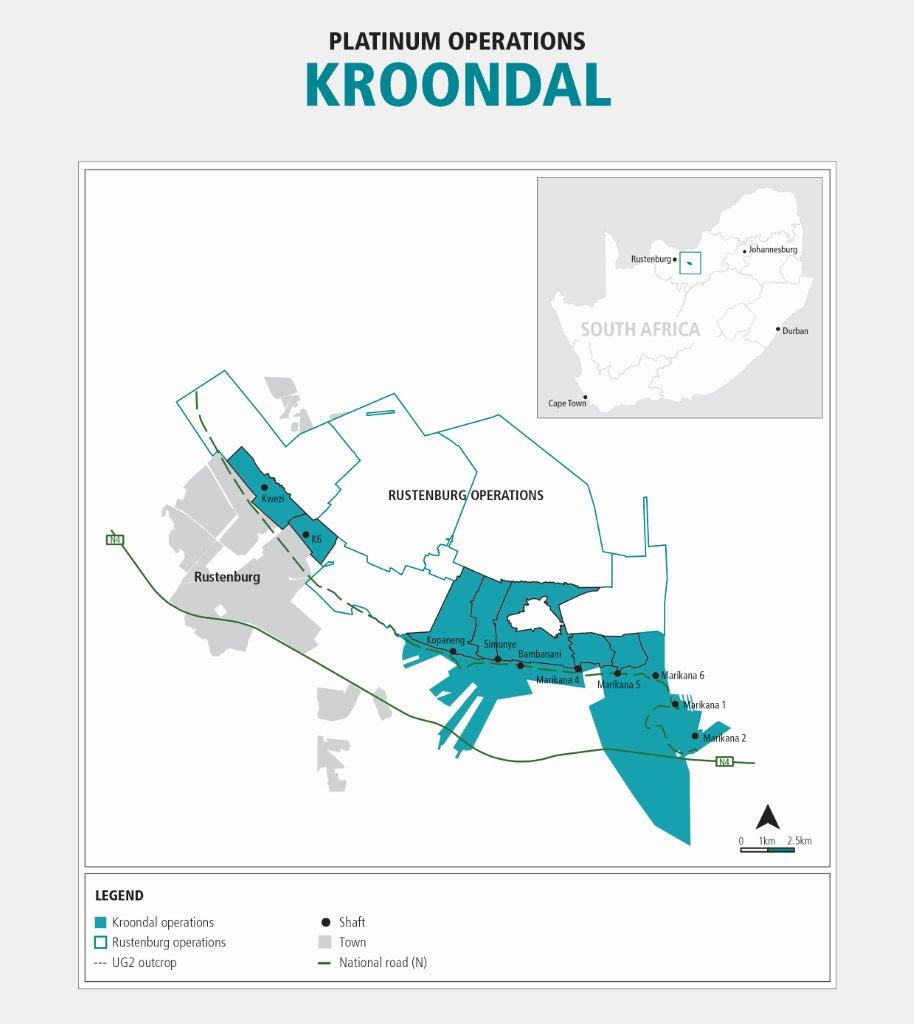
| |
General | Kroondal is situated in the Magisterial District of Rustenburg near the town of Rustenburg, approximately 120km northwest of Johannesburg and about 120km west of Pretoria (Tshwane) in the North West province of South Africa. Kroondal consists of established shallow mechanised PGM mines in the Western Limb of the BC. Currently Kroondal consists of five operating shafts and one shaft under care and maintenance. The UG2 Reef is currently being mined at Kroondal. The deposit is accessed from surface using decline systems and mined via bord and pillar method. Mining takes place at depths between 250m and 550m below surface. There are two concentrator processing plants (K1 and K2) processing the run-of-mine (ROM) at Kroondal operations and there is spare processing capacity at a third plant, which is currently under care and maintenance (Marikana plant). While Sibanye-Stillwater purchased all of the Aquarius assets, the MR in the area is registered under AAP and therefore excluded. The Kroondal Extension is mined on royalty basis to AAP by the Platinum operations with exclusive MR from AAP. Blue Ridge has been on care and maintenance since 2011 and remained on care and maintenance during 2017, therefore not declaring any Mineral Reserves. All legal aspects and tenure are in order. |
Strategic intent | Optimise the LoM by repositioning and creating synergies with Rustenburg Platinum Mines Stabilise production profiles at sustainable levels |
Mineralisation style | Layered Mafic to Ultramafic Intrusive Igneous orebody |
| |
Sibanye-Stillwater | Form 20-F 2017 | 246 |
Mineralisation characteristics | Tabular orebody, laterally continuous with relatively long-range predictability Two chromite rich horizons hosting PGM Minerals within the UG2, separated by a pyroxenite parting forming the mineable horizon Reef disruptions in the form of potholing occur throughout the orebody Cross cutting faulted dykes occur throughout the orebody at variable scales |
Depositional environment | The mining unit consists of an upper UG2 Leader (UG2L), a feldspathic pyroxenite parting and UG2 Main Mineralisation is constrained to the UG2L and the UG2 The Merensky Reef at Kroondal was mined out pre-acquisition by Sibanye |
Licence status and holdings | Kroondal has a new order mining right No 35/2007 MRC, DMR Ref NW30/5/1/2/2(104) MR valid from 17 October 2007 to 16 October 2022 in respect of a mining area, totalling approximately 1722ha, the mining right comprises various farms (or portions thereof) |
Infrastructure | Five operating shafts: Kwezi Shaft and K6 Simunye Shaft and Bambanani Shaft Kopaneng Shaft Two concentrator plants: Kroondal No 1 plant (K1) Kroondal No 2 plant (K2) |
Mining method | Bord and pillar |
Mineral processing | Currently ore from Kwezi, Simunye and Bambanani is processed at K2 plant Ore from K6 and Kopaneng is processed at K1 plant |
Tailings disposal | K1 TSF which receives tailings from K1 concentrating plant K150 TSF which receives tailings from K1 and K2 concentrating plants K2 TSF which receives tailings from K2 concentrating plant Marikana TSF which has been recommissioned |
Climate | Surface climatic conditions do not affect the underground mining operations |
Environmental/ health and safety | Kroondal’s systems, procedures and training are in line with international best practice The procedures and status of all the programmes that drive environmental, health and safety goals are detailed in the Integrated Annual Report 2017 |
Life of mine | It is estimated that the current Mineral Reserves will sustain the operations until 2032 |
Key developments and brownfield projects (on-mine) | Current operations are fully defined, no exploration planned |
| |
Hoisting and production capacities | Mining unit | Operating shaft | 5-year planned production (ktpm) | Operating capacity (ktpm) |
Kwezi | 1 | 145 | 150 |
K6 | 1 | 125 | 140 |
Kopaneng | 1 | 144 | 186 |
Simunye | 1 | 141 | 160 |
Bambanani | 1 | 95 | 130 |
| | | |
Plant capacities | Plant | Design capacity (ktpm) | Current operational capacity (ktpm) | Average recovery factor (%) | Material treated |
| K1 | 290 | 290 | 81.7 | UG2 |
| K2 | 300 | 300 | 80.0 | UG2 |
| |
Sibanye-Stillwater | Form 20-F 2017 | 247 |
PGM operations: Rustenburg
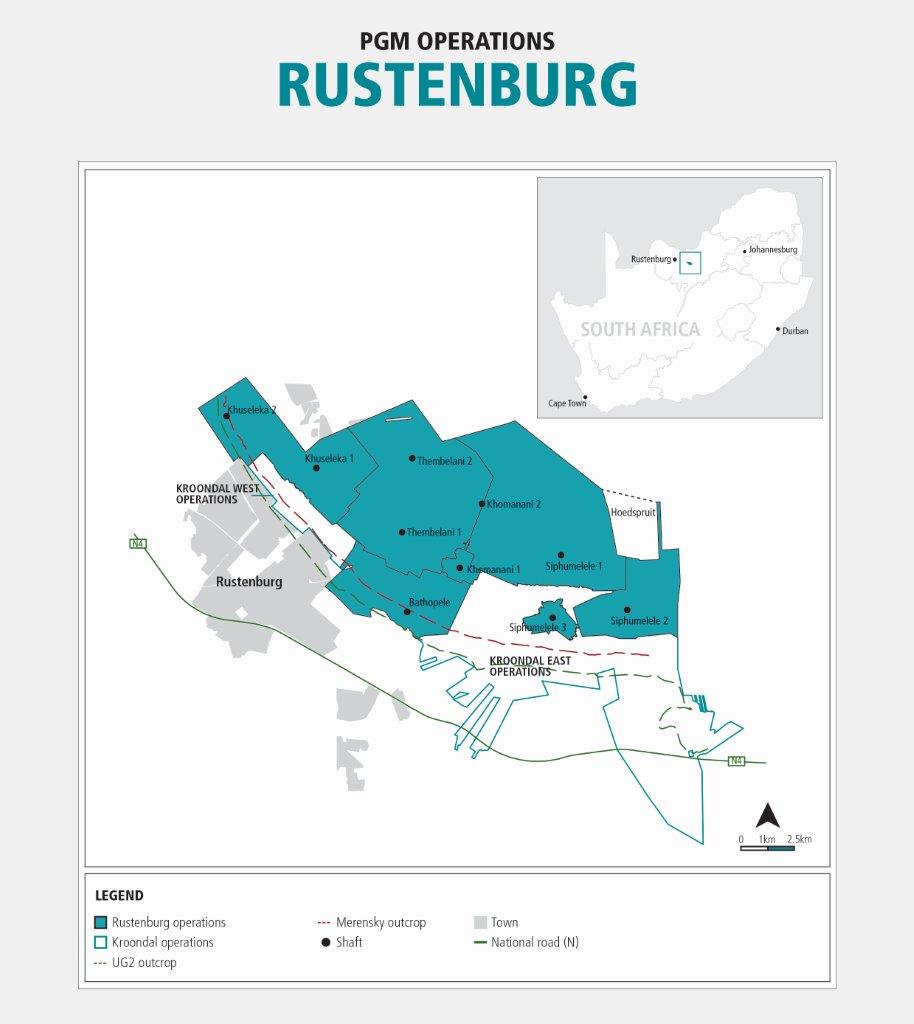
| Mineral Resource is accessed from surface using conventional underground mining methods to 34 Level (the lowest working level) at Siphumelele Shaft, approximately 1,350m BS, and 28 Level (the lowest working level) at Khuseleka, approximately 2,105m below surface, and 29 Level (the lowest working level) at Thembelani Shaft. The Mineral Resource at Bathopele is accessed from surface via two decline clusters using mechanised mining methods to a depth of approximately 500m below surface. |
General | The Rustenburg operations are located in the North West province, north-east of the towns of Rustenburg and Kroondal, and 123km west of Pretoria and 126km north-west of Johannesburg. The lease area covers approximately 130km2 and is in excess of 20km from east to west and 15km from north to south. Rustenburg consists of three operating vertical shafts, which utilise a conventional mining method (Siphumelele 1, Khuseleka 1, and Thembelani 1) and Bathopele, which is a mechanized operation. The Mineral Resource is accessed from surface using conventional underground mining methods to 34 Level (the lowest working level) at Siphumelele Shaft, approximately 1,350m BS, and 28 Level (the lowest working level) at Khuseleka, approximately 2,105m below surface, and 29 Level (the lowest working level) at Thembelani Shaft. The Mineral Resource at Bathopele is accessed from surface via two decline clusters using mechanised mining methods to a depth of approximately 500m below surface. Four process plants are located at Rustenburg. The Waterval UG2 concentrator processes only UG2 ore. The Waterval retrofit concentrator treats a blend of Merensky and UG2 ores. In 2016, this plant also started treating tailings from the Waterval East and West TSF. The Western Limb Tailings Retreatment Plant (WLTR plant) treats tailings from the Waterval and Klipfontein. The chrome retreatment plant (CRP) treats UG2 tailings to recover a saleable chromite concentrate. |
Strategic intent | Extend the LoM by repositioning and creating synergies with Kroondal Platinum Mines (KPM) Stabilise production profiles at current performance levels |
Mineralisation style | UG2 reef: consists of main chromitite band with average thickness of 70cm Mining includes the main band and various components of hangingwall and footwall to a planned minimum resource cut of 105cm Merensky reef: consists of pegmatoidal feldsphatic pyroxenite with top and bottom chrome seam at average width of 20cm Mining includes the Merensky reef and various components of hangingwall and footwall to a planned minimum resource cut of 105cm |
| |
Sibanye-Stillwater | Form 20-F 2017 | 248 |
Mineralisation characteristics | Tabular orebody, laterally continuous with relatively long-range predictability Two chromite rich horizons hosting PGM minerals within the UG2, separated by a pyroxenite parting forming the mineable horizon, and one platinum bearing pyroxenite layer known as the Merensky Reef lies 140m above the UG2 Reef Reef disruptions in the form of potholing occur throughout the orebody Cross cutting faulted dykes occur throughout the orebody at variable scales |
Depositional environment | Layered Mafic to Ultramafic Intrusive Igneous orebody |
Licence status and holdings | Rustenburg Operations presently comprises, inter alia, one mining right granted under the transitional provisions of Schedule II Rustenburg has a new order mining right, DMR Ref NW30/5/1/2/2/82 MR (82MR) valid from 25 July 2016 to 28 July 2040 |
Infrastructure | Four mining shafts: Khuseleka Thembelani Siphumelele Bathopele Mining tailings dams: Waterval East Waterval West Klipfontein |
Mining method | Conventional scattered breast mining and mechanised bord and pillar |
Mineral processing | Waterval UG2 concentrator, treating only UG2 Waterval Retrofit concentrator, treating a blend of Merensky and UG2 ores and from 2016 started treating tailings from the Waterval East and West TSF WLTR plant, treating tailings from the Klipfontein TSF CRP treats UG2 rougher middlings to recover a saleable chromite concentrate |
Tailings disposal | Hoedspruit TSF active dam with tonnes being added from WLTR plant Paardekraal TSF active dam with tonnes being added from Retrofit and UG2 plants Waterval East TSF is being mined and processed at Retrofit plant Waterval West TSF is mined and processed at WLTR plant Klipfontein TSF which is being mined and processed at WLTR plant |
Climate | Surface climatic conditions minimally affect the underground mining operations |
Environmental/ health and safety | Rustenburg systems, procedures and training are in line with international best practice |
Life of mine | It is estimated that the current Mineral Reserves will sustain the operations until 2053 |
Key developments and brownfield projects (on-mine) | Hoedspruit: The appeal was upheld by DMR under PR298JQ and Sibanye-Stillwater has commissioned a Section 102 application to convert the prospecting right into a mining right |
Hoisting and production capacities | Mining unit | Operating shaft | 5-year planned production (ktpm) | Operating capacity (ktpm) |
Siphumelele | 1 | 65 | 195 |
Khuseleka | 1 | 140 | 225 |
Thembelani | 1 | 140 | 220 |
Bathopele | 2 | 260 | 280 |
| | | | |
| |
Sibanye-Stillwater | Form 20-F 2017 | 249 |
Plant capacities | Plant | Design capacity (ktpm) | Current operational capacity (ktpm) | Average recovery factor (%) | Material treated |
Waterval UG2 concentrator | 450 | 420 | 84.0 | UG2 |
Waterval retrofit concentrator | 650 | 450 | 74.0 | MER, UG2 and surface |
WLTR plant | 450 | 380 | 28.0 | Surface |
CPR1 | 440 | 440 | 11.0 | Surface |
Plat Mile | 800 | 650 | 12.0 | Surface |
| 1 CRP @ 11.0% yield |
PGM operations: Mimosa
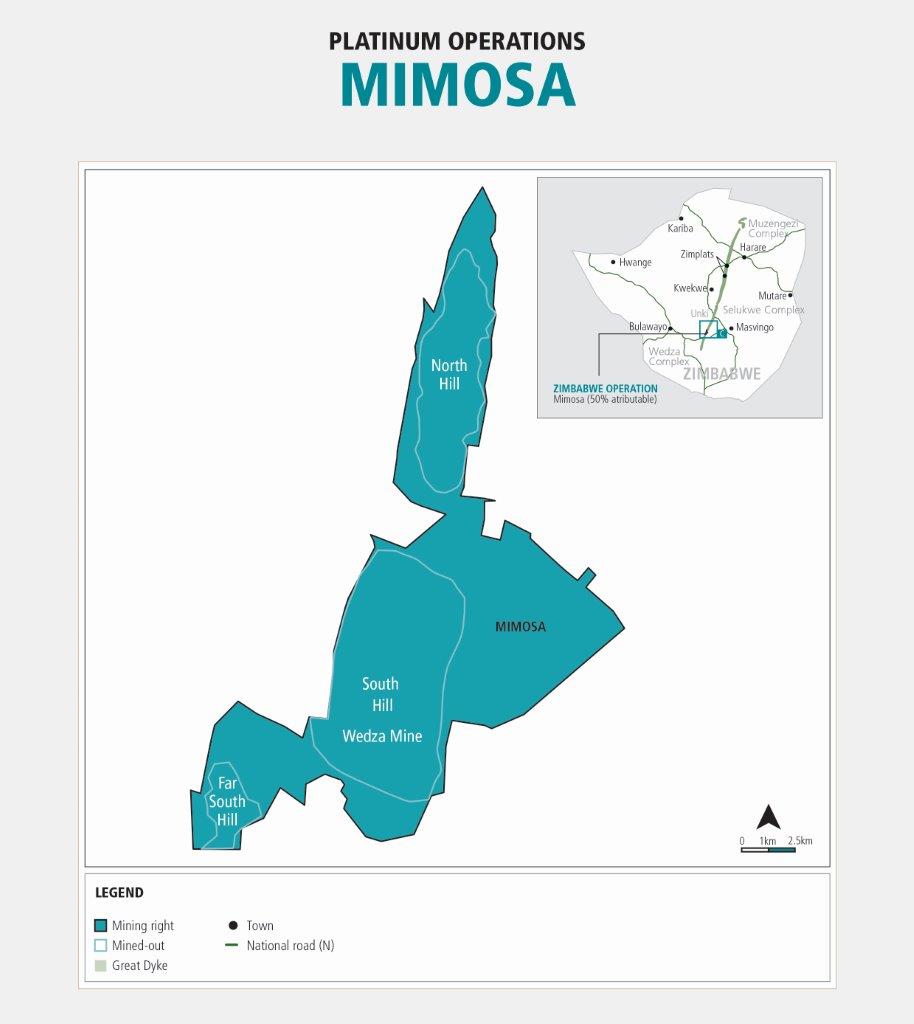
| |
General | Mimosa Mining Company is jointly owned by Impala Platinum and Sibanye-Stillwater on a 50:50 shareholding, following conclusion of a deal on 12 April 2016 which resulted in acquiring all the shares formerly belonging to Aquarius Limited. Mimosa is a PGM and base metal mining operation located in the Wedza subchamber of the Great Dyke of Zimbabwe, some 32km West of Zvishavane, a major mining centre situated 340km southwest of Harare, the capital city of Zimbabwe. The Wedza subchamber is the southernmost of four subchambers on the Great Dyke, hosting the economic MSZ from which PGMs and base metals are mined. Mimosa is an ongoing underground operation on the South Hill ore deposit consisting of two shafts, namely the Wedza Shaft and the Mtshingwe Shaft. The Wedza Shaft which is on the northern part of South Hill, has been extensively mined while Mtshingwe Shaft is at the development stage. There are two mineralised zones at Mimosa of which only the Main Sulphide Zone (MSZ) is economical. |
| |
Sibanye-Stillwater | Form 20-F 2017 | 250 |
Strategic intent | Extend the LoM Stabilise production profiles at current performance levels |
Mineralisation style | Mineralisation formation was through differential crystallisation and sulphur enrichment of an ultramafic melt by injection of successive pulse of primary magma during the formation of the Great Dyke As successive pulses of magma fed into a differentiating magma the subsequent melt became enriched with low temperature minerals culminating in sulphur saturation and the of the main sulphide zone Although mineralisation is very consistent, localised disruption to reef due to pegmatiods and washout channels have been encountered in some areas of the mine |
Mineralisation characteristics | The MSZ, host to economically exploitable PGM and associated base metals mineralisation, is located 5m to 20m below the mafic/ultramafic contact in the P1 pyroxenite band of the Wedza sub-chamber Unlike the BC, the reef is not in contact with or within chromite The MSZ has definitive metal profiles which are very consistent |
Depositional environment | Layered Mafic to Ultramafic Intrusive Igneous orebody |
Licence status and holdings | Mimosa mining right is covered by a mining lease covering an area of 6,594ha The mining lease, Lease No 24, was granted to Mimosa Mining Company on 5 September 1996 The lease was registered for nickel, copper, cobalt, gold, silica, chromite and PGMs and Mimosa Mines (Pvt) Ltd currently holds the mining right to that lease The lease agreement gives Mimosa Mining Company exclusive mining rights for PGMs and base metals within the vertical limits of its boundary |
Infrastructure | Fully equipped underground mobile equipment workshops 21km underground conveyor network with ore bunker Two 850kW, four 280kW, two 220kW and one 900kW primary exhaust fan Ten ventilation raisebore shafts with four planned for future sinking Ventilation control through brick walls and curtains Two main surface magazines and three underground distribution stores Anfo mixing shed and bulb emulsion storage facilities Service water recycled through surface tanks and underground dams Current mining at Wedza shaft and exploration development at Mtshigwe South shaft |
Mining method | Conventional bord and pillar |
Mineral processing | One concentrator processing plant with concentrates transported by road to South Africa for smelting and refining at the Impala Platinum facilities |
Tailings disposal | Tailings are disposed of at TSF on site |
Climate | No surface climatic conditions affect the underground mining operations |
Environmental/ health and safety | Mimosa systems, procedures and training are in line with international best practice |
Life of mine | It is estimated that the current Mineral Reserves will sustain the operation until 2032 |
Key developments and brownfield projects (on-mine) | Mtshingwe Block Exploration development is currently ongoing into Mtshingwe Shaft at 14 Level The Mtshingwe Block has not been evaluated It is in a graben with sympathetic faults present in the orebody |
Hoisting and production capacities | Mining unit | Operating shaft | 5-year planned production (ktpm) | Operating capacity (ktpm) |
South Hill | Wedza | 220 | 240 |
| | | | |
Plant capacities | Plant | Design capacity (ktpm) | Current operational capacity (ktpm) | Average recovery factor (%) | Material treated |
| Mimosa | 185 | 227 | 78.2 | MSZ |
| |
Sibanye-Stillwater | Form 20-F 2017 | 251 |
United states region
PGM operations: stillwater and east boulder
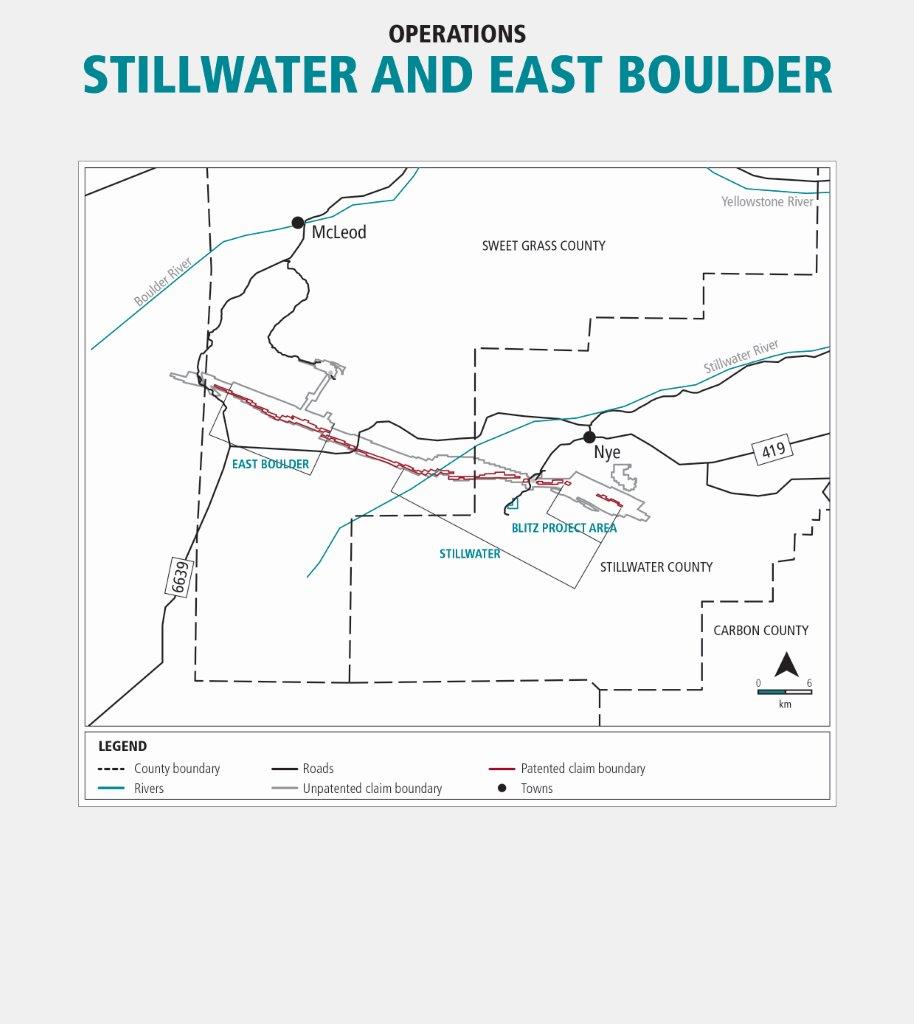
Stillwater and EAST BOULDER
The East Boulder Mine is fully permitted independently of the Stillwater Mine and comprises a second distinct mining operation accessing the western portion of the J-M Reef. The mine consists of underground mine development and surface support facilities, including a concentrator, shop and warehouse, changing facilities, storage facilities, office and tailings management facility. All mine facilities are wholly-owned and operated by the Company. Surface facilities for the East Boulder Mine are situated on unpatented mill site claims maintained on federal lands located within the Custer Gallatin National Forest and administered by the DEQ and USFS. All surface facilities, including the tailings management complex, are located within a 1,630 acre operating permit area. Proven and probable ore reserves for the mine are controlled by patented mining claims owned by the Company.
From the surface facilities at the East Boulder Mine, the J-M Reef is accessed by two 18,500 foot long, 15 foot diameter horizontal rail adits driven into the mountain. These two parallel tunnels intersect the ore body deep within the mountain at an elevation 6,450 feet above sea level. Within the mine, the ore body currently is accessed from eight levels of horizontal footwall lateral drifts driven parallel to the J-M Reef totaling approximately 85,000 feet in length, and from three primary ramps totaling approximately 37,700 feet of development. The ore body is accessed vertically by ramp systems tying together the footwall laterals and driven approximately every 2,500 feet along the length of the deposit. The mined ore is transported horizontally out of the East Boulder Mine by rail haulage to the mine portal.
The Company processes ore from the East Boulder Mine through a surface concentrator facility (mill) adjacent to the two portals. The mill has a permitted throughput capacity of 2,000 tons per day. Crushed mine ore is fed into the concentrator, mixed with water and ground to slurry in the concentrator’s mill circuits to liberate the PGM-bearing sulfide minerals from the rock matrix. Various reagents are added to the slurry, which then is agitated in a froth flotation circuit to separate the valuable sulfides from the waste rock. In this circuit, the sulfide minerals are successively floated, recycled, re-ground and re-floated to produce a concentrate suitable for further processing. The final flotation concentrate, which represents approximately 2.5% of the original ore weight, is filtered, placed in large bins and then transported by truck to the Company’s metallurgical complex in Columbus, Montana.
| |
Sibanye-Stillwater | Form 20-F 2017 | 252 |
| |
General | The mine began operations in 1986. Stillwater mine, including the Blitz section, is located near the town of Nye and the East Boulder Mine is located near the town of McLeod. Both are shallow to intermediate level underground PGM mines. PGM production commenced in 1986 and has largely been uninterrupted. The mining assets are located in the front range of the Beartooth Mountains with elevations exceeding 1,524m amsl. The mine is located approximately 85 miles southwest of Billings, Montana and is accessed by a paved road. The mine has adequate water and power from established sources to conduct its current operations. Several river valleys have eroded into the mountainous terrain with the Stillwater River valley providing reef access to the Stillwater Mine. The two mines are within the Custer and Gallatin national forests, approximately 42km to the north of Miller Mountain and Wolverine Peak. The Stillwater River generally flows from the south to the north-east after leaving the mountains near the town of Nye, approximately 5.6km downstream of the Stillwater. The Stillwater River is a tributary of the Yellowstone River, which it joins approximately 56.3km downstream of the Stillwater. The Stillwater Mine accesses and has developed a 6.8 mile-long underground segment of the J-M Reef, on various levels between 1,700 and 7,500 feet above sea level. Access to the ore at the Stillwater Mine is accomplished by means of a 1,950 foot vertical shaft from the valley floor and by a system of horizontal adits and drifts driven parallel to the strike of the J-M Reef at vertical intervals of between 150 feet and 300 feet. The climate is very seasonal with freezing temperatures and blowing snow in the winter which occasionally poses adverse operating conditions. Snow can have an impact on mine site access but avalanches have never been an issue in the steep terrain. Heavy snows, stream flooding or forest fires are the only significant environmental factors affecting site access but these have not significantly hindered operations since mining commenced at Stillwater and East Boulder. Ramp and fill (R&F) stopes are the predominant mining method (85%) at Stillwater and East Boulder. While the primary method is by overhand mining, some undercut R&F is used. Of the R&F stopes, overhand R&F stopes constitute 90% and underhand R&F stopes account for 10%. All surface infrastructure and tailings management facilities are located within the Stillwater Mine and East Boulder Mine operating permits, which covers and area measuring 1,396ha. Stillwater has two principal mining sections, namely: The current section, which has been in operation since 1986 and currently produces 330,000oz per annum (676 ktpa) of Pt + Pd in concentrate The Blitz section, which is currently under development and started ore production in 2017 All legal aspects and tenure are in order. East Boulder has been in operation since 2002 and currently produces 220,000oz per annum (580 ktpa) of Pt + Pd in concentrate. The East Boulder Mine is located in Sweet Grass County, Montana, approximately 32 miles south of the town of Big Timber and is accessed by a public road. Development of East Boulder Mine began in 1988, and the mine commenced commercial production effective 1 January 2002 and is actively mining approximately 3.2 horizontal miles underground along the J-M Reef. |
Strategic intent | Improve cost per ounce performance through efficiently utilising manpower and equipment Significantly increase production in the Blitz area |
Mineralisation style | Large layered igneous complex |
Mineralisation characteristics | The J-M Reef is a magmatic reef type PGM deposit defined as the Pd-Pt rich stratigraphic interval, mainly occurring within a troctolite (OB-I zone) of the Lower Banded Series Pd and Pt are the main PGMs, both constituting between 20g/t to 25g/t over a variable thickness with economic mineralised thickness ranging from 0.9m-2.7m and averaging 1.8m. Ratios of Pd to Pt in metallurgical concentrate are known to range from 3.3:1 (in situ 3.4:1) at Stillwater to 3.5:1 (in situ 3.6:1) at East Boulder Other associated PGMs such as Rh, Ir, Ru and Os, and Au occur in low abundances and are generally not evaluated by Stillwater The visual identification of the J-M Reef is facilitated by the presence of approximately 0.25% to locally 3% visible associated disseminated copper-nickel pathfinder sulphide minerals |
Licence status and holdings | Stillwater holds or leases 1,674 patented and unpatented lode, placer, tunnel or mill site claims in the Stillwater, Sweet Grass and Park counties of south-central Montana, encompassing over 10,522ha, claims are renewed annually and are in good standing |
Infrastructure | Stillwater: Key infrastructure includes the mining operations and ancillary buildings that contain the concentrator, workshop and warehouse, changing facilities, headframe, hoist house, sand and paste plants, water treatment, storage facilities and offices East Boulder: Key Infrastructure includes the mining operations and ancillary buildings that contain the concentrator, workshop and warehouse, changing facilities, twin tunnels to access mine, sand plant, water treatment, storage facilities and offices |
| |
Sibanye-Stillwater | Form 20-F 2017 | 253 |
Mining method | The three principal mining methods are the following: Overhand cut and fill (C&F) stoping, utilising either conventional trackless machinery or raise boring to create access R&F as both overhand and underhand utilizing rubber-tyred equipment Sub-level extraction (SLE) by long hole open stoping with subsequent backfill utilising rubber- tyre equipment |
Mineral processing | The Stillwater concentrator currently operates at a production level of 680kt per annum based on 75% utilisation in alignment with mine production. The excess capacity will be used to process the ore from the Blitz section. A plant capacity upgrade is planned in 2021 to accommodate the increase from the Blitz section. The East Boulder concentrator currently operates at a production level of 608kt per year based on a 75% utilisation in alignment with mine production, and there is excess capacity to process additional tonnage if required The smelter in Columbus, Montana consists of a 136t per day submerged arc furnace and a smaller 91t per day submerged arc furnace. The smelter has adequate capacity to process current and planned concentrates from the mining operations The convertor matte from the smelter is treated at the base metal refinery, which has feed capacity of 3,900t of matte per annum, and the base metal refinery has adequate capacity to process current and planned matte production with a minor upgrade to copper electrowinning circuit in 2019 |
Tailings disposal | Stillwater: Currently 55% of all mill tails go back underground for backfill the remaining 45% is sent via pipeline to Hertzler TSF 11km north of the Stillwater, current storage facility has 6,400kt of storage remaining, with expansion planned to add an addition 11,600kt of storage in 2029, and the Hertzler storage facility has adequate storage for the known proven and probable Ore Reserves East Boulder: Currently 50% of all mill tails go back underground for backfill with the remaining 50% sent via pipeline to a TSF adjacent to the mine site. The current storage facility has 5,200kt of storage remaining. An expansion is planned to add an addition 5,700kt of storage in 2034, and the current and planned storage facilities have adequate storage for the known proven and probable Ore Reserves |
Climate | Extreme climatic conditions are experienced but have minimally hindered the mining operations, which have historically been curtailed for no more than one or two days per annum |
Environmental/ health and safety | The procedures and status of all the programmes that drive environmental, health and safety health and safety goals are detailed in the Integrated 2017 Integrated Annual Report |
Life of mine | Stillwater: It is estimated that the current Mineral Reserves will sustain the Stillwater operation until 2039, and the Blitz project has the potential to significantly expand the Mineral Reserve in the future East Boulder: It is estimated that the current Mineral Reserves will sustain the East Boulder operation until 2059 |
Key developments and brownfield projects (on-mine) | The approved Blitz project will significantly expand the ore production at the Stillwater. First ore production was in October 2017 and is expected to reach a sustaining level of 300Koz per annum in 2022 |
| |
Hoisting and production capacities | Muck haulage system | Operational hoisting/ capacity (ktpm) | Planned production (ktpm) |
Stillwater Shaft | 5,400 | 3,500 |
Blitz Rail | 4,000 | 3,000 |
East Boulder Rail | 4,500 | 2,600 |
| | | |
Plant capacities | Plant | Design capacity (ktpm) | Current operational capacity (ktpm) | Average recovery factor (%) | Material treated |
Stillwater | 3,1001 | 2,500 | 92.2 | UG |
East Boulder | 1,600 | 2,200 | 90.8 | UG |
| 1 Stillwater concentrator capacity is planned to increase to meet design capacity in 2021 |
| |
Sibanye-Stillwater | Form 20-F 2017 | 254 |
INTRODUCTION
Sibanye-Stillwater reports its mineral reserves in accordance with SAMREC, the South African Code for the reporting of Mineral Asset Valuation and other relevant international codes such as the SEC’s Industry Guide 7. Only the reserves at each of our operations and exploration projects as of 31 December 2017, which qualify as reserves for purposes of the SEC’s Industry Guide number 7, are presented in the tables below. In accordance with the requirements imposed by the JSE, we report our reserves using the terms and definitions of the SAMREC Code (2016 edition). Mineral or ore reserves, as defined under the SAMREC Code, are divided into categories of proved and probable reserves and are expressed in terms of tons to be processed at mill feed head grades, allowing for estimated mining dilution, mining recovery and other factors.
SA GOLD OPERATIONS
Geology
Our operations consist of deep level underground gold mines located along the northern and southwestern margins of the Witwatersrand Basin in South Africa. These properties include the Driefontein, Kloof and Cooke operations along the northern margin and the Beatrix operation along the southwestern margin. These mines are typical of the many Witwatersrand Basin operations, which have been the primary contributors to South Africa’s production of a significant portion of the world’s recorded gold output since 1886.
The Witwatersrand Basin comprises a 6,000-meter vertical thickness of sedimentary rocks, extending laterally for some 350 kilometres northeast to southwest by some 120 kilometres northwest to southeast, generally dipping at shallow angles toward the centre of the Witwatersrand Basin. The Witwatersrand Basin outcrops at its northern extent near Johannesburg, but to the west, south and east it is overlaid by up to 4,000 meters of volcanic and sedimentary rocks. The Witwatersrand Basin is Archaean in age, meaning the sedimentary rocks are of the order of 2.8 billion years old.
Gold mineralisation occurs within laterally extensive quartz pebble conglomerate beds called reefs, which are developed above unconformable surfaces near the basin margin. As a result of faulting and primary controls on mineralisation processes, the goldfields are not continuous and are characterised by the presence or dominance of different reef units. The reefs are generally less than two meters in thickness and are widely considered to represent laterally extensive braided fluvial deposits or unconfined flow deposits, which formed along the flanks of alluvial fan systems around the edge of an inland sea. Dykes and sills of diabase or dolerite composition are developed within the Witwatersrand Basin and are associated with several intrusive and extrusive events.
Gold generally occurs in native form, often associated with pyrite, carbon and uranium. Pyrite and gold within the reefs display a variety of forms, some obviously indicative of detrital transport within the depositional system and others suggesting crystallisation within the reef itself.
As early as 1923, the presence of uranium was noted in the Witwatersrand reefs. It was found that on average the reefs contain about 0.03% uranium and as a by-product of gold relatively low uranium grades can be recovered. Notwithstanding different opinions as to the origin of the uranium in the reefs, most theories accept localisation of both gold and uranium a function of sedimentary textures. Metal concentrations are directly related to the reefs. Exploration programmes and eventual evaluation of gold and uranium according to a placer philosophy, prove to be highly successful.
The most fundamental controls of gold and uranium distribution are the primary sedimentary features such as facies variation and channel directions. Consequently, the modeling of sedimentary features within the reefs and the correlation of payable grades within certain facies is key to in situ reserve estimation, as well as effective operational mine planning and grade control.
Block Model Estimation and Reserving Process
Underground reserves are based on an estimated block model of the ore body, which is derived from surface drilling, underground drilling, surface three-dimensional reflection seismics, ore body facies modeling, structural modeling, underground mapping, underground channel sampling and geostatistical estimation. The reefs are initially explored by drilling from the surface on an approximately 500-meter to 2,000-meter grid. Once underground access is available, definition drilling is undertaken on an approximately 30-meter to 90-meter grid. Underground channel sampling perpendicular to the reef is undertaken at three-meter intervals in development areas and five-meter intervals at stope faces. Estimation is constrained within both geologically homogenous structural and facies zones, and is generally derived from either ordinary or simple kriged small-scale grids. Areas close to current workings will have smaller block sizes ranging from 10-meter to 50-meter and is generally derived from either ordinary or simple kriging. Areas further away will have blocks sizes ranging from 50 meters to 420 meters, and is estimated using simple Kriging in combination with declustered averaging or Sichel “t” techniques.
Surface low grade rock dumps (SRD) are estimated based on bulk samples taken at regular intervals, and historical processing results. Surface tailings (TSF) have been estimated using a regular, closely spaced drill pattern (100m × 100m). Volume estimates are determined by land and aerial surveys conducted on a regular basis.
Reserves are reported using pay limits, to reflect both the cost structures and required margins relevant to each mining operation. Pay limit is defined as the grade at which an ore body can be mined without profit or loss, and is calculated using an appropriate metal price, working cost and modifying factors. Modifying factors used to calculate the pay limit grades include adjustments to mill delivered amounts, due to dilution incurred in the course of mining. Modifying factors applied in estimating reserves are based on historical achievements, but may incorporate minor adjustments for planned operational improvements. Tonnage and grade include some mineralisation below the selected pay limit to ensure that the reserve comprises blocks of adequate size and continuity. Reserves also take into account cost levels at each operation and are derived from a strategic and operational planning process that is embedded at each operation. Reserves on the operating mines are supported by cyclical mine plans, and the project reserves are derived from detailed pre-feasibility or feasibility studies compiled for each project respectively.
| |
Sibanye-Stillwater | Form 20-F 2017 | 255 |
Reserve Classification Methodology
The reserve estimates are initially categorised according to the measured, indicated and inferred classification assigned to the block models. The measured confidence category is converted to proved reserves and indicated to probable reserves. The inferred confidence category has too low a confidence to be converted to reserves and is excluded.
The confidence classification applied to the block model uses a combination of the quality of the Kriged estimates and the confidence in the geological interpretation (drill spacing, continuity of ore body, structural confidence, and confidence in extrapolation or interpolation of facies types). The lower of the two confidence estimates is accepted as the final classification.
The quality of the Kriged estimate is benchmarked using the 90% lower confidence limit on the estimates. The Kriging variance is used in conjunction with the estimated value to calculate the 90% lower confidence limit for each block. The 90% lower confidence limit value estimate is then divided by the estimate and expressed as a percentage. Blocks with a value of greater than 50% are considered to have measured confidence (assuming that the geological confidence is also good enough). Blocks with values of between 20% and 50% are considered to have indicated confidence, and block with values of less than 20% are classified as inferred confidence. The geological confidence is assigned by the geologists, and is based on their subjective judgement. The confidence could be down-graded by the geologists based on the level of ore body complexity. Blocks classified as measured confidence are generally adjacent to closely spaced sampling and generally pierced by a relatively dense irregular pattern of boreholes. Blocks classified as indicated confidence are generally adjacent to blocks classified as measured confidence. In cases where the mining engineer deems it necessary, he may downgrade the classification from proved to probable based on expected mining complexity.
| |
Sibanye-Stillwater | Form 20-F 2017 | 256 |
Gold Ore Reserve Statement as of 31 December 20171, 2
As of 31 December 2017, Sibanye-Stillwater had aggregate proved and probable gold reserves of approximately 25.7Moz as set forth in the following table.
| | | | |
| 2017 | 2016 |
| Tons | Grade | Gold | Gold |
| (Mt) | (g/t) | (Moz) | (Moz) |
Operations | | | | |
Beatrix | | | | |
Proved (AI)3 | 8.9 | 3.3 | 0.933 | 2.048 |
Probable (AI) | 11.2 | 3.2 | 1.152 | 1.675 |
Total (AI) | 20.1 | 3.2 | 2.086 | 3.723 |
Probable (BI)4 | - | - | - | - |
Total underground | 20.1 | 3.2 | 2.086 | 3.723 |
Driefontein | | | | |
Proved (AI) | 16.8 | 6.7 | 3.602 | 4.420 |
Probable (AI) | 9.2 | 5.6 | 1.670 | 0.737 |
Total (AI) | 26.0 | 6.3 | 5.272 | 5.157 |
Probable (BI) | 8.8 | 6.1 | 1.707 | 1.694 |
Total underground | 34.8 | 6.2 | 6.980 | 6.851 |
Kloof | | | | |
Proved (AI) | 13.5 | 8.1 | 3.516 | 4.700 |
Probable (AI) | 13.0 | 5.1 | 2.135 | 1.184 |
Total (AI) | 26.5 | 6.6 | 5.652 | 5.884 |
Probable (BI) | 3.2 | 5.3 | 0.537 | 0.566 |
Total underground | 29.7 | 6.5 | 6.189 | 6.450 |
Cooke | | | | |
Proved (AI) | - | - | - | 0.728 |
Probable (AI) | - | - | - | 0.097 |
Total (AI) | - | - | - | 0.826 |
Probable (BI) | - | - | - | - |
Total underground | - | - | - | 0.826 |
Total underground operations | 84.6 | 5.6 | 15.254 | 17.849 |
Current SRD and TSF | | | | |
Beatrix (Probable) | 3.7 | 0.3 | 0.041 | 0.052 |
Driefontein (Probable) | 1.1 | 0.5 | 0.019 | 0.076 |
Kloof (Probable) | 11.3 | 0.5 | 0.192 | 0.200 |
Randfontein Surface (Proved) | 5.4 | 0.3 | 0.052 | 0.047 |
Randfontein Surface (Probable) | 0.4 | 0.6 | 0.007 | |
Total SRD and TSF | 21.8 | 0.4 | 0.311 | 0.375 |
Total (excluding projects) | | | | |
Beatrix | 23.9 | 2.8 | 2.127 | 3.775 |
Driefontein | 35.9 | 6.1 | 6.998 | 6.926 |
Kloof | 41.0 | 4.8 | 6.381 | 6.650 |
Cooke | 5.7 | 0.3 | 0.059 | 0.872 |
Total (excluding projects) | 106.4 | 4.5 | 15.565 | 18.224 |
Projects | | | | |
Underground projects | | | | |
Burnstone (Proved) | 0.5 | 3.7 | 0.058 | |
Burnstone (Probable) | 14.3 | 4.1 | 1.876 | 2.137 |
De Bron Merriespruit | 15.4 | 4.3 | 2.112 | 2.112 |
Total underground projects | 30.2 | 4.2 | 4.045 | 4.248 |
Surface projects | | | | |
WRTRP (Probable) | 670.8 | 0.3 | 6.126 | 6.222 |
Total surface projects | 670.8 | 0.3 | 6.126 | 6.222 |
Total projects | 701.0 | 0.5 | 10.171 | 10.470 |
| | | | |
Total underground (Including projects) | 114.8 | 5.4 | 19.300 | 22.098 |
Total surface (including projects) | 692.6 | 0.3 | 6.437 | 6.596 |
Total mineral reserves | 807.4 | 1.0 | 25.737 | 28.694 |
1 Managed, unless otherwise stated.
2
| (a) | | Quoted as mill delivered metric tons and Run-of-Mine (RoM) grades, inclusive of all mining dilutions and gold losses except mill recovery. Metallurgical recovery factors have not been applied to the reserve figures. The metallurgical recovery is the ratio, expressed as a percentage, of the mass of the specific mineral |
| |
Sibanye-Stillwater | Form 20-F 2017 | 257 |
product actually recovered from ore treated at the plant to its total specific mineral content before treatment. The approximate metallurgical factors for gold are as follows: (i) Driefontein Plants (DP1-Underground feed 96.6%, DP 2 SRD feed 83.9% and DP 3 SRD feed 80.0%), (ii) Kloof Plants (KP1 SRD feed 89.4%, KP 2 Underground feed 98.4%), (iii) Beatrix Plants (BP1 Underground feed 95.5%, BP1 SRD feed 83.4%, BP2 Underground feed 93.0% (iv) Ezulwini Plant SRD feed 86.6%, Cooke Plant TSF feed 56.6%, (v) De Bron Merriespruit underground utilising BP1 96.0%, (vi) WRTRP TSF feed 52.9% and (vii) Burnstone 96.0%. |
| (b) | | A gold price of R510,000/kg (US$1,218/oz at an exchange rate of R13.05/US$) was applied in valuing the ore reserve. The gold price used for reserves is the approximate three-year trailing average, calculated on a monthly basis, of the London afternoon fixing price of gold. These prices are approximately 4% higher in Rand terms than the prices used for the 31 December 2016 declaration. |
| (c) | | Mine dilution relates to the difference between the mill tonnage and the stope face tonnage and includes other sources stopping (which is waste that is broken on the mining horizon, other than on the stope face), development to mill and tonnage discrepancy (which is the difference between the tonnage expected on the basis of the mine’s measuring methods and the tonnage accounted for by the plant). The mine dilution factors are as follows: (i) Driefontein 29%; (ii) Kloof 42%; (iii) Beatrix 22%, (iv) De Bron Merriespruit (Down Dip mine design) 48% and (v) Burnstone 13%. |
| (d) | | The mining recovery factor relates to the proportion or percentage of planned and scheduled reserves against total potentially available reserves at the gold price used for the declaration of reserves, with all modifying factors, mining constraints and pillar discounts applied. The mining recovery factors are as follows: (i) Driefontein 57%; (ii) Kloof 111%; (iii) Beatrix 43%, (iv) De Bron Merriespruit 89%, (v) Burnstone 53% and (vi) WRTRP 100%. Where the percentage is low, there is significant resource potential on the operation, and where it is more than 100% it is a function of low-grade incremental mining and planned decreases in pay limits. |
| (e) | | The pay limit varies per operation and per shaft, depending on the respective costs, depletion schedule, ore type and dilution. The following are the average pay limits applied in the underground planning process: (i) Driefontein 1,480cm.g/t, (ii) Kloof 1,670cm.g/t and (iii) Beatrix 1,000cm.g/t. |
| (f) | | Totals may not sum due to rounding. |
| (g) | | A mine call factor based on historic performance and incorporating any planned improvements is applied to the mineral reserves. The following mine call factors have been applied: Driefontein 83%, Kloof 81%, Beatrix 78%, De Bron Merriespruit 81% and Burnstone 85% |
| (h) | | The WRTRP (assessing the potential for extraction of gold and uranium from Sibanye-Stillwater’s West Wits Line and the adjacent Cooke TSFs) is based on a Definitive Feasibility Study. The 31 December 2017 reserves are based on the definitive feasibility study, but have been updated with deposition to the active TSFs during 2017 and exclusions of some TSFs transferred to the Cooke surface operations. |
3 Above infrastructure (AI) reserves relate to mineralisation which is located at a level at which an operation currently has infrastructure sufficient to allow mining operations to occur.
4 Below infrastructure (BI) reserves relate to mineralisation which is located at a level at which an operation currently does not have infrastructure sufficient to allow mining operations to occur, but where the operation has made plans to install additional infrastructure in the future which will allow mining to occur at that level.
Gold Price Sensitivity
The amount of gold mineralisation that we can economically extract, and therefore can classify as reserves, is sensitive to fluctuations in the price of gold. The following table indicates our reserves at different gold prices that are 10% above and below the US$1,200/oz (R510,000/kg) gold price used to estimate our attributable reserves; however, the reserve sensitivities are not based on detailed depletion schedules and should be considered on a relative and indicative basis only.
| | | |
(Moz)1 | R459,000/kg | R510,000/kg | R561,000/kg |
Beatrix | 1.636 | 2.127 | 2.384 |
Driefontein | 6.373 | 6.998 | 7.521 |
Kloof | 5.143 | 6.381 | 7.003 |
Cooke | 0.059 | 0.059 | 0.059 |
Burnstone | 1.372 | 1.934 | 2.439 |
De Bron Merriespruit | - | 2.112 | 2.207 |
WRTRP | - | 6.126 | 6.126 |
Total | 14.583 | 25.737 | 27.739 |
1 Driefontein, Kloof, Beatrix and Cooke operations’ reserves include Run-of-Mine ore stockpiles, tailings and D.
Our attributable gold reserves decreased from 28.7Moz at 31 December 2016 to 25.7Moz at 31 December 2017, as set forth in the following table:
| |
Factors | Gold (Moz) |
31 December 2016 | 28.694 |
2017 depletion | (1.457) |
Post-depletion | 27.236 |
Changes in geology structure at operations | (0.376) |
Changes in estimation models at operations | 0.642 |
Technical factors (mine call factor (MCF), % waste mining) | (0.560) |
Specific inclusions | |
White areas and general additions | 1.092 |
Secondary reefs | 0.379 |
Additional SRDs at Kloof and Randfontein Surface operation (RSO) | 0.099 |
Specific exclusions | |
Beatrix 4 Shaft and Beisa project | (1.659) |
Cooke underground operations | (0.752) |
WRTRP exclusions | (0.096) |
Rock engineering | (0.096) |
Pay limit changes | (0.174) |
31 December 2017 | 25.736 |
| |
Sibanye-Stillwater | Form 20-F 2017 | 258 |
Uranium Ore Reserve Statement as of 31 December 20171, 2
As of 31 December 2017, we had probable uranium reserves of approximately 96.1Mlb as set forth in the following table:
| | | | |
| 2017 | 2016 |
| Tons | Grade | U3O8 | U3O8 |
| (Mt) | (kg/t) | (Mlb) | (Mlb) |
Operations | | | | |
Beatrix | | | | |
Proved (AI) | - | - | - | - |
Probable (AI) | - | - | - | 16.060 |
Total underground | - | - | - | 16.060 |
Cooke | | | | |
Proved (AI) | - | - | - | - |
Probable (AI) | - | - | - | - |
Total underground | - | - | - | - |
Total underground operations | - | - | - | 16.060 |
Total (excluding projects) | | | | |
Beatrix | - | - | - | 16.060 |
Cooke | - | - | - | - |
Total (excluding projects) | - | - | - | 16.060 |
Projects | | | | |
Surface projects | | | | |
WRTRP (Probable) | 670.8 | 0.065 | 96.083 | 97.166 |
Total surface | 670.8 | 0.065 | 96.083 | 97.166 |
Total projects | 670.8 | 0.065 | 96.083 | 97.166 |
Total underground and surface | 670.8 | 0.065 | 96.083 | 113.226 |
1 Managed, unless otherwise stated.
2
| (a) | | Quoted as mill delivered metric tons and Run-of-Mine (RoM) grades, inclusive of all mining dilutions and uranium losses except mill recovery. Metallurgical recovery factors have not been applied to the reserve figures. The metallurgical recovery is the ratio, expressed as a percentage, of the mass of the specific mineral product actually recovered from ore treated at the plant to its total specific mineral content before treatment. The approximate metallurgical factor is 39% for WRTRP. |
| (b) | | A uranium price of R1,208/kg ($42/lb at an exchange rate of R13.05/US) was applied in valuing the ore reserve. The uranium price used for reserves relates to the three year average long term contract price of $42/lb. The reserve price is approximately 4% lower in South African rand terms than the price used for the 31 December 2016 declaration. |
| (c) | | For the South African operations, mine dilution relates to the difference between the mill tonnage and the stope face tonnage and includes other sources stopping (which is waste that is broken on the mining horizon, other than on the stope face), development to mill and tonnage discrepancy (which is the difference between the tonnage expected on the basis of the mine’s measuring methods and the tonnage accounted for by the plant). No dilution is applied to the WRTRP. |
| (d) | | The mining recovery factor relates to the proportion or percentage of ore mined from the defined ore body at the gold price used for the declaration of reserves. This percentage will vary from mining area to mining area and reflects planned and scheduled reserves against total potentially available reserves (at the gold price used for the declaration of reserves), with all modifying factors, mining constraints and pillar discounts applied. The mining recovery factor for the WRTRP is 100%. |
| (e) | | Uranium is mined as a co-product and as such the pay-limit does not apply. |
| (f) | | Totals may not sum due to rounding. |
| (g) | | AI: Above infrastructure reserves relate to mineralisation which is located at a level at which an operation currently has infrastructure sufficient to allow mining operations to occur. |
Our attributable uranium reserves decreased from 113.2Moz at 31 December 2016 to 96.1Moz at 31 December 2017, as set forth in the following table:
| |
Factors | U3O8 (Moz) |
31 December 2016 | 113.226 |
Specific exclusions | |
Beisa exclusions | (16.060) |
WRTRP exclusions | (1.083) |
31 December 2017 | 96.083 |
SA PGM OPERATIONS
Geology
Kroondal and Rustenburg (South Africa operations)
The Kroondal and Rustenburg Mining operations are located within the Western Limb of the Bushveld Complex (BC). The BC is the world’s largest known layered mafic-ultramafic intrusive complex covering an area of approximately 67,000km2, contains 85% of all known PGM resources and is the source of over half of current world PGM production. This massive mafic-ultramafic layered intrusion and its associated suite of granitoid rocks intruded into the Transvaal Supergroup within the Kaapvaal Craton. The Proterozoic (2.6Ga to 2.058Ga) BC is divided into the basal Rustenburg Layered Suite (RLS) of ultramafic to mafic rocks, the overlying Lebowa Granite Suite (LGS) and the felsic extrusive rocks of the Rashoop Granophyre Suite (RGS). It is the RLS that is host to the PGMs at Kroondal and Rustenburg operations. The critical zone of the RLS is
| |
Sibanye-Stillwater | Form 20-F 2017 | 259 |
host to the Merensky and UG2 reefs, the economic mineralisation exploited at Rustenburg platinum operations. At Kroondal operations only the UG2 reef is exploited, the Merensky reef was mined out at the time of acquisition by Sibanye.
The persistence of the Merensky Reef and UG2 Reef in the Kroondal and Rustenburg Platinum Lease Area has been confirmed mainly by extensive surface and underground drilling as well as 3D seismic surveys. The only aberration to this pattern is in the vicinity of the two major dunite pipes, the Brakspruit and Townlands pipes.
The Merensky Reef is, in most instances, well defined and typically consists of a pegmatoidal feldspathic pyroxenite layer, bounded on the top and bottom by thin chromitite layers. A notable feature of the Merensky Reef is the regularity of thickness, within limits of 5 cm to 60 cm, over large areas. However, variation does occur and the pegmatoidal feldspathic reef can vary locally in thickness, from a few centimeters up to approximately 1.5 meters. The Merensky Reef contains economically important base metal sulphide (BMS) and PGM mineralisation. Mineralisation of the Merensky Reef generally occurs in the pegmatoidal feldspathic pyroxenite and to a limited extent in the hangingwall and footwall, with highest PGM concentration peaking at the chromitite stringers.
The UG2 Reef, which is consistently developed throughout the RLS, is rich in chromitite but with lower gold, copper and nickel values as compared to that of the Merensky Reef. The UG2 Reef average thickness varies between 55 cm and 75 cm, and comprises a single, well developed chromitite layer. Within the Rustenburg Lease Area, the UG2 Reef occurs vertically between 90 m and 150 m below the Merensky Reef and dips in a northerly direction. The UG2 Reef is more prone to undulations than the Merensky Reef resulting in rolling reef.
As at all other platinum mines, the Merensky Reef and the UG2 Reef are affected by structural and other geological features, including potholes and Iron Rich Ultramafic Pegmatoids (IRUPs), which result in geological losses and impact on mining.
Mimosa (Non-South Africa operations – Zimbabwe)
Mimosa PGM mineralisation occurs in the Great Dyke in Zimbabwe. The Great Dyke is a long (550km) and narrow (11km), 2.5 billion year old layered igneous intrusion which bisects Zimbabwe in a north-north easterly direction. The Great Dyke is divided vertically into a lower ultramafic sequence, dominated from the base upwards by cyclic repetitions of dunite and/or serpentinite, hartzburgite and pyroxenite and an upper mafic unit consisting of gabbro and gabbro-norite and repetitions of dunite and/or serpentinite, hartzburgite and pyroxenite.
Economic PGM (platinum, palladium, rhodium, iridium and ruthenium along with gold, copper, cobalt and nickel) mineralisation occurs within the Main Sulphide Zone (MSZ), which is generally 10m to 20m from the top of the Ultramafic Sequence. Because it lies just below the Mafic Sequence, the PGM resources coincide with the four main erosional remnants of these rocks. The MSZ is typically 2 meters to 3 meters thick, but is locally up to 20 meters thick with a marked decrease in grade with thickening of the zone. Areas of very thick, uneconomic MSZ are mainly restricted to the axis of the Darwendale and Musengezi chambers.
Block Model Estimation and Reserving Process
Underground reserves are based on an estimated block model of the ore body, which is derived from surface drilling, underground drilling, surface three-dimensional reflection seismics, ore body facies modeling, structural modeling, underground mapping, underground channel sampling and geostatistical estimation to create the Mineral Resource models. The Resource models are then converted using modifying factors to generate Mineral Reserves.
An integrated block model is created for both Rustenburg and Kroondal operations. The Mineral Resource estimation is carried out utilizing Datamine software per geological domain. The main interpolation methodology used is Ordinary Kriging. Estimation by ordinary kriging is done for elements with sufficient data and ID (Inverse distance to the power of two) estimates for elements with limited data. MRM sampling data and Sable diamond drilling data form the principal dataset utilized in these estimates. QA/QC analysis is completed on a batch by batch basis and batches are rejected if errors are encountered exceeding a set threshold.
At Mimosa operations, Surpac Software is also utilised to create the Resource models. Geological ore body modeling is done by extracting XYZ points at the base of the platinum peak for all holes that have been selected for creation of the platinum peak surface. These holes are displayed in Surpac together with the ore body limits. A triangulated surface of the platinum peak is generated through triangulation. The platinum peak surface is then copied 0.45m up and 1.55m down. The top and bottom surfaces are triangulated to produce a geological solid which is then validated. Tonnage and grade estimations are done using boreholes with a consistent metal profile only in Surpac software by creating a block model. The block model is then constrained to a 2 metre wide mining slice extending to 0.45m above and 1.55m below the base of the platinum peak datum using a solid model. The main blocks are 2m high and 12.5m by 12.5m wide. Sub-blocking is done at 6.25m × 6.25m × 1m. Grades for each block within the slice are then estimated by inverse distance method varying search radii based on the platinum variogram, but limiting the number of holes to a minimum of 3 and a maximum of 7.
The results of this process is a Resource Model with Mineral Resources classified into Measured, Indicated and Inferred in order of decreasing geological confidence respectively.
Reserve Classification Methodology
The reserve estimates are derived from the Resource Models initially categorised according to the measured, indicated and inferred classification assigned to the block models. The measured confidence category is converted to proved reserves and indicated to probable reserves. The inferred confidence category has too low a confidence to be converted to reserves and is excluded.
The confidence classification applied to the block model uses a combination of the quality of the kriged estimates and the confidence in the geological interpretation (drill spacing, continuity of ore body, structural confidence, and confidence in extrapolation or interpolation of facies types). The lower of the two confidence estimates is accepted as the final classification.
Various modifying factors are applied at the different operations to convert the Mineral resources to Mineral reserves with an approved Life of Mine in accordance with guidelines of the SAMREC Code (2016) and SEC guidelines. A key aspect to the conversion of the Mineral Resources to Mineral Reserves is economic viability which utilises approved projected metal prices for the PGMs. This will then be used to demonstrate economic viability of their extraction hence declaration as Mineral Reserves.
| |
Sibanye-Stillwater | Form 20-F 2017 | 260 |
4E PGM mineral Reserve Statement as of 31 December 2017
As of 31 December 2017, Sibanye-Stillwater declared maiden 4E PGM mineral reserves, excluding Mimosa, of approximately 22.4Moz as set forth in the following table:
| | | | | |
| | 2017 | 2016 |
| | Tons | Grade | 4E PGM | 4E PGM |
| | (Mt) | (g/t) | (Moz) | (Moz) |
SA operations: Kroondal (50% attributable)2 | | | | | |
UG2 | Proved | 15.1 | 2.6 | 1.243 | 1.802 |
| Probable | 6.8 | 2.6 | 0.561 | 0.489 |
| Total | 21.9 | 2.6 | 1.804 | 2.291 |
SA operations: Rustenburg (excluding tailings) | | | | | |
MER | Proved | 9.4 | 5.3 | 1.597 | 1.602 |
| Probable | 0.9 | 4.9 | 0.149 | 0.125 |
| Total | 10.4 | 5.2 | 1.746 | 1.727 |
UG2 | Proved | 109.7 | 3.7 | 12.953 | 13.563 |
| Probable | 7.5 | 4.2 | 1.007 | 0.775 |
| Total | 117.2 | 3.7 | 13.960 | 14.339 |
Combined | Proved | 119.2 | 3.8 | 14.550 | 15.165 |
| Probable | 8.4 | 4.3 | 1.156 | 0.901 |
| Total | 127.6 | 3.8 | 15.706 | 16.066 |
Tailings | | | | | |
TSF | Proved | - | - | - | - |
| Probable | 81.9 | 1.1 | 2.818 | 3.140 |
| Total | 81.9 | 1.1 | 2.818 | 3.140 |
Non- SA operations: Mimosa (50% attributable)3 | | | | | |
MSZ | Proved | 12.5 | 3.5 | 1.423 | 1.053 |
| Probable | 5.6 | 3.4 | 0.607 | 0.636 |
| Total | 18.1 | 3.5 | 2.030 | 1.689 |
Total PGM operations | | | | | |
Kroondal | | 21.9 | 2.6 | 1.804 | 2.291 |
Rustenburg | | 209.4 | 2.8 | 18.524 | 19.206 |
Mimosa | | 18.1 | 3.5 | 2.030 | 1.689 |
Total operations | | 249.4 | 2.8 | 22.358 | 23.186 |
1 A platinum price of R14,251/oz (US$1,092/oz), palladium price of R9,187/oz (US$704/oz), rhodium price of R11,758/oz (US$901/oz) and gold price of R15,895/oz (US$1,218/oz) (at an exchange rate of R13.05/US$) was applied in valuing the mineral reserve. The prices used for reserves is the approximate three-year trailing average metal prices.
2 Kroondal is operated by Sibanye-Stillwater under a pool and share agreement with Anglo American Platinum and therefore reports 50% attributable mineral reserves.
3 Mimosa is an independently managed operation in which Sibanye-Stillwater owns a 50% share with Impala Platinum.
Our attributable 4E PGM mineral reserves decreased from 23.2Moz at 31 December 2016 to 22.4Moz at 31 December 2017, as set forth in the following table:
| |
Factors | 4E PGM (Moz) |
31 December 2016 | 23.186 |
2017 depletion | (1.500) |
Post-depletion | 21.686 |
Inclusions | |
Evaluation | 0.027 |
Geological changes | 2.077 |
Boundary changes | 0.081 |
Exclusions | |
Economic valuation | (0.752) |
Technical factors | (0.757) |
31 December 2017 | 22.358 |
US PGM OPERATIONS
Geology
The J-M Reef of the Stillwater Complex is a world class PGM deposit and is the prime exploration and mining target for Pd-Pt mineralisation mined at Stillwater and East Boulder mines. It is a typical stratiform magmatic reef type PGM deposit located primarily within the olivine-bearing-I (OB-I), which thickens and thins dramatically along strike. It has some lithological and stratigraphic similarities to the Merensky Reef of the BC, but also has some fundamental differences. Unlike the Merensky Reef, the J-M Reef is not potholed but shows a higher degree of variability in grades and thickness at a local level with PGM bearing sulphide often transgressing into footwall rocks. In addition, the J-M Reef has PGM grades that are significantly higher than the Merensky Reef grades and the grade does not drop as the reef thickens.
| |
Sibanye-Stillwater | Form 20-F 2017 | 261 |
The Stillwater Complex is a large layered igneous complex resulting from magma intrusion through regional transverse faults into highly deformed Archaean sedimentary rocks. The magma intrusion and emplacement was accompanied by fractionation and accumulation of magmatic crystals that gave rise to the conspicuous magmatic layering observed in the complex. The magmatic layering is reflected in the changes in mineralogy, mode, grain size and texture across the stratigraphic profile of the complex. However, the overall texture of the lithological units in the Stillwater Complex is typified by subhedral to euhedral cumulate grains in a framework of post-cumulus interstitial material including oikocrysts. The mineralogical, modal, grain size and textural variations formed the basis for subdividing the Stillwater Complex into five major series as follows: the Basal Series, Ultramafic Series, Lower Banded Series, Middle Banded Series and Upper Banded Series (McCallum, 2002). The Ultramafic Series (UMS) is further subdivided into the Bronzitite Zone and Peridotite Zone.
The contact between the Bronzitite Zone and Lower Banded Series has been mapped over much of the Stillwater Complex showing the extensive nature of the economic Lower Banded Series, of which the J-M Reef is part.
The Lower Banded Series consists of norite and gabbronorite units and minor olivine bearing cumulates that host the target J-M Reef. The series has been subdivided into Norite I (N-I), Gabbro-norite-I (GN-I), OB-I, Norite-II (N-II), Gabbronorite-II (GN-II) and Olivine-bearing-II (OB-II) zones. It is to be noted that the J-M Reef is generally confined to the OB-I (troctolite) zone, but not restricted to a particular stratigraphic position within this zone.
For evaluation purposes, the J-M Reef is defined as the Pd-Pt rich stratigraphic interval mainly occurring within a troctolite or OB-I zone of the Lower Banded Series. It is characterised by a variable thickness ranging from 0.9m to 2.7m and averaging 1.8m, but locally forms keel shaped footwall zones, which transgress the footwall mafic rocks, commonly reaching thicknesses of 6m and greater. Pd and Pt are the main PGMs, with Pd being the more significant of the two (in situ Pd:Pt ratio of 3.4:1 to 3.6:1). Other associated PGMs such as Rh, Ir, Ru and Os, and Au occur in low abundances. The J-M Reef contains approximately 0.25% to 3% visible disseminated copper-nickel sulphide minerals, predominantly chalcopyrite, pyrrhotite and pentlandite, with microscopic PGM minerals and Pt-Fe alloys within a complex cumulate of olivine, plagioclase, bronzite and augite.
Structurally, most of the regional faults affecting the Stillwater Complex have been ascribed to the Laramide Orogeny, and these have been grouped according to trends as follows:
| " | | North-west to south-east striking thrust faults |
| " | | East to west striking south dipping steep reverse faults |
| " | | East to west trending vertical faults |
| " | | North-east to south-west steep dipping transverse faults |
ore reserves determination methodoloGy
The Company utilises statistical methodologies to calculate ore reserves based on interpolation between and projection beyond sample points.
Interpolation and projection are limited by certain modifying factors including geologic boundaries, economic considerations and constraints imposed by safe mining practices. Sample points consist of variably spaced drill core intervals through the J-M Reef obtained from drill sites located on the surface and in underground development workings. Results from all sample points within the ore reserve area are evaluated and applied in determining the ore reserve.
For proven ore reserves, distances between samples range from 25 to 100 feet but are typically spaced at 50 foot intervals both horizontally and vertically. The sample data for proven ore reserves consists of survey data, lithologic data and assay results. Quality Assurance / Quality Control (QA / QC) protocols are in place at both of the Company's Montana mines to test the sampling and analysis procedures. To test assay accuracy and reproducibility, pulps from core samples are resubmitted and compared. To test for sample label errors or cross-contamination, blank core (waste core) samples are submitted with the mineralised sample lots and compared. The QA / QC protocols are practiced on both resource delineation and development and production samples. The resulting data is entered into a 3-dimensional modelling software package and is analysed to produce a 3-dimensional solid block model of the resource. The assay values are further analysed by a geostatistical modelling technique (kriging) to establish a grade distribution within the 3-dimensional block model. Dilution is then applied to the model and a diluted tonnage and grade are calculated for each block. Ore and waste tons, contained ounces and grade are then calculated and summed for all blocks.
Two types of cut-off grades are recognised for the J-M Reef, a geologic cut-off grade and an economic cut-off grade. The geologic cut-off grade for both the Stillwater Mine and the East Boulder Mine falls in the range of 0.2 to 0.3 troy ounces of palladium plus platinum (Pd + Pt) per ton. The economic cut-off grade is lower than the geologic cut-off and can vary between the mines based on cost and efficiency factors. The determination of the economic cut-off grade is completed on a round by round basis and is driven primarily by available mill capacity, geologic character encountered at the mining face and incremental costs of processing the broken rock.
Probable ore reserves estimations are based on longer projections than proven reserves, and projections up to a maximum radius of 1,000 feet beyond the limit of existing drill hole sample intercepts of the J-M Reef are used. Statistical modelling and the established continuity of the J-M Reef, as determined from results of 31 years of mining activity to date, support the Company’s technical confidence in estimates of tonnage and grade over this projection distance. Where appropriate, projections for the probable ore reserves determination are constrained by any known or anticipated restrictive geologic features.
The Company reviews its methodology for calculating ore reserves on an annual basis. Conversion, an indicator of the success in upgrading probable ore reserves to proven ore reserves, is evaluated annually as part of the reserve estimation process. The annual review examines the effect of new geologic information, changes implemented or planned in mining practices and mine economics on the measures used for the estimation of probable ore reserves. The review includes an evaluation of the Company’s rate of conversion of probable ore reserves to proven ore reserves. The proven and probable ore reserves are then modelled as a long-term mine plan and additional factors including mining methods, process recoveries, metal prices, mine operating productivities and costs and capital estimates are applied to determine the overall economics of the ore reserves.
| |
Sibanye-Stillwater | Form 20-F 2017 | 262 |
2E PGM mineral Reserve Statement as of 31 December 20171
As of 31 December 2017, Sibanye-Stillwater declared maiden 2E PGM reserves of approximately 21.9Moz as set forth in the following table:
| | | | | |
| | 2017 | 2016 |
| | Tons | Grade | 2E PGM | 2E PGM |
| | (Mt) | (g/t) | (Moz) | (Moz) |
Stillwater | | | | | |
Proved | | 2.6 | 20.6 | 1.727 | - |
Probable | | 15.1 | 20.1 | 9.792 | - |
Total | | 17.8 | 20.2 | 11.519 | 10.467 |
East Boulder | | | | | |
Proved | | 2.4 | 13.2 | 1.018 | |
Probable | | 21.6 | 13.5 | 9.366 | |
Total | | 24.0 | 13.4 | 10.384 | 10.731 |
Total operations | | 41.8 | 16.3 | 21.903 | 21.198 |
1 The Mineral Resource estimates used to derive the Mineral Reserve estimates as at 31 July 2017 have been depleted with the five
months of production to be representative as at 31 December 2017.
Corporate Governance
The Competent Persons that take responsibility for the reporting of mineral reserves are the respective operation (per mining unit) or project based Mineral Resource Manager or Manager Geology. The details of all the personnel who approved the mineral reserves are listed in the respective Competent Person’s Reports for the specific operation.
Corporate Governance on the overall compliance of the company’s figures and responsibility for the generation of a Group consolidated statement has been overseen by the Technical Services team listed below. This team, who consent to the disclosure of the 31 December 2017 Mineral Reserve Statement, are permanent employees of Sibanye-Stillwater, and function independently of the operating mines and projects.
| | | |
Competent Person | Title | Qualification | Years |
SA gold operations | | | |
Gerhard Janse van Vuuren | VP Mine Technical Services | BTech (Mineral Resource Management);
| 30 |
SAIMM 706705 | | GDE (Mining Engineering); MBA; MSCC | |
Johan van Eeden | Unit Manager Geology | MSc (Geology) | 34 |
SACNASP 400043/092 | | | |
Leon Tolmay | Unit Manager Evaluation | NHD (Mine Survey); GDE (Mining | 41 |
SAIMM 7041403 | | Engineering); MSCC | |
Steven Wild | Unit Manager Mine Planning | GDE Mining Engineering; NHD MRM | 22 |
SAIMM 706556 | | | |
SA PGM operations | | | |
Andrew Brown | VP Mine Technical Services | MSc (Mining Engineering) | 33 |
SAIMM 705060 | | | |
Leonard Changara | Unit Manager Geology | M.Sc. (Geology); B.Sc. Hons | 19 |
SACNASP 400089/08 | | (Geology); B.Sc. Gen (Geology & Mathematics); Pr.Sci.Nat; GSSA | |
Brian Smith | Unit Manager Survey | NHD (Mine Survey); MEng MRM; MSCC | 30 |
SAIMM 702313 | | | |
US PGM operations | | | |
Michael Koski | Stillwater: Mineral Resource | BA (Geology) | 39 |
AIPG CPG 11321 | estimation | | |
Brent LaMoure | Stillwater: Mineral Reserves | BSc Hons (Mining Eng) | 22 |
MMSA 01363QP | estimation | | |
Stanford Foy | Stillwater: Mineral Resource | BSc Hons (Geological Eng) | 27 |
AIPG CPG 10946 | and Mineral Reserve estimation | | |
| |
Sibanye-Stillwater | Form 20-F 2017 | 263 |
CHAIRMAN AND INDEPENDENT NON-EXECUTIVE DIRECTOR
SELLO MOLOKO (52)
BSc (Hons) and Postgraduate Certificate in Education, Advanced Management Programme, University of Pennsylvania Wharton School
Sello Moloko was appointed non-executive Chairman on 1 January 2013. He is a founder and the executive Chairman of Thesele Group Proprietary Limited. He recently retired from his role as the Chairman of Alexander Forbes Group Holdings Limited and previously served as a director of Gold Fields. Sello has an established career in financial services, including periods as an executive director at Brait Asset Managers and CEO of Old Mutual Asset Managers until 2004. He is a trustee of the Nelson Mandela Foundation. Sello’s other directorships include Stor-Age REIT Limited and Gen Re Africa.
EXECUTIVE DIRECTORS
NEAL FRONEMAN (58)
Chief Executive Officer
BSc Mech Eng (Ind Opt), University of the Witwatersrand; BCompt, University of South Africa; PrEng
Neal Froneman was appointed executive director and CEO of Sibanye-Stillwater on 1 January 2013. Over the past five years he has led the transformation of Sibanye-Stillwater from a 1.5Moz South Africa based gold producer into a leading precious metals miner with an international operating footprint ranking among the world’s top three PGM producers. His career spans more than 30 years during which time he worked at Gold Fields of South Africa Limited, Harmony Gold Mining Company Limited and JCI Limited. In April 2003, Neal was appointed CEO of Aflease Gold Limited (Aflease Gold), which, through a series of reverse take-overs, became Gold One in May 2009. He was primarily responsible for the creation of Uranium One Incorporated (Uranium One) from the Aflease Gold uranium assets. During this period, he was CEO of Aflease Gold and Uranium One until his resignation from Uranium One in February 2008. He held the CEO position at Gold One until his appointment at Sibanye-Stillwater. In May 2016, he was elected to serve as a Vice President of the Chamber of Mines.
CHARL KEYTER (44)
Chief Financial Officer
BCom, University of Johannesburg; MBA, North-West University; ACMA and CGMA
Charl Keyter was appointed a director of Sibanye-Stillwater on 9 November 2012, and executive director and CFO on 1 January 2013. Previously, he was Vice President and Group Head of International Finance at Gold Fields. Charl has more than 20 years’ mining experience, having begun his career at Gold Fields in February 1995.
INDEPENDENT NON-EXECUTIVE DIRECTORS
TIMOTHY CUMMING (60)
BSc (Hons) (Engineering), University of Cape Town; BA (PPE); MA (Oxford)
Timothy (Tim) Cumming was appointed as a non-executive director on 21 February 2013. He is the founder and executive director of Scatterlinks Proprietary Limited, a South African-based company providing leadership development services to senior business executives as well as strategic advisory services to companies. He has a wealth of experience in financial services, including periods as an executive at the Old Mutual Group, HSBC Securities (Africa), Allan Gray Limited and is currently also an independent non-executive director of Nedgroup Investments Limited. Tim started his career as an engineer at the Anglo American Corporation of South Africa Limited. He worked on a number of diamond mines and gold mines in South Africa. He is also a trustee of the Woodside Endowment Trust and chairs the Investment Committee of the Mandela Rhodes Foundation.
SAVANNAH DANSON (50)
BA (Hons) Communication Science and Finance, Bridgewater University, United States; MBA (Strategic Planning and Finance) DeMontford University
Savannah Danson was appointed as a non-executive director on 23 May 2017. As the founder, chairperson and group CEO of Bunengi Group, she brings a wealth of experience from the finance, mining, infrastructure and media sectors. Savannah is the chairperson of Parsons Brinckerhoff Proprietary Limited and serves on the boards of Wilson Bayly Holmes-Ovcon Limited, and WSP Group Africa, a Canadian-listed engineering group.
| |
Sibanye-Stillwater | Form 20-F 2017 | 264 |
BARRY DAVISON (72)
BA (Law and Economics), University of the Witwatersrand; Graduate Commerce Diploma, Birmingham University; CIS Diploma in Advanced Financial Management and Advanced Executive Programme, University of South Africa
Barry Davison was appointed as a non-executive director on 21 February 2013. He has more than 40 years’ experience in the mining. At the time of his retirement in 2005, he was an executive director of Anglo American Plc and chairman of its Platinum and Ferrous Metals and Industries Divisions. A former President of the Chamber of Mines, he also sat on the boards of a number of listed companies, including the Nedbank Group Limited, Kumba Resources Limited, Samancor Limited and the Tongaat-Hulett Group.
RICHARD MENELL (62)
MA (Natural Sciences, Geology), Trinity College, University of Cambridge; MSc (Mineral Exploration and Management), Stanford University
Richard (Rick) Menell was appointed as a non-executive director on 1 January 2013. He has over 35 years’ experience in the mining industry. Previously, he occupied the positions of President of the Chamber of Mines; President and CEO of TEAL Exploration & Mining Inc; Chairman of Anglovaal Mining Limited and of Avgold Limited; Chairman of Bateman Engineering Proprietary Limited; deputy Chairman of Harmony and of African Rainbow Minerals Limited. He has also been a director of Telkom Group Limited, Standard Bank of South Africa Limited, and Mutual and Federal Insurance Company Limited. He is currently a non-executive director and Chairman of Credit Suisse Securities Johannesburg Proprietary Limited, and non-executive director of Gold Fields, a position he has held since 8 October 2008, and of The Weir Group plc. Rick is a trustee of the Carrick Foundation and of the Claud Leon Foundation. He is co-Chairman of the City Year South Africa Citizen Service Organisation, and Chairman and trustee of the Palaeontological Scientific Trust.
NKOSEMNTU NIKA (59)
BCom, University of Fort Hare; BCompt (Hons), University of South Africa Advanced Management Programme, INSEAD; CA (SA)
Nkosemntu Nika was appointed as a non-executive director on 21 February 2013. He is currently an independent non-executive director of Scaw South Africa Proprietary Limited and director and Chairman of the Audit and Risk Committee of Foskor Proprietary Limited. He also serves as an independent non-executive director of Trollope Mining Services 6000 Proprietary Limited. He was previously CFO and Finance Director of PetroSA (SOC) Limited and Executive Manager: Finance at the Development Bank of Southern Africa. He has held various internal auditing positions at Eskom Holdings (SOC) Limited, Shell Company of South Africa Limited and Anglo American Corporation of South Africa Limited. He was also a non-executive board member of the Industrial Development Corporation of South Africa Limited, and previously chaired its Audit and Risk Committee and Governance and Ethics Committee.
KEITH RAYNER (61)
BCom, Rhodes University; CTA; CA (SA)
Keith Rayner was appointed as a non-executive director on 1 January 2013. Keith is chief executive officer of KAR Presentations, an advisory and presentation corporation specialising in corporate finance and regulatory advice. He is an independent non-executive director of Ecponent Limited, and a non-executive director of Nexus Intertrade Proprietary Limited, 2Quins Engineered Business Information Proprietary Limited, Sabi Gold Proprietary Limited, Keidav Properties Proprietary Limited and Appropriate Process Technologies Proprietary Limited. He is a member of the JSE Limited’s Issuer Regulation Advisory Committee, a fellow of the Institute of Directors in South Africa (IoDSA), a non-broking member of the Institute of Stockbrokers in South Africa and a member of the Investment Analysts Society. He is a past member of the SAMREC/SAMVAL working group, the Takeover Regulation Panel’s rewrite committee, the IoDSA’s CRISA committee and the South African Institute of Chartered Accountants Accounting Practice Committee.
SUSAN VAN DER MERWE (63)
BA, University of Cape Town
Susan (Sue) van der Merwe was appointed as a non-executive director on 21 February 2013. She served as a member of Parliament for 18 years until October 2013, and held various positions, including Deputy Minister of Foreign Affairs from 2004 to 2010. She has participated in various civil society organisations and currently serves as a trustee and Chair of the Kay Mason Foundation, which is a non-profit organisation assisting disadvantaged scholars in Cape Town. Since 2014, Sue has been a member of the National Council of the South African Institute of Internationals Affairs, a non-governmental research institute focused on South Africa's and Africa's international relations.
| |
Sibanye-Stillwater | Form 20-F 2017 | 265 |
JERRY VILAKAZI (57)
BA, University of South Africa; MA, Thames Valley University; MA, University of London; MBA, California Coast University
Jerry Vilakazi was appointed a non-executive director on 1 January 2013. He is Chairman of Palama Investment Holdings Proprietary Limited, which he co-founded to facilitate investments in strategic sectors. He is a past chief executive officer of Business Unity South Africa, Managing Director of the Black Management Forum. In 2009, Jerry was appointed to the Presidential Broad-based Black Economic Empowerment Advisory Council and, in 2010, he was appointed as a Commissioner of the National Planning Commission. He completed both terms in 2015. Previously, he was appointed Public Service Commissioner in 1999 and played a critical role in shaping major public service policies in post-1994 South Africa. Jerry was Chairman of the Mpumalanga Gambling Board and of the State Information Technology Agency (SOC) Proprietary Limited. He previously held the position of Chairman of Netcare Limited and directorships of Pretoria Portland Cement, Goliath Gold Limited, General Healthcare Group (UK) and Computershare. He is currently a non-executive director in Blue Label Telecoms Limited and Palama Industrial.
ROTATION OF DIRECTORS
In accordance with the MOI, one third of the directors shall retire from office at each AGM. The first to retire are those directors appointed as additional members of the Board, followed by the longest-serving members. The Board, assisted by the Nominating and Governance Committee, can recommend the eligibility of retiring directors (subject to availability and their contribution to the business) for re-appointment. Retiring directors can be immediately re-elected by the shareholders at the AGM. Directors retiring in terms of the Company’s MOI are Savannah Danson, Rick Menell, Keith Rayner and Jerry Vilakazi. All the directors are eligible and offer themselves for re-election.
Executive Management
ROBERT VAN NIEKERK (53)
Executive Vice President: Head of SA region
National Higher Diploma (Metalliferous Mining), Technikon Witwatersrand; BSc (Mining Engineering), University of the Witwatersrand; South African Mine Manager’s Certificate of Competency
Robert van Niekerk was appointed to this position in July 2017. Previously he served as Divisional CEO: Platinum and Executive Vice President: Organisational Effectiveness. Prior to joining Sibanye-Stillwater (in February 2013), he was the Senior Vice President and Group Technical Head of Mining at Gold Fields. He previously occupied several senior operational and executive management positions at Harmony, Anglo American Platinum Limited, Uranium One and Gold One. Robert began his mining career in 1982 as a Learner Official and progressed through the ranks at a number of South African underground and surface mining operations locally and outside of South Africa.
CHRIS BATEMAN (53)
Executive Vice President: Head of US region
BEng (Hons) (Production Engineering and Production Management), University of Nottingham, UK; Qualified as a Chartered Accountant in England and Wales
Chris Bateman was appointed as Executive Vice President: US region in 2017 after serving as CFO at Stillwater Mining Company. Chris has worked in the mining industry for more than 18 years with experience in platinum, palladium, copper, uranium, diamonds and industrial minerals. Prior to joining Stillwater Mining Company he served in CFO positions for Turquoise Hill, Rio Tinto Diamonds and Minerals product group, Rio Tinto Iron and Titanium and Energy Resources of Australia. He has served on the boards of Richards Bay Minerals in South Africa, Oyu Tolgoi copper mine in Mongolia and QIT Madagascar Minerals in Madagascar. Prior to entering the mining industry he was a senior manager with Arthur Andersen’s Business Consulting practice and served as a production engineer in the automotive industry.
HARTLEY DIKGALE (58)
Executive Vice President: Head of legal and regulatory affairs (SA region)
BIuris, University of the North; LLB, HDip (Company Law), University of the Witwatersrand; LLM, Vista University
Hartley Dikgale is an admitted advocate of the High Court of South Africa and has more than 30 years of corporate experience as a business executive. He has served on more than 20 boards of directors of listed and unlisted companies. He has worked for, among others, Sanlam Limited, Old Mutual, the Independent Communications Authority of South Africa, Rand Water Board and Pamodzi Investment Holdings Proprietary Limited. In recent years, Hartley has worked for Rand Uranium and Gold One as Senior Vice President: General Counsel. Hartley joined Sibanye-Stillwater in 2013 where he served in a similar capacity until he was appointed as the Executive Vice President: General Counsel and Regulatory Affairs in 2016.
DAWIE MOSTERT (48)
Executive Vice President: Organisational Effectiveness
Diploma in Labour Relations; MDP (Adv Labour Law); MBA, University of South Africa
Dawie Mostert, who has more than 20 years’ experience in the mining industry, was appointed on 1 January 2013 as Senior Vice President: Organisational Effectiveness, focused on introducing new operating and business models in support and directing the turnaround at Sibanye-
| |
Sibanye-Stillwater | Form 20-F 2017 | 266 |
Stillwater. Executive Vice President: Commercial Services. Prior to joining Sibanye-Stillwater, he served as Vice President: Commercial Services at Gold One and Vice President: Human Capital at Great Basin Gold. Prior to joining Great Basin Gold, he was Executive: Organisational Development and Employee Relations at Harmony from 200. Dawie joined Harmony in 1996 as part of the acquisition transformational team and was appointed Mine Manager at the then Elandsrand mine from 2001 to 2002.
THEMBA NKOSI (44)
Executive Vice President: Head of human resources (SA region)
BA Hons (Employment Relations), University of Johannesburg; BTech (Human Resources), Peninsula Technikon; Human Resources Executive Program, University of Michigan
Themba Nkosi was appointed on 4 July 2016. He has more than 20 years’ experience across various industries in human resources, corporate affairs, communication and stakeholder management. Prior to joining Sibanye-Stillwater, he was Head: Human Resources, Transformation and Corporate Communications at ArcelorMittal South Africa Limited (ArcelorMittal). He previously occupied several senior management positions at ArcelorMittal and Human Resources Director for Sub-Saharan Africa at the PepsiCo Group.
WAYNE ROBINSON (55)
Executive Vice President: Head of operations (SA region)
BSc (Mechanical Engineering), University of Natal; BSc (Mining Engineering), University of the Witwatersrand; PrEng; South African Mine Manager’s Certificate of Competency (Metalliferous); South African Mechanical Engineer’s Certificate of Competency
Wayne Robinson was appointed as Divisional CEO: Gold and Uranium after serving as Senior Vice President: Underground Operations – Beatrix and Cooke from June 2014. Wayne has worked in the South African gold and platinum mining sectors for more than 25 years with experience in underground mine management. Prior to joining Sibanye-Stillwater, he was Executive Vice President of Cooke Operations and served on Gold One’s Executive Committee. He held senior management positions at Eastern Platinum Limited, at Richards Bay Minerals and at Gold Fields after qualifying as a mechanical and mining engineer.
RICHARD STEWART (42)
Executive Vice President: Business Development
BSc (Hons), PhD (Geology), University of the Witwatersrand; MBA, Warwick Business School (UK); PrSciNat
Richard Stewart has over 18 years’ experience in South Africa’s geological and mining industries, and is a Fellow of the Geological Society of South Africa. Prior to joining Sibanye-Stillwater in 2014, he served on the Gold One Executive Committee with the most recent appointment at Gold One as Executive Vice President: Technical Services and was also CEO of Goliath Gold Limited. Prior to that he held management positions at the Council for Scientific and Industrial Research Mining Technology division, Shango Solutions (where he remains a director), Uranium One and was an Investment Consultant for African Global Capital Proprietary Limited.
| |
Sibanye-Stillwater | Form 20-F 2017 | 267 |
ENVIRONMENTAL
Sibanye-Stillwater’s operations are subject to various laws and regulations relating to the protection of the environment, and Section 24 of South Africa’s Constitution of 1996 grants the country’s people the right to an environment that is not harmful to human health or well-being, and to the protection of that environment for the benefit of present and future generations through reasonable legislation and other measures. The Constitution and the NEMA, as well as various other related pieces of legislation enacted and implemented since 1996, grant legal standing to a wide range of interest groups to institute legal proceedings to enforce their environmental rights, which are enforceable against private entities as well as the South African government.
South African environmental legislation commonly requires businesses whose operations may have an impact on the environment to obtain environmental authorisations, permits, licences and other approvals for those operations, and to comply with the conditions of approval prescribed in these environmental approvals. The Government’s constitutional mandate is to protect the environment, hence the rationale behind environmental authorisations is to ensure that companies with activities that are reasonably expected to have environmental impacts, assess the extent of the environmental impacts emanating from their business activities, as well as to put reasonable and practicable mitigation measures in place to manage and mitigate these impacts.
The most critical and applicable environmental legislation for the mining industry in South Africa remains the MPRDA and the NEMA, each with its own specific Regulations and amendments. From 8 December 2014, the “One Environmental System”, which was a significant step change for the mining industry insofar as the regulatory regime for environmental issues was concerned, came into force following the promulgation of legislation creating the new regime on 2 September 2014. In terms of the “One Environmental System”, the Minister of Mineral Resources (and thus by delegation, the prescribed officials of the DMR) became the competent authority to grant environmental authorisations under the NEMA framework for listed activities pertaining to prospecting/mining operations, a responsibility which was previously administered by the Department of Environmental Affairs (DEA). From that point, environmental authorisations replaced the traditional environmental management programme (EMP) reports for all prospecting and mining projects (with existing MPRDA-approved EMP reports remaining valid until formally requested to convert). However, the DEA remains the appeal authority on all DMR-issued environmental authorisations. Company directors, in their personal capacity, may be held liable under provisions of NEMA for any environmental degradation and/or the remediation thereof.
In terms of the 2014 NEMA Amendment Act, the Minister of Mineral Resources is obliged to appoint environmental mineral resource inspectors to monitor the compliance of mining companies, as well as the enforcement of provisions insofar as it relates to prospecting, exploration, mining or production. The training of these inspectors is underway, and there are already a number of inspectors active in the field. There is general consensus in the mining industry that, whilst the intent of the OES had been noble, the practical implementation thereof thus far has been challenging, specifically insofar as the Government’s adherence to the timeframes for issuing environmental authorisations is concerned. Through the Chamber of Mines and other industry associations, the mining industry is working closely with Government to improve this system.
The Regulations on Financial Provisioning, issued on 20 November 2015 under auspices of the “One Environmental System”, remain controversial and largely untenable to industry. As a result of widespread criticism from industry, Government issued a Regulation in October 2016, deferring the implementation date for the November 2015 Regulations on Financial Provisioning to February 2019, with the unstated objective of reviewing the Regulations on Financial Provisioning well before the anticipated commencement date. The DEA, who is the custodian for the development of NEMA-related laws and regulations, has started with the review process and industry is part of the review process.
To date, neither legislation nor the actual implementation of a carbon tax, has been finalised and/or introduced. The National Treasury released the second draft Carbon Tax Bill for public comment, in December 2017. A new draft bill was adopted in August 2017 and the South African parliament released the draft bill in December 2017 for comment and the bill is expected to be enacted before the end of fiscal 2018. The South African government proposed to implement the tax from 1 January 2019 to meet its nationally determined contributions under the 2016 Paris Agreement of the United Nations Framework Convention on Climate Change. The National Treasury has stated that the carbon tax will be designed to ensure that it has no net impact on the electricity price. In parallel, the mining industry has raised concerns through the Chamber of Mines at various forums, including the Davis Tax Commission, on the potential negative financial impact of the carbon tax, particularly in relation to marginal mining operations. Insofar as the design of the carbon tax is concerned: it requires the calculation of tax liability to be based on the volume of fossil fuel input which results in Scope 1 greenhouse gas emissions, and for such liability to commence at R120/t of CO2e. The design also anticipates a tax free threshold of 60% and various allowances that would permit a tax liable entity to further mitigate its liability. Such allowances include an allowance for trade exposed sectors and the use of carbon offsets against a carbon tax liability. The National Treasury has alluded that electricity may not be taxed during the first phase (until 2022). While many aspects of the proposed carbon tax remain uncertain, the financial implications of government’s proposed carbon tax for Sibanye-Stillwater, in today’s terms, the 2017 carbon footprint and at an anticipated rate of R120/t of CO2e, would be between approximately R4 million and R26 million per annum on the premise that electricity (i.e. Scope 2 emissions) is excluded. The potential net effect of proposed allowances is to permit the reduction of a carbon tax by 60% to 95%.
The National Environmental Management Waste Act, 2008 (Act No 59 of 2008) (the Waste Act) commenced on 1 July 2009 with the exception of certain sections relating to contaminated land, which came into force on 2 May 2014. Responsible waste management has become a priority for the DEA. On 2 June 2014, amendments to the Waste Act were published, which stated that as of 8 December 2014, residue deposits and residue stockpiles would be brought within the Waste Act’s scope of operation and as such, residue stockpiles and residue deposits are now subject to regulation under the Waste Act and waste management licenses for activities relating to their establishment and reclamation will need to be obtained. In addition, Regulations regarding the Planning and Management of Residue Deposits and Stockpiles (MRDS), were published on 24 July 2015. Due to the onerous nature and the anticipated financial impact these Regulations would have on industry with little or no benefit to the environment from a pollution control/containment perspective, industry has constantly argued both from a technical and legal perspective, that there was sufficient regulation in legislation other than the Waste Act (e.g. MPRDA) to regulate MRDS (under a different definition than the current “hazardous waste” under the Waste Act), and that MRDS be statutory excluded from the Waste Act and its amendments, through a NEMA Act amendment. The DEA has indicated that industry’s comments would be considered in the drafting of the revised Regulations. Engagement with the government in relation to this issue is ongoing.
With regards to the requirements of the Waste Act insofar as general waste is concerned, applications for waste management licences for all of the relevant waste management activities have been made, except for at Burnstone (which will be made once the mine is operational). Sibanye-
| |
Sibanye-Stillwater | Form 20-F 2017 | 268 |
Stillwater currently has licensed waste disposal facilities at its Beatrix operations. Pursuant to the requirements of the Waste Act, these facilities will need to be managed in accordance with the Waste Act and, if necessary, rehabilitated.
Sibanye-Stillwater undertakes activities which are regulated by the National Nuclear Regulator Act, 1999 (Act No 47 of 1999) (the NNR Act). The NNR Act requires Sibanye-Stillwater to obtain authorisation from the National Nuclear Regulator (NNR) and undertake activities in accordance with the conditions of such authorisations. During the reporting period, both internal and external audits and inspections were conducted. These audits and inspections, conducted by the NNR Inspectorate, registered an average compliance index of 88.2% which is higher than the benchmark of 80%. Each of Sibanye-Stillwater’s mining operations possesses and maintains a Certificate of Registration (CoR) as required by the NNR Act.
Although traditionally weak, the enforcement of environmental laws under South Africa’s comprehensive environmental regulatory framework, has experienced rapid improvement. Three separate legislative acts, including the NEMA (for the mining industry enforced by the DMR), the MPRDA (enforced by the DMR) and the National Water Act (enforced by the Department of Water and Sanitation) all make provisions for the appointment of environmental management inspectors, which have sweeping authority and mandates to enforce environmental legislation. Some of the new environmental laws and regulations have been viewed as “disabling” and as having a negative impact on the growth and development of the mining industry. To date, Sibanye-Stillwater’s approach has been to work with Government and to positively influence new and emerging legislation as far as possible in the interest of the industry as well as in the interest of the environment.
HEALTH AND SAFETY
Health and safety performance on mines is regulated by the South African Mine Health and Safety Act, 1996 (Act No 29 of 1996) (MHSA). The MHSA, among others, requires the mining companies as employers and their contractors to ensure that their operating and non-operating mines maintain a safe and healthy working environment, confers on the employees the right to refuse to perform hazardous work or enter into an unsafe working place, and describes the powers and functions of the Mine Health and Safety Inspectorate (MHSI), within the jurisdiction of the DMR and as part of the process of enforcement.
As legally required, all employees are represented in formal joint management/worker health and safety committees, through their representatives, to help monitor and advise on occupational health and safety programmes.
In terms of the MHSA, an employer is obligated, among others, to ensure that mines are designed, constructed and equipped to provide conditions for safe operation and a healthy working environment, and the mines are commissioned, operated, maintained and decommissioned so that employees can perform their work without endangering their health and safety or that of any other person. Every employer must ensure that people who are not employees, but who may be directly affected by the activities at a mine, are not exposed to any health and safety hazards. The MHSA authorises the inspectors in the MHSI, upon identifying certain health and safety hazards, to restrict or stop, partially or wholly, operations at any mine or a workplace, and require an employer to take steps to address the said health and safety hazards before such restriction or stoppage can be lifted.
The principal health risks associated with mining operations in South Africa arise from occupational exposure to silica dust, noise, heat and certain hazardous chemicals. The most significant occupational diseases affecting our workforce include lung diseases such as silicosis, tuberculosis (TB), a combination of both, and chronic obstructive airways disease (COAD) as well as noise induced hearing loss (NIHL).
The Occupational Diseases in Mines and Works Act, 1973 (Act No 78 of 1973) (ODMWA) governs compensation paid to mining employees who contract certain occupational illnesses, such as silicosis. The South African Constitutional Court has ruled that a claim for compensation under ODMWA does not prevent an employee from seeking compensation from an employer in a civil action under common law (either as individuals or as a class). For information on pending silicosis-related litigation involving Sibanye-Stillwater see Annual Financial Report—Accountability—Directors’ report–Litigation and Annual Financial Report—Annual financial statements—Notes to the consolidated financial statements–Note 26: Occupational healthcare obligation.
A failure to comply with MHSA is a criminal offence for which an employer, or any responsible person, may be charged and, if successfully prosecuted, be fined or imprisoned, or both. The MHSI also has the power to impose administrative fines upon an employer in the event of a breach of the Mine Health and Safety Act. The maximum administrative fine that may be imposed is R1 million per offence.
MINE SAFETY DISCLOSURE
Under the Dodd-Frank Wall Street Reform and Consumer Protection Act (Dodd-Frank Act), each operator of a coal or other mine is required to include certain mine safety results within its periodic reports filed with the SEC. In accordance with the reporting requirements included in Section 1503(a) of the Dodd-Frank Act and Item 104 of Regulation S-K (17 CFR 229.104), the required mine safety results regarding certain mining safety and health matters for each of Sibanye-Stillwater’s mine locations that are covered under the scope of the Dodd-Frank Act are included in "Exhibit 16 Mine Safety Disclosures" of this Annual Report on Form 20-F. In 2017, Sibanye-Stillwater received a total of 48 violations of mandatory health or safety standards that could significantly and substantially contribute to the cause and effect of a coal or other mine safety or health hazard under section 104 of the Federal Mine Safety and Health Act. See “Exhibit 16 Mine Safety Disclosures” of this Annual Report on Form 20-F for more information.
MINERAL RIGHTS
The MPRDA
The MPRDA came into effect on 1 May 2004. The MPRDA consists of two parts, namely the Act itself and the Transitional Provisions contained in Schedule II to the Act. In terms of the MPRDA, the mineral and petroleum resources of South Africa belong to the nation and the state (as custodian of the nation’s resources), which is entitled to grant prospecting and mining rights.
| |
Sibanye-Stillwater | Form 20-F 2017 | 269 |
Under the MPRDA, prospecting rights may be granted for an initial maximum period of five years and can be renewed once upon application for a further period not exceeding three years. Mining rights are valid for a maximum period of 30 years, and can be renewed upon application for further periods, each of which may not exceed 30 years. A wide range of factors and principles, including proposals relating to BEE and social responsibility, will be considered by the Minister of Mineral Resources when exercising his discretion whether to grant these applications. A prospecting or mining right can be suspended or cancelled if the holder conducts mining operations in breach of the MPRDA, a term or condition of the right or an environmental management plan, or if the holder of the right submits false, incorrect or misleading information to the DMR. The MPRDA sets out a process which must be followed before the Minister of Mineral Resources is entitled to suspend or cancel the prospecting or mining right. In November 2006, the DMR approved the conversion of Sibanye-Stillwater’s mining licences under the old regulatory regime at Kloof, Driefontein and Beatrix into rights under the new regime. All of Sibanye-Stillwater’s mines have received their new-order mining rights.
The MPRDA empowered the Minister of Mineral Resources to develop the Mining Charter to set the framework, targets and timetable for effecting entry of HDSAs into the mining industry and to allow such South Africans to benefit from the exploitation of South Africa’s mineral resources.
Among other things, the Mining Charter stated that mining companies agreed to achieve 26% HDSA ownership of South African mining industry assets within 10 years (i.e. by the end of 2014). Ownership can comprise active involvement, through HDSA-controlled companies (where HDSAs own at least 50% plus one share of the company and have management control), strategic joint ventures or partnerships (where HDSAs own at least 25% plus one vote of the joint venture or partnership interest and there is joint management and control) or collective investment vehicles, the majority ownership of which is HDSA based, or passive involvement, particularly through broad-based vehicles such as employee stock option plans. The Mining Charter also required mining companies to submit annual, audited reports on progress toward their commitments, as part of an ongoing review process and social and labour plans, or SLPs, which set out their commitments relating to human resource development, labour planning and socio-economic development planning to the DMR.
Following a review, the DMR released the Amended Mining Charter on 13 September 2010. Amendments to the Mining Charter in the Amended Mining Charter included, among other things, the requirement by mining companies to: (i) facilitate local beneficiation of mineral commodities; (ii) procure a minimum of 40% of capital goods, 70% of services and 50% of consumable goods from HDSA suppliers (i.e. suppliers in which a minimum of 25% + 1 vote of their share capital must be owned by HDSAs) by 2014 (exclusive of non-discretionary procurement expenditure); (iii) ensure that multinational suppliers of capital goods contribute a minimum of 0.5% of their annual income generated from South African mining companies into a social development fund from 2010 towards the socio-economic development of South African communities; (iv) achieve a minimum of 40% HDSA demographic representation by 2014 at top management (board) level, senior management (executive committee) level, middle management level, junior management level and core and critical skills; (v) invest up to 5% of annual payroll in essential skills development activities; and (vi) implement measures to improve the standards of housing and living conditions for mineworkers by converting or upgrading mineworkers’ hostels into family units, attaining an occupancy rate of one person per room and facilitating home ownership options for all mineworkers in consultation with organised labour, all of which was to be achieved by 2014. In addition, mining companies are required to monitor and evaluate their compliance to the Amended Mining Charter and must submit annual compliance reports to the DMR. The Scorecard for the Broad-Based Socio-Economic Empowerment Charter for the South African Mining Industry attached to the Amended Mining Charter (the Scorecard) made provision for a phased-in approach for compliance with the above targets over the five year period ended 2014. For measurement purposes, the Scorecard allocates various weightings to the different elements of the Amended Mining Charter. Failure to comply with the provisions of the Amended Mining Charter will amount to a breach of the MPRDA and may result in the cancellation or suspension of a mining company’s existing mining rights. In light of the Amended Mining Charter, the status of the Mining Charter is unclear although such charter appears to have been replaced by the Amended Mining Charter.
In accordance with the MPRDA, on 29 April 2009 the DMR published the Code relating to the socio-economic transformation of the mining industry. The current industry position is that the DMR does not apply the Codes and that mining companies are subject only to the provisions of the MPRDA and the Amended Mining Charter.
In the same vein as the 2009 review, during the course of fiscal 2014, the DMR appointed a private entity to conduct Amended Mining Charter compliance audits on its behalf, in respect of a number of mining companies. Mining companies were required to complete questionnaires and templates as a means of reporting on their compliance with fiscal 2014 targets as set in the Amended Mining Charter. However, it is generally understood that the DMR disregarded or abandoned this audit process. It is therefore unclear what the status of the process is and what the outcomes were. It is also unclear whether or not the information provided during this audit process will be considered or used by the DMR for any purpose in the future. It appears that the information gathering mechanism has been substituted by the DMR’s own formal request for information and data on Amended Mining Charter compliance in terms of section 29 of the MPRDA. The DMR directed mining companies to populate an electronic reporting template, but this template has raised a number of concerns due to its inflexible approach towards the assessment of compliance with the Amended Mining Charter. The template applies a mechanical process in that it asks specific questions and requires the completion of certain information, without making provision for the detailing of complex facts or historical transactions entered into in pursuance of meeting the Mining Charter HDSA ownership element.
With the 2014 HDSA ownership target date contemplated in the Amended Mining Charter having passed, the DMR’s application of the Amended Mining Charter and its assessment of compliance therewith in respect of the ownership element is concerning. There are concerns in the mining industry that the approach followed by the DMR poses a risk of government action against many mining entities, which will threaten security of tenure, in that government may order the suspension or cancelation of mining rights in instances of deemed non-compliance with the requirements of the Amended Mining Charter.
On 31 March 2015, the Chamber of Mines reported that the DMR believes that empowerment transactions by mining companies concluded after 2004 where the HDSA ownership level has fallen due to HDSA disposal of shares or for other reasons, should not be included in the calculation of HDSA ownership for the purposes of, among other things, the 26% HDSA ownership guidelines under the Mining Charter. The position of the Chamber of Mines (including Sibanye-Stillwater) is that such historical empowerment transactions should be included in the calculation of HDSA ownership. The DMR and the Chamber jointly agreed to approach the South African courts to seek a declaratory order that will provide a ruling on the relevant legislation and the status of the Mining Charter and the Amended Mining Charter, including clarity on the status of previous empowerment transactions concluded by mining companies and a determination on whether the ownership element of the Mining Charter and the Amended Mining Charter should be a continuous compliance requirement for the duration of the mining right as argued by the DMR, or a once-off requirement as argued by the Chamber of Mines, on the “once empowered always empowered” principle. The Chamber of Mines and the DMR filed papers in court and the matter (the Main Application) was placed on the roll to be heard on 15 March 2016. In February 2016, an application
| |
Sibanye-Stillwater | Form 20-F 2017 | 270 |
was filed by a third party, Malan Scholes Inc., to consolidate the Main Application with its own application for a declaratory order on the empowerment aspects of the Mining Charter and the Amended Mining Charter (the Scholes Application). The Chamber of Mines opposed the consolidation of these applications on the basis that, amongst other things, the right to relief in the respective applications does not depend substantially on the same questions of law and/or fact. On 3 May 2016, the court refused to consolidate the two applications. On 16 February 2018, the High Court postponed the Mining Charter hearing indefinitely to allow the Chamber and the Government to engage in further discussions on this matter.
If the DMR were to prevail in the Main Application and the “once empowered always empowered” principle is rejected, mining companies, including Sibanye-Stillwater ,may be required to undertake further empowerment transactions in order to increase their HDSA ownership, which would result in the dilution of existing shareholders and could have a negative impact on the financial indebtedness of Sibanye-Stillwater. In such event, mining companies, including Sibanye-Stillwater, may be required to maintain a minimum HDSA ownership level indefinitely.
The Mineral and Petroleum Resources Development Amendment Act, 2008 (the MPRDAA) was assented to by the President on 19 April 2009 and was to come into effect on a date to be proclaimed by the President. From 19 April 2009 to 31 May 2013, the fate of the MPRDAA was unclear and it was thought that the government would not proceed with the MPRDAA. On 31 May 2013, it was published in the government gazette that the MPRDAA would come into effect 7 June 2013. This proclamation was amended by a further proclamation dated 6 June 2013 such that only certain sections of the MPRDAA took effect as of 7 June 2013. Because Sibanye-Stillwater is already the holder of mining rights in respect of its mines, the amendments introduced by the MPRDAA have limited impact on the current regulation of its operations.
In December 2012, the first draft of the MPRDB was published for comment. While the stated purpose of the MPRDB is, among other things, to remove ambiguities and enhance sanctions, the MPRDB has been criticised by stakeholders in the mining industry. Comments on the MPRDB were submitted and a second draft, known as the Mineral and Petroleum Resources Development Amendment Bill B15-2013 (MPRDB 2013) was published on 31 May 2013. A further revised version of the MPRDB 2013, the Mineral and Petroleum Resources Development Amendment Bill B15B-2013 (the Revised MPRDB 2013) was approved by the National Assembly of Parliament on 12 March 2014 and by the National Council of Provinces on 27 March 2014. In January 2015, the President referred the MPRDB back to Parliament for reconsideration and on 1 November 2016, the Portfolio Committee on Mineral Resources tabled non-substantial revisions to the MPRDB in the National Assembly and a slightly revised version of the MPRDB was passed by the National Assembly and referred to the NCOP. On 3 March 2017, the National Assembly passed certain minor amendments to the MPRDB. The National Assembly has referred the MPRDB to the NCOP where the Select Committee had received comments on the draft legislation. On 16 February 2018, President Ramaphosa announced that the MPRDB was at an advanced stage in Parliament. Among other things, the MPRDB seeks to require the consent of the Minister of Mineral Resources for the transfer of any interest in an unlisted company or any controlling interest in a listed company where such companies hold a prospecting right or mining right and to give the Minister of Mineral Resources broad discretionary powers to prescribe the levels required for beneficiation in promoting the beneficiation of minerals.
THE NEW MINING CHARTER
While it remains to be seen whether the Chamber will prevail in the Main Application, on 15 June 2017, the DMR published a new mining charter, or the New Mining Charter, which came into effect on the same day. The Chamber launched an urgent application, or the Interdict Application, in the High Court of South Africa, Gauteng Division, Pretoria, or the Gauteng Division High Court, to interdict the implementation of the New Mining Charter, pending an application by the Chamber, or the Chamber Application, to set the New Mining Charter aside on the basis that it was unilaterally developed and imposed on the industry and that the process that was followed by the DMR in developing the New Mining Charter had been seriously flawed. However, the Minister and the Chamber reached an agreement on 13 September 2017 under which the Minister undertook to suspend the New Mining Charter pending the outcome of the Chamber Application. The Chamber Application has been postponed indefinitely by agreement between the DMR and the Chamber on the basis that the Chamber has entered into a new round of discussions with the newly elected President of South Africa, Cyril Ramaphosa, and the new Minister of Mineral Resources, Gwede Mantashe. On 19 February 2018, the Gauteng Division High Court ordered that the DMR and the Chamber must also involve communities affected by mining activities in these new discussions over the New Mining Charter. The involvement of communities in these discussions may delay the process of agreeing on a new Mining Charter. For the time being, existing holders must continue to comply with the provisions of the Mining Charter and are not required to implement any aspect of the suspended New Mining Charter.
In the event that the negotiations on the New Mining Charter fail and the court upholds the New Mining Charter in its current form (if the Chamber Application is again placed on the roll to be heard) then existing and new holders of mining rights will need to comply with the New Mining Charter, which may require, among other things, further issuance of Sibanye-Stillwater shares to comply with the new ownership requirements, limitation on procurement and other activities, changes to management and the payment of additional fees and levies as set out in the New Mining Charter.
THE BBBEE ACT AND THE BBBEE AMENDMENT ACT
The BBBEE Act established a national policy on broad-based black economic empowerment with the objective of increasing the participation of HDSAs in the economy. The BBBEE Act provides for various measures to promote black economic empowerment, including empowering the Minister of Trade and Industry to issue the BBBEE Codes of Good Practice (BBBEE Codes), with which organs of state and public entities and parties interacting with them or obtaining rights and licenses from them would be required to comply. There has been some debate as to whether or to what extent the mining industry was subject to the BBBEE Act and the policies and codes provided for thereunder, which apply generally to other industries in South Africa. The MPRDA does not require mining companies to comply with the BBBEE Act and the BBBEE Codes but the former Minister of Mineral Resources has expressed a desire to align the New Mining Charter with the BBBEE Act and the more onerous BBBEE Codes. The current version of the New Mining Charter reflects the former Minister of Mineral Resource’s latest attempts at alignment notwithstanding the questionable need to do so. Accordingly, if brought into effect in its current form, the New Mining Charter could potentially create further uncertainty.
On 24 October 2014, the BBBEE Amendment Act, No. 46 of 2013 was brought into operation. The BBBEE Amendment Act inserted a new provision in the BBBEE Act, whereby the BBBEE Act would trump the provisions of any other law in South Africa which conflicts with the provisions of the BBBEE Act, provided such conflicting law was in force immediately prior to the effective date of the BBBEE Amendment Act. The BBBEE Amendment Act also stipulates that this provision would only be effective one year after the BBBEE Amendment Act is brought into effect. This provision came into effect on 24 October 2015 and, on 27 October 2015, the Minister for Trade and Industry published a government gazette
| |
Sibanye-Stillwater | Form 20-F 2017 | 271 |
notice declaring an exemption in favour of the DMR from applying the requirements contained in section 10(1) of the BBBEE Act for a period of 12 months. The exemption can be read as confirmation that the Department of Trade and Industry sees the BBBEE codes as “applicable” to the Mining Industry after the exemption was lifted on 27 October 2016. In any event, the DMR is likely to continue implementing the Mining Charter and it is unlikely that the DMR will begin applying the BBBEE Act and BBBEE codes in administering the MPRDA.
This raises the question of whether the BBBEE Act and the BBBEE Codes may overrule the Mining Charter in the future. There is no clarity on this point at this stage. The revised Broad-Based Black Economic Empowerment Codes of Good Practice (the Revised BEE Codes) became available for voluntary use on 11 October 2013 and became effective on 1 May 2015 but are still under consideration and are not yet in force. Entities may elect to be measured under the Revised BEE Codes immediately. Both the BBBEE Amendment Act and the Revised BEE Codes expressly stipulate that where an economic sector in South Africa has a Sector Code in place for BEE purposes, companies in that sector must comply with the Sector Code. For purposes of the BBBEE Act, the Mining Charter is not a Sector Code. It is not clear at this stage how the Mining Charter and Code relate to each other. The government may designate the Mining Charter as a Sector Code, in which case it will be under the auspices of the BBBEE Act. On the other hand, the Mining Charter may remain a stand-alone document under the auspices of the MPRDA and may be subject to the trumping provision discussed above. This uncertainty may be resolved through either government clarification or judicial attention. On 17 February 2016, the Minister of Trade and Industry published a gazette notice which repealed and confirmed the validity of a number of Sector Codes. The omission of the Mining Charter from the notice can be interpreted as confirmation that the Mining Charter is not contemplated as a Sector Code. This supports the interpretation BBBEE Act did not intend to trump the Mining Charter. While it remains to be seen how this will be interpreted, it appears that the BBBEE Act and the BEE Codes will not overrule the Mining Charter in the future.
THE ROYALTY ACT
The Mineral and Petroleum Resources Royalty Act, No. 28 of 2008 (the Royalty Act) imposes a royalty on refined and unrefined minerals payable to the South African government.
The royalty in respect of refined minerals (which include gold and platinum) is calculated by dividing earnings before interest and taxes (EBIT) by the product of 12.5 times gross revenue calculated as a percentage, plus an additional 0.5%. EBIT refers to taxable mining income (with certain exceptions such as no deduction for interest payable and foreign exchange losses) before assessed losses but after capital expenditure. A maximum royalty of 5% of revenue has been introduced for refined minerals.
Sibanye-Stillwater currently pays a royalty based on the refined minerals royalty calculation as applied to its gross revenue.
The South African President has appointed the Davis Tax Committee to look into and review the current mining tax regime. The committee’s first interim report on mining, which was released for public comment on 13 August 2015, proposed no changes to the royalty regime but recommended the discontinuation of the upfront capital expenditure write-off regime in favour of an accelerated capital expenditure depreciation regime. In addition, the report recommended retaining the so called “gold formula” for existing gold mines only, as new gold mines would be unlikely to be established in circumstances where profits are marginal or where gold mines would conduct mining of the type intended to be encouraged by the formula. The committee also recommended the phasing out of additional capital allowances available to gold mines in order to bring the gold mining corporate income tax regime in line with the tax system applicable to all taxpayers. On 13 November 2017, following a period of public comment, the Davis Tax Committee issued its final report which largely reaffirmed its initial recommendations. The South African National Treasury will continue to consider the Davis Tax Committee’s final recommendations. It is not clear at this stage which, if any, of the recommendations will be adopted as legislation.
EXCHANGE CONTROLS
South African law provides for Exchange Control Regulations which, among other things, restrict the outward flow of capital from the CMA. The Exchange Control Regulations, which are administered by the Financial Surveillance Department of the SARB, are applied throughout the CMA and regulate international transactions involving South African residents, including companies. The South African government has committed itself to gradually relaxing exchange controls and various relaxations have occurred in recent years.
SARB approval is required for Sibanye-Stillwater and its subsidiaries to receive and/or repay loans to non-residents of the CMA. Funds raised outside of the CMA by any future Sibanye-Stillwater non-South African resident subsidiaries (whether through debt or equity) can be used for overseas expansion, subject to any conditions imposed by the SARB. Sibanye-Stillwater and its South African subsidiaries would, however, require SARB approval in order to provide guarantees for the obligations of any of Sibanye-Stillwater’s subsidiaries with regard to funds obtained from non-residents of the CMA. Debt raised outside the CMA by any future Sibanye-Stillwater non-South African subsidiaries must be repaid or serviced by those foreign subsidiaries. Absent SARB approval, income earned in South Africa by Sibanye-Stillwater and its South African subsidiaries cannot be used to repay or service such foreign debts. Unless specific SARB approval has been obtained, income earned by any future Sibanye-Stillwater foreign subsidiaries cannot be used to finance the operations of another foreign subsidiary.
Transfers of funds from South Africa for the purchase of shares in offshore entities or for the creation or expansion of business ventures offshore require exchange control approval. However, if the investment is a new outward foreign direct investment where the total cost does not exceed R500 million per company per calendar year, the investment application may, without specific SARB approval, be processed by an authorised dealer, subject to all existing criteria and reporting obligations.
Sibanye-Stillwater must obtain approval from the SARB regarding any capital-raising involving a currency other than the Rand. In connection with its approval, it is possible that the SARB may impose conditions on Sibanye-Stillwater’s use of the proceeds of any such capital-raising, such as limits on Sibanye-Stillwater’s ability to retain the proceeds of the capital-raising outside South Africa or requirements that Sibanye-Stillwater seeks further SARB approval prior to applying any such funds to a specific use.
| |
Sibanye-Stillwater | Form 20-F 2017 | 272 |
DIVIDEND POLICY AND DIVIDEND DISTRIBUTION
Sibanye-Stillwater may make distributions from time to time, provided that any such distribution is pursuant to an existing legal obligation of Sibanye-Stillwater or a court order or has been authorised by resolution of the Board (save in the case of a pro rata distribution to all shareholders (except one which results in shareholders holding shares in an unlisted entity which requires the sanction of an ordinary resolution), cash dividends paid out of retained income, capitalisation issues or scrip dividends incorporating an election to receive either capitalisation shares or cash), and provided further that:
| · | | dividends be paid to shareholders registered as at a date subsequent to the date of declaration or date of confirmation of the dividend, whichever is the later; |
| · | | it reasonably appears that Sibanye-Stillwater will satisfy the ‘solvency and liquidity’ test as set out in the Companies Act immediately after completing the proposed distribution; and |
| · | | no obligation is imposed by Sibanye-Stillwater, if it is a distribution of capital, that such capital be used to subscribe for shares in Sibanye-Stillwater. |
Sibanye-Stillwater must complete any such distribution fully within 120 business days after the Board acknowledges that the ‘solvency and liquidity’ test has been applied as aforesaid, failing which it must again comply with the above.
Sibanye-Stillwater must hold all unclaimed distributions due to the shareholders of Sibanye-Stillwater in trust subject to the laws of prescription, and accordingly may release any distributions once the prescriptive period in relation to those dividends has expired.
All dividends paid by Sibanye-Stillwater prior to the Spin-off were historically paid to Gold Fields. After the Spin-off, the Board adopted a new dividend policy to return at least 25% to 35% of normalised earnings. Sibanye-Stillwater defines normalised earnings as profit for the year excluding gains and losses on foreign exchange, financial instruments, non-recurring items and share of result of associates after royalties and tax. For a reconciliation of loss attributable to the owners of Sibanye-Stillwater to normalised earnings, see Annual Financial Report—Annual Financial Statements—Notes to the consolidated financial statements—Note 11: Dividends.
Sibanye-Stillwater has not declared a dividend for the year ended 31 December 2017.
Under South African law, Sibanye-Stillwater will be entitled to pay a dividend or similar payment to its shareholders only if it meets the solvency and liquidity tests set out in the Companies Act, and we are permitted to do so in terms of the Memorandum of Incorporation.
There is no arrangement under which future dividends are waived or agreed to be waived.
| |
Sibanye-Stillwater | Form 20-F 2017 | 273 |
As of 23 March 2018, the issued share capital of Sibanye-Stillwater consisted of 2,178,647,129 ordinary shares.
Listing Details
As of 31 December 2017, 106 record holders of Sibanye-Stillwater’s ordinary shares, holding an aggregate of 782,333,520 ordinary shares (36%), were listed as having addresses in the United States.
JSE Trading History
The tables below show the high and low closing prices in Rand and the average daily volume of trading activity on the JSE for Sibanye-Stillwater’s ordinary shares for the periods indicated.
The following table sets out ordinary share trading information on a yearly basis for the last five fiscal years since the shares began trading on 11 February 2013, as reported by I-Net Bridge, a South African financial information service:
| | Ordinary share price | | Average daily trading volume (number of ordinary shares) |
Year ended | | High (R/share) | | Low (R/share) | |
31 December 2013 | | 16.30 | | 6.73 | | 4,754,958 |
31 December 2014 | | 29.52 | | 12.34 | | 2,868,842 |
31 December 2015 | | 32.26 | | 13.66 | | 3,024,491 |
31 December 2016 | | 70.23 | | 21.98 | | 6,165,133 |
31 December 2017 | | 35.40 | | 14.15 | | 9,080,455 |
through 23 March 2018 | | 16.64 | | 11.22 | | 9,591,956 |
The following table sets out ordinary share trading information on a quarterly basis for the periods indicated in Sibanye-Stillwater’s two most recent full financial years, as reported by I-Net Bridge:
| | Ordinary share price | | Average daily trading
volume (number of ordinary shares) |
Quarter ended | | High (R/share) | | Low (R/share) | |
31 March 2016 | | 61.20 | | 24.57 | | 8,106,968 |
30 June 2016 | | 60.37 | | 43.46 | | 4,156,655 |
30 September 2016 | | 70.23 | | 46.48 | | 4,952,352 |
31 December 2016 | | 47.83 | | 21.98 | | 7,514,997 |
31 March 2017 | | 31.15 | | 24.01 | | 6,089,544 |
30 June 2017 | | 35.40 | | 15.05 | | 11,283,163 |
30 September 2017 | | 21.89 | | 14.75 | | 9,277,686 |
31 December 2017 | | 20.34 | | 14.15 | | 9,776,318 |
The following table sets out ordinary share trading information on a monthly basis for each of the last six months, as reported by I-Net Bridge:
| | Ordinary share price | | Average daily trading value (number of ordinary shares) |
Month ended | | High (R/share) | | Low (R/share) | |
30 September 2017 | | 21.07 | | 14.75 | | 13,661,921 |
31 October 2017 | | 18.31 | | 15.07 | | 10,061,956 |
30 November 2017 | | 20.34 | | 17.99 | | 8,934,370 |
31 December 2017 | | 18.81 | | 14.15 | | 10,420,466 |
31 January 2018 | | 16.64 | | 13.76 | | 7,718,430 |
28 February 2018 | | 13.93 | | 11.30 | | 10,816,723 |
On 23 March 2018, the closing price of the ordinary shares on the JSE was R11.44.
NYSE Trading History
The tables below show the high and low closing prices in US dollars and the average daily volume of trading activity on the NYSE for the periods indicated.
| |
Sibanye-Stillwater | Form 20-F 2017 | 274 |
The following table sets out ordinary share trading information on a yearly basis for the last five fiscal years since the shares began trading on 11 February 2013, as reported by Bloomberg:
| | | | | | |
| | ADS price | | |
Year ended | | High ($/ADS) | | Low ($/ADS) | | Average daily trading volume (number of ADSs) |
31 December 2013 | | 7.47 | | 2.65 | | 887,984 |
31 December 2014 | | 11.09 | | 4.69 | | 844,925 |
31 December 2015 | | 11.35 | | 4.21 | | 1,122,803 |
31 December 2016 | | 20.78 | | 6.16 | | 1,666,327 |
31 December 2017 | | 10.56 | | 4.39 | | 3,446,199 |
through 23 March 2018 | | 5.48 | | 3.85 | | 3,772,330 |
The following table sets out ADS trading information on a quarterly basis for the periods indicated, as reported by Bloomberg:
| | $/ADS) | | ) | | ) |
| | ADS price | | |
Year ended | | High ($/ADS) | | Low ($/ADS) | | Average daily trading volume (number of ADSs) |
| | | | | | |
31 March 2016 | | 15.71 | | 6.16 | | 1,843,201 |
30 June 2016 | | 16.35 | | 11.47 | | 1,556,359 |
30 September 2016 | | 20.78 | | 13.64 | | 1,380,049 |
31 December 2016 | | 13.94 | | 6.41 | | 1,897,603 |
31 March 2017 | | 9.40 | | 7.45 | | 2,133,038 |
30 June 2017 | | 10.56 | | 4.62 | | 5,878,312 |
30 September 2017 | | 6.70 | | 4.39 | | 2,986,651 |
31 December 2017 | | 5.61 | | 4.44 | | 2,765,951 |
The following table sets out ADS trading information on a monthly basis for each of the last six months, as reported by Bloomberg:
| | $/ADS) | | ) | | ) |
| | ADS price | | |
Year ended | | High ($/ADS) | | Low ($/ADS) | | Average daily trading volume (number of ADSs) |
30 September 2017 | | 6.46 | | 4.39 | | 3,618,307 |
31 October 2017 | | 5.13 | | 4.44 | | 2,661,506 |
30 November 2017 | | 5.61 | | 5.10 | | 2,283,078 |
31 December 2017 | | 5.51 | | 4.63 | | 3,387,856 |
31 January 2018 | | 5.48 | | 4.62 | | 2,920,035 |
28 February 2018 | | 4.77 | | 3.89 | | 4,276,249 |
On 23 March 2018, the closing price of Sibanye-Stillwater’s ADSs quoted on the NYSE was US$3.91.
| |
Sibanye-Stillwater | Form 20-F 2017 | 275 |
MEMORANDUM OF INCORPORATION
A summary of Sibanye-Stillwater’s Memorandum of Incorporation can be found in the 2012 Annual Report on Form 20-F filed on 26 April 2013.
MATERIAL CONTRACTS
The following are material contracts not entered into in the ordinary course of business that were entered into, novated or amended by Sibanye-Stillwater in the period under review.
Stillwater Acquisition
On 9 December 2016, Sibanye and Stillwater entered into an Agreement and Plan of Merger (Merger Agreement) with Thor US Holdco Inc. (US Holdco) and Thor Mergco Inc., an indirect wholly owned subsidiary of Sibanye (Merger Sub).
The Merger Agreement provided that, among other things and subject to the terms and conditions therein, (1) Merger Sub would be merged with and into Stillwater and (2) at the effective time of the merger, each outstanding share of common stock of Stillwater, par value US$0.01 per share (Stillwater Shares) (other than Stillwater Shares owned by Stillwater, Sibanye or their respective subsidiaries or Stillwater Shares with respect to which appraisal rights were validly exercised and not lost in accordance with Delaware law) would be converted into the right to receive US$18.00 per share in cash without interest.
Sibanye-Stillwater concluded the acquisition on 4 May 2017.
2017 Senior Notes
On 27 June 2017 Stillwater, as a subsidiary of Sibanye-Stillwater, issued at face value US$1.05 billion of senior notes (the 2017 Senior Notes) to an indenture dated 16 March 2017 among Sibanye, The Bank of New York Mellon and certain guarantors. The 2017 Senior Notes offering comprises of two tranches, US$500 million 6.125% Senior Notes due 2022, which bear interest at a rate of 8.125% per annum (the 2022 Notes) and US$550 million 7.125% Senior Notes due 2025, which bear interest at a rate of 7.125% per annum (the 2025 Notes). The 2017 Senior Notes are denominated in US Dollars, mature and become due and payable in arrears in equal semi-annual instalments on 27 June and 27 December of each year. The 2017 Senior Notes are fully and unconditionally guaranteed, jointly and severally by Kroondal Operations Proprietary Limited, Rand Uranium Proprietary Limited, Sibanye Rustenburg Platinum Mines Proprietary Limited and Sibanye Gold Limited. The guarantees rank equally in right of payment to all existing and future senior debt of the guarantors.
Prior to 27 June 2019, in the case of the 2022 Notes, or 27 June 2021, in the case of the 2025 Notes, Stillwater may redeem all or a portion of the 2022 Notes or 2025 Notes by paying the relevant price (expressed as a percentage of the principal amount of the 2022 Notes or 2025 Notes plus an applicable premium) plus accrued and unpaid interest on the 2022 Notes or 2025 Notes. At any time on or after 27 June 2019, in the case of the 2022 Notes, or 27 June 2021, in the case of the 2025 Notes, Stillwater may redeem all or part of the 2022 Notes or 2025 Notes by paying the relevant price (expressed as a percentage of the principal amount of the 2022 Notes or 2025 Notes plus an applicable premium) plus accrued and unpaid interest on the 2022 Notes or 2025 Notes. In addition, prior to 27 June 2019, the Stillwater may redeem up to 35% of the original aggregate principal amount of the 2022 Notes or 2025 Notes with the net proceeds from certain equity offerings. If Sibanye-Stillwater undergoes a change of control, Sibanye or Stillwater will be required to make an offer to purchase each of the 2022 Notes and 2025 Notes at a purchase price equal to 101% of the principal amount of each of the Notes, plus accrued and unpaid interest to the date of purchase. In the event of certain developments affecting taxation, Stillwater may redeem all, but not less than all, of the 2022 Notes and 2025 Notes.
Sibanye-Stillwater used the proceeds of the 2017 Senior Notes for the partial repayment of the US$350 million Bridge Facility Agreement between Sibanye Gold Limited and HSBC Bank plc, dated 5 October 2015, raised for the acquisition of Stillwater. Sibanye-Stillwater is in the process of amending the indenture.
2017 Convertible Bond
On 28 March 2018, Sibanye-Stillwater entered into a supplemental trust deed relating to its issuance, on 26 September 2017, of a US$450 million senior unsecured guaranteed convertible bond due 2023 (the 2017 Convertible Bond), pursuant to a trust deed dated 26 September 2017, among Sibanye Gold Limited, Stillwater Mining Company and Kroondal Operations Proprietary Limited as guarantors and BNY Mellon Corporate Trustee Services Limited as Trustee. The 2017 Convertible Bond bears a coupon of 1.875% per annum, payable semi-annually in arrears in equal instalments on 26 March and 26 September of each year. The 2017 Convertible Bonds are guaranteed by Stillwater Mining Company and Kroondal Operations Proprietary Limited.
The conversion price is subject to customary adjustments pursuant to the terms and conditions of the 2017 Convertible Bond and will be adjusted for any dividends paid. The 2017 Convertible Bond, subject to the receipt of the requisite approval by a general meeting of the shareholders of Sibanye-Stillwater on or before 31 May 2018, will be convertible into new and/or existing shares of Sibanye-Stillwater, cash or a combination thereof pursuant to the terms and conditions of the 2017 Convertible Bond. Absent such approval, holders of the Convertible Bonds will on conversion receive a cash amount equal to the value of the underlying new and/or existing shares.
For so long as the conversion of the 2017 Convertible Bond has not been approved by a general meeting of the shareholders, Sibanye-Stillwater reserves the right to redeem all but not some of the 2017 Convertible Bonds at the greater of: (i) 102% of their principal value, or (ii) 102% of their fair market value, in each case plus accrued interest.
The Convertible Bonds were issued at 100% of their principal amount (i.e. US$200,000 per 2017 Convertible Bond). Unless previously redeemed, converted or purchased and cancelled, the 2017 Convertible Bonds will be redeemed at their principal amount on 26 September 2023. Sibanye-Stillwater will has the option to redeem all but not some of the 2017 Convertible Bonds at their principal amount (plus accrued but unpaid interest)
| |
Sibanye-Stillwater | Form 20-F 2017 | 276 |
in accordance with the terms and conditions of the 2017 Convertible Bonds at any time (i) on or after 17 October 2020, if the value of the new and/or existing shares underlying a 2017 Convertible Bond is equal to or exceeds US$260,000 for a specified period of time, or (ii) if 15% or less of the aggregate principal amount of the 2017 Convertible Bond remains outstanding (all as more fully described in the terms and conditions of the 2017 Convertible Bond).
Sibanye-Stillwater used the proceeds of the 2017 Convertible Bond for the partial repayment of the US$350 million Bridge Facility Agreement between Sibanye Gold Limited and HSBC Bank plc, dated 5 October 2015, raised for the acquisition of Stillwater.
Lonmin Acquisition
On 14 December 2017, Sibanye-Stillwater announced that it had reached an agreement on the terms of a recommended all-share offer pursuant to which Sibanye-Stillwater, and/or a wholly-owned subsidiary of Sibanye-Stillwater, will acquire the entire issued and to be issued ordinary share capital of Lonmin plc, which operates three platinum mines in South Africa (the Lonmin Acquisition). On the same day, a co-operation agreement was signed between Sibanye Gold Limited and Lonmin plc in connection with the Lonmin Acquisition. The Lonmin Acquisition is proposed to be effected by means of a scheme of arrangement between Lonmin and Lonmin Shareholders under Part 26 of the UK Companies Act. Under the terms of the Lonmin Acquisition, each Lonmin shareholder will be entitled to receive 0.967 new Sibanye-Stillwater shares for each Lonmin share that they hold. The Lonmin Acquisition is subject to the fulfilment of a number of conditions, as set out in the announcement published pursuant to Rule 2.7 of the UK City Code on Takeovers and Mergers, including anti-trust and regulatory approvals and the approval of Lonmin shareholders and Sibanye-Stillwater shareholders. The Lonmin Acquisition is expected to complete in the second half of 2018.
Deposit Agreement
In connection with the establishment of an ADR facility in respect of Sibanye-Stillwater’s shares, Sibanye entered into a deposit agreement with BNYM in respect of Sibanye’s shares among Sibanye, BNYM and all owners and holders from time to time of ADRs issued thereunder (the Deposit Agreement).
This summary is subject to and qualified in its entirety by reference to the Deposit Agreement, including the form of ADRs attached thereto. Terms used in this section and not otherwise defined will have the meanings set forth in the Deposit Agreement. Copies of the Deposit Agreement are available for inspection at the Corporate Trust Office of the Depositary, located at 101 Barclay Street, New York, New York 10286. BNYM’s principal executive office is located at One Wall Street, New York, New York 10286.
American Depositary Shares
Each ADS represents four shares (or a right to receive four shares) deposited with the principal Johannesburg offices of either of FirstRand Bank, Societe Generale (ZA) or Standard Bank of South Africa, as custodians for the Depositary. Each ADS also represents any other securities, cash or other property which may be held by BNYM under the Deposit Agreement.
You may hold ADSs either (A) directly (i) by having an American Depositary Receipt, also referred to as an ADR, which is a certificate evidencing a specific number of ADSs, registered in your name, or (ii) by having ADSs registered in your name in the Direct Registration System (or DRS) or (B) indirectly by holding a security entitlement in ADSs through your broker or other financial institution. If you hold ADSs directly, you are a registered ADS holder, also referred to as an ADS holder. This description assumes you are an ADS holder. If you hold the ADSs indirectly, you must rely on the procedures of your broker or other financial institution to assert the rights of ADS holders described in this section. You should consult with your broker or financial institution to find out what those procedures are.
The DRS is a system administered by The Depository Trust Company (or the DTC) pursuant to which the Depositary may register the ownership of uncertificated ADSs, which ownership shall be evidenced by periodic statements sent by the Depositary to the registered holders of uncertificated ADSs.
South African law governs shareholder rights. BNYM will be the holder of the shares underlying your ADSs. As a registered holder of ADSs, you will have ADS holder rights. A deposit agreement among Sibanye, BNYM and you, as an ADS holder, and all other persons indirectly holding ADSs sets out ADS holder rights, as well as the rights and obligations of the Depositary. New York law governs the Deposit Agreement and the ADSs.
The following is a summary of the material provisions of the Deposit Agreement. For more complete information, you should read the entire Deposit Agreement and the form of ADR.
Share Dividends and other Distributions
How will you receive Dividends and other Distributions on the Ordinary Shares?
BNYM will pay to you the cash dividends or other distributions it or the custodian receives on the ordinary shares or other deposited securities, after deducting its fees and expenses. You will receive these distributions in proportion to the number of ordinary shares your Sibanye ADRs represent.
Cash
BNYM will convert any cash dividend or other cash distribution Sibanye-Stillwater pays on the ordinary shares other than any dividend or distribution paid in US dollars, into US dollars. If that is not possible or if any government approval is needed and cannot be obtained, the Deposit Agreement allows BNYM to distribute the foreign currency only to those ADR holders to whom it is possible to do so. It will hold the foreign
| |
Sibanye-Stillwater | Form 20-F 2017 | 277 |
currency it cannot convert for the account of the ADR holders who have not been paid. It will not invest the foreign currency and it will not be liable for any interest.
Before making a distribution, BNYM will deduct any withholding taxes that must be paid. It will distribute only whole US dollars and US cents and will round fractional amounts to the nearest whole cent. If the exchange rates fluctuate during a time when BNYM cannot convert the foreign currency, you may lose some or all of the value of the distribution.
Shares
BNYM may, and will if Sibanye-Stillwater so requests, distribute new ADRs representing any ordinary shares Sibanye-Stillwater distributes as a dividend or capitalisation issue. BNYM will only distribute whole ADRs. It will sell ordinary shares which would require it to issue a fractional ADR and distribute the net proceeds to the holders entitled to those ordinary shares. If BNYM does not distribute additional cash or ADRs, each ADR will also represent the new ordinary shares. BNYM may sell a portion of the distributed shares sufficient to pay its fees and expenses in connection with the distribution.
Rights to purchase additional ordinary shares
If Sibanye-Stillwater offers holders of securities any rights, including rights to subscribe for additional ordinary shares, BNYM may make these rights available to you. Sibanye-Stillwater must first instruct BNYM to do so and furnish it with satisfactory evidence that it is legal to do so. If Sibanye-Stillwater does not furnish this evidence and/or give these instructions, and BNYM determines that it is practical to sell the rights, BNYM may sell the rights and distribute the proceeds to holders’ accounts. BNYM will allow rights that are not distributed or sold to lapse. In that case, you will receive no value for them.
If BNYM makes rights available to you, upon instruction from you it will exercise the rights and purchase the ordinary shares on your behalf. BNYM will then deposit the ordinary shares and deliver ADSs to the persons entitled to them. It will only exercise rights if you pay BNYM the exercise price and any other charges the rights require you to pay.
US securities laws may restrict the sale, deposit, cancellation and transfer of the ADSs issued after exercise of rights. For example, you may not be able to trade these ADSs freely in the United States. In this case, BNYM may deliver the ADRs under a separate restricted deposit agreement, which will contain the same provisions as the Deposit Agreement except for changes needed to put the necessary restrictions in place. BNYM will not offer you rights unless those rights and the securities to which the rights relate are either exempt from registration or have been registered under the Securities Act of 1933 with respect to a distribution to all ADR holders.
Other distributions
BNYM will send to you anything else Sibanye-Stillwater distributes on deposited securities by any means BNYM thinks is legal, fair and practical. If it cannot make the distribution in that way, BNYM may decide to sell what Sibanye-Stillwater distributed-for example by public or private sale-and distribute the net proceeds, in the same way as it does with cash, or it may decide to hold what Sibanye-Stillwater distributed, in which case ADSs will also represent the newly distributed property. BNYM may sell a portion of the distributed securities or property sufficient to pay its fees and expenses in connection with the distribution.
BNYM is not responsible if it decides that it is unlawful or impractical to make a distribution available to any ADR holder. Sibanye-Stillwater will have no obligation to take any other action to permit the distribution of ADRs, shares, rights or anything else to ADR holders. This means that you may not receive the distribution Sibanye-Stillwater makes on its ordinary shares or any value for them if it is illegal or impractical for Sibanye-Stillwater to make them available to you.
Deposit, Withdrawal and Cancellation
How are ADRs issued?
BNYM will deliver the ADRs that you are entitled to receive in the offer against deposit of the underlying ordinary shares. BNYM will deliver additional ADRs if you or your broker deposit ordinary shares with the custodian. You must also deliver evidence satisfactory to BNYM of any necessary approvals of the governmental agency in South Africa, if any, which is responsible for regulating currency exchange at that time. If required by BNYM, you must in addition deliver an agreement transferring your rights as a shareholder to receive dividends or other property. Upon payment of its fees and of any taxes or charges, BNYM will register the appropriate number of ADRs in the names you request and will deliver the ADRs to the persons you request.
How do ADR holders cancel ADRs and obtain ordinary shares?
You may submit a written request to withdraw ordinary shares and turn in your ADRs evidencing your ADSs at the Corporate Trust Office of BNYM. Upon payment of its fees and of any taxes or charges, such as stamp taxes or stock transfer taxes, BNYM will deliver the deposited securities underlying the ADSs to an account designated by you at the office of the custodian. At your request, risk and expense, BNYM may deliver at its Corporate Trust Office any dividends or distributions with respect to the deposited securities represented by the ADSs, or any proceeds from the sale of any dividends, distributions or rights, which may be held by BNYM.
How do ADS holders interchange between certificated ADSs and uncertificated ADSs?
You may surrender your ADR to the Depositary for the purpose of exchanging your ADR for uncertificated ADSs. The Depositary will cancel that
| |
Sibanye-Stillwater | Form 20-F 2017 | 278 |
ADR and will send to the ADS holder a statement confirming that the ADS holder is the registered holder of uncertificated ADSs. Alternatively, upon receipt by the Depositary of a proper instruction from a registered holder of uncertificated ADSs requesting the exchange of uncertificated ADSs for certificated ADSs, the Depositary will execute and deliver to the ADS holder an ADR evidencing those ADSs.
Record Dates
Whenever any distribution of cash or rights, change in the number of ordinary shares represented by ADRs or notice of a meeting of holders of ordinary shares or ADRs is made, BNYM will fix a record date for the determination of the owners entitled to receive the benefits, rights or notice.
Voting Rights
How do you vote?
If you are an ADR holder on a record date fixed by BNYM, you may instruct BNYM how to exercise the voting rights of the ordinary shares represented by your ADRs. Otherwise, you will not be able to exercise your right to vote unless you withdraw the ordinary shares. However, you may not know about the meeting far enough in advance to withdraw the shares. If Sibanye-Stillwater asks for your instructions, BNYM will notify you of the upcoming meeting and arrange to deliver certain materials to you. The materials will: (1) include all information included with the meeting notice sent by Sibanye-Stillwater to BNYM; (2) explain how you may instruct BNYM to vote the ordinary shares or other deposited securities underlying your ADRs as you direct if you vote by mail or by proxy; and (3) include a voting instruction card and any other information required under South African law that Sibanye-Stillwater and BNYM will prepare. For instructions to be valid, BNYM must receive them on or before the date specified in the instructions. BNYM will try, to the extent practical, subject to applicable law and the provisions of the by-laws of Sibanye-Stillwater, to vote or have its agents vote the underlying shares as you instruct. BNYM will only vote, or attempt to vote, as you instruct. However, if we give notice to BNYM on or before the first date when we give notice, by publication or otherwise, of any meeting of holders of ordinary shares, and if BNYM does not receive your voting instructions, BNYM will give a proxy to vote your ordinary shares to a designated representative of Sibanye-Stillwater, unless Sibanye-Stillwater informs BNYM that: (1) it does not want the proxy issued; (2) substantial opposition exists; or (3) the matter materially and adversely affects the rights of holders of ordinary shares.
Sibanye-Stillwater cannot assure that you will receive the voting materials in time to ensure that you can instruct BNYM to vote your ordinary shares. In addition, BNYM and its agents are not responsible for failing to carry out voting instructions or for the manner of carrying out voting instructions. This means that you may not be able to exercise your right to vote and there may be nothing you can do if your ordinary shares are not voted as you requested.
Inspection of Transfer Books
BNYM will keep books for the registration and transfer of ADRs. These books will be open at all reasonable times for inspection by you, provided that you are inspecting the books for a purpose related to Sibanye-Stillwater or the Deposit Agreement or the ADRs.
Fees and Expenses
BNYM, as Depositary, will charge any party depositing or withdrawing ordinary shares or any party surrendering ADRs or to whom ADRs are issued:
| | |
Persons depositing or withdrawing shares or ADS holders must pay | | For |
$5.00 (or less) per 100 Sibanye-Stillwater ADRs (or portion of 100 Sibanye-Stillwater ADRs) | | Issuance of Sibanye-Stillwater ADRs, including issuances resulting from a distribution of ordinary shares or rights or other property or cancellation of Sibanye-Stillwater ADRs for the purpose of withdrawal, including if the deposit agreement terminates |
$.05 (or less) per ADR (or portion thereof) | | Any cash distribution pursuant to the Deposit Agreement |
A fee equivalent to the fee that would be payable if securities distributed to you had been ordinary shares and those ordinary shares had been deposited for issuance of ADRs | | Distribution of securities distributed to holders of deposited securities which are distributed by BNYM to Sibanye’s ADR holders |
$.05 (or less) per ADRs per calendar year | | Depositary services |
Registration or transfer fees | | Transfer and registration of shares on Sibanye’s share register to or from the name of BNYM or its agent when you deposit or withdraw ordinary shares |
Expenses of BNYM | | Cable, telex and facsimile transmissions (when expressly provided in the deposit agreement) converting foreign currency to US dollars |
Taxes and other governmental charges BNYM or the custodian have to pay on any ADR or share underlying an ADR, for example, stock transfer taxes, stamp duty or withholding taxes | | As necessary |
| |
Sibanye-Stillwater | Form 20-F 2017 | 279 |
Any charges incurred by BNYM or its agents for servicing the deposited securities | | As necessary |
The Depositary collects its fees for delivery and surrender of ADSs directly from investors depositing shares or surrendering ADSs for the purpose of withdrawal or from intermediaries acting for them. The Depositary collects fees for making distributions to investors by deducting those fees from the amounts distributed or by selling a portion of distributable property to pay the fees. The Depositary may collect its annual fee for depositary services by deduction from cash distributions or by directly billing investors or by charging the book-entry system accounts of participants acting for them. The Depositary may generally refuse to provide fee-attracting services until its fees for those services are paid.
From time to time, the Depositary may make payments to Sibanye-Stillwater to reimburse and/or share revenue from the fees collected from ADR holders, or waive fees and expenses for services provided, generally relating to costs and expenses arising out of establishment and maintenance of the ADR programme. In performing its duties under the Deposit Agreement, the Depositary may use brokers, dealers or other service providers that are affiliates of the Depositary and that may earn or share fees or commissions.
Payment of Taxes
You will be responsible for any taxes or other governmental charges payable on your ADRs or on the deposited securities underlying your ADRs. BNYM may deduct the amount of any taxes owed from any payments to you. It may also restrict or refuse the transfer of your Sibanye-Stillwater ADRs or restrict or refuse the withdrawal of your underlying deposited securities until you pay any taxes owed on your Sibanye-Stillwater ADRs or underlying securities. It may also sell deposited securities to pay any taxes owed.
You will remain liable if the proceeds of the sale are not enough to pay the taxes. If BNYM sells deposited securities, it will, if appropriate, reduce the number of Sibanye-Stillwater ADRs held by you to reflect the sale and pay to you any proceeds, or send to you any property, remaining after it has paid the taxes.
Reclassifications, Recapitalisations and Mergers
| | |
If Sibanye | | Then |
Reclassifies, splits up or consolidates any of the Sibanye-Stillwater ordinary shares | | |
Distributes securities on any of the Sibanye-Stillwater ordinary shares that are not distributed to you | | The cash, ordinary shares or other securities received by BNYM will become new deposited securities under the Deposit Agreement. Each Sibanye-Stillwater ADR will automatically represent the right to receive a proportional interest in the new deposited securities. |
Recapitalises, reorganises, merges, consolidates, sells its assets, or takes any similar action | | BNYM may, and will if Sibanye-Stillwater asks it to, deliver new Sibanye-Stillwater ADRs representing the new deposited securities or ask you to surrender your outstanding Sibanye-Stillwater ADRs in exchange for new Sibanye-Stillwater ADRs identifying the new deposited securities |
Amendment and Termination
How may the Deposit Agreement be amended?
Sibanye-Stillwater may agree with BNYM to amend the Deposit Agreement and the ADRs without your consent for any reason. If the amendment adds or increases fees or charges, except for taxes and governmental charges or prejudices an important right of Sibanye-Stillwater ADR holders, it will only become effective 30 days after BNYM notifies you of the amendment. At the time an amendment becomes effective, you are considered, by continuing to hold your ADRs, to agree to the amendment and to be bound by the agreement as amended. However, no amendment will impair your right to receive the deposited securities in exchange for your Sibanye-Stillwater ADRs.
How may the Deposit Agreement be terminated?
BNYM will terminate the Deposit Agreement if Sibanye-Stillwater asks it to do so, in which case it must notify you at least 30 days before termination. BNYM may also terminate the agreement after notifying you if BNYM informs Sibanye-Stillwater that it would like to resign and Sibanye-Stillwater does not appoint a new depositary bank within 90 days.
If any Sibanye-Stillwater ADRs remain outstanding after termination, BNYM will stop registering the transfer of Sibanye-Stillwater ADRs, will stop distributing dividends to Sibanye-Stillwater ADR holders, and will not give any further notices or do anything else under the Deposit Agreement other than:
collect dividends and distributions on the deposited securities, sell rights and other property offered to holders of deposited securities; and deliver ordinary shares and other deposited securities upon cancellation of Sibanye’s ADRs. At any time after four months after termination of the Deposit Agreement, BNYM may sell any remaining deposited securities by public or private sale. After that, BNYM will hold the money it received on the sale, as well as any cash it is holding under the Deposit Agreement for the pro rata benefit of the Sibanye-Stillwater ADR holders that have not surrendered their Sibanye-Stillwater ADRs. It will not invest the money and has no liability for interest. BNYM’s only obligations will be to account for the money and cash. After termination, Sibanye’s only obligations will be with respect to indemnification of, and to pay specified amounts to, BNYM.
| |
Sibanye-Stillwater | Form 20-F 2017 | 280 |
Limitations on Obligations and Liability
The Deposit Agreement expressly limits the obligations of Sibanye-Stillwater and BNYM. It also limits the liability of Sibanye-Stillwater and BNYM. Sibanye-Stillwater and BNYM:
are only obligated to take the actions specifically set forth in the Deposit Agreement without negligence or bad faith;
are not liable if either of them is prevented or delayed by law, any provision of the Sibanye by-laws or circumstances beyond their control from performing their obligations under the Deposit Agreement;
| · | | are not liable if either of them exercises or fails to exercise discretion permitted under the Deposit Agreement; |
| · | | have no obligation to become involved in a lawsuit or proceeding related to the ADRs or the Deposit Agreement on your behalf or on behalf of any other party; and |
| · | | may rely upon any advice of or information from any legal counsel, accountants, any person depositing ordinary shares, any Sibanye ADR holder or any other person whom they believe in good faith is competent to give them that advice or information. |
In the Deposit Agreement, Sibanye and BNYM agree to indemnify each other under specified circumstances.
Requirements For Depositary Actions
Before BNYM will deliver or register the transfer of a Sibanye ADR, make a distribution on a Sibanye ADR, or permit withdrawal of ordinary shares, BNYM may require:
| · | | production of satisfactory proof of the identity of the person presenting ordinary shares for deposit or Sibanye ADRs upon withdrawal, and of the genuineness of any signature; and |
| · | | compliance with regulations BNYM may establish, consistent with the Deposit Agreement, including presentation of transfer documents. |
BNYM may refuse to deliver, transfer, or register transfer of Sibanye ADRs generally when the transfer books of BNYM are closed or at any time if BNYM or Sibanye thinks it advisable to do so.
Your Right To Receive The Ordinary Shares Underlying Your ADRs
You have the right to cancel your Sibanye ADRs and withdraw the underlying ordinary shares at any time, except:
| · | | due to temporary delays caused by BNYM or Sibanye closing its transfer books, the transfer of ordinary shares being blocked in connection with voting at a shareholders’ meeting, or Sibanye paying dividends; |
| · | | when you or other ADR holders seeking to withdraw ordinary shares owe money to pay fees, taxes and similar charges; or |
| · | | when it is necessary to prohibit withdrawals in order to comply with any laws or governmental regulations that apply to Sibanye ADRs or to the withdrawal of ordinary shares or other deposited securities. |
This right of withdrawal may not be limited by any provision of the Deposit Agreement.
Pre-Release of Sibanye ADRs
In certain circumstances, subject to the provisions of the Deposit Agreement, BNYM may deliver Sibanye ADRs before deposit of the underlying ordinary shares. This is called a pre-release of Sibanye ADRs. BNYM may also deliver ordinary shares prior to the receipt and cancellation of pre-released Sibanye ADRs (even if those Sibanye ADRs are cancelled before the pre-release transaction has been closed out). A pre-release is closed out as soon as the underlying ordinary shares are delivered to BNYM. BNYM may receive Sibanye ADRs instead of ordinary shares to close out a pre-release. BNYM may pre-release Sibanye ADRs only under the following conditions: (1) before or at the time of the pre-release, the person to whom the pre-release is being made must represent to BNYM in writing that it or its customer owns the ordinary shares or Sibanye ADRs to be deposited; (2) the pre-release must be fully collateralised with cash or collateral that BNYM considers appropriate; and (3) BNYM must be able to close out the pre-release on not more than five business days’ notice. The pre-release will be subject to whatever indemnities and credit regulations BNYM considers appropriate. In addition, BNYM will limit the number of Sibanye ADRs that may be outstanding at any time as a result of pre-release.
Direct Registration System
In the Deposit Agreement, all parties to the Deposit Agreement acknowledge that the DRS and Profile Modification System (Profile) will apply to uncertificated ADSs upon acceptance thereof to DRS by DTC. DRS is the system administered by DTC pursuant to which the Depositary may register the ownership of uncertificated ADSs, which ownership shall be evidenced by periodic statements sent by the Depositary to the registered holders of uncertificated ADSs. Profile is a required feature of DRS which allows a DTC participant, claiming to act on behalf of a registered holder of ADSs, to direct the Depositary to register a transfer of those ADSs to DTC or its nominee and to deliver those ADSs to the DTC account of that DTC participant without receipt by the Depositary of prior authorisation from the ADS holder to register that transfer.
In connection with and in accordance with the arrangements and procedures relating to DRS/Profile, the parties to the Deposit Agreement understand that the Depositary will not verify, determine or otherwise ascertain that the DTC participant which is claiming to be acting on behalf of an ADS holder in requesting registration of transfer and delivery described in the paragraph above has the actual authority to act on behalf of the ADS holder (notwithstanding any requirements under the Uniform Commercial Code). In the Deposit Agreement, the parties agree that the Depositary’s reliance on and compliance with instructions received by the Depositary through the DRS/Profile System and in accordance with the Deposit Agreement, shall not constitute negligence or bad faith on the part of the Depositary.
| |
Sibanye-Stillwater | Form 20-F 2017 | 281 |
Shareholder Communications; Inspection of Register of Holders of ADSs
The Depositary will make available for your inspection at its office all communications that it receives from us as a holder of deposited securities that Sibanye makes generally available to holders of deposited securities. The Depositary will send you copies of those communications if Sibanye asks it to. You have a right to inspect the register of holders of ADSs, but not for the purpose of contacting those holders about a matter unrelated to our business or the ADSs.
Governing Law
The Deposit Agreement is governed by the law of the State of New York.
South African Exchange Control Limitations affecting Security Holders
The discussion below relates to exchange controls in force as of the date of this annual report. These controls are subject to change at any time without notice. It is not possible to predict whether existing exchange controls will be abolished, continued or amended by the South African government in the future. Investors are urged to consult a professional adviser as to the exchange control implications of their particular investments.
Acquisitions of shares or assets of South African companies by non-South African purchasers solely for a cash consideration equal to the fair value of the shares or assets will generally be permitted by the SARB pursuant to South African Exchange Control Regulations. An acquisition of shares or assets of a South African company by a non-South African purchaser may be refused by the SARB in other circumstances, such as if the consideration for the acquisition is shares in a non-South African company or if the acquisition is financed by a loan from a South African lender. Denial of SARB approval for an acquisition of shares or assets of a South African company may result in the transaction not being able to be completed. Subject to this limitation, there are no restrictions on equity investments in South African companies and a foreign investor may invest freely in the ordinary shares and ADRs of Sibanye.
There are no exchange control restrictions on the remittance in full of dividends declared out of trading profits to non-residents of the CMA by Sibanye, provided the share certificates held by non-resident Sibanye shareholders have been endorsed with the words “non-resident”. The same endorsement, however, will not be applicable to ADRs of Sibanye held by non-resident shareholders.
Under South African Exchange Control Regulations, the ordinary shares and ADRs representing ordinary shares of Sibanye are freely transferable outside South Africa between persons who are not residents of the CMA, provided such transfer is reported to the SARB and, where new share certificates are issued, such certificates are endorsed with the words “non-resident”. The same endorsement, however, will not be applicable to ADRs of Sibanye held by non-resident shareholders. Additionally, where ordinary shares are sold on the JSE on behalf of shareholders of Sibanye who are not residents of the Common Monetary Area, the proceeds of such sales will be freely exchangeable into foreign currency and remittable to them. In such case no share certificates need to be endorsed as the shares on the JSE have been dematerialised.
Taxation
Certain South African Tax Considerations
The discussion in this section sets out the material South African tax consequences of the purchase, ownership and disposition of Sibanye’s ordinary shares or ADSs under current South African law. Changes in the law may alter the tax treatment of Sibanye’s ordinary shares or ADSs, possibly on a retroactive basis.
The following summary is not a comprehensive description of all of the tax considerations that may be relevant to a decision to purchase, own or dispose of Sibanye’s ordinary shares or ADSs and does not cover tax consequences that depend upon your particular tax circumstances. In particular, the following summary addresses tax consequences for holders of ordinary shares or ADSs who are not residents of, or who do not carry on business in, South Africa and who hold ordinary shares or ADSs as capital assets (that is, for investment purposes). For the purposes of the income tax treaty between South Africa and the United States and South African tax law, a United States resident that owns Sibanye ADSs will be treated as the owner of the Sibanye ordinary shares represented by such ADSs. Sibanye recommends that you consult your own tax adviser about the consequences of holding Sibanye’s ordinary shares or ADSs, as applicable, in your particular situation.
Withholding Tax on Dividends
It should be noted that the withholding tax on dividends declared by South African resident companies to non-resident shareholders or non-resident ADS holders was introduced with effect from 1 April 2012 and the percentage was increased on 22 February 2017 from 15% to 20%. Generally, under the terms of the reciprocal tax treaty entered into between South Africa and the United States (the Treaty) the withholding tax on dividends may be reduced to 5% of the gross amount of the dividends if the beneficial owner of the shares is a company holding directly at least 10% of the voting stock of the company paying the dividends and to 15% of the gross amount of the dividends in all other cases, provided certain requirements in terms of the Treaty are met. The reduction of the rate of the withholding tax on dividends in terms of the Treaty is subject to the beneficial owner of the dividends making certain declarations and undertakings and providing same to the company or regulated intermediary making payment of the dividend.
Income Tax and Capital Gains Tax
Non-resident holders of ordinary shares or ADSs should not be subject to income or capital gains tax in South Africa with respect to the disposal
| |
Sibanye-Stillwater | Form 20-F 2017 | 282 |
of those ordinary shares or ADSs unless those ordinary shares or ADSs are attributable to a permanent establishment of the non-resident in South Africa or where the non-resident holds 20% or more of the ordinary shares or ADSs of which 80% or more of the market value of the ordinary shares or ADSs are directly or indirectly derived from immovable property (including prospecting and/or mining rights) located in South Africa.
As Sibanye operates in the mining sector, it is highly probable that 80% or more of the market value of the ordinary shares or ADSs are directly or indirectly derived from immovable property located in South Africa. In the instances where non-resident shareholders hold 20% or more of the ordinary shares or ADSs and dispose of the same, the purchaser of the ordinary shares or ADSs will be obliged to withhold a percentage (between 5% and 10%, depending on the nature of the seller) of the purchase consideration for the ordinary shares or ADSs payable to the non-resident shareholders and pay such amount over to the South African Revenue Service within 14 days where the purchaser is a South African resident or within 28 days where the purchaser is a non-resident. The taxing right of the capital gain could, however, be awarded to the specific jurisdiction of the seller (and not South Africa) depending on the wording and application of the applicable Double Taxation Treaty.
Securities Transfer Tax
No Securities Transfer Tax (STT) is payable in South Africa with respect to the issue of a security.
STT is charged at a rate of 0.25% on the taxable amount of the transfer of every security issued by a company or a close corporation incorporated in South Africa, or a company incorporated outside South Africa but listed on an exchange in South Africa, subject to certain exemptions.
The word “transfer” is broadly defined and includes the transfer, sale, assignment or cession or disposal in any other manner of a security. The cancellation or redemption of a security is also regarded as a transfer unless the company is being liquidated. However, the transfer of a security that does not result in a change in beneficial ownership is not regarded as a transfer.
STT is levied on the taxable amount of a security. The taxable amount of a listed security is the greater of the consideration given for the security declared by the transferee or the closing price of that security. The taxable amount of an unlisted security is the greater of the consideration given for the acquisition of the security or the market value of an unlisted security. In the case of a transfer of a listed security, either the member, the participant or the person to whom the security is transferred is liable for the tax. The tax must be paid by the 14 day of the month following the transfer. The liability for tax with respect to the transfer of listed securities lies with the party facilitating the transfer or the recipient of the security.
Interest withholding tax
Interest withholding tax has been introduced into the South African tax regime with effect from 1 March 2015. Although not specifically applicable to non-resident shareholders or non-resident ADS holders, interest withholding tax will be levied at a rate of 15% on any interest paid for the benefit of any foreign person to the extent that the interest is regarded as being from a source within South Africa. There is, however, a specific exemption from interest withholding tax on any interest incurred on a listed debt (i.e. debt listed on a recognised exchange). Any interest withholding tax may further be reduced by the applicable Double Taxation Treaty.
Davis Tax Committee
The Davis Tax Committee has been established to review the current South African mining tax regime and to consider input from the industry on practical elements not currently taken into account by the mining tax legislation. No update has been provided on the status of the outcome of the Davis Tax Committee’s investigations. This does not currently affect any non-resident shareholders or non-resident ADS holders, although it could have an indirect effect in future depending on the findings of the Davis Tax Committee and the impact thereof on the mining tax regime in South Africa.
US Federal Income Tax Considerations
The following discussion summarises the material US federal income tax consequences of the acquisition, ownership and disposition of ordinary shares and ADRs by a US Holder. As used herein, the term “US Holder” means a beneficial owner of ordinary shares or ADRs that is for US federal income tax purposes:
| · | | a citizen or resident of the United States; |
| · | | a corporation created or organised under the laws of the United States or any State within the United States; |
| · | | an estate the income of which is subject to US federal income tax without regard to its source; or |
| · | | a trust if a court within the United States is able to exercise primary supervision over the administration of the trust and one or more US persons have the authority to control all substantial decisions of the trust, or the trust has validly elected to be treated as a domestic trust for US federal income tax purposes. |
The US federal income tax treatment of a partner in an entity or arrangement treated as a partnership for US federal income tax purposes that holds ordinary shares or ADRs will depend upon the status of the partner and the activities of the partnership. If you are an entity or arrangement treated as a partnership for US federal income tax purposes, you should consult your tax adviser concerning the US federal income tax consequences to you and your partners of the acquisition, ownership and disposition of ordinary shares or ADRs by you.
This summary only applies to US Holders that hold ordinary shares or ADRs as capital assets. This summary is based upon:
| · | | the current federal income tax laws of the United States, including the Internal Revenue Code of 1986, as amended (the Code), its legislative history, and existing and proposed regulations promulgated thereunder; |
| |
Sibanye-Stillwater | Form 20-F 2017 | 283 |
| · | | current US Internal Revenue Service (the IRS) practice and applicable US court decisions; |
| · | | the income tax treaty between the United States and South Africa (the Treaty); and |
| · | | all as of the date hereof and all subject to change at any time, possibly with retroactive effect. |
This summary assumes that the obligations of the Depositary under the Deposit Agreement and any related agreements will be performed in accordance with their terms.
This summary is of a general nature and does not address all US federal income tax consequences that may be relevant to you in light of your particular situation. For example, this summary does not apply to:
| · | | investors that own (directly, indirectly, or by attribution) 5% or more of Sibanye’s stock (by vote or value); |
| · | | investors liable for the alternative minimum tax or the net investment income tax; |
| · | | individual retirement accounts and other tax-deferred accounts; |
| · | | tax-exempt organisations; |
| · | | dealers in securities or currencies; |
| · | | investors that hold ordinary shares or ADRs as part of straddles, hedging transactions or conversion transactions for US federal income tax purposes; |
| · | | persons that have ceased to be US citizens or lawful permanent residents of the United States; |
| · | | investors that hold ordinary shares or ADRs in connection with a trade or business conducted outside the United States; |
| · | | US citizens or lawful permanent residents living abroad; or |
| · | | investors whose functional currency is not the US dollar. |
Sibanye does not believe that it should be treated as, and does not expect to become, a passive foreign investment company (PFIC) for US federal income tax purposes, but Sibanye’s possible status as a PFIC must be determined annually and therefore may be subject to change. If Sibanye were to be treated as a PFIC, US Holders of ordinary shares or ADRs would be required (i) to pay a special US addition to tax on certain distributions and gains on sale and (ii) to pay tax on any gain from the sale of ordinary shares or ADRs at ordinary income (rather than capital gains) rates in addition to paying the special addition to tax on this gain. Additionally, dividends paid by Sibanye would not be eligible for the reduced rate of tax described below under “Taxation of Dividends”. The remainder of this discussion assumes that Sibanye is not a PFIC for US federal income tax purposes. You should consult your own tax advisers regarding the potential application of the PFIC regime.
The summary of US federal income tax consequences set out below is for general information only. You are urged to consult your tax advisers as to the particular tax consequences to you of acquiring, owning and disposing of the ordinary shares or ADRs, including your eligibility for the benefits of the Treaty and the applicability and effect of state, local, non-US and other tax laws and possible changes in tax law.
US Holders of ADRs
For US federal income tax purposes, a US Holder of ADRs generally will be treated as the owner of the corresponding number of underlying ordinary shares held by the Depositary for the ADRs, and references to ordinary shares in the following discussion refer also to ADRs representing the ordinary shares.
Deposits and withdrawals of ordinary shares by US Holders in exchange for ADRs will not result in the realisation of gain or loss for US federal income tax purposes. Your tax basis in withdrawn ordinary shares will be the same as your tax basis in the ADRs surrendered, and your holding period for the ordinary shares will include the holding period of the ADRs.
Taxation of Dividends
Distributions paid out of Sibanye’s current or accumulated earnings and profits (as determined for US federal income tax purposes), before reduction for any South African withholding tax paid by Sibanye with respect thereto, will generally be taxable to you as dividend income, and will not be eligible for the dividends received deduction allowed to corporations. Distributions that exceed Sibanye’s current and accumulated earnings and profits will be treated as a non-taxable return of capital to the extent of your basis in the ordinary shares and thereafter as capital gain. However, we do not maintain calculations of our earnings and profits in accordance with US federal income tax accounting principles. You should therefore assume that any distribution by us with respect to the shares will be reported as ordinary dividend income. You should consult your own tax advisers with respect to the appropriate US federal income tax treatment of any distribution received from us.
Dividends paid by Sibanye generally will be taxable to non-corporate US Holders at the reduced rate normally applicable to long-term capital gains, provided that either (i) Sibanye qualifies for the benefits of the Treaty, or (ii) with respect to dividends paid on the ADRs, the ADRs are considered to be “readily tradable” on the NYSE. You will be eligible for this reduced rate only if you are an individual, and have held the ordinary shares or ADRs for more than 60 days during the 121‑day period beginning 60 days before the ex-dividend date.
For US federal income tax purposes, the amount of any dividend paid in Rand will be included in income in a US dollar amount calculated by reference to the exchange rate in effect on the date the dividends are received by you or the depositary (in the case of ADRs), regardless of whether they are converted into US dollars at that time. If you or the Depositary, as the case may be, convert dividends received in Rand into US dollars on the day they are received, you generally will not be required to recognise foreign currency gain or loss in respect of this dividend
| |
Sibanye-Stillwater | Form 20-F 2017 | 284 |
income.
Effect of South African Withholding Taxes
As discussed above in Taxation—Certain South African Tax Considerations—Withholding Tax on Dividends, under current law, South Africa imposes a withholding tax of 20% on dividends paid by Sibanye. A US Holder will generally be entitled, subject to certain limitations, to a foreign tax credit against its US federal income tax liability, or a deduction in computing its US federal taxable income, for South African income taxes withheld by Sibanye.
US Holders that receive payments subject to this withholding tax will be treated, for US federal income tax purposes, as having received the amount of South African taxes withheld by Sibanye, and as then having paid over the withheld taxes to the South African taxing authorities. As a result of this rule, the amount of dividend income included in gross income for US federal income tax purposes by a US Holder with respect to a payment of dividends may be greater than the amount of cash actually received (or receivable) by the US Holder from Sibanye with respect to the payment.
For purposes of the foreign tax credit limitation, foreign source income is classified in one of two “baskets”, and the credit for foreign taxes on income in any basket is limited to US federal income tax allocable to that income. Dividends paid by Sibanye generally will constitute foreign source income in the “passive income” basket.
The rules governing foreign tax credits are complex. You should consult your tax adviser concerning the foreign tax credit implications of the payment of South African withholding taxes.
Taxation of a Sale or other Disposition
Upon a sale or other disposition of ordinary shares or ADRs, other than an exchange of ADRs for ordinary shares and vice versa, you will generally recognise US source capital gain or loss for US federal income tax purposes equal to the difference between the amount realised and your adjusted tax basis in the ordinary shares or ADRs. Your tax basis in an ordinary share or ADR will generally be its US dollar cost. This capital gain or loss will be long-term capital gain or loss if your holding period in the ordinary shares or ADRs exceeds one year. However, regardless of your actual holding period, any loss may be treated as long-term capital loss to the extent you receive a dividend that qualifies for the reduced rate described above under “Taxation of Dividends” and also exceeds 10% of your basis in the ordinary shares. The deductibility of capital losses is subject to significant limitations.
Foreign currency received on the sale or other disposition of an ordinary share will have a tax basis equal to its US dollar value on the settlement date. Foreign currency that is purchased will generally have a tax basis equal to the US dollar value of the foreign currency on the date of purchase. Any gain or loss recognised on a sale or other disposition of a foreign currency (including its use to purchase ordinary shares or upon exchange for US dollars) will be US source ordinary income or loss.
To the extent you incur Securities Transfer Tax in connection with a transfer or withdrawal of ordinary shares as described under “Certain South African Tax Considerations—Securities Transfer Tax” above, such securities transfer tax will not be a creditable tax for US foreign tax credit purposes.
Backup Withholding and Information Reporting
Payments of dividends and other proceeds with respect to ordinary shares or ADRs by US persons will be reported to you and to the IRS as may be required under applicable regulations. Backup withholding may apply to these payments if you fail to provide an accurate taxpayer identification number or certification of exempt status or fail to comply with applicable certification requirements. Some holders are not subject to backup withholding. You should consult your tax adviser as to your qualification for an exemption from backup withholding and the procedure for obtaining an exemption.
Foreign Financial Asset Reporting
US taxpayers that own certain foreign financial assets, including equity of foreign entities, with an aggregate value that exceeds $50,000 at the end of the taxable year or $75,000 at any time during the taxable year may be required to file an information report with respect to such assets with their tax returns. Sibanye’s ordinary shares and ADRs are expected to constitute foreign financial assets subject to these requirements unless they are held in an account at a financial institution (in which case, the account may be reportable if maintained by a foreign financial institution). You should consult your tax adviser regarding the application of the rules relating to foreign financial asset reporting.
Documents On Display
Sibanye-Stillwater will also file annual and special reports and other information with the SEC. You may read and copy any reports or other information on file at the SEC’s public reference room at the following location:
100 F Street, N.E.
Washington, D.C. 20549
Please call the SEC at 1-800-SEC-0330 for further information on the public reference room. The SEC filings are also available to the public from commercial document retrieval services. Sibanye-Stillwater’s SEC filings may also be obtained electronically via the EDGAR system on the website maintained by the SEC at http://www.sec.gov.
The above information may also be obtained at the registered office of Sibanye-Stillwater and can be accessed at http://www.sibanyegold.co.za.
| |
Sibanye-Stillwater | Form 20-F 2017 | 285 |
Subsidiary Information
Not applicable.
Refining and Marketing
Sibanye-Stillwater has appointed Rand Refinery Proprietary Limited (Rand Refinery) to refine all of Sibanye-Stillwater’s South African-produced gold. Rand Refinery is a private company in which Sibanye-Stillwater holds a 33.1% interest, with the remaining interests held by other South African gold producers. Since 1 October 2004, up to the Spin-off date, Gold Fields’ treasury department arranged the sale of all the gold production from Sibanye-Stillwater’s operations. As from the Spin-off, Rand Refinery advises Sibanye-Stillwater’s department of treasury (Treasury) on a daily basis of the amount of gold available for sale. Treasury, then sells the gold at a price benchmarked against the London afternoon fixing price. Two business days after the sale of gold, Sibanye-Stillwater deposits an amount in US dollars equal to the value of the gold at the London afternoon fixing price into Rand Refinery’s nominated US dollar account. Rand Refinery deducts refining charges payable by Sibanye-Stillwater relating to such amount of gold and deposits the balance of the proceeds into the nominated US dollar account of Sibanye.
JSE CORPORATE GOVERNANCE PRACTICES COMPARED WITH NYSE LISTING STANDARDS
Sibanye-Stillwater’s corporate governance practices are regulated by the JSE Listings Requirements. The following is a summary of the significant ways in which South Africa’s corporate governance standards and Sibanye-Stillwater’s corporate governance practices differ from those followed by domestic companies under the NYSE Listing Standards.
The NYSE Listing Standards require that the non-management directors of US listed companies meet at regularly scheduled executive sessions without management. The JSE Listing Requirements do not require such meetings of listed company non-executive directors. Sibanye-Stillwater’s non-management directors meet regularly without management.
The NYSE Listing Standards require US listed companies to have a nominating/corporate governance committee composed entirely of independent directors. The JSE Listings Requirements do not require the appointment of such a committee, however if such a committee is appointed it must stipulate that all members of this committee must be non-executive directors, the majority of whom must be independent and the chair must be the chair of the Board, if independent, or must be the lead independent director, if the Board chair is not independent. Sibanye-Stillwater has a Nominating and Governance Committee which is currently comprised of five non-executive directors, all of whom are independent under the JSE Listings Requirements and chaired by the Chairman of Sibanye-Stillwater, as required by the JSE Listings Requirements.
The NYSE Listing Standards require US listed companies to have a compensation committee composed entirely of independent directors. The JSE Listings Requirements merely require the appointment of such a committee. Sibanye-Stillwater has appointed a Remunerations (or Compensation) Committee, currently comprised of five board members, all of whom are independent under the JSE Listings Requirements.
The NYSE Listings Standards require US listed companies to have an audit committee composed entirely of independent directors. The Companies Act requires that the Audit Committee be approved by shareholders on an annual basis at a company’s AGM. The Companies Act and the JSE Listings Requirements also require an audit committee composed entirely of independent directors. Sibanye-Stillwater has appointed an Audit Committee, currently comprised of four board members, all of whom are independent non-executive, as defined under the Companies Act and the JSE Listings Requirements. One of these non-executive directors is also a non-executive director of Gold Fields, the former parent of Sibanye-Stillwater; however, Sibanye-Stillwater believes he satisfies the requirements of Rule 10A-3 under the US Securities Exchange Act of 1934 and applicable NYSE Listing Standards.
| |
Sibanye-Stillwater | Form 20-F 2017 | 286 |
| (a) | | Disclosure Controls and Procedures |
Sibanye-Stillwater has carried out an evaluation, under the supervision and with the participation of management, including the CEO and CFO of Sibanye-Stillwater, of the effectiveness of the design and operation of Sibanye-Stillwater’s disclosure controls and procedures (as defined in Exchange Act Rule 13a 15(e)) as of the end of the period covered by this annual report. Based upon that evaluation, Sibanye-Stillwater’s CEO and CFO concluded that, as of 31 December 2017, Sibanye-Stillwater’s disclosure controls and procedures were effective.
| (b) | | Management’s Report on Internal Control over Financial Reporting |
Sibanye-Stillwater’s management is responsible for establishing and maintaining adequate internal control over financial reporting. The Securities Exchange Act of 1934 defines internal control over financial reporting in Rule 13a 15(f) and 15d 15(f) as a process designed by, or under the supervision of, the company’s principal executive and principal financial officers and effected by the company’s board of directors, management and other personnel, to provide reasonable assurance regarding the reliability of financial reporting and the preparation of financial statements for external purposes in accordance with generally accepted accounting principles and includes those policies and procedures that:
| · | | pertain to the maintenance of records that in reasonable detail accurately and fairly reflect the transactions and dispositions of the assets of the company; |
| · | | provide reasonable assurance that transactions are recorded as necessary to permit preparation of financial statements in accordance with generally accepted accounting principles, and that receipts and expenditures of the company are being made only in accordance with authorisations of management and directors of the company; and |
| · | | provide reasonable assurance regarding prevention or timely detection of unauthorised acquisition, use or disposition of the company’s assets that could have a material effect on the consolidated financial statements. |
Because of its inherent limitations, internal control over financial reporting may not prevent or detect misstatements. Also, projections of any evaluation of effectiveness to future periods are subject to risk that controls may become inadequate because of changes in conditions, or that the degree of compliance with the policies or procedures may deteriorate.
Sibanye-Stillwater acquired Stillwater in 2017. Management has excluded from its assessment of internal control over financial reporting as of 31 December 2017, Stillwater’s internal control over financial reporting associated with approximately 19% of consolidated total assets and approximately 20% of consolidated revenue, included in the consolidated financial statements as of and for the year ended 31 December 2017.
Sibanye-Stillwater’s management assessed the effectiveness of its internal control over financial reporting as of 31 December 2017. In making this assessment, Sibanye-Stillwater’s management used the criteria set forth in Internal Control -Integrated Framework (2013) issued by the Committee of Sponsoring Organizations of the Treadway Commission (COSO). Based upon its assessment, Sibanye-Stillwater’s management concluded that, as of 31 December 2017, its internal control over financial reporting is effective based upon those criteria.
KPMG Inc., an independent registered public accounting firm that audited the consolidated financial statements included in this annual report on Form 20-F, has issued an attestation report on the effectiveness of Sibanye-Stillwater’s internal control over financial reporting as of 31 December 2017.
| (c) | | Attestation Report of the Registered Public Accounting Firm |
See Annual Financial Report—Accountability—Report of independent registered public accounting firm.
| (d) | | Changes in Internal Control Over Financial Reporting |
There has been no change in Sibanye-Stillwater’s internal control over financial reporting that occurred during fiscal 2017 that has materially affected, or is reasonably likely to materially affect, Sibanye-Stillwater’s internal control over financial reporting.
| |
Sibanye-Stillwater | Form 20-F 2017 | 287 |
The following instruments and documents are included as Exhibits to this annual report.
| | |
No. | | Exhibit |
1.1 | | Memorandum of Incorporation of Sibanye-Stillwater.1 |
2.1 | | Form of Deposit Agreement among Sibanye-Stillwater, BNYM, as depositary, and the owners and beneficial owners from time to time of ADRs.2 |
2.2 | | Form of ADR.2 |
2.3 | | The Sibanye 2013 Share Plan, adopted 21 November 2012.1 |
2.4 | | Trust Deed among Orogen, as issuer; Gold Fields, GFIMSA, GFO and GFH, as guarantors; and Citicorp Trustee Company Limited, as trustee, dated 7 October 2010 in relation to the Notes.1 |
4.1 | | R4.5 billion term and revolving credit facilities agreement between Bank of China Limited Johannesburg Branch, FirstRand Bank, ABSA Bank Limited, J.P. Morgan Chase Bank, N.A., Johannesburg Branch, Standard Bank, Nedbank, the Financial Institutions listed in Schedule 1, Opiconsivia Trading 305 (RF) Proprietary Limited and Sibanye-Stillwater dated 10 December 2013.3 |
4.2 | | First Addendum to the R4.5 billion term and revolving credit facilities agreement between Bank of China Limited Johannesburg Branch, FirstRand Bank, ABSA Bank Limited, J.P. Morgan Chase Bank, N.A., Johannesburg Branch, Standard Bank, Nedbank, the Financial Institutions listed in Schedule 1, Opiconsivia Trading 305 (RF) Proprietary Limited and Sibanye-Stillwater dated 13 March 2014.3 |
4.3 | | Second Addendum to the R4.5 billion term and revolving credit facilities agreement between Bank of China Limited Johannesburg Branch, FirstRand Bank, ABSA Bank Limited, J.P. Morgan Chase Bank, N.A., Johannesburg Branch, Standard Bank, Nedbank, the Financial Institutions listed in Schedule 1, Opiconsivia Trading 305 (RF) Proprietary Limited and Sibanye-Stillwater dated 12 May 2014.4 |
4.4 | | Third Addendum to the R4.5 billion term and revolving credit facilities agreement between Bank of China Limited Johannesburg Branch, FirstRand Bank, ABSA Bank Limited, J.P. Morgan Chase Bank, N.A., Johannesburg Branch, Standard Bank, Nedbank, the Financial Institutions listed in Schedule 1, Opiconsivia Trading 305 (RF) Proprietary Limited and Sibanye-Stillwater dated 22 July 2014.4 |
4.5 | | Fourth Addendum to the R4.5 billion term and revolving credit facilities agreement between Bank of China Limited Johannesburg Branch, FirstRand Bank, ABSA Bank Limited, J.P. Morgan Chase Bank, N.A., Johannesburg Branch, Standard Bank, Nedbank, the Financial Institutions listed in Schedule 1, Opiconsivia Trading 305 (RF) Proprietary Limited and Sibanye-Stillwater dated 14 August 2014.4 |
4.6 | | Fifth Addendum to the R4.5 billion term and revolving credit facilities agreement between Bank of China Limited Johannesburg Branch, FirstRand Bank, ABSA Bank Limited, J.P. Morgan Chase Bank, N.A., Johannesburg Branch, Standard Bank, Nedbank, the Financial Institutions listed in Schedule 1, Opiconsivia Trading 305 (RF) Proprietary Limited and Sibanye-Stillwater dated 6 October 2014.4 |
4.7 | | Amended and Restatement Agreement of the R4.5 billion term and revolving credit facilities agreement between Bank of China Limited Johannesburg Branch, FirstRand Bank, ABSA Bank Limited, J.P. Morgan Chase Bank, N.A., Johannesburg Branch, Standard Bank, Nedbank, the Financial Institutions listed in Schedule 1, Opiconsivia Trading 305 (RF) Proprietary Limited and Sibanye-Stillwater dated 6 October 2015.5 |
4.8 | | Cession and Pledge in Security by Sibanye Gold Limited (as Pledgor) in favor of Opiconsivia Trading 305 Proprietary Limited (as Debt Guarantor), dated 22 August 2013.3 |
4.9 | | Addendum to the Cession and Pledge in Security by Sibanye Gold Limited (as Pledgor) in favor of Opiconsivia Trading 305 Proprietary Limited (as Debt Guarantor), dated 10 December 2013.3 |
4.10 | | Cession in Security by Sibanye Gold Limited (as Pledgor) in favor of Opiconsivia Trading 305 Proprietary Limited (as Debt Guarantor), dated 22 August 2013.3 |
4.11 | | Cession in Security by Sibanye Gold Limited (as Pledgor) in favor of Opiconsivia Trading 305 Proprietary Limited (as Debt Guarantor), dated 22 October 2013.3 |
4.12 | | Cession in Security by Sibanye Gold Limited (as Pledgor) in favor of Opiconsivia Trading 305 Proprietary Limited (as Debt Guarantor), dated 15 August 2014.4 |
4.13 | | Notorial General Bond by Sibanye Gold Limited in favor of Opiconsivia Trading 305 Proprietary Limited (as Debt Guarantor), registered 24 October 2013.3 |
4.14 | | Merger Agreement between Sibanye-Stillwater, Gold One International Limited, and Newshelf 1114 Proprietary Limited dated 20 August 2013.3 |
4.15 | | First Addendum to the Merger Agreement between Sibanye-Stillwater, Gold One International Limited, and Newshelf 1114 Proprietary Limited dated 26 September 2013.3 |
4.16 | | Second Addendum to the Merger Agreement between Sibanye-Stillwater, Gold One International Limited, and Newshelf 1114 Proprietary Limited dated 17 February 2014.3 |
4.17 | | Third Addendum to the Merger Agreement between Sibanye-Stillwater, Gold One International Limited, and Newshelf 1114 Proprietary Limited dated 24 March 2014.3 |
4.18 | | Fourth Addendum to the Merger Agreement between Sibanye-Stillwater, Gold One International Limited, and Newshelf 1114 Proprietary Limited dated 30 April 2014.4 |
4.19 | | Fifth Addendum to the Merger Agreement between Sibanye-Stillwater, Gold One International Limited, and Newshelf 1114 Proprietary Limited dated 6 May 2014.4 |
4.20 | | Sixth Addendum to the Merger Agreement between Sibanye-Stillwater, Gold One International Limited, and Newshelf 1114 Proprietary Limited dated 15 May 2014.4 |
4.21 | | Indemnity Agreement among Orogen, Gold Fields, GFO, GFH and Sibanye-Stillwater, in respect of Sibanye-Stillwater’s obligations under the Notes, dated 20 December 2012.1 |
| |
Sibanye-Stillwater | Form 20-F 2017 | 288 |
| | |
No. | | Exhibit |
4.22 | | Cession in Security Agreement among Sibanye-Stillwater, ABSA Bank Limited, Nedbank, Standard Bank, FirstRand Bank and JP Morgan Chase Bank, N.A., Johannesburg Branch, dated 20 December 2012.1 |
4.23 | | Agreement between Neal Froneman and Sibanye-Stillwater, dated 7 December 2012.1 |
4.24 | | Agreement between Charl Keyter and Sibanye-Stillwater, dated 7 December 2012.1 |
4.25 | | Term Loan Facility Agreement between SGEO (previously Southgold Exploration Proprietary Limited), the Financial Institutions listed in Schedule 1, Credit Suisse AG, Standard Chartered Bank and Purple Rain Security SPV (RF) Proprietary Limited, dated 17 April 2014.4 |
4.26 | | First Amendment to the Term Loan Facility Agreement between SGEO (previously Southgold Exploration Proprietary Limited), the Financial Institutions listed in Schedule 1, Credit Suisse AG, Standard Chartered Bank and Purple Rain Security SPV (RF) Proprietary Limited, dated 26 June 2014.4 |
4.27 | | Second Amendment to the Term Loan Facility Agreement between SGEO (previously Southgold Exploration Proprietary Limited), the Financial Institutions listed in Schedule 1, Credit Suisse AG, Standard Chartered Bank and Purple Rain Security SPV (RF) Proprietary Limited, dated 1 July 2014.4 |
4.28 | | Third Amendment to the Term Loan Facility Agreement between SGEO (previously Southgold Exploration Proprietary Limited), the Financial Institutions listed in Schedule 1, Credit Suisse AG, Standard Chartered Bank and Purple Rain Security SPV (RF) Proprietary Limited, dated 8 July 2014.4 |
4.29 | | Cession and Pledge in Security amongst Witwatersrand Consolidated Gold Resources Limited, K2013164354 Proprietary Limited and Purple Rain Security SPV (RF) Proprietary Limited, dated 2 April 2014.4 |
4.30 | | Cession in Security by SGEO (previously Southgold Exploration Proprietary Limited) in favour of Purple Rain Security SPV (RF) Proprietary Limited, dated 2 April 2014.4 |
4.31 | | Sale and Purchase Agreement between Rustenburg Platinum Mines Limited, Sibanye Rustenburg Platinum Mines Proprietary Limited and Sibanye Gold Limited, signed on 8 September 2015.5 |
4.32 | | Implementation Agreement between Sibanye Gold Limited and Sibanye Platinum Bermuda Proprietary Limited and Aquarius Platinum Limited, signed on 6 October 2015.5 |
4.33 | | Revolving Facility Agreement between Sibanye Gold Limited, Bank of America Merrill Lynch International Limited and HSBC Bank plc, dated 24 August 2015.5 |
4.34 | | $350 million Bridge Facility Agreement between Sibanye Gold Limited and HSBC Bank plc, dated 5 October 2015.5 |
4.35 | | Revolving Credit Facility Agreement between ABSA Bank Limited (acting through its Corporate and Investment Banking Division), Bank of China Limited, Johannesburg Branch, FirstRand Bank Limited (acting through its Rand Merchant Bank Division), Nedbank Limited, The Standard Bank of South Africa Limited and Sibanye-Stillwater, dated 15 November 2016.6 |
4.36 | | US$2.65 billion Acquisition Bridge Facilities Agreement with Citibank, HSBC ABSA Bank Limited (acting through its Corporate and Investment Banking Division), Barclays Bank PLC, Banca IMI S.P.A., London branch, Credit Suisse International, FirstRand Bank Limited (acting through its Rand Merchant Bank Division), J.P. Morgan Limited, Mizuho Bank Europe N.V., Morgan Stanley Bank International Limited, Royal Bank of Canada, Societe Generale, the Bank of Nova Scotia, The Bank of Tokyo-Mitsubishi UFJ, Ltd., The Standard Bank of South Africa Limited, BNP Paribas, Nedbank Limited, London Branch and Sibanye-Stillwater, dated 9 December 2016. 6 |
4.37 | | Merger Agreement between Sibanye-Stillwater, Thor US Holdco Inc., Thor Mergeco Inc. and Stillwater Mining Company, dated 9 December 2016. 6 |
4.38 | | Indenture, with respect to 6.125% Senior Notes due 2022 and 7.125% Senior Notes due 2025, among Stillwater Mining Company, as issuer, Sibanye Gold Limited as guarantor, the other guarantors party thereto and The Bank Of New York Mellon, London Branch, as Trustee, dated 27 June 2017. |
4.39 | | Trust Deed, with respect to USD 450,000,000 1.875% Guaranteed Convertible Bonds due 2023, among Sibanye Gold Limited, as issuer, Stillwater Mining Company and Kroondal Operations Proprietary Limited, as guarantors, and BNY Mellon Corporate Trustee Services Limited, as Trustee, dated 26 September 2018. |
4.40 | | Supplemental Trust Deed, with respect to USD 450,000,000 1.875% Guaranteed Convertible Bonds due 2023, among Sibanye Gold Limited, as issuer, Stillwater Mining Company and Kroondal Operations Proprietary Limited, as guarantors, and BNY Mellon Corporate Trustee Services Limited, as Trustee, dated 28 March 2018. |
4.41 | | Co-operation Agreement between Sibanye and Lonmin plc, dated 14 December 2017. |
8.1 | | List of subsidiaries of the registrant. |
12.1 | | Certification of Chief Executive Officer. |
12.2 | | Certification of Chief Financial Officer. |
13.1 | | Certification of Chief Executive Officer. |
13.2 | | Certification of Chief Financial Officer. |
16 | | Mine Safety Disclosures. |
1 Filed as an exhibit to the registration statement on Form 20-F (File No. 001-35785), filed by Sibanye-Stillwater with the Securities and Exchange Commission on 16 January 2013.
2 Filed as an exhibit to the registration statement on Form 20-F (File No. 001-35785), filed by Sibanye-Stillwater with the Securities and Exchange Commission on 1 February 2013.
3 Filed as an exhibit to the annual report on Form 20-F (File No. 001-35785), filed by Sibanye-Stillwater with the Securities and Exchange Commission on 29 April 2014.
4 Filed as an exhibit to the annual report on Form 20-F (File No. 001-35785), filed by Sibanye-Stillwater with the Securities and Exchange Commission on 24 March 2015.
5 Filed as an exhibit to the annual report on Form 20-F (File No. 001-35785), filed by Sibanye-Stillwater with the Securities and Exchange Commission on 21 March 2016.
6 Filed as an exhibit to the annual report on Form 20-F (File No. 001-35785), filed by Sibanye-Stillwater with the Securities and Exchange Commission on 6 April 2017.
| |
Sibanye-Stillwater | Form 20-F 2017 | 289 |
The registrant hereby certifies that it meets all of the requirements for filing on Form 20 F and that it has duly caused and authorised the undersigned to sign this annual report on its behalf.
| | | |
SIBANYE GOLD LIMITED | | |
| | |
/s/ Charl Keyter | | |
Name: | Charl Keyter | | |
Title: | Chief Financial Officer | | |
Date: | 30 March 2018 | | |
| |
Sibanye-Stillwater | Form 20-F 2017 | 290 |