Exhibit (c)(iii)
PRELIMINARY DRAFT
SUBJECT TO SUBSTANTIAL REVISION
Project Hawkeye

Presentation to the Special Committee of the Board of Directors
March 7, 2022
PRELIMINARY DRAFT
SUBJECT TO SUBSTANTIAL REVISION
Table of Contents
| I. | Situation Overview | 3 |
| II. | Overview of Projections | 12 |
| III. | Preliminary Financial Analysis Summary | 17 |
| Appendices | ||
| A. | Preliminary Discounted Cash Flow Analysis | 21 |
| B. | Preliminary Selected Publicly Traded Companies Analysis | 26 |
| C. | Preliminary Selected Precedent Transactions Analysis | 35 |
| D. | Other Information | 40 |
[ 1 ]
PRELIMINARY DRAFT
SUBJECT TO SUBSTANTIAL REVISION
Disclaimer
This presentation has been prepared by Moelis & Company LLC (“Moelis”) for exclusive use by the Special Committee of the Board of Directors of Hawkeye in considering the transaction described herein based on information provided by Hawkeye and upon information from third party sources. Moelis has not assumed any responsibility for independently verifying the accuracy of such information, and disclaims any liability with respect to the information herein. In this presentation, Moelis, at Hawkeye’s direction, has used certain projections, forecasts or other forward-looking statements with respect to Hawkeye and/or other parties involved in the transaction which were provided to Moelis by Hawkeye and / or such other parties and which Moelis has assumed, at Hawkeye’s direction, were prepared based on the best available estimates and judgments of the management of Hawkeye and/or such other parties as to the future performance of Hawkeye and/or such other parties. This presentation is provided as of the date hereof and Moelis assumes no obligation to update it or correct any information herein.
This presentation is solely for informational purposes. This presentation is not intended to provide the sole basis for any decision on any transaction and is not a recommendation with respect to any transaction. The recipient should make its own independent business decision based on all other information, advice and the recipient’s own judgment. This presentation is not an offer to sell or a solicitation of an offer to buy any business, security, option, commodity, future, loan or currency. It is not a commitment to underwrite any security, to loan any funds or to make any investment. Moelis does not offer tax, accounting, actuarial or legal advice. Absent Moelis’ prior written consent, this material, whether in whole or in part, may not be copied, photocopied, or duplicated in any form by any means, or redistributed.
Moelis and its related investment banking entities provide mergers and acquisitions, recapitalization, restructuring, corporate finance and other financial advisory services to clients. Certain affiliates of Moelis are engaged in asset management and other activities for their own account and otherwise. Personnel of Moelis or such affiliates may make statements or provide advice that is contrary to information included in this material. The proprietary interests of Moelis or its affiliates may conflict with the recipient’s or Hawkeye’s interests. In addition, Moelis and its affiliates and their personnel may from time to time have positions in or effect transactions in securities referred to in this material (or derivatives of such securities), or serve as a director of companies referred to in this presentation. Moelis and its affiliates may have advised, may seek to advise and may in the future advise or invest in companies referred to in this presentation.
[ 2 ]
PRELIMINARY DRAFT
SUBJECT TO SUBSTANTIAL REVISION
I. Situation Overview
PRELIMINARY DRAFT
SUBJECT TO SUBSTANTIAL REVISION
Timeline of Events
January 2022 | ■ On January 8, Sparrow Capital Partners (“Sparrow”) submitted a non-binding indication of interest (“Indicative Offer”) to acquire all of the common shares of Hawkeye at an offer price of $8 per share ■ On January 10, 2022, at the request of the Special Committee, members of Hawkeye Management reached out to Moelis asking them to meet with the Special Committee later that week to discuss working with the Special Committee on a new mandate ■ Moelis met with the Special Committee on January 14 and was subsequently asked to represent the Special Committee as its financial advisor in connection with evaluating the Sparrow Indicative Offer and other potential strategic alternatives ■ On January 24, the Special Committee held a meeting with Davis Polk and Moelis to discuss the Indicative Offer and next steps; Moelis provided an update on its diligence completed to date and key requests and potential interest from third parties. The Special Committee directed Management to provide Moelis with diligence information — On January 25, the Special Committee sent Sparrow a letter acknowledging receipt of the Indicative Offer and noting that they are reviewing the Indicative Offer with their advisors ■ In late January, at the request of the Special Committee, Moelis reached out to Sparrow to discuss the Indicative Offer and during this call Sparrow verbally provided additional details about its proposal including details around its plans for the Company to sell Pelican to Talon in connection with its Indicative Offer |
February 2022 | ■ On February 10, Talon sent Moelis a list of business diligence requests ■ On February 15, the Company and Sparrow and the Company and Talon separately executed NDAs ■ On February 15, the Special Committee held a meeting with Davis Polk and Moelis, during which Moelis provided an update on its diligence progress, discussed Talon’s diligence requests and process next steps. The Committee directed Management and Moelis to provide responses to most of the Talon requests, but not to provide certain commercially sensitive information ■ On February 16, Sparrow requested permission to begin discussions with certain debt financing providers, including JP Morgan, Deutsche Bank and Credit Suisse. ■ On February 19, the Special Committee decided to grant Sparrow permission to discuss financing with Deutsche Bank and Credit Suisse. Due to a desire to protect the Company’s existing credit relationship with JP Morgan, the Special Committee did not give Sparrow permission to discuss financing with JP Morgan. The Special Committee’s consent subject to the lenders establishing internal trees to avoid precluding lenders from working with any other potential buyer or Hawkeye. ■ Through the week of February 21, Moelis provided Talon with initial responses to their diligence requests. At Sparrow’s request, Moelis also shared these files with Sparrow ■ On February 21, Latham & Watkins (counsel to Sparrow) sent Davis Polk a legal diligence request list ■ On February 23, Sparrow submitted a diligence request list from its financial advisor, PwC, to Moelis and also requested a call to discuss Pelican carve-out considerations ■ On February 24, Latham & Watkins held a call with Davis Polk, during which Latham & Watkins raised the possibility of a sale of Pelican to Talon ahead of the closing of the acquisition of the entire Company ■ On February 28, the Special Committee held a meeting with Davis Polk and Moelis to review process and next steps. A representative of Viacom contacted Moelis to express their interest in a potential acquisition of certain Hawkeye assets, including Pelican |
[ 4 ]
PRELIMINARY DRAFT
SUBJECT TO SUBSTANTIAL REVISION
Timeline of Events (cont’d)
| ■ | On March 1, Talon introduced KPMG to Moelis as an advisor assisting Talon with its evaluation of Pelican. KPMG sent Moelis a data request list. Davis Polk held a call with Talon’s legal counsel, Hogan Lovells, to discuss the potential structure of a Talon transaction | ||
| ■ | On March 2, the Special Committee held a meeting with Davis Polk and Moelis to discuss several process updates, including potential interest from third parties in certain Hawkeye assets, including Pelican; the Special Committee instructed Moelis to provide Viacom with an NDA and information to assist in their diligence of Pelican. Also on March 2, Talon shared certain diligence information on their radio stations in Puerto Rico. Talon also shared follow up requests based on their review of diligence information provided. Moelis held a call with KPMG to discuss their data requests. Moelis held a call with Sparrow to discuss transaction structure. | ||
| March 2022 | ■ | On March 3, Sparrow called Moelis to discuss transaction structure and informed Moelis that it was no longer considering the transaction structure in which Hawkeye would sell Pelican on an expedited schedule, and that Sparrow was reverting to the structure originally proposed in its January 8 Indicative Offer | |
| ■ | On March 4, the Special Committee held a meeting with Davis Polk, Moelis and the Company’s management team during which the Company’s management team presented its latest financial projections. | ||
| — | Management subsequently was excused from the meeting and thereafter the Special Committee, Davis Polk and Moelis also discussed the projections, several process updates and strategy | ||
| — | The Special Committee directed management to assume cost rationalization initiatives in the forecast period, and management shared a revised forecast with the Special Committee reflecting this requested change | ||
[ 5 ]
PRELIMINARY DRAFT
SUBJECT TO SUBSTANTIAL REVISION
Summary of Moelis Work
| ■ | January [10], 2022: Moelis was notified in confidence by Hawkeye Management that the Special Committee was going to hire a financial advisor in connection with a review of strategic alternatives. Moelis was asked to prepare a pitch to the Special Committee the following week. | |
| ■ | January 14, 2022: Moelis presented a pitch to the Special Committee, including Moelis’ perspectives on potential strategic alternatives. Moelis sent the Special Committee a disclosure letter outlining its relationships with certain parties that could be involved in a potential transaction; shortly thereafter, the Special Committee verbally engaged Moelis as a financial advisor and informed Moelis that Sparrow had made a proposal to take the Company private | |
| ■ | January 24, 2022: Moelis, David Polk and the Special Committee held a meeting, during which Moelis presented an overview of key work streams (including Moelis’ diligence requests), key process deliverables, select strategic alternatives and the appropriate response to Sparrow | |
| ■ | February 4, 2022: Management began providing financial information to Moelis. Moelis sent an email update to the Special Committee on the progress of Moelis’ diligence | |
| ■ | February 6, 2022: Moelis sent initial diligence request list and questions to the Company’s CFO | |
| ■ | February 7, 2022: Moelis held a business and financial diligence call with the Company’s CFO | |
| ■ | February 10, 2022: Moelis held a business and financial diligence call with the Company’s CFO Moelis sent an email update to the Special Committee on the financial forecast, Talon diligence and next steps | |
| ■ | February 13, 2022: The Company’s CFO sent Moelis a summary of financial projections | |
| ■ | February 14, 2022: Moelis held a business and financial diligence call with the Company’s CFO; following the call, the Company’s CFO sent Moelis an updated set of projections. | |
| ■ | February 15, 2022: Moelis held a business and financial diligence call with the Company’s CFO | |
| ■ | February 17, 2022: Moelis sent an updated list of outstanding data requests and diligence questions to the Company’s CFO | |
| ■ | February 18, 2022: The Company’s CFO shared updated financial information with Moelis. Moelis sent an email update to the Special Committee on Sparrow’s request to speak with financing sources | |
| ■ | February 22, 2022: Moelis held a financial diligence call with the Company’s CFO, specifically focused on forecasted cash flow items. Moelis shared initial responses to Talon’s diligence requests lists. | |
| ■ | February 23, 2022: The Company’s CFO shared additional financial information with Moelis. | |
| ■ | February 24, 2022: Moelis sent an email update to the Special Committee on diligence with Talon and Sparrow, reverse diligence on certain Talon radio station assets, and a proposed schedule for calls the following week. Moelis held a financial diligence call with the Company’s CFO | |
| ■ | February 28, 2022: Moelis, Davis Polk and the Special Committee held a meeting, during which Moelis presented a process update. Moelis held a financial diligence call with the Company’s CFO. A representative of Viacom contacted Moelis to express their interest in a potential acquisition of certain Hawkeye assets, including Pelican | |
| ■ | March 1, 2022: Moelis held a financial diligence call with the Company’s CFO | |
| ■ | March 2, 2022: Moelis, Davis Polk and the Special Committee held a meeting, during which Moelis presented a process update. Moelis and the Special Committee executed an engagement letter. Moelis held a financial diligence call with the Company’s CFO. | |
| ■ | March 4, 2022: Following management’s discussion of its financial projections with the Special Committee, Moelis, Davis Polk and the Special Committee held a meeting during which Moelis presented a process update. Moelis held a financial diligence call with the Company’s CFO |
[ 6 ]
PRELIMINARY DRAFT
SUBJECT TO SUBSTANTIAL REVISION
Basis of Presentation and Limitation to Analyses
The commentary below summarizes the information received by Moelis to date from
the Company and the primary limitations to our analyses which inform the basis of our presentation
INFORMATION RECEIVED FROM THE COMPANY
| ■ | Indicative Proposal from Sparrow to acquire Hawkeye for $8 per share | ||
| ■ | Management’s financial projections (the “LRP”) covering 2022E – 2026E as well as a Management extrapolation (the “Extrapolation”) covering 2027E-2031E. The LRP included revenue, expense and cash flow detail for Pelican and Networks separately | ||
| — | Moelis held multiple discussions with Management regarding the LRP and the Extrapolation | ||
| — | The Company’s CFO has been willing to speak with Moelis to answer our questions on a regular basis; Moelis has engaged in frequent communication with the Company’s CFO over the last several weeks | ||
| — | Moelis also received detailed forecast KPIs for both the Networks and Pelican businesses | ||
| ■ | Key business diligence information, including but not limited to a schedule of Pelican content releases and KPI detail | ||
| ■ | Company net debt, cash, shares outstanding (including detailed options schedule) as of 12/31/2021 | ||
GENERAL LIMITATIONS AND AREAS FOR ADDITIONAL DILIGENCE
| ■ | Contact with management has been primarily with the Company’s CEO and CFO; Moelis has not had any conversations with any other members of management of Networks and only limited interaction with the management team at Pelican | |
| ■ | Treatment of tax attributes (e.g. NOLs) and projected tax rate are preliminary and need further refinement | |
| ■ | Limited discussions on structure and the potential tax implications of various potential transactions | |
| ■ | No additional due diligence materials other than those noted above |
[ 7 ]
PRELIMINARY DRAFT
SUBJECT TO SUBSTANTIAL REVISION
Analysis at Various Prices
Sparrow has submitted an initial indication of interest regarding an acquisition of Hawkeye for $8 per share
SUMMARY PREMIA AND IMPLIED TEV AT VARIOUS PRICES
| ($ in millions; except per share data) | Current Price (as of 03/04/22) | Illustrative Offer Price | |||||
| Share Price | $5.04 | $8.00 | |||||
| % Premium to Current | - | 59% | |||||
| Recent Statistics | |||||||
| 52 Week High (03/12/21) | $14.44 | (65%) | (45%) | ||||
| 52 Week Low (02/24/22) | 4.96 | 2% | 61% | ||||
| 10-Day VWAP | 5.41 | (7%) | 48% | ||||
| 20-Day VWAP | 5.80 | (13%) | 38% | ||||
| 30-Day VWAP | 6.01 | (16%) | 33% | ||||
| 60-Day VWAP | 6.66 | (24%) | 20% | ||||
| 90-Day VWAP | 7.75 | (35%) | 3% | ||||
| 180-Day VWAP | 9.91 | (49%) | (19%) | ||||
| 270-Day VWAP | 10.74 | (53%) | (25%) | ||||
| 365-Day VWAP | 10.56 | (52%) | (24%) | ||||
| Diluted Shares Out. (mm) | 40.332 | 40.332 | |||||
| Implied Market Capitalization | $203 | $323 | |||||
| Plus: Net Debt & Other (as of 12/31/21) | 190 | 190 | |||||
| Implied Enterprise Value | $394 | $513 |
| Note: | 52 Week High and Low based on intraday share prices, diluted shares outstanding includes Class A, Class B shares and the impact of options calculated using the Treasury Stock Method | |
| Source: | Company information, Capital IQ as of 03/04/22 |
[ 8 ]
PRELIMINARY DRAFT
SUBJECT TO SUBSTANTIAL REVISION
Sparrow Bid Summary
Sparrow Capital Partners L.P. (“Sparrow”) submitted an Initial Indication of Interest (the “Indicative Offer”) on January 8
| Purchase Price per Share | ■ $8.00 per share (all cash); Sparrow referenced the below premia in their letter: — 15.3% premium to Hawkeye’s closing trading price on January 5 of $6.94 — 11.8% premium to Hawkeye’s 20-day VWAP of $7.16 | |
| Identity of Purchaser | ■ Newly formed entity by Sparrow; Gato1 is not part of the Indicative Offer and Sparrow did not engage with Gato regarding the Indicative Offer | |
| Key Assumptions | ■ Outstanding shares, cash and debt as of Q3 2021 publicly reported balance sheet2 ■ Company is run in the ordinary course prior to closing | |
| Pelican | ■ Sparrow believes best way to maximize value is to separate Pelican from the rest of the business; intent is to divest Pelican to Talon or another party ■ Would seek to engage with Talon to finalize an agreement with them to acquire Pelican, with the expectation that such divestiture would close concurrently with the acquisition of the other assets of Hawkeye | |
| Timing | ■ Completing the transaction on an expedited basis is critical; given Sparrow expects Hawkeye to generate negative cash flow during 2022, as time elapses net debt will increase, which could reduce Sparrow’s or other buyers’ value and ability to finance a transaction ■ If given full access to due diligence and management, believe they can complete confirmatory due diligence and negotiate definitive agreements over next four weeks, with the expectation of announcing a transaction on the Company’s fourth quarter earnings call | |
| Diligence | ■ Given knowledge of the Company, Sparrow would require limited incremental business due diligence, and would intend to focus on confirmatory legal, financial and tax due diligence and negotiating definitive documentation ■ Talon will need to conduct confirmatory diligence on Pelican; however, given Talon performed diligence on Pelican during summer 2021, Sparrow believes that Talon’s remaining diligence would be limited and could be completed on an expected basis | |
| Required Approval | ■ Indicative Offer conditioned upon (i) a special committee of independent directors of the Company’s Board considering this Indicative Offer and making a recommendation to the Company’s full Board (Sparrow will not move forward unless Indicative Offer is recommended by a Special Committee) and (ii) the non-waivable approval by a fully informed vote of a majority of the voting power represented by shares of common stock of the Company that are not owned or affiliated with Sparrow ■ No required additional external approvals; Indicative Offer approved by Sparrow’s Investment Committee. Terms and conditions of any definitive agreements would require final approval from Sparrow’s Investment Committee. | |
| Financing | ■ Equity: Equity financing would come in the form of re-investment of proceeds from Gato’s current investment in the Company and equity from Sparrow funds and its affiliates ■ Third-party debt financing | |
Additional Information from Sparrow on Pelican | ■ Subsequent to the delivery of the Indicative Offer, Sparrow communicated to Moelis that Sparrow believed Talon’s preliminary offer to acquire Pelican would be for $115mm in cash, plus Talon’s existing portfolio of radio assets in Puerto Rico including accompanying tax attributes |
| 1. | Gato Investments L.P. (“Gato”) is an entity which holds approximately 15,740,000 shares of Hawkeye’s high vote Class B common stock, which represents approximately 43% of the issued and outstanding capital stock of Hawkeye and approximately 72% of the voting power of Hawkeye. Searchlight is a limited partner of Gato and the general partner of Gato is controlled by Peter M. Kern. | |
| 2. | 20,550,862 Class A shares, 19,720,381 Class B Shares, 3,100,000 shares available for the issuance of stock options or other stock-based awards; cash of $54.7mm and debt of $253.0mm |
[ 9 ]
PRELIMINARY DRAFT
SUBJECT TO SUBSTANTIAL REVISION
Share Price Performance (Since 2020)
Hawkeye’s share price is below pre-COVID levels and is down ~50% since it announced
and subsequently terminated its proposed capital raise in November 2021
SHARE PRICE PERFORMANCE (SINCE 2020) - HAWKEYE VS. SELECTED MEDIA COMPANIES

| Source: | Capital IQ as of 03/04/2022 |
| 1. | Includes Paramount, Discovery, AMC Networks and Fox |
| 2. | Includes Nexstar, TEGNA, Sinclair, Gray, Entravision and E.W. Scripps calculated as a weighted average |
| 3. | Includes Netflix, Sirius XM, Spotify, fubo TV, Chicken Soup for the Soul Entertainment, Roku, and CuriosityStream calculated as a simple average |
[ 10 ]
PRELIMINARY DRAFT
SUBJECT TO SUBSTANTIAL REVISION
Share Price Performance in Context
 |
■ On November 15, 2021, Hawkeye announced a common stock offering of 6m shares
— Implies gross proceeds of $68mm ($78mm if overallotment exercised) 1
■ On November 17, the Company announced the termination of its common stock offering due to market conditions, noting:
— The offering was opportunistic and at then-current share price levels ($9.06 per share) the offering was no longer attractive
— Hawkeye had ample liquidity to fund operations and the necessary capital to continue to fund strategic growth initiatives, including content and production for Pelican | 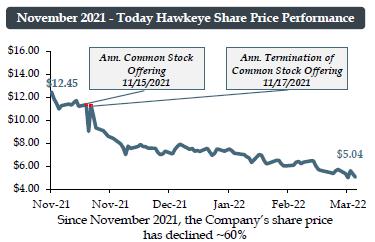 | |||
 |
■ In January 2022, Netflix announced slower than expected forecast subscriber growth, sending its shares down over 20% 2 ■ Equity research analysts have noted that Netflix's performance may highlight that the U.S. SVOD market is reaching saturation ■ Analysts have speculated that Netflix’s performance implies the U.S. SVOD market is reaching maturity and/or saturation ■ Some analysts have further questioned the attractiveness of the SVOD business model, particularly for smaller competitors, given the requirement to continuously invest in new content to attract subscribers | 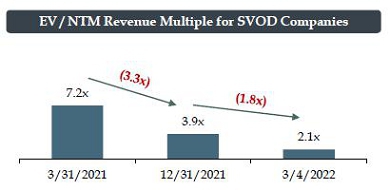 | |||
| Source: | Capital IQ as of 03/04/2022 |
| 1. | 6mm Class A shares with an option for the underwriters to purchase up to an additional 900k Class A shares. Based on Class A share price of $11.19 as of November 14, 2021 |
| 2. | Reflects price decline between market close on January 20 vs 21 (Netflix announced earnings on January 20) |
[ 11 ]
PRELIMINARY DRAFT
SUBJECT TO SUBSTANTIAL REVISION
| II. | Overview of Projections |

PRELIMINARY DRAFT
SUBJECT TO SUBSTANTIAL REVISION
Overview of Projections
Financial Plan Overview & Assumptions
For purposes of the analysis, Moelis relied on Hawkeye’s management team’s guidance and latest financial projections (the “LRP” and the “Extrapolation”)
OVERVIEW | ■ The Management team developed and provided the LRP and Extrapolation to Moelis ■ In July 2021, management prepared and provided a set of projections to Talon; the key drivers of the difference between the LRP and the July 2021 forecast are — Greater visibility for Pelican post-integration, (Hawkeye had owned Pelican for only ~3 months at the time of the July 2021 forecast) resulting in slower growth but higher margins — 2021 performance across both business lines — Feedback from market participants following the Company’s attempted equity offering in November 2021 |
NETWORKS | ■ Networks’ revenue CAGR from 2022E – 2026E of 3% and from 2027E – 2031E of 1% is driven by steady growth in advertising and subscriber revenue across segments ■ EBITDA expected to remain steady through the projection period — Steady state of EBITDA through projection period is a result of incremental revenue growth across segments, offset by increased operating costs and costs of revenue |
PELICAN | ■ Pelican’s revenue CAGR from 2022E – 2026E of 27% and from 2022E – 2026E of 9% is driven primarily by the continued subscriber acquisition and growth in ARPU — Subscribers projected to reach ~3.0mm in 2025 in-line with the high-end of public guidance — Subscriber projections are supported by expected efficiencies in subscriber acquisition and increased investment in content — ARPU increases over the projection period, primarily driven by a $1.00 price increase in May 2023 ■ EBITDA losses are generated in 2021 – 2024, and full-year profitability is expected to be achieved in 2025, with margins reaching ~15% in 2026 and ~24% by 2031 — As the subscriber base scales, operating leverage is established from returns on content and marketing investments
|
Source: LRP + Extrapolation
[ 13 ]
PRELIMINARY DRAFT
SUBJECT TO SUBSTANTIAL REVISION
Overview of Projections
Networks Summary
The below reflects Management’s forecast of Networks segment performance
| Actuals | Projections | Extrapolation | '22E - '26E | '26E - '31E | ||||||||||||
| $ in millions | 2020A | 2021A | 2022E | 2023E | 2024E | 2025E | 2026E | 2027E | 2028E | 2029E | 2030E | 2031E | CAGR | CAGR | ||
| WAPA Puerto Rico | $75 | $82 | $86 | $88 | $96 | $92 | $96 | $97 | $104 | $100 | $101 | $103 | 3% | 1% | ||
| Cable Networks | 76 | 73 | 76 | 75 | 77 | 78 | 80 | 82 | 83 | 84 | 84 | 85 | 1% | 1% | ||
| Total Net Revenue | $151 | $155 | $161 | $164 | $173 | $170 | $176 | $179 | $187 | $183 | $186 | $188 | 2% | 1% | ||
| Y/Y Growth % | 2% | 4% | 1% | 6% | (1%) | 3% | 2% | 5% | (2%) | 1% | 1% | |||||
| Cost of Revenue | $48 | $49 | $52 | $53 | $57 | $59 | $62 | $64 | $67 | $69 | $71 | $73 | 4% | 3% | ||
| SG&A | 39 | 42 | 47 | 48 | 50 | 51 | 53 | 54 | 56 | 58 | 60 | 62 | 3% | 3% | ||
| Operating Expenses | $88 | $91 | $99 | $101 | $107 | $110 | $114 | $118 | $123 | $127 | $131 | $135 | 4% | 3% | ||
| Memo: | ||||||||||||||||
| Corporate Overhead Allocation1 | (3) | (4) | (4) | (4) | (5) | (5) | (5) | (5) | (5) | (6) | (6) | |||||
| Adj. EBITDA | $64 | $67 | $66 | $66 | $70 | $65 | $66 | $66 | $70 | $62 | $60 | $59 | (0%) | (2%) | ||
| Y/Y Growth % | 6% | (1%) | (0%) | 6% | (8%) | 2% | (1%) | 6% | (11%) | (2%) | (2%) | |||||
| Margin % | 42% | 43% | 41% | 41% | 41% | 38% | 38% | 37% | 37% | 34% | 33% | 31% | ||||
| SBC | (5) | (5) | (5) | (6) | (6) | (6) | (6) | (7) | (7) | (7) | (8) | 5% | 5% | |||
| Adj. EBITDA (Post-SBC) | $64 | $63 | $61 | $61 | $65 | $59 | $60 | $59 | $63 | $55 | $53 | $51 | (1%) | (3%) | ||
| Y/Y Growth % | (2%) | (2%) | (0%) | 6% | (9%) | 2% | (2%) | 6% | (13%) | (3%) | (3%) | |||||
| Margin % | 42% | 40% | 38% | 37% | 38% | 35% | 34% | 33% | 34% | 30% | 29% | 27% | ||||
| Revenue by Type (%) | ||||||||||||||||
| Subscriber Fees | 51% | 50% | 48% | 47% | 46% | 45% | 44% | 44% | 42% | 43% | 43% | 43% | ||||
| Net Advertising | 46% | 47% | 47% | 48% | 52% | 48% | 48% | 48% | 50% | 48% | 48% | 48% | ||||
| Other | 3% | 3% | 5% | 5% | 6% | 7% | 8% | 8% | 8% | 9% | 9% | 10% | ||||
| Memo: Capex | $2 | $4 | $4 | $4 | $4 | $4 | $4 | $5 | $5 | $5 | $6 | $6 | ||||
| Source: | LRP + Extrapolation |
| 1. | Assumes 25% of corporate overhead expenses allocated to Pelican per Management |
[ 14 ]
PRELIMINARY DRAFT
SUBJECT TO SUBSTANTIAL REVISION
Overview of Projections
Pelican Summary
The below reflects Management’s forecast of the Pelican segment performance
| Actuals | Projections | Extrapolation | '22E - '26E | '26E - '31E | ||||||||||
| $ in millions | 2020A | 2021A | 2022E | 2023E | 2024E | 2025E | 2026E | 2027E | 2028E | 2029E | 2030E | 2031E | CAGR | CAGR |
| Total EoP Subscribers (000s) | 850 | 948 | 1,461 | 1,986 | 2,506 | 2,966 | 3,366 | 3,666 | 3,966 | 4,216 | 4,416 | 4,566 | 23% | 6% |
| Y/Y Growth % | 30% | 12% | 54% | 36% | 26% | 18% | 13% | 9% | 8% | 6% | 5% | 3% | ||
| Subscription | $44 | $51 | $57 | $90 | $125 | $154 | $179 | $219 | $247 | $265 | $280 | $291 | 33% | 10% |
| Theatrical | 0 | 0 | 6 | 21 | 28 | -- | -- | -- | -- | -- | -- | -- | n/m | 0% |
| Licensing & Other | 2 | 2 | 15 | 27 | 33 | 27 | 24 | 24 | 23 | 24 | 25 | 26 | 12% | 2% |
| Total Net Revenue | $47 | $53 | $78 | $138 | $186 | $181 | $202 | $243 | $270 | $289 | $304 | $317 | 27% | 9% |
| Y/Y Growth % | 13% | 48% | 76% | 35% | (3%) | 12% | 20% | 11% | 7% | 5% | 4% | |||
| Content | $10 | $5 | $19 | $43 | $57 | $50 | $53 | $59 | $66 | $71 | $78 | $84 | 29% | 10% |
| Distribution | 5 | 5 | 6 | 8 | 11 | 13 | 15 | 18 | 21 | 22 | 23 | 24 | 26% | 10% |
| Technical | 3 | 5 | 6 | 6 | 7 | 8 | 10 | 11 | 12 | 12 | 13 | 14 | 13% | 7% |
| Marketing | 32 | 47 | 50 | 62 | 70 | 73 | 70 | 79 | 87 | 87 | 89 | 90 | 9% | 5% |
| Other SG&A | 11 | 12 | 21 | 30 | 38 | 19 | 19 | 19 | 20 | 21 | 22 | 23 | (3%) | 4% |
| Operating Expenses | $61 | $74 | $102 | $149 | $183 | $163 | $167 | $187 | $205 | $214 | $225 | $235 | 13% | 7% |
| Memo: | ||||||||||||||
| Corporate Overhead Allocation¹ | 3 | 4 | 4 | 4 | 5 | 5 | 5 | 5 | 5 | 6 | 6 | |||
| Adj. EBITDA | ($14) | ($24) | ($28) | ($15) | ($1) | $13 | $31 | $51 | $60 | $69 | $74 | $76 | n/m | 20% |
| Y/Y Growth % | n/m | n/m | n/m | n/m | n/m | n/m | 128% | 66% | 17% | 16% | 7% | 3% | ||
| Margin % | n/m | n/m | n/m | n/m | n/m | 7% | 15% | 21% | 22% | 24% | 24% | 24% | ||
| SBC | (2) | (2) | (2) | (2) | (2) | (2) | (2) | (2) | (2) | (2) | (3) | 5% | 5% | |
| Adj. EBITDA (Post-SBC) | ($14) | ($26) | ($29) | ($17) | ($3) | $12 | $29 | $49 | $58 | $67 | $71 | $74 | n/m | 21% |
| Y/Y Growth % | n/m | n/m | n/m | n/m | n/m | n/m | 149% | 70% | 18% | 16% | 7% | 3% | ||
| Margin % | n/m | n/m | n/m | n/m | n/m | 6% | 14% | 20% | 21% | 23% | 23% | 23% | ||
| Select KPIs² | ||||||||||||||
| Monthly Churn | 12% | 8% | 8% | 7% | 7% | 6% | 6% | 6% | 6% | 6% | 6% | 6% | ||
| ARPU | $4.88 | $4.76 | $3.96 | $4.35 | $4.65 | $4.69 | $4.70 | $5.20 | $5.40 | $5.40 | $5.40 | $5.40 | ||
| SAC | $27.41 | $48.79 | $34.33 | $30.31 | $29.38 | $29.43 | $30.00 | $33.00 | $34.00 | $33.00 | $33.00 | $33.00 | ||
| LTV | $39.15 | $59.67 | $51.19 | $61.63 | $69.41 | $74.49 | $75.20 | $83.87 | $87.80 | $88.52 | $89.26 | $90.00 | ||
| LTV / SAC | 1.4x | 1.2x | 1.5x | 2.0x | 2.4x | 2.5x | 2.5x | 2.5x | 2.6x | 2.7x | 2.7x | 2.7x | ||
| Cash Content Cost ($mm) | $22 | $36 | $32 | $36 | $39 | $43 | $47 | $52 | $57 | $63 | $69 | $76 | ||
| Source: | LRP + Extrapolation | |
| 1. | Assumes 25% of corporate overhead expenses allocated to Pelican per Management | |
| 2. | KPI figures for 2021A reflects operating results for the nine months ending December 31, 2021 |
[ 15 ]
PRELIMINARY DRAFT
SUBJECT TO SUBSTANTIAL REVISION
Overview of Projections
Consolidated Summary
The below reflects Management’s forecast of the financial performance of the entire
Hawkeye business (Networks and Pelican)
| Actuals | Projections | Extrapolation | '22E - '26E | '26E - '31E | ||||||||||
| $ in millions | 2020A | 2021A | 2022E | 2023E | 2024E | 2025E | 2026E | 2027E | 2028E | 2029E | 2030E | 2031E | CAGR | CAGR |
| WAPA Puerto Rico | $75 | $82 | $86 | $88 | $96 | $92 | $96 | $97 | $104 | $100 | $101 | $103 | 3% | 1% |
| Cable Networks | 76 | 73 | 76 | 75 | 77 | 78 | 80 | 82 | 83 | 84 | 84 | 85 | 1% | 1% |
| Pelican | 47 | 53 | 78 | 138 | 186 | 181 | 202 | 243 | 270 | 289 | 304 | 317 | 27% | 5% |
| Total Net Revenue | $198 | $208 | $240 | $302 | $359 | $352 | $378 | $422 | $458 | $472 | $490 | $505 | 12% | 4% |
| Y/Y Growth % | 5% | 15% | 26% | 19% | (2%) | 8% | 12% | 9% | 3% | 4% | 3% | |||
| Networks | $48 | $49 | $52 | $53 | $57 | $59 | $62 | $64 | $67 | $69 | $71 | $73 | 4% | 3% |
| Pelican | 18 | 14 | 31 | 57 | 75 | 72 | 77 | 88 | 98 | 106 | 114 | 123 | 26% | 7% |
| Total Cost of Revenue | $66 | $63 | $83 | $111 | $132 | $131 | $139 | $152 | $165 | $175 | $185 | $195 | 14% | 5% |
| Networks | $39 | $42 | $47 | $48 | $50 | $51 | $53 | $54 | $56 | $58 | $60 | $62 | 3% | 3% |
| Pelican | 43 | 59 | 71 | 92 | 108 | 91 | 89 | 99 | 107 | 108 | 111 | 112 | 6% | 3% |
| Total SG&A | $82 | $101 | $118 | $140 | $158 | $142 | $142 | $153 | $164 | $167 | $171 | $174 | 5% | 3% |
| Total Operating Expenses | $149 | $165 | $201 | $251 | $290 | $273 | $281 | $305 | $328 | $341 | $355 | $370 | 9% | 4% |
| Consolidated Adj. EBITDA | $50 | $43 | $39 | $51 | $69 | $78 | $97 | $116 | $129 | $131 | $134 | $135 | 26% | 3% |
| Y/Y Growth % | (13%) | (10%) | 32% | 35% | 13% | 23% | 20% | 11% | 1% | 3% | 1% | |||
| Margin % | 25% | 21% | 16% | 17% | 19% | 22% | 26% | 28% | 28% | 28% | 27% | 27% | ||
| SBC | (5) | (6) | (7) | (7) | (7) | (8) | (8) | (9) | (9) | (9) | (10) | (10) | 5% | 4% |
| Adj. EBITDA (Post-SBC) | $44 | $37 | $32 | $44 | $62 | $71 | $89 | $108 | $120 | $121 | $124 | $125 | ||
| Y/Y Growth % | (17%) | (13%) | 37% | 40% | 14% | 26% | 22% | 12% | 1% | 2% | 0% | |||
| Margin % | 22% | 18% | 13% | 15% | 17% | 20% | 23% | 26% | 26% | 26% | 25% | 25% | ||
| Contribution (%) | ||||||||||||||
| Revenue - Networks | 76% | 74% | 67% | 54% | 48% | 48% | 47% | 42% | 41% | 39% | 38% | 37% | ||
| Revenue - Pelican | 24% | 26% | 33% | 46% | 52% | 52% | 53% | 58% | 59% | 61% | 62% | 63% | ||
| EBITDA - Networks | n/m | n/m | n/m | n/m | 102% | 83% | 68% | 56% | 54% | 47% | 45% | 44% | ||
| EBITDA - Pelican | n/m | n/m | n/m | n/m | (2%) | 17% | 32% | 44% | 46% | 53% | 55% | 56% | ||
| Source: | LRP + Extrapolation |
[ 16 ]
PRELIMINARY DRAFT
SUBJECT TO SUBSTANTIAL REVISION
| III. | Preliminary Financial Analysis Summary |
PRELIMINARY DRAFT
SUBJECT TO SUBSTANTIAL REVISION
Preliminary Financial Analyses and Commentary
Moelis performed its financial analysis on a sum-of-the-parts basis (“SOTP”) to reflect the different characteristics of the Company’s business lines: (1) Networks, a broadcaster with cable network assets and (2) Pelican, an SVOD platform
 | ■ The discounted cash flow analysis was performed using the LRP and Extrapolation provided by the Company for 2022E – 2031E ■ The discounted cash flow analysis was discounted to December 31, 2021 and relied upon the mid-year convention – Moelis discounted the cash flows separately for the Networks and Pelican businesses ■ Moelis used the perpetuity growth method to calculate estimated terminal values |
 | ■ Moelis reviewed and analyzed certain financial information and market trading data related to companies whose operations Moelis believed to be generally relevant for the Networks and Pelican businesses ■ For Networks, selected publicly traded companies analysis focused on EV / EBITDA multiples based on Wall Street consensus estimates for 2022E and 2023E EBITDA1 ■ For Pelican, selected publicly traded companies analysis focused on EV / revenue multiples based on Wall Street consensus estimates for 2022E and 2023E |
 | ■ Moelis reviewed and analyzed certain precedent merger and acquisition transactions involving companies whose operations Moelis believe to be generally relevant for the Networks and Pelican businesses ■ For Networks, selected precedent transaction analysis focused on EV / EBITDA multiples ■ For Pelican, selected precedent transaction analysis focused on EV / revenue multiples |
| 1. | For publicly traded Broadcasters, 2022E and 2023E EBITDA reflects consensus estimates for the average of 2021/2022 and 2022/2023, reflecting the significant political advertising contributions in even years to those businesses |
[ 18 ]
PRELIMINARY DRAFT
SUBJECT TO SUBSTANTIAL REVISION
Preliminary Financial Analysis Summary – Consolidated
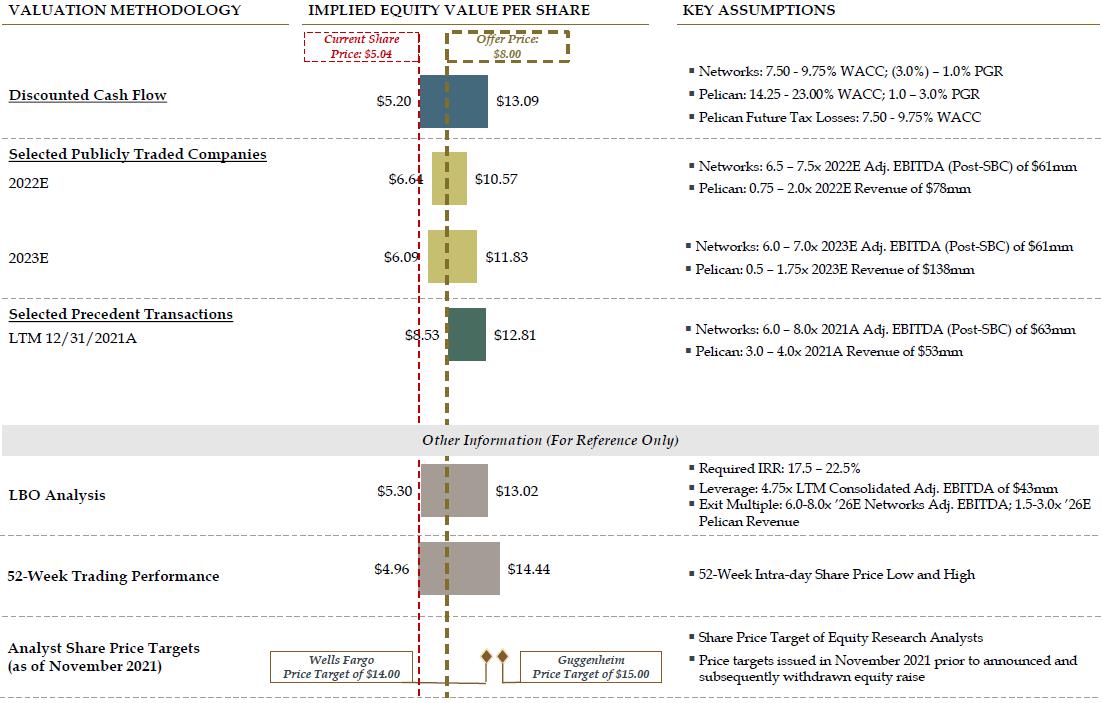
| Source: | Company filings, LRP + Extrapolation, Wall Street research, Capital IQ |
| Note: | Market data as of 03/04/2022. Assumes 20.6mm Class A shares, 19.7mm Class B Shares, 4.37mm options with strike prices ranging from $9.29 to $15, total debt of $252.3mm, cash of $49.5mm and equity method investments of $12.5mm (which are treated as cash and calculated using management’s estimate for the value of these assets) |
[ 19 ]
PRELIMINARY DRAFT
SUBJECT TO SUBSTANTIAL REVISION
Appendix
PRELIMINARY DRAFT
SUBJECT TO SUBSTANTIAL REVISION
A. Preliminary Discounted Cash Flow Analysis
PRELIMINARY DRAFT
SUBJECT TO SUBSTANTIAL REVISION
Discounted Cash Flow Analysis
Networks
PROJECTED UNLEVERED FREE CASH FLOW
| Actuals | Projections | Extrapolation | Terminal | |||||||||
| ($ in millions) | 2021A | 2022E | 2023E | 2024E | 2025E | 2026E | 2027E | 2028E | 2029E | 2030E | 2031E | Year |
| Adjusted EBITDA | $67.2 | $66.4 | $66.4 | $70.4 | $65.0 | $66.2 | $65.5 | $69.5 | $61.7 | $60.5 | $59.0 | $60.11 |
| % Growth | (1%) | (0%) | 6% | (8%) | 2% | (1%) | 6% | (11%) | (2%) | (2%) | 2% | |
| Less: SBC | (5.0) | (5.3) | (5.5) | (5.8) | (6.1) | (6.4) | (6.7) | (7.1) | (7.4) | (7.8) | (7.8) | |
| Less: Depreciation & Amortization | (6.3) | (5.0) | (5.2) | (5.2) | (5.3) | (5.3) | (5.3) | (5.3) | (5.3) | (5.3) | (6.0) | |
| Less: Severance | -- | -- | -- | -- | -- | -- | -- | -- | (0.5) | (0.5) | -- | |
| Adjusted EBIT | $55.1 | $56.1 | $59.7 | $54.0 | $54.9 | $53.8 | $57.6 | $49.4 | $47.3 | $45.5 | $46.3 | |
| Less: Taxes | (16.8) | (17.1) | (18.2) | (16.5) | (16.7) | (16.4) | (17.6) | (15.1) | (14.4) | (13.9) | (14.1) | |
| Tax-Affected EBIT | $38.3 | $39.0 | $41.5 | $37.5 | $38.1 | $37.4 | $40.0 | $34.3 | $32.9 | $31.6 | $32.2 | |
| Plus: Depreciation & Amortization | 6.3 | 5.0 | 5.2 | 5.2 | 5.3 | 5.3 | 5.3 | 5.3 | 5.3 | 5.3 | 6.0 | |
| Plus: Programming Amortization | 14.1 | 12.9 | 13.4 | 13.9 | 14.4 | 15.1 | 15.8 | 16.5 | 17.2 | 18.0 | 18.0 | |
| Less: Capital Expenditures | (3.5) | (4.0) | (4.0) | (4.0) | (4.0) | (5.0) | (5.0) | (5.0) | (6.0) | (6.0) | (6.0) | |
| Less: Programming Payments | (14.9) | (13.6) | (14.2) | (15.0) | (15.7) | (16.4) | (17.1) | (17.9) | (18.7) | (19.6) | (19.6) | |
| Less: Equity Method Investments | (1.1) | -- | -- | -- | -- | -- | -- | -- | -- | -- | -- | |
| Plus: Other Adj. | 0.6 | 0.5 | 0.3 | 0.2 | 0.2 | 0.2 | 0.2 | 0.2 | 0.2 | 0.2 | 0.2 | |
| Less: (Incr.) / Decr. in NWC | 0.7 | 3.3 | (0.2) | 1.9 | 0.6 | 0.5 | (0.2) | 1.0 | 0.1 | 0.1 | 0.1 | |
| Unlevered Free Cash Flow | $40.5 | $43.1 | $41.9 | $39.9 | $39.0 | $37.1 | $38.9 | $34.4 | $31.0 | $29.6 | $31.0 | |
| % Growth | 6% | (3%) | (5%) | (2%) | (5%) | 5% | (12%) | (10%) | (4%) | 4% | ||
| % Conversion | 61% | 65% | 60% | 61% | 59% | 57% | 56% | 56% | 51% | 50% | 52% | |
| IMPLIED TOTAL ENTERPRISE VALUE ("TEV") | IMPLIED TEV / TERMINAL ADJ. EBITDA | |||||||||||||
| Perpetuity Growth Rate | Perpetuity Growth Rate | |||||||||||||
| (3.0%) | (2.0%) | (1.0%) | 0.0% | 1.0% | (3.0%) | (2.0%) | (1.0%) | 0.0% | 1.0% | |||||
| 7.5% | $417 | $434 | $454 | $481 | $515 | 7.5% | 4.9x | 5.5x | 6.2x | 7.1x | 8.3x | |||
| 8.1% | 397 | 411 | 429 | 451 | 479 | 8.1% | 4.7x | 5.2x | 5.9x | 6.6x | 7.7x | |||
| WACC | 8.6% | 379 | 392 | 407 | 425 | 448 | WACC | 8.6% | 4.5x | 5.0x | 5.5x | 6.2x | 7.1x | |
| 9.2% | 363 | 374 | 387 | 402 | 422 | 9.2% | 4.3x | 4.7x | 5.2x | 5.9x | 6.6x | |||
| 9.8% | 348 | 358 | 369 | 382 | 398 | 9.8% | 4.1x | 4.5x | 5.0x | 5.5x | 6.2x | |||
| Source: | Company Management, LRP + Extrapolation | |
| 1. | To calculate the normalized impact of election year cash flows on the Networks business, Moelis increased 2031E EBITDA to calculate a normalized terminal year EBITDA. This adjustment was calculated by an assuming an incremental $6.3mm of terminal year revenue, less agency commissions and news costs, resulting in an election year EBITDA contribution of $4.35mm. This figure was then multiplied by 25% to reflect a four year election cycle, resulting in $1.1mm of incremental EBITDA added to the terminal year |
[ 22 ]
PRELIMINARY DRAFT
SUBJECT TO SUBSTANTIAL REVISION
Discounted Cash Flow Analysis
Pelican
PROJECTED UNLEVERED FREE CASH FLOW
| Actuals | Projections | Extrapolation | Terminal | |||||||||
| ($ in millions) | 2021A | 2022E | 2023E | 2024E | 2025E | 2026E | 2027E | 2028E | 2029E | 2030E | 2031E | Year |
| Net Revenue | $53.0 | $78.3 | $138.2 | $186.2 | $181.2 | $202.2 | $242.9 | $270.3 | $288.8 | $304.3 | $317.0 | $317.0 |
| % Growth | 48% | 76% | 35% | (3%) | 12% | 20% | 11% | 7% | 5% | 4% | 0% | |
| Adjusted EBITDA | ($24.1) | ($27.6) | ($15.2) | ($1.2) | $13.5 | $30.7 | $51.0 | $59.9 | $69.2 | $73.8 | $76.2 | $76.2 |
| % Growth | (14%) | 45% | 92% | 1244% | 128% | 66% | 17% | 16% | 7% | 3% | 0% | |
| Less: SBC | (1.7) | (1.8) | (1.8) | (1.9) | (2.0) | (2.1) | (2.2) | (2.4) | (2.5) | (2.6) | (2.6) | |
| Less: Depreciation & Amortization | (19.8) | (19.8) | (19.8) | (12.4) | (4.7) | (4.7) | (4.7) | (4.7) | (4.7) | (1.2) | (0.8) | |
| Adjusted EBIT | ($49.1) | ($36.8) | ($22.8) | ($0.9) | $24.0 | $44.2 | $52.9 | $62.1 | $66.6 | $72.4 | $72.8 | |
| Less: Taxes | -- | -- | -- | -- | (5.8) | (10.6) | (12.7) | (14.9) | (16.0) | (17.4) | (17.5) | |
| Tax-Affected EBIT | ($49.1) | ($36.8) | ($22.8) | ($0.9) | $18.2 | $33.6 | $40.2 | $47.2 | $50.6 | $55.0 | $55.3 | |
| Plus: Depreciation & Amortization | 19.8 | 19.8 | 19.8 | 12.4 | 4.7 | 4.7 | 4.7 | 4.7 | 4.7 | 1.2 | 0.8 | |
| Less: Capital Expenditures | (1.4) | (0.8) | (0.8) | (0.8) | (0.8) | (0.8) | (0.8) | (0.8) | (0.8) | (0.8) | (0.8) | |
| Plus: Content Amortization | 13.5 | 24.6 | 33.8 | 42.4 | 47.2 | 54.3 | 61.8 | 68.0 | 74.5 | 81.5 | 81.5 | |
| Less: Cash Content Spend | (32.3) | (35.5) | (39.1) | (43.0) | (47.3) | (52.0) | (57.2) | (63.0) | (69.3) | (76.2) | (76.2) | |
| Plus: Intercompany Dist. Fees | 0.8 | 0.9 | 1.1 | 1.4 | 1.6 | 1.8 | 2.0 | 2.2 | 2.3 | 2.5 | 2.5 | |
| Less: LatAm Cash Timing Diff. | 0.5 | 0.9 | -- | -- | -- | -- | -- | -- | -- | -- | -- | |
| Less: Change in Working Capital | (0.2) | (2.2) | (1.6) | (1.7) | (1.8) | (2.2) | (2.5) | (2.6) | (2.8) | (2.9) | (2.9) | |
| Plus: Pantelion 2.0 Cash Flow | (7.0) | (1.3) | (6.1) | 3.6 | (0.6) | (1.3) | (0.8) | 1.0 | 1.5 | 0.9 | 0.9 | |
| Unlevered Free Cash Flow | ($55.4) | ($30.3) | ($15.6) | $13.5 | $21.2 | $38.0 | $47.5 | $56.8 | $60.9 | $61.2 | $61.1 | |
| % Growth | 45% | 48% | 186% | 57% | 79% | 25% | 19% | 7% | 1% | (0%) | ||
| % Conversion | n/m | n/m | n/m | 100% | 69% | 75% | 79% | 82% | 82% | 80% | 80% | |
| IMPLIED TOTAL ENTERPRISE VALUE ("TEV")1 | IMPLIED TEV / TERMINAL REVENUE | |||||||||||||
| Perpetuity Growth Rate | Perpetuity Growth Rate | |||||||||||||
| 1.0% | 1.5% | 2.0% | 2.5% | 3.0% | 1.0% | 1.5% | 2.0% | 2.5% | 3.0% | |||||
| 14.3% | $184 | $190 | $196 | $203 | $210 | 14.3% | 1.6x | 1.6x | 1.7x | 1.8x | 1.9x | |||
| 16.4% | 134 | 138 | 141 | 146 | 150 | 16.4% | 1.4x | 1.4x | 1.5x | 1.5x | 1.6x | |||
| WACC | 18.6% | 98 | 101 | 103 | 106 | 109 | WACC | 18.6% | 1.2x | 1.2x | 1.3x | 1.3x | 1.4x | |
| 20.8% | 72 | 73 | 75 | 77 | 79 | 20.8% | 1.1x | 1.1x | 1.1x | 1.2x | 1.2x | |||
| 23.0% | 52 | 53 | 54 | 55 | 56 | 23.0% | 1.0x | 1.0x | 1.0x | 1.1x | 1.1x | |||
| Source: | Company Management, LRP + Extrapolation | |
| 1. | Includes present value of tax savings (see next page for detail) |
[ 23 ]
PRELIMINARY DRAFT
SUBJECT TO SUBSTANTIAL REVISION
Discounted Cash Flow (DCF) Analysis
Pelican Tax Savings Analysis
TAX SAVINGS PROJECTIONS
| Actuals | Projection | Extrapolation | |||||||||
| ($ in millions) | 2021A | 2022E | 2023E | 2024E | 2025E | 2026E | 2027E | 2028E | 2029E | 2030E | 2031E |
| Adj. EBIT (Pelican) | ($49.1) | ($36.8) | ($22.8) | ($0.9) | $24.0 | $44.2 | $52.9 | $62.1 | $66.6 | $72.4 | |
| Adj. EBIT Losses (Pelican) | ($49.1) | ($36.8) | ($22.8) | ($0.9) | $-- | $-- | $-- | $-- | $-- | $-- | |
| (x) Tax Rate (Pelican) | 24.0% | 24.0% | 24.0% | 24.0% | 24.0% | 24.0% | 24.0% | 24.0% | 24.0% | 24.0% | |
| Tax Savings Generated | $11.8 | $8.8 | $5.5 | $0.2 | - | - | - | - | - | - | |
| Memo | |||||||||||
| Adj. EBIT (Networks) | $55.1 | $56.1 | $59.7 | $54.0 | $54.9 | $53.8 | $57.6 | $49.4 | $47.3 | $45.5 | |
| (-) Taxes (Networks) | (16.8) | (17.1) | (18.2) | (16.5) | (16.7) | (16.4) | (17.6) | (15.1) | (14.4) | (13.9) | |
| Implied Tax Rate | 30.5% | 30.5% | 30.5% | 30.5% | 30.5% | 30.5% | 30.5% | 30.5% | 30.5% | 30.5% | |
| Tax Affected EBIT (Networks) | $38.3 | $39.0 | $41.5 | $37.5 | $38.1 | $37.4 | $40.0 | $34.3 | $32.9 | $31.6 | |
| PRESENT VALUE OF TAX SAVINGS | ||||
| WACC | ||||
| 7.5% | 8.1% | 8.6% | 9.2% | 9.8% |
| $24.0 | $23.9 | $23.7 | $23.6 | $23.4 |
| Source: | Company Management, LRP + Extrapolation |
[ 24 ]
PRELIMINARY DRAFT
SUBJECT TO SUBSTANTIAL REVISION
Discounted Cash Flow Analysis
Consolidated (Networks + Pelican)

| CONSOLIDATED TEV (INCL. PV OF TAX SAVINGS) | IMPLIED SHARE PRICE (INCL. PV OF TAX SAVINGS) | |||||||||||||
| Perpetuity Growth Rate | Perpetuity Growth Rate | |||||||||||||
| -3.0% / 1.0% | -2.0% / 1.5% | -1.0% / 2.0% | 0.0% / 2.5% | 1.0% / 3.0% | -3.0% / 1.0% | -2.0% / 1.5% | -1.0% / 2.0% | 0.0% / 2.5% | 1.0% / 3.0% | |||||
| 7.5% / 14.3% | $601 | $623 | $650 | $683 | $725 | 7.5% / 14.3% | $10.17 | $10.71 | $11.36 | $12.14 | $13.09 | |||
| 8.1% / 16.4% | 531 | 549 | 570 | 597 | 629 | 8.1% / 16.4% | $8.45 | $8.89 | $9.42 | $10.07 | $10.86 | |||
| WACC | 8.6% / 18.6% | 477 | 492 | 510 | 531 | 557 | WACC | 8.6% / 18.6% | $7.12 | $7.48 | $7.92 | $8.44 | $9.09 | |
| 9.2% / 20.8% | 435 | 447 | 462 | 479 | 500 | 9.2% / 20.8% | $6.06 | $6.37 | $6.73 | $7.16 | $7.69 | |||
| 9.8% / 23.0% | 400 | 410 | 423 | 437 | 455 | 9.8% / 23.0% | $5.20 | $5.46 | $5.76 | $6.12 | $6.56 | |||
| Networks / Pelican | Networks / Pelican | |||||||||||||
Source: Company Management, LRP + Extrapolation
[ 25 ]
PRELIMINARY DRAFT
SUBJECT TO SUBSTANTIAL REVISION
B. Preliminary Selected Publicly Traded Companies Analysis
PRELIMINARY DRAFT
SUBJECT TO SUBSTANTIAL REVISION
Selected Publicly Traded Companies Analysis
Summary – 2022E
Analysis reflects implied enterprise value to EBITDA multiples and implied enterprise value to Revenue multiples for Networks and Pelican, respectively, based on public market trading multiples of companies deemed generally relevant by Moelis in certain respects to Hawkeye
| Multiple Range | Enterprise Value | |||||||||||
| Segment | Metric | Value | Low | - | High | Low | - | High | ||||
| Networks | 2022E Adj. EBITDA (Post-SBC) | $61.4 | 6.5x | - | 7.5x | $399 | - | $461 | ||||
| Pelican | 2022E Revenue | $78.3 | 0.75x | - | 2.0x | $59 | - | $157 | ||||
| Total Enterprise Value | $458 | $617 | ||||||||||
| Less: Net Debt (as of 12/31/21) | (203) | (203) | ||||||||||
| Add: Other (as of 12/31/21) 1 | 13 | 13 | ||||||||||
| Total Equity Value | $268 | $427 | ||||||||||
| Fully Diluted Shares Outstanding (as of 12/31/21) | 40.332 | 40.379 | ||||||||||
| Implied Equity Value per Share | $6.64 | $10.57 | ||||||||||
Source: Company filings, Wall Street research, LRP + Extrapolation
1. Equity method investments of $12.5mm (which are treated as cash and calculated using management’s estimate for the value of these assets)
[ 27 ]
PRELIMINARY DRAFT
SUBJECT TO SUBSTANTIAL REVISION
Selected Publicly Traded Companies Analysis
Summary – 2023E
Analysis reflects implied enterprise value to EBITDA multiples and implied enterprise value to Revenue multiples for Networks and Pelican, respectively, based on public market trading multiples of companies deemed generally relevant by Moelis in certain respects to Hawkeye
| Multiple Range | Enterprise Value | |||||||||||
| Segment | Metric | Value | Low | - | High | Low | - | High | ||||
| Networks | 2023E Adj. EBITDA (Post-SBC) | $61.1 | 6.0x | - | 7.0x | $367 | - | $428 | ||||
| Pelican | 2023E Revenue | $138.2 | 0.5x | - | 1.75x | $69 | - | $242 | ||||
| Total Enterprise Value | $436 | $670 | ||||||||||
| Less: Net Debt (as of 12/31/21) | (203) | (203) | ||||||||||
| Add: Other (as of 12/31/21)1 | 13 | 13 | ||||||||||
| Total Equity Value | $246 | $480 | ||||||||||
| Fully Diluted Shares Outstanding (as of 12/31/21) | 40.332 | 40.527 | ||||||||||
| Implied Equity Value per Share | $6.09 | $11.83 | ||||||||||
Source: Company filings, Wall Street research, LRP + Extrapolation
1. Equity method investments of $12.5mm (which are treated as cash and calculated using management’s estimate for the value of these assets)
[ 28 ]
PRELIMINARY DRAFT
SUBJECT TO SUBSTANTIAL REVISION
Selected Publicly Traded Companies Analysis
Detail – Diversified Media & Networks
| (Figures in $ millions) | Hawkeye (Networks) |  |  |  |  |
| Valuation Metrics | |||||
| Total Enterprise Value | $112,706 | $34,603 | $25,374 | $4,057 | |
| Equity Value | 64,481 | 22,497 | 23,467 | 1,849 | |
| TEV / 2022E Metrics | |||||
| EBITDA Post-SBC | 10.5x | 9.1x | 7.7x | 6.5x | |
| EBITDA Post-SBC (excl. SVOD losses) | 11.2x | 6.6x | 7.7x | 6.3x | |
| TEV / 2023E Metrics | |||||
| EBITDA Post-SBC | 8.4x | 9.0x | 7.4x | 6.7x | |
| EBITDA Post-SBC (excl. SVOD losses) | 10.8x | 6.3x | 7.4x | 6.4x | |
| Net Debt / 2022E EBITDA | 4.3x | 3.4x | 1.2x | 3.0x | |
| Projected Operating Metrics | |||||
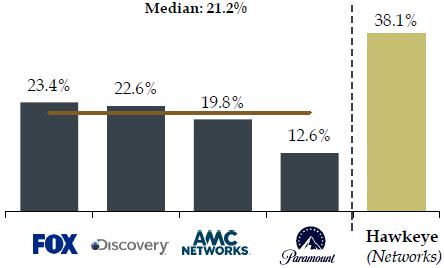
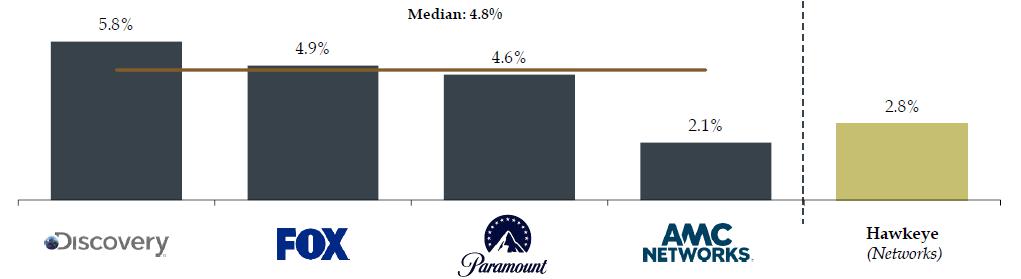
| ‘21A - ‘23E Revenue CAGR % | 2.8% | 5.8% | 4.6% | 4.9% | 2.1% |
| ‘21A - ‘23E Post-SBC EBITDA CAGR % | (1.2%) | 14.5% | (7.2%) | 7.2% | (7.4%) |
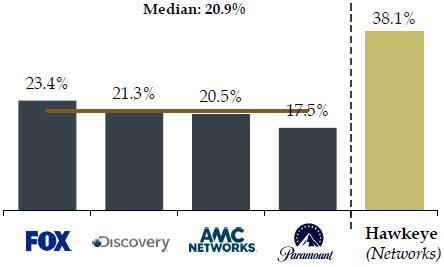
| 2022E Post-SBC EBITDA Margin % | 38.1% | 22.6% | 12.6% | 23.4% | 19.8% |
| 2022E Post-SBC EBITDA (excl. SVOD losses) Margin % | 38.1% | 21.3% | 17.5% | 23.4% | 20.5% |
| Source: | Company filings, Wall Street research, Press releases |
| Note: | Market data as of 03/04/2022 |
| 1. | Pro forma for WarnerMedia acquisition |
| 2. | CY2023E EBITDA and revenue reflects consensus estimates calendarized (average of FY2023E and FY2024E estimates 6/30 fiscal year end) |
[ 29 ]
PRELIMINARY DRAFT
SUBJECT TO SUBSTANTIAL REVISION
Selected Publicly Traded Companies Analysis
Comparison of Selected Publicly Traded Diversified Media & Networks Companies
Analysis below compares operating metrics of selected publicly traded media networks companies
2022E EBITDA MARGIN (PRE-SVOD LOSSES)
2022E EBITDA MARGIN (POST-SVOD LOSSES)
2021A-2023E REVENUE CAGR (%)
| Source: | Company filings, Wall Street research, Capital IQ |
| Note: | Market data as of 03/04/2022 |
[ 30 ]
PRELIMINARY DRAFT
SUBJECT TO SUBSTANTIAL REVISION
Selected Publicly Traded Companies Analysis
Detail – Broadcasters
| (Figures in $ millions) | Hawkeye (Networks) |  |  |  |  |  |  |
| Valuation Metrics | |||||||
| Total Enterprise Value | $14,207 | $9,404 | $7,278 | $5,683 | $13,454 | $597 | |
| Equity Value | 7,899 | 2,178 | 3,861 | 1,862 | 2,028 | 568 | |
| TEV / 2022E Metrics | |||||||
| 2021A-2022E Avg. EBITDA Post-SBC | 6.9x | 7.0x | 6.8x | 8.4x | 11.0x | 7.7x | |
| TEV / 2023E Metrics | |||||||
| 2022E-2023E Avg. EBITDA Post-SBC | 6.6x | 6.6x | 6.3x | 8.3x | 12.2x | n/a | |
| Net Debt / 2022E EBITDA | 3.4x | 4.7x | 2.9x | 4.6x | 10.0x | 0.3x | |
| Projected Operating Metrics | |||||||
| ‘21A - ‘23E Revenue CAGR % | 2.8% | 5.9% | 5.8% | 6.7% | 6.8% | 3.2% | n/a |
| ‘21A - ‘23E Post-SBC EBITDA CAGR % | (1.2%) | 3.9% | 0.6% | 9.9% | 1.6% | (10.3%) | n/a |
| 2022E Post-SBC EBITDA Margin % | 38.1% | 43.1% | 37.8% | 34.4% | 28.8% | 18.5% | 8.3% |
| For Reference Only | |||||||
| Source: | Company filings, Wall Street research, Press releases |
| Note: | Market data as of 03/04/2022; Operating metrics represent a 2-period average (average of t and t-1) |
| 1. | Pro forma for Meredith and Quincy acquisitions |
| 2. | TEGNA reflects unaffected price from the day prior to the news of Standard General’s acquisition (9/14/2021) |
[ 31 ]
PRELIMINARY DRAFT
SUBJECT TO SUBSTANTIAL REVISION
Selected Publicly Traded Companies Analysis
Detail – Streaming Services
| (Figures in $ millions) | Pelican |  |  |  |  |  |  |  |
| Valuation Metrics | ||||||||
| Total Enterprise Value | $172,549 | $33,308 | $23,998 | $15,212 | $1,205 | $135 | $77 | |
| Equity Value | 163,092 | 24,965 | 26,180 | 17,268 | 1,182 | 145 | 168 | |
| TEV/2022E Metrics | ||||||||
| Revenue | 5.2x | 3.7x | 1.9x | 4.1x | 1.1x | 0.9x | 0.6x | |
| EBITDA Post-SBC | 25.0x | 12.2x | n/m | n/m | n/m | 4.3x | n/m | |
| TEV/2023E Metrics | ||||||||
| Revenue | 4.6x | 3.6x | 1.6x | 3.1x | 0.8x | 0.7x | 0.4x | |
| EBITDA Post-SBC | 19.5x | 11.6x | n/m | n/m | n/m | 3.1x | n/m | |
| Net Debt / 2022E EBITDA | 1.3x | 3.1x | n/m | n/m | n/m | n/m | n/m | |
| Projected Operating Metrics | ||||||||
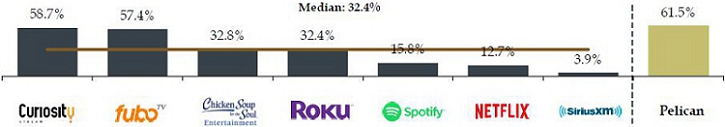
| ‘21A - ‘23E Revenue CAGR % | 61.5% | 12.7% | 3.9% | 15.8% | 32.4% | 57.4% | 32.8% | 58.7% |
| ‘21A - ‘23E Post-SBC EBITDA CAGR % | n/m | 17.6% | 3.4% | 34.7% | n/m | n/m | 45.7% | n/m |
| 2022E Post-SBC EBITDA Margin % | (37.3%) | 20.6% | 30.3% | 1.7% | (2.0%) | (29.3%) | 21.4% | (29.9%) |
| Source: | Company filings, Wall Street research, Press releases |
| Note: | Market data as of 03/04/2022 |
| 1. | Utilizing 9/30/2021 financials since 12/31/2021 financials have not been released |
[ 32 ]
PRELIMINARY DRAFT
| Selected Publicly Traded Companies Analysis | SUBJECT TO SUBSTANTIAL REVISION |
Streaming Services Valuation in Context
(Time of Pelican Acquisition vs. Today)
Since Hawkeye’s acquisition of the remainder of Pelican in March 2021, publicly traded streaming companies have experienced significant multiple compression
| VALUATION AS DATE 3/31/21 (PELICAN ACQUISITION) | CURRENT VALUATION |
| EV / NTM Revenue | EV / NTM Revenue | |||||
| Trailing | As of | Trailing | As of | |||
| 3 Months | 3/31/2021 | 3 Months | 3/4/2022 | |||
| Netflix, Inc. | 8.5x | 8.0x | Netflix, Inc. | 8.4x | 5.2x | |
| Sirius XM | 4.3x | 4.1x | Sirius XM | 3.8x | 3.7x | |
| Spotify | 6.4x | 5.3x | Spotify | 3.8x | 2.1x | |
| fuboTV | 7.4x | 7.2x | fuboTV | 2.6x | 1.0x | |
| Roku | 19.4x | 16.1x | Roku | 7.5x | 4.0x | |
| Chicken Soup | 3.7x | 4.2x | Chicken Soup | 1.5x | 0.9x | |
| CuriosityStream | 12.1x | 9.6x | CuriosityStream 1 | 2.5x | 0.5x | |
| Median | 7.4x | 7.2x | Median | 3.8x | 2.1x | |
Memo: Hawkeye acquisition of Pelican | 3.6x | Delta vs. 3/31/2021 | (3.6x) | (5.1x) | ||
| Curiosity Stream | 2.5x | 0.5x | ||||
| Delta vs. 3/31/2021 | (9.6x) | (9.1x) | ||||
| Source: | Capital IQ as of 03/04/2022 |
| 1. | 3/4/22 TEV/NTM Revenue multiple reflects a weighted average (83% towards 2022 estimates, 17% towards 2023 estimates), due to lack of NTM projections |
[ 33 ]
PRELIMINARY DRAFT
SUBJECT TO SUBSTANTIAL REVISION
Selected Publicly Traded Companies Analysis
Comparison of Selected Publicly Traded Streaming Companies
Analysis below compares operating metrics of selected publicly traded streaming companies
2021A-2023E REVENUE CAGR (%)
2022E EBITDA MARGIN

2022E MONTHLY CHURN

| Source: | Company filings, Wall Street research, Capital IQ |
| Note: | Market data as of 03/04/2022 |
[ 34 ]
PRELIMINARY DRAFT
SUBJECT TO SUBSTANTIAL REVISION
C. Preliminary Selected Precedent Transactions Analysis
PRELIMINARY DRAFT
SUBJECT TO SUBSTANTIAL REVISION
Selected Precedent Transactions Analysis
Summary
Analysis reflects implied enterprise value to EBITDA multiples and implied enterprise value to Revenue multiples for Networks and Pelican, respectively, based on public market trading multiples of companies deemed generally relevant by Moelis in certain respects to Hawkeye
| Multiple Range | Enterprise Value | |||||||||||
| Segment | Metric | Value | Low | - | High | Low | - | High | ||||
| Networks | LTM EBITDA (Post-SBC) as of 12/31/2021 | $62.6 | 6.0x | - | 8.0x | $376 | - | $501 | ||||
| Pelican | LTM Revenue as of 12/31/2021 | $53.0 | 3.0x | - | 4.0x | $159 | - | $212 | ||||
| Total Enterprise Value | $534 | $713 | ||||||||||
| Less: Net Debt (as of 12/31/21) | (203) | (203) | ||||||||||
| Add: Other (as of 12/31/21) 1 | 13 | 13 | ||||||||||
| Total Equity Value | $344 | $522 | ||||||||||
| Fully Diluted Shares Outstanding (as of 12/31/21) | 40.332 | 40.777 | ||||||||||
| Implied Equity Value per Share | $8.53 | $12.81 | ||||||||||
| Source: | Company filings, Wall Street research, LRP + Extrapolation |
| 1. | Equity method investments of $12.5mm (which are treated as cash and calculated using management’s estimate for the value of these assets) |
[ 36 ]
PRELIMINARY DRAFT
SUBJECT TO SUBSTANTIAL REVISION
Selected Precedent Transactions Analysis
Select Networks Precedent Transactions
NETWORKS
| Announced | Target | Acquiror | TEV ($mm) | TEV / LTM EBITDA |
| Apr-21 | Grupo Televisa (Content Assets) | Univision | $4,800 | 7.8x1 |
| Mar-21 | MSGN | MSGE | 1,7982 | 6.5x |
| Dec-20 | Oprah Winfrey Network | Discovery Communications | 4783 | 5.7x |
| Aug-19 | Viacom | CBS Corporation | 19,552 | 6.6x |
| Mar-18 | The Weather Channel | Allen Media | 977 | 6.9x4 |
| Jul-17 | Scripps Networks | Discovery Communications | 14,260 | 9.9x |
| Jul-17 | Home Shopping Network | QVC | 2,594 | 9.8x |
| Jun-16 | Starz | Lions Gate | 4,400 | 10.9x |
| Mar-16 | Crown Media Holdings | Hallmark Cards, Inc. | 2,088 | 10.1x |
| Jan-16 | Tennis Channel | Sinclair | 3505 | 16.2x |
| Overall Mean | $5,130 | 9.0x | ||
| Overall Median | $2,341 | 8.8x | ||
| Source: | Company filings, Wall Street research, Press releases |
| 1. | Reflects operating income from content assets; USD to MXN FX rate as of transaction announcement date (20.061x) |
| 2. | Assumes implied transaction value based on the MSGE closing price the day prior to the transaction (0.172x exchange ratio) |
| 3. | Grossed-up amount shown based on $100mm in total consideration for an incremental 21.0% equity stake in the Oprah Winfrey Network LLC from Harpo that Discovery did not already own |
| 4. | Estimated EBITDA per SNL Kagan |
| 5. | Does not include ~$65mm adjustment for savings from present value of Tennis Channel net operating losses |
[ 37 ]
PRELIMINARY DRAFT
SUBJECT TO SUBSTANTIAL REVISION
Selected Precedent Transactions Analysis
Broadcasting Precedent Transactions
BROADCASTERS
| TEV / | ||||
| Announced | Target | Acquiror | TEV ($mm) | L8Q AVG. EBITDA |
| Feb-22 | TEGNA | Standard General | $8,605 | 8.8x |
| Jun-21 1 | Meredith | Gray Television, Inc. | 2,825 | 9.9x |
| Sep-20 | ION Media | E.W. Scripps Company | 2,650 | 8.6x2 |
| Jun-19 | Dispatch (2 Stations) | TEGNA | 535 | 7.9x3 |
| Mar-19 | Nextsar (8 Stations)4 | E.W. Scripps Company | 580 | 10.4x |
| Mar-19 | Nextsar (11 Stations) 4 | TEGNA | 740 | 12.0x |
| Dec-18 | Tribune Media | Nexstar Broadcast Group | 6,400 | 9.2x |
| Oct-18 | Cordillera (15 Stations) 4 | E.W. Scripps Company | 521 | 9.8x |
| Aug-18 | Gray (2 Stations) 4 | TEGNA | 105 | 5.9x3 |
| Jun-18 | Raycom Media, Inc. | Gray Television, Inc. | 3,660 | 9.5x |
| Dec-17 | Midwest Television Inc.4 | TEGNA | 325 | 6.6x3 |
| Apr-17 | Bonten Media Group | Sinclair Broadcast Group | 240 | 6.7x3 |
| Jan-16 | Media General | Nexstar Broadcast Group | 4,115 | 9.1x |
| Overall Mean | $2,408 | 8.8x | ||
| Overall Median | $740 | 9.1x | ||
| Source: | Company filings, Wall Street research, Press releases |
| 1. | Revised bid date, initial announcement was on 5/3/2021 |
| 2. | Reflects average of LTM 6/3020A and 2019A EBITDA |
| 3. | Includes pro forma synergies |
| 4. | Asset deal |
[ 38 ]
PRELIMINARY DRAFT
SUBJECT TO SUBSTANTIAL REVISION
Selected Precedent Transactions Analysis
Select Streaming Precedent Transactions
STREAMERS
| TEV / | ||||
| Announced | Target | Acquiror | TEV ($mm) | LTM Revenue |
| Apr-21 | Pantaya | Hemisphere Media Group | $165 | 3.6x |
| Jan-19 | PlutoTV | Viacom | 340 | 3.4x1 |
| Jul-18 | Acorn (RLJ) | AMC Networks | 274 | 2.9x |
| Jul-17 | Funimation | Sony | 151 | 1.5x1 |
| Overall Mean | $232 | 2.9x | ||
| Overall Median | $220 | 3.2x | ||
| Source: | Company filings, Wall Street research, Press releases | |
| 1. | Approximate revenue figure reported in the press |
[ 39 ]
PRELIMINARY DRAFT
SUBJECT TO SUBSTANTIAL REVISION
D. Other Information
PRELIMINARY DRAFT
SUBJECT TO SUBSTANTIAL REVISION
Other Information
Leveraged Buyout (LBO) Assumptions and Illustrative Analysis
KEY ASSUMPTIONS
| ■ | Uses LRP through 2026 for the consolidated Hawkeye business (Networks and Pelican) | |
| ■ | Assumes $200mm of new debt (~4.75x 2021A EBITDA of $43.1mm) | |
| — | Assumes refinancing of existing debt with new Unitranche Facility at L + 600bps, subject to a 1.00% LIBOR floor and 1% OID | |
| ■ | Remaining purchase price provided by equity from Sponsor | |
| ■ | Assumes transaction date of 12/31/21 and exit on 12/31/2026 | |
| — | Assumes minimum cash balance of $30mm | |
| — | Assumes $20mm of illustrative other transaction expenses | |
| ■ | Exit multiple calculated on a sum-of-the-parts basis based on 2026E revenue and EBITDA for the Pelican and Networks businesses, respectively | |
SENSITIVITY ANALYSIS
| Implied Purchase Price (@ 4.75x Max Leverage) | |||||
| Exit | Required IRR | ||||
| Multiple | 17.5% | 18.8% | 20.0% | 21.3% | 22.5% |
| 6.0x / 1.5x | $6.79 | $6.38 | $5.99 | $5.63 | $5.30 |
| 6.5x / 1.9x | 8.39 | 7.90 | 7.43 | 7.00 | 6.59 |
| 7.0x / 2.3x | 9.99 | 9.41 | 8.87 | 8.37 | 7.89 |
| 7.5x / 2.6x | 11.54 | 10.91 | 10.31 | 9.73 | 9.19 |
| 8.0x / 3.0x | 13.02 | 12.35 | 11.70 | 11.07 | 10.48 |
| Networks / Pelican | |||||
PF FREE CASH FLOW BUILD
| Fiscal Year Ending December 31, | ||||||||||||||
| ($ in millions) | 2022E | 2023E | 2024E | 2025E | 2026E | |||||||||
| Adjusted EBITDA (Post-SBC) | $32 | $44 | $62 | $71 | $89 | |||||||||
| % Growth | 37.4% | 40.1% | 14.3% | 25.5% | ||||||||||
| (-) Taxes | (1 | ) | (4 | ) | (8 | ) | (12 | ) | (20 | ) | ||||
| (+) Other Adjustments | 1 | 1 | 0 | 0 | 0 | |||||||||
| (-) Capex | (5 | ) | (5 | ) | (5 | ) | (5 | ) | (5 | ) | ||||
| (+) Programming / Content Amortization | 28 | 37 | 47 | 56 | 62 | |||||||||
| (-) Cash Content Spend | (47 | ) | (49 | ) | (53 | ) | (58 | ) | (63 | ) | ||||
| (-) Change in Working Capital | 1 | 1 | (2 | ) | 0 | (1 | ) | |||||||
| (+) Pantelion 2.0 Cash Flow | (7 | ) | (1 | ) | (6 | ) | 4 | (1 | ) | |||||
| (-) Interest Expense | ($16 | ) | ($18 | ) | ($16 | ) | ($14 | ) | ($10 | ) | ||||
| Levered Free Cash Flow | ($15 | ) | $6 | $19 | $42 | $51 | ||||||||
| Source: | Company filings, LRP |
| Note: | Market data as of 03/04/2022. Assumes 20.6mm Class A shares, 19.7mm Class B Shares, 4.37mm options with strike prices ranging from $9.29 to $15, total debt of $252.3mm, cash of $49.5mm and equity method investments of $12.5mm (which are treated as cash and calculated using management’s estimate for the value of these assets) |
[ 41 ]
PRELIMINARY DRAFT
SUBJECT TO SUBSTANTIAL REVISION
Other Information
Hawkeye Current Capitalization
| TEV BUILD |
| (figures in $ millions, except per share data) |
Capitalization
| Capitalization (balances as of 12/31/2021) | |
| Share Price Class A Shares (as of 03/04/2022) | $5.04 |
| (x) FDSO | 20.611 |
| Share Price Class B Shares (as of 03/04/2022) | $5.04 |
| (x) FDSO | 19.720 |
| Equity Value | $203.3 |
| (+) Total Debt | 252.3 |
| (–) Cash | (49.5) |
| Net Debt | $202.8 |
| (+) Noncontrolling Interests | -- |
| (–) Non-Core Assets | (13) |
| TEV | $393.6 |
| FDSO | |
| Common Shares (A Shares) | 20.611 |
| (+) Options |  |
| FDSO | 20.611 |
| OPTIONS SCHEDULE |
| (figures in $ millions, except per share data) |
| Options Schedule (balances as of 12/31/2021) | |||
| Item | # of Units | Strike Price | Dilution |
| Tranche 1 | 0.025 | $9.29 | -- |
| Tranche 2 | 1.200 | $10.20 | -- |
| Tranche 3 | 0.025 | $10.35 | -- |
| Tranche 4 | 0.055 | $10.39 | -- |
| Tranche 5 | 0.040 | $10.60 | -- |
| Tranche 6 | 0.055 | $11.35 | -- |
| Tranche 7 | 0.025 | $11.35 | -- |
| Tranche 8 | 0.040 | $11.51 | -- |
| Tranche 9 | 0.375 | $11.65 | -- |
| Tranche 10 | 0.010 | $11.70 | -- |
| Tranche 11 | 0.650 | $11.90 | -- |
| Tranche 12 | 0.210 | $11.95 | -- |
| Tranche 13 | 1.025 | $12.06 | -- |
| Tranche 14 | 0.060 | $12.43 | -- |
| Tranche 15 | 0.105 | $12.56 | -- |
| Tranche 16 | 0.065 | $13.49 | -- |
| Tranche 17 | 0.045 | $13.53 | -- |
| Tranche 18 | 0.035 | $14.00 | -- |
| Tranche 19 | 0.325 | $15.00 | -- |
| Total | 4.370 | | |
| Source: | Company filings, LRP | |
| Note: | Market data as of 03/04/2022. Assumes 20.6mm Class A shares, 19.7mm Class B Shares, 4.37mm options with strike prices ranging from $9.29 to $15, total debt of $252.3mm, cash of $49.5mm and equity method investments of $12.5mm (which are treated as cash and calculated using management’s estimate for the value of these assets) |
[ 42 ]
PRELIMINARY DRAFT
SUBJECT TO SUBSTANTIAL REVISION
Other Information
Hawkeye Equity Research Overview
Research was last published in November 2021, prior to when the Company announced and subsequently withdrew a proposed equity offering
| ANALYST / DATE / RATING | PRICE TARGET |

BROKER VALUATION PERSPECTIVES
| Valuation Method | 2022E Revenue | 2022E EBITDA | |
| ■ | Based on our DCF valuation using a 2% long-term growth rate and a 9.1% WACC | $224mm | $52mm |
| ■ | Valuation is based solely on our DCF due to the company’s PELICAN acquisition | ||
| ■ | Apply a 250x EV/Sub multiple on YE22 Pelican subscribers of 1.32mm. | ||
| ■ | Models the company returning to EBITDA growth in FY23 as revenue/profitability growth lags the increased investment | $225mm | $43mm |
| ■ | Believes there is room for meaningful value creation | ||
| Source: | Wall Street research, Capital IQ as of 03/04/22 |
[ 43 ]