Exhibit (c)(vi)
 |  | |
| Project Hawkeye | |
| PRESENTATION TO THE SPECIAL COMMITTEE OF HMTV | |
| May 7, 2022 |
| Summary of the Merger Agreement |
| > | Searchlight to acquire all outstanding common shares of HMTV for $7.00 per share, other than the shares held by Gato which will be cancelled(1) |
| ‒ | Gato owns 41.1% economic and 75.3% voting stake in HMTV(2) |
| > | Closing of the sale of Pantaya to Univision is a Searchlight condition to closing the HMTV transaction |
| > | Closing conditions for the HMTV transaction also include that a majority of HMTV shares not held by Gato have voted in favor of the transaction, FCC approval, HSR clearance (if applicable) and other customary closing conditions |
| > | Each of Searchlight and HMTV can terminate the Merger Agreement if, among other things, (a) the Pantaya Transaction Agreement is terminated or (b) the HMTV transaction has not closed 6 months after signing, which may be extended by either HMTV or Searchlight to 9 months after signing if, among other things, the Pantaya transaction has not closed |
| > | 30-day post-signing Go-Shop period during which HMTV may solicit additional acquisition proposals |
| ‒ | Searchlight will have matching rights with respect to a superior proposal |
| ‒ | HMTV termination fee of (a) 2% of equity value if the Merger Agreement is terminated in connection with the Go-Shop provision; or (b) 3.75% of equity value otherwise |
| > | Searchlight termination fee of 5.5% of equity value |
| > | Fully committed debt and equity financing has been secured by Searchlight with the amount of equity financing to be sufficient to cover (if applicable) the cash purchase price for the Pantaya transaction |
| (1) | In the money stock options will be cashed out for the difference between the strike price and $7.00 per share. |
| (2) | Gato and Peter Kern own a total of ~16.6mm shares (Peter Kern personally owns ~0.2mm Class A shares and ~0.7mm Class B shares); Gato Investments LP (“Gato”) is a Delaware limited partnership, Gemini Latin Holdings, LLC is the general partner of Gato and Peter Kern is the controlling person of Gemini; a Searchlight fund, as the sole limited partner in Gato, holds all of the economic interests in Gato (subject to Peter Kern‘s carried interest, which entitles him to payments in certain scenarios). |
 1
1
| Summary of Other Key Transaction Agreements |
| > | Pantaya Transaction Agreement and Radio Stations Transaction Agreement |
| ‒ | Pantaya to be sold to Univision for a combination of $115mm of cash (subject to working capital and net debt adjustments), a $10mm promissory note and HMTV has agreed to forgo $7.3mm of content payments / license fee due from Univision |
| ○ | Pantaya sale to close (i) concurrently with the HMTV transaction if it closes on or before a to-be-determined date, (ii) a to-be-determined number of business days following receipt of the Required Company Stockholder Approval, if the HMTV transaction does not close by a to-be-determined date or (iii) as soon as practicable following termination of the HMTV transaction by HTMV for a superior proposal |
| ○ | Pantaya sale subject to customary closing conditions, including receipt of HSR clearance |
| ○ | Pantaya Transaction Agreement to automatically terminate if the Merger Agreement is terminated, other than by HMTV for a superior proposal |
| ‒ | Under the Radio Stations Transaction Agreement, in exchange for cancellation of the promissory note received pursuant to the Pantaya Transaction Agreement, HMTV to receive Univision of Puerto Rico, Inc. (which holds certain Puerto Rico radio station assets and certain NOLs) |
| ○ | Univision of Puerto Rico, Inc. is a party to a real estate lease in Puerto Rico expiring in 2059, which may result in costs to it of between $5.8 and $20.9 million |
| ○ | Radio Stations Transaction Agreement to automatically terminate if the Pantaya Transaction Agreement is terminated |
| ‒ | Pursuant to the Programming Agreement, HMTV to pay to Univision a fee of $15mm ratably over 3 years |
| ‒ | HMTV to provide certain services to Univision in connection with Pantaya pursuant to a transition services agreement and Univision and HMTV to provided certain services to each other pursuant to a shared services agreement in connection with the radio station assets |
| > | Voting and Support Agreement |
| ‒ | If a superior proposal is accepted as part of the go-shop process, shares owned by Gato will be voted in the same manner and proportion as the remaining stockholders |
| ‒ | Searchlight to execute a separate letter agreement in which it agrees not to transfer its interests in Gato, with such restriction terminating on the earlier of (a) termination of the HMTV transaction (other than by HMTV for a superior proposal), (b) if the HMTV transaction is terminated by HMTV for a superior proposal, the earlier of the consummation of such superior proposal transaction or the termination of the agreement for such superior proposal transaction and (c) closing of the HMTV transaction |
2
| Consideration Received in Connection with Pantaya Sale |
| ($mm) | Low | High | ||||
| Cash Proceeds | $115.0 | $115.0 | ||||
| Illustrative Valuation of Puerto Rican Radio Assets @ ~5.0-8.0x 2022E EBITDA | 35.0 | 55.0 | ||||
| PV of Tax NOLs per HMTV Management Guidance(1) | 0.0 | 23.0 | ||||
| PV of Assumed Lease Liability per HMTV Management Guidance(2) | (19.8 | ) | (5.7 | ) | ||
| PV of Programming Agreement Payments(3) | (12.5 | ) | (12.5 | ) | ||
| Unreimbursed Content Payments / License Fee Forgiveness | (7.3 | ) | (7.3 | ) | ||
| Net Value of Consideration | $110.3 | $167.4 | ||||
| Implied Multiple of 2021A Revenue ($53.0mm) | 1.4 | x | 2.1 | x | ||
| Implied Multiple of 2022E Revenue ($78.3mm) | 1.0 | x | 1.4 | x | ||
| Midpoint Value of Consideration | $138.9 | |||||
| Net Value of Non-Radio Consideration | $75.3 | $112.4 | ||||
| Midpoint Value of Non-Radio Consideration | $93.9 |
| In April 2021, HMTV acquired Lionsgate‘s 75% stake in Pantaya that HMTV did not already own at a $165mm valuation (on a 100% basis). |
Note: Analysis assumes transactions contemplated by the Radio Stations Purchase Agreement will be consummated in accordance with their terms.
| (1) | Illustratively assumes a discount rate of 9.5% based on the midpoint of the WACC range for Networks; range represents 0% to 100% range of utilization of the PV of the NOLs based on consent from HMTV management. |
| (2) | Illustratively assumes a discount rate of 9.5% based on the midpoint of the WACC range for Networks; low end of range reflects PV of lease costs with LMG payments throughout the lease and high end of range reflects PV of lease costs without LMG payments after December 2025 based on consent from HMTV management. |
| (3) | Illustratively assumes a discount rate of 9.5% based on the midpoint of the WACC range for Networks on the $5mm payable by HMTV in each of the first three years of the Programming Agreement. |
3
| Proposed Transaction Sources & Uses |
| Sources | $mm | Uses | $mm | |
| New Debt Financing(1) | $360 | Purchase ~23.8mm Common Shares of HMTV(3) | $168 | |
| Rolled Searchlight Equity(2) | 115 | Rolled Searchlight Equity(2) | 115 | |
| Cash Proceeds from Sale of Pantaya | 115 | Refinancing of Existing Indebtedness | 252 | |
| HMTV Cash on Hand (6/30/22E) | 27 | Estimated Transaction Fees & Expenses | 25 | |
| Estimated Debt Arrangement Fees & OID | 25 | |||
| Assumed Opening Cash on Balance Sheet | 25 | |||
| Unreimbursed Content Payments / License Fee Forgiveness(5) | 7 | |||
| Total Sources | $617 | Total Uses | $617 |
| Gato‘s rolled equity represents 24.2%(4) of total sources; new debt financing represents approximately 4.6x the Closing Date EBITDA of $77.9mm as referenced in the Searchlight Debt Commitment Letter. |
Note: Analysis assumes transactions contemplated by the Radio Stations Purchase Agreement will be consummated in accordance with their terms.
| (1) | Assumes $35mm revolving credit facility to be undrawn at closing. |
| (2) | Gato and Peter Kern own a total of ~16.6mm shares (Peter Kern personally owns ~0.2mm Class A shares and ~0.7mm Class B shares); Gato Investments LP (“Gato”) is a Delaware limited partnership, Gemini Latin Holdings, LLC is the general partner of Gato and Peter Kern is the controlling person of Gemini; A Searchlight fund, as the sole limited partner in Gato, holds all of the economic interests in Gato (subject to Peter Kern‘s carried interest, which entitles him to payments in certain scenarios). |
| (3) | Reflects 40.4mm total common shares (i.e., ~20.7mm Class A shares and ~19.7mm Class B shares) and ~4.4mm options at weighted-average strike price of $11.55 (0.02mm on a treasury stock basis) less a total of ~16.6mm shares owned by Gato and Peter Kern. |
| (4) | Reflects total Rolled Searchlight Equity of $115mm divided by the sum of total Rolled Searchlight Equity plus New Debt Financing of $360mm. |
| (5) | Illustratively assumed to impact cash concurrently with closing. |
4
| Summary Financial Performance Metrics |
| Historical | LTM | Projected | ||||||||||
| ($mm) | 2021 | 3/31/2022 | 2022 | 2023 | ||||||||
| Revenue | ||||||||||||
| Networks | $154.7 | $153.6 | $161.4 | $163.5 | ||||||||
| Pantaya | 53.0 | 56.3 | 78.3 | 138.2 | ||||||||
| Consolidated | $207.7 | $209.8 | $239.7 | $301.7 | ||||||||
| (-) Pantaya | (53.0 | ) | (56.3 | ) | (78.3 | ) | (138.2 | ) | ||||
| (+) Radio Assets | 14.2 | (2) | 14.8 | (1) | 14.6 | 14.6 | ||||||
| Pro Forma for Pantaya Divestiture | $168.9 | $168.4 | $175.9 | $178.1 | ||||||||
| Adj. EBITDA (Post-SBC) incl. Pantaya losses | ||||||||||||
| Networks | $62.6 | $60.1 | $61.6 | $61.1 | ||||||||
| Pantaya | (25.7 | ) | (31.2 | ) | (29.2 | ) | (17.0 | ) | ||||
| Consolidated | $36.9 | $28.9 | $32.5 | $44.2 | ||||||||
| (-) Pantaya | 25.7 | 31.2 | 29.2 | 17.0 | ||||||||
| (-) Stranded Corporate Costs Post Pantaya Divestiture | (3.4 | ) | (3.6 | ) | (4.1 | ) | (4.3 | ) | ||||
| (+) Radio Assets | 6.5 | (2) | 6.6 | (3) | 6.8 | (4) | 6.8 | (4) | ||||
| Pro Forma for Pantaya Divestiture | $65.7 | $63.0 | $64.3 | $63.7 | ||||||||
| (+) Assumed Searchlight Synergies(5) | 8.6 | 8.6 | 8.6 | 8.6 | ||||||||
| Assumed Searchlight View | $74.4 | $71.7 | $73.0 | $72.3 | ||||||||
| Adj. EBITDA (Post-SBC) excl. Pantaya losses | ||||||||||||
| Networks | $62.6 | $60.1 | $61.6 | $61.1 | ||||||||
| Pantaya | - | - | - | - | ||||||||
| Consolidated | $62.6 | $60.1 | $61.6 | $61.1 | ||||||||
| (-) Pantaya | - | - | - | - | ||||||||
| (-) Stranded Corporate Costs Post Pantaya Divestiture | (3.4 | ) | (3.6 | ) | (4.1 | ) | (4.3 | ) | ||||
| (+) Radio Assets | 6.5 | (2) | 6.6 | (3) | 6.8 | (4) | 6.8 | (4) | ||||
| Pro Forma for Pantaya Divestiture | $65.7 | $63.0 | $64.3 | $63.7 | ||||||||
| (+) Assumed Searchlight Synergies(5) | 8.6 | 8.6 | 8.6 | 8.6 | ||||||||
| Assumed Searchlight View | $74.4 | $71.7 | $73.0 | $72.3 | ||||||||
Source: HMTV management.
Note: Analysis assumes transactions contemplated by the Radio Stations Purchase Agreement will be consummated in accordance with their terms.
| (1) | Assumes Q1 2022 LTM revenue calculated as Q2-Q4 2021 revenue plus Q1 2022 revenue estimated as 25% of 2022E revenue as provided by Univision management. |
| (2) | Diligence adjusted per PwC QoE. |
| (3) | LTM EBITDA calculated as weighted average of 2021A and 2022E. |
| (4) | 2022 illustratively reflects 2021 QoE adjustments for accounting team ($0.177mm) and allocated lease costs ($0.125mm); 2023 assumes same EBITDA as 2022. |
| (5) | Amount of synergies assumed to be aligned to the $77.9mm Closing Date EBITDA as per the Searchlight Debt Commitment Letter less 3/31/2022 LTM PF EBITDA of $63.0 less 3/31/2022 LTM SBC of $6.2mm. |
5
| Implied Valuation Multiples Analysis |
| Offer @ $7.00 | ||||||||||||
| (Figures in millions, except per share figures) | Status Quo @ $3.77 Market Price | Status Quo | Adjusted for Pantaya Divestiture | Assumed Searchlight View | ||||||||
| Share Price | $3.77 | $7.00 | $7.00 | $7.00 | ||||||||
| (x) FDSO(1) | 40.4 | 40.4 | 40.4 | 40.4 | ||||||||
| Implied Equity Value | $152.3 | $283.0 | $283.0 | $283.0 | ||||||||
| (+) Debt(2) | 251.6 | 251.6 | 251.0 | 251.0 | ||||||||
| (-) Cash(2) | (37.3 | (37.3 | (26.6 | (26.6 | ||||||||
| (+) Post-Tax Pension(3) | 1.7 | 1.7 | 1.7 | 1.7 | ||||||||
| (-) Equity Method Investments(4) | (22.7 | (22.7 | (22.7 | (22.7 | ||||||||
| (-) Midpoint Non-Radio Value of Consideration Received for Pantaya | - | - | (93.9 | (93.9 | ||||||||
| (+) Transaction Fees & Expenses | - | - | - | 50.0 | ||||||||
| Adj. Implied Total Enterprise Value | $345.6 | $476.2 | $392.5 | $442.5 | ||||||||
| TEV / Adj. EBITDA (Post-SBC) incl. Pantaya Losses Multiples | ||||||||||||
| 2021A | 9.4x | 12.9x | — | — | ||||||||
| LTM 3/31/22A | 12.0x | 16.5x | — | — | ||||||||
| 2022E | 10.6x | 14.7x | — | — | ||||||||
| 2023E | 7.8x | 10.8x | — | — | ||||||||
| Adj. TEV / Adj. EBITDA (Post-SBC) excl. Pantaya Losses Multiples | ||||||||||||
| 2021A | 5.5x | 7.6x | 6.0x | 5.9x | ||||||||
| LTM 3/31/22A | 5.8x | 7.9x | 6.2x | 6.2x | ||||||||
| 2022E | 5.6x | 7.7x | 6.1x | 6.1x | ||||||||
| 2023E | 5.7x | 7.8x | 6.2x | 6.1x | ||||||||
Source: HMTV management.
Note: Market data as of 5/6/2022. Analysis assumes transactions contemplated by the Radio Stations Purchase Agreement will be consummated in accordance with their terms.
| (1) | Reflects 40.4mm total common shares (i.e., ~20.7mm Class A shares, ~19.7mm Class B shares) and ~4.4mm options at weighted-average strike price of $11.55 (0.02mm on a treasury stock basis). |
| (2) | Adjusted for Pantaya Divestiture and Assumed Searchlight View columns as of 6/30/2022; status quo columns as of 3/31/2021. |
| (3) | Based on 12/31/21 balance of $2.3mm as per HMTV management guidance; tax-affected at a 28% tax rate. |
| (4) | Reflects $19.7mm stake in Canal 1 and $3mm stake in Remezcla as per HMTV management guidance. |
6
| HMTV Share Price Performance Since January 1, 2021 |
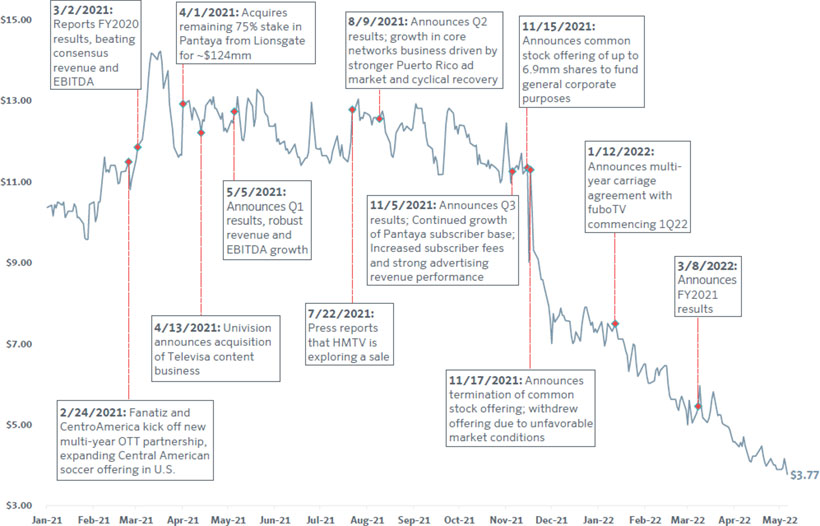
| Source: HMTV press releases; Capital IQ. |
| Note: Market data as of 5/6/2022. |
7
| Implied Premiums / Discounts at Offer Price of $7.00 per Share |
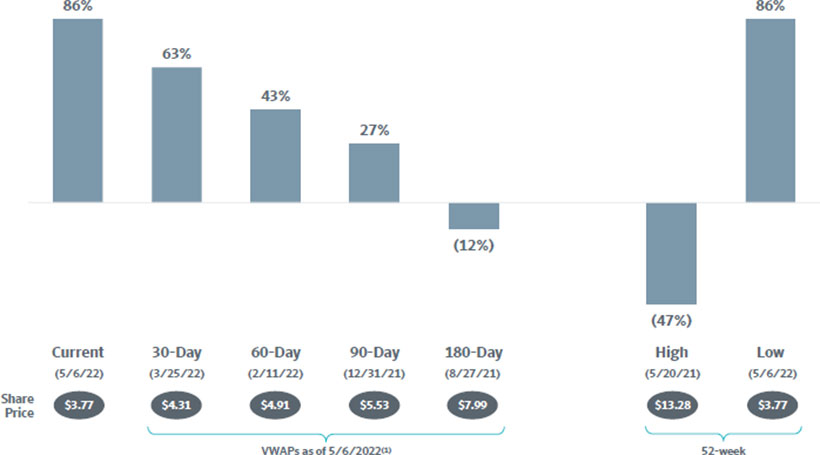
| Source: Capital IQ; Wall Street research. | ||
| Note: Market data as of 5/6/2022. Based on share prices at market close. | ||
| (1) VWAPs based on trading days. |
8
| Standalone HMTV Value Per Share By Methodology |
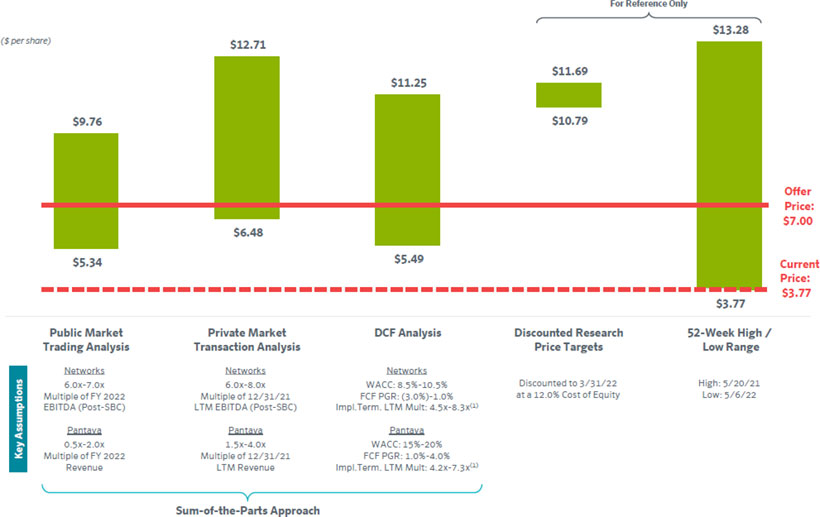
| Source: HMTV management; company filings; Capital IQ; Wall Street research. |
| Note: Market data as of 5/6/2022; per share calculations based on Q1 2022 balances of $251.6mm of debt, $1.7mm of post-tax pension liabilities, $37.3mm of cash and $22.7mm of equity-method investments. FDSO assumes ~20.7mm of Class A shares and ~19.7mm of Class B shares and potential dilution from ~4.4mm options at weighted-average strike price of $11.55. |
| (1) Implied terminal LTM EBITDA multiples shown on a post-SBC basis. |
9
| Networks and Pantaya Peer Group Operating Metrics Benchmarking Analysis | |
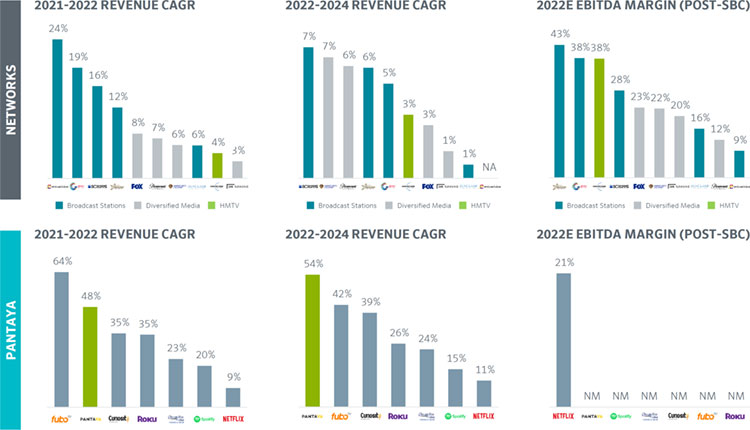
| Although both Networks and Pantaya have growth rates in-line with the relevant peer groups, their scale is significantly below most of their comparables. |
Source: HMTV management; company filings; Capital IQ; Wall Street research.
Note: Market data as of 5/6/2022.
10
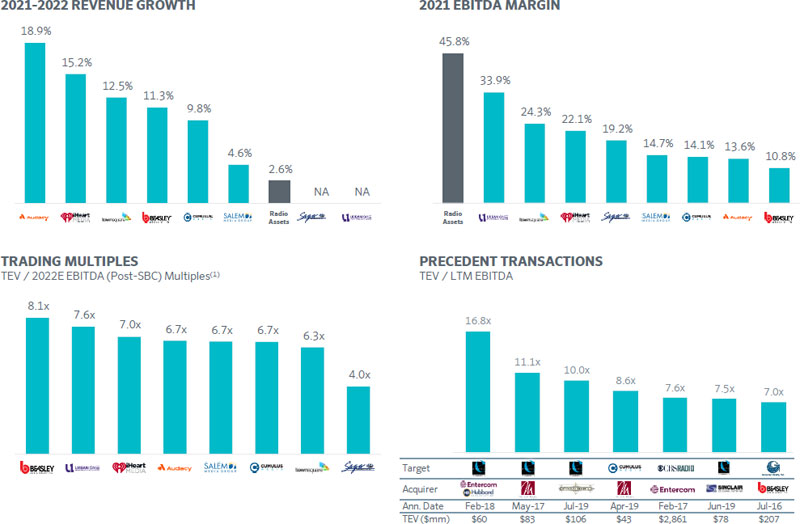
| Networks and Pantaya Peer Group Select Trading Multiples | |
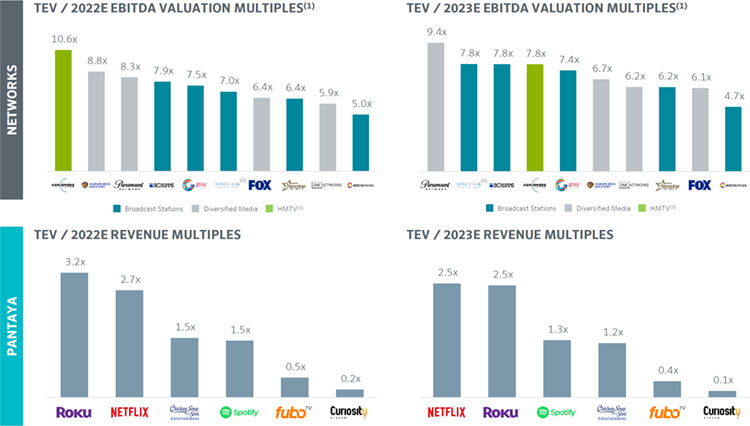
| Public comparables support a ‘22E EBITDA range of 6.0x-7.0x for Networks and a ‘22E EBITDA range of 0.5x-2.0x for Pantaya. |
| Source: HMTV management; company filings; Capital IQ; Wall Street research. | |
| Note: Market data as of 5/6/2022. | |
| (1) | Valuation multiples for Broadcast companies reflect 2021/2022 averages for 2022 and 2022/2023 averages for 2023. |
| (2) | Reflects debt at market value. |
| (3) | Reflects WholeCo multiple, which includes Pantaya losses. |
11
| Networks and Pantaya Private Market Precedent Transactions | |
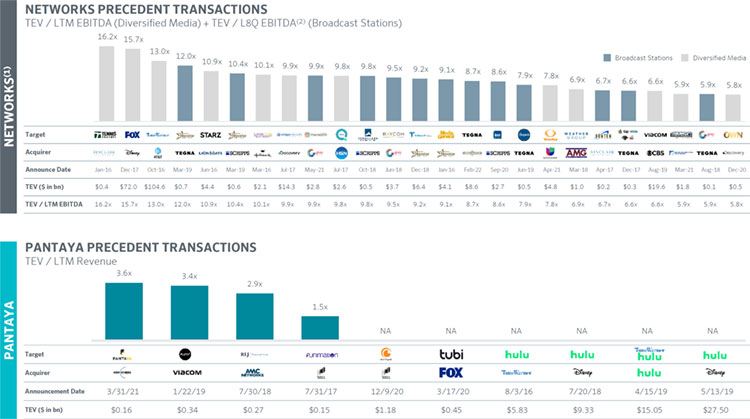
| Precedent transactions support a 12/31/21 LTM EBITDA (Post-SBC) range of 6.0x-8.0x for Networks and a 12/31/21 LTM Revenue range of 1.5x-4.0x for Pantaya(3). |
| Source: Capital IQ; press releases; Wall Street research. | |
| (1) | Excludes RSN transactions. |
| (2) | Represents last 8 quarters average. |
| (3) | Pantaya precedent transactions primarily occurred during a period with significantly higher growth expectations and valuations for the sector. |
12
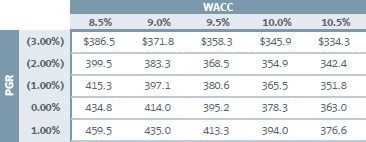
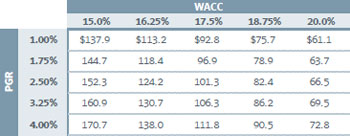
| 9.75-Year SOTP DCF Analysis | |
| (Figures in millions, except prices per share, percentages and multiples) | Low | High | ||
| Networks | ||||
| Free Cash Flow PGR | (3.0%) | 1.0% | ||
| WACC | 10.5% | 8.5% | ||
| Implied Terminal 2031E EBITDA Multiple (Post-SBC) | 4.5x | 8.3x | ||
| Networks Enterprise Value | $334.3 | $459.5 | ||
| Implied ‘21 EBITDA Multiple (Post-SBC) | 5.3x | 7.3x | ||
| Implied ‘22 EBITDA Multiple (Post-SBC) | 5.4x | 7.5x | ||
| Pantaya | ||||
| Free Cash Flow PGR | 1.0% | 4.0% | ||
| WACC | 20.0% | 15.0% | ||
| Implied Terminal 2031E Revenue Multiple | 1.0x | 1.7x | ||
| Implied Terminal 2031E EBITDA Multiple (Post-SBC) | 4.2x | 7.3x | ||
| Pantaya Enterprise Value | $61.1 | $170.7 | ||
| (+) Tax Synergy Adjustment(1) | 19.5 | 19.5 | ||
| Pantaya Enterprise Value (incl. Tax Synergy) | $80.7 | $190.2 | ||
| Implied ‘21 Revenue Multiple (excl. Tax Synergy) | 1.2x | 3.2x | ||
| Implied ‘22 Revenue Multiple (excl. Tax Synergy) | 0.8x | 2.2x | ||
| Total Consolidated Enterprise Value (incl. Pantaya Tax Synergy) | $415.0 | $649.7 | ||
| (-) Debt (3/31/2022) | (251.6) | (251.6) | ||
| (-) Post-Tax Pension(2) | (1.7) | (1.7) | ||
| (+) Cash (3/31/2022) | 37.3 | 37.3 | ||
| (+) Equity Method Investments(3) | 22.7 | 22.7 | ||
| Equity Value | $221.7 | $456.4 | ||
| (/) FDSO | 40.4 | 40.6 | ||
| Equity Value per Share | $5.49 | $11.25 |
| Source: HMTV filings; HMTV management. | |
| Note: Assumes 3/31/2022 valuation date. FDSO includes ~20.7mm of Class A shares and ~19.7mm of Class B shares and potential dilution from ~4.4mm options at weighted-average strike price of $11.55. Analysis assumes a 30.5% Networks tax rate and a 24.0% Pantaya tax rate for the purposes of calculating unlevered cash taxes. | |
| (1) | Reflects tax savings on account of Pantaya losses at the consolidated level; assumes a 10% discount rate (approximated based on the weighted average of the midpoints of the Networks and Pantaya WACC ranges). |
| (2) | Based on 12/31/21 balance of $2.3mm as per HMTV management guidance; tax-affected at a 28% tax rate. |
| (3) | Reflects $19.7mm stake in Canal 1 and $3mm stake in Remezcla as per HMTV management guidance. |
13
| HMTV Research Analyst Perspectives | FOR REFERENCE ONLY |
| ($mm, except prices per share) | ||||||||||||||||
| Broker | Price | Discounted | Reported (Pre-SBC) Adj. EBITDA | |||||||||||||
| (date) | Target(1) | Price Target(2) | Rating | 2022E | 2023E | 2024E | 2025E | Valuation Methodology | ||||||||
 | $13.00 | $11.69 | Overweight | $41 | $46 | --- | --- | ► SOTP analysis assumes 8x NTM EBITDA for WAPA Puerto Rico ($213mm), 7x for Cable Networks ($195mm), 125x TEV/Subs for Pantaya ($217mm) and $101mm valuation for HMTV‘s investments in Canal Uno, Remezcla & Mar Vista | ||||||||
| (3/8/2022) | ► On a consolidated basis, SOTP represents a multiple of ~43x NTM EBITDA | |||||||||||||||
| ► DCF analysis using a 9.5% WACC and a 2% PGR | ||||||||||||||||
 | $12.00 | $10.79 | Buy | $40 | $49 | $64 | $76 | |||||||||
| ► Valuation is based solely on DCF due to Pantaya acquisition | ||||||||||||||||
| (3/8/2022) | ||||||||||||||||
| Source: Wall Street research. | |
| Note: For reference only. | |
| (1) | Represents 12 month price targets from the date of the report. |
| (2) | Discounted at 12% cost of equity to 3/31/2022. |
14
| | |
| Appendix |
| HMTV Shareholder Profile |
| Class A | Class B | Options @ $7.00 | Total Treasury-Method | Ownership (%) | ||||||||
| ($ and shares in millions) | (1 Vote) | (10 Votes) | Per Share (Treasury) | Shares Outstanding(1) | Economic | Voting | ||||||
| Insiders | ||||||||||||
| Gato Investments(2) | 0.2 | 16.4 | - | 16.6 | 41.1% | 75.3% | ||||||
| Grupo MVS S.A. de C.V. | - | 2.7 | - | 2.7 | 6.7% | 12.5% | ||||||
| Employees, Mgmt & Directors | 3.0 | 0.6 | 0.02 | 3.6 | 8.9% | 4.1% | ||||||
| Total Insiders | 3.2 | 19.7 | 0.02 | 22.9 | 56.7% | 92.0% | ||||||
| Top 10 Institutions | ||||||||||||
| Fine Capital Partners | 3.3 | - | - | 3.3 | 8.1% | 1.5% | ||||||
| Edenbrook Capital | 3.1 | - | - | 3.1 | 7.6% | 1.4% | ||||||
| BlackRock | 1.1 | - | - | 1.1 | 2.7% | 0.5% | ||||||
| AIG Asset Management | 1.0 | - | - | 1.0 | 2.4% | 0.4% | ||||||
| The Vanguard Group | 0.9 | - | - | 0.9 | 2.1% | 0.4% | ||||||
| Renaissance Technologies | 0.8 | - | - | 0.8 | 2.0% | 0.4% | ||||||
| Columbia Management | 0.7 | - | - | 0.7 | 1.7% | 0.3% | ||||||
| Dimensional Fund Advisors | 0.7 | - | - | 0.7 | 1.7% | 0.3% | ||||||
| Wells Fargo Advisors | 0.4 | - | - | 0.4 | 0.9% | 0.2% | ||||||
| State Street Global Advisors | 0.4 | - | - | 0.4 | 0.9% | 0.2% | ||||||
| Total Top 10 Institutions | 12.2 | - | - | 12.2 | 30.3% | 5.6% | ||||||
| All Others | 5.3 | - | - | 5.3 | 13.0% | 2.4% | ||||||
| Total | 20.7 | 19.7 | - | 40.4 | 100.0% | 100.0% | ||||||
| Gato owns a total of ~15.7mm Class B shares and Peter Kern personally owns ~0.2mm Class A shares and ~0.7mm Class B shares; Gato and Peter Kern own a total of ~16.6mm shares (Peter Kern personally owns ~0.2mm Class A shares and ~0.7mm Class B shares); Gato Investments LP (“Gato”) is a Delaware limited partnership, Gemini Latin Holdings, LLC is the general partner of Gato and Peter Kern is the controlling person of Gemini; A Searchlight fund, as the sole limited partner in Gato, holds all of the economic interests in Gato (subject to Peter Kern‘s carried interest, which entitles him to payments in certain scenarios). |
| Source: HMTV management; HMTV filings. | |
| Note: RSUs are included in the Class A basis share counts. Total share count based on shares outstanding as of 5/6/22; institutions and insiders as of latest available. | |
| (1) | Options dilution assumes Treasury Stock Method based on offer price of $7.00. |
| (2) | Gato Investments total share count includes shares personally owned by Peter Kern (~0.2mm Class A and ~0.7mm Class B shares). |
16
| Public Market Trading Analysis: | |
| Bridge from Assumed Valuation Multiple to Value Per Share | |
| ($mm) | Low | High | ||||
| Networks | ||||||
| 2022E EBITDA (Post-SBC) | $61.6 | $61.6 | ||||
| (x) Multiple | 6.0x | 7.0x | ||||
| Networks Enterprise Value | $369.9 | $431.5 | ||||
| Pantaya | ||||||
| 2022E Revenue | $78.3 | $78.3 | ||||
| (x) Multiple | 0.5x | 2.0x | ||||
| Pantaya Enterprise Value | $39.2 | $156.6 | ||||
| Total Enterprise Value | $409.0 | $588.1 | ||||
| (-) Debt (3/31/2022) | (251.6 | ) | (251.6 | ) | ||
| (-) Post-Tax Pension(1) | (1.7 | ) | (1.7 | ) | ||
| (+) Cash (3/31/2022) | 37.3 | 37.3 | ||||
| (+) Equity Method Investments(2) | 22.7 | 22.7 | ||||
| Equity Value | $215.8 | $394.9 | ||||
| (/) FDSO | 40.4 | 40.4 | ||||
| Equity Value per Share | $5.34 | $9.76 |
| Source: HMTV filings; HMTV management. | |
| Note: Assumes 3/31/2022 valuation date. FDSO includes ~20.7mm of Class A shares and ~19.7mm of Class B shares and potential dilution from ~4.4mm options at weighted-average strike price of $11.55. | |
| (1) | Based on 12/31/21 balance of $2.3mm as per HMTV management guidance; tax-affected at a 28% tax rate. |
| (2) | Reflects $19.7mm stake in Canal 1 and $3mm stake in Remezcla as per HMTV management guidance. |
17
| Private Market Transaction Analysis: | |
| Bridge from Assumed Valuation Multiple to Value Per Share | |
| ($mm) | Low | High | ||||
| Networks | ||||||
| 12/31/2021 LTM EBITDA (Post-SBC) | $62.6 | $62.6 | ||||
| (x) Multiple | 6.0x | 8.0x | ||||
| Networks Enterprise Value | $375.6 | $500.8 | ||||
| Pantaya | ||||||
| 12/31/2021 LTM Revenue | $53.0 | $53.0 | ||||
| (x) Multiple | 1.5x | 4.0x | ||||
| Pantaya Enterprise Value | $79.5 | $211.9 | ||||
| Total Enterprise Value | $455.0 | $712.7 | ||||
| (-) Debt (3/31/2022) | (251.6 | ) | (251.6 | ) | ||
| (-) Post-Tax Pension(1) | (1.7 | ) | (1.7 | ) | ||
| (+) Cash (3/31/2022) | 37.3 | 37.3 | ||||
| (+) Equity Method Investments(2) | 22.7 | 22.7 | ||||
| Equity Value | $261.8 | $519.4 | ||||
| (/) FDSO | 40.4 | 40.9 | ||||
| Equity Value per Share | $6.48 | $12.71 | ||||
| Source: HMTV filings; HMTV management. | |
| Note: Assumes 3/31/2022 valuation date. FDSO includes ~20.7mm of Class A shares and ~19.7mm of Class B shares and potential dilution from ~4.4mm options at weighted-average strike price of $11.55. | |
| (1) | Based on 12/31/21 balance of $2.3mm as per HMTV management guidance; tax-affected at a 28% tax rate. |
| (2) | Reflects $19.7mm stake in Canal 1 and $3mm stake in Remezcla as per HMTV management guidance. |
18
| Networks 9.75-Year DCF Analysis |
FREE CASH FLOW BUILD
| ($mm) | Q2-Q4 ‘22E | 2023E | 2024E | 2025E | 2026E | 2027E | 2028E | 2029E | 2030E | 2031E | Normalized | ||||||||||||||||||||||
| Revenue | $124.2 | $163.5 | $172.7 | $170.4 | $175.8 | $178.9 | $187.4 | $183.3 | $185.5 | $187.8 | $189.4 | (4) | |||||||||||||||||||||
| % Growth | 31.7 | % | 5.6 | % | (1.4 | %) | 3.2 | % | 1.8 | % | 4.8 | % | (2.2 | %) | 1.2 | % | 1.3 | % | |||||||||||||||
| Adjusted EBITDA (Pre-SBC) | $52.4 | $66.4 | $70.4 | $65.0 | $66.2 | $65.5 | $69.5 | $61.7 | $60.5 | $59.0 | $60.1 | (4) | |||||||||||||||||||||
| % Margin | 42.2 | % | 40.6 | % | 40.8 | % | 38.2 | % | 37.7 | % | 36.6 | % | 37.1 | % | 33.7 | % | 32.6 | % | 31.4 | % | 31.7 | % | |||||||||||
| % Growth | 26.7 | % | 6.1 | % | (7.7 | %) | 1.8 | % | (1.1 | %) | 6.2 | % | (11.3 | %) | (2.0 | %) | (2.5 | %) | |||||||||||||||
| (-) SBC | (3.7 | ) | (5.3 | ) | (5.5 | ) | (5.8 | ) | (6.1 | ) | (6.4 | ) | (6.7 | ) | (7.1 | ) | (7.4 | ) | (7.8 | ) | (7.8 | ) | |||||||||||
| (-) Severance | – | – | – | – | – | – | – | – | (0.5 | ) | (0.5 | ) | – | ||||||||||||||||||||
| (+) Programming Amortization | 11.1 | 12.9 | 13.4 | 13.9 | 14.4 | 15.1 | 15.8 | 16.5 | 17.2 | 18.0 | 18.0 | ||||||||||||||||||||||
| (+) Other Adjustments(1) | 0.4 | 0.5 | 0.3 | 0.2 | 0.2 | 0.2 | 0.2 | 0.2 | 0.2 | 0.2 | 0.2 | ||||||||||||||||||||||
| (-) Capital Expenditures | (2.7 | ) | (4.0 | ) | (4.0 | ) | (4.0 | ) | (4.0 | ) | (5.0 | ) | (5.0 | ) | (5.0 | ) | (6.0 | ) | (6.0 | ) | (6.0 | ) | |||||||||||
| (-) Cash Content Spend(2) | (10.2 | ) | (13.6 | ) | (14.2 | ) | (15.0 | ) | (15.7 | ) | (16.4 | ) | (17.1 | ) | (17.9 | ) | (18.7 | ) | (19.6 | ) | (19.6 | ) | |||||||||||
| (-) Equity Method Investments | (0.9 | ) | – | – | – | – | – | – | – | – | – | – | |||||||||||||||||||||
| (+) Decrease / (Increase) in NWC | 4.6 | 3.3 | (0.2 | ) | 1.9 | 0.6 | 0.5 | (0.2 | ) | 1.0 | 0.1 | 0.1 | 0.1 | ||||||||||||||||||||
| (-) Unlevered Cash Taxes(3) | (13.7 | ) | (17.1 | ) | (18.2 | ) | (16.5 | ) | (16.7 | ) | (16.4 | ) | (17.6 | ) | (15.1 | ) | (14.4 | ) | (13.9 | ) | (14.1 | ) | |||||||||||
| Unlevered Free Cash Flow | $37.1 | $43.1 | $41.9 | $39.9 | $38.9 | $37.0 | $38.8 | $34.3 | $30.9 | $29.5 | $30.9 | ||||||||||||||||||||||
| % Growth | 16.1 | % | (2.7 | %) | (5.0 | %) | (2.5 | %) | (4.8 | %) | 4.9 | % | (11.7 | %) | (9.9 | %) | (4.4 | %) | |||||||||||||||
| Discount Period | 0.375 | 1.250 | 2.250 | 3.250 | 4.250 | 5.250 | 6.250 | 7.250 | 8.250 | 9.250 | 9.250 | ||||||||||||||||||||||
| Discount Factor | 0.97 | 0.89 | 0.82 | 0.74 | 0.68 | 0.62 | 0.57 | 0.52 | 0.47 | 0.43 | 0.43 | ||||||||||||||||||||||
| PV of Unlevered Free Cash Flow | $35.9 | $38.5 | $34.2 | $29.7 | $26.4 | $23.0 | $22.0 | $17.8 | $14.6 | $12.8 | $13.3 | ||||||||||||||||||||||
| Memo: D&A | $3.7 | $5.0 | $5.2 | $5.2 | $5.3 | $5.3 | $5.3 | $5.3 | $5.3 | $5.3 | $6.0 | ||||||||||||||||||||||
ENTERPRISE VALUATION SUMMARY
| WACC | 9.5 | % | |
| PGR | (1.0 | %) | |
| Terminal UFCF | $30.9 | ||
| Terminal Value | $291.1 | ||
| Implied Terminal Multiple (Post-SBC) | 5.8x | ||
| PV of UFCF (‘22-‘31) | $254.9 | ||
| PV of Terminal Value | $125.7 | ||
| Terminal Value % of TEV | 33.0 | % | |
| Implied Enterprise Value | $380.6 |
ENTERPRISE VALUATION SENSITIVITY ANALYSIS ($MM)
Source: HMTV filings; Wall Street research; HMTV management.
Note: Assumes 3/31/2022 valuation date; base case assumes 9.5% WACC and (1.0)% PGR.
| (1) | Other adjustments includes Provision for Bad Debts, Amortization of Operating Lease Right-of-Use Assets and Proceeds from FCC Spectrum Repack. |
| (2) | Includes Change in Programming Rights, Programming Rights Payable, Original Production Rights and Caribbean / Other Production Acquisitions. |
| (3) | Unlevered cash taxes calculated based on Adjusted EBITDA less D&A, SBC and Severance; assumes 30.5% tax rate. |
| (4) | Normalized terminal year includes $1.575mm of political ad revenue, $0.275mm of agency costs and $0.2125mm of news coverage costs. |
19
| Pantaya 9.75-Year DCF Analysis |
FREE CASH FLOW BUILD
| ($mm) | Q2-Q4 ‘22E | 2023E | 2024E | 2025E | 2026E | 2027E | 2028E | 2029E | 2030E | 2031E | Normalized | ||||||||||||||||||||||
| Revenue | $63.0 | $138.2 | $186.2 | $181.2 | $202.2 | $242.9 | $270.3 | $288.8 | $304.3 | $317.0 | $317.0 | ||||||||||||||||||||||
| % Growth | 119.4 | % | 34.7 | % | (2.7 | %) | 11.6 | % | 20.1 | % | 11.3 | % | 6.8 | % | 5.4 | % | 4.2 | % | |||||||||||||||
| Adjusted EBITDA (Pre-SBC) | ($15.5 | ) | ($15.2 | ) | ($1.2 | ) | $13.5 | $30.7 | $51.0 | $59.9 | $69.2 | $73.8 | $76.2 | $76.2 | |||||||||||||||||||
| % Margin | (24.6 | %) | (11.0 | %) | (0.6 | %) | 7.4 | % | 15.2 | % | 21.0 | % | 22.2 | % | 23.9 | % | 24.3 | % | 24.0 | % | 24.0 | % | |||||||||||
| % Growth | (1.7 | %) | (92.3 | %) | NM | 128.2 | % | 66.0 | % | 17.4 | % | 15.5 | % | 6.7 | % | 3.2 | % | ||||||||||||||||
| (-) SBC | (1.2 | ) | (1.8 | ) | (1.8 | ) | (1.9 | ) | (2.0 | ) | (2.1 | ) | (2.2 | ) | (2.4 | ) | (2.5 | ) | (2.6 | ) | (2.6 | ) | |||||||||||
| (-) Capital Expenditures | (1.2 | ) | (0.8 | ) | (0.8 | ) | (0.8 | ) | (0.8 | ) | (0.8 | ) | (0.8 | ) | (0.8 | ) | (0.8 | ) | (0.8 | ) | (0.8 | ) | |||||||||||
| (-) Cash Content Spend | (27.0 | ) | (35.5 | ) | (39.1 | ) | (43.0 | ) | (47.3 | ) | (52.0 | ) | (57.2 | ) | (63.0 | ) | (69.3 | ) | (76.2 | ) | (81.5 | ) | |||||||||||
| (+) Content Amortization | 11.0 | 24.6 | 33.8 | 42.4 | 47.2 | 54.3 | 61.8 | 68.0 | 74.5 | 81.5 | 81.5 | ||||||||||||||||||||||
| (+) Decrease / (Increase) in NWC | (8.7 | ) | (2.6 | ) | (7.7 | ) | 1.9 | (2.5 | ) | (3.6 | ) | (3.2 | ) | (1.6 | ) | (1.2 | ) | (2.0 | ) | (2.0 | ) | ||||||||||||
| (-) Unlevered Cash Taxes(1) | – | – | – | – | (5.8 | ) | (10.6 | ) | (12.7 | ) | (14.9 | ) | (16.0 | ) | (17.4 | ) | (17.5 | ) | |||||||||||||||
| Unlevered Free Cash Flow | ($42.6 | ) | ($31.2 | ) | ($16.8 | ) | $12.1 | $19.6 | $36.2 | $45.6 | $54.6 | $58.5 | $58.7 | $53.3 | |||||||||||||||||||
| % Growth | (26.7 | %) | (46.3 | %) | (172.3 | %) | 62.1 | % | 84.5 | % | 25.8 | % | 19.9 | % | 7.2 | % | 0.3 | % | |||||||||||||||
| Discount Period | 0.375 | 1.250 | 2.250 | 3.250 | 4.250 | 5.250 | 6.250 | 7.250 | 8.250 | 9.250 | 9.250 | ||||||||||||||||||||||
| Discount Factor | 0.94 | 0.82 | 0.70 | 0.59 | 0.50 | 0.43 | 0.36 | 0.31 | 0.26 | 0.22 | 0.22 | ||||||||||||||||||||||
| PV of Unlevered Free Cash Flow | ($40.1 | ) | ($25.5 | ) | ($11.7 | ) | $7.2 | $9.9 | $15.5 | $16.6 | $17.0 | $15.5 | $13.2 | $12.0 | |||||||||||||||||||
| Memo: D&A | $14.9 | $19.8 | $19.8 | $12.4 | $4.7 | $4.7 | $4.7 | $4.7 | $4.7 | $1.2 | $0.8 | ||||||||||||||||||||||
| ENTERPRISE VALUATION SUMMARY | |||
| WACC | 17.5 | % | |
| PGR | 2.5 | % | |
| Terminal UFCF | $53.3 | ||
| Terminal Value | $364.4 | ||
| Implied Terminal Multiple (Post-SBC) | 5.4x | ||
| PV of UFCF (‘22-‘31) | $19.4 | ||
| PV of Terminal Value | $82.0 | ||
| Terminal Value % of TEV | 80.9 | % | |
| Implied Enterprise Value | $101.3 | ||
ENTERPRISE VALUATION SENSITIVITY ANALYSIS ($MM)
Source: HMTV filings; Wall Street research; HMTV management.
Note: Assumes 3/31/2022 valuation date; base case assumes 17.5% WACC and 2.5% PGR.
| (1) | Unlevered cash taxes calculated based on Adjusted EBITDA less D&A and SBC; assumes 24% tax rate. |
20
| Standalone HMTV Unlevered Tax Synergy Calculation | |
| ($mm) | Q2-Q4 '22E | 2023E | 2024E | 2025E | 2026E | 2027E | 2028E | 2029E | 2030E | 2031E | ||||||||||||||||||||
| Pantaya Standalone DCF Taxes | ||||||||||||||||||||||||||||||
| Allocated EBIT | ($31.6 | ) | ($36.8 | ) | ($22.8 | ) | ($0.9 | ) | $24.0 | $44.2 | $52.9 | $62.1 | $66.6 | $72.4 | ||||||||||||||||
| Allocated Tax Rate | -- | -- | -- | -- | 24.0 | % | 24.0 | % | 24.0 | % | 24.0 | % | 24.0 | % | 24.0 | % | ||||||||||||||
Allocated Tax (Shield) / Expense  | - | - | - | - | $5.8 | $10.6 | $12.7 | $14.9 | $16.0 | $17.4 | ||||||||||||||||||||
| Pantaya Consolidated DCF Impact | ||||||||||||||||||||||||||||||
| Allocated EBIT | ($31.6 | ) | ($36.8 | ) | ($22.8 | ) | ($0.9 | ) | $24.0 | $44.2 | $52.9 | $62.1 | $66.6 | $72.4 | ||||||||||||||||
| Allocated Tax Rate | 24.0 | % | 24.0 | % | 24.0 | % | 24.0 | % | 24.0 | % | 24.0 | % | 24.0 | % | 24.0 | % | 24.0 | % | 24.0 | % | ||||||||||
Allocated Tax (Shield) / Expense  | ($7.6 | ) | ($8.8 | ) | ($5.5 | ) | ($0.2 | ) | $5.8 | $10.6 | $12.7 | $14.9 | $16.0 | $17.4 | ||||||||||||||||
Implied Tax Synergy | $7.6 | $8.8 | $5.5 | $0.2 | - | - | - | - | - | - | ||||||||||||||||||||
| Discount Period | 0.375 | 1.250 | 2.250 | 3.250 | 4.250 | 5.250 | 6.250 | 7.250 | 8.250 | 9.250 | ||||||||||||||||||||
| Discount Factor | 0.96 | 0.88 | 0.79 | 0.71 | 0.64 | 0.58 | 0.52 | 0.47 | 0.42 | 0.38 | ||||||||||||||||||||
| PV of Implied Tax Synergy | $7.3 | $7.7 | $4.3 | $0.2 | - | - | - | - | - | - | ||||||||||||||||||||
| NPV of Unlevered Tax Synergies | $19.5 | |||||||||||||||||||||||||||||
Source: HMTV management.
Note: Assumes a 11% discount rate (approximated based on the weighted average of the midpoints of the Networks and Pantaya WACC ranges).
21
| Diversified Media Public Market Trading Analysis | |
| (Figures in millions, except per share figures) |  |  |  |  |  | ||||||||||
| Share Price | $3.77 | $32.45 | $33.50 | $28.05 | $17.75 | ||||||||||
| (x) FDSO | 40 | 45 | 569 | 657 | 2,427 | ||||||||||
| Market Capitalization | $152 | $1,452 | $19,050 | $18,426 | $43,072 | ||||||||||
| (+) Debt | 252 | 2,893 | 7,204 | 17,370 | 56,634 | ||||||||||
| (+) Preferred Stock | - | - | - | - | - | ||||||||||
| (-) Cash | (37 | ) | (822 | ) | (3,505 | ) | (6,713 | ) | (5,599 | ) | |||||
| (+) Non-Controlling Interest(3) | - | 339 | 763 | 598 | 1,434 | ||||||||||
| (+) Pension Obligations(4) | 2 | - | 469 | 1,575 | - | ||||||||||
| (-) Equity Method Investments(5) | (23 | ) | (135 | ) | (3,022 | ) | (568 | ) | (2,108 | ) | |||||
| TEV | $346 | $3,727 | $20,959 | $30,688 | $93,433 | ||||||||||
| '22-'24 Revenue Growth & Margin Metrics | |||||||||||||||
| '22E-'24E Revenue CAGR | 22.4 | % | 1.5 | % | 2.9 | % | 6.1 | % | 6.6 | % | |||||
| '21A EBITDA (Post-SBC) Margin | 17.8 | % | 22.8 | % | 22.9 | % | 15.4 | % | 23.0 | % | |||||
| '22E EBITDA (Post-SBC) Margin | 13.5 | % | 19.8 | % | 22.5 | % | 12.2 | % | 22.2 | % | |||||
| Valuation Multiples | |||||||||||||||
| TEV / ‘22E EBITDA (Post-SBC) | 10.6 | x | 5.9 | x | 6.4 | x | 8.3 | x | 8.8 | x | |||||
| TEV / ‘23E EBITDA (Post-SBC) | 7.8 | x | 6.2 | x | 6.1 | x | 9.4 | x | 6.7 | x | |||||
| TEV / ‘24E EBITDA (Post-SBC) | 5.6 | x | 6.2 | x | 6.3 | x | 8.1 | x | 6.7 | x | |||||
Source: Capital IQ; company filings.
Note: Market data as of 5/6/2022; balance sheet figures for Warner Bros.Discovery and Fox as of 12/31/2021; HMTV, AMC Networks and Paramount as of 3/31/2022.
| (1) | HMTV balance sheet as of 3/31/2022. |
| (2) | Pro forma for WarnerMedia transaction announced on May 17, 2021 and closed on April 8, 2022. |
| (3) | Non-controlling interest figures based on disclosure in company filings; AMC Networks includes RLJE and BBC America; Fox includes Big Ten Network and Credible; Paramount includes redeemable put option to an international subsidiary; Warner Bros.Discovery includes Discovery Family, MotorTrend Group, OWN, Food Network and Cooking Channel. |
| (4) | Reflects post-tax pension obligations. |
| (5) | HMTV reflects $19.7mm stake in Canal 1 and $3mm stake in Remezcla; Equity Method Investments figures based on disclosure in company filings; AMC Networks includes stakes in ACL and a Toronto-based production company and studio; Fox includes Caffeine Studios; Paramount includes The CW and Viacom18; Warner Bros.Discovery includes stakes in nC+, Discovery Solar Ventures, All3Media, Group Nine Media, Formula E and Philo. |
22
| Broadcast Station Public Market Trading Analysis | |
| (Figures in millions, except per share figures) |  |  |  |  |  Debt @ Face Value |
Debt @ Market Value | ||||||||||||
| Share Price | $4.44 | $18.84 | $158.41 | $16.39 | $23.98 | $23.98 | ||||||||||||
| (x) FDSO | 90 | 96 | 43 | 86 | 72 | 72 | ||||||||||||
| Market Capitalization | $398 | $1,808 | $6,827 | $1,404 | $1,719 | $1,719 | ||||||||||||
| (+) Debt | 213 | 6,831 | 7,494 | 3,158 | 13,125 | 7,258 | ||||||||||||
| (+) Preferred Stock | - | 650 | - | 600 | 175 | 175 | ||||||||||||
| (-) Cash | (214 | ) | (217 | ) | (78 | ) | (35 | ) | (816 | ) | (816 | ) | ||||||
| (+) Non-Controlling Interest(1) | - | - | 7 | - | 64 | 64 | ||||||||||||
| (+) Pension Obligations(2) | - | 17 | 104 | 82 | - | - | ||||||||||||
| (-) Equity Method Investments(3) | - | (117 | ) | (1,219 | ) | (6 | ) | (517 | ) | (517 | ) | |||||||
| TEV | $398 | $8,971 | $13,136 | $5,203 | $13,750 | $7,883 | ||||||||||||
| '22-'24 Revenue Growth & Margin Metrics | ||||||||||||||||||
| '22E-'24E Revenue CAGR | NA | 5.2 | % | 6.0 | % | 7.1 | % | 0.7 | % | 0.7 | % | |||||||
| '21A EBITDA (Post-SBC) Margin | 10.3 | % | 30.0 | % | 40.8 | % | 25.5 | % | 20.1 | % | 20.1 | % | ||||||
| '22E EBITDA (Post-SBC) Margin | 8.6 | % | 38.4 | % | 42.6 | % | 28.0 | % | 15.7 | % | 15.7 | % | ||||||
| Valuation Multiples | ||||||||||||||||||
| TEV / '21A EBITDA (Post-SBC) | 5.1 | x | 9.5 | x | 6.9 | x | 8.9 | x | 11.1 | x | 6.4 | x | ||||||
| TEV / '22E EBITDA (Post-SBC) | 4.9 | x | 6.2 | x | 5.9 | x | 7.0 | x | 13.5 | x | 7.7 | x | ||||||
| TEV / '23E EBITDA (Post-SBC) | 4.6 | x | 9.0 | x | 6.4 | x | 8.8 | x | 13.9 | x | 8.0 | x | ||||||
| TEV / '24E EBITDA (Post-SBC) | NA | 5.7 | x | 5.4 | x | 5.9 | x | 13.2 | x | 7.6 | x | |||||||
| TEV / '21A-'22E Avg. EBITDA (Post-SBC) | 5.0 | x | 7.5 | x | 6.4 | x | 7.9 | x | 12.2 | x | 7.0 | x | ||||||
| TEV / '22E-'23E Avg. EBITDA (Post-SBC) | 4.7 | x | 7.4 | x | 6.2 | x | 7.8 | x | 13.7 | x | 7.8 | x | ||||||
| TEV / '23E-'24E Avg. EBITDA (Post-SBC) | NA | 7.0 | x | 5.9 | x | 7.1 | x | 13.5 | x | 7.8 | x | |||||||

Source: Capital IQ; IHS Markit; Bloomberg; company filings.
Note: Market data as of 5/6/2022; balance sheet figures for Nexstar and Sinclair as of 12/31/2021; Entravision, Gray and Scripps as of 3/31/2022.
| (1) | Non-controlling interest figures based on disclosure in company filings; Nexstar includes stakes in VIEs; TEGNA includes stake in Premion; Sinclair includes stakes in RSNs and VIEs. |
| (2) | Reflects post-tax pension obligations. |
| (3) | Equity Method Investments figures based on disclosure in company filings; Gray includes investments in several television, production and technology companies; Nexstar includes stake in TV Food Network; Scripps includes investments in private companies; Sinclair includes investment in YES Network and entities that are primarily focused on the development of real estate, sustainability initiatives, and other non-media businesses. |
| (4) | Entravision figures denoted by “NA” are not available due to lack of research coverage. |
23
| OTT Platform Public Market Trading Analysis | |
| (Figures in millions, except per share figures) |  |  |  |  |  |  | ||||||||||||
| Share Price | $9.59 | $2.07 | $3.25 | $180.97 | $96.83 | $104.68 | ||||||||||||
| (x) FDSO | 16 | 54 | 159 | 444 | 145 | 195 | ||||||||||||
| Market Capitalization | $150 | $111 | $516 | $80,400 | $14,039 | $20,392 | ||||||||||||
| (+) Debt | 67 | - | 409 | 14,623 | 89 | 1,259 | ||||||||||||
| (+) Preferred Stock | 54 | - | - | - | - | - | ||||||||||||
| (-) Cash | (45 | ) | (81 | ) | (374 | ) | (6,009 | ) | (2,235 | ) | (3,747 | ) | ||||||
| (+) Non-Controlling Interest(2) | 1 | - | (11 | ) | - | - | - | |||||||||||
| (+) Pension Obligations(3) | - | - | - | - | - | - | ||||||||||||
| (-) Equity Method Investments and Other(4) | - | (10 | ) | - | - | - | - | |||||||||||
| TEV | $226 | $20 | $540 | $89,014 | $11,892 | $17,904 | ||||||||||||
| Growth & Margin Metrics | ||||||||||||||||||
| '22E-'24E Revenue (Post-SBC) CAGR | 23.6% | 38.6% | 41.8% | 10.8% | 26.0% | 15.5% | ||||||||||||
| '21A-'23E EBITDA (Post-SBC) CAGR | NM | NM | NM | 12.3% | (58.0% | ) | (4.6% | ) | ||||||||||
| '22E EBITDA (Post-SBC) Margin | NM | NM | NM | 20.5% | NM | NM | ||||||||||||
| Revenue Multiples | ||||||||||||||||||
| TEV / '22E Revenue | 1.5x | 0.2x | 0.5x | 2.7x | 3.2x | 1.5x | ||||||||||||
| TEV / '23E Revenue | 1.2x | 0.1x | 0.4x | 2.5x | 2.5x | 1.3x | ||||||||||||
| TEV / '24E Revenue | 1.0x | 0.1x | 0.3x | 2.2x | 2.0x | 1.1x | ||||||||||||
| Valuation Multiples(1) | ||||||||||||||||||
| TEV / '22E EBITDA (Post-SBC) | NM | NM | NM | 13.4 | x | NM | NM | |||||||||||
| TEV / '23E EBITDA (Post-SBC) | NM | NM | NM | 11.8 | x | NM | NM | |||||||||||
| TEV / '24E EBITDA (Post-SBC) | NM | NM | NM | 9.8 | x | NM | 39.7x | |||||||||||
Source: Capital IQ; company filings.
Note: Market data as of 5/6/2022; balance sheet figures for Chicken Soup, CuriosityStream and fuboTV as of 12/31/2021; Netflix, Roku and Spotify as of 3/31/2022.
| (1) | NM denotes multiples in excess of 50.0x or instances in which forecasted EBITDA is expected to be negative. |
| (2) | Non-controlling interest figures based on disclosure in company filings; Chicken Soup for the Soul Entertainment includes stakes in CSS AVOD, Locomotive Global and Landmark Studio Group; fuboTV includes stake in Evolution AI Corporation. |
| (3) | Reflects post-tax pension obligations. |
| (4) | Equity Method Investments figures based on disclosure in company filings; includes CuriosityStream‘s stakes in Spiegel Venture and Nebula. |
24
| Radio Public Market Trading Analysis | |
| (Figures in millions, except per share figures) |  |  |  |  |  |  |  |  | ||||||||||||||||
| Share Price | $2.21 | $1.66 | $15.44 | $14.01 | $22.90 | $2.95 | $11.06 | $7.64 | ||||||||||||||||
| (x) FDSO | 144 | 30 | 22 | 150 | 6 | 27 | 20 | 54 | ||||||||||||||||
| Market Capitalization | $318 | $50 | $333 | $2,097 | $139 | $80 | $216 | $414 | ||||||||||||||||
| (+) Debt | 1,827 | 300 | 1,011 | 5,771 | - | 175 | 550 | 833 | ||||||||||||||||
| (+) Preferred Stock | - | - | - | - | - | - | - | - | ||||||||||||||||
| (-) Cash | (60 | ) | (51 | ) | (181 | ) | (390 | ) | (55 | ) | (3 | ) | (51 | ) | (132 | ) | ||||||||
| (+) Minority Interest | - | - | - | 8 | - | - | 3 | 17 | ||||||||||||||||
| (+) Pension Obligations(1) | - | 8 | - | - | - | - | - | - | ||||||||||||||||
| (-) Equity Method Investments and Other | - | (2 | ) | - | (11 | ) | - | - | - | - | ||||||||||||||
| TEV | $2,085 | $305 | $1,163 | $7,475 | $83 | $252 | $719 | $1,132 | ||||||||||||||||
| Growth & Margin Metrics | ||||||||||||||||||||||||
| '21A-'22E Revenue Growth | 18.9 | % | 11.3 | % | 9.8 | % | 15.2 | % | NA | 4.6 | % | 12.5 | % | NA | ||||||||||
| '21A-'22E EBITDA (Post-SBC) Growth | 87.2 | % | 45.3 | % | 34.8 | % | 36.3 | % | NA | (0.8 | %) | 12.0 | % | NA | ||||||||||
| '21A EBITDA (Post-SBC) Margin | 13.6 | % | 10.8 | % | 14.1 | % | 22.1 | % | 19.2 | % | 14.7 | % | 24.3 | % | 33.9 | % | ||||||||
| '22E EBITDA (Post-SBC) Margin | 21.4 | % | 14.0 | % | 17.4 | % | 26.2 | % | NA | 14.0 | % | 24.2 | % | NA | ||||||||||
| Valuation Multiples | ||||||||||||||||||||||||
| TEV / '21A EBITDA (Post-SBC) | 12.6 | x | 11.7 | x | 9.0 | x | 9.5 | x | 4.0 | x | 6.6 | x | 7.1 | x | 7.6 | x | ||||||||
| TEV / '22E EBITDA (Post-SBC) | 6.7 | x | 8.1 | x | 6.7 | x | 7.0 | x | NA | 6.7 | x | 6.3 | x | NA | ||||||||||
| TEV / '23E EBITDA (Post-SBC) | 6.1 | x | 8.0 | x | 6.3 | x | 6.5 | x | NA | 6.3 | x | 6.1 | x | NA | ||||||||||
| TEV / '21A-'22E Avg. EBITDA (Post-SBC) | 8.8 | x | 9.6 | x | 7.6 | x | 8.0 | x | NA | 6.6 | x | 6.7 | x | NA | ||||||||||
Source: Capital IQ; company filings.
Note: Market data as of 5/6/2022; balance sheet figures for Audacy, Beasley, iHeart, Salem, Townsquare and Urban One as of 12/31/2021; Cumulus and Saga as of 3/31/2022.
| (1) | Reflects post-tax pension obligations. |
25
| Radio Assets Peer Group Operating Benchmarking and Valuation Multiples | |
Source: Capital IQ; company filings; press releases.
Note: Market data as of 5/6/2022.
(1) TEV / 2021A EBITDA (Post-SBC) multiples utilized for Saga Communications and Urban One due to lack of available broker projections for 2022E EBITDA.
26
| Broadcast Stations Private Market Transaction Analysis |
($ in millions)
| Announced | Revenue Growth | ||||
| Date | Target | Acquiror | 1 Year Forward | TEV | L8Q(1) |
| 2/22/2022 | Tegna | Standard General | NA | $8,600 | 8.7x |
| 5/3/2021 | Meredith Local Media Group | Gray | NA | 2,825 | 9.9x |
| 9/25/2020 | Ion Media | Scripps Networks | NA | 2,650 | 8.6x |
| 6/11/2019 | Dispatch Broadcast Group (2 Stations) | Tegna | NA | 535 | 7.9x |
| 3/20/2019 | Nexstar (8 Stations) | Scripps Networks | NA | 580 | 10.4x |
| 3/20/2019 | Nexstar (11 Stations) | Tegna | NA | 740 | 12.0x |
| 12/3/2018 | Tribune | Nexstar | 4% | 6,400 | 9.2x |
| 10/31/2018 | Cordillera Communications (15 stations) | Scripps Networks | NA | 521 | 9.8x |
| 8/20/2018 | Gray (2 Stations) | Tegna | NA | 105 | 5.9x |
| 6/25/2018 | Raycom | Gray | NA | 3,660 | 9.5x |
| 12/18/2017 | Midwest Television (4 Stations) | Tegna | NA | 325 | 6.6x |
| 4/21/2017 | Bonten Media Group | Sinclair Broadcasting | NA | 240 | 6.7x |
| 1/27/2016 | Media General | Nexstar | 20% | 4,115 | 9.1x |
| Mean | 8.8x | ||||
| Median | 9.1x |
Source: Capital IQ; press releases; Wall Street research.
| (1) | Represents last 8 quarters average unless otherwise note; For Tegna, reflects 2020/2021; for Meredith Local Media Group, reflects 2019/2020; for Ion Media, reflects 9/30/2020E LTM; for Dispatch, reflects 2018/2019E and includes run-rate synergies; for Nexstar (8 stations), reflects 2017/2018; for Nexstar (11 stations), reflects 2018/2019E based on equity research; for Tribune, announced purchase multiple did not specify applicable date ranges; for Cordillera Communications (15 stations), reflects 2017/2018 (Sept. year end); for Gray (2 stations), reflects 2017/2018E and includes run-rate synergies but not NPV of tax savings; for Raycom, reflects 2017/2018E (June year end); for Midwest Television (4 stations), reflects 2017E/2018E average and includes run-rate synergies and NPV of tax savings; for Bonten Media Group, announced 6.7x purchase multiple did not specify applicable date ranges; for Media General, reflects 2015E/2016E average. |
27
| Diversified Media Private Market Transaction Analysis |
($ in millions)
| Announced | Revenue Growth | EBITDA Multiple | ||||
| Date | Target | Acquiror | 1 Year Forward | TEV | LTM | NTM |
| 4/13/2021 | Televisa | Univision | 7% | $4,800 | 7.8x | 7.8x |
| 3/26/2021 | MSGN | MSGSE | (6%) | 1,765 | 5.9x | 7.7x |
| 12/22/2020 | OWN | Discovery | NA | 490 | 5.8x | NA |
| 8/13/2019 | Viacom | CBS | 2% | 19,557 | 6.6x | 6.8x |
| 3/22/2018 | Weather Group | Allen Media | NA | 977 | 6.9x | NA |
| 12/14/2017 | Fox | Disney | NA | 72,010 | 15.7x | 14.4x |
| 7/31/2017 | Scripps | Discovery | 4% | 14,259 | 9.9x | 9.6x |
| 7/6/2017 | HSN | QVC | 1% | 2,600 | 9.8x | 9.1x |
| 10/22/2016 | Time Warner | AT&T | 7% | 104,647 | 13.0x | 12.0x |
| 6/30/2016 | Starz | Lions Gate | (0%) | 4,400 | 10.9x | 9.8x |
| 3/9/2016 | Crown Media | Hallmark | NA | 2,088 | 10.1x | NA |
| 1/27/2016 | Tennis Channel | Sinclair Broadcasting | NA | 350 | 16.2x | NA |
| Mean | 9.9x | 9.6x | ||||
| Median | 9.9x | 9.4x | ||||
Source: Capital IQ; press releases; Wall Street research.
28
| OTT Private Market Transaction Analysis |
($ in millions)
| Announced | ||||||||
| Date | Target | Acquirer | Service Type | % Acquired | TEV | EV / LTM Revenu | TEV / LTM EBITDA | TEV / Subscribers |
| 7/30/18 | RLJ Entertainment | AMC Networks | SVOD | 30.4% | $274 | 2.9x | 14.8x | $334.1 |
| 3/31/21 | Pantaya | Hemisphere Media | SVOD | 75.0% | 165 | 3.6x | - | 183.1 |
| 12/9/20 | Crunchyroll | Sony Pictures Entertainment | SVOD | 100.0% | 1,175 | - | - | 391.7 |
| 1/22/19 | Pluto TV | Viacom | AVOD | 100.0% | 340 | 3.4x | - | 28.3 |
| 3/17/20 | Tubi | Fox Corporation | AVOD | 100.0% | 445 | - | - | 17.8 |
| 7/31/17 | Funimation | Sony Pictures Entertainment | SVOD | 95.0% | 151 | 1.5x (1) | - | - |
| 8/3/16 | Hulu | Time Warner (investment) | Hybrid | 10.0% | 5,830 | - | - | - |
| 7/20/18 | Hulu (Fox Interest) | Walt Disney | Hybrid | 30.0% | 9,329 | - | - | - |
| 4/15/19 | Hulu (Time Warner stake) | Hulu (redemption) | Hybrid | 9.5% | 15,053 | - | - | - |
| 5/13/19 | Hulu (Comcast Interest) | Walt Disney (Put/ Call Min.) | Hybrid | 33.0% | 27,500 | - | - | - |
| Mean | 3.3x | 14.8x | $191.0 | |||||
| Median | 3.4x | 14.8x | $183.1 |
| Source: Capital IQ; press releases; Wall Street research. |
| (1) Based on $100mm+ annual revenue figure as reported in press releases. |
29
| Radio Private Market Transaction Analysis | ||
| Announced | ||||
| Date | Target | Acquiror | TEV | TEV / LTM EBITDA |
| 8/31/2020 | Potomac Radio Group (1 Station) | iHeartMedia | $1 | NA |
| 3/17/2020 | Local Media San Diego (1 Station) | iHeartMedia | $1 | NA |
| 2/18/2020 | Entercom (1 Station) | Educational Media Foundation | $11 | NA |
| 12/30/2019 | Tegna (2 Stations) | Local Media San Diego | $5 | NA |
| 8/15/2019 | Salem Media (9 Stations in 8 Markets) | Immaculate Heart Media | $9 | NA |
| 8/8/2019 | Salem Media (4 Stations in Florida) | Immaculate Heart Media | $8 | NA |
| 7/1/2019 | Emmis (2 Stations) | Standard General | $106 | 10.0x |
| 6/27/2019 | Cumulus (1 Station) | Red Apple Media | $13 | NA |
| 6/10/2019 | Emmis (6 Stations) | Sinclair Telecable | $78 | 7.5x |
| 4/15/2019 | Cumulus (1 Station) | Meruelo Group | $43 | 8.6x |
| 2/13/2019 | Cumulus (6 Stations) | Entercom | $104 | NA |
| 2/4/2019 | Alpha Media (6 Stations) | Midwest Communications | $22 | NA |
| 9/27/2018 | Alpha Media (6 Stations) | Hubbard Radio | $88 | NA |
| 2/22/2018 | Emmis (4 Stations) | Hubbard Radio, Entercom | $60 | 12.0x |
| 5/9/2017 | Emmis (1 Station) | Meruelo Group | $83 | 11.1x |
| 11/1/2017 | Entercom (10 Stations) | iHeartMedia | NA | NA |
| 2/2/2017 | CBS Radio | Entercom | $2,861 | 8.1x |
| 7/19/2016 | Greater Media | Beasley | $207 | 7.0x |
| Mean | 9.2x | |||
| Median | 8.6x | |||
Source: Capital IQ; press releases; Wall Street research.
30
| Radio Assets Key Financials | ||
| ($mm) | 2017A | 2018A | 2019A | 2020A | 2021A | 2022E | '17-'19 CAGR | 19-'22 CAGR | |||||||||||||||||
| Total Gross Ad Sales (excl. Political) | $16.7 | $19.8 | $17.0 | $14.4 | $17.0 | $17.3 | 0.8% | 0.5% | |||||||||||||||||
| (+) Political Ad Revenue | 0.1 | 0.0 | 0.0 | 0.8 | 0.0 | – | (67.0%) | (100.0%) | |||||||||||||||||
| Total Gross Ad Sales | $16.9 | $19.8 | $17.0 | $15.1 | $17.0 | $17.3 | 0.4% | 0.5% | |||||||||||||||||
| (-) Direct Expenses | (3.7 | ) | (4.8 | ) | (3.7 | ) | (3.3 | ) | (3.4 | ) | (3.4 | ) | (0.1%) | (3.0%) | |||||||||||
| Total Net Ad Sales | $13.2 | $15.0 | $13.3 | $11.9 | $13.5 | $13.9 | 0.6% | 1.4% | |||||||||||||||||
| (+) Other Revenue | 0.9 | 1.1 | 1.1 | 0.7 | 0.7 | 0.7 | 8.6% | (14.3%) | |||||||||||||||||
| (+) Subscription Revenue | - | - | 0.2 | 0.2 | - | - | NA | (100.0%) | |||||||||||||||||
| Total Net Revenue | $14.1 | $16.0 | $14.6 | $12.8 | $14.2 | $14.6 | 1.8% | (0.1%) | |||||||||||||||||
| (-) Operating Expenses | (8.1 | ) | (7.6 | ) | (8.1 | ) | (7.6 | ) | (7.3 | ) | (7.5 | ) | 0.0% | (2.9%) | |||||||||||
| (-) QoE Adjustments(1) | - | - | - | (0.1) | (1) | (0.4 | )(1) | (0.3 | )(2) | ||||||||||||||||
| EBITDA | $6.0 | $8.4 | $6.5 | $5.0 | (1) | $6.5 | (1) | $6.8 | 4.1% | 1.8% | |||||||||||||||
| Net Revenues Growth | 13.7 | % | (9.0 | %) | (12.7 | %) | 11.4 | % | 2.6 | % | |||||||||||||||
| EBITDA Growth | 41.3 | % | (23.4 | %) | (22.4 | %) | 29.5 | % | 4.8 | % | |||||||||||||||
| EBITDA Margin | 42.4 | % | 52.6 | % | 44.3 | % | 39.4 | % | 45.8 | % | 46.8 | % |
Source: HMTV management (Univision provided to HMTV; PwC QoE provided by Searchlight to HMTV).
Note: 2020A and 2021A EBITDA figures based on PwC QoE analysis; all other figures as provided by Univision management.
| (1) | Based on PwC QoE analysis. |
| (2) | Illustratively reflects 2021 PwC QoE adjustments for accounting team ($0.177mm) and allocated lease costs ($0.125mm). |
31
| Radio Assets NOL Tax Calculation | ||
| Assumes a Discount Rate of 9.5% | ||
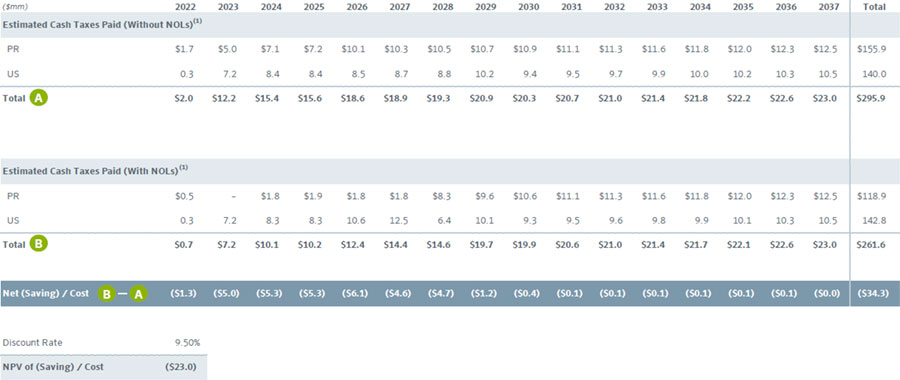
| Per the information provided by HMTV, the utilization of the NOLs being acquired as part of the Radio Stations Transaction Agreement is subject to a number of uncertainties. With the consent of HMTV, the PJT analysis contemplate a range of values for the NOLs that assume either full or no utilization of the NOLs; PJT is illustratively showing the midpoint of ~$11.5mm on prior slides. |
| Source: HMTV management (Univision provided to Searchlight; Searchlight provided to HMTV). | |
| Note: Assumes a discount rate of 9.5%, approximated based on the midpoint WACC range for Networks. | |
| (1) HMTV management projected cash taxes paid with and without NOLs, assuming the NOLs are fully utilizable without limitation. |
32
| Lease Liability PV Calculation | ||
| Assumes a Discount Rate of 9.5%(1) | ||
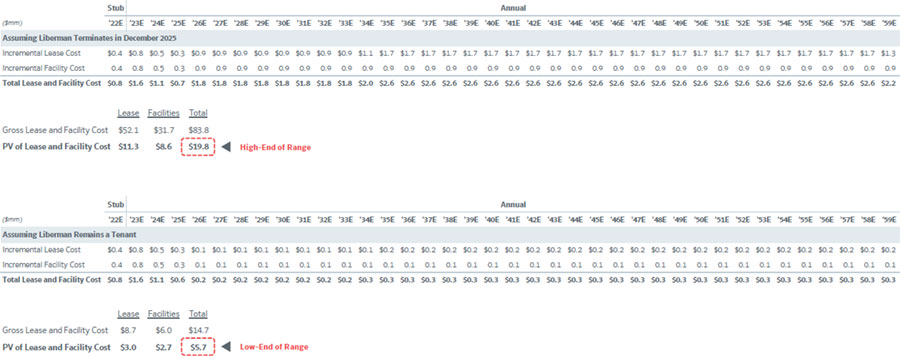
| Per the information provided by HMTV, the value of lease depends on a number of currently unknowable factors and the Liberman lease provides for a termination right in 2025. With the consent of HMTV, in order to calculate the present value of the lease, Moelis and PJT are assuming a range that contemplates Liberman terminating the lease in 2025 and no replacement tenant steps into the Liberman lease or that Liberman does not terminate its lease in 2025. |
| Source: HMTV management (Univision provided to Searchlight; Searchlight provided to HMTV). | |
| (1) Approximated based on the midpoint of the WACC range for Networks. |
33
| Unreimbursed Content Payments / License Fee Forgiveness | ||
> | Televisa does not plan to reimburse ~$4.7mm of funding payments through working capital within the next 90 days on the titles listed below |
| > | Separately, Televisa is asking that Pantaya forgive a ~$2.6mm license fee payable on Pena Ajena that would otherwise be due in installments to the end of calendar year 2022 |
| Overview of Unreimbursed Content Payments / License Fee Forgiveness | |||
| Title | Amount to be paid by Pantaya within the next 90 days | License Fee Receivable | Commentary |
| A Beautiful Life | $4.4 | n.a. | Amounts paid between signing and closing will not be reimbursed via working capital |
| Pena Ajena | n.a. | $2.6 | Televisa is requesting that Pantaya forgive ~$2.6mm in license fees payable (by Televisa to Pantaya) |
| Montecristo | $0.3 | n.a. | Amounts paid between signing and closing will not be reimbursed via working capital |
| Rebelión | $0.1 | n.a. | Amounts paid between signing and closing will not be reimbursed via working capital |
| Total | $4.7 | $2.6 | |
| Grand Total | $7.3 |
Source: HMTV management (Univision provided to Searchlight; Searchlight provided to HMTV).
34
| Networks Preliminary WACC Analysis Based on Peer Beta | ||
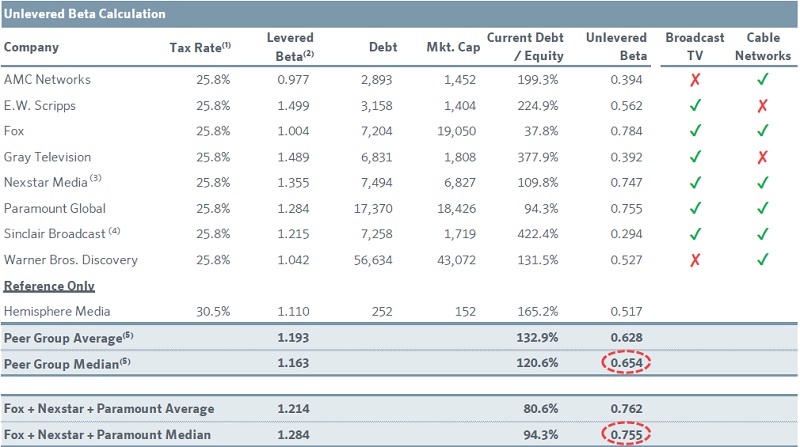
Source: Bloomberg; Capital IQ; company filings.
Note: Market data as of 5/6/2022.
| (1) | For peers, represents weighted average of pre and post tax reform rates of 38% and 24%, respectively; for HMTV, represents tax rate of 30.5% based on HMTV management guidance for Network‘s blended tax rate. |
| (2) | Historical monthly beta since 5/6/2017, where available. |
| (3) | Based on 31% ownership of TV Food Network. |
| (4) | Reflects the market value of Sinclair‘s debt. |
| (5) | Peer group summary data excludes Gray Television and Sinclair due to elevated leverage levels. |
35
| Networks Preliminary WACC Analysis Based on Peer Beta (Cont‘d) | ||
| Cost of Equity Calculation | Levered Beta Calculation | |||||
| Risk Free Rate(1) | 3.43% | Unlevered Beta(5) | 0.654 | 0.755 | ||
| Equity Risk Premium(2) | 6.22% | Debt / Equity | 66.7% | 66.7% | ||
| Levered Beta | 0.958 | Levered Beta | 0.958 | 1.105 | ||
| Beta-Adj. Premium | 5.96% | |||||
| Size Premium(3) | 4.54% | WACC Calculation | ||||
| Cost of Equity(4) | 13.93% | After-Tax Cost of Debt(6) | 4.87% | 4.87% | ||
| WACC | 10.30% | 10.85% | ||||
| Cost of Equity Sensitivity | WACC Sensitivity | ||||||||||
| Unlevered | Debt / Equity | Unlevered | Debt / Equity | ||||||||
| Beta | 33.3% | 66.7% | 100.0% | Beta | 33.3% | 66.7% | 100.0% | ||||
| 0.654 | 10.54% | 11.49% | 12.43% |  | 2.10% size premium | 0.654 | 9.12% | 8.84% | 8.65% | | 2.10% size premium |
| 12.98% | 13.93% | 14.87% | | 4.54% size premium | 10.95% | 10.30% | 9.87% | | 4.54% size premium | ||
| 0.755 | 11.32% | 12.41% | 13.49% | 0.755 | 9.70% | 9.39% | 9.18% | ||||
| 13.76% | 14.85% | 15.93% | 11.53% | 10.85% | 10.40% | ||||||
Source: Duff & Phelps 2022 Valuation Handbook; Capital IQ; Bloomberg; IHS Markit.
Note: Market data as of 5/6/2022.
| (1) | 20-year US Treasury as of 5/6/2022. |
| (2) | Historical supply-side equity risk premium (historical equity risk premium minus price-to-earnings ratio calculated using three-year average). |
| (3) | CSRP 9th decile size premium. |
| (4) | Calculated as risk free rate + beta-adjusted equity risk premium + size premium. |
| (5) | Median of peer monthly beta since 5/6/2017. |
| (6) | Illustratively assumes pre-tax cost of debt of 7% in-line with ICE BofA Single-B index yield of ~7.3% (compared to ~6.4% yield on the current HMTV 7-year term L+502.4 term loan due February 2024). |
36
| Pantaya Preliminary WACC Analysis Based on Peer Beta | ||
| Unlevered Beta Calculation | ||||||
| Company | Tax Rate(1) | Levered Beta(2) | Debt | Market Cap | Current Debt / Equity | Unlevered Beta |
| Chicken Soup for the Soul Entertainment | 25.8% | 1.248 | 67 | 150 | 44.8% | 0.936 |
| CuriosityStream | 25.8% | 1.679 | - | 111 | - | 1.679 |
| FuboTV | 25.8% | 3.206 | 409 | 516 | 79.2% | 2.019 |
| Netflix | 25.8% | 1.186 | 14,623 | 80,400 | 18.2% | 1.045 |
| Roku | 25.8% | 1.620 | 89 | 14,039 | 0.6% | 1.612 |
| Spotify | 25.8% | 1.535 | 1,259 | 20,392 | 6.2% | 1.468 |
| Reference Only | ||||||
| Hemisphere Media | 24.0% | 1.110 | 252 | 152 | 165.2% | 0.492 |
| Peer Group Average | 1.745 | 1.460 | ||||
| Peer Group Median | 1.577 | 1.540 | ||||
Source: Bloomberg; Capital IQ.
Note: Market data as of 5/6/2022.
| (1) | For peers, represents weighted average of pre and post tax reform rates of 38% and 24%, respectively; for HMTV (Pantaya), represents post-tax reform rate of 24% based on HMTV management guidance for Pantaya‘s blended tax rate. |
| (2) | Monthly beta since 5/6/2017, where available; levered beta since 8/18/17 used for Chicken Soup for the Soul Entertainment; levered beta since 10/15/20 (completion date of merger with SPAC Software Acquisition Group) used for CuriosityStream; levered beta since 10/7/20 used for FuboTV; levered beta since 9/28/17 used for Roku; levered beta since 4/3/18 used for Spotify. |
37
| Pantaya Preliminary WACC Analysis Based on Peer Beta (Cont‘d) | ||
| Cost of Equity Calculation | Levered Beta Calculation | |||
| Risk Free Rate(1) | 3.43% | Unlevered Beta(5) | 1.540 | |
| Equity Risk Premium(2) | 6.22% | Debt / Equity | - | |
| Levered Beta | 1.540 | Levered Beta | 1.540 | |
| Beta-Adj. Premium | 9.58% | |||
| Size Premium(3) | 6.34% | WACC Calculation | ||
| Cost of Equity(4) | 19.35% | After-Tax Cost of Debt(6) | NA | |
| WACC | 19.35% | |||
| Cost of Equity Sensitivity | WACC Sensitivity | |||||||||
| Unlevered | Size Premium | Unlevered | Size Premium | |||||||
| Beta | 11.17% | 6.34% | 4.54% | 2.34% | Beta | 11.17% | 6.34% | 4.54% | 2.34% | |
| 1.340 | 22.93% | 18.10% | 16.30% | 14.10% | 1.340 | 22.93% | 18.10% | 16.30% | 14.10% | |
| 1.440 | 23.56% | 18.73% | 16.93% | 14.73% | 1.440 | 23.56% | 18.73% | 16.93% | 14.73% | |
| 1.540 | 24.18% | 19.35% | 17.55% | 15.35% | 1.540 | 24.18% | 19.35% | 17.55% | 15.35% | |
| 1.640 | 24.80% | 19.97% | 18.17% | 15.97% | 1.640 | 24.80% | 19.97% | 18.17% | 15.97% | |
| 1.740 | 25.42% | 20.59% | 18.79% | 16.59% | 1.740 | 25.42% | 20.59% | 18.79% | 16.59% | |
 | | | | | | | | |||
| Based on Value Implied by Low-End of DCF Analysis | Based on Value Implied by High-End Of DCF Analysis | Next Decile (10x) | Second Next Decile (10w) | Based on Value Implied by Low-End Of DCF Analysis | Based on Value Implied by High-End Of DCF Analysis | Next Decile (10x) | Second Next Decile (10w) | |||
Source: Duff & Phelps 2022 Valuation Handbook; Capital IQ; Bloomberg.
Note: Market data as of 5/6/2022.
| (1) | 20-year US Treasury as of 5/6/2022. |
| (2) | Historical supply-side equity risk premium (historical equity risk premium minus price-to-earnings ratio calculated using three-year average). |
| (3) | CSRP 10th (i.e., 10y) decile size premium. |
| (4) | Calculated as risk free rate + beta-adjusted equity risk premium + size premium. |
| (5) | Median of peer monthly beta since 5/6/2017, where possible. |
38
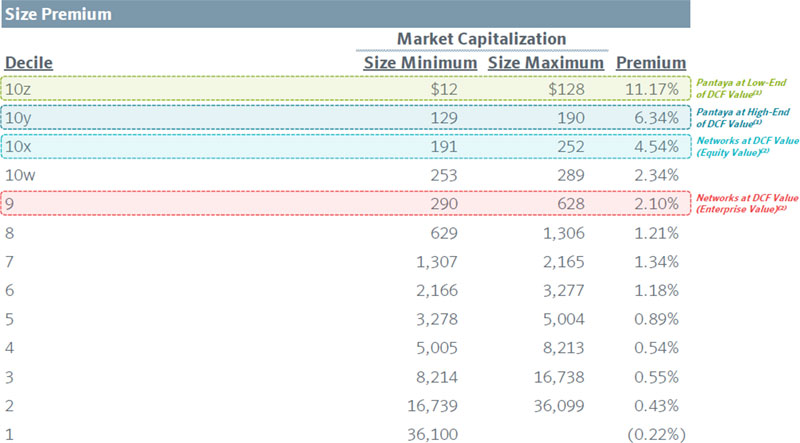
| Capital Asset Pricing Model Size Risk Premia |
($mm)
| Source: Duff & Phelps 2022 Valuation Handbook. | |
| (1) | Pantaya WACC assumes 10th (i.e., 10y) decile size premium; Pantaya‘s DCF TEV range from $61mm on the low-end and $171mm on the high-end. |
| (2) | Assumes midpoint DCF TEV of $380.6mm for Networks; assumes $193mm of net debt and other adjustments between Enterprise Value and Equity Value. |
39
| Pantaya Peer Group Levered Beta Analysis |
 |  |  |  |  |  |  | ||||||||
| Weekly | Monthly | Weekly | Monthly | Weekly | Monthly | Weekly | Monthly | Weekly | Monthly | Weekly | Monthly | Weekly | Monthly | |
| 1-Year | 1.025 | (0.028) | 2.362 | 1.440 | 2.445 | 2.504 | 1.892 | 2.192 | 2.044 | 1.580 | 1.735 | 2.146 | 1.206 | 0.706 |
| 2-Year | 1.265 | 1.375 | 1.852 | 1.679 | 1.628 | 3.206 | 1.311 | 1.644 | 1.769 | 1.880 | 1.457 | 1.802 | 1.323 | 1.288 |
| 3-Year | 1.117 | 1.230 | - | - | - | - | 0.938 | 1.073 | 1.390 | 1.577 | 1.034 | 1.549 | 0.961 | 1.263 |
| 4-Year | 1.019 | 1.210 | - | - | - | - | 1.009 | 1.133 | 1.370 | 1.591 | 1.060 | 1.538 | 0.957 | 1.187 |
| 5-Year | 0.993 | 1.248 | - | - | - | - | 1.063 | 1.186 | 1.329 | 1.620 | 1.059 | 1.535 | 0.905 | 1.110 |
| Data | ||||||||||||||
| Available | 8/18/17 | 10/15/20 | 10/7/20 | 5/23/02 | 9/28/17 | 4/3/18 | 4/5/13 | |||||||
| Since | ||||||||||||||
Source: Bloomberg.
Note: Market data as of 5/6/2022.
(1) CuriosityStream merger with SPAC Software Acquisition Group was not completed until October 15, 2020.
40
| Disclaimer |
These materials were prepared by PJT Partners LP (“PJT Partners”, “we” or “us”) solely for the information and assistance of the Special Committee (“Special Committee”) of the Board of Directors (the “Board”) of HMTV (the “Company”) in order to assist the Special Committee in connection with its consideration of the matters referred to herein. These materials are incomplete without reference to, and should be viewed solely in conjunction with, any oral information provided by PJT Partners in connection with these materials.
These materials and any oral information provided by PJT Partners in connection with these materials (collectively, the “Confidential Information”), as well as any information derived from the Confidential Information, may not be communicated, reproduced, disclosed (in whole or in part) to, or relied upon by, any other person, referred to, or used for any purpose, other than with PJT Partners‘ prior written consent.
The Confidential Information is based on information publicly available, provided by or on behalf of the Company or obtained from other sources. We assume no responsibility for independent verification of any such information, and we have assumed and relied upon the accuracy and completeness of such information for purposes of preparing the Confidential Information. Neither we nor any of our affiliates or agents, make any representation or warranty, express or implied, in relation to the accuracy or completeness of the Confidential Information, or any data it generates and expressly disclaim any and all liability in relation to any such Confidential Information. The Confidential Information is based on financial, economic, market and other conditions prevailing as of the date of such Confidential Information and is subject to change. We undertake no obligation or responsibility to update or revise any of the Confidential Information. Any valuation, appraisal or conclusion of a financial nature contained in these materials results from the application by PJT Partners of techniques and principles generally adopted in the context of the preparation of financial presentations of this nature, and PJT Partners cannot and does not warrant that the use of different techniques and principles would not lead to a different result.
Our analyses do not purport to be an appraisal of any assets or liabilities of the Company or any other party, nor have we evaluated the solvency of the Company or any other party under any laws relating to bankruptcy, insolvency or similar matters.
We are not legal, regulatory, accounting or tax advisors and these materials do not constitute legal, regulatory, accounting, tax or other specialist advice. These materials do not constitute and should not be considered any form of financial opinion, advice or recommendation by us or any of our affiliates to any party, with respect to any proposed transaction or otherwise. You should not rely upon or use these materials to form the definitive basis for any decision or action whatsoever, with respect to any proposed transaction or otherwise. Each of the Special Committee and the Company must make its own independent assessment and such investigation as it deems necessary to determine its interest in participating in any transaction.
These materials do not constitute an offer to sell or the solicitation of an offer to buy any security, nor do they constitute an offer or commitment to lend, syndicate or arrange a financing, underwrite or purchase any securities or act as an agent or advisor or in any other capacity with respect to any transaction, or commit capital to, or participate in, any trading strategies. This document is not a research report and should not be considered as such.
This document may include information from the S&P Capital IQ Platform Service. Such information is subject to the following: “Copyright © 2022, S&P Capital IQ (and its affiliates, as applicable). This may contain information obtained from third parties, including ratings from credit ratings agencies such as Standard & Poor‘s. Reproduction and distribution of third party content in any form is prohibited except with the prior written permission of the related third party. Third party content providers do not guarantee the accuracy, completeness, timeliness or availability of any information, including ratings, and are not responsible for any errors or omissions (negligent or otherwise), regardless of the cause, or for the results obtained from the use of such content. THIRD PARTY CONTENT PROVIDERS GIVE NO EXPRESS OR IMPLIED WARRANTIES, INCLUDING, BUT NOT LIMITED TO, ANY WARRANTIES OF MERCHANTABILITY OR FITNESS FOR A PARTICULAR PURPOSE OR USE. THIRD PARTY CONTENT PROVIDERS SHALL NOT BE LIABLE FOR ANY DIRECT, INDIRECT, INCIDENTAL, EXEMPLARY, COMPENSATORY, PUNITIVE, SPECIAL OR CONSEQUENTIAL DAMAGES, COSTS, EXPENSES, LEGAL FEES, OR LOSSES (INCLUDING LOST INCOME OR PROFITS AND OPPORTUNITY COSTS OR LOSSES CAUSED BY NEGLIGENCE) IN CONNECTION WITH ANY USE OF THEIR CONTENT, INCLUDING RATINGS. Credit ratings are statements of opinions and are not statements of fact or recommendations to purchase, hold or sell securities. They do not address the suitability of securities or the suitability of securities for investment purposes, and should not be relied on as investment advice.
This document may include information from SNL Financial LC. Such information is subject to the following: “CONTAINS COPYRIGHTED AND TRADE SECRET MATERIAL DISTRIBUTED UNDER LICENSE FROM SNL. FOR RECIPIENT‘S INTERNAL USE ONLY.”
PJT Partners is an SEC registered broker-dealer and is a member of FINRA and SIPC. PJT Partners is represented in the United Kingdom by PJT Partners (UK) Limited. PJT Partners (UK) Limited is authorised and regulated by the Financial Conduct Authority (Ref No. 678983) and is a company registered in England and Wales (No. 9424559). PJT Partners is represented in Spain by PJT Partners Park Hill (Spain) A.V., S.A.U., a firm authorized and regulated by the Comision Nacional del Mercado de Valores (“CNMV”). PJT Partners is represented in Hong Kong by PJT Partners (HK) Limited, authorised and regulated by the Securities and Futures Commission, and in Australia, by PJT Partners (HK) Limited, by relying on a passport license approved by the Australia Securities and Investment Commission. In connection with our capital raising services in Canada, PJT Partners relies on the international dealer exemption pursuant to subsection 8.18(2) of National Instrument 31-103 Registration Requirements. Please see https://pjtpartners.com/regulatory-disclosure for more information.
Copyright © 2022, PJT Partners LP (and its affiliates, as applicable).
41