Exhibit (c)(v)
Project Hawkeye

Presentation to the Special Committee of the Board of Directors
May 7, 2022
Table of Contents
| I. | Situation Overview | 3 |
| II. | Overview of Projections | 13 |
| III. | Preliminary Financial Analysis Summary | 19 |
| Appendices | ||
| A. | Preliminary Discounted Cash Flow Analysis | 24 |
| B. | Preliminary Selected Publicly Traded Companies Analysis | 31 |
| C. | Preliminary Selected Precedent Transactions Analysis | 44 |
| D. | WACC Analysis | 51 |
| E. | Pelican Sale Supplemental Materials | 57 |
| F. | Other Information | 67 |
[ 1 ]
Disclaimer
This presentation has been prepared by Moelis & Company LLC (“Moelis”) for exclusive use by the Special Committee of the Board of Directors of Hawkeye in considering the transaction described herein based on information provided by Hawkeye and upon information from third party sources. Moelis has not assumed any responsibility for independently verifying the accuracy of such information, and disclaims any liability with respect to the information herein. In this presentation, Moelis, at Hawkeye‘s direction, has used certain projections, forecasts or other forward-looking statements with respect to Hawkeye and/or other parties involved in the transaction which were provided to Moelis by Hawkeye and / or such other parties and which Moelis has assumed, at Hawkeye’s direction, were prepared based on the best available estimates and judgments of the management of Hawkeye and/or such other parties as to the future performance of Hawkeye and/or such other parties. This presentation is provided as of the date hereof and Moelis assumes no obligation to update it or correct any information herein.
This presentation is solely for informational purposes. This presentation is not intended to provide the sole basis for any decision on any transaction and is not a recommendation with respect to any transaction. The recipient should make its own independent business decision based on all other information, advice and the recipient’s own judgment. This presentation is not an offer to sell or a solicitation of an offer to buy any business, security, option, commodity, future, loan or currency. It is not a commitment to underwrite any security, to loan any funds or to make any investment. Moelis does not offer tax, accounting, actuarial or legal advice. Absent Moelis’ prior written consent, this material, whether in whole or in part, may not be copied, photocopied, or duplicated in any form by any means, or redistributed.
Moelis and its related investment banking entities provide mergers and acquisitions, recapitalization, restructuring, corporate finance and other financial advisory services to clients. Certain affiliates of Moelis are engaged in asset management and other activities for their own account and otherwise. Personnel of Moelis or such affiliates may make statements or provide advice that is contrary to information included in this material. The proprietary interests of Moelis or its affiliates may conflict with the recipient’s or Hawkeye’s interests. In addition, Moelis and its affiliates and their personnel may from time to time have positions in or effect transactions in securities referred to in this material (or derivatives of such securities), or serve as a director of companies referred to in this presentation. Moelis and its affiliates may have advised, may seek to advise and may in the future advise or invest in companies referred to in this presentation.
[ 2 ]
I. Situation Overview
Timeline of Key Events
| ■ | On January 8, Sparrow Capital Partners (“Sparrow”) submitted a non-binding indication of interest (“Indicative Offer”) to acquire all of the common shares of Hawkeye at an offer price of $8 per share |
| — | Gato Investments LP owns ~41% of Hawkeye’s shares and controls ~75% of the voting power of Hawkeye1 |
| ■ | On January 14, Moelis met with the Special Committee and was subsequently asked to represent the Special Committee as its financial advisor in connection with evaluating the Sparrow Indicative Offer and other potential strategic alternatives |
| ■ | In late January, at the request of the Special Committee, Moelis reached out to Sparrow to discuss the Indicative Offer and during this call Sparrow verbally provided additional details about its proposal including details around its plans for the Company to sell Pelican to Talon in connection with its Indicative Offer |
| ■ | On or about February 25, Latham & Watkins, counsel to Sparrow, held a call with Davis Polk, counsel to the Special Committee, during which Latham & Watkins raised the possibility of a sale of Pelican to Talon ahead of the closing of the acquisition of the entire Company |
| ■ | On March 3, Sparrow verbally indicated that the price it was willing to pay was now less than $8, and referenced $7.75 as a potential revised offer price |
| ■ | On March 7, the Special Committee held a meeting with Davis Polk and Moelis. Moelis presented a preliminary, illustrative financial analysis based on the revised management forecast and discussed various potential counterproposals |
| ■ | On March 8, Moelis communicated the Special Committee’s counterproposal to Sparrow. Sparrow communicated that the Pelican deal was only available as part of the take private |
| ■ | On March 10, the Company held a regularly scheduled Board Meeting. Following the Board Meeting, representatives of Sparrow met with the Special Committee to discuss the key terms of Sparrow’s offer |
| ■ | On March 11, the Special Committee, Moelis and Davis Polk held a meeting during which the Special Committee informed Moelis and Davis Polk of the conversations that occurred following the March 10 Board meeting, discussed at a high level some of their views on recent business performance and near-term forecasted performance, and directed Moelis to continue discussions with Sparrow on a potential deal at $8.00 per share |
| ■ | On March 14, Moelis and Sparrow held a discussion during which Sparrow indicated openness to acquiring Hawkeye at $8.00 per share, including a go-shop process with a binding commitment to support a superior offer. The Special Committee, Moelis and Davis Polk held a call to discuss the latest developments, during which the Special Committee directed Moelis and Davis Polk to expedite the completion of diligence and the drafting of definitive documents |
| ■ | Throughout March and April, the Special Committee, Moelis and Davis Polk met on a regular basis to discuss key transaction terms, the status of negotiations and other considerations related to a potential transaction |
| ■ | On April 21, Sparrow informed Moelis that it was lowering its bid to $7 per share because of less favorable economic terms in the Pelican sale; Sparrow also referenced increased financing costs and a more uncertain macroeconomic environment |
| ■ | On April 24, April 27 and May 1, the Special Committee, Moelis and Davis Polk held meetings during which the Special Committee discussed the latest terms of Sparrow’s offer, and asked Moelis and Davis Polk to negotiate on certain key terms |
| ■ | On May 5, the Special Committee, Moelis and Davis Polk met to review outstanding commercial points. Moelis held a conversation with Sparrow and reiterated the Committee’s request to expand the go-shop provision to cover the entire Company; however, Talon would not agree to a go-shop covering Pelican |
| 1. | Gato Investments L.P. (“Gato”) is an entity which holds approximately 15,740,000 shares of Hawkeye’s high vote Class B common stock. Sparrow also owns approximately 102,290 shares of Class A common stock. Sparrow is a limited partner of Gato and the general partner of Gato is controlled by Peter M. Kern. Mr. Kern owns 650,000 additional Class B shares and ~226,000 Class A shares |
[ 4 ]
Summary of Moelis Work
| ■ | January 14, 2022: Moelis presented a pitch to the Special Committee, including Moelis’ perspectives on potential strategic alternatives. Moelis sent the Special Committee a disclosure letter outlining its relationships with certain parties that could be involved in a potential transaction; shortly thereafter, the Special Committee verbally engaged Moelis as a financial advisor and informed Moelis that Sparrow had made a proposal to take the Company private |
| ■ | January 24, 2022: Moelis, Davis Polk and the Special Committee held a meeting, during which Moelis presented an overview of key work streams (including Moelis’ diligence requests), key process deliverables, select strategic alternatives and the appropriate response to Sparrow |
| ■ | February 28, 2022: Moelis, Davis Polk and the Special Committee held a meeting, during which Moelis presented a process update |
| ■ | March 2, 2022: Moelis, Davis Polk and the Special Committee held a meeting, during which Moelis presented a process update. Moelis and the Special Committee executed an engagement letter |
| ■ | March 4, 2022: Following Hawkeye Management’s discussion of its financial projections with the Special Committee, Moelis, Davis Polk and the Special Committee held a meeting during which Moelis presented a process update. |
| ■ | March 7, 2022: Moelis, Davis Polk and the Special Committee held a meeting, during which Moelis presented a preliminary draft of its financial analysis and discussed various potential counterproposals |
| ■ | March 9, 2022: Moelis, Davis Polk and the Special Committee held a meeting, during which Moelis updated the Special Committee on negotiations with Sparrow |
| ■ | March 29, 2022: The Special Committee, Moelis and Davis Polk held a meeting to discuss process and review the latest draft of the merger agreement |
| ■ | April 4, 2022: Moelis held a call with Counterparty A during which Counterparty A expressed its continued interest in a potential transaction with Pelican and discussed next steps |
| ■ | April 20, 2022: Moelis, the Special Committee and Davis Polk held a meeting, during which Moelis discussed potential go-shop participants and go-shop process considerations |
| ■ | April 24, 2022: Moelis, the Special Committee and Davis Polk held a meeting, during which Moelis discussed the progress of Counterparty A’s diligence and presented the changes in Talon’s offer to acquire Pelican |
| ■ | May 2, 2022: Moelis received a letter from a representative of Counterparty B inquiring about an opportunity to acquire Hawkeye |
| ■ | May 4, 2022: Moelis held a call with a representative from Counterparty B to discuss Counterparty B's potential interest in a transaction. Given lack of financing and views on valuation, amongst other considerations, Moelis and Davis Polk advised the Special Committee that it was not an actionable bid at present |
| ■ | May 4, 2022: Moelis held a call with Counterparty A during which Counterparty A said that while they appreciated the opportunity to meet with management and diligence the asset, they unfortunately were not able to confirm completion of business diligence and would require approximately a month to determine if it was interested in acquiring Pelican |
[ 5 ]
Basis of Presentation and Limitation to Analyses
The commentary below summarizes the information received by Moelis to date from Hawkeye and the primary limitations to our analyses which inform the basis of our presentation
INFORMATION RECEIVED FROM HAWKEYE
| ■ | Indicative Proposal from Sparrow to acquire Hawkeye for $7.00 per share |
| ■ | Hawkeye Management’s financial projections (the “LRP”) covering 2022E - 2026E as well as a Hawkeye Management extrapolation (the “Extrapolation”) covering 2027E-2031E. The LRP included revenue, expense and cash flow detail for Pelican and Networks separately |
| — | Moelis held multiple discussions with Hawkeye Management regarding the LRP and the Extrapolation |
| — | Moelis also received forecast KPIs for both the Networks and Pelican businesses |
| ■ | Key business diligence information, including but not limited to a schedule of Pelican content releases and KPI detail |
| ■ | Diligence information on the Talon radio stations |
| ■ | Hawkeye Management’s estimate of Hawkeye’s ability to utilize the NOLs Talon will give to Hawkeye as part of the Pelican consideration |
| ■ | Hawkeye estimated net debt and cash as of 3/31/2022 and shares outstanding (including a detailed options schedule) as of 4/29/2022 |
| ■ | Materials prepared by Hawkeye Management for the March 2022 Board of Directors meeting |
GENERAL LIMITATIONS
| ■ | Contact with management has been primarily with the Hawkeye CEO and CFO |
| ■ | Projected tax rates are estimates provided by Hawkeye Management |
| ■ | No detailed utilization schedule of Hawkeye’s tax attributes |
| ■ | No projections (beyond 2022 budget) for the Talon radio stations were provided; Talon NOL estimates are preliminary and limited support was provided to substantiate these attributes |
| ■ | Limited discussions on the potential tax implications of the potential transaction structures |
| ■ | No additional due diligence materials other than those noted above |
[ 6 ]
Key Terms of the Transactions
| ■ | If the Special Committee decides to move forward, Hawkeye will sign two agreements: 1) the sale of Pelican to Talon for certain consideration (“the Pelican Transaction”) (see Appendix for additional information) and 2) the sale of Hawkeye to Sparrow for $7.00 per share (the “Hawkeye Transaction”) |
| ■ | See below for a summary of key terms of the Transactions |
| Purchase Price per Share | ■ Hawkeye common shareholders will receive $7.00 per share (all cash) ■ Includes consideration received by the Company in the Pelican Transaction; the proceeds from which will be used to fund the $7.00 per share purchase price | |
| Termination Fees | ■ Company Transaction Fee: $10.6mm; $5.7mm if the Company (i) enters into a definitive agreement with a topping bidder within the 30-day go-shop period or (ii) the Company provides notice to Sparrow that it has received a Superior Proposal within the 30-day go-shop period and a definitive agreement with the topping bidder is signed within certain notice periods ■ Parent Termination Fee: $15.6mm if Sparrow terminates the agreement under certain circumstances | |
| Expense Reimbursement | ■ If Disinterested Shareholders do not approve the deal, and the Hawkeye Transaction is terminated, Hawkeye shall pay to Sparrow fees and expenses of up to $4.375mm; Sparrow has a separate agreement with Talon to share a portion of these reimbursed expenses with Talon | |
| Regulatory Efforts | ■ Sparrow required to use “reasonable best efforts” to take actions necessary to obtain regulatory approval | |
| Disinterested Shareholder Approval | ■ Before closing the sale to Sparrow or the sale of Pelican to Talon, a majority of the voting power of shares held by Disinterested Shareholders must approve the transaction. Disinterested Shareholders are defined as all shareholders other than Gato, any officer of the Company, Sparrow, and affiliates and associates of the above. | |
| Pelican Transaction | ■ Concurrent to signing the definitive agreement to sell Sparrow in the Hawkeye Transaction, Hawkeye would also sign definitive documentation for the Pelican Transaction ■ Prior or concurrent closing of the Pelican Transaction is a condition to closing the Hawkeye Transaction ■ There is a scenario in which Hawkeye would close the Pelican Transaction but not close the Hawkeye Transaction: if the Disinterested Shareholders approve the sale to Sparrow, but Sparrow does not close by July 31 for any reason including an inability to secure financing, the Pelican Transaction would close | |
| Go-Shop | ■ 30-day go-shop period ■ No expense reimbursement for go-shop parties permitted ■ A topping bidder would “step into the shoes” of Sparrow would be acquiring the Networks business and the consideration Hawkeye will receive in the Pelican Transaction; a topping bidder would not be able to acquire Pelican – If an unsolicited bid for Pelican was received prior to closing, shareholders would have the option of voting down the entire transaction and negotiating with a third party ■ Sparrow will enter into a voting agreement to vote in favor of a Superior Proposal ■ Any information provided to potential bidders that has not previously provided to Sparrow must be shared with Sparrow ■ The Company intends to conduct outreach to potential bidders, including both strategic parties and financial sponsors, following the signing of the merger agreement |
[ 7 ]
Analysis at Various Prices
Sparrow and Hawkeye are negotiating definitive documentation regarding an acquisition of Hawkeye for $7.00 per share
SUMMARY PREMIA AND IMPLIED TEV AT VARIOUS PRICES
| ($ in millions; except per share data) | Current Price (as of 05/06/22) | Sparrow Offer Price | |||||
| Share Price | $3.77 | $7.00 | |||||
| % Premium to Current | - | 86% | |||||
| Recent Statistics | |||||||
| 52 Week High (05/24/21) | $14.04 | (73%) | (50%) | ||||
| 52 Week Low (04/07/22) | 3.58 | 5% | 96% | ||||
| 10-Day VWAP | 3.95 | (4%) | 77% | ||||
| 20-Day VWAP | 4.09 | (8%) | 71% | ||||
| 30-Day VWAP | 4.29 | (12%) | 63% | ||||
| 60-Day VWAP | 4.91 | (23%) | 43% | ||||
| 90-Day VWAP | 5.55 | (32%) | 26% | ||||
| 180-Day VWAP | 8.08 | (53%) | (13%) | ||||
| 270-Day VWAP | 9.48 | (60%) | (26%) | ||||
| 365-Day VWAP | 9.98 | (62%) | (30%) | ||||
| Diluted Shares Out. (mm) | 40.401 | 40.424 | |||||
| Implied Market Capitalization | $152 | $283 | |||||
| Plus: Net Debt & Other (as of 03/31/22) | 193 | 193 | |||||
| Implied Enterprise Value | $346 | $476 | |||||
| Note: | 52 Week High and Low based on intraday share prices; diluted shares outstanding includes Class A, Class B shares and the impact of options calculated using the Treasury Stock Method |
| Source: | Company information, Capital IQ as of 05/06/22 |
[ 8 ]
Implied Multiples on Networks + Radio
| Hawkeye Perspective | Sparrow Perspective | ||||||||
| ($ in millions) | Current Price as of 05/06/22 | Sparrow Offer | Low | Mid | High | ||||
| Share Price Class A Shares | $3.77 | $7.00 | $7.00 | $7.00 | $7.00 | ||||
| (x) Common shares outstanding | 20.680 | 20.704 | 20.704 | 20.704 | 20.704 | ||||
| Share Price Class B Shares | $3.77 | $7.00 | $7.00 | $7.00 | $7.00 | ||||
| (x) Common shares outstanding | 19.720 | 19.720 | 19.720 | 19.720 | 19.720 | ||||
| Implied Equity Value | $152.3 | $283.0 | $283.0 | $283.0 | $283.0 | ||||
| (+) Total Debt | 251.6 | 251.6 | 251.6 | 251.6 | 251.6 | ||||
| (-) Cash | (37.3) | (37.3) | (37.3) | (37.3) | (37.3) | ||||
| Net Debt 1 | $214.3 | $214.3 | $214.3 | $214.3 | $214.3 | ||||
| (+) Noncontrolling Interests | -- | -- | -- | -- | -- | ||||
| (+) Post-tax Pension Obligation | 1.7 | 1.7 | 1.7 | 1.7 | 1.7 | ||||
| (-) Non-Core Assets 1 | (22.7) | (22.7) | (22.7) | (22.7) | (22.7) | ||||
| Implied TEV | $345.6 | $476.2 | $476.2 | $476.2 | $476.2 | ||||
| Pelican Sale Adjustments | (-) Cash Consideration | -- | -- | (115.0) | (115.0) | (115.0) | |||
| (-) Net Benefit from PR NOLs (PV) 2 | -- | -- | -- | (12.4) | (24.4) | ||||
| (+) 3 Years of Programming Fee (PV) 3 | -- | -- | 13.6 | 13.6 | 13.6 | ||||
| (+) Unreimbursed Content Payments / License Fee Forgiveness 4 | -- | -- | 7.3 | 7.3 | 7.3 | ||||
| (+) Incremental Puerto Rico Lease Obligations (PV) 5 | -- | -- | 22.8 | 20.0 | 15.0 | ||||
| Adj. Implied TEV | $345.6 | $476.2 | $405.0 | $389.7 | $372.8 | ||||
| TEV / Adj. EBITDA (Post-SBC) incl. Pelican Losses | Metric | ||||||||
| LTM 3/31/22 | $30.1 | 11.5x | 15.8x | -- | -- | -- | |||
| 2022E | 32.5 | 10.6x | 14.7x | -- | -- | -- | |||
| 2023E | 44.2 | 7.8x | 10.8x | -- | -- | -- | |||
| Adj. TEV / Adj. EBITDA (Post-SBC) excl. Pelican Losses | PF Metric 6 | ||||||||
| LTM 3/31/22 | $56.5 | 6.1x | 8.4x | $63.0 | 6.4x | 6.2x | 5.9x | ||
| 2022E | 57.5 | 6.0x | 8.3x | 64.3 | 6.3x | 6.1x | 5.8x | ||
| 2023E | 56.8 | 6.1x | 8.4x | 63.7 | 6.4x | 6.1x | 5.9x | ||
| Source: | Capital IQ as of 05/06/22, Hawkeye Management, Talon, Sparrow and third party tax advisors |
| 1. | 3/31/22 estimates per Hawkeye Management |
| 2. | High end reflects present value of net benefit of Puerto Rican NOLs received less the decrease in foreign tax credits utilized given the decrease in forecasted taxes paid in Puerto Rico - discounted at 8.0%; mid-point assumes 51% probability of utilization |
| 3. | Includes three $5mm payments for programming fees from 2022 to 2024 |
| 4. | Reflects upfront content funding payments that will not be reimbursed through working capital and current payment that Talon owes Pelican for content that will be forgiven as a result of the transaction |
| 5. | Low end reflects present value of absorbed lease obligations as a result of the transaction, mid and high end reflects illustrative potential to break the lease before 2059 when the current contract expires - discounted at 8.0% |
| 6. | PF Adj. EBITDA includes impact of PR radio acquisition (radio projections only go out to 2022, assumes 2023 EBITDA is flat from prior year) and is burdened by corporate overhead allocated to Pelican. PF Adj. EBITDA with respect to Sparrow Perspective includes EBITDA associated with Talon PR Radio assets |
[ 9 ]
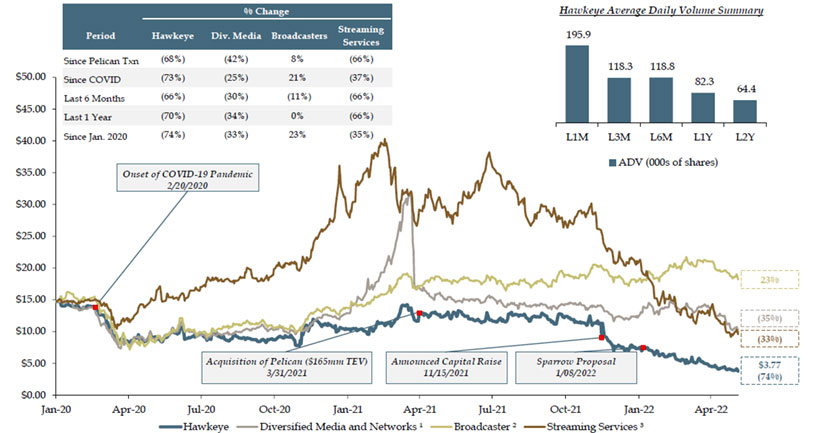
Share Price Performance (Since 2020)
Hawkeye’s share price is below pre-COVID levels and is down ~67% since it announced and subsequently terminated its proposed capital raise in November 2021, and down ~50% since Sparrow’s confidential proposal
SHARE PRICE PERFORMANCE (SINCE 2020) - HAWKEYE VS. SELECTED MEDIA COMPANIES
| Source: | Capital IQ as of 05/06/2022 |
| 1. | Includes Paramount, Discovery, AMC Networks and Fox |
| 2. | Includes Nexstar, TEGNA, Sinclair, Gray, Entravision and E.W. Scripps calculated as a weighted average |
| 3. | Includes Netflix, Sirius XM, Spotify, fubo TV, Chicken Soup for the Soul Entertainment, Roku and CuriosityStream calculated as a simple average |
[ 10 ]
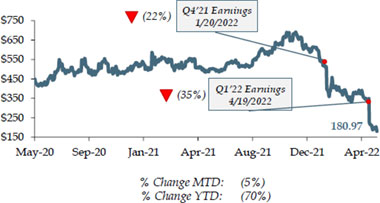
Share Price Performance in Context
 |
■ On November 15, 2021, Hawkeye announced a common stock offering of 6mm shares
— Implies gross proceeds of $68mm ($78mm if overallotment exercised) 1
■ On November 17, the Company announced the termination of its common stock offering due to market conditions, noting:
— The offering was opportunistic and at then-current share price levels the offering was no longer attractive
— Hawkeye had ample liquidity to fund operations and the necessary capital to continue to fund strategic growth initiatives, including content and production for Pelican | 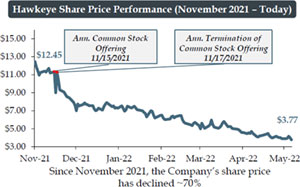 | ||||
 | ■ In January 2022, Netflix announced slower than expected forecast subscriber growth, sending its shares down over — Equity research analysts have noted that Netflix’s performance may highlight that the U.S. SVOD market is reaching saturation ■ On April 20, 2022, Netflix announced 200k of subscriber declines (excluding Russia) and forecasted significant declines for the rest of the year — Stock fell 35% the next trading day ■ Netflix’s recent subscription challenges has led to a rerating of the entire SVOD sector — Since Netflix announced Q1 and Q2 earnings, SVOD companies are down an average of 44% and 19% respectively 3 | | ||||
| Source: | Capital IQ as of 05/06/2022 |
| 1. | 6mm Class A shares with an option for the underwriters to purchase up to an additional 900k Class A shares. Based on Class A share price of $11.19 as of November 14, 2021 |
| 2. | Reflects price decline between market close on January 20 vs 21 (Netflix announced earnings on January 20) |
| 3. | Reflects price decline between market close on January 20 (Netflix Q1 earnings) and April 19 (Netflix Q2 earnings) vs. May 6 |
[ 11 ]
Recent Market Pressures on the SVOD Business Model
KEY RECENT DEVELOPMENTS IN SVOD MARKET
 | On April 19, 2022, Netflix Announced Q1 Subscriber Loss and Guides to 2 Million Subscriber Loss in Q2 2022 |
● Netflix attributed its slowing growth outlook to several factors, including:
| – | Slower growth in rate of adoption of connected TVs |
| – | In addition to its 222 million paying households, Netflix is being shared with over 100 million additional households |
| – | Robust competition from new streaming services that have launched and invested significantly in content |
| – | Sluggish economic growth, inflation, Russian conflict and other macroeconomic factors | |
| ● | On its latest earnings call, Netflix said that it would reduce content spending growth and is exploring offering an ad-supported model |
 | Warner Bros Discovery Shuts Down CNN+ |
| ● | In April 2022, following the completion of the Warner Bros Discovery merger, the new management team of the Company shuttered CNN+, a news streaming service |
| ● | The service was shut down barely a month after it was launched |
| ● | On a recent earnings call, CEO David Zaslav stated that they would “not overspend to drive subscriber growth” and CFO Gunnar Wiedenfels stated he was reviewing and seeking to decrease content spend, noting that there were “a lot of chunky investments that are lacking what I would view as a solid financial foundation and meeting the hurdle that I would like to see.” |
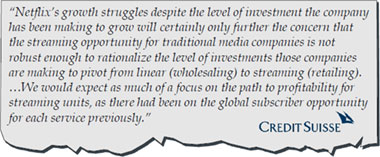
KEY ANALYST COMMENTARY

NETFLIX STOCK PRICE CHART (LAST 2 YEARS)
Source: Capital IQ as of 5/06/22, Wall Street research
[ 12 ]
| II. | Overview of Projections |

Overview of Projections
Financial Plan Overview & Assumptions
For purposes of its analysis, Moelis relied on Hawkeye’s Management’s guidance and Hawkeye Management’s latest financial projections (the “LRP” and the “Extrapolation”)
OVERVIEW | ▪ Hawkeye Management developed and provided both the LRP and Extrapolation to Moelis ▪ In July 2021, Hawkeye Management prepared and provided a set of projections to Talon; the key drivers of the difference between the LRP and the July 2021 forecast are — Greater visibility for Pelican post-integration (Hawkeye had owned Pelican for only ~3 months at the time of the July 2021 forecast) resulting in slower growth but higher margins — 2021 performance across both business lines — Feedback from market participants following Hawkeye’s attempted equity offering in November 2021 |
NETWORKS | ▪ Networks’ revenue CAGR from 2022E – 2026E of 3% and from 2026E – 2031E of 1% is driven by steady growth in advertising and subscriber revenue across segments ▪ EBITDA projected to remain steady through the projection period — Steady state of EBITDA through projection period is a result of incremental revenue growth across segments, offset by increased operating costs and costs of revenue |
PELICAN | ▪ Pelican’s revenue CAGR from 2022E – 2026E of 23% and from 2026E – 2031E of 6% is driven primarily by the continued subscriber acquisition and growth in ARPU — Subscribers projected to reach ~3.0mm in 2025 in-line with the high-end of public guidance — Subscriber projections are supported by expected efficiencies in subscriber acquisition and increased investment in content — ARPU increases over the projection period, primarily driven by a $1.00 price increase in May 2023 ▪ EBITDA losses are generated in 2021 – 2024, and full-year profitability is projected to be achieved in 2025, with margins reaching ~15% in 2026 and ~24% by 2031 — As the subscriber base scales, operating leverage is established from returns on content and marketing investments
▪ Talon has announced plans to launch their global streaming service in H2 2022; a well-capitalized competitor in Spanish-language streaming content could be a significant competitive threat to Pelican |
Source: Hawkeye Management
[ 14 ]
Near Term Liquidity and Leverage
Assuming the business performs in line with Hawkeye Management projections, Hawkeye available liquidity is projected to drop to $40.0mm in Q2’22; pro forma net leverage is projected to be above the 5.0x threshold for the springing covenant in Q2
| ($ in mm) | Q4'21A | Q1'22B | Q2'22B | Q3'22B | Q4'22B |
| Cash | $49.5 | $37.3 | $29.5 | $26.4 | $37.7 |
| Availability Under Revolver | 30.0 | 30.0 | 10.5 | 30.0 | 30.0 |
| Total Liquidity | $79.5 | $67.3 | $40.0 | $56.4 | $67.7 |
| Debt | $252.3 | $251.6 | $251.0 | $250.3 | $249.6 |
| LTM Adj. EBITDA (Core) | $67.2 | $64.8 | $64.9 | $65.9 | $66.4 |
| LTM Adj. EBITDA (Pelican) | ($24.1) | ($29.6) | ($30.7) | ($29.8) | ($27.6) |
| LTM Adj. EBITDA (Consolidated) | $43.1 | $35.1 | $34.2 | $36.1 | $38.9 |
| LTM Adj. EBITDA (Per Financial Covenant) 1 | $53.1 | $44.8 | $43.9 | $46.0 | $48.8 |
Gross Leverage | 5.9x | 7.2x | 7.3x | 6.9x | 6.4x |
| Net Leverage | 4.7x | 6.1x | 6.5x | 6.2x | 5.5x |
| Pro Forma Net Leverage per Financial Covenant 1 | 3.8x | 4.8x | 5.0x | 4.9x | 4.3x |
Source: Hawkeye Management
| 1. | The Company’s Revolving Facility has a springing net leverage covenant if the aggregate amount of revolving loans and letter of credit exposure exceeds 35% of the aggregate commitments under the Revolving Facility. Per the covenant, Pro Forma Net Leverage may not exceed 5.0x. The calculation of Pro Forma Net Leverage per the Revolving Facility provides for the add-back of Pelican’s EBITDA losses in an amount up to 15% of Hawkeye’s EBITDA before giving the effect of Pelican’s losses, and permits cash netting of up to $60 million. The calculation above assumes that when Pro Forma Net Leverage exceeds 5.0x, availability under the Revolving Facility is limited to 35% of the aggregate commitments under the Revolving Facility to avoid triggering the covenant. |
[ 15 ]
Overview of Projections
Networks Summary
The below reflects Hawkeye Management’s forecast of Networks segment performance
| Actuals | Projections | Hawkeye Extrapolation | '22E - '26E | '26E - '31E | ||||||||||
| $ in millions | 2020A | 2021A | 2022E | 2023E | 2024E | 2025E | 2026E | 2027E | 2028E | 2029E | 2030E | 2031E | CAGR | CAGR |
| WAPA Puerto Rico | $75 | $82 | $86 | $88 | $96 | $92 | $96 | $97 | $104 | $100 | $101 | $103 | 3% | 1% |
| Cable Networks | 76 | 73 | 76 | 75 | 77 | 78 | 80 | 82 | 83 | 84 | 84 | 85 | 1% | 1% |
| Total Net Revenue | $151 | $155 | $161 | $164 | $173 | $170 | $176 | $179 | $187 | $183 | $186 | $188 | 2% | 1% |
| Y/Y Growth % | 2% | 4% | 1% | 6% | (1%) | 3% | 2% | 5% | (2%) | 1% | 1% | |||
| Cost of Revenue | $48 | $49 | $52 | $53 | $57 | $59 | $62 | $64 | $67 | $69 | $71 | $73 | 4% | 3% |
| SG&A | 39 | 42 | 47 | 48 | 50 | 51 | 53 | 54 | 56 | 58 | 60 | 62 | 3% | 3% |
| Operating Expenses | $88 | $91 | $99 | $101 | $107 | $110 | $114 | $118 | $123 | $127 | $131 | $135 | 4% | 3% |
| Memo: | ||||||||||||||
| Corporate Overhead Allocation1 | (3) | (4) | (4) | (4) | (5) | (5) | (5) | (5) | (5) | (6) | (6) | |||
| Adj. EBITDA 1 | $64 | $67 | $66 | $66 | $70 | $65 | $66 | $66 | $70 | $62 | $60 | $59 | (0%) | (2%) |
| Y/Y Growth % | 6% | (1%) | (0%) | 6% | (8%) | 2% | (1%) | 6% | (11%) | (2%) | (2%) | |||
| Margin % | 42% | 43% | 41% | 41% | 41% | 38% | 38% | 37% | 37% | 34% | 33% | 31% | ||
| SBC | (5) | (5) | (5) | (6) | (6) | (6) | (6) | (7) | (7) | (7) | (8) | 6% | 5% | |
| Adj. EBITDA (Post-SBC) 1 | $64 | $63 | $62 | $61 | $65 | $59 | $60 | $59 | $63 | $55 | $53 | $51 | (1%) | (3%) |
| Y/Y Growth % | (2%) | (2%) | (1%) | 6% | (9%) | 2% | (2%) | 6% | (13%) | (3%) | (3%) | |||
| Margin % | 42% | 40% | 38% | 37% | 38% | 35% | 34% | 33% | 34% | 30% | 29% | 27% | ||
| Revenue by Type (%) | ||||||||||||||
| Subscriber Fees | 51% | 50% | 48% | 47% | 45% | 45% | 44% | 44% | 42% | 43% | 43% | 43% | ||
| Net Advertising | 46% | 47% | 47% | 48% | 50% | 48% | 48% | 48% | 50% | 48% | 48% | 48% | ||
| Other | 3% | 3% | 5% | 5% | 5% | 7% | 8% | 8% | 8% | 9% | 9% | 10% | ||
| Memo: Capex | $2 | $4 | $4 | $4 | $4 | $4 | $4 | $5 | $5 | $5 | $6 | $6 | ||
| Source: | Hawkeye Management |
| 1. | Adj. EBITDA adjusted for 25% of corporate overhead expenses allocated to Pelican per Hawkeye Management |
[ 16 ]
Overview of Projections
Pelican Summary
The below reflects Hawkeye Management’s forecast of the Pelican segment performance
| Actuals | Projections | Hawkeye Extrapolation | '22E - '26E | '26E - '31E | ||||||||||
| $ in millions | 2020A | 2021A | 2022E | 2023E | 2024E | 2025E | 2026E | 2027E | 2028E | 2029E | 2030E | 2031E | CAGR | CAGR |
| Total EoP Subscribers (000s) | 850 | 948 | 1,461 | 1,986 | 2,506 | 2,966 | 3,366 | 3,666 | 3,966 | 4,216 | 4,416 | 4,566 | 23% | 6% |
| Y/Y Growth % | 30% | 12% | 54% | 36% | 26% | 18% | 13% | 9% | 8% | 6% | 5% | 3% | ||
| Subscription | $44 | $51 | $57 | $90 | $125 | $154 | $179 | $219 | $247 | $265 | $280 | $291 | 33% | 10% |
| Theatrical | 0 | 0 | 6 | 21 | 28 | -- | -- | -- | -- | -- | -- | -- | n/m | 0% |
| Licensing & Other | 2 | 2 | 15 | 27 | 33 | 27 | 24 | 24 | 23 | 24 | 25 | 26 | 12% | 2% |
| Total Net Revenue | $47 | $53 | $78 | $138 | $186 | $181 | $202 | $243 | $270 | $289 | $304 | $317 | 27% | 9% |
| Y/Y Growth % | 13% | 48% | 76% | 35% | (3%) | 12% | 20% | 11% | 7% | 5% | 4% | |||
| Content | $10 | $5 | $19 | $43 | $57 | $50 | $53 | $59 | $66 | $71 | $78 | $84 | 29% | 10% |
| Distribution | 5 | 5 | 6 | 8 | 11 | 13 | 15 | 18 | 21 | 22 | 23 | 24 | 26% | 10% |
| Technical | 3 | 5 | 6 | 6 | 7 | 8 | 10 | 11 | 12 | 12 | 13 | 14 | 13% | 7% |
| Marketing | 32 | 47 | 50 | 62 | 70 | 73 | 70 | 79 | 87 | 87 | 89 | 90 | 9% | 5% |
| Other SG&A | 11 | 12 | 21 | 30 | 38 | 19 | 19 | 19 | 20 | 21 | 22 | 23 | (3%) | 4% |
| Operating Expenses | $61 | $74 | $102 | $149 | $183 | $163 | $167 | $187 | $205 | $214 | $225 | $235 | 13% | 7% |
| Memo: | ||||||||||||||
| Corporate Overhead Allocation1 | 3 | 4 | 4 | 4 | 5 | 5 | 5 | 5 | 5 | 6 | 6 | |||
| Adj. EBITDA 1 | ($14) | ($24) | ($28) | ($15) | ($1) | $13 | $31 | $51 | $60 | $69 | $74 | $76 | n/m | 20% |
| Y/Y Growth % | n/m | n/m | n/m | n/m | n/m | n/m | 128% | 66% | 17% | 16% | 7% | 3% | ||
| Margin % | n/m | n/m | n/m | n/m | n/m | 7% | 15% | 21% | 22% | 24% | 24% | 24% | ||
| SBC | (2) | (2) | (2) | (2) | (2) | (2) | (2) | (2) | (2) | (2) | (3) | 6% | 5% | |
| Adj. EBITDA (Post-SBC) 1 | ($14) | ($26) | ($29) | ($17) | ($3) | $12 | $29 | $49 | $58 | $67 | $71 | $74 | n/m | 21% |
| Y/Y Growth % | n/m | n/m | n/m | n/m | n/m | n/m | 149% | 70% | 18% | 16% | 7% | 3% | ||
| Margin % | n/m | n/m | n/m | n/m | n/m | 6% | 14% | 20% | 21% | 23% | 23% | 23% | ||
| Select KPIs2 | ||||||||||||||
| Monthly Churn | 12% | 8% | 8% | 7% | 7% | 6% | 6% | 6% | 6% | 6% | 6% | 6% | ||
| ARPU | $4.88 | $4.76 | $3.96 | $4.35 | $4.65 | $4.69 | $4.70 | $5.20 | $5.40 | $5.40 | $5.40 | $5.40 | ||
| SAC | $27.41 | $48.79 | $34.33 | $30.31 | $29.38 | $29.43 | $30.00 | $33.00 | $34.00 | $33.00 | $33.00 | $33.00 | ||
| LTV | $39.15 | $59.67 | $51.19 | $61.63 | $69.41 | $74.49 | $75.20 | $83.87 | $87.80 | $88.52 | $89.26 | $90.00 | ||
| LTV / SAC | 1.4x | 1.2x | 1.5x | 2.0x | 2.4x | 2.5x | 2.5x | 2.5x | 2.6x | 2.7x | 2.7x | 2.7x | ||
| Cash Content Cost ($mm) | $22 | $36 | $32 | $36 | $39 | $43 | $47 | $52 | $57 | $63 | $69 | $76 | ||
| Source: | Hawkeye Management |
| 1. | Adj. EBITDA adjusted for 25% of corporate overhead expenses allocated to Pelican per Hawkeye Management |
| 2. | KPI figures for 2021A reflects operating results for the nine months ending December 31, 2021 |
[ 17 ]
Overview of Projections
Consolidated Summary
The below reflects Hawkeye Management’s forecast of the financial performance of the entire Hawkeye business (Networks and Pelican)
| Actuals | Projections | Hawkeye Extrapolation | '22E - '26E | '26E - '31E | ||||||||||
| $ in millions | 2020A | 2021A | 2022E | 2023E | 2024E | 2025E | 2026E | 2027E | 2028E | 2029E | 2030E | 2031E | CAGR | CAGR |
| WAPA Puerto Rico | $75 | $82 | $86 | $88 | $96 | $92 | $96 | $97 | $104 | $100 | $101 | $103 | 3% | 1% |
| Cable Networks | 76 | 73 | 76 | 75 | 77 | 78 | 80 | 82 | 83 | 84 | 84 | 85 | 1% | 1% |
| Pelican | 47 | 53 | 78 | 138 | 186 | 181 | 202 | 243 | 270 | 289 | 304 | 317 | 27% | 5% |
| Total Net Revenue | $198 | $208 | $240 | $302 | $359 | $352 | $378 | $422 | $458 | $472 | $490 | $505 | 12% | 4% |
| Y/Y Growth % | 5% | 15% | 26% | 19% | (2%) | 8% | 12% | 9% | 3% | 4% | 3% | |||
| Networks | $48 | $49 | $52 | $53 | $57 | $59 | $62 | $64 | $67 | $69 | $71 | $73 | 4% | 3% |
| Pelican | 18 | 14 | 31 | 57 | 75 | 72 | 77 | 88 | 98 | 106 | 114 | 123 | 26% | 7% |
| Total Cost of Revenue | $66 | $63 | $83 | $111 | $132 | $131 | $139 | $152 | $165 | $175 | $185 | $195 | 14% | 5% |
| Networks Pelican | $39 43 | $42 59 | $47 71 | $48 92 | $50 108 | $51 91 | $53 89 | $54 99 | $56 107 | $58 108 | $60 111 | $62 112 | 3% 6% | 3% 3% |
| Total SG&A | $82 | $101 | $118 | $140 | $158 | $142 | $142 | $153 | $164 | $167 | $171 | $174 | 5% | 3% |
| Total Operating Expenses | $149 | $165 | $201 | $251 | $290 | $273 | $281 | $305 | $328 | $341 | $355 | $370 | 9% | 4% |
| Consolidated Adj. EBITDA | $50 | $43 | $39 | $51 | $69 | $78 | $97 | $116 | $129 | $131 | $134 | $135 | 26% | 3% |
| Y/Y Growth % | (13%) | (10%) | 32% | 35% | 13% | 23% | 20% | 11% | 1% | 3% | 1% | |||
| Margin % | 25% | 21% | 16% | 17% | 19% | 22% | 26% | 28% | 28% | 28% | 27% | 27% | ||
| SBC | (5) | (6) | (6) | (7) | (7) | (8) | (8) | (9) | (9) | (9) | (10) | (10) | 6% | 4% |
| Adj. EBITDA (Post-SBC) | $44 | $37 | $32 | $44 | $62 | $71 | $89 | $108 | $120 | $121 | $124 | $125 | ||
| Y/Y Growth % | (17%) | (12%) | 36% | 40% | 14% | 26% | 22% | 12% | 1% | 2% | 0% | |||
| Margin % | 22% | 18% | 14% | 15% | 17% | 20% | 23% | 26% | 26% | 26% | 25% | 25% | ||
| Contribution (%) | ||||||||||||||
| Revenue - Networks | 76% | 74% | 67% | 54% | 48% | 48% | 47% | 42% | 41% | 39% | 38% | 37% | ||
| Revenue - Pelican | 24% | 26% | 33% | 46% | 52% | 52% | 53% | 58% | 59% | 61% | 62% | 63% | ||
| EBITDA - Networks | n/m | n/m | n/m | n/m | 102% | 83% | 68% | 56% | 54% | 47% | 45% | 44% | ||
| EBITDA - Pelican | n/m | n/m | n/m | n/m | (2%) | 17% | 32% | 44% | 46% | 53% | 55% | 56% | ||
Source: Hawkeye Management
[ 18 ]
| III. | Preliminary Financial Analysis Summary |
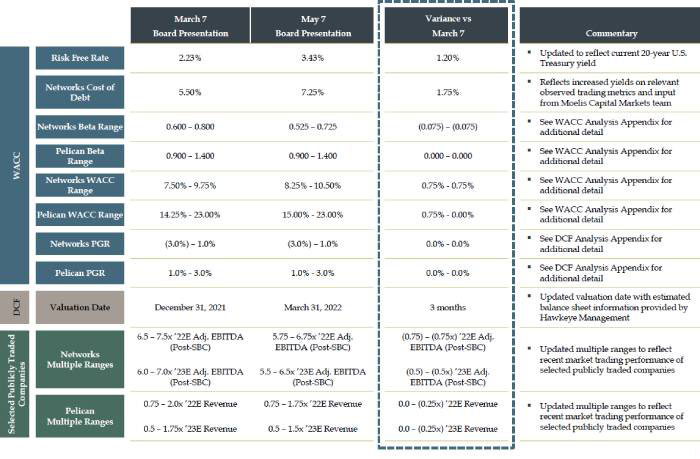
Summary of Changes to Financial Analysis
[ 20 ]
Preliminary Financial Analyses and Commentary
Moelis performed its financial analysis on a sum-of-the-parts basis (“SOTP”) because of the different characteristics of Hawkeye’s business lines: (1) Networks, a broadcaster with cable network assets, and (2) Pelican, an SVOD platform
 | ▪ The DCF analysis was performed using the LRP and Extrapolation provided by Hawkeye for 2022E – 2031E ▪ The DCF analysis was discounted to March 31, 2022 and relied upon the mid-year convention – Moelis discounted the cash flows separately for the Networks and Pelican businesses, and then added together the DCF analyses to calculate a consolidated DCF price per share ▪ Moelis used the perpetuity growth method to calculate estimated terminal values ▪ To calculate the normalized impact of election year cash flows on the Networks business, Hawkeye Management directed Moelis to increase 2031E EBITDA to calculate a normalized terminal year EBITDA. See appendix A for additional detail |
 | ▪ Moelis reviewed and analyzed certain financial information and market trading data related to companies whose operations Moelis believed to be generally relevant for the Networks and Pelican businesses for purposes of this analysis ▪ For Networks, selected publicly traded companies analysis focused on EV / EBITDA multiples based on Wall Street consensus estimates for 2022E and 2023E EBITDA1 ▪ For Pelican, selected publicly traded companies analysis focused on EV / revenue multiples based on Wall Street consensus estimates for 2022E and 2023E |
 | ▪ Moelis reviewed and analyzed certain selected precedent merger and acquisition transactions involving companies whose operations Moelis believe to be generally relevant for the Networks and Pelican businesses for purposes of this analysis ▪ For Networks, selected precedent transaction analysis focused on EV / EBITDA multiples ▪ For Pelican, selected precedent transaction analysis focused on EV / revenue multiples |
| 1. | For publicly traded Broadcasters, 2022E and 2023E EBITDA reflects consensus estimates for the average of 2021/2022 and 2022/2023, reflecting the significant political advertising contributions in even years to those businesses |
[ 21 ]
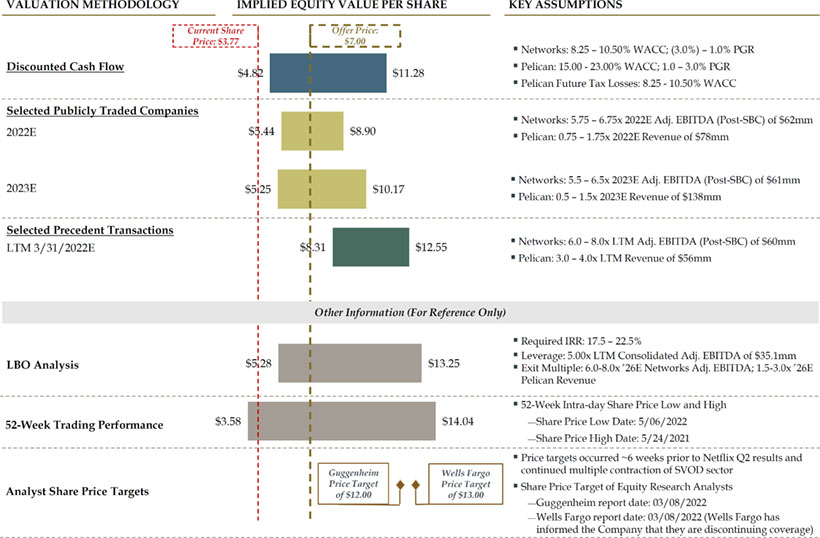
Preliminary Financial Analysis Summary – Consolidated
| Source: | Hawkeye Management, Wall Street research, Capital IQ |
| Note: | Market data as of 05/06/2022. Assumes 20.7mm Class A shares, 19.7mm Class B Shares, 4.48mm options with strike prices ranging from $5.44 to $15.00, total debt of $251.6mm, cash of $37.3mm, equity method investments of $22.7mm (which are treated as cash and calculated using Hawkeye Management’s estimate for the value of these assets) and post-tax pension liability of $1.7mm per Hawkeye Management |
[ 22 ]
Appendix
A. Preliminary Discounted Cash Flow Analysis
Discounted Cash Flow Analysis
Networks Methodology & Assumptions
Discounted cash flow (“DCF”) analysis reflects implied enterprise value range based on estimated present value of unlevered after-tax free cash flows projected by Hawkeye Management and estimated present value of terminal value
| ▪ | Based on Hawkeye Management’s projections for the Networks business |
| — | Tax rate based on effective tax rate of 30.5% for Networks per Hawkeye Management; cash tax projections do not take into account potential benefit from interest tax shield or other tax characteristics that the Networks business may benefit from |
| — | Assumes transaction date of 03/31/22 and uses projected 03/31/22 balance sheet information per Hawkeye Management |
| ▪ | Unlevered after-tax free cash flows from 2022E through 2031E and terminal values were discounted to March 31, 2022 using the mid-year convention |
| — | Discount rate range of 8.25% to 10.50% derived from the capital asset pricing model (“CAPM”) |
| ▪ | To calculate the estimated terminal value, Moelis used the perpetuity growth method and assumed a perpetuity growth rate of (3.0)% to 1.0% |
| — | Perpetuity growth assumption of (3.0)% to 1.0% reflects declining EBITDA and free cash flow in the extrapolated period |
| — | Terminal year cash flows set equal to 2031E except for the below adjustments: |
| ● | EBITDA increased, per Hawkeye Management, by $1.1mm to reflect a normalized level of contributions from political revenue over a four year election cycle |
| – | This adjustment was calculated, per Hawkeye Management, by assuming an incremental $6.3mm of terminal year revenue, less agency commissions and news costs, resulting in an election year EBITDA contribution of $4.35mm. This figure was then multiplied by 25% to reflect a four year election cycle, resulting in $1.1mm of incremental EBITDA added to the terminal year |
| ● | Terminal year D&A set equal to terminal year capex per Hawkeye Management |
| ▪ | Networks DCF value calculated on an enterprise value basis; in order to calculate consolidated value implied by the DCF on a per share basis, Moelis utilized the following approach: |
| — | First, Networks DCF and Pelican DCF enterprise values were added together |
| — | Second, the combined enterprise value was reduced by total Hawkeye net debt (see page 69) to calculate consolidated equity value |
| — | Third, the consolidated equity value was divided by the number of fully diluted shares outstanding (see page 69) to calculate per share equity value |
Source: Hawkeye Management
[ 25 ]
Discounted Cash Flow Analysis
Networks
PROJECTED UNLEVERED FREE CASH FLOW
| Actuals | Projections | Hawkeye Extrapolation | Terminal | ||||||||||
| ($ in millions) | 2021A | Q1 '22E | Q2-Q4 '22E | 2023E | 2024E | 2025E | 2026E | 2027E | 2028E | 2029E | 2030E | 2031E | Year |
| Adjusted EBITDA | $67.2 | $14.0 | $52.4 | $66.4 | $70.4 | $65.0 | $66.2 | $65.5 | $69.5 | $61.7 | $60.5 | $59.0 | $60.1 1 |
| % Growth | 27% | 6% | (8%) | 2% | (1%) | 6% | (11%) | (2%) | (2%) | 2% | |||
| Less: SBC | ($1.1) | (3.7) | (5.3) | (5.5) | (5.8) | (6.1) | (6.4) | (6.7) | (7.1) | (7.4) | (7.8) | (7.8) | |
| Less: Depreciation & Amortization | ($2.6) | (3.7) | (5.0) | (5.2) | (5.2) | (5.3) | (5.3) | (5.3) | (5.3) | (5.3) | (5.3) | (6.0) | |
| Less: Severance | -- | -- | -- | -- | -- | -- | -- | -- | -- | (0.5) | (0.5) | -- | |
| Adjusted EBIT | $10.4 | $45.0 | $56.1 | $59.7 | $54.0 | $54.9 | $53.8 | $57.6 | $49.4 | $47.3 | $45.5 | $46.3 | |
| Less: Taxes | (3.2) | (13.7) | (17.1) | (18.2) | (16.5) | (16.7) | (16.4) | (17.6) | (15.1) | (14.4) | (13.9) | (14.1) | |
| Tax-Affected EBIT | $7.2 | $31.3 | $39.0 | $41.5 | $37.5 | $38.1 | $37.4 | $40.0 | $34.3 | $32.9 | $31.6 | $32.2 | |
| Plus: Depreciation & Amortization | 2.6 | 3.7 | 5.0 | 5.2 | 5.2 | 5.3 | 5.3 | 5.3 | 5.3 | 5.3 | 5.3 | 6.0 | |
| Plus: Programming Amortization | 3.1 | 11.1 | 12.9 | 13.4 | 13.9 | 14.4 | 15.1 | 15.8 | 16.5 | 17.2 | 18.0 | 18.0 | |
| Less: Capital Expenditures | (0.8) | (2.7) | (4.0) | (4.0) | (4.0) | (4.0) | (5.0) | (5.0) | (5.0) | (6.0) | (6.0) | (6.0) | |
| Less: Programming Payments | (4.7) | (10.2) | (13.6) | (14.2) | (15.0) | (15.7) | (16.4) | (17.1) | (17.9) | (18.7) | (19.6) | (19.6) | |
| Less: Equity Method Investments | (0.1) | (0.9) | -- | -- | -- | -- | -- | -- | -- | -- | -- | -- | |
| Plus: Other Adj. | 0.1 | 0.4 | 0.5 | 0.3 | 0.2 | 0.2 | 0.2 | 0.2 | 0.2 | 0.2 | 0.2 | 0.2 | |
| Less: (Incr.) / Decr. in NWC | (3.8) | 4.6 | 3.3 | (0.2) | 1.9 | 0.6 | 0.5 | (0.2) | 1.0 | 0.1 | 0.1 | 0.1 | |
| Unlevered Free Cash Flow | $3.6 | $37.1 | $43.1 | $41.9 | $39.9 | $38.9 | $37.0 | $38.8 | $34.3 | $30.9 | $29.5 | $30.9 | |
| % Growth | 16% | (3%) | (5%) | (3%) | (5%) | 5% | (12%) | (10%) | (4%) | 4% | |||
| % Conversion | 71% | 65% | 60% | 61% | 59% | 57% | 56% | 56% | 51% | 50% | 51% | ||
| IMPLIED TOTAL ENTERPRISE VALUE (“TEV”) | IMPLIED TEV / TERMINAL ADJ. EBITDA | |||||||||||||
| Perpetuity Growth Rate | Perpetuity Growth Rate | |||||||||||||
| (3.0%) | (2.0%) | (1.0%) | 0.0% | 1.0% | (3.0%) | (2.0%) | (1.0%) | 0.0% | 1.0% | |||||
| 8.3% | $394 | $408 | $425 | $446 | $473 | 8.3% | 4.6x | 5.1x | 5.7x | 6.5x | 7.4x | |||
| 8.8% | 377 | 389 | 404 | 422 | 444 | 8.8% | 4.4x | 4.9x | 5.4x | 6.1x | 6.9x | |||
| WACC | 9.4% | 362 | 372 | 385 | 400 | 419 | WACC | 9.4% | 4.2x | 4.6x | 5.1x | 5.7x | 6.5x | |
| 9.9% | 347 | 357 | 367 | 380 | 396 | 9.9% | 4.0x | 4.4x | 4.9x | 5.4x | 6.1x | |||
| 10.5% | 334 | 342 | 352 | 363 | 377 | 10.5% | 3.9x | 4.2x | 4.6x | 5.1x | 5.7x | |||
| Source: | Hawkeye Management |
| Note: | Cash flows discounted back to 3/31/2022 |
| 1. | Per Hawkeye Management, to calculate the normalized impact of election year cash flows on the Networks business, analysis increased 2031E EBITDA to calculate a normalized terminal year EBITDA. This adjustment was calculated by an assuming an incremental $6.3mm of terminal year revenue, less agency commissions and news costs, resulting in an election year EBITDA contribution of $4.35mm. This figure was then multiplied by 25% to reflect a four year election cycle, resulting in $1.1mm of incremental EBITDA added to the terminal year |
[ 26 ]
Discounted Cash Flow Analysis
Pelican Methodology & Assumptions
Discounted cash flow (“DCF”) analysis reflects implied enterprise value range based on estimated present value of unlevered after-tax free cash flows projected by Hawkeye Management and estimated present value of terminal value
| ▪ | Based on Hawkeye Management’s projections for the Pelican business |
| — | Tax rate based on effective tax rate of 24% for Pelican per Hawkeye Management |
| — | Assumes transaction date of 03/31/22 and uses estimated 03/31/22 balance sheet information per Hawkeye Management |
| ▪ | Unlevered after-tax free cash flows from 2022E through 2031E and terminal values were discounted to March 31, 2022 using the mid-year convention |
| — | Discount rate range of 15.00% to 23.00% derived from the CAPM and private studies on cost of capital for late stage venture investments1 |
| ▪ | Tax Savings that Pelican is forecasted to generate on a standalone basis were valued separately, and discounted to March 31, 2022, using the same discount rate range derived from the WACC calculation for the Networks business |
| — | NOL balance is zero per Hawkeye Management, as prior Pelican taxable losses were used to offset taxes owed on income generated by the Networks business |
| — | Tax savings estimated as Pelican’s negative EBIT (as presented on the DCF), and are expected to be used immediately to offset taxes owed on income generated by the Networks business |
| — | Because the income the tax savings are offsetting is generated at the Networks business, Moelis used the Networks discount rate to calculate the value of the Tax Savings |
| ▪ | To calculate the terminal value, Moelis used the perpetuity growth method and assumed a perpetuity growth rate of 0.5% to 2.0% |
| — | Perpetuity growth assumption of 1.0% to 3.0% in-line with forecasted U.S. GDP growth |
| — | Terminal year cash flows set equal to 2031E except for the below adjustments: |
| ● | Terminal year D&A set equal to terminal year capex per Hawkeye Management |
| ● | Terminal year cash content spend set equal to terminal year content amortization per Hawkeye Management |
| ▪ | Pelican DCF value calculated on an enterprise value basis; in order to calculate consolidated value implied by the DCF on a per share basis, Moelis utilized the following approach: |
| — | First, Networks DCF and Pelican DCF enterprise values were added together |
| — | Second, the combined enterprise value was reduced by total Hawkeye net debt (see page 69) to calculate consolidated equity value |
| — | Third, the consolidated equity value was divided by the number of fully diluted shares outstanding (see page 69) to calculate per share equity value |
| Source: | Hawkeye Management |
| 1. | 2021 Private Capital Markets Report (Pepperdine University) |
[ 27 ]
Discounted Cash Flow Analysis
Pelican
PROJECTED UNLEVERED FREE CASH FLOW
| Actuals | Projections | Hawkeye Extrapolation | Terminal | ||||||||||
| ($ in millions) | 2021A | Q1 '22E | Q2-Q4 '22E | 2023E | 2024E | 2025E | 2026E | 2027E | 2028E | 2029E | 2030E | 2031E | Year |
| Net Revenue | $53.0 | $15.3 | $63.0 | $138.2 | $186.2 | $181.2 | $202.2 | $242.9 | $270.3 | $288.8 | $304.3 | $317.0 | $317.0 |
| % Growth | 119% | 35% | (3%) | 12% | 20% | 11% | 7% | 5% | 4% | 0% | |||
| Adjusted EBITDA | ($24.1) | ($12.1) | ($15.5) | ($15.2) | ($1.2) | $13.5 | $30.7 | $51.0 | $59.9 | $69.2 | $73.8 | $76.2 | $76.2 |
| % Growth | 2% | 92% | n/m | 128% | 66% | 17% | 16% | 7% | 3% | 0% | |||
| Less: SBC | (0.4) | (1.2) | (1.8) | (1.8) | (1.9) | (2.0) | (2.1) | (2.2) | (2.4) | (2.5) | (2.6) | (2.6) | |
| Less: Depreciation & Amortization | (5.0) | (14.9) | (19.8) | (19.8) | (12.4) | (4.7) | (4.7) | (4.7) | (4.7) | (4.7) | (1.2) | (0.8) | |
| Adjusted EBIT | ($17.4) | ($31.6) | ($36.8) | ($22.8) | ($0.9) | $24.0 | $44.2 | $52.9 | $62.1 | $66.6 | $72.4 | $72.8 | |
| Less: Taxes | -- | -- | -- | -- | -- | (5.8) | (10.6) | (12.7) | (14.9) | (16.0) | (17.4) | (17.5) | |
| Tax-Affected EBIT | ($17.4) | ($31.6) | ($36.8) | ($22.8) | ($0.9) | $18.2 | $33.6 | $40.2 | $47.2 | $50.6 | $55.0 | $55.3 | |
| Plus: Depreciation & Amortization | 5.0 | 14.9 | 19.8 | 19.8 | 12.4 | 4.7 | 4.7 | 4.7 | 4.7 | 4.7 | 1.2 | 0.8 | |
| Less: Capital Expenditures | (0.3) | (1.2) | (0.8) | (0.8) | (0.8) | (0.8) | (0.8) | (0.8) | (0.8) | (0.8) | (0.8) | (0.8) | |
| Plus: Content Amortization | 2.5 | 11.0 | 24.6 | 33.8 | 42.4 | 47.2 | 54.3 | 61.8 | 68.0 | 74.5 | 81.5 | 81.5 | |
| Less: Cash Content Spend | (5.3) | (27.0) | (35.5) | (39.1) | (43.0) | (47.3) | (52.0) | (57.2) | (63.0) | (69.3) | (76.2) | (81.5) | |
| Less: LatAm Cash Timing Diff. | (0.1) | 0.6 | 0.9 | -- | -- | -- | -- | -- | -- | -- | -- | -- | |
| Less: Change in Working Capital | 6.0 | (6.2) | (2.2) | (1.6) | (1.7) | (1.8) | (2.2) | (2.5) | (2.6) | (2.8) | (2.9) | (2.9) | |
| Plus: Pantelion 2.0 Cash Flow | (5.7) | (1.3) | (1.3) | (6.1) | 3.6 | (0.6) | (1.3) | (0.8) | 1.0 | 1.5 | 0.9 | 0.9 | |
| Unlevered Free Cash Flow | ($15.4) | ($40.8) | ($31.2) | ($16.8) | $12.1 | $19.6 | $36.2 | $45.6 | $54.6 | $58.5 | $58.7 | $53.3 | |
| % Growth | 23% | 46% | 172% | 62% | 85% | 26% | 20% | 7% | 0% | (9%) | |||
| % Conversion | n/m | n/m | n/m | 90% | 64% | 71% | 76% | 79% | 79% | 77% | 70% | ||
| IMPLIED TOTAL ENTERPRISE VALUE (“TEV”) 1 | IMPLIED TEV / TERMINAL REVENUE | |||||||||||||
| Perpetuity Growth Rate | Perpetuity Growth Rate | |||||||||||||
| 1.0% | 1.5% | 2.0% | 2.5% | 3.0% | 1.0% | 1.5% | 2.0% | 2.5% | 3.0% | |||||
| 15.0% | $158 | $162 | $167 | $172 | $178 | 15.0% | 1.3x | 1.4x | 1.4x | 1.5x | 1.5x | |||
| 17.0% | 121 | 123 | 127 | 130 | 134 | 17.0% | 1.1x | 1.2x | 1.2x | 1.3x | 1.3x | |||
| WACC | 19.0% | 92 | 94 | 97 | 99 | 101 | WACC | 19.0% | 1.0x | 1.1x | 1.1x | 1.1x | 1.2x | |
| 21.0% | 71 | 72 | 74 | 75 | 77 | 21.0% | 0.9x | 1.0x | 1.0x | 1.0x | 1.1x | |||
| 23.0% | 54 | 55 | 56 | 57 | 58 | 23.0% | 0.9x | 0.9x | 0.9x | 0.9x | 1.0x | |||
| Source: | Hawkeye Management |
| Note: | Cash flows discounted back to 3/31/2022 |
| 1. | Includes present value of Tax Savings (see next page for detail) |
[ 28 ]
Discounted Cash Flow (DCF) Analysis
Pelican Tax Savings Analysis
TAX SAVINGS PROJECTIONS
| Actuals | Projection | Hawkeye Extrapolation | |||||||||
| ($ in millions) | 2021A | Q2-Q4 '22E | 2023E | 2024E | 2025E | 2026E | 2027E | 2028E | 2029E | 2030E | 2031E |
| Adj. EBIT (Pelican) | ($31.6) | ($36.8) | ($22.8) | ($0.9) | $24.0 | $44.2 | $52.9 | $62.1 | $66.6 | $72.4 | |
| Adj. EBIT Losses (Pelican) | ($31.6) | ($36.8) | ($22.8) | ($0.9) | $-- | $-- | $-- | $-- | $-- | $-- | |
| (x) Tax Rate (Pelican) | 24.0% | 24.0% | 24.0% | 24.0% | 24.0% | 24.0% | 24.0% | 24.0% | 24.0% | 24.0% | |
| Tax Savings Generated | $7.6 | $8.8 | $5.5 | $0.2 | - | - | - | - | - | - | |
| Memo | |||||||||||
| Adj. EBIT (Networks) | $45.0 | $56.1 | $59.7 | $54.0 | $54.9 | $53.8 | $57.6 | $49.4 | $47.3 | $45.5 | |
| (-) Taxes (Networks) | (13.7) | (17.1) | (18.2) | (16.5) | (16.7) | (16.4) | (17.6) | (15.1) | (14.4) | (13.9) | |
| Implied Tax Rate | 30.5% | 30.5% | 30.5% | 30.5% | 30.5% | 30.5% | 30.5% | 30.5% | 30.5% | 30.5% | |
| Tax Affected EBIT (Networks) | $31.3 | $39.0 | $41.5 | $37.5 | $38.1 | $37.4 | $40.0 | $34.3 | $32.9 | $31.6 | |
| PRESENT VALUE OF TAX SAVINGS | ||||
| WACC | ||||
| 8.3% | 8.8% | 9.4% | 9.9% | 10.5% |
| $20.1 | $20.0 | $19.9 | $19.7 | $19.6 |
| Source: | Hawkeye Management |
[ 29 ]
Discounted Cash Flow Analysis
Consolidated (Networks + Pelican)
| CONSOLIDATED TEV (INCL. PV OF TAX SAVINGS) | IMPLIED SHARE PRICE (INCL. PV OF TAX SAVINGS) | |||||||||||||
| Perpetuity Growth Rate | Perpetuity Growth Rate | |||||||||||||
| -3.0% / 1.0% | -2.0% / 1.5% | -1.0% / 2.0% | 0.0% / 2.5% | 1.0% / 3.0% | -3.0% / 1.0% | -2.0% / 1.5% | -1.0% / 2.0% | 0.0% / 2.5% | 1.0% / 3.0% | |||||
| 8.3% / 15.0% | $552 | $571 | $592 | $619 | $651 | 8.3% / 15.0% | $8.88 | $9.33 | $9.87 | $10.50 | $11.28 | |||
| 8.8% / 17.0% | 498 | 513 | 530 | 551 | 577 | 8.8% / 17.0% | $7.53 | $7.90 | $8.33 | $8.86 | $9.50 | |||
| WACC | 9.4% / 19.0% | 454 | 467 | 481 | 499 | 520 | WACC | 9.4% / 19.0% | $6.45 | $6.76 | $7.12 | $7.55 | $8.07 | |
| 9.9% / 21.0% | 418 | 429 | 441 | 456 | 473 | 9.9% / 21.0% | $5.57 | $5.83 | $6.13 | $6.49 | $6.93 | |||
| 10.5% / 23.0% | 388 | 397 | 408 | 420 | 435 | 10.5% / 23.0% | $4.82 | $5.05 | $5.31 | $5.61 | $5.98 | |||
| Networks / Pelican | Networks / Pelican | |||||||||||||
| Source: | Hawkeye Management |
[ 30 ]
| B. | Preliminary Selected Publicly Traded Companies Analysis |
Selected Publicly Traded Companies Analysis
Summary – 2022E
Analysis reflects implied enterprise value to Adj. EBITDA multiples and implied enterprise value to Revenue multiples for Networks and Pelican, respectively, based on public market trading multiples of companies deemed generally relevant by Moelis in certain respects to Hawkeye for purposes of this analysis
| Multiple Range | Enterprise Value | |||||||||||
| Segment | Metric | Value | Low | - | High | Low | - | High | ||||
| Networks | 2022E Adj. EBITDA (Post-SBC) | $61.6 | 5.75x | - | 6.75x | $354 | - | $416 | ||||
| Pelican | 2022E Revenue | $78.3 | 0.75x | - | 1.75x | $59 | - | $137 | ||||
| Total Enterprise Value | $413 | $553 | ||||||||||
| Less: Net Debt (as of 3/31/22) 1 | (214) | (214) | ||||||||||
| Add: Other (as of 3/31/22) 1 | 21 | 21 | ||||||||||
| Total Equity Value | $220 | $360 | ||||||||||
| Fully Diluted Shares Outstanding (as of 3/31/22) 1 | 40.401 | 40.442 | ||||||||||
| Implied Equity Value per Share | $5.44 | $8.90 | ||||||||||
| Source: | Hawkeye Management |
| 1. | See page 69 for further detail |
[ 32 ]
Selected Publicly Traded Companies Analysis
Summary – 2023E
Analysis reflects implied enterprise value to Adj. EBITDA multiples and implied enterprise value to Revenue multiples for Networks and Pelican, respectively, based on public market trading multiples of companies deemed generally relevant by Moelis in certain respects to Hawkeye for purposes of this analysis
| Multiple Range | Enterprise Value | |||||||||||
| Segment | Metric | Value | Low | - | High | Low | - | High | ||||
| Networks | 2023E Adj. EBITDA (Post-SBC) | $61.1 | 5.5x | - | 6.5x | $336 | - | $397 | ||||
| Pelican | 2023E Revenue | $138.2 | 0.5x | - | 1.50x | $69 | - | $207 | ||||
| Total Enterprise Value | $405 | $605 | ||||||||||
| Less: Net Debt (as of 3/31/22) 1 | (214) | (214) | ||||||||||
| Add: Other (as of 3/31/22) 1 | 21 | 21 | ||||||||||
| Total Equity Value | $212 | $411 | ||||||||||
| Fully Diluted Shares Outstanding (as of 3/31/22) 1 | 40.401 | 40.452 | ||||||||||
| Implied Equity Value per Share | $5.25 | $10.17 | ||||||||||
| Source: | Hawkeye Management |
| 1. | See page 69 for further detail |
[ 33 ]
Selected Publicly Traded Companies Analysis
Networks: Discussion of Selected Publicly Traded Companies
Selected publicly traded companies analysis provides a valuation range based on public market valuations of businesses with operations and financial characteristics similar in certain respects to Networks for purposes of this analysis
| ▪ | Moelis selected publicly traded companies which have a significant presence in the diversified media and networks as well as TV broadcasting industries |
| — | Network segment’s principal business is producing and distributing news, sports and entertainment content across broadcast in Puerto Rico and cable television in the U.S. primarily targeted to a U.S. Spanish language audience |
| ▪ | No single company is substantially similar across a range of key criteria including size of the company, geographic focus, EBITDA margin, growth profile, financial leverage and business model (including ownership of broadcast network and affiliate stations, TV market presence and business segments) |
| ▪ | Moelis selected four publicly traded diversified media and networks companies with operations diversified across broadcast networks, cable channels, digital properties and other media assets that it deemed relevant for purposes of this analysis |
| — | Fox Corporation is similar in certain respects to Hawkeye given its broadcast network and cable networks ownership with a focus on TV news, sports and general entertainment programming |
| ● | Moelis views Fox Corporation as the most relevant corporation for Networks and believes Networks should trade at a discount to Fox because: |
| – | Fox earns the majority of its revenue from its broadcast network operations and cable network operations |
| – | Fox is a “Big Four” network (includes ABC, NBC, CBS and FOX) broadcaster and has superior distribution footprint |
| – | Fox News (cable network) is carried on basic cable, whereas Hawkeyes is primarily included on lesser distributed Spanish language tiers |
| – | Fox is expected to achieve significantly higher growth of ~5% revenue CAGR (2021-2023E) compared to Hawkeye Networks at ~3% over the same period |
| — | Paramount is comprised of a broadcast network (CBS), owned and operated TV stations, premium and basic cable channels (Comedy Central, Nickelodeon, etc.) and a film studio (Paramount) |
| ● | Excluding Pelican, the Networks business model is more similar in certain respects to the CBS broadcast networks segment of the legacy CBS business and the cable networks (Nickelodeon, Comedy Central) segment of the legacy Viacom business; the remaining assets (Paramount film studio, Showtime, etc.) of Paramount are less relevant |
| — | AMC Networks is similar in certain respects to the cable networks business within Networks as the majority of its revenue is derived from distribution fees from AMC’s MVPD and vMVPD partners that distribute its networks including ABC, BBC AMERICA and other networks |
| ● | AMC Networks is less relevant to Networks in that it does not operate a traditional broadcast network |
| — | Prior to the acquisition of Warner Media, Discovery is similar in certain respects to the cable networks business within Networks as a portion of Discovery's revenue is from distribution fees from Discovery's MVPD and vMVPD partners |
| ● | Post Warner Media acquisition, Discovery is less relevant given its premium subscription, cable, film studio and other assets |
[ 34 ]
Selected Publicly Traded Companies Analysis
Networks: Discussion of Selected Publicly Traded Companies (Cont’d)
| ▪ | Moelis also reviewed six publicly traded companies within the TV broadcasting industry that it deemed less relevant for purposes of this analysis |
| — | Network’s business model differs from the other selected TV broadcasters given that Networks broadcast business owns its own networks (WAPA PR) whereas the other selected TV broadcasters pay fees to their affiliated Network (CBS, Fox, etc.) in exchange for programming |
| — | Nexstar, Sinclair, TEGNA, Gray Television, EW Scripps and Entravision derive the vast majority of their revenue from TV broadcasting operations; each individual television station is affiliated with a third-party network (e.g., Fox, NBC) |
| ● | The majority of their network affiliations are on ABC, CBS, NBC and Fox TV networks |
| ● | The Big Four networks have greater distribution, higher ratings, earn higher retransmission fees from distributors and command higher CPMs than Non-Big Four networks such as CW and MyTV |
| ▪ | Moelis focused on forward EBITDA multiples for diversified media and networks companies |
| ▪ | Moelis focused on two-year average EBITDA multiples for the TV Broadcasting companies (due to the even calendar year impact of political advertising revenue) |
| — | We note this approach is consistent with leading Wall Street research analysts who cover the TV broadcasting industry |
| ▪ | Moelis selected a range of multiples from the selected publicly traded companies analysis and applied the multiples to the Company’s 2022E and 2023E EBITDA to calculate enterprise value |
| — | Moelis primarily utilized the diversified media companies that operate both broadcast and cable networks (primarily Fox, and also Paramount) in the determination of its multiples given they are more relevant since their business model more closely aligns with Hawkeye |
| — | Unlike the select publicly traded broadcasters, Hawkeye earns a relatively small portion of its revenue from political (~2.5% in 2020A) and therefore forward EBITDA as opposed to a blend of forward and historical EBITDA was appropriate (as is used for the broadcasters as discussed above) |
| ▪ | Based on the above and its professional judgement, Moelis selected a reference range of 5.75x – 6.75x 2022E Networks Adj. EBITDA and 5.5x – 6.5x 2023E Networks Adj. EBITDA |
[ 35 ]
Selected Publicly Traded Companies Analysis
Detail – Diversified Media & Networks
| (Figures in $ millions) | Hawkeye (Networks) |  |  |  |  |
| Valuation Metrics | |||||
| Total Enterprise Value | $93,433 | $30,688 | $20,959 | $3,727 | |
| Equity Value | 43,072 | 18,426 | 19,050 | 1,452 | |
| TEV / 2022E Metrics | |||||
| EBITDA Post-SBC | 8.8x | 8.3x | 6.3x | 6.0x | |
| EBITDA Post-SBC (excl. SVOD losses) | 7.6x | 5.9x | 6.3x | 5.8x | |
| TEV / 2023E Metrics | |||||
| EBITDA Post-SBC | 6.7x | 9.4x | 6.1x | 6.2x | |
| EBITDA Post-SBC (excl. SVOD losses) | 6.7x | 6.1x | 6.1x | 5.9x | |
| Net Debt / 2022E EBITDA | 4.6x | 3.5x | 1.2x | 3.1x | |
| Projected Operating Metrics | |||||
| ‘21A - ‘23E Revenue CAGR % | 2.8% | 6.3% | 6.2% | 4.9% | 2.6% |
| ‘21A - ‘23E Post-SBC EBITDA CAGR % | (1.2%) | 15.2% | (14.3%) | 7.2% | (7.8%) |
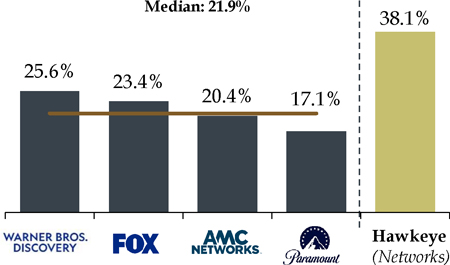
| 2022E Post-SBC EBITDA Margin % | 38.1% | 22.2% | 12.2% | 23.4% | 19.6% |
| 2022E Post-SBC EBITDA (excl. SVOD losses) Margin % | 38.1% | 25.6% | 17.1% | 23.4% | 20.4% |
| Source: | Company filings, Wall Street research, Press releases |
| Note: | Market data as of 05/06/2022 |
| 1. | Pro forma balance sheet figures from most recent public filing reflecting 12/31/2021 |
| 2. | CY2023E EBITDA and revenue reflects consensus estimates calendarized (average of FY2023E and FY2024E estimates 6/30 fiscal year end) |
[ 36 ]
Selected Publicly Traded Companies Analysis
Comparison of Selected Publicly Traded Diversified Media & Networks Companies
Analysis below compares operating metrics of selected publicly traded media networks companies
2022E EBITDA MARGIN (PRE-SVOD LOSSES)
2022E EBITDA MARGIN (POST-SVOD LOSSES)
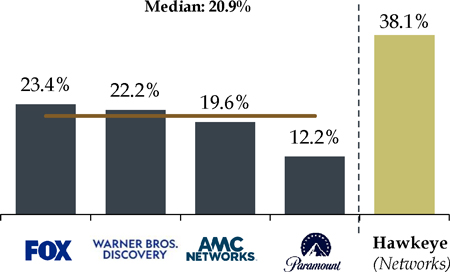
2021A-2023E REVENUE CAGR (%)

| Source: | Company filings, Wall Street research, Capital IQ |
| Note: | Market data as of 05/06/2022 |
[ 37 ]
Selected Publicly Traded Companies Analysis
Detail – Broadcasters
| (Figures in $ millions) | Hawkeye (Networks) |  |  |  |  |  |  |
| Valuation Metrics | |||||||
| Total Enterprise Value | $13,136 | $8,971 | $7,278 | $5,203 | $398 | $13,749 | |
| Equity Value | 6,827 | 1,808 | 3,861 | 1,404 | 398 | 1,719 | |
| TEV / 2022E Metrics | |||||||
| 2021A-2022E Avg. EBITDA Post-SBC | 6.4x | 7.7x | 6.8x | 7.8x | 5.0x | 12.1x | |
| TEV / 2023E Metrics | |||||||
| 2022E-2023E Avg. EBITDA Post-SBC | 6.1x | 7.5x | 6.3x | 7.8x | 4.7x | 13.6x | |
| Net Debt / 2022E EBITDA | 3.4x | 4.7x | 2.9x | 4.7x | 0.0x | 11.4x | |
| Projected Operating Metrics | |||||||
| ‘21A - ‘23E Revenue CAGR % | 2.8% | 5.4% | 5.8% | 6.0% | 6.6% | 14.7% | 3.9% |
| ‘21A - ‘23E Post-SBC EBITDA CAGR % | (1.2%) | 4.1% | 0.6% | 9.9% | 0.4% | 5.3% | (10.4%) |
| 2022E Post-SBC EBITDA Margin % | 38.1% | 43.1% | 36.6% | 35.5% | 28.1% | 8.6% | 15.9% |
| For Reference Only | |||||||
| Source: | Company filings, Wall Street research, Press releases |
| Note: | Market data as of 05/06/2022; Operating metrics represent a 2-period average (average of t and t-1) |
| 1. | TEGNA reflects unaffected price from the day prior to the news of Standard General’s acquisition (9/14/2021) |
| 2. | Reflects the book value of Sinclair debt |
[ 38 ]
Selected Publicly Traded Companies Analysis
Streamers: Discussion of Selected Publicly Traded Companies
Selected publicly traded companies analysis provides a valuation range based on public market valuations of businesses with operations and financial characteristics similar in certain respects to the Pelican Business
| ■ | Moelis selected publicly traded companies which have a significant presence in the subscription streaming entertainment industries |
| — | Pelican’s principle business is operating a U.S. Spanish language audience subscription streaming service |
| ■ | No single company is substantially similar across a range of key criteria including size of the company, EBITDA margin, growth profile, financial leverage, target demographic and business model |
| ■ | Moelis selected seven publicly traded subscription streaming entertainment companies that it deemed relevant for purposes of this analysis |
| — | Curiosity Stream, Netflix, FuboTV, Spotify, Roku, SiriusXM and Chicken Soup for the Soul were chosen for the similarity of their business models to Pelican’s |
| — | Curiosity Stream is relevant to our analysis of Pelican given its business model derives substantially all of its revenue from monthly membership fees for services related to streaming video content to its members |
| ● | Curiosity Stream is also more similar to Pelican than other Streamers in terms of scale, growth profile and profitability |
| — | Netflix is relevant to our analysis of Pelican given its business model derives substantially all of its revenue from monthly membership fees for services related to streaming video content to its members; on the other hand, Netflix is significantly larger than Pelican and is highly profitable, whereas Pelican is expected to generate losses for the next few years |
| ● | Netflix has a superior business and financial profile compared to Pelican given its scale, profitability and global subscriber base |
| — | FuboTV is similar in certain respects to Pelican given its business model derives substantially all of its revenue from subscription fees from its subscribers |
| ● | FuboTV is less relevant to our analysis of Pelican in that its business model operates as a virtual MVPD offering its subscribers access to content from third parties (e.g., ESPN). FuboTV also monetizes its audience through its digital advertising offerings (whereas Pelican primarily generates revenue from subscriber fees) |
[ 39 ]
Selected Publicly Traded Companies Analysis
Streamers: Discussion of Selected Publicly Traded Companies (Cont’d)
| — | Chicken Soup for the Soul Entertainment is relevant to Pelican in that it operates streaming video-on-demand networks |
| ● | Chicken Soup is less relevant in that it owns a variety of ad-supported in addition to subscription based-VOD networks. Chicken Soup is also profitable whereas Pelican is expected to generate losses for the next few years |
| — | Spotify is similar in certain respects to Pelican given its business model derives substantially all of its revenue from subscription fees from its subscribers |
| ● | Spotify’s product offering is different in that it primarily offers streaming audio, as compared to Pelican which is a streaming video product |
| — | Roku is similar in certain respects to Pelican given a large part of its business derives revenue from subscription fees from its subscribers |
| ● | Roku is less relevant to our analysis of Pelican in that it derives a material amount revenue from hardware sales and has a business model that operates as a connected TV and AVOD platform (whereas Pelican primarily generates revenue from subscriber fees) |
| — | SiruisXM is similar in certain respects to Pelican given its business model derives substantially all of its revenue from subscription fees from its subscribers |
| ● | Spotify is less relevant to our analysis of Pelican in that it offers its subscribers primarily streaming audio content as compared to streaming video on Pelican |
| ■ | Based on the above and its professional judgement, Moelis selected a reference range of 0.75x – 1.75x 2022E Pelican revenue and 0.5x – 1.5x 2023E Pelican revenue |
[ 40 ]
Selected Publicly Traded Companies Analysis
Detail – Streaming Services
| (Figures in $ millions) | Pelican |  |  |  |  |  |  |  |
| Valuation Metrics | ||||||||
| Total Enterprise Value | $89,014 | $33,748 | $17,904 | $11,892 | $539 | $226 | $20 | |
| Equity Value | 80,400 | 24,515 | 20,392 | 14,038 | 516 | 150 | 111 | |
| TEV/2022E Metrics | ||||||||
| Revenue | 2.7x | 3.7x | 1.5x | 3.2x | 0.5x | 1.5x | 0.2x | |
| EBITDA Post-SBC | 13.4x | 12.6x | n/m | n/m | n/m | 9.1x | n/m | |
| TEV/2023E Metrics | ||||||||
| Revenue | 2.5x | 3.6x | 1.3x | 2.5x | 0.3x | 1.2x | 0.1x | |
| EBITDA Post-SBC | 11.8x | 11.9x | n/m | n/m | n/m | 6.6x | n/m | |
| Net Debt / 2022E EBITDA | 1.2x | 3.5x | n/m | n/m | n/m | 0.7x | n/m | |
| Projected Operating Metrics | ||||||||
| ‘21A - ‘23E Revenue CAGR % | 61.5% | 9.4% | 4.5% | 13.8% | 31.7% | 55.6% | 25.4% | 39.2% |
| ‘21A - ‘23E Post-SBC EBITDA CAGR % | n/m | 12.3% | 5.0% | n/m | n/m | n/m | 34.3% | n/m |
| 2022E Post-SBC EBITDA Margin % | (37.3%) | 20.5% | 29.6% | (1.2%) | (2.7%) | (42.8%) | 16.8% | (63.4%) |
| Source: | Company filings, Wall Street research, Press releases |
| Note: | Market data as of 05/06/2022 |
| 1. | PF for acquisition of 1091 Pictures |
| 2. | Perpetual preferred equity included at redemption value |
[ 41 ]
Selected Publicly Traded Companies Analysis
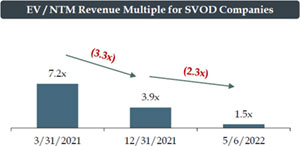
Streaming Services Valuation in Context (Time of Pelican Acquisition vs. Today)
Since Hawkeye’s acquisition of the remainder of Pelican in March 2021, publicly traded streaming companies have experienced significant multiple compression
| VALUATION AS DATE 3/31/21 (PELICAN ACQUISITION) | CURRENT VALUATION |
| EV / NTM Revenue | EV / NTM Revenue | |||||
| Trailing | As of | Trailing | As of | |||
| 3 Months | 3/31/2021 | 3 Months | 5/6/2022 | |||
| Netflix, Inc. | 8.5x | 8.0x | Netflix, Inc. | 5.8x | 2.8x | |
| Sirius XM | 4.3x | 4.1x | Sirius XM | 4.0x | 3.7x | |
| Spotify | 6.4x | 5.3x | Spotify | 2.7x | 1.5x | |
| fuboTV | 7.4x | 7.2x | fuboTV | 1.5x | 0.5x | |
| Roku | 19.4x | 16.1x | Roku | 5.7x | 2.9x | |
| Chicken Soup | 4.2x | 4.7x | Chicken Soup | 1.5x | 1.3x | |
| CuriosityStream | 12.1x | 9.6x | CuriosityStream | 1.2x | 0.3x | |
| Median | 7.4x | 7.2x | Median | 2.7x | 1.5x | |
Memo: Hawkeye acquisition of Pelican | 3.6x | Delta vs. 3/31/2021 | (4.7x) | (5.7x) | ||
| Curiosity Stream | 1.2x | 0.3x | ||||
| Delta vs. 3/31/2021 | (10.8x) | (9.3x) | ||||
| Source: | Capital IQ as of 05/06/2022 |
[ 42 ]
Selected Publicly Traded Companies Analysis
Comparison of Selected Publicly Traded Streaming Companies
Analysis below compares operating metrics of selected publicly traded streaming companies
2021A-2023E REVENUE CAGR (%)

2022E EBITDA MARGIN
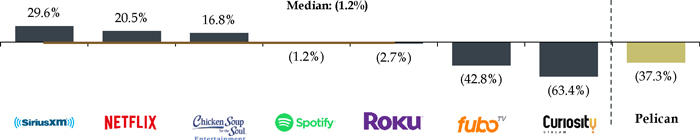
2022E MONTHLY CHURN

| Source: | Company filings, Wall Street research, Capital IQ |
| Note: | Market data as of 05/06/2022 |
[ 43 ]
C. Preliminary Selected Precedent Transactions Analysis
Selected Precedent Transactions Analysis
Summary
Analysis reflects implied enterprise value to Adj. EBITDA multiples and implied enterprise value to Revenue multiples for Networks and Pelican, respectively, based on precedent transaction trading multiples of companies deemed generally relevant by Moelis in certain respects to Hawkeye for purposes of this analysis
| Multiple Range | Enterprise Value | |||||||||||
| Segment | Metric | Value | Low | - | High | Low | - | High | ||||
| Networks | LTM EBITDA (Post-SBC) as of 3/31/2022 | $60.1 | 6.0x | - | 8.0x | $361 | - | $481 | ||||
| Pelican |
LTM Revenue | $56.3 | 3.0x | - | 4.0x | $169 | - | $225 | ||||
| Total Enterprise Value | $529 | $706 | ||||||||||
| Less: Net Debt (as of 3/31/22) 1 | (214) | (214) | ||||||||||
| Add: Other (as of 3/31/22) 1 | 21 | 21 | ||||||||||
| Total Equity Value | $336 | $512 | ||||||||||
| Fully Diluted Shares Outstanding (as of 3/31/22) 1 | 40.437 | 40.825 | ||||||||||
| Implied Equity Value per Share | $8.31 | $12.55 | ||||||||||
| Source: | Hawkeye Management |
| 1. | See page 69 for further detail |
[ 45 ]
Selected Precedent Transactions Analysis
Networks: Methodology & Assumptions
Analysis reflects implied enterprise value to EBITDA multiples paid in selected precedent transactions deemed generally relevant by Moelis in certain respects to Hawkeye for purposes of this analysis
| ■ | Moelis selected precedent transactions in the networks and TV broadcasting industry |
| ■ | However, no single transaction is similar across a range of key criteria including |
| — | Transaction value / relative size |
| — | EBITDA margin |
| — | Growth profile |
| — | Business model (including revenue mix from broadcast network operations, cable networks and other media assets) |
| ■ | Moelis selected 10 transactions in the diversified media and networks industry and 13 transactions in the TV Broadcasting industry since 2016 and focused primarily on the transactions with an enterprise value less than $1 billion given the scale of Hawkeye’s Networks business |
| ■ | Moelis selected a range of multiples from the selected precedent transactions analysis and applied the multiples to the Networks LTM Adj. EBITDA to calculate enterprise value |
| — | Moelis selected a multiple range of 6.0x to 8.0x based on the selected precedent transactions and was applied to Networks LTM Adj. EBITDA as of 3/31/22 |
| — | Unlike the publicly traded broadcasters, Networks earns a relatively small portion of its revenue from political (~2.5% in 2020A) and therefore LTM EBITDA as opposed to blended two-year average EBITDA was appropriate |
| — | The transactions in the networks industry are relevant to our analysis given the similarity to the cable networks business within Hawkeye Networks |
| ● | MSGN’s acquisition by MSGE is relevant to our analysis as MSGN was a targeted cable network (New York sports) in the U.S. with a similar growth profile to the Hawkeye cable networks |
| — | The broadcaster transactions are relevant to our analysis given the similarity to the broadcast assets within Hawkeye Networks |
| ● | Moelis notes that all of the broadcaster transactions involved strategic acquirers that expected to achieve significant levels of synergies which are unlikely to be present in an acquisition of Hawkeye |
[ 46 ]
Selected Precedent Transactions Analysis
Select Networks Precedent Transactions
NETWORKS
| Announced | Target | Acquiror | TEV ($mm) | TEV / LTM EBITDA |
| Apr-21 | Grupo Televisa (Content Assets) | Univision | $4,800 | 7.8x1 |
| Mar-21 | MSGN | MSGE | 1,7652 | 5.9x |
| Dec-20 | Oprah Winfrey Network | Discovery Communications | 4783 | 5.7x |
| Aug-19 | Viacom | CBS Corporation | 19,552 | 6.6x |
| Mar-18 | The Weather Channel | Allen Media | 977 | 6.9x4 |
| Jul-17 | Scripps Networks | Discovery Communications | 14,260 | 9.9x |
| Jul-17 | Home Shopping Network | QVC | 2,594 | 9.8x |
| Jun-16 | Starz | Lions Gate | 4,400 | 10.9x |
| Mar-16 | Crown Media Holdings | Hallmark Cards, Inc. | 2,088 | 10.1x |
| Jan-16 | Tennis Channel | Sinclair | 3505 | 16.2x |
| Overall Mean | $5,126 | 9.0x | ||
| Overall Median | $2,341 | 8.8x | ||
| Source: | Company filings, Wall Street research, Press releases |
| 1. | Reflects operating income from content assets; USD to MXN FX rate as of transaction announcement date (20.061x) |
| 2. | Assumes implied transaction value based on the MSGE closing price the day prior to the transaction (0.172x exchange ratio) |
| 3. | Grossed-up amount shown based on $100mm in total consideration for an incremental 21.0% equity stake in the Oprah Winfrey Network LLC from Harpo that Discovery did not already own |
| 4. | Estimated EBITDA per SNL Kagan |
| 5. | Does not include ~$65mm adjustment for savings from present value of Tennis Channel net operating losses |
[ 47 ]
Selected Precedent Transactions Analysis
Broadcasting Precedent Transactions
BROADCASTERS
| TEV / | ||||
| Announced | Target | Acquiror | TEV ($mm) | L8Q AVG. EBITDA |
| Feb-22 | TEGNA | Standard General | $8,605 | 8.8x |
| Jun-21 1 | Meredith | Gray Television, Inc. | 2,825 | 9.9x |
| Sep-20 | ION Media | E.W. Scripps Company | 2,650 | 8.6x2 |
| Jun-19 | Dispatch (2 Stations) | TEGNA | 535 | 7.9x3 |
| Mar-19 | Nextsar (8 Stations)4 | E.W. Scripps Company | 580 | 10.4x |
| Mar-19 | Nextsar (11 Stations) 4 | TEGNA | 740 | 12.0x |
| Dec-18 | Tribune Media | Nexstar Broadcast Group | 6,400 | 9.2x |
| Oct-18 | Cordillera (15 Stations) 4 | E.W. Scripps Company | 521 | 9.8x |
| Aug-18 | Gray (2 Stations) 4 | TEGNA | 105 | 5.9x3 |
| Jun-18 | Raycom Media, Inc. | Gray Television, Inc. | 3,660 | 9.5x |
| Dec-17 | Midwest Television Inc.4 | TEGNA | 325 | 6.6x3 |
| Apr-17 | Bonten Media Group | Sinclair Broadcast Group | 240 | 6.7x3 |
| Jan-16 | Media General | Nexstar Broadcast Group | 4,115 | 9.1x |
| Overall Mean | $2,408 | 8.8x | ||
| Overall Median | $740 | 9.1x | ||
| Source: | Company filings, Wall Street research, Press releases |
| 1. | Revised bid date, initial announcement was on 5/3/2021 |
| 2. | Reflects average of LTM 6/30/2020 and 2019A EBITDA |
| 3. | Includes pro forma synergies |
| 4. | Asset deal |
[ 48 ]
Selected Precedent Transactions Analysis
Pelican: Methodology & Assumptions
Analysis reflects implied enterprise value to revenue multiples paid in selected precedent transactions deemed generally relevant by Moelis in certain respects to Pelican for purposes of this analysis
| ■ | Moelis selected precedent transactions in the streaming subscription video |
| ■ | With the exception of Hawkeye’s April 2021 acquisition of the 75% of Pelican it did not previously own, no single transaction is similar across a range of key criteria including |
| — | Transaction value / relative size |
| — | EBITDA margin |
| — | Growth profile |
| — | Business model |
| ■ | Moelis selected 4 transactions in the streaming video industry since 2016 with a focus on transactions under $350mm given Pelican’s scale |
| ■ | Moelis selected a range of multiples from the selected precedent transactions analysis and applied the multiples to Pelican’s LTM revenue to calculate enterprise value |
| ■ | In its analysis of Pelican, Moelis placed less weight on the selected precedent transactions analysis for Pelican’s valuation, given limited relevant benchmarks and the recent significant change in market sentiment towards SVOD platforms (see slide 40) |
| ■ | Moelis selected a multiple range of 3.0x to 4.0x based on the selected precedent transactions and was applied to Pelican’s LTM Revenue as of 3/31/22 |
| — | Moelis notes the most relevant transaction to Pelican is the March 2021 acquisition by Hawkeye of the 75% of Pelican that it did not own |
[ 49 ]
Selected Precedent Transactions Analysis
Select Streaming Precedent Transactions
STREAMERS
| Announced | Target | Acquiror | TEV ($mm) | TEV / LTM Revenue |
| Apr-21 | Pantaya | Hemisphere Media Group | $165 | 3.6x |
| Jan-19 | PlutoTV | Viacom | 340 | 3.4x1 |
| Jul-18 | Acorn (RLJ) | AMC Networks | 274 | 2.9x |
| Jul-17 | Funimation | Sony | 151 | 1.5x1 |
| Overall Mean | $232 | 2.9x | ||
| Overall Median | $220 | 3.2x | ||
| Source: | Company filings, Wall Street research, Press releases |
| 1. | Approximate revenue figure reported in the press |
[ 50 ]
| D. | WACC Analysis |
WACC Analysis - Networks
Overview of Preliminary Networks WACC Analysis
Reference range of 8.25% - 10.50% discount rate derived from WACC calculation as described below
| ■ | Networks WACC calculation based on range of: |
| — | Risk-free rate based on the 20-year U.S. Treasuries yield of 3.43% as of 05/06/2022 |
| — | Equity risk premium of 6.22% represents the supply-side long-horizon expected equity risk premium1 |
| — | Unlevered beta range of 0.525 to 0.725 based on Diversified Media & Networks and Broadcasters companies’ unlevered 2-year weekly and 5-year monthly Bloomberg adjusted betas |
| ● | ViacomCBS and Fox Corporation’s 5 year betas were excluded because of significant M&A activity within the last 5 years; specifically Viacom and CBS’s merger in 2019 and Fox Corporation’s spin-off from 21st Century Fox in 2019 |
| ● | Sinclair’s beta is less relevant given its highly levered capital structure and the impact of debt overhang from its Diamond Sports subsidiary on its equity trading |
| ● | Gray’s unlevered beta is calculated using trading information and capital structure as of May 2021, prior to the announcement their acquisition of Meredith’s Local Media Group, which significantly transformed their business and capital structure |
| ● | Tegna’s unlevered beta is calculated using trading information as of February 22, 2022, 1 day prior to the announcement of its sale to Standard General |
| — | Target debt-to-total capitalization ratio of 25% to 65% based on capitalization of select publicly traded companies |
| — | Cost of debt estimated to be 7.25% before tax informed by the following reference ranges: |
| ● | 20-year risk-free rate, plus the: |
| − | Spread of 3.99%, calculated based on the ICE BofA US High Yield Index Effective Yield of 7.02% and the 7-year risk-free rate of 3.13% as of 05/06/2022 |
| ● | Yield-to-worst on Hawkeye’s existing debt |
| − | $213mm Senior Secured Term Loan B due February 2024 YTW @ 6.03% |
| − | $50mm Senior Secured Term Loan B Add-On due February 2024 YTW @ 4.56% |
| — | Cash tax rate of 30.5% consistent with Hawkeye Management assumptions in the projections for the Networks business |
| — | Size premium of 3.31% based on 10a decile as provided by Kroll1, based on companies with equity values of $190.49 million to $289.1 million |
| Source: | Bloomberg, Capital IQ, U.S. Department of the Treasury, company filings, Kroll (formerly known as Duff & Phelps) and S&P. Market data as of 05/06/2022 |
| 1. | Kroll (formerly known as Duff & Phelps) 2021 Year End Cost of Capital Navigator |
[ 52 ]
WACC Analysis - Networks
| Levered Beta ¹ | Total | Debt / | Unlevered Beta ² | |||||||||||
| ($ in millions, except per share data) | 2-Year | 5-Year | Equity | Debt | Cap | 2-Year | 5-Year | |||||||
| Diversified Media & Networks | ||||||||||||||
| Paramount 3 | 1.083 | NM | $18,426 | $18,945 | 50.7% | 0.631 | NA | |||||||
| Fox Corporation 4 | 0.738 | NM | 19,050 | 7,673 | 28.7% | 0.577 | NA | |||||||
| Discovery 5 | 0.998 | 1.248 | 22,061 | 15,026 | 40.5% | 0.677 | 0.847 | |||||||
| AMC Networks | 1.189 | 0.977 | 1,452 | 2,893 | 66.6% | 0.498 | 0.409 | |||||||
| Diversified Media Mean | 1.002 | 1.112 | 46.6% | 0.596 | 0.628 | |||||||||
| Diversified Media Median | 1.040 | 1.112 | 45.6% | 0.604 | 0.628 | |||||||||
| Broadcasters | ||||||||||||||
| Sinclair | 1.304 | 1.215 | $1,719 | $13,102 | 88.4% | 0.207 | 0.193 | |||||||
| Nexstar | 1.226 | 1.355 | 6,827 | 7,598 | 52.7% | 0.691 | 0.764 | |||||||
| Tegna 6 | 1.107 | 1.014 | 3,861 | 3,557 | 48.0% | 0.675 | 0.618 | |||||||
| Gray 7 | 1.443 | 1.705 | 1,912 | 4,035 | 67.9% | 0.585 | 0.691 | |||||||
| Entravision | 1.656 | 0.899 | 398 | 213 | 34.9% | 1.206 | 0.655 | |||||||
| E.W. Scripps | 1.643 | 1.499 | 1,404 | 3,240 | 69.8% | 0.631 | 0.576 | |||||||
| Broadcasters Mean | 1.397 | 1.281 | 60.3% | 0.666 | 0.583 | |||||||||
| Broadcasters Median | 1.374 | 1.285 | 60.3% | 0.653 | 0.637 | |||||||||
| Aggregate Mean | 1.239 | 1.239 | 54.8% | 0.638 | 0.594 | |||||||||
| Aggregate Median | 1.208 | 1.231 | 51.7% | 0.631 | 0.637 | |||||||||
| Hawkeye | 1.323 | 1.110 | $152 | $251 | 62.3% | 0.616 | 0.517 | |||||||
KEY ASSUMPTIONS
| ■ | Historical long-horizon equity risk premium (supply-side) of 6.22% (Source: Kroll 2021 Year End Cost of Capital Navigator) |
| ■ | Yield of 20-year U.S. Treasuries of 3.43% (as of 05/06/2022) |
| ■ | Size premium of 3.31% based on 10a decile as provided by Kroll, based on companies with equity values of $190.49 million to $289.1 million |
| ■ | Target debt-to-total capitalization ratio of 25% to 65% based on capitalization of select publicly traded companies |
WACC SENSITIVITY
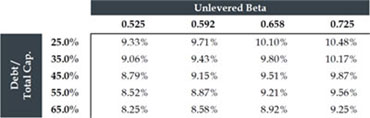
| Source: | Bloomberg, Capital IQ, U.S. Department of the Treasury, company filings, Kroll (formerly known as Duff & Phelps) and S&P. Market data as of 05/06/2022 | |
| 1. | Median unlevered adjusted beta of Selected Public Companies used to calculate relevered beta using the formula B = Bu(1+(1-t)(D/E)); 2-year and 5-year betas unlevered using 2-year and 5-year average effective tax rates, respectively | |
| 2. | Assumes 30.5% effective tax rate based on Hawkeye Management guidance | |
| 3. | Represents beta for Paramount Class B Common Stock for period beginning 12/4/2019 (date of CBS merger completion) | |
| 4. | Represents beta for Fox Corporation Class A Common Stock for period beginning 3/19/2019 (date of Disney acquisition close); capital structure is PF for transaction | |
| 5. | Represents beta and capital structure for Discovery Communications Class A Common Stock for period ending 5/14/2021 (1 day prior to WarnerMedia merger announcement) | |
| 6. | Represents beta for Tegna Class A Common Stock for period ending 2/22/2022 (1 day prior to Standard General merger announcement) | |
| 7. | Represents beta and capital structure for Gray Television Common Stock for period ending 5/2/2021 (1 day prior to Meredith acquisition announcement) |
[ 53 ]
WACC Analysis - Pelican
Overview of Preliminary Pelican WACC Analysis
Reference range of 15.00% - 23.00% discount rate derived from WACC calculation as described below
| ■ | To estimate Pelican’s cost of capital, we reviewed research on cost of equity capital for privately-held businesses per a Pepperdine University report, and prepared a cost of capital analysis using the CAPM |
| — | Our range of 15.00% - 23.00% is informed by the high end of our CAPM analysis (at the low end of our range) and by research on the cost of equity for privately-held businesses (at the high end of our range) 1 |
| ■ | Forecast negative cash flows through 2026, uncertainty on the amount of content investment required to attract new subs, and the unproven, nascent nature of the streaming business model to generate long-term profits all create significant risk to the Pelican achieving its forecast, which supports utilizing venture capital rates of return in our discount rate range |
| ■ | The median rate of return for Late Stage Venture Capital investments is 23.0%1 |
| — | Given Pelican’s existing subscriber base and the revenue it generates currently, we believe the return for a late stage venture capital investment to be relevant to our WACC analysis |
| ■ | Pelican’s WACC calculation based on a range of: |
| — | Risk-free rate based on the 20-year U.S. Treasuries yield of 3.43% as of 05/06/22 |
| — | Unlevered beta range of 0.900 to 1.400 based on the SVOD / Streaming Companies’ 2-year (weekly adjusted) and 5-year (monthly adjusted) betas: |
| ● | fuboTV and CuriosityStream’s 5 year beta were excluded from the analysis because both companies began trading in October 2020 |
| — | Cash tax rate of 24.0% during projection period and terminal year consistent with Hawkeye Management assumptions |
| — | Total debt / total capitalization of 0% is informed by the SVOD / Streaming Companies and Pelican’s expected cash flow profile |
| — | Equity risk premium of 6.22% represents the supply-side long-horizon expected equity risk premium2 |
| — | Size premium of 3.31% based on 10a decile as provided by Kroll1, based on companies with equity values of $190.49 million to $289.01 million |
| Source: | Bloomberg, Capital IQ, U.S. Department of the Treasury, company filings, Kroll (formerly known as Duff & Phelps) and S&P. Market data as of 05/06/2022 | |
| 1. | 2021 Private Capital Markets Report (Pepperdine University) | |
| 2. | Kroll (formerly known as Duff & Phelps) 2021 Year End Cost of Capital Navigator |
[ 54 ]
WACC Analysis - Pelican
| Levered Beta ¹ | Total | Debt / | Unlevered Beta ² | |||||||||||
| ($ in millions, except per share price) | 2-Year | 5-Year | Equity | Debt | Cap | 2-Year | 5-Year | |||||||
| SVOD / Streaming | ||||||||||||||
| Netflix | 1.311 | 1.186 | $80,400 | $14,623 | 15.4% | 1.152 | 1.042 | |||||||
| Spotify | 1.457 | 1.535 | 20,392 | 1,259 | 5.8% | 1.392 | 1.466 | |||||||
| Sirius XM | 0.913 | 0.971 | 24,515 | 9,844 | 28.7% | 0.699 | 0.744 | |||||||
| fuboTV | 1.250 | NA | 516 | 409 | 44.2% | 0.780 | NA | |||||||
| Chicken Soup for The Soul | 1.265 | 1.252 | 150 | 67 | 31.0% | 0.943 | 0.934 | |||||||
| Roku | 1.769 | 1.620 | 14,038 | 89 | 0.6% | 1.761 | 1.612 | |||||||
| CuriosityStream | 1.430 | NA | 111 | -- | 0.0% | 1.430 | NA | |||||||
| SVOD / Streaming Mean | 1.342 | 1.313 | 17.9% | 1.165 | 1.160 | |||||||||
| SVOD / Streaming Median | 1.311 | 1.252 | 15.4% | 1.152 | 1.042 | |||||||||
KEY ASSUMPTIONS
| ■ | Historical long-horizon equity risk premium (supply-side) of 6.22% (Source: Kroll 2021 Year End Cost of Capital Navigator) |
| ■ | Yield of 20-year U.S. Treasuries of 3.43% (as of 05/06/2022) |
| ■ | Size premium of 3.31% based on 10a decile as provided by Kroll, based on companies with equity values of $190.49 million to $289.1 million |
| ■ | Total debt / total capitalization of 0% is informed by the SVOD / Streaming Companies and Pelican’s expected cash flow profile |
WACC SENSITIVITY @ DEBT / TOTAL CAP OF 0%
| Unlevered Beta | |||||||
| 0.900 | 1.067 | 1.233 | 1.400 | ||||
| 12.34% | 13.37% | 14.41% | 15.45% | ||||
| Source: | Bloomberg, Capital IQ, U.S. Department of the Treasury, company filings, Kroll (formerly known as Duff & Phelps) and S&P. Market data as of 05/06/2022 |
| 1. | Median unlevered adjusted beta of Selected Public Companies used to calculate relevered beta using the formula B = Bu(1+(1-t)(D/E)); 2-year and 5-year betas unlevered using 2-year and 5-year average effective tax rates, respectively |
| 2. | Assumes 24.0% effective tax rate based on Hawkeye Management guidance |
[ 55 ]
WACC Analysis
Cost of Capital for Privately-held Businesses
Later stage venture capital investments typically require rates of return from 18% (1st quartile) to 38% (3rd quartile) with a median of 23%; given Pelican’s existing subscriber base and the revenue it generates currently, we believe the return for a late stage venture capital investment to be relevant to our WACC analysis
PRIVATE CAPITAL MARKET REQUIRED RATES OF RETURN
| Capital Type | Size | 1st Quartile | Median | 3rd Quartile | Capital Type | Size | 1st Quartile | Median | 3rd Quartile | ||||||||
| Bank | $1mm Loan | 5.0% | 5.5% | 6.0% | Private Equity | $1mm EBITDA | - | - | - | ||||||||
| $5mm Loan | 3.9% | 4.3% | 4.8% | $5mm EBITDA | 25.5% | 30.0% | 31.5% | ||||||||||
| $10mm Loan | 3.9% | 4.0% | 4.5% | $10mm EBITDA | 22.5% | 25.0% | 27.5% | ||||||||||
| $25mm Loan | 3.8% | 4.0% | 4.3% | $25mm EBITDA | 21.0% | 25.0% | 27.0% | ||||||||||
| $50mm Loan | 3.0% | 3.3% | 3.5% | $50mm EBITDA | 20.0% | 25.0% | 25.5% | ||||||||||
Asset-Based Lending | $1mm Loan | 15.5% | 16.0% | 18.5% | Venture Capital | Seed | 33.0% | 38.0% | 40.0% | ||||||||
| $5mm Loan | 14.8% | 15.5% | 16.3% | Startup | 30.0% | 33.0% | 40.0% | ||||||||||
| $10mm Loan | 4.4% | 8.5% | 15.0% | Early Stage | 23.0% | 30.0% | 38.0% | ||||||||||
| $25mm Loan | 3.5% | 5.0% | 8.0% | Expansion | 19.0% | 25.0% | 32.0% | ||||||||||
| $50mm Loan | 3.1% | 3.8% | 4.4% | Later Stage | 18.0% | 23.0% | 38.0% | ||||||||||
| Mezzanine | $1mm Loan | 11.5% | 14.0% | 21.0% | Angel | Seed | 33.0% | 43.0% | 65.0% | ||||||||
| $5mm Loan | 11.0% | 14.0% | 17.5% | Startup | 23.0% | 33.0% | 50.0% | ||||||||||
| $10mm Loan | 9.5% | 12.0% | 17.0% | Early Stage | 23.0% | 28.0% | 48.0% | ||||||||||
| $25mm Loan | 8.5% | 12.0% | 13.0% | Expansion | 23.0% | 25.0% | 48.0% | ||||||||||
| $50mm Loan | 8.5% | 10.0% | 12.0% | Later Stage | 18.0% | 23.0% | 38.0% |
| Source: | 2021 Private Capital Markets Report (Pepperdine University) |
[ 56 ]
| E. | Pelican Sale Supplemental Materials |
Overview of Pelican Sale Transaction / Consideration
| ● | As part of Sparrow’s Acquisition Proposal of Hawkeye, Sparrow has entered into an agreement to sell Pelican to Talon for a package of consideration consisting of cash, tax attributes and a seller note mandatorily exchangeable for either (a) all of Talon’s existing radio assets (the “Radio Assets”) or (b) 75% of the EBITDA generated by the Radio Assets plus the Radio Programming Agreement would be terminated and therefore Hawkeye would not be required to make any of the three $5mm annual payments to Talon pursuant to that agreement |
| – | Cash consideration: $115mm payable at Closing |
| – | Tax attributes: Hawkeye advisors forecast that $82mm of net operating losses in Puerto Rico will be transferred at closing (9/30/2022) with an expected net present value estimated to be between $0.0 – $24.1mm to Hawkeye, net of foreign tax credits |
| – | The transaction will result in Hawkeye paying Talon a $15mm programing fee split evenly over three years assuming the sale of the Radio Assets closes 1 |
| – | Additionally, Hawkeye will not be reimbursed for $7.3mm of content payments that Talon was expected to repay and Hawkeye will absorb a lease obligation that will run through 2059 and has a PV of between $15.0mm and $22.8mm |
| – | Seller Note with a face value of $10mm containing the below provisions: |
| ■ | If FCC approval is granted for the radio stations, the seller note will be exchanged for the radio assets, and no cash will be exchanged |
| ■ | If FCC approval is not granted for the radio stations, Talon and the Pelican seller will enter into a JSA for 75% of the EBITDA of the radio assets and the Radio Programming Agreement would be terminated and no payments would be due from Hawkeye to Talon thereunder |
| ● | Any go-shop buyer will be required to assume the above transaction (i.e., step into Sparrow’s position) as par of its proposal |
| $ in millions | Illustrative Pelican Consideration | ||
| Low | Mid | High | |
| (+) Cash Consideration | $115.0 | $115.0 | $115.0 |
| (+) Radio Assets @5.0x - 7.0x 2022E Adj. EBITDA of $6.8mm | 34.1 | 40.9 | 47.7 |
| (+) Net Benefit from PR NOLs (PV)2 | - | 12.3 | 24.1 |
| (-) 3 Years of Programming Fee (PV)3 | (13.6) | (13.6) | (13.6) |
| (-) Unreimbursed Content Payments / License Fee Forgiveness 4 | (7.3) | (7.3) | (7.3) |
| (-) Incremental Puerto Rico Lease Obligations (PV) 5 | (22.8) | (20.0) | (15.0) |
| Ilustrative Pelican Consideration | $105.4 | $127.3 | $151.0 |
| Source: | Hawkeye Management, Talon, 3rd party tax advisors |
| 1. | Assuming FCC approval is granted |
| 2. | High end reflects present value of net benefit of Puerto Rican NOLs received less the decrease in foreign tax credits utilized given the decrease in forecasted taxes paid in Puerto Rico – discounted at 8.25%; mid-point assumes 51% probability of utilization |
| 3. | Includes three $5mm payments for programming fees from 2022 to 2024 |
| 4. | Reflects upfront content funding payments that will not be reimbursed through working capital and current payment that Talon owes Pelican for content that will be forgiven as a result of the transaction |
| 5. | Low end reflects present value of absorbed lease obligations as a result of the transaction, mid and high end reflects illustrative potential to break the lease before 2059 when the current contract expires – discounted at 8.25% |
[ 58 ]
Overview of the Talon Radio Assets
ASSET OVERVIEW
| ● | Talon is currently the owner of a station group in Puerto Rico with reach that extends across the entire island 1 |
| ● | WKAQ and WUKQ are two of the top ranked radio stations on the Island 2 |
| – | The AM and FM stations were the first and second stations, respectively, to broadcast on the Island |
| – | The AM station is currently ranked #1 in the 6AM to 3PM weekday slot for listeners aged 12+, while the FM station is ranked #2 from 10AM to 3PM |
| ● | The stations have strong EBITDA margins and in 2021 generated $14.2mm of revenue and $6.5mm of Adj. EBITDA |
| ● | Hawkeye Management believes the assets will be complementary with WAPA PR and could present cross-selling opportunities and potential synergies with the broadcast network |
| ● | Hawkeye’s advisors have forecasted that $82mm of NOLs will be available after utilization assuming the transaction closes by 9/30/2022 |
SUMMARY RADIO P&L
$ in millions
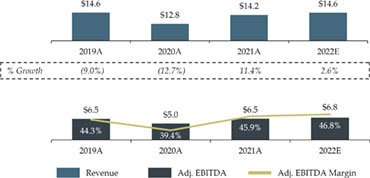
RATINGS BY DAYPART FOR PERSONS 12+ 1
| Station | DayPart | Ranking |
| 6A - 10A | 1 | |
| WKAQ580 | 10A - 3P | 1 |
| 3P - 7P | 2 | |
| 6A - 10A | 8 | |
| KQ105 | 10A - 3P | 2 |
| 3P - 7P | 4 |
| Source: | Talon, Nielsen | |
| Note: | ||
| 1. | The stations cover the entire Island, WKAQ (FM) covers the eastern half of the island, while WUKQ (FM) covers the western half; for the AM stations, WKAQ covers the northern part of the island and WUKQ covers the southern part | |
| 2. | Nielsen ratings as of January 2022 |
[ 59 ]
Puerto Rico Radio Detailed Financial Overview
COMMENTARY
| ● | AM stations accounted for 66% of net revenue in 2021 |
| ● | Local sales account for over 98% of gross revenue |
| ● | 2022 revenue is expected to grow ~2% driven by increased national and local spend |
| ● | Adj. EBITDA margins have consistently ranged from 40-50% (2017-2021) |
| ● | Other adjustments include the allocation of costs that are currently being recognized at another Talon entity, as well as non-recurring costs and insurance normalization |
| ● | Minimal Capex forecasted |
DETAILED P&L
| Actuals | Projected | |||||||||||||||||
| $ in millions | 2017A | 2018A | 2019A | 2020A | 2021A | 2022B | ||||||||||||
| AM Revenue | 8.4 | 9.3 | 8.8 | 9.1 | 9.5 | 8.7 | ||||||||||||
| FM Revenue | 5.7 | 6.8 | 5.8 | 3.6 | 4.7 | 5.9 | ||||||||||||
| Total Net Revenue | $14.1 | $16.0 | $14.6 | $12.8 | $14.2 | $14.6 | ||||||||||||
| % Growth | n/a | 13.7% | (9.0% | ) | (12.7% | ) | 11.4% | 2.6% | ||||||||||
| Payroll | $5.4 | $5.2 | $5.1 | $5.3 | $5.2 | $5.1 | ||||||||||||
| Other Opex | 2.7 | 2.4 | 3.0 | 2.4 | 2.1 | 2.3 | ||||||||||||
| Total Opex | $8.1 | $7.6 | $8.1 | $7.6 | $7.3 | $7.5 | ||||||||||||
| Other Adjustments | - | - | - | ($0.1 | ) | ($0.4 | ) | ($0.3 | ) | |||||||||
| Adjusted EBITDA | $6.0 | $8.4 | $6.5 | $5.0 | $6.5 | $6.8 | ||||||||||||
| Margin % | 42.4% | 52.6% | 44.3% | 39.4% | 45.9% | 46.8% | ||||||||||||
| Memo: Capex | n/a | $0.1 | $0.2 | $0.1 | $0.4 | $0.2 | ||||||||||||
| Source: | Talon |
[ 60 ]
Pelican Consideration in Context – Preliminary Valuation Summary
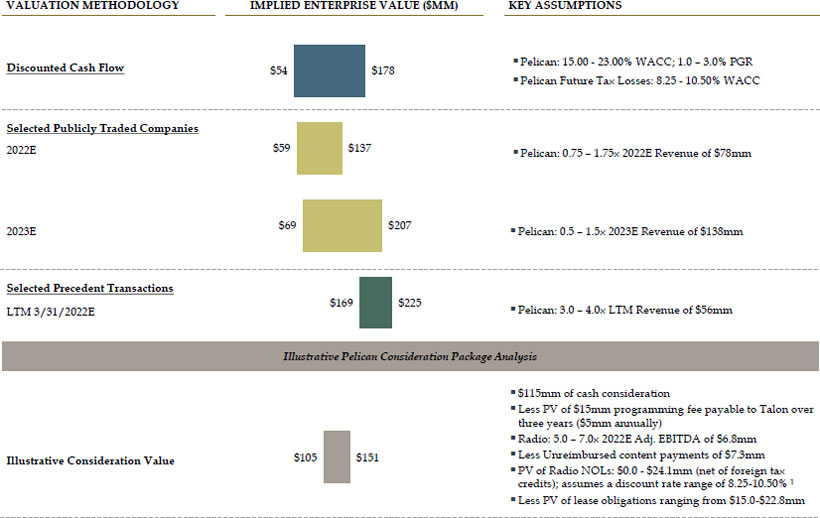
| Source: | Hawkeye Management, Wall Street research, Capital IQ |
| Note: | Market data as of 05/06/2022; Includes value attributable to NOLs generated by Pelican |
| 1. | Discount rate range derived from Networks capital asset pricing model (“CAPM”) |
[ 61 ]
Selected Publicly Traded Companies Analysis
Radio: Discussion of Selected Publicly Traded Companies
Selected publicly traded companies analysis provides a valuation range based on public market valuations of businesses with operations and financial characteristics similar in certain respects to the Talon Radio Business for the purposes of this analysis
| ■ | Moelis selected publicly traded companies which have a significant presence in the radio and audio media service sector |
| — | Talon’s Radio Business operates stations in Puerto Rico |
| ■ | No single company is substantially similar across a range of key criteria including size of the company, geographic footprint, diversification across markets and product offerings, EBITDA margin, growth profile, target demographic and business model |
| ■ | Moelis selected eight publicly traded radio and audio media services companies that it deemed relevant for purposes of this analysis |
| — | iHeartMedia and Audacy are relevant to our analysis of Talon’s Radio Business given they both operates radio stations |
| ● | iHeartMedia and Audacy are less relevant to our analysis given their much larger size and scale relative to Talon’s Radio Business, both companies are also diversified across several operating segments, including a significant footprint in digital audio media and both companies have much larger financial profiles |
| — | Cumulus is relevant to our analysis of Talon’s Radio Business given its primary operations involve the ownership of radio stations |
| ● | Cumulus is less relevant to our analysis given the size of its geographic footprint, diversification across program offerings, larger financial profile and its digital marketing services segment |
| — | Urban One and Salem Media Group are relevant to our analysis given that they operates radio stations focused on a targeted demographic |
| ● | Urban One and Salem Media Group are less relevant to our analysis given that they operates through several segments outside of radio, including digital, television and publishing, the size and scope of its radio stations and larger financial profile |
| — | Townsquare Media is relevant to our analysis given that it owns and operates radio stations |
| ● | Townsquare Media is less relevant to our analysis given that it has substantial exposure to digital audio media, subscription services and live events, its radio business encompasses several hundred markets and has a vastly different financial profile than Talon’s Radio Business |
| — | Beasley Broadcast Group is relevant to our analysis given that its primary business is operating radio stations |
| ● | Beasley Broadcast Group is less relevant to our analysis given that it operates across several markets, owns significantly more stations and is diversified beyond radio in the digital marketing and esports space |
| — | Saga Communications is relevant to our analysis given its business is solely focused on local radio stations |
| ● | Saga Communications is less relevant to our analysis given that it owns and operates significantly more radio stations that are diversified across several markets |
[ 62 ]
Selected Publicly Traded Companies Analysis - Radio
Publicly Traded Companies Analysis
| TEV / Post SBC EBITDA | 21-23E CAGR | CY22E EBITDA MARGIN | ||||||||||||||||||
| ($ in millions, except per share data) | % of 52 Week High | Market Cap | Enterprise Value | CY22 | CY23 | Revenue | EBITDA | |||||||||||||
 | 49.6% | $2,097 | $7,475 | 7.0x | 6.5x | 9.2% | 20.7% | 26.2% | ||||||||||||
 | 46.9% | 318 | 2,085 | 6.7x | 6.1x | 11.6% | 43.5% | 21.4% | ||||||||||||
 | 98.5% | 333 | 1,163 | 6.7x | 6.3x | 6.4% | 19.4% | 17.4% | ||||||||||||
 | 40.2% | 414 | 1,132 | NA | NA | NA | NA | NA | ||||||||||||
 | 72.1% | 216 | 719 | 6.3x | 6.1x | 8.8% | 7.8% | 24.2% | ||||||||||||
 | 49.0% | 50 | 305 | 8.1x | 8.0x | 7.9% | 21.5% | 14.0% | ||||||||||||
 | 43.3% | 80 | 252 | 6.7x | 6.3x | 1.9% | 2.8% | 14.0% | ||||||||||||
 | 80.1% | 139 | 83 | 3.9x | 1 | NA | NA | NA | 19.3% | 1 | ||||||||||
| Average | 6.5 | x | 6.5 | x | 7.6 | % | 19.3 | % | 19.5 | % | ||||||||||
| Median | 6.7 | x | 6.3 | x | 8.4 | % | 20.0 | % | 19.3 | % | ||||||||||
| Memo: | ||||||||||||||||||||
| Puerto Rico Radio 2 | (0.1 | %) | 1.8% | 46.8% |
| Source: | Company filings, Wall Street research, Press releases |
| Note: | Market data as of 05/06/2022 |
| 1. | Reflects LTM EBITDA metrics |
| 2. | CAGRs represent ’19A - ’22E |
[ 63 ]
Selected Precedent Transactions Analysis
Radio: Methodology & Assumptions
Analysis reflects implied enterprise value to EBITDA multiples paid in selected precedent transactions deemed generally relevant by Moelis in certain respects to Talon’s Radio Business for the purposes of this analysis
| ■ | Moelis selected precedent transactions in the radio and audio media services sector |
| ■ | However, no single transaction is similar across a range of key criteria including |
| — | Transaction value / relative size |
| — | EBITDA margin |
| — | Growth profile |
| — | Business model (market attractiveness, station clusters and geographic diversification) |
| — | Further, all of the selected transactions occurred prior to the COVID-19 pandemic |
| ■ | Moelis selected seven transactions in the radio and audio media services sector since 2016 and focused primarily on the transactions with an enterprise value less than $3 billion given the size of Talon’s Radio Business |
| ■ | Moelis selected a range of multiples from the selected precedent transactions analysis and applied the multiples to the Company’s EBITDA to calculate enterprise value |
| — | Moelis selected a multiple range of 5.0x to 7.0x based on the selected precedent transactions and was applied to Talon’s Radio Business’ LTM Adj. EBITDA as of 12/31/2021 |
| — | The transactions in the radio sector are relevant to our analysis given the each target operated radio stations |
| — | None of the transactions are exact matches for Talon’s Radio Business given that all of the transactions involving single stations were in top 40 MSAs including three in top two MSAs, and the larger transactions involved the sale of several stations across multiple media markets |
[ 64 ]
Selected Precedent Transactions Analysis - Radio
Radio Precedent Transactions
RADIO
| Ann. | Target | Acquiror | Markets | TEV ($mm) | TEV / LTM EBITDA |
| Jul-19 | Emmis Communications Corp. | Standard General L.P. | #1 New York | $106 | 10.0x |
| Jun-19 | Emmis Communications Corp. | Sinclair Telecable | #40 Austin | 78 | 7.5x |
| Apr-19 | Cumulus Media Inc. | Meruelo Group LLC | #2 Los Angeles | 43 | 8.6x |
| Feb-18 | Emmis Communications Corp. | Hubbard Broadcasting / Entercom Communications | #23 St. Louis | 60 | 12.0x |
| May-17 | Emmis Communications Corp. | Meruelo Group | #2 Los Angeles | 83 | 11.1x |
| Feb-17 | CBS Broadcasting, Inc. | Entercom Communications Corp. | 19 Total, Including: #1 New York, #2 Los Angeles, #3 Chicago | 2,861 | 8.1x |
| Jul-16 | Greater Media, Inc. | Beasley Broadcast Group, Inc. | 19 Total, Including: #7 Philadelphia, #11 Boston, #14 Detroit, #22 Charlotte | 207 | 7.0x |
| Overall Mean | $491 | 9.2x | |||
| Overall Median | $83 | 8.6x | |||
| Source: | Company filings, Wall Street research, Press releases |
[ 65 ]
Puerto Rico Radio Assets: NOL Utilization & Illustrative Valuation
The below reflects a summary of Hawkeye Management’s views of potential future Puerto Rico NOL utilization combined with the loss of foreign tax credits
STANDALONE WAPA PRE-TAX INCOME 1
| Projections | ||||||||||||||||||||||||||||||||||||||||||||||
| $ in millions | Q4 2022E | 2023E | 2024E | 2025E | 2026E | 2027E | 2028E | 2029E | 2030E | 2031E | 2032E | 2033E | 2034E | 2035E | 2036E | 2037E | ||||||||||||||||||||||||||||||
| WAPA Pre-tax Income 2 | $3.9 | $16.0 | $16.3 | $16.6 | $16.9 | $17.3 | $17.6 | $18.0 | $18.3 | $18.7 | $19.1 | $19.5 | $19.8 | $20.2 | $20.6 | $21.1 | ||||||||||||||||||||||||||||||
| Subject to Tax Grants | - | - | - | - | 10.0 | 10.2 | 10.4 | 10.6 | 10.8 | 11.0 | 11.2 | 11.4 | 11.7 | 11.9 | 12.1 | 12.4 | ||||||||||||||||||||||||||||||
| Total WAPA Pretax Income | $3.9 | $16.0 | $16.3 | $16.6 | $26.9 | $27.4 | $28.0 | $28.5 | $29.1 | $29.7 | $30.3 | $30.9 | $31.5 | $32.1 | $32.8 | $33.4 | ||||||||||||||||||||||||||||||
| PR Taxes @37.4% | $1.5 | $6.0 | $6.1 | $6.2 | $10.1 | $10.3 | $10.5 | $10.7 | $10.9 | $11.1 | $11.3 | $11.6 | $11.8 | $12.0 | $12.3 | $12.5 | ||||||||||||||||||||||||||||||
| Add: Taxes (Act 135) | 0.2 | 0.9 | 1.0 | 1.0 | - | - | - | - | - | - | - | - | - | - | - | - | ||||||||||||||||||||||||||||||
| Tax Credit | - | (2.0 | ) | - | - | - | - | - | - | - | - | - | - | - | - | - | - | |||||||||||||||||||||||||||||
| Cash Taxes Paid in PR | $1.7 | $5.0 | $7.1 | $7.2 | $10.1 | $10.3 | $10.5 | $10.7 | $10.9 | $11.1 | $11.3 | $11.6 | $11.8 | $12.0 | $12.3 | $12.5 | ||||||||||||||||||||||||||||||
PRO FORMA FOR ABILITY TO UTILIZE PUERTO RICO RADIO TAX ATTRIBUTES AND IMPACT OF LOST FOREIGN TAX CREDITS
| PRO FORMA TAXES | ||||||||||||||||||||||||||||||||||||||||||||||
| Pro Forma PreTax Income for AMT | $3.3 | $13.3 | $13.6 | $13.9 | $25.9 | $26.4 | $26.9 | $27.5 | $28.0 | $28.6 | $29.2 | $29.7 | $30.3 | $30.9 | $31.6 | $32.2 | ||||||||||||||||||||||||||||||
| NOL Limitation 3 | 2.3 | 9.3 | 9.5 | 9.7 | 18.1 | 18.5 | 18.9 | 19.2 | 19.6 | 20.0 | 20.4 | 20.8 | 21.2 | 21.7 | 22.1 | 22.5 | ||||||||||||||||||||||||||||||
| NOLs Available Balance | 81.5 | 79.2 | 62.5 | 53.0 | 43.3 | 25.2 | 6.7 | - | - | - | - | - | - | - | - | - | ||||||||||||||||||||||||||||||
| NOLs Utilized | $2.3 | $9.3 | $9.5 | $9.7 | $18.1 | $18.5 | $6.7 | - | - | - | - | - | - | - | - | - | ||||||||||||||||||||||||||||||
| Taxable Income | $1.0 | $4.0 | $4.1 | $4.2 | $7.8 | $7.9 | $20.3 | $27.5 | $28.0 | $28.6 | $29.2 | $29.7 | $30.3 | $30.9 | $31.6 | $32.2 | ||||||||||||||||||||||||||||||
| PR Taxes AMT | 0.2 | 0.9 | 0.9 | 1.0 | 1.8 | 1.8 | 4.7 | 6.3 | 6.4 | 6.6 | 6.7 | 6.8 | 7.0 | 7.1 | 7.3 | 7.4 | ||||||||||||||||||||||||||||||
| PR Taxes Regular | 0.1 | 0.6 | 0.6 | 0.6 | 1.0 | 1.0 | 9.5 | 10.7 | 10.9 | 11.1 | 11.3 | 11.6 | 11.8 | 12.0 | 12.3 | 12.5 | ||||||||||||||||||||||||||||||
| Taxes Paid 4 | $0.2 | $0.9 | $0.9 | $1.0 | $1.8 | $1.8 | $9.5 | $10.7 | $10.9 | $11.1 | $11.3 | $11.6 | $11.8 | $12.0 | $12.3 | $12.5 | ||||||||||||||||||||||||||||||
| Add: Taxes (Act 135) | 0.2 | 0.9 | 1.0 | 1.0 | - | - | - | - | - | - | - | - | - | - | - | - | ||||||||||||||||||||||||||||||
| Tax Credit | - | (1.9 | ) | (0.1 | ) | - | - | - | - | - | - | - | - | - | - | - | - | - | ||||||||||||||||||||||||||||
| AMT Tax Credit | - | - | - | - | - | - | (1.2 | ) | (1.1 | ) | (0.3 | ) | - | - | - | - | - | - | - | |||||||||||||||||||||||||||
| Cash Taxes Paid in PR | $0.5 | - | $1.8 | $1.9 | $1.8 | $1.8 | $8.3 | $9.6 | $10.6 | $11.1 | $11.3 | $11.6 | $11.8 | $12.0 | $12.3 | $12.5 | ||||||||||||||||||||||||||||||
| Add: Cash Taxes Paid in US With NOL | 0.3 | 7.2 | 8.3 | 8.3 | 10.6 | 12.5 | 6.4 | 10.1 | 9.3 | 9.5 | 9.6 | 9.8 | 9.9 | 10.1 | 10.3 | 10.5 | ||||||||||||||||||||||||||||||
| Net Cash Taxes Paid With NOL | $0.7 | $7.2 | $10.1 | $10.2 | $12.4 | $14.4 | $14.6 | $19.7 | $19.9 | $20.6 | $21.0 | $21.4 | $21.7 | $22.1 | $22.6 | $23.0 | ||||||||||||||||||||||||||||||
| Cash Taxes Paid in US Without NOL | 2.0 | 12.2 | 15.4 | 15.6 | 18.6 | 18.9 | 19.3 | 20.9 | 20.3 | 20.7 | 21.0 | 21.4 | 21.8 | 22.2 | 22.6 | 23.0 | ||||||||||||||||||||||||||||||
| Net Benefit from NOLs | $1.3 | $5.0 | $5.3 | $5.3 | $6.1 | $4.6 | $4.7 | $1.2 | $0.4 | $0.1 | $0.1 | $0.1 | $0.1 | $0.1 | $0.1 | $0.0 | ||||||||||||||||||||||||||||||
NPV Net Benefit Provided from | $24.1 |
| SENSITIVITY ANALYSIS – NPV OF NET REDUCTION IN TAXES | ||||
| Discount Rate | ||||
| 8.25% | 8.81% | 9.38% | 9.94% | 10.50% |
| $24.1 | $23.6 | $23.1 | $22.6 | $22.1 |
| Source: | Hawkeye Management, Talon, 3rd party tax advisors |
| Note: | Discount rate range derived from Networks capital asset pricing model (“CAPM”); assumes NOL balance as of 12/31/2021; reflects fully levered WAPA pre-tax income for illustrative purposes |
| 1. | Assumes growth rate in WAPA pre-tax income of 2.0% |
| 2. | Assumes none of the income is subject to tax grants per Hawkeye Management |
| 3. | Assumes 70% NOL limitation with an AMT structure |
| 4. | Assumes taxes paid are the higher of regular tax and the alternative minimum tax (“AMT”) |
[ 66 ]
| F. | Other Information |
Other Information
Leveraged Buyout (LBO) Assumptions and Illustrative Analysis
KEY ASSUMPTIONS
| ■ | Uses LRP through 2026 for the consolidated Hawkeye business (Networks and Pelican) |
| ■ | Assumes $180mm of new debt (~5.00x LTM EBITDA of $35.1mm) |
| — | Assumes refinancing of existing debt with new Unitranche Facility at L + 650bps, subject to a 1.00% LIBOR floor and 2% OID |
| ■ | Remaining purchase price provided by equity from Sponsor |
| ■ | Assumes transaction date of 03/31/22 and exit on 12/31/2026 |
| — | Assumes minimum cash balance of $30mm |
| — | Assumes $20mm of illustrative other transaction expenses |
| ■ | Exit multiple calculated on a sum-of-the-parts basis based on 2026E revenue and EBITDA for the Pelican and Networks businesses, respectively |
SENSITIVITY ANALYSIS
| Implied Purchase Price (@ 4.75x Max Leverage) | |||||
| Exit | Required IRR | ||||
| Multiple | 17.5% | 18.8% | 20.0% | 21.3% | 22.5% |
| 6.0x / 1.5x | $6.80 | $6.39 | $5.99 | $5.62 | $5.28 |
| 6.5x / 1.9x | 8.46 | 7.96 | 7.49 | 7.05 | 6.64 |
| 7.0x / 2.3x | 10.12 | 9.54 | 8.99 | 8.48 | 8.00 |
| 7.5x / 2.6x | 11.72 | 11.09 | 10.49 | 9.91 | 9.36 |
| 8.0x / 3.0x | 13.25 | 12.58 | 11.93 | 11.30 | 10.70 |
| Networks / Pelican | |||||
PF FREE CASH FLOW BUILD
| Fiscal Year Ending December 31, | ||||||||||||||
| ($ in millions) | 9M 2022E | 2023E | 2024E | 2025E | 2026E | |||||||||
| Adjusted EBITDA (Post-SBC) | $32 | $44 | $62 | $71 | $89 | |||||||||
| % Growth | 40.1% | 14.3% | 25.5% | |||||||||||
| (-) Taxes | (3 | ) | (4 | ) | (8 | ) | (12 | ) | (19 | ) | ||||
| (+) Other Adjustments | 0 | 1 | 0 | 0 | 0 | |||||||||
| (-) LatAm Cash Timing Difference | 1 | 1 | -- | -- | -- | |||||||||
| (-) Equity Method Investments | (1 | ) | -- | -- | -- | -- | ||||||||
| (-) Capex | (4 | ) | (5 | ) | (5 | ) | (5 | ) | (5 | ) | ||||
| (+) Programming / Content Amortization | 22 | 37 | 47 | 56 | 62 | |||||||||
| (-) Cash Content Spend | (37 | ) | (49 | ) | (53 | ) | (58 | ) | (63 | ) | ||||
| (-) Change in Working Capital | (2 | ) | 1 | (2 | ) | 0 | (1 | ) | ||||||
| (+) Pantelion 2.0 Cash Flow | (1 | ) | (1 | ) | (6 | ) | 4 | (1 | ) | |||||
| (-) Interest Expense | (17 | ) | (19 | ) | (18 | ) | (15 | ) | (11 | ) | ||||
| Levered Free Cash Flow | ($9 | ) | $6 | $18 | $42 | $51 | ||||||||
| Source: | Hawkeye Management |
| Note: | Market data as of 05/06/2022. Assumes 20.7mm Class A shares, 19.7mm Class B Shares, 4.48mm options with strike prices ranging from $5.44 to $15, total debt of $251.6mm, cash of $37.3mm, equity method investments of $22.7mm (which are treated as cash and calculated using Hawkeye Management’s estimate for the value of these assets) and post-tax pension liability of $1.7mm per Hawkeye Management |
[ 68 ]
Other Information
Hawkeye Current Capitalization
| TEV BUILD |
| (figures in $ millions, except per share data) |
Capitalization
| Capitalization | |
| Share Price Class A Shares (as of 05/06/2022) | $3.77 |
| (x) Common shares outstanding | 20.680 |
| Share Price Class B Shares (as of 05/06/2022) | $3.77 |
| (x) Common shares outstanding | 19.720 |
| Equity Value | $152.3 |
| (+) Total Debt 1 | 251.6 |
| (–) Cash 1 | (37.3) |
| Net Debt | $214.3 |
| (+) Noncontrolling Interests | -- |
| (+) Pension Obligation | 1.7 |
| (–) Non-Core Assets 1 | (22.7) |
| TEV | $345.6 |
| FDSO | |
| Common Shares (A Shares + B Shares) | 40.401 |
| (+) Options |  |
| FDSO | 40.401 |
| OPTIONS SCHEDULE |
| (figures in $ millions, except per share data) |
| Options Schedule | |||
| Item | # of Units | Strike Price | Dilution |
| Tranche 1 | 0.105 | $5.44 | -- |
| Tranche 2 | 0.025 | $9.29 | -- |
| Tranche 3 | 1.200 | $10.20 | -- |
| Tranche 4 | 0.020 | $10.35 | -- |
| Tranche 5 | 0.030 | $10.39 | -- |
| Tranche 6 | 0.040 | $10.60 | -- |
| Tranche 7 | 0.055 | $11.35 | -- |
| Tranche 8 | 0.025 | $11.35 | -- |
| Tranche 9 | 0.040 | $11.51 | -- |
| Tranche 10 | 0.300 | $11.65 | -- |
| Tranche 11 | 0.010 | $11.70 | -- |
| Tranche 12 | 0.650 | $11.90 | -- |
| Tranche 13 | 0.210 | $11.95 | -- |
| Tranche 14 | 1.025 | $12.06 | -- |
| Tranche 15 | 0.060 | $12.43 | -- |
| Tranche 16 | 0.095 | $12.56 | -- |
| Tranche 17 | 0.065 | $13.49 | -- |
| Tranche 18 | 0.045 | $13.53 | -- |
| Tranche 19 | 0.035 | $14.00 | -- |
| Tranche 20 | 0.325 | $15.00 | -- |
| Total | 4.360 |  | |
| Source: | Company filings, Hawkeye Management |
| Note: | Market data as of 05/06/2022. Assumes 20.7mm Class A shares, 19.7mm Class B Shares, 4.48mm options with strike prices ranging from $5.44 to $15.00, total debt of $251.6mm, cash of $37.3mm, equity method investments of $22.7mm (which are treated as cash and calculated using Hawkeye Management’s estimate for the value of these assets) and post-tax pension liability of $1.7mm |
| 1. | 3/31/22 estimates per Hawkeye Management |
[ 69 ]
Other Information
Hawkeye Equity Research Overview
| ANALYST / DATE / RATING | PRICE TARGET |
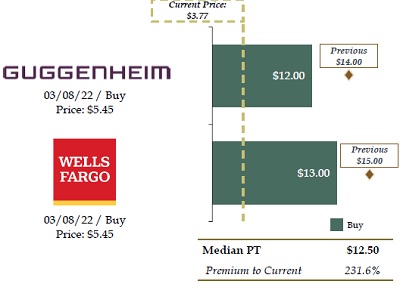
BROKER VALUATION PERSPECTIVES
| Valuation Method | 2022E Revenue | 2022E EBITDA | |
■ | Based on Guggenheim’s DCF valuation using a 2% long-term growth rate and a 9.5% WACC (up from 9.1% prior) | $220mm | $40mm |
■ | Valuation is based solely on Guggenheim’s DCF due to the company’s Pelican acquisition | ||
| ■ | Lowered EV/Sub multiple from 250x to 125x, using YE23 Pelican subs of 1.7mm | ||
■ | Models the company returning to EBITDA growth in FY23 as revenue/profitability growth lags the increased investment
| $229mm
| $41mm
|
MOELIS OBSERVATIONS
| ■ | Given Guggenheim’s near-term cash flow forecast, WACC and terminal year growth rate assumptions, it would require long term projections materially higher than Hawkeye Management’s forecast to achieve a valuation of $12.00 per share |
| ■ | Wells Fargo’s SOTP valuation implies the following: |
| — | Blended Networks / Broadcasting multiple of 6.6x management 2022E EBITDA, as compared to Fox multiple of 6.3x 2022E EBITDA |
| — | Pelican multiple of 2.8x management 2022E revenue, as compared to Netflix and Curiosity Stream 2022E revenue multiples of 2.7x and 0.2x, respectively |
| — | $101mm of value for equity method investments, which Hawkeye Management estimates is worth $22.7mm (implied impact per share of $1.94) |
| ■ | Wells Fargo has informed the Company that they are discontinuing coverage |
Source: Hawkeye Management, Wall Street research, Capital IQ as of 05/06/2022
[ 70 ]